
Incidence, predictors and implications of depression after Title stroke Author(s)
Title Author(s) Incidence, predictors and implications of depression after stroke Lee, Chu-kee, Angel.; 李珠璣. Citation Issue Date URL Rights 2008 http://hdl.handle.net/10722/53151 The author retains all proprietary rights, (such as patent rights) and the right to use in future works. Incidence, Predictors and Implications of Depression After Stroke by Angel Chu Kee LEE RN BN(Hon) MBA in HSM MMedSc A thesis submitted in partial fulfillment of the requirements for the Degree of Doctor of Philosophy at The University of Hong Kong February 2008 Abstract of thesis entitled “Incidence, Predictors and Implications of Depression After Stroke” Submitted by Angel Chu Kee LEE for the degree of Doctor of Philosophy at The University of Hong Kong on February 2008 Background Stroke after depression (DAS) in old age, in particular, casts a triple burden in healthcare (stroke, depression, old age). However, DAS is generally under-recognized. There is a paucity of studies on the incidence and predictors of DAS among the older Chinese populations, possibly due to the logistic difficulty in evaluating depression in older subjects of limited educational background with cognitive and physical impairment resulted from stroke. This thesis serves to address some unanswered important issues related to DAS in Hong Kong Chinese, particularly in the area of incidence, evaluation, assessment, research and educational needs. Aim and objectives The research is aimed to: (1) estimate the incidence of DAS among Chinese subjects who have first-ever ischemic stroke, (2) identify the risk factors and predictors for DAS, (3) evaluate the changes in various functional domains among stroke survivors at one month and six months, (4) discuss the clinical outcome of the depressed stroke survivors, and (5) recommend directions for research, education and practice in DAS. i Methods This study adopted a descriptive longitudinal study design. Consecutive ischemic stroke patients were recruited, and interviewed at one month and six months after stroke. A single-blind psychiatric consultation with all depressed subjects and a sample of non-depressed subjects was also conducted after the six-month interview. A 6-section questionnaire examined variables from five domains - bio-anatomical, cognitive and communicative, dependency and somatic symptoms, emotional, and family and social support. Depression was assessed by DSM IV, GDS, CESD, and also by three smiley diagrams. Results DAS occurred one in four at one month and one in ten at six months. The determinants for DAS at one month fell into the emotional and dependency-level domains. Cognitive function was also a determinant at six months. Emotional, cognitive, and somatic symptoms domains at one month predicted depression score, and jointly explained a 44% variability of DAS at six months. Majority of the stroke participants did not know ‘what is depression’ in Chinese. 8.5% of the participants (16 out of 188) had consulted psychiatrists at six months. DAS was found to be common among Chinese. Life stressors, display of sad faces, early cognitive decline and unresolved somatic symptom are important warning signs for DAS in the long-term. Chinese older stroke patients express depression in words not commonly used by clinicians in depression diagnosis. While diagnosis using standard Western diagnostic criteria could be more accurate, the simple Smiley diagrams, possibly a culturally neutral, less time-consuming and less dependent on verbal ability and educational background, might be suitable for preliminary screening of DAS in these older stroke patients. Careful interpretation of DAS assessment results is needed because Chinese patients may moderate emotional expressions. ii Significance This study provides updated information of DAS in older Chinese populations. A high incidence of DAS is found but under-recognition, under-detection and under-treatment of DAS are also common. Management of these patients requires more than just prescribing antidepressant drugs when warning signs of depression are observed. Many psycho-social issues detected in the study may contribute useful reference for future healthcare planning, research, practice and education in the local setting. iii Declaration I declare that this thesis represents my own work, except where due acknowledgement is made, and that it has not been previously included in a thesis, dissertation or report submitted to this University or to any other institution for a degree, diploma or other qualifications. Signed ……………………………… iv Acknowledgements I am much indebted to my supervisor, Professor S W Tang - an eminent scientist, a dedicated scholar, a tireless worker, a teacher who guides his students by facilitation rather than prescriptions and lectures, a patient-Centerd clinician, a person with integrity, wisdom and, most important, an all-encompassing heart. My sincere gratitude also goes to Dr Gabriel Yu, my second supervisor, and to Prof Sophia Chan, Head of the Department of Nursing Studies. Without their support, my doctoral study could not have become a reality. During the research process, I have learnt much from the generous teaching of Professor R T F Cheung and Dr Daniel Fong. Many clinical partners have offered me constant support, and I must thank in particular Dr T H Tsoi, Dr H C Ma, Mr K H Lo, Ms Lucy Cheng, Ms Virgina Cheung, Mr David Wong, Ms Erica Yeung, Mr Eric Kuk, Dr C M Chang and many others. I am grateful for the research assistance offered by Carmen, Elaine, Jacky, Joanna and Ting. Last but far from least, I am very much appreciative of all stroke participants and their families, whose sharing has enlightened my understanding of depression after stroke. Their suffering and resilience during the disease process have given me much insight into future research, practice and education in healthcare. The project was funded by The University of Hong Kong Seeding Funding. v 香港大學醫學院精神科教授 鄧兆華 醫生惠存 鄧 兆 華 香 港 大 學 精 神 科 教 授 德 澤 中 華 醫 德 彩 薰 中 雅 貫 研 工 學 誨 導 範 福 外 夏 桃 明 生 痌 瑞 君 中 醫 妙 論 諄 學 唐 病 杏 寰 李 珠 璣 瘝 龍 子 西 術 手 證 諄 梓 堯 黎 林 宇 天 譽 高 和 光 蔭 良 育 濟 樹 盡 攀 承 除 齊 沐 下 豐 瞻 風 社 蒼 師 青 萬 樑 關 頂 仲 苦 讚 春 受業 重 隆 矚 送 會 穹 表 松 民 棟 懷 峰 景 痛 賞 風 題謝 二零零八年 李珠璣 vi Dedication To Leung Shing On and Leung Ka Yan - my drives in life. To God - my destiny in life. vii Contents Abstract………………………………………………………………………………………… i Declaration…………………………………………………………………….…………… iv Acknowledgements…………………………………………………………………………… v Table of Contents……………………………………………………………………………viii List of Tables…………………………………………………………………………………xiv List of Figures …………………………………………………………………. ………… xvi List of Appendices……………………………………………………………….………… xvii Abbreviations……………………………………………………………………………… xviii Publications………………………………………………………………………………… xxi Chapter 1 Introduction…………………………………………………………………… 1 Chapter 2 Methods…………………………………………………………………… 29 Chapter 3 Results……………………………………………………………………… 58 Chapter 4 Discussion………………………………………………………………… 128 Chapter 5 Summary and conclusions………………………………………………… 175 References………………………………………………………………………… 183 Appendices……………………………………………………………………… 202 viii Chapter 1 Introduction 1.1 Background 1.1.1 Definitions 1.1.2 Significance of the problem 1.1.3 Importance of the study 1.2 Literature review 1.2.1 Ischemic stroke in Hong Kong 1.2.1.1 Impact of stroke 1.2.1.2 Interventions and rehabilitation for stroke survivors 1.2.2 Geriatric depression 1.2.2.1 Assessment and prevalence of geriatric depression 1.2.2.2 Factors associated with geriatric depression 1.2.2.3 Interventions for geriatric depression 1.2.3 Depression after stroke (DAS) 1.2.3.1 Impact of DAS 1.2.3.2 Incidence and prevalence of DAS 1.2.3.3 Risk factors and predictors of DAS 1.3 y Bio-anatomical domain factors y Cognitive and communicative domain y Dependency and somatic symptom domain y Emotional domain y Family and social support domain Indications for current study 1.3.1 Gaps of previous studies 1.3.2 Research questions ix Chapter 2 Methods 2.1 Aim and objectives of study 2.2 Study design 2.2.1 Justification of study design 2.2.2 Ethics approval and consent 2.2.3 Study procedures 2.2.3.1 Record reviews 2.2.3.2 Interviews 2.3 Sampling 2.3.1 Target populations 2.3.1.1 Inclusion criteria 2.3.1.2 Exclusion criteria 2.3.2 Sampling method 2.3.3 Sampling size 2.4 Data collection 2.4.1 Study outcomes - the incidence and predictors of DAS 2.4.1.1 Tools for diagnosing and quantification of depression in patients suspected of DAS 2.4.1.2 Use of smiley diagrams to detect depression in patients suspected of DAS 2.4.1.3 Health literacy regarding depression 2.4.1.4 The domain factors associated with DAS and predictors of DAS 2.4.2 DAS interventions 2.4.3 Pilot study 2.5 Data analysis 2.5.1 Data management 2.5.2 Patients’ demographic and health profiles 2.5.3 Validity of the assessment tools 2.5.4 Incidence of DAS at one month and six months 2.5.5 Risk factors and predictors of DAS 2.5.6 Changes of domain factors from one month to six months 2.5.7 The clinical outcomes of stroke survivors 2.5.8 Qualitative analysis – depression literacy x Chapter 3 Results 3.1 Subject recruitment 3.1.1 Inclusion and exclusion analysis 3.1.2 Representativeness of recruited sample 3.1.3 Descriptive analysis of participants 3.1.3.1 Demographics and medical history 3.1.3.2 Bio-anatomical characteristics of stroke lesions 3.1.3.3 Cognitive and communicative status 3.1.3.4 Dependency level and somatic complaints 3.1.3.5 Emotional status 3.1.3.6 Family and social support 3.2 Study outcomes 3.2.1 Level of agreements between depression assessments 3.2.1.1 The level of agreement between psychiatrists and the research nurse 3.2.1.2 The level of agreement between depression assessment tools 3.2.2 Incidence of DAS 3.2.3 Risk factors of DAS 3.2.3.1 Using DSM IV as the assessment tool 3.2.3.2 Using GDS/CESD as the assessment tool 3.2.4 Predictors of DAS 3.2.4.1 Using DSM IV as the assessment tool 3.2.4.2 Using GDS/CESD as the assessment tool 3.2.5 Health literacy of depression 3.2.5.1 Descriptors in affective domain 3.2.5.2 Descriptors in behavioural domain 3.2.5.3 Descriptors in cognitive domain 3.3 Clinical outcomes 3.3.1 Post-stroke quality of life 3.3.2 Institutionalisation and mortality 3.3.3 DAS interventions in formal healthcare 3.3.3.1 Use of anti-depressants 3.3.3.2 Use of mental healthcare resources xi Chapter 4 Discussion 4.1 Incidence of DAS at one month and six months 4.1.1 Comparing the incidence with published Chinese samples 4.1.2 Comparing the incidence with published Caucasian samples 4.1.3 The trend of DAS at six months and after 4.2 Risk factors and predictors of DAS 4.2.1 Bio-anatomical domain 4.2.2 Cognitive and communicative domains 4.2.3 Dependency and somatic symptoms domain 4.2.4 Emotional domain 4.2.5 Family and social support domain 4.2.6 Demographic and other factors 4.3 DAS interventions 4.3.1 Consequence of inattention to DAS 4.3.2 Primary preventive measures 4.3.2.1 Recognition of DAS - depression literacy 4.3.2.2 Early detection of DAS – use of smiley diagrams 4.3.3 Treatment modalities of DAS 4.3.3.1 Pharmacological treatment 4.3.3.2 Non-pharmacological treatment 4.4 Limitations of study 4.4.1 Threats to internal validity 4.4.1.1 Selection bias 4.4.1.2 Study design 4.4.1.3 History 4.4.1.4 Maturation 4.4.1.5 Mortality 4.4.2 Threats to external validity 4.4.2.1 Sample representativeness 4.4.2.2 Reliability of reporting ‘depression’ in Chinese stroke patients in Hong Kong hospitals 4.4.2.3 Measurement effects xii 4.5 Recommendations for future research, practice and education 4.5.1 Future research 4.5.1.1 Incidence studies 4.5.1.2 Bio-anatomical or biochemical research 4.5.1.3 Depression literacy studies 4.5.1.4 Detecting depression 4.5.2 Future practice and education Chapter 5 Summary and conclusions References Appendices Publications xiii List of tables Table 1.1 Prevalence of GD in Hong Kong (13) Table 1.2 Conceptual framework in postulating DAS causality (21) Table 2.1 Comparing the profile of sampling frame with other districts in Hong Kong (38) Table 2.2 Sampling estimation using Epinfo 2005 (40) Table 2.3 Process review agenda on DAS (50) Table 3.1 Reasons for admission and exclusion of study subjects (61) Table 3.2 Comparing age and gender groups of potential participants (62) Table 3.3 Representativeness of the recruited sample (62) Table 3.4 Demographic characteristics of 214 participants (64) Table 3.5 Medical history of 214 participants (65) Table 3.6 Characteristics of stroke lesions among participants at one month (66) Table 3.7 Functional levels in cognitive and communicative domains at one month and six months (69) Table 3.8 Dependency level and somatic symptoms at one month and six months (72) Table 3.9 Emotional status at one month and six months (77) Table 3.10 Frequency of displaying different facial expressions over the past week at one month and six months (79) Table 3.11 Coping resources (80) Table 3.12 The level of agreement between psychiarists’ and nurse’ assessment on depression (82) Table 3.13 Screening property of depression assessment tools at one month (83) Table 3.14 Incidence of depression at one month and six months (85) xiv Table 3.15 Changes in the GDS and CESD mean scores at one month and six months (85) Table 3.16 Relationship of socio-demographics and health history with DAS (89) Table 3.17 The association of bio-anatomical domain factors with DAS at one month (90) Table 3.18 The association of cognitive and communicative domain factors with DAS (92) Table 3.19 The association of dependency and somatic symptom domain factors with DAS (93) Table 3.20 The association of emotional domain factors with DAS (97) Table 3.21 The association of social support domain factors with DAS at six months (99) Table 3.22 Factors associated with GDS at one and six months (101) Table 3.23 Factors associated with CESD at one and six months (103) Table 3.24 Selected variables for regression analysis in DSM (from Tables 3.17-3.21) (107) Table 3.25 Determinants of DAS assessed by DSM IV (109) Table 3.26 Determinants of DAS assessed by GDS (109) Table 3.27 Determinants of DAS assessed by CESD (110) Table 3.28 Predictors of depression scores (by GDS) at six months (113) Table 3.29 Predictors accounting for the change in depression scores (by GDS) from one month to six months (113) Table 3.30 Comparing demographic and depression between of depression literate and illiterate groups (114) xv Table 3.31 Domains of emerging themes on depression interpretation by 86 participants (114) Table 3.32 Analysis of ‘Burying things in oneself and concealing from others’ under affective domain (117) Table 3.33 Analysis of ‘Nature and content of thoughts’ under cognitive domain (120) Table 3.34 Predictors of quality of life at six months (122) Table 3.35 Treatment and clinical outcomes of the participants (125) Table 3.36 Comparison of clinical status and outcome between dropouts and persistent participants (127) Table 4.1 Comparing the incidence findings with published studies (131) xvi List of figures Figure 3.1 A flow chart of subject recruitment (60) Figure 3.2 Changes in Quality of life score from one month to six months (122) xvii List of appendices Appendix 2.1 Timetable for the research project Appendix 2.2 DAS consent form Appendix 2.3 Interview guide for psychogeriatrician Appendix 2.4 1M questionnaire Appendix 2.5 6M questionnaire Appendix 2.6 Comparison of age and gender between two target hospitals Appendix 3.1 Bio-chemical status of participants at 1M after stroke admission Appendix 3.2 Individual item score in DSM at 1M and 6M Appendix 3.3 Individual item score in GDS at 1M and 6M Appendix 3.4 Individual item score in CESD at 1M and 6M Appendix 3.5 Correlation of risk factors with GDS at 1M and 6M Appendix 3.6 Correlation of risk factors with CESD at 1M and 6M xviii Abbreviations 1M 6M ACA AMT ANOVA BADL BDI C&AH CA CBT CD CESD CI CO CSSA CT scan CVA DA DAS DBP df DM DSM IV EC EH F FBS FN FP GCS GD GDS GHQ HA HAD HDA HCP HT ICD Inc INR LOD LSNS MAOI Min Max MMSE MRA One month Six months Anterior Cerebral Artery Abbreviated Mental Test Analysis of Variance Barthel Activity of Daily Living Beck Depression Inventory Care and Attention Home Carotid Artery Cognitive Behavior Therapy Carotid Doppler Center of Epidemiologic Studies of Depression Confidence Interval Cut-off point Combined Social Security Allowance Computerized tomography Cardiovascular Accident/Stroke Disability Allowance Depression After Stroke Diastolic Blood Pressure degree of freedom Diabetes Mellitus Diagnostic and Statistical Manual, Fourth Edition Elderly Center Elderly Home Test statistic used in ANOVA and other tests Fasting Blood Sugar False Negatives False Positives Glasgow Coma Scale Geriatric Depression Geriatric Depression Scale General Health Questionnaire Hospital Authority Hospital Anxiety and Depression Scale High disability Allowance Health Care Professional Hypertension International Codes of Diagnoses Incidence International Normalized Ratio Level Of Disturbance Lubben Social Network Scale Monoamine Inhibitor Minimum Maximum Mini Mental State Examination Magnetic Resonance Angiography xix MRI MRSQoL n N NA NAD NH NS NSPS OAA OR p PACI PCA PG POCI PTSD QoL r R R2 SBP sc SD Sen Spe SSRIs t TACI TIA TN TP TCD US χ2 Magnetic Resonance Imaging Modified Rankin Scale for Quality of Life Number of cases in a subgroup or the sample Total number of cases or sample members Not applicable No abnormality detected Nursing Home Not Significant Norton Scale of Pressure Sore Old Age Allowance Odds ratio p-value; probability that observed data are consistent with null hypothesis Partial Anterior Circulation Infarction Posterior Cerebral Artery Psychogeriatrician Posterior Circulation Infarction Post-traumatic stress disorder Quality of Life Pearson product-moment correlation coefficient Multiple correlation coefficient Coefficient of determination, proportion of variance in Y attributable to Xs Systolic Blood Pressure subject code Standard Deviation Sensitivity Specificity Selective Serotonin Reuptake Inhibitors t-value Total anterior circulation ischemia Transient Ischaemic Attack True Negatives True Positives Transcranial Carotid Doppler United States Greek chi-squared, a test statistic for several nonparametric tests xx Publications Lee, A. C. K., Tang, S. W., Yu, G. K. K., Cheung, R. T. F. (2007). Depression after stroke: incidence and predictors. International Journal of Psychiatry in Clinical Practice 11, (3):200-206. Lee, A. C. K., Tang, S. W., Yu, G. K. K., Cheung, R. T. F. (2007). The Smiley as a Simple Screening Tool for Depression After Stroke: a preliminary study. International Journal of Nursing Studies (in press). Retrievable online, DOI: 10.1016/j.ijnurstu.2007.05.008. xxi Chapter 1 Introduction 1.1 Background (2) 1.1.1 Definitions (3) 1.1.2 Significance of the problem (3) 1.1.3 Importance of the study (4) 1.2 Literature review (6) 1.2.1 Ischemic stroke in Hong Kong (6) 1.2.1.1 Impact of stroke (6) 1.2.1.2 Interventions and rehabilitation for stroke survivors (8) 1.2.2 Geriatric depression (10) 1.2.2.1 Assessment and prevalence of geriatric depression (11) 1.2.2.2 Factors associated with geriatric depression (13) 1.2.2.3 Interventions for geriatric depression (14) 1.2.3 Depression after stroke (DAS) (16) 1.2.3.1 Impact of DAS (17) 1.2.3.2 Incidence and prevalence of DAS (18) 1.2.3.3 Risk factors and predictors of DAS (20) y 1.3 Bio-anatomical domain factors Anatomical hypothesis Vascular hypothesis Biochemical hypothesis y Cognitive and communicative domain y Dependency and somatic symptom domain y Emotional domain y Family and social support domain Indications for current study (28) 1.3.1 Gaps of previous studies (28) 1.3.2 Research questions (28) 1 1.1 Background Stroke, or cerebrovascular disease, is prevalent worldwide (American Stroke Association 2005) and also in Hong Kong. It has been ranked the third or fourth most deadly disease (Center of Health Protection 2006). Nearly one in ten admissions are due to stroke every year (Department of Community Medicine 1998). Moreover, depression is especially important among the older population because of their high vulnerability (Woo et al. 1994, Zalewski et al. 1994) and the tragic outcomes depression brings (Yip et al. 1998). It has been predicted that depression will become the second most burdensome global disease in the next two decades (Murray & Lopez 1996). The prevalence of depression within the geriatric population alone ranged from 10% to 40% among samples from clinical or institutional settings (Leung 1998) as well as from the community at large (Woo et al. 1994, Zalewski et al. 1994, Lee 2003). The lifetime prevalence of depression can be as high as 60% in Australia (National Mental Health Strategy Evaluation Steering Committee 1997). Historically, the earliest papers introducing depression after stroke (DAS) dated back to 1982 and later (Feibel & Springer 1982, Robinson et al. 1985, House 1987, Primeau 1988). Some authors admitted that there had been few systematic studies on DAS despite frequent documentation of psychological symptoms among stroke survivors (Catapano & Galderisi 1990, Diller & Bishop 1995). Studies had usually been done on a small scale with small numbers of stroke participants (Egelko et al. 1989, Schubert et al. 1992a). A cross-sectional study design had been commonly used, and so a causal relationship between stroke and depression had yet to be confirmed (Schubert et al. 1992a). To identify the temporal link between stroke and depression, a longitudinal study design has been undertaken more frequently from the 90s onwards (Bacher et al. 1990, Morris et al. 1990, Andersen et al. 1994), and studies on depression and stroke collectively have increased in number (Robinson et al. 1990, Andersen et al. 1994, O'Rourke et al. 1998). Both discrete reports (Cushman 1988, Egelko et al. 1989, Morris et al. 1990, Francisco 1993, Agrell & Dehlin 1994) and some national samples 2 estimate the prevalence of depression after stroke among first or recurrent stroke patients to be between 10 and 27% (National Institute of Mental Health 2002). However, there is a paucity of studies on the incidence and predictors of DAS among Chinese populations, despite the high admission rate of stroke patients and the fact that stroke is one of the top five killing diseases in mortality statistics. The applicability of results from abroad regarding the prevalence and incidence of the risk factors or predictors (and the controversy over them) remains largely unknown, not to mention evidence-based interventions. This thesis serves to address some of the unanswered important issues related to DAS in Hong Kong Chinese, particularly in the area of incidence, evaluation, assessment, educational needs and welfare. 1.1.1 Definitions According to the American Stroke Association (2007), stroke is a type of cardiovascular disease. It affects the arteries leading to and within the brain. A stroke occurs when a blood vessel that carries oxygen and nutrients to the brain is blocked by a clot or bursts. When that happens, part of the brain cannot get the blood (and oxygen) it needs, so it starts to die. Depression is a serious medical illness, not imaginary or a weakness of one’s personality as some would like to believe. It is more than just feeling ‘down in the dumps’ or ‘blue’ for a few days. It is feeling ‘down’ and ‘low’ and ‘hopeless’ for weeks at a time (National Institute of Mental Health 2007). 1.1.2 Significance of the problem Depression after stroke (DAS) is a triple burden itself, actually combining three conditions: stroke, depression and old age. DAS will likely demand an intensive healthcare effort. The three conditions have been studied extensively, in a discrete way, at national and global levels (Murray & Lopez 1996, Nussbaum 1997, O'Connell et al. 2004, American Stroke Association 2005). Studies of DAS as a three-in-one phenomenon, however, have been comparatively less frequent. 3 Stroke is the third most frequent cause of mortality among Caucasians (Hinkle 1998, American Stroke Association 2005) and ranks third/fourth locally (Yu et al. 2003, Center of Health Protection 2006). In Hong Kong, stroke accounted for more than 25,700 in-patient discharges and deaths in all hospitals and 3 434 deaths in 2005 (Center of Health Protection 2005, 2006). Stroke is known to cause tremendous suffering and dysfunction in various domains, with recovery a tedious process. Depression has caused growing concern in many societies because of its high life-time prevalence and the projection that it will become the second global burden of disease (Murray & Lopez 1996, Strock 2000, National Institute of Mental Health 2003). Compared with other age groups, older adults are found to be more susceptible to depression in Caucasian samples (Zalewski et al. 1994, Commonwealth Department of Health and Aged Care 2000, National Institute of Mental Health 2003), and Chinese are no different (Woo et al. 1994, Leung 1998, Lee 2003). Chinese constitute one fifth of the global population. The ageing of the Chinese population is an imminent and inevitable challenge to healthcare, with one in four residents aged over 60 by 2030 according to projected health and vital statistics in Hong Kong (Department of Health Census and Statistics 2003). Naturally, ageing is associated with increased health concerns and healthcare expenditure. 1.1.3 Importance of the study The study of DAS remains an important public health topic. Public health concerns are raised over a certain health problem according to a few criteria: (1) it is common, as evidenced by high incidence and prevalence among the population, (2) the problem is a chronic phenomenon that is not resolved without active intervention, (3) it imposes a tremendous burden on healthcare, the victims themselves and society at large, (4) it is detectable, treatable and preventable. The justifications of DAS as a significant health problem are as follows: 1. DAS may cause multiple impacts and tremendous burdens on patients, families and the healthcare system. 4 2. There are discrepancies in the existing findings on incidence and predictors of DAS. 3. There is a paucity of information regarding incidence and predictors of DAS among Chinese subjects in any Chinese community around the world including China. 4. DAS exemplifies how the intercalated health problem of a multifaceted disease etiology can be understood and delineated systematically and studied chronologically from acute to chronic stages, establishing the natural history of the problem. 5. DAS study helps to explore the gaps in care and management of a highly debilitating disease by reflecting on the domains of unmet needs 5 1.2 Literature review 1.2.1 Ischemic stroke in Hong Kong Stroke or cardiovascular accident (CVA) is one of the leading five causes of mortality in Hong Kong (Center of Health Protection 2005, 2006). It is considered the most important and frequent condition in the specialty of neurology (Yu et al. 2003). But it is not a homogeneous disease, with 70% being of the ischemic type and 30% originating in haemorrhagic lesions. Without due clinical attention, stroke may lead to high mortality, morbidity and disability (Robinson 1997, Chang et al. 1999, Yu et al. 2003). In Hong Kong, most acute stroke patients are admitted to hospital wards in the general medical, neuro-medical or stroke units, depending on hospital policy or availability. Admission or transfer to the neurosurgery division takes place if neurosurgical intervention is contemplated. Common investigations and treatment for a suspected stroke patient include: non-contrast computed tomography scan of the brain within 24 hours of first admission, consideration of thrombolytic therapy, identification and treatment of risk factors and complications, as well as the early rehabilitation programme (Tsoi 2004). After stabilisation of the clinical status, stroke patients may be transferred to a rehabilitation hospital as in-patients or discharged home with or without an active rehabilitation programme to be undertaken at day hospital. The arrangement of rehabilitation programmes and the clinical outcomes of patients are variable. The patients’ functional status in respective domain areas ties in closely with the severity of the neurological insult and their entry level of functions and the availability of social support at the outset (Tsoi 2004). 1.2.1.1 Impact of stroke Burdens on stroke patients. Dysfunctions of stroke can be multiple, chronic and debilitating despite the fact that some patients find their functions readily restored with minimal residual symptoms after the acute stage (Yu et al. 2003). For many, 6 stroke recovery can be complicated by different domain factors deriving from or resulting in various impairments, co-morbidity and psychological and somatic symptoms (Parikh et al. 1990, Morris et al. 1992). A study on quality of life (QoL), with 85 consecutive patients (36 women and 49 men with a mean age of 65) with first-ever ischemic stroke of a mild to moderate nature, showed that the overall QoL of the participants was low (Kauhanen et al. 2000) and remained so for the first year post-stroke (Kim et al. 1999, Suenkeler et al. 2002). Burdens on families. Depression affects many stroke caregivers (41%), as reported by Kotila et al. (1998). Socio-demographic, physical and psychosocial factors were noted to be associated with depressive behaviour in family caregivers of stroke survivors in the acute care phase (Grant et al. 2004). The presence of visible impairments initially seemed to affect the spouses' emotional health, while cognitive and emotional impairments among patients became more evident later in everyday life. In the long term, the spouses' individual life situations and coping abilities are expected to be more influential in moderating the well-being of the spouses (Forsberg-Warleby et al. 2004). Burdens on healthcare. Depression following stroke can impede recovery and prolong rehabilitation (Lai et al. 2002). Patients that are more depressed tend to need longer hospital stays and have inefficient use of healthcare resources than those not afflicted in that way (Schubert et al. 1992b, Gillen et al. 2001). This might be associated with the low levels of self-rated health among stroke survivors, as identified in current study results (data published already, see Publications). A three-factor model with depressive symptomatology, physical disease and functional disability may explain 79% of the variance in self-rated health among community-dwelling older adults with stroke (Han et al. 2001). Alternatively, the extended use of healthcare resources might also be indicated as residual impairment can last beyond two years post-stroke (Parikh et al. 1988, Parikh et al. 1990) and even up to seven years among patients with DAS (Dam 2001). The aggregate cost to society of unattended DAS has been estimated to be high (Evers et al. 1997). 7 1.2.1.2 Interventions and rehabilitation for stroke survivors The rehabilitation needs of stroke survivors are multifaceted and intensive rehabilitation has therefore been advocated. Currently, more alternative interventions are available to foster health-related quality of life despite the inevitable or irreversible disabilities sustained by some stroke survivors. Three different kinds of rehabilitative programmes or activities are found in the literature: (1) physical rehabilitation, (2) a system approach to stroke rehabilitation, or (3) cognitive interventions. A comprehensive approach has been indicated in the past decade which aimed at tackling overt physical symptoms and covert ones that link with post-stroke complications. Because of the overt functional compromise of many stroke survivors, physiotherapy has been suggested, extending beyond the first year after stroke (Green et al. 2004). The extension of physiotherapy to community settings such as old age homes has also been initiated. This community physiotherapy programme or home-based therapy allows flexibility in the onsite training of care providers and adds to the convenience of older stroke people (Baskett et al. 1999). It was introduced to patients with mobility problems one year after stroke. The study showed a significant but clinically small initial improvement in the mobility and gait speed of users. But the treatment outcome was not sustained after the programme ended (Baskett et al. 1999). Another study was also unable to demonstrate the treatment effect on patients' daily or social activity, anxiety, depression and number of falls, or on the emotional stress of carers (Lord 2003). As much effort was invested to prevent and manage post-stroke complications (McGuire & Harvey 1999), a self-directed learning module targeted at healthcare workers caring for stroke patients which highlight the diagnosis and treatment of co-morbidities and complications (Moroz et al. 2004) has been introduced, and also adopted in Hong Kong. As another strategy to foster closer monitoring and the provision of informational support to hospital and community healthcare providers of stroke patients, telephone follow-up were tried. Telephone interviews have been used prospectively in stroke studies to evaluate clinical outcome, functioning and disability after stroke, cognitive status, stroke-free status and cognitive function in community out-patients (Merino et al. 2005). The use of a single rater was suggested to ensure the reliability of data collection, and this method was shown to be useful in 8 allowing more cost-effective monitoring of stroke rehabilitation progress. Along the same lines, ‘tele-rehabilitation’ for community-dwelling stroke clients has been tried in Hong Kong and seemed to be well received. The pilot study demonstrated the feasibility, efficacy and high level of acceptance of tele-rehabilitation for community-dwelling stroke clients (Lai et al. 2004). Some previous studies have adopted a system approach for stroke interventions. System approach in stroke care emphasizes an organizational rearrangement involving corporate decision-makers and clinicians or healthcare providers at all levels. There have been two commonly discussed modes of the system approach. One study has compared the effects of an extended stroke unit service (ESUS) with the effects of an ordinary stroke unit service (OSUS) on long-term QoL. But only marginal benefits on QoL at 52 weeks compared with former service types were reported, and its routine use was therefore not recommended (Fjaertoft et al. 2004). Another study worked on the routine implementation of care pathways for acute stroke management or stroke rehabilitation in hospital (Hankey et al. 2003). Most of the results were non-randomised studies in which results might likely be influenced by potential biases and confounding factors. Cognitive interventions to improve post-stroke rehabilitation outcome or QoL have been examined. The following are the proposed rationales for recommending certain cognitive interventions recently: 1. The rationale was that knowledge of strokes and clear expectations of rehabilitation were important determinants of rehabilitation success. Thus providing information on these two aspects and monitoring of such psychological factors might help to promote positive outcomes (Clark & Smith 1999). 2. Potential use of cognitive therapy to reduce negative attitudes among stroke survivors may be indicated, as it has been shown that short-term parameters of stroke survivors predict worse long-term survival rates (Lewis et al. 2001). 9 3. Intervention to improve patient outcomes targeted on patients’ cognitive power, such as perceptions of control six months after discharge, was used to predict mortality three years after stroke. The outcome was significant (Johnston et al. 2004). 1.2.2 Geriatric depression Depression was defined as ‘the failure-to-thrive syndromes and represents a psycho-physiological response to a chronic, seemingly unresolvable stress’ (Fred et al. 1997). However, the diagnosis of depression requires a clear definition and the use of explicit assessment and diagnostic tools (Abram et al. 1995). The rising nation-wide concern about depression has been noted (Commonwealth department of health and aged care 2000; Dawson & Tylee 2001; European Commission-Health and Consumer Protection Directorate-General 2005; Murray & Lopez 1996). The growing concern about depression among the elderly was induced by the projected upsurge in baby-boomers who will be 60+ in two decades’ time. Current healthcare supply is unlikely to be able to meet the demand from this group, who may take up a large share of medical provision (Lo & Yeung 2001). In addition, geriatric depression (GD) that is likely to have an effect on patients’ perceived health may directly affect healthcare outcomes (Krause et al. 1998) and the use of social and medical resources (Johnson et al. 1992). Among patients with depressive symptoms, somatisation during medical consultations frequently occurs (Woo et al. 1994, National Institute of Mental Health 2003), thus increasing healthcare utilisation such as outpatient visits (Glasser & Gravdal 1997). This vicious circle may well aggravate the economic burden of serving elderly people (Murray & Lopez 1996, Glasser & Gravdal 1997). National morbidity statistics for England and Wales in 1981 showed that psychiatric disorders (9%) were the third most common cause of primary care consultations, following those concerning the respiratory (15%) and cardiovascular (11%) systems (Glasser & Gravdal 1997). Estimates from the US suggest that among adults aged 18 or over in a given year the prevalence of depression was about 9.5% (National Institute of Mental Health 2003). A complex random sample in five US communities with 18,571 adults in the Epidemiologic Catchment Area Study showed a life-time prevalence of depressive symptoms of 23% (Narrow 1998). 10 The prevalence of depressive symptoms among older adults is widespread all over the world (Illife et al. 1991, Woo et al. 1994, Liu et al. 1997, Lyness et al. 1997, Lu et al. 1998, National Institute of Mental Health 2003). Justifications for more healthcare concern towards geriatric depression include its chronicity (Pulska et al. 1999) and its association with mortality, in particular suicides (Yip et al. 1998, Pulska et al. 1999). Epidemiological data over 12 countries revealed an association between suicides and major depression among older adults (Conwell & Brent 1995). Similar results were obtained in local and subsequence studies (De Leo & Diekstra 1990, Yip et al. 1998, Denton 1999, Pulska et al. 1999, Davies et al. 2001). Other related studies on geriatric depression have increased exponentially all over the globe in the past few years. Some studies have examined the epidemiology of the GD (Mann 1992, Abram et al. 1995, Nussbaum 1997, Gallo & Lebowitz 1999, Forsell 2000, Haynie et al. 2001). These studies covered the predisposing factors (Krause & Liang 1992, Lyness et al. 1997, Leung 1998, Alexopoulos et al. 1999, Pulska et al. 1999, Badger & Collins-Joyce 2000, Forsell 2000, Hwang et al. 2000), detection and assessment (Rapp et al. 1988, Illife et al. 1991, American Psychiatric Association 1994b, Lam et al. 1995, Glasser & Gravdal 1997, Lee et al. 2006a), screening tools development (Radloff 1977, Brink et al. 1982, Chiu et al. 1994, Lee 1994, Lam et al. 1995, Boey 1999b), and treatment and management guidelines of GD in primary care (Glasser & Gravdal 1997, Scott et al. 2002, Gerstenlauer et al. 2003). 1.2.2.1 Assessment and prevalence of geriatric depression Prevalence of GD among Chinese subjects. Geriatric depression is common in the local territory and among Chinese people generally (Woo et al. 1994, Lam et al. 1995, Boey & Chi 1998, Leung 1998, Lee 2003, Lam et al. 2004). The prevalence of GD among Chinese subjects residing in Taiwan, Mainland China and Hong Kong was estimated to range from 10% to 35% in community samples. For example, the reported prevalence of GD among suburban subjects in Taiwan was 34.8%, using 11 out of 30 as the cut-off point in the Geriatric Depression Scale (Lu et al. 1998). But that from rural samples in Taiwan reached only 26%, using 5 out of 15 as the cut-off point in the Geriatric Depression Scale short form (Liu et al. 1997). The prevalence of GD in Mainland China was found to be 18.2% for a random sample of residents 11 aged 60 or over in Beijing, Shanghai and Guangzhou in the mid 1990s (Song & Chi 2001). The Center of Epidemiologic Studies of Depression scale (CESD), with a cut-off point of 16 or over indicating depression, was used in Song’s study. Typical problems occurred in comparing results of these studies, which had adopted different assessment tools or used different cut-off points with the same scale on Chinese subjects who may be residing in different parts of Asia. Prevalence of GD in Hong Kong. In Hong Kong, as far as community samples were concerned, the prevalence estimate ranged between 10% (Lee 2003) and 35% (Woo et al. 1994). One study reported an adjusted prevalence of geriatric depression to be as high as 35% (29.2% for male subjects and 41.1% for female subjects) from a stratified random sample of more than 1500 subjects, age 70+, receiving old age and disability allowance (Woo et al. 1994). Another local study recruited subjects from old-age homes (n=252) and old-age Centers (n=644), and yielded a lower GD prevalence: 11% and 10% respectively (Leung 1998). Both studies used the Geriatric Depression Scale short form (GDS-SF) as the screening tool. Eight or over was used as the cut-off point indicating depression (see Table 1.1). Among more than 700,000 older citizens (aged 65 or over) in Hong Kong, less than 20% were receiving disability allowance, and less than 10% were living in institutions (Social Welfare Department 2003). Frequent morbidity among older adults is common (Lo & Yeung 2001), though they do not necessarily suffer from self-care deficits at the same time. A recent cross-sectional study has estimated that 10% of 1,130 ambulant older adults (60+) suffer from depressive symptoms as assessed by GDS-SF (Lee 2003) (see Table 1.1). Such a figure is close to a previous local study recruiting members of old-age Centers or homes in which the majority of residents can undertake self-care and are mobile (Leung 1998). 12 Table 1.1 Prevalence of GD in Hong Kong Leung, 1998 Woo et al, 1994 Lee, 2003 Convenience sample from Stratified random of elderly Convenience sample of Elderly Home (EH) and Elderly people receiving disability Community dwelling older adults Center (EC) allowance N= 1130 attendees N= 252 (EH); N= 644 (EC) N=1511 N=140 non-attendees Age age 60 or over age 70 or over age 60 or over Screening GDS-SF (cut-off point: >/=8) GDS-SF (cut-off point: >/=8) GDS-SF (cut-off point: >/=8) 11% (EH); 35% 10% (attendees) Sample Tool Prevalence of 10% (EC) GD GDS-SF: Geriatric Depression Scale – short form 1.2.2.2 Factors associated with geriatric depression Most studies have identified multi-faceted rather than unidimensional predictors or risk factors for GD. Common risk factors may be categorised as follows: (1) socio-demographic, (2) health status, (3) psychosocial support and (4) life events. Socio-demographic factors. Some studies have mentioned that GD tends to increase with age (Woo et al. 1994, Blazer 1997, Kotila et al. 1998, Lu et al. 1998). But such a relationship becomes insignificant when age is put into a regression model together with physical impairments (Woo et al. 1994, Forsell 2000). Two studies reported that males were more prone to GD (Woo et al. 1994, Lam et al. 1995), especially males in the old-old age group (80 years old or over). The Department of Health in Hong Kong reported that men were 51% more likely to commit suicide than women. Almost half of the male subjects reported that they had felt depressed during the past 12 months (Department of Health 1999). Conversely, some studies have also suggested that females are more prone to GD (Zunzunegui et al. 1998, Harwood et al. 1999, Wang 2001), especially widows, as remarked in a local report (Woo et al. 1994). Other less frequently mentioned demographic factors include poor financial status (Woo et al. 1994, Krause et al. 1998, Chong et al. 2000). In fact, Blazer has proposed a similar list of possible risk factors in different samples: male over 55, painful or disabling physical illness, living alone or financial problems and recent bereavement (Blazer et al. 2000). 13 Health status. Health status in terms of the number of co-morbidities (Kurlowicz 1997, Zunzunegui et al. 1998, Forsell 2000, Ormel & Von Korff 2000, Song & Chi 2001) or a history of psychiatric or mood problems (Pulska et al. 1999) were found to correlate significantly with GD. Increased levels of dependency resulting from a chronic disease were proposed as the root cause of GD (Femia et al. 1997, Badger & Collins-Joyce 2000). One study has established the comorbidity of cognitive decline with depression. 500 85-year-old people in the community were interviewed annually for four years. The development of depressive symptoms co-existed with cognitive impairment. On the other hand, the presence of depression alone might not increase the risk of cognitive decline (Vinkers et al. 2004). Psychosocial support and life events. The role of buffering factors for GD, such as social support especially from children and spouse, were found to have a protective effect against GD (Woo et al. 1994, Kurlowicz 1997, Bee et al. 1998, Krause et al. 1998, Lu et al. 1998, Denton 1999, Forsell 2000, Song & Chi 2001). Low emotional support from children, lack of a confidant and few social activities were found to relate to depressive symptoms identified by CESD among 1116 subjects (Zunzunegui et al. 1998). Life events refers to the presence of current loss or bereavement (Forsell 2000, Hwang et al. 2000) or other unhappy episodes in life (Kurlowicz 1997). A local study also looked into the effect of perceived autonomy among residents in elderly homes, and found that the more autonomy the elderly had in daily chores, the less prone they were to suffer from depression (Leung 1998). A sense of lack of control were independently associated with high levels of depressive symptoms (Zunzunegui et al. 1998). 1.2.2.3 Interventions for geriatric depression Use of oral anti-depressants. A systematic review of the efficacy of anti-depressant classes for the depressed elderly is available. A total of 32 trials provided data for systematic analysis, and 17 studies contributed data towards the efficacy analysis. These studies were carried out from 1986 to 2001 and most (12 out of 17) had a sample size smaller than 50 in each or both of the arms. The paper reported tentative evidence regarding efficacy as a change in the Hamilton Depression Rating Scales 14 (usually a reduction of 50% or a drop below a preset score). Secondary outcome included the total withdrawal rates associated with each class and the description of side-effect profiles as the third study outcome (Mottram 2006). The inclusion criteria for the review were: 1. Randomised control trials comparing at least two oral anti-depressants; 2. Depressed older adults, aged 55+; 3. Settings for subject recruitment: in-patients, outpatients or communities; 4. Anti-depressants groups: these were grouped according to the British National Formulary (British Medical Association 1999) as follows, with some examples: z Classical tricyclic anti-depressants: amitriptyline, clomipramine, desipramine, dothiepin, doxepin, imipramine, nortriptyline, nomifensine, trimipramine z Tricyclic-related anti-depressants: maprotiline, mianserin, trazodone z Selective serotonin e-uptake inhibitors (SSRI): paroxetine, fluoxetine, citalopram, fluvoxamine, sertraline z Atypical anti-depressants (all newer anti-depressants that do not fall into this list): z buspirone, venlafaxine, reboxetine z monoamine inhibitors (MAOI): phenlzine, moclobemide The main findings indicated that both classical and related tricyclic anti-depressants were equally efficacious when compared with SSRIs. In terms of withdrawal rates due to side effects, classical tricyclic anti-depressants were significantly higher compared with SSRIs but not the tricyclic-related anti-depressants. The authors advised caution in the use of their results as the relatively small number of studies (when examined by anti-depressant group) restricted the nature and validity of conducting sub-group analysis on these differing populations, including different types of depression. In examining comparative efficacy data, findings have been limited through small sample sizes and poverty of data, thus potentially limiting the implications of the findings (Mottram 2006). 15 Use of non-pharmacological interventions for depression. Besides oral medication, different interventions have been introduced to treat or alleviate depressive symptoms among older adults. Exercise and psychotherapy are two of the most researched interventions. 1,801 primary care patients aged 60 or more with major depression, dysthymia or both were randomly assigned either to a 12-month collaborative care intervention or to standard care for depression. Significant effects were observed between intervention and control groups (Hunkeler 2006). A nurse-led programme aimed to pilot the effect of social interaction sessions delivered by volunteers with residents in old-age homes after in-depth depression and psychosocial assessment. The social interaction sessions were held twice weekly for a 12-session programme for volunteers, and an evaluation of the intervention outcome in a RCT study. A significant reduction in depression was reported between the treatment and control groups (McCurren et al. 1999). Using exercise to reduce depression seems promising though concrete evidence is not available because of poor data (Lawlor & Hopker 2001). A later study on 2,000 older adults claimed that physical activity had a protective effect against depression (Strawbridge et al. 2002). 1.2.3 Depression after stroke Despite suspicions of frequent psychological comorbidity among stroke survivors, formal studies on depression after stroke were not conducted till the early 80s (Feibel & Springer 1982, Robinson et al. 1985, House 1987, Primeau 1988). The research was directed towards testing hypotheses and explaining the causation of DAS after formal identification of prevalence or incidence of DAS in various populations. A detailed discussion of the available studies to test various hypotheses will be offered in a forthcoming section. 1.2.3.1 Impact of DAS Researchers have made it explicit that one of the compelling reasons for 16 studying DAS is the burden it imposes on multiple parties (Robinson 1997). Multiple comorbidities among DAS victims have been reported. Various functional losses are found (Johnston et al. 2004, Muslumanoglu et al. 2004), in particular after discharge (Nannetti et al. 2005). Depression is a frequent and clinically relevant sequela in patients who have suffered from an attack of single or repeated cerebrovascular lesions. Despite the contribution of 20 years’ study, there are still too many questions and too few answers regarding the pathophyisology of DAS. The challenge originated from the variations in diagnostic approach and nosographic status, as well as the complex nature of multifaceted disease etiology and the diversity of clinical outcomes that depression, stroke or DAS may individually bring forth (Provinciali & Coccia 2002). The chronicity of DAS adds a further burden as it persists beyond the first year once detected (Catapano & Galderisi 1990, Everson et al. 1998, Britta et al. 1999). Depression has been reported as the strongest factor associated with the Philadephia Geriatric Center Morale score among a group of stroke survivors three years post stroke (Britta et al. 1999). Later study also identified DAS as one of the predictors of quality of life (Carod-Artal et al. 2000). Quality of life (QoL) was shown to be the most affected among patients with emotional complications besides stroke or chronic pain (Frühwald et al. 2001). Results showed a negative impact of DAS on the functional recovery process after discharge, which had not been the case during hospitalization (Nannetti et al. 2005). Only two studies disputed the effect of DAS on rehabilitation parameters (Miller 2000, Johnston et al. 2004). Comorbidity of DAS was also reported in 47.5% of major depressed stroke patients who had anxiety disorder at the same time. And of those with anxiety disorder, 27.5% suffered major depression (Beekman et al. 2000). DAS was associated with higher mortality (Everson et al. 1998, Gupta et al. 2002, Williams et al. 2004) even after adjustment for factors associated with stroke severity at 12 or 24 months (House et al. 2001). One in 11 patients (26/300) seen at the general neurology clinics had given serious thought to committing suicide in the past two weeks. Almost all of these patients (23/26) had major depression (Carson et al. 2000a). 17 1.2.3.2 Incidence and prevalence of DAS There have been studies recruiting national samples (Burvill et al. 1995, Beekman et al. 1998, Weimar et al. 2002, Eriksson et al. 2004). The Perth Community Stroke Study (PCSS) was population-based and examined the incidence, causes and outcomes of acute stroke. Among 294 patients, the incidence of depressive illness four months after stroke was 23% (18-28%), 15% (11-19%) major depression and 8% (5-11%) minor depression (Burvill et al. 1995). Using a case-control study design in another large community-based study of 3,050 older people (aged 55-85) in three regions of the Netherlands, the prevalence of depression in survivors of stroke, measured by the Center for Epidemiological Studies Depression Scale (CESD), was estimated to be 27%, significantly higher than the base rate (OR 2.28, 95% CI 1.61-3.24) (Beekman et al. 1998). In Germany, 67% of 4,264 stroke survivors were followed up at 100 days and one year post-stroke. The incidence of DAS assessed by CESD with a cut-off point of 10 was estimated to be 32.9% (Weimar et al. 2002). A Swedish national sample of 15,747 stroke survivors were asked about depressive mood and anti-depressant treatment 3 months after stroke via the telephone. 12.4% of male and 16.4% of female stroke survivors reported that they always or often felt depressed. The variable self-reported depression (yes/no) was the primary outcome variable in this study (Eriksson et al. 2004). Among rural Taiwanese, a study has compared depression among 45 stroke patients with older adults in general as control (n=1,471). The prevalence of depression using 15-item GDS with a cut-off point of 5 was 62.2% and 33.4% respectively (Fuh et al. 1997). Among Chinese samples (in Hong Kong), DAS was estimated at between 16.4% (Tang et al. 2005) and 24.0% (data already published; see Publications) in two separate studies using DSM IV. In fact, the range of incidence or prevalence estimated in different countries can vary quite widely, depending on the tools and the cut-off point chosen for decision-making. The American Heart Association has stated that some 11-68% of stroke survivors suffer depression, of whom about a third suffer major depression (Kelly-Hayes et al. 1998). The temporal relationship between stroke and onset of DAS has been studied. Studies generally argue that depression is very common in the first year after stroke. The pattern and causes of depression onset among stroke victims at the early phase 18 (1-6 months) may differ from what occurs at later time (>1 years) in terms of vegetative state and psychological functions. The findings have implications for depression recognition and assessment (Tateno et al. 2002). Studies undertaken at different time points are presented chronologically below: Admission – 2 weeks. An Irish sample showed that 10 out of 50 participants (20%) met criteria for major depressive disorder on admission or within seven days (Cassidy et al. 2004). In another pool of stroke survivors, aged 27-70, depressive symptoms were relatively common two weeks after the first clinically significant stroke (27% Beck Depression Inventory >/=10). The prevalence of major depression was only 5.6% (Berg et al. 2001). But early onset of depression (ie immediately after stroke, in the first or second week) has been regarded as a normal reactive mood that is secondary to the sudden onset of a debilitating disease rather than having any endogenous origin (Jones et al. 2000, Nys et al. 2005). Hospital discharge - one year. Fifty-two patients in a rehabilitation Center were assessed for depression using the Hamilton Rating Scale for Depression on admission to and discharge from the rehabilitation Center. Upon discharge, depression estimated for the first-ever stroke patients was 28.6% (Loong et al. 1995), and it was noted that patients’ moods did not correlate with degrees of functional impairment as reflected by scores on Barthel Activities of Daily Living (Loong et al. 1995). A study was undertaken at three months after stroke to assess the stability of depressive symptoms. It showed that 46% (n = 23) of the total sample described fewer depressive symptoms; while 44% (n = 22) indicated more depressive symptoms, and 10% (n = 5) showed no difference from the depression scores at the tenth day from discharge (Popovich et al. 2002). In another study at 3 months, 41% of 297 first-ever stroke survivors in Bangladesh were identified as depressed on the Beck Depression Inventory (BDI) against 18% of the control group (p <0.001). The rate did not decrease at the one-year follow-up (42% versus 19% at one year, p<0.05) (Hayee et al. 2001). A further study also supported the finding that DAS could be a stable and chronic phenomenon from inception (Carson et al. 2000b). 19 Beyond one year. In studies undertaken after a year or more, the prevalence did not seem to decrease significantly. Berg et al. (2003) reported 54% of all participants studied felt at least mildly depressed at some time during the follow-up; 46% of those who were depressed during the first two months were also depressed at 12 or 18 months. Another 12% or so were depressed for the first time at 12 or 18 months (Berg et al. 2003). Another study looking at the prevalence of DAS at 3 years, estimating about 34% (62 out of 180 participants) were depressed using a score of 14 on the BDI as a cut-off point (Angeleri et al. 1997). Despite the above evidence on DAS incidence and prevalence, counter arguments were also presented. Burvill and colleagues (1997) argued that DAS is no more common than ‘ordinary’ depression in older people. Another study revealed that depression occurred equally often during the first year after stroke and after myocardial infarction when non-specific factors such as sex, age and level of handicap were taken into account. Thus the relatively high incidence of post-stroke depression seemed not to reflect a specific pathogenic mechanism (Aben et al. 2003). Another study used a structural-equation modelling approach to examine depression symptom endorsement between geriatric stroke patients and other geriatric patients. Results indicated that stroke patients did not suffer more severe depression (Mast 2004). 1.2.3.3 Risk factors and predictors of DAS To allow a systematic analysis over multiple interwoven factors, the domains used in this thesis are grossly categorised into bio-anatomical domain, cognitive and communicative domain, dependency and somatic domain, emotional domain or family and social support domain. The inclusion of this information is indicated to form a baseline reference for the comparison of impact resulting from DAS as identified by this study. The hypotheses of DAS causation are closely related to the five domain factors. The conceptual framework or schematic view of the respective domains of risk factors or predictors for DAS is given in Table 1.2 below. 20 Table 1.2 Conceptual framework in postulating DAS causality Endogenous Model Functional Model Relationship Model Bio-anatomical domain Cognitive and communicative Emotional domain domain y Anatomical hypothesis y Vascular hypothesis y Biochemical hypothesis Dependency and somatic symptom Family and social support domain domain y It relates to innate and fixed y It relates to the compromised y It relates to human factors, clinical states, relatively less functions and tasks as an both the stroke victims and manipulations can be made immediate consequences of those with a relation with once stroke outbreak for the stroke; highly modifiable but him/her; anatomical hypothesis, but still subjected to clinical states more interventions are resulted from stroke deficit y These domain factors are possible for vascular modifiable and not hypothesis and biochemical necessarily tied with previous hypothesis models theoretically Arguments: Arguments: Arguments: This biological changes in brain Dysfunctions and somatic symptom The worries and anxiety resulted resulted from stroke lead to DAS after stroke lead to DAS directly from the sudden stroke; lack of directly buffering factors (family and social support), depriving stroke patients’ coping resources, lead to DAS directly Bio-anatomical domain. Scientists have attempted to look for specific evidence outside the clinical association to explain a pathophysiological mechanism behind DAS. Such findings have important implications for assessment and treatment modalities (Hinkle 1998). Under the bio-anatomical domain, three different hypotheses can be advanced for the explanation of DAS: anatomical, vascular and biochemical. Within the anatomical hypothesis, the lesions’ location and laterality, brain-area involvement and size of lesions were studied (Robinson et al. 1990, MacHale et al. 1998, Berg et al. 2001, Rao 2001, Spalletta et al. 2003, Vataja et al. 2004). Robinson and Starkstein have proposed that the side of brain lesion may impact on DAS, and also the involvement of cortical or subcortical lesions (Robinson & Starkstein 1990). Nelson (1994) suggested that patients with left-sided lesion showed a slower recovery at 2 months after stroke, whereas emotional functions worsened mainly for those with right-sided lesions at 6 months (Nelson et al. 1994). Harrington and Salloway (1997) has suggested that anterior subcortical lesion will increase the risk of DAS. But the 21 relationship between laterality and DAS is not duplicated by other researchers (Angeleri et al. 1993, Agrell & Dehlin 1994, Angeleri et al. 1997). Also, a recent systematic review by Carson and his team did not support the effect of the location of the brain lesion on DAS (Carson et al. 2000b). A later study then identified that depression was associated with more severe stroke, particularly in vascular territories that supply limbic structures (Desmond et al. 2003). Another study claimed that subcortical and anterior cerebral artery (ACA) lesions were independent risk factors for poststroke depression (Tang et al. 2005). On the other hand, Aybek (2005) has refuted any association between acute emotional behaviour after stroke and neurological impairment or lesion localisation. Another subcategory in the bio-anatomical domain is the vascular hypothesis. Dieguez et al. argued that post-stroke depression was a vascular depression (Dieguez et al. 2004). To test this hypothesis, Mast et al. (2004) compared three groups of patients to inspect the relationship between cerebrovascular risk factors and depression. Data from 670 geriatric rehabilitation patients were incorporated to compare the frequency of depression in three patient groups: (1) those with no evidence of vascular disease or stroke, (2) those with cerebrovascular risk factors but no evidence of stroke, and (3) patients with stroke. His team identified a significant relationship between the second group of patients and frequency of depression (Mast et al. 2004). A more recent study on the effect of haemodynamic factors on depression in late life suggested that the observed reduction in cerebral blood flow velocity measured by Transcranial Doppler Ultrasound could be the result of reduced demand in more seriously depressed cases as a DSM-IV disorder, whereas lowered carbon-dioxide induced cerebral vasomotor reactivity is a possible causal factor of sub-threshold depressive disorder (Tiemeier et al. 2002). Further study also supported this hypothesis, that cerebrovascular reactivity was significantly reduced in depressed patients (Neu et al. 2004). However, whether the reduced cerebrovascular reactivity among depressed stroke patients is a cause or an effect remains largely unknown and requires further study. The third sub-category of the bio-anatomical domains involves the biochemical nature of depression, in particular the serontonin activity. Mayberg (1991) has 22 identified some temporal changes in cortical selective serotonin re-uptake inhibitors (SSRIs) receptors post-stroke. There was only compensatory up-regulation of 5HT2 receptors in the right hemisphere but not on the left side (Mayberg et al. 1991). The results differed from an earlier study, where no difference in platelet 5-HT uptake was found across depressed and non-depressed subjects six months after stroke (Barry et al. 1990). But available evidence shows that post-stroke pathological crying is induced by partial destruction of the serotonergic raphe nuclei in the brainstem or their ascending projections to the hemispheres (Andersen 1997). Mayberg attempted to explain a biochemical origin of depression causation in two possible pathways, as evidenced by a set of post-treatment imaging results that signaled different neurological pathways of depressed subjects using cognitive behaviour therapy (CBT) or oral anti-depressants respectively. He added, ‘Anti-depressant drugs change the neuro-chemical balance in the brain through effects at specific target sites. Cognitive behaviour therapy also changes brain activity: it's just tapping into perhaps a different functional component of the depression circuit board.’ (Quoted in Mayor 2004, pp 7431). Cognitive and communicative domain. Occurrence of dementia among stroke patients is frequent. DAS was shown to correlate with both physical and cognitive impairment (Robinson 1997). Cognitive decline was found among 61.7% of stroke patients (Pohjasvaara et al. 1997), and was significant as a factor associated with depression in another study (Kauhanen et al. 1999). There was a concern that overlapping mood and cognitive symptoms made detection less explicit (Bourgeois et al. 2004). Interestingly, the association between depression and cognitive impairment was reported to occur primarily in patients with left-hemisphere lesions, and was strongest during the acute post-stroke period (Kurz 1997). Dementia was associated with female gender, age and lower education level (Madureira et al. 2001). Abnormal illness behaviour was also reported among some stroke survivors (Clark & Smith 1998). Like depression, DAS has been explained by cognitive theorists as behavioural sequela of irrationality and errors in one’s thinking process. This argument has some support in that significantly more negative cognitions and fewer positive cognitions were found among stroke patients who were depressed than among stroke patients 23 who were not (Nicholl et al. 2002). Despite such evidence, the cognitive depression hypothesis was refuted in a study showing that patients with major post-stroke depression whose mood improved at follow-up had significantly greater recovery in cognitive functioning than patients whose mood did not improve, suggesting that major post-stroke depression leads to cognitive impairment and not vice versa (Murata et al. 2000). Another earlier study examining cognitive function among a cohort of 74 stroke subjects in the Framingham Study also found that post-stroke patients suffered more depression as assessed by CESD, but their intellectual decline appeared to be independent of the presence of depression (Kase et al. 1998). Dependency and somatic symptoms domain. Many studies have reported the effect of post-stroke disabilities, body discomforts and self-care dependence on depressive symptoms (Fuh et al. 1997, Beekman et al. 1998, Paradiso & Robinson 1998, Kao 2000, Lalasingh-Nixon 2001, Gainotti & Marra 2002, Weimar et al. 2002, Eriksson et al. 2004, Johnston 2004, Muslumanoglu et al. 2004, Nannetti et al. 2005). Studies advocating the reactive depression hypothesis argued that DAS was primarily a normal reactive response to the loss of body functions and stress arising from increasing dependency at about one month after stroke onset, rather than of endogenous origin (Jones et al. 2000), in particular the earlier phase of stroke (Nys et al. 2005). DAS was significantly associated with the level of disability recorded by the Functional Independence Measure (FIM), and level of handicap recorded by the Nottingham Extended ADL Index (NEADLI) and left-hemisphere stroke, at four time points in the first year (3, 6, 9, 12 months) (Gottlieb et al. 2002). Kao (2003) found that patients' functional ability was the strongest predictor for DAS among Taiwanese. Several stroke-induced complications are well documented. Neuropathic or central pain has been estimated to occur in up to 8% of patients after a stroke. Functional disturbances such as depression, anxiety and sleep disturbances are significant comorbid conditions associated with central post-stroke pain (Hansson 2004). This is a further example showing comorbidity of emotional domain factors on physical somatic domain factors. Constipation is recognised as a serious problem 24 in clinical practice, affecting 60% of those in stroke rehabilitation wards (Robain et al. 2002). But a single educational intervention has effectively improved symptoms of bowel dysfunction up to 6 months later, changing bowel-modifying lifestyle behaviours up to 12 months later (Harari et al. 2004). Stroke patients are notoriously susceptible to fall episodes (Jorgensen 2002). Among the stroke patients, depressive symptomatology predicted falls, which are more frequent among non-institutionalised long-term stroke survivors than among community control subjects (Jorgensen et al. 2002). This forms a useful clinical example to demonstrate the temporal effect of depression on falls, though the reciprocal occurrence can also take place. It illustrates the complexity of studying DAS when factors in different domains may interact in two directions. Straightforward as it is, the dependency level of stroke survivors may also be affected by the confounding effect of family functioning and somatic problems. One study was able to identify family functioning as a significant factor directly influencing lifestyle activities and self-care performance rather than the patient’s ability to carry out self-care functions at six and twelve months (Clark & Smith 1999). Other noxious somatic symptoms may also have an impact on self-care functions. Thus guidelines for caring for older community dwellers reiterate the need to ensure the adequacy of pain control in patients with chronic pain, and to assess its relationship to depression (Gerstenlauer et al. 2003). It has been suggested that sub-threshold depression is co-morbidity with somatic illnesses and physical disability (Geiselmann et al. 2001). Pre-morbid somatic complaints are common in old age. The fact that there is a reciprocal relationship between somatic symptoms and DAS has complicated the DAS causative model. Emotional domain. This area has earned more attention over the past decade. Some argue that the effect of the emotional domain on stroke survivors may have superseded the other domains, and are supported by some studies (Jonkman et al. 1998, Kim et al. 1999, Kauhanen et al. 2000, Perry & McLaren 2004). Among various mood exhibits, depression was most prevalent, with anxiety disorder, fatigue and psychosis less common among stroke survivors (Bourgeois et al. 2004). The degree of depression on admission was a good predictor of the clinical outcome of the final physical 25 impairment (Loong et al. 1995). Emotional health, independent of other baseline measures, is associated with recovery in functional ability one year after stroke (Chemerinski et al. 2001). The findings suggest that reducing pre-morbid levels of depressive symptoms (during initial stroke admission) or increasing positive affect may help the recovery process (Chemerinski et al. 2001, Ostir et al. 2002). Additionally, in a case-control study with 290 stroke inpatients, non-depressed patients were nearly twice as likely to show an excellent recovery rate in both self-care and mobility as the depressed patients (Paolucci et al. 2001; Parikh et al. 1990). One study has suggested that about 10% post-stroke patients fulfilled criteria for post-traumatic stress disorder (PTSD) (Sembi et al. 1998). Other findings have reported the development of suicidality among stroke survivors (Kishi et al. 1996, Kishi et al. 2001, Pohjasvaara et al. 2001), thus pointing to direct and indirect causes of mortality (Robinson 1997, Everson et al. 1998). Family and social support domain. The importance of social support in reducing the neuro-behavioural consequences of stroke has also been discussed over the last decade (Swartzman et al. 1998). The most significant predictor for social functions after stroke in Angeleri’s study (1997) was depression. Multiple regression analysis from another study revealed that ‘worrying about disease’, ‘worrying about family’ and informational support from family, relatives and friends accounted for 22.1% of the variance in depression (Li et al. 2003). The role of family support has been regarded as a buffering factor against suffering and might enhance the quality of life of stroke survivors (Swartzman et al. 1998, Kim et al. 1999, Jaracz & Kozubski 2003, Tang et al. 2005). Results from 87 survivors indicated that larger social networks were associated with fewer limitations in physical function and a lower risk of institutionalisation (p<0.05), controlling for relevant health and socio-demographic conditions (Cohen-Mansfield & Taylor 1998). The discussion over the role of social support in relation to DAS at different time points was less explicit. Some authors proposed that psychosocial factors were more important in the medium term (from six months to two years after stroke) (Astrom et al. 1993). But Robinson has remarked that social support is particularly important in the first few weeks, as are material needs such as finance following the acute phase 26 (Robinson et al. 1999). Recently the families or care-givers of stroke survivors have also reported compromised QoL due to an overwhelming care-giving burden (Angeleri et al. 1993, Anderson et al. 1995, Martin et al. 1998, Chumbler et al. 2004). Increasing evidence has shown the frequency of depression among carers of stroke patients (Tompkins et al. 1988, Angeleri et al. 1993, Dennis et al. 1998) in particular when patients have been dependent before stroke (Dennis et al. 1998). This information signifies a deeper understanding regarding the dynamics and hidden agenda in a possible reciprocal relationship between social and family support and DAS in stroke patients. It is hoped that this study may offer some insights into the role of social support domain factors on DAS. Demographic and other factors. Age was one of the most common confounding factors on DAS causality, with the older age groups having a higher risk (Berg et al. 2001; Fuh et al. 1997; Kao 2000). While others found no such relationship (Gesztelyi et al. 1999, Nys et al. 2005) or proposed that ages younger than 65 would be a risk factor (Beekman et al. 2000, Eriksson et al. 2004). Regarding gender and its relationship to DAS, females have been reported more susceptible, and such a view predominates in the literature (Cassidy et al. 2004 ; Desmond et al. 2003; Eriksson et al. 2004; Miller 2000; Paradiso & Robinson 1998; Tang et al. 2005; Weimar et al. 2002), except in one study (Berg et al. 2003) which suggests the opposite. One study found that women with major depression had a greater frequency of left-hemisphere lesions than men. Major depression among men was associated with greater impairment in daily living activities (Paradiso & Robinson 1998). Others did not identify any gender effect on DAS (Burvill et al. 1995, Nys et al. 2005). 27 1.3 Indications for current study 1.3.1 Gaps in previous studies Taking a stance from the above arguments, research into the incidence and predictors as well as the interventions of DAS is indicated. Undue attention to help DAS victims, who are likely to be suffering from a triple burden, is ethically unacceptable. But there are two major unanswered questions to be considered before addressing the condition in the treatment paradigm. The prevalence of DAS among Chinese needs to be quantified. If DAS is a common phenomenon, then we need to study the risk factors and the predictors of DAS. The present study has been initiated against such a background and rationale. And related research is not readily available in Chinese populations at the commencement of this research. 1.3.2 Research questions The research questions of the current study are as follows: z What is the incidence of DAS among Chinese subjects who have ischemic stroke for the first time? z What are the risk factors and predictors for DAS? z What are the changes in various domains factors among stroke survivors during the acute phase (1 month) and after active rehabilitation (6 months)? z What is the clinical outcome of the depressed stroke survivors at one month and six months? z In line with the literature, what are the recommended interventions for DAS? 28 Chapter 2 Methods 2.1 Aim and objectives of study (31) 2.2 Study design (32) 2.2.1 Justification of study design (32) 2.2.2 Ethics approval and consent (33) 2.2.3 Study procedures (34) 2.3 2.2.3.1 Record reviews (34) 2.2.3.2 Interviews (35) Sampling (37) 2.3.1 Target populations (37) 2.3.1.1 Inclusion criteria (38) 2.3.1.2 Exclusion criteria (39) 2.3.2 Sampling method (39) 2.3.3 Sampling size (39) 2.4 Data collection (41) 2.4.1 Study outcomes - the incidence and predictors of DAS (41) 2.4.1.1 Tools for diagnosing and quantification of depression in patients suspected of DAS (41) y DSM IV y GDS y CESD 2.4.1.2 Use of smiley diagrams to detect depression in patients suspected of DAS (44) 2.4.1.3 Health literacy regarding depression (45) 2.4.1.4 The domain factors associated with DAS and predictors of DAS (46) y Bio-anatomical domain y Cognitive and communicative domain y Dependency and somatic symptom domain y Emotional domain y Family and social support domain y Socio-demographics and other clinical sequelae 29 2.4.2 DAS interventions (50) 2.4.3 Pilot study (50) 2.5 Data analysis (53) 2.5.1 Data management (53) 2.5.2 Patients’ demographic and health profiles (53) 2.5.3 Validity of the assessment tools (53) 2.5.4 Incidence of DAS at one month and six months (54) 2.5.5 Risk factors and predictors of DAS (54) 2.5.6 Changes of domain factors from one month to six months (56) 2.5.7 The clinical outcomes of stroke survivors (56) 2.5.8 Qualitative analysis – depression literacy (57) 30 2.1 Aim and objectives of study This study was aimed at identifying the incidence of depression after stroke (DAS), the risk factors and predictive factors at one month and six months after stroke onset. Basing itself on the findings of the primary outcome, the study continued to address the secondary outcomes in terms of detection of DAS, health literacy regarding depression among Chinese stroke patients and interventions in DAS. The study objectives were: 1. To estimate the incidence of depression among Chinese patients with first-ever ischemic stroke attack at one month and six months; 2. To identify the domain factors that are associated with and independently explain DAS at one month and six months; 3. To understand the changes in the five proposed domain factors: the level and significance of changes in the case of DAS; 4. To identify the factors at one month that can predict DAS at six months; 5. To examine health literacy in respect of depression among stroke survivors; 6. To explore clinical outcomes (use of formal healthcare and anti-depressants, institutionalisation, mortality, quality of life) in stroke survivors; 7. To discuss possible DAS interventions and implications for future research, practice and education. 31 2.2 Study design This study adopted a descriptive longitudinal study design. Longitudinal study is a non-experimental design that compares one group’s status at two or more points in time (Polit & Beck 2004). It is also referred to as panel studies, which attempt to identify the causal role of exposure to a risk factor in generating changes in health or causing disease (Strommel & Wills 2004). The researcher does not play an active role in the manipulation of the cause and effect relationship in an occurrence of a topic of interest. It is considered most appropriate if the phenomenon studied is either known or hypothesised to change over time. This helps to provide important information in the study of disease progressions such as the changes in quality of life, physical functioning and mental health of patients with particular chronic diseases (Kurtz et al. 2001, Strommel & Wills 2004). Thus exposure to ischemic stroke is considered an illness-causing agent or risk factor in respect of depression. A major merit of such designs is that they fulfil one major criterion for causality, and multiple clinical outcomes or potential consequences can be examined at the same time (Nurses Health Study 2002). Unlike a cohort study design, longitudinal studies do not have a control group. An inception cohort of depression-free first-ever ischemic stroke subjects was recruited for the present study. The medical records of participants were reviewed after obtaining their written consent and upon discharge to ensure that genuine stroke participants had been recruited and to facilitate the checking against the admission criteria of the study. This strategy helped to maintain the quality of the depression-free and stroke-free cohort, thus allowing a true incidence rate of DAS to be obtained. 2.2.1 Justification of study design A longitudinal study design was one of the commonest types occurring in the literature to identify the incidence of various disease and stroke conditions (Parikh et al. 1988, Bacher et al. 1990, Astrom et al. 1993, Colantonio et al. 1993, Nelson et al. 1994, Femia et al. 1997, Clark & Smith 1999, Singh et al. 2000, King et al. 2001, Aben et al. 2003, Forsberg-Warleby et al. 2004, Jorge & Robinson 2004, Toso et al. 2004, Whyte et al. 2004). It had also been used by national studies of DAS (Jonas & Mussolino 2000, Toso et al. 2004). The reasons for not incorporating a control group 32 were multiple: 1. Study objectives - There was no existing good quality study addressing DAS in Chinese speaking communities when our study was first launched in Hong Kong. A longitudinal study design was adequate to set the stage in understanding the occurrence, natural disease progression and predictors of DAS in Chinese, which were largely unknown. 2. Resources implications - Capturing a group of comparable older people who were free from cardiovascular risks including hypertension, diabetes and ischemic heart disease would involve prohibitive human and financial resources. 3. It was a logistic challenge to engage elderly stroke patients who were likely debilitated and suffering might make them unwilling/unable to talk with researchers. This was reflected in the fact that three hired research assistants were unable to obtain valid consent from the targeted number of first-ever ischemic patients (n=30) within three months during the pilot phase, signifying the challenge and practical difficulty for less experienced research staff. 4. The well established hierarchy and bureaucracy of Hong Kong hospital structure might not allow a researcher with nursing background working outside the hospital to carry out a study with a complex design involving multiple units in the hospital. This was evidenced by overnight breach of agreement to collaborate after six-months’ negotiation and ground work preparation in some hospitals. 2.2.2 Ethics approval and consent The study protocol sought ethics approval from the Institutional Review Board of the University of Hong Kong and the two regional hospitals to access patients’ medical records. The schedule of the research project was included in the study protocol to guide the momentum of the study (Appendix 2.1). All patients admitted to the stroke units of the two hospitals with a provisional diagnosis of stroke were screened for inclusion. Only those who fulfilled the preset inclusion and exclusion criteria were contacted in person or by phone for their consent. After an explanation of the study’s 33 purposes and its procedures, assurance would be provided to potential subjects regarding any influence on standard care and confidentiality of personal data. Participants were given time to clarify their queries before signing the consent form and one copy of the written consent was issued to the patient, one filed in his/her own medical records and the original kept by the researcher. Essential information such as the name and contact number of the researcher was given in the consent form (Appendix 2.2). Subjects were reassured of the right to withdraw from the study at any time without any influence on current medical and healthcare so as to ensure voluntary participations. During the consent stage, one of the nursing staff working at the stroke unit would be a witness and sign to verify suitable case selection. At times, patients’ significant others were also briefed about the purpose and arrangement of the study if indicated. 2.2.3 Study procedures Consecutive patients admitted to the stroke units of the two regional hospitals were screened with reference to their provisional diagnosis on admission for recruitment eligibility. The case identification phase fell between 1 June 2004 and 31 May 2005. The subjects who fulfilled both inclusion and exclusion criteria and gave their consent to participation in the study would form the inception cohort. 2.2.3.1 Record reviews With the approval of the respective hospital, the medical records of the consenting participants were studied at three different time points: (1) after obtaining consent to ensure adherence to inclusion and exclusion criteria and vetting the past medical history to rule out mental health history or stroke, and retrieving socio-demographic data; (2) after first interview at one month; and (3) following the second interview after six months. One of the most important indications for the first two record reviews was to screen out those with a documented medical history of depression and stroke. Where queries over the diagnosis or other ambiguity existed, the consultant neurologist’s final verification would be sought. The third review was conducted to capture qualitative data relating to depression assessment and treatment, 34 to supplement information during the natural course of disease progression from one to six months, such as concurrent life events or use of psychoactive drugs (see section 2.4.1.4). Additional record reviews were sometimes indicated if there was ambiguity over patients’ data, or missing laboratory or investigation results that were scheduled after hospital discharge. 2.2.3.2 Interviews Personal interview was one of the most frequent methods used for studying DAS, in particular among older subjects in Hong Kong. The reasons were as follows: Foster participation. Older Chinese adults, especially those depressed, might not be motivated to join any study revealing their ‘inner’ emotions as it is uncommon in this culture to readily disclose one’s emotions to strangers, particularly in those of the older generation. A face-to-face interview by a person showing empathy and comforting attitude was therefore needed to establish rapport first and then solicit sensitive and sentimental data. Low literacy in respect of depression. The stroke subjects were mostly older adults born after World War II and immigrants from the countryside in China with no or little formal education (Butters 1939, Endacott 1964, Tsang 2004). They seldom hear words like ‘depression, hope, hobbies’ and thus would have difficulty understanding the questions addressing symptoms of a major depression. Another barrier was that some older adults were reluctant or unable to disclose emotional pain masked by immediate and multiple dysfunctions due to stroke and other symptoms of concomitant diseases (Bond 1991, Piamarta et al. 2004). Alternative ways, such as self-completing postal questionnaires and telephone interviews of collecting depression and health data from older Chinese were infrequently used because of the low response rate and because older people were often guarded about disclosing personal information over the telephone as mentioned above. Validation of data. Questionnaires addressing medical, technical and clinical data might be hard to understand or easily misinterpreted by older Chinese with minimal 35 education. The problem might be further aggravated if the participants had suffered from mild cognitive impairment as a consequence of stroke. This further emphasized the need for a skilful interviewer to produce consistent and valid data Each participant was interviewed twice, or three times at most. The inception cohort was interviewed by the same research nurse twice: at one month and six months after first admission to the stroke unit. The nurse had 20 years’ working experience in clinical practice, research and gerontology. The use of a third interview was subject to the findings of depression status among the subjects. Confirmation of diagnosis was through consultation by a psycho-geriatrician (interview form in Appendix 2.3), blind to the emotional status of the subject. A mixed group of patients who were either depressed or from a randomly selected pool of non-depressed participants would be interviewed. This interview would take place after the second interview. 36 2.3 Sampling ‘How well a sample represents a population depends on the sample frame, the sample size, and the specific design of selection procedures.’ (Fowler 1993, pp.10) 2.3.1 Target populations The sampling frame of the study was the Eastern district of Hong Kong Island, one of the 18 districts in the Territory. Due to the small size of Hong Kong and the mobility of the population, as well as the non-exclusive nature of the eastern district, the assumption was made that the sample is representative of Hong Kong Chinese. It might also be justified as the residents’ profile is found in the middle range as shown in Table 2.1. The regional hospital in which the eventual sample was recruited serves a population of 590,400, 7.6% of the whole population (Hong Kong Census and Statistics Department 2004). The target population was the consecutive patients admitted to the designated regional hospital serving the Eastern district with a primary diagnosis of ischemic stroke for the first time. In this region, 6.1% of the residents had not had any schooling, 61% were married with the rest ‘never married’ (30.3%), ‘widowed’ (6.2%) or ‘divorced/separated’ (2.5%) (Hong Kong Census and Statistics Department 2004). The age and gender distribution of the target populations in the sampling frame was compared with other districts of Hong Kong as shown in Table 2.1 below. Because of considerations of resources, vast differences in new admissions and the clinical management of stroke patients, the sample studied was captured from the larger regional hospital only and the subjects recruited in another hospital and at an earlier phase were to be used to compile the pilot study data to improve the study design. 37 Table 2.1 Comparing the profile of sampling frame with other districts in Hong Kong. Mean for 18 Eastern district Minimum Maximum Sex ratio (per 1000 women) 847 766 998 929 3 Median age 40 34 40 38 13-18 Age range (25-64) 61.1 56.4 63.9 60 11-13 Age range (65+) 13.3 6.8 17.6 11.7 13 districts Rank (1=lowest) To evaluate a sampling frame, comprehensiveness, probability of selection and efficiency should be taken into account. As 90% of hospital admissions were taken up by the public sector, leaving only 10% attending private hospitals, in particular for serious disease episodes in Hong Kong (Department of Community Medicine 1998). The target hospital was an index hospital that was likely to have captured the majority of significant stroke episodes in the region. The sampling frame was to be comprehensive. Since admissions for stroke were concentrated in a stroke unit and coordinated by a stroke nurse, probability of selection could be ensured. To obtain an incidence, the recruitment of subjects within a one-year span was undertaken, to avoid seasonal variations in admission patterns. 2.3.1.1 Inclusion criteria Patients were recruited to the study if they: (1) spoke Chinese, (2) were 50 or over, and (3) had been admitted during the period of 1 June 2004 to 31 May 2005, (4) had first-ever ischemic stroke diagnosed by a neurologist. The diagnosis would be confirmed by the cardinal signs and symptoms of stroke attack using the International Classifications of Diseases Coding System, ninth edition (those between 434.00 and 436.00) (National Center for Health Statistics 2003) and/or supported by computerised tomography (CT scan) or magnetic resonance imaging (MRI) reports or discharge summary. 38 2.3.1.2 Exclusion criteria Exclusion criteria applied to patients who had: (1) a history of depression or other psychiatric disease before the onset date of stroke, (2) a history of brain damage, transient ischaemic attack or hemorrhagic stroke, (3) severe cognitive impairment as evidenced by a score on the Abbreviated Mental Test of 5 or below during admission, and (4) critical health status (such as a comatose state) with a score of 12 or below on the Glasgow Coma Scale. 2.3.2 Sampling method Consecutive first-ever ischemic patients formed the inception cohort. The medical notes were read to counter-check fulfilment of the inclusion and exclusion criteria for admission to the study after patients had given their consent. Most patients were captured during the hospital stay after acute admission to the stroke units. Some were discharged patients who had only a short hospital stay. They were contacted by telephone for preliminary verbal consent. Formal consent would be obtained when the interviewer met the potential participants at the first follow-up session. This group of participants would be interviewed right away after consent. 2.3.3 Sampling size Sample size was estimated using EPINFO software (Centers for Disease Control and Prevention 2005). Taking 5% as the level of significance, 80% as the power and allowing 3-5% margin of error to predict 10% incidence/prevalence (which is on the low side compared with previous studies), only 137 subjects was estimated. Taking into account dropouts and refusals, 50% more cases were added and the sample size was rounded up to 210 (see Table 2.2). In Hong Kong, more than 90% of hospital services are provided by the Hospital Authority (HA) which is wholly funded by the Government. Hospitalisation for acute stroke accounted for more than 25,700 in-patient discharges and deaths in all hospitals and 3,434 deaths in 2005 (Centers for Disease Control and Prevention 2005, Center of 39 Health Protection 2006). Of all stroke episodes, roughly 70% are the ischemic type and 30% haemorrhagic lesions (Yu 2003). The recruitment was possible as yearly admissions per hospital are estimated to be more than a thousand. Even after the application of the inclusion and exclusion criteria, the sample size was achievable bearing in mind previous annual hospital admission records for stroke cases Table 2.2 Sampling estimation using Epiinfo 2005 Population Survey or Descriptive Study Using Random < Not Cluster > Sampling Population Size 2,000 Expected Frequency 10.00% Worst Acceptable 15.00 % Confidence Level Sample Size 80 % 59 90 % 97 95 % 137 99 % 236 99.9 % 382 99.99 % 530 40 2.4 Data collection 2.4.1 Study outcomes - the incidence and predictors of DAS An 8-page questionnaire was designed to incorporate various measurement tools for variables in the study. It was referred to as the one-month questionnaire (Appendix 2.4). For the follow-up study that took place at six months from admission for first-ever ischemic stroke, the six-month questionnaire (Appendix 2.5) was used. 2.4.1.1 Tools for diagnosing and quantification of depression in patients suspected of DAS Depression was the outcome variable to be identified for this study, and both quantitative and qualitative data on depression would be sought. Measurement tools were considered and chosen on the nature of the target group and the tools’ psychometric properties, in particular the reliability and validity of respective instruments in the target sample. Though numerous assessment tools were available and used by clinicians in research and practice in Western literature, direct application to Chinese subjects was cautioned as depression specificity had been an unresolved issue (Aben et al. 2001). Complexity in assessing depression across culture were well documented, such as insufficient knowledge of depression, lack of cultural specificity and diversity in emotional expressions among older adults, inadequate communicative indicators to aid in detection, especially during the initial phase, though verbal indications were shown to be useful in achieving early detection and recognition (Robinson-Smith 2004). Researchers had therefore been careful about using tools that have been validated and targeted at Chinese. Even so, there is few large scale validation exercise in the world literature regarding the Chinese population in the past decades. To obtain quantitative evaluation of DAS, we adopted four different means of assessing depressive symptoms. Additional strategies were incorporated to collect 41 qualitative data for depression validation. Incidence of depression at two prospective phases would be assessed by four instruments. The Diagnostic and Statistic Manual (fourth version) was used as the gold standard to detect depression. For screening purposes, the Geriatric Depression Scale (short form) with 15 items in Chinese (GDS), the Center for Epidemiologic Studies Depression Scale (CESD) with 10 items in Chinese and three smiley diagrams, which served as adjunct assessment, were used concurrently with DSM IV. A detailed discussion justifying the use of these tools and their psychometric properties are given in the following sections. DSM IV. The DSM IV (American Psychiatric Association 1994), a generally accepted gold standard, was used in previous studies to study DAS (Rao et al. 2001, Aben et al. 2003, Toso et al. 2004, Cassidy 2004). Subjects were identified as depressed if they reported five out of the nine criteria, including either persistent low mood or lack of interest in daily living activities in the past week. Use of DSM criteria in detecting geriatric depression in community settings has been criticised for their limited effectiveness as many older adults might not display full bloom of depressive symptoms identified by DSM (Everson et al. 1998). At the same time, the use of screening tools was known to have more false positive results. This argument was supported by the findings of Madianos’s study in 1992 on the elderly population in Athens (Madianos et al. 1992). Twenty-seven percent of subjects were screened to have depression using a self-reporting questionnaire. But only 10% were considered to have depressive disorder using the DSM criteria. A similar finding was noted by Liu’s study (Liu et al. 1997). Only 13% out of the 26% who were screened positive using GDS-SF were eventually diagnosed with depressive disorder using DSM III R criteria. Thus two screening tools were added for the assessment and this argument will also be tested in the current study. GDS. The Geriatric Depression Scale was devised by Brink, Yesavage and other colleagues (1982). The tool was also reported to out-perform those of the Zung Depression Scale (Zung 1965) and Hamilton Rating Scale in Depression (Hamilton 1967) in differentiating depressed from non-depressed elderly clients (Nezu et al. 2000). The Chinese version of the short form, GDS-SF, was available and validated in Hong Kong (Sheikh & Yesavage 1986, Chiu et al. 1994, Lee et al. 1994). Studies of 42 Chinese subjects had used 5 or 8 out of a total of 15 as cut-off points. However the best rotating operating curve suggested 8 in order to yield the highest sensitivity (87.5%) and specificity (92%) for depression assessment (Lee et al. 1994). Additionally, the use of 8 as the cut-off point for the GDS was reported to have satisfactory reliability and validity (Chiu et al. 1994, Lee et al.1994). In Hong Kong, GDS was widely adopted as a screening instrument by many geriatric wards and incorporated as an assessment routine and progress evaluation tool in psychiatric hospital units. As far as research studies were concerned, most had adopted 8 as the cut-off point (Lee et al. 1994, Lesher & Beryhill 1994, Herrnann et al. 1996, McGivney et al. 1996). GDS was recommended as a standard instrument for screening in geriatric populations by the Royal College of Physicians and the British Geriatrics Society (Royal College of physicians of London and the British Geriatrics Society 1992). It was suggested that as GDS-SF correlated well with the Philadelphia Geriatric Center Morale Scale, Southampton Self-Esteem Scale and Bradburn Affect Balance Scale, additional use of such well-being measures might be unnecessary (Coleman et al. 1995). There had been worries that impaired hearing and cognitive function, poor cooperation or altered level of consciousness might affect the reliability of the screening results (Kwai Chung Hospital Psychogeriatric Team 2000). But another study showed that the sensitivity and specificity of the short or long forms of GDS were generally maintained with either cognitively intact or impaired groups (Kwai Chung Hospital Psychogeriatric Team 2000). Some clinical studies had adopted the tool for Caucasian (Agrell & Dehlin 1989, Johnson et al. 1995, Mast 2004) or Chinese stroke patients (Tang et al. 2004). The subjects were considered as depressed with a score of 8 or over out of the 15 points in this study. CESD. The Center for Epidemiologic Studies Depression Scale (CESD) had been recently validated in Chinese (Radloff 1977, Boey 1999a). It is a 10-item scale and subjects are given four answer options (0, 1, 2, 3; 0=none at all, 3=all the time in the past week). Again, the tool has satisfactory reliability and validity among a geriatric population. It was frequently used to detect DAS among Caucasian populations (Agrell & Dehlin 1989, King et al. 2001, Robinson-Smith 2004, Cassidy et al. 2004) but has not been tested among the local population. 43 2.4.1.2 Use of smiley diagrams to detect depression in patients suspected of DAS In view of the practical difficulties in assessing this elderly Chinese population with lower educational level and mostly physically disabled, a simple non-verbal cultural independent tool not requiring sustained concentration or cognitive effort was sought. A smiley pattern method was developed and described below. The utility of the smiley pattern recognition as a simple first step assessment tool for depression detection in this population has been published recently (see Publications). This tool consisted of three enlarged diagrams, 3×3cm2: a smiley [ a flat face [ ], and an upset/tearing diagram [ emoticon emoticon (happy), (flat), emoticon (upset/tearing) ], one with ], henceforth referred to as respectively. This was the first attempt to use the tool on stroke patients to assess their mood status. The idea began with a simple visual tool requiring less verbalisation compared with other depression scales. The tool could help the mildly aphasic patients to validate and supplement information in the assessment of depression. Subjects were asked to rate the frequency of having these facial expressions over the past week using a 4-point scale (0=none at all, 1=sometimes/1-3days per week, 2=most of the time/4-6 days per week, 3 all the time/ 7 days per week). Happy and sad facial expressions were universally understood despite different cultural backgrounds and literacy levels. The diagrams served to facilitate the comprehension and expression of an emotional state among older adults, in particular those with low education levels and difficulty in verbalising their moods in respect of a debilitating disease. 2.4.1.3 Health literacy regarding depression The complexity in detecting depression in this elderly Chinese population with lower education level was also reflected in the little explored area of the concept of depression and the relationship between heath literacy level and the report of depressive symptoms. Qualitative data aims to explore the meaning that study subjects 44 give to events or experience that is of distinctive values to a study apart from the quantitative data (Streubert & Carpenter 1999). To validate the diagnosis of depression, additional methods were used to collect qualitative data, which would be referenced by three parties: patient, research nurse and psycho-geriatrician. All the cases identified as depressed using DSM IV at six months were invited to see the psycho-geriatrician after the second interview. The only exceptions were those who had already been under the care of a psychiatrist after stroke. This was because most of these latter patients and their relatives had refused to have a second psychiatric consultation, seeing it as redundant. 20% of non-depressed patients, randomly selected, were also invited to see the psycho-geriatrician. The study also captured qualitative data from the stroke patients in three ways. First, participants were asked the question ‘what is depression to them’ at the first-month and six-month interviews. Second, their emotional status and expressions (tearful/sigh/lack of facial expression) were observed and recorded by the research nurse at both interviews. Third, all retrievable medical records were studied retrospectively for any documentation of mood status. The following information areas would be considered: the presence of depression with documented signs and symptoms as in DSM IV, any emotional complaints or observation by relatives of self-worthlessness, hopelessness, frustration, self-pity, grief, guilt and shame; suicidal ideation (expression of self-worthlessness, thoughts of death, concrete plans for suicide, attempts at suicide); screening instruments or diagnostic tools for depression, who reported the onset of depression (patient/relative/nurse/doctor); any prescription of treatment options (psychoactive medication including anti-depressants, referral to psychiatrist/psychologist/medical social workers/nurse specialist/others…) due to emotional needs after stroke onset; and treatment duration. Health literacy in respect of depression directly influenced early recognition of the condition. We had very little information on patients’ literacy levels in respect of depression despite the fact that it was known to be common among older Chinese adults (Woo et al. 1994, Lee 2003) and stroke survivors (data published already, see Publications). In fact, the search for subjective views on the situation of vulnerable 45 groups, including those aged 65+, mentally disabled or having low literacy levels, had remained fruitless in the professional literature (Mika et al. 2005). More importantly, a low level of literacy was proportional to mortality as well as healthcare access among older people (Sudore et al. 2006). All participants were asked at the end of the interview: ‘What is the meaning of depression to you?’ and ‘How will depression be interpreted?’ Respondents were encouraged to give any possible meanings to the term, and were reassured that they would not be judged by their answers as there was no right or wrong answer, but only their own perceptions. They were also asked if they would be interested in learning more about depression. 2.4.1.4 The domain factors associated with DAS and predictors of DAS The independent variables originated from the impact factors among the five commonly affected domains post-stroke are: 1. Bio-anatomical domain. Data in this domain could be collected from stroke related investigations, eg computerised tomography, magnetic resonance imaging, magnetic resonance angiography, Carotid Doppler and serum blood levels. Most of the data in this domain were at a nominal level of measurement yielding binary (Yes versus No) answer options except that of blood results, which maintains continuous measurement levels. Categories of data fell into the following pattern: z Lesions location: left hemisphere/right hemisphere z Structural involvement: cortical/subcortical/brain-stem lesions; cranial nerve involvement z Arterial system involvement: Large vessel diseases/small vessel diseases z Blood results: glucose, lipid profile, blood pressure z Cardiovascular risk factors: hypertension, diabetes, ischemic heart disease, hyperlipidemia 46 2. Cognitive and communicative domains. Under this heading, two aspects of the variables were examined. In the communicative domain, several items were assessed for their level of disturbance using a 4-point scale. To assess cognitive state and status, two standard tools were used: the Glasgow Coma Scale (GCS) and the Abbreviated Mental Test (AMT; score range: 0-10). Patients who were fully alert and conscious according to their verbal, motor and eye-opening response sub-categories gained a full score of 15 on the GCS. The data were collected from patient records documented in the Accident and Emergency Department. Patients having a score below 12 were excluded from the study. Cognitive soundness in terms of AMT was assessed at one-month and six-month interview. Patients were considered cognitively intact with a score between 6 and 10 out of a full score of 10. Those scoring lower than 6 were excluded from the study during the consent stage. In respect of communicative impairments, patients were asked to evaluate the level of disturbance resulting from the following types: expressive aphasia, receptive aphasia, global aphasia, dysarthria, swallowing, visual impairment, hearing deficit and agnosia. A zero meant none at all, 1 indicated a mild or infrequent level of disturbance (about once or twice weekly), a 2 referred to a moderate level (about three or four times weekly), and a 3 meant a severe level (five times or more on a weekly basis). 3. Dependency and somatic symptoms domain. In the disabilities and dependency domain, we measured self-care functions by two validated scales, another scale for quality of life with respect to disability, and a 4-point scale for the level of disturbance of somatic symptoms. The two validated scales were: the Barthel Index of Activities of Daily Living (BADL; 0-20, 20 being the highest functional level) (Collin 1988, The Royal College of Physicians London and The British Geriatrics Society 1992), and the Norton Scale of Pressure Sores (NSPS; 5-20, 20 being the lowest dependency in skin-care and minimal proneness to pressure sores) (Norton 1989, Pang & Wong 1998). These tools were commonly used among local residents. 47 To assess the level of disturbance induced by somatic symptoms, five types of pain and five kinds of bodily discomfort were included: headache, stomach pain, joint pain, low back pain and nonspecific muscle pain; nausea, vomiting, dizziness, constipation and other nonspecific discomforts. A 4-point scale was used: 0 indicating none, 1=mild, 2=moderate and 3=severe levels of disturbance. A similar scoring system was used to that described in the communicative domain. The patients’ crude quality of life was measured by the Modified Rankin Scale for Quality of Life (MRSQoL). It was a 6-point scale ranging from 0 to 5 with 5 being the highest level of compromised quality of life (Rankin 1957, Farrell et al. 1991). 4. Emotional domain. Besides the standardised tools used on depression, ten additional items in this domain were assessed. Patients were asked about the levels of disturbance caused by anxiety, worry about stroke rehabilitation progress, worry about disease deterioration, life stressors such as levels of disturbance due to financial problem, losing a job, bodily pain and discomforts, poor family relationships, loss of loved ones. There was growing evidence of a bio-chemical basis with respect to hypersecretion of adrenal glucocorticoids to connect the occurrence of chronic stress with depression (Leonard 2006a). Therefore the examination of level of disturbance with respect to different stressors was indicated. The same 4-point scale was used as that in the communicative domain. In addition, participants’ perceived current health status and the level of disturbance due to worry about that status were explored under this domain. 5. Family and social support domains. The Lubben Social Network Scale (LSNS) in Chinese was used (Chi & Chou 2001, Lubben & Gironda 2003) to assess the role of family and social support in depression. The scale consists of 10 items, each having 5-point-answer options (1-5). It may be divided into three sub-categories: (1) family network, (2) friends network, (3) confidant 48 relationship. The aggregate scores ranged from 0 to 50, 50 indicating maximal perceived support. Some questions were put to the participants to probe the availability of help with their emotional needs during a hospital stay due to stroke. They were asked if any of the hospital staff or other people (doctor/nurse/social worker/therapist /spouse/children/friends) might talk to them about their emotions or moods, and how helpful they thought these people were, using a 4-point scale (0=no use at all to 3=most helpful). Participants were also assessed on their current use of strategies to relieve life stress or unhappiness. Seven items were proposed, with an open-ended item to add another possibility. As before, the effectiveness of various means was assessed using a 4-point scale. The items included both indoor and outdoor activities. Sleeping, watching TV or listening to the radio or music, drinking or smoking or eating, doing household chores was regarded as an indoor activity. Going for a walk, shopping, exercising or finding someone to chat with, was considered outdoor activities. Besides the five domain factors, socio-demographics and other clinical sequelae were also examined. Participants’ age, gender, education, marital status, living arrangement, financial support, pre-morbid data such as medical history, physical health condition, health-related life-style factors such as smoking, and institutionalisation that occurred before stroke onset were retrieved and recorded in the questionnaire from patients’ case notes. As depression can be related to side effects of drug use, the prescriptions of current drugs used were recorded. Investigation and treatment modalities related to depression were also noted, including medication, referrals to a psychiatrist, psychologist, nurse specialist, medical social worker or other personnel. A process review on the four aspects - recognition, detection, diagnosis and treatment for DAS during the study period - was documented in the questionnaire as well (see Table 2.3). 49 Table 2.3 Process review agenda on DAS. Key Category of information Who does What to Whom When How Why so What z z z z Possible data to be identified Research team, patients, relatives, healthcare professionals Communications Interventions (investigation, seeing relatives, observations) from case notes z z z z z z z z z z Words on mood that related DAS DAS Patients and relatives or other health care members Date and time from onset of stroke and DAS Cues from patients or relatives to allow recognition of DAS The methods / tools used to detect depression Plans to treat or care patients with DAS Follow up plan for DAS Rationale for clinical decisions relating to DAS Formal or informal; explicit or subtle The outcomes to patients in terms of mortality, use of formal health care or informal care, hospital admission, quality of life. 2.4.2 DAS interventions Though it was a popular trend in healthcare intervention studies, the discussion of such was considered secondary when answers to important primary questions were still unaddressed. Based on the study outcomes, DAS interventions would be discussed. It was hoped that the proposed interventions were relevant and realistic in the eyes of local residents, as well critically appraised together with the evidence in earlier literature. 2.4.3 Pilot study A pilot study was particularly important because of the paucity of research on DAS among Chinese in Hong Kong, and major changes were indicated at the piloting stage. The aim was to polish the data collection tool to make them more user-friendly, as well as to improve content and construct validity and streamline the data collection process. 50 A 10% section (n=20) of the original estimated sample was planned for the pilot study, which aimed at testing the feasibility of the whole set of questionnaires and the reliability of respective depression assessments. A panel of investigators, academic and clinical experts (a professor of psychiatry, a consultant psycho-geriatrician, a professor of neurology and the teaching consultant in nursing) jointly evaluated the face and content validity of the questionnaire. Other logistical arrangements for the on-site studies were negotiated with clinical collaborators by the research nurse. The clinical partners included: a consultant physician and nurse specialists from stroke units and geriatric day hospitals, a ward manager of outpatient clinics, the administrator in charge of the medical records office, and ward nursing staff. The ultimate goal was to ensure the collection of reliable and valid data in an efficient manner. The initial questionnaire was trimmed to be more user-friendly for the participants, the interviewer and the researcher. The finalised questionnaires for the one-month and six-month interviews were in Appendices 2.1 and 2.2. After the pilot phase, the following revisions were made. 1. The one-month 12-page questionnaire was cut down to 8 pages with two main sections: the first four pages contained questions exploring the core domain factors, while pages 5-8 covered different sets of validated tools incorporated in the study. 2. The format of the questionnaire was greatly revised to provide clearer but simpler wording, layout and design. 3. Logical sequencing was followed by allotting questions to the five domain factors that might be associated with DAS, together with sensitive questions such as those exploring life stressors and family relationships, to be followed by socio-demographic data and health history. 4. The exact wording for instructional use of the depression assessment tools was incorporated into the questionnaire to maintain consistency in interviewing. 5. All questions and answer options were coded in a consistent numerical format. The most frequently selected items were assigned first place to allow ease of data-entry and avoid false entries. 6. The items: ‘date of interview’ and ‘subjective interpretation of depression’ 51 were added. 7. The items morale scale, esteem and self-concept, locus of control scale; role deficit; Hospital Anxiety and Depression Scale and GHQ-12 were removed. Many diseases under ‘medical history’ were moved to the ‘others, specify’ section, except neurological, cardiovascular and psychiatric diseases, to avoid excessive detail. Five smiley diagrams were reduced to three. The answers of most questions including the smiley diagrams were revised as follows: z Cutting most of the answer options from a 7-point Likert scale to a 4-point scale z Re-sizing to make bigger smiley diagrams for older subjects z Aligning the answer options that were used by clinical partners z Arranging the answer options according to frequency of selection z All dates for respective investigations were aligned with questions for reference only, instead of serving as data. 8. The target population was cut down from two regional hospitals that were arbitrarily clustered by the Hong Kong Hospital Authority to a larger regional hospital that serves a district on Hong Kong Island. The rationale for this decision was as follows: 9. z Low recruitment rates in the smaller hospital due to higher recurrent stroke admissions z Time and manpower involved major resource implications and feasibility concerns z Data analysis on annual admissions (at the end of subject recruitment) showed that there was a significant difference in the client profile of stroke units in the two district hospitals (Appendix 2.6). 52 2.5 Data analysis 2.5.1 Data management Data entry was undertaken with the use of Microsoft Access. Specifically, data screen input forms were developed with data input controls to avoid entering implausible values. After all data were entered, they were converted to the Excel format and two research assistants independently cross-checked the entered data with original hardcopy of the completed questionnaires. All discrepancies were handled and resolved by the principal investigator. The final database was then read into SPSS 14.0 for Windows statistical analysis. 2.5.2 Patients’ demographic and health profiles A broad description of the participants’ background in terms of their personal and health profiles were analysed and presented. Specifically, frequency counts and percentages would be shown for categorical data, for example, gender, marital status, occupation, presence of a disease (yes/no; such as mental psychiatric disease/hypertension/diabetes/cardiovascular disease/tumour), and the use of different groups of medications. For continuous data, the mean and standard deviation were calculated and presented (Last 2001). This applied to age, length of hospital stay and years of formal education, physiological indicators such as blood sugar level or lipid profile, total number of chronic diseases and aggregate number of pains or somatic symptoms. 2.5.3 Validity of the assessment tools The agreement between raters and rating scales was examined by using the kappa coefficient. Kappa coefficient is an index of the degree of non-random agreement between two categorical variables. It typically ranges from 0 indicating no agreement to 1 indicating perfect agreement. 0.41-0.60 would be considered as a moderate agreement (Chuang 2001). Taking DSM IV as the gold standard, a kappa coefficient was calculated for its agreement with each of the other three assessment tools (Last 2001). Besides this, the test was also applied to validate the agreement in depression 53 diagnosis made between the psychiatrist and nurse. This analysis also helped the calculation of the sensitivity, specificity, predictive values and likelihood ratios as essential component to evaluate the screening properties of the tools. The likelihood ratio was also included, as it is an index that has added value by not being directly affected by prevalence of the disease as in the case of sensitivity, specificity or predictive values (Sackett 1991). 2.5.4 Incidence of DAS at one month and six months The incidence of DAS was assessed by calculating the percentage of depressed patients. This percentage was calculated for each of three diagnosis methods of depression: DSM, GDS and CESD. The corresponding 95% confidence intervals were calculated using the formula ‘p±1.96 √(pq/n)’, where p=estimated incidence rate of depression, q=(1-p), and n=number in the sample (Triola & Triola 2006). Cross-tabulation was used to show the respective frequencies of depression among male and female participants. 2.5.5 Risk factors and predictors of DAS Potential factors associated with depression at one month and six months were examined. Depression was identified by DSM IV. Potential factors of interest covers five respective domains including (1) bio-anatomical domain - laterality of brain lesions or side of neurological dysfunctions (left versus right), presence of circulatory and neurological abnormalities in different investigations (computerised tomography/Carotid Doppler), presence of cranial nerve involvement; (2) cognitive and communicative domain – presence of different aphasia, visual or hearing problem, memory problems; (3) dependency level and symptomatic symptoms domain – presence of different pains or bodily discomforts; (4) emotional domain –presence of different worries and life stressors, display of different facial expressions and anxiety, perceived current health status (good or average versus poor), presence of different mood conditions during hospitalization (depression/anxiety/ panic/worry/agitation); (5) social support domain - any help with different coping methods (yes/no). Besides the domain factors, the demographic variables and health factors were also examined. 54 In the case of factors presented as a continuous level of measurement, an independent sample t-test (Student’s t-test) was used to identify significant differences in group means between depressed and non-depressed groups. Factors that adopted such a test included: 1. Demographics - age, length of hospital stay and years of formal education; 2. Health status or history - physiological indicators such as blood sugar level or lipid profile and total number of chronic diseases; 3. Dependency level and somatic symptoms domain –aggregate number of pains or somatic symptoms; dependency level by Barthel Activities of Living (BADL) or Norton Score for Pressure Sore (NSPS); disability-related quality of life using the Modified Rankin Scale for Quality of Life (MRSQoL); 4. Cognitive domain –Abbreviated Mental Test (AMT); 5. Emotional domain – frequency of displaying a happy/flat/upset or tearing facial expression; and 6. Social support domain – Lubben Social Network Scale (LSNS). Effect of each categorical factor was examined by the Pearson chi-square test while that of each continuous factor was examined by the two independent samples t-test. Independent effects of all factors were examined by a multiple logistic regression. All effects were expressed as an odds ratio. Adequacy of the logistic regression analysis was assessed by performing the Hosmer-Lemeshow test with a p> 0.05 indicates no evidence of poor fit. Multiple regression was indicated when the dependent variable fell on a continuous level of measurement such that by GDS. In order to identify predictive factors that could account for the depression score at six months as well as the change in depression scores, linear regression was used. To test model fitness, model adequacy was checked by examining the residuals. No departures for model assumptions were found. The change in depression scores was yielded by the 55 following calculation: depression score 6M- depression score 1M. The GDS score was chosen as the dependent variable in this section, as it provided a continuous level of measurement of depression, and was thus more sensitive to changes at different time points. Identification of predictors at one month might help to direct adequate attention to high-risk patients or even to devise early intervention when DAS is detected. 2.5.6 Changes of domain factors from one month to six months To examine the change of domain factors from one month to six months after stroke, the paired t-test was used. Specifically, domain factors considered included cognitive functions using AMT, level of disturbance due to communicative problems, level of disturbance due to different types of pain or body discomfort, dependency levels in terms of BADL, disability related quality of life MRSQoL, depression levels in terms of GDS/CESD or frequency of displaying different facial expression, and level of disturbance due to worry or anxiety. The changes were estimated by the means together with the corresponding 95% confidence intervals. The normality assumption of the paired differences was checked by using the P-P plot. 2.5.7 The clinical outcomes of stroke survivors The clinical outcomes of current stroke survivors refers to the treatment of DAS under formal healthcare, crude quality of life, mortality and institutionalisation after first stroke, particularly at the chronic stage. The difference that might be identified between depressed and non-depressed subjects was estimated mainly by Pearson chi-square test, as most of these variables were categorical. To identify predictors of quality of life at six months, multiple regression analysis was performed. Predictors considered included from the respective five domains as in DAS analysis. Multicollinearity was checked by examining the tolerance and residuals were examined for model adequacy. 56 2.5.8 Qualitative analysis – depression literacy The present study is not an intervention study, and only theoretical recommendations based on current study results and those in the literature are proposed. For data based on the current study, two possible directions to devise interventions in DAS might be contemplated: (1) the utility of smiley diagrams as a preliminary assessment for depression among older stroke survivors, and (2) the assessment of depression literacy among stroke subjects. The screening properties of smiley diagrams have been discussed in Section 2.5.3. The assessment of depression literacy among stroke subjects yielded qualitative data. Qualitative data analysis method for the verbal scripts/descriptors provided by stroke survivors on ‘what is depression to them?’ is indicated. The qualitative analysis process required the researcher to scrutinise the data carefully, reading the data many times in a search for meaning and a deeper understanding. As claimed by Morse and Field (1995), qualitative analysis is a ‘process of fitting data together, of making the invisible obvious, of linking and attributing consequence to antecedents’ (p126). Qualitative study enhances understanding of meaning, values and belief in constructs that are unlikely to be revealed by a quantitative study design (Polit & C.T. 2004). Qualitative study served as adjunct data to facilitate a more comprehensive understanding of depression after stroke among participants. It might produce very important hints where mental health promotion among older adults or stroke patients is concerned. Participants were asked about their understanding of the term ‘depression’, and their perceptions of ‘what is depression to them’, at the first-month and six-month interviews. The raw data obtained in Chinese was produced in English by two translators separately. One academic staff member and one researcher worked separately to delineate and categorise the subjects’ interpretations of depression. This strategy was important as peer review helps to enhance the quality of a category system (Polit & C.T. 2004). Core emerging themes are deduced and categorised, and their implications discussed. 57 Chapter 3 Results 3.1 Subject recruitment (59) 3.1.1 Inclusion and exclusion analysis (59) 3.1.2 Representativeness of recruited sample (59) 3.1.3 Descriptive analysis of participants (63) 3.1.3.1 Demographics and medical history (63) 3.1.3.2 Bio-anatomical characteristics of stroke lesions (65) 3.1.3.3 Cognitive and communicative status (71) 3.1.3.4 Dependency level and somatic complaints (71) 3.1.3.5 Emotional status (72) 3.1.3.6 Family and social support (74) 3.2 Study outcomes (80) 3.2.1 Level of agreements between depression assessments (81) 3.2.1.1 The level of agreement between psychiatrists and the research nurse (81) 3.2.1.2 The level of agreement between depression assessment tools (82) 3.2.2 Incidence of DAS (84) 3.2.3 Risk factors of DAS (86) 3.2.3.1 Using DSM IV as the assessment tool (86) 3.2.3.2 Using GDS/CESD as the assessment tool (100) 3.2.4 Predictors of DAS (106) 3.2.4.1 Using DSM IV as the assessment tool (106) 3.2.4.2 Using GDS/CESD as the assessment tool (108) 3.2.5 Health literacy of depression (113) 3.2.5.1 Descriptors in affective domain (114) 3.2.5.2 Descriptors in behavioural domain (118) 3.2.5.3 Descriptors in cognitive domain (119) 3.3 Clinical outcomes (121) 3.3.1 Post-stroke quality of life (121) 3.3.2 Institutionalisation and mortality (123) 3.3.3 DAS interventions in formal healthcare (124) 3.3.3.1 Use of anti-depressants (124) 3.3.3.2 Use of mental healthcare resources (124) 58 3.1 Subject recruitment Among all subjects (n=816) admitted during the one-year study period (1 June 2004 to 31 May 2005), there were all together 839 admission episodes in the target regional hospital. A list of eligible subjects was drawn from hospital admission records at the stroke unit. The process of subject recruitment was followed according to a pre-set protocol as shown in Figure 3.1. 3.1.1 Inclusion and exclusion analysis During the study period, a total of 816 patients were diagnosed with stroke. 152 haemorrhagic stroke cases (18.6%) were excluded from the study, leaving 664 as ischemic stroke patients (see Table 3.1). After applying the inclusion and exclusion criteria, 49.6% of patients were excluded for the following reasons: 2.8% (23 out of 816) were aged below 50 years old, 1.5% were cases of ‘transient ischemic attack’, 11.4% were recurrent stroke cases, and 5.2% had problems in communicating. Among the eligible pool, about a third, were not recruited for a combination of reasons noted in the table, some eligible stroke patients could not be found or refused to participate in the study (23.2%, 189 out of 816). Eventually, about half of all the eligible subjects consented to participate in the study (27.2%, 222 out of 816). 3.1.2 Representativeness of recruited sample A ‘goodness-of-fit’ Chi-square test was used to examine the level of representativeness of the sample compared with the target population. There was no significant age difference between ‘eligible and consenting’, ‘eligible and not consenting’ and ‘excluded’ groups (F=0.811, p=0.445, see Table 3.2A). A significant difference existed among the female groups (p=0.003) but not identified among male subjects (p=0.401, see Table 3.3). Regarding gender distribution, the proportion in ‘Eligible and consented’ female subjects was fewer (21.9%, p=0.007) than the two counterparts (‘Eligible and did not consent’ or ‘Excluded’, see Table 3.2B). Overall fewer females were recruited in the study (p=0.004, see Table 3.3). 59 Figure 3.1 A flow chart of subject recruitment All stroke cases (1 June 2004 to 31 May 2005) in a regional hospital N=816 Hemorrhagic stroke N=152 (18.6%) Excluded First ischemic stroke N=664 (81.4%) Inclusion and exclusion criteria applied Total excluded: 405 (49.6%) Hemorrhagic stroke=18.6% Age <50=2.8% TIA=1.5% Recurrent case=11.4% Impair communication=5.2% Others=10.1% Excluded Total: 189 (23.2%) Can’t find pt (11.9%) Refuse to participate (11.3%) Eligible 411 (50.4%) Not consent Consented Total: 222 (27.2%) Withdrew before interview: 8 (1.0%) Interview at 1 month (214) Dropouts=26 (12.1%) Passed away=11 (5.1%) Away from HK=4 (1.9%) Telephone changed=6 (2.8%) Withdraw by self/relative=5 (2.3%) ALL DAS + (20) Interview at 6 month (188) DAS -ve Interviewed by Psychiatrist A random sample of 34 (20%) 60 Table 3.1 Reasons for admission and exclusion of study subjects Excluded reasons n % Age <50 23 2.8 Transient ischemic attack 13 1.5 Recurrent stroke 93 11.4 Haemorrhagic stroke 152 18.6 16 2.0 19 2.3 7 0.9 (42) (5.2) Impaired communication z aphasic (moderate/severe) z language barrier z a low cognitive level (AMT<6) (Sub-total) Other reasons for exclusion z secondary stroke due to complications of other diseases 3 0.4 z death 12 1.5 b z poor general condition (GCS<10) 56 6.9 z primary diagnosis is not stroke 1 0.1 z history of depression or psychiatric illness 6 0.7 z not Cantonese speakers 4 0.5 (82) (10.1) 405 49.6 (Sub-total) Total (excluded subjects) Eligible subjects but consent to study not obtained z can't find the pt 97 11.9 z subjects refuse to participate 92 11.3 (189) (23.2) 214 26.2 8 1.0 (222) (27.2) 816 100.0 (Sub-total) Eligible and consent to study given z first interview conducted z withdrew before first interview (Sub-total) Total a AMT=Abbreviated Mental Test; b GCS=Glasgow Coma Scale 61 Table 3.2 Comparing age and gender groups of potential participants (A) Age Groups n Mean age SD df F p Eligible and consented 222 72.1 9.4 2 0.811 0.445 Eligible and did not consent 189 73.3 9.5 Excluded 405 72.0 13.7 816 72.3 11.8 Total One-way ANOVA was done (B) Sex Male Female n % n % df χ 140 31.7 82 21.9 2 9.990 Eligible and did not consent 96 21.8 93 24.8 Excluded 205 46.5 200 53.3 441 100.0 375 100.0 Groups Eligible and consented Total 2 p 0.007 Pearson chi-square test was done Table 3.3 Representativeness of the recruited sample Population Sample N % n (observed) % n (expected) Male 418 53.4 135 63.1 114.2 Female 365 46.6 79 36.9 99.8 Total 783 100.0 214 100.0 214.0 50-59 60 14.4 12 8.9 19.4 60-69 124 29.7 47 34.8 40.0 70-79 137 32.8 45 33.3 44.2 80-89 85 20.3 27 20.0 27.5 Gender (age 50+) chitest 0.004 Age - Male 0.401 90+ 12 2.9 4 3.0 3.9 Total 418 100.0 135 100.0 135.0 50-59 30 8.2 9 11.4 6.5 60-69 41 11.2 19 24.1 8.9 70-79 165 45.2 32 40.5 35.7 80-89 103 28.2 15 19.0 22.3 90+ 26 7.1 4 5.1 5.6 Total 365 100.0 79 100.0 79.0 Age - Female 0.003 Age - Both 0.012 50-59 90 11.5 21 9.8 24.6 60-69 165 21.1 66 30.8 45.1 70-79 302 38.6 77 36.0 82.5 80-89 188 24.0 42 19.6 51.4 90+ 38 4.9 8 3.7 10.4 Total 783 100.0 214 100.0 214.0 ‘Goodness-of-fit’ Chi-square test was used 62 3.1.3 Descriptive analysis of participants 3.1.3.1 Demographics and medical history The mean age of the 214 participants was 72.3 years (SD=9.4, range 50-94). The average duration of hospital stay for stroke admission was 17.1 days (SD=15.4, range 3-89). The participants had had an average of only 5.5 years of formal education (SD=5.0, range 0-23). About two thirds of the participants were male (63.1%, 135 out of 214) and married (63.6%, 136 out of 214). Most were living with family members, spouse or children or both (85.6%, 183 out of 214). Only a minority were living alone (10.7%, 23 out of 214) or were still working (12.6%, 27 out of 214) at the time of the stroke episode. In this sample, only five participants (2.3%) had been living in a care and attention home or nursing home, as they required much nursing care. It was noted that a quarter of the participants were dependent on public financial assistance such as disability allowance (7.5%, 16 out of 214) or the combined social security allowance (17.8%, 38 out of 214). The majority received financial support from family members (63.6%, 136 out of 214), and others relied on savings (13.6%, 29 out of 214) or pensions (4.7%, 10 out of 214, see Table 3.4). Thus, these patients are generally under-educated and highly dependent on family and social support. The medical history of the 214 participants is shown in Table 3.5. 69.6% of the participants (149 out of 214) reported a history of hypertension; 29.9% (64 out of 214) had diabetes; 36.9% (79 out of 214) had different cardiovascular diseases, including hyperlipidemia. The majority had some chronic disease; the mean number of chronic diseases reported was 2.1 (SD=1.2, range=0-6). Only 25 participants (11.7%) claimed that they did not have any known chronic health problems before stroke (see Table 3.5). 63 Table 3.4 Demographic characteristics of 214 participants n % 135 63.1 Gender Male Female 79 36.9 Occupation before stroke Retired 128 59.8 Housewife 52 24.3 Unemployed 7 3.3 Others working status 27 12.6 Married 136 63.6 Widowed 61 28.5 Single/Divorced/Separated 17 7.9 Spouse 42 19.6 Martial status Living with c Living at Children 51 23.8 Both spouse & children 90 42.2 10.7 Alone 23 Others 8 3.7 Public estate 87 40.7 Private premise 114 53.3 8 3.7 Rental C&AH/NH Financial assistance Nil OAA b c 5 2.3 133 62.1 27 12.6 16 7.5 38 17.8 Children 105 49.1 Spouse 19 8.9 Both children & spouse 12 5.6 Saving 29 13.6 Pension 10 4.7 Others 39 18.2 DA/HDA CSSA Financial Support from a d Age (in years), mean±SD (range) 72.3±9.4 (50-94) Length of stay (in days), mean±SD (range) 17.1±15.4 (3-89) Formal education (in years), mean±SD (range) a 5.5±5.0 (0-23) Care and Attention Home (C&AH)/Nursing Home (NH) b Old Age Allowance c Disability Allowance / High disability Allowance d Combined Social Security Allowance 64 Table 3.5 Medical history of 214 participants n % Diseases in medical record Stroke -- -- Psychiatric disease -- -- Neurological disease (exclude stroke) a Hypertension (HT) 7 3.3 149 69.6 Diabetes mellitus 64 29.9 Cardiovascular diseases (exclude HT) 79 36.9 Tumor 15 7.0 Major operation done 45 21.0 Others 94 43.9 Number of chronic diseases 0 25 11.7 1-2 103 48.1 3-6 86 40.2 Smoker 53 24.8 Non-smoker/ex-smoker 161 Smoking status Number of chronic diseases, mean±SD (range) a 75.2 2.1±1.2 (0-6) Parkinsonism 3.1.3.2 Bio-anatomical characteristics of stroke lesions This section provides information regarding the characteristics of stroke lesions as reflected by radiological and circulatory findings, and by biochemical and neurological assessments. Among the 214 participants, about 80% (171 out of 214) were diagnosed with cerebral thrombosis (ICD 434.00) upon discharge (see Table 3.6A). All participants had undergone computerised tomography (CT) after first stroke. About two-thirds (67.3%, 144 out of 214) of the records had detected abnormalities, with the rest deemed unremarkable. Most of the stroke lesions were one-sided according to the clinical and/or radiological findings documented in case notes. Only 4.7% (10 out of 214) had lesions in both hemispheres and 9.3% did not remark the laterality of lesions (20 out of 214). Of one-sided lesions, 46.7% (100 out of 214) were located in the right hemisphere and 39.3% (84 out of 214) in the left. Most of the medical notes did not document the locations of brain lesions. Of the left-sided lesions, 66.2% (53 out of 80) were in the sub-cortical region, 16.2% (13 out of 80) in the brain stem, 12.5% (10 out of 80) in the cortical region and 3.8% in the cerebellar region. Of right-sided lesions, 65.5% (59 out of 90) were located in the sub-cortical region, 15.5% in the cortical region, 10.1% in the brain stem and 7.8% in the cerebellar region. About one-fifth of the participants also had MRI (14.6%, 31 out of 212) or MRA (4.3%, 9 out of 212, see Table 3.6A). 65 Table 3.6 Characteristics of stroke lesions among participants at one month (A) Imaging report N % ICD code on discharge 433.80 6 2.8 434.00 171 79.9 434.10 10 4.7 436.00 27 12.6 No abnormality 70 32.7 Abnormality recorded 144 67.3 Radiological report Findings on Computerized Tomography Laterality of lesions Left 84 45.7 Right 100 54.3 Both 10 4.7 Not applicable/not remark 20 9.3 Cortical region 10 12.5 Subcortical region 53 66.2 Cerebellar 3 3.8 Brain stem 13 16.2 More than one site 1 1.3 Cortical region 14 15.5 Subcortical region 59 65.5 Cerebellar 7 7.8 Brain stem 9 10.1 1 1.1 Locations of left-sided lesions (n=80) Locations of right-sided lesions (n=90) More than one site Additional imaging done CT 2 0.9 MRI 31 14.6 MRA 9 4.3 TCD 1 0.5 Carotid Doppler 1 0.5 168 79.2 Not done a a n=212 66 (B) Arterial assessment and neurological report n % Arterial involvement Carotid Doppler result Not done 44 20.6 No abnormality 46 21.5 Abnormality recorded 118 55.1 6 2.8 Mild (1 to 49% cross-sectional area occluded) 102 47.7 Moderate (50 to 99% cross-sectional area occluded) 12 5.6 Occluded 3 1.4 Normal/Not done/Missing 97 45.3 Mild (1 to 49% cross-sectional area occluded) 88 41.1 Moderate (50 to 99% cross-sectional area occluded) 19 8.9 Occluded 5 2.3 102 47.7 LACI 104 48.6 PACI 23 10.7 TACI 15 7.0 POCI 22 10.3 Not classified 50 23.4 Missing Carotid artery blockage – Left side Carotid artery blockage – Right side Normal/Not done/Missing Clinical classification of stroke type a Neurological deficit Side of functional deficit Left 105 49.1 Right 80 37.4 Both 7 3.3 Nil 22 10.3 Cranial nerve involvement a Yes 82 38.3 No 132 61.7 Had included one subject with uncertain result under unclassified b LACI=Lacunar cerebral infarction / PACI=Partial anterior circulation infarction / TACI=Total anterior circulation infarction / POCI=Posterior circulation infarction Besides the scan report, Carotid Doppler reports revealed that slightly more than half (55.1%, 118 out of 214) had abnormal result, although the majority of these artery blockages were mild without significant clinical implications (see Table 3.6B). Another clinical classification for stroke type by circulatory disruption showed that about half the participants (48.6%, 104 out of 214) had lacunar lesions. 18% involved the anterior cerebral circulation, with 10.7% classified as partial (23 out of 214) and 7.0% as total anterior circulation infarction (15 out of 214). 10.3% were classified as posterior circulation infarction (22 out of 214, see Table 3.6B). Neurological assessment revealed that 38.3% participants (82 out of 214) had cranial nerve involvement. More left-sided body dysfunctions (49.1%, 105 out of 214) than right-sided (37.4%, 80 out of 214) were detected and this finding also 67 corresponded to the laterality of brain lesions (see Tables 3.6AB). For the biochemical status of participants, the blood level in case notes and medications in the discharge summary for the first stroke admission was retrieved (see Appendix 3.1). Mean levels of total cholesterol, low density lipoprotein and high density lipoprotein (in mmol/l) were 5.3 (SD=1.4), 3.5 (SD=1.0) and 1.3 (SD=0.3) respectively. Fasting blood sugar was 7.1 mmol/l (SD=2.8). As for drug prescriptions, aspirin was given to the majority of patients (84.9%, 180 out of 214), followed by statin compound (65.6%, 139 out of 214) and anti-hypertensive agents (49.1%, 104 out of 214). The use of psychoactive agents (night drug/anti-depressants/anxiolytic) at one month was uncommon and was examined in section 3.3.3. 68 Table 3.7 Functional levels in cognitive and communicative domains at one month and six months (A) Communicative functions Level of disturbance None Level of disturbance due to Mild Moderate Severe Time Total n % n % n % n % 1M 213 179 84.0 24 11.3 4 1.9 6 2.8 6M 188 185 98.4 2 1.1 1 0.5 0 0.0 1M 213 211 99.1 2 0.9 0 0.0 0 0.0 6M 188 188 100.0 0 0.0 0 0.0 0 0.0 1M 213 209 98.1 3 1.4 0 0.0 1 0.5 6M 188 188 100.0 0 0.0 0 0.0 0 0.0 Expressive aphasia Receptive aphasia Global aphasia Dysarthria 1M 213 168 78.9 27 12.7 9 4.2 9 4.2 6M 188 184 97.9 3 1.6 1 0.5 0 0.0 1M 213 188 88.3 16 7.5 7 3.3 2 0.9 6M 188 182 96.8 5 2.7 1 0.5 0 0.0 1M 213 210 98.6 2 0.9 0 0.0 1 0.5 6M 188 0 0.0 0 0.0 0 0.0 0 0.0 Time Total n % n % n % n % 1M 213 174 81.7 28 13.1 7 3.3 4 1.9 6M 188 178 94.7 6 3.2 3 1.6 1 0.5 1M 213 188 88.3 18 8.5 6 2.8 1 0.5 6M 188 186 98.9 1 0.5 0 0.0 1 0.5 1M 213 172 80.8 30 14.1 8 3.8 3 1.4 6M 188 179 95.2 6 3.2 3 1.6 0 0.0 Swallowing Agnosia (B) Cognitive and sensory functions Level of disturbance due to Visual acuity Hearing Memory 69 (C) Changes in cognitive and communicative functions from one month to six months 1M Glasgow Coma Scale (not analysed at 6M) 6M 6M-1M Mean SD Mean SD 14.89 (0.54) -- -- N Mean 95%CI p AMT Total 8.96 1.30 9.10 1.40 186 0.15 -0.02, 0.31 0.083 Level of disturbance due to expressive aphasia 0.25 0.65 0.02 0.18 188 -0.23 -0.32, -0.14 <0.001 Level of disturbance due to dysarthria 0.35 0.76 0.03 0.19 188 -0.32 -0.43, -0.22 <0.001 Level of disturbance due to swallowing problem 0.17 0.53 0.03 0.22 188 -0.13 -0.21, -0.05 0.001 Level of disturbance due to visual acuity 0.27 0.62 0.08 0.37 188 -0.19 -0.28, -0.09 <0.001 Level of disturbance due to hearing problem 0.16 0.48 0.02 0.23 188 -0.14 -0.21, -0.08 <0.001 Level of disturbance due to memory problem 0.27 0.61 0.06 0.30 188 -0.21 -0.30, -0.11 <0.001 70 3.1.3.3 Cognitive and communicative status Communicative disturbances resulted from stroke were reported at one month. The commonest was dysarthria (21.1%, 45 out of 213), followed by expressive aphasia (16.0%, 34 out of 213). 11.7% of subjects had swallowing problems (25 out of 213). These complaints dropped drastically to 0 to 6 cases only at six months (see Table 3.7A). 18.3% of participants (39 out of 213) reported visual problems, 19.2% (41 out of 213) memory problems, and 11.7% (25 out of 213) some loss of hearing. All these problems decreased to no more than ten at six months. The mental state assessment by the Abbreviated Mental Test (AMT) showed a mean score of 9.0 out of 10 (SD=1.3) at one month and 9.1 (SD=1.4) at six months. The conscious level of the participants was nearly full as reflected in the score on the Glasgow Coma Scale (14.9 out of 15, see Table 3.7B). Except AMT, there was a significant change in memory and most of the communicative functions from one month to six months (see Table 3.7C). 3.1.3.4 Dependency level and somatic complaints The self-care functions of participants measured by the Barthel Activity of Daily Living Index (BADL) and the Norton Scale of Pressure Sore were 15.8 (SD=5.3) and 16.9 (SD=2.4) respectively at one month. At six months BADL was 17.0 (SD=4.7). The Rankin Scale of Quality of Life at one month and six months was 2.4 (SD=1.3) and 2.1 (SD=1.2) respectively (see Table 3.8A). As for pains and somatic symptoms at one month, more participants reported joint and low back pains with 22% reported joint pain (47 out of 214) and 17.3% low back pain (37 out of 214, see Table 3.8B). About 10% and 8% reported headache and stomach pain respectively at one month. At six months, the various forms of pain dropped to 6.9% headaches, 3.2% stomach pain, 10.6% joint pain and 11.7% low back pain (see Table 3.8B). The amount of pain reported was much reduced and levels were regarded as mild at six months. The only exception to the falling trend was non-specific muscle pain, which became more frequent at six months (19.7%, 37 out of 188) compared with the rate at one month (11.2%, 24 out of 214, see Table 3.8B). 71 Among other somatic complaints, dizziness (17.8%, 38 out of 214 at 1M; 10.6%, 20 out of 188 at 6M) and constipation (18.2%, 39 out of 214 at 1M; 9.0%, 17 out of 188 at 6M) were more common at both time points. The occurrence of other somatic complaints (nausea and diarrhea) was about 3% at one month and 0-1% at six months (see Table 3.8C). Table 3.8 Dependency level and somatic symptoms at one month and six months (A) Self care function 1M 6M Variables Mean (SD) Mean (SD) N Mean 95%CI p Barthel ADL Index (Range=0-20) 15.8 (5.3) 17.0 (4.7) 188 1.3 0.71, 1.79 <0.001 2.4 (1.3) 2.1 (1.2) 188 0.2 0.08, 0.36 0.002 16.9 (2.4) -- 0.7 (1.0) 0.5 (0.9) 188 -0.2 -0.34, -0.03 0.018 0.5 (0.8) 0.3 (0.5) 188 -0.2 -0.32, -0.09 0.001 1.2 (1.4) 0.8 (1.1) 188 -0.4 -0.58, -0.19 <0.001 Rankin Scale of Quality of Life (MRSQoL) (Range=0-5) Norton Scale of Pressure Sore (Range=5-20) a 6M-1M Somatic problems Number of pains (Range=0-5) Number of body discomfort (exclude pains) (Range=0-5) Total number of body discomfort and pains (Range=0-10) a Item not assessed at six months; Paired samples t-test was done 3.1.3.5 Emotional status Emotional assessment included worries, anxiety, perceived health and frequency of different facial expressions. Findings revealed the occurrence and disturbance induced by different stressors at one month in descending order: worry about stroke rehabilitation (59.3%, 127 out of 214) and disease deterioration (32.2%, 67 out of 208), level of disturbance due to body pains and discomfort (28.0%, 60 out of 214), financial problems (26.6%, 57 out of 214), poor family relationship (11.7%, 25 out of 214), loss of jobs (9.4%, 21 out of 214), current health status or other problems (7.5%, 16 out of 211) and loss of loved ones (4.8%, 10 out of 206, see Table 3.9A). A reduced frequency of the three most common stressors was found at the six-month interview: body pains and discomfort (25.5%, 48 out of 188), worry about stroke rehabilitation (21.8%, 41 out of 188) and financial problems (21.3%, 40 out of 188, see Table 3.9A). Besides these stressors, participants also reported anxiety at one month (23.2%, 47 out of 203), although the level was much reduced at six months (5.9%, 17 out of 188, see 72 Table 3.9B). During hospitalisation for acute stroke attack, 214 participants reported the presence of different types of emotions: depression (31.3%), anxiety (12.1%), worries (33.2%), panic (20.1%), and agitation (7.0%, see Table 3.9B). The participants also rated their perceived health status at one month and six months respectively. Nearly half the participants perceived their current health status as bad at one month (49.1%, 105 out of 203) but this dropped to 15.4% at six months (33 out of 188). On the other hand, the choice of good health had risen from one fifth (21.0%, 45 out of 203) to one third of participants (34.6%, 74 out of 188), comparing one-month and six-month ratings (see Table 3.9C). Some factors had showed a significant mean change in scores when paired-sample t-test was done. Four factors had a significant reduction from one-month to six-month ratings: perceived current health status (p<0.001), days in the last week with an upset/tearing facial expression (p<0.001), level of disturbance in worry about stroke rehabilitation (p<0.001), level of disturbance in anxiety (p<0.001 see Table 3.9D). When participants were asked about the frequency of displaying three different facial expressions (happy, flat and upset/tearing) over the past week at one month and six months interviews, 37.6% (80 out of 213) echoed the absence of a happy face at one month, reducing to 26.6% (50 out of 188) at six months. Nearly two thirds of the sample reported their flat-face frequency at one month as ‘half of the time’ (37.6%, 80 out of 213) or ‘all the time’ (27.7%, 59 out of 213). More than half of those reporting ‘all the time’ scored lower at six months (from 27.7% to 11.2%, see Table 3.10). 52% participants reported the absence of an upset/tearing facial expression at one month, while the rest would display such an expression at a different frequency (see Table 3.10). 73 3.1.3.6 Family and social support A retrospective recall of available coping strategies towards unhappiness among participants at the one-month interview revealed that many participants did not have any means of tackling emotional problems before stroke. Many of them had tried the following methods: (1) indoors - watching TV/listening to radio/music (43.9%), finding someone to chat to (32.5%), sleeping (23.2%), drinking/smoking/eating (15.6%) and doing household chores (12.3%). As outdoor interventions, most preferred going for a walk (38.7%), exercising or 9.0% going shopping (see Table 3.11A). At six months, participants’ available social support was reflected in their scores on the Lubben Social support Network Scale. The mean score was 20.4 (SD=8.0) out of 50. The subscales for family networks, relative networks and confidant relationships were 4.7 (SD=3.7), 5.0 (SD=4.6) and 10.7 (SD=4.0) respectively (see Table 3.11B). 74 Table 3.8 Dependency levels and somatic symptoms at one month and six months (B) Various pains Level of disturbance None Mild n Moderate % n Severe Time Total n % % n % 1M 212 191 90.1 9 4.2 6 2.8 6 2.8 6M 188 175 93.1 11 5.9 1 0.5 1 0.5 1M 214 196 91.6 9 4.2 6 2.8 3 1.4 6M 188 182 96.8 5 2.7 1 0.5 0 0.0 1M 214 167 78.0 30 14.0 10 4.7 7 3.3 6M 188 168 89.4 13 6.9 4 2.1 3 1.6 1M 214 177 82.7 28 13.1 5 2.3 4 1.9 6M 188 166 88.3 16 8.5 6 3.2 0 0.0 1M 214 190 88.8 14 6.5 6 2.8 4 1.9 6M 188 151 80.3 29 15.4 8 4.3 0 0.0 Headache Stomach pain Joint pain Low back pain Non-specific muscle pain Row % were presented 75 (C) Somatic symptoms Level of disturbance None Mild Moderate Severe Time Total n % n % n % n % 1M 214 176 82.2 21 9.8 9 4.2 8 3.7 6M 188 168 89.4 16 8.5 3 1.6 1 0.5 1M 214 207 96.7 5 2.3 1 0.5 1 0.5 6M 188 188 100.0 0 0.0 0 0.0 0 0.0 1M 214 208 97.2 5 2.3 0 0.0 1 0.5 6M 188 187 99.5 1 0.5 0 0.0 0 0.0 Dizziness Nausea Diarrhoea Constipation 1M 214 175 81.8 26 12.1 11 5.1 2 0.9 6M 188 171 91.0 15 8.0 2 1.1 0 0.0 1M 214 196 91.6 11 5.1 1 0.5 6 2.8 6M 188 172 91.5 13 6.9 0 0.0 3 1.6 Others, specify Row % were presented 76 Table 3.9 Emotional status at one month and six months (A) Worries and life stressors Level of disturbance 0 2 3 Time Total n % n % n % n % Worries about current health status 1M 211 195 92.5 4 1.9 6 2.8 6 2.8 6M 188 161 75.2 14 6.5 9 4.2 4 1.9 Worries about stroke rehabilitation 1M 214 87 40.7 28 13.1 35 16.4 64 29.9 6M 188 147 78.2 17 9.0 16 8.5 8 4.3 Bodily pains and discomfort 1M 214 154 72.0 25 11.7 15 7.0 20 9.3 6M 188 140 74.5 19 10.1 23 12.2 6 3.2 Financial problems 1M 214 157 73.4 18 8.4 18 8.4 21 9.8 6M 188 148 76.6 22 11.7 13 6.9 5 2.7 Loss of jobs 1M 214 193 90.6 8 2.6 5 2.3 7 3.3 6M 188 169 79.0 7 3.3 10 4.7 2 0.9 Poor family relationship 1M 214 189 88.3 11 5.1 6 2.8 8 3.7 6M 188 175 93.1 5 2.7 6 3.2 2 1.1 Loss of love ones 1M 206 196 95.2 4 1.9 5 2.4 1 0.5 6M 188 181 96.3 4 2.1 2 1.1 3 0.5 1M 211 195 92.5 4 1.9 6 2.8 6 2.8 6M 188 161 75.2 14 6.5 9 4.2 4 1.9 1M 208 141 67.8 18 8.7 18 8.7 31 14.9 6M -- -- -- -- -- -- -- -- -- Other problems Worries about disease deterioration 0=No disturbance at all a 1 a 1=Mild disturbance 1 to 2 days a week 2=Moderate disturbance 3 to 4 days a week 3=Severe disturbance more than 5 days a week Item not assessed at 6 month Row % were presented 77 (B) Other emotions Level of disturbance 0 1 2 3 Time Total n % n % n % n % 1M 203 156 76.8 26 12.8 11 5.5 10 4.9 6M 188 171 94.1 8 4.2 8 4.2 1 0.5 Anxiety Reported emotions during hospitalization, n (%) Worry 1M 214 71 (33.2) Depression 1M 214 67 (31.3) Panic 1M 214 43 (20.1) Anxiety 1M 214 26 (12.1) Agitation 1M 214 15 (7.0) 0=No disturbance at all 1=Mild disturbance 1 to 2 days a week 2=Moderate disturbance 3 to 4 days a week 3=Severe disturbance more than 5 days a week (C) Perceived current health status Good Average Bad Time Total n % n % n % 1M 214 44 20.5 64 29.9 105 49.1 6M 188 74 34.6 81 37.9 33 15.4 (D) Changes in emotional status and life stressors from one month to six months 1M 6M 6M-1M Mean SD Mean SD N Mean 95%CI p Days in the last week with a happy facial expression 1.9 -1.0 2.0 -0.8 Days in the last week with an flat facial expression 1.8 -1.0 1.8 -0.7 188 0.1 -0.10, 0.22 0.469 188 -0.1 -0.20, 0.11 Days in the last week with an upset/tearing facial expression 0.8 -0.9 0.4 0.539 -0.6 188 -0.4 -0.52, -0.26 <0.001 Perceived current health status 2.3 -0.8 1.8 -0.7 188 -0.5 -0.62, -0.36 <0.001 1.4 -1.3 0.4 -0.8 188 -1.0 -1.19, -0.79 <0.001 Level of disturbance due to of losing job Level of disturbance due to anxiety 0.2 -0.6 0.2 -0.6 187 0.0 -0.11, 0.09 0.839 0.5 -1.1 0.1 -0.5 179 -0.3 -0.51, -0.15 <0.001 Life stressors Level of disturbance due to worry about stroke rehabilitation progress Paired samples t-test was done; Row % were presented 78 Table 3.10 Frequency of displaying different facial expressions over the past week at one month and six months Level of disturbance 0 1 2 3 Time Total n % n % n % n % 1M 213 80 37.6 58 27.2 57 26.8 18 8.5 6M 188 50 26.6 85 45.2 50 26.6 3 1.6 1M 213 21 9.9 53 24.9 80 37.6 59 27.7 6M 188 4 2.1 54 28.7 109 58.0 21 11.2 1M 214 111 52.1 58 27.2 33 15.5 11 5.2 6M 188 137 72.9 34 18.1 17 9.0 0 0.0 Days in the last week with a happy facial expression a flat facial expression an upset/tearing facial expression 0=Not at all; 1=Sometimes 1 to 3 days a week; 2=Most of the time 4 to 6 days a week; 3=All the time with daily or more occurrence; Row % were presented 79 Table 3.11 Coping resources (A) Resources to cope with unhappiness before stroke at one month Degree of helpfulness No help at all % Mild n Moderate % n Help a lot Total n % n % Sleeping 211 162 76.8 36 17.1 7 3.3 6 2.8 Watching TV/Listening to radio/music 212 119 56.1 61 28.8 24 11.3 8 3.8 Indoor Drinking/Smoking/Eating 212 179 84.4 18 8.5 10 4.7 5 2.4 Finding someone to chat 212 143 67.5 47 22.2 19 9.0 3 1.4 Being occupied by household chores 212 186 87.7 23 10.8 3 1.4 0 0.0 Outdoor Going for a walk 212 130 61.3 67 31.6 10 4.7 5 2.4 Going shopping 212 193 91.0 14 6.6 3 1.4 2 0.9 Doing exercise 212 186 87.7 17 8.0 5 2.4 4 1.9 (B) Lubben Social Support Network scores at six months n Mean SD Range 188 20.4 8.0 4-42 Subtotal score of LSNS on family (0-15) 188 4.7 3.7 0-13 Subtotal score of LSNS on relatives (0-15) 188 5.0 4.6 0-15 188 10.7 4.0 0-19 Sum score of Lubben Social Network Scale (0-50) Subtotal score of LSNS on confidant (0-20) Row % were presented 80 3.2 Study outcomes 3.2.1 Level of agreements between depression assessments 3.2.1.1 The level of agreement between psychiatrists and the research nurse To validate the compatibility of the assessment made by the nurse and that diagnosed by the psychiatrist, we presented the result on level of agreement using Kappa’s statistics. Major depression was diagnosed by the psychiatrist under formal healthcare setting as referenced by the documentation in patients’ record that was reviewed retrospectively. The referral to psychiatric consultation was made independently under formal healthcare setting during the period one to four months after stroke. They did not know the assessment result made by the research nurse though they may know that the patient was a subject of this study as a copy the patient’s consent form was in place. At six months, a pscyhogeriatrician who was blind to nurse’s assessment result and patients’ background had met a pool of 42 patients with mixed depressive state. Only two patients were identified depressed. At one month, the level of agreement between the psychiatrist and the nurse was high with a Kappa’s value 0.843. Among those identified depressed by psychiatrist, the nurse was able to capture 87.5% and all in the non-depressed group using DSM IV (Specificity=100%, see Table 3.12A). At six months, the sensitivity and specificity of nurse’s assessment were 100% and 73.8% respectively. The estimated positive and negative predictive values were 15.4% and 100%. The Kappa’s value dropped to 0.204 (see Table 3.12B). 81 Table 3.12 Incidence of depression at one month and six months (A) Level of agreement for assessments at one month Diagnosis by psychiatrist Assessment made by the research nurse Depressed N=8 Not depressed N=5 DSM + TP=7 FP=0 PPV=100% DSM - FN=1 TN=5 NPV=83.3% Sen=87.5% Spe=100% 13 True positive (TP); False positive (FP); False negative (FN); True negative (Evans & Whitney); Sensitivity (Sen)=TP/(TP+FN); Specificity (Spe)=TN/(FP+TN); Positive predictive value (PPV)=TP/(TP+FP); Negative predictive value (NPV) =TN/(FN+TN); Pearson chi-square test conducted; Kappa’s value=0.843 (B) Level of agreement for assessments at six month Diagnosis by psychiatrist Depressed Assessment made by the research nurse Not depressed DSM + TP=2 FP=11 PPV=15.4% DSM - FN=0 TN=31 NPV=100% Sen=100% Spe=73.8% 44 Pearson chi-square test conducted; Kappa’s value=0.204 3.2.1.2 The level of agreement between depression assessment tools The use of different smiley pictures to assess depression after stroke is shown in Table 3.13. Taking DSM IV as the gold standard, the sensitivity and specificity of the three emoticons (upset/tearing, flat and happy) were 76.8%/76.5.%, 75.8%/44.3% and 49.5%/72.2% respectively. For GDS or CESD, the sensitivity and specificity were 83.8%/74.8%, 64.6%/91.3% respectively. The positive and negative predictive values of the smiley pictures were shown in percentage form as follows: emoticon (upset/tearing) =73.8/79.3; emoticon (flat) =54/68; emoticon (happy) =60.5/62.4. Those for GDS and CESD were 74.1/84.3 (GDS) and 86.5/75.0; CESD using a cut-off point of 11. The positive likelihood ratio of GDS and CESD was 3.3 and 7.4 respectively. Those for the upset/tearing, flat and happy smiley diagrams were 3.3, 1.4 and 1.8. The Kappa’s value was highly significant between DSM and GDS/CESD/emoticon (upset/tearing), with values set at 0.581/0.571/0.531 respectively (see Table 3.13). 82 Table 3.13 Screening property of depression assessment tools at one month DSM IV (fulfilling 3 criteria) Total Not depressed Depressed n=115 n=99 N=214 Freq. (%) Freq. (%) Freq. (%) Sn Sp PPV NPV Kappa (%) (%) (%) (%) PLR 0.531 76.8 76.5 73.8 79.3 3.3 0.196 75.8 44.3 54.0 68.0 1.4 0.219 49.5 72.2 60.5 62.4 1.8 0.581 83.8 74.8 74.1 84.3 3.3 0.571 64.6 91.3 86.5 75.0 7.4 In the past week, patients had demonstrated An upset/tearing face No 88 (76.5) 23 (23.2) 111 (51.9) Yes 27 (23.5) 76 (76.8) 103 (48.1) No 51 (44.3) 24 (24.2) 75 (35.0) Yes 64 (55.7) 75 (75.8) 139 (65.0) Yes 32 (27.8) 49 (49.5) 81 (37.9) No 83 (72.2) 50 (50.5) 133 (62.1) Not depressed 86 (74.8) 16 (16.2) 102 (47.7) Depressed 29 (25.2) 83 (83.8) 112 (52.3) 105 (91.3) 35 (35.4) 140 (65.4) 10 (8.7) 64 (64.6) 74 (34.6) A flat face A happy face GDS group (Cut-off at 5) CESD group (Cut-off at 11) Not depressed Depressed Sn = Sensitivity; Sp = Specificity; PPV = Positive predictive value; NPV = Negative predictive value; PLR = Likelihood ratio [Sn/(1-Sp)] Pearson Chi square test was used. 83 3.2.2 Incidence of DAS The incidence of depression for one-month cohort was 29.0% (62 out of 214, 95%CI=22.9%, 35.1%, see Table 3.14), using DSM IV as the gold standard. Nearly three fifths of the female participants (95%CI=30.9%, 52.7%) were depressed while only one fifth of the males (95%CI=14.6%, 28.4%) reported so at one month. The incidence of depression at six months dropped to about one third at six months (10.6%, 20 out of 188, 95%CI=6.2%, 15%). Depression among the stroke participants was also assessed by two other scales, the Geriatric Depression Scale (GDS) and the Center for Epidemiologic Studies Depression scale (CESD). The cut-off point used for GDS was 8 and for CESD 15. The incidence of depression identified by GDS was 26.6% (57 out of 214, 95%CI=20.7%, 32.5%) and 16.0% (30 out of 188, 95%CI=10.8%, 21.2%) at one month and six months respectively. The incidence of depression at one month and six months identified by CESD was 22.9% (49 out of 214, 95%CI=17.3%, 28.6%) and 13.3% (25 out of 188, 95%CI=8.4%, 18.2%, see Table 3.14) respectively. The mean score obtained from GDS was 5.2 (SD=3.9, range 0-15) at one month. It dropped to 3.3 (SD=3.5, range 0-14) at six months. For CESD, the mean score was 8.4 (SD=7.0, range 0-27) at one month, reducing to 6.4 (SD=5.9, range 0-22) at six months. Thus there was a significant reduction in depression as assessed by GDS and CESD (p<0.001, see Table 3.15). 84 Table 3.14 Incidence of depression at one month and six months Depression groups Non-depressed Total n Depressed % n 95% CI % DSM IV IM Total 214 152 71.0 62 29.0 22.9, 35.1 Male 135 106 78.5 29 21.5 14.6, 28.4 Female 79 33 41.8 46 58.2 30.9, 52.7 Total 188 168 89.4 20 10.6 6.2, 15.0 Male 118 111 94.1 7 5.2 1.2, 9.2 Female 70 57 81.4 13 18.6 9.5, 27.7 6M DSM (3 Criteria or more) IM 214 115 53.7 99 46.3 53.0, 39.6 6M 188 133 70.7 55 29.3 35.8, 22.8 GDS (CO at 8) IM 214 157 73.4 57 26.6 20.7, 32.5 6M 188 158 84.0 30 16.0 10.8, 21.2 GDS (CO at 5) IM 214 102 47.7 112 52.3 59.0, 45.6 6M 188 133 70.7 55 29.3 35.8, 22.8 CESD (CO at 15) IM 214 165 77.1 49 22.9 17.3, 28.6 6M 188 163 86.7 25 13.3 8.4, 18.2 CESD (CO at 10) IM 214 133 62.1 81 37.9 44.4, 31.4 6M 188 132 70.2 56 29.8 36.3, 23.3 Row % presented; CO=Cut-off point Table 3.15 Changes in the GDS and CESD mean scores at one month and six months 1M 6M 6M-1M Mean (SD) Mean (SD) N Mean 95%CI p GDS (Range 1M=0-15; 6M=0-14) 5.2 (3.9) 3.3 (3.5) 187 1.9 1.35, 2.38 <0.001 CESD (Range 1M=0-27; 6M=0-22) 8.4 (7.0) 6.4 (5.9) 187 2.1 1.26, 3.01 <0.001 Paired sample t-test conducted 85 3.2.3 Risk factors of DAS 3.2.3.1 Using DSM IV as the assessment tool Socio-demographic factors and health history. By putting the demographic factors into univariate analysis with the depression group using DSM IV as the gold standard, four demographic factors were found to have an association with depression. They were: length of hospital stay (OR=1.03, 95%CI=1.01, 1.05, p=0.001, see Table 3.16A), being female (OR=2.62, 95%CI=1.43, 4.81, p=0.003, see Table 3.16B), not being married (OR=2.46, 95%CI=1.34, 4.50, p=0.003) and living alone or other living arrangements instead of living with family (OR=2.32, 95%CI=1.06, 5.05, p=0.032). Participants’ age or formal education, working status, living premises or financial assistance received did not have such an association, and nor did health factors, including the number of chronic diseases, a smoking habit or health history (see Tables 3.16ABC). Bio-anatomical domain. The findings related to radiological, circulatory and neurological assessment on depression are discussed in this section. The association between anatomical lesions depicted by computerised tomography in terms of laterality and location along with depression could not be established in this sample (see Table 3.17A). And it was noted that fewer than 50% of clients had their lesion location documented in the case notes, leading to a reduced number of total subjects available for analysis in this section. Where circulatory or neurological functioning was concerned, the lesions that involved both the total or partial anterior cerebral circulation infarction were identified as having a weak association with depression (p=0.028, OR=2.23, 95%CI=1.08, 4.57, see Table 3.17B). Though not shown in tables, analysis of various serum levels (including low/high density lipoprotein, total cholesterol, fasting blood sugar, blood pressure on admission) was conducted but was not associated with depression, neither was any documented use of drugs in this study (aspirin, statin, antihypertensive, antidiabetic prescribed upon discharge). 86 Cognitive and communicative domain. In this section, the effect of communicative problems are reported, in terms of aphasia, visual acuity and hearing; as well as cognitive functions in terms of memory, and the Abbreviated Mental Test score on DAS. Visual impairment had a consistent effect on depression at both acute and rehabilitative phases (p1m=0.002; p6m<0.001, see Table 3.18A), but those visual problems were few in this sample, especially at six months (n=10). The number reporting expressive aphasia dropped from 34 to 3, whereas for global aphasia it changed from 4 to none at six months, indicating that these problems were not common in the sample (see Table 3.18A). In the cognitive domain, the AMT score that reflected subjects’ mental capacity demonstrated a significant inverse relationship with depression. Thus, the higher the AMT score, the less susceptible to depression the subjects were. The depressed group had a significantly lower score (poorer mental capacity) in AMT than their counterparts. The mean AMT score of the depressed group was 8.4 (SD=1.5) compared with 9.2 (SD=1.1) among non-depressed subjects at one month (p<0.001, OR=0.62, 95%CI=0.49, 0.78, see Table 3.18B). Such a trend persisted at six months with a further drop in the mean score in the depressed group (p=0.001, OR=0.52, 95%CI=0.39, 0.69, see Table 3.18B). Dependency and somatic symptoms domain. In this section, the effect of pain, somatic symptoms and self-care capabilities on depression was explored. As regards physical health factors, pain was frequently found to be associated with DAS. Among various types, joint pain was the only significant factor associated with DAS at both one month (p=0.020) and six months (p=0.006, see Table 3.19A). Dizziness was another somatic complaint reported constantly that might have a role in depression (p=0.018 at 1M; p=0.028 at 6M). The somatic complaints aggregate also showed a significant effect on depression at different time points (p=0.001 at 1M; p=0.008 at 6M, see Table 3.19B). Most of the pain and symptoms subsided at six months, the only exception being non-specific muscle pain, which had increased from 11.2% to 19.7% (see Table 3.19A) despite an insignificant effect on depression. 87 Three more tools for assessing self-care function were related to depression. On the Barthel ADL index, the depressed group had a lower mean score (mean=12.5) compared with that of the non-depressed (mean=16.9, p<0.001, OR=0.86, 95%CI=0.81, 0.91, see Table 3.19B). A similar pattern was observed for the Norton Scale of Pressure Sore (p<0.001). In this study, the subjects’ quality of life measured by the Modified Rankin Scale for Quality of Life (MRSQoL) showed a significant and strong relationship with depression (p<0.001, OR=1.95, 95%CI=1.49, 2.54,). And MRSQoL remained low and unimproved among the depressed participants six months after first stroke (mean=3.1 at 1M and 6M, see Table 3.19B). 88 Table 3.16 Relationship of socio-demographics and health history with DAS (A) Socio-demographics (continuous data) Age (in years) Total Non-depressed Depressed n=214 n=152 n=62 Mean SD Mean SD Mean SD OR 95% CI p 72.3 9.4 71.5 9.4 74.1 9.3 1.03 0.99 , 1.06 0.071 Formal education (in years) 5.5 5.0 5.2 4.7 4.6 5.6 0.97 0.91 , 1.03 0.421 Length of hospital stay (in days) 17.1 15.4 14.9 14.6 22.4 16.0 1.03 1.01 , 1.05 0.001 No of chronic diseases 2.1 1.2 2.0 1.2 2.3 1.4 1.17 0.92 , 1.49 0.191 Student’s t-test used (B) Socio-demographics (nominal data) Total Gender Marital status Living with c Financial assistance % n % n % Male 135 63.1 106 69.7 29 46.8 (Female) 79 36.9 46 30.3 33 53.2 136 63.6 106 69.7 30 48.4 78 36.4 46 30.3 32 51.6 187 87.4 130 85.5 57 91.9 (Working) 27 12.6 22 14.5 5 8.1 Family 183 85.5 135 88.8 48 77.4 (Others) 31 14.4 17 11.2 14 22.6 No 160 74.8 119 78.3 41 66.1 54 25.2 33 21.7 21 33.9 Married Not working (Yes) a b d Pearson chi-square test used a Depressed n (Not Married) Occupation Non-depressed 2 df OR 95% CI p 9.009 1 2.62 1.43 , 4.81 0.003 8.666 1 2.46 1.34 , 4.50 0.003 1.641 1 1.93 0.69 , 5.34 0.199 4.617 1 2.32 1.06 , 5.05 0.032 3.452 1 1.85 0.96 , 3.54 0.063 (Variable)=risk factor for depression Not married: Widowed/Single/Divorced/Separated Others: including those living alone χ d b Not working: Retired/ Housewife/Unemployed c Family: Spouse/Children/Both spouse & children; Yes: Had received Old Age Allowance/Disability Allowance/High disability Allowance/Combined Social Security Allowance 89 (C) Health history Total Non-depressed n Had a history of % n Depressed % n % χ 2 df OR 95% CI p a Hypertension 149 69.6 106 69.7 43 69.4 0.003 1 0.98 0.51 , 1.86 0.956 Diabetes mellitus 64 29.9 44 28.9 20 32.3 0.230 1 1.17 0.61 , 2.21 0.631 Cardiovascular diseases excluding hypertension 79 36.9 51 33.6 28 45.2 2.548 1 1.63 0.89 , 2.98 0.112 161 75.2 109 71.7 52 83.9 3.495 1 0.49 0.22 , 1.04 0.062 53 24.8 43 28.3 10 16.1 Smoking habit Non-smoker (Smoker) Pearson chi-square test used a (Variable)=risk factor for depression Analysis was done using binary groups, i.e. yes vs. no such history Table 3.17 The association of bio-anatomical domain factors with DAS at one month (A) Features of brain lesions Non-depressed Total Depressed n % n % n % Unremarkable findings 70 32.7 55 36.2 15 24.2 (Abnormality recorded) 144 67.3 97 63.8 47 75.8 Left 84 45.7 60 46.5 24 43.6 (Right) 100 54.3 69 53.5 31 56.4 Subcortical region/cerebellar and brain stem 69 86.3 50 89.3 19 79.2 (Cortical region/multiple sites) 11 13.8 6 10.7 5 20.8 Subcortical region/cerebellar and brain stem 75 83.3 51 85.0 24 80.0 (Cortical region/multiple sites) 15 16.7 9 15.0 6 20.0 χ 2 df OR 95% CI p 2.877 1 1.78 0.91 , 3.47 0.090 3.141 1 1.12 0.59 , 2.12 0.208 1.451 1 2.19 0.59 , 8.03 0.228 0.360 1 1.42 0.45 , 4.43 0.549 Findings on computerized tomography Laterality of lesions Locations of left-sided lesions Locations of right-sided lesions Pearson chi-square test used (Variable)=risk factor for depression 90 (B) Circulatory and neurological findings Non-depressed Total Depressed n % n % n % 102 87.2 74 89.2 28 82.3 15 12.8 9 10.8 6 17.7 0-49% occlusion 88 79.6 64 81.0 24 72.7 (>/=50% occlusion) 24 21.4 15 19.0 9 27.3 LACI/POCI/Not classified 175 81.8 130 85.5 45 72.6 (TACI/PACI) 39 18.2 22 14.5 17 27.4 132 61.7 97 63.8 35 56.5 82 38.3 55 36.2 27 43.5 105 56.8 73 56.2 32 58.2 43.2 57 43.8 23 41.8 Degree of occlusion in left Carotid Artery (diameter reduction) 2 df OR 95% CI p 0.953 1 1.70 0.58, 5.00 0.333 0.955 1 1.55 0.64, 3.76 0.331 4.952 1 2.23 1.08 , 4.57 0.028 1.131 1 1.39 0.75 , 2.53 0.288 0.138 1 1.13 0.60 , 2.11 0.709 a 0-49% occlusion (>/=50% occlusion) Degree of occlusion in right Carotid Artery (diameter reduction) Classification a/c circulation χ a b Cranial nerve involvement No (Yes) Side of functional deficit a Right (Left) Pearson chi-square test used b 80 (Variable)=risk factor for depression a Total not adding up to 214 due to missing data LACI=Lacunar circulation infarction; POCI=Posterior circulation infarction; TACI= Total anterior circulation infarction; PACI= Partial anterior circulation infarction 91 Table 3.18 The association of cognitive and communicative domain factors with DAS (A) Communicative factors Total Non-depressed Depressed χ 2 df OR 95% CI p 0.006 1 0.97 0.38 , 2.44 0.940 Time n % n % n % Swallowing problems 1M 25 11.7 18 11.8 7 11.5 6M 6 3.2 4 2.4 2 10.0 3.358 1 NA -- 0.067 Visual acuity problems 1M 39 18.3 20 13.2 19 31.1 9.419 1 2.99 1.45 , 6.11 0.002 6M 10 5.3 4 2.4 6 30.0 27.070 1 NA -- <0.001 Hearing problems 1M 25 11.7 16 10.5 9 14.8 0.751 1 1.47 0.61 , 3.53 0.386 6M 2 1.1 1 0.6 1 5.0 3.295 1 NA -- 0.070 1M 41 19.2 24 15.8 17 27.9 4.086 1 2.06 1.01 , 4.18 0.043 6M 9 4.8 7 4.2 2 10.0 1.334 1 NA -- 0.248 Dysarthria 1M 45 21.1 28 18.4 17 27.9 2.332 1 1.71 0.85 , 3.42 0.127 6M 4 2.1 3 1.8 1 5.0 0.887 1 NA -- 0.346 Expressive aphasia 1M 34 16.0 21 13.8 13 21.3 1.823 1 1.69 0.78 , 3.63 0.177 6M 3 1.6 1 0.6 2 10.0 10.067 1 NA -- 0.002 Receptive aphasia 1M 2 0.9 1 0.7 1 1.6 0.451 1 NA -- 0.502 6M 0 -- -- -- -- -- 1M 4 1.9 0 0.0 4 6.6 10.158 1 NA -- 0.001 6M 0 -- -- -- -- -- 1M 3 1.4 2 1.3 1 1.6 0.033 1 NA -- 0.856 6M 0 -- -- -- -- -- Had disturbance due to Memory problems Global aphasia Agnosia Binary outcome was assessed (ie. Yes vs. no. and only those reported having such symptoms were tabled; Pearson chi-square test used; NA- Not applicable; OR was not estimated if cell empty/ row total =0-10 (B) Cognitive factor Non-depressed Total Time Depressed Mean SD Mean SD Mean SD OR 95% CI p 1M 9.0 1.3 9.2 1.1 8.4 1.5 0.62 0.49 , 0.78 <0.001 6M 9.1 1.4 9.3 1.2 7.5 2.0 0.52 0.39 , 0.69 0.001 Abbreviated Mental Test (0-10, 10=highest mental functioning) Student’s t-test used 92 Table 3.19 The associations of dependency and somatic symptoms domain factors with DAS (A) Somatic symptoms Non-depressed Total Depressed Time n % n % n % No 1M 167 78.0 125 82.2 27 17.8 (Yes) 1M 47 22.0 27 17.8 20 32.3 No 6M 168 89.4 154 91.7 14 70.0 (Yes) 6M 20 10.6 14 8.3 6 30.0 χ 2 df OR 95% CI p 5.398 1 2.21 1.12, 4.33 0.020 8.826 1 4.71 1.57 14.19 0.006 2.909 1 1.89 0.90, 3.93 0.088 0.236 1 1.38 0.37, 5.17 0.627 3.735 1 2.31 0.97, 5.47 0.053 0.001 1 1.02 0.32, 3.26 0.970 5.580 1 2.36 1.14, 4.85 0.018 4.856 1 3.40 1.09, 10.66 0.028 2.087 1 1.70 0.82, 3.51 0.149 0.996 1 1.94 0.51, 7.44 0.326 Had disturbance due to Joint pain Low back pain Non-specific muscle pain Dizziness Constipation Pearson chi-square test used; No 1M 177 82.7 130 85.5 47 75.8 (Yes) 1M 37 17.3 22 14.5 15 24.2 No 6M 166 88.3 149 88.7 17 85.0 (Yes) 6M 22 11.7 19 11.3 3 15.0 No 1M 190 88.8 139 91.4 51 82.3 (Yes) 1M 24 11.2 13 8.6 11 17.7 No 6M 151 80.3 135 80.4 16 80.0 (Yes) 6M 37 19.7 33 19.6 4 20.0 No 1M 176 82.2 131 86.2 45 72.6 (Yes) 1M 38 17.8 21 13.8 17 27.4 No 6M 168 89.4 153 91.1 15 75.0 (Yes) 6M 20 10.6 15 8.9 5 25.0 No 1M 175 81.8 128 84.2 47 75.8 (Yes) 1M 39 18.2 24 15.8 15 24.2 No 6M 171 91.0 154 91.7 17 85.0 (Yes) 6M 17 9.0 14 8.3 3 15.0 (Variable)=risk factor for depression 93 (B) Dependency levels and aggregate somatic symptoms Time Total Non-depressed N=214 n=152 Mean SD Mean Depressed n=62 SD Mean SD OR 95% CI p Total no. of reported pain (0-5) 1M 0.7 1.0 0.5 0.9 1.0 1.3 1.57 1.18, 2.08 0.002 6M 0.5 0.8 0.5 0.8 0.9 0.9 1.50 0.96, 2.36 0.076 Total no. of reported symptoms excluding pains (0-5) 1M 0.5 0.8 0.5 0.8 0.9 0.9 1.61 1.11, 2.35 0.013 6M 0.3 0.5 0.3 0.5 0.6 0.8 2.75 1.32, 5.76 0.007 Total no. of body symptoms (0-10) Barthel ADL Index (0-20, 20=highest function) Modified Rankin Scale for Quality of Life (0-5, 5=Lowest QoL) Norton Scale of Pressure Sore (5-20, 20=Lowest risk) Student’s t-test used; a a 1M 1.2 1.4 1.0 1.2 1.7 1.7 1.42 1.16, 1.75 0.001 6M 0.3 0.5 0.3 0.5 0.6 0.8 1.61 1.13, 2.29 0.008 1M 15.6 5.3 16.9 4.4 12.5 6.0 0.86 0.81 , 0.91 <0.001 6M 17.0 4.7 17.6 4.3 12.8 5.3 0.86 0.79, 0.93 0.001 1M 2.4 1.3 2.1 1.2 3.1 1.3 1.95 1.49, 2.54 <0.001 6M 2.1 1.2 2.0 1.1 3.1 1.0 2.21 1.44, 3.40 <0.001 1M 16.8 2.4 17.4 2.0 15.4 2.8 0.70 0.61, 0.80 <0.001 -- -- -- -- -- -- -- The item was not included in 6M questionnaire 94 Emotional domain. Besides physical and cognitive functioning, some factors under the emotional domain were also found to correlate with DAS. The assessment of this domain falls into three aspects: (1) presence of different worries and life stressors, (2) perceived current health status and disturbance due to anxiety, (3) frequency of different facial expression (happy/flat/upset or tearing) over the past week. The majority of the stroke survivors had stressors and worries over various aspects. Immediately after stroke, the most frequent were worries over stroke rehabilitation, disturbance due to body pains and discomfort, and financial problems. As many as 82.3% of depressed participants (51 out of 62) verbalised worries related to stroke rehabilitation while only 50% reported such worries among the non-depressed group (76 out of 152, p<0.001, see Table 3.20A). At six months, the proportion of participants reporting worries decreased mostly to one half or less. The most significant life stressors at six months became disturbance due to body pains and discomfort, (p=0.001), poor family relationships (p=0.003), and worry about stroke rehabilitation among the depressed group (p=0.011, see Table 3.20A). Anxiety and perceived current health status were two factors associated with DAS at two time points. 35.1% (20 out of 57) of the depressed group compared with 18.5% (27 out of 146) of the non-depressed group (p=0.013, see Table 3.20B) reported disturbance due to anxiety. More depressed subjects (67.7%, 42 out of 62) reported poor perceived health compared with the non-depressed (41.4%, 63 out of 152, p<0.001). Such a difference in perception persisted to six months (p<0.001), even though the total number of participants reporting poor health had dropped from 105 (at one month) to 33 at six months (see Table 3.20B). As regards frequency of displaying a happy face, about 51% (31 out of 61, see Table 3.20C) of the depressed group reported none compared with 32% of the non-depressed group (49 out of 152, p=0.012) at the one-month interview. The proportion having a happy face rose to 77.4% for the non-depressed but dropped further to 60.0% from 40.0% for the depressed at the six-month interview (p=0.001, see Table 3.20C). As for the flat face option, a majority of the non-depressed group reported ‘Yes’ (86.2%) and the whole of the depressed 95 group did so. When asked about the frequency of displaying an upset/tearing face (as shown by the upset/tearing emoticon), 86.9% of the depressed group (53 out of 62) while about a third of the non-depressed group (32.2%, 49 out of 152) admitted to having an upset/tearing face over the last week (p<0.001). Such a trend persisted at six months with a large disparity in the proportion having an upset/tearing face between the depressed and non-depressed groups (p<0.001, see Table 3.20C). Subjects’ reports on having different emotions during stroke hospitalisation might have an effect on DAS, as shown in Table 3.20C. Significantly more depressed subjects (62.9%, 39 out of 62) than non-depressed (18.4%, 28 out of 152, p<0.001) suspected themselves of having depression during their hospital stay. Agitation was another factor identified as having an association with depression but not reported worry, anxiety and panic during hospitalisation (see Table 3.20D). Family and social support domain. No significant difference was noted in the availability and use of the various means mentioned in Table 3.11 to cope with unhappiness before stroke and depression at one month (not shown in table). Participants’ social networks assessed at six months revealed that there was a mild protective effect of having better scores on the ‘relatives network’ subscale (OR=0.88, 95%CI=0.78, 0.99, p=0.044, see Table 3.21) or the aggregate scores on the Lubben Social Network Scale (OR=0.94, 95%CI=0.88, 0.99, p=0.045) but not with the ‘family network’ and ‘confidant relationship’ subscales. 96 Table 3.20 The association of emotional domain factors with DAS (A) Presence of worries and life stressors Total Time Worry about stroke rehabilitation Financial problems Body pains and discomfort Poor family relationship Pearson chi-square test used; Non-depressed n % n % Depressed n % No 1M 87 40.7 76 50.0 11 17.7 (Yes) 1M 127 59.3 76 50.0 51 82.3 No 6M 147 78.2 136 81.0 11 55.0 (Yes) 6M 41 21.8 32 19.0 9 45.0 No 1M 157 73.4 114 75.0 43 69.4 (Yes) 1M 57 26.6 38 25.0 19 30.6 No 6M 148 78.7 131 78.0 17 85.0 (Yes) 6M 40 21.3 37 22.0 3 15.0 No 1M 154 72.0 120 78.9 34 54.8 (Yes) 1M 60 28.0 32 21.1 28 45.2 No 6M 140 74.5 132 78.6 8 40.0 (Yes) 6M 48 25.5 36 21.4 12 60.0 No 1M 189 88.3 138 90.8 51 82.3 (Yes) 1M 25 11.7 14 9.2 11 17.7 No 6M 175 93.1 160 95.2 15 75.0 (Yes) 6M 13 6.9 8 4.8 5 25.0 χ 2 df OR 95% CI p 18.993 1 4.64 2.24, 9.57 <0.001 7.059 1 3.48 1.33, 9.09 0.011 0.718 1 1.33 0.69, 2.55 0.398 0.526 1 0.62 0.17, 2.25 0.472 12.686 1 3.09 1.64, 5.82 <0.001 13.985 1 5.5 2.09, 14.47 0.001 3.107 1 0.91 0.91, 4.98 0.078 11.372 1 6.67 1.94, 22.95 0.003 (Variable)=risk factor for depression (B) Perceived current health status and anxiety levels Total Disturbance due to anxiety Perceived current health status Pearson chi-square test used Non-depressed Depressed Time n % n % n % No 1M 156 76.8 119 81.5 37 64.9 (Yes) 1M 47 23.2 27 18.5 20 35.1 No 6M 171 91.0 155 92.3 16 80.0 20.0 (Yes) 6M 17 9.0 13 7.7 4 Good/average 1M 109 50.9 89 58.6 20 32.3 (Poor) 1M 105 49.1 63 41.4 42 67.7 Good/average 6M 155 82.4 146 86.9 9 45.0 (Poor) 6M 33 17.6 22 13.1 11 55.0 χ 2 df OR 95% CI p 6.345 1 2.38 1.20, 4.73 0.013 3.267 1 2.98 0.87, 10.23 0.083 12.183 1 2.97 1.59, 5.52 <0.001 21.686 1 8.11 3.02, 21.79 <0.001 (Variable)= risk factor for depression 97 (C) Occurrence of different facial expressions over the past week (binary answer) Total Non-depressed Depressed Time n % n % n % χ 1M 133 62.4 103 67.8 30 49.2 2 df OR 95% CI p 6.410 1 2.17 1.19, 3.98 0.012 12.792 1 5.13 1.96, 13.47 0.001 9.349 1 -- -- NA 0.487 1 -- -- NA 52.094 1 13.93 6.15, 31.54 <0.001 31.649 1 15.2 4.78, 48.35 <0.001 df OR 95% CI p Displaying of various facial expression over past week a happy facial expression Yes a flat facial expression an upset/tearing facial expression (No) 1M 80 37.6 49 32.2 31 50.8 Yes 6M 138 73.4 130 77.4 8 40.0 (No) 6M 50 26.6 38 22.6 12 60.0 No 1M 21 9.9 21 13.8 0 0.0 (Yes) 1M 192 90.1 131 86.2 61 100.0 No 6M 4 2.1 4 2.4 0 0.0 (Yes) 6M 184 97.9 164 97.6 20 100.0 No 1M 111 52.1 103 67.8 8 13.1 (Yes) 1M 102 47.9 49 32.2 53 86.9 No 6M 137 72.9 133 79.2 4 20.0 (Yes) 6M 51 27.1 35 20.8 16 80.0 (D) Occurrence of different emotions during hospitalisation Total Non-depressed Depressed Time n % n % n % χ Reported depression by 1 question 1M 67 31.3 28 18.4 39 62.9 40.516 1 7.51 3.88, 14.5 <0.001 Reported anxiety by 1 question 1M 26 12.1 18 11.8 8 12.9 0.046 1 1.72 0.93, 3.16 0.829 2 Proportion reported ‘Yes’ Reported worry by 1 question 1M 71 33.2 45 29.6 26 41.9 3.020 1 1.11 0.45, 2.68 0.083 Reported panic by 1 question 1M 43 20.1 29 19.1 14 22.6 0.336 1 1.24 0.6, 2.54 0.562 1M 15 7.0 6 3.9 9 14.5 7.547 1 4.13 1.4, 12.16 0.006 Reported agitation by 1 question Pearson chi-square test used (Variable)= risk factor for depression NA- Not applicable; OR was not estimated if cell empty/ row total =0-10 98 (E) Occurrence of different facial expressions over the past week (ordinal scale) Total Non-depressed Depressed Time Mean SD Mean SD Mean SD t df OR 95% CI p 1M 1.9 1.0 1.8 1.0 2.3 0.8 -4.224 147 1.86 1.31, 2.62 <0.001 6M 2.0 0.8 1.9 0.8 2.6 0.5 -4.020 186 4.41 1.95, 9.94 <0.001 1M 1.8 0.9 1.8 1.0 2.0 0.8 -1.495 211 1.28 0.92, 1.77 0.137 6M 1.8 0.7 1.8 0.7 1.8 0.6 -0.129 186 1.05 0.51, 2.11 0.897 1M 0.7 0.9 0.4 0.7 1.6 0.9 -8.877 85 5.03 3.19, 7.91 <0.001 6M 0.4 0.6 0.2 0.5 1.4 0.8 -8.556 186 7.84 3.82, 16.07 <0.001 Displaying of various facial expression over past week a happy facial expression (0-3) a a flat facial expression (0-3) an upset/tearing facial expression(0-3) Student’s t-test used a Reversed coding done Table 3.21 The association of social support domain factors with DAS at six months Non-depressed Depressed n=168 n=20 Mean SD Mean SD T df OR 95% CI p 20.8 8.0 17.0 6.5 2.051 186 0.94 0.88, 0.99 0.045 Subtotal score of LSNS on family (0-15) 4.7 3.6 4.7 4.1 0.037 186 1 0.88, 1.13 0.971 Subtotal score of LSNS on relatives (0-15) 5.2 4.6 3 4.0 2.086 186 0.88 0.78, 0.99 0.044 Subtotal score of LSNS on confidant (0-20) 10.8 4.0 9.3 4.1 1.631 186 0.91 0.81, 1.02 0.107 Sum score of Lubben Social Network Scale 6M (0-50) Student’s t-test used 99 3.2.3.2 Using GDS/CESD as the assessment tool The factors associated with depression measured by GDS are displayed in Tables 3.22 and those measured by CESD in Table 3.23. Demographics. The findings were in line with that of DSM. Four factors, as in DSM, were able to demonstrate a significant relationship with depression: ‘not married’, female, ‘not living with family’ and ‘length of hospital stay’ (see Table 3.22A). Cognitive and communicative domain. Ignoring factors with cell count in the row total with fewer than ten subjects, visual acuity problems remained highly significant as depicted by the three tools. Not identified by DSM, some other significant risk factors were revealed by GDS: dysarthria, swallowing and memory problems at one month. But such significant findings did not persist to the six-month follow-up, when the frequency of participants having dysarthria or memory problems had dropped drastically to four and nine respectively (see Table 3.22B). The highly significant relationship between DAS and mental capacity reflected by the Abbreviated Mental Test (AMT) was noted by the three tools at the two time points (see Tables 3.18B, 3.22B, 3.23B). Dependency and somatic symptoms domain. Similar to those assessed by DSM, self-care functions and some somatic symptoms in this domain were factors associated with DAS at one month. Scores on the Barthel Activity of Daily Living Index, stomach pain, joint pain and the total aggregate number of body symptoms (10 types) remained significant factors at six months (see Table 3.23C), as in line with DSM. 100 Table 3.22 Factors associated with GDS at one and six months (A) Demographics Age Time OR 95%CI p 1M 1 0.97, 1.04 0.789 0.002 Gender - Female 1M 2.71 1.45, 5.04 Years of formal education 1M 0.94 0.88, 1.01 0.077 Length of hospital stay 1M 1.05 1.02, 1.07 <0.001 Marital status – Not married 1M 3.09 1.65, 5.78 <0.001 Not living with family 1M 2.28 1.04, 5.03 0.041 Had financial assistance from government 1M 0.84 0.41, 1.71 0.623 Individual logistic regression done; Dependent variable=GDS for Tables A-E (B) Cognitive and Communicative domains Sum score Abbreviated Mental Test Time OR 95%CI p 1M 0.64 0.51, 0.81 <0.001 6M 0.57 0.44, 0.74 <0.001 <0.001 Had problems in Expressive aphasia 1M 4.17 1.95, 8.95 6M 11.214 0.98, 127.87 0.052 global aphasia 1M 8.83 0.90, 86.72 0.062 6M -- -- NA Dysarthria 1M 2.59 1.29, 5.18 0.007 6M 1.78 0.17, 17.72 0.622 Swallowing 1M 2.5 1.06, 5.89 0.037 6M 5.74 1.1, 29.94 0.038 visual acuity 1M 3.07 1.49, 6.33 0.002 6M 6.12 1.65, 22.67 0.007 memory 1M 2.11 1.03, 4.34 0.042 6M 2.81 0.66, 11.94 0.160 NA- Not applicable and OR can’t be calculated due to empty cell (C) Dependency and somatic symptoms domain Time OR 95%CI p BADL sum score 1M 0.82 0.77, 0.88 <0.001 6M 0.85 0.78, 0.91 <0.001 Modified Rankin Scale for Quality of Life 0 to 5 1M 2.04 1.54, 2.69 <0.001 6M 1.86 1.28, 2.71 0.001 1M 0.61 0.52, 0.72 <0.001 1M 4.59 1.81, 11.61 0.001 6M 1.64 0.42, 6.36 0.471 stomach pain 1M 3.08 1.16, 8.21 0.024 6M 1.06 0.11, 9.36 0.962 non-specific muscle pain 1M 1.15 0.45, 2.94 0.766 6M 2.94 1.25, 6.90 0.013 dizziness 1M 2.39 1.15, 4.98 0.020 6M 2.57 0.90, 7.34 0.078 other specific health problems 1M 1.98 0.95, 4.12 0.068 6M 3.71 1.23, 11.11 0.020 1M 1.54 1.16, 2.04 0.003 6M 1.41 0.94, 2.11 0.092 1M 1.62 1.10, 2.37 0.014 6M 2.77 1.43, 5.33 0.002 1M 1.41 1.15, 1.73 0.001 6M 1.56 1.13, 2.13 0.006 Norton Scale of pressure sore sum score a Level of disturbance due to headache Total no. of reported pain Total no. of reported symptoms excluding pains Total no. of body symptoms a This item was not included at 6M questionnaire 101 (D) Emotional domain Perceived current health status Worry about current health a Time OR 95%CI p 1M 2.99 1.57, 5.68 0.001 6M 9.48 3.94, 22.76 <0.001 1M 5.68 2.92, 11.02 <0.001 1M 2.31 1.57, 3.39 <0.001 6M 6.56 3.07, 13.97 <0.001 1M 1.47 1.04, 2.07 0.028 6M 1.69 0.90, 3.12 0.097 1M 3.34 2.26, 4.94 <0.001 Displaying of various facial expression over past week a happy facial expression (Reversely coded) a flat facial expression an upset/tearing facial expression Disturbance due to anxiety 6M 4.79 2.69, 8.48 <0.001 1M 3.16 1.59, 6.26 0.001 6M 3.34 1.12, 9.88 0.029 1M 5.27 2.42, 11.46 <0.001 Disturbance due to worry over stroke rehabilitation progress Disturbance due to 6M 2.97 1.28, 6.82 0.011 financial problem 1M 3.05 1.59, 5.85 0.001 6M 1.76 0.73, 4.2 0.207 bodily pain and discomforts 1M 2.44 1.28, 4.66 0.007 6M 4.50 1.99, 10.17 <0.001 poor family relationship 1M 3.57 1.52, 8.39 0.003 6M 5.39 1.66, 17.41 0.005 losing job/loss of job 1M 0.90 0.31, 2.61 0.852 6M 4.86 1.76, 13.40 0.002 other things 1M 0.62 NA 0.467 6M 0.90 NA 0.861 1M 2.96 1.56, 5.60 0.001 1M 1.51 1.22, 1.88 <0.001 6M 2 1.45, 2.75 <0.001 depression 1M 3.24 1.72, 6.12 <0.001 worry 1M 1.54 0.82, 2.88 0.181 anxiety 1M 2.26 0.97, 5.28 0.058 panic 1M 1.44 0.70, 2.97 0.327 1M 1.93 0.66, 5.70 0.231 disease deterioration a Sum of life stressors Reported emotions during hospitalization a agitation a This item was not included at 6M questionnaire; NA- Not applicable and OR can’t be calculated due to empty cell (E) Social support domain Time OR 95%CI p Finding someone to chat 1M 1.34 0.55, 3.23 0.520 Going for a walk 1M 0.57 0.15, 2.13 0.404 Exercising 1M 2.26 0.73, 6.97 0.155 0.001 Usefulness of means to relieve unhappiness before stroke Sum score of Lubben Social Network Scale (LSNS) 6M 6M 0.9 0.85, 0.95 Subtotal score of LSNS on family 6M 0.97 0.86, 1.07 0.520 Subtotal score of LSNS on relatives 6M 0.89 0.80, 0.98 0.022 Subtotal score of LSNS on confidant 6M 0.83 0.74, 0.91 <0.001 102 Table 3.23 Factors associated with CESD at one and six months (A) Demographics Time OR 95%CI p 1M 1 0.97, 1.03 0.938 Gender - Female 1M 3.33 1.72, 6.45 <0.001 Years of formal education 1M 0.94 0.87, 1.01 0.080 Length of hospital stay 1M 1.03 1.01, 1.05 0.003 Marital status – Not married 1M 3.43 1.77, 6.64 <0.001 Not living with family 1M 2.49 1.11, 5.59 0.027 Age Individual logistic regression done; Dependent variable=CESD for Tables A-E (B) Cognitive and communicative domains Time OR 95%CI p Sum score Abbreviated Mental Test 1M 0.63 0.49, 0.80 <0.001 6M 0.67 0.51, 0.85 0.002 Expressive aphasia 1M 2.17 0.98, 4.79 0.056 6M 2.22 0.22, 22.24 0.497 Global aphasia 1M 10.93 1.11, 107.65 0.040 6M -- -- NA Dysarthria 1M 2.68 1.31, 5.50 0.007 6M 2.22 0.22, 22.24 0.497 Visual acuity 1M 4.75 2.26, 9.99 <0.001 6M 12.55 3.24, 48.5 <0.001 Memory 1M 2.1 1.00, 4.44 0.051 6M 1.94 0.37, 9.90 0.427 NA- Not applicable and OR can’t be calculated due to empty cell (C) Dependency and somatic symptom domains Time OR 95%CI p BADL sum score 1M 0.83 0.78, 0.89 <0.001 6M 0.91 0.85, 0.99 0.019 Modified Rankin Scale for Quality of Life 0 to 5 1M 2.21 1.63, 2.99 <0.001 6M 1.86 1.28, 2.71 0.001 1M 0.65 0.56, 0.76 <0.001 1M 3.78 1.50, 9.58 0.005 6M 3.26 0.92, 11.52 0.067 Norton Scale of pressure sore sum score a Level of disturbance due to headache 1M 3.9 1.45, 10.47 0.007 6M 7.27 1.38, 38.30 0.019 1M 2.39 1.18, 4.86 0.016 6M 3.36 1.15, 9.79 0.026 1M 2.12 0.98, 4.57 0.055 6M 2.15 0.71, 6.46 non-specific muscle pain 1M 2.25 6M 0.75 dizziness 1M 2.72 1.29, 5.77 0.009 6M 3.36 1.15, 9.79 0.026 1M 1.66 0.77, 3.58 0.199 6M 4.36 1.45, 13.15 0.009 1M 1.78 6M 2.4 Total no. of reported pain 1M 1.72 6M 1.59 1.05, 2.41 0.030 Total no. of reported symptoms excluding pains 1M 1.68 1.13, 2.50 0.010 6M 3.3 1.65, 6.59 0.001 Total no. of body symptoms 1M 1.51 1.22, 1.88 <0.001 6M 1.74 1.25, 2.43 0.001 stomach pain joint pain low back pain constipation other specific health problems a 0.174 0.076 0.620 0.276 0.160 1.28, 2.31 <0.001 This item was not included at 6M questionnaire 103 (D) Emotional domain Perceived current health status a Level of worry about current health (0-3) Time OR 95%CI p 1M 3.85 1.90, 7.80 <0.001 6M 9.65 3.83, 24.28 <0.001 1M 16.5 6.90, 34.99 <0.001 1M 2.01 1.35, 2.96 <0.001 6M 4.67 2.21, 9.84 <0.001 1M 1.42 0.99, 2.04 0.056 6M 2.05 1.03, 4.05 0.038 1M 3.04 2.06, 4.47 <0.001 Displaying of various facial expression over past week a happy facial expression (0-3) (reversely coded) a flat facial expression (0-3) an upset/tearing facial expression (0-3) 6M 3.96 2.23, 7.04 <0.001 1M 3.75 1.85, 7.59 <0.001 6M 4.36 1.44, 13.15 0.009 1M 5.65 2.40, 13.30 <0.001 6M 2.84 1.16, 6.91 0.022 financial problem 1M 2.69 1.37, 5.28 0.004 6M 0.91 0.32, 2.60 0.867 bodily pain and discomforts 1M 2.72 1.39, 5.32 0.003 6M 7.28 2.94, 17.96 <0.001 poor family relationship 1M 1.7 0.68, 4.21 0.253 6M 7.04 2.14, 23.13 losing job/loss of job 1M 0.56 6M 1.88 other things 1M 2.19 Disturbance due to anxiety Disturbance due to worry over stroke rehabilitation progress 0.001 0.377 0.3 0.75, 6.36 0.151 6M 3.57 1.35, 9.37 0.01 1M 5.76 2.87, 11.56 <0.001 1M 1.53 1.24, 1.90 <0.001 6M 2 1.45, 2.75 <0.001 depression (0-1) 1M 9.07 4.42, 18.58 <0.001 worry (0-1) 1M 3.37 1.74, 6.53 <0.001 anxiety (0-1) 1M 1.96 0.81, 4.72 0.134 panic (0-1) 1M 1.88 0.90, 3.92 0.095 agitation (0-1) 1M 3.27 1.12, 9.54 0.03 disease deterioration a Sum of life stressors Reported emotions during hospitalization a a This item was not included at 6M questionnaire; NA- Not applicable and OR can’t be calculated due to empty cell (E) Social support domain Time OR 95%CI p Finding someone to chat 1M 1.56 0.53, 4.51 0.413 Going for a walk 1M 1.69 0.71, 4.07 0.238 Exercising 1M 2.14 0.86, 5.31 0.100 Usefulness of means to relieve unhappiness before stroke 1M Sum score of Lubben Social Network Scale 6M 6M 0.9 0.84, 0.95 0.001 Subtotal score of LSNS on family 6M 0.87 0.77, 0.98 0.033 Subtotal score of LSNS on Relatives 6M 0.9 0.80, 0.99 0.043 Subtotal score of LSNS on Confidant 6M 0.88 0.79, 0.97 0.017 104 Emotional domain. ‘Worries over stroke rehabilitation’ and ‘level of disturbance related to body pains and discomfort’ had a persistent impact on DAS, as assessed by the three tools at one and six months (see Tables 3.20A, 3.22D, 3.23D). Not found in DSM, the ‘level of disturbance related to financial problems’ was only identified by GDS (see Table 3.22D) and CESD (see Table 3.23D). But this financial burden did not have a lasting effect on depression at six months. In addition, the ‘level of disturbance related to poor family relationships’ was identified by both GDS and CESD at six months but not by DSM (see Tables 3.22D and 3.23D). The aggregate number of life stressors also had a significant role in depression disregard the tool used and time of assessment (see Table 3.22D, and Table 3.23D). Besides worries, DAS was found to be related to the participants’ perceived current health status, ‘level of disturbance due to anxiety’ and frequency of displaying different facial expressions (happy/flat/upset or tearing face) over the past week were assessed by all three assessment tools; in particular, the inability to present a happy face and the occurrence of an upset/tearing face were highly significant risk factors (p<0.001 see Table 3.22D and Table 3.23D). This significant relationship was sustained at six months. The effect of anxiety on DAS was different with the three tools. GDS and CESD were able to show a significant relationship between disturbance due to anxiety and depression at one month (see Tables 3.20B, 3.22D, 3.23D), but the result could not be duplicated at six months or by all three tools. In a direct assessment of types of emotions displayed during acute hospital admission for first stroke, only a minority of the participants mentioned depression, worry, panic, anxiety or agitation (in descending order; see Tables 3.20C, 3.22D, 3.23D). Social support domain. The available strategies used by subjects to cope with unhappiness before stroke had no effect on DAS at one month, whatever the assessment tools used (see Tables 3.22E, 3.23E). On the other hand, scores on Lubben Social Network Scale (LSNS) at six months were identified as having a significant protective effect on depressed subjects (p=0.001, OR=0.90, 95%CI=0.84, 0.95, see Tables 3.22E, 3.23E). Unlike GDS and CESD, DSM was able to find a weak association between DAS and LSNS only (p=0.045, OR=0.94, 95%CI=0.88, 0.99, see 105 Table 3.21). 3.2.4 Predictors of DAS 3.2.4.1 Using DSM IV as the assessment tool The identification of determinants for depression measured by DSM at one month and six months is presented in this section. The determinants for depression identified by GDS and CESD will be dealt with subsequently. One-month factors selected in the regression analysis included (1) bio-anatomical domain: laterality of lesion, (2) physical domain: Barthel Activity Daily Living, Modified Rankin Scale for Quality of Life, Norton Scale of Pressure Sore, the number of pains, reported symptoms and the aggregate number of somatic complaints, (3) cognitive and communicative domain: Abbreviated Mental Test score, level of disturbance in visual acuity and memory, (4) emotional domain: level of disturbance due to anxiety, poor perceived current health status, various worries (about health status, stroke rehabilitation), displaying a happy/upset or tearing facial expression over the past week, and the level of disturbance due to body pains and discomfort. Three mildly significant variables in the bio-anatomical domain were excluded because there was too much data missing (more than half of the subjects): stroke types, use of anticoagulants, serum level of high density lipoprotein. The significant single-item factors in the emotional domain, ‘reported depression/anxiety/worry during hospitalisation’ were omitted because of their inclusion in GDS and CESD assessment and the likelihood of skewing the final regression model. At one month, the determinants for DAS were: ‘displayed an upset/tearing facial expression over the past week’ (OR=3.11, 95% CI=1.89, 5.09, p<0.001) and ‘level of worry over current health status’ (OR=2.48, 95% CI=1.52, 4.01; p<0.001) and age (OR=1.06, 95% CI=1.01, 1.11, p=0.038) as assessed by DSM (see Table 3.25). At the six-month analysis, two other factors were identified by the model: ‘perceived current health as bad’, ‘sum score of Abbreviated Mental Test’ on top of ‘displayed an upset/tearing facial expression over the past week’. In the six-month analysis, two factors were not 106 used as they were not measured at that time: the Norton Scale of Pressure Sore and ‘worry about current health status’. Table 3.24 Selected variables from DSM assessment for regression analysis (from Tables 3.15-3.19) Factors associated with depression by DSM IV p (at 1M) p (at 6M) <0.001 0.001 <0.001 <0.001 <0.001 -- Joint pain 0.020 0.006 Dizziness 0.018 0.028 Total no. of reported pain 0.002 NS Total no. of reported symptoms excluding pains 0.013 0.007 Total no. of body symptoms 0.001 0.008 Abbreviated Mental Test <0.001 0.001 Problems in visual acuity 0.002 NA Memory problems 0.043 NA Physical domain (physiological, bio-anatomical, biochemical) Barthel Activity Daily Living Modified Rankin Scale for Quality of Life Norton Scale of Pressure Sore b Pains and somatic complaints Cognitive and communicative domain Emotional domain Disturbance due to anxiety 0.013 NS Perceived health status - Poor <0.001 <0.001 <0.001 -- <0.001 <0.001 NS NS <0.001 <0.001 Worry about health status b Displaying of various facial expression over past week a happy facial expression (0-3) a flat facial expression (0-3) an upset/tearing facial expression (0-3) Worries over stroke rehabilitation <0.001 0.011 body pains and discomfort <0.001 0.001 NS 0.003 0.001 0.001 -- 0.045 poor family relationship Total number of life stressors Sum score of Lubben Social Network Scale 6M (0-50) a PACI= Partial anterior cerebral infarction; b The item was not included at 6M; c The item was not included at 1M; c TACI= Total anterior cerebral infarction; NS= Not significant; NA= Not applicable if cell count was </=10 107 3.2.4.2 Using GDS/CESD as the assessment tool At one month, the common determinants of DAS assessed by GDS/CESD (compared with DSM) were: ‘displayed an upset/tearing facial expression over the past week’ (OR=2.50, 95% CI=1.54, 4.03, p<0.001, see Table 3.26), and ‘level of worry over current health status’ (OR=3.51, 95% CI=2.03, 6.04, p<0.001, see Table 3.27). Other determinants identified by GDS alone at one month included: z ‘Sum score of Norton Scale for Pressure Sore’ (OR=0.54, 95% CI=0.38, 0.74, p<0.001) z ‘Modified Rankin scale for Quality of Life’ (OR=0.44, 95% CI=0.23, 0.81, p=0.009) z ‘Length of hospital stay’ (OR=1.03, 95% CI=1.01, 1.06, p=0.034) z ‘Total number of life stressors’ (OR=1.66, 95% CI=1.22, 2.25, p=0.001, see Table 3.26) With CESD at one month, three more independent factors for DAS were identified on top of the one mentioned above: z ‘Sum score of Norton Scale for Pressure Sore’ (OR=0.65, 95% CI=0.50, 0.83, p=0.001) z ‘Level of disturbance over financial problems’ (OR=1.93, 95% CI=1.24, 2.98, p=0.003) z ‘Level of disturbance due to visual problems’ (OR=2.63, 95% CI=1.37, 5.02, p=0.003, see Table 3.27) 108 Table 3.25 Determinants of DAS assessed by DSM IV 1M 6M OR 95%CI p OR 95%CI p Displayed an upset/tearing face over the past week 3.11 1.89, 5.09 <0.001 13.74 2.55, 73.93 0.002 Level of worry over current health status 2.48 1.52, 4.01 <0.001 Age 1.06 1.01, 1.11 0.038 Perceived current health status as bad 11.34 2.85, 45.01 0.001 Sum score of Abbreviated Mental Test 0.45 0.26, 0.74 0.002 Logistic regression was used. The model has been adjusted for gender, age, length of hospital stay, marital status and living arrangement Table 3.26 Determinants of DAS assessed by GDS 1M 6M OR 95%CI p OR 95%CI p Displayed an upset/tearing face over the past week 2.50 1.54, 4.03 <0.001 3.55 1.51, 8.32 0.004 Sum score in Norton Scale for Pressure Sore 0.54 0.38, 0.74 <0.001 Total number of life stressors 1.66 1.22, 2.25 0.001 Modified Rankin Scale for Quality of Life 0.44 0.23, 0.81 0.009 Length of hospital stay 1.03 1.01, 1.06 0.034 Sum score of Abbreviated Mental Test 0.55 0.36, 0.81 0.003 Perceived current health status as bad 2.47 1.05, 5.79 0.037 Level of disturbance due to losing job 2.44 1.07, 5.53 0.033 Displayed a happy face over the past week (reversely coded) 2.96 1.04, 8.35 0.041 Logistic regression was used. The model has been adjusted for gender, age, length of hospital stay, marital status and living arrangement 109 Table 3.27 Determinants of DAS assessed by CESD 1M 6M OR 95%CI p OR 95%CI p Level of worry over current health status 3.51 2.03, 6.04 <0.001 Sum score in Norton Scale for Pressure Sore 0.65 0.50, 0.83 0.001 Level of disturbance due to financial problems 1.93 1.24, 2.98 0.003 Level of disturbance due to visual problems 2.63 1.37, 5.02 0.003 Perceived current health status as bad 5.72 2.18, 14.97 <0.001 Gender – Female 0.25 0.06, 0.96 0.045 Total number of life stressors 1.66 1.08, 2.54 0.020 Sum score of Lubben Social Network Scale 0.89 0.81, 0.97 0.016 Displayed an upset/tearing face over the past week 2.65 1.20, 5.81 0.015 Logistic regression was used. The model has been adjusted for gender, age, length of hospital stay, marital status and living arrangement 110 At six months, the determinants identified by GDS were all identified by DSM in the regression analysis: ‘displayed an upset/tearing face over the past week’, ‘perceived current health status as bad’ and ‘sum score on Abbreviated Mental Test’. CESD also captured the first two but not the third (see Tables 3.25-3.27). Besides the common ones, GDS/CESD also identified the following factors in explaining DAS: GDS z ‘Level of disturbance due to losing job’ (OR=2.44, 95% CI=1.07, 5.53, p=0.033) z ‘Displayed a happy face over the past week’ in reversed coding (OR=2.96, 95% CI=1.04, 8.35, p=0.041, see Table 3.26) CESD z ‘Perceived current health status as bad’ (OR=5.72, CI=2.18, 14.97, p<0.001) z ‘Total number of life stressors’ (OR=1.66, 95% CI=1.08, 2.54, p=0.020) z ‘Sum score on Lubben Social Network Scale’ (OR=0.89, CI=0.81, 0.97, p=0.016) z ‘Displayed an upset/tearing face over the past week ‘ (OR=2.65, 95% CI=1.20, 5.81, p=0.015) z Gender - female (OR=0.25, CI=0.06, 0.96, p=0.045, Table 3.27) 111 Predictors for depression scores. This section explores factors that helped to predict depression at six months. The predictors for the depression scores at six months and those that can explain the change in depression score are shown in Tables 3.28 and 3.29 respectively. The predictors from three domains - emotional, cognitive and dependency and somatic symptom domains at one month - jointly explained 44% variance in depression scores measured by GDS at six months (see Table 3.28). Factors in the emotional domain were: ‘days in the last week with an upset/tearing facial expression’, ‘level of disturbance due to worry about disease deterioration’, and ‘level of worry about current health status’. ‘Level of disturbance due to memory’ and AMT scores were factors in the cognitive domain. In the dependency and somatic symptoms domain, three factors were identified: ‘level of disturbance due to other problems’, ‘length of hospital stay’, and ‘level of disturbance due to constipation’ (see Table 3.28). The predictors accounting for the change in depression score assessed by GDS closely resembled those in the previous paragraph. The factors from the same three domains were able to explain 60% of the variance in the change of depression score from the acute to chronic phase. Additional predictors included the Barthel Activity of Daily Living score, and the ‘level of disturbance due to financial problems’ in the dependency and somatic symptoms domain; and ‘perceived current health status’ instead of ‘level of worry about current health status’ in the cognitive domain. Age instead of ‘length of hospital stay’ was also found (see Tables 3.28, 3.29). 112 Table 3.28 Predictors of depression scores (by GDS) at six months Estimated effect 95%CI p Cognitive domain Level of disturbance due to memory problems at 1M 0.76 0.04, 1.48 0.039 AMT score at 1M -0.61 -0.98, -0.25 0.001 Dependency and somatic symptoms domain Length of hospital stay 0.05 0.02, 0.07 0.001 Level of disturbance due to other problems at 1M -1.12 -1.80, -0.43 0.002 Level of disturbance due to constipation at 1M 1.38 0.66, 2.10 <0.001 Emotional domain Days in the last week with an upset/tearing facial expression at 1M 0.65 0.11, 1.19 0.018 Level of disturbance due to worry about disease deterioration at 1M 0.52 0.15, 0.89 0.006 Level of worry about current health status at 1M 0.56 0.08, 1.05 0.023 2 R = 0.44; Model was adjusted for age, gender, length of hospital stay Table 3.29 Predictors accounting for the change in depression scores (by GDS) from one to six months Estimated effect 95%CI p 0.02, 0.17 0.008 Demographics Age 0.10 Cognitive domain Level of disturbance due to memory problems at 1M 1.15 0.56, 1.72 <0.001 AMT score at 1M -2.07 -3.18, -0.95 <0.001 Dependency and somatic symptoms domain BADL score at 1M 0.23 0.08, 0.37 0.002 Level of disturbance due to other problems at 1M 1.45 0.36, 2.53 0.009 Level of disturbance due to constipation at 1M -2.30 -3.43, -1.16 <0.001 Level of disturbance due to financial problem at 1M -0.86 -1.5, -0.2 0.010 Days in the last week with an upset/tearing facial expression at 1M -1.54 -2.39, -0.67 0.001 Level of disturbance due to worry about disease deterioration at 1M -0.89 -1.49, -0.29 0.004 Perceived current health status at 1M -1.26 -2.11, -0.41 0.004 Emotional domain 2 R = 0.60; Model was adjusted for age, gender, length of hospital stay 3.2.5 Health literacy of depression Of a total of 214 patients participating in the study, 86 (40.2 %) described depression in their own words. This group was hereafter referred as the ‘depression literate’ group. The remainder of the patients, referred to as the ‘depression illiterate’ group, explicitly remarked their lack of knowledge or understanding of the term ‘depression’ in Cantonese, which is the prevailing Chinese language. For both literate and illiterate groups, about 30% were identified as clinically depressed using DSM IV criteria (see Table 3.30). There was no significant difference in the age and length of hospital stay between the two groups. Only about one third of the respondents in either group expressed an interest in knowing more about depression. But participants in the depression literate group had significantly more formal education (mean=6.1 years) 113 than their counterparts (mean=4.4 years, t=-2.449, p=0.015, see Table 3.30). Core emerging themes of depression interpretation fell into affective, behavioural and cognitive domains. Sixty participants in the depression literate group (69.8%) described depression using terms in the affective domain, 25 (29.1%) in the behavioural and 39 (45.3%) in the cognitive domains. Forty participants used descriptors in dual domains: affective and behavioural (20.9%), affective and cognitive (19.8%), behavioural and cognitive (5.8%, see Table 3.31). Table 3.30 Comparing demographic and depression between of depression literate and illiterate groups Depression illiterate Depression literate (n=128) (n=86) Mean SD Mean SD t df p Age 72.4 9.7 72.2 9.0 0.158 212 0.874 Days of hospital stay 17.7 15.4 16.2 15.3 0.702 212 0.483 Years of formal education 4.4 4.8 6.1 5.2 -2.449 211 0.015 Gender – Male, n (%) 80 (62.5) 55 (64.0) Had depression – by DSMIV, n (%) 36 (28.1) 26 (30.2) Paired sample t-test was done for age, days of hospital stay and years of formal education Table 3.31 Domains of emerging themes on depression interpretation by 86 participants Domains of descriptors for depression Affective n % 60 69.8 Behavioral 25 29.1 Cognitive 39 45.3 Affective and behavioral 18 20.9 Affective and cognitive 17 19.8 Behavioral and cognitive 5 5.8 3.2.5.1 Descriptors in affective domain ‘Unhappy’. There were 60 illustrations depicting the affective perspective on ‘depression’, ‘unhappy’, ‘worries’, ‘boredom’, ‘keeping things to oneself’, and these were core mood-related descriptors. The most frequent word used by participants was ‘unhappy’, which was quoted 20 times, among which six also included an intensifier, such as: ‘very unhappy’ [sc142 F/66-0] [sc184 F/56-0] [sc238 F/71-0] [sc302 M/66-6] or ‘always unhappy or sad’ [sc81 F/69-6] [sc189 M/79-0] [sc295 M/51-15] [sc293 114 M/71-1].* Some participants suggested that the unhappiness was generated by the sufferers themselves: ‘Unhappy things locked in one’s heart cause illness’ [sc164 M/78-5]; ‘feeling unhappy by oneself; one confines oneself but one doesn't feel comfortable’ [sc141 F/72-2]. Five added ‘sulkiness/upset’ alongside an unhappy mood [sc170 M/67-1] [sc193 F/79-12] [sc219 M/76-15] [sc276 M/78-6] [sc293 M/71-1]. *[scXXX=subject code no; M=male; F=female, followed by age; the last figure following a hyphen=years of formal education] ‘Burying things in one’s heart’. Altogether 21 scripts mentioned a portrait of the depressed subjects as ‘burying things within oneself’. What were they burying? Five suggested ‘unhappiness’, and four problems they wanted to conceal; three mentioned ‘worries’. Quite a few respondents (n=9) did not specify what exactly the issue/problem was that the depressed people had concealed. This was particularly the case in women with a low level of formal education (0-4 years) - 4 out of 5 female respondents (see Table 3.32). ‘Worry/anxiety’ and ‘bored/gloomy’. ‘Worry/anxiety’ and ‘boredom’ were another two common descriptions of depression. Six had used worries alone to interpret ‘depression’: [sc101 M/83-4] [sc102 M/72-5] [sc132 M/75-6] [sc145 M/70-16] [sc226 M/84-6] [sc240 M/65-12]. Another six added the intensity and frequency of worries: ‘worry too much’ [sc185 M/84-9] [sc289 M/69-2] [sc302 M/66-5], ‘always worry’ [sc132 M/75-6] [sc306 M/63-6] or ‘worry about everything’ [sc263 F/70-10]. Eight scripts mentioned boredom, three separately with others occurring in combination and/or specifying the intensity of the mood [sc88 M/62-15] [sc114 M/64-10] [sc140 F/87-2] [sc251 F/68-12] [sc263 F/70-10]. ‘Fidgeting/irritated’. This was mentioned six times to interpret depression. Such emotion, however, was seen to follow other descriptors rather than being posed at the beginning of the illustration. Examples were as follows: z ‘Got to take medicine; always in a fidget, always feel sad’ [sc81 F/69-6] z ‘Unhappy; in a fidget’ [sc105 M/64-15] z ‘Patient very irritated; feeling sick in different parts of the body’ [sc124 115 M/75-1] z ‘Confining one’s problems to oneself; not speaking to others; irritated’ [sc144 F/87-0] z ‘Don't feel at ease all day; always in a fidget and always blaming oneself for one’s bad temper’ [sc231 M/69-12] z ‘Feeling bored and throwing oneself into a fidget’ [sc278 M/81-20] Non-specific descriptors. Some subjects were unable to describe depression specifically, as shown by the use of vague terms such as ‘in a bad mood’ [sc89 F/68-0] [sc269 F/72-12], ‘a heavy heart’ [sc166 M/54-6] [sc220 M/83-10] [sc267 M/83-6], ‘feeling uncomfortable’ [sc118 M/73-4] [sc141 F/72-2] [sc219 M/76-15] [sc227 F/81-4], ‘don't feel at ease all day’ [sc231 M/69-12], ‘want to die’ [sc238 F/71-0] [sc282 F/80-15], ‘feeling lonely’ [sc284 F/81-0], ‘desire for something’ [sc296 F/71-2], ‘neurosis’ [sc300 F/71-5], ‘it's something to do with one's personality’ [sc88 M/62-15] [sc251 F/68-12], ‘always fail to get what one wants’ [sc84 M/88-4], ‘feeling useless’ [sc112 M/78-14]. This might also reflect the limited literacy regarding depression even in the ‘depression literate’ group. 116 Table 3.32 Analysis of ‘burying things in oneself and concealing from others’ under affective domain Unhappiness (5) feeling unhappy by self; one confines oneself but one doesn't feel comfortable [sc141 F/72-2]* the unhappy things that locked in one’s heart cause illness [sc164 M/78-5] keep silent; upset; one is not happy and won't tell anyone; wear a sad face [sc193 F/79-12] unhappy; don't know to whom one can talk about things that buried in one's heart; don't even want to talk [sc228 F/64-9] in a bad mood; bury the unhappiness in one’s heart [sc269 F/72-12] Problems (4) it's one's own problem; one just confines oneself indoors; the problem could have been solved, but one retreats to one's own pyramid and get oneself into a dead end; so nothing is solved [sc87 M/59-12] there are entangled knots in one’s heart; there are personal problems which one doesn't want to spread out, so garner them up; autism; self-torture [sc88 M/62-15] wont' tell anybody else even when one has a problem [sc142 F/69-0] for problems that one can't solve oneself, one would bury them in one’s heart; won't tell anybody else [sc156 M/64-7] Worries (3) always worry and bury them in one's heart without speaking them out [sc132 M/75-6] worry and take things too hard, just like suffering from autism [sc240 M/65-12] worry too much and conceal them [sc289 M/69-2] Non-specific (9) wont' tell anything to others; bury things in one’s heart; keep silent [sc143 F/76-2] confine things to myself; won't speak to others [sc144 F/87-0] won't tell anybody about the things concealed in one’s heart [sc166 M/54-6] bury in one’s heart and won't speak a word [sc218 F/72-0] sulky; the pains can only be tasted by oneself; feeling uncomfortable and would commit suicide [sc219 M/76-15] bury something in one's heart and feel uncomfortable. [sc227 F/81-4] bury things in one's heart and feel unhappy [sc231 M/69-12] always weep and bury things in one's heart [sc246 M/74-1] feel melancholy to the extreme; confine oneself; want to die [sc282 F/80-15] *[scXXX=subject code no; M=male; F=female, followed by age; the last figure following a hyphen=years of formal education] 117 3.2.5.2 Descriptors in behavioural domain Among the three domains, the behavioural was the least elaborated. Some showed that depressed people would display obvious avoidance behaviour such as ‘confining oneself’ (4); decreased or no verbalization, avoiding people - family members, other people or a medical doctor (13). Other behavioural cues, as used in DSM IV indicating depression, were only mentioned once or twice (8), for example, ‘cry’ (2) [sc246 M/74-1] [sc283 M/64-12], ‘wear a sad face’ (2) [sc193 F/79-12] [sc283 M/64-12], ‘can't do lots of things’ [sc90 M/89-6], ‘very lazy in taking care of myself’ [sc231 M/69-12], ‘displaying bad temper’ [sc276 M/78-6], ‘can't sleep’ [sc306 M/63-6]. ‘Keeping to oneself’ z problems not resolvable, kept to self [sc156 M/64-7] z hide oneself away [sc172 M/64-4] z keep to one's own heart [sc246 M/74-1] z keeping to oneself [sc250 M/52-6] ‘Don't/can't let go’ z [sc172 M/64-4], [sc175 M/67-12], [sc186 M/57-3], [sc189 M/79-0], [sc276 M/78-6], [sc297 M/78-6], [sc303 M/90-2] z [sc153 F/74-0], [sc285 F/91-4] ‘Unwilling to talk to people (Dr/family/others)’ z don’t share with family [sc213 M/62-10] or others [sc142 F/69-0], z [sc193 F/79-12], [sc250 M/52-6] z don't let people know [sc156 M/64-7] z don’t meet people [sc186 M/57-3] 118 z don't see doctor about diseases [sc213 M/61-10] ‘Other behavioural descriptors’ Six other behavioural descriptors identified were: ‘cry’ (2) [sc246 M/74-1]; [sc283 M/64-12], ‘with a sad mouth and face’ (2) [sc283 M/64-12]; [sc193 F/79-12], ‘being uncomfortable’ (1) [sc118 M/73-4], ‘neurosis’ (1) [sc300 F/71-5], ‘display temper’ (1) [sc276 M/78-6], ‘can't perform what one wishes’ (1) [sc90 M/89-6]. 3.2.5.3 Descriptors in cognitive domain Descriptors in the cognitive domain were the second most commonly cited by the interviewees. To delineate the nature and content of their thoughts, specific and non-specific descriptors could be identified, with some elaborated according to the intensity of these thoughts (see Table 3.33). It was the altered thinking pattern of ‘taking things too hard’ that was quoted most frequently (8). Respondents also cited ‘can’t take things in a relaxed manner’ (4) or ‘can’t understand how things go’ (4). Four subjects noted that such an emotional state could be a disease (see Table 3.33). Other specific descriptors included the following (6): ‘to split hairs, think about things that are hard or bad’ [sc139 M/62-15], ‘the world is grey and there is no future’ [sc134 M/60-12], ‘always deep in thought, brooding over something bad’ [sc138 F/79-0], ‘negative things’ [sc301 M/71-0], ‘thinking from one single perspective’ (2) [sc118 M/73-4] [sc146 F/67-0]. Three people related their cognition to self-worth, and ten emphasised the intense frequency of such patterns of thought (see Table 3.33). 119 Table 3.33 Analysis of ‘nature and content of thoughts’ under cognitive domain Specific descriptors (6) always think in one single perspective [sc118 M/73-4] [sc146 F/67-0] my world is grey and there is no future [sc134 M/60-12] always in thought, brood over something bad [sc138 F/79-0] to split hairs, think about things that are hard or bad [sc139 M/62-15] think of negative things [sc301 M/71-0] Related to disease (4) this is a kind of morbidity; a kind of psychological problem [sc87 M/59-12] when one is introverted; one will be prone to this illness [sc251 F/68-12] mental disorder; but don't know what it is [sc272 F/57-5] the unhappy things locked in my heart bring me this illness [sc164 M/78-5] Related to self capacity/worth (3) always assume that neither this nor that can be done [sc106 M/78-0] thinking that one is useless [sc112 M/78-14] [sc235 F/76-0] Frequency and intensity of thinking (10) Always (5) [sc106 M/78-0], [sc138 F/79-0], [sc179 M/64-3], [sc233 M/66-1], [sc301 M/71-0] Frequently (5) think too much [sc146 F/67-0], [sc163 M/85-4], [sc248 F/72-0], [sc285 F/91-4] lots to think [sc303 M90-2] Non-specific (4) think about things that are not relevant, and find that everything is not to one’s liking [sc165 M/77-7] can't understand how things go and can't be optimistic [sc220 M/83-10] think things round and round [sc248 F/72-0] think a lot [sc250 M/52-6] 120 3.3 Clinical outcomes 3.3.1 Post-stroke quality of life The mean score in quality of life significantly improved, from 2.36 (SD=1.30) to 2.14 (SD=1.16, 95%CI=0.08, 0.36, p=0.002, see Table 3.8A), at six months. About two-thirds of the subjects reported same or lowered quality of life when comparing the six-month and one-month scores (see Figure 3.2). To identify the predictors of post-stroke quality of life (PSQoL) at six months, five respective domain factors at one month were included in the regression model. Quality of life at six months can be predicted by three factors at one month: the Barthel Index of Activities of Daily Living, the score on the Abbreviated Mental Test and level of worry about current health, together with the length of hospital stay (see Table 3.34). A model with four factors falling into three domains was able to explain 55% of the variance in the PSQoL score at six months. 121 Table 3.34 Predictors of quality of life at six months Predictors (n=178) Estimated effects 95% CI p Length of hospital stay (days) 0.011 0.001, 0.022 0.034 BADL scores at 1M -0.121 -0.152, -0.089 <0.001 AMT scores at 1M -0.114 -0.213, -0.016 0.023 Level of worry about current health at 1M 0.126 0.002, 0.25 0.046 2 R =0.553; Stepwise regression analysis undertaken; Model was adjusted for age, gender and length of hospital stay; Factors entered into the regression model: Number of pains; Number of body symptoms; Barthel Index of Activities of Daily Living (BADL) Level of disturbance due to expressive aphasia; Level of disturbance due to dysarthria; Level of disturbance due to swallowing; Level of disturbance due to visual acuity Level of disturbance due to hearing; Level of disturbance due to memory; Level of worry about current health; Level of disturbance due to worry about stroke rehabilitation progress Level of disturbance due to anxiety; Level of disturbance due to financial problem Score of Abbreviated Mental Test (AMT); Score of Geriatric Depression Scale (GDS) Figure 3.2 Changes in Quality of life score from one month to six months 50.0% N=82 43.3% N=69 36.7% Percent 40.0% 30.0% N=30 20.0% 20.0% 10.0% 0.0% Deteriorated No change Improved Change in QoL scores 122 3.3.2 Institutionalisation and mortality Institutionalisation referred to admissions to any healthcare settings away from home. Thus admissions to hospital or old-age home for more nursing care resulting from stroke were taken into account. In this study sample, five participants had been living at old-age home before stroke. At six months, four non-depressed participants (2.4%, 4 out of 152) had recurrent stroke as recorded in their medical notes (see Table 3.35B). 30 participants were readmitted to hospital with other medical conditions. Depressed subjects had significantly more repeated hospitalisation (45% vs. 12.5% among the non-depressed, p<0.001, see Table 3.35B). More depressed participants were admitted to nursing home or care and attention home on discharge from hospital after first stroke onset (22.6%), compared with only 6.6% of the non-depressed (p=0.001). This pattern disappeared at six months. The total number of institutionalisations was reduced from 24 at one month to 20 at six months (see Table 3.35B). Regarding mortality at six months, altogether, 11 and 2 participants had passed away after the one-month and six-month interviews. A brief comparison of clinical status and outcome between dropouts (n=26) and participants (n=188) who continued to take part in this study after one-month interview was made (see Table 3.36). There was no significant difference between the dropouts and participants remaining in the study after the one-month interview in terms of gender, depression, psychiatric consultation, use of anti-depressant, hospitalisation and admission rates to old-age home, except in the case of mortality. 35% (9 out of 26) among the dropouts passed away after one month while only 2.1% (4 out of 192) among the remainder. There was no association between mortality and depression identified at two time points but the mortality among the depressed subjects was higher (8.1%, 5 out of 62; vs. 3.9%, 6 out of 152 among the non-depressed, not shown in Table). 123 3.3.3 DAS interventions in formal healthcare 3.3.3.1 Use of antidepressants Retrieving the medical records and discharge summaries of all the participants at one month, it was found that only 11.3% among the depressed had started to use antidepressants (7 out of 62, see Table 3.35A). As there was a time lapse between record review and one-month follow-up, the prescription data was only available by retrospective checking. In fact most of the prescription did not occur at one-month but three months later. The number of patients taking antidepressants was found to increase to 11 after six months (see Table 3.35B). But 10 of these were in the non-depressed group, leaving only one identified as depressed and still were being put on antidepressants. Very few patients were given hypnotics and anxiolytic at both time points (see Tables 3.35A, B). All the prescriptions were documented in the medical records except one patient. This patient obtained antidepressants from a general practitioner and was noted by the interviewer during the follow-up home visit. 3.3.3.2 Use of mental healthcare resources As identified by the record review after the one-month interview, 11 out of 62 depressed participants (17.7%) had their emotional status (with terms like ‘upset/tearing’, ‘cry’…) documented. Only three depressed subjects were referred to medical social workers (4.8%, 3 out of 62). Disregard depressive status, only a total of ten consulted the psychiatrist (4.7%, 10 out of 214). Seven were identified as depressed while three were not (see Table 3.35A). At six months, formal consultations with a psychiatrist increased to 16 (8.5%, 16 out of 188). They all belonged to the non-depressed group, as identified by the DSM IV criteria. 44 patients were invited to meet a psychogeriatrician after the six-month follow-up as set in the study protocol. 13 came from the depressed group (65.0%) and 31 from the non-depressed (18.5%, see Table 3.35B). Seven depressed subjects refused the invitation to consultation because of immobility or resistance from relatives. All these 20 depressed subjects were not under formal mental healthcare. 124 Table 3.35 Treatment and clinical outcomes of the participants (A) At one-month follow-up Total Nondepressed Depressed n % n % n % χ No 204 95.3 149 98 55 88.7 Yes 10 4.7 3 2 7 11.3 No psychoactive drug 199 93.0 147 96.7 52 83.9 Used anti-depressant 9 4.2 2 1.3 7 11.3 2 df p 8.581 1 0.003 13.298 3 0.004 7.459 1 0.006 2.558 1 0.110 11.324 1 0.001 At one month Consulted psychogeriatrian or psychiatrist Used of medication Has used anxiolytic 3 1.4 1 0.7 2 3.2 Has used hypnotics 3 1.4 2 1.3 1 1.6 No 211 98.6 152 100 59 95.2 Yes 3 1.4 0 0 3 4.8 Met MSW Cried during interview No 188 87.9 137 90.1 51 82.3 Yes 26 12.1 15 9.9 11 17.7 No 190 88.8 142 93.4 48 77.4 Yes 24 11.2 10 6.6 14 22.6 Lived at old age home 125 (B) At six-month follow-up Total n Nondepressed % n % Depressed n % χ 2 df p 22.049 2 <0.001 3.310 2 0.191 20.169 1 <0.001 3.295 1 0.070 0.487 1 0.485 14.076 1 <0.001 2.063 1 0.151 At six months Consult psychogeriatrian or psychiatrist No 128 68.1 121 72 7 35.0 Yes by invitation 44 23.4 31 18.5 13 65.0 Yes by identified by Doctor/self referred 16 8.5 16 9.5 0 0.0 No 175 93.1 157 93.5 18 90.0 Yes 11 5.9 10 6.0 1 5.0 Only hypnotics 2 1.1 1 0.6 1 5.0 No 172 91.5 159 94.6 13 65.0 Yes 16 8.5 9 5.4 7 35.0 No 186 98.9 167 99.4 19 95.0 Yes 2 1.1 1 0.6 1 5.0 No 184 97.9 164 97.6 20 100.0 Yes 4 2.1 4 2.4 0 0.0 Used of anti-depressant Cried during interview at 6M Had passed away Hospitalized due to recurrent stroke Hospitalized due to other medical conditions No 158 84 147 87.5 11 55.0 Yes 30 16 21 12.5 9 45.0 Lived at old age home No 168 89.4 152 90.5 16 80.0 Yes 20 10.6 16 9.5 4 20.0 126 Table 3.36 Comparison of clinical status and outcome between dropouts and persistent participants Participants Total remained Dropouts N % n % n % χ Male 135 63.1 118 62.8 17 65.4 Female 79 36.9 70 37.2 9 34.6 2 df p 0.067 1 0.795 0.5 1 0.480 0.003 1 0.960 0.064 1 0.799 52.733 1 <0.001 2.595 1 0.107 0.342 1 0.559 0.517 1 0.472 Gender Identified depressed by DSM at one month No 152 71 132 70.2 20 76.9 Yes 62 29 56 29.8 6 23.1 No 197 92.1 173 92.0 24 92.3 Yes 17 7.9 15 8.0 2 7.7 No 200 93.5 176 93.6 24 92.3 Yes 14 6.5 12 6.4 2 7.7 No 203 94.9 186 98.9 17 65.4 Yes 11 5.1 2 1.1 9 34.6 No 208 97.2 184 97.9 24 92.3 Yes 6 2.8 4 2.1 2 7.7 Consulted psychiatrist (Dr/Self referral) Used anti-depressant Had passed away Hospitalized due to recurrent stroke Hospitalized due to other medical conditions No 181 84.6 158 84 23 88.5 Yes 33 15.4 30 16 3 11.5 No 190 88.8 168 89.4 22 84.6 Yes 24 11.2 20 10.6 4 15.4 Lived at Old Age Home after stroke episode Pearson chi-square test was used. 127 Chapter 4 Discussion 4.1 Incidence of DAS at one month and six months (130) 4.1.1 Comparing the incidence with published Chinese samples (131) 4.1.2 Comparing the incidence with published Caucasian samples (132) 4.1.3 The trend of DAS at six months and after (133) 4.2 Risk factors and predictors of DAS (135) 4.2.1 Bio-anatomical domain (136) 4.2.2 Cognitive and communicative domains (137) 4.2.3 Dependency and somatic symptoms domain (139) 4.2.4 Emotional domain (140) 4.2.5 Family and social support domain (143) 4.2.6 Demographic and other factors (144) 4.3 DAS interventions (146) 4.3.1 Consequence of inattention to DAS (146) 4.3.2 Primary preventive measures (148) 4.3.2.1 Recognition of DAS - depression literacy (149) 4.3.2.2 Early detection of DAS – use of smiley diagrams (151) 4.3.3 Treatment modalities of DAS (154) 4.3.3.1 Pharmacological treatment (154) 4.3.3.2 Non-pharmacological treatment (155) 4.4 Limitations of study (157) 4.4.1 Threats to internal validity (157) 4.4.1.1 Selection bias (157) 4.4.1.2 Study design (159) 4.4.1.3 History (160) 4.4.1.4 Maturation (161) 4.4.1.5 Mortality (162) 4.4.2 Threats to external validity (162) 4.4.2.1 Sample representativeness (162) 4.4.2.2 Reliability of reporting ‘depression’ in Chinese stroke patients in Hong Kong hospitals (163) 4.4.2.3 Measurement effects (164) 128 4.5 Recommendations for future research, practice and education (167) 4.5.1 Future research (167) 4.5.1.1 Incidence studies (167) 4.5.1.2 Bio-anatomical or biochemical research (169) 4.5.1.3 Depression literacy studies (169) 4.5.1.4 Detecting depression (170) 4.5.2 Future practice and education (171) 129 This chapter will discuss the major findings of the study in order to answer the research questions set out at the end of chapter one. The objectives of this section are: (1) to identify the incidence of DAS at one month and six months among older patients, (2) to analyse the risk factors and predictors of DAS, (3) to discuss the management of DAS according to this study result and those in the literature, (4) to evaluate the limitations of current study and (5) to recommend directions for future research, practice and education. 4.1 Incidence of DAS at one month and six months The incidence of DAS estimated by DSM IV at one month is only slightly higher (29%) than the figure in a recent publication (24%) (data published already, see Publications). But the incidence of DAS produced by GDS and CESD for the same sample is lower, with estimates of 27% and 22% respectively. If minor depression is included, the incidence rises to 46.3% (99 out of 214 using DSM), 52.3% (GDS) and 34.6% (CESD). The incidence at six months drops to 11%, 16% and 13% as identified by DSM IV, GDS and CESD respectively. In this study, we have classified those treated with antidepressant and/or having consultation with psychiatrists under non-depressed group according to the DSMIV assessment. If taking those diagnosed depressed (with or without oral antidepressant treatment at 6M) into consideration and categorized under depression group, the cumulative incidence at six months will be 16.0%. In any case, the data reflects the fact that DAS is a significant healthcare problem under-reported, under-recongized and therefore under-addressed and under-funded 130 Table 4.1 Comparing the incidence findings with published studies By DSM IV Caucasian Chinese At one month, Major Depression only (incidence=29%) Comparable incidence 32% - DeCoster 200 Our incidence is lower Our incidence is higher 31%- Liu et al. 2003 12-16% Eriksson 2004 21.6% - Aben 2003 16% - Tang et al. 2005 21%- Chiu 2005 14%- Morris et al. 1990 5.6% - Berg et al. 2001 Major Depression+ Minor Depression (incidence=46%) Comparable incidence 25-50% - NIMH 2002 Our incidence is lower Our incidence is higher 62% - Fuh et al. 1997 33% -Weimar et al. 2002 32% -Morris et al. 1990 At six months, Major Depression only (incidence=11%) Comparable incidence 28% -Beekman et al. 1998 Our incidence is lower 30% - Aben et al. 2003 16% - Kauhanen et al. 1999 15%- Burvill et al. 1995 4.1.1 Comparing the incidence with published Chinese samples As far as Chinese populations are concerned, several studies have been produced. Three are on Taiwanese subjects (Fuh et al. 1997, Kao 2000, Chiu et al. 2005), one was carried out in mainland China (Liu et al. 2003) and two are from Hong Kong (Tang et al. 2005). The incidence ranges from 13%, from rural samples (Chiu et al. 2005) to 31% (Liu et al. 2003). Three studies adopt the GDS Chinese version as the screening tool (Chiu et al. 2005; Tang et al. 2005). The brevity of this research history on DAS in local settings justifies more vigorous research to address inconclusive questions, controversy and identifiable gaps, which are elaborated in the different sections of this chapter. 131 4.1.2 Comparing the incidence with published Caucasian samples There are growing studies on DAS abroad but the comparison of these results with this study is pragmatically challenging as discussed. Alternatively, studies with similar study design and type of stroke patients, and which have been undertaken within six months after first-ever stroke, are selected for crude comparison and discussion. The findings of incidence/accumulative incidence in ascending order are summarised as follows (see also Table 4.1): <10%: 9% and 16% major depression at 3 and 12 months after the stroke based on DSM-III-R criteria (Kauhanen et al. 1999); 10-20%: by the use of CESD and DSM-IV, 20% identified as depressed on admission (Cassidy et al. 2004); 21-30%: 23% in the Perth Community Stroke Study four months after stroke using DSM III (Burvill et al. 1995); two studies reported 27%, one with CESD (Beekman et al. 1998; Berg et al. 2001) and the later one measuring depression at 2 weeks after first stroke using BDI among 100 patients aged 27-70 (Berg et al. 2001). 31-40%: 32% with minor depression inclusive at two months (Morris et al. 1990); an estimate of 33% at 100 days post-stroke using CESD (Weimar et al. 2002); 34% as assessed by DSM IV and the BDI at six months after stroke (Toso et al. 2004); 38% showing a one-year cumulative incidence including minor depression using DSM IV (Aben et al. 2003). The incidence at one month after stroke identified by the current study is comparable to some previous work (Beekman et al. 1998; Berg et al. 2001). However, the incidence can still be considered as lower than reports with incidence/cumulative incidence ranging between 32% and 40% (Aben et al. 2003; Liu et al. 2003; Morris et al. 1990; Toso et al. 2004; Weimar et al. 2002). The American Heart Association states that some 11-68% of stroke survivors suffer depression and about a third have major depression (Kelly-Hayes et al. 1998). There are different Caucasian national samples 132 with a population-based study design (Burvill et al. 1995, Beekman et al. 1998, Weimar et al. 2002, Eriksson et al. 2004, Aybek et al. 2005) with a sample ranging from 294 in Perth (Burvill et al. 1995) to 4264 stroke survivors in Germany (Weimar et al. 2002). If mild depressive cases are counted, the incidence is also comparable to a prevalence study reporting 62.2% on poststroke depression among the Chinese elderly in a rural community, using 15-item GDS with a cut-off point of 5 (Fuh et al. 1997). In contrast to previous comparisons, the incidence of DAS identified in this study may also be considered high with reference to a study on American patients. The estimate lies around 10-27% (NIMH 2002) or 16.4% among 189 first-ever ischemic stroke patients in Hong Kong using DSM III, GDS and HADS (Tang et al. 2005). Direct comparisons among the studies should be made judiciously because of the differences in study design, sample characteristics, methods of data collection (self-completed or by interview) or assessment tools/cut-off points used for depression identification. More importantly, cultural diversity may also show itself in the emotional responses to the sudden contraction of a highly debilitating disease like stroke. Chinese are known to be cautious in revealing their true emotions to outsiders or at least those other than family members (Bond 1991). 4.1.3 The trend of DAS at six months and after A big drop in the six-month incidence has also been observed in the current study, as shown previously. Another study has remarked that the recovery pattern is spontaneous within the first month for about half of initially depressed patients, and suggested that the remainder are likely to develop chronic depression (Andersen 1997). And a report that the prevalence in community samples is much lower than that in hospital settings (Aben et al. 2001) may also reflect the local situation, when nearly all the patients have been residing in a community at the time of the six-month interview, whether it be their home or some other long-term care facility. Our findings show a similarity with a follow-up study reporting a substantial decline, to 12 percent overall, in the prevalence of depressive disorder (Morris et al. 1990). But the data were collected fifteen months after the first stroke episode. The likely pattern beyond six 133 months is therefore less certain in this study since there is a study noting two peaks in identifying DAS (Aben et al. 2001). In contrast to the falling trend, a persistent pattern in DAS has also been reported. Depression among a sample of 321 stroke survivors did not decrease by the one-year follow-up (Kotila et al. 1998) or was maintained at 24% in a sample assessed by a standardised questionnaire at 15 months after stroke (Choi-Kwon et al. 2005). Some claim that the prevalence and severity of depression are highest between six months and two years post-stroke (Francisco 1993), or that the incidence of DAS three years after first stroke is as high as 34%, by using a score of 14 on the BDI as a cut-off (Angeleri et al. 1997). 134 4.2 Risk factors and predictors of DAS Current study results have partly supported Lyketsos’s criteria set for stroke-depression causality as shown below: 1. Under the appropriate circumstances, depression and stroke occur together the great majority of the time. 2. There is no other coherent explanation for the depression, such as another illness, medication, substance use, or a personal or family history of major depression. 3. No study has demonstrated that major depressions lead to stroke 4. The onset of depression is within one month of the stroke. 5. Resolution of the active phase of stroke is followed by resolution of depression in close temporal proximity (Lyketsos et al. 1998). Lyketsos’s criteria set for DAS have been supported in the literature except the third proposition. Among a population-based cohort of 6,095 stroke-free white and black men and women aged 25 to 74 years, depression is predictive of stroke across all strata (Jonas & Mussolino 2000). Depression also predicts the risk of stroke, specifically ischemic stroke among Japanese (Ohira et al. 2001). Another study was able to support such findings (Krishnan 2000, Krishnan et al. 2002). Besides stroke, men with depression within the preceding 10 years were three times more likely to develop ischemic heart disease than the controls (Hippisley-Cox et al. 1998), or established coronary artery disease (Krishnan et al. 2002). DAS causality prediction is the subject of an on-going debate when cross-sectional or case-control study design is adopted when the temporality cannot be affirmed. 135 4.2.1 Bio-anatomical domain The role of patho-physiological mechanisms in DAS remains controversial. We can find a weak association between the stroke types (those affecting the anterior cerebral circulation, partial or total) and DAS, indicating a possible link between severity of brain tissue damage and DAS, in line with local and overseas findings (Harrington & Salloway 1997, Tang et al. 2005). The finding is crucial as it will help assessment and treatment modalities (Hinkle 1998). Even though previous studies have hinted at the possible relationship with DAS of the lesions’ location, laterality, brain area involvement or the size of lesions (Robinson et al. 1990, MacHale et al. 1998, Berg et al. 2001, Rao 2001, Spalletta et al. 2003, Vataja et al. 2004), we are unable to establish adequate evidence to draw reliable conclusions. This is partly due to data missing from scan reports or to useless information in case notes about the stroke lesions. An attempt to prove the hypothesis of a laterality effect on DAS has been unsuccessful. Despite Robinson's influential neuro-anatomical model and other findings lending support to DAS being associated with left hemispheric lesion (Robinson & Starkstein 1990, Fuh et al. 1997, Vataja et al. 2004), there are inadequate data to confirm a laterality effect in DAS (Carson et al. 2000a, Gainotti & Marra 2002). Studies also suggest that subcortical stroke is significantly associated with DAS (Robinson 1990, Robinson et al. 1990, Provinciali & Coccia 2002), but that has not been established in our study. In fact, Aybek (2005) has refuted any association between acute emotional behaviour after stroke and neurological impairment or lesion localisation. To test the hypothesis proposed by Mast (2004), we have also examined whether there is any relationship between cerebrovascular risks factors (CVRF) and DAS. The effect of CVRF (hypertension/diabetes/cardiovascular diseases) on DAS is not established in this study. We may need further data over a longer period for follow-up (2+years) to see the effect of CVRF on DAS, as in previous studies (Everson et al. 1998), or a population-based study among Chinese people. Studies have also postulated that the reduced blood velocity in the carotid artery may impact on depression by examining Carotid Doppler findings (Tiemeier et al. 2002). However, Carotid Doppler assessment is not routine in our study. For more than 30% of 136 participants, a Carotid Doppler report is not available. To explain this, the under-utilisation of Carotid Doppler results in the UK has also been attributed to the possibility of ageism in stroke care (Fairhead & Rothwell 2006). Even if the results are available, the question of whether reduced cerebrovascular reactivity among depressed stroke patients is a cause or an effect remains largely unknown, as current results rely mainly on a one-off examination. Some researches have turned to the examination of any significant reduction in the cerebrovascular reactivity among depressed patients (Neu et al. 2004). The hypothesis of carbon dioxide-induced cerebral vasomotor reactivity is proposed as a causal factor for sub-threshold depressive disorder (Tiemeier et al. 2002). A more recent study of the effects of haemodynamic factors in depression in late life suggests that the observed reduction in cerebral blood flow velocity measured by Transcranial Doppler Ultrasound could be a result of reduced demand in more seriously depressed cases. A separate study is warranted to verify these hypotheses. 4.2.2 Cognitive and communicative domains Cognitive function, as reflected by scores on the Abbreviated Mental Test (AMT), is identified as a significant factor associated with depression, as demonstrated earlier (Kauhanen et al. 1999). However, in contrast to having a majority of stroke patients (61.7%) reporting a cognitive decline (Pohjasvaara et al. 1997), our participants have produced a slightly better cognitive assessment six months after first stroke. In this study cognitive impairment of the participants is relatively mild and infrequent, as shown by the high mean scores in the AMT at one month and six months. Despite the high entry level of the AMT score, its decline has played a persistent and important role in predicting depression. This is supported by the fact that the AMT score has been a highly significant determinant for DAS. As in previous findings, we have also found an association between DAS and cognitive impairment (Leonard & Myint 2006) especially in terms of memory defect (Kauhanen et al. 1999, Liu et al. 2003, Vinkers et al. 2004). In this study, the change in depression can be predicted by a change in memory function. Its role is more evident with a longer time frame post-stroke (six months in this study), as demonstrated by a previous study (Kauhanen et al. 1999). Comorbidity of dementia among the depressed group may be highly suspected, though the temporality and causality between stroke, dementia and depression in this sample 137 are difficult to prove. We produced an assessment of AMT at two interviews after stroke but not before stroke onset. Thus we may not have adequate evidence to rule out the pre-clinical development of any mild cognitive impairment. In fact, previous work examining cognitive function among a cohort of 74 stroke subjects in the Framingham Study suggested that the intellectual decline in post-stroke patients appeared to be independent of the presence of depression (Kase et al. 1998). Other research indicates that the presence of depression at baseline does not seem to accelerate cognitive decline that has been monitored over a longer time frame (Vinkers et al. 2004). This is contradictory to our study results. A deteriorating trend in the AMT score among the depressed group has been noted at six months. In addition, the baseline AMT score is one of the predictors accounting for the change in depression as assessed by GDS. It is also one of the final predictors for depression at six months when DSM and GDS assessments are used. It indicates a longer follow-up study to clarify the result. Whether the resolution of depression can attenuate the cognitive function or the opposite direction is the true story requires further study and a longer follow-up as suggested before (Dam 2001, Berg et al. 2003). However Murata et al. (2000) further proposes that the mood improvement at follow-up is found to lead to a greater recovery in cognitive functioning. According to this observation, they suggest that DAS has led to cognitive impairment and not vice versa. Since our study is not delivering any intervention, we may not have evidence to support or refute such a proposal. The communicative domain in DAS is relatively less significant than that reported previously (Hosking et al. 1996, Kauhanen et al. 1999). The inability to demonstrate the persistent effect of aphasia in depression may be due to the fact that aphasia is not common or mild among the recruited sample, as severe aphasia was one of the exclusion criteria during subject recruitment. Those reporting communicative problems including aphasia, dysarthria, or visual/hearing problems have returned to a low level or no disturbance at all at six months. No factor in the communicative domain is found in the ultimate regression model. 138 4.2.3 Dependency and somatic symptoms domain Under this domain, the dependency level of participants was measured by the Barthel Index and Norton Score on Pressure Sore, with the somatic symptoms domain reflected by the level of disturbance of ten somatic symptoms measured on a four-point ordinal scale. Our study has identified the effect of physical factors (body discomfort, different pains and self-care functions) on DAS as in line with previous findings (Geiselmann et al. 2001, Gerstenlauer et al. 2003). Their effect on DAS persists at six months. Studies have proposed that the loss of body functions or increased dependency levels are the root cause of DAS at the acute stage (Nys et al. 2005), or years after discharge (Jones et al. 2000). Among the somatic symptoms, Yen (2003) suggests that unresolved neuropathic pain may have a vital effect on DAS (Yen & Chan 2003). In our study, the effect of various types of pain is less significant as most resolve themselves to a lower frequency and intensity, except that of nonspecific muscle pain, which increases from 11.2% to 19.7%. The urge to assess pain-associated depression and manage pain control in older community patients with chronic pain has been emphasised (Gerstenlauer et al. 2003). In this study, dizziness and joint pains are associated with depression at one month and six months after stroke but neither are determinants or predictors of DAS if DSM criteria are applied. Instead, disturbance due to constipation and other problems at one month have taken over as the predictors of the depression score at six months as assessed by GDS, or are replaced by dependency levels if CESD is used. Such findings may imply an artifact as GDS/CESD for depression is known to be void of assessments on somatic complaints. It has been argued that patients with depressive symptoms tend to somatise during medical consultations (Woo et al. 1994, National Institute of Mental Health 2003), though this is not a prominent observation in this research. The tricky point is that somatic symptoms and elevated dependency may be the cause of DAS as demonstrated in this study, as well as the effect of DAS as treating DAS has been shown to improve self-care outcomes (Chemerinski et al. 2001). The important point to make is that clinicians should not overlook unresolved somatic symptoms among stroke survivors. As for the suggestion of sub-threshold depression being a co-morbidity with somatic illnesses and physical disability (Geiselmann et al. 2001), we may not have adequate data to support such a conclusion. 139 4.2.4 Emotional domain Some recent studies have proposed mood factors as core determinants of DAS (Jonkman et al. 1998, Kim et al. 1999, Kauhanen et al. 2000, Perry & McLaren 2004). In this study, four different items in the emotional domain are found to relate to DAS: (1) one-item questions on identifying any emotions during hospitalisation at the one-month interview, (2) level of disturbance due to worries or various life stressors, (3) perceived health status and disturbance due to anxiety, (4) frequency of displaying three facial expressions (happy/flat/sad or tearing) over the past week. Our participants have reported more worries and depression during hospital admission due to acute stroke than other emotional symptoms such as anxiety, panic and agitation. In fact, a previous study has suggested that depression is more common than anxiety disorder, fatigue or psychosis among stroke survivors (Bourgeois et al. 2004). The presence of worries/life stressors has been identified as a persistent and important predictor of DAS. It is the most frequently reported emotion during hospital stays. Among all worries, that relating to stroke rehabilitation is the most common, as more than 80% of depressed participants, and 50% even among the non-depressed group report so. Even the frequency of reporting worries drops by more than a half at six months compared with the one-month data, and it remains one of the significant factors associated with DAS. Studies have reported that life events such as current loss or bereavement (Forsell 2000, Hwang et al. 2000) or other unhappy episodes in life such as marital problems or unemployment (Kurlowicz 1997, Fung 2003) are associated with geriatric depression. This is also reflected in the present study. The ‘level of disturbance due to losing job’ identified by GDS and the total number of life stressors identified by CESD are determinants of DAS at six months. These factors do not show its significant effect at one month. Whether these worries are real or merely apparent is worth careful examination as such findings may have implications for intervention. A comprehensive assessment and interventions of worries and life stressors is indicated as studies have accumulated more evidence to prove the profound damage of chronic stress in the hypothalamic-pituitary-adrenal axis and the immune system, which in turns, acts as a trigger for depression (Leonard 2006). At one month, the majority of the subjects, disregarding depression levels, have 140 reported the worry about stroke condition that is also a predictor of DAS. The level of worry over current health status has been identified as a determinant of DAS at one month by DSM and CESD, as well as a predictor of the depression score at six months. These reported worries seem justifiable after the first attack of stroke and are supported by a current study reporting that ‘worrying about disease’ and ’worrying about family’ can predict DAS (Li et al. 2003). The significance of such finding affirms patients’ ability to report DAS in their language usage such as ‘worry about current health status’ that is valid, reliable, assessable and modifiable by the joint effort from patients, families and clinicians. The validity of this finding is also in line with data of health literacy on depression from the same study sample who frequently mention ‘worries’ as one of the descriptors for depression. This preliminary result may prompt more vigorous studies to validate and replicate if patients’ worries and life stressors may help to predict DAS in the future. And more indepth assessment tool such as the stress inventory scale may be recommended. In comparison with depression, the role of anxiety in this study is less obvious. ‘Level of disturbance due to anxiety’ has been shown to be one of the significant correlates of DAS, as an earlier study also found (Beekman et al. 2000). The frequency of reporting anxiety drops from 23% to 6% at six months. And it is not a predictor of DAS. This is possibly due to the fact that a single-item question may not be able to capture its presence fully, as compared with the use of a validated scale such as the Hospital Anxiety and Depression scale (HAD) (Kim et al.). But the performance of HAD in DAS assessment is not considered satisfactory by one local study (Tang et al. 2004). The frequency of a sad/tearing facial expression over the week is a consistent determinant or predictor of DAS across three assessment tools, as reported previously (data published already, see Publications). This diagrammatic tool may have helped older adults to reflect their emotional status more readily and directly without the need for much verbal elaboration. In non-English-speaking countries, diagnostic and rating tools generally accepted in the West may be particularly difficult or impractical to apply, as low literacy levels 141 are common, although variable, among local elderly patients. Moreover, traditional diagnostic depression scales are: (1) established mainly for research purposes or drug trials, (2) too academic to use and therefore require training, (3) not user-friendly for under-educated communities and (4) time-consuming during first screening. The reliability of these screening tools rests heavily on the language ability and education level of the patient. Recent effort has been diverted to a simplified and user-friendly tool to aid early and prompt assessment by non-specialists in healthcare to trace high-risk patients without further aggravating the healthcare burden. Study has attempted one question on depression assessment (Watkins et al. 2001). The variable on self-reported depression (yes/no) was the primary outcome variable in a Swedish national study (Eriksson et al. 2004). In our study, we have tried the use of one question as well. We probe the existence of notable mood conditions (depression, anxiety, worry, panic, others) during hospitalisation. It is this one question that is identified as a very significant factor in DAS at one month as assessed by three tools. This also justifies early assessment of depression by posing a simple question to patients during their acute admission, as has been demonstrated before (Watkins et al. 2001). A single-item tool, asking ‘Do you often feel sad or depressed?’ has been used. But the biggest problem in applying this strategy to Chinese people is that it is deemed unsuccessful because of low literacy as regards ‘depression’. Additionally, when this one-question assessment compares the responses with those obtained using a clinical classification, the Montgomery Asberg depression rating scale (MADRS), result shows a low positive predictive value but a high negative predictive value (Watkins et al. 2001). Others have attempted the use of two questions (Arroll 2003), or three questions claiming that the ‘help’ question has boosted the specificity of DAS assessment to a satisfactory level (Arroll 2005). Therefore, the use of any simplified tools needs further validation because of cultural specificity and to address the issue of varied levels of depression literacy as reflected in our study. 142 4.2.5 Family and social support domains The buffering effect of family and social support has attracted an increasing research effort (Angeleri et al. 1997, Swartzman et al. 1998). In addition, individual life situations and coping abilities can be influential on DAS (Forsberg-Warleby et al. 2004). The added benefits of larger social networks as regards physical function and a lower risk of institutionalisation have been suggested (Cohen-Mansfield & Taylor 1998). Thus personal resources before stroke and the social support network at six months have been also examined. The evaluation of the use of eight means to relieve unhappiness before stroke at the one-month interview showed that the majority of participants did not find the above or any other means helpful nor did the use of these means relate to depression. Only about 40% of participants reported the use of the following means to relieve unhappiness before having the stroke: ‘watching TV/listening to radio/music’ (43.9%), ‘going for a walk’ (38.7%), ‘finding someone to chat to’ (32.5%) or ‘sleeping’ (23.2%). The perceived help of all these means is considered weak. Such findings suggest that many older people do not have any readily available or effective alternatives to relieve emotional stress. Effort in this regard needs to be strengthened for primary and secondary emotional health promotion. One study has also proposed the dual role of social support and the satisfaction of material needs such as finance in the first few weeks after stroke (Robinson et al. 1999), and this is also supported in this study. ‘Level of disturbance due to financial problems’ is a determinant of DAS at one month by CESD. As for the longer time frame (six months to two years after stroke), psychosocial factors may be more important predictors for DAS (Astrom et al. 1993, Angeleri et al. 1997). Family support might enhance quality of life among stroke survivors (Swartzman et al. 1998, Kim et al. 1999, Jaracz & Kozubski 2003, Tang et al. 2005). In this study, the unequivocal finding of the aggregate score on the Lubben Social Network Scale (LSNS) being a protective factor for DAS has been demonstrated. In fact, researchers have postulated that the diminishing effect of physical functioning and dependency levels of stroke survivors may have been confounded by the effect of family functioning (Clark & Smith 1999). But the role of social support studied by different depression assessment tools is inconsistent in this study. While in DSM only the 143 ‘relative subscale’ has shown a relationship with DAS, GDS has identified both the ‘relative subscale’ and the ‘confidant subscale’ as factors associated with DAS, but not the ‘family subscale’. This is contrary to the positive finding that informational support from family, relatives and friends jointly accounts for 22.1% of the variance in depression (Li et al. 2003). In this way, such inconsistency has weakened the effect of this domain in explaining DAS when compared with factors in other domains. The notion that family support is not one of the significant factors associated DAS can also be explained. Reports have shown that families or care-givers also experience a tremendous burden in prolonging care-giving to stroke survivors (Angeleri et al. 1993, Anderson et al. 1995, Angeleri et al. 1997, Martin et al. 1998, Chumbler et al. 2004). Frequency of depression among carers of stroke patients is common (Tompkins et al. 1988, Angeleri et al. 1993, Dennis et al. 1998). Thus the problem of DAS may extend to also the family. The targeted interventions toward DAS should take both the patient and the family into consideration from assessment to management of stroke and depression at the same time. 4.2.6 Demographic and other factors Age. In this study, the mean age of the depressed group is higher than that of their counterparts. The effect of age is not straightforward, despite previous findings that age is one of the common confounding factors on DAS (Fuh et al. 1997, Beekman et al. 2000, Kao 2000, Berg et al. 2001, 2003, Eriksson et al. 2004). Age is only identified by DSM as a determinant for depression at one month, not by other tools or at six-month follow-up. Such inconsistency also exists in the literature (Gesztelyi et al. 1999, Nys et al. 2005). Gender. That female gender enhances the risk of DAS has predominated in the literature (Paradiso & Robinson 1998, Miller 2000, Weimar et al. 2002, Desmond et al. 2003, Eriksson et al. 2004, Cassidy et al. 2004, Tang et al. 2005). Being female as a stroke survivor is an independent predictor of self-reported depression (Eriksson et al. 2004), and one study has noted a two-fold higher rate of both subjectively reported and objectively rated depressive symptoms (Cassidy et al. 2004). This finding is also supported in the current study. If the discussion is confined to Chinese people, one study has reported that males in the old-old group (=/> 80 years old) were more prone 144 to geriatric depression (Woo et al. 1994). Other studies may not identify a gender effect on DAS (Burvill et al. 1995, Burvill et al. 1997, Buzzelli et al. 1997, Nys et al. 2005). Marital status. In this study, ‘not living with family’ has been identified as a factor associated with DAS at one month. This finding supports Hayee’ s (2001) suggestion that being older than 70 and living alone after a stroke might produce a risk of DAS. But these factors have no persistent effect in predicting depression at six months. 145 4.3 DAS interventions 4.3.1 Consequence of inattention to DAS DAS is common among older Chinese stroke survivors in the short and long term. This is found in the current study (data published; see Publications) and has been documented previously (Tang et al. 2005). The high incidence, one in four with DAS at one month and one in ten at six months according to the current study, shows the need for more attention to be given to public health interventions. The size of the problem is an essential consideration, taking into account the fact that a quarter of the global population is Chinese. Additionally, the high risk of cardiovascular risk factors (hypertension, diabetes, smoking, cardiovascular diseases) in the territory (Leung 2002) may endorse the need to address the issue of DAS. Before proceeding to discuss interventions in cases of DAS, we examine if inattention to DAS may impact on patients’ clinical outcomes, in terms of their quality of life and mortality, two commonly quoted indices for clinical outcomes reflected in the this and current studies. The discussion helps to justify the need to intervene in cases of DAS, but has not simply relied on previous papers where the findings on clinical outcomes for patients with DAS can be misleading or inapplicable to local settings. Quality of life. In the current study, the quality of life of the majority of stroke survivors did not improve at six months, which supports earlier findings on a compromised quality of life (QoL) among stroke survivors in short and longer time spans (Sturm et al. 2002, Moon et al. 2004). This study also supports findings that a further drop in QoL after the acute stage post-stroke is possible among depressed participants (Suenkeler et al. 2002). Emotional domain factors have demonstrated an indirect though indisputable role in post-stroke quality of life. This study has found that the level of worry over perceived health status in the early stages after stroke does help to predict quality of life at six months. But our study does not have adequate evidence to support the notion that either anxiety or depression at one 146 month may predict quality of life at six months. Despite this, the role of depression and social-support factors at six months as determinants of PSQoL at six months is in line with other studies (Jonkman et al. 1998, Kim et al. 1999, Kauhanen et al. 2000, Perry & McLaren 2004). In addition, patients’ levels of worry about their perceived health status at an early stage after stroke have been identified as a predictor of depression (data published already, see Publications). An assessment of mood including worries should therefore be administered early to salvage a compromised quality of life in the long run (Sturm et al. 2002, Moon et al. 2004). Clinicians working on the clinical front-line may need to monitor factors falling into the cognitive, emotional and physical domains, factors which are modifiable for positive changes. In particular, interventions to foster self-care functions, to alleviate worries that may be either valid or merely apparent and due to irrational thoughts, or to target early mild cognitive impairment might be indicated. Efforts in that respect have been supported in that perceptions of control six months after discharge have been found to add significantly to the predictive equations on quality of life (Johnston et al. 2004). Mortality. The identification of a relationship between mortality and DAS is worthwhile as mortality is taken as a common healthcare outcome indicator. DAS, together with dependency and somatic symptoms, has been found to be associated with a higher mortality (Herrmann 1999). It has been further suggested that the inability to lead an independent life at three months post stroke could be the only predictor of mortality in the first year (Sonde & Viitanen 2001, Pohjasvaara et al. 2002). Previous studies have reported a relationship between mortality and DAS (Robinson 1997, Everson et al. 1998, Gupta et al. 2002, Williams et al. 2004) even after adjustment for factors associated with stroke severity at 12 or 24 months (House et al. 2001). In this study, mortality in the depressed group is higher than in the non-depressed group, though a statistically significant difference has not been attested. Previously the development of suicidal tendencies among stroke survivors has been noted (Kishi et al. 1996, Kishi et al. 2001, Pohjasvaara et al. 2001). The examination of suicidality is addressed indirectly in this study by retrieving such documentation in patients’ medical record. Quality of data is highly subject to a list of factors: (1) Clinicians’ preference, knowledge or skill to assess mood or suicidality of patients 147 admitted for stroke (Peveler et al. 2002). (2) It is not a norm for healthcare professionals to document data related to emotions. (3) Some may wish to do so but for a busy work schedule and competing clinical demand, thus only little or partial information on emotions has been entered. (4) Researcher may miss some documented information in view of the lengthy record or availability of the record which might have been sent out /kept by hospital staff. (5) Such findings may not be surprising as reflected by the study participants’ limited literacy level on depression as well as the low detection rate of DAS acknowledged before (Gupta et al. 2002) and in this study (data already published; see Publications). Therefore it is likely that the database on emotional documentation is not exhausted. 4.3.2 Primary preventive measures The rationale for primary preventive measures against DAS is the triple burden the condition brings, as elaborated in the literature review sections and supported by the findings on clinical outcome indicators set out above. The core concerns are early recognition and means for detection of DAS, based on current findings. An understanding of the hidden issues also forms one of the first steps to primary preventive measures. We need to acknowledge the nature and intensity of existing problems in the recognition and detection of depression among older stroke patients. The answer to these questions is of prime importance as the information will help guide any rational interventions to address existing problems where they exist. Regarding intervention of DAS, the design of the study is not qualified to conclude any valuable points, hence further experimental study in clinical settings using (randomized controlled trial) and community in terms of health educational procedures will reveal information to intervene DAS. 148 4.3.2.1 Recognition of DAS - depression literacy While health literacy as regards depression directly influences early recognition of depression, and improvement in depression literacy fosters changes in attitude, health-seeking behaviour (Lauber et al. 2003) and health outcomes (Baker 2006), little discussion of the construct ‘depression’ among Cantonese Chinese was found in the literature. Studies caution against applying the translated Western term ‘depression’ in the local context, as the term can be interpreted differently among different ethnic groups (Patel et al. 2001). The answers to the questions ‘What is depression?’ and ‘How will depression be interpreted?’ among older Chinese adults remain largely unknown. In our study, the majority of the interviewees (60%) were unable to describe ‘depression’. Some said they had never heard of it. Under the affective domains, some subjects were unable to describe depression specifically, as shown by the use of vague terms such as ‘in a bad mood’/ ‘a heavy heart’ /‘feeling uncomfortable’. Most of these descriptors are not found in the fourth edition of the Diagnostic and Statistical Manual (DSM IV) (American Psychiatric Association 1994) or in the Geriatric Depression Scale short form, Chinese version (Brink et al. 1982, Lee 1994)/Center of Epidemiologic Studies for Depression, Chinese version (Radloff 1977, Boey 1999). It shows that the understanding or description of depression given by most older participants is brief, vague, superficial, unspecific and far from meeting the diagnostic criteria set in the gold standard (DSM IV) or by common assessment tools for depression. The use of descriptors/words by most interviewees is very limited – most illustrations falling into one of the three domains (affective, behavioural or cognitive) only. Some have incorporated terms from two domains. But the worry is that the most frequently cited descriptors, such as ‘unhappy’, ‘bored/in a fidget’, ‘irritation’, are unlikely to be indicative of depression as a medical disease when they are presented to clinicians. The difficulty of detecting depression may be compounded by the patients themselves. Worse still, a very popular and commonly accepted proverb reflects much 149 of the Chinese belief patterns among the elderly population: ‘Unsatisfactory outcomes are common, occurring nine out of ten times’. This common belief shared by Chinese patients might mask a depressed mood and fail to tip the health worker to the need for further medical attention. Chinese people also tend to be rather reserved in their displays of emotion. They consider displaying sadness or unhappiness in front of people outside the family circle inappropriate because of the ‘loss of face’ issue (Bond 1991). This is supported by the numerous responses that show avoidance of or passiveness towards depression. One study, however, presents a different finding on the issue. The patients studied cited a lack of people to confide in as contributing to their emotional problems (Alexander 2001). This may also apply in this study sample as only a quarter of patients can/will choose to chat with someone when they are unhappy before the stroke onset. Indeed, a recent study has found two streams of lay opinion regarding depression. One group treats depression as a life crisis, implying that depression might be considered a ‘normal life event’, while the other prefers a problem-solving approach to tackle any occurrence of depressive symptoms as a medical problem (Lauber et al. 2001). A poor literacy level in respect of depression may thus further perpetuate belief in mood episodes and favour the acceptance of persistent mood disturbance among the sufferers. And the situation may be more common among older people who are passive in health decision-making. This study also supports previous findings regarding reluctance among older adults to seek help for their emotional needs (Fisher & Goldney 2003). Two thirds of patients reported they were not interested in knowing about depression as a medical disease. In this way, only four subjects remarked that the mood condition - depression - was or might turn into a disease. This is an important finding as patients’ inclinations and views on mental health will affect their health decision-making and subsequent health outcomes. Studies have demonstrated that those who regard depression as a medical illness are more receptive to psycho-pharmacology, while others perceiving the condition as a psychological matter would turn to psychotherapy as a natural remedy (Lauber et al. 2003). Following from this discussion, we are justified in suggesting that mental health literacy among older adults must be addressed as an important public health issue if depression and old age are recognised as growing concerns in healthcare. To raise 150 depression literacy, the joint efforts of healthcare authorities, clinicians, older adults and their families are indicated to achieve effectiveness. This is supported by a finding that medical societies/associations and health politics in some European countries are core factors that contribute to an adequate service tackling depression in later life (Bramesfeld 2003). 4.3.2.2 Early detection of DAS – use of smiley diagrams Problem in early detection. This study has supported the notion that patients with DAS have largely remained unattended (Gupta et al. 2002). The detection or assessment of DAS is therefore seen as a crucial step, in particular at the acute phase when mild disease tends to have better remission than when it has become a long-standing disease progression. Result in our study also shows some treatment efficacy of early intervention of the depressed stroke subjects. All those under the care of psychiatrists are no longer depressed at six months when detection and treatment of DAS has been prompted early. But there are many problems for such undertaking. The reasons for healthcare workers to set DAS aside are multi-faceted. The inability among patients to recognise depression has been explored under the previous section on health literacy in respect of depression among stroke survivors. Two other perspectives hindering early detection of DAS among Chinese people are discussed: (1) clinicians’ concerns and (2) the lack of unified assessment tools. Some of these clinical difficulties encountered by healthcare professionals as the main hurdle in the assessment of depression have been documented (Chew-Graham et al. 2004). In a previous local report, healthcare professionals admitted that time constraints and competing demands in busy geriatric wards formed one of the most prominent hindrances to conducting a mood assessment on the client (Lee 2002). Some admit that they may not keep track of the new and rapid development of current and efficacious anti-depressants or alternative therapies available for depressed stroke patients (Farrell 2004), and are thus less motivated to carry out screening. Other healthcare professionals believe that mood and mental health need to be handled by clinicians with a psychiatric background. Other reasons are related to knowledge and 151 skill deficit or ageism (Boey & Chi 1999, McCurren et al. 1999, Peveler et al. 2002) . A low index of suspicion of depression and the low priority given to handling mood problems in acute settings were the reasons proposed by geriatricians in local settings (Lee 2002). Against such a background, verbal cues for early detection and diagnosis are likely to be missed. Interestingly, some geriatricians have admitted to withholding the use of the term ‘depression’ in Cantonese from some older patients who might not understand or accept having depression at all (Lee 2002). This is partly supported by the previous discussion on literacy levels in respect of depression. The lack of a biological marker as an assessment tool in the case of depression has been the major barrier to prompt clinical diagnosis. The selection of an appropriate tool to diagnose depression in the developing world, with a wide range of literacy, has been a challenge. With respect to the instruments, the reliability and validity of imported types for the local population remains a concern, because of cultural specificity (data published already, see Publications). To strike a balance between better validity and patients’ tolerance of a comprehensive tool is not easy and remains an ongoing task. Thus researchers have been keen to identify a simplified version of available tools to resolve the problem (Anderson 1996, Watkins et al. 2001, Arroll 2003). At the same time, any simplified screening is also attacked in that categorical representations of important clinical phenomena can misrepresent dimensional quantities (Nease 2003). An alternative to prompt early detection. Working along these lines, this study has attempted the use of a diagrammatic tool to prompt depression assessment among Chinese, who are more reserved in their emotional disclosure and limit such expression of mood mainly to family members (Tung 1991). More importantly, only 40% of the participants are able to interpret ‘depression’ in their own words and the rest report not knowing or having heard such a term at all. Earlier discussion has put up a conceptual background to this pilot study on the utility of a diagrammatic tool for DAS assessment on top of a questionnaire, a common assessment tool. The universally understood smiley diagram might be a feasible alternative to assess depression even for those with a low literacy level, a language barrier or mild expressive aphasia. The study has presented preliminary findings to support such a proposition. The 152 justification is that the emoticon (sad) shows good correlation with DSM IV as indicated by its Kappa value and other screening properties including specificity, and positive and negative predictive values and is also comparable with that of GDS/CESD, which takes about 5-10 minutes for completion. Utility of smiley diagrams in DAS detection. The use of smiley diagrams in prompting DAS detection has been discussed and published recently (see Publications). When stroke victims report a high frequency of the emoticon (flat) and a low frequency of the emoticon (happy), the clinician might still need to maintain a high index of suspicion of depression rather than exempting patients from further assessment. The unexpected findings in the case of the emoticon (happy) have alerted us to the use of screening instruments when cultural specificity is uncertain. Previous literature has remarked the strong cultural differences in the frequency, duration and intensity with which various emotions are felt among Chinese and other cultures (Bond 1991), in that Chinese tend to moderate their expressive emotions compared with Westerners (Bond 1991). In this study, GDS/CESD has also been used concurrently for depression assessment. While GDS/CESD is a clinically acceptable and widely used tool to detect DAS, the three emoticons, which take a shorter time for completion, being less wordy and more acceptable to illiterate patient groups, might also help to detect and monitor early depression when depression assessment is not routine in medical settings for stroke patients because of time constraints (Lee 2002). However, the routine depression assessment has been challenged. A recent systematic review has shown that detection of depression using different assessment tools may not necessarily guarantee provision of treatment by clinicians (Schreiner et al. 2001). A formal channel of communication may be necessary to alert clinicians to warning signs rather than relying on the current mechanism of routine screening (Gilbody et al. 2005). In the same sample, fewer than one in ten stroke patients gained access to mental healthcare facilities at 6 months after stroke, despite nearly a quarter of a large sample being identified as depressed at one month (data published already, see Publications). It is therefore likely that only patients with marked DAS are 153 captured by current systems. 4.3.3 Treatment modalities of DAS Previous discussion has focused on recognition and detections of DAS in local Chinese people as the initial step before intervention. This section follows on to ask how to improve the quality of stroke care, as it is still under scrutiny (Mayor 2007). Once DAS is confirmed, effective treatment modalities are indicated. This section will discuss the available evidence on two types of treatment of DAS as identified in the literature: (1) pharmacological treatment, mainly anti-depressants and (2) non-pharmacological interventions. 4.3.3.1 Pharmacological treatment The effect of anti-depressants on DAS has also been demonstrated in this study, though statistical significance cannot be established with so small a sample. All patients under the care of formal mental health service are found non-depressed. Among them, ten have been taking anti-depressant. This may give some preliminary evidence to show the efficacy of anti-depressant and the added benefit of medical surveillance. The argument is that if this group of milder stroke patients can benefit from anti-depressant treatment, the effect for the moderate to severe grade of stroke victims might be even more prominent or justified though they are commonly exempted from receiving active psychoactive treatment due to concomitant problems in speech and cognitions. Previous studies on anti-depressants have produced interesting findings. Both fluoxetine and sertraline are found to be efficacious treatments for DAS; it is also suggested that left stroke can be a predictor of treatment resistance (Spalletta et al. 2003). One study has tested the preventive effect of giving Mirtazapine on the first day post-stroke and claims that it may prevent 34 cases of depression per 100 stroke patients, leading to a significant reduction in depression incidence (Goldberg 2005). As for the efficacy of the drugs in question, 67.5% patients using anti-depressant drugs do not report depressive mood (Eriksson et al. 2004). The findings suggest that reducing premorbid levels of depressive symptoms (initial stroke admission) or increasing positive affect may help the recovery process (Ostir et al. 154 2002). The benefits of using anti-depressants have been documented, where efficacy is regarded as a change in the Hamilton Depression Rating Scales (usually a reduction of 50% or a drop below a pre-specified score). A systematic analysis of nine selected randomised control trials between 1986 and 2001 affirmed the efficacy of using oral anti-depressants (including classical and related tricyclic anti-depressants or SSRI) to curb DAS (Mottram 2006). In addition, SSRIs are reported to have fewer side effects than classical tricyclic anti-depressants in terms of withdrawal rate (Bhogal et al. 2005). Studies have established that treating DAS with anti-depressants has significantly impacted on positive self-care outcomes (Battaglia & Bejor 2001; Chemerinski et al. 2001), and thereby improves the quality of life among stroke survivors. If DAS is left unattended, a deleterious influence on functional recovery is likely (Gainotti & Marra 2002). Recent study shows that anti-depressant therapy produces a significant improvement in various aspects of cognitive performance, including attention and abstract reasoning (Battaglia & Bejor 2001). There is another inflammatory hypothesis to explain the possible anti-depressant effect. It is found that effective anti-depressant treatment of depressed patients also reduces the inflammatory changes (Leonard & Song 1999, Leonard 2006). Though exact mechanism is not fully understood, studies have suggested the anti-inflammatory actions of anti-depressant may indirectly modulate central monamine dysfunctions in depression by improving the immune and endocrine system producing neuro-protection (Leonard 2006). In fact, studies have argued that pharmacological treatment must be used with moderate and severely depressed stroke patients to trigger their cognitive or psychomotor engine, at a functional level, before psychotherapy can be effective (Battaglia & Bejor 2001). 4.3.3.2 Non-pharmacological treatment Physical/social activity. Depending on the proposed etiology of DAS, previous efforts have targeted improving physical and cognitive functions, social activity or the prevention and management of post-stroke complications (McGuire & Harvey 1999, Lai et al. 2004, Moroz et al. 2004, Merino et al. 2005). A recent study has claimed that 155 physical activity protects against depression (Strawbridge et al. 2002). A comparable intervention with stroke survivors is extended physiotherapy. Physical training seems to facilitate symptom relief in stroke rehabilitation (Harari et al. 2004). Cognitive therapy. Some DAS interventions target the worries perpetuated by irrational thoughts. Cognitive therapy, providing information and monitoring psychological factors (Clark & Smith 1999), has been used to alleviate depressive symptoms among stroke survivors. Some cognitive theorists attribute DAS to irrationality and erroneous cognition in the thinking process. The rationale of cognitive therapy claims to reduce negative attitudes among stroke survivors (Lewis et al. 2001) and moderate the perceptions of control. This argument has lent some support by a study showing that depressed stroke patients have significantly less positive cognition than the non-depressed (Nicholl et al. 2002). This cannot be verified in our study even though some subjects have attempted to interpret depression as having negative thoughts, using descriptors like ‘unhappy things’, ‘gloomy world’, ‘painful and bad things’, ‘no-good things’, or ‘thinking at one side/about the negatives’. But the majority of the sample (60%) cannot explain what ‘depression’ is. In that case, we are not sure if erroneous thoughts are the culprits inducing depression, in particular among the depressed group, though the ability to define depression is not found to be related to depression levels in this sample. Family support. The literature has remarked the role and style of problem-solving among Chinese families. The family is significant in providing resources, fulfilment, protection and welfare to its members (Young 1995), and turning to outside sources for support is considered to be the last resort (Chan 1995), because of the face issue (Bond 1991, Tung 1991). But in this study, we have pointed out the relatively weak utility of family networks in fostering patients’ emotional health. Thus, there is a need to facilitate and expand family support or to extend any available financial or healthcare resources following the acute phase (Robinson et al. 1999). Innovations such as interventions directed towards the family may be indicated. More evidence-based study on current strategies such as the use of integrated pathway and systematic discharge support is therefore indicated. 156 4.4 Limitations of study 4.4.1 Threats to internal validity 4.4.1.1 Selection bias Selection bias is one of the most problematic and frequently encountered threats to the internal validity of studies not using an experimental design (Polit & Beck 2004). The application of inclusion and exclusion criteria to subject recruitment has reduced the heterogeneity of the studied sample. But at the same time the very ill, the severely aphasic, those cognitively impaired and the seriously depressed are likely to be excluded. Eligible subjects will be relatively milder in their stroke condition. Underestimation of DAS is possible, which might explain the lower incidence of DAS in the Hong Kong sample compared with Caucasian samples. The 50% recruitment rate by a part-time research nurse should be considered satisfactory. Three tiers of problems might lead to major practical and logistic difficulties encountered in subject recruitment process: Patient-oriented. In hindsight, potential candidates may have refused to join the study for the following reasons: (1) Patients are uncertain about the importance of DAS due to a low level of literacy regarding depression, in particular the female subjects who were found less likely to be recruited to the study. In fact, the decision to include or exclude subjects was also validated by the staff nurses or the stroke coordinator in the stroke unit. (2) Some mention an inability to read and write, or unfamiliarity with what is research in particular the group with low/no formal education, and so cannot complete the required consent form. (3) Some patients are not motivated to learn or bother about depression, but only about stroke, as the latter is the diagnosis for current admission. (4) Some dislike having their mood state examined and disclosed. (5) A few may fear committing themselves to the study due to personal plans. (6) Some patients are unwilling to be the subject of research, irrespective of the reasons. A few (n=8) in fact withdrew even after giving their 157 consent to join the study. Most of those withdrawing early were deterred by family members, including one medical doctor who refused to let his mother to participate in the study despite patient’s willingness to do so. The reason given was that the family instead of the patient’s wish should be respected. Some withdrew because of time constraints or simple lack of interest. Nurse-oriented. Some potential participants might have been missed due to several reasons: (1) the research nurse was the only one responsible for recruiting subject since the possibility of collaboration with ward staff or recruiting other suitable research nurse was not successful; (2) being a full-time teacher during the study period, the research nurse could only afford two to three visits every week to the target hospital which located at the further end from work place and took at least 20 minutes’ drive if there was no traffic jam; (3) the nurse researcher has to tackle multiple and competing tasks during hospital visits, such as obtaining patients’ consent, doing interviews, tracing the patients’ medical record, clarification of disease nature with stroke nurse, photocopy of relevant laboratory result, ensuring patients’ follow-up date and time, confirming follow-up details such as venue…(4) the nurse had to meet a lot of logistic and clinical uncertainties such as clashing with ward routine or patients’ investigation or physiotherapy sessions, lack of interview room for interviews or patients’ defaulting the follow-up due to personal or medical conditions…(5) the nurse had to dash for several sites to meet the patients such as stroke unit, geriatric day hospital, specialist outpatient clinic, general outpatient clinic, waiting rooms for speech, occupational or physical therapies. Hospital policy. The rest either refused or were missed because of early discharge or a change in hospital admission policy whereby not all stroke cases were admitted to the stroke unit - the agreed study site. Among all ischemic stroke patients, nearly half the subjects were excluded after application of exclusion criteria. Despite such efforts, about a quarter of eligible subjects could not be reached, which might be explained by the short length of stay in acute settings (3-7 days, particularly milder cases). Potential subjects tended to refrain from participation by phone contact, which was not recommended in the approved protocol - no personal data should be accessed without patients’ consent to the study. 158 4.4.1.2 Study design Inadequacy of study design poses a threat to the internal and external validity of results, thus limiting the generalisability and replication of the findings. This study attempts to identify the incidence of DAS among Hong Kong Chinese subjects with first ischemic stroke. A longitudinal study design was undertaken and subjects were interviewed at one month and six months after stroke onset. The non-DAS clients were naturally taken as the comparison group. Two major problems with the study design had to be addressed: its longitudinal nature and the lack of a control group. To obtain data on the incidence of disease from an inception cohort, either a population-based study with a random sample or a prospective cohort study design are preferable to a longitudinal design. The longitudinal study is a commonly adopted design in the case of stroke and depression (Bracke 1998, Hwang et al. 2000, Whyte et al. 2004, de Coster et al. 2005, Thomas & Lincoln 2006) to help describe and evaluate disease progress and the effect of time changes on the natural course of a health problem or recovery (Stommel 2004b). But the lack of a control group to make comparisons between the exposed and the non-exposed groups (in this case, exposure refers to stroke) may render the result problematic when a background risk of geriatric depression cannot be ruled out. But in clinical study, the researcher encounters limitations in adding a control group, for several major reasons: Resources: nearly 50% of eligible subjects were missed during recruitment. This can be explained by the lack of full-time research staff in the stroke unit and by inadequate funding. The research team had devised alternative ways of recruiting. Junior researchers were employed for subject recruitment but the recruitment rate was low because of difficulty in engaging older sick people, those mildly aphasic or with a language barrier. A high wastage of recruited subjects occurred because access to medical records was inadequate, except for the principal researcher. Another unsuccessful attempt was made to seek collaboration from nursing staff in the stroke unit, including the stroke nurse coordinator, but this failed because of a busy ward schedule and the staff’s lack of interest. The inclusion of two regional hospitals in the pilot phase was another strategy to speed up the recruitment process. All these showed 159 evidence of the researcher’s effort to improve the study. But when the recruitment of the main subjects is problematic a control group is a definite burden on resources. A suitable control group: capturing a group of older people who are free from cardiovascular risks, including hypertension, diabetes or ischemic heart disease, is not a straightforward task, as evidence has shown that subjects bearing cardiovascular risks are highly prone to depression and likely to introduce a confounding factor (Mast 2002). The idea of having a control was reluctantly rejected because of the unavailability of additional resources and a pessimistic control recruitment-rate when neither stroke nor depression are the immediate concerns of potential participants. To improve a study, either a probabilistic population study or a cohort design is preferable when resources are less of a problem. 4.4.1.3 History History refers to the occurrence of external events that take place concurrently with the independent variable that can affect the dependent variables (Polit & Beck 2004). Although this is not an intervention study, the spreading of the depression message during a study period that lasted a full year might well have spread and fostered an awareness of the disease. The counter-argument is that this will apply to the whole cohort irrespective of depression levels. Additionally, a significant inter-group difference could not be identified in the case of depression literacy. Like most mood problems, depression can be induced by life stressors that coincide with or surface during stroke episodes. Environmental factors may also play a role in DAS (Remer-Osborn 1998). A background risk of geriatric depression may exist. Deviation from true depression scores may possibly be caused by unpredictable life events. Any recent events may colour the respondents’ experience and thus affect their behaviour and responses during the two interviews. The ‘genuine answers’ of participants regarding mood assessment were highly moderated by media shown 160 during the study period, which lasted a year. In 2004 a local celebrity attempted suicide, probably because of depression, and the discussion on ‘depression’ in the media became more frequent. Despite such publicity, only 40% of the participants had heard of or were able to explain ‘depression’, and most of the descriptors they used were rather simple and non-specific. To discover if reactive depression had coincided with DAS, concomitant life events were inquired into at the two interviews. This confounding factor may therefore be ruled out and adjusted for in the analysis. The validity of depression scores may also be challenged when there is a long interval between baseline study and follow-up. Amelioration or symptom relief may occur because of private treatment, leading to a dilution effect on the depressive state. This was partly avoided by having a six-month rather than a one-year follow-up. On top of this, documented medications at both follow-ups were carefully evaluated, in particular psychoactive agents. However, the possibility of other medications prescribed by general practitioners could not be excluded from the current study. 4.4.1.4 Maturation Maturation refers to processes occurring within subjects during the course of the study as s result of the passage of time (Polit & Beck 2004). Thus changes in depression may be due to any change that occurs as a function of time, including emotional maturity or adaptation to disability or acceptance of the disease. In a longitudinal design, the transition or adaptation of the disease process is well observed. Here we note the vast drop in depression (29% to 11%) at six months after the first stroke onset. Some may attribute such change to maturation, but this view is in opposition to the fact that changes in depression scores occur to the same extent in both depressed and non-depressed groups, as evidenced by the insignificant mean difference. Also, the frequency of depression and the effect of maturation may not have stabilised at six months after stroke. Berg’s study (2003) reported that nearly half of those who were depressive during the first two months were also depressive at 12 or 18 months., thus may need longer duration for follow-up study. Previous study has shown that depression may persist as long as seven years after stroke (Dam 2001) 161 4.4.1.5 Mortality Attrition due to mortality may also be acute in clinical studies. It can be argued that those who remain in the study are unrepresentative of the group as a whole, since the depressed group may have withdrawn, been institutionalised and been lost to follow up. It might thus appear that depression scores in the depression group decline over time, but the decline might only be evidence of biased attrition. In our study, the overall dropout rate is 12.1% from one-month to six-month. The analysis of this dropout does not support any significant difference between depressed and non-depressed groups. During the sample estimation, we actually took the dropouts into account and increased the sample size by 50%. The mortality was estimated to be 5.1% (11 out of 214), which is within the range reported by local research in stroke care (20% for cortical infarct at one month and 1% for lacunar infarct at one month) (Yu et al. 2003). It has been suggested that the attritional risk is especially great when the follow-up period is long. Therefore a six-month follow-up was arranged. To minimise losses at follow-up, the researcher double-checked the phone number at the consent stage. 4.4.2 Threats to external validity 4.4.2.1 Sample representativeness Consecutive eligible first-ever ischemic stroke patients in the stroke unit of a regional hospital under the Hong Kong Hospital Authority, over a one-year span (1 June 2004 to 31 May 2005) were recruited. The adoption of one-year subjects helps to avoid any seasonal effects of depression or stroke admission. Within the study sample, 81.7% suffered from ischemia stroke. This is a bit higher than the figure reported previously, that ischemic stroke accounts for 70% of all stroke admissions (Yu et al. 2003). Participants’ mean age was 72 years, not far from that of the general population in the older age group (65+) (Department of Statistics Hong Kong 2006). The recruitment of more males than females (5:3) might be explained by significantly lower education levels and more language barriers among female clients, who were mostly housewives and might be reluctant to disclose emotions or discuss a topic they 162 might not know at all with an unknown researcher. And depression literacy was found to be associated only with the level of formal education received, and not with depression or other socio-demographic factors. The sample was financially more dependent, as a quarter of the participants were living on public assistance and slightly less than two thirds regarded their spouse/children as the main source of financial support. The need for public assistance is higher than current government indications - that less than 20% of 700,000 older citizens (age 65 or over) are receiving disability allowance, and less than 10% are living in institutions (Social Welfare Department 2003). On the other hand, this cohort seemingly has better social support in terms of the following two observations. Two thirds were living with family members and only five participants were residents of institutions before stroke. The medical and health background of the sample is in line with a previous cross-sectional study capturing 1,300 local elderly community dwellers: 13% were disease-free, about half had one to two chronic illnesses before stroke, and the rest had three or more chronic health problems (Lee 2003). 4.4.2.2 Reliability of reporting ‘depression’ in Chinese stroke patients in Hong Kong hospitals The reliability and validity of ‘depression’ as interpreted by patients can be challenged. Two thirds of participants were depression illiterate, and the understanding of ‘depression’ is also culturally specific (Abas 1997). A study among local geriatricians also notes their reluctance to use the term ‘depression’ as they doubt patients’ ability to capture its full meaning as a medical disease (Lee 2002). In this study the exact term ‘depression’ in Chinese was mentioned three times: in CESD, in seeking what they understood by the term ‘depression’, and in asking about the type of emotions experienced during stroke admission. This is why the assessment of depression is explored alternatively through the use of different validated tools, as described in Chapter 2. It is suggested that a validation study on depression literacy and the use of a clear definition of ‘depression’ before the actual study may further improve the validity of study results. 163 Still the initiation to discuss ‘depression’ in Chinese language poses a real challenge despite the use of a senior nurse. The data may be as futile as it is in particular older adults who are under-educated as shown in this study or speaking a different dialect other than Cantonese that is generally adopted by the majority local residents. The concept of ‘depression’ has been only emerging recently (less than a decade) in Hong Kong. Most people, including healthcare professionals, may not readily accept the perspective of taking ‘depression as a medical disease’; rather, depression is referred to as a psychiatric condition that is a notorious stigma. These concepts are new to patients and its discussion is likely explorative but worthwhile to form a ground work for further study. Another difficulty is probably related to the non-cooperative attitude of the exhausted and sick patients during the study. Male patients, in particular, might suspect the purpose or indications of such discussion as reflected by a minority of the consented participants actually withdrew from study or gave only superficial information once their stroke symptoms had been resolved. 4.4.2.3 Measurement effects Measurement effects refer to the possible moderation of results through different data collection procedures (Stommel 2004). The following discussion explores some possible bias introduced by the data collection procedures. Interview ‘flow’. Despite the use of a structured questionnaire, procedures for assessing mood cannot be standardised. Four different instruments/tools were adopted to assess depression. Of the four, one, DSM IV, is the gold standard for assessing depression, two were screening instruments that have been validated locally with good reliability and validity. But they are not flawless. In fact, Blazer (1997) has challenged the ability of DSM criteria to capture geriatric depression. Its use can be problematic among older people who do not display the typical symptom profiles depicted by the criteria set. In the use of screening tools (GDS and CESD), false positives are common as reported by previous studies, especially those undertaken by untrained staff (Lincoln et al. 2003). GDS assessment requires binary answers that older people can capture more readily but precision of measurement may be compromised. On the other hand, the more answer options given in CESD have enhanced its measurement 164 properties but complicated the assessment, which was not fully accepted by some participants, in particular those who were less educated, mildly aphasic and or speaking a different dialect. Despite these arguments, the consistency between DSM, GDS and CESD as shown by the kappa’s value is satisfactory (> 0.4). And the incidence rates of DAS identified by the three tools were fairly close together, supporting their use in the current study. Some participants might feel over-used when their mood was assessed repeatedly, with four different tools. Thus an experienced and persistent researcher is required, to enhance the quality of the study in terms of ability to engage and motivate the participants to expose their mood condition. Some logistic and technical problems might also be overcome to minimise variability of data collection in widely diversified healthcare settings. Controlling for extraneous variables. Technical difficulties, especially the uncontrollable time and venues of interviews, can be an issue. The data collection sites included specialist out-patient clinics, general out-patient clinics and patients’ homes, if a pre-scheduled follow-up date had been missed. While some participants were anticipating the medical follow-up at outpatient clinic for the stroke episode, they were less inclined to an interview assessing their mood and depression level. The competition for time can be intense sometimes, and the quality of an interview might be subject to a few inevitable environmental interruptions such as lack of privacy, noise interference or a time clash with the medical follow-up, such as having the same follow-up times for two potential interviewees at different hospitals or clinics. Diagnosis validation by psychiatrist. In this study, a nurse researcher has undertaken all depression assessments, though a psychiatrist or psychologist may be used in some studies. Even though this study does not aim at diagnosis for depression, a validation study having a single-blind consultation with a psycho-geriatrician (PG) was arranged. All the screened positive subjects (depressed group) at six months and 20% of the non-depressed group, randomly selected, attended the study. Because of the geographical location, participants recruited from the study hospital were invited to meet the psycho-geriatrician in another hospital, rather than staying at the same hospital. Special arrangements for transfer between hospitals were necessary. Some clashing of appointments (those of patients, researcher and PG) was encountered. 165 Some consultations extended beyond three to six months rather than taking place immediately after the second interview as planned. Seven out of the 20 depressed subjects declined the interview with the psycho-geriatrician. The reasons given were mainly travel sickness or the interview being perceived as redundant, as they were already under medical or psychiatric care. Missing data. Documentation on mood and some details of stroke lesion was not complete in this dataset. Much of the recorded information on stroke lesions was brief, seldom remarked their area, severity and location. More than half of the CT reports were not available despite a routine CT scan for all stroke admissions. More often CT results were denoted as ‘NAD’ (no abnormality detected). Useful anatomical and biological data that might have yielded some understanding of the heated debate on DAS etiology was not available. Some of the diagnoses had to be made on clinical judgments by doctors who had jotted down very brief final decisions in the record or discharge summary. The situation related to mood and depression in the case notes was even worse. The assessment of mood was not incorporated as routine and therefore only patients with overt signs and symptoms, including frequent crying or bizarre behaviour, would be spotted by doctors or nurses. This is supported by the study findings showing that only 19.7% (42 out of 214) of the participants reported being asked about their mood during hospitalisation by healthcare professionals. As mood assessment is not routine and may be conducted by different healthcare disciplines at different times beyond the one-month interview, the direct use of the clinical data was not adopted. Despite such limitations, we are able to clarify the laterality and major conflicting documentation with the consultant of the stroke unit to enhance data quality. In order to minimise missing data, the record study was done more than twice for subjects with pending or unclear results. 166 4.5 Recommendations for future research, practice and education 4.5.1 Future research 4.5.1.1 Incidence studies The incidence in the current study presents very interesting results that require continued follow-up to confirm the conflicting pattern (a falling or rising pattern). The point that half the patients naturally resolve the depressive symptoms whereas the remainder are likely to develop chronic depression (Andersen 1997) warrants another study with a longer follow-up period. In this study, we selected a six-month follow-up because of concerns over attrition and resources factors. Future studies involving clinical partners may undertake a longer time frame for study (eg 1-3 years), also recommended by previous studies (Dam 2001, Berg 2003). With more clinical collaboration, recruitment of a control group indicating a prospective cohort design will more likely to yield robust results. The significant drop in the current study may also be due to a selection bias, as milder cases were recruited. But how the study result may apply to those with a moderate or severe grade of stroke insult, as classified by a standardised stroke inventory, is definitely worth further exploration. Updating the above information on DAS is crucial for clinical care, scientific pursuance of unanswered DAS etiology questions and for healthcare planning. More research effort in these areas is also supported by the clinical outcome data of patients with DAS presented in previous sections, as well as that set out under the topic ‘Significance of current study’ in Chapter 1. 4.5.1.2 Bio-anatomical or biochemical research The mechanism of DAS is an ongoing research topic as the root cause of DAS is not fully understood because of methodological diversities (Aben et al. 2001). Some advocate that DAS is simply a natural emotional response to the occurrence of any debilitating disease. Evidence to support such an argument concentrates on comparative studies to show that DAS is no more common than ordinary depression in 167 older people in geriatric settings (Burvill et al. 1997), or compared with patients in other disease group such as myocardial infarction (Aben et al. 2003) or lower limb fractures (Mast et al. 1999) or other debilitating medical conditions (Evans & Whitney 1998). Another study uses a structural-equation modelling approach to examine depression symptom endorsement between geriatric stroke patients and general-medical geriatric patients, indicating that stroke patients do not demonstrate greater depression severity (Mast 2004). Whether such findings may also apply to Chinese people deserves further exploration, as the data from the above research areas cannot be assumed applicability in Chinese populations. In bio-anatomical research, current studies are unable to find a strong laterality effect or culprit structure for DAS such as the limbic region, because of missing data in medical records. More vigorous research with the use of a brain bank and functional MRI may be promising. There is suggestion that post-stroke pathological crying is attributable to stroke-induced partial destruction of the serotoninergic raphe nuclei in the brainstem or their ascending projections to the hemispheres (Andersen 1997). By definition, vascular depression is that occurs in patients with cerebrovascular or ischemic changes in the brain (Krishnan 2000). Stroke can be viewed as falling along a continuum of potential cerebrovascular changes (ie, small vessel to large vessel changes). It is possible that depression and ischemic stroke share a common etiology and that the two conditions coexist (Leon et al. 1998). Researchers have suggested examining the number of patients with vascular depression who may develop stroke over time and determining if depression puts them at a greater risk than those with cerebrovascular risk factors alone (Mast 2002). Others are keen to explore a plausible marker for future stroke if late-onset depression has a vascular basis. In fact some initial evidence has emerged to demonstrate that, disregarding age, gender and ethnicity, depression was predictive of stroke (Jonas & Mussolino 2000), specifically ischemic stroke among Japanese (Ohira et al. 2001). Such information is very limited in Chinese populations. In biochemical areas, studies have shown the protective effect of selective serotonin re-uptake inhibitors (SSRIs) as a preventive measure to foster better 168 treatment and functional outcomes (Herrmann 1999). Other reports suggest that both tricyclics and SSRIs appear to be effective in improving DAS (Turner-Stokes & Hassan 2002). But the reviews do not offer conclusive remarks on the relative efficacy of SSRIs and heterocyclic anti-depressants nor prove a definitive protective effect (Bhogal et al. 2005). This missing area also requires clinical trials to prove the efficacy and safety of SSRIs in order to foster better quality of life among stroke survivors, whose quality of life indices do not show much improvement at six months, after two decades of discussion and concern in the field of stroke care. Another emerging theory, the inflammatory model to explain stroke and depression is a definite area for research. It may help explain the etiology of the frequent comorbidity of depression and stroke in terms of common pathways and involved biochemical components in the brains (Leonard 2006). Comorbidity of dementia among the depressed group may be highly suspected though the temporality and causality between stroke, dementia and depression in this sample are difficult to prove. There is emerging evidence suggesting the changes in proinflammatory cytokines occurring both in depression and dementia, implicating common etiology. To study along the line, the use of cyclo-oxygenase (COX2) inhibitors might have exerted both central anti-inflammatory changes as well as anti-depressant effect. This is postulated from a clinical study result on patients resolving both osteoarthritis and comorbid depression after a course of rofecoxib, COX2 inhibitors, explained by the researcher (Leonard & Myint 2006). Therefore such explanation is biologically plausible, extending the explanation to not just depression and stroke but also dementia. This kind of research may provide very useful information that is definitely a missing piece in Chinese populations. 4.5.1.3 Depression literacy studies Health literacy studies will impact on wide areas of health, including those involving communication, education and training in community, organisational and policy development (Rootman & Ronson 2005). The current study shows that we may still need to work very hard towards such a goal, so as to promote depression literacy among older people and their families, since their knowledge, skill and motivation to 169 learn about depression are still relatively low. The results of our study support the supposition that older adults might not have adequate mental-health literacy as regards decision-making. The majority of stroke patients aged 50+ reported inadequate knowledge of depression, despite the fact that there was frequent coverage of depression in the local news media. This certainly reflects the limitations of current health-education programmes in reaching or fulfilling the needs of the target groups. Clinicians tend to be unaware of or have unrealistic assumptions about patients’ reading abilities in health education. Worse still, none of the patient education material that was studied considered cultural sensitivity to be an important factor (Wilson et al. 2003). Furthermore, the wide range of literacy levels within the same culture or among various diversified ethnic groups is seldom investigated before any health promotion attempts are made. Studies that examine and exhaust the verbal cues to be used by older adults in expressing their emotional needs, pains and suffering are worthwhile if curbing depression is a real healthcare goal or mental health promotion is an initiative in the society. 4.5.1.4 Detecting depression Current study acknowledges a very low detection and treatment rate of depressed stroke patients when compared with European healthcare systems (Eriksson et al. 2004). The fact that the presence of depression limits the level of functional outcomes, and the extension of rehabilitation potential among stroke patients, indicates that more attention to the diagnosis and timely treatment of depression is needed to help make therapeutic stimuli significant during rehabilitation (Battaglia & Bejor 2001). One study recommends, given the prevalence and significance of depressive symptoms, the active screening of all stroke patients together with aggressive management (Herrmann 1999). Post-stroke depression also responds to anti-depressant treatment, as reported by Jorge (2004), and also demonstrated in this study. The results actually lend support to early detection and therefore encourage further investigation into the development of a non-verbal assessment tool for depression and its reduction in post-stroke patients (Kao 2000). Despite published work on a preliminary attempt to use alternative means, smiley diagrams, to screen for depression (data published already, see Publications), the sensitivity of the three emoticons is not very high and 170 some truly depressed subjects may still be missed. And its utility in screening for depression in the case of other chronic health conditions remains to be examined. It has been argued that the proximity of stroke onset to DAS might have implications for depression recognition and assessment (Tateno et al. 2002). The selection of the periods (currently one and six months) for the two interviews that reflect major events in the course of a disease has undergone a long process of negotiation. Previous study periods ranged from the (1) the first week (Cassidy et al. 2004); (2) hospital discharge from stroke (Loong et al. 1995); (3) 3 months (Kauhanen et al. 1999, Hayee et al. 2001, Popovich et al. 2002); (4) more than a year (Berg et al. 2003, Choi-Kwon et al. 2005). None of these studies has justified the time frame for depression assessment. Only Carson has proposed that DAS can be a chronic phenomenon since inception (Carson et al. 2000a). Thus there is no conclusive finding on the best time to conduct depression assessments. A recent systematic review on intervention efforts to prevent DAS analyses nine studies, most of which have recruited stroke participants at one month after first stroke (Anderson et al. 2005). Other research may involve the study of somatic symptoms, such as reduced appetite, psychomotor retardation and fatigue, which are all found to have high discriminative properties in DAS detection compared with the feelings of guilt or other psychological symptoms such as hypochondriasis and lack of insight reported in previous studies (de Coster et al. 2005). This research area may well be a fruitful one as Chinese are known to somatise depressive symptoms (Woo et al. 1994). 4.5.2 Future practice and education Education and practice go hand in hand. Current study results show a wide gap in knowledge of DAS, and in the skills of detecting and treating DAS. A high incidence of DAS among Chinese stroke survivors after the first episode at the acute phase and after rehabilitation at six months has been identified. But active detection and interventions for DAS lag very much behind many common cardiovascular conditions. Current study findings also note the ignorance of DAS among the potential victims as well as among the healthcare teams. It signifies a tremendous theory-practice gap. 171 Ageism may be a root cause of under-investigation, and under-treatment of carotid disease in elderly patients with transient ischaemic attack and stroke has been documented (Fairhead & Rothwell 2006). More important, ageism has influenced the public’s values and beliefs that might deter the detection and treatment of a complex health problem - DAS among old-age populations. To combat such a pattern, we need to start by fighting ageism in the first place during the education of healthcare professionals. The study regarding ageism in recognizing, detecting, diagnosing and treating depression in older patients is worthwhile research area. Stereotypes and myths regarding the inevitable emotional or cognitive impairment in late life have to be clarified early across lifespan in all levels in the society. Studies may continue to look into undergraduates’ learning needs and attitude regarding mental health literacy or mental health promotion in particular depression in older adults as study has shown that senior nursing students are less inclined to work with older people (Lee et al. 2006). At the end of the day, healthcare professionals play a significant role in elucidating a correct concept of depression or DAS to the public. Healthcare input is essential for differential diagnosis of DAS. Healthcare students and professionals have to acknowledge the need of and be educated in aligning the language and literacy levels of patients and their families to articulate the concept that ‘DAS is a medical problem as common as cardiovascular diseases, as treatable using pharmacological means and adjunct therapies as other medical diseases’. More information and discussion of DAS may foster alertness and optimism in handling the problem by early detection and prevention. Previous study has noted that early detection is prompted if depressed patients may have tipped their mood verbally to healthcare professionals (Robinson-Smith 2004). To prompt early screening, the utility of three smiley pictures, a simple, brief and non-verbal tool to assess depression among stroke survivors, has been proposed. It may be a promising direction for future research and clinical applications when healthcare staff are facing time constraints and competing demand on their services. The role of healthcare professionals in fostering post-stroke quality of life has 172 been discussed (Green & King, 2007) and found to be important as stroke survivors have constantly suffered from low quality of life (Kim et al. 1999, Moon et al. 2004). This study has updated current findings and affirmed static or poor quality of life among a majority of stroke survivors with only mild to moderate levels of stroke. Before the stress created by a sudden stroke onset turns into a chronic one that aggravates the risk of depression as proposed by the literature (Leonard 2006), effectiveness studies on measures to alleviate stress through activating the coping mechanism among patients and families are also indicated. As an intervention, an explanation of the natural course of DAS to patients and family care-givers helps to allay worries and anxiety (Li et al. 2003), as the ‘worry about current health status’ at one month is a predictor of depression at six months. Significantly more negative cognitions and fewer positive cognitions were found in stroke patients who were depressed than in stroke patients who were not (Nicholl et al. 2002). This is evidenced in both the depression literacy results and by the smiley diagrams, being the determinants or predictors in DAS. Patients with such a cognitive bias, cognitive therapy can be an option (Lewis et al. 2001). As patients’ self-care dependency is a potent determinant of DAS in both patients and family care-givers (Clark & Smith 1999), practical material support is deemed essential, in particular for the high-risk groups discussed in section 4.2.6. With only finite resources, out-patient rehabilitation and support may be first directed towards severely depressed patients and care-givers who are deprived of resources and other forms of support (Kotila et al. 1998). Healthcare professionals need to take note of the need to clarify multiple uncertainties regarding both stroke and DAS in terms of disease etiology, recognition, prevention and intervention. This is particularly important in the case of older Chinese adults who may have low formal education and a reluctance to display emotions in front of non-family members (Bond 1991, Tung 1991), thus rendering useful verbal cues to prompt early detection of DAS in vain (Robinson-Smith 2004). Once a diagnosis of depression is made, treatment should be delivered promptly. The treatment rate among local samples lies around 3.4%, and one in every ten DAS 173 victims (11%). It is nearly the opposite scenario to that of other countries. Only 8.4% of all depressed Swedish stroke patients are not treated with anti-depressants, such medication being used by 22.5% of men and 28.1% of women who had had a stroke (Eriksson et al. 2004). This is a definite area for improvement once robust evidence-based data to support treatment efficacy in DAS has been established among Chinese populations. 174 Chapter 5 Summary and conclusions This chapter is to summarize the findings, identify the added value of this research, discuss the key the implications for research, practice and education, and, lastly propose major areas for improvement. The study of depression after stroke was the first of its kind when it was conceptualised and commenced in the local territory. DAS is an important public health topic. The victim has to bear a triple condition - depression, stroke and old age. Inattention is unethical and is likely to pose a costly burden on patients, family and healthcare services. Before active intervention, the clarification of problem intensity, its nature and natural history in Chinese populations is justified. The aims of this study were to identify the incidence of DAS for first-ever ischemic stroke patients in Hong Kong, the determinants at both one month and six months, and the predictors that might explain the six-month depression score. This formed the primary study outcome. As secondary outcomes, the study addressed changes in the different domain factors among stroke survivors, and their clinical outcomes. With the study results, it becomes possible to rationalise interventions that are also supported in the literature. This study updates and adds information to address several unresolved research questions, in particular those involving Chinese populations. It identifies a high incidence of depression among older stroke patients: one in four at one month and one in ten at six months. DAS is thus common among Chinese, comparable to levels documented in other countries. The determinants and predictors of depression after stroke (DAS) at acute and chronic stages have been explored and discussed. Factors in five domains have been examined - bio-anatomical, cognitive and communicative, dependency and somatic symptoms, emotional, and family and social support. In line with previous studies, factors in all five domains are found to be associated with DAS. To estimate DAS, two assessment tools have been used on top of the Diagnostic and Statistical Manual IV for major depression (DSM), the gold standard, to conduct interviews (by a senior research nurse) with ischemic stroke patients. The incidence of depression after stroke identified by DSM was 29% at one month and dropped to 11% 175 at six months. A slightly lower incidence was obtained by using CESD and GDS. This result was still comparable with previous data, which ranged between 10 and 40%. Some mismatch in the study results is also anticipated with a variety of different assessment tools being adopted in the assessment of depression, and inherent cultural differences are expected, in particular mental-health literacy and emotion assessments which are uncommon in acute medical settings. The results of this study also support an increased effort to acknowledge DAS using an evidence-based approach. The determinants for DAS at one month fall into the emotional and dependency-level domains. The role of cognitive function became more prominent at six months and was identified together with the other two domain factors at one month, providing evidence to confirm the complex nature of DAS. Despite the frequent belief in family support as a buffering factor in DAS, this study had found its effect to be much overrated. To be able to identify DAS in high-risk groups, due attention should be paid to cognitive function, disturbance due to memory change, dependency and somatic symptoms, as well as the presence of an upset/tearing facial expression and multiple worries, so that preventive work or constant monitoring can be instituted. Another insight about the predictors of DAS involves somatic symptoms. This is particularly relevant to older Chinese adults who are known to somatise, thus making detection of depression less likely. Lingering but unresolved somatic symptoms, as simple as constipation, may render patients depressed. Healthcare professionals can explore the intensity and duration of existing somatic problems as well as monitoring the effects of treatment. With proper monitoring of these domain factors, early interventions can be initiated to prevent profound disease debilitation. Apart from answering the three most important research questions, as set out earlier, the study results also offer new and additional utility in the following areas: (1) depression literacy of stroke survivors and (2) smiley diagrams to prompt preliminary screening of DAS. 176 Using elderly after-stroke Chinese patients as a study population, our paper represents a preliminary exploration into mental health literacy levels and the expression of depressed moods, cognition or behaviour. In this study, the definition of depression provided by the stroke patients does not match that used by clinicians. Our results have provided some insight into future work in mental health promotion among the older population, irrespective of ethnicity. As health literacy is critical to empowerment (Nutbeam 1998) and the provision of information does not guarantee desirable health literacy to aid effective decisions on depression, healthcare educators need to rethink carefully in designing health communication strategies for older adults in promotion and education programmes (Vahabi 2007). Future research may explore existing initiatives, clarify the extent of problems in health literacy among different target groups in culturally appropriate contexts, particularly during the assessment and planning phases of health promotion and education programmes, in order to justify outcome-based, cost-effective and culturally specific studies. Health literacy is a primary core research element or component as highlighted in this study. The current study shows that we may still need to work very hard towards such a goal, so as to promote depression literacy among older people and their families, since their knowledge, skill and motivation to learn about depression are still relatively low. To raise depression literacy, the joint efforts of healthcare authorities, clinicians and older adults are needed to be effective. Health literacy studies will impact on wide areas of health, including that involving communication, education and training in community, organisational and policy development (Rootman & Ronson 2005). This is supported by a previous finding of the indispensable roles that medical societies/associations and health politics in assuring the provision of adequate service to tackle depression in later life (Bramesfeld 2003). It is sad to note that only a small number of the depressed patients (11%) were given due attention by healthcare facilities, suggesting serious under-recognition and under-detection of DAS in local acute settings. In Hong Kong, there is also a paucity of evidence supporting any particular tool as superior in measuring DAS among local Chinese subjects. The search for a simple 177 but valid tool to detect depression has attracted much attention over the last decade (Anderson 1996, Watkins et al. 2001, Arroll 2003). This study reports on our use of simple smiley diagrams to help in the early detection of DAS. We have also examined their compatibility with the gold standard and Geriatric Depression Scale (GDS), as well as their merits when clinically applied. A simple, non-language-based, culturally neutral, non-verbal tool is desirable that is easy to apply and not highly dependent on training. It may help front-line healthcare workers, particularly nursing staff, to identify depression early in that particular patient population. The smiley pictures seem to fulfil these requirements for early and prompt screening of older patients. Information deriving from this study may assist researchers and clinicians who are keen to identify a valid but economical tool for prompt DAS assessment (Watkins et al. 2001, Arroll 2003, 2005). While families and clinicians may take worries and a sad face to be a natural reaction to stroke after one month, their presence and persistence are indicators of mental health concerns and worth close monitoring. The current study offers some preliminary findings on the utility of the culturally universal, non-verbal and less literacy-dependent diagrams to prompt early screening and monitoring for busy clinicians in stroke or medical units. If the tool is further developed and passes vigorous psycho-metric testing in the future, it will reduce numerous barriers to the early detection of DAS faced by geriatricians and patients. DAS sufferers are vulnerable as they may be either depression illiterate or unable to express their pleas for attention and help in appropriate words. Healthcare professionals should be proactive and the first to help clarify the presence of DAS and alter the diagnosis, thus offering interventions when DAS is masked by stroke-related symptoms. They should raise the index of suspicion in the case of high-risk groups, prompt early assessment, continue monitoring, educate patients and relatives in the common signs and symptoms of DAS, and initiate relevant treatments in partnership with the family. The professional’s attitude, knowledge and skill in dealing with DAS are essential to relieve the multiple burdens it may cause. 178 DAS is a complex but important public health problem. Under-recognition, under-detection and under-treatment are all common, as observed in current findings, which indicate the need for a coordinated effort ranging from detection to diagnosis and treatment of DAS. Moreover, the needs and treatment regimes of Chinese depressed stroke patients are not fully understood. Assessment and the emerging and growing diversity of treatment suggested in other countries remain an ongoing research agenda, in particular when cultural sensitivity and relevance in emotional care are highly desirable but not readily available. Such a trend will impose a tremendous burden and high costs on patients, families and healthcare services. However, DAS is a topic less frequently researched in Chinese populations, despite the high inherent risks. Several reasons may be proposed: (1) DAS is a three-in-one condition which is likely to have a complex etiology and a diversity of clinical outcomes; (2) inconsistent evidence in the literature does not help to provide a confident platform for unanimous research results; (3) stroke may be considered of higher clinical importance than depression when conflicting results of DAS are common; (4) there is likely to be a taboo among Chinese on talking about emotions or mental health, and data collection may therefore be difficult; (5) ageism in clinical care is common, as emotional nuisance is inevitable or at least common in later life. The justification for assuring recognition, early detection and interventions for patients with this triple burden is reflected in the difference in clinical outcomes between depressed stroke patients and their counterparts in this study and that in the literature. The former group has a significantly higher hospitalization due to other health problems other than stroke, lowered level of post-stroke quality of life and a higher mortality at six months. Untreated DAS is costly to stake-holders, as this study shows. An important message emerges for front-line clinicians in clinical practice. Despite rehabilitation efforts and decades of research into stroke patients, the quality of life in the majority of patients is low at one month after stroke and remains so without change at six months. The assessment of mood (including worries) should be administered early to salvage a compromised quality of life among stroke survivors over the long term. Clinicians may need to monitor factors falling into the cognitive, 179 emotional and physical domains, as these are modifiable towards positive change. This study attempts to show how an intricate physical-mental health complex can be delineated and studied. It also provides some basic information for comparison in future research. There is much room for improvement. Suggestions are made here on ways to improve the quality of data in current study, in future research and in clinical practice with respect to DAS in Chinese populations. To yield a more representative sample, a prospective cohort design or a probabilistic sample from a representative sampling frame is preferable. Some of the measurement tools perhaps need to undergo more vigorous pre-testing for psychometric properties, in particular those self-developed items in the somatic domain together with a feasibility test in the pilot study. As noted by previous researchers, many unresolved questions or inconclusive findings will call for more research (Toso et al. 2004), addressing complex disease pathogenesis (Whyte & Mulsant 2002), in particular the causality between depression and stroke; whether they share similar mechanisms in a continuum of cerebro-vascular basis is a classic research topic (Provinciali & Coccia 2002, Dieguez et al. 2004). Despite the long list of research possibilities in Section 4.5, encompassing both broad directions and specific areas for future study, research in the case of Chinese populations should be state-of-the-art and target stroke survivors’ and families’ practical needs. Dissemination of robust study results for clinical practice has to be addressed. More important, the theory-practice gap between academic institutes and clinical facilities has to be spotted and bridged. Genuine interdisciplinary collaboration also poses a vital component for meaningful effort in early recognition and detection for effective intervention as a recent review has rightly pointed out that the assessment of depression is unable to change patients’ clinical outcome in terms of treatment prescription by physicians (Gilbody et al. 2006). 180 What is already known about DAS? z There is no unanimous pathogenesis model regarding Depression after stroke (DAS) z Depression after stroke (DAS) is common in Caucasian samples z Unresolved DAS poses triple burden to patient, families and healthcare z DAS might impact on rehabilitation and clinical outcomes z Depressed stroke survivors suffer a compromised quality of life z The extent of problems in health literacy among Chinese populations is not known z Detecting depression in elderly patients is important but often difficult because of factors relating to patients, healthcare professionals and assessment tools z A valid and user-friendly assessment tool is required for early and prompt screening of geriatric depression and DAS in busy medical settings 181 What this study adds? z DAS is as common among older Chinese stroke survivors as the Caucasian populations z DAS occurs one in four at one month and one in ten at six months z Under-recognition, under-detection and under-treatment of DAS are all common in Chinese stroke patients z The quality of life among two thirds of older Chinese stroke survivors is unchanged or lower at six months z Life stressors, cognitive impairment and display of a sad face at one month predict depression score, and jointly explain a 44% variability of DAS at six months z Older Chinese stroke survivors have relatively low literacy level with respect to depression and seldom regard depression as a medical disease z Careful interpretation of DAS assessment results is needed because of cultural specificity in verbalizing and moderating emotions among Chinese z The degree of agreement between DSM IV and the ‘sad’ emoticon is moderately high and comparable with that of the Geriatric Depression Scale (Chinese) z Smiley diagrams, being a simple, non-language-based, culturally neutral, less time-consuming tool that is also easy to apply, might be suitable for preliminary screening of DAS z Depressed stroke patients have minimal access to formal mental healthcare z Among those identified depressed and prescribed with oral anti-depressants, they are not classified as depressed at six months any more z Many psycho-social issues detected in the study contribute useful reference for future healthcare planning, researches, practice and education in local settings z Proper dissemination of robust study results for clinical practice has to be addressed 182 References Abas M. A., Boradhead, J. C. (1997). Depression and anxiety among women in an urban setting in Zimbabwe. Psychological Medicine 27: 59 - 71. Aben I., Verhey F., Honig A., Lodder J., Lousberg R. & Maes M. (2001). Research into the specificity of depression after stroke: a review on an unresolved issue. Progress in Neuro-Psychopharmacology & Biological Psychiatry 25(4): 671-689. Aben I., Verhey F., Strik J., Lousberg R., Lodder J. & Honig A. (2003). A comparative study into the one year cumulative incidence of depression after stroke and myocardial infarction. Journal of Neurology, Neurosurgery and Psychiatry 74(5): 581-585. Abram W. B., Beers M. H., Berkow R. & Fletcher A. J. (1995). The Merck Manual of Geriactrics. 2nd ed. New York, Merck Research Laboratories. Ch 94. Agrell B. & Dehlin O. (1989). Comparison of six depression rating scales in geriatric stroke patients. Stroke 20(9): 1190-1194. Agrell B. & Dehlin O. (1994). Depression in stroke patients with left and right hemisphere lesions. A study in geriatric rehabilitation in-patients. Aging-Clinical & Experimental Research 6(1): 49-56. Alexander J. (2001). Depressed men: an exploratory study of close relationships. J Psychiatric & Mental Health Nursing 8(1): 67-75. Alexopoulos G. S., Bruce M. L., Hull J., Sirey J. A. & Kakuma T. (1999). Clinical determinants of suicidal ideation and behavior in geriatric depression. Archives of General Psychiatry 56(11): 1048. American Psychiatric Association. (1994 ). Diagnostic and Statistical Manual of Mental Disorders. 4th. Washington, DC, American Psychiatric Association. American Stroke Association. (2005). What is stroke? American Heart Association Website, from <http://www.strokeassociation.org> American Stroke Association. (2007). What is stroke? Retreived on 23 October 2007. from <http://www.strokeassociation.org> Andersen G. (1997). Post-stroke depression and pathological crying: Clinical aspects and new pharmacological approaches. Aphasiology 11(7): 651-664. Andersen G., Vestergaard K., Riis J. O. & Lauritzen L. (1994). Incidence of the post-stroke depression during the first year in a large unselected stroke population determined using a valid standardized rating scale. Acta Psychiatrica Scandinavica 90: 190-195. Anderson C., Laubscher, Sara., Burns, Richard. (1996). Validation of the short form 36 (SF-36) Health survey questionnaire among stroke patients. Stroke 27(10): 1812-1816. Anderson C. S., Hackett M. L. & House A. O. (2005). Interventions for preventing depression after stroke. Oxford, The Cochrane Library. Anderson C. S., Linto J. & Stewart-Wynne E. G. (1995). A population-based assessment of the impact and burden of caregiving for long-term stroke survivors. Stroke 26(5): 843-849. Angeleri F., Angeleri V. A., Foschi N., Giaquinto S. & Nolfe G. (1993). The influence of depression, social activity, and family stress on functional outcome after stroke. Stroke 24(10): 1478-1483. Angeleri F., Angeleri V. A., Foschi N., Giaquinto S., Nolfe G., Saginario A. & Signorino M. (1997). Depression after stroke: an investigation through catamnesis. Journal of Clinical Psychiatry 58(6): 261-265. 183 Arroll B., Goodyear-Smith, F.,Kerse, N., Fishman, T., Gunn, J. (2005). Effect of the addition of a "help" question to two screening questions on specificity for diagnosis of depression in general practice: diagnostic validity study. BMJ 331(7521): 884-887. Arroll B., Khin, N., Kerse, N. (2003). Screening for depression in primary care with two verbally asked questions: cross sectional study. BMJ 327(7424): 1144-1146. Astrom M., Olsson T. & Asplund K. (1993). Different linkage of depression to hypercortisolism early versus late after stroke: A 3-year longitudinal study. Stroke 24(1): 52-57. Aybek S., Carota A., Ghika-Schmid F., Berney A., Melle G. V., Guex P. & Bogousslavsky J. (2005). Emotional behavior in acute stroke: the Lausanne emotion in stroke study. Cognitive & Behavioral Neurology 18(1): 37-44. Bacher Y., Korner-Bitensky N., Mayo N., Becker R. & Coopersmith H. (1990). A longitudinal study of depression among stroke patients participating in a rehabilitation program. Canadian Journal of Rehabilitation 4(1): 27-37. Badger T. A. & Collins-Joyce P. (2000). Depression, Psychosocial resources, functional abilities in older adults. Clinical Nursing Research 9(3): 238-255. Baker D. W. (2006). The meaning and the measure of health literacy. Journal Gen Intern Med 21: 878-883. Barry S., Phillips O. M., Williams D. C. & Dinan T. G. (1990). Platelet 5-HT uptake in post-stroke depression. Acta Psychiatrica Scandinavica 82(1): 88-89. Baskett J. J., Broad J. B., Reekie G., Hocking C. & Green G. (1999). Shared responsibility for ongoing rehabilitation: a new approach to home-based therapy after stroke. Clinical Rehabilitation 13(1): 23-33. Battaglia A. & Bejor M. (2001). Influence of poststroke depression on functional outcome. Europa Medicophysica 37(1): 25-37. Bee L., Low B. L. & Chong S. A. (1998). Treating poststroke pathologic crying with fluoxetine. Journal of Clinical Psychopharmacology 18(3): 252. Beekman A. T., Penninx B. W., Deeg D. J., Ormel J., Smit J. H., Braam A. W. & van Tilburg W. (1998). Depression in survivor of stroke: a community-based study of prevalence, risk factors and consequences. Social Psychiatry and Psychiatric Epidemiology 33(10): 463-470. Beekman A. T. F., de Beurs E., van Balkom A. J. L. M. & Deeg D. J. H., et al. (2000). Anxiety and depression in later life: Co-occurrence and communality of risk factors. The American Journal of Psychiatry 157(1): 89. Berg A., Palomaki H., Lehtihalmes M., Lonnqvist J. & Kaste M. (2001). Poststroke depression in acute phase after stroke. Cerebrovascular Diseases 12(1): 14-20. Berg A., Palomaki H., Lehtihalmes M., Lonnqvist J. & Kaste M. (2003). Poststroke depression: an 18-month follow-up. Stroke 34(1): 138-143. Blazer D. G. (1997). Depression in the elderly: Myths and misconceptions. Psychitr Clin North Am 20: 111-119. Blazer D. G., Bachar J. R. & Manton K. G. (2000). Suicide in Late-life: Review and commentary. Journal of the American Geriatrics Society 34: 519-525. Boey K. W. & Chi I. (1998). A study of life events and psychological well-being of the older adults in Hong Kong. Journal of Clinical Geropsychology 4: 55-64. Boey K. W. (1999a). Cross-validation of a short form of the CES-D in Chinese elderly. International Journal of Geriatric Psychiatry 14(8): 608-617. 184 Boey K. W. & Chi I. (1999b). Detection of geriatric depression: Knowledge and practice of hospital nurses. Clinical Gerontologist 20(2): 47-56. Bond M. H. (1991). Beyond the Chinese face: insights from psychology / by Michael Harris Bond. Hong Kong: Oxford University Press. Bourgeois J. A., Hilty D. M., Chang C. H., Wineinger M. A. & Servis M. E. (2004). Poststroke neuropsychiatric illness: An integrated approach to diagnosis and management. Current Treatment Options in Neurology 6(5): 403-420. Bracke P. (1998). Sex differences in the course of depression: evidence from a longitudinal study of a representative sample of the Belgian population. Social Psychiatry and Psychiatric Epidemiology 33(9): 420-429. Bramesfeld A. (2003). Service provision for elderly deprssed persons and politcal and professional awareness for this subject: a comparison of six European countries. International Journal of Geriatric Psychiatry 18(5): 392-401. Brink T. L., Yesavage J. A., Lum O., Herrsema P. H., Adey M. & Rose T. L. (1982). Screening tests for geriatric depression. Clinical Gerontologist 1: 37-44. British Medical Association. (1999). British National Formulary. 8th. London, British Medical Association and Royal Pharmaceutical Society of Great Britain. Britta L., Yngve G. & Lars N. (1999). Psychological Well-Being 3 Years After Severe Stroke. Stroke 30(3): 567-572. Burvill P., Johnson G., Jamrozik K., Anderson C. & Stewart-Wynne E. (1997). Risk factors for post-stroke depression. International Journal of Geriatric Psychiatry 12(2): 219-226. Burvill P. W., Johnson G. A., Jamrozik K. D., Anderson C. S., Stewart-Wynne E. G. & Chakera T. M. H. (1995). Prevalence of depression after stroke: the Perth community stroke study. British Journal of Psychiatry 166(3): 320-327. Butters H. R. (1939). Sessional Papers. Report on labour and labour conitions in Hong Kong. Buzzelli S., di Francesco L., Giaquinto S. & Nolfe G. (1997). Psychological and medical aspects of sexuality following stroke. Sexuality and Disability 15(4): 261-270. Carod-Artal J., Egido J. A., Gonzalez J. L. & Varela de Seijas E. (2000). Quality of life among stroke survivors evaluated 1 year after stroke: experience of a stroke unit. Stroke 31(12): 2995-3000. Carson A. J., Best S., Waelow C. & Sharpe M. (2000a). Suicidal ideation among outpatients at general neurology clinics: prospective study. BMJ 320 (7245): 1311-1312. Carson A. J., MacHale S., Allen K., Lawrie S. M., Dennis M., House A. & Sharpe M. (2000b). Depression after stroke and lesion location: a systematic review. Lancet 356(9224): 122-126. Cassidy E. M., O'Connor R. & O'Keane V. (2004). Prevalence of post-stroke depression in an Irish sample and its relationship with disability and outcome following inpatient rehabilitation. Disability and Rehabilitation 26(2): 71-77. Catapano F. & Galderisi S. (1990). Depression and cerebral stroke. Journal of Clinical Psychiatry 51 (Suppl): 9-12. Centers for Disease Control and Prevention. (2005). Epi Info™ Version 3.3.2. Department of Health and Human Services. Release Date: February 9, 2005. Retrieved at http://www.cdc.gov/epiinfo/, United States. Center of Health Protection. (2005). Death Rates for Leading Causes, 1981-2000. Updated on 23 Sep 2005. Department of Health. Access: http://www.chp.gov.hk/data.asp Retrieved at 25 Jan 2006., Hong Kong. 185 Center of Health Protection. (2006). Death Rates for Leading Causes, Cerebrovascular Disease.1981-2000. Last revision date 28 Nov 2006. Department of Health. Access: http://www.chp.gov.hk/contentcdcd.html?lang=en&info_id=58&id=25&pid= 9 Retrieved at 2 Dec 2006., Hong Kong. Chan H., Lee, R. L. (1995). Hong Kong Families: At the crossroads of modernism and traditionalism. Journal of Comparative Family Studies 26(1): 83-99. Chang A. M., Mackenzie A. E., Yip M. P. & Dhillon R. (1999). The psychosocial impact of stroke. Journal of Clinical Nursing 8(4): 477-478. Chew-Graham C., Baldwin R. & Burns A. (2004). Treating depression in later life. BMJ 329(7459): 181-182. Chi I. & Chou K. L. (2001). Social support and depression among elderly Chinese people in Hong Kong. International Journal of Aging and Human Development 52 (3): 231-252. Chiu H., Chen C., Huang C. & Mau L. (2005). Depressive symptoms, chronic medical conditions and functional status: a comparison of urban and rural elders in Taiwan. International Journal of Geriatric Psychiatry 20(7): 635-644. Chiu H. F. K., Lee H. C. B., Wing Y. K., Kwong P. K., Leung C. M. & Chung D. W. S. (1994). Reliability, validity, and structure of the Chinese Geriatric Depression Scale in a Hong Kong context: A preliminary report. Singapore Medical Journal 35: 477-480. Choi-Kwon S., Han S. W., Kwon S. U. & Kim J. S. (2005). Poststroke fatigue: characteristics and related factors. Cerebrovascular Diseases 19(2): 84-90. Chong M. Y., Chen C. C., Tsang H. Y., Yeh T. L., Chen C. S., Lee Y. H., Tang T. C. & Lo H. Y. (2000). Community study of depression in old age in Taiwan. British Journal of Psychiatry 18: 29-35. Chuang J. H. (2001). Agreement between Categorical Measurements: Kappa Statistics. Last modified on 02/07/2001. Retrieved from: http://www.dmi.columbia.edu/homepages/chuangj/kappa/. Chumbler N. R., Rittman M., Van Puymbroeck M., Vogel W. B. & Qin H. (2004). The sense of coherence, burden, and depressive symptoms in informal caregivers during the first month after stroke. International Journal of Geriatric Psychiatry 19(10): 944-953. Clark M. S. & Smith D. S. (1998). The effects of depression and abnormal illness behaviour on outcome following rehabilitation from stroke. Clinical Rehabilitation 12(1): 73-80. Clark M. S. & Smith D. S. (1999). Psychological correlates of outcome following rehabilitation from stroke. Clinical Rehabilitation 13(2): 129-140. Cohen-Mansfield J. & Taylor L. (1998). The relationship between depressed affect, pain and cognitive function: a cross-sectional analysis of two elderly populations. Aging & Mental Health 2(4): 313. Colantonio A., Kasl S. V., Ostfeld A. M. & Berkman L. F. (1993). Psychosocial predictors of stroke outcomes in an elderly population. Journal of Gerontology 48(5): S261-268. Coleman P. G., Philp I. & Mullee M. A. (1995). Does the use of the geriatric depression scale make redundant the need for separate measures of well-being on geriatrics wards? Age and Ageing 24(5): 416. Collin C., Wade, D. T., Davies, S., Horne, V. (1988). The Barthel ADL Index: a reliability study. Int Disability Study 10: 61-63. 186 Commonwealth Department of Health and Aged Care. (2000). National Action Plan for Depression. Mental Health and Special Programs Branch, Canberra, Australia. Conwell Y. & Brent D. (1995). Suicide and aging. I: patterns of psychiatric diagnosis. International Psychogeriatrics 7(2): 149-164. Cushman L. A. (1988). Secondary neuropsychiatric complications in stroke: implications for acute care. Archives of Physical Medicine and Rehabilitation 69(10): 877-879. Dam H. (2001). Depression in stroke patients 7 years following stroke. Acta Psychiatrica Scandinavica 103(4): 287-293. Davies S., Naik P. C. & Lee A. S. (2001). Depression, suicide, and the national service framework. BMJ 322(7301): 1500-1501. de Coster L., Leentjens A. F. G., Lodder J. & Verhey F. R. J. (2005). The sensitivity of somatic symptoms in post-stroke depression: a discriminant analytic approach. International Journal of Geriatric Psychiatry 20(4): 358-362. De Leo D. & Diekstra R. F. W. (1990). Depression and Suicide in Later Life. Toronto, Hogrefe & Huber Publishers. Dennis M., O'Rourke S., Lewis S., Sharpe M. & Warlow C. (1998). A quantitative study of the emotional outcome of people caring for stroke survivors. Stroke 29(9): 1867-1872. Denton D. D. (1999). Review on Suicide: Biopsychosocial Approaches. In Bostis, A. J., Soldatos, C. R., and Costas, S. N. (Eds.). American Journal of Psychiatry, Washington 15(6): 966. Department of Community Medicine. (1998). Hospital admission as classified by diseases categories. Source from Short-term effects of ambient air pollution on public health in Hong Kong - a FU study. A consultancy report submitted to the Environmental Protection Department, The University of Hong Kong, Hong Kong. Department of Health. (1999). Department of Health Annual Report. 1999. Hong Kong Government: Department of Health. Department of Health Census and Statistics. (2003). Health statistics 2003 to 2004 from Hong Kong Hospital Authority. Desmond D. W., Remien R. H., Moroney J. T., Stern Y., Sano M. & Williams J. B. (2003). Ischemic stroke and depression. Journal of the International Neuropsychological Society 9(3): 429-439. Dieguez S., Staub F., Bruggimann L. & Bogousslavsky J. (2004). Is poststroke depression a vascular depression? Journal of the Neurological Sciences 226(1-2): 53-58. Diller L. & Bishop D. S. (1995). Depression and stroke. Topics in Stroke Rehabilitation 2(2): 44-55. Egelko S., Simon D., Riley E., Gordon W., Ruckdeschel-Hibbard M. & Diller L. (1989). First year after stroke: tracking cognitive and affective deficits. Archives of Physical Medicine and Rehabilitation 70(4): 297-302. Endacott G. B. (1964). A history of Hong Kong. 2nd. Hong Kong and Oxford, Eriksson M., Asplund K., Glader E. L., Norrving B., Stegmayr B., Terent A., Asberg K. H. & Wester P. O. (2004). Self-Reported Depression and Use of Antidepressants after Stroke: A National Survey. Stroke 35(4): 936-941. Evans G. L. & Whitney F. W. (1998). The role of medical conditions and depression in the functional outcome of stroke survivors: a review and pilot study. Topics in Stroke Rehabilitation 5(3): 30-50. 187 Evers S. M. A. A., Engel G. L. & Ament A. J. H. A. (1997). Cost of Stroke in the Netherlands From a Societal Perspective. Stroke 28(7): 1375 - 1381. Everson S. A., Roberts R. E., Goldberg D. E. & Kaplan G. A. (1998). Depressive symptoms and increased risk of stroke mortality over a 29-year period. Archives of Internal Medicine 158(10): 1133. Fairhead J. F. & Rothwell P. M. (2006). Underinvestigation and undertreatment of carotid disease in elderly patients with transient ischaemic attack and stroke: comparative population based study. BMJ 333(7567): 525-527. Farrell B., Godwin J., Richards S. & Warlow C. (1991). The United Kingdom transient ischaemic attack [UK-TIA] aspirin trial: final results. J Neurol Neurosurg Psychiatry 54: 1044-1054. Farrell C. (2004). Poststroke depression in elderly patients. DCCN: Dimensions of Critical Care Nursing 23(6): 264-269. Feibel J. H. & Springer C. J. (1982). Depression and failure to resume social activities after stroke. Archives of Physical Medicine and Rehabilitation 63: 276-278. Femia S. E., Zarit S. H. & Johansson B. (1997). Predicting change in activities of daily living: A longitudinal study of the oldest-old in Sweden. Journal of Gerontology: Psychological Sciences, 52B: 294-302. Fisher L. & Goldney R. (2003). Differences in community mental health literacy in older and younger Australians. Int J Geriatric Psychiatry 18(1): 33-40. Fjaertoft H., Indredavik B., Johnsen R. & Lydersen S. (2004). Acute stroke unit care combined with early supported discharge. Long-term effects on quality of life. A randomized controlled trial. Clinical Rehabilitation 18(5): 580-586. Forsberg-Warleby G., Moller A. & Blomstrand C. (2004). Psychological well-being of spouses of stroke patients during the first year after stroke. Clinical Rehabilitation 18(4): 430-437. Forsell Y. (2000). Predictors for Depression, Anxiety and psychotic symptoms in a very elderly population: data from a 3-year follow-up study. Social Psychiatry Pschiatr Epidemiol 35: 259-263. Fowler F. J. (1993). Survey research methods. California: Newbury park, Sage Publications. pp.10. Francisco G. S. (1993). An overview of post-stroke depression. New Jersey Medicine 90(9): 686-689. Fred F. F., Fretwell M. D. & Wachtel T. J. (1997). Practical Guide to the Care of the Geriatric Patient. 2nd ed. St Louis, Mosby. Frühwald S., Löffler H., Eher R., Saletu B. & Baumhackl U. (2001). Relationship between depression, anxiety and quality of life: a study of stroke patients compared to chronic low back pain and myocardial ischemia patients. Psychopathology 34 (1): 50-56. Fuh J. L., Liu H. C., Wang S. J., Liu C. Y. & Wang P. N. (1997). Poststroke depression among the Chinese elderly in a rural community. Stroke 28(6): 1126 -1129. Fung P. Y. (2003). Welfare initiatives to tackle famly violence in Hong Kong. Paper presented at the International Conference on Family Violence Retrieved from http://wwwgovhk/constatd/Chinese/press/labour1/1b1_latest_indexhtml, San Diego, CA. Retreived on Sept, 26 2002. Gainotti G. & Marra C. (2002). Determinants and consequences of post-stroke depression. Current Opinion in Neurology 15(1): 85-89. 188 Gallo J. J. & Lebowitz B. D. (1999). The epidemiology of common late-life mental disorders in the community: Themes for the new century. Psychiatric Services 50(9): 1158-1166. Geiselmann B., Linden M. & Helmchen H. (2001). Psychiatrists' diagnoses of subthreshold depression in old age: frequency and correlates. Psychological Medicine 31(1): 51-63. Gerstenlauer C. J., Maguire S. R. & Wooldridge L. (2003). Geriatric nurse practitioner care guidelines: depression in older adults. Geriatric Nursing 24(3): 185-187. Gesztelyi R., Fekete I., Kellermann M., Csiba L. & Bereczki D. (1999). Screening for depressive symptoms among post-stroke outpatients in Eastern Hungary. Journal of Geriatric Psychiatry and Neurology 12(4): 194-199. Gilbody S., House A. O. & Sheldon T. A. (2005). Screening and case finding instruments for depression. Cochrane Database of Systematic Reviews (4): CD002792. Gilbody S., Sheldon T. & Wessely S. (2006). Should we screen for depression? BMJ 332(7548): 1027-1030. Gillen R., Tennen H., McKee T. E., Gernert-Dott P. & Affleck G. (2001). Depressive symptoms and history of depression predict rehabilitation efficiency in stroke patients. Archives of Physical Medicine and Rehabilitation 82(12): 1645-1649. Glasser M. & Gravdal J. A. (1997). Assessment and treatment of geriatric depression in primary care settings. Achives of Family Medicine 6(5): 433-438. Goldberg R. J. (2005). Early treatment with mirtazapine may help curb post-stroke depression. Brown University Geriatric Psychopharmacology Update 9(2): 1-3. Gottlieb D., Salagnik I., Kipnis M. & Brill S. (2002). Post stroke depression, first year post stroke, in middle band patients. International Journal of Geriatric Psychiatry 17(5): 486-487. Grant J. S., Weaver M., Elliott T. R., Bartolucci A. R. & Newman Giger J. (2004). Sociodemographic, physical and psychosocial factors associated with depressive behaviour in family caregivers of stroke survivors in the acute care phase. Brain Injury 18(8): 797-809. Green J., Young J., Forster A., Collen F. & Wade D. (2004). Combined analysis of two randomized trials of community physiotherapy for patients more than one year post stroke. Clinical Rehabilitation 18(3): 249-252 (218 ref). Gupta A., Pansari K. & Shetty H. (2002). Post-stroke depression. International Journal of Clinical Practice 56(7): 531-537. Hamilton M. (1967). Development of a rating scale for primary depressive illness. British Journal of Social and Clinical Psychology 6: 278-296. Han B., Small B. J. & Haley W. E. (2001). The structure of self-rated health among community-dwelling older adults with stroke. Home Health Care Services Quarterly 20(4): 1-15. Hankey G. J., Kwan J. & Sandercock P. (2003). In-Hospital Care Pathways for Stroke: A Cochrane Systematic Review. Stroke 34(2): 587-588. Hansson P. (2004). Post-stroke pain case study: clinical characteristics, therapeutic options and long-term follow-up. European Journal of Neurology 11 Suppl 1: 22-30. 189 Harari D., Norton C., Lockwood L. & Swift C. (2004). Treatment of constipation and fecal incontinence in stroke patients: randomized controlled trial. Stroke 35(11): 2549-2555. Harrington C. & Salloway S. (1997). The diagnosis and treatment of post-stroke depression. Medicine and Health, Rhode Island 80(6): 181-187. Harwood D. G., Barker W. W., Ownby R. L., Mullan M. & Duara R. (1999). Factors associated with depressive symptoms in non-demented community-dwelling elderly. International Journal of Geriatric Psychiatry 14(5): 331. Hayee M. A., Akhtar N., Haque A. & Rabbani M. G. (2001). Depression after stroke-analysis of 297 stroke patients. Bangladesh Medical Research Council Bulletin 27(3): 96-102. Haynie D. A., Berg S., Johansson B., Gatz M. & Zarit S. H. (2001). Symptoms of Depression in the Oldest Old: A Longitudinal Study. Journal of Gerontology: Psychological Sciences 56B(2): 111-118. Herrmann N. (1999). Post stroke depression. Primary Care Psychiatry 5(3): 81-87. Herrmann N., Mittman N., Silver I. L. & Shulman K. I. (1996). A validation study of the Geriatric Depression Scale short form. International Journal of Geriatric Psychiatry 11(5): 457-460. Hinkle J. L. (1998). Biological and behavioral correlates of stroke and depression. Journal of Neuroscience Nursing 30(1): 25-31 (41 ref). Hippisley-Cox J., Fielding K. & Pringle M. (1998). Depression as a risk factor for ischaemic heart disease in men: population based case-control study. BMJ 316(7146): 1714-1719. Hong Kong Census and Statistics Department. (2004). Population and Household Statistics Analysed by District Council District. Census and Statistics Department., HKSAR. Hosking S. G., Marsh N. V. & Friedman P. J. (1996). Poststroke depression: prevalence, course, and associated factors. Neuropsychology Review 6(3): 107-133. House A. (1987). Depression after stroke. British Medical Journal 294(6564): 76-78. House A., Knapp P., Bamford J. & Vail A. (2001). Mortality at 12 and 24 months after stroke may be associated with depressive symptoms at 1 month. Stroke 32(3): 696-701. Hunkeler E. M., Katon, Wayne.,Tang, Lingqi., Williams, John W., Jr., Kroenke, Kurt., Lin, Elizabeth H. B., Harpole, L. H., Arean, Patricia., Levine, Stuart., Grypma, L. M., Hargreaves, William. A., Unutzer, Jurgen. (2006). Long term outcomes from the IMPACT randomised trial for depressed elderly patients in primary care. BMJ 332(7536): 259-263. Hwang W. C., Myers H. F. & Takeuchi D. T. (2000). Psychosocial predictors of first-onset depression in Chinese Americans. Social Psychiatry & Psychiatric Epidemiology 35(3): 133. Illife S., Haines A., Gallivan S., Booroff S. & Goldenberg E. P. (1991). Assessment of elderly people in general practice. British Journal of General Practice 41: 9-15. Jaracz K. & Kozubski W. (2003). Quality of life in stroke patients. Acta Neurologica Scandinavica 107(5): 324-329. Johnson G., Burvill P. W., Anderson C. S., Jamrozik K., Stewart-Wynne E. G. & Chakera T. M. (1995). Screening instruments for depression and anxiety following stroke: experience in the Perth community stroke study. Acta Psychiatrica Scandinavica 91(4): 252-257. 190 Johnson J., Weissman M. M. & Klerman G. L. (1992). Service utilization and social morbidity associated with depressive symptoms in the community. JAMA 267: 1478-1483. Johnston M., Pollard B., Morrison V. & MacWalter R. (2004). Functional limitations and survival following stroke: psychological and clinical predictors of 3-year outcome. International Journal of Behavioral Medicine 11(4): 187-196. Jonas B. S. & Mussolino M. E. (2000). Symptoms of depression as a prospective risk factor for stroke. Psychosomatic Medicine 62(4): 463-471. Jones A. L., Charlesworth J. F. & Hendra T. J. (2000). Patient mood and carer strain during stroke rehabilitation in the community following early hospital discharge. Disability and Rehabilitation 22(11): 490-494. Jonkman E. J., de Weerd A. W. & Vrijens N. L. (1998). Quality of life after a first ischemic stroke. Long-term developments and correlations with changes in neurological deficit, mood and cognitive impairment. Acta Neurologica Scandinavica 98(3): 169-175. Jorge R. E. & Robinson R. G. (2004). Post-stroke depression. Geriatrics and Aging 7(8): 26-32. Jorgensen L., Engstad T. & Jacobsen B. K. (2002). Higher incidence of falls in long-term stroke survivors than in population controls: depressive symptoms predict falls after stroke. Stroke 33(2): 542-547. Kao L. K. (2000). An assessment of the depression and factors that affect depression among post-stroke adults in Taiwan. (University of Northern Colorado). Kase C. S., Wolf P. A., Kelly-Hayes M., Kannel W. B., Beiser A. & D'Agostino R. B. (1998). Intellectual decline after stroke: the Framingham study. Stroke 29(4): 805-812. Kauhanen M., Korpelainen J. T., Hiltunen P., Brusin E., Mononen H., Maatta R., Nieminen P., Sotaniemi K. A. & Myllyla V. V. (1999). Poststroke depression correlates with cognitive impairment and neurological deficits. Stroke 30(9): 1875-1880. Kauhanen M. L., Korpelainen J. T., Hiltunen P., Nieminen P., Sotaniemi K. A. & Myllyla V. V. (2000). Domains and determinants of quality of life after stroke caused by brain infarction. Archives of Physical Medicine and Rehabilitation 81(12): 1541-1546. Kelly-Hayes M., Robertson J., Broderick J., Duncan P., Hershey L., Roth E., Thies W. & Trombly C. (1998). The American Heart Association Stroke Outcome Classification. Stroke 29(6): 1274-1280. Kim P., Warren S., Madill H. & Hadley M. (1999). Quality of life of stroke survivors. Quality of Life Research 8(4): 293-301. King R. B., Carlson C. E., Shade-Zeldow Y., Bares K. K., Roth E. J. & Heinemann A. W. (2001). Transition to home care after stroke: depression, physical health, and adaptive processes in support persons. Research in Nursing and Health 24(4): 307-323. Kishi Y., Kosier J. T. & Robinson R. G. (1996). Suicidal plans in patients with acute stroke. Journal of Nervous and Mental Disease 184(5): 274-280. Kishi Y., Robinson R. G. & Kosier J. T. (2001). Suicidal ideation among patients during the rehabilitation period after life-threatening physical illness. Journal of Nervous and Mental Disease 189(9): 623-628. Kotila M., Numminen H., Waltimo O. & Kaste M. (1998). Depression After Stroke: Results of the FINNSTROKE Study. Stroke 29(2): 368-372. 191 Krause N. & Liang J. (1992). Cultural variations in depressive symptoms in later life. International Psychogeriatrics 4(2): 173-190. Krause N., Liang J. & Gu S. (1998). Financial Strain, Received Support, Anticipated Support, and Depressive Symptoms in the People's Republic of China. Psychology and Aging 13(1): 58-68. Krishnan K. R. (2000). Depression as a contributing factor in cerebrovascular disease. American Heart Journal 140(4 Suppl): 70-76. Krishnan K. R. R., Delong M., Kraemer H., Carney R., Spiegel D., Gordon C., McDonald W., Dew M. A., Alexopoulos G. & Buckwalter K. (2002). Comorbidity of depression with other medical diseases in the elderly. Biological Psychiatry 52(6): 559. Kurlowicz L. H. (1997). Nursing standard of practice protocol: depression in elderly patients. Geriatric Nursing 178(5): 192-199. Kurtz M. E., Kurtz J. C., Stommel M., Given C. W. & Given B. A. (2001). Physical functioning and depression among older persons with cancer. Cancer Practice 9: 11-18. Kurz J. C. (1997). Cognitive impairment and depression after stroke. American Journal of Nursing 97(3): 16. Kwai Chung Hospital Psychogeriatric Team. (2000). Geriatric Depression Scale short form. Modified Cantonese version. User guide. Hong Kong, Kwai Chung Hospital. Not validated. Lai J. C., Woo J., Hui E. & Chan W. M. (2004). Telerehabilitation - a new model for community-based stroke rehabilitation. Journal of Telemedicine and Telecare 10(4): 199-205. Lai S. M., Duncan P. W., Keighley J. & Johnson D. (2002). Depressive symptoms and independence in BADL and IADL. Journal of Rehabilitation Research and Development 39(5): 589. Lalasingh-Nixon S. R. (2001). Diagnosing and treating post-stroke depression: case managers can utilize available research to motivate patients to achieve optimal functional ability. CareManagement 7(3): 19-13. Lam C. L. K., Pan P. C., Chan A. W. T., Aylwin W. T. C., Chan S. Y. & Munro C. (1995). can the Hospital Anxiety and Depression (HAD) Scale be used on Chinese edlerly in general practice? Family Practice 12(2): 149. Lam T. H., Li Z. B., Ho S. Y., Chan W. M., Ho K. S., Li M. P. & Leung G. M. (2004). Smoking and depressive symptoms in Chinese elderly in Hong Kong. Acta Psychiatrica Scandinavica 110(3): 195 -200. Last J. M. (2001). A dictionary of epidemiology. 4th ed. Oxford, Oxford University Press. Lauber C., Nordt C., Falcato L. & Rossler W. (2001). Lay recommendations on how to treat mental disorders. Soc Psychiatr Epidemiol 36(11): 553-556. Lauber C., Nordt C., Falcato L. & Rossler W. (2003). Do people recognise mental illness? Factors influencing mental health literacy. Eur Arch Psychiatry Clin Neurosci 253: 248-251. Lawlor D. A. & Hopker S. W. (2001). The effectiveness of exercise as an intervention in the management of depression: systematic review and meta-regression analysis of randomised controlled trials. BMJ 322(7289): 763-. Lee A. C. K. (2002 ). Detecting depression by doctors working in geriatric wards. Paper presented at the Biomedical Frontiers Conference, Hong Kong. 192 Lee A. C. K. (2003). Prevalence of and factors associated with community dwelling elderly people using the mobile health clinic in Hong Kong. Unpublished Master Thesis. The University of Hong Koong. Lee A. C. K., Wong A. K. P. & Loh E. K. Y. (2006). Score in the Palmore's aging Quiz, knowledge of community resourxes and working preferences of undergrduate nursing students toward the elderly in Hong Kong. Nurse Education Today 26: 269-276. Lee H. C. B., Chiu H. F. K. & Kwong P. K. (1994). Cross-validation of the Geriatric Depression Scale Short Form in the Hong Kong elderly. Bulletin of the Hong Kong Psychological Society 32/33: 72-77. Leon A. S., John M., Yechiel F. & Judith S. (1998). Risk Factors for Ischemic Stroke: Dubbo Study of the Elderly. Stroke 29 (7): 1341-1346. Leonard B. E. (2006). HPA and Immue Axes in Stress: Involvement of the Serotonergic System. Neuroimmunomodulation 13: 268-276. Leonard B. E. & Myint A. (2006). Changes in the immue system in depression and dementia: causal or coincidental effects? Dialogues Clin Neurosci 8: 163-173. Leonard B. E. & Song C. (1999). Stress, depression and the role of cytokines. New York, Kluwer Academic Plenum. Lesher E. L. & Beryhill J. S. (1994). Validation of the Geriatric Depression Scale-Short Form among patients. Journal of Clinical Psychology 50: 256-260. Leung G. M. (2002). The challenge of chronic conditions in Hong Kong. Hong Kong Medical Journal 8: 376-378. Leung K. F. T. (1998). Relationship between Perceived Autonomy and Depression amongst the Elderly Living in Residential Homes. Hong Kong Journal of Gerontology 12(1): 28-33. Lewis S. C., Dennis M. S., O'Rourke S. J. & Sharpe M. (2001). Negative attitudes among short-term stroke survivors predict worse long-term survival. Stroke 32(7): 1640-1645. Li S. C., Wang K. Y. & Lin J. C. (2003). Depression and related factors in elderly patients with occlusion stroke. Journal of Nursing Research 11(1): 9-18. Lincoln N. B., Nicholl C. R., Flannaghan T. & Leonard M. (2003). The validity of questionnaire measures for assessing depression after stroke. Clinical Rehabilitation 17(8): 840. Liu C. Q., Xie C. H. & Sun S. G. (2003). Post-stroke depression and its related factors. Zhongguo Linchuang Kangfu 7(28): 3840-3841. Liu C. Y., Wang S. J., Teng E. L., Fuh J. L., Lin C. C., Lin K. N., Chen H. M., Lin C. H., Wang P. N., Yang Y. Y., Larson E. B., Chou P. & Liu H. C. (1997). Depressive disorders among older residents in a Chinese rural community. Psychological Medicine 27(4): 943-949. Lo K. & Yeung S. (2001). Thematic household survey: Results on Health-related issues, September to December 1999. HKSAR: Hong Kong Census and Statistics Department. Loong C. K., Kenneth N. K. & Pauline S. T. (1995). Post-stroke depression: outcome following rehabilitation. Australian and New Zealand Journal of Psychiatry 29(4): 609-614. Lord S. (2003). Physiotherapy for patients with mobility problems more than 1 year after stroke: a randomised controlled trial. New Zealand Journal of Physiotherapy 31(3): 143. 193 Lu C. H., Liu C. Y. & Yu S. (1998). Depressive Disorders Among the Chinese Elderly in a Suburban Community. Public Health Nursing 15(3): 196. Lubben J. & Gironda M. (2003). Centrality of social ties to the health and well-being of older adults. In Social Work and Health Care in an Aging Society. Eds. Berkman, B., Harootyan, L. Springer Publishing Company. Lyketsos C. G., Treisman G. J., Lipsey J. R., Morris P. L. P. & Robinson R. G. (1998). Does stroke cause depression? Journal of Neuropsychiatry & Clinical Neurosciences 10(1): 103-107. Lyness J. M., Noel T. K., Cox C., King D. A., Conwell Y. & Caine E. D. (1997). Screening for depression in elderly primary care patients. A comparison of the Center for Epidemiologic Studies-Depression Scale and the Geriatric Depression Scale. Archives of Internal Medicine 157(4): 449. MacHale S. M., O'Rourke S. J., Wardlaw J. M. & Dennis M. S. (1998). Depression and its relation to lesion location after stroke. Journal of Neurology, Neurosurgery and Psychiatry 64(3): 371-374. Madianos M. G., Gournas G. & Stefanis C. N. (1992). Depressive symptoms and depression among elderly people in Athens. Acta Psychiatr Scand 86: 320-326. Madureira S., Guerreiro M. & Ferro J. M. (2001). Dementia and cognitive impairment three months after stroke. European Journal of Neurology 8(6): 621-627. Mann A. (1992). Depression and Anxiety in Primary Care: The Epidemiological Evidence. In Jenkins, R., Newton, J., and Young, R. The prevention of Depression and Anxiety. The role of the primary care team. London, HMSO. Chapter 1. Martin D., Suzanne O., Stephanie L., Michael S. & Charles W. (1998). A Quantitative Study of the Emotional Outcome of People Caring for Stroke Survivors. Stroke 29 (9): 1867-1872. Mast B. T. (2002). An examination of the post-stroke and vascular depression hypotheses among geriatric rehabilitation patients. (Wayne State University). Mast B. T. (2004). Cerebrovascular disease and late-life depression: a latent-variable analysis of depressive symptoms after stroke. American Journal of Geriatric Psychiatry 12(3): 315-322. Mast B. T., MacNeill S. E. & Lichtenberg P. A. (2004). Post-stroke and clinically-defined vascular depression in geriatric rehabilitation patients. American Journal of Geriatric Psychiatry 12(1): 84-92. Mayberg H. S., Parikh R. M., Morris P. L. & Robinson R. G. (1991). Spontaneous remission of post-stroke depression and temporal changes in cortical S2-serotonin receptors. Journal of Neuropsychiatry and Clinical Neurosciences 3(1): 80-83. Mayor S. (2004). Cognitive behaviour therapy affects brain activity differently from antidepressants. BMJ 328(7431): 69. Mayor S. (2007). Stroke care is improving in England but not in Wales, audit shows. BMJ 334(7601): 969-a-. McCurren C., Dowe D., Rattle D. & Looney S. (1999). Depression among nursing home elders: Testing an intervention strategy. Applied Nursing Research 12(4): 185. McGivney S. A., Mulvihill M. & Taylor B. (1996). Validating the GDS depression screen in the nursing home. Journal of American Geriatrics Society 44(1): 98-100. 194 McGuire J. R. & Harvey R. L. (1999). The prevention and management of complications after stroke. Physical Medicine and Rehabilitation Clinics of North America 10(4): 857-874. Merino J., Lattimore S. & Warach S. (2005). Telephone Assessment of Stroke Outcome is reliable. Stroke 36(2): 232-233. Mika V. S., Kelly P. J., Price M. A., Franquiz M. & Villarreal R. (2005). The ABCs of health literacy. Family Community Health 28(4): 351-357. Miller K. E. (2000). Can poststroke depression affect rehabilitation. American Family Physician 61(1): 215. Moroz A., Bogey R. A., Bryant P. R., Geis C. C. & O'Neill B. J. (2004). Stroke and neurodegenerative disorders. 2. Stroke: comorbidities and complications. Archives of Physical Medicine and Rehabilitation 85(3 Suppl 1): S11-14. Morris P. L., Raphael B. & Robinson R. G. (1992). Clinical depression is associated with impaired recovery from stroke. Medical Journal of Australia 157(4): 239-242. Morris P. L., Robinson R. G. & Raphael B. (1990). Prevalence and course of depressive disorders in hospitalized stroke patients. International Journal of Psychiatry in Medicine 20(4): 349-364. Morse J. M. & Field P. A. (1995). Qualitative research methods for health professionals. 2nd. CA: Sage Publications, Thousand Oaks. Mottram P., Wilson, K., Strobl, J. (2006). Antidepressants for depressed elderly. Cochrane Database of Systematic Reviews (1): CD003491. Murata Y., Kimura M. & Robinson R. G. (2000). Does cognitive impairment cause post-stroke depression? American Journal of Geriatric Psychiatry 8(4): 310-317. Murray C. J. & Lopez A. D. (1996). The global burden of disease: a comprehensive assessment of mortality and disability from diseases, injuries and risk factors in 1990 and projected to 2002. Global Burden of disease and Injury Series 1: Muslumanoglu L., Aki S., Turkdogan D., Us O. & Akyuz G. (2004). Involvement of sympathetic reflex activity in patients with acute and chronic stroke: a comparison with functional motor capacity. Archives of Physical Medicine and Rehabilitation 85(3): 470-473. Nannetti L., Paci M., Pasquini J., Lombardi B. & Taiti P. G. (2005). Motor and functional recovery in patients with post-stroke depression. Disability and Rehabilitation 27(4): 170-175. Narrow W. E. (1998). One-year prevalence of depressive disorders among adults 18 and over in the U.S.: NIMH ECA prospective data. Population estimates based on U.S. Census estimated residential population age 18 and over on July 1, 1998. Unpublished. Cited in the website: <http://www.nimh.nih.gov/publicat/depstroke.cfm#ptdep2>. National Center for Health Statistics. (2003). The International Classification of Diseases, 9th Revision, Clinical Modification" (ICD-9-CM). 6th ed. Retrieved at http://www.cdc.gov/nchs/icd9.htm. National Institute of Mental Health. (2002). Depression and Stroke No. 02-5006. National Institute of Mental Health. (2003). Older Adults: Depression and suicide facts. National Institute of Mental Health. (2007). U.S. Department of Health and Human Services. What is Depression? Retreived on 22 Oct 2007. from http://www.nimh.nih.gov/health/topics/depression/index.shtml 195 National Mental Health Strategy Evaluation Steering Committee. (1997). Australian Health Ministers Advisory Council, Evaluation of the National Mental Health Strategy: Final Report, mental health Branch. Commonwealth Department of Health and Family Services. Nease D. E. (2003). DSM depression and anxiety criteria and severity of symptoms in primary care: cross sectional study. BMJ 327(7422): 1030-1031. Nelson L. D., Cicchetti D., Satz P., Sowa M. & Mitrushina M. (1994). Emotional sequelae of stroke: a longitudinal perspective. Journal of Clinical and Experimental Neuropsychology 16(5): 796-806. Neu P., Schlattmann P., Schilling A. & Hartmann A. (2004). Cerebrovascular Reactivity in Major Depression: A Pilot Study. Psychosomatic Medicine 66(1): 6-8. Nezu A. M., Ronan G. F., Meadows E. A. & McClure K. S. (2000). Practitioner’s guide to empirically based measures of depression. Kluwer Academic / Plenum Publishers. Nicholl C. R., Lincoln N. B., Muncaster K. & Thomas S. (2002). Cognitions and post-stroke depression. British Journal of Clinical Psychology 41(Pt 3): 221-231. Norton D. (1989). Calculating the risk: Reflections on the Norton scale. Decubitus 2: 24-31. Nurses Health Study. (2002). http://wwwchanningharvaidedu/nhs/indexhtml: Nussbaum P. D. (1997). Handbook of neuropsychology and aging. New York, Plenum Press. Nutbeam D. (1998). Health promotion glossary. Health promotion International 13(4): 349-364. Nys G. M., van Zandvoort M. J., van der Worp H. B., de Haan E. H., de Kort P. L. & Kappelle L. J. (2005). Early depressive symptoms after stroke: neuropsychological correlates and lesion characteristics. Journal of the Neurological Sciences 228(1): 27-33. O'Connell H., Chin A.-V., Cunningham C. & Lawlor B. A. (2004). Recent developments: Suicide in older people. BMJ 329(7471): 895-899. O'Rourke S., MacHale S., Signorini D. & Dennis M. (1998). Detecting psychiatric morbidity after stroke: comparison of the GHQ and the HAD Scale. Stroke 29(5): 980-985. Ohira T., Iso H., Satoh S., Sankai T., Tanigawa T., Ogawa Y., Imano H., Sato S., Kitamura A. & Shimamoto T. (2001). Prospective study of depressive symptoms and risk of stroke among japanese. Stroke 32(4): 903-908. Ormel J. & Von Korff M. (2000). Synchrony of change in depression and disability. Arch Gen Psychiatry 57: 381-382. Ostir G. V., Goodwin J. S., Markides K. S., Ottenbacher K. J., Balfour J. & Guralnik J. M. (2002). Differential Effects of Premorbid Physical and Emotional Health on Recovery from Acute Events. Journal of the American Geriatrics Society 50(4): 713. Pang S. M. & Wong T. K. (1998). Predicting pressure sore risk with the Norton, Braden, and Waterloo scales in a Hong Kong rehabilitation hospital. Nursing Research 47: 147-153. Paradiso S. & Robinson R. G. (1998). Gender differences in poststroke depression. Journal of Neuropsychiatry and Clinical Neurosciences 10(1): 41-47. 196 Parikh R. M., Lipsey J. R., Robinson R. G. & Price T. R. (1988). A two year longitudinal study of poststroke mood disorders: prognostic factors related to one and two year outcome. International Journal of Psychiatry in Medicine 18(1): 45-56. Parikh R. M., Robinson R. G., Lipsey J. R., Starkstein S. E., Fedoroff J. P. & Price T. R. (1990). The impact of poststroke depression on recovery in activities of daily living over a 2-year follow-up. Archives of Neurology 47(7): 785-789. Patel V., Abas M. A., Broadhead J., Todd C. & Reeler A. (2001). Depression in developing countries: lessons from Zimbabwe. British Medical Journal 322: 482-484. Perry L. & McLaren S. (2004). An exploration of nutrition and eating disabilities in relation to quality of life at 6 months post-stroke. Health and Social Care in the Community 12(4): 288-297. Peveler R., Carson A. & Rodin G. (2002). ABC of psychological medicine: Depression in medical patients. BMJ 325(7356): 149-152. Piamarta F., Iurlaro S., Isella V., Atzeni L., Grimaldi M., Russo A., Forapani E. & Appollonio I. (2004). Unconventional affective symptoms and executive functions after stroke in the elderly. Archives of Gerontology & Geriatrics Supplement (9): 315-323. Pohjasvaara T., Erkinjuntti T., Vataja R. & Kaste M. (1997). Dementia Three Months After Stroke: Baseline Frequency and Effect of Different Definitions of Dementia in the Helsinki Stroke Aging Memory Study (SAM) Cohort. Stroke 28(4): 785-792. Pohjasvaara T., Vataja R., Leppavuori A., Kaste M. & Erkinjuntti T. (2001). Suicidal ideas in stroke patients 3 and 15 months after stroke. Cerebrovascular Diseases 12(1): 21-26. Pohjasvaara T., Vataja R., Leppavuori A., Kaste M. & Erkinjuntti T. (2002). Cognitive functions and depression as predictors of poor outcome 15 months after stroke. Cerebrovascular Diseases 14(3-4): 228-233. Polit D. F. & Beck C.T. (2004). Nursing Research: Principles and Methods. 7th. Philadelphia, Lippincott Williams & Wilkins. Popovich J. M., Fox P. G. & Burns K. R. (2002). The impact of depression on stroke recovery in the U.S. International Journal of Psychiatric Nursing Research 7(3): 842-855. Primeau F. (1988). Post-stroke depression: a critical review of the literature. Canadian Journal of Psychiatry - Revue Canadienne de Psychiatrie 33(8): 757-765. Provinciali L. & Coccia M. (2002). Post-stroke and vascular depression: a critical review. Neurological Sciences 22(6): 417-428. Pulska T., Pahkala K., Laippala P. & Kivela S.-L. (1999). Follow up study of longstanding depression as predictor of mortality in elderly people living in the community. British Medical Journal 318(7181): 432. Radloff L. S. (1977). The CES-D Scale: A self-reported depression scale for research in the general population. Applied Psychological Measurement 1: 385-401. Rankin J. (1957). Cerebral vascular accidents in patients over the age of 60, II: prognosis. Scottish Medical Journal 2: 200-215. Rao R. (2001). Review: the location of stroke is not associated with the risk of depression. Evidence-Based Mental Health 4 (1): 27. 197 Rao R., Jackson S. & Howard R. (2001). Depression in older people with mild stroke, carotid stenosis and peripheral vascular disease: a comparison with healthy controls. International Journal of Geriatric Psychiatry 16(2): 175-183. Rapp S. R., Walsh D. A., Parisi S. A. & Wallace C. E. (1988). Detecting depression in elderly medical inpatients. J Consult Clin Psycho 56: 509-513. Remer-Osborn J. (1998). Psychological, behavioral, and environmental influences on post-stroke recovery. Topics in Stroke Rehabilitation 5(2): 45-53. Robain G., Chennevelle J. M., Petit F. & Piera J. B. (2002). Incidence of constipation after recent vascular hemiplegia: prospective cohort of 152 patients. Revue Neurologique 158: 589-592. Robinson-Smith G. (2004). Verbal indicators of depression in conversations with stroke survivors. Perspectives in Psychiatric Care 40(2): 61-69. Robinson R. G. (1997). Neuropsychiatric consequences of stroke. Annual Review of Medicine 48: 217-229. Robinson R. G., Lipsey J. R. & Price T. R. (1985). Diagnosis and clinical management of post-stroke depression. Psychosomatics 26(10): 769-778. Robinson R. G., Morris P. L. & Fedoroff J. P. (1990). Depression and cerebrovascular disease. Journal of Clinical Psychiatry 51: 26-31. Robinson R. G., Morris, P. L., Fedoroff, J. P. (1990). Depression and cerebrovascular disease. Journal of Clinical Psychiatry 51(26-31.): Robinson R. G., Murata Y. & Shimoda K. (1999). Depression: dimensions of social impairment and their effect on depression and recovery following stroke. International Psychogeriatrics 11(4): 375-384. Robinson R. G. & Starkstein S. E. (1990). Current research in affective disorders following stroke. Journal of Neuropsychiatry and Clinical Neurosciences 2(1): 1-14. Rootman I. & Ronson B. (2005). Literacy and health research in Canada: where have we been and where should we go? Canadian J or Public Health 2(Supp): 62-77. Royal College of physicians of London and the British Geriatrics Society. (1992). A report of joint workshops of the Research Unit of the Royal College of Physicians and the British Geriatrics Society- Standardized assessment scales for elderly people. Royal College of physicians of London and the British Geriatrics Society., London. Sackett D. L., Haynes, R. B., Guyatt, G. H., Tugwell, P. (1991). Clinical epidemiology: a A basic science for clinical medicine. 2nd. Boston, Little, Brown and Company. Schreiner A. S., Morimoto T. & Asano H. (2001). Depressive symptoms among poststroke patients in Japan: frequency distribution and factor structure of the GDS. International Journal of Geriatric Psychiatry 16(10): 941-949. Schubert D. S., Taylor C., Lee S., Mentari A. & Tamaklo W. (1992a). Detection of depression in the stroke patient. Psychosomatics 33(3): 290-294. Schubert D. S., Burns R., Paras W. & Sioson E. (1992b). Increase of medical hospital length of stay by depression in stroke and amputation patients: a pilot study. Psychotherapy and Psychosomatics 57(1-2): 61-66. Scott J., Thorne A. & Horn P. (2002). Quality improvement report: Effect of a multifaceted approach to detecting and managing depression in primary care. BMJ 325(7370): 951-954. 198 Sembi S., Tarrier N., O'Neill P., Burns A. & Faragher B. (1998). Does post-traumatic stress disorder occur after stroke: a preliminary study. International Journal of Geriatric Psychiatry 13(5): 315-322. Sheikh J. I. & Yesavage J. A. (1986). Geriatric Depression Scale (GDS) Recent evidence and development of a shorter version. In T.L. Brink (ed.), Clinical Gerontology: A guide to assessment and intervention (pp. 165-173). New York, Harworth Press. Singh A., Black S. E., Herrmann N., Leibovitch F. S., Ebert P. L., Lawrence J. & Szalai J. P. (2000). Functional and neuroanatomic correlations in poststroke depression: the Sunnybrook Stroke Study. Stroke 31(3): 637-644. Social Welfare Department. (2003). Social financial assistance schemes: comprehensive social security assistance scheme, disability allowance. Retrieved at <http://www.info.gov.hk/swd/html_eng/ser_sec/soc_secu/main.html> Last Modified Date: 31-Jul-2003. Sonde L. & Viitanen M. (2001). Length of hospital stay, functional independence and life satisfaction after stroke. International Journal of Rehabilitation Research 24(1): 73-78. Song X. & Chi I. (2001). The role of social support in the relationship between physical health strain and depression of elderly Chinese. In Chi, I., Chappell, N. L., Lubben, J. (Eds.). Elderly Chinese in Pacific Rim Countries. Social Support and Integration. Hong Kong, Hong Kong University Press. Ch.13. Spalletta G., Guida G. & Caltagirone C. (2003). Is left stroke a risk-factor for selective serotonin reuptake inhibitor antidepressant treatment resistance? Journal of Neurology 250(4): 449-455. Strawbridge W. J., Deleger S., Roberts R. E. & Kaplan G. A. (2002). Physical activity reduces the risk of subsequent depression for older adults. American Journal of Epidemiology 15: 328-334. Streubert H. J. & Carpenter D. R. (1999). Qualitative research in nursing: Advancing the humanistic imperative. 2nd. Philadephia, Lippincott. Strock M. (2000). Plain Talk about Depression. National Institute of Mental Health Publication (NIH Publication No. 00-3561). Strommel M. & Wills C. E. (2004). Clincial research: concepts and principles for advanced practice nurses. Philadephia, Lippincott Williams and Wilkins. Sudore R. L., Mehta K. M., Simonsick E. M., Harris T. B., Newman A. B., Satterfield S., Rosano C., Rooks R. N., Rubin S. M., Ayonayon H. N. & Yaffe K. (2006). Limited literacy in older people and disparities in health and healthcare access. Journal of the American Geriatrics Society (5): 770-776. Suenkeler I. H., Nowak M., Misselwitz B., Kugler C., Schreiber W., Oertel W. H. & Back T. (2002). Timecourse of health-related quality of life as determined 3, 6 and 12 months after stroke. Relationship to neurological deficit, disability and depression. Journal of Neurology 249(9): 1160-1167. Swartzman L. C., Gibson M. C. & Armstrong T. L. (1998). Psychosocial considerations in adjustment to stroke. Physical Medicine and Rehabilitation: State of the Art Reviews 12(3): 519-541. 199 Tang W. K., Chan S. S., Chiu H. F., Ungvari G. S., Wong K. S., Kwok T. C., Mok V., Wong K. T., Richards P. S. & Ahuja A. T. (2005). Poststroke depression in Chinese patients: frequency, psychosocial, clinical, and radiological determinants. Journal of Geriatric Psychiatry and Neurology 18(1): 45-51. Tang W. K., Ungvari G. S., Chiu H. F., Sze K. H., Yu A. C. & Leung T. L. (2004). Screening post-stroke depression in Chinese older adults using the hospital anxiety and depression scale. Aging & Mental Health 8(5): 397-399. Tateno A., Kimura M. & Robinson R. G. (2002). Phenomenological characteristics of poststroke depression: early- versus late-onset. American Journal of Psychiatry 10(5): 575-582. The Royal College of Physicians London and The British Geriatrics Society. (1992). Standardised Assessment Scales for Elderly People. Thomas S. A. & Lincoln N. B. (2006). Factors relating to depression after stroke. British Journal of Clinical Psychology 45(Part 1): 49-61. Tiemeier H., Bakker S. L. M., Hofman A., Koudstaal P. J. & Breteler M. M. B. (2002). Cerebral haemodynamics and depression in the elderly. Journal of Neurology, Neurosurgery and Psychiatry 73(1): 34-39. Tompkins C. A., Schulz R. & Rau M. T. (1988). Post-stroke depression in primary support persons: predicting those at risk. Journal of Consulting and Clinical Psychology 56(4): 502-508. Toso V., Gandolfo C., Paolucci S., Provinciali L., Torta R., Grassivaro N. & Destro Study Group. (2004). Post-stroke depression: research methodology of a large multiCenter observational study (DESTRO). Neurological Sciences 25(3): 138-144. Triola M. M. & Triola M. F. (2006). Biostatistics. Boston, Pearson, Addison Wesley. Tsang S. (2004). A modern history of Hong Kong, 1841-1997. Hong Kong, Hong Kong University Press. Tsoi T. H. (2004). Acute Stroke Care in Hong Kong. Hong Kong Medical Journal 10(Supp l1): 34. Tung M. (1991). Insight-oriented psychotherapy and the Chinese patient. American Journal of Orthopsychiatry 61: 186-194. Turner-Stokes L. & Hassan N. (2002). Depression after stroke: a review of the evidence base to inform the development of an integrated care pathway. Part 1: diagnosis, frequency and impact. Clinical Rehabilitation 16(3): 231-247. Vahabi M. (2007). Impact of health communication on health-related decision making - a review of evidence. Health Education 107(1): 27-41. Vataja R., Leppavuori A., Pohjasvaara T., Mantyla R., Aronen H. J., Salonen O., Kaste M. & Erkinjuntti T. (2004). Poststroke depression and lesion location revisited. Journal of Neuropsychiatry and Clinical Neurosciences 16(2): 156-162. Vinkers D. J., Gussekloo J., Stek M. L., Westendorp R. G. J. & van der Mast R. C. (2004). Temporal relation between depression and cognitive impairment in old age: prospective population based study. BMJ 329(7471): 881-884. Wang J. (2001). Prevalence and correlateds of depressive symtoms in the elderly of rural communities in southern Taiwan. Journal of Nursing Reasearch (China) 9(3): 1-12. Watkins C., Daniels L., Jack C., Dickinson H. & van den Broek M. (2001). Accuracy of a single question in screening for depression in a cohort of patients after stroke: comparative study. BMJ 323(7322): 1159. 200 Weimar C., Kurth T., Kraywinkel K., Wagner M., Busse O., Haberl R. L. & Diener H.-C. (2002). Assessment of functioning and disability after ischemic stroke. Stroke 33(8): 2053. Whyte E. M. & Mulsant B. H. (2002). Post stroke depression: epidemiology, pathophysiology, and biological treatment. Biological Psychiatry 52(3): 253-264. Whyte E. M., Mulsant B. H., Vanderbilt J., Dodge H. H. & Ganguli M. (2004). Depression after stroke: a prospective epidemiological study. Journal of the American Geriatrics Society 52(5): 774-778. Williams L. S., Ghose S. S. & Swindle R. W. (2004). Depression and other mental health diagnoses increase mortality risk after ischemic stroke. American Journal of Psychiatry 161(6): 1090-1095. Wilson F. L., Racine E., Tekieli V. & Williams B. (2003). Literacy, readability and cultural barriers: critical factors to consider when educating older African Americans about anticogngulation thrapy. Journal of Clinical Nursing 12: 275-282. Woo J., Ho S. C., Lau J., Yuen Y. K., Chiu H., Lee H. C. & Chi I. (1994). The prevalence of depressive symptoms and predisposing factors in an elderly Chinese population. Acta Psychiatrica Scandinavica 89: 8-13. Yen H. L. & Chan W. (2003). An East-West approach to the management of central post-stroke pain. Cerebrovascular Diseases 16(1): 27-30. Yip P. S. E., Chi I. & Yu K. K. (1998). An epidemiological profile of elderly suicides in Hong Kong. International Journal of Geriatric Psychiatry 13(9): 631-637. Young K. P. H. (1995). Understanding marriage: A Hong Kong case study. Hong Kong, Hong Kong University Press. Yu Y. L., Fong, J.K.Y., Ho, S.L., Cheung, R.T.F. (2003). Neurology in Practice. 3rd. ed. Hong Kong, Hong Kong University Press. Zalewski C., Keller B., Bowers C., Miske P. & Gradman T. (1994). Depressive symptomatology and post-stroke rehabilitation outcome. Clinical Gerontologist 14(4): 62-67. Zung W. W. K. (1965). A self-rating depression scale. Archives of General Psychology 12: 63-70. Zunzunegui M. V., Beland F., Llzcer A. & Leon V. (1998). Gender differences in depressive symptoms among Spanish elderly. Social Psychiatry and Psychiatric Epidemiology 33(5): 195. 201 Appendices Appendix 2.1 Timetable for the research project Appendix 2.2 DAS consent form Appendix 2.3 Interview guide for psychogeriatrician Appendix 2.4 1M questionnaire Appendix 2.5 6M questionnaire Appendix 2.6 Comparison of age and gender between two target hospitals Appendix 3.1 Bio-chemical status of participants at 1M after stroke admission Appendix 3.2 Individual item score in DSM at 1M and 6M Appendix 3.3 Individual item score in GDS at 1M and 6M Appendix 3.4 Individual item score in CESD at 1M and 6M Appendix 3.5 Correlation of risk factors with GDS at 1M and 6M Appendix 3.6 Correlation of risk factors with CESD at 1M and 6M 202 Appendix 2.1 Timetable for the research project Research tasks Duration (Wks) Period 4 Nov 03 12 Nov 03 - Jan 04 Pilot Phase Preparation of proposal and consultation with supervisors Literature review Set questionnaire Pilot testing of questionnaire Revision of questionnaire 6 6 2 Second pilot testing of questionnaire 4 Final revision of questionnaire 2 Application of ethics approval for study from hospitals Liaison with hospital for study arrangement (time, place, person, material) Jan 04 - May 04 26 Nov 03 - Apr 04 20 Dec 03 - Apr 04 56 Apr 04 - Mar 05 56 May 04 - May 05 52 May 04 - May 05 56 May 04 - May 05 52 Jun 04 - May 05 12 Jul 04 - Sep 04 26 Oct 04 - Mar 05 16 Dec 04 - Mar 05 2 Sep 04 2 Sep 04 8 Oct 04 - Nov 04 26 Oct 04 - Mar 05 36 Nov 04 - Jul 05 2 Aug 05 26 Jun 05 - Nov 05 12 Dec 05 - Feb 06 26 May 06 - Nov 0 6 8 Nov 06 - Dec 06 2 Dec 05 at wards, record office, clinics First month (1M) interview Case screening and recording exclusion list Obtain consent from potential subjects Affirmation of follow up date Retreival of clinical information and data entry Undertaking interview at 1M Data management-entry, checking, cleaning, analysis Writing interim report and prepare the first paper Presentation in media, seminars and conference Six month (6M) interview Set FU questionnaire Pilot testing of FU questionnaire Record study for missing data at 1M, trace FU details Phone confirmation for 6-month follow-up Undertaking interview after 6M (clinics, home, age home, hospitals) Retreival of records after 6M interview to check mood status and use of drugs Update literature review Data management for 6M data Prepare the second and third papers Presentation in seminars Validation study with psychogeriatrician Prepare and pilot the consultation form 203 Arrange travel of patients and scheduling of consultation Data management for consultation form 26 Dec 05 - May 06 12 Apr 05 - Jun 06 8 Jul 06 - Aug 06 12 Jun 06 - Aug 06 12 Sep 06 - Nov 06 2 Dec 06 26 Dec 06 - May 07 8 Jun 07 - Oct 07 4 Nov 07 Thesis write-up Record retrieval for final checking of missing data Data management Revision of submitted papers Consultation with statistician for data analysis and presentation Draft an outline for the write up & submit the first draft by May 07 Second draft submission Thesis (final) submission 204 Appendix 2.2 DAS consent form 205 206 207 208 209 210 211 212 213 214 215 216 217 218 219 220 221 Appendix 3.1 Bio-chemical status of participants at 1M after stroke admission n Mean (Al-Shahi) Min-Max 195 5.3 (1.4) 1.0-9.6 202 7.1 (2.8) 1.1-18.6 177 1.5 (1.1) 0.5-8.1 79 1.2 (0.6) 0.8-4.0 197 3.5 (1.0) 0.9-6.8 123 1.3 (0.3) 0.5-2.3 203 149.6 (25.3) 100-233 202 80.0 (13.8) 47-128 Blood result Total Cholesterol level Fasting blood sugar level Triglyceride level INR Low Density Lipoprotein level High Density Lipoprotein level Systolic BP Diastolic BP Drug prescription, n (%) Aspirin Anticoagulant Statin Anti-hypertensive drug Diabetic drug Others (e.g. antibiotic, PPI) 180 (84.9) 47 (22.2) 139 (65.6) 104 (49.1) 57 (26.9) 148 (69.8) 222 Appendix 3.2 Individual item score in DSM at 1M and 6M Proportion reported ‘Yes’ z Depressed mood most of the day or nearly everyday z Marked decrease in interest or pleasure in all or almost all basic living most of the day or nearly everyday z Increase or loss in appetite or body weight more than 5 percent z Insomnia or hypersomnia nearly everyday z Psychomotor retardation or agitation nearly everyday z Fatigue or loss of energy nearly everyday z Feelings of worthlessness or excessive or inappropriate guilt z Diminished ability to think or concentrate or indecisiveness nearly everyday z Recurrent thoughts of death or suicidal thoughts or suicidal plans or attempts or commit suicide 1-Month (n=214) 6-Month (n=188) n % n % 77 36.0 42 19.6 40 18.7 17 7.9 35 16.4 14 6.5 66 30.8 35 16.4 77 36.0 52 24.3 100 46.7 74 34.6 82 38.3 55 25.7 47 22.0 10 4.7 52 24.3 23 10.7 223 Appendix 3.3 Individual item score in GDS at 1M and 6M Proportion reported ‘Yes’ GDS 1 Basically satisfied with life GDS 2 Dropped many of activities and interest GDS 3 Feel that life is empty GDS 4 Often get bored GDS 5 In good spirit most of the time GDS 6 Afraid that something bad is going to happen GDS 7 Feel happy most of the time GDS 8 Often feel helpless GDS 9 Prefer to stay at home rather than going out and doing new things GDS 10 Feel having more problems with memory than most GDS 11 Think it is wonderful to be alive now GDS 12 Feel pretty worthless the way you are now GDS 13 Feel full of energy GDS 14 Feel that your situation is hopeless GDS 15 Think that most people are better off than you are 1-Month (n=214) 6-Month (n=188) n % n % 50 23.4 28 14.9 121 56.5 64 34.0 56 26.2 28 14.9 100 46.7 69 36.7 87 40.7 56 29.8 64 29.9 33 17.6 88 41.1 49 26.1 63 29.4 42 22.3 67 31.3 27 14.4 48 22.4 23 12.2 48 22.4 29 15.4 91 42.5 47 25.0 107 50.0 61 32.4 64 29.9 39 20.7 52 24.3 22 11.7 224 Appendix 3.4 Individual item score in CESD at 1M and 6M Proportion reported ‘Yes with 1, 2, 3’ CESD 1 I was bothered by things that usually don’t 1-Month (n=214) 1 2 3 CESD 2 I felt depressed 1 2 3 CESD 3 I felt fearful 1 2 3 CESD 4 My sleep was restless 1 2 3 CESD 5 I could not get going 1 2 3 CESD 6 I felt that thing I did was an effort 1 2 3 CESD 7 I felt lonely 1 2 3 CESD 8 I had trouble keeping my mind on what I was doing 1 2 3 CESD 9 I felt trouble about the future 1 2 3 CESD 10 I was happy 1 2 3 6-Month (n=188) N % N % 26 12.1 49 26.1 15 7.0 19 10.1 37 17.3 10 5.3 25 11.7 51 27.1 32 15.0 31 16.5 38 17.8 12 6.4 25 11.7 33 17.6 10 4.7 17 9.0 25 11.7 8 4.3 38 17.8 51 27.1 20 9.3 19 10.1 34 15.9 14 7.4 38 17.8 38 20.2 20 9.3 18 9.6 21 9.8 4 2.1 35 16.4 59 31.4 34 15.9 31 16.5 47 22.0 13 6.9 34 15.9 29 15.4 19 8.9 21 11.2 28 13.1 20 10.6 41 19.2 17 9.0 16 7.5 8 4.3 12 5.6 2 1.1 50 23.4 34 18.1 18 8.4 18 9.6 37 17.3 21 11.2 56 26.2 58 30.9 33 15.4 28 14.9 50 23.4 18 9.6 0=Rarely or none of the time; 1=Some or a little of the time 1 to 2 days a week; 2=Occasionally or a moderate amount of the time 3 to 4 days a week; 3=Most or all the time 5 to 7 days a week 225 Appendix 3.5 Correlation of risk factors with GDS at 1M and 6M 1M 6M r r Physical domain BADL sum score (0-20) a -0.497*** -0.428*** -0.546*** -- 0.439*** 0.518*** headache (0-3) 0.288*** 0.169* stomach pain (0-3) 0.168* joint pain (0-3) 0.153* Norton Scale of pressure sore sum score (5-20) Modified Rankin Scale for Quality of Life (0-5) b Level of disturbance due to non-specific muscle pain (0-3) 0.196** 0.265*** dizziness (0-3) 0.210** 0.151* constipation (0-3) 0.204** 0.205** other specific health problems (0-3) Total number of body symptoms (0-10) 0.172* c 0.290*** 0.364*** -0.307*** -0.419*** Cognitive and Communicative domain Sum score Abbreviated Mental Test d Expressive aphasia (0-3) 0.219** Global aphasia (0-3) 0.170* Dysarthria (0-3) 0.233*** Swallowing problems (0-3) 0.145* Visual acuity problems (0-3) 0.232*** 0.221** Memory problems (0-3) 0.204** 0.145* 226 1M 6M r r Emotional domain Perceived current health status (1M=1-5; 6M=1-3) 0.433*** 0.541*** Level of worry about current health (0-3) 0.502*** -- a pleasant facial expression (0-3) -0.415*** -0.510*** a flat/average facial expression (0-3) 0.288*** 0.229** 0.478*** 0.600*** Reported depression (0-1) 0.362*** -- Reported worry (0-1) 0.203** -- Reported panic (0-1) 0.156* -- Reported anxiety (0-1) 0.149* -- Reported agitation (0-1) 0.171* -- 0.294*** 0.216** stroke rehabilitation progress (0-3) 0.483*** 0.344*** financial problem (0-3) 0.279*** 0.210** bodily pain and discomforts (0-3) 0.305*** 0.259*** poor family relationship (0-3) 0.214** Days in the last week with an upset facial expression or cry (0-3) Types of emotions dissipated during hospitalization e Level of disturbance due to anxiety (0-3) Worries over losing job/loss of job (0-3) 0.211** f 0.500*** 0.515*** Finding someone to chat (0-3) 0.057 -- Going for a walk (0-3) -0.083 -- Having exercise (0-3) 0.105 -- -- -0.334*** -- -0.049 -- -0.232** -- -0.343*** Total number of worries Social support domain Usefulness of means to relieve unhappiness at one month Sum score of Lubben social network scale (LSNS) at six month Subtotal score of LSNS on family Subtotal score of LSNS on relatives Subtotal score of LSNS on confidant a-f Spearman's rho test was used Pearson correlation test was used * Significant at <0.05 ** Significant at <0.01 *** Significant at <0.001 227 Appendix 3.6 Correlation of risk factors with CESD at 1M and 6M 1M 6M r r Physical domain BADL sum score (0-20) a -0.475*** -0.382*** -0.506*** -- 0.426*** 0.443*** headache (0-3) 0.275*** 0.202** stomach pain (0-3) 0.168* 0.159* joint pain (0-3) 0.153* 0.251*** Norton Scale of pressure sore sum score (5-20) Modified Rankin Scale for Quality of Life (0-5) b Level of disturbance due to low back pain (0-3) 0.161* non-specific muscle pain (0-3) 0.243*** dizziness (0-3) 0.229*** 0.248*** constipation (0-3) 0.184** 0.232** other specific health problems (0-3) Total number of body symptoms (0-10) 0.144* c 0.281*** 0.412*** -0.327*** -0.371*** Expressive aphasia (0-3) 0.147* 0.150* Global aphasia (0-3) 0.145* Dysarthria (0-3) 0.195** Visual acuity problems (0-3) 0.286*** Memory problems (0-3) 0.141* Cognitive and Communicative domain Sum score Abbreviated Mental Test d 0.218** 228 1M 6M r r Emotional domain Perceived current health status (1M=1-5; 6M=1-3) 0.388*** 0.535*** Level of worry about current health (0-3) 0.563*** -- a pleasant facial expression (0-3) -0.405*** -0.496*** a flat/average facial expression (0-3) 0.305*** 0.215** 0.568*** 0.561*** Reported depression (0-1) 0.426*** -- Reported worry (0-1) 0.213** -- Reported panic (0-1) 0.189** -- Reported anxiety (0-1) 0.112 -- Reported agitation (0-1) 0.179** -- 0.338*** 0.277*** stroke rehabilitation progress (0-3) 0.511*** 0.333*** financial problem (0-3) 0.217** 0.238** bodily pain and discomforts (0-3) 0.318*** 0.281*** disease deterioration (0-3) 0.368*** poor family relationship (0-3) 0.162* Days in the last week with an upset facial expression or cry (0-3) Types of emotions dissipated during hospitalization e Level of disturbance due to anxiety 0 to 3 Worries over losing job/loss of job (0-3) 0.234** other things (0-3) Total number of worries 0.204** f 0.460*** 0.549*** Finding someone to chat (0-3) 0.113 -- Going for a walk (0-3) -0.067 -- Having exercise (0-3) 0.179** -- -- -0.325*** -- -0.088 -- -0.233** -- -0.287*** Social support domain Usefulness of means to relieve unhappiness at one month Sum score of Lubben social network scale (LSNS) at six months Subtotal score of LSNS on family Subtotal score of LSNS on relatives Subtotal score of LSNS on confidant a-f Spearman's rho test was used Pearson correlation test was used * Significant at <0.05 ** Significant at <0.01 *** Significant at <0.001 229


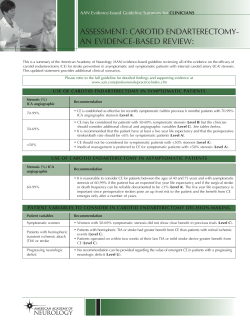


© Copyright 2026