
Annual Plan and Budget, 2014-15
YOUR COUNCIL Lord Mayor Robert Doyle Deputy Lord Mayor Susan Riley Councillors Richard Foster Rohan Leppert Kevin Louey Stephen Mayne Cathy Oke Ken Ong Beverley Pinder-Mortimer Jackie Watts Arron Wood 2 TABLE OF CONTENTS YOUR COUNCIL .......................................................................................................................................................... 2 OVERVIEW ................................................................................................................................................................... 7 1. EXECUTIVE SUMMARY ...................................................................................................................................... 7 2. BUDGET PROCESS OVERVIEW ......................................................................................................................13 3. HIGHLIGHTS ......................................................................................................................................................16 4. SERVICES, INITIATIVES AND SERVICE PERFORMANCE INDICATORS .....................................................22 BUDGET ANALYSIS ..................................................................................................................................................43 5. ANALYSIS OF OPERATING BUDGET ..............................................................................................................43 6. ANALYSIS OF BUDGETED CASH POSITION ..................................................................................................50 7. ANALYSIS OF COUNCIL WORKS (INCLUDING MAINTENANCE) ..................................................................53 8. ANALYSIS OF BUDGETED FINANCIAL POSITION .........................................................................................57 9. STRATEGIC RESOURCE PLAN 2014-2018 .....................................................................................................60 10. VALUATION........................................................................................................................................................63 11. INVESTMENT STRATEGY ................................................................................................................................66 APPENDICES A. BUDGET STATEMENTS………………………………………………………………………………………….. 70 B. STATUTORY DISCLOSURES…………………………………………………………………………….......... 77 C. STRATEGIC RESOURCE PLAN 2014-18……………………………………………………………………... 80 D. KEY FINANCIAL INDICATORS…………………………………………………………………………………. 88 E. COUNCIL WORKS PROGRAM 2014-15……………………………………………………………………… 89 F. SCHEDULE OF FEES AND CHARGES……………………………………………………………………….. 96 G. SCHEDULE OF GRANTS AND CONTRIBUTIONS………………………………………………………….. 146 H. DOCKLANDS INCOME STATEMENT…………………………………………………………………………. 147 I. PUBLIC NOTICE – ANNUAL PLAN AND BUDGET………………………………………………………….. 148 J PUBLIC NOTICE – INTENTION TO DECLARE A DIFFERENTIAL RATE…………………………………. 149 K. PROPERTY LEASE REGISTER…………………………………………………………………………..……. 151 L. GLOSSARY OF TERMS………………………………………………………………………………..……….. 158 3 4 5 6 OVERVIEW 1. EXECUTIVE SUMMARY The 2014-15 Annual Plan and Budget is the second year of Council’s 2013-2017 Council Plan. Through this plan the Council will ensure Melbourne is a vibrant inclusive place, well positioned to meet the opportunities and challenges of a growing city for decades to come. A greener, better connected Melbourne that supports and inspires its residents, workers and visitors is at the heart of the second year of Council’s four-year vision for the city to be delivered through the draft 2014-15 Annual Plan and Budget. Last year, Council unveiled its vision for a bold, inspirational and sustainable Melbourne. In 2014-15, we’re getting on with delivering on that vision with a further 116 second year initiatives as part of the four year Council Plan. The Council will complete major capital projects this year within the fully funded $99.37 million capital works program and deliver $374.41 million in services while preparing for a historical level of investment in the redevelopment of the Queen Victoria Market (QVM). In 2014-15 the QVM renewal fund will be established, followed by a QVM master plan incorporating community feedback and finally a funding and financing strategy. This budget will see the foundations of the legal and financing vehicle in place ready for a record investment by Council. This is a disciplined budget, maintaining tight fiscal control over expenditure growth. The budget delivers no reduction in services while opening new facilities and accommodating strong resident population growth of 10.5 per cent with overall costs increasing by 2.56 per cent, expected to be below inflation. The continued focus on costs in this budget builds on flat overall costs last year. During the term of this Council, cost increases have risen by 2.56 per cent over two years, well below CPI. The 2014-15 budget also provides for a fully funded capital works program without reducing cash reserves, borrowings or major asset sales. Getting on with business Completing major capital projects while delivering 116 second year initiatives as part of the Council’s four year Council Plan. Continuing to address long term challenges Planning and taking action on today’s opportunities and tomorrow’s challenges. Preparing for the renewal of QVM Implementing the legal and financial structure in preparation for what will be the largest investment in Council’s history Financial Responsibility A disciplined balanced budget that will see spending increase contained to 2.5 per cent expected to be below inflation, a fully funded capital works program without reducing cash reserves, major asset sales or borrowings and a financially sustainable Annual Plan and Budget. 7 Getting on with business Last year the Council adopted a four year Council Plan. The plan set the high level agenda over the short to medium term aimed at delivering the vision for a bold, inspirational and sustainable city. The budget will see the completion of some major community facilities including Kathleen Syme Library and Community Centre ($6.50 million). The Docklands Family Services and Boating Hub ($0.55 million) and the Kensington Town Hall ($0.64 million). These facilities will commence operations during 2014-15. The Council will also continue the rollout of the 2012-16 Bicycle Plan with a further $3.00 million investment and fund $6.96 million towards public open space. As the second year of the four year Council Plan, a total of 116 second year initiatives will be delivered and build on the achievements of last year. Refer to section four of the budget papers for further details of the 2014-15 initiatives. Continuing to address long term challenges A sustainable organisation is one that thinks and acts with a long term horizon in mind. In this budget, the Council is continuing to take action to address the City’s long term challenges and opportunities, including climate change, accommodating a growing population, taking advantage of advancements in technology and supporting a resilient local economy. In 2013, the City of Melbourne resident population recorded the highest proportional increase of any Australian Council, up 10.5 per cent, or 11,000 residents. The budget caters for the increased growth through new facilities and growth in core services. The Council will also plant 3,000 trees as part of the Urban Forest strategy and $1.00 million in flood mitigation works alongside $0.16 million to install solar array panels across five Council facility sites. Cities by their nature have significant asset bases. The City of Melbourne’s infrastructure assets including roads, footpaths, buildings, drains, parks, laneways, wharves and marinas account for over 90 per cent of total assets. Ensuring there is adequate investment annually to maintain the City’s assets is important, and therefore council is investing $42.15 million in renewal and $12.24 million in maintenance works. This regular annual investment in existing assets maintains the public amenity in the short term and protects the condition of assets for future generations. Preparing for a historical investment – renewal of the Queen Victoria Market The Queen Victoria Market is an integral part of the city, iconic and loved by Melbournians. The Council in this budget is laying the foundations for a historical investment in the renewal of the Queen Victoria Market. In 2014-15 the QVM renewal fund will be established, followed by a QVM master plan incorporating community feedback and finally a funding and financing strategy. This budget will see the foundations of the legal and financing vehicle in place ready for a record investment by Council. 8 Underpinned by Financial responsibility The 2014-15 Budget reflects decisions with long term financial sustainability in mind. Through efficiencies and targeted savings, the organisation will continue to deliver high quality services to the community with overall cost increases contained to 2.56 per cent. This is after allowing for new facilities including Docklands Library and Community Centre, Docklands Family Services and Boating Hub, Kathleen Syme Library and Community Centre, Kensington Town Hall and Fitzroy Gardens Visitor Centre and strong growth in residents. While cost containment has been essential, modest revenue increases in rates are necessary to ensure the long term financial sustainability of the city, whilst delivering the services and infrastructure required for a growing population. Rates are proposed to increase by 3.60 per cent in the budget, which is likely to be one of the lowest rate increases in Victoria. Over the term of this Council, the forward estimates as reflected in the Strategic Resource Plan forecast an underlying surplus every year, a clear commitment to financial responsibility. In 2014-15 the Council has committed to engaging the community in developing its 10 Year Financial Plan to position the City for the next decade. Council Plan (Year two initiatives) The Council Plan is the foundation on which the 2014-15 Annual Plan and Budget has been developed. In the second year of the Council Plan over 100 Initiatives have been identified and funded. They will be delivered through implementing the 2014-15 Annual Plan and Budget. The full list of initiatives is included in section 4 and provides an insight into the priorities for Council in 2014-15. Operating Result 1.1. The budget delivers an underlying surplus of $6.37 million (Appendix A) and an operating surplus of $24.60 million. 1.2. Total revenue will increase by $19.77 million from $379.10 million to $398.86. This is a 5.21 per cent increase. Full details of revenue changes are provided in Section 5. 1.3. There are no changes proposed to on street parking fees. 1.4. Fee increases in some services are a result of either mandatory rises as a result of state legislation, bringing prices in line with competitors, or moving fees closer to cost recovery and parity with other neighbouring municipalities. 1.5. Total operating expenditure will increase by 2.56 per cent or $9.35 million from $365.05 million to $374.41 million (Section 5 provides full details). This is expected to be below CPI. 1.6. The 2014-15 budget is based on a rate revenue increase of 3.60 per cent which is expected to be one of the lowest in Victoria. Rates 9 1.7. 2014-15 is a revaluation year and therefore individual rate notices will not increase by 3.6 per cent but will increase or decrease relative to changes in the property values. During a revaluation year there is a re-distribution of the rates, based on changes to property values over the past two years. 1.8. The residential rate in the dollar has decreased from 4.0591 cents to 4.0469 cents and the nonresidential rate in the dollar has decreased from 4.7744 cents to 4.5901 cents. 1.9. The total number of rateable assessments has increased from 88,077 to 94,453 which represents an increase of 7.24 per cent from 2013-14. 1.10. There are 1,415 properties which are public, educational, religious or charitable in use or ownership and which are exempt from rates. Exemptions represent 13.02 per cent of the rate base. 1.11. Council operates a Pensioner Rebate scheme by which those eligible to receive the State Government rebate receive an additional City of Melbourne rebate equivalent to 50 per cent of the State Government rebate. In 2010-11 Council approved an affordable housing rebate which will provide a rate rebate for new affordable housing of 35 per cent of full rates. This is budgeted to continue in 2014-15 at a cost through lower revenue of ($0.13 million). 1.12. The draft budget includes an amount of $0.40 million which is the estimated revenue to be derived from Cultural and Recreational Lands in the municipality (refer to section 10.2). Fire Services Property Levy 1.13. The Government has enacted the Victorian Bushfires Royal Commission’s recommendation to replace the previous insurance-based levy with a property-based levy. 1.14. The Fire Services Property Levy commenced in 2013-14 and is collected through council rates. The rate of the levy is determined by the State government on an annual basis and varies for residential, industrial, commercial and primary production properties. 1.15. Further information on the Fire Services Property Levy and the levy rates for 2014-15 is available at the following web address. http://www.firelevy.vic.gov.au/how-much-am-i-contributing.html Services and Events 1.16. The 2014-15 Annual Plan and Budget recognises Council’s pivotal role in supporting and enhancing the City’s cultural heritage, public art, events, festivals, visitor services, sport and street activity. 1.17. It continues Council's commitment to enhance the City's business competitiveness domestically and internationally. 1.18. The 2014-15 Annual Plan and Budget includes new and extended services and continues with activation of the City. The most notable examples are: 1.19. Full year of funding for the new Docklands Library and Community centre ($0.82 million) which opened in late 2013-14. 1.20. Funding for Kathleen Syme Library and Community Centre to be completed ($6.5 million) and become operational during the financial year ($0.81 million). 10 1.21. Funding for the opening of the Kensington Town Hall and Docklands Family Services and Boating Hub ($0.27 million) 1.22. $1.56 million allocated in the budget for the continuation of the Melbourne Visitor Shuttle service including additional buses during the peak cruise ship season. This is partially offset by revenue of $0.48million. 1.23. $10.68 million (excluding capital) allocated for the continuation of the City’s premier events including New Year’s Eve, Melbourne Spring Fashion Week, Moomba, Melbourne Music and Melbourne Awards. This is partially offset by revenue of $1.66 million. 1.24. $0.34 million for the continuation of Docklands Winter Activation program. 1.25. $0.18 million for an additional laneway compactor. The budget includes provision for four laneway compactors at a total operating cost of $0.58 million. 1.26. $0.03 million for a trial taxi rank in Bourke Street. 1.27. $0.19 million in operating and $0.15 million in capital to expand smoke free areas as a priority. 1.28. $0.70 million to support the Melbourne Convention and Exhibition Centre. Cash and investments 1.29. The investment portfolio is expected to provide net income of $25.09 million, representing an average return of 7.45 per cent. The investment portfolio is made up of subsidiary companies, car parks, commercial properties and cash. 1.30. The cash component returns from the portfolio assume a flat interest rate environment. 1.31. Refer to section 11 for details on Council’s investment strategy. Council Works 1.32. The total council works program is $99.37 million. This includes $40.98 million for new assets, $42.15 million for renewing and refurbishing existing assets, $4.00 million for upgrade/expansion works and $12.24 million for major maintenance and other assets not in the direct control of the City but which are used by ratepayers, residents and visitors. The estimated capital works carry forward 2013-14 program is $16.90 million. 1.33. As the city continues to grow so does the need for community infrastructure. Amongst other projects this budget includes funding for recreation infrastructure improvements for Royal and Princess Parks ($7.10 million), Kathleen Syme Library and Community Centre in Carlton ($6.50 million) and streetscape improvements and design ($4.00 million). 1.34. A $0.16 million investment to install solar panel arrays across five Council facility sites with Council’s ongoing commitment to renewable energy. 11 1.35. There is also further investment of $3.00 million towards bicycle improvement works as part of the 2012-16 Bicycle Plan. A full list of the capital works program is listed in Appendix E. 1.36. Council’s financial position is expected to remain strong with the ratio of current assets to current liabilities budgeted at 1.15:1 and total net assets of $3.65 billion at the end of 2014-15. Financial Sustainability The Strategic Resource Plan (SRP) has been updated and for the financial years 2014-15 to 2017-18. The SRP has been developed to assist Council in adopting the budget within a longer term financial framework. The key objective of the SRP is financial sustainability in the medium to long term, whilst still achieving the Council’s strategic objectives as specified in the Council Plan. In 2014-15, Council will engage with the community on a ten year financial plan. 12 2. BUDGET PROCESS OVERVIEW 2.1. Integrated Planning Framework The City of Melbourne has an Integrated Planning Framework that aligns operational, corporate and strategic plans to achieve sustainable improvements for the city and its people. The framework includes long, medium and short terms plans that set direction for everything we do. 13 The Annual Plan and Budget forms an important part of Council’s Integrated Planning Framework. The framework ensures that the Annual Plan and Budget are developed in response to Council Plan priorities and within the constraints of the Strategic Resource Plan which provides the financial parameters for the four year period of Council Plan. The framework includes reports to monitor the implementation of our plans. Monthly and quarterly reports enable the management team and Council to closely monitor the organisations progress towards goals. The Annual Report, including audited financial statements, is our report to the community on our performance during the year. 2.2. Budget Preparation Under the Act, Council is required to prepare and adopt an annual budget for each financial year. The budget is required to include certain information about the rates and charges that Council intends to levy as well as a range of other information required by the Local Government (Finance and Reporting) Regulations 2004 (‘the Regulations’). The first step in the budget process is for the Administration to prepare the annual budget in accordance with the Act and submit the “proposed” budget to Council for approval “in principle”. Council is then required to give “public notice” that it intends to “adopt” the budget. It must give 28 days’ notice of its intention to adopt the proposed budget and make the budget available for inspection at its offices. A person has a right to make a submission on any proposal contained in the budget and any submission must be considered before adoption of the budget by Council. The final step is for Council to adopt the budget after receiving and considering any submissions from interested parties. The budget is required to be adopted and a copy submitted to the Minister by 31 August each year. The 2014-15 Annual Plan and Budget which is included in this report is for the year 1 July 2014 to 30 June 2015 and is prepared in accordance with the Act and Regulations. The budget includes financial statements. These include Income Statement, Balance Sheet, Cash Flows, Capital Works Program, Statement of Equity and Statement of Human Resources. These statements have been prepared for the year ended 30 June 2015 in accordance with Australian Accounting Standards and in accordance with the Act and Regulations. The 2014-15 Annual Plan and Budget includes Services and Initiatives including Major Initiatives and reflects the priorities for Council in year two. It also includes detailed information about the rates and charges to be levied, the capital works program to be undertaken and other financial information, which Council requires in order to make an informed decision about the adoption of the budget. 2.3. Budget Process The key dates for the budget process are summarised below: 14 Budget submitted to Council for approval in principle 8 May 2014 Public notice advising intention to adopt budget 9 May 2014 Budget available for public inspection and comment 9 May 2014 Submissions period closes 6 June 2014 Submissions considered by Committee 19 June 2014 Budget and submissions presented to Council for Adoption 24 June 2014 Copy of adopted budget submitted to the Minister by 31 August 2014 2.4. Budget Influences The Annual Plan and Budget is premised on a number of influences and assumptions, which are likely to impact on the delivery of services provided by Council. The most significant of these factors include: • an increase in rates of 3.60 per cent; • Reserve Bank official cash rate 2.5 per cent; and • Consumer Price Index between 2.5 – 3.0 per cent. 2.5. Budget Statements The Melbourne City Council Budget is comprised of seven primary financial statements which are: • the Income Statement • the Statement of Cash Flow • the Balance Sheet • the Statement of Human Resources • the Statement of Equity • the Statement of Capital Works • the Summary of Planned Human Resources Expenditure. The Income Statement is an accrual-based statement prepared in accordance with Australian Accounting Standards and generally adopted accounting principles. It includes non-cash items such as depreciation charges 15 but does not include capital items such as capital works funding. The Income Statement provides for a projected surplus of $24.60 million that will contribute towards the Capital Works program. The Statement of Cash Flow is a cash statement prepared in accordance with Australian Accounting Standards. The Statement of Cash Flow provides for a projected inflow of $1.79 million. The Balance Sheet is a representation of the Assets and Liabilities of the Council as at the year ending June 2015. For the purposes of clarity a reconciliation between the Income Statement and the Statement of Cash flow is provided in Section 6. The statement of Human Resources is a statement which is a representation of council staff expenditure and numbers. The statement of Changes in Equity is a statement which is a representation of accumulated surplus, revaluation reserve and other reserve movements at 30 June each financial year. The Statement of Capital Works has been included in accordance with the Local Government Regulations. This statement sets out all the expected capital expenditure in relation to non-current assets for the year. It categorises capital works expenditure into renewal of assets, upgrading of assets, or creating new assets. Each of these categories has a different impact on Council’s future costs. Refer to section 7 ‘Analysis of council works budget’ for further details. The summary of planned Human Resources expenditure represents permanent council staff expenditure and numbers of full time equivalent council staff categorised according to the organisational structure. 3. HIGHLIGHTS This section summarises the budget, more detail can be found in sections 5-8. The summary looks at the four key areas of: • Operating Budget • Cash Flow Budget • Council Works Budget • Council Services 16 3.1. Operating Budget Operating Revenue (excluding capital contributions) Expenditure Sub totals Capital Contributions Revenue Operating surplus/(deficit) Budget 2013-14 $000s Budget 2014-15 $000s Variance $000s 366,153 (365,053) 1,100 380,770 (374,405) 6,365 14,617 (9,352) 5,265 13,097 14,197 18,237 24,602 5,140 10,405 The Budgeted Income Statement forecasts a surplus of $24.60 million for the year ending 30 June 2015, after capital grants and contributions. As a minimum, the operating surplus should equate to the capital contributions (including the developer contributions received for Public Open Space) to ensure the contributions received for capital are available to support the capital program. The operating surplus is required to be reported but is not a true indication of an organisation’s underlying result. This is because it includes external capital contributions which are not available for operational expenditure and must be used for capital works (the purpose for which funding was received). When capital contributions are removed from the operating surplus, the underlying surplus is $6.37 million. In 2014-15 the underlying surplus of $6.37 million has been directed towards ensuring a fully funded $99.37 million capital works program and the Queen Victoria Market renewal fund. Refer to Section 5, “Analysis of Operating Budget”, for a more detailed analysis. 17 3.2. Cash Flow Budget Net Surplus/(deficit) from operations Movements affecting cash flows Budget 2013-14 $000s Budget 2014-15 $000s 14,197 59,877 24,602 62,230 10,405 2,353 Variance $000s Funds available for capital/ investments Capital Expenditure Proceeds from asset sales 74,074 (89,725) 726 86,832 (85,860) 816 12,758 3,865 90 Net Cash inflows/(outflows) (14,925) 1,788 16,713 91,200 76,275 76,275 78,063 (14,925) 1,788 Cash at beginning of year Cash at end of year The budgeted Statement of Cash Flow shows an inflow of cash of $1.79 million, outlined in the statement above. Further details of the cash flow are provided in section 6, ‘Analysis of budgeted cash position’. 3.3. Council Works Budget Council Works Area Maintenance Capital Works Carry forward capital* Capital Works Expenditure Budget 2013-14 $000s Budget 2014-15 $000s 10,399 88,225 12,238 87,133 1,839 (1,092) 24,168 122,792 16,905 116,276 (7,263) (6,516) Variance $000s The 2014-15 Budgeted Statement of Council Works forecasts total works of $99.37 million (excluding carried forward expenditure), which is an increase of $0.75 million from 2013-14. See Section 7 “Analysis of Council works budget” for a more detailed analysis. 18 3.4. Financial Position Budget Budget 2013-14 $000s Budget 2014-15 $000s Variance $000s Assets and Liabilities Net Current Assets Net Non Current Assets Net Assets 17,498 3,452,729 3,470,227 14,504 3,636,479 3,650,983 (2,994) 183,750 180,756 Equity Accumulated Surplus Reserves Total Equity 1,783,401 1,686,826 3,470,227 1,808,004 1,842,979 3,650,983 24,603 156,153 180,756 The budgeted Balance Sheet shows net assets of $3.65 billion as at 30 June 2014, which is an increase of $180.76 million over 2013-14 budget. This largely reflects an anticipated increase in infrastructure assets as a result of the capital works program and an anticipated increase from the annual revaluation of assets. See Section 8 “Analysis of Budgeted Financial Position” for more detailed analysis. 19 20 21 4. SERVICES, INITIATIVES AND SERVICE PERFORMANCE INDICATORS Annual Plan – a subset of the Budget • this year’s major and other initiatives to help achieve Council Plan Council Plan 2013–17 • Long-term goals • 4-year outcomes • 4-year priorities Annual Plan and Budget • 1-year budget • 4-year resource plan Annual Report – reporting progress against Council Plan and Annual Plan and Budget The City of Melbourne’s long-term vision, goals and four-year priorities and desired outcomes are set out in Council Plan 2013–17, including a series of indicators and measures to track progress. Each year the Council selects a series of shorter-term initiatives to further its goals, priorities and desired outcomes for Melbourne. These initiatives and major initiatives are set out here, in the Annual Plan section of the Annual Plan and Budget. Initiatives may contribute to multiple goals. we have listed them against the goal that contains priorities and desired outcomes with the strongest alignment. It is important to note these initiatives are just a part of what we do. Much of the work to achieve our aspirations for Melbourne occurs within the strategies we implement and the services we deliver. These also are listed here, under our goals, along with the outcome indicators that will be used to evaluate our performance of our services. Progress against our four-year aspirations, one-year initiatives and our service delivery is shared with the public via our Annual Report, available on-line in late September each year. 22 4.1 COUNCIL PLAN GOAL 1: A CITY FOR PEOPLE Melbourne will be accessible, inclusive, safe and engaging. Our streets, buildings and open spaces will be alive with activity. People of all ages and abilities will feel secure and empowered, freely participate in their community and lead healthy lives. We will support our citizens – whatever their age, physical ability, socio-economic status or cultural background – to feel like they can be active, healthy and valued community members. We plan and design for our growing city, including safe, healthy and high-quality public spaces. Major Initiatives for 2014–15 − Build the Docklands Community Boating Hub and Family Services Centre. − Open the Kathleen Syme Library and Community Centre. − Install IT and furniture infrastructure and open Kensington Town Hall. − Complete the community engagement and Precinct Renewal Master Plan for Queen Victoria Market. − Implement up to six opportunities for smoke-free public spaces for consideration. − Deliver phase one of the work related to sporting and park facilities in the Council's Memorandum of Understanding with the Linking Melbourne Authority to reduce the impact from the proposed EastWest Link. − Complete the Neil Street and Return to Royal Park projects and progress the Eastwood/Rankins, Hawke/Adderley and University Square Precinct projects as part of the Open Space Strategy implementation. Initiatives for 2014–15 − Complete planning scheme amendment C190 Arden-Macaulay. − Draft a Lorimer structure plan for consultation. − Draft a Moonee Ponds Creek master plan for consultation (subject to the East-West Link). − Prepare a West Melbourne structure plan for consultation and trial new pre-planning consultation approach. − Carry out improvements to the park area between Collins and Bourke Streets as part of the Docklands Park project including: − adaptation of the existing wetland along Collins Street into a new activity space improved path access additional seating additional tree-planting. Identify short and long-term options for City Library. 23 − Work with Inner Melbourne Action Plan councils (IMAP) to develop a new IMAP plan for the region. − Work with the Office of the Victorian Government Architect to develop the Victorian Apartment Design Standards as part of our Housing Strategy implementation. − Complete Carlton Baths stage two design and tender phase for new filtration plant, toddler pool and landscaping. − Develop a plan to provide more outdoor gym equipment and promote its use to the community. − Develop and deliver physical recreation programs and services targeting underrepresented groups and those with low physical activity, including by carrying out a gender equity audit of selected Council facilities. − Build knowledge and skills to improve food security for all people in the municipality as part of our Food Policy implementation. − Advocate to the State Government for better late night (after 1am) and early morning transport options in the central city. − Implement crime-prevention-through-environmental-design improvements at Enterprize Park, King Street, Swanston Street, Flinders Street and North Melbourne as per last year's audit. − Consider the need to improve lighting in the Arden Street precinct, including the area used by The Huddle youth project. − Identify safe, welcoming and inclusive spaces and service sites in the municipality for women and children experiencing or at risk of violence. − Investigate opportunities for the involvement of local schools in civic events such as citizenship ceremonies. − Develop the Indigenous Heritage Action Plan 2015–2018. − Develop and implement the Reconciliation Action Plan 2014–2017. − Review the Refugee Welcome Zone Declaration and recommit to activities that fall within local government’s responsibility. − Renew the Multicultural Policy or draft a Cultural Diversity Statement containing an acknowledgment and recognition of the contribution refugees and asylum seekers make. − Implement the supply and demand plan for child-care. − Work with the homelessness sector to develop a register of rough sleepers in the central city. − Identify the feasibility of 24-hour safe and inclusive spaces and medium and long-term housing options in the central city using the following models: 1) short-term accommodation; 2) housing-first; 3) womenspecific accommodation. − Implement high priority actions identified in the Melbourne for All People Strategy. − Publish the results of the Places for People 2014 study and case studies. Our strategies / plans that relate to this goal − Active Melbourne Strategy − City North Structure Plan − Age Friendly Melbourne – Age Friendly City Strategy − Children's Plan − Strategy for a Safer City − Arden-Macaulay Structure Plan 24 − Community Infrastructure Implementation Framework − Community Funding Policy − − Lifelong Melbourne Plan − Melbourne Library Service Strategic Plan − Melbourne Planning Scheme Docklands Community and Place Plan − Open Space Strategy − Docklands Public Realm Plan − Our Melbourne, Disability Action Plan − Docklands Waterways Strategic Plan − − Domestic Animal Management Plan Pathways - City of Melbourne Homelessness Strategy − Electronic Gaming Machine Policy − Policy for the 24 Hour City − Emergency Management Plan − Places for People − Empowering Young People Policy − Preventing Violence Against Women Strategy − Food City – the City of Melbourne’s Food Policy − Public Toilet Plan − Reconciliation Action Plan − Graffiti Management Plan − Southbank Structure Plan − Housing Strategy − Urban Design Strategy − Inner Melbourne Action Plan Our service areas that relate to this goal − Planning for population growth − Parks and gardens − Building, development and planning − Public health and safety − Family, children and youth − Recreation and leisure − Aged and inclusion − Street cleaning and waste management − Libraries − Sustainable environmental management − Homelessness − Urban policy and design − City safety Service Performance Outcome Indicators Service Indicator Performance Measure Computation Statutory Planning Decision making (planning applications processing and decisions are consistent with the local planning scheme) Council planning decisions upheld at VCAT (percentage of planning application decisions subject to review by VCAT and that were not set aside) Number of VCAT decisions that did not set aside Council’s decisions in relation to a planning application / Number of VCAT decisions in relation to planning applications x100 Aquatic Facilities Utilisation (aquatic facilities are safe, accessible and well utilised) Utilisation of aquatic facilities (number of visits to aquatic facilities per head of municipal population) Number of visits to aquatic facilities / Municipal population 25 Service Indicator Performance Measure Computation Animal Management Health and safety (animal management service protects the health and safety of animals, humans and the environment) Animal management prosecutions (number of successful animal management prosecutions) Number of successful animal management prosecutions Food Safety Health and safety (food safety service protects public health by preventing the sale of unsafe food) Critical and major non-compliance notifications (percentage of critical and major noncompliance outcome notifications that are followed up by Council) Number of critical and major non-compliance notifications about a food premises followed up / Number of critical and major non-compliance notifications about food premises x100 Home and Community Care Participation (people are supported to live independently and safely in their own community and home environment) Participation in HACC service (percentage of the municipal target population that receives a HACC service) Number of people that receive a HACC service / Municipal target population for HACC services x100 Participation (Councils promote healthy outcomes for children and their families) Participation in the MCH service (percentage of children enrolled who participate in the MCH service) Maternal and Child Health Participation in HACC services by CALD people (percentage of the municipal target population in relation to CALD people who receive a HACC service) Participation in the MCH service by Aboriginal children (percentage of Aboriginal children enrolled who participate in the MCH service) 26 Number of CALD people who receive a HACC service / Municipal target population in relation to CALD people for HACC services x100 Number of children who attend the MCH service at least once (in the year) / Number of children enrolled in the MCH service x100 Number of Aboriginal children who attend the MCH service at least once (in the year) / Number of Aboriginal children enrolled in the MCH service x100 4.2 COUNCIL PLAN GOAL 2: A CREATIVE CITY Melbourne will be a place that inspires experimentation, innovation and uniqueness and fosters leaders of creativity and courage. It will build upon long-standing heritage and embrace Aboriginal and Torres Strait Islander history and culture. We will encourage participation in creative and artistic expression and enterprises and support experimentation to inspire innovation and a sense of wonder. We celebrate our rich Aboriginal and Torres Strait Islander history and culture and protect and respond to our city’s heritage. Major Initiative for 2014–15 Grow the Arts House Program and create a strategic plan for the future of Arts House. Initiatives for 2014–15 − Review and develop sustainable operating models for our current and future cultural infrastructure and programming. − Develop a cultural infrastructure framework related to the Community Infrastructure Framework to include the: Potential conversion of 602 Little Bourke Street into a mixed-use creative space Feasibility of an international live/work artists’ facility. − Upon adoption of the Arts Strategy, identify and implement 2014–15 components. − Evaluate and review the 2014 Melbourne Indigenous Arts Festival and provide recommendations to the Council regarding its future. − Implement the renewed City of Melbourne Music Strategy and continue to support the Music Strategy Advisory Committee. − Implement a planning scheme amendment to encourage the development and operation of live music venues. − Explore the Yarra Trams proposal for an “arts line”. − Deliver the first of the Melbourne-designed pavilions as part of the Melbourne Pavilions Program. − Partner with the State Government in the establishment of a City of Literature role. 27 − Develop and run the Biennial Dance Massive Festival. − Deliver the biennial Going Nowhere international sustainable arts festival. − Implement the Indigenous Heritage Action Plan 2012–2015 priorities including: implement the final stages of the process to publicly mark and acknowledge the events related to the Tunnerminnerwait and Maulboyheener story and its connection to the history of Melbourne, and develop a GIS mapping tool that could support the further development of self-guided tours and/or a walking trail to celebrate Aboriginal culture in the municipality. − Complete the heritage planning scheme amendments C198 City North Heritage, C207 Arden Macaulay Heritage and C215 Kensington Heritage. − Finish reviewing the planning scheme heritage policies 22.04 Heritage Places within the Capital City Zone and 22.05 Heritage Places outside the Capital City Zone. − Complete a Bourke Hill Precinct heritage review and coordinate results with the State Government’s Bourke Hill Precinct planning review. − Complete the planning scheme amendment C211/212 Exceptional Tree Register. − Investigate the establishment of a City of Melbourne heritage information portal that provides access to all Melbourne’s heritage information repositories including the City of Melbourne’s own collection. Our strategies / plans that relate to this goal − Arts Strategy − Music Strategy − Indigenous Heritage Action Plan − Housing Strategy − Heritage Strategy − Southbank Structure Plan − Melbourne Planning Scheme − Arden-Macaulay Structure Plan − Public Art Framework − City North Structure Plan − Cultural Infrastructure Frameworks − Reconciliation Action Plan Our service areas that relate to this goal − Arts and cultural policy, planning, infrastructure, asset management and programming − Building, development and planning − Urban policy and design − International and national connections − Arts participation and activation 28 4.3 COUNCIL PLAN GOAL 3: A PROSPEROUS CITY Melbourne will have a global focus with first-rate infrastructure and services, a highly skilled workforce and affordable business accommodation. It will share knowledge, mentor emerging businesses, collaborate and attract global investment and visitors. We will support and foster entrepreneurs and enterprises, small and large, helping them to compete in local, national and global markets. We will ensure infrastructure and programs are in place to support their success and create a high standard of living for all. Major Initiative for 2014–15 Work with stakeholders to improve the City Yield Program to gain greater benefits to the city from business event delegates and cruise ship passengers Initiatives for 2014–15 − From the Economic Development Framework, identify two key priority areas and develop/deliver business improvement activities. − Explore opportunities to engage and educate businesses in digital content development as part of the Destination Marketing and Retail and Hospitality Strategy. − Attract events and people to Docklands by: raising awareness of the Events Partnership Program promoting the Melbourne Star working with the Docklands Chamber of Commerce and Destination Docklands Ltd extending City of Melbourne and other events to Docklands where appropriate and beneficial to the overall event concept. − Develop retail focused events and activities as part of Melbourne Spring Fashion Week and a Melbourne Music Week sponsorship strategy. − Develop a café licensee operating partnership at the Fitzroy Gardens Visitor Centre. − Improve the capacity of consumers to provide content as part of the Destination Marketing Strategy. − Implement the actions from the ASEAN statement for Business Partner Cities in the context of the International Engagement Framework. − Identify five new laneways across the central city for improvement as part of the Love Your Laneway Program. 29 − Complete a desk-top study on retail, prosperity and streetscape upgrades and other business and event activation opportunities for the Errol and Victoria street strips. − Complete the Melbourne City Marina Facility fit-out. − Complete the feasibility work for the boating ramp as part of the Waterways Strategic Plan. − Continue to advocate with Places Victoria to advance the: Harbour Esplanade Masterplan Metropolitan Fire Brigade facility and marine services facility, Bolte Precinct, Docklands. − Develop a program or processes to raise awareness of accessibility issues amongst Melbourne retailers through the Melbourne for All People Strategy. Our strategies / plans that relate to this goal − City of Melbourne Tourism Plan − Melbourne Hospitality Strategy − Destination Marketing Strategy − Melbourne Retail Strategy − City of Melbourne Precinct Program − Premier Events Strategic Plans Our service areas that relate to this goal − Business − Local laws compliance − International connections − Building, development and planning − City promotion and tourism − Urban policy and design − Events Service Performance Outcome Indicators Service Indicator Performance Measure Computation Economic Development Economic activity (economic development activities support stimulation of local economic activity) Change in number of businesses (percentage change in the number of businesses with an ABN in the municipality) Number of businesses with an ABN in the municipality at the end of the financial year less the number of businesses at the start of the financial year / Number of businesses with an ABN in the municipality at the start of the financial year x100 30 4.4 COUNCIL PLAN GOAL 4: A KNOWLEDGE CITY Melbourne will be a place where ideas and talent thrive, based on a well-resourced education and research sector and knowledge networks. It will have a dynamic online culture to amplify our knowledge capability. We will continue to develop new ways to gather and share information to support those whose innovations and developments underpin the growth of the city. We broaden understanding and respect for Melbourne’s diverse knowledge sector and ensure learning can be a lifelong process. Major Initiative for 2014–15 − Deliver one event consistent with the Knowledge Strategy per quarter in 2014-15 Initiatives for 2014–15 − Host and participate in forums with the education sector, local governments and the State Government to explore opportunities to collaborate on international student wellbeing, housing and employment. − Implement the Smart City Strategy and the associated governance body. − Work with the proponent to complete a planning scheme amendment for the Carlton Connect precinct as per the City North Structure Plan. − Implement the Knowledge Strategy. − Develop a growth strategy for Melbourne Knowledge Week. − Provide a City of Melbourne knowledge fellowship and communicate the knowledge gained by the fellow via our libraries. − Explore with Melbourne-based entrepreneurs, makers and service providers the potential for a high-tech, high-value manufacturing network and make recommendations in relation to the City of Melbourne’s role. 31 Our strategies / plans that relate to this goal − City North Structure Plan − Knowledge City Strategy − Open Data Policy − Smart City Strategy − International Student Strategy Our service areas that relate to this goal − Libraries − Visitor and resident information − International connections − Research − Information technology − Building, development and planning − Urban policy and design Service Performance Outcome Indicators Service Indicator Performance Measure Computation Libraries Participation (library resources are free, accessible and well utilised) Active library members (percentage of the municipal population that are active library members) Number of active library members / Municipal population x100 32 4.5 COUNCIL PLAN GOAL 5: AN ECO–CITY As an eco-city, Melbourne is committed to reducing our ecological footprint and will work to ensure our people and organisations can adapt to climate change and build a sustainable future. We will provide solid foundations for the sustainability of Melbourne’s communities. We embrace the unfamiliar if it helps us achieve our ambitions. We continue to encourage our community to take positive actions and we lead by example locally, nationally and globally. Major Initiative for 2014–15 Lead Melbourne’s participation in the Rockefeller 100 Resilient Cities Challenge, appoint a Chief Resilience Officer, develop a resilience strategy and determine whole-of-council opportunities to engage in the network Initiatives for 2014–15 − As part of the Zero Net Emissions Strategy: Work with the local energy distributor to plan the city's future energy grid Develop a plan to leverage the Federal Government’s Direct Action Policy Plan to attract investment in business Investigate the viability of providing a carbon offset service for businesses and residents. − Promote the Capital City Lord Mayors CitySwitch and the City of Melbourne 1200 Buildings programs to low-participation precincts and approach the Federal Government for funding under its Direct Action Plan. − In conjunction with the Department of Human Services, real estate agents and student housing providers, expand the high-rise recycling program to incorporate waste-reduction education programs and target highrise communities, renters and low-income groups. − Develop and run programs that improve the uptake of renewable energy generation in the city, particularly in commercial buildings, and drive investment in large-scale renewable energy. − Implement the planning scheme recommendations from the Solar Access Options Study. − Work with the Sustainable Melbourne Fund to adapt Environmental Upgrade Agreements to support investment in renewable energy. − Lead the C40 Sustainable Urban Development Network and determine whole-of-council opportunities to engage in the network. − Install an additional waste compactor in the city. − Produce an integrated water management plan for the Elizabeth Street catchment as part of the Total Watermark Strategy. 33 − Complete the planning scheme amendment C208 Developer Contribution Plans. − Present the draft Biodiversity Strategy to the Council. − Increase the resilience of the city’s parks and street trees to climate change and plant at least 3000 trees to reduce the urban heat island effect. − Complete urban forest precinct plans for Southbank, Parkville and Fishermans Bend. − Undertake a pilot study to measure the environmental impact of a premier event and complete an analysis of all event delivery models to identify opportunities to reduce their impact. − Review sustainability reporting within the organisation. − Develop a sustainability leadership training program. − Implement year one of the lighting strategy including energy efficient technology. Our strategies / plans that relate to this goal − Biodiversity Strategy − Urban Forest Strategy − Carbon Neutral Strategy − Waste Management Strategy − Climate Change Adaptation Strategy − Zero Net Emissions Strategy − Growing Green − Carbon Neutral Strategy (Council Operations) − Open Space Strategy − Southbank Structure Plan − Public Lighting Strategy − Arden-Macaulay Structure Plan − Total Watermark - City as a Catchment − City North Structure Plan Our service areas that relate to this goal − Sustainable environmental management − Public health and safety − Parks and gardens − Roads, transport and infrastructure − Street cleaning and waste management − Building, development and planning − Property and assets − Urban policy and design Service Performance Outcome Indicators Service Indicator Performance Measure Computation Waste Collection Waste diversion (amount of waste diverted from landfill is maximised) Kerbside collection waste diverted from landfill (percentage of garbage, recyclables and green organics collected from kerbside bins that is diverted from landfill) Weight of recyclables and green organics collected from kerbside bins / Weight of garbage, recyclables and green organics collected from kerbside bins x100 34 4.6 COUNCIL PLAN GOAL 6: A CONNECTED CITY In Melbourne, all people will be able to move freely to communicate and trade without sacrificing essential social or ecological values. Melbourne’s connections will give people access to a rich seam of opportunities. We will manage movement in and around our growing city to help people trade, meet, participate and move about safely and easily, enabling our community to access all of the services and opportunities the municipality has to offer. Major Initiative for 2014–15 Roll out the first phase of pay-by-phone parking services across the municipality Initiatives for 2014–15 − Implement the Walking Plan including planning scheme amendments to support through-block links and other pedestrian network benefits. − Implement year three actions of the bike plan including capital works on: Lorimer Street and Dynon Road shared paths Spring Street, The Avenue, Gisborne Street, Albert Street-to-La Trobe Street connection Arden Street route and pedestrian/bicycle bridge Leveson Street at Courtney Street Smithfield Epsom and Macaulay Roads upgrades Flemington Road separated lanes Queensbridge Street-to-Market Street and Bridge Road-to-Yarra Park connections Elizabeth Street and Chelmsford contra-flow bike corrals. − Complete a masterplan for Elizabeth Street in consultation with Yarra Trams and stakeholders. − Work with the State Government on the Melbourne Metro Rail Capacity Project and other rail improvements. − Complete a City Road master plan in line with Southbank Structure Plan objectives. − Implement Road Safety Plan actions including work on: 35 a motorcycle plan the Spring Street footpath at Collins Street footpaths and pedestrian crossing on Flinders Lane between Spring and Exhibition streets the O’Connell Street pedestrian refuge at Peel Street. − Amend the planning scheme to require motorcycle and bicycle parking that better matches current and predicted use. − Trial a safe city taxi rank in Bourke Street, including upgrading the evening Bourke Street rank between Russell Place and Russell Street. − Work with the State Government and other partners to develop an approach to last-kilometre freight for central Melbourne. − Complete a desk-top review of the car-share policy to assess benefits to the city and capitalise on new business models and technologies. − Continue to facilitate the introduction of water transport-ferry services to Docklands. Our strategies / plans that relate to this goal − Bicycle Plan − Road Safety Plan − CBD and Docklands Parking Plan − Walking Strategy − Melbourne Transport Strategy − Zero Net Emissions Strategy Our service areas that relate to this goal − Roads, transport and infrastructure − Local laws compliance − Parking management − Urban policy and design − Street cleaning and waste management − Building, development and planning Service Performance Outcome Indicators Service Indicator Performance Measure Computation Roads Satisfaction (sealed local road network is maintained and renewed to ensure that it is safe and efficient) Satisfaction with sealed local roads (community satisfaction rating out of 100 with how Council has performed on the condition of sealed local roads) Community satisfaction rating out of 100 with how Council has performed on the condition of sealed local roads 36 4.7 COUNCIL PLAN GOAL 7: RESOURCES ARE MANAGED WELL An organisation that manages its resources well will use what it has available efficiently and effectively to achieve its goals and ensure the community will continue to grow and prosper locally, nationally and internationally. We will constantly improve what we deliver and how we deliver it. We are a high-performing, learning and financially sustainable organisation that continues to deliver more value with available resources and in partnership with others to make things better and easier for everyone. Major Initiative for 2014–15 Implement the community engagement process agreed for the 10-year Financial Plan Initiatives for 2014–15 − Review the Town Hall venue management contract taking into consideration the existing Council grant programs to determine the optimum operational and financial model. − Complete a feasibility study for the future use of council-owned land known as Council House precinct (including Council House One, 225 Bourke Street and associated properties). − Review governance and processes for decision making on capital works projects to embed Corporate Social Responsibility and transparent reporting. − Deliver measurable improvements to three high-volume, high-cost services that contribute to improved customer experiences or increased organisational productivity. − Deploy new organisational measures to relevant branches and services and remove obsolete measures. − Progress people strategy by introducing a strategic workforce planning model, determine immediate high risk areas and develop managers who have high risk areas to implement and manage action plans. 37 Our strategies / plans that relate to this goal − Customer Experience Strategy − City of Melbourne Management and Leadership Framework − Information Management and Technology Strategy − Risk Management Strategy − Smart City Strategy − 10-year Financial Plan − People Strategy − Zero Net Emissions Strategy − Carbon Neutral Strategy (Council Operations) Our service areas that relate to this goal − Finance − Information technology − Customer relations − Human resources − Learning and development − Property and assets − Building, development and planning − Lean Thinking − Corporate planning and performance − Sustainability 38 4.8 COUNCIL PLAN GOAL 8: AN ACCESSIBLE, TRANSPARENT AND RESPONSIVE ORGANISATION An accessible, transparent and responsive organisation is willing to share what it has done and why it was done it with people who need to know. It acts in a professional, timely manner and ensures the community can feel a sense of pride in its operations. We will improve opportunities for the community to participate in and engage with our activities and decision making. We share information about our decisions and performance and let people know how their views have influenced what we do. Major Initiative for 2014–15 Develop and propose to the Council a suite of measures of interest for publication on the website Initiatives for 2014–15 − Implement an online system for disclosing public submissions to Future Melbourne Committee and Council meetings. − Publish on the website a list of City of Melbourne properties valued over $5 million. − Evaluate the results of community engagement forums, our community engagement audit and community engagement research and implement the findings. − Deliver mobile, accessible, transparent and engaging digital communications via: a redeveloped corporate site (including all current sub sites) supported by a new governance framework and processes a redeveloped intranet a redeveloped service directory improved functionality (based on a new content management system) content renewal and migration based on a content strategy. 39 − Continue to build our capacity to engage our community and stakeholders via digital channels (eg Participate Melbourne). Our strategies / plans that relate to this goal − Information Management and Technology Strategy − Open Data Policy − Smart City Strategy Our service areas that relate to this goal − Legal, governance and corporate − Finance − Community engagement − Communications, media and publications − Information technology Service Performance Outcome Indicators Service Indicator Performance Measure Computation Governance Satisfaction (Councils make and implement decisions in the best interest of the community) Satisfaction with Council decisions (community satisfaction rating out of 100 with how Council has performed in making decisions in the interests of the community) Community satisfaction rating out of 100 with how Council has performed in making decisions in the interest of the community 40 Performance Statement The service performance outcome indicators in the preceding pages are set by the State Government and will be reported on within the City of Melbourne’s Performance Statement prepared at the end of the financial year as required under section 132 of the Act. They will be audited by the Victorian Auditor General whose audit opinion, along with the Performance Statement and information about the major and other initiatives, will be included in the Annual Report. External factors affecting Major Initiatives The City of Melbourne’s to complete major initiatives can be affected by factors outside of its control. In most cases major initiatives are structured to focus on our specific role however this is not always practical, especially when readers require a fuller context to understand the intent of the initiative. External funding arrangements also can affect major initiatives and some rely on external funding contributions. The City of Melbourne monitors progress on its major and other initiatives monthly. 41 42 BUDGET ANALYSIS 5. ANALYSIS OF OPERATING BUDGET This section of the annual budget report analyses the expected revenues and expenses of the Council for the 2014-15 year. 5.1. Operating Revenue Budget 2013-14 $000s Budget 2014-15 $000s Variance $000s Revenue Type 5.1.1 Rates Grants & Subsidies Fees & Charges Property Rental and Hire Sales & Recoveries Finance Income Inter-company Revenue Operating Revenue before Capital Grants 215,568 10,682 109,249 7,467 3,155 3,506 16,372 365,999 230,116 11,093 110,084 7,326 4,877 3,755 13,373 380,624 14,548 411 835 (141) 1,722 249 (2,999) 14,625 Capital grants and contributions Total Operating Revenue 13,097 379,096 18,237 398,862 5,140 19,765 Net Rates ($14.55 million increase) The increase of $14.55 million in net rates includes the proposed rate increase of 3.60 per cent ($7.87 million) and an additional $5.85 million of new supplementary rates coming online in 2014-15. This has been partly offset by a budgeted increase in Valuer General adjustments of $0.60 million reflecting current objections. The remaining difference largely reflects the full year of 2013-14 supplementary rates. 43 5.1.2 Grants and Subsidies ($0.41 million increase) Grants and subsidies have increased by $0.41 million. The increase predominantly relates to assumed CPI increases in most State and Federal grants. The following table summarises the main movements. Budget 2013-14 $000s Budget 2014-15 $000s 2,489 1,858 461 124 1,839 3,911 2,660 1,874 463 126 2,068 3,902 171 16 2 2 229 (9) 10,682 11,093 411 Variance $000s Grants and Subsidies Funding Type Home & Community Services Child Care Benefit Maternal & Child Health Street Cleaning Grants Appropriation - Vic Grants Commission Other Grants/Subsidies Total Grants and Subsidies 5.1.3 Fees and Charges ($0.84 million increase) The budget contains a number of increases to fees as a result of either mandatory rises as a result of state legislation, bringing prices in line with competitors, or moving fees closer to cost recovery and parity with other neighbouring municipalities. Revenue has increased from other fees and charges such as general fees $0.46 million, general fines $0.48 million and building and planning fees $0.43 million reflecting expected activity levels. Parking fees are expected to be lower by $0.99 million with a reduction of parking bays across the city as the Council supports more sustainable modes of transport. There are no changes to parking fee pricing in 2014-15. Total parking fine revenue is expected to remain flat at $40.71 million ($40.42 million in 2013-14) with continued compliance by the public. A list of the changes in fees and charges from 2014-15 is provided in Appendix F. 5.1.4 Property Rental and Hire ($0.14 million decrease) The decrease in property rental is due largely to works planned to be carried out on a number of properties during year. During this time the properties will be unavailable for rent and therefore rentals are expected to be modestly lower. 44 5.1.5 Sales and Recoveries ($1.72 million increase) The increase in sales and recoveries reflects the biennial recoveries of property valuation information from the State Revenue Office. This was not been budgeted for 2013-14. 5.1.6 Finance income ($0.25 million increase) The increase in Finance income is largely due to modestly higher cash balances and assumes a flat interest rate environment for the year. For a full analysis of investment returns refer to section 11. 5.1.7 Intercompany revenue ($3.00 million decrease) The lower intercompany revenue reflects the projected lower profits from Council’s subsidiary companies. 5.1.8 Capital grants and contributions ($5.14 million increase) Capital grants vary year on year depending on the capital works program for the year. Some projects which were completed in 2013-14 will not receive funding in 2014-15 and some new projects have come on line which is budgeted to receive grant funding. In 2014-15 increase in capital grants and contributions is due to funding to be received for Royal and Princess Parks recreational infrastructure improvements. A list of all the capital contributions used to fund the 2014-15 Council works program is detailed in Appendix E. 45 5.2. Operating Expenditure Budget 2013-14 $000s Budget 2014-15 $000s Variance $000s Expenditure Type Employee Costs Materials & Services Maintenance Finance & Insurance Costs Grants & Contributions Government Taxes & Levies Depreciation - Other Assets 128,199 146,944 10,399 10,188 12,656 1,335 55,332 133,686 146,889 12,238 10,249 12,476 1,545 57,323 5,487 (56) 1,839 61 (180) 210 1,991 Total Operating Expenditure 365,053 374,405 9,352 The City of Melbourne continues to utilise Lean process improvement to ensure the highest possible quality of services within the budget and improve productivity. 5.2.1. Employee costs ($5.49 million increase) The majority of Council services and programs are delivered through staff. As the City grows, so do the demands for these services and programs. Council must balance the demands that this places on staff with the need to contain costs. The 2014-15 Annual Plan and Budget makes provision for additional staffing for new facilities coming online including Kathleen Syme Library and Community Centre and the Fitzroy Visitor Centre. It also includes staffing for the full year of operations for Docklands Library and Community Centre which opened at the end of the 2013-14 financial year. The budgeted 2014-15 Full Time Equivalent (FTE) is 1309.33 compared to 1290.60 in 2013-14 an increase of 18.73 which includes 13.52 FTE related to new facilities. The overall increase in employee costs ($5.49 million) also provides for staff increases in accordance with the Melbourne City Council Enterprise Agreement (EA). The 2014-15 budget is based on 1 FTE for every 72.14 rateable properties. This has increased from 1 FTE per 68.24 rateable properties in 2013-14 indicating increased efficiency to meet the demands of a growing municipality. 5.2.2. Materials and Services ($0.06 million decrease) Materials and Services expenditure for 2014-15 is slightly lower by $0.06 million or 0.04 per cent. Contractor costs represent $100.89 million of the total materials and services. Where there have been contracted price increases, savings have been found across the organisation to offset the overall costs of materials and services. 46 The most significant increases in materials and services expenditure are as follows: $0.47 million in utilities primarily relating to anticipated higher water utility costs as result of expected price increases. Although this cost is up by 23 per cent the cost would have been up by more than 50 per cent without Council’s 225,000 kilo litres in storm water harvesting capacity which saved $0.61 million. $0.18 million for an additional laneway compactor. The budget includes provision of four laneway compactors at a total operating cost of $0.58 million. $0.025 million for a trial taxi rank in Bourke Street. $0.19 million in operating and $0.15 million in capital to expand smoke free areas as a priority. $0.66 million for stage 1 of the pay by phone rollout across the municipality. $0.08 million for the preparation of West Melbourne Structure Plan for consultation. $0.81 million in operating costs for Kathleen Syme Library and Community centre which will commence operations during the year. $0.44 million in operating costs for the QVM engagement and renewal master plan. $0.20 million for the biennial Dance Massive and going nowhere international and sustainable arts festival. $0.15 million for community engagement on Council’s 10 Year Financial Plan. $0.17 million in operating costs for the Kensington Town Hall. $0.82 million in operating costs reflecting a full year’s operation of the Docklands Library and Community Centre. Increased contract costs of $2.5 million due to contract escalations and/or increased service demands in the following contracts: property maintenance aged and disability services waste management; and civil design The increase in costs has been offset by identified productivity and savings through the budgeting process predominantly in professional services, contractors and administration costs. There is also a commitment to deliver further savings over the course of the financial year through continued process improvements made through our application of lean. 5.2.3. Maintenance ($1.84 million increase) Maintenance expenditure for 2014-15 is higher by $1.84 million. The increase reflects a prioritisation of maintenance works and is offset by lower renewal works. The full maintenance program is provided in Appendix E. 47 5.2.4. Finance and Insurance Cost ($0.06 million increase) Finance and insurance costs are budgeted to increase due to an increase in provision for insurance claims and merchant bank fees offset by lower provisioning for write offs associated with parking fines following a review of collection rates which have improved. 5.2.5. Grants and Contributions ($0.18 million decrease) The decrease in grants and contributions reflects several non-recurring grants funded in 2013-14 including “The Ring” festival $0.20 million. A summarised list of grants and contributions is provided in Appendix G. 5.2.6. Government Taxes and Levies ($0.21 million increase) Government taxes and levies are budgeted to be $0.21 million higher due to the expansion of the congestion levy boundary which now includes Council’s Elgin Street car park. 5.2.7. Depreciation and amortisation ($1.99 million increase) Infrastructure asset stock and replacement costs continue to increase as set out in the Capital Works program. The growing asset base leads to increasing depreciation and amortisation costs. 48 49 6. ANALYSIS OF BUDGETED CASH POSITION The cash flow statement shows cash movement in two main categories: operating activities – these activities refer to the cash generated or used in the normal service delivery functions of Council; and investing activities – these activities refer to cash generated or used in the enhancement or creation of infrastructure and other assets. These activities also include the acquisition and sale of other assets such as vehicles, property, equipment etc. 6.1. Operating Expenditure The 2014-15 budgeted cash inflow of $1.79 million reflects higher operating surplus for 2014-15. Budget 2013-14 $000s Budget 2014-15 $000s Variance $000s 382,858 (308,784) 74,074 395,988 (309,156) 86,832 13,130 (372) 12,758 Statement of Cash Flow CASH INFLOWS/(OUTFLOWS) FROM OPERATING ACTIVITIES Receipts Payments Net Cash Provided by Operating Activities CASH INFLOWS/(OUTFLOWS) FROM INVESTING ACTIVITIES Proceeds from sale of Property Plant & Equip (Payments) Receipts for Property, Infrastructure, Plant and Equipment (89,725) (85,860) 3,865 Net Cash Used in Investing Activities (88,999) (85,044) 3,955 Net increase/(decrease) in cash held (14,925) 1,788 16,713 91,200 76,275 76,275 78,063 (14,925) 1,788 726 Cash at beginning of the financial year Cash at end of the financial year 6.1.1. 816 0 90 Operating Activities ($12.76 million higher cash inflow) Operating activities refer to the cash generated or used in the normal service delivery functions of Council. An inflow of cash is required to fund the capital works program. The higher cash inflow in 2014-15 is largely due to modestly higher anticipated revenues. 50 6.1.2. Investing Activities ($3.96 million lower cash outflow) The lower cash outflow is due timing of payments of capital works program compared to 2013-14. 6.1.3. Cash at the end of Year ($1.79 million increase in cash balance) Overall, total cash is forecast to increase by $1.79 million due to modestly higher revenues. The following table provides an analysis of the major changes in cash inflows and outflows between the 2013-14 and 2014-15 budgets. 6.2. Reconciliation of operating Performance to Cash Flow The following table provides a reconciliation of the operating performance from the Income Statement to the Cash Flow. Budget 2013-14 $000s Budget 2014-15 $000s Net Surplus/(deficit) from operations 14,197 24,602 10,405 Add back: Depreciation Net movement in working capital Cash proceeds Funds available for capital 55,332 4,545 726 74,800 57,323 4,907 816 87,648 1,991 362 90 12,848 Capital Expenditure (89,725) (85,860) 3,865 Net Cash inflow/(outflow) (14,925) 1,788 16,713 91,200 76,275 76,275 78,063 (14,925) 1,788 Variance $000s For the Year ending 30 June Bank account (Opening Balance) Bank account (Closing Balance) 6.2.1. Funds Available for Capital The funds available for capital are expected to increase by $12.85 million, this reflects higher net surplus from operations partly as a result of higher external capital contributions. 6.2.2. Net Cash inflow The net cash inflow is due to higher net operating surplus compared to 2013-14. 51 52 7. ANALYSIS OF COUNCIL WORKS (INCLUDING MAINTENANCE) This section of the budget report provides an analysis of the planned council works expenditure budget for the 2014-15 year and the sources of funding for the budget. It should be noted that maintenance is included as part of the overall review of council works program but is funded out of the operating budget. 7.1. Funding Sources Budget 2013-14 $000s Budget 2014-15 $000s Source of Funding External Funding Proceeds from sales of assets Public Open Space Reserve Long Term Parking Levy Sub totals 5,207 572 5,484 7,000 18,263 10,447 670 6,957 7,000 25,074 5,240 98 1,473 0 6,811 Funding Provided by Council 80,360 74,297 (6,063) Total Funding Sources 98,623 99,371 Source of Funding 2014-15 $ Millions Funding Provided by Council 74.30 External Funding, 10.45 Proceeds from sales of assets, 0.67 Public Open Space Reserve, 6.96 Long Term Parking Levy, 7.00 53 Variance $000s 748 7.1.1. External Funding ($10.45 million) External funding includes amounts budgeted to be received from Federal and State government departments for the following; 7.1.2. $7.10 million Royal and Princess Park Recreational Improvements $2.00 million Living Victoria Fund $0.35 million Roads to Recovery program $0.55 million Local road funding and $0.25 million Lonsdale Street median strip renewal and tree replacement. $0.05 million Living Rivers fund $0.05 million Dodds Street linear park Proceeds from asset sales ($0.67 million) Proceeds from sales of assets refer to motor vehicle sales in accordance with Council’s fleet renewal policy. 7.1.3. Public Open Space Reserve ($6.96 million) The $6.96 million represents the amount to be allocated from the public open space reserves and will be spent on the following projects. Neill Street Carlton recreational area, Royal park, urban landscapes and climate adaption works, princess park new playground facility, railway place and Miller Street reserve park expansion, Southbank Boulevard and MacArthur Square upgrade, Hawke and Adderley Street park expansion, Eastwood Street/ Rankins road open space and Dodds Street linear park. The public open space reserve is a statutory reserve required to account for developer contributions. The use of the funds is dictated by legislation, ensuring the funds are used to create community public spaces. The amount of open space contributions varies year on year. At the end of 2014-15 we expect the remaining balance from the open space reserve to be $7.82 million. 7.1.4. Long Term Parking Levy – Capital Projects ($7.00 million) The amount of $7.00 million from Long Term Parking Levy relates to funding provided to improve congestion in the city. The funds will be used for the bicycle improvement program and major streetscape improvements. 7.1.5. Funding Provided by Council ($74.30 million) During the year Council generates cash from its operating activities, which is used as a funding source for the capital works program. In 2014-15, $74.30 million is budgeted to be generated from operations. Refer section 6, “Budgeted Cash Position” for more information on funds from operations. 54 7.2. Council Works Budget 2013-14 $000s Budget 2014-15 $000s Council Works Area Maintenance Capital Grants Maintenance Minor Works Total Maintenance 1,004 9,395 0 10,399 1,269 10,969 0 12,238 265 1,574 0 1,839 Capital Works New Works Renewal/ Refurbishment Upgrade/ Expansion * Total Capital Expenditure 39,171 49,054 0 88,225 40,978 42,153 4,002 87,133 1,807 (6,901) 4,002 (1,092) 98,624 24,168 122,792 99,371 16,905 116,276 747 (7,263) (6,516) Total Council Works Program Carry Forward Council Works Expenditure *Upgrade/ Expansion is new category for the 2014-15 financial year Source: Appendix E 2014-15 Council Works Program Upgrade/ Expansion * 4% Total Maintenance 12% Renewal/ Refurbishment 43% New Works 41% A detailed listing of all projects comprising the capital works programme is in Appendix E. 55 Variance $000s 7.2.1. Capital Grants ($1.27 million) For the 2014-15 year, $1.27 million will be provided in grants for maintenance program of works on assets not directly owned by the City of Melbourne. The projects are street lighting improvements ($0.47 million) and traffic signal installations and upgrades ($0.69 million). 7.2.2. Maintenance ($10.97 million) For the 2014-15 year, $10.97 million will be expended on maintenance. The more significant projects include public lighting ($1.69 million), property minor works ($1.48 million), parks maintenance works ($1.33 million), Christmas decorations maintenance ($1.20 million), small equipment and software maintenance ($0.88 million), bridge maintenance ($0.30 million) and accommodation ($0.30 million). 7.2.3. New Works/Upgrade ($40.98 million) For the 2014-15 year, $40.98 million will be expended on new works/upgrades. The more significant projects include Royal and Princess Parks recreational infrastructure ($7.10 million), Kathleen Syme Library and Community Centre ($6.50 million), Living Victoria Fund project which includes Carlton square stormwater harvesting scheme ($2.00 million), major streetscape improvements in central city ($4.00 million), bicycle improvement program ($3.00 million), Neighbourhood recreational area Neill St Carlton ($2.00 million), royal park project ($1.81 million), urban landscapes climate adaption ($1.50 million), flood mitigation works ($1.00 million) and implementation of Docklands community and place plan ($1.00 million). 7.2.4. Renewal/Refurbishment ($42.15 million) For the 2014-15 year, $42.15 million will be expended on renewal/refurbishment of existing assets. The more significant projects include roadways and footpaths renewal ($9.00 million), parks renewal ($6.44 million), property renewal works ($3.16 million), Information Technology renewal ($5.50 million), climate adaption – urban landscapes renewal ($2.56 million), digital transformation ($2.00 million), kerb and channel renewal ($2.30 million), parks renewal tree planting ($1.45 million) and drains renewal ($2.00 million). 7.2.5. Upgrade/ Expansion ($4.00 million) For the 2014-15 year, $4.00 million will be expended on upgrade/expansion of existing assets. The more significant projects include property services efficiency upgrades ($1.40 million) and Carlton Baths Stage 2 works ($1.00 million). Refer to Appendix E for full details. 56 8. ANALYSIS OF BUDGETED FINANCIAL POSITION This section of the budget report analyses the movements in assets, liabilities and equity between 2013-14 and 2014-15. 8.1. Budgeted Balance Sheet for Year ending 30 June Budget 2013-14 $000s Budget 2014-15 $000s Variance $000s 104,217 (86,719) 17,498 108,877 (94,373) 14,504 4,660 (7,654) (2,994) Non Current Assets Liabilities Net Non Current Assets 3,459,037 (6,307) 3,452,730 3,643,056 (6,577) 3,636,479 184,019 (270) 183,749 NET ASSETS 3,470,228 3,650,983 180,755 Equity Accumulated Surplus Reserves Total Equity 1,783,402 1,686,826 3,470,228 1,808,004 1,842,979 3,650,983 24,602 156,153 180,755 Current Assets Liabilities Net Current Assets 8.1.1. Current Assets ($4.66 million increase) The increase in current assets is due mainly to an increase in cash assets due to modestly higher operating surplus in 2014-15. Actual 2011-12 $000s Actual 2012-13 $000s Budget 2013-14 $000s Budget 2014-15 $000s 1.4% 74.2% 1.5% 66.9% 0.9% 56.1% 0.9% 59.0% Debtor Management Rate Debtors Ratio PINS Debtor Ratio Note: Rate Debtors shown as a percentage of Rate revenue PINs Debtors shown as a percentage of PINs revenue The above table illustrates the anticipated collection of debtors. 8.1.2. Current Liabilities ($7.65 million increase) 57 The increase in current liabilities (that is, obligations Council must pay within the next year) of $7.69 million is a result of assumed timing of creditor payments, modest increase in overall expenditure and provision for annual leave. 8.1.3. Net Current Assets ($2.99 million decrease) The normal business cycle necessitates businesses meeting their obligations/liabilities from current assets which can and will be converted into cash in time to meet those obligations (those occurring in the normal business cycle and within the current year). The decrease is a result mainly of an increase in liabilities attributable to the points referred to in section 8.1.1 and 2. 8.1.4. Non Current Assets ($184.02 million increase) The budgeted Balance Sheet shows non current assets of $3.64 billion as at 30 June 2015, which is an increase of $184.02 million over 2013-14. The increase in non-current assets is due to the combination of council works program of $99.37 million which is offset by depreciation for the same period of $57.32 million and anticipated revaluation of assets. In recent years the revaluation of assets has resulted in higher asset values. 8.1.5. Non Current Liabilities ($0.27 million increase) The minor increase in non-current liabilities (that is, obligations Council must pay beyond next year) is a result of increased long service leave provisions. Council has no short term or long term debt. 8.1.6. Equity ($180.76 million increase) The net increase in equity (or net assets) of $180.76 million is the net difference between assets and liabilities as outlined in sections 8.1.1 through to 8.1.5 above. 8.1.7. Key Assumptions In preparing the Budgeted Balance Sheet for the year ended 30 June 2014 it was necessary to make a number of assumptions about key assets, liabilities and equity balances. The key assumptions are as follows: a total of 99.1 per cent of total rates raised will be collected in the 2014-15 year; trade creditors to be based on materials and services expenditure and increased capital; employee entitlements to be increased by estimated Enterprise Agreement outcome only. No increase in the average rate of leave taken is expected; and total council works expenditure of $99.37 million will be paid in full in the 2014-15 year. 58 59 9. STRATEGIC RESOURCE PLAN 2014-2018 The Strategic Resource Plan (SRP) identifies the financial and non-financial resources required over the four-year period of 2014-18. The purpose of the strategic resource plan is to ensure adequate resources are available to maintain services at levels established by the Council and to implement the Council Plan priorities. The four year SRP has been prepared in accordance with the requirements of the Local Government Act 1989. The Act requires that the Council prepare and approve a four year Council Plan, including the SRP. The SRP includes a four year financial estimate that comprises the Comprehensive Income Statement, Balance Sheet, Statement of Changes in Equity, Statement of Cashflows, Statement of Capital Works, Statement of Human Resources and Statement of Planned Human Resources. The Strategic Resource Plan is revised annually as part of the Annual Plan and Budget process and projects out on a four year basis the financial resources estimated to be available to deliver the Council Plan and ongoing services to the community. 9.1. The economic environment and key financial assumptions The Strategic Resource Plan is prepared and revised annually based of the latest economic and financial information at the time of preparing the plan. As economic and financial variables change over time the plan is adjusted accordingly to take account of these movements. The key financial assumptions underpinning the SRP are detailed in the table below: Rate Increase CPI Total Revenue Increase Total Cost Increase Investment Returns 2014-15 2015-16 2016-17 2017-18 3.60% 3.00% 3.00% 3.00% 2.5 - 3% 2.5 - 3% 2.5 - 3% 2.5 - 3% 5.20% 2.56% 4.63% 3.81% 2.50% 3.83% 3.96% 3.37% 3.50% 3.50% 3.50% 3.50% The SRP has been developed through a rigorous process and is based on the following key information: Audited financial statements as at 30 June 2013; Proposed 2014-15 Annual Plan and Budget ; Assumptions about changes in future income and expenditure associated with meeting current levels of services; and economic and financial indicators based on external sources. 60 The financial projections included in the SRP have been developed using a contemporary approach to financial statements which links the Comprehensive Income Statement, Balance Sheet, Statement of Changes in Equity, Statement of Cashflows, Statement of Capital Works, Statement of Human Resources and Statement of Planned Human Resources. 9.2. Key Objectives of the Plan The key objectives which underpin the financial plan include: Long Term Financial Sustainability –Over the 4 year plan it is expected to sustain its solid financial position through a commitment to prudent financial management and maintaining long term underlying surpluses. Asset Management – Infrastructure assets will exceed $3.5 billion and represent the single biggest asset group in Council’s control. Recognising the need to ensure adequate financial provision is made to maintain assets at appropriate service levels in a growing municipality, the plan includes provision for an increase in the Capital Works Program. Rating Strategy – over the period of strategic resource plan, commencing 2014-15, a modest increase in rates is planned reflecting expected general cost increases and growth in service demand across the municipality. The rate increases are expected to be well below most other metropolitan Councils. Council expects development to continue across the municipality which will contribute to an increasing rate revenue base. Improve accessibility to the City and encourage greater use of public transport. Monitor the investment portfolio and update strategies to ensure target returns are achieved over the long term. The Council recognizes the need for long term financial planning and has committed to the development of a 10 Year Financial Plan. The plan will incorporate the objectives outlined and ensure continued long term financial sustainability of Council while providing sufficient funding for future services and infrastructure to the community. 9.3. Four-year Council Financial Plan In preparing the Strategic Resource Plan, the Council has also been mindful of the need to comply with the following principles of sound financial management as contained in the Act: Prudently manage financial risks relating to debt, assets and liabilities. Provide reasonable stability in the level of rate burden. Consider the financial effects of Council decisions on future generations. Provide full, accurate and timely disclosure of financial information. 61 Strategic Resource Plan 2015-16 2016-17 $'000 Budget 2014-15 $'000 2017-18 Key Financial Indicators Underlying Surplus/(deficit) Total Revenue Total Operating Expenditure Gross Capital Expenditure Cash Inflow/(Outflow) Cash Assets 6,365 380,624 374,405 87,133 1,787 78,063 738 389,272 388,534 87,921 1,609 79,672 4,696 408,603 403,907 87,618 3,806 83,478 6,893 424,421 417,528 90,863 10,252 93,730 9.4. Financial Plan Summary The underlying theme of the four year Council Financial Plan is sustainability of core Council services and progressively growing the financial capacity to meet increased infrastructure. The plan presents a prudent financial position. 62 10. VALUATION 10.1. Revaluation The Councillors of the City of Melbourne, on 26 June 2012, resolved to cause a general valuation of the municipality to be made and returned in accordance with Section 11 of the Valuation of Land Act 1960 (VLA). The resolution instructed the Manager Property Services to make a general valuation showing the Net Annual Value (NAV), the Capital Improved Value (CIV) and the Site Value (SV) of all rateable property and all property owned by the City of Melbourne, the State and Federal Governments and charitable and educational institutions in the municipality and to return the valuation by 30 June 2014. In accordance with Section 11 of the VLA, the 1 January 2014 is the date at which all property will be assessed. This resolution will allow the valuation as at 1 January 2014 to be adopted as the basis on which general rates are to be levied for the period commencing 1 July 2014 and ending 30 June 2016. 10.2. Outcomes of the General Revaluation The 2014 General Valuation resulted in an overall increase in the total NAV from $5.6 Billion to $6.0 Billion, for all properties in the municipality irrespective of rateable status. This represents an overall increase of 6.2%. The total NAV for rateable properties has increased from $4.84 Billion to $5.15 Billion. This represents an increase of 6.4%. Overall non-residential NAV has increased by 7.8%, whilst residential NAV has increased by 3.9% 10.3. Major Influences The major influences affecting the outcome of the General Valuation have been: All property sectors have experienced variations in their valuations since 2012. The residential market was generally subdued throughout 2012 and the early part of 2013. Over the past twelve months record low levels of interest rates have contributed to consistent growth in the outer residential sector Record levels of high density residential developments have continued. Retail has remained resilient with high demand from international retailers, food outlets and the service industry. The total office stock increased between 2012 and 2014 with high levels of new development and refurbishment works completed – overall the office market is generally sound. Industrial properties have experienced moderate growth. Mixed use sites have experienced strong growth since 2012 as a result of high demand from developers and speculative investors. 10.4. Revaluations by Rate Code 63 The totals of the various land use classes detailed in the valuation return are as follows: City of Melbourne Valuations 2014-15 Class of Land Number of Assessments Net Annual Value $ Capital Improved Value $ Site Value $ Residential Non-Residential Total Rateable (General Rates 1 & 2) 72,132 22,321 1,827,506,786 3,324,027,131 36,547,148,742 47,164,075,651 11,427,249,910 14,626,430,616 94,453 5,151,533,917 83,711,224,393 26,053,680,526 Exempt Cultural & Recreational Lands Total for all Use Types 1,415 42 95,910 779,080,071 54,655,922 5,985,269,910 12,020,454,234 1,061,247,832 96,792,926,459 7,032,074,371 188,680,008 33,274,434,905 10.5. Percentage Change in Rateable Net Annual Value (NAV) between 2012 and 2014 64 10.6. Cultural & Recreational Land In accordance with section 4 of the Cultural and Recreational Lands Act 1963, Council is required to determine that a charge paid as rates identified in the table on the following page in respect to recreational lands are reasonable having regard to the services provided by the Council in relation to such lands and having regard to the benefit to the community derived from such recreational lands. Cultural & Recreational Lands 2014-15 Assessment Number 13295 13313 13373 13376 13379 13388 13391 13392 14083 14657 18077 18275 18285 18331 18907 18913 18926 18928 18935 18938 23033 23068 23865 24948 25221 25257 25284 25308 26623 36880 39534 40376 41246 42507 57827 59538 73387 77359 77363 77364 88565 90101 Address / Description Rates Charged Per C. & R. L. Act (1963) $ 23 Fogarty Street, NORTH MELBOURNE VIC 3051 33 Fogarty Street, NORTH MELBOURNE VIC 3051 Melbourne Rowing Club, Yarra Boathouses, Boathouse Drive, MELBOURNE VIC 3004 Melbourne University Boatshed, Yarra Boathouses, Boathouse Drive, MELBOURNE VIC 3004 Banks Rowing Club, Yarra Boathouses, Boathouse Drive, MELBOURNE VIC 3004 Mercantile Rowing Club, Yarra Boathouses, Boathouse Drive, MELBOURNE VIC 3004 Richmond Rowing Club, Yarra Boathouses, Boathouse Drive, MELBOURNE VIC 3004 Yarra Rowing Club, Yarra Boathouses, Boathouse Drive, MELBOURNE VIC 3004 North Park Tennis Club, Royal Park, Flemington Road, PARKVILLE VIC 3052 Melbourne Park, Batman Avenue, MELBOURNE VIC 3004 Corp. Box 500 Epsom Road, FLEMINGTON VIC 3031 Track Manager Residence. 500 Epsom Road, FLEMINGTON VIC 3031 Race Course, 500 Epsom Road, FLEMINGTON VIC 3031 Residence, 500 Epsom Road, FLEMINGTON VIC 3031 Pavilion Members Stand, MCG, 120 Brunton Avenue, JOLIMONT VIC 3002 Corp. Box MCG, 120 Brunton Avenue, JOLIMONT VIC 3002 Restaurant MCG, 120 Brunton Avenue, JOLIMONT VIC 3002 Great Southern Stand Offices, MCG, 120 Brunton Avenue, JOLIMONT VIC 3002 MCG, 120 Brunton Avenue, JOLIMONT VIC 3002 TAB, MCG, 120 Brunton Avenue, JOLIMONT VIC 3002 Richmond Cricket Club, Punt Road, JOLIMONT VIC 3002 Punt Road Oval, Punt Road, JOLIMONT VIC 3002 House Smithfield Road, FLEMINGTON VIC 3031 Carlton Gardens Tennis Club, Carlton Gardens North, Nicholson Street, CARLTON VIC 3053 Princes Park Bowling Club, Princes Park, 109 Bowen Crescent, CARLTON NORTH VIC 3054 Part Visy Park, Royal Parade, CARLTON NORTH VIC 3054 Corp. Box/Office, Royal Parade, CARLTON NORTH VIC 3054 Visy Park, Royal Parade, CARLTON NORTH VIC 3054 Parkville Tennis Club, 151-153 Royal Parade, PARKVILLE VIC 3052 Princes Hill Tennis Club, Princes Park, 121 Princes Park Drive, CARLTON NORTH VIC 3054 City of Melbourne Bowls Club Inc., Flagstaff Gardens, Dudley Street, WEST MELBOURNE VIC 3003 Melbourne Grammar School Boatshed, Yarra Boathouses, Boathouse Drive, MELBOURNE VIC 3004 Block A-C, 400 Epsom Road, FLEMINGTON VIC 3031 Corp. Box Rod Laver Arena, Melbourne Park, Batman Avenue, MELBOURNE VIC 3004 Part Ground MCG, 120 Brunton Avenue, JOLIMONT VIC 3002 Royal Park Tennis Club, Royal Park, 333 The Avenue, PARKVILLE VIC 3052 Part Westpac Centre, Olympic Park, 10 Olympic Boulevard, MELBOURNE VIC 3004 Melbourne Showgrounds, 276-318 Epsom Road, FLEMINGTON VIC 3032 North Melbourne Recreation Reserve, 204-206 Arden Street, NORTH MELBOURNE VIC 3051 Excess Land Punt Road Oval, Punt Road, JOLIMONT VIC 3002 Flemington - Kensington Bowls Club, 407-411 Racecourse Road, KENSINGTON VIC 3031 120 Todd Road, FISHERMANS BEND VIC 3207 Total Rates - Cultural & Recreational Lands 65 3,674 2,205 980 919 2,143 1,775 980 857 368 42,870 27,558 488 79,616 488 1,837 21,435 3,061 61,243 45,933 611 3,674 3,980 736 488 1,530 3,980 3,367 11,636 488 611 1,959 1,163 20,641 9,187 2,449 1,715 14,698 8,573 307 307 2,048 4,584 397,162 11. INVESTMENT STRATEGY 11.1. Strategy Development The Council maintains an investment portfolio of cash investments, property holdings, car parks and shares in subsidiary and associated companies. Commercial investments are broadly defined to include those assets that are able to achieve a commercial rate of return, most of which also satisfy a strategic objective of Council. The investment portfolio is projected to total $337.78 million as at 30 June 2015. The investment portfolio is expected to yield an annual cash income to council of approximately $25.09 million, a decrease of $3.06 million from the 2013-14 budget. The portfolio is invested in accordance with Council’s investment policy. The profile of the investment portfolio and the returns are expressed in the following charts. Asset Allocation - 30 June 2015 Cash Investments 19% Investment Properties 25% Fixed Interest Investments 4% Car Parks 7% Subsidiaries and Other Investments 45% 66 11.2. Key Targets The investment portfolio strategy and policy have previously been reviewed by the administration and independent external advisors. The following targets were developed: The total return objective of the portfolio is the average 10 year government bond rate + 3 per cent per annum measured over a rolling five year period. To further reduce the volatility of cash returns, the fixed interest allocation was increased from 5 per cent to 10 per cent with asset allocation ranges introduced. Maintain the real value of the investment portfolio. 11.3. Key Influences for 2014-15 In developing the budget for 2014-15 and the financial return from the investment portfolio a number of factors have had an effect on the outcomes. The most significant are: 11.3.1. Cash and Fixed Interest The cash balance is forecast at $76.28 million as at 1 July 2014 and forecast to finish the financial year at $78.06 million, largely due to the higher operating surplus. The cash and fixed interest investments are forecast to return $3.41 million. This is based on an average cash and fixed interest balance of $97.50 million for 2014-15. This is forecast to yield 3.50 per cent. 67 11.3.2. Subsidiaries Decrease in subsidiary income is due to anticipated lower operating profits generated by subsidiaries in 2014-15 based on 2013-14 actual performance. Lower operating profits decreases the amount of dividends and tax equivalent income payable to Council. 11.3.3. Car Parks Fee revenue will increase from Council Car Parks due to better than expected performance in 2013-14 carrying through to 2014-15. 11.3.4. Investment Properties Net property rental income property rental is projected to decrease due to works planned to be carried out on certain properties making them unavailable for rent for periods of the year as well as some Council indirect costs being allocated to investment property assets for the first time in the 2014-15 budget. Table 1 provides a summary of the changes in the returns for the assets contained in the investment portfolio in the budget for 2014-15. It should be noted that these amounts are contained in the categories of revenue shown in the budget document. The amounts will not, in all cases represent the total revenue reported. As the investment portfolio, includes most, but not all of the assets and activities generating revenue for the Council. Table 1 Source Interest Income Inter Company Revenue - Subsidiaries - Other Property Investments - Off Street Car Parks (Net) - Property Rentals (Net) TOTAL Budget 30 Jun 2014 $'000's 3,076 Budget 30 June 2015 $'000's 3,412 16,286 42 13,287 0 (2,999) (42) 3,936 4,815 28,155 4,207 4,186 25,092 271 (629) (3,063) Variance $'000's 336 The initiatives and strategies described above are expected to result in the investment portfolio contributing $25.09 million to council’s total revenue. The value of these investments and returns included in the proposed budget for 2014-15. 68 Table 2 Investment properties City Square car park Council House car park Elgin St car park Total car parks Total Subsidiary & Other Investments Cash & Fixed Investments TOTAL INVESTMENT PORTFOLIO Beginning End 2014-15 Net Income 2014-15 84,522 84,522 4,186 Return % 4.95% 13,800 4,830 4,997 23,627 13,800 4,830 4,997 23,627 2,720 1,029 458 4,207 19.71% 21.30% 9.17% 17.81% 151,564 151,564 13,287 8.77% 76,275 78,063 3,412 3.50% 335,988 337,776 25,092 7.45% 69 APPENDIX A - BUDGET STATEMENTS STANDARD INCOME STATEMENT STANDARD BALANCE SHEET STANDARD STATEMENT OF CASH FLOWS RECONCILIATION OF BUDGETED OPERATING RESULT AND NET CASH FLOWS STANDARD STATEMENT OF CAPITAL WORKS SOURCES OF FUNDING – OPERATING SOURCES OF FUNDING WORKS This section sets out the budgeted financial statements (including the standard statements) for 2014-15 in detail. This information is the basis of the disclosure and analysis. Please note all financial statements have been prepared using the corporate financial system and rounded to the nearest thousand. 70 STANDARD INCOME STATEMENT AS AT 30 JUNE 2015 Actual 2012-13 $000s Budget 2013-14 $000s Budget 2014-15 $000s Variance $000s REVENUE 203,576 Rates Grants and Subsidies 10,561 Operating 29,814 Capital Contributions 40,021 Parking Fees 41,858 Parking Fines 21,483 Sundry Fees & Charges 7,126 Property Rental and Hire 5,776 Sales & Recoveries 5,907 Finance Income 19,973 Intercompany Revenue 1,468 Gain on Investment Revaluation 387,563 Total Revenue 215,568 230,116 14,548 10,682 13,097 47,364 40,419 21,466 7,467 3,155 3,506 16,372 0 379,096 11,093 18,237 46,376 40,711 22,997 7,326 4,877 3,755 13,373 0 398,862 411 5,140 (988) 292 1,531 (141) 1,722 249 (2,999) 0 19,766 EXPENDITURE Employee Costs Materials & Services Finance & Insurance Costs Grants & Contributions Government Taxes & Levies Depreciation - Other Assets Maintenance Financial Performance Expenditure 128,199 146,944 10,188 12,656 1,335 55,332 10,399 365,053 133,686 146,889 10,249 12,476 1,545 57,323 12,238 374,405 (5,487) 55 (61) 180 (210) (1,991) (1,839) (9,352) 102 Net Gain or Loss on disposal of Assets 30,603 Result from Ordinary Activities 154 14,197 146 24,603 (8) 10,406 (13,097) (18,237) (5,140) 1,099 6,365 5,266 117,939 147,559 10,952 13,465 4,065 52,822 10,261 357,062 (29,814) Less Capital Contributions 789 Underlying Surplus/(Deficit) 71 STANDARD BALANCE SHEET AS AT 30 JUNE 2015 Actual 2012-13 $000s Budget 2013-14 $000s ASSETS Current Assets Cash Assets Current Receivables Other Current Assets Total Current Assets Budget 2014-15 $000s Variance $000s 76,275 24,041 3,900 104,216 78,063 26,915 3,900 108,877 1,787 2,874 0 4,661 31,632 89,446 3,337,959 3,459,037 3,563,253 31,632 89,446 3,521,978 3,643,056 3,751,934 0 0 184,019 184,019 188,681 62,499 24,019 200 86,718 69,135 25,039 200 94,373 6,636 1,020 0 7,655 6,307 6,307 93,025 6,577 6,577 100,951 270 270 7,926 3,419,336 NET ASSETS 3,470,228 3,650,983 180,755 Equity 1,811,036 Accumulated Surplus 1,608,300 Reserves 3,419,336 TOTAL EQUITY 1,783,402 1,686,826 3,470,228 1,808,004 1,842,979 3,650,983 24,602 156,153 180,755 102,876 29,131 3,960 135,967 32,856 108,149 3,219,798 3,369,541 3,505,508 56,660 26,351 518 83,529 Non Current Assets Investments Investment Properties Fixed Assets Total Non Current Assets TOTAL ASSETS LIABILITIES Current Liabilities Payables Employee Entitlements Provisions Total Current Liabilities Non Current Liabilities 2,643 Employee Entitlements 2,643 Total Non Current Liabilities 86,172 TOTAL LIABILITIES 72 STANDARD STATEMENT OF CASH FLOWS FOR YEAR ENDED 30 JUNE 2015 Actual 2012-13 $000s Budget 2013-14 $000s Budget 2014-15 $000s Variance $000s Statement of Cash Flow 333,641 2,255 8,306 32,274 5,867 33,697 CASH INFLOWS/(OUTFLOWS) FROM OPERATING ACTIVITIES Receipts Rates, Fees and Charges Contributions Grants - operating Grants - capital Interest Received Other (Including Sales and Recoveries) Payments (125,178) Employee Cost (204,883) Materials and Services (5,176) Financial Cost 80,803 Net Cash Provided by Operating Activities 1,726 (111,422) 5,000 (104,696) CASH INFLOWS/(OUTFLOWS) FROM INVESTING ACTIVITIES Proceeds from sale of Property Plant & Equip (Payments) Receipts for Property, Infrastructure, Plant and Equipment Sale of Investment Net Cash Used in Investing Activities CASH INFLOWS/(OUTFLOWS) FROM FINANCING ACTIVITIES (2,716) Finance Costs (2,716) Net Cash Used in Financing Activities 316,638 2,888 7,794 13,097 3,505 38,935 324,467 2,794 8,299 18,237 3,755 38,436 7,829 (94) 505 5,140 250 (499) (126,404) (172,191) (10,188) (132,396) (166,511) (10,249) (5,992) 5,680 (61) 74,074 86,832 12,758 726 816 90 (89,725) 0 (88,999) 0 0 (85,860) 0 (85,044) 3,865 0 3,955 0 0 0 0 (26,609) Net increase/(decrease) in cash held (14,925) 1,788 16,712 129,485 Cash at beginning of the financial year 102,876 Cash at end of the financial year 91,200 76,275 76,275 78,063 (14,925) 1,787 73 RECONCILIATION OF BUDGETED OPERATING RESULT AND NET CASH FLOWS FOR THE YEAR ENDING 30 JUNE 2015 Actual 2012-13 $000s Budget 2013-14 $000s Budget 2014-15 $000s 51,214 Net Surplus/(deficit) from operations 14,197 24,603 10,406 55,332 0 4,545 57,323 0 4,906 1,991 0 361 74,074 86,832 12,758 (89,725) 726 (85,860) 816 3,865 90 (14,925) 1,788 16,713 91,200 76,275 76,275 78,063 (14,925) 1,787 52,822 (102) (3,769) (1,468) (20,610) 78,087 (111,422) 1,726 5,000 (26,609) Add back: Depreciation & amortisation Loss/(Profit) on sale of assets Net movement in working capital Increase in Investment Contributed Assets Funds available for investment activities Capital Expenditure Proceeds from asset sales Sale of Investment Net Cash inflow/(outflow) 129,485 Bank account (Opening balance) 102,876 Bank account (Closing balance) Variance $000s STANDARD STATEMENT OF CAPITAL WORKS Budget 2013-14 $000s Budget 2014-15 $000s 10,399 88,225 12,238 87,133 1,839 (1,092) 24,168 122,792 16,905 116,276 (7,263) (6,516) Council Works Area Maintenance Capital Works Carry forward capital* Capital Works Expenditure *Estimated Carry forward 74 Variance $000s SOURCES OF FUNDING – OPERATING Budget 2014-15 $'000 Operating Recurrent Federal CACPS Program Grants Child Care Benefit Child Centre Grants Immunisation Grants Total Federal 198 1,874 58 26 2,156 State Street Cleaning Grants Victorian Grants Commission Arts Programs Events Melbourne School traffic compliance grants Public Health & Safety Family & Children Ageing & Inclusion Library Services Business & International Total State 126 2,068 72 150 75 31 1,246 2,813 707 50 7,338 Other Tourism Melbourne Events Melbourne Total Other Total Operating Recurrent 125 633 758 10,252 Non-Recurring Grants Federal Urban Landscapes Arts Programs Total Federal 100 679 779 Other Parking & Traffic Events Melbourne Total Other 12 50 62 Total Operating Non-Recurring Total Operating Grants (recurrent and non-recurrent) 841 11,093 75 SOURCES OF FUNDING WORKS Budget 2014-15 $000s Works Source of Funding Grants Recurrent Victorian Grants Commission - State Government Parking Levy - State Government Roads to Recovery - Federal Government Total Recurrent 550 7,000 346 7,896 Non-Recurring Green Infrastructure - State Government Total Non-Recurring 100 100 Total Grants 7,996 Contributions Recurrent Public Open Space - Government and NonGovernment Total Recurrent 6,957 6,957 Non-Recurring Living Fund Victoria - State Government Royal Princess Park - State Government Melbourne Water Non-Government Total Non-Recurring 2,000 7,100 50 300 9,450 Total Contributions 16,407 Proceeds from sale of assets Works Source of Funding 670 25,074 76 APPENDIX B - STATUTORY DISCLOSURES The following section provides details as required by: Section 127 and 158 of the Local Government Act 1989 Part 2 of the Local Government (Finance and Reporting) Regulations 2004 1. STANDARD STATEMENTS The Standard Statements as required by the Local Government (Finance and Reporting) Regulations 2004 are provided in Appendix A. 2. RATES AND CHARGES 2.1. 2.2. The proposed rate in the dollar for each type of rate to be levied: A general rate of 4.0469 cents in the dollar of NAV of all rateable residential properties; A general rate of 4.5901 cents in the dollar of NAV of all rateable non-residential properties; The estimated amount to be raised by each type of rate to be levied: Type of Property Residential Non-Residential Total General Rates 2013-14 $ 67,621,501 146,068,448 213,689,949 2014-15 $ 73,957,372 152,576,169 226,533,541 383,361 1,495,000 397,162 3,185,000 215,568,310 230,115,703 Cultural and Recreational Lands Other rates Total Rates 2.3. The estimated total amount to be raised by general rates is $226,533,541 and $397,162 for Cultural and Recreational Lands (excluding supplementary rates) 2.4. The proposed percentage change in rates and the rate in the dollar for each type of rate to be levied, compared to that of the previous financial year are: 77 Percentage Percentage Change Change In Rate in $ In Rates Residential -0.3% 3.6% Non-Residential -3.9% 3.6% Cultural and Recreational Lands N/A 3.6% Note: Percentage change in rates includes 2013-14 supplementary valuations. Type of Property 2.5. The number of assessments for each type of rate to be levied compared to the previous year: Type of Property Exempt Residential Non-Residential Cultural and Recreational Lands The total number of assessments is: 2013-14 1,553 67,767 20,310 42 89,672 2014-15 1,415 72,132 22,321 42 95,910 2.6. The basis of valuation to be used is the Net Annual Value (NAV). 2.7. The estimated total Net Annual Value of land in respect of which each type of rate is to be levied compared with the previous year: 2013-14 $ 740,685,635 1,665,944,015 3,059,415,917 52,256,665 5,518,302,232 Type of Property Exempt Residential Non-Residential Cultural and Recreational Lands Total 2.8. 2.9. 2014-15 $ 779,080,071 1,827,506,786 3,324,027,131 54,655,922 5,985,269,910 The City of Melbourne does not propose to levy any rates or charges under the following sections of the Act: Section 159 – Municipal charge Section 162 – Service rate and service charge Section 163 – Special rate and special charge There are no known significant changes, which may affect the estimated amounts to be raised by rates and charges. However, the total amount to be raised by rates and charges may be affected by: The making of supplementary valuations; The variation of returned levels of value (e.g. valuation objections & appeals); Changes of use of land such that rateable land becomes non-rateable land and vice versa; Changes of use of land such that residential land becomes commercial land and vice versa. 78 3. DIFFERENTIAL RATES 3.1. Rates to be levied The rate and amount of rates payable in relation to land in each differential category are: A general rate of 4.0469 cents in the dollar of NAV for all rateable residential properties; A general rate of 4.5901 cents in the dollar of NAV for all rateable non-residential properties; Each differential rate will be determined by multiplying the Net Annual Value of each rateable land (categorised by the characteristics described below) by the relevant rates indicated above. 3.2. Residential land Residential land is any land, which is: 3.3. used primarily for residential purposes (but does not include serviced apartments, apartment houses, boarding houses, hotels, motels or hostels); or vacant land but which by reason of its locality, zoning or other relevant criteria would, if developed, be or be likely to be used primarily for residential purposes. Non-Residential land All rateable land (including vacant and unoccupied land), wherever located in the municipality and howsoever zoned under the planning scheme, which does not have the characteristics of Residential land. The classification of land which is improved will be determined by the occupation of that land and have reference to the planning scheme zoning 3.4. History of the Rate in $ Historical Rates Cents in the $ 14 12 Rate Revenue $M $250 13.0 13.0 $200 10.4 9.8 10 9.0 8.2 7.9 8.1 6.4 6.6 $150 8 7.7 6 7.7 7.7 6.4 7.0 5.7 4 6.5 5.8 6.0 5.0 5.2 6.0 6.2 5.4 5.5 4.6 4.7 5.2 5.2 5.8 5.1 4.6 4.8 4.6 3.9 4.1 4.0 $100 5.3 4.4 4.4 $50 2 0 $0 General Rates Non-residential cents in $ 79 Residential cents in $ APPENDIX C - STRATEGIC RESOURCE PLAN COMPREHENSIVE INCOME STATEMENT BALANCE SHEET STATEMENT OF CHANGES IN EQUITY STATEMENT OF CASH FLOWS STATEMENT OF CAPITAL WORKS STATEMENT OF HUMAN RESOURCES SUMMARY OF PLANNED HUMAN RESOURCES EXPENDITURE This section includes Council’s forecast financial performance and financial and cash positions for the years 201415 to 2017-18. Please note all financial statements have been prepared using the corporate financial system and rounded to the nearest thousand. 80 COMPREHENSIVE INCOME STATEMENT FOR THE FOUR YEARS ENDING 30 JUNE 2018 Budget 2014-15 $'000 Plan 2015-16 $'000 Plan 2016-17 $'000 Plan 2017-18 $'000 REVENUE Rates Grants and Subsidies Operating Recurrent Operating Non-Recurrent Capital Contributions Recurrent Capital Contributions Non-Recurrent Parking Fees Parking Fines Sundry Fees & Charges Property Rental and Hire Sales & Recoveries Finance Income Intercompany Revenue # Total Revenue 230,116 243,819 259,497 274,561 10,252 841 8,788 9,450 46,376 40,711 22,997 7,326 4,877 3,755 13,373 398,862 10,457 858 9,511 10,228 46,420 40,839 23,595 7,516 3,404 3,705 8,659 409,011 10,730 880 9,329 10,033 46,464 41,248 24,209 7,711 5,134 3,849 8,881 427,965 11,008 903 9,561 10,281 46,767 41,661 24,839 7,912 3,667 3,993 9,110 444,263 EXPENDITURE Employee Costs Materials & Services Finance & Insurance Costs Grants & Contributions Government Taxes & Levies Depreciation - Other Assets Maintenance Financial Performance Expenditure 133,686 146,889 10,249 12,476 1,545 57,323 12,238 374,405 140,370 151,094 10,556 12,541 1,591 59,700 12,682 388,534 146,687 155,334 10,873 12,917 1,639 62,640 13,817 403,907 153,288 159,702 11,199 13,305 1,688 65,129 13,217 417,528 Net Gain or Loss on disposal of Assets Result from Ordinary Activities 146 24,603 0 20,477 0 24,058 0 26,735 (18,237) (19,739) (19,362) (19,842) 4,696 6,893 Less Capital Contributions Underlying Surplus/(Deficit) 6,365 738 # Note the reduction in intercompany revenue from 2015-16 onwards reflects the assumption that all returns from the Queen Victoria Market will be directed to the QVM renewal fund not Council. 81 BALANCE SHEET FOR THE FOUR YEARS ENDING 30 JUNE 2018 Budget 2014-15 $'000 ASSETS Current Assets Cash Assets Current Receivables Other Current Assets Total Current Assets Plan 2015-16 $'000 Plan 2016-17 $'000 Plan 2017-18 $'000 78,063 26,915 3,900 108,877 79,672 26,893 3,900 110,465 83,478 27,324 3,900 114,702 93,730 27,110 3,900 124,740 31,632 89,446 3,521,978 3,643,056 3,751,934 31,632 89,446 3,654,861 3,775,939 3,886,404 31,632 89,446 3,792,520 3,913,598 4,028,300 31,632 89,446 3,934,468 4,055,546 4,180,286 69,135 25,039 200 94,373 70,205 26,281 200 96,686 68,873 27,454 200 96,527 69,046 28,681 200 97,927 6,577 6,577 100,951 6,906 6,906 103,592 7,217 7,217 103,744 7,542 7,542 105,468 NET ASSETS 3,650,983 3,782,812 3,924,556 4,074,817 Equity Accumulated Surplus Reserves TOTAL EQUITY 1,808,004 1,842,979 3,650,983 1,828,481 1,954,331 3,782,812 1,852,539 2,072,016 3,924,556 1,879,275 2,195,543 4,074,817 Non Current Assets Investments Investment Properties Fixed Assets Total Non Current Assets TOTAL ASSETS LIABILITIES Current Liabilities Payables Employee entitlements Provisions Total Current Liabilities Non Current Liabilities Employee entitlements Total Non Current Liabilities TOTAL LIABILITIES 82 STATEMENT OF CHANGES IN EQUITY FOR THE FOUR YEARS ENDING 30 JUNE 2018 Total Accumulated Surplus $'000 $'000 2015 Balance at beginning of the financial year Adjustment on change in accounting policy Net Surplus New asset revaluation increment (decrement) Impairment losses on revalued assets Reversal of impairment losses on revalued assets Transfers to reserves Transfers from reserves Balance at end of the financial year 2016 Balance at beginning of the financial year Adjustment on change in accounting policy Net Surplus New asset revaluation increment (decrement) Impairment losses on revalued assets Reversal of impairment losses on revalued assets Transfers to reserves Transfers from reserves Balance at end of the financial year 2017 Balance at beginning of the financial year Adjustment on change in accounting policy Net Surplus New asset revaluation increment (decrement) Impairment losses on revalued assets Reversal of impairment losses on revalued assets Transfers to reserves Transfers from reserves Balance at end of the financial year 2018 Balance at beginning of the financial year Adjustment on change in accounting policy Net Surplus New asset revaluation increment (decrement) Impairment losses on revalued assets Reversal of impairment losses on revalued assets Transfers to reserves Transfers from reserves Balance at end of the financial year 3,470,227 1,783,401 Revaluation Reserve $'000 1,679,685 Other Reserves $'000 7,141 24,603 156,153 3,650,983 1,808,004 1,835,838 890 (890) 7,141 3,650,983 1,808,004 1,835,838 7,141 20,477 111,352 3,782,812 1,828,481 1,947,190 890 (890) 7,141 3,782,812 1,828,481 1,947,190 7,141 24,058 117,685 3,924,556 1,852,539 2,064,875 890 (890) 7,141 3,924,556 1,852,539 2,064,875 7,141 26,734 123,526 4,074,817 83 1,879,273 2,188,402 890 (890) 7,141 STATEMENT OF CASH FLOWS FOR THE FOUR YEARS ENDING 30 JUNE 2018 Budget 2014-15 $'000 Plan 2015-16 $'000 Plan 2016-17 $'000 Plan 2017-18 $'000 Statement of Cash Flow CASH INFLOWS/(OUTFLOWS) FROM OPERATING ACTIVITIES Receipts Rates, Fees and Charges Grants and Other Contributions Interest Received Other (Including Sales and Recoveries) Payments Employee Cost Materials and Services Financial Cost Net Cash Provided by Operating Activities 324,467 29,331 3,755 38,436 341,501 31,054 3,705 32,773 357,449 30,972 3,849 35,264 374,152 31,753 3,993 34,579 (132,396) (166,511) (10,249) (138,799) (176,838) (10,556) (145,203) (185,039) (10,873) (151,737) (187,739) (11,199) 86,832 82,840 86,419 93,802 816 0 0 0 CASH INFLOWS/(OUTFLOWS) FROM INVESTING ACTIVITIES Proceeds from sale of Property Plant & Equip (Payments) Receipts for Property, Infrastructure, Plant and Equipment (85,860) (81,231) (82,613) (83,550) Net Cash Used in Investing Activities (85,044) (81,231) (82,613) (83,550) 1,788 1,609 3,806 10,252 76,275 78,063 78,063 79,672 79,672 83,478 83,478 93,730 Net increase/(decrease) in cash held Cash at beginning of the financial year Cash at end of the financial year 84 STATEMENT OF CAPITAL WORKS PROGRAM FOR THE FOUR YEARS ENDING 30 JUNE 2018 Property Buildings Building improvements Heritage buildings Total Property Plant and equipment Plant, machinery and equipment Fixtures, fittings and furniture Computers and telecommunications Heritage plant and equipment Library books Total plant and equipment Infrastructure Roads Bridges Footpaths and cycleways Drainage Recreational, leisure and community facilities Parks, open space and streetscapes Kerb and channel Other infrastructure Total infrastructure Total capital works Represented by: New asset expenditure Asset renewal expenditure Asset upgrade/expansion expenditure Total capital works expenditure Budget 2014-15 $'000 Plan 2015-16 $'000 Plan 2016-17 $'000 Plan 2017-18 $'000 516 5,974 1,399 7,889 350 6,032 2,000 8,382 350 6,596 5,180 12,126 421 6,435 2,968 9,824 2,558 1,025 8,000 450 919 12,952 2,398 35 8,500 450 1,127 12,510 2,336 170 10,500 450 1,262 14,718 2,522 425 9,340 467 1,144 13,898 9,247 400 10,650 4,250 9,170 28,320 2,300 1,955 66,292 87,133 9,247 1,300 11,640 7,200 4,200 28,737 2,530 2,175 67,029 87,921 9,247 500 11,710 5,700 1,435 26,797 2,760 2,625 60,774 87,618 9,597 761 11,761 5,932 5,121 29,006 2,626 2,337 67,141 90,863 40,978 42,153 4,002 87,133 35,978 46,373 5,570 87,921 33,765 49,388 4,465 87,618 38,301 47,706 4,856 90,863 85 STATEMENT OF HUMAN RESOURCES FOR THE FOUR YEARS ENDING 30 JUNE 2018 Budget 2014-15 $'000 Staff Expenditure Employee Costs - operating Employee Costs - capital Total Staff Exependiture Plan 2015-16 $'000 Plan 2017-18 $'000 133,686 140,370 146,687 153,288 133,686 140,370 146,687 153,288 FTE Employees Total Staff Numbers Plan 2016-17 $'000 1,309.33 1,309.33 FTE 1,326.70 1,326.70 FTE 1,345.20 1,345.20 FTE 1,364.75 1,364.75 SUMMARY OF PLANNED HUMAN RESOURCES EXPENDITURE FOR THE FOUR YEARS ENDING 30 JUNE 2018 City Planning and Infrastructure - Permanent full time - Permanent part time Total City Planning and Infrastructure Corporate Business - Permanent full time - Permanent part time Total Corporate Business Community Development - Permanent full time - Permanent part time Total Community Development City Design - Permanent full time - Permanent part time Total City Design City Business - Permanent full time - Permanent part time Total City Business City Governance, Learning and Development - Permanent full time - Permanent part time Total City Governance, Learning and Development Total casuals and other Total staff expenditure Budget 2014-15 $'000 Plan 2015-16 $'000 Plan 2016-17 $'000 Plan 2017-18 $'000 37,144 847 37,991 39,001 889 39,890 40,756 929 41,685 42,590 971 43,561 19,770 730 20,500 20,758 766 21,525 21,693 801 22,493 22,669 837 23,506 34,671 3,810 38,481 36,405 4,000 40,405 38,043 4,180 42,223 39,755 4,368 44,123 9,572 17 9,589 10,051 18 10,069 10,503 19 10,522 10,976 19 10,996 17,261 490 17,751 18,124 514 18,638 18,940 537 19,477 19,792 561 20,353 5,975 40 6,274 42 6,556 44 6,851 46 6,015 3,359 133,686 6,316 3,527 140,370 6,600 3,686 146,687 6,897 3,852 153,288 86 City Planning and Infrastructure - Permanent full time - Permanent part time Total City Planning and Infrastructure Corporate Business - Permanent full time - Permanent part time Total Corporate Business Community Development - Permanent full time - Permanent part time Total Community Development City Design - Permanent full time - Permanent part time Total City Design City Business - Permanent full time - Permanent part time Total City Business City Governance, Learning and Development - Permanent full time - Permanent part time Total City Governance, Learning and Development Total casuals and other Total staff numbers Budget 2014-15 FTE Plan 2015-16 FTE Plan 2016-17 FTE Plan 2017-18 FTE 377.00 11.30 388.30 382.00 11.45 393.45 387.33 11.61 398.94 392.96 11.78 404.74 171.00 6.04 177.04 173.27 6.12 179.39 175.68 6.21 181.89 178.24 6.30 184.53 372.64 47.20 419.84 377.58 47.83 425.41 382.85 48.49 431.34 388.41 49.20 437.61 79.00 0.25 79.25 80.05 0.25 80.30 81.16 0.26 81.42 82.34 0.26 82.60 154.00 6.71 160.71 156.04 6.80 162.84 158.22 6.89 165.11 160.52 6.99 167.51 48.00 0.53 48.64 0.54 49.31 0.54 50.03 0.55 48.53 35.66 1,309.33 49.17 36.13 1,326.70 49.86 36.64 1,345.20 50.58 37.17 1,364.75 87 APPENDIX D - KEY FINANCIAL INDICATORS Budget 2013-14 $'000 Budget 2014-15 $'000 0.3% 2,426 998 4,145 159 59% 6.3% 1.7% 2,398 1,025 3,964 261 60% 7.4% 0.2% 2,492 1,091 4,041 213 63% 7.6% 1.1% 2,559 1,153 4,050 241 64% 7.2% 1.6% 2,606 1,200 4,026 258 65% 7.1% + + + + + + 1,056 1.21:1 1.7% 20.2% 1,069 1.15:1 1.7% 22.8% 1,078 1.14:1 1.8% 21.3% 1,040 1.19:1 1.8% 21.3% 1,017 1.28:1 1.8% 22.1% + + 89% 107% 1.78:1 83% 41% 74% 102% 1.73:1 101% 38% 78% 99% 1.69:1 102% 34% 79% 101% 1.62:1 105% 32% 73% 94% 1.61:1 112% 31% + Strategic Resource Plan 2015-16 2016-17 2017-18 $'000 Trend +/o/ Financial Performance Underlying surplus/(deficit) / underlying revenue Average rates and charges per assessment Average residential rates and charges per assessment Average operating expenditure per assessment Operating result per assessment Rate revenue / underlying revenue Grants / total revenue Financial Position Average liabilities per assessment Current assets : Current liabilities Non current liabilities / Own Source of revenue Net operating cash flows / underlying revenue Capital expenditure Renewal Renewal and maintenance Capital expenditure : depreciation Cash from operations / net capital outlays Capital works / rate revenue Key to Trend + Budgeted increasing trend Neutral Budgeted decreasing trend Notes to indicators Financial Performance Stronger overall operating financial performance is expected in 2014-15 as represented by the ratios above with an increased underlying surplus. Ratio remains positive over the next four years Financial Position The trend indicates a modest increase in the Council’s short term liquidity financial position over the next four years. 88 APPENDIX E - COUNCIL WORKS PROGRAM 2014-2015 Program Code Title Cash Grants Contributions Parking Levy Grants External Proceeds from Sale of Assets Public Open Space Total Project Cost CAPITAL WORKS PROGRAM PROPERTY BUILDINGS New Asset Expenditure Property Services New Works 185,951 0 0 0 0 0 185,951 Kensington Town Hall - Lighting, Signage and Furniture 330,000 0 0 0 0 0 330,000 Total New Asset Expenditure 515,951 0 0 0 0 0 515,951 TOTAL BUILDINGS 515,951 0 0 0 0 0 515,951 751,208 0 0 0 0 0 751,208 751,208 0 0 0 0 0 751,208 1,615,984 0 0 0 0 0 1,615,984 843,282 0 0 0 0 0 843,282 701,545 0 0 0 0 0 701,545 3,160,811 0 0 0 0 0 3,160,811 660,000 0 0 0 0 660,000 Property Services Efficiency Upgrade Total Asset upgrade/ expansion expenditure 1,402,034 0 0 0 0 1,402,034 2,062,034 0 0 0 0 0 2,062,034 TOTAL BUILDING IMPROVEMENTS 5,974,053 0 0 0 0 0 5,974,053 500,000 0 0 0 0 0 500,000 Total New Asset Expenditure 500,000 0 0 0 0 0 500,000 Asset Renewal Expenditure 14G3406R Cooks' Cottage Discovery Centre Redevelopment 190,000 0 0 0 0 0 190,000 14G3523R 250,000 0 0 0 0 0 250,000 13G3520N 14G3504N BUILDING IMPROVEMENTS New Asset Expenditure 14G3507N Property Services Sustainable Management New Works Total New Asset Expenditure Asset Renewal Expenditure 14G3510R Property Services Corporate Renewal Works 14G3512R Property Services Community Renewal Works 14G3513R Property Services Commercial Renewal Works Total Asset Renewal Expenditure Asset upgrade/ expansion expenditure 14G3516R Property Services DDA - Physical Access Works 14G3528R HERITAGE BUILDINGS New Asset Expenditure 14G1301N 14G3527R Queen Victoria Market Precinct Renewal Project QVM - Light Replacement Sheds D-E QVM - Minor New Works 159,000 0 0 0 0 0 159,000 Total Asset Renewal Expenditure 599,000 0 0 0 0 0 599,000 Asset upgrade/ expansion expenditure 14G3517R QVM - Upgrade Fire Services D Shed 200,000 0 0 0 0 0 200,000 89 Program Code Title Cash Grants Parking Levy Grants 14G3526R QVM - Substation Cabling A-E Contributions External Proceeds from Sale of Assets Public Open Space Total Project Cost 100,000 0 0 0 0 0 300,000 0 0 0 0 0 300,000 1,399,000 0 0 0 0 0 1,399,000 7,889,004 0 0 0 0 0 7,889,004 Installation of Solar Panel Arrays 164,623 0 0 0 0 0 164,623 New Christmas Decorations - City D - New Christmas Decorations Docklands New Moomba Parade Float Beds 250,000 0 0 0 0 0 250,000 150,000 0 0 0 0 0 150,000 Total Asset upgrade/ expansion expenditure TOTAL HERITAGE BUILDINGS TOTAL PROPERTY 100,000 PLANT & EQUIPMENT PLANT, MACHINERY & EQUIPMENT New Asset Expenditure 14G1601N 14G2811N 14G2812N 14G2815N 69,000 0 0 0 0 0 69,000 109,800 0 0 0 0 0 109,800 Furniture Equipment & Whitegoods Acquisitions Kensington Town Hall - AV/IT 14G7611N Fitout. Total New Asset Expenditure 310,000 0 0 0 0 0 310,000 1,053,423 0 0 0 0 0 1,053,423 Asset Renewal Expenditure 14G0312R Corporate Fleet Replacement 480,000 0 0 0 670,000 1,150,000 14G2805R Refurbishment of Christmas Decorations - City Refurbishment of Christmas Decorations - Docklands 215,000 0 0 0 0 215,000 40,000 0 0 0 0 40,000 Banner Pole Replacement 100,000 0 0 0 0 835,000 0 0 0 0 670,000 1,505,000 1,888,423 0 0 0 0 670,000 2,558,423 1,000,000 0 0 0 0 0 1,000,000 1,000,000 0 0 0 0 0 1,000,000 25,000 0 0 0 0 0 25,000 14G3502N 14G2806R 14G2814R Total Asset Renewal Expenditure TOTAL PLANT, MACHINERY & EQUIPMENT 100,000 FIXTURES, FITTINGS &FURNITURE New Asset Expenditure 14G3509N Marine Facilities Centre & Waterways Office Fitout Total New Asset Expenditure Asset Renewal Expenditure 14G3404R Melbourne Visitor Centre Refurbishments Total Asset Renewal Expenditure TOTAL FIXTURES, FITTINGS &FURNITURE 25,000 0 0 0 0 0 25,000 1,025,000 0 0 0 0 0 1,025,000 500,000 0 0 0 0 0 500,000 500,000 0 0 0 0 0 500,000 7,500,000 0 0 0 0 0 7,500,000 7,500,000 0 0 0 0 0 7,500,000 8,000,000 0 0 0 0 0 8,000,000 450,000 0 0 0 0 0 450,000 COMPUTERS & TELECOMMUNICATIONS New Asset Expenditure 14G6002N IT New works Total New Asset Expenditure Asset Renewal Expenditure 14G6001R IT renewal Total Asset Renewal Expenditure TOTAL COMPUTERS & TELECOMMUNICATIONS HERITAGE PLANT & EQUIPMENT New Asset Expenditure 13G2319N Public Art Program 2014-15 90 Program Code Title Cash Grants Contributions Parking Levy Grants External Proceeds from Sale of Assets Public Open Space Total Project Cost Total New Asset Expenditure 450,000 0 0 0 0 0 450,000 TOTAL HERITAGE PLANT & EQUIPMENT 450,000 0 0 0 0 0 450,000 Asset Renewal Expenditure 14G7601R Library Collection 919,000 0 0 0 0 0 919,000 Total Asset Renewal Expenditure 919,000 0 0 0 0 0 919,000 TOTAL LIBRARY BOOKS TOTAL PLANT & EQUIPMENT 919,000 0 0 0 0 0 919,000 12,282,423 0 0 0 0 670,000 12,952,423 850,000 0 0 0 0 0 850,000 0 0 3,000,000 0 0 0 3,000,000 850,000 0 3,000,000 0 0 0 3,850,000 Asset Renewal Expenditure 14G0319R Roads to Recovery program 0 347,450 0 0 0 0 347,450 14G0320R Victorian Grants Commission Local Road Funding 0 550,000 0 0 0 0 550,000 14G0321R Roadway Renewal 4,500,000 0 0 0 0 0 4,500,000 4,500,000 897,450 0 0 0 0 5,397,450 5,350,000 897,450 3,000,000 0 0 0 9,247,450 250,000 0 0 0 0 0 250,000 150,000 0 0 0 0 0 150,000 400,000 0 0 0 0 0 400,000 400,000 0 0 0 0 0 400,000 4,000,000 0 0 0 4,000,000 LIBRARY BOOKS INFRASTRUCTURE ROADS New Asset Expenditure 14G0360N Road Safety Program 14G0361N Bicycle Improvement Program Total New Asset Expenditure Total Asset Renewal Expenditure TOTAL ROADS BRIDGES Asset Renewal Expenditure 14G0356R Princess Bridge Bluestone Repair works 14G0368R Arden Street Bridge Strengthening Total Asset Renewal Expenditure TOTAL BRIDGES FOOTPATHS & CYCLEWAYS New Asset Expenditure Major Streetscape Improvements 14G0358N and Design 14G0359N Minor Streetscape Improvements 0 0 300,000 0 0 0 0 0 300,000 Total New Asset Expenditure 300,000 0 4,000,000 0 0 0 4,300,000 Asset Renewal Expenditure 14G0316R Parking Meter Renewal 500,000 0 0 0 0 0 500,000 14G0318R Street Furniture Renewal 300,000 0 0 0 0 0 300,000 14G0322R Footpath Renewal 4,500,000 0 0 0 0 0 4,500,000 14G0324R Docklands New Quay Pavement Refurbishment 0 0 0 0 0 0 0 14G0355R Street Lighting Renewal 700,000 0 0 0 0 0 700,000 6,000,000 0 0 0 0 0 6,000,000 0 0 0 0 350,000 Total Asset Renewal Expenditure Asset upgrade/ expansion expenditure 14G0313R DDA Compliance - Infrastructure 350,000 Total Asset upgrade/ expansion expenditure TOTAL FOOTPATHS & CYCLEWAYS 350,000 0 0 0 0 0 350,000 6,650,000 0 4,000,000 0 0 0 10,650,000 91 Program Code Title Cash Grants Contributions Parking Levy Grants External Proceeds from Sale of Assets Public Open Space Total Project Cost DRAINAGE New Asset Expenditure 14G0357N New Drainage Infrastructure 250,000 0 0 0 0 0 250,000 14G0367N Flood Mitigation New Works 1,000,000 0 0 0 0 0 1,000,000 Total New Asset Expenditure 1,250,000 0 0 0 0 0 1,250,000 Asset Renewal Expenditure 14G0314R Flood Mitigation Renewal 1,000,000 0 0 0 0 0 1,000,000 14G0315R 2,000,000 0 0 0 0 0 2,000,000 3,000,000 0 0 0 0 0 3,000,000 4,250,000 0 0 0 0 0 4,250,000 6,500,000 0 0 0 0 0 6,500,000 Drains renewal Total Asset Renewal Expenditure TOTAL DRAINAGE REC, LEISURE & COMMUNITY FACILITIES New Asset Expenditure 13G7608N Carlton Kathleen Syme Library & Community Centre 14G6501N Smoke Free Areas 150,000 0 0 0 0 0 150,000 14G7503N Docklands Community Boating Hub - Family Services Fit Out 550,000 0 0 0 0 0 550,000 14G7605N Boyd Centre - Improvements. 14G7821N Riverslide Skatepark Total New Asset Expenditure 60,000 0 0 0 0 0 60,000 100,000 0 0 0 0 0 100,000 7,360,000 0 0 0 0 0 7,360,000 Asset Renewal Expenditure 14G2328R North Melbourne Town Hall foyer window 14G7502R Minor Capital Works and Refurbishment for Community Services Buildings 14G7609R East Melbourne Library - Refresh of public spaces 20,000 0 0 0 0 0 20,000 250,000 0 0 0 0 0 250,000 50,000 0 0 0 0 0 50,000 14G7804R 200,000 0 0 0 0 0 200,000 520,000 0 0 0 0 0 520,000 Asset upgrade/ expansion expenditure 14G2306R Arts House staged replacement of lighting and audio theatre stock 25,000 0 0 0 0 0 25,000 14G2307R Arts House replacement of sound equipment (Digital Overhaul) 20,000 0 0 0 0 0 20,000 14G2323R ArtPlay Building Safety and Security Improvement 45,000 0 0 0 0 0 45,000 14G7812R Brens Pavilion Advanced Design & Redevelopment 50,000 0 0 0 0 0 50,000 14G7817R Leased Community Sports Club Lighting Upgrades 150,000 0 0 0 0 0 150,000 1,000,000 0 0 0 0 0 1,000,000 1,290,000 0 0 0 0 0 1,290,000 9,170,000 0 0 0 0 0 9,170,000 Leased Recreation Facility Fencing Works Total Asset Renewal Expenditure 14G7819R Carlton Baths Stage 2 Works New Plant & Equipment and upgrade of Toddlers Pool Total Asset upgrade/ expansion expenditure TOTAL REC, LEISURE & COMMUNITY FACILITIES PARKS, OPEN SPACE & STREETSCAPES New Asset Expenditure 92 Program Code Title Cash Grants Parking Levy Grants 13G7914N 13G8103N 13G8105N 13G8106N Royal and Princes Parks Recreation Infrastructure Improvements Living Victoria Fund Urban Landscapes Climate Adaptation (new streets and associated open spaces) Stormwater Harvesting and Flood Mitigation Schemes Contributions External 0 0 0 7,100,000 Proceeds from Sale of Assets Public Open Space Total Project Cost 0 0 7,100,000 0 0 0 2,000,000 0 0 2,000,000 1,000,000 0 0 0 500,000 0 1,500,000 300,000 0 0 0 0 0 300,000 13G8107N 14G7902N Return to Royal Park Newmarket Reserve Masterplan Implementation Works - Stage 3 0 0 0 0 1,807,494 0 1,807,494 0 0 0 0 350,000 0 350,000 14G7903N Neil Street, Carlton - New Neighbourhood Recreational Areas Stage 2 Princes Park New Playground Facility Melbourne City Marina - New Infrastructure Works 0 0 0 0 2,000,000 0 2,000,000 0 0 0 0 450,000 0 450,000 115,000 0 0 0 0 0 115,000 14G7906N 14G7907N 14G8111N Southbank Boulevard Upgrading 0 0 0 0 300,000 0 300,000 14G8112N MacArthur Square Upgrading 0 0 0 0 500,000 0 500,000 14G8114N Hawke and Adderley Street Park Expansion Railway Place and Miller Street Reserve Park Expansion 0 0 0 0 50,000 0 50,000 0 0 0 0 500,000 0 500,000 Eastwood Street/Rankins Road Open Space Living Rivers fund - Soil moisture recharge project 0 0 0 0 450,000 0 450,000 50,000 0 0 50,000 0 0 100,000 14G8115N 14G8116N 14G8127N 14G8129N Dodds Street linear park, Southbank Total New Asset Expenditure 0 0 0 50,000 50,000 0 100,000 1,465,000 0 0 9,200,000 6,957,494 0 17,622,494 Asset Renewal Expenditure 14G7904R Parks Renewal Works Program 6,435,000 0 0 0 0 0 6,435,000 14G7913R Parks Renewal Tree Planting 1,450,000 0 0 0 0 0 1,450,000 14G8102R Urban Landscapes Climate Adaptation (streets renewal) 2,562,500 0 0 0 0 0 2,562,500 14G8126R Lonsdale Street median renewal and tree replacement 0 0 0 250,000 0 0 250,000 10,447,500 0 0 250,000 0 0 10,697,500 11,912,500 0 0 9,450,000 6,957,494 0 28,319,994 2,300,000 0 0 0 0 0 2,300,000 2,300,000 0 0 0 0 0 2,300,000 2,300,000 0 0 0 0 0 2,300,000 125,000 0 0 0 0 0 125,000 Total Asset Renewal Expenditure TOTAL PARKS, OPEN SPACE & STREETSCAPES KERB & CHANNEL Asset Renewal Expenditure 14G0317R Kerb and Channel Renewal Total New Asset Expenditure TOTAL KERB & CHANNEL OTHER INFRASTRUCTURE Asset Renewal Expenditure 14G0362N Pedestrian Monitoring Program 93 Program Code Title Cash Grants Contributions Parking Levy Grants External Proceeds from Sale of Assets Public Open Space Total Project Cost 300,000 0 0 0 0 0 300,000 400,000 0 0 0 0 0 400,000 1,000,000 0 0 0 0 0 1,000,000 1,825,000 0 0 0 0 0 1,825,000 130,000 0 0 0 0 0 130,000 130,000 0 0 0 0 0 130,000 1,955,000 0 0 0 0 0 1,955,000 TOTAL INFRASTRUCTURE 41,987,500 897,450 7,000,000 9,450,000 6,957,494 0 66,292,444 CAPITAL WORKS PROGRAM 62,158,927 897,450 7,000,000 9,450,000 6,957,494 670,000 87,133,871 CAPITAL GRANTS 14G0328M Traffic Signal installations 685,000 0 0 0 0 0 685,000 14G0329M Street Lighting Upgrade 473,550 0 0 0 0 0 473,550 14G8123M Assessing the Economic Value of Green Infrastructure 10,000 100,000 0 0 0 0 110,000 1,168,550 100,000 0 0 0 0 1,268,550 300,000 0 0 0 0 0 300,000 1,686,000 0 0 0 0 0 1,686,000 14G0365N 14G4011N 14G4902N Urban Renewal Areas concept design development Melbourne Comtemporary Pavilion Implementation of Docklands Community and Place Plan Total New Asset Expenditure Asset Renewal Expenditure 14G0323R Street Trading furniture renewal Total Asset Renewal Expenditure TOTAL OTHER INFRASTRUCTURE MAINTENANCE PROGRAM TOTAL CAPITAL GRANTS MAINTENANCE 14G0301M Bridge Maintenance 14G0302M 14G0303M Street Lighting Maintenance (OMR Charges) Wharf and Marina Maintenance 150,000 0 0 0 0 0 150,000 Street Trading Infrastructure Maintenance Docklands Public Lighting Maintenance (OMR charges) 135,000 0 0 0 0 0 135,000 212,000 0 0 0 0 0 212,000 14G0307M Safe City Camera Maintenance 124,000 0 0 0 0 0 124,000 14G0308M Corporate Security Access and Control Maintenance 108,000 0 0 0 0 0 108,000 14G0309M Bicycle lane maintenance 150,000 0 0 0 0 0 150,000 14G0310M Pump station maintenance 50,000 0 0 0 0 0 50,000 14G0311M Pedestrian monitoring 33,000 0 0 0 0 0 33,000 14G2301M ArtPlay Annual Maintenance of Audio Visual, Theatre Equipment and Furniture Arts House Annual Maintenance of Theatrical Equipment 40,000 0 0 0 0 0 40,000 40,000 0 0 0 0 0 40,000 Signal Annual Maintenance of Audio Visual, Theatre Equipment and Furniture Art & Heritage Collection Maintenance Creative Spaces Maintenance Project Banner Pole Maintenance 51,500 0 0 0 0 0 51,500 160,000 0 0 0 0 0 160,000 50,000 0 0 0 0 0 50,000 14G0304M 14G0305M 14G2302M 14G2304M 14G2310M 14G2311M 14G2801M 14G2803M Maintenance of Christmas Decorations - City 70,000 0 0 0 0 0 70,000 1,085,000 0 0 0 0 0 1,085,000 94 Program Code Title Cash Grants Parking Levy Grants 14G2804M Maintenance of Christmas Decorations - Docklands 14G3407M Melbourne Visitor Booth Maintenance Western Gateway Visitor Signage (Year Four) 14G3408M Contributions External Proceeds from Sale of Assets Public Open Space Total Project Cost 110,000 0 0 0 0 0 110,000 20,000 0 0 0 0 0 20,000 70,000 0 0 0 0 0 70,000 14G3508M Accommodation Modifications 300,000 0 0 0 0 0 300,000 14G3515M Property Services Annual Minor Program Works 1,483,509 0 0 0 0 0 1,483,509 14G4006M 105,000 0 0 0 0 0 105,000 14G4007M Maintenance of City Pedestrian Signage Advance Industrial Design 50,000 0 0 0 0 0 50,000 14G4008M Advance Streetscape Design 50,000 0 0 0 0 0 50,000 14G4009M Advance Architectural Design 100,000 0 0 0 0 0 100,000 14G4010M Built Asset Drawing Management 90,000 0 0 0 0 0 90,000 14G4012M 250,000 0 0 0 0 0 250,000 14G4903M Melbourne Contemporary Pavilion Advanced Urban Design 290,000 0 0 0 0 0 290,000 14G6003M IT Maintenance 880,000 0 0 0 0 0 880,000 14G7501M Replacement of equipment for Children Centres 60,000 0 0 0 0 0 60,000 14G7603M City Library - optimise the amenity of public spaces. 68,700 0 0 0 0 0 68,700 14G7801M Annual Recreation Centre Equipment Renewal & Maintenance Works YMCA Managed Recreation Facility Maintenance Works 150,000 0 0 0 0 0 150,000 200,000 0 0 0 0 0 200,000 14G7811M City Of Melbourne Bowls Club Facility Maintenance 200,000 0 0 0 0 0 200,000 14G7824M Community Recreation Facility Renewal Works Parks Maintenance Works Program Parks Advance Design Works 150,000 0 0 0 0 0 150,000 1,331,000 0 0 0 0 0 1,331,000 14G7802M 14G7912M 14G7914M 100,000 0 0 0 0 0 100,000 14G8113M Pest and Disease Maintenance Budget for the Urban Forest 256,250 0 0 0 0 0 256,250 14G8122M Advanced Design Climate Adaptation landscape projects 210,125 0 0 0 0 0 210,125 TOTAL MAINTENANCE 10,969,084 0 0 0 0 0 10,969,084 TOTAL MAINTENANCE PROGRAM 12,137,634 100,000 0 0 0 0 12,237,634 TOTAL PROGRAM 74,296,561 997,450 7,000,000 9,450,000 6,957,494 670,000 99,371,505 95 APPENDIX F - FEES AND CHARGES SCHEDULE Branch Description Unit of Measure Name of Product or Service Current Price per unit (including GST)* as at 30 June 2014 Revised Price per unit (including GST) from 1 July 2014 * % change Arts & Culture Arts & Culture Arts & Culture Kitchen hire: hire and extensive clean Kitchen hire: hire and standard clean Main Halls: Events - Bump in and Bump out - Main Halls Each Each Per Half Day 0.00 0.00 0.00 390.00 130.90 780.00 NEW NEW NEW Arts & Culture Main Halls: Events - Bump in and Bump out - Main Halls Per Day 0.00 1,299.00 NEW Arts & Culture Main Halls: Events - Bump in and Bump out - Main Halls Per Week 0.00 7,295.00 NEW Community Safety & Wellbeing Relationship Declaration Register: Application & Certificate Per Registration 180.00 250.00 39.00% Community Services Aged Care: ADASS Planned Activity Group (includes meal, transport & activity) - HACC eligible high Range Per Hour To 9.30 9.80 5.00% Community Services Aged Care: ADASS Planned Activity Group (includes meal, transport & activity) - HACC eligible low Range Per Hour From 7.80 8.50 9.00% Community Services Aged Care: Centre based meals Per Meal 6.90 7.10 3.00% Community Services Aged Care: Centre based meals - Full cost recovery rate Each 17.00 13.52 -20.00% Community Services Aged Care: Community Aged Care Packages - (CACP) Fees Range Per Week From 18.50 15.00 -19.00% Community Services Aged Care: Community Aged Care Packages - (CACP) Fees Range Per Week From 62.15 15.00 -76.00% Community Services Aged Care: Delivered Meals - Full cost recovery rate Per Meal 17.00 15.86 -7.00% Community Services Aged Care: Delivered Meals - HACC eligible Per Meal 6.90 7.10 3.00% Community Services Aged Care: Home Care Fees - Full cost recovery rate 7am-6pm Mon-Fri Range Per Hour 38.30 40.60 6.00% Community Services Aged Care: Home Care Fees - HACC eligible high Range Per Hour To 31.00 32.20 4.00% Community Services Aged Care: Home Care Fees - HACC eligible low Range Per Hour From 4.80 5.00 4.00% Community Services Aged Care: Home Care Fees - HACC eligible medium Range Per Hour From 13.90 14.40 4.00% Community Services Aged Care: Home Maintenance Fees - HACC eligible high Range Per Hour To 18.00 20.40 13.00% 96 Branch Description Unit of Measure Name of Product or Service Current Price per unit (including GST)* as at 30 June 2014 Revised Price per unit (including GST) from 1 July 2014 * % change Community Services Aged Care: Home Maintenance Fees - HACC eligible low Range Per Hour From 6.40 7.40 16.00% Community Services Aged Care: Home Maintenance Fees - HACC eligible medium Range Per Hour From 9.60 10.90 14.00% Community Services Aged Care: Linkages Program Fees Range Per Week From 16.90 15.00 -11.00% Community Services Aged Care: Linkages Program Fees Range Per Week From 67.30 15.00 -78.00% Community Services Aged Care: Personal Care Fees - Full cost recovery rate standard hours Range Per Hour 41.15 40.92 -1.00% Community Services Aged Care: Personal Care Fees - HACC eligible high Range Per Hour To 9.20 10.30 12.00% Community Services Aged Care: Personal Care Fees - HACC eligible low Range Per Hour From 1.85 2.10 14.00% Community Services Aged Care: Personal Care Fees - HACC eligible medium Range Per Hour To 4.50 5.00 11.00% Community Services Aged Care: Planned Activity Group - Full cost recovery rate 8am-6pm Mon-Fri Range Per Hour 24.70 17.09 -31.00% Community Services Aged Care: Respite Care Fees - Full cost recovery rate standard hours Range Per Hour 41.15 40.92 -1.00% Community Services Aged Care: Respite Care Fees - HACC eligible high Range Per Hour To 4.70 4.80 2.00% Community Services Aged Care: Respite Care Fees - HACC eligible low Range Per Hour From 3.00 3.10 3.00% Community Services Aged Care: Respite Care Fees - HACC eligible medium Range Per Hour To 4.10 4.20 2.00% Community Services Child Care: Pre - School Per Week 37.50 39.00 4.00% Community Services Child Care: Child Care - Long Day Care Per Day 95.00 98.00 3.00% Community Services Child Care: Child Care - Long Day Care 441.00 453.00 3.00% Community Services Child Care: Regular Part-Time / Occasional Care Full Time Care (Per Week) Per 3.5 Hour Session 48.00 49.00 2.00% Community Services Child Care: Regular Part-Time / Occasional Care 4 Hour Session 54.50 56.00 3.00% Community Services Children Services: Childcare late fee Each 15.00 1.00 -93.00% Community Services Children Services: Consultation Per Hour 25.00 0.00 N/A 97 Branch Description Name of Product or Service Unit of Measure Current Price per unit (including GST)* as at 30 June 2014 Revised Price per unit (including GST) from 1 July 2014 * % change Community Services Children Services: Evening room hire Per Evening 56.00 57.50 3.00% Community Services Children Services: Half day room hire Per Half Day 77.00 79.50 3.00% Community Services Children Services: Key deposit Per Use 109.00 0.00 N/A Community Services Children Services: Room hire Per Day 155.00 160.00 3.00% Community Services Family Services: Baby Capsule Hire Per Unit (6 Months) 47.00 48.00 2.00% Community Services Family Services: Baby Capsule Hire ( Deposit ) (refundable) Per Unit 36.00 37.00 3.00% Community Services Family Services: Baby Capsule Hire (Concession) Per Unit (6 Months) 29.50 30.00 2.00% Community Services Family Services: Community Room Hire (Community Groups ) Max Per Day 35.00 36.00 3.00% Community Strengthening 3D printing Each 0.00 0.05 NEW Community Strengthening Book sales Hardbacks Min Per Item 1.50 2.00 33.00% Community Strengthening Book sales Magazines Min Per Item 0.30 0.50 67.00% Community Strengthening Book sales Paperbacks Min Per Item 0.50 1.00 100.00% Community Strengthening Boyd Community Hub: Assembly Hall -Community Groups within CoM Per Hour 0.00 10.00 NEW Community Strengthening Boyd Community Hub: Assembly Office - Community groups outside CoM Per Hour 0.00 24.00 NEW Community Strengthening Boyd Community Hub: Assembly Hall - Commercial Rate Per Hour 0.00 49.00 NEW Community Strengthening Boyd Community Hub: Principals Office - Community groups outside CoM Per Hour 0.00 7.00 NEW Community Strengthening Boyd Community Hub: Principals Office - Community Groups within CoM Per Hour 0.00 3.00 NEW Community Strengthening Boyd Community Hub: Principals Office -Commercial Rate Per Hour 0.00 15.00 NEW Community Strengthening Boyd Community Hub: Security Bond - refundable Each 0.00 300.00 NEW Community Strengthening Boyd Library and Community Centre - Commercial Rate (Assembly Hall) Per Hour 49.00 0.00 N/A Community Strengthening Boyd Library and Community Centre - Commercial Rate (Principals Office) Per Hour 15.00 0.00 N/A 98 Branch Description Unit of Measure Name of Product or Service Current Price per unit (including GST)* as at 30 June 2014 Revised Price per unit (including GST) from 1 July 2014 * % change Community Strengthening Boyd Library and Community Centre - Community groups - outside CoM (Assembly Office) Per Hour 24.00 0.00 N/A Community Strengthening Boyd Library and Community Centre - Community groups - outside CoM (Principals Office) Per Hour 7.00 0.00 N/A Community Strengthening Boyd Library and Community Centre - Community Groups - within CoM (Assembly Hall) Per Hour 10.00 0.00 N/A Community Strengthening Boyd Library and Community Centre - Community Groups - within CoM (Principals Office) Per Hour 3.00 0.00 N/A Community Strengthening Boyd Library and Community Centre - Security Bond Each 300.00 0.00 N/A Community Strengthening City Library Charges: City Library Gallery deposit Each 300.00 400.00 33.00% Community Strengthening City Library Charges: City Library Gallery Hire exhibition 3 Week Exhibition 800.00 850.00 6.00% Community Strengthening City Library Charges: City Library Gallery Space Hire for approved events - For A 90 Minute Session 195.00 200.00 3.00% Community Strengthening Docklands Hub: Commercial Rate (Atrium Room) Per Hour 49.00 0.00 N/A Community Strengthening Docklands Hub: Commercial Rate (Cinema Room) Per Hour 35.00 0.00 N/A Community Strengthening Docklands Hub: Commercial Rate (Long Room) Per Hour 18.00 0.00 N/A Community Strengthening Docklands Hub: Community Rate - outside CoM (Atrium Room) Per Hour 24.00 0.00 N/A Community Strengthening Docklands Hub: Community Rate - outside CoM (Cinema Room) Per Hour 17.00 0.00 N/A Community Strengthening Docklands Hub: Community Rate - outside CoM (Long Room) Per Hour 9.00 0.00 N/A Community Strengthening Docklands Hub: Community Rate - within CoM (Atrium Room) Per Hour 10.00 0.00 N/A Community Strengthening Docklands Hub: Community Rate - within CoM (Cinema Room) Per Hour 7.00 0.00 N/A Community Strengthening Docklands Hub: Community Rate - within CoM (Long Room) Per Hour 4.00 0.00 N/A Community Strengthening Docklands Hub: Public Liability [ One off fee for casual bookings ] Each 30.00 0.00 N/A Community Strengthening Docklands Hub: Security Bond – refundable Each 300.00 0.00 N/A Community Strengthening Kensington Town Hall: Conference Room Commercial Per Hour 0.00 50.00 NEW 99 Unit of Measure Current Price per unit (including GST)* as at 30 June 2014 Revised Price per unit (including GST) from 1 July 2014 * % change Branch Description Name of Product or Service Community Strengthening Kensington Town Hall: Conference Room - Community Groups outside CoM Per Hour 0.00 25.00 NEW Community Strengthening Kensington Town Hall: Conference Room - Community Groups within CoM Per Hour 0.00 10.00 NEW Community Strengthening Kensington Town Hall: Hot Desk - Commercial Per Hour 0.00 20.00 NEW Community Strengthening Kensington Town Hall: Hot Desk - Community Groups outside CoM Per Hour 0.00 10.00 NEW Community Strengthening Kensington Town Hall: Hot Desk - Community Groups within CoM Per Hour 0.00 4.00 NEW Community Strengthening Kensington Town Hall: Main Hall - Commercial Per Hour 0.00 109.00 NEW Community Strengthening Kensington Town Hall: Main Hall - Community Groups outside CoM Per Hour 0.00 54.50 NEW Community Strengthening Kensington Town Hall: Main Hall - Community Groups within CoM Per Hour 0.00 21.80 NEW Community Strengthening Kensington Town Hall: Meeting Room 1 - Commercial Per Hour 0.00 20.00 NEW Community Strengthening Kensington Town Hall: Meeting Room 1 - Community Groups outside CoM Per Hour 0.00 10.00 NEW Community Strengthening Kensington Town Hall: Meeting Room 1 - Community Groups within CoM Per Hour 0.00 4.00 NEW Community Strengthening Kensington Town Hall: Meeting Room 2 - Commercial Per Hour 0.00 20.00 NEW Community Strengthening Kensington Town Hall: Meeting Room 2 - Community Groups outside CoM Per Hour 0.00 10.00 NEW Community Strengthening Kensington Town Hall: Meeting Room 2 - Community Groups within CoM Per Hour 0.00 4.00 NEW Community Strengthening Kensington Town Hall: Meeting Room 3 - Commercial Per Hour 0.00 15.00 NEW Community Strengthening Kensington Town Hall: Meeting Room 3 - Community Groups outside CoM Per Hour 0.00 8.00 NEW Community Strengthening Kensington Town Hall: Meeting Room 3 - Community Groups within CoM Per Hour 0.00 3.00 NEW Community Strengthening Kensington Town Hall: Meeting Room 4 - Commercial Per Hour 0.00 20.00 NEW Community Strengthening Kensington Town Hall: Meeting Room 4 - Community Groups outside CoM Per Hour 0.00 10.00 NEW Community Strengthening Kensington Town Hall: Meeting Room 4 - Community Groups within CoM Per Hour 0.00 4.00 NEW Community Strengthening Kensington Town Hall: Refundable Room Security Deposit Each 0.00 300.00 NEW 100 Branch Description Unit of Measure Name of Product or Service Current Price per unit (including GST)* as at 30 June 2014 Revised Price per unit (including GST) from 1 July 2014 * % change Community Strengthening Kensington Town Hall: Supper Room - Commercial Per Hour 0.00 65.00 NEW Community Strengthening Kensington Town Hall: Supper Room - Community Groups within CoM Per Hour 0.00 13.00 NEW Community Strengthening Kensington Town Hall: Supper Room -Community Groups outside CoM Per Hour 0.00 32.50 NEW Community Strengthening Kensington Town Hall: Training Room - Commercial Per Hour 0.00 50.00 NEW Community Strengthening Kensington Town Hall: Training Room - Community Groups outside CoM Per Hour 0.00 25.00 NEW Community Strengthening Kensington Town Hall: Training Room - Community Groups within CoM Per Hour 0.00 10.00 NEW Community Strengthening Library at The Dock: Activities Room - Commercial Per Hour 0.00 49.00 NEW Community Strengthening Library at The Dock: Activities Room - Community Groups outside CoM Per Hour 0.00 25.00 NEW Community Strengthening Library at The Dock: Activities Room - Community Groups within CoM Per Hour 0.00 10.00 NEW Community Strengthening Library at The Dock: Animation Zone - Commercial Per Hour 0.00 35.00 NEW Community Strengthening Library at The Dock: Animation Zone - Community Groups outside CoM Per Hour 0.00 18.00 NEW Community Strengthening Library at The Dock: Animation Zone - Community Groups within CoM Per Hour 0.00 7.00 NEW Community Strengthening Library at The Dock: Community Room - Commercial Per Hour 0.00 50.00 NEW Community Strengthening Library at The Dock: Community Room - Community Groups outside CoM Per Hour 0.00 25.00 NEW Community Strengthening Library at The Dock: Community Room - Community Groups within CoM Per Hour 0.00 10.00 NEW Community Strengthening Library at The Dock: Editing Suite and Recording Studio - Commercial Per Hour 0.00 38.00 NEW Community Strengthening Library at The Dock: Editing Suite and Recording Studio - Community Groups outside CoM Per Hour 0.00 19.00 NEW Community Strengthening Library at The Dock: Editing Suite and Recording Studio - Community Groups within CoM Per Hour 0.00 8.00 NEW Community Strengthening Library at The Dock: Gallery and Exhibition Space Commercial Per Week 0.00 1,000.00 NEW Community Strengthening Library at The Dock: Gallery and Exhibition Space Community Groups outside CoM Per Week 0.00 500.00 NEW Community Strengthening Library at The Dock: Gallery and Exhibition Space Community Groups within CoM Per Week 0.00 200.00 NEW 101 Branch Description Unit of Measure Name of Product or Service Current Price per unit (including GST)* as at 30 June 2014 Revised Price per unit (including GST) from 1 July 2014 * % change Community Strengthening Library at The Dock: Gameplay Space - Commercial Per Hour 0.00 10.00 NEW Community Strengthening Library at The Dock: Gameplay Space - Community Groups outside CoM Per Hour 0.00 5.00 NEW Community Strengthening Library at The Dock: Gameplay Space - Community Groups within CoM Per Hour 0.00 2.00 NEW Community Strengthening Library at The Dock: Makers' Space - Commercial (Materials additional) Per Hour 0.00 10.00 NEW Community Strengthening Library at The Dock: Makers' Space - Community Groups outside CoM Per Hour 0.00 5.00 NEW Community Strengthening Library at The Dock: Makers' Space - Community Groups within CoM Per Hour 0.00 2.00 NEW Community Strengthening Library at The Dock: Meeting Room 1 - Commercial Per Hour 0.00 20.00 NEW Community Strengthening Library at The Dock: Meeting Room 1 - Community Groups outside CoM Per Hour 0.00 10.00 NEW Community Strengthening Library at The Dock: Meeting Room 1 - Community Groups within CoM Per Hour 0.00 4.00 NEW Community Strengthening Library at The Dock: Meeting Room 2 - Commercial Per Hour 0.00 15.00 NEW Community Strengthening Library at The Dock: Meeting Room 2 - Community Groups outside CoM Per Hour 0.00 8.00 NEW Community Strengthening Library at The Dock: Meeting Room 2 - Community Groups within CoM Per Hour 0.00 3.00 NEW Community Strengthening Library at The Dock: Meeting Room 3 - Commercial Per Hour 0.00 15.00 NEW Community Strengthening Library at The Dock: Meeting Room 3 - Community Groups outside CoM Per Hour 0.00 8.00 NEW Community Strengthening Library at The Dock: Meeting Room 3 - Community Groupsl within CoM Per Hour 0.00 3.00 NEW Community Strengthening Library at The Dock: Outdoor Activity Space Commercial Per Hour 0.00 18.00 NEW Community Strengthening Library at The Dock: Outdoor Activity Space Community Groups outside CoM Per Hour 0.00 9.00 NEW Community Strengthening Library at The Dock: Outdoor Activity Space Community Groups within CoM Per Hour 0.00 4.00 NEW Community Strengthening Library at The Dock: Performance Space - Commercial Per Hour 0.00 120.00 NEW Community Strengthening Library at The Dock: Performance Space - Community Groups outside CoM Per Hour 0.00 60.00 NEW Community Strengthening Library at The Dock: Performance Space - Community Groups within CoM Per Hour 0.00 24.00 NEW 102 Branch Description Unit of Measure Name of Product or Service Current Price per unit (including GST)* as at 30 June 2014 Revised Price per unit (including GST) from 1 July 2014 * % change Community Strengthening Library at The Dock: Practice Room 1 - Commercial Per Hour 0.00 10.00 NEW Community Strengthening Library at The Dock: Practice Room 1 - Community Groups outside CoM Per Hour 0.00 5.00 NEW Community Strengthening Library at The Dock: Practice Room 1 - Community Groups within CoM Per Hour 0.00 2.00 NEW Community Strengthening Library at The Dock: Practice Room 2 - Commercial Per Hour 0.00 10.00 NEW Community Strengthening Library at The Dock: Practice Room 2 - Community Groups outside CoM Per Hour 0.00 5.00 NEW Community Strengthening Library at The Dock: Practice Room 2 - Community Groups within CoM Per Hour 0.00 2.00 NEW Community Strengthening Library at The Dock: Refundable Room Security Deposit Each 0.00 300.00 NEW Community Strengthening Library bags: Per Bag 2.50 5.00 100.00% Community Strengthening Lost / Damaged magazines Per Item 18.00 0.00 N/A Community Strengthening Lost cards: Per Card 5.50 6.00 9.00% Community Strengthening MLS sustainable cups (large) Per Cup 14.50 0.00 N/A Community Strengthening MLS sustainable cups (small) Per Cup 12.50 0.00 N/A Community Strengthening Overdues: Per Item Per Day 0.30 0.35 17.00% Community Strengthening USB memory stick Per Stick 13.50 0.00 N/A Events Melbourne Event Activity Permit: application fee (applicable to all events and/or activities except public events where attendees > 500 people) Each 50.00 52.50 5.00% Events Melbourne Event Activity Permit: application fee (for public events where attendees > 500 people) Each 200.00 210.00 5.00% Events Melbourne Events: Memorials/Private events - Attendees fee Max Per Event 100.00 105.00 5.00% Events Melbourne Filming Permit - Parks (4 + hours per day) Per Day 1,200.00 1,260.00 5.00% Events Melbourne Filming Permit - Parks (hourly permit) Per Hour 250.00 262.50 5.00% Events Melbourne Filming Permit - Parks (up to 4 hours per day) Per Half Day 600.00 630.00 5.00% 103 Branch Description Unit of Measure Name of Product or Service Current Price per unit (including GST)* as at 30 June 2014 Revised Price per unit (including GST) from 1 July 2014 * % change Events Melbourne Filming unit bases - Parks Per Day/Per Site 500.00 525.00 5.00% Events Melbourne Filming unit bases (students) - Parks Per Day/Per Site 200.00 210.00 5.00% Events Melbourne Hot Air Ballooning - Annual licence Per Annum 255.00 266.82 5.00% Events Melbourne Memorial - Premium Site Per Day 460.00 485.00 5.00% Events Melbourne Memorial - Standard Site Per Day 375.00 395.00 5.00% Events Melbourne Memorial - Unique Site Per Day 415.00 435.00 5.00% Events Melbourne Private Event - Premium Site Max Per Day 460.00 485.00 5.00% Events Melbourne Private Event - Standard Site Max Per Day 375.00 395.00 5.00% Events Melbourne Private Event - Unique Site Max Per Day 415.00 435.00 5.00% Events Melbourne Promotional Activity permits (up to 2 hours) Max Per Day 1,000.00 1,050.00 5.00% Events Melbourne Promotional Activity permits (up to 4 hours) Per Half Day 1,500.00 1,575.00 5.00% Events Melbourne Promotional Activity permits (up to 8 hours) Per Day 2,000.00 2,100.00 5.00% Events Melbourne Public Events: Public Ticketed/Non-Ticketed events/Parades - Attendees fee Max Per Event 2,000.00 2,100.00 5.00% Events Melbourne Public Events: Public Ticketed/Non-Ticketed events/Parades - Premium Site (Large) Per Day/Per Site 4,500.00 4,725.00 5.00% Events Melbourne Public Events: Public Ticketed/Non-Ticketed events/Parades - Premium Site (Medium) Per Day/Per Site 3,500.00 3,675.00 5.00% Events Melbourne Public Events: Public Ticketed/Non-Ticketed events/Parades - Premium Site (Small) Per Day/Per Site 1,250.00 1,310.00 5.00% Events Melbourne Public Events: Public Ticketed/Non-Ticketed events/Parades - Standard Site (Large) Per Day/Per Site 2,250.00 2,360.00 5.00% Events Melbourne Public Events: Public Ticketed/Non-Ticketed events/Parades - Standard Site (Medium) Per Day/Per Site 1,750.00 1,835.00 5.00% Events Melbourne Public Events: Public Ticketed/Non-Ticketed events/Parades - Standard Site (Small) Per Day/Per Site 625.00 655.00 5.00% Events Melbourne Public Events: Public Ticketed/Non-Ticketed events/Parades - Unique Site (Large) Per Day/Per Site 3,375.00 3,545.00 5.00% Events Melbourne Public Events: Public Ticketed/Non-Ticketed events/Parades - Unique Site (Medium) Per Day/Per Site 2,625.00 2,755.00 5.00% 104 Branch Description Unit of Measure Name of Product or Service Current Price per unit (including GST)* as at 30 June 2014 Revised Price per unit (including GST) from 1 July 2014 * % change Events Melbourne Public Events: Public Ticketed/Non-Ticketed events/Parades - Unique Site (Small) Per Day/Per Site 937.50 985.00 5.00% Events Melbourne Signage Hubs - installation and removal fees for a single poster Per Signage Hub 247.50 260.00 5.00% Events Melbourne Standard Banners - duration/usage fee (per banner pole) Per Day 2.75 2.90 5.00% Events Melbourne Standard Banners - installation and removal (per banner pole) Each 84.98 89.25 5.00% Events Melbourne Super Banners - duration/usage fee (per banner pole) Per Day 4.50 4.75 6.00% Events Melbourne Super Banners - installation and removal (per banner pole) Each 60.50 63.50 5.00% Events Melbourne Tour Operator License - Annual License Per Annum 255.00 266.82 5.00% Events Melbourne Wedding Permits - Premium site Per Booking 550.00 575.00 5.00% Events Melbourne Wedding Permits - Standard site Per Booking 450.00 475.00 6.00% Events Melbourne Wedding Permits - Unique site Per Booking 500.00 525.00 5.00% Health Services Each Additional Business Per Registration 0.00 50.00 NEW Health Services Each Temporary Stall linked to Food Act Registration/Renewal Fixed Premises / Class 2 (6 months) Per Application 125.00 130.00 4.00% Health Services Each Temporary Stall linked to Food Act Registration/Renewal Fixed Premises / Class 3 (6 months) Per Application 105.00 110.00 5.00% Health Services Each Temporary Stall linked to Food Act Registration/Renewal Fixed Premises / Class 2 (9 months) Per Application 175.00 180.00 3.00% Health Services Each Temporary Stall linked to Food Act Registration/Renewal Fixed Premises / Class 3 (9 months) Per Application 145.00 150.00 3.00% Health Services Food Act / Public & Wellbeing Act - Additional onsite assessment e.g. additional pre final / final inspection, property enquiry, follow up temporary food premises and any additional inspections which may be required. Per Hour 135.00 140.00 4.00% Health Services Food Act New Premises Registration / Mobile Food Premises / Class 2 Premises Per Registration 0.00 610.00 NEW Health Services Food Act New Premises Registration / Mobile Food Premises / Class 3 Premises Per Registration 0.00 560.00 NEW 105 Branch Description Unit of Measure Name of Product or Service Current Price per unit (including GST)* as at 30 June 2014 Revised Price per unit (including GST) from 1 July 2014 * % change Health Services Food Act New Premises Registration/Class 1 and 2 Premises/Large Per Registration 0.00 1,510.00 NEW Health Services Food Act New Premises Registration/Class 1 and 2 Premises/Medium Per Registration 0.00 1,080.00 NEW Health Services Food Act New Premises Registration/Class 1 and 2 Premises/Small Per Registration 0.00 840.00 NEW Health Services Food Act New Premises Registration/Class 3 Premises/Large Per Registration 0.00 1,400.00 NEW Health Services Food Act New Premises Registration/Class 3 Premises/Medium Per Registration 0.00 1,020.00 NEW Health Services Food Act New Premises Registration/Class 3 Premises/Small Per Registration 0.00 770.00 NEW Health Services Food Act New Premises Registration/Priority Service (5 working day turn around) Per Registration 0.00 250.00 NEW Health Services Food Act Premises Alterations Fee - Class 1 and 2 Premises - Large Per Application 0.00 390.00 NEW Food Act Premises Alterations Fee - Class 1 and 2 Premises - Medium Per Application 0.00 335.00 NEW Food Act Premises Alterations Fee - Class 1 and 2 Premises - Small Per Application 0.00 300.00 NEW Food Act Premises Alterations Fee - Class 2 Mobile Food Premises / Vehicle Per Application 0.00 185.00 NEW Health Services Food Act Premises Alterations Fee - Class 2 Vending Machine Registration Per Application 0.00 185.00 NEW Health Services Food Act Premises Alterations Fee - Class 3 Mobile Food Premises / Vehicle Per Application 0.00 160.00 NEW Health Services Food Act Premises Alterations Fee - Class 3 Premises - Fruit & Vegetable Stall Cutting Per Application 0.00 115.00 NEW Health Services Food Act Premises Alterations Fee - Class 3 Premises - Large Per Application 0.00 335.00 NEW Health Services Food Act Premises Alterations Fee - Class 3 Premises - Medium Per Application 0.00 305.00 NEW Food Act Premises Alterations Fee - Class 3 Premises - Small Per Application 0.00 270.00 NEW Health Services Health Services Food Act Premises Alterations Fee - Class 3 Vending Machine Registration Food Act Property Enquiry: Food Act Registration Per Application 0.00 215.00 160.00 220.00 NEW 2.00% Health Services Food Act Registration Transfer/ Class 1 and 2 Premises - Medium Per Application 325.00 335.00 3.00% Health Services Food Act Registration Transfer/ Class 1 and 2 Premises- Large Per Application 365.00 390.00 7.00% Health Services Health Services Health Services Health Services 106 Per Application Branch Description Unit of Measure Name of Product or Service Current Price per unit (including GST)* as at 30 June 2014 Revised Price per unit (including GST) from 1 July 2014 * % change Health Services Food Act Registration Transfer/ Class 1 and 2 Premises- Small Per Application 290.00 300.00 3.00% Health Services Food Act Registration Transfer/ Class 1 Premises- Non Standard FSP/ Large Per Application 395.00 0.00 N/A Health Services Food Act Registration Transfer/ Class 1 Premises- Non Standard FSP/ Medium Per Application 320.00 0.00 N/A Health Services Food Act Registration Transfer/ Class 1 Premises- Non Standard FSP/ Small Per Application 240.00 0.00 N/A Health Services Food Act Registration Transfer/ Class 2 / Temporary Stall - (Annually Registered) Per Application 120.00 125.00 4.00% Health Services Food Act Registration Transfer/ Class 2 Premises- Non Standard FSP/ Large Per Application 395.00 0.00 N/A Health Services Food Act Registration Transfer/ Class 2 Premises- Non Standard FSP/ Medium Per Application 320.00 0.00 N/A Health Services Food Act Registration Transfer/ Class 2 Premises- Non Standard FSP/ Small Per Application 240.00 0.00 N/A Health Services Food Act Registration Transfer/ Class 3 / Temporary Stall - (Annually Registered) Per Application 100.00 105.00 5.00% Health Services Food Act Registration Transfer/ Class 3 Mobile Food Premises / Vehicle Per Application 155.00 160.00 3.00% Health Services Food Act Registration Transfer/ Class 3 Premises Fruit & Vegetable Stall Cutting Per Application 110.00 115.00 5.00% Health Services Food Act Registration Transfer/ Class 3 Premises Large Per Application 325.00 335.00 3.00% Health Services Food Act Registration Transfer/ Class 3 PremisesMedium Per Application 295.00 305.00 3.00% Health Services Food Act Registration Transfer/ Class 3 PremisesSmall Per Application 260.00 270.00 4.00% Health Services Food Act Registration/ Class 2 / Temporary Food Premises - (Week Registered) Per Registration 135.00 140.00 4.00% Health Services Food Act Registration/Class 2 / Temporary Food Premises - (Quarter Registration) Per Registration 195.00 200.00 3.00% Health Services Food Act Registration/Renewal/ Class 1 and 2 Premises- Large Per Registration 730.00 780.00 7.00% Health Services Food Act Registration/Renewal/ Class 1 and 2 Premises- Medium Per Registration 650.00 670.00 3.00% Health Services Food Act Registration/Renewal/ Class 1 and 2 Premises- Small Per Registration 580.00 600.00 3.00% Health Services Food Act Registration/Renewal/ Class 1 Premises- Non Standard FSP/ Large Per Registration 790.00 0.00 N/A Health Services Food Act Registration/Renewal/ Class 1 Premises- Non Standard FSP/ Medium Per Registration 640.00 0.00 N/A 107 Branch Description Unit of Measure Name of Product or Service Current Price per unit (including GST)* as at 30 June 2014 Revised Price per unit (including GST) from 1 July 2014 * % change Health Services Food Act Registration/Renewal/ Class 1 Premises- Non Standard FSP/ Small Per Registration 480.00 0.00 N/A Health Services Food Act Registration/Renewal/ Class 2 / Temporary Food Premises - (Annual Registration) Per Registration 240.00 250.00 4.00% Health Services Food Act Registration/Renewal/ Class 2 Mobile Food Premises / Vehicle Per Application 360.00 370.00 3.00% Health Services Food Act Registration/Renewal/ Class 2 Premises- Non Standard FSP/ Large Per Registration 790.00 0.00 N/A Health Services Food Act Registration/Renewal/ Class 2 Premises- Non Standard FSP/ Medium Per Registration 640.00 0.00 N/A Health Services Food Act Registration/Renewal/ Class 2 Premises- Non Standard FSP/ Small Per Registration 480.00 0.00 N/A Health Services Food Act Registration/Renewal/ Class 2 Vending Machine Registration Per Application 360.00 370.00 3.00% Health Services Food Act Registration/Renewal/ Class 3 / Temporary Stall - (Quarter Registration) Per Registration 155.00 160.00 3.00% Health Services Food Act Registration/Renewal/ Class 3 / Temporary Stall - (Week Registration) Per Registration 115.00 120.00 4.00% Health Services Food Act Registration/Renewal/ Class 3 / Temporary Food Premises - (Annual Registration) Per Registration 200.00 210.00 5.00% Health Services Food Act Registration/Renewal/ Class 3 Mobile Food Premises / Vehicle Per Application 310.00 320.00 3.00% Health Services Food Act Registration/Renewal/ Class 3 Premises Fruit & Vegetable Stall Cutting Per Registration 220.00 230.00 5.00% Health Services Food Act Registration/Renewal/ Class 3 PremisesLarge Per Registration 650.00 670.00 3.00% Health Services Food Act Registration/Renewal/ Class 3 PremisesMedium Per Registration 590.00 610.00 3.00% Health Services Food Act Registration/Renewal/ Class 3 PremisesSmall Per Registration 520.00 540.00 4.00% Health Services Food Act Registration/Renewal/ Class 3 Vending Machine Registration Per Application 310.00 320.00 3.00% Health Services Food Act Registration/Temporary Food Premises/Event Group Registrations 0-25 stalls Per Registration 640.00 660.00 3.00% Health Services Food Act Registration/Temporary Food Premises/Event Group Registrations 26-50 stalls Per Registration 1,175.00 1,210.00 3.00% Health Services Food Act Registration/Temporary Food Premises/Event Group Registrations 51-100 stalls Per Registration 1,730.00 1,780.00 3.00% 108 Branch Description Unit of Measure Name of Product or Service Current Price per unit (including GST)* as at 30 June 2014 Revised Price per unit (including GST) from 1 July 2014 * 2,285.00 2,350.00 3.00% % change Health Services Food Act Registration/Temporary Food Premises/Event Group Registrations 101-200 stalls Per Registration Health Services Food Act Registration/Transfer/ Class 2 Mobile Food Premises / Vehicle Per Application 180.00 185.00 3.00% Health Services Food Act Registration/Transfer/ Class 2 Vending Machine Registration Per Application 180.00 185.00 3.00% Health Services Food Act Registration/Transfer/ Class 3 Vending Machine Registration Per Application 155.00 160.00 3.00% Health Services Food Act: Fruit & Vegie Stalls Plans Assessment Per Application 105.00 0.00 N/A Health Services Food Act: Plans Assessment - 0-50m² Per Application 235.00 0.00 N/A Health Services Food Act: Plans Assessment - 51-150m² Per Application 400.00 0.00 N/A Health Services Food Act: Plans Assessment 151-300m² Per Application 710.00 0.00 N/A Health Services Food Act: Plans Assessment 301-450m² Per Application 990.00 0.00 N/A Health Services Food Act: Plans Assessment over 450m² Per Application 1,140.00 0.00 N/A Health Services Health Services Food Act: Plans Assessment Priority Service (5 working day turn around) New Registration Prescribed Accommodation 4-10 beds Jan - Mar Per Application 0.00 310.00 250.00 320.00 NEW 3.00% Health Services Permits: Septic Tank and Grey Water Permit Per Application 210.00 220.00 5.00% Health Services Permits: Water Carrier Per Application 210.00 220.00 5.00% Health Services Public Health & Wellbeing Act Premises, Personal Care & Body Art - Low & High Risk - New Registration Apr to June Per Registration 155.00 160.00 3.00% Health Services Public Health & Wellbeing Act Premises, Personal Care & Body Art - Low & High Risk - New Registration Jan to Mar Per Registration 220.00 230.00 5.00% Health Services Public Health & Wellbeing Act Premises, Renewal of Registration Fees, Personal Care & Body Art - Low & High Risk - Fixed Premises Per Registration 220.00 230.00 5.00% Health Services Public Health & Wellbeing Act Property Enquiry: Low & High Risk Per Application 125.00 130.00 4.00% Health Services Public Health & Wellbeing Act Property Enquiry: Prescribed Accommodation Per Application 155.00 160.00 3.00% 109 Per Registration Branch Description Unit of Measure Name of Product or Service Current Price per unit (including GST)* as at 30 June 2014 Revised Price per unit (including GST) from 1 July 2014 * % change 0.00 230.00 NEW Health Services Public Health & Wellbeing Act Registration / Temporary Premises / Event Group Registrations Per Registration Health Services Public Health and Wellbeing Act Plans Assessment: Hairdresser, Skin penetration, Beauty Parlour, Body Piercing, Tattooist and Colonic Irrigation Per Application 195.00 200.00 3.00% Health Services Public Health and Wellbeing Act Plans Assessment: Prescribed Accommodation Per Application 235.00 240.00 2.00% Health Services Public Health and Wellbeing Act Prescribed Accommodation Premises - Maximum Fee Per Registration 1,545.00 1,590.00 3.00% Health Services Public Health and Wellbeing Act Prescribed Accommodation Premises (Pro-rata): 11-15 beds Apr-Jun Per Registration 270.00 280.00 4.00% Health Services Public Health and Wellbeing Act Prescribed Accommodation Premises (Pro-rata): 11-15 beds Jan-Mar Per Registration 360.00 370.00 3.00% Health Services Public Health and Wellbeing Act Prescribed Accommodation Premises (Pro-rata): 15-over beds Apr-Jun Per Registration 270.00 280.00 4.00% Health Services Public Health and Wellbeing Act Prescribed Accommodation Premises (Pro-rata): 15-over beds Jan-Mar Per Registration 360.00 370.00 3.00% Health Services Public Health and Wellbeing Act Prescribed Accommodation Premises (Pro-rata): 4-10 beds Apr-Jun Per Registration 225.00 230.00 2.00% Health Services Public Health and Wellbeing Act Prescribed Accommodation Premises (Pro-rata): 4-10 beds Jul-Dec Per Registration 155.00 160.00 3.00% Health Services Public Health and Wellbeing Act Registration Transfer: Health Act Registration Transfer Prescribed Accommodation/ 4-10 beds Per Registration 155.00 160.00 3.00% Health Services Public Health and Wellbeing Act Renewal: Health Act Renewal Prescribed Accommodation/ 11-15 beds Per Registration 360.00 370.00 3.00% Health Services Public Health and Wellbeing Act Renewal: Health Act Renewal Prescribed Accommodation/ 15-over beds Per Registration 360.00 370.00 3.00% Health Services Public Health and Wellbeing Act Renewal: Health Act Renewal Prescribed Accommodation/ 4-10 beds Per Registration 310.00 320.00 3.00% Health Services Water Carrier Permit / Transfer Per Application 105.00 110.00 5.00% Park Services Berthing Rates: Fuelling Charge for vessels without berthing licence Per Session 770.00 793.00 3.00% Park Services Berthing Rates: Melbourne City Marina - entire marina (both visitors' arms) Per Night 1,200.00 1,400.00 17.00% 110 Branch Description Unit of Measure Name of Product or Service Current Price per unit (including GST)* as at 30 June 2014 Revised Price per unit (including GST) from 1 July 2014 * 600.00 700.00 17.00% % change Park Services Berthing Rates: Melbourne City Marina - half marina (one visitors' arm only) Per Night Park Services Park Services Berthing Rates: Melbourne City Marina monthly Berthing Rates: Melbourne City Marina monthly for vessels 20.1 to 30 metres Per Month Per Month 1,080.00 0.00 0.00 1,440.00 N/A NEW Park Services Berthing Rates: Melbourne City Marina monthly for vessels up to 20 metres Per Month 0.00 1,200.00 NEW Park Services Berthing Rates: Melbourne City Marina NYE one-night stay vessels 20.1 to 30 metres Per Night 0.00 180.00 NEW Park Services Berthing Rates: Melbourne City Marina NYE one-night stay vessels up to 20 metres Per Night 0.00 150.00 NEW Park Services Berthing Rates: Melbourne City Marina NYE threenight stay Per Package 420.00 0.00 N/A Park Services Berthing Rates: Melbourne City Marina NYE threenight stay vessels 20.1 to 30 metres Per Package 0.00 540.00 NEW Park Services Berthing Rates: Melbourne City Marina NYE threenight stay vessels up to 20 metres Per Package 0.00 450.00 NEW Park Services Park Services Berthing Rates: Melbourne City Marina overnight Berthing Rates: Melbourne City Marina overnight for vessels 20.1 to 30 metres Per Night Per Night 45.00 0.00 0.00 60.00 N/A NEW Park Services Berthing Rates: Melbourne City Marina overnight for vessels up to 20 metres Per Night 0.00 50.00 NEW Park Services Park Services Berthing Rates: Melbourne City Marina weekly Berthing Rates: Melbourne City Marina weekly for vessels 20.1 to 30 metres Per Week Per Week 270.00 0.00 0.00 360.00 N/A NEW Park Services Berthing Rates: Melbourne City Marina weekly for vessels up to 20 metres Per Week 0.00 300.00 NEW Park Services Berthing Rates: Melbourne City Marina Winter Berthing for vessels 20.1 to 30 metres Per Month 0.00 1,200.00 NEW Park Services Berthing Rates: Melbourne City Marina Winter Berthing for vessels up to 20 metres Per Month 0.00 1,000.00 NEW Park Services Berthing Rates: Melbourne Superyacht Marina for vessels more than 30 metres Per Meter Per Day 0.00 7.70 NEW Park Services Berthing Rates: Rubbish Removal Per Cubic Metre 14.00 0.00 N/A Park Services Berthing Rates: South Wharf, Yarra River - Long Term (Licence) Per Meter Per Annum 525.00 540.00 3.00% Park Services Berthing Rates: Super Yacht Marina Long Term > three months Per Meter Per Day 5.25 0.00 N/A Park Services Berthing Rates: Super Yacht Marina Short term < three months Per Meter Per Day 8.40 0.00 N/A 111 Branch Description Current Price per unit (including GST)* as at 30 June 2014 Revised Price per unit (including GST) from 1 July 2014 * Name of Product or Service Unit of Measure Park Services Berthing Rates: Victoria Harbour Commercial Berthing - Long Term (Licence) Per Meter Per Annum 630.00 650.00 3.00% Park Services Berthing Rates: Victoria Harbour Commercial Berthing Permit - Short Term (pro rata) Per Meter Per Annum 655.00 675.00 3.00% Park Services Park Services Hire Rates: Harbour View Meeting Room Hire Rates: Harbour View Meeting Room - full commercial Per Day Per Hour 575.00 83.00 597.00 86.00 4.00% 4.00% Parking and Traffic Alternate tag fee Per Unit 0.00 15.00 NEW Parking and Traffic Debit Adjustment - Enforcement Order Costs Per Infringement 27.10 27.70 2.00% Parking and Traffic Debit Adjustment - Lodgement Fee Per Infringement 50.30 51.40 2.00% Parking and Traffic Debit Adjustment - Penalty Reminder Notice Letter Per Infringement 23.30 23.70 2.00% Parking and Traffic Enforcement Order Costs Per Infringement 27.10 27.70 2.00% Parking and Traffic Handbill Permits 10.00 20.00 100.00% Parking and Traffic Lodgement Fee Administration Fee Per Permit Per Infringement 50.30 51.40 2.00% Parking and Traffic Magistrates' Court Lodgement Cost Single Infringement 73.47 75.20 2.00% Parking and Traffic Magistrates' Court Lodgement Cost Multi Infringement 110.40 113.40 3.00% Parking and Traffic Parking Fines - eg Expired meters Per Infringement 72.00 74.00 3.00% Parking and Traffic Parking Fines - eg On a clearway Per Infringement 145.00 148.00 2.00% Parking and Traffic Parking Fines - eg On a footway Per Infringement 87.00 89.00 2.00% Parking and Traffic Parking Fines (Debit adjustment) - eg Expired meters, period longer Per Infringement 72.00 74.00 3.00% Parking and Traffic Parking Fines (Debit adjustment) - eg On a clearway Per Infringement 145.00 148.00 2.00% Parking and Traffic Parking Fines (Debit adjustment) - eg On a footway Per Infringement 87.00 89.00 2.00% Parking and Traffic Penalty Reminder Notice Letter Per Infringement 23.30 23.70 2.00% Parking and Traffic Release of abandoned vehicles Per Vehicle 322.00 386.40 20.00% 112 % change Branch Description Name of Product or Service Unit of Measure Current Price per unit (including GST)* as at 30 June 2014 Revised Price per unit (including GST) from 1 July 2014 * % change Parking and Traffic Release of towaway vehicles Per Vehicle 322.00 386.40 20.00% Parking and Traffic Visy Park parking permits Per Annum 75.00 100.00 33.00% Parking and Traffic Withdrawal - Enforcement Order Costs Per Infringement 27.10 27.70 2.00% Parking and Traffic Withdrawal - Lodgement Fee Per Infringement 50.30 51.40 2.00% Parking and Traffic Withdrawal - Penalty Reminder Notice Letter Per Infringement 23.30 23.70 2.00% Parking and Traffic Withdrawal of Parking Fines - eg Expired meters, period longer Per Infringement 72.00 74.00 3.00% Parking and Traffic Withdrawal of Parking Fines - eg On a clearway Per Infringement 145.00 148.00 2.00% Parking and Traffic Withdrawal of Parking Fines - eg On a footway Per Infringement 87.00 89.00 2.00% Parking and Traffic Witness Summons Per Case 43.84 44.80 2.00% Parking and Traffic Zoo parking permits Per Annum 75.00 100.00 33.00% Planning & Building Building - Space Occupancy Permit Fee - Motorised plant includes concrete pumps, scissor lifts, boom lifts etc Per Day 95.20 97.80 3.00% Planning & Building Building - Space Occupancy Permit Fee - Non Motorised plant includes ladders, mobile scaffolds & footpath occupation Per Day 44.80 46.00 3.00% Planning & Building Crane < 150 ton / Travel Tower / Concrete Pump Application Fee Per Application 123.00 126.30 3.00% Planning & Building Crane < 150 ton / Travel Tower / Concrete Pump Rental Fee Per Day 95.20 97.80 3.00% Planning & Building Crane > 150 ton / Travel Tower / Concrete Pump / Space Occupancy Rental Fee Per Day 280.00 287.60 3.00% Planning & Building Crane > 150 ton / Travel Tower / Concrete Pump Application Fee Per Application 123.00 126.30 3.00% Planning & Building Hoarding Permit - Application Fee Per Application 123.00 126.30 3.00% Planning & Building Occupancy Permit Fee - Places of Public Entertainment - 10000m2 + (max. 10 structures of 200sq.m ea.) Per Application 3,129.50 3,214.00 3.00% Planning & Building Occupancy Permit Fee - Places of Public Entertainment - 1001m2 to 5000m2 (max. 5 structures of 200sq.m ea.) Per Application 1,435.50 1,474.25 3.00% 113 Branch Description Unit of Measure Name of Product or Service Current Price per unit (including GST)* as at 30 June 2014 Revised Price per unit (including GST) from 1 July 2014 * % change Planning & Building Occupancy Permit Fee - Places of Public Entertainment - 5001m2 to 10000m2 (max. 5 structures of 200sq.m ea.) Per Application 2,211.60 2,271.30 3.00% Planning & Building Occupancy Permit Fee - Places of Public Entertainment - 500m2 to 1000m2 (max. 5 structures of 200sq.m ea.) Per Application 1,138.00 1,168.75 3.00% Planning & Building Occupancy Permit Fee - Places of Public Entertainment - Additional Inspections-max 2 hours 180.00 184.85 3.00% Planning & Building Occupancy Permit Fee - Places of Public Entertainment - Additional structures over limit specified in TOPs above. Max size of structure 200sq.m Per InspectionMin. Per Structure 105.00 107.85 3.00% Planning & Building Occupancy Permit Fee - Places of Public Entertainment Late fee - 10001m2 + Per Application 1,850.00 1,900.00 3.00% Planning & Building Occupancy Permit Fee - Places of Public Entertainment Late Fee - 1001m2 to 5000m2 Per Application 890.00 914.00 3.00% Planning & Building Occupancy Permit Fee - Places of Public Entertainment Late Fee - 5001m2 to 10000m2 Per Application 1,370.00 1,407.00 3.00% Planning & Building Occupancy Permit Fee - Places of Public Entertainment Late Fee - 500m2 to 1000m2 Per Application 710.00 729.20 3.00% Planning & Building Out of Hours Permit - One Day Per Day 123.00 126.30 3.00% Planning & Building Out of Hours Permit - Three or more Days Per Day 206.00 211.55 3.00% Planning & Building Out of Hours Permit - Two Days Per Day 148.00 152.00 3.00% Planning & Building Road Closure Permit Fees - per Lane Per Lane Per Day 123.00 126.30 3.00% Planning & Building Road Management Act Consent Fees (Minimum Fee) 147.70 151.70 3.00% Planning & Building Space Occupancy Permits Fee - Commercial Per Application Min Per Day 44.80 46.00 3.00% Planning & Building Temporary Siting Permit Fee - Temp Structures - 1 Structure Per Application 382.50 392.80 3.00% Planning & Building Temporary Siting Permit Fee - Temp Structures - 10 15 Structures Per Application 1,038.10 1,066.10 3.00% Planning & Building Temporary Siting Permit Fee - Temp Structures - 2 to 5 Structures Per Application 568.50 584.00 3.00% Planning & Building Temporary Siting Permit Fee - Temp Structures - 6 to 9 Structures Per Application 765.00 785.70 3.00% 114 Branch Description Unit of Measure Name of Product or Service Current Price per unit (including GST)* as at 30 June 2014 Revised Price per unit (including GST) from 1 July 2014 * 180.00 184.85 3.00% 250.00 256.75 3.00% % change Planning & Building Temporary Siting Permit Fee - Temp Structures Additional Inspections max. 2 hours Planning & Building Temporary Siting Permit Fee - Temp Structures - Late fee 1 Structure Per InspectionMin. Per Application Planning & Building Temporary Siting Permit Fee - Temp Structures - Late fee 10 + Structures Per Application 670.00 688.10 3.00% Planning & Building Temporary Siting Permit Fee - Temp Structures - Late fee 2 to 5 Structures Per Application 360.00 370.00 3.00% Planning & Building Temporary Siting Permit Fee - Temp Structures - Late fee 6 to 9 Structures Per Application 495.00 508.40 3.00% Planning & Building Tower Crane located within road reserve / Space Occupancy Rental Fee Per Week 170.00 174.60 3.00% Planning & Building Tower Crane located within road reserve Application Fee Per Application 1,132.00 1,162.60 3.00% Recreation Services Carlton Baths Fees : Multi Visit and Membership Passes: Membership Fees: Active Melbourne: Fortnightly DD. Per Fortnight 0.00 47.00 NEW Recreation Services Carlton Baths Fees: Aquatic Education : Fortnightly Direct Debit Each 19.00 25.80 36.00% Recreation Services Carlton Baths Fees: Aquatic Education: Adult Swim Lesson (Per visit - Term Basis Only) Each 14.00 0.00 N/A Recreation Services Carlton Baths Fees: Aquatic Education: Adult Swim Lesson 30 minute class Each 22.00 0.00 N/A Recreation Services Carlton Baths Fees: Aquatic Education: Adult Swim Lesson 45 minute class Each 26.00 0.00 N/A Recreation Services Carlton Baths Fees: Aquatic Education: Adult Swim Lesson 60 minute squad class Each 27.00 0.00 N/A Recreation Services Carlton Baths Fees: Aquatic Education: AquaSafe School Holiday Program Each 12.00 12.30 3.00% Recreation Services Carlton Baths Fees: Aquatic Education: Concession Swim Lesson (Per visit - Term Basis Only) Each 13.00 0.00 N/A Recreation Services Carlton Baths Fees: Aquatic Education: Private Swimming Lesson 30min - One on One - Guest Each 54.00 52.40 -3.00% Recreation Services Carlton Baths Fees: Aquatic Education: Private Swimming Lesson 30min - One on One - Member Each 42.50 43.65 3.00% Recreation Services Carlton Baths Fees: Aquatic Education: Private Swimming Lesson 60min - One on One - Guest Each 74.50 79.85 7.00% Recreation Services Carlton Baths Fees: Aquatic Education: Private Swimming Lesson 60min - One on One - Member Each 64.00 65.70 3.00% Recreation Services Carlton Baths Fees: Aquatic Education: Private Swimming Lesson 60min - One on Two - Guest Each 103.50 109.70 6.00% 115 Branch Description Unit of Measure Name of Product or Service Current Price per unit (including GST)* as at 30 June 2014 Revised Price per unit (including GST) from 1 July 2014 * % change Recreation Services Carlton Baths Fees: Aquatic Education: Private Swimming Lesson 60min - One on Two - Member Each 90.00 91.40 2.00% Recreation Services Carlton Baths Fees: Children's Programs: Ed Gym Casual Each 14.00 14.40 3.00% Recreation Services Carlton Baths Fees: Children's Programs: Gymnastics (Per visit - Term Basis Only) Each 12.00 12.30 3.00% Recreation Services Carlton Baths Fees: Children's Programs: Junior Soccer Each 5.50 5.65 3.00% Recreation Services Carlton Baths Fees: Facility Equipment and Staff Hire: Aquatic education Instructor hire per hour Each 50.00 51.35 3.00% Recreation Services Carlton Baths Fees: Facility Equipment and Staff Hire: Group Instructor hire per hour Each 90.00 92.45 3.00% Recreation Services Carlton Baths Fees: Facility Equipment and Staff Hire: Miscellaneous: Casual Shooting Each 3.00 3.10 3.00% Recreation Services Carlton Baths Fees: Facility Equipment and Staff Hire: Miscellaneous: Locker Hire Each 2.50 2.60 4.00% Recreation Services Carlton Baths Fees: Facility Equipment and Staff Hire: Pool: Inflatable hire 1.5hrs Each 90.00 92.45 3.00% Recreation Services Carlton Baths Fees: Facility Equipment and Staff Hire: Pool: Lifeguard per hour Each 35.00 35.95 3.00% Recreation Services Carlton Baths Fees: Facility Equipment and Staff Hire: Pool: Pool Lane Hire per Hour (Plus Group Entry Fee) Each 45.00 46.25 3.00% Recreation Services Carlton Baths Fees: Facility Equipment and Staff Hire: Rooms/Studios: Bus hire half day Each 46.00 47.25 3.00% Recreation Services Carlton Baths Fees: Facility Equipment and Staff Hire: Rooms/Studios: Bus hire half day - community group hire Each 32.00 32.85 3.00% Recreation Services Carlton Baths Fees: Facility Equipment and Staff Hire: Rooms/Studios: Bus hire per day Each 75.00 77.05 3.00% Recreation Services Carlton Baths Fees: Facility Equipment and Staff Hire: Rooms/Studios: Bus hire per day - community group hire Each 54.00 55.45 3.00% Recreation Services Carlton Baths Fees: Functions: Birthday Parties Per Person (Limited Food Option - Min 10) Each 22.00 22.60 3.00% Recreation Services Carlton Baths Fees: Functions: Birthday Parties Per Person (without food) Each 18.00 18.50 3.00% Recreation Services Carlton Baths Fees: Group Exercise (Land Based): Adult Exercise Class Each 17.00 17.45 3.00% Recreation Services Carlton Baths Fees: Group Exercise (Land Based): Pensioner Exercise Class Each 13.00 13.35 3.00% Recreation Services Carlton Baths Fees: Group Exercise (Land Based): Prime Movers Older Adults Class Each 13.00 13.35 3.00% 116 Branch Description Unit of Measure Name of Product or Service Current Price per unit (including GST)* as at 30 June 2014 Revised Price per unit (including GST) from 1 July 2014 * % change Recreation Services Carlton Baths Fees: Group Exercise (Land Based): Student Exercise Class Each 15.00 15.40 3.00% Recreation Services Carlton Baths Fees: Group Exercise (Water Based): Swim Squad Class - Casual Each 17.00 17.45 3.00% Recreation Services Carlton Baths Fees: Group Exercise (Water Based): Swim Squad Class Casual - Concession Each 13.00 13.35 3.00% Recreation Services Carlton Baths Fees: Gymnasium: Adult Gym Each 17.00 17.45 3.00% Recreation Services Carlton Baths Fees: Gymnasium: Concession/Child Gym Each 13.00 13.35 3.00% Recreation Services Carlton Baths Fees: Gymnasium: Student Gym Each 15.00 15.40 3.00% Recreation Services Carlton Baths Fees: Holiday Programs: Primary Holiday Program (Per Person Per Day) Each 57.00 58.55 3.00% Recreation Services Carlton Baths Fees: Miscellaneous: Adult Shower Each 5.20 5.35 3.00% Recreation Services Carlton Baths Fees: Miscellaneous: Y Access Each 5.20 5.35 3.00% Recreation Services Carlton Baths Fees: Multi Activity Memberships : Young at Heart 12 mth membership Each 475.00 520.00 9.00% Recreation Services Carlton Baths Fees: Multi Activity Memberships : Young at Heart fortnightly membership Each 22.00 20.55 -7.00% Recreation Services Carlton Baths Fees: Multi Activity Memberships : Youth Gym 12 month membership Each 475.00 520.00 9.00% Recreation Services Carlton Baths Fees: Multi Visit and Membership Passes: Group Exercise (Land and Water Based): Adult Exercise Class 20 visit Pass Each 323.00 331.55 3.00% Recreation Services Carlton Baths Fees: Multi Visit and Membership Passes: Group Exercise (Land and Water Based): Concession/Child Exercise Class 20 visit Pass Each 247.00 253.65 3.00% Recreation Services Carlton Baths Fees: Multi Visit and Membership Passes: Group Exercise (Land and Water Based): Student Exercise Class 20 visit Pass Each 285.00 292.70 3.00% Recreation Services Carlton Baths Fees: Multi Visit and Membership Passes: Gymnasium: Adult Gym 20 Visit Pass Each 323.00 331.55 3.00% Recreation Services Carlton Baths Fees: Multi Visit and Membership Passes: Gymnasium: Concession/Child Gym 20 Visit Pass Each 247.00 253.65 3.00% Recreation Services Carlton Baths Fees: Multi Visit and Membership Passes: Gymnasium: Student Gym 20 Visit Pass Each 285.00 292.70 3.00% 117 Branch Description Unit of Measure Name of Product or Service Current Price per unit (including GST)* as at 30 June 2014 Revised Price per unit (including GST) from 1 July 2014 * % change Recreation Services Carlton Baths Fees: Multi Visit and Membership Passes: Multi - Private Swimming Lessons: Private Swim Lesson 30 min x 10 - Guest Each 486.00 471.60 -3.00% Recreation Services Carlton Baths Fees: Multi Visit and Membership Passes: Multi - Private Swimming Lessons: Private Swim Lesson 30 min x 10 - Member Each 382.50 392.85 3.00% Recreation Services Carlton Baths Fees: Multi Visit and Membership Passes: Multi - Private Swimming Lessons: Private Swim Lesson 60 min One on Two x 10 - Guest Each 931.50 987.30 6.00% Recreation Services Carlton Baths Fees: Multi Visit and Membership Passes: Multi - Private Swimming Lessons: Private Swim Lesson 60 min One on Two x 10 - Member Each 801.00 822.60 3.00% Recreation Services Carlton Baths Fees: Multi Visit and Membership Passes: Multi - Private Swimming Lessons: Private Swim Lesson 60 min x 10 - Guest Each 670.50 718.65 7.00% Recreation Services Carlton Baths Fees: Multi Visit and Membership Passes: Multi - Private Swimming Lessons: Private Swim Lesson 60 min x 10 - Member Each 576.00 591.30 3.00% Recreation Services Carlton Baths Fees: Multi Visit and Membership Passes: Multi-Activity Memberships: Aquatic Fortnightly DD Membership Each 18.00 18.50 3.00% Recreation Services Carlton Baths Fees: Multi Visit and Membership Passes: Multi-Activity Memberships: HC + PT Membership - 30min Member (one session per week) Each 72.00 73.95 3.00% Recreation Services Carlton Baths Fees: Multi Visit and Membership Passes: Multi-Activity Memberships: HC + PT Membership - 30min Member (three sessions per week) Each 281.50 289.10 3.00% Recreation Services Carlton Baths Fees: Multi Visit and Membership Passes: Multi-Activity Memberships: HC + PT Membership - 30min Member (two sessions per week) Each 198.30 203.65 3.00% Recreation Services Carlton Baths Fees: Multi Visit and Membership Passes: Multi-Activity Memberships: HC + SGT Membership - one session per week Each 66.90 68.70 3.00% Recreation Services Carlton Baths Fees: Multi Visit and Membership Passes: Multi-Activity Memberships: HC + SGT Membership - three sessions per week Each 136.90 140.60 3.00% Recreation Services Carlton Baths Fees: Multi Visit and Membership Passes: Multi-Activity Memberships: HC + SGT Membership - two session per week Each 101.90 104.65 3.00% 118 Branch Description Unit of Measure Name of Product or Service Current Price per unit (including GST)* as at 30 June 2014 Revised Price per unit (including GST) from 1 July 2014 * % change Recreation Services Carlton Baths Fees: Multi Visit and Membership Passes: Multi-Activity Memberships: Health Club 12 Month Membership Each 875.00 832.00 -5.00% Recreation Services Carlton Baths Fees: Multi Visit and Membership Passes: Multi-Activity Memberships: Health Club 3 month Membership Each 430.00 408.90 -5.00% Recreation Services Carlton Baths Fees: Multi Visit and Membership Passes: Multi-Activity Memberships: Health Club Fortnightly Membership Each 32.00 32.85 3.00% Recreation Services Carlton Baths Fees: Multi Visit and Membership Passes: Multi-Activity Memberships: Membership Admin / Joining Fee - Youth / Young at Heart / Prime Movers Each 65.00 69.00 6.00% Recreation Services Carlton Baths Fees: Multi Visit and Membership Passes: Multi-Activity Memberships: Youth Gym Each 22.00 20.55 -7.00% Recreation Services Carlton Baths Fees: Multi Visit and Membership Passes: Personal Training: Personal Training Member 30 mins x 10 - Guest Each 486.00 471.60 -3.00% Recreation Services Carlton Baths Fees: Multi Visit and Membership Passes: Personal Training: Personal Training Member 30 mins x 10 - Member Each 382.50 392.85 3.00% Recreation Services Carlton Baths Fees: Multi Visit and Membership Passes: Personal Training: Personal Training Member 60 mins One on Two x 10 - Guest Each 931.50 987.30 6.00% Recreation Services Carlton Baths Fees: Multi Visit and Membership Passes: Personal Training: Personal Training Member 60 mins One on Two x 10 - Member Each 801.00 822.60 3.00% Recreation Services Carlton Baths Fees: Multi Visit and Membership Passes: Personal Training: Personal Training Member 60 mins x 10 - Guest Each 670.50 709.65 6.00% Recreation Services Carlton Baths Fees: Multi Visit and Membership Passes: Personal Training: Personal Training Member 60 mins x 10 - Member Each 576.00 591.30 3.00% Recreation Services Carlton Baths Fees: Multi Visit and Membership Passes: Pool : Adult Swim 20 visit pass Each 99.00 100.70 2.00% Recreation Services Carlton Baths Fees: Multi Visit and Membership Passes: Pool : Adult Swim Season Pass - 1 month Each 55.00 63.60 16.00% Recreation Services Carlton Baths Fees: Multi Visit and Membership Passes: Pool : Adult Swim Season Pass - 7 months Each 255.00 296.80 16.00% Recreation Services Carlton Baths Fees: Multi Visit and Membership Passes: Pool : Concession/Child Swim 20 visit Pass Each 55.00 62.70 14.00% 119 Branch Description Unit of Measure Name of Product or Service Current Price per unit (including GST)* as at 30 June 2014 Revised Price per unit (including GST) from 1 July 2014 * % change Recreation Services Carlton Baths Fees: Multi Visit and Membership Passes: Pool : Concession/Child Swim Season Pass 1 month Each 38.00 39.60 4.00% Recreation Services Carlton Baths Fees: Multi Visit and Membership Passes: Pool : Concession/Child Swim Season Pass 7 months Each 160.00 184.80 16.00% Recreation Services Carlton Baths Fees: Multi Visit and Membership Passes: Pool : Family Swim 20 visit pass Each 247.00 254.60 3.00% Recreation Services Carlton Baths Fees: Multi Visit and Membership Passes: Pool : Family Swim Season Pass Each 580.00 609.70 5.00% Recreation Services Carlton Baths Fees: Multi Visit and Membership Passes: Pool : Student Swim 20 Visit Pass Each 72.00 79.55 10.00% Recreation Services Carlton Baths Fees: Multi Visit and Membership Passes: Pool : Student Swim Season Pass - 1 month Each 50.00 50.40 1.00% Recreation Services Carlton Baths Fees: Multi Visit and Membership Passes: Pool : Student Swim Season Pass - 7 months Each 200.00 235.20 18.00% Recreation Services Carlton Baths Fees: Personal Training: Challenge Fitness Camp: Member 1st camp (per camp). Each 252.00 258.80 3.00% Recreation Services Carlton Baths Fees: Personal Training: Challenge Fitness Camp: Member Ongoing camps (per camp). Each 201.00 206.45 3.00% Recreation Services Carlton Baths Fees: Personal Training: Challenge Fitness Camp: Non-Member 1st camp (per camp). Each 272.00 279.35 3.00% Recreation Services Carlton Baths Fees: Personal Training: Challenge Fitness Camp: Non-Member Ongoing camps (per camp). Each 217.00 222.85 3.00% Recreation Services Carlton Baths Fees: Personal Training: Personal Training 30 mins - Guest Each 54.00 52.40 -3.00% Recreation Services Carlton Baths Fees: Personal Training: Personal Training 30 mins - Member Each 42.50 43.65 3.00% Recreation Services Carlton Baths Fees: Personal Training: Personal Training 60 mins - Guest Each 74.50 78.85 6.00% Recreation Services Carlton Baths Fees: Personal Training: Personal Training 60 mins - Member Each 64.00 65.70 3.00% Recreation Services Carlton Baths Fees: Personal Training: Personal Training One on Two 60 mins - Guest Each 103.50 109.70 6.00% Recreation Services Carlton Baths Fees: Personal Training: Personal Training One on Two 60 mins - Member Each 89.00 91.40 3.00% Recreation Services Carlton Baths Fees: Sports Competitions: Netball Game Fee Per Team Each 62.00 63.65 3.00% Recreation Services Carlton Baths Fees: Sports Competitions: Netball Team Season Registration Each 150.00 153.00 2.00% 120 Branch Description Unit of Measure Name of Product or Service Current Price per unit (including GST)* as at 30 June 2014 Revised Price per unit (including GST) from 1 July 2014 * % change Recreation Services Carlton Baths Fees: Sports Competitions: Netball VNA Registration Each 105.00 107.85 3.00% Recreation Services Carlton Baths Fees: Stadium: Adult Stadium Entry Each 3.00 3.10 3.00% Recreation Services Carlton Baths Fees: Stadium: Child Stadium Entry Each 3.00 3.10 3.00% Recreation Services Carlton Baths Fees: Swim: Adult Group Swim Entry Each 3.20 3.30 3.00% Recreation Services Carlton Baths Fees: Swim: Adult Swim Each 5.20 5.30 2.00% Recreation Services Carlton Baths Fees: Swim: Child Group Swim Entry Each 2.70 3.05 13.00% Recreation Services Carlton Baths Fees: Swim: Concession/Child Swim Each 2.90 3.30 14.00% Recreation Services Carlton Baths Fees: Swim: Family Swim Each 13.00 13.40 3.00% Recreation Services Carlton Baths Fees: Swim: Student Swim Each 3.80 4.20 11.00% Recreation Services City Baths Fees: Boot Camp per session - member Each 12.00 13.85 15.00% Recreation Services City Baths Fees: Boot Camp per session - non member/guest. Each 15.00 15.50 3.00% Recreation Services City Baths Fees: Club Guest - Multi Visits: Adult Gymnasium / Group Fitness SSS & L 20 visit Pass Per Pass 380.00 389.50 3.00% Recreation Services City Baths Fees: Club Guest - Multi Visits: Concession Gymnasium / Group Fitness SSS & L 20 visit Pass Per Pass 210.00 228.00 9.00% Recreation Services City Baths Fees: Club Guest - Multi Visits: Student Gymnasium / Group Fitness SSS & L 20 visit Pass Per Pass 360.00 311.60 -13.00% Recreation Services City Baths Fees: Club Guest (Gym / Group Fitness / Locker & Swim Spa Sauna (SSS): Adult Gym / Group Fitness - SSS & Locker Per Visit 19.99 20.50 3.00% Recreation Services City Baths Fees: Club Guest (Gym / Group Fitness / Locker & Swim Spa Sauna (SSS): Concession Gym / Group Fitness - SSS & Locker Per Visit 11.00 12.00 9.00% Recreation Services City Baths Fees: Club Guest (Gym / Group Fitness / Locker & Swim Spa Sauna (SSS): Student Gym / Group Fitness - SSS & Locker Per Visit 19.50 16.40 -16.00% Recreation Services City Baths Fees: Corporate Memberships: 1001 - 1500 visits Per Visit 0.00 8.50 NEW Recreation Services City Baths Fees: Corporate Memberships: 101 - 250 visits Per Visit 0.00 9.75 NEW 121 Branch Description Unit of Measure Name of Product or Service Current Price per unit (including GST)* as at 30 June 2014 Revised Price per unit (including GST) from 1 July 2014 * % change Recreation Services City Baths Fees: Corporate Memberships: 1501 - 2000 visits Per Visit 0.00 8.00 NEW Recreation Services City Baths Fees: Corporate Memberships: 2001 - 2500 visits Per Visit 0.00 7.50 NEW Recreation Services City Baths Fees: Corporate Memberships: 2501 - 3000 visits Per Visit 0.00 7.00 NEW Recreation Services City Baths Fees: Corporate Memberships: 501 - 1000 visits Per Visit 0.00 9.00 NEW Recreation Services City Baths Fees: Corporate Memberships: Concession 251 - 500 visits Per Visit 0.00 4.55 NEW Recreation Services City Baths Fees: Corporate Memberships: Concession 501 - 1000 visits Per Visit 0.00 4.50 NEW Recreation Services City Baths Fees: Corporate Memberships: Concession Up to 250 visits Per Visit 0.00 4.75 NEW Recreation Services City Baths Fees: Corporate Memberships: Up to 100 visits Per Visit 0.00 10.00 NEW Recreation Services City Baths Fees: Corporate Memberships: Up to 251 500 visits Per Visit 0.00 9.50 NEW Recreation Services City Baths Fees: Facility Hire: GF Instructor Hire Per Hour Per Hour 100.00 105.00 5.00% Recreation Services City Baths Fees: Facility Hire: Life Guard Hire Per Hour Per Hour 70.00 75.00 7.00% Recreation Services City Baths Fees: Facility Hire: Netball / Tennis Court Hire Each 9.00 0.00 N/A Recreation Services City Baths Fees: Facility Hire: Netball / Tennis Court Hire - Lights Each 13.00 0.00 N/A Recreation Services City Baths Fees: Facility Hire: Squash Court Hire: 30 minute off peak. Each 0.00 11.50 NEW Recreation Services City Baths Fees: Kinesiology Services: 60 minute standard consultation - member Each 70.00 72.00 3.00% Recreation Services City Baths Fees: Massage Services: 30 minute Consultation Per Session 50.00 52.00 4.00% Recreation Services City Baths Fees: Massage Services: 30 minute Consultation - Member Per Session 46.00 47.00 2.00% Recreation Services City Baths Fees: Massage Services: 45 minute Consultation Per Session 60.00 64.00 7.00% Recreation Services City Baths Fees: Massage Services: 45 minute Consultation - Member Per Session 56.00 58.00 4.00% Recreation Services City Baths Fees: Massage Services: 60 minute Consultation Per Session 70.00 73.00 4.00% Recreation Services City Baths Fees: Massage Services: 90 minute Consultation Per Session 100.00 106.00 6.00% 122 Branch Description Unit of Measure Name of Product or Service Current Price per unit (including GST)* as at 30 June 2014 Revised Price per unit (including GST) from 1 July 2014 * 90.00 94.00 4.00% % change Recreation Services City Baths Fees: Memberships: Active Melbourne Monthly DD Per Month Recreation Services City Baths Fees: Memberships: Active Melbourne DD Joining Fee Each 139.00 89.00 -36.00% Recreation Services City Baths Fees: Memberships: Active Melbourne Off Peak - Monthly Debit Each 74.00 76.00 3.00% Recreation Services City Baths Fees: Memberships: Aquatic Ed Adult Familiarisation / Development F-DD Each 23.50 0.00 N/A Recreation Services City Baths Fees: Memberships: Aquatic Ed Adult Refinement F-DD Each 28.00 0.00 N/A Recreation Services City Baths Fees: Memberships: Aquatic Ed Infants & Children F-DD Each 22.50 0.00 N/A Recreation Services City Baths Fees: Memberships: Aquatic Ed Squad FDD Each 29.00 0.00 N/A Recreation Services City Baths Fees: Memberships: Aquatic Education Adult: 45 minute lesson Each 16.80 18.82 12.00% Recreation Services City Baths Fees: Memberships: Aquatic Education Children 60 minute lesson Each 17.40 19.48 12.00% Recreation Services City Baths Fees: Memberships: Aquatic Education: Adult 30 minute lesson Each 14.10 15.50 10.00% Recreation Services City Baths Fees: Memberships: Aquatic Education: Infants/children 30 minute lesson Each 13.50 15.50 15.00% Recreation Services City Baths Fees: Memberships: Aquatic Fortnightly DD (S/S/S/locker) Per Fortnight 29.00 29.80 3.00% Recreation Services City Baths Fees: Memberships: Aquatic Monthly DD (S/S/S/locker) Per Month 58.00 61.50 6.00% Recreation Services City Baths Fees: Memberships: Aquatic12 month (S/S/S/locker) Per Annum 678.00 774.80 14.00% Recreation Services City Baths Fees: Memberships: Club - 12 Months (Results) Per Annum 1,139.00 1,222.00 7.00% Recreation Services City Baths Fees: Memberships: Club Off Peak Fortnightly DD Per Fortnight 37.00 38.00 3.00% Recreation Services City Baths Fees: Memberships: Gold- 12 Months Per Annum 1,399.00 1,429.00 2.00% Recreation Services City Baths Fees: Memberships: Gold- Monthly DD Per Month 114.00 117.00 3.00% Recreation Services City Baths Fees: Memberships: Living Stronger - 12 month Membership Each 679.00 668.20 -2.00% Recreation Services City Baths Fees: Memberships: Living Stronger Monthly Per Month 58.00 59.60 3.00% Recreation Services City Baths Fees: Memberships: Prime - 3 month Membership Each 189.00 194.00 3.00% 123 Branch Description Unit of Measure Name of Product or Service Current Price per unit (including GST)* as at 30 June 2014 Revised Price per unit (including GST) from 1 July 2014 * 355.00 365.00 3.00% % change Recreation Services City Baths Fees: Memberships: Prime - 6 month Membership Each Recreation Services City Baths Fees: Memberships: Prime Fortnightly DD Per Fortnight 25.00 25.70 3.00% Recreation Services City Baths Fees: Memberships: RMIT Direct Debit Each 28.00 0.00 N/A Recreation Services City Baths Fees: Memberships: Student 12 months. Each 0.00 855.40 NEW Recreation Services City Baths Fees: Memberships: Student Direct Debit. Per Fortnight 0.00 32.90 NEW Recreation Services City Baths Fees: Memberships: Upgrade Fee (upgrade to club membership) Each 70.00 20.00 -71.00% Recreation Services City Baths Fees: Miscellaneous: Locker Hire Each 2.60 2.70 4.00% Recreation Services City Baths Fees: Miscellaneous: Racquet Hire Each 8.00 8.20 3.00% Recreation Services City Baths Fees: Miscellaneous: Towel Hire Each 5.50 5.70 4.00% Recreation Services City Baths Fees: Naturopaty Services: 30 minute standard consultation - non member Each 0.00 61.50 NEW Recreation Services City Baths Fees: Naturopaty Services: 30 minute standard consultation - member Each 0.00 56.00 NEW Recreation Services City Baths Fees: Naturopaty Services: 45 minute standard consultation - non member Each 0.00 88.00 NEW Recreation Services City Baths Fees: Naturopaty Services: 45 minute standard consultation - member Each 0.00 80.00 NEW Recreation Services City Baths Fees: Naturopaty Services: 60 minute standard consultation - non member Each 0.00 115.50 NEW Recreation Services City Baths Fees: Naturopaty Services: 60 minute standard consultation - member Each 0.00 105.00 NEW Recreation Services City Baths Fees: Naturopaty Services: 90 minute standard consultation - non member Each 0.00 137.50 NEW Recreation Services City Baths Fees: Naturopaty Services: 90 minute standard consultation - member Each 0.00 125.00 NEW Recreation Services City Baths Fees: Personal Training: One on One 30 Min Session - Casual 10 visit Pass Per Pass 504.00 531.00 5.00% Recreation Services City Baths Fees: Personal Training: One on One 30 Minute Session Per Session 56.00 59.00 5.00% Recreation Services City Baths Fees: Personal Training: One on One Hour Session Per Session 80.00 82.00 3.00% Recreation Services City Baths Fees: Personal Training: One on One Hour Session - Casual 10 visit Pass Per Pass 720.00 738.00 3.00% 124 Branch Description Name of Product or Service Unit of Measure Current Price per unit (including GST)* as at 30 June 2014 Revised Price per unit (including GST) from 1 July 2014 * 72.00 73.80 3.00% % change Recreation Services City Baths Fees: Personal Training: One on One Hour Session - Member Per Session Recreation Services City Baths Fees: Personal Training: One on One Hour Session - Member 10 visit Pass Per Pass 648.00 664.20 3.00% Recreation Services City Baths Fees: Personal Training: One on Two 30 minute session: casual 10 visit pass Per Pass 0.00 666.00 NEW Recreation Services City Baths Fees: Personal Training: One on Two 30 minute session: Member Per Session 0.00 66.50 NEW Recreation Services City Baths Fees: Personal Training: One on Two 30 minute session: Member 10 visit pass Per Pass 0.00 598.50 NEW Recreation Services City Baths Fees: Personal Training: One on Two 30 minute session: Non Member Per Session 0.00 74.00 NEW Recreation Services City Baths Fees: Personal Training: One on Two Hour Session Per Session 100.00 104.50 5.00% Recreation Services City Baths Fees: Personal Training: One on Two Hour Session - Casual 10 visit Pass Per Pass 900.00 940.50 5.00% Recreation Services City Baths Fees: Personal Training: One on Two Hour Session - Member Per Session 84.00 94.00 12.00% Recreation Services City Baths Fees: Personal Training: One on Two Hour Session - Member 10 visit Pass Per Pass 756.00 846.00 12.00% Recreation Services City Baths Fees: Private Swimming Lessons : One on Two 30 minute session : Non Member Per Session 0.00 74.00 NEW Recreation Services City Baths Fees: Private Swimming Lessons: One on One 30 Min Session - Casual 10 visit Pass Per Pass 504.00 531.00 5.00% Recreation Services City Baths Fees: Private Swimming Lessons: One on One 30 Minute Session Per Session 56.00 59.00 5.00% Recreation Services City Baths Fees: Private Swimming Lessons: One on One Hour Session Per Session 80.00 82.00 3.00% Recreation Services City Baths Fees: Private Swimming Lessons: One on One Hour Session - Casual 10 visit Pass Per Pass 720.00 738.00 3.00% Recreation Services City Baths Fees: Private Swimming Lessons: One on One Hour Session - Member Per Session 72.00 73.80 3.00% Recreation Services City Baths Fees: Private Swimming Lessons: One on One Hour Session - Member 10 visit Pass Per Pass 648.00 664.20 3.00% Recreation Services City Baths Fees: Private Swimming Lessons: One on Two 30 minute session: Member Per Session 0.00 66.50 NEW Recreation Services City Baths Fees: Private Swimming Lessons: One on Two 30 minute session: Member 10 Visit Pass Per Pass 0.00 598.50 NEW Recreation Services City Baths Fees: Private Swimming Lessons: One on Two 30 minute: casual 10 Visit Pass Per Pass 0.00 666.00 NEW Recreation Services City Baths Fees: Private Swimming Lessons: One on Two Hour Session Per Session 100.00 104.50 5.00% 125 Branch Description Unit of Measure Name of Product or Service Current Price per unit (including GST)* as at 30 June 2014 Revised Price per unit (including GST) from 1 July 2014 * 900.00 940.50 5.00% 84.00 94.00 12.00% 756.00 846.00 12.00% % change Recreation Services City Baths Fees: Private Swimming Lessons: One on Two Hour Session - Casual 10 visit Pass Per Pass Recreation Services City Baths Fees: Private Swimming Lessons: One on Two Hour Session - Member Per Session Recreation Services City Baths Fees: Private Swimming Lessons: One on Two Hour Session - Member 10 visit Pass Per Pass Recreation Services City Baths Fees: Swim Casual Entry: Adult Swim / Shower / Bath Per Visit 5.90 6.10 3.00% Recreation Services City Baths Fees: Swim Casual Entry: Child Swim / Shower Per Visit 2.90 3.60 24.00% Recreation Services City Baths Fees: Swim Casual Entry: Concession Swim / Shower / Bath Per Visit 2.90 3.60 24.00% Recreation Services City Baths Fees: Swim Casual Entry: Family Swim Per Visit 13.30 15.20 14.00% Recreation Services City Baths Fees: Swim Casual Entry: Student Swim / Shower / Bath Per Visit 5.00 5.20 4.00% Recreation Services City Baths Fees: Swim Multi Visit Passes: Adult Swim 20 visit pass Per Pass 112.10 115.90 3.00% Recreation Services City Baths Fees: Swim Multi Visit Passes: Child Swim 20 visit pass Per Pass 55.10 68.40 24.00% Recreation Services City Baths Fees: Swim Multi Visit Passes: Concession Swim 20 visit Pass Per Pass 55.10 68.40 24.00% Recreation Services City Baths Fees: Swim Multi Visit Passes: Student Swim 20 Visit Pass Per Pass 95.00 98.80 4.00% Recreation Services City Baths Fees: Swim Spa Sauna (SSS) Multi Visit Passes: Adult SSS 20 visit Pass Per Pass 237.50 243.20 2.00% Recreation Services City Baths Fees: Swim Spa Sauna (SSS) Multi Visit Passes: Concession SSS 20 visit Pass Per Pass 110.20 146.30 33.00% Recreation Services City Baths Fees: Swim Spa Sauna (SSS) Multi Visit Passes: Student SSS 20 visit Pass Per Pass 190.00 195.70 3.00% Recreation Services City Baths Fees: Swim Spa Sauna (SSS): Adult Swim/Spa/Sauna Per Visit 12.50 12.80 2.00% Recreation Services City Baths Fees: Swim Spa Sauna (SSS): Concession Swim/Spa/Sauna Per Visit 5.80 7.70 33.00% Recreation Services City Baths Fees: Swim Spa Sauna (SSS): Student Swim/Spa/Sauna Per Visit 10.00 10.30 3.00% Recreation Services City Baths Fees: Wellness Course: Adult Wellness Class - Guest Reformer Per Pass 109.00 0.00 N/A Recreation Services City Baths Fees: Wellness Course: Adult Wellness Class - Member Reformer Per Pass 99.00 0.00 N/A Recreation Services City Baths Fees: Wellness Course: Adult Wellness Class; Member Per Session 16.50 17.00 3.00% 126 Branch Description Name of Product or Service Unit of Measure Current Price per unit (including GST)* as at 30 June 2014 Revised Price per unit (including GST) from 1 July 2014 * 18.20 18.80 3.00% % change Recreation Services City Baths Fees: Wellness Course: Adult Wellness Class; Non Member Per Session Recreation Services Facility Hire: Outdoor Sports Courts: Off Peak per half hour Each 0.00 9.30 NEW Recreation Services Facility Hire: Outdoor Sports Courts: Peak per half hour Each 0.00 13.50 NEW Recreation Services Golf Course Fees: Admission Fees - Royal Park Golf Course (Child 9 holes) Each 10.00 10.50 5.00% Recreation Services Golf Course Fees: Admission Fees - Royal Park Golf Course (Junior annual ticket) Each 490.00 505.00 3.00% Recreation Services Golf Course Fees: Admission Fees - Royal Park Golf Course (Pensioner 18 holes) Each 14.00 14.50 4.00% Recreation Services Golf Course Fees: Admission Fees - Royal Park Golf Course (Pensioner 9 holes) Each 10.00 10.50 5.00% Recreation Services Golf Course Fees: Admission Fees - Royal Park Golf Course (Senior 18 holes) Each 16.50 17.00 3.00% Recreation Services Golf Course Fees: Admission Fees - Royal Park Golf Course (Senior 9 holes) Each 12.00 12.50 4.00% Recreation Services Golf Course Fees: Admission Fees - Royal Park Golf Course (Student 18 holes) Each 14.00 14.50 4.00% Recreation Services Golf Course Fees: Admission Fees - Royal Park Golf Course (5 day annual ticket) Each 550.00 565.00 3.00% Recreation Services Golf Course Fees: Admission Fees - Royal Park Golf Course (7 day annual ticket) Each 750.00 770.00 3.00% Recreation Services Golf Course Fees: Admission Fees - Royal Park Golf Course (Adult 18 holes) Each 23.00 23.50 2.00% Recreation Services Golf Course Fees: Admission Fees - Royal Park Golf Course (Adult 9 holes) Each 16.00 16.50 3.00% Recreation Services Golf Course Fees: Admission Fees - Royal Park Golf Course (Child 18 holes) Each 14.00 14.50 4.00% Recreation Services Golf Course Fees: Admission Fees - Royal Park Golf Course (golf practice) Each 5.00 6.50 30.00% Recreation Services Golf Course Fees: Admission Fees - Royal Park Golf Course (Student 9 holes) Each 10.00 10.50 5.00% Recreation Services Kensington Pool Fees: Facility Equipment and Staff Hire: Miscellaneous: Adult Netball - Registration Fee Each 125.00 153.00 22.00% Recreation Services Kensington Pool Fees: Facility Equipment and Staff Hire: Miscellaneous: Adult Netball/Soccer - Game Fee Each 62.00 63.65 3.00% Recreation Services Kensington Pool Fees: Facility Equipment and Staff Hire: Miscellaneous: Bus - Half Day Each 46.00 47.25 3.00% 127 Branch Description Unit of Measure Name of Product or Service Current Price per unit (including GST)* as at 30 June 2014 Revised Price per unit (including GST) from 1 July 2014 * % change Recreation Services Kensington Pool Fees: Facility Equipment and Staff Hire: Miscellaneous: Bus - Half Day - community group rate Each 32.00 32.85 3.00% Recreation Services Kensington Pool Fees: Facility Equipment and Staff Hire: Miscellaneous: Bus - Hire Per Day Each 75.00 77.05 3.00% Recreation Services Kensington Pool Fees: Facility Equipment and Staff Hire: Miscellaneous: Bus - Hire Per Day - community group rate Each 54.00 55.45 3.00% Recreation Services Kensington Pool Fees: Facility Equipment and Staff Hire: Miscellaneous: Casual Shooting Each 3.00 3.10 3.00% Recreation Services Kensington Pool Fees: Facility Equipment and Staff Hire: Miscellaneous: Community Garden Plot Hire (Per Annum) Each 68.00 69.85 3.00% Recreation Services Kensington Pool Fees: Facility Equipment and Staff Hire: Miscellaneous: Community Garden Plot Hire (Per Annum) - Concession Each 40.00 41.10 3.00% Recreation Services Kensington Pool Fees: Facility Equipment and Staff Hire: Miscellaneous: Locker hire Each 2.50 2.60 4.00% Recreation Services Kensington Pool Fees: Facility Equipment and Staff Hire: Miscellaneous: Tennis - Annual Family Each 400.00 410.80 3.00% Recreation Services Kensington Pool Fees: Facility Equipment and Staff Hire: Miscellaneous: Tennis - Casual per hour Each 15.00 15.40 3.00% Recreation Services Kensington Pool Fees: Facility Equipment and Staff Hire: Miscellaneous: Tennis - Direct Debit Membership (fortnight) Each 14.00 14.38 3.00% Recreation Services Kensington Pool Fees: Facility Equipment and Staff Hire: Miscellaneous: Tennis - Joining Fee Each 40.00 41.08 3.00% Recreation Services Kensington Pool Fees: Facility Equipment and Staff Hire: Miscellaneous: Tennis- Direct Debit Concession Membership (fortnight) Each 11.50 11.80 3.00% Recreation Services Kensington Pool Fees: Facility Equipment and Staff Hire: Pool: Inflatable Hire 1.5hrs Each 90.00 92.45 3.00% Recreation Services Kensington Pool Fees: Facility Equipment and Staff Hire: Pool: Lifeguard per hour Each 35.00 35.85 2.00% Recreation Services Kensington Pool Fees: Facility Equipment and Staff Hire: Pool: Pool Lane Hire per Hour (plus entry fee) Each 45.00 46.25 3.00% Recreation Services Kensington Pool Fees: Facility Equipment and Staff Hire: Rooms/Studios: Community Hall Hire After Hours (Per Hour after 10pm) Each 110.00 112.95 3.00% Recreation Services Kensington Pool Fees: Facility Equipment and Staff Hire: Stadium/Courts: Stadium entry fee Each 3.00 3.10 3.00% 128 Branch Description Unit of Measure Name of Product or Service Current Price per unit (including GST)* as at 30 June 2014 Revised Price per unit (including GST) from 1 July 2014 * % change Recreation Services Kensington Pool Fees: Functions: Birthday parties (without food) Each 18.00 18.50 3.00% Recreation Services Kensington Pool Fees: Functions: Birthday Parties (with Food - Min 10) Each 22.00 22.60 3.00% Recreation Services Kensington Pool Fees: Group Exercise - 10 Packs: Adult 20 visit pass Each 323.00 331.50 3.00% Recreation Services Kensington Pool Fees: Group Exercise - 10 Packs: Concession/Child 20 visit pass Each 247.00 253.60 3.00% Recreation Services Kensington Pool Fees: Group Exercise - 10 Packs: Student 20 visit pass Each 385.00 292.70 -24.00% Recreation Services Kensington Pool Fees: Group Exercise (Land Based): Adult Exercise Class Each 17.00 17.45 3.00% Recreation Services Kensington Pool Fees: Group Exercise (Land Based): Concession/Child Exercise Class Each 13.00 13.35 3.00% Recreation Services Kensington Pool Fees: Group Exercise (Land Based): Prime Movers Older Adults Class Each 13.00 13.35 3.00% Recreation Services Kensington Pool Fees: Group Exercise (Land Based): Student Exercise Class Each 15.00 15.40 3.00% Recreation Services Kensington Pool Fees: Group Exercise (Water Based): Aquatic Education: Adult Swim Lesson (Per visit - Term Basis Only) Each 14.00 15.50 11.00% Recreation Services Kensington Pool Fees: Group Exercise (Water Based): Aquatic Education: AquaSafe School Holiday Program Each 12.00 12.30 3.00% Recreation Services Kensington Pool Fees: Group Exercise (Water Based): Aquatic Education: Concession/Child Swim Lesson (Per visit - Term Basis Only) Each 13.00 15.50 19.00% Recreation Services Kensington Pool Fees: Group Exercise (Water Based): Aquatic Education: Private Swim Lesson 30min - One on One - Guest Each 54.00 52.40 -3.00% Recreation Services Kensington Pool Fees: Group Exercise (Water Based): Aquatic Education: Private Swim Lesson 30min - One on One - Member Each 42.50 43.65 3.00% Recreation Services Kensington Pool Fees: Group Exercise (Water Based): Aquatic Education: Private Swim Lesson 60min - One on One - Guest Each 74.50 79.85 7.00% Recreation Services Kensington Pool Fees: Group Exercise (Water Based): Aquatic Education: Private Swim Lesson 60min - One on One - Member Each 64.00 65.70 3.00% Recreation Services Kensington Pool Fees: Group Exercise (Water Based): Aquatic Education: Private Swim Lesson 60min - One on Two - Guest Each 103.50 109.70 6.00% 129 Branch Description Unit of Measure Name of Product or Service Current Price per unit (including GST)* as at 30 June 2014 Revised Price per unit (including GST) from 1 July 2014 * % change Recreation Services Kensington Pool Fees: Group Exercise (Water Based): Aquatic Education: Private Swim Lesson 60min - One on Two - Member Each 90.00 91.40 2.00% Recreation Services Kensington Pool Fees: Group Exercise (Water Based): Aquatic Education: Swim Squad Each 17.00 17.45 3.00% Recreation Services Kensington Pool Fees: Group Exercise (Water Based): Aquatic Education: Swim Squad Concession Each 13.00 13.35 3.00% Recreation Services Kensington Pool Fees: Group Exercise (Water Based): Private Swimming Lessons - 10 Packs: Private Swim Lesson 30min 10 pack - Casual Each 486.00 471.60 -3.00% Recreation Services Kensington Pool Fees: Group Exercise (Water Based): Private Swimming Lessons - 10 Packs: Private Swim Lesson 30min 10 pack - Member Each 382.50 392.85 3.00% Recreation Services Kensington Pool Fees: Group Exercise (Water Based): Private Swimming Lessons - 10 Packs: Private Swim Lesson 60min 10 pack - Casual Each 670.50 718.65 7.00% Recreation Services Kensington Pool Fees: Group Exercise (Water Based): Private Swimming Lessons - 10 Packs: Private Swim Lesson 60min 10 pack - Casual (one on two) Each 931.50 987.30 6.00% Recreation Services Kensington Pool Fees: Group Exercise (Water Based): Private Swimming Lessons - 10 Packs: Private Swim Lesson 60min 10 pack - Member Each 576.00 591.30 3.00% Recreation Services Kensington Pool Fees: Group Exercise (Water Based): Private Swimming Lessons - 10 Packs: Private Swim Lesson 60min 10 pack - Member (one on two) Each 801.00 822.60 3.00% Recreation Services Kensington Pool Fees: Health Club - 20 Pack: Adult Gym - 20 pack Each 323.00 331.55 3.00% Recreation Services Kensington Pool Fees: Health Club - 20 Pack: Concession/Child Gym - 20 pack Each 247.00 253.65 3.00% Recreation Services Kensington Pool Fees: Health Club - 20 Pack: Student Gym - 20 pack Each 285.00 292.70 3.00% Recreation Services Kensington Pool Fees: Health Club: Adult Health Club Casual Each 17.00 17.45 3.00% Recreation Services Kensington Pool Fees: Health Club: Concession Health Club Casual Each 13.00 13.35 3.00% Recreation Services Kensington Pool Fees: Health Club: Student Health Club Casual Each 15.00 15.40 3.00% Recreation Services Kensington Pool Fees: Multi Activity Memberships : Young at Heart 12 month membership Each 475.00 520.00 9.00% Recreation Services Kensington Pool Fees: Multi Activity Memberships : Young at Heart fortnightly membership Each 22.00 20.55 -7.00% 130 Branch Description Unit of Measure Name of Product or Service Current Price per unit (including GST)* as at 30 June 2014 Revised Price per unit (including GST) from 1 July 2014 * % change Recreation Services Kensington Pool Fees: Multi Activity Memberships : Youth 12 month membership Each 475.00 520.00 9.00% Recreation Services Kensington Pool Fees: Multi Visit and Membership Passes: Multi-Activity Memberships- Current Membership Options: Aquatic Fortnightly Membership Each 18.00 18.50 3.00% Recreation Services Kensington Pool Fees: Multi Visit and Membership Passes: Multi-Activity Memberships- Current Membership Options: Health Club 12 Month Membership Full Each 875.00 832.00 -5.00% Recreation Services Kensington Pool Fees: Multi Visit and Membership Passes: Multi-Activity Memberships- Current Membership Options: Health Club 3 Month Membership Each 430.00 408.90 -5.00% Recreation Services Kensington Pool Fees: Multi Visit and Membership Passes: Multi-Activity Memberships- Current Membership Options: Health Club Fortnightly Membership Each 32.00 32.85 3.00% Recreation Services Kensington Pool Fees: Multi Visit and Membership Passes: Multi-Activity Memberships- Current Membership Options: Membership Administration / Joining Fee - Youth & Prime Movers Each 65.00 69.00 6.00% Recreation Services Kensington Pool Fees: Multi Visit and Membership Passes: Multi-Activity Memberships- Current Membership Options: Youth Fortnightly Membership Each 22.00 20.55 -7.00% Recreation Services Kensington Pool Fees: Multi Visit and Membership Passes: Pool: Adult swim 12 month membership Each 479.00 491.90 3.00% Recreation Services Kensington Pool Fees: Multi Visit and Membership Passes: Pool: Adult Swim 20 visit pass Each 98.00 100.70 3.00% Recreation Services Kensington Pool Fees: Multi Visit and Membership Passes: Pool: Concession/Child Swim 20 visit Pass Each 55.10 62.70 14.00% Recreation Services Kensington Pool Fees: Multi Visit and Membership Passes: Pool: Family Swim 20 visit pass Each 247.00 254.60 3.00% Recreation Services Kensington Pool Fees: Multi Visit and Membership Passes: Pool: Student Swim 20 Visit Pass Each 72.20 79.80 11.00% Recreation Services Kensington Pool Fees: Multi Visit and Membership Passes: Membership Fees: Active Melbourne: Fortnightly DD. Per Fortnight 0.00 47.00 NEW Recreation Services Kensington Pool Fees: Music Classes: Jazz Ballet Each 10.30 10.60 3.00% Recreation Services Kensington Pool Fees: Music Classes: Keyboard Lessons Each 27.60 28.35 3.00% 131 Branch Description Unit of Measure Name of Product or Service Current Price per unit (including GST)* as at 30 June 2014 Revised Price per unit (including GST) from 1 July 2014 * % change Recreation Services Kensington Pool Fees: Schools: Personal Training - 10 Pack: 1 hour 10 pack members Each 576.00 591.30 3.00% Recreation Services Kensington Pool Fees: Schools: Personal Training - 10 Pack: 1 hour 10 pack non members Each 670.50 709.65 6.00% Recreation Services Kensington Pool Fees: Schools: Personal Training - 10 Pack: 30 min 10 pack - members Each 382.50 392.85 3.00% Recreation Services Kensington Pool Fees: Schools: Personal Training - 10 Pack: 30 min 10 pack non members Each 486.00 471.80 -3.00% Recreation Services Kensington Pool Fees: Schools: Personal Training - 10 Pack: Personal Training Member 60 mins One on Two x 10 - Guest Each 931.50 987.30 6.00% Recreation Services Kensington Pool Fees: Schools: Personal Training - 10 Pack: Personal Training Member 60 mins One on Two x 10 - Member Each 801.00 822.60 3.00% Recreation Services Kensington Pool Fees: Schools: Personal Training casual: 30 minute session - member Each 42.50 43.56 2.00% Recreation Services Kensington Pool Fees: Schools: Personal Training casual: 30 minute session - non member Each 54.00 52.40 -3.00% Recreation Services Kensington Pool Fees: Schools: Personal Training casual: 60 minute session - member Each 64.00 65.70 3.00% Recreation Services Kensington Pool Fees: Schools: Personal Training casual: 60 minute session -not member Each 74.50 78.85 6.00% Recreation Services Kensington Pool Fees: Schools: Personal Training casual: Personal Training 60 mins - One on Two Guest Each 103.50 109.70 6.00% Recreation Services Kensington Pool Fees: Schools: Personal Training casual: Personal Training 60 mins - One on Two Member Each 89.00 91.40 3.00% Recreation Services Kensington Pool Fees: Stadium: Ed Gym Each 14.00 14.40 3.00% Recreation Services Kensington Pool Fees: Stadium: Stadium - Junior Basketball Program Each 5.50 5.65 3.00% Recreation Services Kensington Pool Fees: Stadium: Stadium - Junior Netball Program Each 5.50 5.65 3.00% Recreation Services Kensington Pool Fees: Stadium: Stadium Junior Soccer Program Each 5.50 5.65 3.00% Recreation Services Kensington Pool Fees: Swim: Adult group swim entry Each 3.20 3.30 3.00% Recreation Services Kensington Pool Fees: Swim: Adult Swim Each 5.20 5.30 2.00% Recreation Services Kensington Pool Fees: Swim: Child group swim entry Each 2.70 3.05 13.00% 132 Branch Description Unit of Measure Name of Product or Service Current Price per unit (including GST)* as at 30 June 2014 Revised Price per unit (including GST) from 1 July 2014 * % change Recreation Services Kensington Pool Fees: Swim: Concession/Child Swim Each 2.90 3.30 14.00% Recreation Services Kensington Pool Fees: Swim: Family Swim Each 13.00 13.40 3.00% Recreation Services Kensington Pool Fees: Swim: Student Swim Each 3.80 4.20 11.00% Recreation Services Kensington Pool Fees; Facility Equipment & Staff Hire Pool : Aquatic Education Instructor Hire Fee Each 50.00 51.35 3.00% Recreation Services Kensington Pool Fees; Facility Equipment & Staff Hire Pool : Group Instructor Hire Fee Each 90.00 92.45 3.00% Recreation Services Kensington Pool Fees; Multi Activity Membership: PT Membership 30 min member (one session per week) Each 72.00 73.95 3.00% Recreation Services Kensington Pool Fees; Multi Activity Membership: PT Membership 60 min member (one session per week) Each 118.00 121.20 3.00% Recreation Services Kensington Pool Fees; Rooms/Studios : Arts and Crafts Room Hire Each 30.00 30.80 3.00% Recreation Services Kensington Pool Fees; Stadium/Courts: Child Stadium Entry Fee Each 3.00 3.10 3.00% Recreation Services Kensington Recreation Centre Fees: Aquatic Education: Adult Swim Lesson 30 minute class Each 22.00 0.00 N/A Recreation Services Kensington Recreation Centre Fees: Aquatic Education: Adult Swim Lesson 45 minute class Each 26.00 0.00 N/A Recreation Services Kensington Recreation Centre Fees: Aquatic Education: Adult Swim Lesson 60 minute squad class Each 27.00 0.00 N/A Recreation Services Kensington Recreation Centre Fees: Personal Training: Challenge Fitness Camp: Member 1st camp (per camp) Each 252.00 258.80 3.00% Recreation Services Kensington Recreation Centre Fees: Personal Training: Challenge Fitness Camp: Member ongoing camps (per camp) Each 201.00 206.45 3.00% Recreation Services Kensington Recreation Centre Fees: Personal Training: Challenge Fitness Camp: Non Member ongoing camps (per camp) Each 217.00 222.85 3.00% Recreation Services Kensington Recreation Centre Fees: Personal Training: Challenge Fitness Camp: Non-Member 1st camp (per camp) Each 272.00 279.35 3.00% Recreation Services Melbourne City Sports - Community Programming: Casual Entry: Sports Competitions: Corporate Sports 10 Round Lawn Bowls Competition - Team Registration (4 pp / team) Each 346.00 365.00 5.00% 133 Branch Description Unit of Measure Name of Product or Service Current Price per unit (including GST)* as at 30 June 2014 Revised Price per unit (including GST) from 1 July 2014 * % change Recreation Services Melbourne City Sports - Community Programming: Casual Entry: Sports Competitions: Corporate Sports 14 Round Basketball Competition - Team Registration (5 pp / team) Each 605.00 622.00 3.00% Recreation Services Melbourne City Sports - Community Programming: Casual Entry: Sports Competitions: Corporate Sports 14 Round Netball Competition - Team Registration (7 pp / team) Each 850.00 873.00 3.00% Recreation Services Melbourne City Sports - Community Programming: Casual Entry: Sports Competitions: Corporate Sports 14 Round Soccer Competition - Team Registration (5 pp / team) Each 605.00 621.00 3.00% Recreation Services Melbourne City Sports - Community Programming: Casual Entry: Sports Competitions: Corporate Sports 8 Round Corporate Cup - Team Registration (4 pp / team) Each 276.00 284.00 3.00% Recreation Services Melbourne City Sports : Corporate Sports : 14 round touch football competition - team registration (7pp/team) Each 850.00 873.00 3.00% Recreation Services Melbourne City Sports : Corporate Sports : Corporate Walking Programs Each 98.00 100.00 2.00% Recreation Services Melbourne City Sports : Corporate Sports : Healthy Workplace programs Each 1,080.00 1,110.00 3.00% Recreation Services Melbourne City Sports : Corporate Sports: Sports Active; Dragon Boat Challenge Each 1,167.00 1,200.00 3.00% Recreation Services Melbourne City Sports : Corporate Sports: Sports Active; Lawn Bowls Each 216.00 222.00 3.00% Recreation Services Melbourne City Sports : Corporate Sports: Sports Active; Soccer, netball, Touch Football Each 540.00 555.00 3.00% Recreation Services Melbourne City Sports : Corporate Sports: Sports Active; Tan Team Challenge Each 86.00 88.00 2.00% Recreation Services North Melbourne Community Centre Fees: Casual Entry: Group Exercise (Land Based): Adult Exercise Class Each 10.90 11.20 3.00% Recreation Services North Melbourne Community Centre Fees: Casual Entry: Group Exercise (Land Based): Pensioner Exercise Class Each 8.70 8.95 3.00% Recreation Services North Melbourne Community Centre Fees: Casual Entry: Group Exercise (Land Based): Prime Movers Older Adults Class Each 5.70 5.85 3.00% Recreation Services North Melbourne Community Centre Fees: Casual Entry: Stadium: Adult Stadium Entry Each 4.00 4.10 3.00% 134 Branch Description Unit of Measure Name of Product or Service Current Price per unit (including GST)* as at 30 June 2014 Revised Price per unit (including GST) from 1 July 2014 * % change Recreation Services North Melbourne Community Centre Fees: Casual Entry: Stadium: Child Stadium Entry Each 2.70 2.80 4.00% Recreation Services North Melbourne Community Centre Fees: Facility Hire (per hour): External Courts: Soccer Grassed Field Each 40.00 41.10 3.00% Recreation Services North Melbourne Community Centre Fees: Facility Hire (per hour): External Courts: Synthetic Turf Surface Full Court Each 75.00 77.00 3.00% Recreation Services North Melbourne Community Centre Fees: Facility Hire (per hour): Miscellaneous: Current NMCC User Groups - All Rooms (per hour, multiple rooms) Each 15.50 15.90 3.00% Recreation Services North Melbourne Community Centre Fees: Facility Hire (per hour): Rooms/Studios: Crèche (playroom) Each 23.00 23.60 3.00% Recreation Services North Melbourne Community Centre Fees: Facility Hire (per hour): Rooms/Studios: Games Room Each 23.00 23.60 3.00% Recreation Services North Melbourne Community Centre Fees: Facility Hire (per hour): Rooms/Studios: Multi Purpose Room Each 23.00 23.60 3.00% Recreation Services North Melbourne Community Centre Fees: Facility Hire (per hour): Rooms/Studios: Rooms/Studios - Partners Each 18.60 19.10 3.00% Recreation Services North Melbourne Community Centre Fees: Facility Hire (per hour): Stadium/Courts: Community Hall Hire with Kitchen Each 35.00 35.95 3.00% Recreation Services North Melbourne Community Centre Fees: Facility Hire (per hour): Stadium/Courts: Community Hall Hire with Kitchen - Concession/Community Groups Each 28.00 28.75 3.00% Recreation Services North Melbourne Community Centre Fees: Facility Hire (per hour): Stadium/Courts: Community Hall Hire with Kitchen - Partners Each 23.00 23.60 3.00% Recreation Services North Melbourne Community Centre Fees: Facility Hire (per hour): Stadium/Courts: Full Court Stadium Hire (Per Hour) Each 39.00 40.00 3.00% Recreation Services North Melbourne Community Centre Fees: Facility Hire (per hour): Stadium/Courts: Full Court Stadium Hire (Per Hour) - Concession/Community Groups Each 32.00 32.85 3.00% Recreation Services North Melbourne Community Centre Fees: Facility Hire (per hour): Stadium/Courts: Full Court Stadium Hire (per hour) - Partners Each 27.00 27.75 3.00% Recreation Services North Melbourne Community Centre Fees: Multi Visit and Membership Passes: EdGym casual entry Each 13.40 13.75 3.00% Recreation Services North Melbourne Community Centre Fees: Multi Visit and Membership Passes: EdGym Monthly Direct Debit Each 37.00 38.00 3.00% 135 Branch Description Unit of Measure Name of Product or Service Current Price per unit (including GST)* as at 30 June 2014 Revised Price per unit (including GST) from 1 July 2014 * % change Recreation Services North Melbourne Community Centre Fees: Multi Visit and Membership Passes: Health Club: 3 month term membership Each 134.00 137.60 3.00% Recreation Services North Melbourne Community Centre Fees: Multi Visit and Membership Passes: Health Club: 10 visit pass Each 82.00 84.20 3.00% Recreation Services North Melbourne Community Centre Fees: Multi Visit and Membership Passes: Health Club: Adult Gym Casual Each 10.30 10.60 3.00% Recreation Services North Melbourne Community Centre Fees: Multi Visit and Membership Passes: Health Club: Concession Gym Casual Each 8.20 8.40 2.00% Recreation Services North Melbourne Community Centre Fees: Multi Visit and Membership Passes: Health Club: Health Club Monthly Gold Membership Each 33.00 33.90 3.00% Recreation Services North Melbourne Community Centre Fees: Multi Visit and Membership Passes: Health Club: Membership Administration/ Joining Fee Each 36.00 37.00 3.00% Recreation Services North Melbourne Community Centre Fees: Multi Visit and Membership Passes: Health Club: Pensioner Gym Casual Each 8.20 8.40 2.00% Recreation Services North Melbourne Community Centre Fees: Multi Visit and Membership Passes: Stadium & Sports Programs: Birthday Parties Per Person Fee (minimum of ten) Each 9.00 9.25 3.00% Recreation Services North Melbourne Community Centre Fees: Multi Visit and Membership Passes: Stadium & Sports Programs: Junior Soccer Competition Team Sheet Fee Each 34.00 34.90 3.00% Recreation Services North Melbourne Community Centre Fees: Multi Visit and Membership Passes: Stadium & Sports Programs: Junior Sports (Soccer and Basketball) Each 3.10 3.20 3.00% Recreation Services North Melbourne Community Centre Fees: Multi Visit and Membership Passes: Stadium & Sports Programs: Social Netball Competition Team Sheet Fee Each 55.00 56.50 3.00% Recreation Services North Melbourne Pool: Aquatic Education : 1 week intensive program - Adult (5 classes) Each 70.00 0.00 N/A Recreation Services North Melbourne Pool: Aquatic Education : 1 week intensive program - Child (5 classes) Each 65.00 0.00 N/A Recreation Services North Melbourne Pool: Aquatic Education : Adult Aquatic Education (per visit - term basis only) Each 14.00 0.00 N/A 136 Branch Description Unit of Measure Name of Product or Service Current Price per unit (including GST)* as at 30 June 2014 Revised Price per unit (including GST) from 1 July 2014 * % change Recreation Services North Melbourne Pool: Aquatic Education : Aquatic Education (30 minute lesson) Each 13.00 15.50 19.00% Recreation Services North Melbourne Pool: Aquatic Education: 1 week intensive program - Goldfish & Shark level Each 13.00 0.00 N/A Recreation Services North Melbourne Pool: Aquatic Education: 1 week intensive program - Stingray Level / Squad Each 13.00 0.00 N/A Recreation Services North Melbourne Pool: Aquatic Education: 1 week intensive program - Water Familiarisation Each 13.00 0.00 N/A Recreation Services North Melbourne Pool: Aquatic Education: Goldfish Shark level (30 minute lesson) Each 13.00 0.00 N/A Recreation Services North Melbourne Pool: Aquatic Education: Stingray Level / Squad (45 minute lesson) Each 14.00 0.00 N/A Recreation Services North Melbourne Pool: Aquatic Education: Water Familiarisation level (Adult 30 minute lesson) Each 14.00 0.00 N/A Recreation Services North Melbourne Pool: Facility Equipment and Staff Hire: Birthday Parties Per child with food (Min 10 Children) Each 22.00 22.60 3.00% Recreation Services North Melbourne Pool: Facility Equipment and Staff Hire: Birthday Parties Per child without food (Min 10 Children) Each 18.00 18.50 3.00% Recreation Services North Melbourne Pool: Facility Equipment and Staff Hire: Miscellaneous Locker Hire Each 2.50 2.60 4.00% Recreation Services North Melbourne Pool: Facility Equipment and Staff Hire: Miscellaneous Replacement Barcoded Card Each 10.00 10.25 3.00% Recreation Services North Melbourne Pool: Facility Equipment and Staff Hire: Pool: Inflatable hire 1.5hrs Each 90.00 92.45 3.00% Recreation Services North Melbourne Pool: Facility Equipment and Staff Hire: Pool: Lifeguard per hour Each 35.00 35.95 3.00% Recreation Services North Melbourne Pool: Facility Equipment and Staff Hire: Pool: Pool Lane Hire per Hour (Plus Group Entry Fee) Each 45.00 46.25 3.00% Recreation Services North Melbourne Pool: Facility Equipment and Staff Hire: Schools Aquatic Education Entry fee per child per day Each 2.70 2.80 4.00% Recreation Services North Melbourne Pool: Facility Equipment and Staff Hire: Schools Aquatic Education Instructor + Lane hire fee Each 50.00 51.35 3.00% Recreation Services North Melbourne Pool: Private Swim Lessons: One on One 30 Min Session - Guest 10 visit Pass Each 486.00 471.60 -3.00% Recreation Services North Melbourne Pool: Private Swim Lessons: One on One 30 Min Session - Member 10 visit Pass Each 382.50 392.85 3.00% 137 Branch Description Unit of Measure Name of Product or Service Current Price per unit (including GST)* as at 30 June 2014 Revised Price per unit (including GST) from 1 July 2014 * % change Recreation Services North Melbourne Pool: Private Swim Lessons: One on One 30 Minute Session - Guest Each 54.00 52.40 -3.00% Recreation Services North Melbourne Pool: Private Swim Lessons: One on One 30 Minute Session - Member Each 42.50 43.65 3.00% Recreation Services North Melbourne Pool: Private Swim Lessons: One on One Hour Session - Guest Each 74.50 79.85 7.00% Recreation Services North Melbourne Pool: Private Swim Lessons: One on One Hour Session - Guest 10 visit Pass Each 670.50 718.65 7.00% Recreation Services North Melbourne Pool: Private Swim Lessons: One on One Hour Session - Member Each 64.00 65.70 3.00% Recreation Services North Melbourne Pool: Private Swim Lessons: One on One Hour Session - Member 10 visit Pass Each 576.00 591.30 3.00% Recreation Services North Melbourne Pool: Private Swim Lessons: One on Two Hour Session - Guest Each 103.50 109.70 6.00% Recreation Services North Melbourne Pool: Private Swim Lessons: One on Two Hour Session - Guest 10 visit Pass Each 931.50 987.30 6.00% Recreation Services North Melbourne Pool: Private Swim Lessons: One on Two Hour Session - Member Each 89.00 91.40 3.00% Recreation Services North Melbourne Pool: Private Swim Lessons: One on Two Hour Session - Member 10 visit Pass Each 801.00 822.60 3.00% Recreation Services North Melbourne Pool: Season Pass (1 month) : Adult Squad (45 minute lesson) Each 17.00 17.45 3.00% Recreation Services North Melbourne Pool: Season Pass (1 month) : Concession Squad (45 minute lesson) Each 13.00 13.35 3.00% Recreation Services North Melbourne Pool: Season Pass (1 month) : Student Squad (45 minute lesson) Each 15.00 15.40 3.00% Recreation Services North Melbourne Pool: Season Passes: Adult Swim Season Pass (1 months) Each 55.00 63.60 16.00% Recreation Services North Melbourne Pool: Season Passes: Adult Swim Season Pass (7 months) Each 255.00 296.80 16.00% Recreation Services North Melbourne Pool: Season Passes: Concession/Child Swim Season Pass (1 months) Each 38.00 39.60 4.00% Recreation Services North Melbourne Pool: Season Passes: Concession/Child Swim Season Pass (7 months) Each 160.00 184.80 16.00% Recreation Services North Melbourne Pool: Season Passes: Family Swim Season Pass (1 months) Each 128.00 134.00 5.00% Recreation Services North Melbourne Pool: Season Passes: Family Swim Season Pass (7 months) Each 580.00 609.70 5.00% Recreation Services North Melbourne Pool: Season Passes: Student Swim Season Pass (1 months) Each 50.00 50.40 1.00% Recreation Services North Melbourne Pool: Season Passes: Student Swim Season Pass (7 months) Each 200.00 235.20 18.00% 138 Branch Description Unit of Measure Name of Product or Service Current Price per unit (including GST)* as at 30 June 2014 Revised Price per unit (including GST) from 1 July 2014 * % change Recreation Services North Melbourne Pool: Spectator Entry Fees: Adult Each 3.00 3.10 3.00% Recreation Services North Melbourne Pool: Spectator Entry Fees: Concession/Child Each 2.00 2.10 5.00% Recreation Services North Melbourne Pool: Spectator Entry Fees: Student Each 2.50 2.60 4.00% Recreation Services North Melbourne Pool: Swim Multi Visit Passes (valid for one year from date of purchase): Adult Swim 20 visit pass Each 98.80 100.70 2.00% Recreation Services North Melbourne Pool: Swim Multi Visit Passes (valid for one year from date of purchase): Concession/Child Swim 20 visit Pass Each 53.20 62.70 18.00% Recreation Services North Melbourne Pool: Swim Multi Visit Passes (valid for one year from date of purchase): Family Swim 20 visit pass Each 247.00 254.60 3.00% Recreation Services North Melbourne Pool: Swim Multi Visit Passes (valid for one year from date of purchase): Student Swim 20 Visit Pass Each 72.20 79.80 11.00% Recreation Services North Melbourne Pool: Swim: Adult Swim Each 5.20 5.30 2.00% Recreation Services North Melbourne Pool: Swim: Concession/Child Each 2.90 3.30 14.00% Recreation Services North Melbourne Pool: Swim: Family Swim Each 13.00 13.40 3.00% Recreation Services North Melbourne Pool: Swim: Student Swim Each 3.80 4.20 11.00% Recreation Services North Melbourne Recreation Centre: Boot Camp: Boot Camps - Member - per session Each 12.00 13.85 15.00% Recreation Services North Melbourne Recreation Centre: Boot Camp: Boot Camps - Non Member - per session Each 15.00 15.50 3.00% Recreation Services North Melbourne Recreation Centre: Community Group Court Hire: Basketball/Netball/Soccer Hire: Per court per hire. Each 0.00 25.00 NEW Recreation Services North Melbourne Recreation Centre: Competitions: Registration fee per season per team Each 150.00 153.00 2.00% Recreation Services North Melbourne Recreation Centre: Competitions: Team sheet per team, per game (Netball/Basketball/Soccer) Each 62.00 63.65 3.00% Recreation Services North Melbourne Recreation Centre: Entry Fees: Adult Each 3.00 3.10 3.00% Recreation Services North Melbourne Recreation Centre: Entry Fees: Student / Concession Each 3.00 3.10 3.00% 139 Branch Description Unit of Measure Name of Product or Service Current Price per unit (including GST)* as at 30 June 2014 Revised Price per unit (including GST) from 1 July 2014 * % change Recreation Services North Melbourne Recreation Centre: Gymnasium & Group Fitness: Adult Each 17.00 17.45 3.00% Recreation Services North Melbourne Recreation Centre: Gymnasium & Group Fitness: Adult Gymnasium 20 visits Each 323.00 331.55 3.00% Recreation Services North Melbourne Recreation Centre: Gymnasium & Group Fitness: Concession Each 13.00 13.35 3.00% Recreation Services North Melbourne Recreation Centre: Gymnasium & Group Fitness: Concession Gymnasium 20 visits Each 247.00 253.65 3.00% Recreation Services North Melbourne Recreation Centre: Gymnasium & Group Fitness: Student Each 15.00 15.40 3.00% Recreation Services North Melbourne Recreation Centre: Gymnasium & Group Fitness: Student Gymnasium 20 visits Each 285.00 292.70 3.00% Recreation Services North Melbourne Recreation Centre: Massage Services: Membership Fees: Club - Fortnightly DD Each 32.00 32.85 3.00% Recreation Services North Melbourne Recreation Centre: Massage Services: Membership Fees: Club - Results 12 Months Each 875.00 832.00 -5.00% Recreation Services North Melbourne Recreation Centre: Massage Services: Membership Fees: Start Up - Young at Heart / Youth Each 65.00 69.00 6.00% Recreation Services North Melbourne Recreation Centre: Membership Fees: Aquatic - Fortnightly DD Each 18.00 18.50 3.00% Recreation Services North Melbourne Recreation Centre: Membership Services: Membership Fees: Active Melbourne: Fortnightly DD. Per Fortnight 0.00 47.00 NEW Recreation Services North Melbourne Recreation Centre: Membership Services: Membership Fees: Prime/Youth - Fortnightly DD Each 20.00 20.55 3.00% Recreation Services North Melbourne Recreation Centre: Membership Services: Membership Fees: Prime/Youth - Results 12 months Each 475.00 520.00 9.00% Recreation Services North Melbourne Recreation Centre: Miscellaneous: Group Fitness Instructor hire per hour Each 90.00 92.45 3.00% Recreation Services North Melbourne Recreation Centre: Miscellaneous: Locker Hire Each 2.50 2.60 4.00% Recreation Services North Melbourne Recreation Centre: Miscellaneous: Multi visit pass: Locker Hire 20 visit pass Each 0.00 49.40 NEW Recreation Services North Melbourne Recreation Centre: Miscellaneous: Replacement Barcoded Card Each 10.00 10.25 3.00% Recreation Services North Melbourne Recreation Centre: Personal Training: One on One 30 Min Session - Guest 10 visit Pass Each 486.00 471.60 -3.00% 140 Branch Description Unit of Measure Name of Product or Service Current Price per unit (including GST)* as at 30 June 2014 Revised Price per unit (including GST) from 1 July 2014 * % change Recreation Services North Melbourne Recreation Centre: Personal Training: One on One 30 Min Session - Member 10 visit Pass Each 382.50 392.85 3.00% Recreation Services North Melbourne Recreation Centre: Personal Training: One on One 30 Minute Session - Guest Each 54.00 52.40 -3.00% Recreation Services North Melbourne Recreation Centre: Personal Training: One on One 30 Minute Session - Member Each 42.50 43.65 3.00% Recreation Services North Melbourne Recreation Centre: Personal Training: One on One Hour Session - Guest Each 74.50 78.85 6.00% Recreation Services North Melbourne Recreation Centre: Personal Training: One on One Hour Session - Guest 10 visit Pass Each 670.50 709.65 6.00% Recreation Services North Melbourne Recreation Centre: Personal Training: One on One Hour Session - Member Each 64.00 65.70 3.00% Recreation Services North Melbourne Recreation Centre: Personal Training: One on One Hour Session - Member 10 visit Pass Each 576.00 591.30 3.00% Recreation Services North Melbourne Recreation Centre: Personal Training: One on Two Hour Session - Guest Each 103.50 109.70 6.00% Recreation Services North Melbourne Recreation Centre: Personal Training: One on Two Hour Session - Guest 10 visit Pass Each 931.50 987.30 6.00% Recreation Services North Melbourne Recreation Centre: Personal Training: One on Two Hour Session - Member Each 89.00 91.40 3.00% Recreation Services North Melbourne Recreation Centre: Personal Training: One on Two Hour Session - Member 10 visit Pass Each 801.00 822.60 3.00% Recreation Services Riverslide Skate Park: Birthday Parties Each 17.00 17.50 3.00% Recreation Services Riverslide Skate Park: Group Skate lessons (max 6 students) price per head Each 17.00 17.50 3.00% Recreation Services Riverslide Skate Park: Locker use Each 1.50 1.55 3.00% Recreation Services Riverslide Skate Park: Membership Each 46.50 47.25 2.00% Recreation Services Riverslide Skate Park: Park Hire (Per 3 hour blocks) Each 600.00 616.20 3.00% Recreation Services Riverslide Skate Park: Private Skate Lessons Each 46.00 47.30 3.00% Recreation Services Riverslide Skate Park: Room hire events Each 240.00 246.50 3.00% 141 Branch Description Unit of Measure Name of Product or Service Current Price per unit (including GST)* as at 30 June 2014 Revised Price per unit (including GST) from 1 July 2014 * % change Recreation Services Riverslide Skate Park: School ASSC group lessons (max 25 students) price per group per session Each 215.00 220.80 3.00% Recreation Services Riverslide Skate Park: School Groups (per heard) Each 17.00 17.45 3.00% Recreation Services Riverslide Skate Park: School Holiday Programs (per head, min 30) Each 9.00 9.25 3.00% Recreation Services Riverslide Skate Park: Skate Board Hire Each 5.00 5.15 3.00% Recreation Services Sports: Baseball Ground Hire (Season - Full Share) Season - Full Share 1,257.00 1,290.00 3.00% Recreation Services Sports: Baseball Ground Hire (Season - Half Share) Season - Half Share 627.00 645.00 3.00% Recreation Services Sports: Cricket Synthetic Ground Hire (Season - Full Share) Season - Full Share 1,639.00 1,685.00 3.00% Recreation Services Sports: Cricket Synthetic Ground Hire (Season - Half Share) Season - Half Share 820.00 840.00 2.00% Recreation Services Sports: Cricket Turf Ground Hire (Season - Full Share) Season - Full Share 6,010.00 6,170.00 3.00% Recreation Services Sports: Cricket Turf Ground Hire (Season - Half Share) Season - Half Share 3,004.00 3,085.00 3.00% Recreation Services Sports: Football Ground Hire (Season - Full Share) Season - Full Share 1,492.00 1,530.00 3.00% Recreation Services Sports: Football Ground Hire (Season - Half Share) Season - Half Share 747.00 765.00 2.00% Recreation Services Sports: Pavilion Seasonal Bonds Season - Full Share 1,000.00 1,030.00 3.00% Recreation Services Sports: Recreation/Sports Ground Hire - Clean, no line markings/infrastructure (Season Full Share) Season - Full Share 576.00 590.00 2.00% Recreation Services Sports: Recreation/Sports Ground Hire - Clean, no line markings/infrastructure (Season Half Share) Season - Half Share 289.00 295.00 2.00% Recreation Services Sports: Refurbished Pavilion Hire - CATEGORY B (Season - Full Share) Season - Full Share 628.50 645.00 3.00% Recreation Services Sports: Refurbished Pavilion Hire - CATEGORY B (Season - Half-Share) Season - Half Share 313.50 320.00 2.00% Recreation Services Sports: Refurbished Pavilion Hire (Season - Full Share) Season - Full Share 1,257.00 1,290.00 3.00% Recreation Services Sports: Refurbished Pavilion Hire (Season - Half Share) Season - Half Share 627.00 645.00 3.00% Recreation Services Sports: Rugby/Soccer/Hockey/Lacrosse Ground Hire (Season - Full Share) Season - Full Share 1,492.00 1,530.00 3.00% Recreation Services Sports: Rugby/Soccer/Hockey/Lacrosse Ground Hire (Season - Half Share) Season - Half Share 747.00 765.00 2.00% 142 Branch Description Unit of Measure Name of Product or Service Current Price per unit (including GST)* as at 30 June 2014 Revised Price per unit (including GST) from 1 July 2014 * % change Recreation Services Sports: Softball Ground Hire (Season - Full Share) Season - Full Share 576.00 590.00 2.00% Recreation Services Sports: Softball Ground Hire (Season - Half Share) Season - Half Share 289.00 295.00 2.00% Recreation Services Sports: Touch Ground Hire (Season - Full Share) Season - Full Share 747.00 765.00 2.00% Recreation Services Sports: Touch Ground Hire (Season - Half Share) Season - Half Share 374.00 385.00 3.00% Recreation Services Sports: Training - All sports. (Per player. Per Session) Per Player. Per Session 1.25 1.30 4.00% Recreation Services Sports: Week Day Refurbished Pavilion Hire CATEGORY B (Per Day) Per Day 183.00 190.00 4.00% Recreation Services Sports: Week Day Refurbished Pavilion Hire (Per Day) Per Day 366.00 375.00 2.00% Recreation Services Sports: Weekday Cricket Turf Ground Hire (Per Day) Per Day 367.00 375.00 2.00% Recreation Services Sports: Weekday Football Ground Hire (Per Day) Per Day 128.00 130.00 2.00% Recreation Services Sports: Weekday Other Ground Hire (Per Day) Per Day 104.00 105.00 1.00% Recreation Services Sports: Weekday Recreation/Sports Ground Hire Clean, no line markings/infrastructure (Per Day) Per Day 44.00 45.00 2.00% Recreation Services Sports: Weekday Rugby/Soccer/Hockey/Lacrosse Ground Hire (Per Day) Per Day 86.00 90.00 5.00% Recreation Services Sports: Weekday Softball Ground Hire (Per Day) Per Day 44.00 45.00 2.00% Recreation Services Sports: Weekend Baseball Ground Hire (Per Day) Per Day 150.00 154.00 3.00% Recreation Services Sports: Weekend Cricket Synthetic Ground Hire (Per Day) Per Day 128.00 130.00 2.00% Recreation Services Sports: Weekend Cricket Turf Ground Hire (Per Day) Per Day 367.00 375.00 2.00% Recreation Services Sports: Weekend Football Ground Hire (Per Day) Per Day 256.00 265.00 4.00% Recreation Services Sports: Weekend Other Ground Hire (Per Day) Per Day 209.00 215.00 3.00% Recreation Services Sports: Weekend Recreation/Sports Ground Hire Clean, no line markings/infrastructure (Per Day) Per Day 89.00 90.00 1.00% Recreation Services Sports: Weekend Refurbished Pavilion Hire CATEGORY B (Per day) Per Day 190.00 195.00 3.00% Recreation Services Sports: Weekend Refurbished Pavilion Hire (Per Day) Per Day 380.00 390.00 3.00% 143 Branch Description Unit of Measure Name of Product or Service Current Price per unit (including GST)* as at 30 June 2014 Revised Price per unit (including GST) from 1 July 2014 * % change Recreation Services Sports: Weekend Rugby/Soccer/Hockey/Lacrosse Ground Hire (Per Day) Per Day 171.00 175.00 2.00% Recreation Services Sports: Weekend Softball Ground Hire (Per Day) Per Day 89.00 90.00 1.00% Recreation Services Sports: Weekend Touch Ground Hire (Per Day) Per Day 121.00 125.00 3.00% Tourism Melbourne Cooks' Cottage: Adult entry to Cooks Cottage Each 5.00 6.00 20.00% Tourism Melbourne Cooks' Cottage: Child entry to Cooks Cottage Each 2.50 3.00 20.00% Tourism Melbourne Cooks' Cottage: Concession entry to Cooks Cottage Each 3.00 3.60 20.00% Tourism Melbourne Cooks' Cottage: Concession Group entry to Cooks Cottage Inbound (Rating 'A' - Operators) Each 2.00 2.20 10.00% Tourism Melbourne Cooks' Cottage: Family entry (2 adults + 2 children) to Cooks Cottage Each 13.50 16.50 22.00% Tourism Melbourne Cooks' Cottage: Pensioner entry to Cooks Cottage Each 3.00 3.60 20.00% Tourism Melbourne Cooks' Cottage: School Holiday Program - Child - selfguided Each 0.00 6.00 NEW Tourism Melbourne Cooks' Cottage: School Holiday Program - Child workshop Each 0.00 12.00 NEW Tourism Melbourne Cooks' Cottage: Schools - Education Program - 3 modules Each 0.00 7.50 NEW Tourism Melbourne Cooks' Cottage: Schools - Education Program - 4 modules Each 0.00 10.00 NEW Tourism Melbourne Cooks' Cottage: Schools - Education Program Additional Teacher/Adult Each 0.00 3.30 NEW Tourism Melbourne Cooks' Cottage: Self-guided visit group entry to Cooks' Cottage (School program) - Student Each 2.00 2.20 10.00% Tourism Melbourne Cooks' Cottage: Student entry to Cooks Cottage Each 3.00 3.60 20.00% Tourism Melbourne Cooks' Cottage: Ticketed Event - Adult Max Per Event 0.00 10.00 NEW Tourism Melbourne Cooks' Cottage: Ticketed Event - Child Max Per Event 0.00 10.00 NEW Where there is a change to or from $0 this reflects; a new facilities coming online or a new service offered or 144 changes to the pricing structure as determined by the state government or a review of the existing pricing structure. Some fees and charges including GST status are subject to change following a review of Division 81 GST legislation 145 APPENDIX G - SCHEDULE OF GRANTS AND CONTRIBUTIONS Description of Grant or Subsidy City Planning and Infrastructure Corporate Business Federation Square – for cleaning and maintenance Shrine of Remembrance - accounting and administrative support Corporate Business Community Development Miscellaneous Community Development Grants Triennial Arts & Culture Program Annual Arts Grant Program Arts Sponsorships Community Development City Design City Business Public Grants available via application Programs Pre-Commitments City Business Division TOTAL COUNCIL 146 2013-14 Budget $'000 2014-15 Budget Variance $'000 $'000 186 143 (43) 668 41 709 722 42 764 54 1 55 1,880 3,037 1,112 160 6,189 109 1,968 2,712 927 135 5,742 112 (13) (325) (185) (25) (548) 3 1,840 1,328 2,295 5,463 12,656 3,312 1,313 1,090 5,715 12,476 1,472 (15) (1,204) 253 (280) APPENDIX H - DOCKLANDS INCOME STATEMENT Income Statement - Docklands Total Rates Total Fees & Charges Total Sales & Recoveries TOTAL REVENUE Budget Budget Variance 2013-14 2014-15 $'000s $'000s $'000s 19,359 21,113 1,754 3,427 3,302 (125) 502 495 (7) 23,288 24,910 1,622 EXPENDITURE Total Employee Costs Total Materials & Services Total Finance & Insurance Costs Total Depreciation & Amortisation Total Other Costs Total Maintenance TOTAL EXPENDITURE* Underlying Surplus / (Deficit)* 2,671 7,155 217 3,647 319 321 14,330 8,958 3,326 7,570 232 3,616 328 322 15,394 9,516 655 415 15 (31) 9 1 1,064 558 Total Docklands operating expenditure only includes identifiable direct costs. Indirect costs that cannot be reliably apportioned to Docklands has not been reflected in expenditure. This leads to an understatement of expenditure and an overstatement of the underlying surplus. Examples of unallocated indirect costs would include corporate overheads and some staff time for municipal wide projects (which would also benefits Docklands). The indirect costs are conservatively estimated in excess of $2.5 million per annum. Budget 2014-15 $'000s Docklands Capital Program New Works Docklands Community Boating Hub/Family Services Hub Implementation of Docklands Community and Place Plan New Christmas decorations Total New Works Renewal Works Refurbishment of Christmas decorations Total Renewal Works 550 1,000 150 1,700 40 40 Maintenance Public Lighting maintenance Maintenance of Christmas decorations Total Maintenance 212 110 322 Total capital works 2,062 147 APPENDIX I – PUBLIC NOTICE – DRAFT 2014-15 ANNUAL PLAN AND BUDGET The Melbourne City Council (Council) has prepared a draft 2014-15 Annual Plan and Budget for the financial year ending 30 June 2015 (Annual Plan and Budget). At its meeting on 8 May 2014 the Council considered the Annual Plan and Budget and resolved to release it for public consultation in accordance with sections 127 and 129 of the Local Government Act 1989 (Act). PUBLIC INSPECTION Copies of the draft Annual Plan and Budget are available for inspection from 9 May 2014 until and including 6 June 2014 at the following locations: Town Hall Administration Building, 120 Swanston Street, Melbourne. Ground Floor at Front Desk (7.30am – 5pm weekdays) City Library (Mon-Sun) North Melbourne Library (Mon-Sun) East Melbourne Library (Mon-Sun) Southbank Library at Boyd (Mon-Sun) The Hub at Docklands (Mon-Fri). Copies may also be viewed online at www.melbourne.vic.gov.au/committees SUBMISSIONS Any person may make a written submission to the Council on the Annual Plan and Budget. All submissions received by the Council on or before 6 June 2014 will be considered in accordance with section 223 of the Act, by the Council’s Future Melbourne Committee (Committee). If a person wishes to be heard in support of their submission they must include the request to be heard in the written submission and this will entitle them to appear in person, or by a person acting on their behalf, before a meeting of the Committee, scheduled to be held on 19 June 2014 at 5.30pm in the Council Meeting Room, Level 2, Town Hall Administration Building, 120 Swanston Street, Melbourne. Written submissions can be submitted online via our website www.melbourne.vic.gov.au or addressed to the Manager Governance Services, Melbourne City Council, Town Hall Administration Building, 120 Swanston Street, Melbourne, 3000 or GPO Box 1603, Melbourne, 3001. Written submissions received will be made public and made available on the Council’s website. MEETING TO ADOPT THE ANNUAL PLAN AND BUDGET Council will meet on 24 June 2014 to adopt the Annual Plan and Budget. Dr Kathy Alexander Chief Executive Officer 148 APPENDIX J - PUBLIC NOTICE – NOTICE OF INTENTION TO DECLARE A DIFFERRENTIAL RATE At its meeting on 8 May 2014, the Council resolved to give public notice under section 223 of the Local Government Act 1989 of its intention to declare a differential rate for the financial year ending 30 June 2015. The rates for each property are determined by multiplying the Net Annual Value of each rateable land classified as Residential or Non-Residential by the differential rate shown in the following table: Class of Land Residential Non-Residential Differential Rate 4.0469 cents in the dollar of the Net Annual Value 4.5901 cents in the dollar of the Net Annual Value The characteristics of the land which determine whether land is classified as Residential or Non-Residential are as follows: Class of Land Characteristics Residential Land which is - NonResidential (a) used primarily for residential purposes (but does not include serviced apartments, apartment houses, boarding houses, hotels, motels or hostels); or (b) vacant land but which by reason of its locality, zoning or other relevant criteria would, if developed, be or be likely to be used primarily for residential purposes. All rateable land (including vacant and unoccupied land) wherever located in the municipality and howsoever zoned under the planning scheme which does not have the characteristics of Residential land. It is considered that each differential rate will contribute to the equitable and efficient carrying out of Council's functions in that it is likely to achieve an equitable financial contribution to the cost of carrying out the functions of Council, including the construction and maintenance of public infrastructure; the development and provision of health and community services; the provision of general support services; Submissions in respect of the declaration of a differential rate will be considered in accordance with section 223 of the Local Government Act 1989. Council's Future Melbourne Committee (‘Committee’) will consider any written submission received by Council on or before 6 June 2014, at a meeting to be held on 19 June 2014 at 5:30 pm in the Council Meeting Room, 2nd Floor, Town Hall, 120 Swanston Street, Melbourne. 149 If a person wishes to be heard in support of their submission they must include the request to be heard in the submission and this will entitle them to appear in person or by a person acting on their behalf before the meeting of the Committee. The postal address for written submissions is: Manager Governance Services, Melbourne City Council, Town Hall Administration Building, 90-120 Swanston Street, Melbourne, 3000 or Manager Governance Services, Melbourne City Council, GPO Box 1603, Melbourne, 3001. Dr Kathy Alexander Chief Executive Officer 150 APPENDIX K - PROPERTY LEASE REGISTER Lease Start date Lease end date Rent PA Lady Gowrie Child Centre (Melbourne) Inc Cafenetics Pty ltd 01-01-09 31-12-12 31-12-14 30-12-22 $566,798.00 $15,188.00 Body Corporation No2 12-03-06 11-03-27 $0.00 Princes Park Bowling Club Inc Princes Hill Tennis Club Inc Café L'Incontro Parkville Tennis Club Inc 25-10-05 01-05-12 04-07-04 01-05-12 17-10-14 30-04-17 03-07-14 30-04-17 $104.00 $104.00 $56,068.00 $104.00 16-22 Little Errol Street North Melbourne Australian Legion of Ex Service Men and Women 01-08-11 30-09-15 $1.00 190-192 Pelham Street Carlton 198 Little Collins Street Melbourne The University of Melbourne Stellini Bar 09-02-00 08-02-50 Monthly $21,083.00 $32,292.00 2 Swanston Street Melbourne Best of Australia Travel Centres Pty Ltd 17-10-12 15-10-24 $30,000.00 20 Therry Street Melbourne 202 Little Collins Street Melbourne Doutta Galla Community Health Services Stellini Bar 28-05-12 27-05-17 Monthly $1.00 $17,886.00 204-206 Arden Street North Melbourne Fencing Victoria Inc. 27-03-12 26-03-33 $1.00 207-221 City Road, Southbank 208 Little Collins Street Melbourne 210 Little Collins Street Melbourne 212 Little Collins Street Melbourne KereKere Pty Ltd Vacant Pratap Pammamull & Gita Pamamull Hairy Canary 08-07-12 07-07-17 $37,829.00 01-04-11 Monthly 31-03-16 $25,000.00 $87,799.00 218 -242 Little Collins Street Melbourne Calibre Clothing 06-11-11 05-11-16 $194,681.00 218 -242 Little Collins Street Melbourne Hairy Little Sista Monthly $180,069.00 218 -242 Little Collins Street Melbourne Swensk, Australia 01-04-13 31-03-18 $95,844.00 218 -242 Little Collins Street Melbourne Ted Baker London 25-08-12 24-08-17 $317,752.00 01-08-11 31-07-14 Monthly $15,768.00 $2,330.00 Monthly $19,905.00 Monthly Monthly Monthly Monthly Monthly Monthly Monthly 31-08-14 31-12-14 31-07-14 Monthly 28-10-14 $66,161.00 $65,943.00 $7,701.00 $21,021.00 $30,349.00 $73,566.00 $16,063.00 $8,199.00 $7,022.00 $7,479.00 $4,337.00 $43,343.00 Address Tenant/ Business Name 1 Seafarers Lane Docklands 1-9 Freshwater Place, Southbank Land Fronting Freshwater Place, Southbank 109 Bowen Crescent Carlton 121 Princes Park Drive Carlton 134-142 Swanston Street Melbourne 151 Royal Parade Parkville 219-225 Bourke Street Melbourne 219-229 Bourke Street Melbourne 219-229 Bourke Street Melbourne 219-229 Bourke Street Melbourne 219-229 219-229 219-229 219-229 219-229 219-229 219-229 219-229 219-229 219-229 219-229 219-229 Bourke Street Bourke Street Bourke Street Bourke Street Bourke Street Bourke Street Bourke Street Bourke Street Bourke Street Bourke Street Bourke Street Bourke Street Melbourne Melbourne Melbourne Melbourne Melbourne Melbourne Melbourne Melbourne Melbourne Melbourne Melbourne Melbourne Vacant Disability Media Inc. Bayanihan Australia Community Network Inc Federation of Community Legal Centres (Victoria) Inc International Women’s Development Agency Inc. JOY Melbourne Inc Kultour Media Arts Pty Ltd (Experimenta) Melbourne Fringe Festival Melbourne International Film Festival Ltd Melbourne Queer Film Festival Phunktional Ltd Platform Artists Group Inc Sustainable Living Foundation The Black Arm Band Travellers Aid Australia Ltd 151 01-09-11 01-03-11 01-08-11 29-10-11 Address 219-229 Bourke Street Melbourne 219-229 Bourke Street Melbourne 219-229 Bourke Street Melbourne 219-229 Bourke Street Melbourne 219-229 Bourke Street Melbourne 219-229 Bourke Street Melbourne 219-229 Bourke Street Melbourne 219-229 Bourke Street Melbourne 219-229 Bourke Street Melbourne 22 Bellair Street Kensington 227-229 Bourke Street Melbourne Tenant/ Business Name United Way Australia West Space Engage Media Collective Inc Gay & Lesbian Switchboard Human Rights Arts and Film Festival Inc Midsumma Festival Minus 18 Inc TLC for Kids Inc. Victoria Walks Inc Flemington Kensington Community Legal Centre Incorporated Foot Locker Australia Inc Lease Start date Lease end date Rent PA 01-08-11 Monthly Monthly 31-07-14 Monthly 31-07-14 Monthly Monthly Monthly Monthly Monthly $5,200.00 01-09-09 31-08-14 $90,000.00 01-08-11 $5,979.00 $0.00 $4,362.00 $3,609.00 $4,355.00 $6,117.00 $3,396.00 $18,798.00 $7,855.00 230-298 Wellington Parade East Melbourne Pavilion Café, Fitzroy Gardens 09-03-12 08-03-17 $93,500.00 231 Bourke Street Melbourne 231 Bourke Street Melbourne 25 NewQuay Promenade Docklands 250 Spring Street Melbourne 2A Spencer Street Melbourne 30-38 Gatehouse Drive Kensington 31 NewQuay Promenade Docklands 333 The Avenue Parkville 34-60 Little Collins Street Melbourne 34-60 Little Collins Street Melbourne 35 NewQuay Promenade Docklands 40 Bellair Street Kensington Mountfords Red Violin Nightclub Newquay Nodal and Marina Pty Ltd Royal Australasian College of Surgeons Microflite Pty Ltd Midwives and Mothers Australia Pty Ltd Newquay Nodal and Marina Pty Ltd Royal Park Tennis Club Inc Citipower Pty Ltd Dexus Funds Management Limited Newquay Nodal and Marina Pty Ltd Local Learning and Employment Network 01-11-11 31-10-14 Monthly 28-11-22 20-05-2092 31-10-14 31-07-15 07-07-24 30-04-17 30-06-37 25-06-37 28-11-22 Monthly $244,526.00 $100,000.00 $0.00 $0.00 $32,912.00 $58,717.00 $0.00 $104.00 $10.00 $385,733.00 $0.00 $6,200.00 405-411 Racecourse Road Kensington Flemington and Kensington Bowling Club Incorporated Monthly $100.00 405-411 Racecourse Road Kensington Kensington Community High School Monthly $150,000.00 417 Dynon Road West Melbourne 417 Flinders Lane, Melbourne 420 Swanston Street Melbourne 427 Docklands Drive Docklands 43 Little Errol Street North Melbourne 439 Docklands Drive Docklands 44-86 Swanston Street Melbourne 45 NewQuay Promenade Docklands 47 Canning Street Carlton 474 Flinders Street Melbourne 5 Blackwood Street North Melbourne 506-516 Elizabeth Street Melbourne 510-512 Elizabeth Street Melbourne 514A Elizabeth Street Melbourne 516 Elizabeth Street Melbourne 52 Errol Street North Melbourne 54 Errol Street North Melbourne 55 NewQuay Promenade Docklands 56 Errol Street North Melbourne CityWide Service Solutions Pty Ltd Brunetti - City Square Café Altered State Australia Pty Ltd Freecorp Investments Pty Ltd Janine Rainbow Waterfront City 1A R & C Pty Ltd Caboose Newquay Nodal and Marina Pty Ltd Benetas Melbourne Aquarium Sujecra Pty Ltd Adult Multicultural Education Services Australia Hanbung Group Pty Ltd Activia Hair Fashion Yuan Hui Du & You Lan Ding Errol Street Physiotherapy Pty Ltd Kitchen Capers Newquay Nodal and Marina Pty Ltd Andrew Harris Optometrist 30-06-21 01-09-15 30-06-15 19-11-25 09-10-14 19-11-25 24-05-15 18-11-22 06-09-14 12-11-47 Monthly 30-04-18 14-08-14 30-04-16 22-04-16 05-09-18 Monthly 18-11-22 Monthly $412,735.00 $83,427.00 $55,515.00 $0.00 $26,950.00 $1.00 $11,500.00 $0.00 $35,637.00 $1.00 $6,687.00 $1.00 $132,541.00 $19,357.00 $73,214.00 $52,000.00 $43,156.00 $0.00 $40,800.00 58 Errol Street North Melbourne The Centre: Connecting Community in North and West Melb Inc 30-11-14 $10.00 152 29-11-02 21-05-93 01-11-11 01-08-11 08-07-04 01-05-12 12-02-02 26-06-62 29-11-02 01-07-06 02-09-12 01-07-12 19-11-05 10-10-12 19-11-05 25-05-12 19-11-02 07-09-12 13-11-97 01-05-13 15-08-09 01-05-13 23-04-13 06-09-13 19-11-02 01-12-11 Address 60 Errol Street North Melbourne 62 Errol Street North Melbourne 64 Errol Street North Melbourne 70 Errol Street, North Melbourne 65 Toorak Road South Yarra 65 Toorak Road South Yarra 65-159 Victoria Street Melbourne 72-74 Grey Street East Melbourne (Powlett Reserve) 72-74 Grey Street East Melbourne (Powlett Reserve) 81, 81a & 81b Altona Street Kensington Tenant/ Business Name Lease Start date Lease end date 01-07-12 01-04-12 Monthly 30-06-15 31-03-15 $15,000.00 $40,776.00 $14,751.00 Monthly $0.00 Rent PA Lucy Figliuzzi Manfred’s Shoe Repairs Manfred’s Shoe Repairs Commonwealth of Australia Australia Post Corporation Fawkner Park Children's Centre Cooperative Limited South Yarra Tennis Centre Fawkner Park Queen Victoria Market Pty Ltd 01-12-08 30-11-18 $104.00 28-07-97 Monthly Ongoing $116,961.00 $1.00 The East Melbourne Child Care Co-Operative 29-07-10 28-07-15 $104.00 Chris Ackerman Tennis Pty Ltd Monthly $122,088.00 Kensington Community Centre Childrens CoOperative Ltd Monthly $104.00 85 Kensington Road Kensington The Venny Adventure Playground 01-07-09 01-09-14 $1.00 Berth 1 Docklands Francis Roth 17-01-05 31-12-24 $0.00 Berth 2 Docklands Paul Gerrard Brown Chong Kheng Superannuation Fund (previously Chris Gough) Robert Wescombe Graham Robert McDonald John & Pauline Kirby (previously Tony Ciabarra ) Malcolm Farr Tarrant Ridge Pty Ltd George Iro Ross Palazzesi Sue Clifton Leonard John Wright & Frances Therese Wright Mirvac (Docklands) Pty Ltd Mirvac (Docklands) Pty Ltd Adington Pty Ltd Anita Ng Airport Corporate Smartpark Pty Ltd Norman South Pty Ltd Ling Ying Dai (Previously Ji Feng Zou) Hua Lu Barry Allison Mirvac (Docklands) Pty Ltd Mirvac (Docklands) Pty Ltd Abraham Khoury Mirvac (Docklands) Pty Ltd Austens Superannuation Services Pty Ltd (& Omnizar Pty Ltd & Peter Thomas) Samuel Schembri, Charles Paul Joseph Schembri, John Schembri and Paul Joseph Schembri (previously Timothy Joseph Walsh) 21-01-05 31-12-24 $0.00 03-06-05 31-12-24 $0.00 19-01-05 19-01-05 27-04-05 28-01-05 07-06-05 24-01-05 17-01-05 17-01-05 19-01-05 29-06-07 29-06-07 20-01-05 14-01-05 20-01-05 11-03-13 29-06-07 29-06-07 19-01-05 29-06-07 29-06-07 20-01-05 29-06-07 31-12-24 31-12-24 31-12-24 31-12-24 31-12-24 31-12-24 31-12-24 31-12-24 31-12-24 01-01-25 01-01-25 31-12-24 31-12-24 31-12-24 31-12-24 01-01-25 18-01-38 31-12-24 01-01-25 01-01-25 31-12-24 01-01-25 $0.00 $0.00 $0.00 $0.00 $0.00 $0.00 $0.00 $0.00 $0.00 $0.00 $0.00 $0.00 $0.00 $0.00 $0.00 $0.00 $0.00 $0.00 $0.00 $0.00 $0.00 $0.00 18-01-05 31-12-24 $0.00 04-02-05 31-12-24 $0.00 10-02-05 17-01-05 17-06-05 17-01-05 20-01-05 17-01-05 31-12-24 31-12-24 31-12-24 31-12-24 31-12-24 31-12-24 $0.00 $0.00 $0.00 $0.00 $0.00 $0.00 Berth 3 Docklands Berth 4 Docklands Berth 5 Docklands Berth 6 Docklands Berth 7 Docklands Berth 8 Docklands Berth 9 Docklands Berth 10 Docklands Berth 11 Docklands Berth 12 Docklands Berth 13 Docklands Berth 14 Docklands Berth 15 Docklands Berth 16 Docklands Berth 17 Docklands Berth 18 Docklands Berth 19 Docklands Berth 20 Docklands Berth 21 Docklands Berth 22 Docklands Berth 23 Docklands Berth 24 Docklands Berth 25 Docklands Berth 26 Docklands Berth 27 Docklands Berth 28 Docklands Berth 29 Docklands Berth 30 Docklands Berth 31 Docklands Berth 32 Docklands Berth 33 Docklands G.J Eagles Builders Evren Baykal Anne Maree Willis Beverley Bishop and Norman Bishop Susan Jean Spender Nisrin Ibrahim 153 Address Berth 34 Docklands Berth 35 Docklands Berth 36 Docklands Berth 37 Docklands Berth 38 Docklands Berth 39 Docklands Berth 40 Docklands Berth 41 Docklands Berth 42 Docklands Berth 43 Docklands Berth 44 Docklands Berth 45 Docklands Berth 46 Docklands Berth 47 Docklands Berth 48 Docklands Berth 49 Docklands Berth 50 Docklands Berth 51 Docklands Berth 52 Docklands Berth 53 Docklands Berth 54 Docklands Berth 55 Docklands Berth 56 Docklands Berth 57 Docklands Berth 58 Docklands Berth 59 Docklands Berth 60 Docklands Berth 61 Docklands Berth 62 Docklands Berth 63 Docklands Berth 64 Docklands Berth 65 Docklands Berth 66 Docklands Berth 67 Docklands Berth 68 Docklands Tenant/ Business Name Wayrich Pty Ltd Peter Hirst and Gillian Hirst Jonathan Morton Leon Thorpe David Melrose Tan Hin Bian Peter Folwell PMS Bendigo Pty Ltd as trustee for De Araugo Super Fund Mirvac (Docklands) Pty Ltd Mirvac (Docklands) Pty Ltd Dernstan Pty Ltd Mirvac (Docklands) Pty Ltd Mirvac (Docklands) Pty Ltd Mirvac (Docklands) Pty Ltd Mirvac (Docklands) Pty Ltd Joseph John Rogers Mirvac (Docklands) Pty Ltd Mirvac (Docklands) Pty Ltd Chong Kheng Law Mirvac (Docklands) Pty Ltd Thomas Payne Australian Brushware Corporation Pty Ltd (previously Robert Unger) Crovic Investments Pty Ltd Stargate Marine Services Pty Ltd (previously Ragussa) Paul Brown Anita Lui Pei Ng Oliver Blaufelder Desmond Stratton Vigushin Holdings Pty Ltd David Landgren Rodney Leopold Stefanos Siperki as trustee for the Stefanos Siperki Family Trust Phillip John Lack Wayne Baxter (Southern Cross Plastering Pty Ltd) Grant Storey Lease Start date Lease end date 18-01-05 17-01-05 21-01-05 29-06-07 29-06-07 29-06-07 29-06-07 31-12-24 31-12-24 31-12-24 01-01-25 01-01-25 01-01-25 01-01-25 $0.00 $0.00 $0.00 $0.00 $0.00 $0.00 $0.00 29-06-07 01-01-25 $0.00 29-06-07 29-06-07 29-06-07 29-06-07 29-06-07 29-06-07 29-06-07 18-01-05 29-06-07 29-06-07 29-06-07 29-06-07 21-01-05 01-01-25 01-01-25 01-01-25 01-01-25 01-01-25 01-01-25 01-01-25 31-12-24 01-01-25 01-01-25 01-01-25 01-01-25 31-12-24 $0.00 $0.00 $0.00 $0.00 $0.00 $0.00 $0.00 $0.00 $0.00 $0.00 $0.00 $0.00 $0.00 02-09-05 31-12-24 $0.00 19-01-05 31-12-24 $0.00 17-01-05 31-12-24 $0.00 10-02-05 20-12-05 11-05-06 09-12-05 12-05-06 12-05-06 12-05-06 31-12-24 31-12-24 30-11-25 30-11-25 01-12-25 01-12-25 01-12-25 $0.00 $0.00 $0.00 $0.00 $0.00 $0.00 $0.00 16-12-05 30-11-25 $0.00 12-05-06 12-12-06 12-12-06 01-12-25 01-12-25 01-12-25 $0.00 $0.00 $0.00 Rent PA Berth 69 Docklands Yarra’s Edge Marina Pty Ltd (Receivers & Managers appointed) 12-12-06 01-12-25 $0.00 Berth 70 Docklands Berth 71 Docklands Berth 72 Docklands Berth 73 Docklands Berth 74 Docklands Berth 75 Docklands Berth 76 Docklands Berth 77 Docklands Berth 78 Docklands Berth 79 Docklands Thomas Kreskas Lorraine Baohn John Gurney Desmond Norton Stratton Simon Trinca Eleni Gounaris Graeme Davis and Tony Volders Peter Jackson Andrea McNab Michael Stefurak 16-02-07 12-05-06 03-02-06 05-01-06 10-04-07 10-04-07 29-07-07 29-06-07 09-12-25 29-06-07 01-12-25 01-12-25 30-11-25 30-11-25 01-12-25 01-12-25 01-12-25 01-12-25 30-11-25 01-12-25 $0.00 $0.00 $0.00 $0.00 $0.00 $0.00 $0.00 $0.00 $0.00 $0.00 154 Address Berth 80 Docklands Berth 81 Docklands Berth 82 Docklands Berth 83 Docklands Berth 84 Docklands Berth 85 Docklands Berth 86 Docklands Berth 87 Docklands Berth 88 Docklands Berth 89 Docklands Berth 90 Docklands Berth 91 Docklands Berth 92 Docklands Berth 93 Docklands Berth 94 Docklands Berth 95 Docklands Berth 96 Docklands Berth 97 Docklands Berth 98 Docklands Berth 99 Docklands Berth 100 Docklands Berth 101 Docklands Berth 102 Docklands Berth 103 Docklands Tenant/ Business Name Lease Start date Lease end date 09-12-05 26-04-07 29-06-07 15-02-13 15-06-07 15-06-07 15-06-07 15-06-07 23-12-05 09-12-05 29-06-07 29-06-07 29-06-07 29-06-07 29-06-07 29-06-07 29-06-07 29-06-07 29-06-07 29-06-07 29-06-07 29-06-07 29-06-07 15-03-13 30-11-25 01-12-25 01-12-25 01-12-25 01-12-25 01-12-25 01-12-25 01-12-25 30-11-25 30-11-25 01-12-25 01-12-25 01-12-25 01-12-25 01-12-25 01-12-25 01-12-25 01-12-25 01-12-25 01-12-25 01-12-25 01-12-25 01-12-25 01-12-25 $0.00 $0.00 $0.00 $0.00 $0.00 $0.00 $0.00 $0.00 $0.00 $0.00 $0.00 $0.00 $0.00 $0.00 $0.00 $0.00 $0.00 $0.00 $0.00 $0.00 $0.00 $0.00 $0.00 $0.00 Rent PA 21-11-06 01-12-25 $0.00 Berth 105 Docklands Berth 106 Docklands Berth 107 Docklands Berth 108 Docklands Berth 109 Docklands Berth 110 Docklands Berth 111 Docklands Berth 112 Docklands Berth 113 Docklands Berth 114 Docklands Berth 115 Docklands Berth 116 Docklands Berth 117 Docklands Berth 118 Docklands Berth 119 Docklands Resnall Pty Ltd David Phillips Shepparton Property Trust James Flood Vasilios Tzirkas & Benjamin Tzirkas Jeff Hanlon Kirkcorp Holdings Pty Ltd Joseph Alfred Gaetano Aquaro Avamar Investments Pty Ltd Ray Malone Mirvac (Docklands) Pty Ltd Mirvac (Docklands) Pty Ltd Mirvac (Docklands) Pty Ltd Mirvac (Docklands) Pty Ltd Mirvac (Docklands) Pty Ltd Mirvac (Docklands) Pty Ltd Mirvac (Docklands) Pty Ltd Mirvac (Docklands) Pty Ltd Mirvac (Docklands) Pty Ltd Mirvac (Docklands) Pty Ltd Mirvac (Docklands) Pty Ltd Mirvac (Docklands) Pty Ltd Kelvin Taing Loopi's Pty Ltd Jennifer Hart (The Hart Family Trust and or Nominee) Robert Digalla & Robert Nicolaidis Marrissa Olsen Mirvac (Docklands) Pty Ltd Thi Lan Tran Seamus Sutcliffe Anthony Sica Mirvac (Docklands) Pty Ltd Wilhelmus Stevens & Merryn Stevens Mirvac (Docklands) Pty Ltd Mirvac (Docklands) Pty Ltd Mirvac (Docklands) Pty Ltd Mirvac (Docklands) Pty Ltd Mirvac (Docklands) Pty Ltd Mirvac (Docklands) Pty Ltd Mirvac (Docklands) Pty Ltd 18-04-07 29-06-07 29-06-07 29-06-07 29-06-07 09-12-25 29-06-07 29-06-07 29-06-07 29-06-07 29-06-07 29-06-07 29-06-07 29-06-07 29-06-07 01-12-25 01-12-25 01-12-25 01-12-25 01-12-25 31-11-25 01-12-25 01-12-25 01-12-25 01-12-25 01-12-25 01-12-25 01-12-25 01-12-25 01-12-25 $0.00 $0.00 $0.00 $0.00 $0.00 $0.00 $0.00 $0.00 $0.00 $0.00 $0.00 $0.00 $0.00 $0.00 $0.00 Berth 120 Docklands Ken Glynn (Sadridge Nominees Pty Ltd) as Trustee 18-04-07 01-12-25 $0.00 Berth 121 Docklands Berth 122 Docklands Berth 123 Docklands Berth 124 Docklands Berth 125 Docklands Berth 126 Docklands Berth 127 Docklands Berth 128 Docklands Quentin Gracanin Harold Chris Lambis Abraham Pace Mirvac (Docklands) Pty Ltd Susan & Geoff Spooner Shi Cheng Cao Vasili Theodoridis Mirvac (Docklands) Pty Ltd 19-12-05 29-06-07 29-06-07 29-06-07 29-06-07 29-06-07 29-06-07 30-11-12 30-11-25 30-11-25 01-12-25 01-12-25 01-12-25 01-12-25 01-12-25 01-12-25 $0.00 $0.00 $0.00 $0.00 $0.00 $0.00 $0.00 $0.00 Berth 104 Docklands 155 Address Berth 129 Docklands Berth 130 Docklands Berth 131 Docklands Berth 132 Docklands Berth 133 Docklands Berth 134 Docklands Berth 135 Docklands Berth 136 Docklands Berth 137 Docklands Berth 138 Docklands Berth 139 Docklands Berth 140 Docklands Berth 141 Docklands Berth 142 Docklands Berth 143 Docklands Berth 144 Docklands Berth 145 Docklands Berth 146 Docklands Berth 147 Docklands Berth 148 Docklands Berth 149 Docklands Birdwood Avenue Melbourne Boathouse Drive Melbourne Boathouse Drive Melbourne Boathouse Drive Melbourne Boathouse Drive Melbourne Boathouse Drive Melbourne Boathouse Drive Melbourne Boathouse Drive Melbourne Brens Drive Parkville Building 3, Riverside Quay, Southbank Campbell Arcade, Melbourne Dudley Street West Melbourne Elliot Avenue Parkville Flinders Walk Melbourne Nicholson Street Carlton Lease Start date Lease end date Shane Douglas Bray Richard Longworth Michael Richter & Barbara Richter Robert Bogorvski Soedeson Tandra Youngsheng Wang Brian Fitzpatrick Greg & Elise Byrne John & Amanda Thatcher Talc Nominees Pty Ltd DJ Enterprises Robert & Rosemary Ungar Kohler Properties Australia Pty Ltd Edward Joseph McGuire Craig Mathieson Graham Boyd Johnson’s Unit Holdings Pty Ltd Yarra’s Edge Marina Pty Ltd Steven & Carolyn Easedale Yarra’s Edge Marina Pty Ltd David Currie National Trust of Australia (Vic) Banks Rowing Club Melbourne Grammar School Melbourne Rowing Club Incorporated Melbourne University Boatshed Mercantile Rowing Club Incorporated Richmond Rowing Club Incorporated Yarra Yarra Rowing Club Inc Urban Camp Melbourne Inc 29-06-07 29-06-07 29-06-07 29-06-07 29-06-07 29-06-07 08-02-13 29-06-07 29-06-07 12-05-06 09-12-05 12-05-06 12-05-06 12-05-06 12-05-06 09-12-05 13-12-05 12-05-06 12-05-06 12-05-06 12-05-06 12-11-98 10-03-93 10-03-93 10-04-93 10-03-93 10-03-93 10-03-93 10-03-93 01-12-10 01-12-25 01-12-25 01-12-25 01-12-25 01-12-25 01-12-25 01-12-25 01-12-25 01-12-25 01-12-25 30-11-25 01-12-25 01-12-25 01-12-25 01-12-25 30-11-25 30-12-25 01-12-25 01-12-25 01-12-25 01-12-25 11-11-19 02-10-33 03-10-33 02-08-34 02-08-34 04-08-34 02-08-34 02-08-34 01-12-20 $0.00 $0.00 $0.00 $0.00 $0.00 $0.00 $0.00 $0.00 $0.00 $0.00 $0.00 $0.00 $0.00 $0.00 $0.00 $0.00 $0.00 $0.00 $0.00 $0.00 $0.00 $1.00 $104.00 $104.00 $104.00 $104.00 $104.00 $104.00 $104.00 $104.00 Skipton Gem Pty Ltd 01-11-09 30-6-30 $50,664.00 Optus Mobile Pty Ltd City of Melbourne Bowling Club Inc North Park Tennis Club Inc City River Cruises Pty Ltd Carlton Gardens Tennis Club Inc 30-03-05 22-12-09 01-05-12 28-03-15 21-12-14 30-04-17 Monthly 01-05-17 $6,651.00 $104.00 $104.00 $500.00 $0.00 Tenant/ Business Name 01-05-12 Rent PA Pavillion 1, Victoria Harbour, Docklands GPT Management Pty Ltd Monthly $1.00 Pavillion 2, Victoria Harbour, Docklands GPT Management Pty Ltd Monthly $1.00 Royal Parade Carlton Russell Place Melbourne Shop 1, Campbell Arcade, Melbourne Shop 2, Campbell Arcade, Melbourne Carlton Football Club Felix Bar Pty Ltd Tim Bartold Tim Bartold 12-12-95 11-12-35 Monthly 01-05-16 Monthly $94,841.00 $1,879.00 $8,037.00 $9,250.00 Shop 3 & 4, Campbell Arcade, Melbourne Christopher Bril 01-02-13 31-01-15 $16,095.00 Monthly $8,037.00 Shop 5, Campbell Arcade, Melbourne Shops 6, 7 & 12, Campbell Arcade, Melbourne Shop 8, Campbell Arcade, Melbourne 01-05-12 Michelle O'Donnell Naberslink Pty Ltd 18-07-10 17-07-16 $21,916.00 Darren Plunkett 01-12-11 30-11-14 $8,583.00 156 Address Tenant/ Business Name Lease Start date Lease end date Rent PA Shop 8A, Campbell Arcade, Melbourne Steven Wuy & Quiong Xin 01-07-10 30-06-16 $31,046.00 Shop 9, Campbell Arcade, Melbourne Karen Bjornenak & Kylie Jane Golsby-Smith 01-01-12 13-12-14 $8,826.00 Shop 10, Campbell Arcade, Melbourne Sticky Institute Monthly $4,493.00 Shop 11, Campbell Arcade, Melbourne Michele & Katrina Lorio 01-04-10 30-04-16 $9,946.00 Showcases, Campbell Arcade, Melbourne Platform Artists Group 01-09-11 31-12-14 $1.00 South Island Pedestrian Bridge Southbank Pony Fish Island 25-09-08 24-09-18 $7,878.00 Southbank Promenade Southbank Mirvac Real Estate Pty Ltd 09-12-13 08-12-16 $51,000.00 Southgate Southbank DEXUS (previously Perpetual Trustees Australia Limited) 05-07-11 04-07-21 $10,127.00 157 APPENDIX L - GLOSSARY OF TERMS Act Local Government Act 1989. AIFRS Australian equivalents to International Financial Reporting Standards. Annual operating budget (Standard income statement) The standard income statement shows the expected operating result in the forthcoming year with a distinction made between revenue received for operating purposes and revenue received for capital purposes. Annual report A report of the activities of the previous financial year and contains a report of operations, audited financial statements and an audited performance statement. Asset expenditure type The following types of asset expenditure: a) asset renewal expenditure; b) new asset expenditure; c) asset upgrade expenditure; d) asset expansion expenditure Asset renewal expenditure Expenditure on an existing asset or on replacing an existing asset that returns the service capability of the asset to its original capability. Asset upgrade expenditure Expenditure that: a) enhances an existing asset to provide a higher level of service; or b) increases the life of the asset beyond its original life Australian Accounting Standards (AASB) Accounting standards are issued from time to by the Australian Accounting Standards Board and are applicable to the preparation of general purpose financial reports. 158 Budget A plan setting out the services and initiatives to be funded for the financial year and how they will contribute to achieving the strategic objectives specified in the council plan. Budgeted balance sheet (Standard balance sheet) The standard balance sheet shows the expected net current asset, net non-current asset and net asset positions in the forthcoming year compared to the forecast actual in the current year. The budgeted balance sheet should be prepared in accordance with the requirements of AASB 101 - Presentation of Financial Statements. Budgeted cash position (Standard cash flow statement) The standard cash flow statement shows the expected net cash inflows and outflows in the forthcoming year in the form of reconciliation between opening and closing balances of total cash and investments for the year. Comparison is made to the current year’s expected inflows and outflows. The budgeted cash flow statement should be prepared in accordance with the requirements of AASB 107 Cash Flow Statements. Budget preparation requirement Under the Act, a Council is required to prepare and adopt an annual budget. Capital works expenditure Capital expenditure is relatively large (material) expenditure that produces economic benefits expected to last for more than 12 months. A pre determined ‘threshold’ may be used which indicates the level of expenditure deemed to be material in accordance with Council’s policy. Capital expenditure on non-current assets and includes new assets, asset renewal, asset expansion and asset. Where capital projects involve a combination of renewal, expansion and upgrade expenditures, the total project cost needs to be allocated accordingly. Capital expenditure is recorded in the balance sheet as additions to the value of the asset (that is, it is capitalised). This accounting treatment reflects the fact that this expenditure has resulted in the creation of additional value in an asset of discernible magnitude (materiality) which will benefit the community over several years and which has not been ‘used up’ in the year. The asset value is then progressively ’expensed’ or written off to the income statement (operating statement), as its life (or service potential) is used up through the depreciation charge. In this way the total cost/value of the asset is spread over the periods in which it is used, the operating result in each period reflecting the consumption 159 of assets and service potential during that period. Council plan A plan setting out the medium-term strategic objectives, strategies, strategic indicators and resources reflecting vision and aspirations of the community for the next four years. Differential rates When a Council intends to declare a differential rate (eg business and residential), information prescribed by the Act under section 161 must be disclosed in the Council budget. External funding sources (Analysis of capital budget) External funding sources relate to capital grants or contributions, which will be received from parties external to the Council. It also includes the proceeds of assets sold to fund the capital works program. External influences in the preparation of a budget Matters arising from third party actions over which Council has little or no control eg change in legislation. Financial resources Income, expenditure, assets, liabilities, equity, cash and capital works required to deliver the services and initiatives in the budget. Financial Statements The financial statements and notes prepared in accordance with the Australian Accounting Standards as they apply to the general purpose financial reports of local governments and a statement of capital works and included in the annual report. Financial sustainability A key outcome of the strategic resource plan. Longer term planning is essential in ensuring that a Council remains financially sustainable in the long term. Financial Year The period of 12 months ending on 30 June each year. Financing activities Financing activities means those activities which relate to changing the size and composition of the financial structure of the entity, including equity, and borrowings not falling within the definition of cash. 160 Human Resources The staff employed by a council. Indicators What will be measured to assess performance. Infrastructure Physical assets of the entity or of another entity that contribute to meeting the public’s need for access to major economic and social facilities and services. Investing activities Investing activities means those activities which relate to acquisition and disposal of non-current assets, including property, plant and equipment and other productive assets, and investments not falling within the definition of cash. Key assumptions When preparing a budgeted balance sheet of financial position, key assumptions upon which the statement has been based should be disclosed in the budget to assist the reader when comparing movements in assets, liabilities and equity between budget years. Key financial indicators A range of ratios and comparisons of critical financial data allowing a reader to gain a better understanding of key measures, such as indebtedness and liquidity which are often undisclosed when financial information is presented in standard statement format. Average rates and charges per Assessment This ratio provides an illustration of the average rates paid on a per assessment basis across the municipality. It should be noted that this measure does not differentiate between residential and commercial ratepayers and does not represent either an average residential or commercial rate. Average residential rates and charges per Assessment This ratio provides an illustration of the average residential rates paid on a per assessment basis across the municipality. 161 Average Operating expenditure per Assessment This ratio measures the average operational spending (as drawn from the income statement) on a per assessment basis. Operating result per Assessment This ratio measures the average operating surplus (deficit) (as drawn from the income statement) on a per assessment basis. Rate revenue/ underlying revenue This ratio measures Council’s reliance on rate revenue as its principal source of funding. Increasing trends in this ratio will highlight that growth in rate revenue is frequently higher than what is able to be achieved in Fees and Grant revenue. Grants/ Total revenue This ratio provides an indication of the percentage of total revenue that is comprised of grant income. Current assets / Current liabilities Otherwise known as the working capital ratio, this indicator expresses Council’s shortterm ability to meet its liquidity requirements within the current financial year. Ratio’s below or nearing 100% indicate that Council may not be able to meet short-term liabilities. Non Current liabilities /Own Source of Revenue This indicator expresses Council’s long-term ability to meet its liquidity requirements from generation of recurrent revenue. Ratio’s below or nearing 1% indicates that Council may not be able to meet long-term liabilities. Average liabilities per Assessment This ratio expresses the sum total of current liabilities and non-current liabilities expressed on a per assessment basis. 162 Capital works / Rate revenue This ratio represents the capital outlays as a percentage of rate revenue and therefore Council’s relative ability to convert rate revenue into capital works. The outcomes in this ratio will be influenced by capital grants. Renewal As distinct from other capital ratios, this indicator looks solely at capital renewal expenditure and excludes capital spending on new assets. By contrasting this ratio against total depreciation, the outcome provides a broad level overview on whether Council is able to achieve a result in excess of 100%. A % less than 100 indicates that the assets are deteriorating faster than being renewed. This is a useful indicator but given depreciation may not always represent asset consumption on an annual basis; care should be used in its interpretation. Cash from Operations/Net Capital outlays This ratio represents the ability of the Council to fund capital expenditure from cash generated from operations. A % less than 100 indicates that the Council is relying on existing cash reserves to service its capital works. Legislative framework The Act, Regulations and other laws and statutes which set a Council’s governance and reporting requirements. Major Initiatives Significant initiatives that will directly contribute to the achievement of the council plan during the current year and have a major focus in the budget Minister The Minister for Local Government Model Budget The Victorian City Council Model Budget prepared annually by the Institute of Chartered Accountants in Australia New asset expenditure Expenditure that creates a new asset that provides a service that does not currently 163 exist Non-financial resources The resources other than financial resources required to deliver the services and initiatives in the budget Non-recurrent grant A grant obtained on the condition that it be expended in a specified manner and is not expected to be received again during the period covered by a Council’s Strategic Resource Plan Operating activities Operating activities means those activities that relate to the provision of goods and services. Operating budgeted income statement The budgeted income statement shows the expected operating result in the forthcoming year. The budgeted statement income statement should be prepared in accordance with the requirements of AASB 101 - Presentation of Financial Statements in accordance in the new International Financial Reporting Standard. Operating expenditure Operating expenditure is defined as consumptions or losses of future economic benefits, in the form of reductions in assets or increases in liabilities; and that result in a decrease in equity during the reporting period. Operating revenue Operating revenue is defined as inflows or other enhancements, or savings in outflows of future economic benefits, in the form of increases in assets or reductions in liabilities; and that result in an increase in equity during the reporting period. Performance Statement A statement including the results of the prescribed service outcome indicators, financial performance indicators and sustainable capacity indicators for the financial year and included in the annual report. Rate structure Site value (SV), capital improved value (CIV) or net annual value (NAV) are the main 164 bases upon which rates will be levied. The City of Melbourne uses NAV. Regulations (LGR) Local Government (Planning and Reporting) Regulations 2014 Statement of capital works A statement which shows all capital expenditure of a council in relation to non-current assets and asset expenditure type prepared accordance to the model statement of capital works in the Local Government Financial Report. Statement of human resources A statement which shows expected council staff expenditure and numbers of full time equivalent council staff Statutory disclosures Section 127 of the Act and the Regulations require certain information relating to projected results, borrowings, capital works and rates and taxes to be disclosed within the budget. Strategic objectives The outcomes a council is seeking to achieve over the next four years and included in the council plan. Strategic resource plan (SRP) A plan of the financial and non-financial resources for at least the next four years required to achieve the strategic objectives in the council plan Summary of planned human resources expenditure A summary of permanent council staff expenditure and numbers of full time equivalent council staff categorised according to the organisational structure of the council Underlying surplus /(deficit) The underlying operating result is a measure of financial sustainability of the Council. Valuations of Land Act 1960 The Valuations of Land Act 1960 requires a Council to revalue all rateable properties every two years. 165

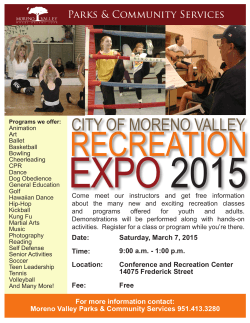

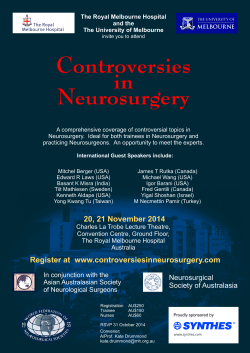

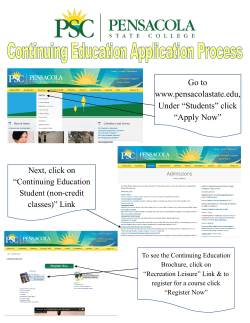


© Copyright 2026