
A speed-optimized RGB-Z capture system with improved denoising
A speed-optimized RGB-Z capture system with improved denoising
capabilities
Aleksandra Chuchvara, Mihail Georgiev, Atanas Gotchev
Department of Signal Processing, Tampere University of Technology, P. O. Box 553, FI-33101,
Tampere, Finland
ABSTRACT
We have developed an end-to-end system for 3D scene sensing which combines a conventional high-resolution RGB
camera with a low-resolution Time-of-Flight (ToF) range sensor. The system comprises modules for range data denoising, data re-projection and non-uniform to uniform up-sampling and aims at composing high-resolution 3D video
output for driving auto-stereoscopic 3D displays in real-time. In our approach, the ToF sensor is set to work with short
integration time with the aim to increase the capture speed and decrease the amount of motion artifacts. However,
reduced integration time leads to noisy range images. We specifically address the noise reduction problem by performing
a modification of the non-local means filtering in spatio-temporal domain. Time-consecutive range images are utilized
not only for efficient de-noising but also for accurate non-uniform to uniform up-sampling on the high-resolution RGB
grid. Use is made of the reflectance signal of the ToF sensor for providing a confidence-type of feedback to the denosing module where a new adaptive averaging is proposed to effectively handle motion artifacts. As of the non-uniform
to uniform resampling of range data is concerned, we have developed two alternative solutions; one relying entirely on
the GPU power and another being applicable to any general platform. The latter method employs an intermediate virtual
range camera recentering after with the resampling process degrades to a 2D interpolation performed within the lowresolution grid. We demonstrate a real-time performance of the system working in low-power regime.
Keywords: Time-of-Flight, ToF, data fusion, video plus depth, non-local means, GPU.
1. INTRODUCTION
3D video is a type of visual media, which delivers to the viewer a 3D depth perception of the observed scenery. The
interest in 3D video production has notably increased recently along with the advances in 3D display technologies. This
includes novel depth sensing camera hardware, combined with 3D analysis and image processing algorithms. Research
in this area spans the whole media processing chain from capture to display [1]. 3D video technology can be applied in
wide variety of applications, including 3D cinema, home 3DTV production and 3D video services for mobile devices.
However, nowadays a fully automated 3D video content generation is still a challenging task. The problem is that to
achieve high quality output, and multiple (free) viewpoints of the captured scene, the scene geometry and object’s
texture have to be accurately captured, estimated and reconstructed. Also, essential problems are caused by ambiguities
and occlusions as well as noise and other inaccuracies in signal acquisition and calibration parameters, thus reliable
estimation cannot always be guaranteed.
Accurate depth sensing is the most important part concerning 3D video output generation. There are many approaches to
obtain scene depth information. In case of dynamic scenes acquisition, Time-of-Flight (ToF) sensors are favored as they
are capable to deliver range images at real-time rates [2]. For depth data acquisition ToF camera based on the Photonic
Mixer Device (PMD) principle is used [2, 3]. These cameras deliver per pixel distance information with high frame rates
and thus are suitable for dynamic scene capturing. While there are variations of the technology, a conventional ToF
camera acquires range (or distance) data by using active sensing illumination. A beamer illuminates the whole scene with
near-infrared light and a CMOS sensor senses the light reflected back by scene objects. Every pixel in the sensor array
independently computes the correlation of the received reflected light with the phase-shifted reference signal. The
calculated phase-delay output of the mixed signal is proportional to the sensed range. However, current ToF devices
have certain technology limitations such as low spatial resolution compared to e.g. full High-Definition (HD) resolution,
and limited ability to capture color information [4]. A solution in this case is to combine two or more separate devices
responsible for color (RGB) and range (Z) data.
Setups described in [5, 6, 7] utilize configuration with a single color view and a single range device. Approaches
described in [6,7] suggest up-sampling the low resolution depth maps by means of adaptive bilateral filtering preventing
edge blurring in geometry data while smoothing it over homogeneous regions. However, such approaches require the
input depth and color data of the scene to be pixel aligned and not influenced by range uncertainties of projected
position. A scene reconstruction method that iteratively adds every unique scene portion of scene data utilizing both
geometric and color properties of the already acquired parts of the scene is proposed in [7]. Another data fusion process
has been proposed in5. In this approach, the data fusion is implemented by mapping the ToF data as 3D point clouds and
projecting them onto the color camera sensor plane, resulting in pixel-to-pixel projection alignment of color and depth
maps. Subsequently, the color image is back-projected as a texture onto ToF sensor plane.
When several multiple color cameras are available at the capturing setup, ToF data can be combined with disparity
correspondence map (disparity map) estimated by stereo-matching algorithms. Error characteristics of depth estimate
provided by ToF sensor and stereo matching are complementary. ToF can estimate depth in situations where stereo
matching does not work, e.g. texture-less or repetitive scene regions. On the other hand, ToF camera can face a number
of sensor-specific challenges such as limited spatial resolution, distant objects, low reflectivity or high reflectivity areas
which may produce weak or over-saturated signal. In [8], depth probability distribution function from each source is
measured and then combined in a single improved depth map. An interesting solution of combining stereo and ToF data
is described in [9]. The algorithm can utilize more than two images for stereo matching and produces a dense depth map
for one of the available color views by calculating per-pixel cost function. In [10], ToF range measurements are first
converted to stereo disparities so that they can be linked to the image pairs in order to initialize a stereo matching
algorithm resulting in high-quality disparity maps.
The present contribution focuses on real-time 3D video rendering by combining a high-resolution color image, denoted
as RGB data with a low-resolution range data, denoted as Z data and acquired by an aligned camera setup of one or
several color cameras and a single ToF range sensor. The motivation is to create an end-to-end system that enables
synchronous multi-sensor scene capture, range data de-noising, projection-alignment data fusion, and rendering on the
fly of resulted 3D video content on a multi-view auto-stereoscopic 3D display. The main goal is to output an accurate
HD dense depth map from captured range data that corresponds to the high-resolution color image. This involves view
projection of the range data converted into depth map and consequent re-sampling to the color camera sensor grid (or
more specifically, up-sampling to the resolution of the HD color camera grid). The paper proposes a fast algorithm for
dense depth map generation that utilizes computer graphics rendering tools. While our realization fully relies on parallel
Graphics Processing Units (GPU) resources, we propose solutions that enable high-speed implementation also on a
general CPU system. This includes ideas for fast data re-sampling, optical system correction, and occlusion detection.
Special attention is paid to the problem of noise reduction in ToF range data, which is important for reliable projection
alignment and data fusion, especially, when data is captured in poor sensing conditions. This is a typical case, when the
sensor is more restricted, for example to fit requirements of low-power consumption and low-computational complexity
on portable devices. A modification of the non-local means filtering in spatio-temporal domain is applied to address this
problem. The possibility of combining multiple depth images acquired with lower integration time to achieve better denoising output is demonstrated.
The paper is organized as follows. Section 2 presents a brief overview of the 3D graphics pipeline and OpenGL
rendering mechanism. Section 3 describes the generalized system architecture and application process flow. Section 4
presents in detail the implementation of data fusion approach and the proposed re-sampling solution. The GPU based
approach to camera view rendering and occlusion detection is presented in Section 5 and the rest of section explains a
workaround approach for avoiding data remapping for optical distortion correction. Section 6 is dedicated to a proposed
de-noising solution of ToF data. Section 7 presents some experimental results and demonstrates the algorithm
performance, while Section 8 concludes the paper.
2. 3D RENDERING PIPELINE AND OPENGL VERTEX TRANSFORMATIONS
2.1 Rendering pipeline
3D Rendering is the process of producing a digital image based on three-dimensional scene description. A rendering
algorithm takes as input a stream of primitives (e.g. triangles, lines, points, etc.) that define the geometry of a scene. The
primitives are processed in a series of steps, where each step forwards the results to the next one. The sequence of steps
required to implement the rendering algorithm is called 3D pipeline or graphics pipeline [11]. Some components of
modern graphics pipeline are fixed and implemented using dedicated logic, while others are programmable and can be
provided to a graphical processor in a form of special shader programs. Standard pipeline is controlled through graphics
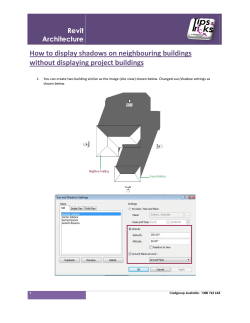
Figure 1. Left: a simplified representation of the graphics pipeline (programmable stages are highlighted). Right: OpenGL
coordinate transformations.
APIs, such as OpenGL and Direct3D, which modify the rendering state and supply input to the pipeline. Programming
shaders is possible with high level shading languages, such as OpenGL Shading Language (GLSL), which is based on
the syntax of the ANSI C programming language. Figure 1 shows a simplified representation of a modern 3D pipeline.
Rendering begins with the supply of surface primitives to the GPU. A primitive is defined by its vertices and described
by 3D location, surface normal vectors, texturing, color information, and material properties. A vertex shader operates on
individual vertices, one at a time. This block can only manipulate the vertex properties. Primitive assembly is responsible
for assembling the transformed vertices back into primitives. Geometry shader takes as input a whole primitive and has
access to all defining elements. The output of a geometry shader can be zero or more primitives, i.e. some primitives can
be filtered out or new primitives can be generated. The non-programmable rasterization and interpolation block defines
a set of pixel-size fragments that are part of a primitive. The value of each vertex attribute (color, etc.) is interpolated for
each fragment. Fragment shader computes the final color value of each fragment. It can access the fragment position,
and all the interpolated data computed in the rasterization process (only current fragment and its associated data). It
changes the fragment depth value and use textures to produce special effects. Raster operations block includes depth test
to determine if the fragment is hidden by already rendered fragments followed by blending of the fragment color with the
color of the already rendered pixel.
2.2 OpenGL vertex transformations
Just like the graphics pipeline, transforming a vertex is done step-by-step. Each transformation transforms a vertex
coordinates into a new coordinate system, moving to the next step (Figure 1). The model matrix – Mmodel transforms a
position in model coordinates to the world position. The view matrix transforms world coordinates into eye coordinates,
i.e. it represents a camera from where a model is observed. The projection matrix – Mproj transforms eye coordinates into
clip coordinates. It determines how the vertex is projected on the screen and the viewing volume of the scene (frustum).
The resulting coordinates are called clip coordinates because the value of wclip is used to decide whether vertex – v(x, y,
z) is “clipped”. The vertex transformation is generalized as the product of the model, view and projection matrices.
v ' M proj M view M model v
(1)
Next, clip coordinates are transformed into a normalized device coordinate (NDC) by perspective division, which is
obtained by dividing the clip coordinates with wclip:
(2)
vx, y, z NDC vx, y, z / wclip
After, the NDC are scaled in order to fit into the rendering screen. Finally, the window coordinates are passed to the
rasterization process to become a fragment.
Figure 2. Camera setup: a) Prosilica GE 1900C, b) PMDTec CamCube 2.0, c) camera mounting setup, d) scene setup.
3. SYSTEM ARCHITECTURE
3.1 Camera setup, system calibration and visualization hardware
We design a multi-sensor camera setup, by mounting standard color (2D) cameras aligned with a ToF range sensor.
Cameras of model – Prosilica GE 1900C are used to obtain color data modality (Figure 2.a), while a single ToF camera –
PMDTec CamCube 2.0 is used to sense scene range data (Figure 1.b). The whole acquisition setup and test scene are
shown in Figure 2.c, d.
The camera setup was calibrated with help of “Matlab Calibration Toolbox” [12]. The calibration process returns a list of
camera intrinsic and extrinsic parameters. The intrinsic parameters for each camera include: focal length – (fx, fy),
principal point coordinates – (px, py), and image distortion coefficients stored in vector d5x1 and defined by the intrinsic
camera matrix – K3x3 as follows:
K 3x3
fy
0
0
0
fx
0
py
p x
1
(3)
The extrinsic parameters are: rotation matrix - R3x3 and translation vector – T3x1. The two parameters are combined for
comfortable use into a single matrix – P as follows:
R T ,
P4 x 4
01x 3 1
(4)
where 01x3 is a zero vector. All the parameters have to be determined only once in a calibration stage (offline mode), after
which the cameras are considered firmly fixed.
For the 3D video output a Dimenco 3D auto-stereoscopic display is used [13]. Table 1 summarized the characteristics of
the cameras and the display.
Table 1. Camera setup specifications: a ) for cameras, b) for 3D display.
Model
Type
Resolution[pixels]
Measurement range[m]
Frame rate[fps]
Fielf-of-view optics[°]
Data interface
CamCube 2.0
time-of-flight
204x204
0.3-7.0
28
~39
USB 2.0
Prosilica GE 1900C
color
1920x1080
30
~55°
Gigabit Ethernet
Model
Type
Resolution[pixels]
Content format
Image type
Depth quantization
Number of views
Dimenco 42 inches
auto-stereoscopic
1920x540 pixels
2D+Z
true color (24 bit)
0÷255(8 bit)
28
Figure 3. Capturing, streaming, triggering and data processing (time consuming parts of processing chain are highlighted).
3.2 Data capture and streaming
For the scene capture by a multi-camera setup, it is important to obtain image data from all the cameras synchronously.
Software triggering mode was used for both cameras to synchronize data acquisition. А software command triggers the
capture of an image, which is then transferred to the PC memory. To minimize the time lag between two trigger events, a
separate thread is created to trigger each camera whenever the system is ready to update memory. So only when all
cameras are ready, they get a capturing signal at the same time and no delay is observed between two images.
In order to decouple the updating and processing part, data streaming between cameras and the application are organized
in producer-consumer-like manner using a fixed amount of reusable frames, where a frame is a couple of corresponding
color and depth images (Figure 3.left part). Whenever an unused frame is available, a separate producer-thread updates
the frame content and marks the frame as ready-to-use. A consumer-thread retrieves a ready frame and uploads the data
to the GPU memory, where the data is processed and rendered. After uploading, the frame is marked as unused and can
be used by the producer module.
3.3 Data processing chain
The implementation steps of a full-processing chain from image acquisition to visualization on a 3D display is
generalized into a unified framework and depicted in Figure 3. Capturing module provides a synchronized data
acquisition from multiple sensors as explained in the previous subsection. Next module performs de-noising of range
data utilizing a modified algorithm specific to ToF data. In the following stage, the distortion effect of ToF optical
system is corrected by lens re-mapping algorithm, while the one of color camera is corrected during the texture
coordinates assignment stage. The data fusion module is responsible for operations that project, convert, and align data
into a dense depth map corresponding to the color camera viewing position and sensor resolution. An approximation
module corrects resampling artifacts by utilizing some properties of the color modality. Finally, the color and
corresponding depth maps are combined in various formats to be displayed on different kinds of 3D displays. As an
additional step, fused data can be rendered as 3D textured surface mesh for viewing from an arbitrary viewpoint and
further post-processing for other applications. The general framework shows that most of the modules are implemented
on GPU, and we highlighted the ones, which influence the computational complexity most. The reason of GPU
utilization is real-time, which is difficult to achieve if the same modules are implemented on other processors. The main
focus of this contribution is to provide solutions for the stages of de-noising, optical distortion re-mapping and data
fusion that can decrease the computational complexity.
4. DEPTH MAP CREATION
The content format used for the given 3D display is referred to as “2D-plus-Depth” or shortly “2D + Z” format [13]. The
depth map is stored as a greyscale image side-by-side to the color image, so every pixel of the 2D content has a
corresponding depth value for the same pixel position on each map (Figure 4). Such data format is typically used to
render perspective views on auto-stereoscopic 3D displays, such as the display used in our experiments [14].
Having acquired 2D color image together with range data provided by the ToF camera, a 2D+Z frame is created by
converting range to depth and assigning corresponding depth values to every pixel of the color image. This task imposes
a major problem: The two cameras are not collinear, that is the positions of optical centers and view directions are
different. Consequently, the two data maps of the observed scene are not mutually aligned. A projective-alignment
correspondence between the depth and color data has to be applied, i.e. for every pixel of the depth sensor one has to find
the corresponding location at each position of the color image. Generally, to obtain such depth-to-color correspondence
depth-warping algorithm can be applied [15]. It consists of the following steps. First, represent range data into global
world coordinates, in such a way that each ToF pixel – d(u, v) becomes a 3D point (all representing world data pointclouds) in terms of a homogeneous coordinate – (x, y, z, w)T:
2
z f PMD d u, v fTOF
u 2 v2 ,
(5)
x u z fTOF , y v z fTOF , w 1
where, fTOF is the focal length of the ToF sensor. The second step is to project every 3D point on the image plane of the
color camera:
(6)
x, y, wRGB K RGB RTPMDRGB x, y, z, wT ,
where RTPMD→RGB is the relative transformation between optical centers of the two cameras determined by the extrinsic
parameters and KRGB specifies intrinsic parameters of the color camera. Finally, the RGB image coordinates for a global
point – (x, y, z, w)T are given by the normalized coordinates:
(7)
x, y, z RGB / w .
The data of the ToF camera is usually of very low-resolution (e.g. 200x200). When projected to the Full HD grid of the
color camera (1920x1080), the corresponding points appear sparsely scattered between the pixel positions of the color
image. Filling the unknown depth values on the regular (high-resolution) grid position is performed by non-uniform
resampling techniques. Non-uniform to uniform mapping is a challenging task and still an open-research problem [16].
High-quality techniques impose also high-computational cost [15]. Depth data has the specifics of piece-wise smooth
function (c.f. Figure 4.a), which offers some simplifications making use of triangulated non-uniform bi-linear resampling supported by the GPU. The approach is summarized in Table 2.
Table 2. Non-uniform resampling algorithm by bilinear triangulation
1.
2.
3.
Represent ToF range data as triangulated surface mesh – M
Create empty memory buffer – ZB = ∞ of HD grid size (e.g. 1920x1080)
For each triangle –Tr in M, DO: render vertices in positions – (A, B, C) with values – (x, y, z) into HD grid
3.1. Estimate all N regular positions – p(x,y)N inside the triangle area of rendered vertices – (A, B, C)
3.1.a. For given three points, DO: Find a plane function – F(x, y)P = z’
3.1.b. For each position – n(n ϵ N), DO: Apply F(x,y)P for p(x, y)n z’n
3.1.c. IF Z{p(x, y)n }>z’n , update position p(x, y)n in ZB
Figure 4. 2D-plus-Depth(2D+Z) frame format: a) color and corresponding depth map, b) auto-stereoscopic display output
The method is notably local and requires small amount of memory (values of three vertices for each resampling
position). The locality enables non-clashing memory handling in the process parallelization, a simple mechanism of data
ordering (as in step 3.1.b), and hardware implementation on GPU. Such non-uniform resampling is considered a standard
by means of computer graphics rendering and OpenGL/GPU utilization. Implementation-wise, the following steps are
performed. First, the depth data from the ToF measurements are represented as a triangulated 3D surface mesh: triangles
are formed in-between neighboring on the depth image grid vertices and every pixel of the depth image is converted into
3D vertex by Eq. 5. To get the surface modeled exactly as it is seen by ToF camera, the intrinsic parameters of the
camera are used to obtain a proper projection matrix [17]. To do so, projective transformation – Mproj is realized in two
steps:
(8)
M proj M NDC M persp ,
where Mpersp matrix converts a frustum-shaped space into a cubic shape, and MNDC converts the cubic space to
normalized device coordinates. The intrinsic camera matrix specifies the camera perspective projection transformation
and can be incorporated into Mpersp as follows:
fy
0
M persp
0
0
0
fx
py
px
0
n f
0
1
0
0
n f
0
,
(9)
where fx, fy is the focal length, (px, py) are the principal point coordinates, and near(n) and far(f) correspond to back and
front clipping planes and may be set equal to camera measurement range, e.g. 0.3 and 7.0. The matrix MNDC is of the
form:
M NDC
0
0
(r l )(r l )
2 /( r l )
0
2 /(t b)
0
(t b)(t b)
0
0
2 /( f n) ( f n) /( f n)
0
0
0
1
,
(10)
where the choice of top(t), bottom(b), left(l), and right(r) clipping planes correspond to the dimensions of the original
image and the coordinate conventions used during calibration (in our case – [0, 204, 0, 204] correspondingly). Second, to
obtain the scene surface as seen from the color camera location, a view transformation is applied. The view matrix is
formed by extrinsic parameters packed in the matrix P (Eq. 4) obtained during the calibration process. The rendering
result is a surface containing no gaps representing the scene observed from the position of the color camera. Rendering
can be done to an off-screen frame buffer. Only the depth component is needed and it can be rendered directly to a
texture. After the depth map corresponding to the color camera location is obtained any uniform interpolation technique
can be used to up-sample it to the high-resolution format. Applying the rendering approach, the final 2D+Z frame can be
created in two rendering passes. The pseudo-code is provided in Table 3.
Table 3. 2D+Z frame rendering pseudo-code.
First pass: create new view depth map
1. Prepare the scene surface mesh data (3D vertices and connectivity).
2. Compute proper view and projection matrices for the camera.
3. Render data with parameters and position of the color camera.
4. Render the scene to the off-screen frame buffer and save Z-buffer as a texture.
Second pass: rendering 2D+Z frame
5. Prepare vertices data for two side-by-side quads.
6. Transform vertices of quads so that they span the whole viewport.
7. In fragment, use color and depth textures, apply color texture and depth to the corresponding quads
Figure 5. Resampling approach for the projection data alignment: a) general approach, b) proposed, c) real-case application.
The general re-sampling approach described above and illustrated in Figure 5.a is a computationally demanding
operation and strongly dependents on the GPU for real-time execution. We propose an alternative approach for fast nonuniform resampling making use of some of the properties of the ToF data. More specifically, we consider the case when
the two cameras are aligned horizontally (or vertically). Taking into account the high difference between the ToF and
RGB sensors, we render the missing data in two steps as depicted in Figure 5.b.
In the first step, we render a virtual ToF camera on the position of the optical center of HD color camera using the
original intrinsics and pose of the ToF camera. Rendering of such virtual camera manages to keep a bilinear non-uniform
resampling in low-resolution grid instead of HD one. Because the cameras used in our setup are aligned, they provide
relatively small depth parallax between optical centers according to the sensing operating range of the device (c.f. Figure
5.c) and no significant scaling effect is expected in the rendering process. This provides same or similar sampling density
between initial and rendered data, which speeds the resampling process (step 3.1.a), because of few-pixel wide triangle
areas. In the second step, we utilize the new camera relation property that is if cameras share same optical center, the
rendering between views (for arbitrary f, R and resolution scale) can be performed by a 2D back-projective transform by
interpolating regular samples without distorting the 3D properties of the sensed scene data. In such resampling, each of
HD grid pixel position is back-projected on the low-resolution grid, where the respective depth value is obtained by
interpolation of surrounded pixels. Such interpolation can be performed very fast on various platforms (e.g. as in [19]).
An experiment in Subsection 7.1 demonstrates, that the proposed two-step rendering approach followed by a proper 2D
back-projective re-sampling algorithm provides similar or better quality compared to the general non-uniform
resampling scheme.
Figure 6. Omitting artificial triangles in depth surface: a) principle, b) no triangles are discarded, c) triangles are discarded.
Figure 7. Occlusion detection results: a) occlusion detection scheme, b) no occlusion detection, erroneous color mapping, c)
occlusions are detected, no texture assignment at occluded areas.
5. ARBTIRARY VIEW RENDERING AND OCCLUSION DETECTION AND OPTICAL
DISTORTION HANDLING
Triangulation of the depth map and depth-image warping procedure explained in the previous section enable efficient
rendering of any arbitrary view of the scene. The (x, y, z) coordinates of each point in the image are computed from the
depth image grid coordinates and depth values, using the intrinsics of the camera. Every vertex of the surface is then
assigned a texture coordinate (also known as a UV-coordinate) applying Eq. 5 and Eq. 6. The depth-map surface is
rendered using the color values of the color image as texture. Whenever a new view of the scene has to be rendered, the
coordinate system transformation of the new view is used as a view-matrix transformation – P (Eq. 4) to place the scene
surface where needed in the world coordinate system.
Due to different viewing directions and position of the cameras, occlusion artifacts appear on the rendered depth map.
There are different sources of such artifacts. First, occlusion artifacts occur at depth map in the areas non-visible from
ToF camera position. The triangulated re-sampling explained above treats the entire depth map as a surface without
discontinuities, connecting data on the background with boundaries of front-situated objects. Triangles spanning
background and foreground points appear large and visually unrealistic, blocking visible information of the back-situated
objects and background. Thus, it is important to determine whether triangles represent actual object surfaces or not. As
observed in Figure 6, the artificial triangles have the property that the triangle normal is almost perpendicular to the
vector from the initial ToF camera viewpoint to the triangle. That is, the dot product of the vectors is close to zero (c.f.
Figure 6.a). Problematic triangles can be discarded inside a geometry shader with the following inequality using a
threshold to control the amount of discarded triangles:
(11)
nt p ,
where t is a triangle index, nt is the normal of t, p is the direction from camera position to the center of the triangle, is
the vector dot product operation, and τ is a threshold parameter. Another type of occlusions artifacts appear in the areas
of the depth map surface, which become occluded when seen from the color camera view. For these surface regions the
mapping procedure assigns erroneous color information as it warps to the same region of the texture map as the
occluding parts. A simple approach to detect erroneous color assignments is to adopt a shadow-mapping technique,
which is used to create shadows in 3D computer graphics [20]. The basic shadow map algorithm consists of two passes
(Figure 7.a). In the first pass, the scene viewed from the point of the light source is rendered to the off-screen frame
buffer. The frame buffer contains a depth buffer, which after rendering stores minimal per-pixel depth that is the zdistance of the rendered scene and can be saved as a texture. In the second pass, the scene is rendered again from the
viewpoint of the light source, but for every fragment its z-coordinate is compared to the value of the z-buffer entry with
the same (x, y)-coordinates: if current z-value is bigger than the one stored in z-buffer, i.e. there is something in between
the current fragment and the light source, the fragment is considered to be in shadow. In our case the color camera plays
the role of the light source and for a fragment ‘to be in shadow’ means ‘to be occluded’, i.e. not seen from the color
camera. During the color assignment, if a fragment is hidden the color assignment is skipped. Otherwise, the color
assignment is performed using texture mapping. Results are illustrated in Figure 7.b and 7.c. The steps for an arbitrary
view rendering with occlusion detection are summarized in Table 4.
Table 4. Arbitrary view rendering with occlusion detection pseudo-code.
First pass: Determine the visibility of the whole scene from the color camera position
1. Prepare the scene surface mesh data (3D vertices and connectivity);
2. Compute proper view and projection matrices for the camera;
3. Move the camera to the color camera position;
4. Render the scene to the off-screen frame buffer and save Z-buffer as a texture.
Second pass: rendering the surface and occlusion detection
5. Again, for every vertex DO: calculate its coordinates in color camera coordinate system as in previous pass;
6. IF color assignment, DO: compare the depth value of the calculated coordinate with the depth texture;
7. IF depth of transformed point, bigger than the value in depth texture, omit the texture assignment.
8. For every triangle, DO: calculate surface normal.
9. IF z-component of the normal less than a threshold – discard the triangle.
Due to distortions of optical system, additional data transformations have to be performed in order to achieve more exact
projection alignment. Optical distortions are modeled as of radial and tangential effect [18]:
(12)
pd 1 d1 r 2 d 2 r 4 d5 r 6 p dx ,
2
2
2
where r =px +py and dx define the tangential distortion which is omitted in our case. The same function is used for
remapping process. Usually, both color and depth images are undistorted before any rendering takes place, but this is an
undesirable time-consuming operation, especially for a high-resolution color image, as it leads to remapping and
interpolating for each pixel in the image grid. However, optical distortions can be corrected without remapping before
the projection alignment is applied and described as summarized in Table 5.
Table 5. Optical system correction steps.
1. Apply un-distortion transformation of ToF camera to 3D point clouds before projection step - just apply
transform in world space.
2. Distort again 3D point clouds with distort transformation of color camera, where data should be projected
3. Apply projection alignment
Figure 8. Effect of noisy influence of low-sensing environment on fusion process stages: a) range data, b) fused data, c)
effect on occlusion detection.
6. DE-NOISING OF TOF RANGE DATA
A typical ToF device consists of a beamer, an electronic light modulator and a sensor chip. The beamer is made of an
array of light-emitting diodes (LED) operating in near-infrared wavelengths (e.g. 850 nm). It radiates a point-source light
of a continuously-modulated harmonic signal which illuminates the scene. The reflected light from object surfaces is
sensed back by pixels of the sensor chip, which collects pixel charges for some period IT referred to as integration time.
For each pixel, the range data is estimated in relation to phase-delay of mixed signal between sensed signal and the one
of the light modulator [21]. The estimation of phase delay φ and amplitude A is performed as a discrete cross-correlation
of several successively captured samples taken between equal intervals during same modulation periods of fixed
frequency. The sensed distance D is proportional to the phase delay φ, while the error in distance measurements
measured through the variance D2 is proportional to the square inverse of the amplitude A:
D
4f
cL ,
1 .
2
A
D2
(13)
In the above equation, f denotes the frequency of the emitted signal and cL denotes the speed of light through dry air
(~298.109 km/h). The exact value of D is calculated after precise calibration of the sensor.
ToF devices exhibit generic drawbacks related with their principles of operation. A specific case of interest is the socalled low-sensing mode, in which the sensor is more restricted, by e.g. requirements for miniaturization leading to
limited beamer size, decreased number of LED elements, embedding into portable low-power devices, requirements for
low power consumption, etc. This results in extremely low sensing measurements of A (e.g. < 250 units), and according
to Eq. 13 will lead to high values of measurement error (noise variance) D2 . For such a mode the noise presence
becomes a dominant problem which should be addressed by dedicated de-noising methods. The case is illustrated in
Figure 8. One can observe that noisy influence of low-sensing mode in fusion process has completely degraded output
and is useless in practice. This illustrates the importance of proper care of the range noise on a system level before
applying the necessary steps for multi-modal data fusion.
A de-noising procedure can be applied to the pre-computed phase-delay map φM as a post-measurement operation. There
are some specifics of the noise arising from ToF low-sensing measurements. While the influence of noise in distance
maps is very high and resembles a moving grainy fog, the distance data is of low-texture content and is usually
considered as piece-wise smooth function (c.f. Figure 8.a). This makes the de-noising step well tractable in the light of
modern non-local de-noising paradigm [22, 23].
Figure 9. Demonstration of wave-like de-noising artifacts: a) noisy video stream(IT=50µs), b) and c) are two consecutively
captured de-noised outputs, d) and their XOR difference.
6.1 Proposed de-noising approach
The technique for suppressing system noise of ToF range data has been developed and presented in our previous
works[15,21,24]. The technique utilizes a non-local means (NLM) de-noising approach [22], modified for the case to
work in a complex-valued domain [21]. In addition to removing system noise caused by low-sensing operational mode,
the proposed method was proved efficient for suppressing artifacts presented also in normal operating mode [21]. The
proposed approach is summarized as follows: First, a non-local means filtering is employed on a complex signal formed
from the measured amplitude and phase C = AM ( e jfM ) . The patch similarity search for complex-valued image patches
effectively adapts to the prior knowledge of noise provided by the amplitude. It simplifies the block search leading to
better weighting for complex-valued signals with reduced computational complexity. The non-local de-noising in
complex domain implies simultaneous filtering of all signal components in a single step thus it additionally improves the
noise confidence parameter AM, which can be further used in subsequent iterative de-noising schemes. Second, we
propose also a preliminary filtering step of individual signal components that provides additional enhancement effect by
suppressing fixed-pattern noise, impulse noise and system artifacts for better de-noised output.
Figure 10. Process diagram of proposed smart averaging technique (a), and b) selected threshold distribution of α .
We propose a modification of our approach [24], aimed at real-time implementation with low-complexity fixed-point
arithmetic while bringing further improvements to the performance. The approach is based on similarity search and
filtering in spatio-temporal complex-valued signal domain. It makes use of highly over-complete data structure utilizing
subsequent time frames where measurements are taken with shorter integration times. The experiments have shown that
such search is less computationally and power expensive. A simplified filter modification specifically addresses a
computationally efficient collection of spatio-temporal patches and meets the requirements for real-time implementation
[24]. Further modification deals with flickering introduced by motion artifacts. An example is given in Figure 13.c and
the approach is depicted in Figure 10 and explained by the following steps:
1.
2.
2.1.
3.
3.1.
4.
Capture video stream of ToF data maps – AM, φM.
For each frame output, create video stream buffer of N consecutive frames.
For each frame in buffer, de-noise amplitude and phase-delay maps – (φM, AM)[1÷N] (φD ,AD) [1÷N] .
Compare de-noised maps – (AM) [1÷N] . Select pixel positions with variance < α.
Create update mask - UM. Update selected positions with averages of noisy data in (φM, AM)[1÷N] , update
other positions with (φM, AM)[1]. AU, φU.
De-noise AU, φUAout, φout.
The threshold α in step 3 is adaptively selected following the dependence of the variance of the amplitude signal A. This
dependence between the intensity value and its variance exhibits a Rayleigh distribution and has been experimentally fit
[24] (c.f. Figure 10.b). For amplitude values in consecutive frames with low variance, the corresponding complex values
are averaged to undergo a second denoising iteration (steps 3 and 4). For the sake of real-time execution, the proposed
modified averaging is applied only to data marked as extremely noisy (i.e. for amplitude A < 100 units) [21, 24]. For
other sensed values, the advantage of that adaptive thresholding is considered costly. Visual results of the proposed
modified adaptive averaging are given in Subsection 7.2.
Figure 11. Experimental setup: a) camera topology test configuration, b) rendered scene, c) visual results on scene details for 10x
asymmetric scale and 0.25m setup misalignment of our and general resampling approach.
7. EXPERIMENTAL RESULTS
7.1 Re-sampling
We demonstrate our resampling technique by an experiment performed on a photorealistic scene synthetically rendered
by Blender software [26]. A rendering script can be configured for different camera arrangements, asymmetric camera
parameters in terms of f, R, T, and varying sensor spatial resolutions. We have designed a scene of high depth contrast
varying within 0÷6 m, which resembles a typical range of the available ToF device and contains objects of different
reflection surfaces, materials and facing directions, and illumination noise (Figure 11.b). Using the script, extreme case
has been simulated. A horizontally aligned camera setup has been misaligned in forward/backward direction within the
range 0 ÷ 0.5 m for an arbitrary chosen relative pose in terms of R and baseline, and for different resolution scale
discrepancy to the HD sensor both for width and height two to ten times. We compared the rendered results of the
proposed approach to the general one by measuring the difference to ground-truth data in terms of Peak signal-to-noise
ratio (PSNR). Ground true was created by asymmetric camera arrangement of HD cameras with the same tested baseline,
relative pose and misalignment. Both re-sampling approaches were programmed on Matlab. For 2D image interpolation,
B-spline interpolation has been implemented [27]. The results plotted in Figure 12, show that for each tested case, our
approach achieves comparable or better quality. Visual results on some scene details are given in Figure 11.c. The results
demonstrate that the proposed approach for projection-alignment resampling has good performance for much faster
speed (about 25 times faster as measured by the time of code execution).
Figure 12. Performance comparison between proposed and general re-sampling approach of asymmetric camera setup for
forward/backward misalignment case: a) plots of PSNR metric and b) corresponding differences in performance.
7.2 De-noising
We demonstrate the proposed adaptive averaging approach for denoising of a video stream captured by very short
integration time (IT = 50µs) causing extreme levels of noise (c.f. Figure 13). The size of the video stream buffer utilized
for spatio-temporal de-noising is 3 frames. This specifies a capture time far below the real-time constraint
(150µs<<40ms). We demonstrate results of range data de-noising and subsequent data fusion. The results are compared
in terms of PSNR where the ground true is formed by the scene depth by the ToF device in normal operating mode IT =
2ms. Table 6 shows some of the results. Another demonstration shows a real-case video application, where object of fast
local motion (a moving person) has been captured. The output of the applied de-noising technique shows robust
performance against motion artifacts (c.f. Figure 13.c, d).
Table 6. De-noising performance of proposed techniques in terms of PSNR
Input
IT= 50 µs, 97 % of low-sensed pixels
Noisy
23.42
IT=100 µs, 73 % of low-sensed pixels
30.58
41.41
43.29
47.09
IT=200 µs, 45 % of low-sensed pixels
37.16
46.23
47.75
49.62
a)
Spatial de-noising Spatio-temporal de-noising (3 frames) Adaptive averaging (3 frames)
35.18
39.08
42.59
b)
c)
d)
Figure 13. ToF range data de-noising (IT=50µs): a) range data de-noising results, b) fusion results(view from azimuth perspective), c)
real-case video application of low-sensing environment noisy input, d) 3 consecutively de-noised frames and their XOR difference.
8. CONCLUSIONS
We have described a real-time performing end-to-end system for 3D video capture in the form of view plus depth. It
synchronously combines the data of HD color camera with low-resolution ToF data, where the two cameras might be in
non-collinear setup. We have specifically addressed the speed improvements required in the most computationally
demanding steps including data remapping for optical correction, resampling and projection alignment, depth data denoising and occlusion handling. The final system is of low complexity, and can handle data in low-sensed environment.
The denoising module of the system employs a novel idea for handling flickering artifacts in range data by adaptive
averaging. This solution is both fast and effective. While we utilize the power of GPU for the general non-uniform to
uniform resampling, an alternative non-GPU implementation of the resampling stage has been developed as well. The
approach essentially avoids operations at the HD grid by introducing an intermediate rendering of range virtual camera
recentered at the RGB camera center. Thus, the subsequent up-sampling can be performed by interpolation at the lowresolution regular grid.
REFERENCES
[1] Smolic, A., “3D video and free viewpoint video - From capture to display,” in J. of Pattern Recognition (44)9,
1958-1968 (2011).
[2] Kolb, A., Barth, E., Koch, R., and Larsen, R., "Time-of-flight cameras in computer graphics," Computer
Graphics Forum 29(1), 141-159 (2010).
[3] Ringbeck, T., "A 3D Time of Flight Camera for Object Detection," Conf. on Optical 3D Meas. Tech, (2007).
[4] PMDTechnologies GmbH, “PMD[Vision] CamCube 2.0”, a PMD Camera Vendor in Siegen, Germany (2010).
[5] Lindner, M., Kolb, A., Hartmann, K., "Data-fusion of PMD-based distance-information and high-resolution
RGB-images," Sym. on Signals Circuits and Systems (ISSCS), 121-124 (2007).
[6] Chan, D., Buisman, H., Theobalt, C., Thrun, S., “A noise-aware filter for real-time depth upsampling”, In
Workshop on Multi-camera and Multi-modal Sensor Fusion Algorithms and Applications, ECCV (2008).
[7] Huhle, B., Jenke, P., Strasser, W., "On-the-fly scene acquisition with a handy multi-sensor system," Int. J. on
Intell. Systems Techn. and App., Issue on Dynamic 3D Imaging 5, 255–263 (2008).
[8] Zhu, J., Wang, L., Yang, R., Davis, J., "Fusion of time-of-flight depth and stereo for high accuracy depth
maps," Proc. of Conference on Computer Vision and Pattern Recognition (CVPR), 1-8 (2008).
[9] Bartczak, B., Koch, R., "Dense depth maps from low resolution time-of-flight depth and high resolution color
views," Proc. of the International Symposium on Visual Computing (ISVC), 228-239 (2009).
[10] Guðmundsson, S., Aanæs, H., and Larsen, R., "Fusion of stereo vision and time-of-flight imaging for improved
3d estimation," J. of Intelligent Systems Technologies and Applications, 5(3), 425-433 (2008).
[11] Industry’s Foundation of High Performance graphics,”Rendering Pipeline Overview,” www.opengl.org .
[12] Bouguet, J.,”Camera calibration toolbox for Matlab”, in www.vision.caltech.edu (2008).
[13] Dimenco, B.V., “3D Content Creation Guidelines,” 3D Interface Specification, www.dimenco.eu (2011).
[14] Sun, W., Xu, L., Au, O. C., Chui, S. H., Kwok, C. W., "An overview of free view-point depth-image-based
rendering (DIBR)," APSIPA Annual Summit and Conference, 1023-1030 (2010).
[15] Georgiev, M., Gotchev, A., Hannuksela, M., “Joint de-noising and fusion of 2D video and depth map sequences
sensed by low-powered ToF range sensor,“ Proc. of Int. Conf. on Media and Expo(ICME), 1-4 (2013).
[16] Sankaran, H., Georgiev, M., Gotchev, A., Egiazarian K., “Non-uniform to uniform image resampling utilizing a
2D farrow structure, , Proc. of SMMSP (2007).
[17] Simek, K., " Calibrated Cameras in OpenGL without glFrustum," in www.ksimek.github.io (2013).
[18] Hartley,R., Zisserman A.: Multiple-view geometry in computer vision, 2nd Edition” ISBN0521-54051-8 (2003).
[19] Mandy, A., Petkov, P., Gotchev, A., Egiazarian, K., “Efficient spline-based image interpolation on a TI OMAP
platform,”, Proc. of European DSP Education and Research Symposium(EDERS) (2006).
[20] Isidoro, J. R., "Shadow Mapping: GPU-based Tips and Techniques," Game Developers Conference (2006).
[21] Georgiev, M., Gotchev, A., Hannuksela, M., "De-noising of distance maps sensed by time-of-flight devices in
poor sensing environment," ICASSP, 1533-1537 (2013).
[22] Buades, A., Morel, J., “A Non-local algorithm for image denoising”, Proc. of Conf. of Comp. Vision and Patt.
Recognition, 2, 60-65 (2005).
[23] Dabov, K., Foi, A., Katkovnik, V., Egiazarian, K.,”BM3D image denoising with shape-adaptive principal
component analysis,” Proc. of SPARS, 16(8) (2009).
[24] Georgiev, M., Gotchev, A., Hannuksela M., “Real-time denoising of tof measurements by spatio-temporal nonlocal mean filtering,” Proc. of Int. Conf. on Media and Expo(ICME) with Hot3D Workshop, 1-4 (2013).
[25] Frank, M., Plaue, M., Koethe, U., Hamprecht, F., “Theoretical and experimental error analysis of continuouswave time-of-flight range cameras,” J. of Optical Engineering 48(1), 1-24 (2009).
[26] Blender Foundation, “Free and open source 3D animation suite,” 3D rendering software in www.blender.org
[27] Keys, R., "Cubic convolution interpolation for digital image processing," Tran. on Signal Processing,
Acoustics, Speech, and Signal Processing 29(6), 1153–1160(1981).


© Copyright 2026