
E-book
African Journal of Agricultural Research Volume 10 Number 2 8 January 2015 ISSN 1991-637X ABOUT AJAR The African Journal of Agricultural Research (AJAR) is published weekly (one volume per year) by Academic Journals. African Journal of Agricultural Research (AJAR) is an open access journal that publishes high-quality solicited and unsolicited articles, in English, in all areas of agriculture including arid soil research and rehabilitation, agricultural genomics, stored products research, tree fruit production, pesticide science, post harvest biology and technology, seed science research, irrigation, agricultural engineering, water resources management, marine sciences, agronomy, animal science, physiology and morphology, aquaculture, crop science, dairy science, entomology, fish and fisheries, forestry, freshwater science, horticulture, poultry science, soil science, systematic biology, veterinary, virology, viticulture, weed biology, agricultural economics and agribusiness. All articles published in AJAR are peerreviewed. Contact Us Editorial Office: [email protected] Help Desk: [email protected] Website: http://www.academicjournals.org/journal/AJAR Submit manuscript online http://ms.academicjournals.me/ Editors Prof. N.A. Amusa Editor, African Journal of Agricultural Research Academic Journals. Dr. Bampidis Vasileios National Agricultural Research Foundation (NAGREF), Animal Research Institute 58100 Giannitsa, Greece. Dr. Panagiota Florou-Paneri Laboratory of Nutrition, Faculty of Veterinary Medicine, Aristotle University of Thessaloniki, Greece. Dr. Zhang Yuanzhi Laboratory of Space Technology, University of Technology (HUT) Kilonkallio Espoo, Finland. Prof. Dr. Abdul Majeed Department of Botany, University of Gujrat,India, Director Horticulture, and landscaping. India. Prof. Suleyman TABAN Department of Soil Science and Plant Nutrition, Faculty of Agriculture, Ankara University, 06100 Ankara-TURKEY. Prof.Hyo Choi Graduate School Gangneung-Wonju National University Gangneung, Gangwondo 210-702, Korea. Dr. MATIYAR RAHAMAN KHAN AICRP (Nematode), Directorate of Research, Bidhan Chandra Krishi Viswavidyalaya, P.O. Kalyani, Nadia, PIN-741235, West Bengal. India. Dr. Mboya E. Burudi International Livestock Research Institute (ILRI) P.O. Box 30709 Nairobi 00100, Kenya. Dr. Andres Cibils Assistant Professor of Rangeland Science Dept. of Animal and Range Sciences Box 30003, MSC 3-I New Mexico State University Las Cruces, NM 88003 (USA). Dr. MAJID Sattari Rice Research Institute of Iran, Amol-Iran. Dr. Agricola Odoi University of Tennessee, TN., USA. Prof. Horst Kaiser Department of Ichthyology and Fisheries Science Rhodes University, PO Box 94, South Africa. Prof. Hamid AIT-AMAR University of Science and Technology, Houari Bouemdiene, B.P. 32, 16111 EL-Alia, Algiers, Algeria. Prof. Xingkai Xu Institute of Atmospheric Physics, Chinese Academy of Sciences, Beijing 100029, China. Prof. Sheikh Raisuddin Department of Medical Elementology and Toxicology,Jamia Hamdard (Hamdard University) New Delhi, India. Dr. Agele, Samuel Ohikhena Department of Crop, Soil and Pest Management, Federal University of Technology PMB 704, Akure, Nigeria. Prof. Ahmad Arzani Department of Agronomy and Plant Breeding College of Agriculture Isfahan University of Technology Isfahan-84156, Iran. Dr. E.M. Aregheore The University of the South Pacific, School of Agriculture and Food Technology Alafua Campus, Apia, SAMOA. Editorial Board Dr. Bradley G Fritz Research Scientist, Environmental Technology Division, Battelle, Pacific Northwest National Laboratory, 902 Battelle Blvd., Richland, Washington, USA. Dr. Almut Gerhardt LimCo International, University of Tuebingen, Germany. Dr. Celin Acharya Dr. K.S.Krishnan Research Associate (KSKRA), Molecular Biology Division, Bhabha Atomic Research Centre (BARC), Trombay, Mumbai-85, India. Dr. Daizy R. Batish Department of Botany, Panjab University, Chandigarh, India. Dr. Seyed Mohammad Ali Razavi University of Ferdowsi, Department of Food Science and Technology, Mashhad, Iran. Dr. Mohamed A. Dawoud Water Resources Department, Terrestrial Environment Research Centre, Environmental Research and Wildlife Development Agency (ERWDA), P. O. Box 45553, Abu Dhabi, United Arab Emirates. Dr. Phillip Retief Celliers Dept. Agriculture and Game Management, PO BOX 77000, NMMU, PE, 6031, South Africa. Dr. Rodolfo Ungerfeld Departamento de Fisiología, Facultad de Veterinaria, Lasplaces 1550, Montevideo 11600, Uruguay. Dr. Timothy Smith Stable Cottage, Cuttle Lane, Biddestone, Chippenham, Wiltshire, SN14 7DF. UK. Dr. E. Nicholas Odongo, 27 Cole Road, Guelph, Ontario. N1G 4S3 Canada. Dr. Yasemin Kavdir Dr. D. K. Singh Canakkale Onsekiz Mart University, Department of Soil Sciences, Terzioglu Campus 17100 Canakkale Turkey. Scientist Irrigation and Drainage Engineering Division, Central Institute of Agricultural Engineeinrg Bhopal- 462038, M.P. India. Prof. Giovanni Dinelli Department of Agroenvironmental Science and Technology Viale Fanin 44 40100, Bologna Italy. Prof. Huanmin Zhou College of Biotechnology at Inner Mongolia Agricultural University, Inner Mongolia Agricultural University, No. 306# Zhao Wu Da Street, Hohhot 010018, P. R. China, China. Prof. Hezhong Dong Professor of Agronomy, Cotton Research Center, Shandong Academy of Agricultural Sciences, Jinan 250100 China. Dr. Ousmane Youm Assistant Director of Research & Leader, Integrated Rice Productions Systems Program Africa Rice Center (WARDA) 01BP 2031, Cotonou, Benin. African Journal of Agricultural Research Table of Contents: Volume 10 Number 2 8 January, 2015 ARTICLES Diallel analysis on variation of Verticillium wilt resistance in upland cotton grown in Zimbabwe Chapepa B., Manjeru P., Ncube B., Mudada N. and Mubvekeri W. 39 Eucalyptus grandis and Tagetes minuta leaf powders effectively protect stored maize against Sitophilus zeamais without affecting grain organoleptic properties Musundire R., Mazodze F., Macheka L., Ngadze R. T., Mubaiwa J. and Manditsera F. 49 Moisture dependent physical properties of nigella seeds R. K. Singh, R. K. Vishwakarma, M. K. Vishal, S. K. Singh and V. K. Saharan Determination of compatibility of Pseudomonas fluorescens and Trichoderma harizianum grown on deoiled cakes of neem and jatropha for mass multiplication of P. fluorescens and T. harizianum in vitro Ajay Tomer, Ramji Singh and Manoj Maurya Effect of temperature and photoperiod on the development of fusariosis in pineapples Izabel Cristina Pereira Vaz Ferreira, Nilza de Lima Pereira Sales and Alisson Vinicius de Araujo 58 67 76 Vol. 10(2), pp. 39-48, 8 January, 2015 DOI: 10.5897/AJAR2014.9191 Article Number: 95F3A8449440 ISSN 1991-637X Copyright © 2014 Author(s) retain the copyright of this article http://www.academicjournals.org/AJAR African Journal of Agricultural Research Full Length Research Paper Diallel analysis on variation of Verticillium wilt resistance in upland cotton grown in Zimbabwe Chapepa B.1*, Manjeru P.2, Ncube B.2, Mudada N.3 and Mubvekeri W.1 1 Cotton Research Institute, Department of Research and Specialist Services, P. Bag 765, Kadoma, Zimbabwe. 2 Faculty of Agriculture and Natural Resources, Midlands State University, P. Bag 9055, Gweru, Zimbabwe. 3 Plant Quarantine Services Institute, Department of Research and Specialist Services, Mazowe, Zimbabwe. Received 1 October, 2014; Accepted 17 December, 2014 Verticillium wilt disease causes significant losses to cotton yield and varietal development for resistance is critical in combating this threat. A study was carried out to determine the underlying genetic pattern controlling disease resistance and identify suitable parental lines to use in varietal tolerance development. Five cotton varieties were crossed in a half diallel mating system to produce ten crosses and five selfed parental lines which were screened against Verticillium wilt by artificial inoculation. There were significant variations on the severity scores, vascular brown index scores, morphological and agronomical traits under Verticillium wilt pressure. The Verticillium wilt severity scores ranged from 1.22 to 3.07 and Vascular Brown Index scores from 0.78 to 2.77. The mean squares of general combining ability (GCA) for the various characteristics of the parents were significant and also for the specific combining ability (SCA) of the vascular brown index score which was 0.27 was also significant. Three parental lines were identified as breeding material with good GCA, morphological and agronomical performance and these were CRI-MS-1, SZ9314 and BC853. This study implies that varietal tolerance can be developed by incorporating genotypes with resistance genes in breeding programmes. Future work should focus on developing resistant varieties suitable for production in Verticillium wilt prone areas. Key words: Verticillium wilt, general combining ability, specific combing ability, cotton. INTRODUCTION Cotton productivity has generally been low in Africa due to the effect of climatic variations, biotic stress and poor crop management by farmers (International Cotton Advisory Committee, 2012). In the Southern African region, cotton industry plays a pivotal role in the national economies of Zimbabwe, South Africa, Mozambique, Zambia and Malawi (Baffes, 2004). Annually in Zimbabwe, 300 000 ha of land is put under cotton and about 250 000 tonnes of seed cotton is realised with a national average yield of around 800 kg per hectare (Mudada, 2013) which is low compared to the expected yield of 2300 kg per hectare in local varieties (Mudada and Muripira, 2010). Smallholder farmers who account for about 99% of cotton production in Zimbabwe contribute to the low yields because of poor production management practices (Mubvekeri and Nobanda, 2012). *Corresponding author. E-mail: [email protected], Tel: +263 773 162 220, +263 773 042 798. Author(s) agree that this article remain permanently open access under the terms of the Creative Commons Attribution License 4.0 International License 40 Afr. J. Agric. Res. Cotton diseases including Verticillium wilt caused by Verticillium dahliae Kleb have also been cited as a major reason for the low yields attained by the smallholder farmers (Mapope, 2001). The disease was also reported to be a problem in South Africa, Tanzania, Uganda, Ethiopia and Malawi in a survey report made by International Cotton Advisory Committee (2003). Cotton has many characteristics that are quantitatively inherited and the most interesting ones being for biotic stress tolerance (Meredith, 1998), especially for disease resistance. Understanding genetic variation and disease resistance, therefore, is important for plant breeders and pathologists because the selection of resistant genotypes depends on high heritability of the traits of the crop influencing resistance (Ashraf and Ahmad, 2000). In breeding programmes of self-pollinated crops, combining desirable genes from different germplasm through recombination is important so as to develop a single superior genotype (Mudada, 2013). More specific, in plant breeding, identifying suitable parents for the crossing programme is important. Lines or parents in hybrid combinations can be compared on their performance through combining ability analysis (Griffing, 1956). The combining ability is a powerful tool used to determine hybrid vigour in a population and thereby aid in selecting parents for producing crosses and segregating populations (Meredith, 1998). General combining ability and specific combining ability analysis are tools used to separate good and poor combiners followed by selection of the best cross combination. One of the techniques widely used for this purpose in different crops, including cotton, is diallel analysis (Hayman, 1954). Diallel mating helps in choosing parents to be used in hybridisation or population breeding programmes (Mather and Jinks, 1982). The aims of this study were to study the underlying genetic pattern controlling disease resistance by determining the combining abilities, phenotypic correlations and yield of the cotton lines and identify suitable parents to be used in cotton breeding programme for the improvement of Verticillium wilt tolerance. MATERIALS AND METHODS The experiment was conducted at Cotton Research Institute (C.R.I) in Zimbabwe which lies at 18° 20′ South and 29° 54′ East at an altitude of 1156 m above sea level. The institute receives an average rainfall of 750 mm per annum and the temperature during the summer season averages 28oC maximum and 14°C minimum ranges (Mubvekeri and Nobanda, 2012). Five diverse upland cotton Zimbabwean genotypes (CRI-MS-1, CRI-MS-2, SZ9314, BC 853 and CIM1) developed by the Cotton Research Institute varying in year of release, verticillium wilt response and seed cotton yield traits (Table 1) were crossed in a half diallel mating fashion. The half diallel mating design which included parent lines was carried out in the greenhouse during the winter period of 2013. The genotypes were crossed to each other and the parent lines selfed but reciprocals excluded in a non-replicated crossing block with four pots per cultivar as shown in the layout in Table 2 as described by Isik (2009). The 10 F1 hybrids produced and their five selfed parents were evaluated under Verticillium wilt pressure in the greenhouse at C.R.I in 2014. The 15 genotypes were laid out in a randomised complete block design with three replications each. The plot sizes were composed of three pots containing single cotton plants that were spaced at 1m between rows and 0.3 m within rows. The blocking factor was shading imposed by one brick walled side of the greenhouse. Artificial inoculation of Verticillium wilt was done on the cotton plants to induce uniform infection in the plants at six weeks after crop emergence as follows: A collection of five cotton plants showing foliar symptoms of verticillium wilt were collected from the field at C.R.I. Leaves from these cotton plants were used for isolation of the pathogen by surface sterilising them using 1% Sodium hypochlorite and cleansed with running distilled water. Twenty small sections of 5 x 5 mm were then cut from the margin of the lesions on the leaves such that the leaf piece contained both the healthy and diseased leaf tissue. The five tissues samples were placed in a petri dish containing Potato Dextrose Agar prepared in an autoclave at 120°C for 20 min. Twenty petri dishes were prepared under a lamina airflow cabinet and they were incubated for 48 h at 26°C under dark conditions. Purification of the fungal growth was done by sub-culturing in Czapek Dox Broth media agar containing 3% solution of lactic acid to inhibit bacterial growth (Hillocks, 1991). Microsclerotia developed on the culture and the inoculum for each isolate was adjusted to a concentration of 2x10⁶ conidia/ml using repeated serial dilutions in distilled water. Six weeks old cotton seedlings were inoculated at the base of the plant using sewing needles dipped in the culture suspension as described by Mapope (2001). The fungal isolates used for inoculation had been cultured in the broth media for 48 h. Comparison of varietal performance of the genotypes under Verticillium wilt pressure was carried out on disease expression (infection scores), Vascular Brown Index (VBI), plant height, fruit retention and bolls per plant, boll weight and seed cotton yield expected per hectare. The severity of the disease and resistance was measured by means of scoring foliar symptoms and using VBI determined on the cross sectional discolouration of stems cut after harvesting according to the Fusarium and Verticillium Resistance Ranking Protocol for Cotton Varieties (2008), Australian Cotton CRC. The scoring system that was used was given in Tables 3 and 4. The general agronomic practices as recommended in the Cotton handbook (Mubvekeri and Nobanda, 2012) were carried out on the cotton crops. Seed cotton picking was done at the end of the season on the whole plot. The data recorded on disease infection score expression, Vascular Brown Index, plant height, fruit retention and bolls per plant, boll weight and seed cotton yield expected per hectare was subjected to analysis of variance (ANOVA) to test with the F-test using Genstat 14th edition statistical package from VSN International bioscience software and consultancy. Genetic analysis GCA and SCA were estimated based on the fixed model method II as described by Griffing (1956) as used by Machikowa et al. (2011) as follows: Xij = + gi + gj + sij Where Xij = the mean phenotypic value; = the general mean; gi gj, = GCA effects of the ith and jth parents respectively; sij = SCA effects of the cross i x j. The estimates of GCA and SCA parents and hybrids were obtained as: Chapepa et al. 41 Table 1. Cotton breeding material for the 5 x 5 half diallel mating design. CRI-MS-1 CRI-MS-2 SZ9314 Breeding centre C.R.I C.R.I C.R.I BC853 C.R.I *CIM1 C.R.I Cultivars Year release 2006 2006 1998 Parentage FW-91-3 x TE 93-10 FQ902 x MR-92-5 STAMF x BC853 A72bc3-78-35 DmMs73bc2-79-28 FQ902 x EU92-16 x of VW tolerance Good Fair Poor Boll weight Plant height Medium Large Very large Medium Medium-Tall Tall Yield (kg/ha) 2600 2300 2400 1995 Very good Medium Medium 1800 Pre-released Fair Medium Medium 2300 Cotton Research Institute variety catalogue, * Pre-released variety. Table 2. Half diallel mating layout. V1 V1 V2 V3 V4 V5 V2 X V3 X X V4 X X X V5 X X X X Design adopted from Isik F. (2009) in Analysis of Diallel Mating Design, x are the crosses that were done between the male and female rows, are selfed parents, V1 = CRI MS 1, V2 = CRI MS 2, V3 = SZ9314, V4 = BC 853 and V5 = CIM1. Table 3. Verticillium wilt infection foliar scoring system. Score 1 2 3 4 5 6 Description No symptoms Symptoms confined to vein discolouration or slight chlorosis Several leaves showing chlorosis Many leaves showing chlorosis some with necrotic areas Most leaves chlorotic some with severe necrosis usually some defoliation Whole plant affected, top most leaves necrotic and shedding of lower leaves Table 4. Verticillium wilt vascular brown infection scoring system. Score 0 1 2 3 4 GCA effects SCA effects Description No discolouration Discolouration restricted to small spots or an area less than 5% of the stem cross section Discolouration of between 5 and 20% of the stem cross section Discolouration of between 20 and 40% of the stem cross section Greater than 40% vascular discolouration of the stem cross section gi = 1/n(n-2)[nXi.-2X..] sij = Xij-1/n(n-2)(Xi+X.j) + 2/(n-1)(n-2)X.. Where Xi., X.j = means of the ith and jth parents respectively; X.. = grand mean; n = number of parent lines. GCA:SCA ratio was calculated using ratios of the mean squares of GCA and SCA. Correlation Phenotypic correlation estimates were calculated using the following formula as used by Lukonge in 2005: rp = covp/ p(x) p(y) 42 Afr. J. Agric. Res. Table 5. Means for plant height and fruit retention of cotton. Genotype CRI-MS-1 CRI-MS-2 SZ9314 BC853 CIM1 CRI-MS-1 x CRI-MS-2 CRI-MS-1 x SZ9314 CRI-MS-1 x BC853 CRI-MS-1 x CIM1 CRI-MS-2 x SZ9314 CRI-MS-2 x BC853 CRI-MS-2 x CIM1 SZ9314 x BC853 SZ9314 x CIM1 BC853 x CIM1 Grand Mean CV% P-value Plant height(cm) 130.7abcd 160.3f ab 124.7 152.7ef 137.2abcde 133.3abcde 133.2abcde 130.8abcd 126.9abc 141.9bcdef 131.1abcd 148.0def 145.4cdef 121.1a 145.0cdef 137.5 7.5 0.003 Fruit retention (%) 71.08cd 53.49a ab 57.83 abcd 65.49 67.27bcd 61.88abc 66.33abcd 63.94abcd 76.06d 61.93abc 61.85abc 58.26abc 63.77abcd 68.80bcd 62.32abc 64.02 10.4 0.047 Means in the same column followed by the same letter are not significantly different after separation by Duncan Multiple range Test (P<0.05). Where: rp = phenotypic correlation between characteristics x and y, covp = phenotypic covariance p(x) p(y) = the root of genetic variance of x and y respectively. Negative value of correlation coefficient (r) indicates dominant genes, while if its value was positive then recessive genes were responsible for the phenotypic expression of the trait. Genstat 14th edition statistical package was applied for correlation analysis. RESULTS Morphological traits Analysis of variance for the cotton lines revealed presence of significant differences on morphological characteristics (Table 5). The plant height was significantly different at P0.05 between the 15 cotton lines where CRI-MS-2 was taller than all the genotypes (160.3cm) but was comparable to BC853, the cross between CRI-MS-2 and SZ9314, the cross between SZ9314 and BC853 and the cross between BC853 and CIM1. The cross between SZ9314 and CIM1 yielded the shortest progeny (121.1 cm) and this was comparable to the parental lines SZ9314, CRI-MS-1, CIM1, the crosses CRI-MS-1 x CRI-MS-2, CRI-MS-1 x SZ9314, CRI-MS-1 x SZ9314, CRI-MS-1 x BC853, CRI-MS-1 x CIM1 and CRIMS-2 x BC853. Fruit retention among the 15 genotypes was significantly different (P0.05). The cross between CRIMS-1 x CIM1 retained most of its fruiting bolls and it was comparable to both parents CRI-MS-1 and CIM1 and also to BC853 and the crosses CRI-MS-1 x SZ9314 and CRI-MS-1 x BC853. CRI-MS-2 shedded most of its bolls as it had the lowest fruit retention percent along with the parental lines SZ9314 and BC853 as shown in Table 5. Yield and yield components Table 6 also shows varietal performance under the disease pressure in terms of number of bolls produced. The number of bolls per plant also did not vary largely for all the genotypes (P0.05). The boll number ranged between 12 and 19. There were also no noticeable differences on the average boll weight of the different cotton genotypes which ranged from 3 and 6 g to that which were used in the study (Table 6). There were significant differences in the mean squares of replications for this trait indicating the importance of blocking in this study. The seed cotton yield of the cotton lines under Verticillium wilt pressure varied largely as the results revealed that the yield means were significantly different at P<0.05 (Figure 1). The cross CRI-MS-1 x SZ9314 had significantly higher yield (2259 kg/ha) although it was comparable to two parent lines CRI-MS-1 and BC853 and six other crosses. The cross between CRI-MS-2 and BC853 yielded the least seed cotton (1296 kg/ha) but the yield was comparable to four parent lines (CRI-MS-2, SZ9314, BC853 and CIM1) and four other crosses. Analysis of variance on the 15 cotton genotypes developed in the diallel mating design revealed highly Chapepa et al. 43 Table 6. Means of number of fruiting branches, number of vegetative branches, number of bolls per plant and average boll weight of cotton genotypes. Genotype CRI-MS-1 CRI-MS-2 SZ9314 BC853 CIM1 CRI-MS-1 x CRI-MS-2 CRI-MS-1 x SZ9314 CRI-MS-1 x BC853 CRI-MS-1 x CIM1 CRI-MS-2 x SZ9314 CRI-MS-2 x BC853 CRI-MS-2 x CIM1 SZ9314 x BC853 SZ9314 x CIM1 BC853 x CIM1 Grand Mean CV% P-value Seed cotton yield (kg/ha) 2500 Number of bolls per plant 17.00 15.67 13.22 13.78 15.11 15.22 15.00 17.22 17.67 18.56 15.22 15.00 13.22 14.00 12.67 15.24 15.2 0.113 P-Value 0.008 Average boll weight (g) 4.33 3.83 4.83 4.83 4.50 5.00 5.50 4.50 5.00 4.67 4.67 4.67 5.00 5.00 5.50 4.79 12.5 0.163 CV 16.9% 2000 1500 1000 Yield (kg/ha) 500 0 Figure 1. Seed cotton yield (kg/ha) of 15 cotton lines under verticillium wilt conditions. Figure 1: Seed cotton yield (kg/ha) of 15 cotton lines under verticillium wilt conditions significance differences among the genotypes when exposed to the same inoculum level of Verticillium wilt disease (P0.001) in terms of foliar infection scores and vascular brown index scores as shown in Table 7. SZ9314 was affected the most with the disease as shown by the high infection score (3.07) and high vascular brown index score (2.67). The genotype was comparable to its cross with CRI-MS-1 (infection score of 2.67 and high vascular brown index score of 2.55) and CIM1 (infection score of 2.56 and high vascular brown index score of 2.77). CRI-MS-2 and BC853 were the most tolerant genotypes as shown by their low infection scores (1.22) and low vascular brown index scores (0.89 and 1.33 respectively). All the genotypes were infected by the 44 Afr. J. Agric. Res. Table 7. Means of Verticillium wilt infection scores and vascular brown index (VBI) scores on cotton. Genotype CRI-MS-1 CRI-MS-2 SZ9314 BC853 CIM1 CRI-MS-1 x CRI-MS-2 CRI-MS-1 x SZ9314 CRI-MS-1 x BC853 CRI-MS-1 x CIM1 CRI-MS-2 x SZ9314 CRI-MS-2 x BC853 CRI-MS-2 x CIM1 SZ9314 x BC853 SZ9314 x CIM1 BC853 x CIM1 Grand Mean CV% P-value Verticillium wilt infection scores 1.44ab 1.22a g 3.07 a 1.22 1.67abcd 1.89abcdef 2.67fg 1.33ab 2.33cdefg 1.67abcd 2.11bcdef 1.78abcde 1.56abc 2.56efg 2.44defg 1.93 11.0* <.001* Vascular Brown Index scores 0.78a 0.89ab c 2.67 ab 1.33 1.33ab 1.22ab 2.55c 1.33ab 1.33ab 1.11ab 1.44b 0.89ab 1.44b 2.77c 1.22ab 1.49 11.1* <.001* * Values obtained after transformation of data with the square root transformation. In the table above, means in the same column followed by the same letter are not significantly different after separation by Duncan Multiple range Test (P<0.05). Table 8. Mean squares for the GCA, SCA and GCA:SCA ratio for plant height and fruit retention of the cotton genotypes in the half diallel mating design. Source of variation DF Replication Genotypes GCA SCA Residual GCA:SCA 2 14 4 9 28 Plant height (cm) 624.5** 367.4* 653.96** 62.15 141.9 10.52 Mean squares Fruit retention (%) 0.99 93.10* 201.47** 18.48 41.70 10.90 Where DF =degrees of freedom, n = number of parents, r = replications, GCA = general combining ability, SCA = specific combining ability, * = P 0.05, ** = P 0.01. disease to some extent as indicated by varying scores. The Verticillium wilt scores ranged from 1.22 to 3.07 and the vascular brown index scores ranged from 0.78 to 2.77. Analysis of parents and F1s using the Griffing’s approach were employed to study the GCA effects and SCA effects for exploring the possibilities of isolating the best recombination related to Verticillium wilt resistance. Mean squares of GCA were significant for plant height, height to node ratio, fruit retention, number of fruiting branches, vascular brown index scores and the average boll mass at 0.01 significance level whilst Verticillium wilt infection scores was significant at 0.05 significance level (Tables 8 and 9). The significant mean square GCA effects indicated that additive genetic effect was controlling most of the characteristics. Mean squares of SCA were significant for vascular brown index scores at 0.05 significance level (Table 9) indicating non additive genetic effect influenced the expression of the scores. GCA effects The GCA contributions of each parent to the various characters influencing resistance against Verticillium wilt are shown in Table 10. Variability of the GCA was observed between the five parental lines with SZ9314 showing the highest positive GCA values for all the seven parameters tested. CRI-MS-1 which was the second best combiner, had positive GCA values for Verticillium wilt Chapepa et al. 45 Table 9. Mean squares for the GCA, SCA and GCA:SCA ratio for Verticillium wilt infection scores, vascular brown index scores, yield components, seed cotton yield of cotton genotypes in the half diallel design. Source of variation DF Replication Genotype GCA SCA Residual GCA:SCA 2 14 4 9 28 VWI 0.03 0.98*** 0.67* 0.25 0.17 2.68 VBI 0.36* 1.24*** 0.95** 0.27* 0.11 3.52 Mean square Bolls/plant 0.83 9.14 6.56 1.59 5.07 4.13 ABM 1.34* 0.54 1.51** 0.06 0.36 25.07 Yield (kg/ha) 82931 253220* 155936 93595 104476 1.67 Where VWI =Verticillium wilt infection, VBI = vascular brown index, ABM=average boll mass, DF =degrees of freedom, GCA = general combining ability, SCA = specific combining ability, * = P 0.05, *** = P 0.001. Table 10. General combining ability (GCA) effects for Verticillium wilt scores, vascular brown index scores, morphological traits and yield components. Genotype CRI-MS-1 CRI-MS-2 SZ9314 BC853 CIM1 VIS 0.001 -0.24 1.66 -0.10 -0.26 VIB -0.04 -0.40 1.95 -0.21 -0.16 FR% 3.84 -5.14 31.18 -0.11 3.25 PH -6.51 7.84 58.12 11.35 -0.27 Bolls/plant 1.18 0.88 4.98 -2.01 -0.13 ABM 0.08 -0.33 2.63 0.38 -0.29 Yield 101.20 -58.99 788.50 75.27 -258.05 Where VIS =Verticillium wilt infection, VIB = vascular brown index, FR% = fruit retention percentage, ABM=average boll mass, PH = plant height (cm). Table 11. Specific combining ability (SCA) effects for Verticillium wilt scores, vascular brown index scores, morphological traits, yield and yield components. Genotype CRI-MS-1xCRI-MS-2 CRI-MS-1xSZ9314 CRI-MS-1xBC853 CRI-MS-1xCIM1 CRI-MS-2xSZ9314 CRI-MS-2xBC853 CRI-MS-2xCIM1 SZ9314xBC853 SZ9314xCIM1 BC853xCIM1 VIS -0.04 0.74 -0.60 0.40 -0.03 0.42 0.09 -0.84 0.16 0.61 VIB -0.22 1.11 -0.11 -0.11 0.03 0.36 -0.19 -0.85 0.48 -0.06 FR% -5.98 -1.53 -3.92 8.20 3.05 2.97 -0.62 0.30 5.33 -1.59 PH 2.35 2.24 -0.20 -4.09 -3.44 -14.22 2.67 15.03 -9.30 -3.84 Bolls/plant -1.20 -1.42 0.80 1.25 2.45 -0.90 -1.11 -0.26 0.52 -0.56 ABM 0.13 0.63 -0.37 0.13 0.21 0.21 0.21 0.06 0.06 0.34 Yield -211.11 418.52 159.27 -470.36 282.40 384.26 208.33 347.01 35.34 37.04 Where VIS =Verticillium wilt infection, VIB = vascular brown index, FR% = fruit retention percentage, ABM=average boll mass, PH = plant height (cm). scores, fruit retention, bolls per plant, average boll mass and seed cotton yield. BC853 also had better GCA values on plant height, average boll mass and seed cotton yield. CRI-MS-2 had better combining abilities for plant height and number of bolls per plant. CIM1 had negative GCA effects for all the characteristics except for fruit retention. CRI-MS-2 and BC853 both had negative GCA effects on Verticillium wilt scores, vascular brown index scores and fruit retention. BC853 also had a negative GCA value for number of bolls per plant. SCA effects SCA estimates (Table 11) indicate that CRI-MS1xSZ9314 was a best cross (0.74) and SZ9314xBC853 46 Afr. J. Agric. Res. Table 12. Phenotypic correlation coefficients for Verticillium wilt infection scores, vascular brown index scores, morphological traits, yield and yield components in cotton. Variables Yield VBI VIS FR (%) Height Bolls/plant ABM Yield VBI 0.04 VIS -0.05 0.55*** FR (%) 0.17 0.14 0.10 Height (cm) 0.11 -0.41*** -0.42*** -0.38** Bolls/plant 0.23* -0.15 -0.17 0.26* -0.04 ABM 0.40*** 0.38** 0.46*** 0.14 -0.02 -0.20* VIS = Verticillium wilt infection scores, VBR = vegetative branches, VBI = vascular brown index, H:N = height to node ratio, FR = fruit retention, FB = fruiting branches, ABM = average boll mass, * = P 0.05, ** = P 0.01, *** = P 0.001. being the worst cross (-0.84) in terms of Verticillium infection scores. The vascular brown index scores also revealed the same (CRI-MS-1xSZ9314 having a positive SCA value of 1.11 and SZ9314xBC853 having a negative SCA value of -0.85). In terms of fruit retention, CRI-MS1xCIM1 proved to be the best combination with a positive SCA effect (8.20) and CRI-MS-1xCRI-MS-2 being the worst (-5.98). The plant height performance of the crosses revealed that SZ9314xBC853 was the best combination (15.03 SCA value) and the cross CRI-MS2xBC853 being the worst (-14.22). The cross CRI-MS2xSZ9314 was the best combination for the number of bolls per plant (2.45) and CRI-MS-1xSZ9314 being the worst (-1.42). For the average boll mass, all the crosses had positive SCA effects with the cross CRI-MS1xSZ9314 being the best (0.63) whilst CRI-MS-1xBC853 was the only cross with a negative SCA effect. The cross CRI-MS-1xSZ9314 had a superior SCA effect in terms of seed cotton yield (418.52) whilst CRI-MS-1xCIM1 was the worst combination (-470.36). Correlation Phenotypic correlations for most of the characteristics were positive and but not significant as shown in Table 12. Most of the characteristics that were negatively correlated were significant. Vascular brown index scores was significantly correlated to Verticillium wilt infection scores (0.55) at P 0.001. There was a significant positive correlation between the seed cotton yield and the number of bolls per plant (0.23) at P 0.05 and highly significant association between the seed cotton yield and the average boll mass (0.40) at P0.01. This indicate that average boll mass is important to cotton yield. Verticillium wilt infection scores had a high significant negative correlation with height (-0.42) at P 0.001. Fruiting retention was not highly associated with the plant height (-0.38). The seed cotton yield was positively correlated with all the traits except for Verticillium wilt infection scores where it had a negative association. DISCUSSION There were some noticeable level of variations observed for the morphological and yield components studied among the c Botton parental lines and their F1 progeny. The study revealed that selection of cotton lines under Verticillium wilt could be done for varietal resistance against the disease, plant height, fruit retention and seed cotton yield. The parental lines CRI-MS-1 and BC853 had better yields under the Verticillium wilt pressure. These findings are in agreement with the information indicated in the variety catalogue by Mudada and Muripira (2010) which showed that the varieties are resistant to the disease. These varieties can also be used as breeding material for varietal tolerance development programme against Verticillium wilt in cotton as indicated by superior crosses including at least one of the parental lines on almost all traits that were studied. Verticillium wilt infections and vascular brown index scores were highly significant indicating differences in genetic make-up of the parental lines and the F1 progeny in terms of reaction to disease infection. SZ9314 was the only parental line that was highly affected by the disease indicating the lack of dominant genes that supressed the progression of the disease in the cotton plants of the variety. The crosses involving this parental line with other tolerant varieties however yielded better performing progenies against the disease and better seed cotton yields in the presence of the diseases. Significant mean squares of the GCA effects that were observed revealed the presence of additive genetic effect controlling the expression of most of the traits that were studied except for the number of bolls per plant and seed cotton yield. This is in contrast with studies by Lukonge (2005) which revealed significant mean squares for bolls per plant and seed cotton yield which suggests that these could be used to improve yield under the disease pressure. The results from the diallel study also indicated that there was high mean square contribution of GCA effects to the total mean squares as revealed by GCA:SCA ratios greater than one which confirms the Chapepa et al. predominant role of additive gene effects to the role of non-additive gene effects for all the characteristics under study. These results were also obtained by El-Dahan et al. (2003). In this case normal, breeding methods such as backcross, pedigree or recurrent selection can be used to fix these additive genes. Significant mean squares of SCA for the vascular brown index scores indicated nonadditive genetic influence on the extent discolouration occurred on the vascular bundles due to disease infection. This is rather a product of genetic and environmental interactions where the amount of phytoalexins produced to avoid the upward movement of the pathogen are determined by the amount level of pathogen inoculum and temperature (Mysore and Ryu, 2004). The cotton parental lines used in this study varied for GCA estimates on all the parameters tested in the experiment. SZ9314 had positive GCA effects for all the traits that were studied indicating that it is a good combiner if used in breeding programmes for varietal tolerance development in cotton under Verticillium wilt conditions. This is in agreement with varietal performance of the crosses including the variety in terms of seed cotton yield, Verticillium wilt infection scores, vascular browning index scores and the other morphological traits. CRI-MS-1 had some characteristics that exhibited positive GCA estimates with vascular brown index, number of fruiting branches, plant height and height to node ratio having negative GCA values. This indicates that these traits are negatively correlated and could lead to challenges during breeding of varietal tolerance against Verticillium wilt. BC853 had five positive GCA estimates and five negative GCA estimates signifying the same challenge as noted for CRI-MS-1. These varieties however were the best performers in terms of combining ability if incorporated in breeding programmes that are targeted at reducing the impact of the disease in cotton especially if yield is to be considered. CRI-MS-2 and CIM1 had most negative GCA estimates for most characteristics indicating that they are poor combiners if used in breeding programmes. According to Griffing (1956), GCA estimates close to zero show that genotype does not differ much from the general mean of all crosses and positive and negative values indicate good and poor parent when used in the diallel. Positive and negative SCA estimates were observed in the crosses of cotton produced in the diallel mating system under Verticillium wilt conditions. Positive SCA effects were observed for crosses that included CRI-MS1, SZ9314 and BC853 parental lines for most of the characteristics. This is a confirmation that the parental lines can be used in the breeding programmes with high chances of improving the characteristics so that they can be fixed and used in the development of tolerant lines against Verticillium wilt. Lukonge (2005) suggested that self-pollinating crops like cotton fixes the additive by additive type of component at later stages of inbreeding. 47 In cotton breeding, the phenomenon of negative correlation exists whereby improvement of certain economic important traits results in breakdown of other traits (Mudada, 2013). This is the case with the results from this study where negative and positive correlation values where observed. The negative correlation of the Verticillium wilt infection scores with yield, plant height and number of bolls per plant will further derail the efforts of breeding for tolerance against the disease in cotton. However, these results suggest that the phenotypic variance for most of the characteristics was mostly additive and those with low values being non-additive. Conclusion Three parental cotton lines with high and positive GCA, namely CRI-MS-1, SZ9314 and BC853, and positive SCA combination value for the characteristics studied were identified in this study. This implies that varietal tolerance development in cotton can be carried out using parental lines with good combining abilities in terms of disease resistance and high yielding. The best hybrids that can be further advanced to fix the genes controlling the resistance traits were also identified in the form of the crosses CRI-MS-1xSZ9314, CRI-MS-1xBC853 and SZ9314xBC853. These were recommended for further use as breeding material through selfing in subsequent filial generations in the Verticillium wilt tolerance development programme. Conflict of Interest The authors have not declared any conflict of interest. REFERENCES Baffes J (2004). Tanzania’s cotton sector: Constraints and challenges in a global environment. African Region Working Paper Series No. 42. El-Dahan MAA, Leid EO, Lopez M, Gutierrez JC (2003). Combining Ability of Yield and Yield Components in Upland Cotton (Gossypium hirsutum) Under Drought Stress Conditions. Proceedings World Cotton Research Conference. Cape Town, South Africa. Griffing B (1956). Concept of general and specific combining ability in relation to diallel crossing system. Aust. J. Biol. Sci. 9:463-493. Hayman BI (1954). The theory and analysis of diallel crosses. J. Genet. 39:789-810. Hillocks RJ (1992). Cotton Diseases. London, UK: CAB International International Cotton Advisory Committee (ICAC) (2003). Assessment of the Impact of the Main Dynamics of Cotton Diseases Affecting in Particular Small-scale Production Systems in Southern and Eastern Africa. 1629 K Street NW, Suite 702, Washington, DC 20006 USA. International Cotton Advisory Committee (ICAC) (2012). World cotton situation. 1629 K Street NW, Suite 702, Washington, DC 20006 USA. International Cotton Advisory Committee (ICAC) (2014). World Prices High Despite Excess Production. 1629 K Street NW, Suite 702, Washington, DC 20006 USA. Isik F (2009). Analysis of Diallel Mating Designs. North Carolina State University, Raleigh, USA. Lukonge EP (2005). Characterisation and Diallel Analysis of Commercially Planted Cotton (Gossypium hirsutum L.) Germplasm in 48 Afr. J. Agric. Res. Tanzania. PhD Dissertation, University of the Free State, South Africa. Machikowa T, Saeteng C, Funpeng K (2011). General and Specific Combining Ability for Quantitative Characters in Sunflower. J. Agric. Sci. 3:1. Mapope N (2001). Verticillium Wilt Survey in Cotton Research Institute Annual Report, Department of Research and Specialist Services, Ministry of Agriculture, Zimbabwe. Mather K, Jinks JL (1982). Introduction to Biometrical Genetics. Chapman & Hall Ltd. London. McCarty JC, Jenkins JN. DOl: 10.1007/978-1-4613-3387-6 Meredith WR (1998). Continued Progress in Plant Breeding for Yield in the U.S.A. Proceedings World Cotton Research Conference Athens, Greece. pp. 97-101. Mubvekeri W, Nobanda S (2012). Cotton Agronomy. CRI, Bag 765, Kadoma, Zimbabwe. Mudada N (2013). Genotype by Environmental Interaction on Yield, Yield Components and Fibre Quality Parameters of Gossypium hirsutum varieties. MSc Dissertation, Midlands State University, Zimbabwe. Unpublished. Mudada N, Muripira V (2010). Cotton Variety Catalogue. Unpublished. Cotton Research Institute, P. Bag 765, Kadoma, Zimbabwe. Mysore KS, Ryu CM (2004). Non host resistance: how much do we know? Trends Plant Sci. 9(2):97-104. Vol. 10(2), pp. 49-57, 8 January, 2015 DOI: 10.5897/AJAR2014.8711 Article Number: D144C4949442 ISSN 1991-637X Copyright ©2014 Author(s) retain the copyright of this article http://www.academicjournals.org/AJAR African Journal of Agricultural Research Full Length Research Paper Eucalyptus grandis and Tagetes minuta leaf powders effectively protect stored maize against Sitophilus zeamais without affecting grain organoleptic properties Musundire R.*, Mazodze F., Macheka L., Ngadze R. T., Mubaiwa J. and Manditsera F. Chinhoyi University of Technology, Off Chirundu Road, Bag 7724, Chinhoyi, Zimbabwe. Received 26 March, 2013; Accepted 17 December, 2014 Use of plant compounds in grain protection has shown great potential as an alternative to synthetic insecticides in Sub-Saharan Africa. This study investigated the efficacy of Eucalyptus grandis and Tagetes minuta ground leaf powders as grain protectants against Sitophilus zeamais in stored maize. Effect of leaf powders were evaluated on percent germination, percent weight loss of grain, insect infestation, grain colour and odour over 192 days (≈six months) duration. Leaf powders (2.5 and 5 g/kg), synthetic pesticide (Actellic Chirindamatura dust (0.5 g/kg)) and an untreated control were used as treatments. All plant powders significantly minimized grain damage and infestation 96 days post treatment (≈three months) and had no effect on percent germination of maize grains when compared to controls. However, variable responses dependent upon botanical plant cultivars and rate of application were observed from three to six months after application. Grain colour and odour were not affected by plant powders over six months of storage. E. grandis and T. minuta significantly reduce grain damage and insect infestation with no adverse effects on seed germination, colour and odour hence can be used as sustainable alternatives to synthetic insecticides in maize storage especially by smallholder farmers. Key words: Sitophilus zeamais, efficacy, Eucalyptus grandis, Tagetes minuta, maize, organoleptic. INTRODUCTION Maize is one of the major cereal grain produced by most small holder farmers in the Sub-Saharan African region and is critical in stimulating economic growth (Adetunji, 2007). The seasonal nature of its production in many African countries where one rainy season is experienced per year necessitates the requirement for good maize storage systems (Owusu et al., 2007). However, maize storage is constrained by a number of factors which include attack from pathogens and insect pests. Insect pests are the major threat, destroying approximately 20 to 50% of stored maize in most African countries (CABI, 2012; Dhliwayo and Pixley, 2003; Nukenine et al., 2002; Derera et al., 2001; Golop and Hodges, 1982). In addition to destruction of grains by feeding and *Corresponding author. E-mail: [email protected], Tel: +263-(67) 22203-5/29053-5. Fax: +263 (67) 27214. Author(s) agree that this article remain permanently open access under the terms of the Creative Commons Attribution License 4.0 International License 50 Afr. J. Agric. Res. reproduction, insects cause an increase in grain temperature and moisture content. These lead to increased respiration and consequent loss in quality of the grain (Tefera et al., 2011; Caneppele et al., 2003). This also pre-disposes the grain to secondary attack by disease causing pathogens such as Aspergillus flavus Link leading to production of mycotoxins (Beti et al., 1995; Freer et al., 1990). The maize weevil, Sitophilus zeamais (Motschulsky) (Coleoptera: Curculionidae), is a serious pest of maize. In Zimbabwe, the postharvest losses due to S. zeamais have been recognized as an important constraint, with grain losses ranging from 20 to 90% being reported for stored untreated maize (Dhliwayo and Pixley, 2003). The grain damage caused affects both farmers and traders. S. zeamais larvae are internal feeders on the maize grains (CABI, 2012). Internal feeding affects seed viability thus negatively affecting seed germination where nonhybrid (retained seed) is used for new season planting. Different technologies such as environmental manipulations to hinder growth, maturation and reproduction of storage pests have been effectively used (Moreno-Martinez et al., 2000, Oduor et al., 2000; Peng et al., 2000; Toscano et al., 1999; Thorpe, 1997; Maier et al., 1996). Such environmental manipulations have been attained by employing a number of control measures, including the use of pesticides, cultural and physical control measures (CABI, 2012; Pereira et al., 2009). Pesticides are effectively used against postharvest insect pests but are often associated with a number of drawbacks (Mulungu et al., 2010; Huang and Subramanyam, 2007; Benhalima et al., 2004). Although S. zeamais can be effectively controlled by synthetic insecticides such as Shumba Super® 200G (Fenitrothion 1% Deltamethrin 0.13%) and Actellic Gold Chirindamatura® Dust (Pirimiphos-methyl 16 g/kg mass/mass and Thiamexotham 3.6 g/kg mass/mass) (Mashavakure, 2012; Mulungu et al., 2010) the majority of farmers in developing countries are resource poor and have neither the means nor the skill to obtain and handle pesticides appropriately (Kamanula et al., 2010). The increasing costs of application of the currently used synthetic pesticides, poor information and the often erratic supply of insecticides have emerged as the reasons for the farmers’ reluctance to use pesticides (Asawalam and Hassanali, 2006). The perception that pesticide residues in the food supply constitute a serious health risk and the development of insecticide resistance is a big concern in agricultural production. These concerns also raise a need for alternatives to grain protectants and eco-friendly insect pest control methods among which are the use of botanical pesticides (Asawalam and Arukwe, 2004; Bekele, 2002). A number of botanical grain protectants in powdered form are used to reduce weevil damages in Zimbabwe. These include Lippia javanica L. (Gadzirayi et al., 2006), Lantana camara L. (Fusire, 2008) and T. minuta (Muzemu et al., 2013) leaves. Several studies have investigated the efficacy of Eucalyptus spp. leaves as grain protectants with many showing a high degree of effectiveness against major storage pests such as S. zeamais (Muzemu et al., 2013; Mulungu et al., 2007; Modgil and Samuels, 1998). Similarly, several studies have investigated the insecticidal properties of T. minuta against storage pests (Muzemu et al., 2013; Shahzadi et al., 2010; Weaver et al., 1994). However, very few of these studies have investigated the effect of these often strong smelling botanical plants on treated grain properties. One of the major concerns regarding use of insecticidal plants to control grain storage pests is the perceived fear that these products can adversely affect the taste, aroma and overall acceptability of treated grain (Ogendo et al., 2004). This study evaluated both the insecticidal and organoleptic properties of ground powders of E. grandis and T. minuta in stored maize grain. Determination of efficacy of plants with pesticidal properties is one of the key steps in the bio-prospecting of new plant based compounds for grain protection. Although most recent advances in pesticidal plants research have gone to the extent of evaluating essential oils from these plant species and determining active compounds against storage pests, our study reports on an innovative approach to the use of plant based pesticides that can readily be implemented in traditional grain protection methods especially by resource poor farmers in sub-Saharan Africa. MATERIALS AND METHODS Grain Untreated maize grain was sourced from a single farmer in Mashonaland West Province of Zimbabwe (17°20'51"S 30°12'30" E). In the laboratory, grain was sieved to remove fluffy material and other foreign matter (Masiiwa, 2004). Any hidden infestation in the grain was removed by putting the grain in the oven at 40°C for four hours (Bekele, 2002). Disinfested grain was kept in a freezer at approximately -1°C to prevent further infestation. Grain treated in this manner was used to rear S. zeamais used in the experiments. For experimental purposes, grain was removed from the freezer and allowed to acclimatize at ambient temperature and relative humidity until it attained a moisture content of 12%. At the prevailing conditions (approximately 26°C and 40% relative humidity), this process took two days. Moisture content, the percent of broken and seed viability were assessed before commencement of experiments. Plant materials Fresh and healthy E. grandis leaves were collected from the GMB Aspindale campus (17° 50' S, 31° 03' E.) in Harare, Zimbabwe during the month of August, while T. minuta leaves were gathered from Warren Park herbal garden (17°51'50'' S, 31°1'47'' E) in Harare during the same period. Plant species identification was done before commencement of studies and at the Zimbabwe Musundire et al. National Botanic Gardens in Harare, Zimbabwe. Harvested leaves of T. minuta and E. grandis were spread and air dried under shade at room temperature of 27 to 30°C for 10 to 12 days respectively to minimize the degradation of volatile compounds. The dried leaves were ground to powder using a Thomas Wiley® laboratory mill, sieved through a 1.5 mm sieve to obtain a finer powder. Insects S. zeamais sourced from a pure colony maintained at the Department of Biological Sciences, University of Zimbabwe was reared on maize under ambient laboratory conditions (approximately 26°C and 40% relative humidity). Six hundred unsexed adult S. zeamais were reared in one-litre glass jars containing 300 g of uninfested maize grains. The top of each glass jar was covered with a cloth and fastened tightly with rubber bands. Insects were allowed to oviposit for 10 days after which all adult insects were removed through sieving (Tefera et al., 2011). Sieved grain was placed in clean jars and left for a period of 28 to 30 days during which emergence of adults was assessed by sieving the grain. At 27°C and relative humidity (RH) 65 ± 5% S. zeamais completed the life cycle in 28 days (Hill, 1987). Although the prevailing, RH in this study was lower (approximately 40%) adults emerged at approximately 30 ± 2 days. Emerging adult insects were collected and kept in separate jars according to their age. Adults that emerged on the same day were considered of the same age. New generations were sustained by the replacement of devoured grain with fresh and uninfested grain. Experiments were conducted using the first generation of insects reared on the same maize batch which was also used for experiments. Grain treatments Across all the six treatments, 10 kg samples of maize grain were used. The treatments were E. grandis, T. minuta, Actellic Chirindamatura® dust (16 g/kg Pirimiphos-methyl + 3 g/kg Permethrin) at 0.5 g/kg (positive treatment) and an untreated control being the negative control; each replicated three times. The ground leaf powders were applied evenly throughout the grains at two rates (2.5 and 5 g/kg) converting to 25 g/10 kg and 50 g/10 kg respectively. Mixing was done manually. A total of 40 randomly selected insects per 10 kg sample were used as initial infestation. Grain sample analyses Initial sub-samples were taken at the beginning of the experiment and subsequent sampling was done at 32 days (approximately one month) intervals for a period of 192 days (approximately six months). All samples of the requisite mass were collected at each sampling time using a sampling spear drawing grain from different positions of each bag. The sub-samples were analyzed in the laboratory to determine grain weight loss (%), number of live insects, seed germination (%), grain colour and odour. Live infestation A procedure by Chikukura et al. (2011) with modifications was used to estimate insect infestations in the experiment. One kilogram subsample was weighed and sieved trough a 1.5 µm sieve. Live insects were physically counted and recorded after every 32 days for 192 days. A variety of botanical plants or their extracts have been shown to cause a number of insect population depressing 51 effects such as mortality (Wanyika et al., 2009), anti-feeding (Liu et al., 2002), repellence and anti-oviposition (Ukeh and Umoetok, 2011; Ukeh et al., 2011) when applied against storage insect pests. For this study indirect assessments of these effects were assessed by estimating the population of the resultant progeny of infested insects. Under the prevailing experimental conditions (Hill, 1987) estimated a life cycle period of 28 days. Our assessments were therefore done after every 32 days to capture the population of newly emerging adults. Grain samples and insects were returned to the respective treatments after assessments. New independent samples were drawn from respective treatments in subsequent assessments. Weight loss Sub-samples were assessed for damage caused by insect infestations every 32 days for 192 days. Two hundred gram subsamples were weighed using an Adams® scale. The weight and number of undamaged and insect damaged grains were assessed and used to calculate the percentage grain weight loss using the method described by Gwinner et al. (1996). Weight loss (%) = UNd - DNu × 100/U (Nd + Nu) Where U = weight of undamaged grains; D = weight of insect damaged grains; Nu = number of undamaged grains and Nd = number of damaged grains. Seed germination percentage The effect of treatments and storage duration on seed viability was investigated over a six month grain storage period. An initial sample of 500 g from the undamaged grains was subdivided using a riffle divider and a working sample of 100 g was obtained for the seed germination tests (Chikukura et al., 2011). The sub-samples were germinated on moistened filter paper (Whatman No. 1) in Petridishes with three replicates. The germination trays were maintained under laboratory conditions of 27 ± 2°C and approximately 40% relative humidity. The number of emerged seedlings from the trays were counted and recorded after seven days. The percentage germination was computed as follows: % seed viability = (NG × 100) / TG Where NG = number of seeds that germinated and TG = total number (=100) of test seeds placed in each tray (Uke et al., 2011). Grain colour and odour The change in grain colour and odour of the treated and untreated samples was assessed three times namely at the beginning of the storage period, three and six months after grain treatment. The subsamples were drawn from treated grain and cleaning by blowing off the residual particles using a fan. Samples were assessed for change in odour and colour by use of a scoring scale of 1 to 5 that was defined separately for each of the two parameters (Ogendo et al., 2004). Scoring for change in grain odour was done according to the following scale: 1: Grain is odourless, 2: Grain has little offensive odour, 3: Grain has moderately offensive odour, 4: Grain has offensive odour, 5: Grain has very offensive odour making it unacceptable for human consumption. Scoring for change in grain colour was done using a scale of 1 to 5 as follows: 1: No detectable change in colour, 2: Slight change in colour, 3: Moderate change in colour, 4: Great change in colour , 5: 52 Afr. J. Agric. Res. Mean number of insects per grain sample 1 month 2 months 3 months 4 months 5 months 6 months 35 30 25 20 15 10 5 0 TG 5 TG 2.5 EUC 5 EUC 2.5 CON 1 CON 2 Grain treatment and application rate (g/kg) Figure 1. Change in live infestation of treated grain over a six months storage period: T. minuta (TG 5, TG 2.5) (g/kg), E. grandis (EUC 5, EUC 2.5) (g/kg), Actellic Chirindamatura dust (CON 1), untreated control (CON 2). Error bars indicate significant differences (P<0.01) among treatments. There was significant interaction between type of botanical plant, concentration and storage duration. Highly significant change making grain unacceptable for human consumption. Each sample was coded and presented in a well-lit and ventilated laboratory room for assessment. A panel consisting of 15 independent assessors scored for change in grain colour and odour (Ogendo et al., 2004). Assessors were allowed into the assessment room, one at a time to ensure independence of scores. Blank scoring sheets were used for each assessment date to ensure that there is no bias due to previous data. Data analysis Repeated measurements on total insect count, weight loss (%), and percentage germination were obtained. All the data collected were first homogenized using appropriate logarithmic transformations (Log X + 1.5 for live infestation and insect damage and arcsine X for percent germination) to normalize them before being subjected to analysis of variance (ANOVA) and Generalized Linear Models in SAS statistical software (SAS-2006-2008). Descriptive statistics were used to evaluate grain colour and odour. RESULTS Live infestation Across all the grain treatments, storage duration had significant effect (F5, 72 = 376.20, P<0.05) on the number of live insects in the grain samples. Tagetes minuta applied at a rate of 5 g/kg showed no significant effect (P>0.05) in the number of live insects 96 days (approximately (≈) three months)) after treatment. However, significant increases in insect numbers occurred from 128 to 192 days (≈month four to six) (Figure 1). The highest mean live infestation (24 insects/kg) was recorded 192 days (≈six months) after treatment. Application of T. minuta at 2.5 g/kg also showed no significant differences 96 days after treatment. An application rate response between 5 and 2.5 g/kg only occurred from 128 days (month four) after treatment, with a rate of 5 g/kg showing significantly (P< 0.05) lower numbers of live insects (Figure 1). At both application rates, that is, 5 and 2.5 g/kg, T. minuta consistently showed significantly higher (P<0.05) number of live insects in the grain samples compared to Actellic Chirindamatura® dust (positive control) for the entire study period. However, compared to the untreated control, T. minuta applications showed significantly lower (P<0.05) live insects in grain samples (Figure 1). E. grandis applied at a rate of 5 g/kg showed no significant effect (P>0.05) in the number of live insects for the first 96 days after treatment. However, significant increases in insect numbers occurred from 128 to192 days post treatment. The highest mean live infestation (16 insects/kg) was recorded 192 days after treatment. Application of E. grandis at 2.5 g/kg also showed no significant differences 96 days (three months) after treatment. An application rate response between 5 and 2.5 g/kg only occurred from 96 to 160 days (month three to five) after treatment, with a rate of 5 g/kg showing significantly (P< 0.05) lower numbers of live insects (Figure 1). There was no significant (P>0.05) difference in Mean insect damage (%) Musundire et al. 20 18 16 14 12 10 8 6 4 2 0 TG 5 0 TG 2.5 1 EUC 5 2 3 EUC 2.5 4 5 CON 1 53 CON 2 6 Month after treatment Figure 2. Insect damage (%) on treated grains: T. minuta (TG 5, TG 2.5) (g/kg), E. grandis (EUC 5, EUC 2.5) (g/kg), Actellic Chirindamatura dust (CON 1), untreated control (CON 2). Error bars indicate significant differences (P<0.01) among treatments. Level of insect damage was dependent on type of botanical plant, concentration and storage duration. live insects in grain samples after 192 days of application of E. grandis at both application rates. Compared to Actellic Chirindamatura® dust, E. grandis applied at 5 g/kg showed the same level of control (P>0.05) until 160 days (≈ five months) after application and when applied at 2.5 g/kg, it controlled to the same level until 96 days after application. At both application rates, that is 5 and 2.5 g/kg, E. grandis consistently showed significantly lower (P<0.05) number of live insects in the grain samples for the entire study period compared to the untreated control (Figure 1). E. grandis applications showed significantly lower (P<0.05) live insects in grain samples compared to T. minuta applications even when applied at half the application rate (Figure 1). However, there was no significant (F25, 72 = 1.29, P = 0.206) interaction between the different grain treatments and storage duration for the live insect infestation. Weight loss There was a significant (F6, 84 = 4966.49, P<0.05) decrease in grain weight with storage period across all treatments. The highest mean percent weight loss was 17.5% on the untreated control. There were significant (F5, 84 = 507.68, P<0.05) effects attributed to different forms of grain treatment types and application rates over the 192 days (≈ six months) storage period. There were also significant interaction effects (F30, 84 = 88.29, P<0.05) between grain treatments and storage duration. After 96 days post treatment, minimal damage was observed across all treatments, however, with a slight increase in the untreated control. From 128 days (≈ four months) onwards, T. minuta applied at 2.5 g/kg had the same level of weight loss as the untreated control, while powders from the same plant cultivar applied at 5 g/kg showed significantly (P<0.05) lower weight loss compared to half the application rate. E. grandis plant powders applied at both 2.5 and 5 g/kg showed significantly lower (P<0.05) weight loss compared to T. minuta application rates and untreated control and to the same low level as the positive control Actellic Chirindamatura ® dust (Figure 2). Significantly higher (P<0.05) weight loss were recorded across all treatments from 160 days post treatment up to the end of the experiment (Figure 2). An application rate response was observed for both T. minuta and E. grandis applications. Half the maximum application rates correspondingly showed significantly (P<0.05) higher weight loss in the grain samples (Figure 2). At the end of the experiment, that is, 192 days (≈ six months) of storage, E. grandis leaf powders applied at 5 g/kg maize gave the same level of control as Actellic Chirindamatura ® dust while half this application rate showed significantly lower P<0.05) weight loss compared to T. minuta treatments and untreated control. Germination percentage There were significant differences (F2, 36 = 20.09, P = 0.01132) due to the effect of storage duration on the germination percentage of the grains. Treated grain 54 Afr. J. Agric. Res. Table 1. Effects of plant treatments on percent germination over a six month grain storage period after treatment using various concentrations of botanical plants and controls. Treatment Rate (g/kg) Tagetes minuta T. minuta Eucalyptus grandis E. grandis Actellic dust Untreated control 2.5 5 2.5 5 0.5 0 0 aA 98.33± 0.33 aA 98.33±0.33 aA 98.33± 0.33 98.33± 0.33aA 98.33± 0.33aA aA 98.33± 0.33 Months after treatment 3 aA 97.67± 0.33 abA 98.33± 0.33 bA 98.67± 0.33 97.67± 0.33aA 97.33± 0.33aB bA 98.67± 0.33 6 aB 96.67± 0.33 aB 96.67± 0.33 aB 97.33± 0.33 98.00 ± 0.33bA 96.67±0.33aB aB 96.67± 0.33 2Within columns for a given mean % germination (comparison among grain treatments within the same month), means followed by the same lower case are not significantly different; within rows, for a given mean % germination, means followed by the same capital letter are not significantly different (comparison between storage periods) at P<0.05 (Tukey’s Studentized Test (HSD)) Table 2. Modal panelist scores for grain colour and odour on quality evaluations conducted after three and six months after grain treatment using various concentrations of botanical plants and controls. Treatment T. minuta T. minuta E. grandis E. grandis Actellic dust Untreated control Rate (g/kg) 2.5 5 2.5 5 0.5 0 Modal panelist score Colour Odour 3 months after 6 months after 3 months after 6 months after treatment treatment treatment treatment 1 1 1 1 1 1 1 1 1 1 2 2 1 1 2 2 1 1 1 1 1 1 1 1 Scores for odour based on scale of 1 to 5. 1, Grain is odourless; 2, grain has little offensive odour; 3, grain has moderately offensive odour, 4, grain has offensive odour; 5, grain has very offensive odour and unacceptable for human consumption; scores for colour bas ed on scale 1 to 5; 1, no detectable change in colour; 2, slight change in colour; 3, moderate change in colour; 4, great change in colour; 5, hi ghly significant change making grain unacceptable for human consumption. Modal scores are derived from assessment by six trained p anelists. stored for 192 days had generally lower percentage germination across all plant powder treatments. After 96 days of storage, grain treated with T. minuta at 2.5 g/kg, E. grandis 5 g/kg and untreated control showed significantly higher (P<0.05) percent germination compared to the rest of the treatments (Table 1). However, there were no significant treatment (F5, 36 =1.76, P= 0.1468) and storage duration by treatment interaction effects on the percent germination of grains. The mean percent germination across treatments varied from 98% (E. grandis at 2.5 g/kg) to 96.7% (T. minuta 5 g/kg, Actellic Chirindamatura dust and untreated control) (Table 2). Grain quality parameters All panelists scored 1 for grain odour at beginning of the experiment indicating that grain were odourless. They also gave a score of 1 for grain colour indicating uniform grain colour at the beginning of the experiment. After 96 days post treatment, the modal score for colour was 1 (no detectable change in colour) and 1 for odour (grain was oudourless) for grain treated with T. minuta (Table 2). However, grain treated with E. grandis at both application rates had a modal odour score of 2, indicating that grain had little offensive odour. This was the case at both assessments periods (96 and 192 days post application (Table 2). DISCUSSION During the first three months, treatment of grain using plant leaf powders and the recommended insecticide resulted in mortality of live insects found on the grain but failed to kill larvae that were inside grain kernels. This is confirmed by the higher number of insects per grain Musundire et al. sample and grain damage in the untreated grain samples compared to those treated with Actellic Chirindamatura ® dust and different plant powder treatment rates. Several plant powders have been reported to be effective in protecting stored grain products for periods of at most 24 weeks (six months) (Kamanula et al., 2010). Although there was a notable increase in live insect infestation and weight loss of grain treated with plant powders especially for T. minuta, from three to six months after grain treatment, comparison with the untreated grains still indicated that that grain treated with plant powders was better protected against S. zeamais than untreated grain. E. grandis treatments showed significantly higher levels of efficacy compared to T. minuta treatments at both application rates. Several studies have indicated efficacy of leaf powders and essential oils of most Eucalyptus spp. against many insect species including storage pests (Muzemu et al., 2013; Rajendran and Sriranjini, 2008; Mulungu et al., 2007; Talukder, 2006; Modgil and Samuels, 1998). Eucalyptus spp leaf powders for example, were shown to protect wheat grain against insect pests (Sitophilus oryzae (L.) Coleoptera: Curculionidae), Sitotroga cereallella (Olivier) Lepidoptera: Gelechiidae) and Tribolium castaneum (Herbst) (Coleoptera: Tenebrionidae) for five months while essential oils of Eucalyptus camaldulensis and E. leucoxylon were shown to be lethal to the dates pest carob moth Ectomylois ceratoniae (Zeller) (Lepidoptera: Pyralidae) (Ben-Jemâa et al., 2013; Modgil and Samuels, 1998). On the other hand, although T. minuta treatments showed less efficacy compared to E. grandis treatments and the positive Atellic Chirindamatura dust, the use of these powders and essential oils and extracts has been recorded to be effective on Callosobruchus maculatus (Fabricius) Coleoptera: Bruchidae) (Shahzadi et al., 2010, Weaver et al., 1994). However, within the scope of the current study, T. minuta applications still showed significant degree of efficacy against S. zeamais compared to untreated control. Plant powders from this plant species can still be used to control S. zeamais where E. grandis is not available. In the current study, the results of E. grandis powders applied at both 2.5 and 5 g/kg confirm their efficacy in storage pest management and against S. zeamais when compared to the untreated grains and grains treated with a recommended commercial insecticide. This result is of significance in relation to the small-scale farmers throughout the sub-Saharan African region who continue to have problems with grain protection in storage. Subsistence farmers often lack financial resources to purchase recommended pesticides for grain protection. Traditional methods using E. grandis could offer a safer, low cost and more dependable method of maize storage while reducing the need to use excessive amounts of conventional pesticides. However, these results as 55 obtained in this study need to be validated in large scale field studies before they can be widely adopted by farmers. Farmers often need information on botanicals to support their decision making with respect to reliability of control of particular plant material to reduce insect infestation (Belmain and Stevenson, 2001). Findings from this study give an insight on the degree to which the use of plant powders can readily be used at farm level (effective application rates and expected period of grain protection). This data coupled with further field scale studies can be packaged in the same way conventional pesticides efficacy data is provided. The efficacy levels and variation over the entire six month grain storage period of E. grandis and T. minuta plant powders observed in this study could be attributed to different plant constituents such as essential oils and alkaloids which impart pesticidal properties to the plants (Manenzhe et al., 2004). It was expected from this study that as storage period of treated grain increased the efficacy of the plant powders also decreased as most the compounds volatilize and degrade from the plant powders as observed by Bekele and Hassanali (2001). The study to a greater extent demonstrated this as more insect infestation and damage was obtained after three months of grain storage. Seed germination percentage was not significantly affected by plant treatments and the concentration rates. Some small scale farmers in Zimbabwe often use retained seed (stored hybrid and open pollinated varieties) for planting. Seed quality is the prerequisite condition that affects the germination and hence the yield of the crops (Msuya and Stefano, 2010). Some studies have also demonstrated that oils and leaf powders of several plant species have no adverse effects on the germination of maize grain when applied as grain protectants (Manezhe et al., 2004; Ogendo et al., 2004). This attribute of E. grandis and T. minuta is therefore of benefit where retained seed is used and also where germination of grain is required as in the traditional brewing processes. One of the reported major constraint for widespread use of botanical plants and their essential oils is the effect of residues on food commodities (Rajendran and Sriranjini, 2008). In the current study, grain colour and odour were not significantly altered due to plant powder treatments. These results contradict the general farmer perception that botanical plant powders impart an offensive odour to maize grain (Ogendo, 2000). Application of T. minuta and E. grandis at 5 g/kg applied to grain did not significantly alter grain colour and odour, which are important parameters in perception or consumer preferences. This could be an indication that constituents from the botanical plant powders were not absorbed by the grains as observed by Jayasekara et al. (2005). However, it should be emphasized that end users of this technology need to remove leaf powders by 56 Afr. J. Agric. Res. winnowing to minimize plant powders being incorporated into the maize meal. Grain cleaning by winnowing is a widespread postharvest practice by most smallholder farmers in Zimbabwe. Hence, use of plant powders that requires cleaning before grain is processed for consumption will not result in extra labour input. Conclusion Plant powders of E. grandis and T. minuta can be used as natural pesticides in maize storage and can significantly reduce grain damage and live insect infestation with no adverse effects on seed germination, colour and odour. For the purposes of the adoption of this technology, E. grandis should be air dried and ground into powder and admixed with grain at 5 g/kg as a single application at the beginning of the storage season. Protection can be guaranteed for six months. However, for T. minuta application rates of 5 g/kg or more are recommended. The plant materials are effective over a short storage period therefore effective use may be achieved by reapplication of the powders after every three months. E. grandis and T. minuta leaf powders offer promise as alternatives to the synthetic pesticides and may be used to retard the development of insect resistance to widely used conventional insecticides. Conflict of Interest The authors have not declared any conflict of interest. ACKNOWLEDGEMENTS The authors thank the Grain Marketing Board of Zimbabwe (GMB) for providing laboratory facilities for these studies and I. Chidemo (GMB) for assistance in the preparation of laboratory studies. We thank two anonymous referees for their constructive comments. REFERENCES Adetunji M (2007). Economics of maize storage techniques by farmers in Kwara State, Nigeria. Pakistan J. Soc. Sci. 4:442-450. Asawalam EJ, Arukwe UE (2004). Effect of Combination of some plant powders for the control of Sitophilus zeamais. Nigeria Agric. J. 35:7685. Asawalam E, Hassanali A (2006). Constituents of the essential oil of Vernonia amygdalina as maize weevil) protectants. Trop. Subtrop. Agroecosyst. 6:95-102. Bekele AJ (2002). Evaluation of the toxicity potential of Milletia ferruginea (Hochest) Baker against Sitophilus zeamais Motsch. Int. J. Pest Manage. 48:29-32. Bekele AJ, Hassanali A (2001). Blend effects in the toxicity of the essential oil constituents of Ocimum kilmandscharicum and O. kanyense on two postharvest insect pests. Phytochemistry 57:385391. Belmain S, Stevenson P (2001). Ethnobotanicals in Ghana: reviving and modernising age-old farmer practice. Pestic. Outlook 12:233-238. Benhalima H, Chaundry HMQ, Mills KA, Price NR (2004). Phosphine resistance in stored-product insects collected from various grain storage facilities in Morocco. J. Stored Prod. Res. 40:241-249. Ben-Jemâa JM, Haouel S, Khouja ML (2013). Efficacy of Eucalyptus essential oils fumigant control against Ectomyelois ceratoniae (Lepidoptera: Pyralidae) under various space occupation conditions. J. Stored Prod. Res. 53:67-71. Beti JA, Phillips TW, Smalley EB (1995). Effects of maize weevils (Coleoptera: Curculionidae) on production of aflatoxin B 1 by Aspergillus flavus in stored corn. J. Econ. Entomol. 88:1776-82. CABI (2012). Sitophilus zeamais data sheet. Last updated. 11 September 2012. Accessed on 18 Novemeber 2014. Caneppele MAB, Caneppele C, Lazzari FA, Lazzari SMN (2003). Correlation between the infestation level of Sitophilus zeamais Motschulsky, 1855 (Coleoptera, Curculionidae) and the quality factors of stored corn, Zea mays L. (Poaceae). Revista Brasileira de Entomologia, Curitiba. 47:625-630. Chikukura L, Mvumi BM, Chikonzo R, Chenzara C (2011). Evaluation of selected indigenous pesticidal plant powders against stored maize and cowpeas insect pests. Afr. Crop Sci. Conf. Proc. 10:189-192. Derera J, Giga DP, Pixley VK (2001). Resistance of maize to the maize weevil: II, Non-preference. Afr. Crop Sci. J. 9:441-450. Dhliwayo T, Pixley KV (2003). Divergent selection for resistance to maize weevil in six maize populations. Crop breeding, genetics and cytology. International Maize and Wheat Improvement Center (CIMMYT), Harare, Zimbabwe. Crop Sci. 43:2043-2049. Freer MW, Siebenmorgen TJ, Couvillion RJ, Loewer OJ (1990). Modelling temperature and moisture content changes in bunkerstored rice. Trans. ASAE. 33:211-220. Fusire M (2008) Integrated Pest Management: Cost-saving techniques for smallholder farmers. Community Technology Development Trust, pp. 1-36. Gadzirayi CT, Mutandwa E, Chikuvire TJ (2006). Effectiveness of maize cob powder in controlling weevils in stored maize grain. Afr. Stud. Q. 8:22-26. Golop P, Hodges R (1982). Study of an outbreak of Prostephanus truncatus (Horn) in Tanzania. Tropical Product Institute, London, England.16:23. Gwinner J, Harnisch R, Muck O (1996). Manual of the prevention of post-harvest grain losses. Deutsche Gesellschaft für Technische Zusammenarbeit (GTZ) GmbH. P. 338. Hill DS (1987). Agricultural insect pest of temperate regions and their control, Cambridge University Press, London P. 659. Huang F, Subramanyam B (2007). Effectiveness of spinosad against seven major stored-grain insects of corn. Insect Sci. 14:225-230. DOI 10.1111/j1744-7917.2007.00148.x. Jayasekara TK, Stevenson PC, Hall DR, Belmain SR (2005). Effect of volatile constituents from Securidaca longepedunculata on insect pests of stored grain. Chem. Ecol. 31:304-311. Kamanula J, , Sileshi GW, Belmain SR, Sola P, Mvumi BM, Nyirenda GKC, Nyirenda SP, Stevenson PC (2010). Farmer’s insect pest management practices and pesticidal plant use in the protection of stored maize and beans in Southern Africa: Int. J. Pest Manage. 57:41-49. Liu ZL, Xu YJ, Wu J, Goh SH, Ho SH (2002). Feeding deterrents from Dictamnus dasycarpus Turcz against two stored product insects. J. Agric. Food Chem. 50:447-1450. Maier DE, Adams WH, Throne JE, Mason LJ (1996). Temperature management of the maize weevil, Sitophilus zeamais Motsch. (Coleoptera: Curculionidae), in three locations in the United States. J. Stored Prod. Res. 32:255-273. Manenzhe NJ, Potgieter N, Mabinya LV (2004). Antimicrobial activities of volatile components of Lippia javanica. Phytochemistry 65:23332336. Mashavakure N (2012). Pest status of the Larger grain borer, Prostephanus trancatus (Horn) (Coleoptera: Bostrichidae) in Zimbabwe and an assessment of the inherent susceptibility of selected maize varieties to the pest. MSc Thesis University of Zimbabwe. Moreno-Martinez E, Jiménez S, Vázquez ME (2000). Effect of Musundire et al. Sitophilus zeamais and Aspergillus chevalieri on the oxygen level in maize stored hermetically. J. Stored Prod. Res. 36:25-36. Modgil R, Samuels R (1998). Efficacy of mint and eucalyptus leaves on the physic-chemical characteristics of stored wheat against insect infestation. Food/Nahrung 42:304-308. Mulungu LS, Lupenza G, Reuben SOWM, Misangu RN (2007). Evaluation of botanical products as stored grain protectant against maize weevil, Sitophilus zeamais (L.), on maize. J. Entomol. 4:258262. Mulungu LS, Kubala MT, Mhamphi GG, Misangu R, Mwatawala MW (2010) Efficacy of protectants against maize weevils (Sitophilus zeamais Motschulsky) and the larger grain borer (Prostphanus truncatus Horn) for stored maize. Int. J. Plant Sci. 1:150-154. Masiiwa P (2004). Evaluation of the African diatomaceous earths (DEs) as potential maize grain protectants against the maize weevil Sitophilus zeamais. BSc degree honours thesis. University of Zimbabwe. Muzemu S, Chitamba J, Mutetwa B (2013). Evaluation of Eucalyptus tereticornis, Tagetes minuta and Carica papaya as stored maize grain protectants against Sitophilus zeamais (Motsch.) (Coleoptera: Curculionidae). Agric. Forest. Fish. 2:196-201. Msuya DG, Stefano J (2010). Responses of Maize (Zea mays) Seed germination capacity and vigour to seed selection based on size of cob and selective threshing. World J. Agric. Sci. 6:683-688. Nukenine EN, Monglo B, Awasom I, Ngamo LST, Tchuenguem FFN, Ngassoum MB (2002). Farmers’ perception on some aspects of maize production, and infestation levels of stored maize by Sitophilus zeamais in the Ngaoundere region of Cameroon. Cam. J. Biol. Biochem. Sci.12:18-30. Oduor GI, Smith SM, Chandi EA, Karanja LW, Agano JO, Moore D (2000). Occurrence of Beauveria bassiana on insect pests of stored maize in Kenya. J. Stored Prod. Res. 36:177-185. Ogendo JO (2000). Evaluation of insecticidal and repellent properties of Lantana camara and Tephrosia vogelli Hook against the maize grain weevil in maize grain storage in Kenya. J. Food Technol. Afr. 5:2936. Ogendo JO, Deng AL, Belmain SR, Walker DJ, Musandu AAO (2004). Effect of insecticidal plant materials, Lantana camara L. and Tephrosia vogelii Hook, on the quality parameters of stored maize grains. J. Food Technol. Afr. 9:29-36. Owusu EO, Osafo WK, Nutsukpu FR (2007). Bioactivities of candlewood solvent extracts against two stored product insects. Afr. J. Sci. Technol. 8:17-21. Peng WK, Lee TK, Liao JF (2000). Distribution of phosphine in bins storing bagged sorghum after application of aluminium phosphate. Chin. J. Entomol. 20:45-55. Pereira C, Pereira E, Cordeiro E, Lucia TD, Tótola M, Guedes R (2009). Organophosphates resistance in the maize weevil, Sitophilus zeamais (Coleoptera: Curculionidae): magnitude and behavior. Crop Prot. 28:168-173. 57 Rajendran S, Sriranjini V (2008). Plant products as fumigants for stored product insect control. J. Stored Prod. Res. 44:126-135. SAS Institute Inc. (2006-2008). SAS/STAT, Version 9.1. Software Cary, NC, USA. Shahzadi I, Hassan A, Khan UW, Shah MM (2010). Evaluating biological activities of the seed extracts from Tagetes minuta L. found in Northern Pakistan. J. Med. Plants Res. 4: 2108-2112. Talukder FA (2006). Plant products as potential stored-product insect management agents-A mini review. Emirates J. Agric. Sci. 18:17-32. Tefera TM, Mugo S, Ikhayo P, Tende R (2011). Effects of insect population density and storage time on grain damage and weight loss in maize due to the maize weevil Sitophilus zeamais and the larger grainborer Prostephanus truncatus. Afr. J. Agric. Res. 6:2249-2254. Thorpe GR (1997). Modelling ecosystems in ventilated conical bottomed farm grain silos. Ecol Modell. 94:255-286;36. Toscano LC, Boica AL Jr, Lara FM, Waquil JM (1999). Resistencia e mecanismos envolvidos em genotipos de milho em relacao ao ataque do gorgulho, Sitophilus zeamais Mots. (Coleoptera: Curculionidae). An. Soc. Entomol. Bras. 28:141-146. Ukeh DA, Adie EB, Uke JA (2011). Insecticidal and repellent activities of pepper fruit Dennettia tripetala (G. Baker) against the cowpea beetle Callosobruchus maculatus (Fabricius). Biopestic. Int. 7:15-23. Ukeh DA, Umoetok, SBA (2011). Repellent effects of five monoterpenoid odours against Tribolium castaneum (Herbst) and Rhyzopertha dominica (F.) in Calabar, Nigeria. Crop Prot. 30:13511355. Wanyika HN, Kareru PG, Keriko JM, Gachanja AN, Kenji GM, Mukiira NJ (2009). Contact toxicity of some fixed plant oils and stabilized natural pyrethrum ex‐tracts against adult maize weevils (Sitophilus zeamais Motschulsky). Afr. J. Pharm. Pharacol. 3:066-069. Weaver DK, Wells CD, Dunkel FV, Bertsch W, Sing SE, Sriharan S. (1994). Insecticidal activity of floral, foliar, and root extracts of Tagetes minuta (Asterales: Asteraceae) against adult Mexican bean weevils (Coleoptera: Bruchidae). J. Econ. Entomol. 87:1718-1725. Vol. 10(2), pp. 58-66, 8 January, 2015 DOI: 10.5897/AJAR2014.8873 Article Number: 1EA9BBE49444 ISSN 1991-637X Copyright ©2014 Author(s) retain the copyright of this article http://www.academicjournals.org/AJAR African Journal of Agricultural Research Full Length Research Paper Moisture dependent physical properties of nigella seeds R. K. Singh1, 2*, R. K. Vishwakarma3, M. K. Vishal1, S. K. Singh2 and V. K. Saharan3 1 National Research Centre on Seed Spices, Ajmer-305206, India. Central Potato Research Station, Sahaynagar, Patna-801506, India. 3 Central Institute of Post-Harvest Engineering and Technology, Abohar-152116, India. 2 Received 27 May, 2014; Accepted 17 December, 2014 A study on the nigella seeds (Ajmer Nigella-1) was performed to investigate the effect of seeds moisture content on their physical properties as these are very important to design post harvest equipments. The physical properties of the nigella were evaluated as a function of moisture contents in the range of 5.2 to 25.1% dry basis (d.b.). Seed geometric parameters such as average length, width, thickness, geometric mean diameter, volume, increased with the increase in seed moisture, except seed sphericity and surface area, which remain unchanged as statistically non-significant. The 1000-seed mass increased linearly with increase in moisture. Bulk density and true density of nigella decreased when seed moisture content was raised from 5.2 to 25.1% d.b. The porosity of nigella increased up to 19.9% moisture content and then decreased slightly. The angle of repose and coefficients of static friction on four different surfaces (plywood, mild steel, galvanized iron and glass) and terminal velocity increased with seed moisture. Key words: Nigella sativa, physical properties, frictional properties, seed spices. INTRODUCTION Nigella (Nigella sativa L.) is an annual herb belonging to the family Ranunculaceae. The plants are erect growing to a height ranging from 30 to 60 cm. Stems are branched and leaves are alternate, 2.5 to 3 cm long, blade is pinnately dissected into thin sub linear lobs usually described as feathery. Flowers are pale blue, which turned to white in later stage. The fruit is a capsule that turns into yellow brown at maturity. Seeds are black trigonous, regulose and tubercular. The seed of nigella is used to add taste and flavour in meat, vegetable dishes, pickles and other edibles. Seeds are sprinkled on naan breads before baking. The seeds contain 0.5 to 1.4% essential oil which has demand in the pharmaceutical and perfume industry. Nigella seeds are also known for its health promoting benefits and used as a medicinal grain (in traditional medicines) and as a food ingredient in several countries, including Egypt, Syria, Jordan and Iran (D’Antuono et al., 2002). The seed or its paste mixed with honey is commonly used as flavoring agent in bread and cheese (Merfort et al., 1997). The nigella oil has been reported to exhibit anti-tumor (Worthen et al., 1998), antioxidant (Burits and Bucar, 2000), anti-inflammatory *Corresponding author. E-mail: [email protected], Tel: +916122224218. Fax: +916122223706. Author(s) agree that this article remain permanently open access under the terms of the Creative Commons Attribution License 4.0 International License Singh et al. (Houghton et al., 1995), and antibacterial (Morsi, 2000) activities. It has stimulatory effect on the immune system (Salem and Hossain, 2000). For efficient processing operation, it is essential to have the knowledge of moisture dependent physical properties such as spatial dimensions, bulk density, true density, and porosity of nigella for better design of storage structures, processing equipments, and processes. The frictional properties and aerodynamic properties of food materials are important for the design of efficient oil extraction, dehulling and hull separation machines. In the literature, physical properties of various crop seeds such as pumpkin (Joshi et al., 1993), cumin (Singh and Goswami, 1996), pigeon pea (Baryeh and Mangope, 2002), okra seed (Sahoo and Srivastava, 2002), caper seed (Dursun and Durson, 2005), sweet corn (Coskun et al., 2006), red kidney beans (Isik and Unal, 2007), chickpea seeds (Nikoobin et al., 2009), rice (Shittu et al., 2009), locust bean seed (Sobukola and Onwuka, 2010) and guar (Vishwakarma et al., 2010) have been reported. Selected engineering properties of soybean (Deshpande et al., 1993), locust bean seed (Olajide and AdeOmowage, 1999), faba bean (Haciseferogullari et al., 2003), cocoa (Bart-Plange and Baryeh, 2003), faba bean (Altuntas and Yildiz, 2007), and barbunia seed (Cetin, 2007) have also been studied in the moisture content range of 18.33 to 32.43% (d.b.). Gharib-Zahedi et al. (2010) and Zewdu (2011) studied some moisture dependent engineering properties of black cumin and Ajwain seeds, respectively. Limited published literature is available on the physical properties of nigella seed as a function of moisture content. The present study was, therefore, aimed to determine moisture dependent physical properties such as spatial dimensions, geometric mean diameter, sphericity, surface area, volume, 1000-seed mass, bulk density, true density, porosity, angle of repose, static coefficient of friction and terminal velocity of nigella seeds (Ajmer Nigella-1) between 5.1 and 25.2% (d.b.) moisture range, which should be helpful in designing handling, processing and packaging equipments for nigella. MATERIALS AND METHODS The nigella seeds of variety Ajmer Nigella-1 were arranged from National Research Centre on Seed Spices, Ajamer (Rajasthan), India. Seeds were cleaned manually to remove all impurities such as dust, chaffs, stones, insects and damaged or unhealthy seeds. Initial moisture content of the seeds was determined using standard hot air oven drying method at 105±1°C for 24 h (AOAC, 1980). Test samples of the desired moisture contents were prepared by adding measured amount of distilled water to achieve the required moisture contents followed by thorough mixing and sealing in LDPE bags. The conditioned samples were kept at 5°C in a refrigerator for 7 days to allow uniform distribution of moisture throughout the sample. Desired quantity of seeds was taken out from the bags and held at room temperature (22 to 25°C) for 2 h before conducting the test (Carman, 1996; Deshpande et al., 1993; Singh and Goswami, 1996; Cetin, 2007). The physical properties were determined at five 59 moisture levels at 5.1, 10.2, 15.0, 19.9, and 25.2% (d.b.). All the experiments were replicated five times (except measurement of dimensions for which 100 seeds were taken randomly at each moisture content) and the average values used in the analysis. To determine the average size of nigella, 100 seeds were randomly selected and length (L), width (W), and thickness (T) of the seeds were measured using a digital micrometer ((least count 0.01 mm; Mitutoyo Corporation, Japan). The arithmetic mean diameter (Da), geometric mean diameter (D g), sphericity (φ) and volume (V) were calculated by using the following relationships (Mohsenin, 1986; Jain and Bal, 1997): D a (L W T)/3 (1) D g (LWT)1/3 (2) (LWT)1/3 L V = πB2L2/6(2L –B) (3) (4) Where, B = (WT) 0.5 (5) The surface area (As) was determined by analogy with a sphere of same geometric mean diameter using the following relationship (Mohsenin, 1986): As D g2 (6) To determine the mass of 1000 seeds (Mt), about 250 seeds were taken randomly and weighed (M) on an electronic balance (least count 0.001 g). Then the number of seeds (n) in the sample was counted (Deshpande et al., 1993). The mass of 1000 seeds was calculated as; Mt M 1000 n (7) Bulk density ( b) was determined following the procedure reported by Singh and Goswami (1996) by filling a 500 ml cylinder with the seeds from a height of 150 mm at a constant rate and then weighing the contents. The seeds were not compacted during the test. True density ( t) was determined using the toluene displacement method. Toluene was used in place of water because the seed absorbed toluene to a lesser extent than that of water and because of its low surface tension shallow dips in seeds were filled and with low dissolution power (Mohsenin, 1986). The volume of toluene displaced was found by immersing a weighed quantity of nigella in the toluene (Mohsenin, 1986; Singh and Goswami, 1996). The bed porosity (ε) of the bulk is the ratio of spaces in the bulk to its bulk volume. The ε was calculated using the following equation (Mohsenin, 1986). ρ t 1 - b 100, ρ (8) To determine angle of repose (θ), a plywood box of 10×10×10 cm size with a removable front panel was used. The box was filled with 60 Afr. J. Agric. Res. Table 1. Dimensional properties of Nigella (Ajmer Nigella-1) at different moisture content (%, d.b.). Particulars Length (mm) Width (mm) Thickness (mm) Arithmetic mean diameter (mm) Geometric mean diameter (mm) Sphericity 2 Surface area (mm ) 3 Volume (mm ) 5.08 2.63±0.12a* 1.42±0.09a a 0.99±0.06 1.68±0.06a a 1.55±0.05 0.59±0.02a a 1.09±0.09 a 1.26±0.14 Moisture content (%, d.b.) 10.17 15.04 19.91 2.64±0.19ab 2.69±0.12b 2.77±0.22b 1.46±0.11ab 1.50±0.11bc 1.53±0.11c a a ab 1.02±0.05 1.02±0.09 1.03±0.07 ab bc 1.71±0.08 1.74±0.07 1.78±0.10cd ab b bc 1.58±0.06 1.60±0.07 1.63±0.09 a a 0.60±0.03 0.59±0.02 0.59±0.03a a a a 1.13±0.13 1.11±0.08 1.10±0.11 ab bc cd 1.34±0.16 1.40±0.17 1.48±0.24 25.23 2.82±0.18b 1.56±0.13c b 1.05±0.08 1.81±0.07d cd 1.66±0.07 0.59±0.04a a 1.10±0.14 d 1.56±0.22 *:Figures in a row followed with different superscripts are significant (p<0.05). seeds and the front panel was quickly removed allowing the seeds to flow and assume a natural slope (Joshi et al., 1993; Paksoy and Aydin, 2004). The diameter (D) and height (H) of the slope were recorded. The angle of repose (θ) was calculated by using the following equation. 2H D tan 1 (9) nigella seeds at selected moisture contents are reported in Table 1. The L, W, T, Da, Dg, and V values increased significantly (p<0.05) with moisture content. The geometric mean diameter of the seed was found more than that of its width and thickness. The relationship between L, W, T and Dg and moisture content (m) can be represented by the following equations. (R2 = 0.95) (11) W = 1.393 + 0.007 m (R2 = 0.99) (12) (R2 = 0.91) (13) L = 2.559 + 0.01 m The static coefficient of friction (µ), a dimensionless quantity required for calculating the friction force, was determined on four different surfaces; plywood, mild steel, galvanized iron and glass. These materials are commonly used for handling and processing of nigella and construction of storage and drying bins. For determination of µ, a wooden box of 100-mm length, 100-mm width and 40-mm height without base and lid was filled with the sample and placed on an adjustable tilting plate, faced with the test surface. The sample container was raised slightly (0.5 to 1.0 mm) so as not to touch the surface. The inclination of the test surface was increased gradually with a screw device until the box just started to slide down and the angle of tilt (α) was read from a graduated scale. The μ was taken as the tangent of this angle (Dutta et al., 1988; Joshi et al., 1993; Singh and Goswami, 1996). tan (10) Terminal velocity was measured using a cylindrical column in which the material was suspended in the air stream (Nimkar and Chattopadhyay, 2001; Vishwakarma et al., 2010). The minimum air velocity, which held the seeds under suspension, was recorded using a digital anemometer (±0.1 m/s) (Joshi et al., 1993). The data analysis of this study was carried out by using the Statistca 6 software. The differences between the mean values of physical characteristics of nigella samples were tested for significance using t-test. The relationship between moisture content and physical properties of nigella seeds was determined using linear regression analysis. T = 0.985 + 0.002 m Dg = 1.518 + 0.006 m (R2 = 0.99) (14) The sphericity and surface area of the nigella remained unchanged with increase in moisture content (Table 1). Seed mass (for 1000 seed) Change in 1000-seed mass of nigella seeds with moisture content is shown in Figure 1. The 1000-seed mass increased linearly from 2.39 to 2.81 g (17.60% increase) with increase in moisture content from 5.1 to 25.2%. The relationship between 1000-seed mass and moisture content can be expressed by the following relationship. Mt = 2.284 + 0.021 m 2 (R = 0.99) (15) Bulk density Geometrical parameters Bulk density of nigella seeds decreased from 552.50 to 3 482.29 kg/m (12.71% decrease) with increase in moisture content from 5.1 to 25.2% (Figure 2). Variation of bulk density with moisture content can be expressed as: Dimensional characteristics, surface area and volume of ρb = 594.16 - 8.77 m + 0.17 m2 RESULTS (R2 = 0.99) (16) Singh et al. 61 2.9 Thousand seed mass, g 2.8 2.7 2.6 2.5 2.4 2.3 2.2 2.1 2 0 5 10 15 20 25 30 Moisture content, % d.b. Figure 1. Effect of moisture content on 1000-grain weight of nigella seeds (R2=0.99, bars show standard deviation from mean). 570 560 Bulk density, kg.m-3 550 540 530 520 510 500 490 480 470 0 5 10 15 Moisture content, % (d.b.) 20 25 30 Figure 2. Effect of moisture content on bulk density of nigella seeds (R 2 =0.99, bars show standard deviation from mean). True density bulk density at all moisture contents. True density of nigella decreased from 1113.43 to 1054.28 kg/m3 (5.31% decrease) with increase in moisture content (Figure 3).The variation of true density mass with moisture content can be expressed as: ρt = 1130.40 - 2.86 m 2 (R = 0.98) (17) The true density of the nigella was higher than that of Bed porosity Bed porosity of nigella increased from 50.37 to 54.78% at 19.9% moisture content and then decreased slightly to 54.25% at 25.2% moisture content (d.b.) as shown in Figure 4. The variations in ε with moisture content was significant (p<0.05). The variation of porosity with 62 Afr. J. Agric. Res. 1120 True density, kg.m-3 1110 1100 1090 1080 1070 1060 1050 0 5 10 15 20 Moisture content, % (d.b.) 25 30 Figure 3. Effect of moisture content on true density of nigella seeds (R 2=0.98, bars show standard deviation from mean). 57 55 Porosity, % 53 51 49 47 45 0 5 10 15 20 Moisture content, % (d.b.) 25 30 Figure 4. Effect of moisture content on porosity of nigella seeds (R 2=0.98, bars show standard deviation from mean). 2 Ө = 22.52 + 0.43 m (R = 0.99) moisture content can be expressed as: ε = 46.85 + 0.75 m - 0.02 m2 (R2 = 0.98) (18) Angle of repose Angle of repose of nigella seeds increased linearly from 24.4 to 33.23º with moisture content (Figure 5). Variation of angle of repose with moisture content can be expressed as: (19) Coefficient of static friction Variation of static coefficient of friction for nigella seeds on four surfaces (plywood, mild steel, galvanized iron and glass) with moisture content are presented in Figure 6. The static coefficient of friction increased significantly (p<0.05) with moisture content for all the surfaces. This was due to the increased adhesion between the seeds Singh et al. 63 35 Angle of repose,0 32 29 26 23 20 0 5 10 15 20 Moisture content, % (d.b.) 25 30 Figure 5. Effect of moisture content on angle of repose of nigella seeds (R2 =0.99, bars show standard deviation from mean). Static coefficient of friction 0.9 0.8 0.7 0.6 Plywood 0.5 Mild Steel 0.4 0.3 Galvanised Iron 0.2 Glass 0.1 0.0 0 5 10 15 20 Moisture content, % (d.b.) 25 30 Figure 6. Effect of moisture content on static coefficient of friction of nigella seeds (bars show Standard Deviation from mean). and the material surfaces at higher moisture values. The static coefficient of friction ranged from 0.50 to 0.65, 0.59 to 0.78, 0.27 to 0.70 and 0.26 to 0.77, respectively for plywood, mild steel, galvanized iron and glass surfaces, respectively in the experimental moisture content range. Variation of μ with moisture content of nigella can be expressed mathematically as follows: μpb = 0.478 + 0.006 m (R2 = 0.92) (20) 2 μms = 0.538 + 0.009 m (R = 0.99) μgi = 0.148 + 0.022 m (21) (R2 = 0.96) μg = -0.053 + 0.059 m - 0.001 m2 (R2 = 0.92) (22) (23) Where μpb, μms, μgi, and μg are static coefficient of friction of nigella seeds against plywood, mild steel, galvanized iron and glass surfaces, respectively. 64 Afr. J. Agric. Res. 3.5 Terminal velocity, m/s 3.2 2.9 2.6 2.3 2.0 0 5 10 15 20 25 30 Moisture content, % (d.b.) Figure 7. Effect of moisture content on terminal velocity of nigella seeds (bars show standard deviation from mean). The coefficient of friction at all moisture contents was highest on mild steel. The μ increased drastically with increase in moisture content beyond 15%, except for plywood. It showed that the material would tend to stick in hoppers at higher moisture contents and tendency of sticking to the surface might be observed. The μ of the nigella seeds increased with increase in moisture content for all the surfaces under study. The seeds may become rougher and sliding characteristics are diminished at higher moisture contents so that the static coefficient of friction is increased. Terminal velocity Terminal velocity (Vt) of nigella seeds exhibited significant increase (p<0.05) from 2.49 to 3.33 m/s as the moisture content increased from about 5.2 to 25.1% (d.b.) (Figure 7). The relationship between terminal velocity and moisture content is represented as: Vt = 2.375 + 0.017 m + 0.001 m2 (R2 = 0.99) (24) DISCUSSION The L, W, T, Da, Dg, and V values increased significantly (p<0.05) with moisture content. The linear increase in spatial dimension was probably due to expansion resulted from moisture uptake by grain in the intercellular space in the seeds. This indicated that drying of nigella at higher moistures should result in shrinkage due to decrease in seed dimensions. Increase in seeds dimensions for black cumin, ajwain, soybeans and pigeon pea have been reported by Gharib-Zahedi et al. (2010), Zewdu (2011), Deshpande et al. (1993) and Baryeh and Mangope (2002), respectively. The geometric mean diameter of the seed was found more than that of its width and thickness. The sphericity and surface area of the nigella remained unchanged with increase in moisture content (Table 1). Zewdu (2011), Deshpande et al. (1993) and Sobukola and Onwuka (2010) reported increase in sphericity of ajwain, soybean and locust bean seeds, respectively. The 1000-seed mass increased linearly from 2.39 to 2.81 g (17.60% increase) with increase in moisture content from 5.1 to 25.2%. Similar results have been reported for barbunia beans (Cetin, 2007), black cumin (Gharib-Zahedi et al., 2010), locust bean seed (Sobukola and Onwuka, 2010), ajwain (Zewdu, 2011) and guar seeds (Vishwakarma et al., 2010). Bulk density of nigella seeds decreased from 552.50 to 3 482.29 kg/m (12.71% decrease) with increase in moisture content from 5.1 to 25.2%. This decrease was due to the higher rate of increase in volume relative to the increase in weight. Similar relationships have been reported for chickpea (Konak et al., 2002), locust bean seed (Sobukola and Onwuka, 2010) and black cumin (Gharib-Zahedi et al., 2010). However, increase in bulk density with moisture content was reported for cashew Singh et al. nut (Balasubramanian, 2001). Zewdu (2011) reported non-significant decrease in bulk density of ajwain seeds. True density of nigella decreased from 1113.43 to 3 1054.28 kg/m (5.31% decrease) with increase in moisture content. The decrease in true density with increase in moisture content was mainly due to the significant increase in volume, which was higher than the corresponding increase in the mass of the material. The behaviour of true density with moisture content is contradictory as reported in the literature. Increase in true density with moisture content has been reported by Singh and Goswami (1996), Altuntas and Yildiz (2007) and (Gharib-Zahedi et al., 2010) for cumin, faba bean, and black cumin, respectively. These seeds have lower volume change in comparison to change in weight with moisture content. However, Tunde-Akintunde and Akintunde (2007), Cetin (2007) and Zewdu (2011) have reported that the true density of beni seeds, barbunia seeds and ajwain decreased with increased moisture content. The true density of the nigella was higher than that of bulk density at all moisture contents. Bed porosity of nigella increased from 50.37 to 54.78% at 19.9% moisture content and then decreased slightly to 54.25% at 25.2% moisture content (d.b.). The variations in ε with moisture content was significant (p<0.05). Increase in porosity with moisture content was reported by Singh and Goswami (1996), Altuntas and Yildiz (2007) and (Gharib-Zahedi et al., 2010) for cumin, faba bean and black cumin seeds, respectively. However, Zewdu (2011), Tunde-Akintunde and Akintunde (2007), Joshi et al. (1993), and Shepherd and Bhardwaj (1986) have reported decrease in porosity of ajwain, beniseeds, pumpkin and pigeon pea seeds, respectively with increased moisture content. Higher porosity values provide better aeration and water vapor diffusion during deep bed drying and the data may be utilized for design of aeration system. Angle of repose of nigella seeds increased linearly from 24.4 to 33.23º with moisture content. Similar behavior has been observed for cumin, black cumin, and guar seeds (Singh and Goswami, 1996; Gharib-Zahedi et al., 2010; Vishwakarma et al., 2010). At higher moisture content, seeds tend to stick together, causing less flowability and angle of repose is increased. The data may be useful for design of hoppers, and storage bins for the nigella. The static coefficient of friction increased significantly (p<0.05) with moisture content for all the surfaces. This was due to the increased adhesion between the seeds and the material surfaces at higher moisture values. The static coefficient of friction ranged from 0.50 to 0.65, 0.59 to 0.78, 0.27 to 0.70 and 0.26 to 0.77, respectively for plywood, mild steel, galvanized iron and glass surfaces, respectively in the experimental moisture content range. The coefficient of friction at all moisture contents was highest on mild steel. The μ increased drastically with increase in moisture content beyond 15%, except for plywood. It showed that the material would tend to stick in 65 hoppers at higher moisture contents and tendency of sticking to the surface might be observed. The order of decrease in coefficient of friction reported for cumin seeds (Singh and Goswami, 1996), karingda seeds (Suthar and Das, 1996) and locust bean seed (Sobukola and Onwuka, 2010) was plywood followed by mild steel and galvanized iron. However, Amin et al. (2004) have reported that no variation existed between plywood and galvanized iron for lentil seeds. The μ of the nigella seeds increased with increase in moisture content for all the surfaces under study. The seeds may become rougher and sliding characteristics are diminished at higher moisture contents so that the static coefficient of friction is increased. Terminal velocity (Vt) of nigella seeds exhibited significant increase (p<0.05) from 2.49 to 3.33 m/s as the moisture content increased from about 5.2 to 25.1% (d.b.). Singh and Goswami (1996), Baryeh and Mangope (2002), Isik and Unal (2007), and Gharib-Zahedi et al. (2010) have reported a linear increase in terminal velocity with moisture content for cumin, pigeon pea, white speckled kidney beans and black cumin, respectively. The increase in terminal velocity with increase in moisture content within the study range can be attributed to the increase in mass of the individual seed per unit frontal area presented to the airflow. Conclusions The physical properties of nigella seeds are function of moisture content. The following conclusions are drawn from this investigation on physical properties of nigella seeds for the moisture content range of 5.2 to 25.1% (d.b.): (1) The length, width, thickness, geometric mean diameter and volume of seed increased with moisture content whereas sphericity and surface area remained unchanged. (2) The thousand seed mass increased from 2.39 to 2.81 g with the increase in moisture content from 5.1 to 18.75% w.b. (3) The bed porosity increased from 50.37 to 54.78 at 19.9% moisture content and then decreased slightly to 54.25 at 25.2% moisture content (d.b.). (4) The bulk density decreased linearly from 552.50 to 482.29 kg/m3 whereas the true density decreased from 3 1113.43 to 1054.28 kg/m with increase in moisture content. (5) The terminal velocity increased from 2.49 to 3.33 m/s and angle of repose increased from 24.4 to 33.23° in the moisture range from 5.2 to 25.1% (d.b.). (6) The static coefficient of friction increased on four structural surfaces namely, galvanized iron sheet (0.27 to 0.70), mild steel (0.59 to 0.78), glass surface (0.26 to 0.77) and plywood (0.50 to 0.65) in the moisture range 66 Afr. J. Agric. Res. from 5.1 to 18.75% w.b. Conflict of Interest The authors have not declared any conflict of interest. ACKNOWLEDGEMENT The authors are thankful to Director, Central Institute of Post-Harvest Engineering and Technology, Ludhiana141004 (Punjab), for his kind cooperation and help provided during the course of study. REFERENCES Altuntas E, Yildiz M (2007). Effect of moisture content on some physical and mechanical properties of faba bean (Viciafaba L.) grains. J. Food Eng. 78(1):174-183. Amin MN, Hossain MA, Roy KC (2004).Effect of moisture content on some physical properties of lentil seeds. J. Food Eng. 65:83-87. th AOAC (1980). Official Methods of Analysis, 13 Ed., Association of Official Analytical Chemists, Arlington, VA. Balasubramanian D (2001). Physical properties of raw cashew nut. J AgrEng Res.78:291-297. Bart-Plange A, Baryeh EA (2003). The physical properties of category B cocoa beans. J. Food Eng. 60(3):219-227. Baryeh EA, Mangope BK (2002).Some physical properties of QP-38 variety pigeon pea. J. Food Eng. 56:59-65. Burits M, Bucar F (2000).Antioxidant activity of Nigella sativa essential oil. Phytother. Res. 14:323-328. Carman K (1996).Some physical properties of lentil seeds. J. Agric. Eng. Res. 63(2):87-92. Cetin M (2007). Physical properties of barbunia bean (Phaseolus vulgaris L. cv. ‘Barbunis’) seed. J. Food Eng. 80:353-358. Coskun MB Yalcin I, Ozarslan C (2006). Physical properties of sweet corn seed (Zea mays saccharata Sturt.). J. Food Eng. 74(4): 523528. D’Antuono LF, Moretti A, Lovato AFS (2002). Seed yield, yield components, oil content and essential oil content and composition of Nigella sativa L. and Nigella damascena L. Ind. Crop Prod.15:59-69. Deshpande SD, Bal S, Ojha TP (1993). Physical properties of soybean. J. Agric. Eng. Res. 56(2):89-98. Dursun E, Durson I (2005).Some physical properties of caper seed. Biosyst. Eng. 92(2):237-245. Dutta SK, Nema VK, Bhardwaj RJ (1988). Physical properties of gram. J. Agric. Eng. Res. 39:259-268. Gharib-Zahedi SMT, Mousavi SM, Moayedi A, Garavand AT,Alizadeh SM (2010).Moisture-dependent engineering properties of black cumin (Nigella sativa L.) seed. AgricEngInt: CIGR J. 12(1):194-202. Haciseferogullari H, Gezer I, Bahtiyarca Y, Menges HO (2003). Determination of some chemical and physical properties of Sakizfaba bean (Viciafaba L. Var. major). J. Food Eng. 60(4):475-479. Houghton PJ, Zarka R, Heras BD, Hoult JRS (1995). Fixed oil of Nigella sativa and derived thymoquinone inhibit eicosanoid generation in leukocytes and membrane lipid peroxidation. Planta Med. 61:33-36. Isik E, Unal H (2007). Moisture-dependent physical properties of white speckled red kidney bean grains. J. Food Eng. 82:209-216. Jain RK,Bal S (1997).Physical properties of pearl millet. J. Agric. Eng. Res.66:85-91. Joshi DC, Das SK, Mukherjee RK (1993).Physical properties of pumpkin grains. J. Agr. Eng. Res. 54(3):219-229. Konak M, Carman K, Aydin C (2002).Physical properties of chick pea seeds. Biosyst. Eng. 82:73-78. Merfort I, Wray V, Barakat HH, Hussein SAM, Nawwar MAM, Willuhn G (1997). Flavonoid triglycerides from seeds of Nigella sativa. Phytochemistry 46:359-63. Mohsenin NN (1986).Physical properties of plant and animal materials. Gordon and Breach Science Publishers, New York. Morsi NM (2000). Antimicrobial effect of crude extracts of Nigella sativa on multiple antibiotics-resistant bacteria. ActaMicrobiol. Pol. 49:6374. Nimkar PM, Chattopadhyay PK (2001).Some physical properties of green gram. J. Agric. Eng. Res. 80(2):183-189. Nikoobin M, Mirdavardoosti F, Kashaninejad M, Soltani A (2009).Moisture-dependent physical properties of chickpea seeds. J. Food Process Eng. 32:544-564. Olajide JO, Ade-Omowage BIO (1999). Some physical properties of locust bean seed. J. Agric. Eng. Res. 74:15-22. Paksoy M, Aydin A (2004). Some physical properties of edible squash (Cucurbitapepo L.).J Food Eng. 65:225-231. Sahoo PK, Srivastava AP (2002).Physical properties of okra seeds. Biosyst. Eng. 83(4):441-448. Salem ML, Hossain MS (2000). In vivo acute depletion of CD8 (+) T cells before murine cytomegalovirus infection up regulated innate antiviral activity of natural killer cells. Int. J. Immunopharmaco. 22:707-718. Shepherd H, Bhardwaj RK (1986).Moisture dependent physical properties of pigeon pea. J. AgrEng. Res. 35:227-234. Singh KK, Goswami TK (1996). Physical properties of cumin seed. J. Agric. Eng. Res. 64(2):93-98. Shittu TA, Olaniyi MB, Oyekanmi AA, Olkeleye KA (2009). Physical and water absorption characteristics of some improved rice varieties. Food Bioprocess Tech. DOI 10.1007/s/11947-009-0288-6. Sobukola OP, Onwuka VI (2010). Effect of moisture content on some physical properties of locust bean seed (Parkiafillicoidea L.). J. Food Process Eng. DOI:10.1111/j.1745-4530.2009.00511. Suthar SH, DAS SK (1996).Some physical properties karingda seeds. J. Agric. Eng. Res.64:93-98. Tunde-Akintunde TY, Akintubde BO (2007).Effect of moisture content and variety on selected properties of beniseed. Agric. Eng Int.: CIGR Ejournal 9:1-14. Manuscript FP 07021. Vishwakarma RK, Nanda SK, Shivhare US (2010). Physical properties of guar seeds. Food Bioprocess Technol. 5(4):1364-1371. Worthen DR, Ghosheh OA, Crooks PA (1998). The in vitro anti-tumor activity of some crude and purified components of blackseed, Nigella sativa L. Anticancer Res. 18:1527-1532. Zewdu AD (2011). Moisture-Dependent Physical Properties of Ajwain (Trachyspermum ammi L.) Seeds. Philipp Agric. Scientist 94(3):278284. Vol. 10(2), pp. 67-75, 8 January, 2015 DOI: 10.5897/AJAR2014.8874 Article Number: F44179549447 ISSN 1991-637X Copyright ©2014 Author(s) retain the copyright of this article http://www.academicjournals.org/AJAR African Journal of Agricultural Research Full Length Research Paper Determination of compatibility of Pseudomonas fluorescens and Trichoderma harizianum grown on deoiled cakes of neem and jatropha for mass multiplication of P. fluorescens and T. harizianum in vitro Ajay Tomer*, Ramji Singh and Manoj Maurya Department of Plant Pathology, Sardar Vallabhbhi Patel University of Agriculture and Technology, Meerut- 2501 10 (UP), India. Received 27 March, 2014; Accepted 18 November, 2014 Tomato plants grown in sterilized soil applied with Pseudomonas fluorescens grown on Jatropha cake resulted in highest recovery of P. flourescens from soil. Combined application of two bio-agents in the rhizosphere of tomato in sterilized soil resulted in comparatively lower recovery of P. fluorescens and Trichoderma harzianum but was found better for root growth, shoot growth and fruit yield enhancement than their single application. Combined application of bio-agents grown on any of the cake to the sterilized soil resulted in “three time” increase in root length, 1.5 times increase in shoot length and “five time” increase in fruit yields of tomato crop. Key words: Compatibility, Pseudomonas fluorescens, Trichoderma harzianum root length, shoot length and yields of tomato crop. INTRODUCTION Some naturally occurring soil bacteria and fungi have demonstrated great potential to antagonize disadvantageous microorganisms responsible for causing diseases in several crops, hence, use of such plant beneficial microorganisms for plant protection is being considered as an alternative to reduce the use of chemical pesticides (Compant et al., 2005). In certain soils, such indigenous plant-beneficial microorganisms are able to suppress the activities of several pathogenic microorganisms and these soils are referred as suppressive soils’ (Weller et al., 2002). Thus, suppressive soils are regarded as sources of antagonistic microorganisms. Bio-control of plant diseases can be ensured by either augmentation of naturally occurring micro-biota or by introducing a new one to the soil/ rhizosphere. Many agro-industrial bio-products such as deoiled cakes of tree born oils seeds (TBOs) like Neem and Jatropha which are either going waste or being used as a less profitable and usable products since quite long time. The oils extracted from Neem and Jatropha, are either Corresponding author. E-mail: [email protected], Tel: +07830989790. Author(s) agree that this article remain permanently open access under the terms of the Creative Commons Attribution License 4.0 International License 68 Afr. J. Agric. Res. directly used as bio-fuel or as raw material for industrial inputs in various manufacturing industries like cosmetics, agrochemicals and pharmaceuticals. Deoiled cakes of these trees remain either unexploited or poorly exploited. These deoiled cakes contains lot of carbohydrates, proteins, fatty acids, minerals and many more biochemical constituents which may serve as source of nutrition for beneficial micro-organisms (growth promoting and bio-control agents) in crop cultivation, hence may be exploited as substrate for mass multiplication of bacterial bio-control agents such as Pseudomonas flourescens. Mass multiplication of Trichoderma has been successfully done on Neem and Jatropha. In addition, application of Bio-control agent (BCAs) grown with deoiled cakes which are rich in many nutrients may reduce soil-borne diseases by releasing allelochemicals generated during product storage or by subsequent microbial decomposition. Tomato is susceptible to several pests and diseases causing considerable decreases in its productivity. In spite of the introduction of several high yielding varieties, its yield potential could not be exploited up to expectation due to pests and diseases. Tomato is found to suffer from a variety of diseases caused by fungi, bacteria, viruses and nematodes. The important diseases are damping off, early blight, late blight, Fusarium wilt, Verticillium wilt, bacterial wilt and tomato mosaic virus. MATERIALS AND METHODS Sources and maintenance of culture Collection of soil samples and isolation of bio-control agent To isolate the biocontrol agent that is, P. fluorescens from tomato crop rhizosphere, soil samples were collected from crop research centre (CRC) of SVPUA&T University Modipuram Meerut Uttar Pradesh 250110 (India). For isolation, one gram of soil sample was placed in a 250 ml conical flask containing 100 ml of sterilized distilled water (SDW) and mixed thoroughly. Different dilutions of working samples were prepared by serially diluting the stock solution (10-8). 1 ml of last serial dilution that is, 10-8 was spread on P. fluorescens selective king’s B Medium (King’s et al., 1954) for isolation of P. fluorescens. The plates were incubated for 2 days at 28±2°C and after incubation, pure culture was grown; colour of bacterial colony was initially yellow but turned yellow green as pigmentation were produced (Bonds et al., 1957). Composition of culture media as given of P. fluorescens (Selective) King’s B Medium (King et al., 1954). Maintenance of the culture The bacteria initially isolated in a pure culture on King’s B media and subcultured on PDA slants were allowed to grow at 28±2°C temperature. The culture thus obtained was stored in refrigerator at 5°C for further studies and was sub cultured periodically. Isolation and maintenance of Trichoderma harzianum culture To isolate the biocontrol agent that is, T. harzianum from rhizosphere, soil samples were collected from crop fields of crop research centre (CRC) of university. For isolation, 10 g of soil sample was placed in a 250 ml conical flask containing 100 ml of sterilized distilled water (SDW) and mixed thoroughly. Different dilutions of working samples were prepared by diluting the stock solution (10-6). 1 ml of last serial dilution that is, 10-6 was spread on Trichoderma Selective Medium (TSM) for isolation of T. harzianum. The plates were incubated for 7 days at 28±2°C and after incubation, pure culture was grown; it was initially hyaline but turned green as colony were produced (Rhode, 1959). Preparation of culture media Trichoderma selective medium (TSM): All the ingredients were mixed with distilled water, agar was added to it in a stainless steel pan and steered with glass rod for proper mixing. Now the medium was filtered through a muslin cloth by squeezing out whole liquid. 200 ml dissolved medium was placed in each 500 ml capacity flasks. Flasks were tightly plugged with non-absorbent cotton and wrapped with butter paper and rubber band. Then medium was autoclaved at 1.1 kg/cm2 pressure for 20 min at 121.6°C and cooled before pouring into Petriplates (Elad and Chet, 1983). Determination of population dynamics and longevity of P. fluorescens on deoiled cakes of neem and jatropha Deoiled cakes of two tree born oilseeds that is, neem and jatropha were used during the course of investigation. These cakes were collected from local agricultural product-processing units. Cakes were used after adding sufficient amount of sterilized distilled water to maintain three level of moisture that is, 15, 25 and 35% (w/v) and autoclaved at 121.6°C (1.1 kg/cm2) for 20 min. The flasks were allowed to cool at room temperature prior to inoculation. Flasks containing substrates were inoculated with 3-4 days old actively growing culture of P. fluorescens (2-3 bits of 5 mm size from the culture grown on PDA in Petri plates under aseptic conditions in laminar flow. Flasks inoculated with P. fluorescens were incubated at 28±2°C and shaken thoroughly once a day. For each treatment, three replicates of flasks were maintained and arranged in a completely randomized manner. Population dynamics of P. fluorescens were determined by following serial dilution plate technique at each 15 days interval till these cakes yielded CFUs of P. fluorescens. After 15 days of incubation substrates were used for mixing it to rhizosphere of tomato plants to determine longevity and viability of bioagent in the soil planted with tomato. Determination of population dynamics and longevity of T. harzianum on deoiled cakes of neem and jatrofa: Deoiled cakes of neem and jatropha were used after adding sufficient amount of sterilized distilled water to maintain two level of moisture that is, 15 and 25% (w/v) and autoclaved at 121.6°C (1.1 kg/cm2) for 20 min. The flasks were allowed to cool at room temperature prior to inoculation. Flasks containing substrates were inoculated with 3-4 days old actively growing culture of T. harzianum (2-3 bits of 5 mm size from the culture grown on PDA in Petri plates under aseptic conditions in laminar flow. Flasks inoculated with T. harzianum were incubated at 28±2°C and shaken thoroughly once a day. For each treatment, three replicates of flasks were maintained and arranged in a completely randomized manner. Population dynamics of T. harzianum were determined by following serial dilution plate technique at each 15 days interval till these cakes yielded CFUs of T. harzianum. After 15 days of incubation substrates were used for mixing it to rhizosphere of tomato plants to determine its longevity and viability in the rhizospheric soil. Tomer et al. Determination of effect of substrate concentration and dilution of inoculums on population dynamics of P. fluorescens Initialy the P. fluorescens cultures were grown in King’s B broth medium at 28 ± 2°C for 2 days. After 2 days of incubation, a serial dilution of 10-5, 10-6, 10-7 and 10-8 were prepared by the method given at para Dilution Plate Method. Monitoring population dynamics in deoiled cakes Population of P. fluorescens and T. harzianum were monitored after each 15 days interval. For this purpose, 1 g of each cakes where P. flourescens or T. harzianum were inoculated were taken from each flasks maintained for different duration that is, 15 to 120 days and CFUs were counted using PDA through dilution plate technique. Determination of population dynamics and longevity of P. fluorescens and T. harzianum in sterilized and unsterilized soil planted with tomato. A pot culture experiment was conducted to determine the longevity of P. fluorescens and T. harzianum grown on neem and jatropha cakes, which was subsquently incorported to pot soil planted with tomato. For this purpose, 2 days old P. fluorescens and 15 days old T. harzianum culture were mixed to the sterilized neem cake and jatropha cakes and incubated for 15 days for proper colonization and growth of these two organisms on substrates, now these substrates were added to sterilized and unsterilized soil in clay pots and mixed thoroughly as per detail given below. Treatments details T1: Tomato plants grown in sterilized soil applied with P. fluorescens grown on neem cake. T2: Tomato plants grown in sterilized soil applied with P. fluorescens grown on jatropha cake T3: Tomato plants grown in sterilized soil applied with P. fluorescens grown on neem cake + T. harzianum grown on Neem cake. T4: Tomato plants grown in sterilized soil applied with P. fluorescens grown on jatrofa cake + T. harzianum grown on jatropha cake T5: Tomato plants grown in unsterilized soil applied with P. fluorescens grown on neem cake in unsterilized soil. T6: Tomato plants grown in unsterilized soil applied with P. fluorescens grown on jatropha cake in unsterilized soil. T7: Tomato plants grown in unsterilized soil applied with P. fluorescens grown on neem cake+ T. harzianum grown on Neem cake. T8: Tomato plants grown in unsterilized soil applied with P. fluorescens grown on neem cak + T. harzianum grown on jatropha cake. T9: Tomato plants grown in sterilized soil without any amendments. (Control-1). T10: Tomato plants grown in unsterilized soil without any amendments (Control-2). Experimental details Bio-control agent used: P. fluorescens, T. harzianum Substrates used: Deoiled cakes- Neem cake, Jatropha, cake Soil used: Sandy loam (Sterilized and unsterilized) No. of pots: 30 Pot’s size: 20×15’’ Crop: Tomato Variety: Arjun H-1 Design: Randomized Block Design (RBD) 69 No. of Treatments: 10 No. of Replications: 3 Date of sowing: 1-9-2011 Pot filling and planting with tomato seedlings After sterilization, soil was left overnight for proper cooling. Now 15 pots were filled with sterilized soil at 3 kg per pot and in another set 15 pots were filled with unsterilized soil at 3 kg per pot. However, both the soil lots were from similar field to maintain similarity in physico chemical and biological properties of soil. In each pot 75 g mass culture of either P. fluorescens or T. harzianum grown on oil cakes of neem and jatropha, were added either separately or mixture of these two as per treatment needs . After pot filling and application of amendments same day pots were planted with 3 seedlings of tomato (cv. Arjun H-1) per pot. Two sets of check were maintained that is, in sterilized and unsterilized soil, without application of any amendments to have a comparison. Each treatment was replicated thrice. Assessment of population dynamics of P. fluorescens and T. harzianum After 15 days of planting, one gram soil sample from each replicate of every treatment was taken from 10 cm depth with sterilized disk cutter into test tube. It was put into another test tube containing 10 ml sterilized distilled water and shaken well, and diluted up to 10 -8 for P. fluorescens and 10-6 for T. harzianum. 1.0 ml of the suspension was put into sterilized Petri plate poured with king’s B medium for P. fluorescens and spread throughout surface with gentle shaking. For monitoring of T. harzianum PDA was used. All the procedure of serial dilution was done under aseptic condition in Laminar Air Flow. The Petri dishes were then incubated for 5 days at 28±2°C for T. harzianum and for 2 days at 28±2°C for P. fluorescens. Within this period colonies were formed which were counted. Population dynamics of P. fluorescens was continuously determined till it yielded with CFUs of bioagents at each 15 days interval by following the procedure given above. Assesement of root length, shoot length and fruit weight of tomato Observations were also recorded to measure root and shoot length of tomato along with weight of total fruits in individual pots. Percent increase in root and shoot length and fruit yield were calculated using the following formula: Length in treated pot – Length in control pots % length increase = x Length in control pots 100 Yield under protected – Yield under unprotected Percent yield increase = x 100 Yield under unprotected Statistical analysis The data were subjected to analysis of variance, and treatment means were differentiated using Fischer’s T test. The data taken into percentage were first transformed into angular value and then analyzed for test of significance (Gomez, and Maravall 1996; Chandel, 2002). 70 Afr. J. Agric. Res. RESULTS Present studies entitled “longevity and survival of P. fluorescens on neem and jatropha cakes” were conducted under laboratory and pot conditions with the objectives to determine the suitability of deoiled cakes of neem and jatropha for mass multiplication of P. fluorescens in vitro and to determine the longevity of P. fluorescens grown on two deoiled cakes in the rhizosphere of tomato at the Department of Plant Pathology, S.V.P. University of Agriculture and Technology, Meerut. Screening of deoil cakes of neem and jatrofa for mass multiplication of T. harziniaum Two deoiled cakes which were earlier tested for suitability for survival and longevity of P. fluorescens, were also tested further for supporting population dynamics and longevity of T. harzianum at two different level of moisture that is, 15 to 25% upto a period of 120 days at each 15 days interval. Results obtained have been presented in Tables 2 and 3. Population dynamics of T. harzianum on neem cake It is evident from Table 2 that neem cake containing 15% level of moisture resulted in 13.00×10⁶ level of CFUs of T. harzianum at 15 days of inoculation. At 30 days the population of T. harzianum increased to the level of 21.67×10⁶. After 45 days, population of T. hearzianum on neem cake further increased to 32.33×10⁶. At 60 days of inoculation, population of T. harzianum started declining and showed 30.67×10⁶ level of CFUs. At 75 days the population of T. harzianum was 27.33×10⁶ and at 90 days, it was only 23.00×10⁶. At 105 days of inoculation population of T. harzianum was 13.67×10⁶ and at 120 days the population level was 4.67×10⁶. The level of population of T. harzianum at each 15 days interval significantly different from each other. Neem cake containing 25% moisture resulted in 15.00×10⁶ number of CFUs of T. harzianum after 15 days of inoculation, whereas at 30 days the population increased to the level of 25.00×10⁶. At 45 days this increased to the level of 39.00×10⁶ CFUs of T. harzianum. At 60 days of inoculation, population was 36.00×10⁶ and further decreased to the level of 33.00×10⁶ after 75 days of inoculation. At 90 days of inoculation the neem cake containing 25% moisture resulted in 27.33×10⁶ level of CFUs of T. harzianum. At 105 days and at 120 days the population of T. harzianum decreased to 15.33×10⁶ and 6.77 ×10⁶ respectively. Level of CFUs recorded after each 15 days interval and each level of moisture were significantly different from each other. Effect of application of P. flourescens grown on neem and jatrofa cakes and T. harzianum grown on neem and jatropha cakes either alone or their mixture on recovery of P. fluorescens and T. harzianum population from soil planted with tomato Data regarding this experiment have been presented in Table 1. At the time of application to the pot soil neem cake was having CFUs of P. fluorescens 139×10⁸, which was declined to the level of 114.00×10⁸ after 15 days of application in the pot soil planted with tomato (T-1) (Table 3), but with an initial decrease, population get increased from 30 days of application to upto 60 days of application to sterilized pot soil planted with tomato. The recovery of P. fluorecens population was 142.33×10⁸, which get increased further at 45 days (169.00×10⁸). Highest recovery of Pseudomonas population was on 60 days of application, which was 192.33×10⁸. Starting from 75 days onward, the population of P. fluorescens started decreasing as there was 136.33 ×10⁸ CFUs at 75 days, 93.00×10⁸ at 90 days, 43.00×10⁸ at 105 days, and only 9.00×10⁸ at 120 days of application. The population of Pseudomonas recovered from sterilized soil planted with tomato at each 15 days interval were siganificantly different from each other. Application of P. fluorescens grown on jatropha cake to sterilized soil planted with tomato (T-2) resulted in 120.33×10⁸ after 15 days of application which was significantly less than initial population at the time of application (148.00×10⁸), but when the population was monitored after 30 days of application, the population get increased to 151.00×10⁸, which further increased to 181.00×10⁸ and 200.33×10⁸ (highest among all), at 45 days and 60 days of application respectively, to the pot soil. After 75 days onwards the population of P. fluorescens started declining in the rhizosphere of tomato plants as there was 152.00×10⁸, 94.00×10⁸, and 53.00×10⁸ and 12.67×10⁸, number of CFUs of P. fluorescens, at 75, 90,105 and 120 days of application respectively to the sterilized soil planted with tomato. The population of Pseudomonas recovered from tomato rhizosphere, after application with jatropha cake grown Pseudomonas were significantly different from each other, at each 15 days interval. It was also observed that population of P. fluorescens was comparatively higher in the rhizospheric soil applied with jatropha cake, than, those applied with neem cake. When mixture of neem cake grown P. fluorescens + neem cake grown T. harzianum were applied to the sterilized pot soil (T-3), there was recovery of 103.66×10⁸ CFUs of P. fluorescens after 15 days of application, which get increased to122×10⁸,146.66 ×10⁸, and 171.33×10⁸ after 30, 45 and 60 days of application respectively. After 75 days onward population of P. fluorescens were found to be decreasing as recovery of CFUs were 120.00×10⁸, 72.66×10⁸, 21.66×10⁸, 6.66×10⁸ after 75, 90, 105 and 120 days respectively after inoculation. This treatment showed Tomer et al. 71 Table 1. Grown of the CFUS of P. fluorescens (PF), P. fluorescens and T. harzinaum (TH) on neem cake and jatropha, in the rhizosphere of tomato plants with and without application of bio agent in sterilized and unsterilized soil. T1 T2 T3 T4 T5 T6 T7 T8 T9 T10 15 Days PF TH 114.00 120.33 103.66 9.67 110.33 13.00 104.00 114.00 93.33 8.00 101.66 11.00 - CD at 5% Cakes =1.2931 Days =2.5862 Cakes and Days = 3.657 S/N 30 Days 45 Days PF TH PF TH 142.33 169.00 151.00 181.00 122.67 19.67 146.66 30.67 139.33 25.00 169.00 43.00 131.33 157.67 142.67 174.33 120.00 14.00 151.33 21.33 132.67 21.67 161.67 33.00 Cakes =0.7498 Days =1.4996 Cakes and Days =2.121 6 recovery of T. harzianum to the level of 9.67×10 , 19.67×10⁶, 30.67×10⁶, 29.00×10⁶, 26.00×10⁶, 23.33×10⁶, 16.33×10⁶ and 2.33×10⁶ after 15, 30, 45, 60, 75, 90, 105 and 120 days after application respectively. When mixture of jatropha cake grown P. fluorescens + jatropha cake grown T. harzianum were applied to the sterilized pot soil (T-4), there was recovery of 110.33×10⁸, 139.33×10⁸, 169.00×10⁸and 187.33×10⁸ P. fluoroscens after 15, 30, 45 and 60 days of application respectively. Up to 60 days the CFUs recovered were in a increasing manner, but after 75 days onward the population of P. fluoroscens started declining as there was 142.00×10⁸, 83.67×10⁸, 41.67×10⁸ and 9.33×10⁸, CFUs of P. fluoroscens recovered after 75, 90, 105 and 120 days after application to the pot soil. This treatment showed recovery of T. harzianum to the level of 13.00×10⁶, 25.00×10⁶, 6 60 Days PF TH 192.33 200.33 171.33 29.00 187.33 34.00 181.00 192.00 170.67 20.00 174.33 28.67 - 6 75 Days PF TH 136.33 152.00 120.00 26.00 142.00 31.00 162.67 173.33 152.00 19.00 163.00 25.33 - 6 6 43.00×10 , 34.00×10 , 31.00×10 , 25.33×10 , 17.66×10⁶ and 4.67×10⁶ after 15, 30, 45, 60, 75, 90, 105 and 120 days after application respectively. Application of P. fluorescens grown on neem cake to unsterilized soil planted with tomato (T-5) with an initial population of 139×108, for starting 15 days it was declined to the level of 104.00×10⁸ after 15 days of application. However, the population of P. fluorescens started further increasing upto 60 days of application. The population of P. fluorescens was131.33×108, 157.67×10⁸ and 181.00×10⁸ number of CFUs of P. fluorescens after 30, 45 and 60 days of application respectively, to the unsterilized soil planted with tomato. From 75 days onwards the population of Pseudomonas started declining as 8 number of CFUs recovered were 162.67×10 , 8 8 8 109.00 ×10 , 69.67×10 and 13.33 ×10 at 75, 90, 90 Days PF TH 93.00 94.67 72.66 23.33 83.67 25.33 109.00 115.66 96.66 17.00 104.00 21.67 - 105 Days PF TH 43.00 53.00 21.66 16.33 41.67 17.66 69.67 80.00 54.00 6.00 70.00 12.67 - 120 Days PF TH 9.00 12.67 6.66 2.33 9.33 4.67 13.33 17.66 5.67 1.91 7.66 3.00 - 105 and 120 days of application respectively to the unsterilized soil planted with tomato. The number of CFUs recovered after each 15 days in unsterilized soil provided with Pseudomonas was grown on neem cake was significantly different from each other. Application of P. fluorescens grown on jatropha cake in unsterilized soil planted with tomato (T-6) with an initial 148.00×10⁸ CFUs of P. fluorescens resulted in a decline in the population to the level of 114.00×10⁸ after 15 days of application. Number of CFUs of P. fluorescens were increased upto 60 days in the rhizosphere of tomato plants in unsterilized soil, which were 8 8 8 142.67×10 , 174.33×10 and 192.00×10 after 30, 45 and 60 days of application respectively. After 75 days onwards the population of P. fluorescens population of P. fluorescens was found to be 8 decreasing which were 173.33.×10 , 115.66.× 8 8 10 , 80.00×10 and 17.66×10⁸ after 75, 90, 105 72 Afr. J. Agric. Res. Table 2. Root and Shoot length of Tomato plants sterilized and unsterilized tomato plants with P.fluorescens and Trichoderma harzianum. S/N T1 T2 T3 T4 T5 T6 T7 T8 T9 T10 CD at 5 % Root length in cm 37.5 37.83 40.5 42.5 33.5 34.5 36.5 37.5 14.5 17.5 1.879 Increasing percentage 158 160 179 193 91 97 108 114 0 0 and 120 days of application respectively. All these CFUs were significantly different from each other except 45 and 75 days where population of P. fluorescens was almost similar. Application of mixture of P. fluorescens grown on neem cake + T. harzianum grown on neem cake to unsterilized soil planted with tomato (T-7) resulted in recovery of P. fluorescens CFUs to the level of 93.33 ×10⁸, 120.00×108,151.33 ×108 and 170.67×10⁸ after 15, 30, 45 and 60 days of application to unsterilized soil planted with tomato. After 75 days onward population of P. fluorescens was started decreasing as there was 152.00×10⁸, 96.66×10⁸, 54.00×10⁸ and 5.67×10⁸ CFUs of P. fluorescens recovered after 75, 90,105 and 120 days after application respectively. Recovery of T. harzianum population in this treatment also showed variation after different interval. Population of T. harzianum were 8.00×10⁶, 14.00 ×10⁶, 21.33×10⁶, 20.00×10⁶, 19.00×10⁶, 17.00×10⁶, 6.00×10⁶ and 1.91×10⁶ after 15, 30, 45, 60, 75, 90 and120 days respectively. Application of mixture of P. fluorescens grown on jatropha cake + T. harzianum grown on jatropha cake to unsterilized soil planted with tomato (T-8) resulted in recovery of P. fluorescens CFUs to the level of 101.66×10⁸, 132.67×10⁸, 161.67×10⁸ and 8 174.33×10 after 15, 30, 45 and 60 days of application to unsterilized soil planted with tomato. After 75 days onward population of P. fluorescens was started decreasing as there was 163.00×10⁸, 104.00×10⁸, 8 8 70.00×10 and 7.66×10 cfus of P. fluorescens recovered after 75 days,90 days,105 days and 120 days after application respectively. Recovery of T. harzianum population in this treatment also showed variation after different interval. Population of T. harzianum were 11.00 ×10⁶, 21.67 ×10⁶, 33.00×10⁶, 28.67×10⁶, 25.33×10⁶, 21.67×10⁶, 12.67×10⁶ and 3.00×10⁶ after 15, 30, 45, 60, 75, 90 and 120 days respectively. Serilized soil planted with tomato without any amendments (T-9) did not show any recovery of either P. fluorescens or T. harzianum, whereas in unsterized soil (t-10) there was recovery of both the bioagents but comparatively quite less than Shoot in length in cm 53.17 55.83 58.3 59.5 48.5 55.5 53.5 51.5 37.5 42.5 2.053 Increasing percentage 42 48 55 58 14 30 42 37 0 0 those where these bioagents were applied along with some of the cake. Effect of application of P. flourescens grown on different cakes and T. harzianum grown on different cake either alone or their mixture on root length, shoot length and fruit weight of tomato in sterilized and unsterilized soil Effect on root length Application of mixture of P. flourescens grown on jatrofa cake and T. harzianum grown on jatrofa cake in sterilized soil (T-4) planted with tomato resulted in highest root length of tomato (42.50 cm) (Table 2). Root length in T-4 was almost three times higher than control (14.50 cm). Second highest root length (40.50) were observed from the tomato plants which were planted in sterilized soil applied with mixture of P. flourescens grown on neem cake and T. harzianum grown on neem cake (T-3).Root length from T-3 and T-4 were significantly different from each other. Tomato root length noticed from the plants provided with P. flourescens grown on jatrofa cake in sterilized soil (37.83cm) (T-2), P. flourescens grown on neem cake in sterilized soil (37.50cm) (T-1), mixture of P. flourescens grown on jatropha cake and T. harzianum grown on jatropha cake in unsterilized soil (37.50 cm)(T8) and mixture of P. flourescens grown on neem cake and T. harzianum grown on neem cake in unsterilized soil (36.50 cm)(T-7) were at par to each other but significantly less than T-3 and T-4. Application of either P. flourescens grown on jatrofa cake (T-6) or P. flourescens grown on neem cake (T-5) resulted in a root length of 34.50 and 33.50 cm respectively were significantly quite less than T3 and T-4. However root lenth in sterilized control pots (T9) were significantly less (14.50 cm) than root length noticed in unsterilized control pots (17.50 cm) (T-10). Tomer et al. 73 Table 3. Weight of tomato fruits sterilized and unsterilized soil with P. fluorescens and T. harzianum. S/N T1 T2 T3 T4 T5 T6 T7 T8 T9 T10 CD at 5% Weight of tomato fruits (g) 398.33 430 480 381.81 313.33 303.33 361.67 315 88.9 143.33 93.531 Effect on shoot length Tomato plants grown in control sterilized soil pots (T-9) exhibited a shoot length of 37.50 cm. Tomato plants grown in sterilized soil, Applied with mixture of P. flourescens grown on jatrofa cake and T. harzianum grown on jatrofa cake (T-4) resulted in highest shoot length (59.50 cm) (Table 3). Second highest shoot length (58.30) were observed from the tomato plants which were planted in sterilized soil applied with mixture of P. flourescens grown on neem cake and T. harzianum grown on neem cake (T-3). Shoot length from T-3 and T4 were at par with each other. Shoot length of tomato plant (55.83 cm) in sterilized soil applied with P. flourescens grown on jatrofa cake (T-2) and in unsterilized soil applied with P. flourescens grown on jatrofa cake (55.50 cm)(T-6) were at par with each other but significantly less than T-4 and T3. In the same way, shoot length of tomato plants (53.50 cm) in unsterilized soil applied with mixture of P. flourescens grown on neem cake and T. harzianum grown on neem cake (T-7) and in sterilized soil applied with P. flourescens grown on neem cake (53.17 cm) (T-1) were also at par with each other but significantly less than T-4,T-3, T-2 and T-6 respectively. Tomato grown in unsterilized soil applied with mixture of P. flourescens grown on jatrofa cake and T. harzianum grown on jatrofa cake (T-8) exhibited a shoot length of 51.50 cm. Tomato grown in unsterilized soil applied with P. flourescens grown on neem cake (T5) exhibited shortest shoot length (48.50 cm). In unsterilized control pot (T-10) shoot length was only 42.50 cm, whereas in sterilized control pots (T-9) it was only 37.50 cm. Shoot length of tomato in T-9 was significantly quite less than shoot length noticed in T-10. Effect on fruit weight Fruit weight of tomato in sterilized (T-9) and unsterilized Increasing percentage 348 383 4.39 329 118 111 152 119 control pots (T-10) were 88.90 and 143.33 g respectively, which were significantly different from each other. Tomato plants which were planted in sterilized soil applied with mixture of P. flourescens grown on neem cake and T. harzianum grown on neem cake (T-3) produced highest fruit yield (480.00 g) which was at par with the fruit yield (430.00 g) and (398.33 g) produced by the tomato plants grown in sterilized soil applied with P. flourescens grown on jatrofa cake (T-2) and in sterilized soil applied with P. flourescens grown on neem cake (T1) respectively. Tomato plants grown in sterilized soil, applied with mixture of P. flourescens grown on jatrofa cake and T. harzianum grown on jatrofa cake (T-4) resulted in a fruit weight of 381.67 cm which was significantly less than the fruit weight observed in T-3 but at par with the fruit weight noticed in T-2 and T-1 respectively. It was interesting to note that tomato grown in T-5, T-6,T-7 and T-8 were significantly quite less than those treatments which were planted in sterilized soil that is, T-1,T-2,T-3 and T-4 respectively. DISCUSSION Deoiled cakes of two trees born oilseeds (TBOs) viz., neem and jatropha, were tested for their suitability for mass multiplication of P. fluorescens and T. harzianum and also that for how long they are able to support the survival of P.fluorescens and T. harzianum with a considerable level of population dynamics. Different concentration of two cakes was also tested for their ability to enhance the population dynamics of P. fluorescens. In addition population dynamics and longevity of P. fluorescens and T. harzianum in sterilized and unsterilized soil planted with tomato were alsodetermined with a mandate to know that for how long different substrates are able to support them when applied to soil with some crop. 74 Afr. J. Agric. Res. Effect of application of P. flourescens grown on neem and jatropha cakes and T. harzianum grown on neem and jatropha cakes either alone or their mixture on recovery of P. fluorescens and T. harzianum population from soil planted with tomato Highest recovery of Pseudomonas population was noticed on 60 days of application in sterilized soil where jatropha cake grown P. fluorescens was applied. Application of neem cake grown P. fluorescens was also resulted in quite higher level of recovery of CFUs of this bioagent but comparatively slightly less than jatropha cake. Mixing two bio-agent resulted in comparatively lower level of recovery of CFUs. Sterilized soil gave higher recovery of P. fluorescens than unsterilized soil. Up to 60 days, population of P. fluorescens tend to increased, whereas after 75 days onward population started decreasing. In case of T. harzianum, its highest population was recorded when mixture of T. harzianum grown on jatrofa cake + mixture of P. fluorescens grown on jatropha cake were applied to sterilized soil planted with tomato after 45 days of application. After 60 days onward population of T. harzianum started declining. Although population started declining after 75 days of application in pot soil but even then it was of quite higher level. Higher population dynamics in the tomato rhizosphere as compared to laboratory condition may be attributed to the fact that different root exudates and lechates along with some other organic matter available in the soil might have helped P. fluorescens to multiply profusely to maintain comparatively higher level of population dynamics along with quite longer longevity by providing abundant food sources. However it is a unique type of investigation which throw some light on the role of different substrates in supporting the population dynamics of P. fluorescens and longevity after mixing to the soil which will help in checking out the strategy for biological control in a long term perspective in such a way that after how much interval reapplication of P. fluorescens should be done in the soil. According to Thangavelu et al. (2004), when T. harzianum grown on five different organic substrates (rice bran, rice chaffy grain, farm yard manure, banana pseudo stem and banana dried leaves) and applied as dried formulation to the soil, the population of the T. harzianum (race Th 10) could increased from 104 to 1013 CFUs/g of soil within 60 days which also effectively controlled the Fusarium wilt of banana. Results of present study are partly in accordance with the previous work of Thangavelu et al. (2004) as during present investigation the increasing trend of P. fluorescens population at maximum level was up to 60 days. The results of another previous group of scientists that is, Nosir et al. (2010) also fully support the findings of present study as they have reported that the population of T. harzianum and Aneurinobacillus migulanus could increase from days 30 to 60 followed by a decrease until by day 150 after inoculation, no T. harzianum CFU were recovered afterward. There was little difference in the level of population dynamics between unsterilized soil planted with tomato and sterilized soil planted with tomato. In case of unsterilized soil planted with tomato, although neem and jatropha cakes could support the population dynamics up to 120 days but in general, level of population dynamics was comparatively lower than the population dynamics recorded due to different substrates in case of sterilized soil planted with tomato. The possible reason behind this trend may be that in unsterilized soil planted with tomato possible presence of diverse microbial population may have pose a competition for nutrition and space for P. fluorescens but there have been no such competition in sterilized soil planted with tomato, because sterilization process of soil had certainly killed all microbes, hence no competition for nutrition and space and that is why the population of P. fluorescens could have been comparatively higher in sterilized soil and comparatively less in unsterilized soil. Conclusion Deoiled cakes of two tree born oilseeds (TBOs) viz., neem and jatropha were tested as solid substrate for their suitability for mass multiplication of P. flourescens and T. harzianum. P. flourescens and T. harzianum grown on jatropha cake and neem cake either alone or mixture of these two were applied to sterilized and unsterilized soil and planted with tomato. From these soil, population of P. flourescens and T. harzianum were monitored at each 15 days interval up to 120 days. Root length, shoot length and fruit yield of tomato were also measured in the plants grown in these sets of treatments. Salient findings of these studies have been summarized in following paragraphs. Tomato plants grown in sterilized soil applied with P. fluorescens grown on neem cake also resulted in very high level of recovery of P. flourescens after 60 days of application. Tomato plants grown in sterilized soil either applied with a mixture of P. fluorescens grown on jatrofa cake+ T. harzianum grown on jatropha cake resulted in highest recovery of T. harzianum after 45 days of application. Application of mixture of two bioagents resulted in comparatively lower recovery of P. fluorescens but it was better for root and shoot growth enhancement. Tomato plants grown in sterilized soil either applied with a mixture of P. fluorescens grown on Jatropha cake or + T. harzianum grown on Jatropha cake or applied with a mixture of P. fluorescens grown on neem cake + T. harzianum grown on neem cake, showed highest root length, highest shoot length and highest fruit yields also. Root length, shoot length and fruit yields of tomato grown in sterilized soil without any amendments were Tomer et al. comparatively lesser than those plants grown in unsterilized soil without any amendments. Application of either mixture of P. fluorescens grown on Jatropha + T. harzianum grown on Jatropha cake or mixture of P. fluorescens grown on Neem cake + T. harzianum grown on neem cake to the sterilized soil resulted in thrice increase of root length 1.5 times increase in shoot length and five time increase in fruit yields of tomato. (1) For soil application P. fluorescens grown on jatropha cake should be preffered over neem cake for longer survival of P. fluorescens with higher viable counts in soil after application. (2) Mixed application of P. fluorescens + T. harzianum to the soil resulted in suppression of CFUs of both the organisms than their single application. (3) Mixed application of P. fluorescens + T. harzianum to the soil was effective in enhancing root growth, shoot growth and fruit yields of tomato. (4) Deoiled cakes of Jatrofa is comparatively better than deoiled cakes of neem for supporting fast multiplication of P. fluorescens , enhancing plant growth, vigour and also fruit yield. (5) Deoiled neem cake is better than deoiled jatrofa cakes in supporting fast multiplication of T. harzianum. Conflict of Interest The authors have not declared any conflict of interest. REFERENCES Bonds GJ, Jensen CE, Thamasen J (1957). A water soluble fluorescing bacterial pigment which deplomerize hylorenic acid. Acta Pharmocol, Toxicol. 13:184-193. Chandel SRS (2002). A hand book of agricultural statistics. 2002 Edn. Achal Prakashan Mandir, India. pp. A-99 – A-101. Compant S, Duffy B, Nowak J, Clement C, Barka E (2005). Use of plant growth promoting bacteria for bio control of plant diseases: Principles, mechanisms of action and future prospects. Appl. Environ. Microbiol. 71:4951-4959. http://dx.doi.org/10.1128/AEM.71.9.49514959.2005 75 Elad Y, chet I (1983). Improved selective media for isolation of Trichoderma spp. or Fusarium spp. Phytoparasitica 11(1):55-58. http://dx.doi.org/10.1007/BF02980712 Gomez V, Maravall A (1996). Programs SEATS and TRAMO: Instructions for the User», Working, Bank of Spain P. 9628. King EO, Ward MK, Raney DE (1954). Two simple media for the demonstration of Pyocyanin and fluorescin. J. Lab. Clin. Med. 36:100-102. Nosir W, Jim D, Steve W (2010). The Efficiency of Trichoderma harzianum and Aneurinobacillus migulanus in the Control of Gladiolus Corm Rot in Soil-Less Culture System, Am. J. Agric. Biol. Sci. 5(4):436-445.http://dx.doi.org/10.3844/ajabssp.2010.436.445. Rhode SME (1959). The Characterization of Pseudomonas fluorescens. J. Gen. Microbiol. 21:221-265. http://dx.doi.org/10.1099/0022128721-1-221. Thangavelu R, Palaniswami A, Velazhahan R (2004). Mass production of Trichoderma harzianum for managing Fusarium wilt of banana. Agric. Ecosyst. Environ. 103:259-263. http://dx.doi.org/ 10.1016/j.agee.2003.09.026. Weller DM, Raaijmakers JM, Spadden MC, Gardner BB, Thomashow LS (2002). Microbial populations responsible for specific soil suppressiveness to plant pathogens. Ann. Rev. Phytopathol. 40:308348. http://dx.doi.org/10.1146/annurev.phyto.40.030402.110010 Vol. 10(2), pp. 76-83, 8 January, 2015 DOI: 10.5897/AJAR2014.8577 Article Number: 2838F1349451 ISSN 1991-637X Copyright ©2014 Author(s) retain the copyright of this article http://www.academicjournals.org/AJAR African Journal of Agricultural Research Full Length Research Paper Effect of temperature and photoperiod on the development of fusariosis in pineapples Izabel Cristina Pereira Vaz Ferreira1, Nilza de Lima Pereira Sales2* and Alisson Vinicius de Araujo1 1 Departamento de Fitotecnia, Universidade Federal de Viçosa. Avenida Peter Henry Rolfs, s/n, 36570-000, Viçosa, Minas Gerais, Brazil. 2 Instituto de Ciências Agrárias, Universidade Federal de Minas Gerais. Avenida Universitária, 1000, Bairro Universitário, 39404-006, Montes Claros, Minas Gerais, Brazil. Received 2 February, 2014; Accepted 17 December, 2014 We examined the incidence of fusariosis in Montes Claros–MG and determined the effect of temperature and photoperiod on the development of Fusarium guttiforme. Four family production units were investigated, from which four isolates of F. guttiforme were isolated. For each isolate, two experiments were set up to assess mycelial growth for 144 h in environments with different temperatures and either a 12 h photoperiod or continuous darkness. To evaluate the development of isolates of F. guttiforme, we used a portion sub-divided randomized block design. The number of conidia produced by each isolate was counted according to the above-mentioned conditions. All production units had occurrence rates ranging from 12.2 to 64.4%. The fungal isolates showed a higher mycelial growth rate when incubated at 25°C under a 12 h photoperiod. However, the production of conidia varied depending on the temperature and on the isolate. With these overall results better understand how the spread of this fungus occurred so quickly. We may use this information to suggest management practices that reduce the incidence of pineapple fusariosis. Key words: Light, mycelial growth rate, Fusarium guttiforme, temperature. INTRODUCTION Brazil has an average pineapple productivity of 40 t ha-1, -1 below the average of 50 t ha achieved by other producer countries. However, the country is the largest producer of pineapples in the world, with a production of 2.49 million t yr-1. Paraíba is the main pineappleproducing state, accounting for 17.9% of the national production, followed by Minas Gerais, which accounts for 17.5% of the national production (Cristani et al., 2010; Aquije et al., 2011). According to Ploetz (2005), fusariosis was first described in Argentina and Brazil, and more recently in Uruguay, Paraguay, and Bolivia, and subsequently has caused large losses in pineapple production in these countries. One of the factors hampering pineapple productivity in the municipality of Montes Claros, Northern Minas Gerais, is plant health. Farmers in the *Corresponding to author. E-mail:[email protected] Author(s) agree that this article remain permanently open access under the terms of the Creative Commons Attribution License 4.0 International License Ferreira et al. region report that their main activity was the production of pineapple. However, in 1980, several farmers abandoned pineapple propagation because of the damage caused by fusariosis. The continuous purchase of pineapple seedlings from neighbouring farmers, including those that have ceased growing this particular crop due to the occurrence of this disease, may have caused the rapid spread of the disease in the region. Currently, a few farmers continue to maintain their pineapple plantations, although close to 100% of the crops are infected by the fungus. Fusariosis is caused by the fungus Fusarium guttiforme Nirenberg and O'Donnell (Sin.:F. subglutinans) (Wollen and Reinking) Nelson, Tousson and Marasas f. sp. ananas Ventura, Zambolim and Gilbertson) (Aquije et al., 2011). This fungus does not produce chlamydospores, but can remain in pineapple plants in the epiphytic form (Ventura and Zambolim, 2002). According to Alves and Nunes (2008), the survival of F. guttiforme in the soil may vary according to the percentage of organic matter in the substrate. However, this fungus does not remain for more than 4 months in the soil without a host. On the basis of the accounts of farmers and the incidence of the disease in pineapples, there is a need to understand how abiotic and biotic factors contribute to the survival and spread of this fungus across the region to establish disease management practices that are appropriate for use by farmers. Doohan et al. (2003) reported that temperature, water availability, aeration, and light are the environmental factors that strongly influence the production of Fusarium sp. inoculum. The species F. graminearum and F. culmorum have been recognized for their optimal growth at a specific temperature and in a potato dextrose agar (PDA) culture medium (Brennan et al., 2003). In addition to temperature, light can also affect fungal development. According to Leach (1967), light stimulates asexual and sexual reproduction in most fungi and this effect is correlated to nutrition and temperature. The quality and intensity of light can also affect conidial germination, vegetative growth rate, formation of reproductive structures, spore pigmentation, and shape and size of most fungal species (Minussi et al., 1977). According to Coutinho (2010), isolates of F. guttiforme from three Brazilian states showed variations when exposed to ambient light, substrate, and different temperatures. The combination of alternating or continuous lighting and PDA culture medium promotes a greater discriminatory power among fungal isolates, indicating that even colonies of the same sub-species may exhibit variation in growth and reproduction when exposed to the same environment. The in vitro characterisation of the growth and reproduction of fungi provides important information on the cultivation and production of viable inoculum. In addition, it leads to a better understanding of the development of microbial colonies in each region, which 77 allows the selection of inoculants with increased virulence that can be used in plant breeding programs. We examined the incidence of fusariosis in four family production units in the municipality of Montes Claros– Minas Gerais and determined the influence of temperature and photoperiod on the development of F. guttiforme thriving in these areas. MATERIALS AND METHODS Four family production units in the rural community of Chapadinha, in Montes Claros–MG (19°54′38′′S, 43°56′48′′W) were selected for this study. This community is located 27 km from the urban area, where pineapple has been farmed for more than 20 years and has been naturally infested by fusariosis. All areas allocated to the agroecological production of pineapple, which were identified using a survey conducted by the residential community association, were evaluated. During the survey period, the farms showed plants in their propagative and reproductive phases of fusariosis, based on disease symptoms that were observable throughout the plant cycle (Ventura and Zambolim, 2002). The average temperature of the study area ranged from 25 to 30°C and the relative humidity remained above 60%. The croplands were conventionally called Family Production Unit 1 (UPF 1), UPF 2, UPF 3, and UPF 4, and all plantations were dry land. In all the UPFs, weed management was accomplished through manual weeding. The farmers themselves planted UPFs 1 and 3 with seedlings, whereas UPFs 2 and 4 were inoculated with seedlings acquired from other farmers. Liming and fertilisation with phosphate and ammonium sulphate (without soil chemical analysis) were conducted in UPF 2 only. Except for UPF 4, all UPFs underwent crop rotation using pineapple and cassava. The incidence of fusariosis in each family production unit was determined by counting the number of diseased plants according to the methodology of Embrapa (2005). We evaluated 500 plants ha-1. Sampling was carried out in a zigzag pathway, sampling 10 points. Plants were considered as diseased when they presented at least one of the following symptoms: gum exudation, curvature of the apex, shortening of the stem, abnormal shape of a cup, change in the leaf rosette configuration, death of the apex of the stem, and stunting. The incidence data were expressed as a percentage of plants with symptoms. In vitro development of F. guttiforme After surveying the incidence of pineapple fusariosis in each property, plants with disease symptoms were collected and transported to the laboratory. The plants were washed in distilled water and liquid detergent and the leaves and fruits were isolated. At the edges of the damaged tissues, approximately 0.5 cm² fragments were removed, and then immersed in 70% ethanol for 30 s, followed by immersion in 2% sodium hypochlorite for 1 min. Subsequently, the fragments were washed three times in sterile distilled water. After eliminating the excess moisture, the fragments were placed in 9 cm Petri dishes containing PDA culture medium and incubated at 25 ± 2°C under a 12 h photoperiod. All procedures were performed in a laminar flow hood under aseptic conditions. Upon growth of Fusarium colonies, these were transferred to Petri dishes containing PDA medium and cultured under the conditions previously described. F. guttiforme was then isolated and identified (Nelson et al., 1994) using the following designation: isolates from leaves (PLA 1 and PLA 2) and isolates from fruits (FRU 1 and FRU 2). We use two isolates of each plant for greater genetic variation. After isolation and identification of the isolates, a monospore 78 Afr. J. Agric. Res. culture was prepared. Briefly, a sample of sporulated culture was placed in a test tube containing 10 ml of sterile distilled water, stirred, and subjected to serial dilution (four times). An aliquot containing 1 ml of the diluted suspension was placed on the surface of Petri dishes containing agar (20%) culture medium and incubated at a constant temperature of 25°C under light, in incubators with four fluorescent lamps (2500 Lux). After a 9 h incubation and growth of the conidial germination tubes, one conidium was isolated under an optical microscope objective. This fragment containing the conidia was transferred to a test tube containing the PDA culture medium and incubated at a constant temperature of 25°C under a 12 h photoperiod. After 15 days, the cultures were inoculated into 9 cm Petri dishes containing the PDA medium. Single-spore cultures of each isolate were assessed for pathogenicity according to the methodology described by Oliveira et al. (2011). To determine the mycelial growth rate and conidial production of the four isolates, two treatments were conducted, in which each isolate was subjected to either a photoperiod of 12 h or continuous darkness. For each treatment, we measured the effect of temperature and time (incubation period) on mycelial growth rate. In each treatment, the experimental design was completely randomised in a 3 6 4 the sub-divided plot scheme, using three temperatures (20, 25, and 30°C), six incubation periods (24, 48, 72, 96, 120 and 144 h) and four isolates of F. guttiforme (PLA 1, PLA 2, FRU 1 and FRU 2) with three replicates. Each plot consisted of a Petri dish containing the PDA culture medium and a 0.7 cm diameter colony disc of the isolate. During the 6-day incubation period, the diameters of colonies in two orthogonal axes were measured every 24 h. The mycelial growth rate was calculated as the difference between the measured diameter and the previous diameter. To assess the amount of conidia produced by each isolate, two 0.7 cm diameter discs with mycelium were withdrawn from the edges of the colony from each replicate at the end of each experiment. The discs were then transferred to test tubes containing 20 ml of sterile distilled water and stirred to promote the shedding of conidia. The number of macroconidia and microconidia in suspension were counted using a Neubauer chamber type and an optical microscope. Data were subjected to variance analysis and regression analysis. When necessary, we compared the means using the Tukey test (P < 0.05). RESULTS AND DISCUSSION The incidence of fusariosis in the family production units (12.2 to 64.4%) was higher than the recommended 1% control level of the disease. Some of the factors that may have contributed to the high number of diseased plants in the units were the relative humidity, which remained above 60% during the evaluation period; the average temperature, which ranged from 20 to 30°C; and the phenological stage of the crop (breeding/propagation). Such factors contributed to the high levels of fusariosis in some pineapple crops in the municipality of Santa Rita– PB (52.2 to 60.0%) (Oliveira et al., 2011). According to these authors, the flowering of plants at specific temperature and relative humidity conditions were favourable to the production of seedlings and the occurrence of fungal infections, thus increasing the number of infected plants. UPF 1 showed a lower incidence of diseased plants (12.2%) than that observed in the other units. The pineapple field in this production unit was only 2 years old, and the planting area was located between sparse native Cerrado vegetation, which allows a spatial isolation in relation to other pineapple plantations in the region. The seedlings used in this pineapple field were selected from other plantations of the same farmer. Such seedlings may have served as an inoculation mechanism for this pathogen in the new planting area because F. guttiforme can infect the whole plant and some seedlings lightly infected by the fungus may not have been identified by the farmers and acted as a source of the initial inoculum in the new cultivation areas (Verzignassi et al., 2009; Oliveira et al., 2011). UPFs 2 and 3 showed a two-fold incidence of fusariosis at 24.22 and 26.2%, respectively, relative to that observed in UPF 1. However, these plantations are near other older pineapple fields (soca type), which were abandoned by farmers due to the high incidence of Fusarium. Fertilisation was not performed in these UPFs, although crop rotation using pineapple and cassava was conducted, which may contribute to the lower fruit damage caused by the disease. In contrast, UPF 4 presented an extremely high incidence of fusariosis (64.4%). Its fruit production was extensively impaired, with a low inflorescence. This property also underwent liming and fertilisation with duck waste phosphate and ammonium sulphate. However, the correction and fertilisation of the soil were not based on its chemical and physical analysis. It may be possible that the soil pH correction with lime contributed to the high incidence of fusariosis in this unit. This has been described by Rodrigues et al. (2002), in which the use of limestone favoured the development of Rhizoctonia solani in beans. However, the level of nitrogen may have been excessive for the pineapple plants, thus increasing their susceptibility to F. guttiforme. According to Santos et al. (2010), the application of nitrogen in the form of ammonia to soils at low pH, such as that of the Cerrado, may favour increased disease severity. Another factor that contributes to the longevity and spread of inoculum is the age of the plantations. The pineapple is essentially a perennial crop and can have multiple cycles for many years in the same location, giving rise to what is commonly called ‘soca’ (Lima et al., 2002). This type of farming was observed in the family production units surveyed. According to Ventura and Zambolim (2002), the fungus can remain in the saprophytic form on the pineapple leaves, but also in other plants present in cultivated areas. Thus, when the ‘soca’ areas are abandoned, they serve as a source of inoculum for neighbouring crops and also permit the maintenance of F. guttiforme in the location, even after the death of the pineapple plant. In vitro development of F. guttiforme When incubated under a 12 h photoperiod, the mycelial Ferreira et al. 79 Table 1. Mycelial growth (cm) of four isolates of F. guttifforme temperature and six of incubation time and 12 h photoperiod. Time (h) Temperature (°C) 24 Isolates 20 25 30 FRU 1 Ab 0.36 Aab 0.68 Aa 1.05 FRU 2 Aa 0.44 Aa 0.74 Aa 0.82 PLA 1 Ab 0.11 Ab 0.38 Aa 1.13 PLA 2 Aa 0.13 Aa 0.77 Aa 0.55 48 20 25 30 1.22Ab Aa 2.17 Ab 1.58 1.54Ab Aa 2.32 Ab 1.46 1.07Ab Aa 2.30 Ab 1.40 1.38Aab Aa 1.89 Ab 1.20 Aab 1.73 2.11Aa Ab 1.53 Ab 1.53 2.18Aa Aab 1.67 Aab 72 20 25 30 1.50 1.89Aa Ab 1.33 1.64 1.73Aa Ab 1.17 Aab 1.60 1.95Aa Ab 1.39 Aa 1.46 1.87Aa Aa 1.44 Aa 96 20 25 30 1.38 1.61Aa Aa 1.10 1.44 1.73Aa Ab 1.04 120 20 25 30 1.26Aa Aa 1.40 1.28Aa 1.39Aa Aa 1.19 1.30Aa 1.15Aa Aa 1.49 1.07Aa 1.09Aab Aa 1.53 0.98Ab 144 20 25 30 1.41Aa 0.00Bb Aa 0.92 1.41Aa 0.00Bb Aa 1.14 1.29Aa 0.62Ab Aab 0.86 1.29Aa 0.65Ab Aab 0.77 C.V. (%) Aab 18.24 Aab Means followed by the same uppercase letter, in the column, and same lower case, in the line, are not statistically different (Tukey test) (p < 0.05). growth rate of all isolates was influenced by the interaction of temperature with the incubation period and isolates. With a photoperiod of 12 h, all F. guttiforme isolates exhibited the highest growth rates when incubated at 25°C (Tables 1 and 2). The isolated PLA 1 and PLA 2 grew better at 25°C after 144 h of incubation (Table 1). This is because the mycelium of FRU 1 and FRU 2 isolates had occupied the entire petri dish, and therefore, the growth rate was equal to zero in this time (Table 1). This indicates that the isolated FRU 1 and FRU 2 can be more vigorous than the single PLA 1 and PLA 2. For the PLA 1 isolate, a temperature of 30°C during the first 24 h resulted in the highest growth rate, when incubated under a 12-h photoperiod (Table 1). For the PLA 1 and PLA 2 isolates, which were derived from leaves, we found that, with 81.73 to 80.82 h of incubation at 25°C under a photoperiod of 12 h, there was a higher rate of mycelial growth (2.05 and 1.91 cm, respectively) (Table 2). The FRU 1 and FRU 2 isolates, which were derived from fruits, showed the highest growth rate (2.26 cm) after 75 to 77 h of incubation at 25°C under a 12 h photoperiod (Table 2). The four F. guttiforme isolates produced the same number of conidia when incubated under a 12 h photoperiod. The fungus, regardless of the isolate used, showed a positive linear conidia production (ŷ = 2.932539 + 0.219633**x, R² = 0.83) between 20 and 30°C, where conidia production was expressed N° conidia x 105 ml-1. We note that in continuous darkness was not influenced by the triple interaction between the factors. However, there was a significant interaction between incubation time and temperatures and there was also the effect of interaction between isolate and incubation time (Tables 3 and 4, Figures 1 and 2). The isolates presented the highest average rate of mycelial growth when cultivated in continuous darkness at a temperature of 25°C, in all of the incubation time (Table 3 and Figure 1). We also observed a pattern of growth of the fungus incubated in continuous darkness, common will all temperatures studied, where the first 24 h there was a significant increase in the growth rate, and then a range (24-120 h) where the growth rate remained constant (Figure 1). The isolates achieved the highest growth rate after 102 h of incubation in continuous darkness, except for the isolated FRU 1, which had the 80 Afr. J. Agric. Res. Table 2. Equations of four isolates of F. guttifforme incubated at different temperatures for 144 h of in a 12 h photoperiod. Isolates 2 Temperatures (°C) 20 25 30 Equations 2 ŷ = -0.415894 + 0.0423970*х – 0.000215364*x ŷ = -0.753487 + 0.0781892**х – 0.000507220**x2 2 ŷ = 0.672379 + 0.0225090*х – 0.000145829*x R 0.82 0.95 0.88 FRU 2 20 25 30 ŷ = -0.0772617 + 0.0345622*х – 0.000175280*x2 2 ŷ = -0.546431 + 0.0746039**х – 0.000496448**x 2 ŷ = 0.324954 + 0.0289570*х – 0.000166189*x 0.73 0.93 0.81 PLA 1 20 25 30 ŷ = -0.644221 + 0.0423274*х – 0.000209196*x2 ŷ = -0.590900 + 0.0645372*х – 0.000394826*x2 ŷ = 1.03019 + 0.00868136*х – 0.0000699241*x2 0.84 0.71 0.82 2 PLA 2 20 25 30 ŷ = -0.587712 + 0.0455603*х – 0.000237633*x 2 ŷ = -0.150864 + 0.0512199*х – 0.000316881**x 2 ŷ = 0.195624 + 0.0230223*х – 0.000135064*x 0.71 0.88 0.74 FRU 1 * Significant t test (p < 0.05). ** Significant t test (p < 0.01). Table 3. Mycelial growth (cm) of F. guttifforme in three temperatures and six of incubation time and continuous darkness. Temperature(°C) 20 25 30 C.V.(%) 24 0.09b 0.42a 0.49a 48 1.00b 1.36a 1.04b Incubation time (h) 72 96 ab 1.21 1.20ab a 1.39 1.39a b 1.01 1.01b 20.42 120 1.23a 1.36a 0.92b 144 1.12b 1.50a 0.91c Means followed by the same letter in the column are not statistically different (Tukey test) (p < 0.05). Table 4. Mycelial growth (cm) of four isolates of F. guttifforme and six of incubation times and continuous darkness. Isolates FRU 1 FRU 2 PLA 1 PLA 2 C.V.(%) 24 a 0.43 a 0.33 a 0.27 a 0.29 48 a 1.11 a 1.21 a 1.12 a 1.09 Incubation times (h) 72 96 a a 1.19 1.19 a a 1.28 1,27 a a 1.18 1.17 a a 1.17 1.16 20.42 120 a 1.10 a 1.27 a 1.17 a 1.15 144 a 1.49 ab 1.22 b 1.11 c 0.88 Means followed by the same letter in the column are not statistically different (Tukey test) (p < 0.05). highest growth rate after 131 h of incubation also in continuous darkness (Figure 2). Demonstrating that isolates can propagate quickly, even in the absence of light, for example, when infecting pineapple fruits. When the four isolates were incubated in continuous darkness, there was no interaction effect between treatments (fungal isolates and incubation temperature) and the number of conidia produced. The FRU 1 isolate produced the greatest number of conidia, more than twice that of the PLA 1, PLA 2, and FRU 2 isolates, regardless of the incubation temperature (Table 5). In general, the isolates showed a higher rate of Ferreira et al. Figure 1. Growth rate of the F. guttiforme as a function of incubation time and different temperatures. * Significant t test (p < 0.05). ** Significant t test (p < 0.01). Figure 2. Mycelial growth as a function of incubation time and of the four F. guttiforme isolates.* Significant t test (p < 0.05). ** Significant t test (p < 0.01). 81 82 Afr. J. Agric. Res. Table 5. Number of conidia produced by four F. guttiforme isolates subjected to different incubation temperatures in continuous darkness. Isolates PLA 1 PLA 2 FRU 1 FRU 2 C.V. (%) N° of conidia ml -1 2.42 10 5b 2.95 10 5a 4.17 10 5 b 2.35 10 48.03 5 b Means followed by the same letter in the column are not statistically different (Tukey test) (p < 0.05). mycelial growth when incubated under a 12 h photoperiod. The same growth pattern was observed for Stenocarpella macrospora and Stenocarpella maydis (Casa et al., 2007). However, the production of conidia varied among isolates. The FRU 1 isolate showed a higher rate of sporulation when maintained in continuous darkness. As for the other isolates, alternation or absence of light did not affect sporulation. Devi and Singh (1994) previously demonstrated that the growth rate of F. moniliforme was higher when incubated with continuous light and sporulated best in continuous darkness. Doohan et al. (2003) reported that temperature and light influence the reproduction of Fusarium sp. We have verified their results in our experiments, in which each isolate showed a distinct growth pattern when incubated in continuous darkness or under a 12 h photoperiod. The alternation of light provided the highest growth rate of the isolates. However, when these isolates were grown in continuous darkness, the production of conidia of the FRU 1 isolate differed from that of the others. According to Leach (1967), light stimulates the sexual and asexual reproduction of fungi and this stimulus is correlated to temperature. This was also observed in the present study, because when the F. guttiforme isolates were exposed to a photoperiod of 12 h, the conidia production increased at higher temperatures. However, when they were subjected to continuous darkness, conidial production of three of the four isolates was not affected by the increase in temperature. In this study, we used PDA culture medium and the optimum growth temperature of F. guttiforme isolates was 25°C. This corroborates the data presented by Bueno et al. (2007) and Basseto et al. (2011), who reported that the optimal temperature range for the growth of the three F. oxysporum strains was from 25 to 26°C. In summary, the incidence of fusariosis in family production units studied in the rural community of Chapadinha, Montes Claros, Minas Gerais was high, ranging from 12.2 to 64.4%. The F. guttiforme isolates showed a higher rate of mycelial growth when incubated under a 12 h photoperiod and in continuous darkness and at 25°C. A 12 h photoperiod and a temperature of 30°C leads to an increase in conidia production in F. guttiforme. The four isolates showed a lot adapted to temperature conditions of the region, due to their high growth rate and higher production of conidia in temperature above 25°C, conditions common to the Brazilian Cerrado region where the study was conducted. This makes it easy to understand why the spread and establishment of the fungus by pineapple plantation the region occurred so quickly. Conflict of Interest The authors have not declared any conflict of interest. ACKNOWLEDGMENTS We thank FAPEMIG, CAPES and CNPq for granting the post-graduate scholarship to the first and third authors, respectively. We thank Pro-reitoria of the Pesquisa of Universidade Federal de Minas Gerais by supporting the research. We also thank the PROCAD/CAPES program (Call: 213/2007) for the possibility of attending the Sandwich MSc, and Professor Aldir de Oliveira de Carvalho (in memoriam) and Professor Margarida Goréte Ferreira do Carmo for the extensive collaboration. Abbreviations: PDA; Potato dextrose agar, UPF; family production unit, PLA; isolate of the fungal from leave, and FRU; isolate of the fungal from fruit. REFERENCES Alves GAR, Nunes MAL (2008). Sobrevivência de Fusarium subglutinans f. sp. ananas em solos. Rev. Bras. Ciênc. Agrár. (49):157-171. http://dx.doi.org/10.1016/j.cropro.2010.11.025 Aquije GMFV, Korres AMN, Buss DS, Ventura JA, Fernandes PMB, Fernandes AAR (2011). Effects of leaf scales of different pineapple cultivars on the epiphytic stage of Fusarium guttiforme. Crop Prot. 30:375-378. Basseto MA, Bueno CJ, Chagas HA, Rosa DD, Padovani CR, Furtado EL (2011). Efeitos da simulação da solarização do solo com materiais vegetais sobre o crescimento micelial de fungos fitopatogênicos habitantes do solo. Summa Phytopathol. 37(3):116120. http://dx.doi.org/10.1590/S0100-54052011000300006 Ferreira et al. Brennan JM, Fagan B, Van Maanen A, Cooke BM, Doohan FM (2003). Studies on in vitro growth and pathogenicity of Fusarium fungi. Eur. J. Plant. Pathol. 109:577-587. http://dx.doi.org/10.1023/A:1024712415326 Bueno CJ, Ambrósio MMQ, Souza NL (2007). Produção e avaliação da sobrevivência de estruturas de resistência de fungos fitopatogênicos habitantes do solo. Summa Phytopathol. 33:47-55. http://dx.doi.org/10.1590/S0100-54052007000100007 Casa RT, Reis EM, Zambolim L, Moreira EM (2007). Efeito da Temperatura e de Regimes de Luz no Crescimento do Micélio, Germinação de Conídios e Esporulação de Stenocarpella macrospora e Stenocarpella maydis. Fitopatol. Bras. 32:137-142. http://dx.doi.org/10.1590/S0100-41582007000200007 Coutinho OL (2010). Comportamento in vitro e patogenicidade de isolados de fusarium gutiforme em abacaxizeiro, oriundos dos estados da Paraíba, Pernambuco e Rio Grande do Norte. Tese de Doutorado, Universidade Federal da Paraíba, Brasil, P. 65. Doohan FM, Brennan J, Cooke BM (2003). Influence of climatic factors on Fusarium species pathogenic to cereals. Eur. J. Plant Pathol. 109:755-768. http://dx.doi.org/10.1023/A:1026090626994 Embrapa Mandioca e Fruticultura Tropical (2005). Manejo integrado da fusariose do abacaxizeiro. Cruz das Almas: Embrapa Mandioca e Fruticultura Tropical, Documentos 32:2. Available in: http://www.cnpmf.embrapa.br/publicacoes/documentos/documentos_ 184.pdf. Acess: March/2009. Leach CM (1967). Sporulation of diverse species of fungi under near ultraviolet radiation. Botany 40:151-161. Lima VP, Reinhardt DH, Costa JA (2002). Desbaste de mudas tipo filhote do abacaxi cv. Pérola – 2: análises de crescimento e de correlações. Rev. Bras. de Frutic. 24:101-107. http://dx.doi.org/10.1590/S0100-29452002000100022 Minussi E, Machado CC, Menten JOM, Castro C, Kimati H (1977). Efeitos de diferentes regimes de luz na esporulação de Stemphylium solani Weber em meio de cultura. Fitopatol. Bras. 2:167-171. 83 Nelson Pe, Dignani Mc, Anaissie Ej (1994). Taxonomy, biology, and clinical aspects of Fusarium species. Clin. Microbiol. Rev. 7:479-504. Oliveira MDM, Nascimento LC, Leite RP (2011). Incidência de fusariose e avaliação de métodos de inoculação de Fusarium gutiforme em folhas de abacaxizeiro. Rev. Caatinga 24:137-142. Ploetz RC (2006). Fusarium-Induced Diseases of Tropical, Perennial Crops. Phytopathology 96:648-652. http://dx.doi.org/10.1094/PHYTO-96-0648 Rodrigues FA, Carvalho EM, Vale FXR (2002). Severidade da podridão-radicular de Rhizoctonia do feijoeiro influenciada pela calagem, e pelas fontes e doses de nitrogênio. Pesqui. Agropec. Bras. 37:1247-1252. http://dx.doi.org/10.1590/S0100204X2002000900007 Santos AC, Vilela LC, Barreto PM, Castro GD, Silva JEC (2010). Alterações de atributos químicos pela calagem e gessagem superficial com o tempo de incubação. Rev. Caatinga 23:77-83. Ventura JA, Zambolim L (2002). Controle das doenças do abacaxizeiro. In: Controle de Doenças de Plantas Fruteiras. Viçosa: UFV pp. 445509. Verzignassi JR, Santos MF, Matos AP, Banchimol RL, Poltronieri LS (2009). Fusariose do abacaxizeiro no Pará. Summa Phytopathol. 35:329-330. http://dx.doi.org/10.1590/S0100-54052009000400014 African Journal of Agricultural Research Related Journals Published by Academic Journals ■ African Journal of Environmental Science & Technology ■ Biotechnology & Molecular Biology Reviews ■ African Journal of Biochemistry Research ■ African Journal of Microbiology Research ■ African Journal of Pure & Applied Chemistry ■ African Journal of Food Science ■ African Journal of Biotechnology ■ African Journal of Pharmacy & Pharmacology ■ African Journal of Plant Science ■ Journal of Medicinal Plant Research ■ International Journal of Physical Sciences ■ Scientific Research and Essays
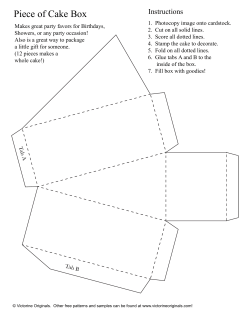


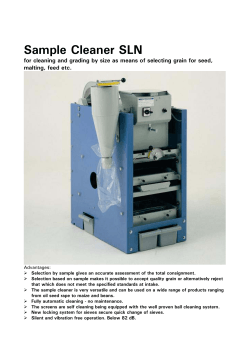


© Copyright 2026