
May 2015 Vol 26 No 2 - Australasian College of Road Safety
Vol 26 No 2, 2015 Journal of the Australasian College of Road Safety Formerly RoadWise – Australia’s First Road Safety Journal Special Issue: Road Trauma and Injury Peer-reviewed papers • Road trauma education: the impact of a patient presenter on the road safety attitudes of adolescents • Comparison of Victorian road trauma trends using traditional and alternative measures of serious injury derived from linked data • Does road safety have any lessons for workplace health and safety? Contributed articles • BITRE review of the impacts of road trauma • Using statistical modelling to predict crash risks, injury outcomes and compensation costs in Victoria • Reducing trauma in the youth of Australia • The social and economic cost of road related injury and death • Enhanced road safety data in New South Wales • Time for a new public debate about the state of road safety Journal of the Australasian College of Road Safety – Volume 26 No.2, 2015 Contents From the President.................................................................................................................................................................. 3 Minister’s Message................................................................................................................................................................. 4 Diary........................................................................................................................................................................................3 College news...........................................................................................................................................................................6 Chapter reports.............................................................................................................................................................6 Other news...............................................................................................................................................................................7 Peer-reviewed papers Road trauma education: the impact of a patient presenter on the road safety attitudes of adolescents - J Buckmaster, C Brownlie, J Olver, B Fedele and D McKenzie..........................................................................................11 Comparison of Victorian road trauma trends using traditional and alternative measures of serious injury derived from linked data - A D’Elia and S Newstead.....................................................................................................................................................19 Does road safety have any lessons for workplace health and safety? - Trevor J Bailey, Jeremy E Woolley and Simon J Raftery.....................................................................................................26 Contributed articles BITRE review of the impacts of road trauma - T Risbey................................................................................................................................................................................34 Using statistical modelling to predict crash risks, injury outcomes and compensation costs in Victoria - R Schuster, M Nieuwesteeg, A Northrop, C Lucas, D Smith...............................................................................................43 Reducing trauma in the youth of Australia - J McLeod..............................................................................................................................................................................50 The social and economic cost of road related injury and death - Dr John Crozier.....................................................................................................................................................................53 Enhanced road safety data in New South Wales - H Raisianzadeh.....................................................................................................................................................................59 Time for a new public debate about the state of road safety - I Johnston..............................................................................................................................................................................61 Cover image A student takes part in a hospital-based session as part of the Prevent Alcohol and Risk-related Trauma in Youth (P.A.R.T.Y.) program. This is one of many programs seeking to reduce the overrepresentation of youth in the trauma statistics. Unlike other programs with this goal however, P.A.R.T.Y. occurs in a hospital, not at a school or in a classroom and is led and delivered by clinical staff. The Program is a full day trauma prevention experience aimed at senior school students, young offenders, trainees and apprentices. It seeks to give participants a snapshot of the possible traumatic and often preventable consequences of risk-related behaviour through vivid clinical reality. Disclaimer Materials (papers, contributed articles, letters, advertisements and editorial) in this journal may not necessarily reflect the opinions of peer reviewers or the Australasian College of Road Safety, who disclaim all liability for any damages that may result from publication of any material and from persons acting on it. Journal of the Australasian College of Road Safety – Volume 26 No.2, 2015 The Journal of the Australasian College of Road Safety (published as RoadWise from 1988-2004) ISSN 1832-9497. Published quarterly by the Australasian College of Road Safety. Managing Editor: Laurelle Tunks, ACRS, PO Box 198, Mawson, ACT 2607 Phone +61 (0)2 6290 2509 Fax +61 (0)2 6290 0914 [email protected] Peer-Reviewed Papers Editor: Prof Raphael Grzebieta, Professor of Road Safety, Transport and Road Safety (TARS) Research, UNSW, West Wing, 1st Floor, Old Main Building (K15), University of NSW, Sydney NSW 2052 Phone +61 (0)2 9385 4479 Fax +61 (0)2 9385 6040 [email protected] Road Safety Literature Editor: Andrew Scarce, Road Class, 6 Oasis Gardens, Bendigo, Victoria 3550. Phone +61 (0)3 5442 5226, Mobile 0429 198 314 [email protected] Editorial board Dr Jennifer Clark University of New England, NSW Dr Soames Job Adjunct Professor, TARS, University of NSW Dr Nadine Levick Objective Safety LLC, New York, US Dr Andrew McIntosh Monash Injury Research Institute Monash University Dr Will Murray Research Director, Interactive Driving Systems, UK A/Prof George Rechnitzer Adjunct Associate Prof, TARS, UNSW Prof Michael Regan TARS, University of NSW Prof Richard Tay Assoc Dept of Infrastructure Engineering, University of Melbourne Prof Michael Taylor Transport Systems Centre, University of South Australia Prof Barry Watson Chief Executive Officer for the Global Road Safety Partnership, Geneva, Switzerland Subscriptions All issues of this journal are mailed to personal members or corporate delegates of the Australasian College of Road Safety. Organisations and persons who are not members of the College may subscribe to the journal on payment of an annual subscription. Advertising and sponsorship Advertising rates, specifications and deadlines are on the College website at www.acrs.org.au/publications/ journaladvertisingkit.html or available by email from faa@ acrs.com.au. Discounts are available for prepaid advertising booked to run for more than one issue. The College also welcomes sponsorship of the journal. Our current sponsors are LB International, ANCAP, and New South Wales Government. For more information about becoming a journal sponsor, please contact the Journal Managing Editor. Editorial Policy The aim of the Journal of the Australasian College of Road Safety is to provide a medium for expression of views and debate on all facets of the study of road safety. Articles are accepted from a variety of disciplines, such as health and medicine, road and automotive engineering, education, law, behavioural sciences, communication, history, management, and urban and traffic planning. Interdisciplinary approaches are particularly welcome. The College encourages interested persons and organisations to submit articles, photographs or letters for publication. Published 2 letters would normally show the name of the writer and the state or territory of residence. The journal provides the opportunity for researchers to have their work submitted for peer review, in order to improve the quality of their research papers. However, peer review cannot guarantee the validity of research nor assure scientific quality. The publisher reserves the right to reject submissions or, with approval of the author, to edit articles. No payment is offered for articles published.Material in this journal may be cited with acknowledgement of the full reference, including the author, article title and the year and volume of the journal. For permission to reprint articles, please contact the Journal Managing Editor. Important Information for authors It is essential that authors writing for the journal obtain and follow the ACRS Instructions for authors. These are updated regularly and can be downloaded from the College website at www.acrs.org.au/srcfiles/Instructions-for-authors-revised. pdf. Authors should check that they have complied with all requirements before submitting their papers. All papers must be in MS Word format and sent as email attachments to journaleditor.acrs.org.au. Articles must not exceed 5000 words in length and authors should state whether or not peer review is requested. Authors must indicate if their articles have been published previously or are under consideration by other publishers. The College has adopted guidelines developed by the Committee on Publication Ethics, which are available at http://publicationethics.org/guidelines. These guidelines include the Code of conduct; Best practice guidelines for journal editors; Guidelines for retracting articles; Guidelines for the board of directors of learned society journals; Guidance for editors: Research, audit and service evaluations; and How to handle authorship disputes: A guide for new researchers. Authors retain the copyright in their papers. However, by submitting a paper, authors give their permission to the College to make minor editorial changes to conform to the College in-house style manual; to print the paper in the Journal of the Australasian College of Road Safety; to send it for indexing to Ebsco, SafetyLit, Informit and other relevant databases; to make the full text of the paper available online through the ACRS website and Informit; and to promote the paper through media releases or by giving permission to re-print it in full or part in other hard copy or online resources that promote road safety. All photographs and diagrams for which the author or the author’s employing organisation does not hold copyright must be accompanied by permission from the copyright holder to be used as indicated above. ACRS office contact details Submissions to the journal, and any queries or comments about journal content, should be addressed to the Managing Editor. Inquiries regarding journal subscriptions, changes of address and back issues should be addressed to the Finance and Administration Officer. Inquiries about membership and College activities should be directed to the Executive Officer. Contacts: Mrs Claire Howe, Executive Officer, [email protected] Ms Laurelle Tunks, Managing Editor, [email protected] Ms Christine Bethwaite, Finance and Administration, [email protected] Mailing address: PO Box 198, Mawson, ACT 2607 Australia Phone: (02) 6290 2509 Head office: Pearce Centre, Collett Place, Pearce ACT Australia Office hours: Tuesday 9.00am – 5.00pm; Wednesday and Thursday 9.00am – 3.00pm. Closed Monday and Friday. Messages may be left on voicemail when the office is unattended. Journal of the Australasian College of Road Safety – Volume 26 No.2, 2015 From the President Dear ACRS members, This edition has a focus on injury and the impacts of road trauma. I have been concerned for well over a decade at the complexity of road crash injury data. We have a lot of data, from many sources on road crash injuries. The general consensus seems to be that the numbers of serious injuries are not decreasing at the same rate as fatalities from road crashes. There is genuine interest in having the right, or correct data and there is a lot of concern at many levels at being able to make comparisons and have programs which reduce injuries. The complexity of the data seems to be reflected in the variability of the data and its reliability. We have seen crash rates for young drivers drop as a result of a range of programs; we know that improved road design and infrastructure reduces crash impacts; we know that crashworthiness of cars has improved dramatically; that many cars are more pedestrian (and other vulnerable road user) friendly; helmets and child seats protect many road users; to cover a few of the key improvements made in recent times - so why are death rates dropping and injury rates remaining the same? Injury can be debilitating for the injured for a long period of time, and of course there are many similar and hence unnecessary impacts across the community. Many impacts are difficult to quantify, easy to overlook. So if injury data is complex, not reliable and the impacts difficult to quantify then the community, that is all of us, are not likely to be very concerned. If we are not concerned, then we are not likely to work to develop a priority action road crash injury reduction program. The contributions in this edition will help us in our understanding of the issues and hopefully help us all to work to accelerate such an action program. Lauchlan McIntosh AM FACRS ACRS President Diary 2015 3 – 10 May 2015 Yellow Ribbon National Road Safety Week http://www.sarahgroup.org/initiatives/2015-road-safety-week/ 4 – 7 May 2015 IRF A Regional Conference for Asia and Australasia 2015 http://www.roads.org.au/conference2015 4 – 10 May 2015 3rd United Nations Global Road Safety Week: Focussed on Children and Road Safety 11 – 12 June, 2015 COMPETT conference: Breakthrough for Electric Vehicles Oslo Science Park, Oslo, Norway https://www.toi.no/electromobility-conference-in-oslojune-11-12-2015 28 – 31 July 2015 AITPM National Traffic and Transport Conference Brisbane Convention and Exhibition Centre, Brisbane http://www.aitpm.com.au/Conference/About-Conference 6 – 8 October 2015 Road Safety and Simulation International Conference Orlando Florida, United States http://stc.utk.edu/STCevents/rss2015/ 14 – 16 October 2015 Australasian Road Safety Conference: Taking Action Together Gold Coast, Queensland www.australasianroadsafetyconference.com.au 2016 May 2016 Road Safety on Five Continents (RS5C) Rio de Janeiro, Brazil http://www.vti.se/en/road-safety-on-five-continents 2 – 5 August 2016 ICTTP2016: The Sixth International Conference on Traffic & Transport Psychology, Brisbane Convention and Exhibition Centre, Queensland, Australia. Website: http://icttp2016.com, Email: [email protected] 3 Journal of the Australasian College of Road Safety – Volume 26 No.2, 2015 Message from The Honourable Jamie Briggs MP Assistant Minister for Infrastructure and Regional Development Member for Mayo One life lost on the road is one too many. Sadly almost everyone has been, or will be, affected by a death or serious injury on our roads. Every road casualty impacts on the lives of victims’ families, their friends and their communities. In Australia, road trauma is estimated to cost around $27 billion each year, or 1.8 per cent of our gross domestic product. While these figures are confronting, we are making progress. For the first time since national statistics began in 1925, the rate of road deaths in Australia has fallen to below five deaths per 100,000 people. This is the lowest rate on record, a major milestone when you consider that the number of vehicles on Australian roads has increased from 300,000 in 1925 to over 17.6 million today. At the last election, the Government made a commitment to commission a report on the impact of road trauma. The report, which I released in December, reviews the full impacts of road trauma, including the benefits and costs of measures to encourage safer drivers, build safer roads, and drive safer cars. Three measures were easily identified as largely responsible for the steady decline in fatalities achieved over the last 50 years. Perhaps unsurprisingly these were speed limits, alcohol restrictions and seatbelt laws. The report identified infrastructure investment and intersection measures as key next steps in improving road safety. That’s why the Australian Government’s ongoing efforts will be focused on building better, safer and more productive roads. The safety benefits generated from better roads should not be underestimated. Better roads are safer roads. For instance, the duplication of the Hume Highway along with improved road conditions, safer vehicles, compulsory seat belts and better policing tools has reduced annual fatalities by 85 per cent. While in New South Wales, it is estimated that upgrading the Pacific Highway to a dual carriageway will avoid around 1000 deaths, and 7400 injuries up to the year of 2050. 4 Our multibillion dollar infrastructure investments will also significantly improve road conditions for motorists on the daily commute. The Perth Freight Link in WA is expected to remove tens of thousands of vehicles a day from the surrounding road network. Similarly, the WestConnex project in New South Wales is expected to remove 3,000 trucks a day from Parramatta Road. Each of these projects will save lives and reduce road trauma, not only on major highways, but also on the nearby local road network. Road safety benefits will also flow from our investments in the North South Corridor in Adelaide, the Gateway Motorway North in Brisbane and the Midland Highway in Tasmania. We are also working with every jurisdiction to improve heavy vehicle safety through establishment of the National Heavy Vehicle Law and a national Regulator. The new laws will provide a consistent set of rules across key areas including road access, driver fatigue and vehicle safety. Advances in vehicle technology will play a vital role in reducing road trauma. Globally, vehicle technology is on the edge of major transformations which will reduce the road toll exponentially. For instance, the Bureau of Infrastructure and Regional Economics has estimated that autonomous emergency braking systems are expected to save over 1200 lives and prevent 54,000 hospitalised injuries by 2033. Although the Australian Government has no direct control over road rules, we do determine which new vehicles enter the Australian fleet under the Motor Vehicles Standards Act. Sections of the Act have become outdated over the years as significant changes in vehicle technology and vehicle manufacturing have taken place. That is why I announced a major review of the Act focussing on reducing the regulatory burden on business and ensuring that consumers have access to the safest cars, at the lowest possible cost. Pending the outcomes of this Review, I have also initiated a process to accelerate harmonisation of Australian Design Rules with international standards to ensure that we keep our standards in line with international best practice. The Australian Government has also committed $229 million to establish the National Highway Upgrade Programme plus an additional $200 million towards the Black Spot Programme, bringing our total commitment to $500 million over the next five years. In January, I attended the International Road Federation Conference (IRF) in New Delhi where I announced that Austrade had signed a memorandum of understanding with the IRF to formalise their joint working relationship around road safety. This will involve collaborative and co-operative efforts to further promote Australian road safety capabilities in India. Journal of the Australasian College of Road Safety – Volume 26 No.2, 2015 cent since 2003 – but too many lives are still being lost or harmed because of carelessness on our roads. Speed cameras, road improvements, random breath tests (RBTs), better policing and strong public education campaigns have done an enormous amount to change driver behaviour and help prevent crashes. However, risky driver behaviours such as alcohol and drug abuse, speeding, driver fatigue, and novice drivers and riders continue to contribute to an unnecessary and avoidable high road toll. The Hon Jamie Briggs MP speaking at an IRF Conference in New Delhi When it comes to road safety, we cannot afford to be complacent. Road safety is not ‘owned’ by the Australian Government or by governments collectively. Manufacturers can implement new safety technology, and governments can improve roads and road rules. But there is no substitute for responsible and safe driving. Road safety is, and will continue to be, everyone’s responsibility. An AMA perspective on road trauma Speeding is still a factor in about one-third of road fatalities in Australia and more than 4,100 people are injured in speed-related incidents each year. Even driving five kilometres over the speed limit doubles the likelihood of a casualty crash. Because more people tend to drive just over the limit to avoid speed traps, low level speeding results in more crashes than high level speeding. Driver fatigue is one of the top three contributors to the road toll. Research shows that fatigue can be as dangerous as other road safety issues, such as drink driving. A fatal crash affects not only the individual or individuals who are killed or injured, but their family, friends, witnesses, and the broader community. The sad reality is that doctors like me – doctors who work around the clock in hospitals around the country – are still seeing too many deaths, too many horrific injuries and too many shattered lives because of recklessness, carelessness, tiredness, misfortune and bad luck on the nation’s roads. The Federal AMA has recently convened a Road Safety Working Group to look at ways that the medical profession can work to help to reduce the road toll, including lobbying governments. Safety assist technology: reducing road trauma by Associate Professor Brian Owler Federal President Australian Medical Association (AMA) 42 Macquarie Street, Barton ACT 2600 Associate Professor Brian Owler is a Sydney neurosurgeon who regularly operates on the victims of road carnage. He also features in the NSW Government’s ‘Don’t Rush’ road safety campaign on television and billboards. There has been a remarkable reduction in national annual road fatalities over the last ten years – down by 25 per by Nicholas Clarke Chief Executive Officer ANCAP 55 Blackall St, Barton, ACT, 2600 Over the last decade there have been considerable advances in car safety, particularly in relation to crash worthiness and at the same time there has been a reduction in road deaths of nearly 30%. Historically it has been relatively simple to separate the good performers from the bad because the physical crash test results told an unambiguous story. Today, the differences are more subtle and much harder to detect, but the differences can still be substantial. 5 Journal of the Australasian College of Road Safety – Volume 26 No.2, 2015 In 2008 ANCAP was the first test organisation in the world to require Electronic Stability Control (ESC) in order to achieve a 5 star safety rating. The advent of ESC opened the door to a range of safety assist technology (ESC) aimed at crash avoidance rather than crash performance. Many new cars today have excellent structures and restraint systems and therefore perform very well in ANCAP’s physical crash tests. There is a significant challenge ahead for car manufacturers if they want to retain 5 star safety ratings for their products. New requirements for mandatory safety assist technology for both ANCAP and Euro NCAP increases the hurdle for a 5 star safety rating to the point where some cars will fail. Crashworthiness alone, is no longer good enough. Austroads recently released a report on fatalities and serious injuries in Australia and New Zealand in the period 20012010. Included in this report were details of average annual causalities per year in the period 2006-2010. Total injuries amounted to just a little under 90,000 per year while serious injuries were a little over 24,000. For all injury types the crash type accounting for the most injuries was for vehicles travelling in the same direction. However, when it came to fatalities and serious injuries, off path crashes most commonly accounted for these. Of note in the report is the difficulty (in some cases impossibility) of sourcing accurate data for injuries; serious or otherwise. In certain cases data from major regions was unavailable and had to be estimated based on results from other regions. It is a national disgrace that in 2015 there is not a single consolidated national repository for crash, fatality and injury data. Notwithstanding this failure, there is still an immense opportunity for safety assist technology to cut swathes through road trauma. Autonomous Emergency Braking (AEB) and Lane Keep Assist (LKA) together can help prevent run off path crashes, particularly in rural and regional areas where these types of crashes occur in high numbers. And there are others; fatigue detection, adaptive headlights, automatic high beam, intelligent speed assist, telematics and the like. The key of course is getting this technology into the market as quickly as possible – and herein lies the greatest problem. Left to market forces it is likely to be decades before this technology is ubiquitous in the car parc. Regulation cannot really help either because of long lead times. Something else is required. Something that will encourage the manufacturers to include this technology in all its cars. With local manufacturing winding up and industry subsidies no longer required maybe it is time to look to safer cars and improved safety assist technology to reduce road trauma in the quickest, cheapest and most effective manner. College news Chapter reports Queensland Chapter The speaker for the first Queensland Chapter seminar for the year was Professor Ray Bingham from University of Michigan. The title of his seminar was “Development and Evaluation of an Evidence-based Parent Coaching Guide for Learner Teen Drivers.” Dr. Raymond Bingham is a research professor at the University of Michigan Transportation Research Institute (UMTRI), where he heads the Young Driver Behavior and Injury Prevention group. He is also a research professor in the Department of Health Behavior and Health Education of the 6 University of Michigan School of Public Health, and in the Department of Psychiatry of the University of Michigan Medical School. At UMTRI his research interests are in unintentional injury prevention, with a primary focus on young drivers, alcohol use, and program development and evaluation. Dr. Bingham’s research has been funded by the Centers for Disease Control and Prevention and the National Center for Injury Prevention and Control, the National Institute on Alcohol Abuse and Alcoholism, the National Institute for Child Health and Human Development, Toyota, and various other private and state agencies, organizations, and corporations. We thank Dr. Bingham for his excellent seminar. The next Queensland Chapter meeting and seminar will be held on June 2 and will be presented by Dr. Pri Wedegama. Dr. Wedegama is an Endeavour Award Recipient from Indonesia. Kerry Armstrong Queensland Chapter Chair Journal of the Australasian College of Road Safety – Volume 26 No.2, 2015 ACT and Region Chapter The main activity in which the ACT and Region Chapter has been involved in the first quarter of 2015 has been the Vulnerable Road User Forum. The Chapter organised this on behalf of the ACT Justice and Community Safety Directorate (JACS). The Forum was held on 23 February 2015 and was opened by the ACT Minister for Municipal Services, Justice, Sport and Recreation, Mr Shane Rattenbury. Over 30 representatives attended. The major organisations representing the vulnerable road user groups made presentations and all who attended actively participated in the discussions. A report on the outcomes of the Forum has been completed and has been forwarded to Minister Rattenbury. Feedback from attendees has been positive. It is anticipated that the Chapter will be able to organise similar activities in future. Our thanks again go to David Healy for chairing the discussion and to all who assisted with the preparation of the Forum and the report. We are hoping that the Forum may provide a base for ongoing joint activities of this nature with the ACT authorities. Upcoming events The Chapter has agreed to participate in the ACT International Road Safety Week activities on 4 May. The remaining activity for the current year is a Communications Seminar (part of the ACRS national series of seminars). The actual date for this activity is yet to be set. In our last report we outlined the campaign the Yass Valley Council was running over Christmas and early 2015. You Don’t have to be speeding – to be driving too fast on country roads. It has been well received by the public; ACT and NSW Police; and NSW and ACT road safety stakeholders including neighbouring NSW councils. It is now hoped that the campaign will spread into several other local government areas including Queanbeyan, Palarang, Goulburn Mulwaree, Eurobodalla, Snowy River, Tumut, Gundagai and Tumbarumba. All of these councils have expressed interest in running the campaign in their local areas and efforts are being made to secure funding to see this campaign growth supported. The campaign radio advertisement was aired over 600 times on four commercial stations and also aired on Yass community radio. The radio commercial reminds drivers to slow down and alerts motorists to the fact that country roads present different hazards. The campaign will also result in the reporting of possible road safety engineering treatments that could be applied to country roads within the Yass Valley. A full campaign report will be completed for the NRMA ACT Road Safety Trust by June 2015. The first Annual Road Safety Seminar (in conjunction with the ACT Government) has been rescheduled for September 2015. Other news ACRS submission to the Australian Road Safety Community: boosting Australia’s productivity and international standing through road trauma reductions ACRS President, Lauchlan McIntosh AM, has released the 2014 ACRS Submission to the Australian Road Safety Community; a comprehensive report informing all stakeholders, including the general public, of the opportunities that are available to address the serious issue of road deaths and injuries in Australia. The causes and consequences of road trauma severely impact the productivity of Australia as a nation, as well as impacting on our international reputation, specifically as road safety leaders. The impact of road trauma is felt across all federal departments, and exists regardless of which party makes up the majority in Parliament. Therefore a united effort is required to adequately address this serious issue; arguably one of the highest ranking public health issues we have in Australia today. 7 Journal of the Australasian College of Road Safety – Volume 26 No.2, 2015 Executive Summary Reducing road trauma must be at the forefront of the Australian productivity and national economic debate, not simply a factor in transport management. The purpose of this submission is to draw attention to this vital subject and to call for greater coordination of our response in addressing this major public health issue. Road trauma is arguably the highest ranking public health issue we face as a nation today. Each week in Australia 25 people die and 600 are seriously injured, and the ripple effect of each road trauma event to our families and communities is enormous. Federal government estimates put the annual cost of road trauma to our economy at $27b (Australian Transport Council, 2011) – more than the size of our national defence budget. If the aim of the National Road Safety Strategy (NRSS) is reached – a target of a 30% reduction in road trauma by 2020 – this trauma will still have cost the Australian economy a massive $264b over the decade to 2020. If we increase Australia’s target to 50% (in line with the goals of Europe) we will have saved the economy $37b by 2020. More importantly, countless lives and injuries will be saved as well as the ripple effects that will be felt across Australian society. Notwithstanding the impacts to society, the current level of economic impact from road trauma is simply unacceptable and must be recognised as a significant factor hindering Australia’s productivity. It is only in this way that we can collectively expedite reductions in road trauma. The potential economic and social gains to Australia must not be ignored. It is now apparent that Australia’s performance in generating road death and injury reductions has not kept pace with world’s best standards. As detailed in the body of this report, Australia’s performance has not improved to the same degree as many Organization of Economic Cooperation and Development (OECD) countries since the year 2000. Australia’s ranking has therefore been slipping, and we need to commit to measuring our achievements on a global scale if we are to make the progress that our society deserves. The NRSS, launched in 2011 and now being reviewed, still has no cohesive action plan or budget linked to the proposed achievements, despite the efforts of many federal, state, professional and other bodies mentioned in the body of this report. This report outlines potential reasons for Australia’s declining road safety performance against international OECD reductions and puts forward suggestions for improvement – many of which lie with an increased commitment to collaboration. 8 Recommendations outlined in the report are as follows: 1. Increase the commitment to collaboration and inclusion across all levels 2. Develop overarching plans to decrease the current fragmented approach • Develop a National Road Safety Action Plan • Develop a National Road Safety Budget • Initiate a coordinated focus on injuries – collection of data and accurate baselines • Encourage broad recognition of the economic and productivity gains from reducing road trauma, across all portfolios, organisations and the Australian community • Develop a Road Safety Communications and Marketing Plan • Develop a National Road Safety Research Plan to complement the NRSRF • Develop Safety Targets for Vehicles and Roads Journal of the Australasian College of Road Safety – Volume 26 No.2, 2015 • Encourage constituency across the community – an innate desire to expedite trauma reductions • Develop demonstration projects – Collaborative identification and implementation of new programs 3. Support increased international collaboration 4. Increase our leadership capabilities 5. Commit to continued measurement of our success against world best standards 6. Remain courageously patient (and committed), and celebrate the achievements! Figure 1: Cost of road trauma to the Australian economy $Billion cumulative 2011-2020 (see Appendix 1 data) Figure 2: Australia’s performance in lowering the national road toll Comparison with performance of other OECD countries 2000-2012 (see Appendix 2 data) Full details of the submission are available at: http://www.acrs.org.au/2014/09/acrs 9 Journal of the Australasian College of Road Safety – Volume 26 No.2, 2015 2015 Australasian Road Safety Conference (ARSC) The Australasian College of Road Safety (ACRS), Austroads and Centre for Accident Research and Road Safety - Queensland (CARRS-Q), are inviting participation in the premier road safety conference for Australia, New Zealand and the Asia Pacific region - the inaugural Australasian Road Safety Conference (ARSC2015). ARSC2015 will be held at the Gold Coast Convention and Exhibition Centre, Queensland, from 14-16 October 2015. The ARSC2015 conference is the result of a successful merger of Australasia’s two premier road safety conferences: the ACRS Conference, and the Australasian Road Safety Research, Policing and Education Conference (RSRPE). With a theme of “Taking Action Together”, the conference will span the road safety issues identified in the United 10 Nations Decade of Action for Road Safety: Road Safety Management, Infrastructure, Safe Vehicles, User Behaviour and Post Crash Care. Showcasing the latest research, programs and developments in the field, ARSC2015 will feature a strong program of national and international keynote speakers, oral and poster presentations, workshops and symposia. The conference is expected to attract over 400 delegates including researchers, practitioners, policy-makers and students working in the fields of behavioural science; education and training; emergency services; engineering and technology; health and rehabilitation; policing, justice and law enforcement; local, state and federal government; traffic management; vehicle safety – and more. Austroads, CARRS-Q and the ACRS look forward to your participation in this important event which aligns with international, Australasian and national road safety efforts and is a significant step forward in Australasia’s road safety strategy. Further information: Register your interest to receive conference updates at www.australasianroadsafetyconference.com.au Journal of the Australasian College of Road Safety – Volume 26 No.2, 2015 Peer-reviewed papers Road trauma education: the impact of a patient presenter on the road safety attitudes of adolescents by Jeremy Buckmaster1,4, Casey Brownlie2,4, John Olver3,4, Bianca Fedele3,4 and Dean McKenzie3,5 Department of Occupational Therapy, Epworth HealthCare Department of Social Work, Epworth HealthCare 3 Epworth HealthCare 4 Epworth Monash Rehabilitation Medicine Unit, Monash University 5 Department of Epidemiology and Preventive Medicine, Monash University 1 2 Abstract Road trauma accidents remain a significant issue in Victoria, with a high proportion involving young drivers. Given this age group, school based road trauma education programs could be successful in alleviating such incidence rates. This study evaluated the effectiveness of an existing road trauma program on 107 secondary school students and determined whether an additional education session with a patient presenter elicited an increased change in attitudes relating to traffic safety. A control group received the program only (n=43) and an experimental group received the program and an additional session (n=64). Quantitative analysis using the ‘The Attitudes Towards Road Safety (ATRS) Questionnaire’ displayed some statistically significant differences. However, analysis of a separate qualitative questionnaire yielded stronger evidence for the positive impact of the additional session. This study demonstrates how educating students on the long term consequences of road trauma can positively impact upon their attitudes towards risk taking behaviour. Keywords Road trauma, Education, Traumatic brain injury, Rehabilitation, Adolescents Introduction Within Victoria, 299 people died and 5,878 people were hospitalised due to injuries sustained on Victorian roads in 2012 [1]. For those who survive a road traffic accident, many are left with physical, cognitive or behavioural deficits that can severely impact their quality of life. Deficits include loss of employment, changes in social participation, marital strain or separation and loss of friends/family support [2]. These issues can lead to social isolation and change not only the lives of those injured, but also their family, friends and local community. Young people appear to be over-represented in these statistics, with 24% (1,430) of patients aged 16-25 years old hospitalised in Victoria in 2012 [1]. Young drivers between 18-25 years only represent 14% of the driving population yet account for 23% of fatalities. Of the 34 young drivers killed on Victorian roads in 2012, 76% were male [3]. Males have been known to have a higher rate of road accidents than females and this gender difference is most marked in the population under the age of 25 years [4]. Some of the road accident risk factors in young people include peer pressure, inexperience, inappropriate speed, failure to wear seatbelts and drugs/alcohol [5]. These factors, combined with the effect of road trauma on the community, highlight the ongoing need for road trauma education programs. Recent literature indicates that school based learning programs can be a successful approach to reducing road fatalities and trauma. Attitudes towards safety are formed at an early age and on that basis it is important to target adolescents and young adults [6]. Evidence for the effectiveness of education in reducing risk-taking in adolescence is speculative; however this does not mean that innovative education programs should not be trialled [7]. Engström et al. in 2003 argued that communication campaigns that employ persuasive, emotional messages are the most effective where young drivers are concerned [8]. A recent study utilised a focus group of young adults (17-24 years old) to discuss various factors which could affect driving behaviours. These young people spoke about campaign effectiveness and felt that ‘who delivers the message is important’. In particular, it was thought that messages from ‘accident victims or their family members would hit home more, especially for high school kids’ [9]. 11 Journal of the Australasian College of Road Safety – Volume 26 No.2, 2015 The aim of the present research was to evaluate the effectiveness of an existing road trauma program (Traffic Safety Essentials – TSE) and determine the effectiveness of an addition to this program received by the experimental group (a personal account of trauma from a road accident survivor and rehabilitation staff member). It was hypothesised that the additional session will create a greater change in adolescent attitudes towards risk taking behaviour on the road, compared with those who did not receive the additional session. A secondary hypothesis was that there will be a difference in the attitudes towards risk taking behaviour between males and females. Method In collaboration with the Victorian Department of Education and Early Intervention, an additional road trauma education session was offered to Year 10 students at a Melbourne secondary school. This research received ethics approval from Epworth HealthCare’s Human Research Ethics Committee. Participants There were 160 Year 10 students (out of 269) who consented to participate (59.5% response rate). All students were eligible to participate if their person responsible (e.g. parent or guardian) consented through signing a Patient Information and Consent Form (PICF). No one declined to participate, but a significant number never returned their consent form. Participants were randomly allocated to either a control group (who received the TSE program) or an experimental group (who received an additional education session). A male patient (aged 22) previously admitted to Epworth HealthCare following a motor vehicle accident was recruited and consented for the additional session. The patient was a passenger who sustained a severe traumatic brain injury (TBI) with multiple orthopaedic injuries and was hospitalised for approximately six months after his accident. Inclusion criteria for selecting this patient were: aged between 18-40 years; involved in a road trauma accident over 12 months ago and sustained a TBI; support from outpatient therapists; and their willingness (and sufficient communication skills) to share their personal road trauma experience with students. Study Intervention All students participated in a traffic safety program routinely offered by the school known as the TSE Program, developed by the Transport Accident Commission (TAC), in partnership with other key Victorian agencies [10]. It consists of six units which cover various classroom road 12 safety activities. The experimental group also attended an additional education session facilitated by the researchers. The session included a presentation from a patient involved in a road traffic accident who was willing to share his road trauma and rehabilitation experience. The extra session commenced with a 15 minute introduction from a principal researcher outlining information on rehabilitation, TBI and choices/consequences around road safety. This was followed by a five minute video compiled by the patient presenter and a 25 minute semi-structured interview between the principal researcher and patient presenter. Materials All students were administered the ‘The Attitudes Towards Road Safety (ATRS) Questionnaire’ to measure attitudes relating to traffic safety issues pre and post the TSE Program and additional education session [11]. This validated instrument comprises 16 items which measure three dimensions of attitudes established through factor analysis: attitudes towards rule violations and speeding (e.g. “Speed limits are exceeded because they are too restrictive”); attitudes towards the careless driving of others (e.g. “I will ride with someone that speeds if that’s the only way to get home at night”); and attitudes towards drinking and driving (e.g. “I would never ride with someone I knew has been drinking alcohol”). Each question is scored on a five-point Likert Scale with higher scores indicating a ‘non-ideal’ attitude and lower scores indicating an ‘ideal’ attitude towards road safety. Student demographics and driving experience were collected including; age, gender and learner permit obtainment. The experimental group were also given a separate questionnaire to gather feedback about the additional session. Study Procedures Students were allocated class numbers (A-L) and student numbers (1-26) which created their student ID numbers used for this research (e.g. A1). The control and experimental groups were administered the ATRS Questionnaire during class time. Both study groups then participated in the routine TSE Program as part of their Year 10 curriculum. The experimental group also received the additional education session conducted by the patient presenter and researcher. The ATRS Questionnaire was then readministered by their teacher six months later to both groups and approximately one week after the additional session. The experimental group were also supplied with a qualitative questionnaire pertaining to the additional session (refer to Table 2). Data Analysis Responses from the ATRS Questionnaire were collated and statistically analysed using the IBM SPSS statistical package (Version 19, 2010). Descriptive statistics were Journal of the Australasian College of Road Safety – Volume 26 No.2, 2015 computed on participant demographics and driving experience including age, gender and learner permit obtainment. As there were only two time-points, a mixed betweenwithin subjects analysis of variance (ANOVA) was employed with one repeated within subjects variable (time) and two between subjects variables (gender and group) [12]. The ANOVA was conducted for each dimension to assess the impact of group (control/experimental) and gender (male/female) on participants’ responses across time (pre-intervention and post-intervention). Main effects of the independent variables (IV) (gender/time/group) as well as statistical interaction between the IV’s were evaluated. Main effects represent the separate effect of each IV on the dependent variable (DV) (participants’ responses) and interactions occur when the effect of one IV changes across the levels of another IV [13]. Independent samples t-tests evaluated any differences in age by gender and group. Qualitative responses from the post feedback questionnaire were subjected to thematic analysis –‘a method for identifying, analysing and reporting patterns (themes) within data’ [14]. Collated data containing numerous quotes and ideas were evaluated independently by two researchers (an Occupational Therapist and Social Worker). Researchers went through the routine thematic analysis process, distilling codes (items) from the responses and sorting them into various themes. Researchers ensured their independent codes and themes were compared until full agreement was reached for each theme. Themes allowed researchers to summarise data, make ‘bulky data manageable’ and assisted in drawing conclusions about what is being investigated [15]. For example, the following quote from a student was categorised as ‘Passenger Awareness’- “I would never get in the car with a risky driver or someone who is intoxicated because I now know the consequences and I don’t want to experience them for myself.” Results Of the 160 consenting participants, 124 (77.5%) were available at the commencement of this study and were randomly allocated to either the control group (N= 46) or experimental group (N= 78). Participants comprised 61 (49.2%) males and 63 (50.8%) females with a collective mean age of 15.20 years (SD=0.58). There were only five (4.0%) participants who obtained a learner permit for a mean of 4.80 months (SD=4.27). Of the total consenters (n=160), 43 (26.9%) were excluded due to incomplete data sets (two students completed pre-intervention questionnaire only, 35 completed post-intervention questionnaire only, one did not complete either questionnaire and five had missing data on at least one scale item). A further 10 (6.3%) were excluded due to ID errors, whereby teachers mismatched the same participants to different ID’s from pre to post intervention. Overall, there were 53 (33.1%) participants excluded resulting in a final analytic sample of 107 participants. Table 1. Mean and standard deviations by main effect Control Main Effect Dimension Group 1 ‘violations/speeding’ 2 ‘careless driving’ 3 ‘drink/driving’ mean 21.14 4.48 2.98 standard deviation 4.55 1.33 1.31 Experimental n mean 43 43 43 22.80 5.72 3.13 Male Main Effect Dimension Gender 1 ‘violations/speeding’ 2 ‘careless driving’ 3 ‘drink/driving’ mean 23.02 5.53 3.36 standard deviation 5.03 1.90 1.60 n 64 64 64 Female n mean 56 56 56 21.16 4.88 2.75 Pre-Intervention standard deviation 4.76 1.70 1.15 n 51 51 51 Post-Intervention 1 ‘violations/speeding’ 2 ‘careless driving’ 22.84 standard deviation 5.52 5.60 2.28 107 4.84 1.86 107 3 ‘drink/driving’ 3.02 1.75 107 3.11 1.81 107 Main Effect Dimension Time standard deviation 5.16 1.95 1.51 mean 21.42 standard deviation 5.69 107 n mean 107 n 13 Journal of the Australasian College of Road Safety – Volume 26 No.2, 2015 The analytic sample had 43 (40.2%) participants in the control group and 64 (59.8%) in the experimental group. There were 56 males and 51 females with a mean age of 15.20 (SD=0.44) and 15.29 (SD=0.65) respectively. Independent samples t-tests revealed no statistically significant differences in age by gender (t = -0.88, p= 0.38). There were also no significant differences in age between the control group (M = 15.27, SD = 0.50) and the experimental group, (M=15.22, SD = 0.58); (t = .42, p= 0.68). Only four (3.7%) students obtained a learner’s permit for a mean of 3.75 months (SD= 4.11); a rate much lower than those actually eligible for a permit (students aged ≥ 16 years: 20.6%). Statistical analyses are presented according to each attitude dimension within the questionnaire. For each dimension, means and standard deviations (Table 1) were calculated by main effect (group, gender and time). Dimension 1: Attitudes towards rule violations and speeding ANOVA assessed the impact of group type (control: experimental) and gender (male: female) on participants’ responses to Dimension 1 at pre and post intervention. There was no statistically significant interaction between gender, group and time, (F1, 103 = 0.75, p=0.39), suggesting that the effect of time is not a function of gender or group type. There was a significant main effect for time, (F1, 103 = 6.02, p=0.02), with participants showing a decrease in scores from pre-intervention (M= 22.84, SD = 5.52) to postintervention (M= 21.42, SD= 5.69) irrespective of group or gender. There were no statistically significant main effects for group or gender, although the latter trended towards statistical significance with males yielding higher scores (M= 23.02, SD=5.03) than females (M=21.16, SD=4.76), (F1, 103 = 3.4, p=0.07). Dimension 2: Attitudes towards the careless driving of others There was no statistically significant interaction between gender, group and time, (F1, 103 = 2.19, p=0.14). There was a significant main effect for time, with all participants, regardless of gender or group showing a reduction in scores from pre-intervention (M=5.60, SD=2.28) to postintervention (M=4.84, SD=1.86), (F1, 103 = 15.02, p <.0001). There was also a main effect for group, with participants in the control group (M=4.48, SD=1.33) scoring lower than the experimental group, irrespective of gender or time (M=5.72, SD=1.95), (F1, 103 = 11.79, p=0.001). Gender did not produce a statistically significant main effect, however it approached statistical significance (F1, 103 = 2.86, p=0.09) with males scoring higher (M=5.53, SD=1.90) than females (M= 4.88, SD=1.70). 14 Dimension 3: Attitudes towards drinking and driving There was no statistically significant interaction between gender, group and time, (F1, 103 = 0.439, p=0.51). The main effect for time was also non-significant, with participants showing no change in scores over time, (F1, 103 = .453, p=0.50). There was a significant main effect for gender, with males (M=3.36, SD=1.60) scoring higher than females (M=2.75, SD=1.15), (F1, 103 = 5.07, p=0.03). Group type did not produce a statistically significant main effect. Qualitative Data A qualitative post questionnaire was completed by 84 students who attended the additional session, however some students failed to complete certain questions. The number of responses from the students ranged from 73 to 84 and so all percentages are based on the number of students who answered the questions (rather than the total amount of questionnaires returned). Table 2 is a summary of the categories identified through thematic analysis and examples of direct quotes to highlight particular responses. A maximum of two quotes per student were used to capture more diversity. Discussion The quantitative data displayed some statistically significant differences between the variables, namely main effects for gender and group, although these results did not differ across time. Young male drivers have been known to be more prevalent in statistics on road trauma and consequently fatalities in Australia. The cause behind this can be multifold; however literature has highlighted alcohol involvement as a main contributor to road fatalities and injuries [16]. In Australia, there is an increased prevalence of drink driving in young adults, ranging from 20-25% [17]. The results of this study were in line with these general findings, with males displaying significantly increased scores (non-ideal attitudes) towards drinking and driving (Dimension 3) than females. Although not significant, males also scored higher than females on the two remaining dimensions indicating increased non-ideal attitudes towards rule violations/speeding and careless driving of others. The experimental group also scored significantly higher than controls (irrespective of gender or time) for attitudes towards the careless driving of others (Dimension 2). The reasoning behind this is unclear; however it queries whether the additional session could have honed in on this particular dimension. The qualitative data provided stronger evidence of the impact that the additional education session had on students. Even though the post questionnaires were Journal of the Australasian College of Road Safety – Volume 26 No.2, 2015 completed one week after the presentation, 62% of students mentioned the patient presenter by name in their responses. It may have been that for many of the students, the patient presenter became the face of road trauma for them. Meeting a victim in ‘real-time’ could have personalised each student’s experience by showing them the long term consequences of risk taking behaviour. Of the students, 58% reported feeling emotional, sad or sorry for the patient presenter and 32% described the presentation as ‘eye opening’. The emotional responses from the students to the additional session demonstrated that this format was one which has the potential to make a significant impact over time. The students’ positive responses towards increased awareness of TBI and in particular of choices and consequences demonstrated how the messages put forward during the additional session were heard and clearly understood. Further evidence of the connection between students and the patient presenter is that 45% of students reported that “getting into the car with a drunk driver” was a risk they would not take (categorised as ‘Passenger Awareness’). The patient presenter spoke of his accident circumstances; accepting a ride home with a driver he did not realise was over the legal limits for alcohol consumption. Other common responses such as not speeding or driving under the influence were expected, but the researchers feel that the large portion of students who referred to ‘passenger awareness’ was directly linked to the patient presenter’s personal story. A focus of the principal researcher’s presentation within the additional education session involved ‘choices and consequences’. The term ‘hidden road toll’ was used during the principal researcher’s presentation to discuss the high number of road trauma victims who suffer long term consequences for the remainder of their lives. It is noted that 74% of the students made reference to ‘choices and consequences’ when answering the qualitative question related to what they learnt from the presentation. There were also 41% of students that referred to ‘choices and consequences’ when answering how the presentation changed their views on risk taking. The researchers believe that this demonstrated the importance of providing a framework for the students; assisting them to process and further understand the emotional and confronting personal account told by the patient presenter. A secondary gain from the additional education session was an improved understanding of TBI by the students; thirty-five percent referred to an improved understanding of TBI and its impact on someone’s overall life in their qualitative responses. When asked the best way to try and reduce young people taking risks on the road, no students recommended the school based TAC TSE Program. Forty six percent recommended the additional session involving the patient presenter and principal researcher and 28% recommended more policing and/or harsher penalties for driving offences. Interestingly, only 6% recommended more television advertising, questioning this as an effective means of targeting this age group. The students were asked whether all Year 10 students should have an opportunity to attend a similar education session and 96% answered yes. Forty percent of the students rated the additional session a 10 out of 10 and 91% rated the additional session as an eight or higher indicating a very positive response. One of the challenges for the principal researchers was trying to connect with and impact upon young male students. Fifty one percent of the students who completed the qualitative questionnaire were male, and 48% reported feeling emotional, sad or sorry for the road trauma presenter. One male student wrote that he “felt moved by the presentation. It changed my perspective of road safety and decision making skills.” Another wrote that “this presentation had a deep impact on me emotionally.” The additional session’s focus on choices and consequences had an impact on the male students, with 65% using those terms in their responses. One male student wrote that “it eliminated the wishful thinking of ‘it won’t happen to me’ or ‘even if it does happen to me, it can’t be that bad’.” Another wrote that “it made me realise how precious life is and how one stupid mistake can wreck your life.” These results demonstrate how the additional session can impact upon one of the main target groups for risk taking behaviour, young males. When reviewing the qualitative responses from students the principal researchers were also looking for any constructive criticism from the students. There were only two comments made by all of the 84 students that were classed as feedback or constructive criticism; “It could have been a little more hands on or audience involved” and “Could have used 2 patient presenters.” A limitation of this type of study is the possibility of “ceiling effects”, whereby pre-questionnaires contained a high level of ‘ideal’ responses. Ceiling effects arise when scores cannot increase because they are already close to the maximum scale value [18]. Due to the wide use of road safety campaigns in the media, the students may already have had attitudes that were close to ideal, and so there may have been little room for improvement on the postintervention questionnaire. This may have been a barrier to ascertaining the effectiveness of the additional session, which may have been ‘preaching to the converted’ as it were. A further limitation of this study was that the ATRS Questionnaire was developed in 2004 for Norwegian adolescents. While the questions appeared to be relevant to an Australian population, further research on scale validation would be required. 15 Journal of the Australasian College of Road Safety – Volume 26 No.2, 2015 With regard to future education programs, the principal researchers are keen to highlight the importance of using a semi-structured interview to support the patient presenter, as it allows for rehearsal, emotional support and guidance as required. The concern from allied health clinicians and family was that the patient presenter’s cognitive deficits including poor attention and memory could lead to a repetitive presentation that lacked structure and guidance. Further research opportunities also exist by exploring the benefits for patient presenters. As well as providing a vocation and sense of value, it may also improve self esteem and confidence. Future road trauma educational programs focused on young males may also be justified to reduce driving under the influence and improve the already established ‘non-ideal attitudes’ towards drink driving [17]. Conclusion The researchers hope that the findings of this research will help to shape future road trauma education strategies for students. It is possible that one of the biggest challenges in road trauma education is bridging the gap that lies between students ‘knowing’ and ‘making’ the right choices. The researchers believe that this study demonstrates that one of the best ways to bridge this gap is through improving the students’ understanding of the severe long term consequences following a road trauma accident. It is not possible to demonstrate the long term consequences of road trauma education. It cannot be ascertained whether an additional education session such as the one facilitated by the researchers will actually impact upon someone’s choice to participate in risk taking behaviour in the future. However the researchers believe that it is imperative that students are made aware of the consequences of such risks, utilising the personal stories of road trauma survivors as a medium that has the potential to leave a lasting impression on them. Acknowledgements The authors thank Sam Howe (patient presenter), Sean McGuigan (Epworth Clinical Trials Research Centre), the Department of Education and Early Intervention, the Transport Accident Commission, Werribee Secondary College, as well as the students themselves. References 1. 2. 16 Road Safety Statistical Summary February 2013 Geelong: Transport Accident Commission 2003. Available from: http:// www.tac.vic.gov.au/__data/assets/pdf_file/0018/35361/Feb13-RSSS.pdf. Ponsford J, Sloan S, Snow P. Traumatic Brain Injury: Rehabilitation for Everyday Adaptive Living. East Sussex: Psychology Press; 2013. 3. Young Driver Statistics Geelong: Transport Accident Commission. Available from: http://www.tac.vic.gov.au/ road-safety/statistics/summaries/young-driver-statistics. 4. McKenna FP, Waylen AE, Burkes ME. Male and female drivers: how different are they? : AA Foundation for Road Safety Research; 1998. Available from: http://www. roadsafetyfoundation.org/media/11338/male_and_female_ drivers_-_how_are_they_different.pdf. 5. Hatfield J, Fernandes R. The role of risk-propensity in the risky driving of younger drivers. Accident Analysis and Prevention. 2009;41(1):25-35. 6. Berg HY. Reducing crashes and injuries among young drivers: what kind of prevention should we be focusing on? Injury Prevention. 2006;12 Suppl 1:i15-8. 7. Waylen AE, McKenna FP. Risky attitudes towards road use in pre-drivers. Accident Analysis and Prevention. 2008 May;40(3):905-11. 8. Engström I, Gregersen NP, Hernetkoski K, Keskinen E, Nyberg A. Young novice drivers, driver education and training. Literature review. VTI rapport 491A. 2003. 9. Glendon I. Influences on young drivers’ reported driving behaviours and perceptions: A focus group study. Journal of the Australasian College of Road Safety. 2013;24(1):16-29. 10. Road Safety in Schools Geelong: Transport Accident Commission. Available from: http://www.tac.vic.gov.au/ road-safety/schools. 11. Rundmo T, Iversen H. Risk perception and driving behaviour among adolescents in two Norwegian counties before and after a traffic safety campaign. Safety Science. 2004;42(1):121. 12. Field A. Discovering Statistics Using SPSS. 4th ed. Thousand Oaks, California: Sage; 2013. 13. Bordens KS, Abbott BB. Research Design and Methods A Process Approach. 7th ed. USA: McGraw-Hill; 2008. 14. Braun V, Clarke V. Using thematic analysis in psychology. Qualitative Research in Psychology. 2006;3(2):77-101. 15. Browne J. 25.Grounded Theory Analysis: Coming to Data with Questioning Minds In: Minichiello V, Sullivan G, Greenwood K, Axford R, editors. Handbook of Research Methods for Nursing and Health Sciences. 2nd Ed ed. Sydney, NSW: Prentice Hall; 2004. 16. Terer K, Brown R. Effective drink driving prevention and enforcement strategies: Approaches to improving practice: Australian Government: Australian Institute of Criminology; 2014. Available from: http://www.aic.gov.au/media_library/ publications/tandi_pdf/tandi472.pdf. 17. Evans-Whipp TJ, Plenty SM, Toumbourou JW, Olsson C, Rowland B, Hemphill SA. Adolescent exposure to drink driving as a predictor of young adults’ drink driving. Accident Analysis and Prevention. 2013 Mar;51:185-91. PubMed PMID: 23246711. Pubmed Central PMCID: 3576432. 18. Haslam SA, McGarty C. Doing Psychology: An Introduction to Research Methodology and Statistics. London: Sage Publications; 1998. Journal of the Australasian College of Road Safety – Volume 26 No.2, 2015 Table 2. Qualitative responses Question Responses How did you feel after hearing the presentation and why? • 58% reported feeling emotional, sad or sorry for the road trauma presenter. • 32% referred as ‘eye opening.’ • 18% reported feeling a need to change their current behaviour. • No students reported that it did not impact upon them. What did you learn from the presentation? • 74% used the terms choices and consequences. • 35% refer to an improved understanding of TBI. • 1% did not report learning anything from the presentation. What risks would you never take when it comes to road safety? • 80% reported that they would never drive under the influence of alcohol or drugs. • 45% referred to passenger awareness and not getting into the car with a drunk driver. • 27% reported that they would not speed. • 46% mentioned the patient presenter’s video. • 72% mentioned the patient presenter and principal researcher discussion. • 5% mentioned the principal researcher presentation. What was the most effective part of the presentation and why? Participants’ Quotes • “I felt changed after hearing the presentation and felt guilty for not being careful enough. It made me be more careful but it was powerful due to it’s personal experience that made it real” • “I feel invincible and Sam did too but based on what happened to him it scared me a little” • “I felt moved by the presentation. It changed my perspective of road safety and decision making skills” • “I learnt that even if you are lucky enough to escape a crash with your life, there may still be horrible consequences and will take a lot of pain, patience, work and rehabilitation, and even then you may never be the same” • “…the hidden road toll which included those who have been severely injured and their lives basically changed forever. Noone sees that figure of 6,000 people” • “The consequences…doesn’t have to be death, it could be worse” • “I would never get in the car with a risky driver or someone who is intoxicated because I now know the consequences and I don’t want to experience them for myself” • “I would never drive more than 10km faster than the speed limit” • “ When he spoke about his life…it really showed that it doesn’t necessarily stop, it’s a life time consequence” • “The most effective part of the presentation was when he spoke to the class because he told us in more detail the pain and suffering he has had to go through to get where he is today” • “Having Sam there was very effective because he is a real person and not just a statistic. We could see how his life was effected and all the struggle he went to” 17 Journal of the Australasian College of Road Safety – Volume 26 No.2, 2015 Question Responses Participants’ Quotes In what way, if any, did the • 41% reported being more aware of • “It made me realise if someone is in an presentation change your choices and consequences. accident and they make it out - surviving views about risk taking on the • 41% reported that they would now be is just the start of the journey. There is a road? long road to get back to normal, if that is more cautious. possible” • 26% reported that it was a reminder • “It made the consequences seem more about risk taking. real and scary meeting a survivor of an • 12% reported that it did not change accident. I want to be even more careful their views. on the road” In what ways can a severe • 66% referred to changes in everyday • “A severe injury can break apart friendships, make someone lose their injury from a road accident life, work and study. memory and physically hinder them from affect your life in the future? • 45% referred to physical issues. going on with the rest of their life” • 31% referred to cognitive issues. • 30% referred to a decreased level of independence. • 29% referred to friendships and relationships issues. What would be the best way • No students recommended the school • “Educate them more, especially more of the presentations that Epworth does” to try and reduce young based TSE Program. people taking risks on the • “Show examples of people who have • 46% recommended the additional road? experienced them. Not holding back any session involving the patient details and giving all the information and presenter and principal researcher. outcomes” • 28% recommended more policing • “By demonstrating the significance severe and/or harsher penalties for driving. accidents can have and showing real life • 22% recommended more education examples such as Sam showing how it has but did not specify what type. affected his life” • 6% recommended more television advertising. Should all Year 10 students • 96% answered yes to the question. • “The reality is more real when in front of have an opportunity to hear you, not just in videos or TV adverts” • 1 student answered no to the a similar presentation? If so, question, stating that “some students • “Yes, because it was a moving why? may be aware of road trauma or presentation with a good message. Some similar instances.” people may change their views about road safety after seeing it” • 2 students answered “I don’t know.” • “Some won’t listen until they hear it from someone who has been in an accident and they see the consequences” Overall, what would you rate • 40% rated the presentation a 10 out • “This presentation had a deep impact on the presentation out of 10? of 10. me emotionally” • 91% rated the presentation as an 8 or • “More aware, hits you stronger than just higher. a board presentation (billboard) or TV advert” • The lowest score was a 6 out 10 from 1 student. • “I cried and stayed behind to talk to Sam because it had a big impact on me and I would recommend everyone seeing it” • “I liked how Sam showed how his life was before because he was normal like everyone else but that decision made his life change” 18 Journal of the Australasian College of Road Safety – Volume 26 No.2, 2015 Comparison of Victorian road trauma trends using traditional and alternative measures of serious injury derived from linked data by Angelo D’Elia1and Stuart Newstead1 Monash University Accident Research Centre Monash Injury Research Institute Building 70, 21 Alliance Lane, Clayton Campus Monash University VIC 3800 angelo.d’[email protected] 1. Abstract Systematic problems have been identified in Victoria’s road safety data system collection, collation and management which have led to problems in the measurement of serious injury. In particular, measurement of the severity of injury sustained in road crashes for the purpose of monitoring the road toll and trends in road trauma relies largely on the classification of injury outcome by police when reporting a crash. As a consequence trends in serious injury, a key outcome measure of performance in the Victorian road safety strategy, may not reflect actual serious injury trends or the effectiveness of the strategy. Previous research has described a range of alternative measures of serious injury that could potentially be calculated consistently over time from Victorian road safety data sources. These include those related to resource use, threat to life and the non-fatal burden of injury. This paper outlines data requirements required to calculate alternative measures of serious injury that could potentially be adopted in the road safety domain and describes the creation of a linked dataset of police reported crash records and Transport Accident Commission (TAC) claims data containing high level injury outcome information able to be used to derive various measures of serious injury. It then presents a comparison of serious injury trends using traditional police reported measures and alternative measures derived from the linked dataset. Such comprehensive information will facilitate a sound evidence base on factors determining serious injury outcomes, allowing good evidence-based policy and practise to be developed to effectively address the problem. Introduction Whilst the definition of a fatality resulting from a road crash is clear, the definition of serious injury has been problematic in Victoria as it has been in many other jurisdictions. Over the past years, the definition of serious injury in Victoria derived from police crash reporting has varied as have the operational procedures for collecting the data. Furthermore, the degree to which the accuracy measurement of serious injury has been validated has varied over time. As a consequence of the ongoing changes to the serious injury definition and crash data systems, trends in the serious injury measure over time may not reflect real serious injury trends. Issues surrounding the definition and measurement of serious injury due to road trauma in Victoria have also been highlighted as part of a recent parliamentary inquiry into serious injury [14]. The Monash University Accident Research Centre (MUARC) has previously completed work exploring the feasibility and benefits of establishing a linked road injury database including police reported crash data; data on TAC claims for injury compensation from road crashes; hospital admissions data collected by the health department; and in-depth crash inspection data collected by MUARC. Results of the project showed linkage of police reported crash data with the TAC claims dataset is feasible and results in a combined database more capable of measuring detailed injury outcome consistently over time. The use of TAC claims data linked to police reported crash data was established as a way in which a consistent measure of trends in serious injury in Victoria could be provided for use in road safety performance monitoring and for road safety research. Subsequently, MUARC collaborated with the TAC to establish a linked TAC claims and police crash dataset for use in road safety research and for monitoring trends in serious injury in Victoria. The project included specifying the content of the database and establishing an ongoing linkage process by the TAC. The project performed a review of available measures of injury severity in order to establish measures that can be calculated consistently over time and identified the most appropriate measures of serious injury that can be calculated from the TAC held or derived injury information in the linked dataset. This paper outlines data requirements required to calculate alternative measures of serious injury that could potentially be adopted in the road safety domain. It also describes 19 Journal of the Australasian College of Road Safety – Volume 26 No.2, 2015 the creation of the linked dataset of police reported crash records and Transport Accident Commission (TAC) claims data containing high level injury outcome information used to derive various measures of serious injury. It then presents a comparison of serious injury trends using traditional police reported measures and selected alternative measures derived from the linked dataset. Alternative measures of serious injury and their calculation There is a significant body of research describing a range of alternative measures of serious injury with a number of these already in common use internationally. There are a range of these measures that could potentially be used as a new measure of serious injury from road crashes. D’Elia and Newstead [5] considered alternative measures or measures of serious injury that could potentially be calculated consistently over time for use in road safety performance monitoring and for research. It included a review of available measures of injury severity that could potentially be calculated from Victorian road safety data sources. The following were recommended as potential measures grouped by their underlying philosophical derivation: Resource Use • Hospital Admission • Probability of hospital admission given crash involvement • Length of hospital stay Threat to Life • • Abbreviated Injury Scale (AIS) injury severity score and associated scores • Maximum AIS (MAIS) across all body regions • Injury Severity Score (ISS) and New Injury Severity Score (NISS) ICD (International Classification of Diseases) Based Injury Severity Score (ICISS) Non-Fatal Burden of Injury • Disability-Adjusted Life Years (DALY) Resource use measures Resource use measures are based around the simple premise of counting the number of people utilising a health resource. In general, measures relating to resource use are popular because they are relatively simple to calculate and they provide a reasonable, albeit somewhat coarse, indication of injury severity. They have some significant 20 weaknesses however, including the potential of being affected by hospital admission policy and changes to funding models and the problem of often being non-specific with a wide variety of injury outcomes often encompassed within a single resource use measure. This means that in some instances trends in serious injury measured from resource use may vary over time with no underlying change in real injury rates whilst at other times the measure might be invariant to real changes in certain important injury types. Resource use information can be obtained directly from the Victorian Admitted Episodes Database (VAED) collected by the Victorian Department of Health. Hospital admissions from road traffic crashes can be identified in the VAED, however without linking VAED data to police reported crash data, no other details of the crash important for research and policy development are known. Hospital admission information is also available from TAC claims data for those cases which make a TAC claim for hospitalisation with the information drawn from the VAED by the TAC through the process of recompensing hospital admission costs. Threat to life measures Broadly speaking, threat to life measures of injury severity provide a measure of the probability that a patient will die from the injuries sustained. The Abbreviated Injury Scale (AIS), first published in 1971 by the Association for the Advancement if Automotive Medicine [4], was designed to catalogue anatomic injuries sustained in motor vehicle crashes. Its primary role was to aid in crash investigations by providing detailed anatomical descriptions of occupant injury [11]. The AIS has two components: (1) the injury descriptor which is a unique numerical identifier for each injury description; and (2) the severity score. The severity score ranges from 1 (minor) to 6 (maximum). An AIS 1 injury will generally not require hospital treatment, whereas an AIS 6 injury is almost certainly fatal [17]. The actual scores to be assigned to various types of injury were derived by consensus among a wide variety of medical specialists [15]. As trauma patients commonly have more than one injured body part, the severity score for the most severe injury is often used – this is termed the Maximum AIS (‘MAIS’). The AIS severity score has some limitations including that it does not address the effects of multiple injuries within one particular body region and scores are not necessarily comparable across body regions. The Injury Severity Score (ISS), created in 1974 and based on the AIS, was developed as a means for describing patients with multiple injuries using a single severity score [1]. To calculate an ISS for an injured person, the body is divided into six body regions (head or neck, face, chest, abdomen or pelvic contents, extremities or pelvic girdle, external injuries) and only the highest AIS severity score in each body region is used. The three most severely injured body regions have their score squared and added together Journal of the Australasian College of Road Safety – Volume 26 No.2, 2015 to produce the final ISS. A modification of the ISS, the New Injury Severity Score (NISS) was developed in 1997 to address the issue of multiple injuries in the same body region [12]. It is very similar to the ISS except it scores the three most severe AIS scores regardless of their body region location, therefore, multiple injuries within a body region can be accounted for. AIS codes can be assigned directly to road crash injury data by experienced coders who have the clinical details of each injury sustained - a highly time consuming and specialist process. Historically, AIS coding of road crash information has only been used in in-depth crash investigations and although it does occur for major trauma patients, it is almost never seen on mass data records on hospital admission which is important if we wish to capture the complete picture of road trauma. None of the road crash data sources currently available in Victoria include AIS injury coding. AIS and derivative scores (ISS and NISS) can be derived from ICD codes through complex mapping processes and computer programming to convert the codes for the injury diagnoses into an injury severity score. Rather than being consensus-derived the International Classification of Disease Injury Severity Score (ICISS) is data-derived and, in contrast to the classifications mentioned previously, is based on the actual average fatality rate for a specified injury calculated using a large trauma database. Originally defined in 1996 the ICISS is a score between 0 and 1 and is a “threat-to-life” method that involves estimating probability of death for each ICD injury diagnosis code [13]. Determining an ICISS score involves calculating a survival risk ratio (SRR) for each individual injury diagnosis, using a large sample of injured people from the trauma database. An SRR is the proportion of cases with a certain injury diagnosis in which the patient does not die, or in other words, a given SRR represents the likelihood that a patient will survive a particular injury. Each patient’s final ICISS score (survival probability) is calculated by multiplying the probabilities of surviving each of their injuries individually. This may be a single SRR, as in the case of a patient with a single injury, or it may be multiple SRRs, as in the case of a patient with multiple injuries [13]. A severity threshold can then be used to classify hospital admissions as either “serious” or “nonserious”. Benefits of using ICISS include that it accounts for multiple injuries; it is not dependent on a specific version of the International Classification of Diseases (ICD) codes; scores can be calculated directly from the injury codes contained in a given dataset and, it can be applied retrospectively. Limitations include that SRRs generated in one country may not be applicable to another due to different health care systems (may not be externally valid), and SRRs within countries, or even within areas in countries, may become less reliable due to changes in case outcomes over time. However, the recent availability of SRRs calculated specifically for Victoria [2] goes some way in addressing the limitations of using ICISS for calculating trends in serious injury. Non-fatal burden of injury measures A comprehensive review of non-fatal burden of injury measures was undertaken in a recent MUARC PhD thesis [18]. It identifies only three measures that have been used to estimate the burden of injury employing routinely generated epidemiological data. These are disability adjusted life-years (DALYs) and quality adjusted lifeyears (QALYs), which can both be estimated directly from ICD injury codes, and the Functional Capacity Index (FCI) based on AIS. Given the international recognition of the methodology and the availability of data to support its calculation, D’Elia and Newstead recommended the DALY as a potential alternative measure of serious injury from road crashes [5]. As described by Murray and Lopez [10], one DALY can be thought of as one lost year of “healthy” life. Watson [18] noted that DALYs were developed solely for use at the population level by the WHO in characterising the global burden of disease and injury. This raises some questions about the appropriateness of using DALYs assigned to an individual as a measure of injury severity as would be necessary in the road safety context. However, it was also noted that DALYs provide an inexpensive, efficient but “broad-brush” approach to estimating disease burden and the impact of interventions. D’Elia and Newstead [5] note that measuring the non-fatal burden of injury in road safety would be of significant interest but measures such as the DALY still require appropriate validation prior to use within the road safety context. Calculation of the DALY measure requires a number of items of data including the normal life expectancy of a person based on their age at time of injury, disability weights associated with each injury type and the average duration of the injury until recovery or death. The Australian Bureau of Statistics (ABS) regularly produces life expectancy tables that can be used for calculating DALYs. Access to the other two measures is more problematic. Like AIS or ICISS measures, calculation of DALYs also requires ICD coded injury data that can be obtained directly from the VAED or TAC claims data. An intrinsic property of the DALY that is important to consider in its implication for road safety policy is that it weights death and disability more highly for younger people than for older people. Use of the DALY as a measure of road safety performance could have the impact of giving less weight to countermeasures which target older road users than those targeting younger road users. The impact of this consequence would need to be carefully considered. The Linked TAC-RCIS system Motivated by problems with the current road safety data systems with respect to measuring injury outcomes D’Elia 21 Journal of the Australasian College of Road Safety – Volume 26 No.2, 2015 and Newstead [7] explored the feasibility of establishing a linked road injury dataset including police reported crash data, TAC claims data, hospital admissions data from the VAED and in-depth crash inspection data. Due to the enormity of the task of gaining approvals to link each of these data sets using personal identifiers, the project used de-identified linkage methods. Results showed linkage of police reported crash data from VicRoads’ Road Crash Information System (RCIS) with the TAC claims dataset was feasible and resulted in a combined dataset more capable of measuring detailed injury outcome consistently over time. An important finding of this project was that the deidentified linkage of hospital admissions data was not found to be feasible; concluding that successful linkage would require identifying information. Although hospital admissions from traffic accidents can be generally identified in the VAED through use of the ICD External Causes codes and the TAC claim status recorded, there was found to be not enough other information to enable a reliable match without using personal identifiers. This was not considered a fundamental flaw as the critical VAED injury code information is already passed to the TAC and included in their claims data. The limitation it creates is not being able to identify VAED road crash cases that did not lodge a TAC claim. We note that adding VAED data to the linked TAC-RCIS data would offer some value, however the incremental benefit of linking the VAED to the TACRCIS system would need to be assessed in order to judge the merit of including the VAED. Depending on the final definition of serious injury, it could be the case that a very large proportion of serious injuries are already captured in the linked TAC-RCIS crash dataset, and the extra coverage that linking the VAED would provide might not be worth the investment required to overcome the technical and other issues associated with that linkage. A subsequent study conducted by D’Elia and Newstead [5] saw MUARC collaborate with the TAC to establish a longterm on-going linked TAC-RCIS database. The capability for measuring detailed injury outcomes comes primarily from the ICD-10-AM injury codes in the TAC hospitalised claims data which are obtained from the Department of Health via the process of the TAC recompensing the Department of Health for hospital costs. For non-hospital admission claimants, the TAC codes injuries in-house using the Systematized Nomenclature of Medicine - Clinical Terms (SNOMED CT). Each set of injury coding systems are mapped internally by the TAC to ICD-9-CM and the current version of the TAC-RCIS dataset contains the full set of injury information in the ICD-9-CM format. D’Elia and Newstead [5] also aimed to establish the use of TAC claims data linked to police reported crash data as a way of providing a consistent measure of trends in serious injury in Victoria. In particular, the broad objectives of the project were to establish: 22 1. an on-going linked dataset of police reported crash records and TAC claims data for use in a broad range of research requiring injury outcome information; and 2. a measure or measures of serious injury derived from the linked dataset that can be calculated consistently over time for use in road safety performance monitoring and as for base research. As mentioned earlier, the first aim was achieved through MUARC collaborating with the TAC in order to develop a linked TAC-RCIS dataset. This included specifying the content of the dataset and establishing an on-going linkage process by the TAC noting that the TAC have linked claims data with police crash records over many years. To achieve the second aim, the injury coding practices of the TAC were reviewed and issues such as the use of multiple coding systems and their potential translation into a single system were examined. The TAC linked dataset included information from the following sources: • TAC Claims Dataset; • Victoria Police Traffic Incident System (TIS, known as VPARS – Victoria Police Accident Records System – at the TAC); and • VicRoads Road Crash Information System (RCIS). TIS was used to add crash details to TAC claims that did not link to RCIS. In order to allow for the broadest possible research uses, the linked dataset included as many relevant variables from each data source as possible after taking into account privacy considerations. The findings of the MUARC research projects have been significant as they demonstrate that the underlying data to support the measurement of a range of alternative measures of serious injury has already been developed. This data system not only supports the calculation of these new measures but also contains all the other required information to facilitate the range of monitoring, policy and research uses that will need to be carried out using whichever new measure or measures of serious injury is adopted. Calculation of demonstration time series for selected measures of serious injury This section presents demonstration monthly time series of a number of the alternative measures of serious injury identified above for the period 2001-2010 inclusive. These measures have been calculated using the linked TAC-RCIS dataset and are presented along with the traditional measure derived from police reported crash data (currently hospital admission). The following measures were selected for comparison and are presented in Figure 1: Journal of the Australasian College of Road Safety – Volume 26 No.2, 2015 A more detailed description of each measure follows: The following threat to life measures are derived from TAC claimant injury information available in the TACRCIS linked dataset. As explained earlier, the TAC obtains injuries coded to ICD-10-AM from the Department of Health for hospital admitted cases and codes injuries in-house using SNOMED CT for non-hospital admission claimants. Each set of injury coding systems are mapped internally by the TAC to ICD-9-CM and the current version of the TAC-RCIS dataset contains the full set of injury information in the ICD-9-CM format. For the purpose of calculating demonstration time series, the ICD-9-CM coding system was used meaning that all injuries sustained by all claimants have been included, although it is expected that claimants that have been seriously injured would have been admitted to hospital. Serious Injury - Police MAIS ≥3 and MAIS ≥2 This measure is derived from police reported crash data and has been extracted from the official state road crash statistics held in the VicRoads administered Road Crash Information System (RCIS) being the number of persons seriously injured each month. The Stata module ICDPIC (ICD Programs for Injury Categorization) [16, 3] was used to classify injuries into a severity and body region. This allowed the ICD-9-CM diagnosis codes to be mapped into the Abbreviated Injury Scale (AIS) by body region. Maximum AIS (MAIS) across all body regions was then determined. Claimants with MAIS greater than or equal to 3 (serious injury) and with MAIS greater than or equal to 2 (moderate injury) were identified. Each series shows the monthly number of persons with MAIS ≥ 3 or MAIS ≥ 2 respectively. Traditional • Serious Injury - Police Resource Use • TAC Claims - Admissions (Hospital Admission) Threat to Life • MAIS ≥3 and MAIS ≥2 • Average ISS and Average NISS • ICISS (Worst Injury) <0.96 TAC Claims - Admissions (Hospital Admission) TAC claims data from the TAC-RCIS linked dataset was used to identify hospital admission based on the TAC variable that records the number of bed days for the life of the claim. The series shows the number of persons seriously injured each month as defined by this hospital admission. Figure 1. Monthly time series of selected measures of serious injury for Victoria for the period 2001-2010 inclusive 23 Journal of the Australasian College of Road Safety – Volume 26 No.2, 2015 Average ISS and Average NISS The ICDPIC module also produced the AIS derivative scores Injury Severity Score (ISS) and New Injury Severity Score (NISS). In order to produce monthly trends of injury, Average ISS and Average NISS were calculated and are shown. ICISS (Worst Injury) <0.96 In order to calculate ICISS (International Classification of Diseases Injury Severity Score) from the TAC-RCIS linked dataset, it was necessary to source Survival Risk Ratios (SRRs) calculated from ICD-9-CM coded data. For the purpose of producing demonstration time series, SRRs calculated from Western Australia data were used and were provided by the Data Linkage Branch at the Department of Health WA. For ICISS based on ICD-9-CM, a severity threshold of less than 0.96 was used to define serious non-fatal injury. The monthly series shows the number of persons with an ICISS score of less than 0.96 based on the single worst injury diagnosis. base on factors determining serious injury outcomes, allowing good evidence-based policy and practise to be developed to effectively address the problem. Acknowledgements This project was funded through the Monash University Accident Research Centre’s Baseline research program for which grants have been received from the following Victorian government agencies: the Department of Justice, the Roads Corporation (VicRoads) and the Transport Accident Commission (TAC). References 1. Baker SP, O’Neil B, Haddon W & Long WB. ‘The injury severity score: a method for describing patients with multiple injuries and evaluating emergency care’, The Journal of Trauma, 1974 vol. 14, no. 3, pp. 187-196. 2. Clapperton, A, D’Elia, A & Day, L. Serious injury in Victoria – part 1: development and validation of a severity measure using Victorian administrative data – part 2: trends in serious road traffic injury hospitalisations, Victoria, 2000-2012/13, Report to VicRoads, Monash Injury Research Institute, Melbourne, 2014. 3. Clark, D. E., Osler, T. M. & Hahn, D. R. ICDPIC: Stata module to provide methods for translating International Classification of Diseases (Ninth Revision) diagnosis codes into standard injury categories and/or scores. Version 3.0. Boston College Department of Economics, 2010. 4. Committee on Medical Aspects of Automotive Safety. Rating the severity of tissue damage; I. The Abbreviated Scale. J Am Med Assoc, 1971 Vol. 2152, pp. 277-280. 5. D’Elia, A & Newstead, S. Data systems and serious injury measures for monitoring road safety outcomes, Report to the Department of Justice, Transport Accident Commission and VicRoads, Monash University Accident Research Centre, Melbourne, 2011. 6. D’Elia, A & Newstead, S. Alternative measures of serious injury for national road safety strategy target setting. In: Proceedings of the Australasian Road Safety Research Policing Education Conference, Perth, Australia, 2011. 7. D’Elia, A. & Newstead S. De-identified linkage of Victorian injury data records: a feasibility study, MUARC report series, no. 296, Monash University Accident Research Centre, Melbourne, 2010. 8. D’Elia, A. & Newstead S. De-identified linkage of Victorian injury data records: a feasibility study, MUARC report series, no. 296, Monash University Accident Research Centre, Melbourne, 2010. 9. Langley, J, Stephenson, S & Cryer, C. ‘Measuring road traffic safety performance: monitoring trends in nonfatal injury’, Traffic Injury Prevention, 2003 vol. 4, pp. 291-293. Comparison of serious injury trends Calculation of demonstration time series for the selected measures of serious injury (Figure 1) enables a broad comparison of trends to be made between the traditional measure of serious injury derived from police crash reports (currently hospital admission); hospital admission as identified from TAC claims data; and the threat to life measures (note that Average ISS/NISS uses the scale on the right). TAC hospital admissions and police reported serious injuries seem to track more closely at the beginning and end of the series with variation occurring through the middle. On the other hand, hospital admissions as derived from TAC claims data track relatively closely with the threat to life measures. These comparisons suggest that hospital admission derived from TAC claims data provides a more consistent measure of serious injury road trauma over time than that derived from police reported crash data. Conclusion Recommending a single measure of serious injury from road crashes to replace the traditional measure of serious injury derived from police crash reports, currently hospital admission, is a difficult task. Each of the alternate measures which are accessible based on the availability of required data have strengths and weaknesses. Having a comprehensive road safety data system incorporating the combined recommended measures of serious injury is vital to ensure the new measures accurately and consistently measure serious injury trends in Victoria whilst facilitating the range of policy and research uses the data needs to serve. The linked TAC-RCIS data system forms a sound basis from which to build. The availability of such comprehensive information will facilitate a sound evidence 24 10. Murray, CJL & Lopez, AD, Eds. The global burden of disease: a comprehensive assessment of mortality and disability from diseases, injury and risk factors in 1990 and projected to 2020. Global Burden of Disease and Injury Series. Cambridge, Harvard School of Public Health, 1996. Journal of the Australasian College of Road Safety – Volume 26 No.2, 2015 11. O’Keefe G, Jurkovich GJ. Measurement of Injury Severity and Co-Morbidity. In: Rivara FP, Cummings P, Koepsell TD, Grossman DC, Maier RV, editors. Injury Control: A guide to research and program evaluation. Cambridge University Press, 2001, pp. 32-46. 12. Osler T, Baker S, Long W. A modification of the Injury Severity Score that both improves accuracy and simplifies scoring. J Trauma, 1997 vol. 43, pp. 922–926. 13. Osler T, Rutledge R, Deis J & Bedrick E. ICISS: an international classification of disease-9 based injury severity score, The Journal of Trauma, 1996 vol. 41, no. 3, pp. 380–388. 14. Parliament of Victoria, Road Safety Committee. Inquiry into serious injury, Government Printer, Melbourne, 2014. 15. Petrucelli E, States JD & Hames LN. The abbreviated injury scale: evolution, usage, and future adaptability, Accident Analysis and Prevention, 1981 Vol. 13, pp. 29-35. 16. StataCorp. Stata Statistical Software: Release 10. StataCorp LP. College Station, Texas, 2007. 17. Stephenson S, Langley J, Henley G & Harrison JE. Diagnosis-based injury severity scaling: a method using Australian and New Zealand hospital data coded to ICD-10AM, Injury research and statistics series, no. 20, Australian Institute of Health and Welfare, Adelaide, 2003. 18. Watson, W. Of life and limb: measuring the burden of non-fatal injury, PhD thesis, Monash University Accident Research Centre, Melbourne, 2005. 25 Journal of the Australasian College of Road Safety – Volume 26 No.2, 2015 Does road safety have any lessons for workplace health and safety? by Trevor J Bailey1, Jeremy E Woolley1 and Simon J Raftery1 1 Centre for Automotive Safety Research (CASR) University of Adelaide, South Australia [email protected] Abstract Work health and safety (WHS) and road safety are distinctive perspectives of public health but they share much in common. Both have evolved from a former focus on individual responsibility to embracing systemwide, integrated approaches. Both now talk of incidents rather than accidents. Both are now characterised by proactive rather than reactive responses and their broad countermeasure approaches share many similarities. However, there are various aspects of WHS policy and practice that could be examined in relation to the road safety experience, particularly how compliance and deterrence approaches work best in WHS; the use of rewards and incentives; better attention to young worker safety; improved collection, analysis and usage of WHS data; and optimal use of WHS auditing and inspection programs. The aim of such examinations should be to gauge 26 if current WHS policies and practices are appropriately balanced in light of the road safety experience. Keywords Enforcement, Occupational health and safety, Regulation, Road safety, Work health and safety Introduction Both work health and safety (WHS) and road safety, along with such fields as epidemiology, environmental health, community safety and health economics, are distinct yet interlinked organised efforts by society under the collective term ‘public health’. An early, but now almost universally accepted definition of health is “…a state of complete physical, mental and social well-being and not merely the absence of disease or infirmity” [1, pg100]. This definition Journal of the Australasian College of Road Safety – Volume 26 No.2, 2015 is applicable to both WHS and road safety. For example, safety-oriented culture and systems that promote wellness are currently advocated in both WHS and road safety strategies over and above simply focussing on reducing incidents that can result in injury and death [2, 3]. Besides such commonalities, there are some strong contrasts between the two; so much so that in the last five years there have been emergent views that WHS has much to teach road safety. In 2009, a trio of eminent road safety professionals asserted that WHS had some important lessons for work-related road safety, if not for road safety generally [4]. A chief lesson was for a road safety management system that is not so much reactively driven by injury incidents, but proactively with a systemic approach that anticipates hazards and injury incidents before they occur. Since then, a more proactive approach in road safety is being realised through adoption of the new ISO 39001 [5] international road safety management standard. A few other papers have been published with specific lessons from WHS for road safety, for example in relation to safety culture [6]. In their recent seminal book, Johnston, Muir and Howard [7] opined that WHS is ‘light years ahead of traffic safety’ (p.164) in its focus on safe design, safe operations and safety cultures because the lessons learned in WHS have not been studied systematically by the transport sector. Johnston et al. attribute this lag to institutional ‘silo’ thinking by the transport sector. It should not escape comment, however, that silo thinking is present in both WHS and road safety, with a pertinent if ironic instance being that road crashes are the single largest cause of work-related death and disability, yet the study of road crashes is often institutionally separated from mainstream WHS [8]. To whatever extent the silo metaphor is a valid one for WHS and road safety, is there room for a dismantling of silo thought in both domains by additionally considering a contribution in the opposite direction? In other words, are there any lessons road safety could offer WHS? This paper is essentially a selective review of qualitative literature that compares broad countermeasure philosophies and developments in the two fields with the intention of identifying areas where WHS policy and practice could be reviewed based on successful approaches in road safety. Commonalities between WHS and road safety In reviewing the literature, several areas of commonality between WHS and road safety were identified, including shared problems or issues. These parallels provide a supportive background context when subsequently examining potential lessons from road safety for WHS. From the early 1970’s, among several reforms, WHS thinking shifted towards placing prime responsibility for safety risks on those who create the risks rather than on individuals who become victim to them [9]. However, these reforms did not encourage or enable employers to look for still more effective solutions [10]. In road safety at about the same time, Haddon’s matrix helped shift the focus of countermeasures from an exclusive emphasis on human behaviour before a crash to broader countermeasures involving vehicles and the road environment both during and after a crash [11]. However, while the matrix provided a systematic approach, like the 1970’s WHS reforms, it did not allow for considering influential factors at systemic levels [12] (such as the effect of fuel prices on crashes). In the last twenty years, both WHS and road safety have transitioned from reactive to proactive perspectives. Reactively viewing WHS or road safety incidents as unfortunate random events has given way to seeking evidence not just if a particular risk was poorly managed but proactively how the management of the risks can be improved [13]. The advantage of this is that risk management approaches that facilitate anticipation of safety hazards before they arise lead to achieving the best safety records [7]. WHS and road safety share a preference for using the terms ‘incident’, ‘collision’ or ‘crash’ rather than ‘accident’. ‘Accident’ implies a lack of attributable fault or arising from unknown causes [14]. It tends to shift responsibility away from those involved, implying a reduced need to examine a variety of potentially influential factors. A prevailing view in work systems and sites is that WHS offences are never seriously considered as criminal; with prosecution only pursued as a last resort. Non-compliance by employers with their WHS legal obligations has become accepted as normal or to be expected [15]. Similar views exist in road safety – while creeping over a speed limit is illegal, there is often a popular consensus that it is not dangerous and certainly not criminal, as distinct from extreme road behaviour, which is typically portrayed as criminal [16]. The ISO 39001 road safety standard [5] and the Australian WHS strategy [2] both call for the consideration of safety issues in infrastructure design, the use of personal safety equipment and the importance of journey/task planning. Indeed, many road safety approaches in ISO 39001 and the National Road Safety Strategy [3] reveal parallel recognition in Safe Work Australia’s [17] hierarchy of control for risks at work, as illustrated in Table 1. 27 Journal of the Australasian College of Road Safety – Volume 26 No.2, 2015 Table 1. Risk control comparison for WHS and road safety Safe Work Australia – Hierarchy of Risk Control Eliminate exposure of the user to the hazard Substitute the hazard to the user for one with something safer Isolate the hazard from people Reduce the risks through engineering (and technological) controls Reduce exposure to the hazard using administrative controls Use of personal protective equipment National Road Safety Strategy (NRSS) ISO 39001 (ISO) Safe journey planning (including reducing the need for a trip (ISO) Use of appropriate roads for the vehicle (ISO) Separation of traffic streams according to vehicle type (ISO & NRSS) Use of vehicles with safer designs (ISO & NRSS). Road design, treatments and safe speeds (ISO & NRSS) Land use planning (NRSS) Electronic Stability Control and Advanced Emergency Braking Systems in new vehicles (NRSS) Appropriate driver authorisation for class of vehicle (ISO) Removal of unfit drivers & riders (ISO) Graduated Licensing Scheme for new drivers (NRSS) Seatbelts, helmets, lights (ISO &NRSS) The hierarchy is a sequence of descending effectiveness – from most effective at the top and least effective at the base. Notably, road safety has traditionally relied on the bottom two least effective controls [7]. In particular, in the context of the hierarchy, a focus on individual and behavioural responses in the bottom two controls can be easily seen as inconsistent with modern road safety and workplace safety management. accompanied by forms of deterrence known to dissuade individuals from engaging in the unsafe actions. People are principally deterred by their perceptions of the likelihood of being detected committing an offence as well as by their knowledge of the applicable penalty. The resultant deterrence applies both to an individual offender specifically, as well as acting on a population or group generally [7, 20]. Finally, it is worth noting that, despite their common aims, both ISO 39001 [5] and comparable WHS standards for safety management systems (such as AS/NZS 4801 [18] and ISO 45001 [19] from 2016) will not influence all organisations in addressing safety issues, unless those organisations are seeking accreditation in their implementation of a Safe System. As AS/NZS 4801 states, for example, its standards are merely voluntary tools for organisations “…to use as little or as much as they choose.” [18, pg. vi] An expert WHS opinion of road safety is that it has become an important public policy issue through emphasising compliance by amplifying the deterrent effects of enforcement activity [21]. In this view, if WHS were to adopt a similar high public profile approach for dealing with non-compliance, it would afford a strategic opportunity for overcoming the ambivalence with which WHS offences are often perceived, as well as achieving significant reductions in work-related death and injury [21]. It may also help achieve a better understanding of how specific WHS enforcement activities can best deter unsafe actions in the workplace [21, 22]. In road safety, it is known that securing deterrence relies on ongoing highintensity enforcement activity, in both visible and covert operations as well as mobile and static operations, and involving a high likelihood of detection and the certainty of a penalty or punishment, with a range of penalties available. An authoritative review of road safety measures advises a strategic mix across these approaches to maximise enforcement effectiveness [23]. Such a mix of highintensity enforcement activities contributes significantly to the WHS expert view of road safety as having a high public profile. What lessons can road safety offer WHS? That both WHS and road safety share so many commonalities in policy and practice should be conducive to the effective application of solutions from road safety to a range of WHS issues. In both WHS and road safety, information needs to be given to individuals about the consequences of breaking safety rules, particularly in relation to penalties and possible death and injury. This information should be 28 Journal of the Australasian College of Road Safety – Volume 26 No.2, 2015 Both new workers and new road users are subject to educative and other informative or persuasive approaches relating to safety. These approaches occur in both formal and informal contexts and both groups can expect to be subject to ongoing educational initiatives from time to time. Following an incident such as an at-fault road crash or detected traffic law infringement, a road user is invariably subject to a penalty such as a fine, demerit points or licence disqualification and sometimes an educational targeted intervention as well. By contrast, in WHS, initial interventions in response to incidents and detected noncompliances are characterised by a heavy reliance on targeted and general educative or other low-level persuasive approaches, with penalties largely reserved as follow-up interventions for any further non-compliance. As Safe Work Australia notes, this may be because certain initial approaches work better for some companies than for others. For example large businesses may respond best to strong persuasive approaches involving the company’s public reputation (such as with adverse publicity orders), whereas informational and lower-level persuasive approaches are often better suited to small businesses [24]. Nonetheless, based on road safety’s high public profile for enforcement practice, there may be a case for WHS to consider whether reported failures to comply (whether or not incident related) would be better served by applying punitive measures rather than educational interventions alone. A Cochrane Collaboration expert review of WHS enforcement tools has noted that rewards and incentives, typically as annual WHS award schemes, are commonly employed by governments [25], including Australian WHS authorities. Safe Work Australia’s examination of four studies of company reward schemes concluded that reward schemes can be effective in the workplace although more research is needed [24]. However, it needs to be asked not just if a reward or incentive produced a desired result, but whether safety improvement would have occurred had no reward been offered. Also, if the reward had been of a different size or nature, would the improvement have occurred more quickly, or could the improvement have been an even better one? [26]. It could also be argued that companies win awards because they have good safety records, but companies are not made safer simply because they win awards. There is also experimental evidence that offering rewards and inducements can be counterproductive, such as when they reduce someone’s intrinsic motivation to perform a task [27] such that people pay more attention to an external reward for an activity than to their inherent enjoyment and satisfaction from performing the activity (i.e. intrinsic motivation). Once rewards are no longer offered, interest in the activity and intrinsic motivation to perform it often wane, such that extrinsic rewards must be continually offered, and perhaps increased in size, in order to sustain the activity [28]. (Interestingly, repeated applications of penalties may likewise create dependencies that maladaptively serve to decrease intrinsic motivation to perform a desired behaviour.) With decreasing intrinsic motivation, a company may display apathy towards WHS requirements in anticipation a reward or inducement may be offered. Thus, not only can poor WHS compliance be unnoticed, it may be inadvertently rewarded. Reward schemes are used sparingly in road safety. Extrinsic rewards exist, for example as no-claim bonuses in the motor insurance industry and driver licence fee discounts for accumulating offence-free driving periods. Such schemes have not so far been shown to improve driver safety records. They can be costly and administratively complex to run and it could be said they simply reward drivers who drive infrequently or for shorter distances, thereby more likely being offence-free. An Australian review [29] into best practice road safety initiatives by companies and businesses concluded that incentive/reward schemes (such as free licence renewals and/or insurance premiums) may be effective among employees who drive in their work. However, some of the programs in that review experienced negative effects such as increased crashes after the incentives were provided. In Denmark, a trial of intelligent speed adaptation (ISA) technology offered drivers substantial rewards if they voluntarily slowed down when an ISA device issued warnings about their vehicle’s speed in relation to the speed limit. However, the rewards failed to curtail speeding behaviour over time [30]. In view of such studies, the use of rewards and incentives in WHS could be adjusted in favour of applying them to circumstances where they have been demonstrated to increase intrinsic motivation to work safely. Another area that WHS could profitably explore relates to injury prevention for young workers. In 2009-2010, Australian workers aged 15-24 were injured at nearly twice the rate of other worker ages [31]. A high proportion of these injuries resulted from being hit or being cut by an object. This suggests that the employers/supervisors may have committed WHS violations relating to the adequacy of their young worker supervision. Young adults also feature significantly in road tolls. Graduated licensing schemes (GLS) commonly impose driving restrictions that are successively lifted or relaxed as a novice driver gains experience. The restrictions (e.g. upper speed limits, no night driving) are relevant to known common factors influencing young driver crashes. Evaluations of GLSs have repeatedly shown they reduce young driver deaths and injuries [32]. Within WHS contexts, it should be possible to determine in which industries young workers are most likely to be injured and consider adopting or strengthening stepped acclimatisation to work in those industries, such that work restrictions placed on a young worker early in their job would be successively lifted or relaxed as the worker becomes more adept. Such a graduated approach 29 Journal of the Australasian College of Road Safety – Volume 26 No.2, 2015 for young workers would ideally be standardised within any one industry, and could apply to novice workers of any age. It should also place due emphasis on the employer/ supervisor’s role, for example not just in conducting a required risk assessment on the new employee as part of their induction, but more particularly in terms of what risks might be rendered more hazardous for a novice worker due to their inexperience. Such information could indicate what types of training courses, supervision or graduated work controls might be advisable for the young worker. A study involving in-depth analyses of over 600 fatal and non-fatal road serious crashes found that relatively few of these crashes were the consequence of intentionally bad behaviours. Rather, the vast bulk of the crashes should be more accurately interpreted as failings of the broader road system, including those errors of human fallibility that the road system compensates for [33]. Within WHS, there are also desires to more fully recognise the contributions made by the work system itself that result in death and injury rather than interpreting them as due to intentional or deliberate acts of safety rule violation. Safe Work Australia [24] notes that there are few studies of WHS rule violations in workplaces and even fewer of these investigate the causes of the violations [21]. One reason WHS violation causes are rarely studied in detail is a common misperception that work violations are acts committed by intentionally ‘bad’ employees and that more fundamental or systemic WHS failings are frequently overlooked in investigations [34]. This is concerning as some industries report up to 70% of workplace accidents as being due to rule violations [34], although it is not immediately clear what proportions of these violations are due to wilful, extreme acts compared to work system errors and errors of human fallibility. While not all violations lead to harm and nor are all violations detected, there is still a need to recognise that commonality in violations can make the WHS system unsafe, just as system failings can contribute to increased opportunities for individual violations [15]. If an analysis of violation patterns reveals changes are needed for a WHS system, the violations should not necessarily be considered as ‘wrong’ actions committed by individual employees, but rather, where appropriate, classified as indicators of malaise or shortcomings in the system. This suggests a need to look more widely at a system-level when exploring causes of WHS violations. Moreover, WHS systems need to be sufficiently robust to allow feedback loops that inform the system constructively and to learn from system failures [34, 35]. Robust feedback loops for improving WHS systems flourish if the systems create and maintain an environment where people can report mistakes without necessarily having to fear blame [36]. This may be pertinent advice particularly in the field of work-related driving because, as earlier noted, road crashes are the single largest cause 30 of work-related death and disability. Under Australian WHS legislation vehicles are included in the definition of a workplace. Hence, promotion of sound feedback systems in work-related driving contexts may encourage more systemwide perspectives of the safety problem and help dispel propensities to blame the driver or viewing incidents as solely due to wilfully bad driving. Several WHS analysts have criticised current WHS incident data recording and analysis for its limited ability to contribute to WHS policy formation and action. For example, improvements are needed in recording data on work-related vehicle incidents, work-related exposures to carcinogens, and older worker injuries, so that their risk management can be more evidence-based [37]. There is also a need for a set of core elements in WHS data collected across Australian jurisdictions [38]. Additionally, WHS incident data tend to focus on incident frequency rather than severity, and in any case may be unrepresentative of the true picture of WHS performance due to it sourcing data from workplace insurance claims, which tend to exclude motor vehicle crashes and injuries [39]. These expert views indicate an urgent need to advance WHS data collection capability to a level it can more productively contribute to WHS policy development. Road safety has seen several improvements in its data collection that better inform road safety policy formulation. It is not just data accuracy in road safety and consistent approaches across jurisdictions that have been key focuses, as an international review of road crash reporting practices noted the use of various data sources in complementary fashion including, forensic science registers, emergency services records, insurance claim data, and electronic linking of databases across health agencies for a sounder understanding of road crashes [40]. A best practice road safety data collection approach [41] now adopted in nine European countries [42] involves many different types of data: • the social costs of road crashes, including medical costs, production loss, quality of life costs, material costs and settlement costs; • data related to safety performance indicators such as mean traffic speeds, seatbelt wearing rates, traffic volumes and distances travelled; • performance measures related to safety programs and initiatives, and; • indicators of safety structures and culture (for example psycho-social data). Data collection models showing such a diversity of performance indicators offer much potential to enrich WHS data collection approaches. For example, cost data for businesses of failures in WHS policies and procedures Journal of the Australasian College of Road Safety – Volume 26 No.2, 2015 can be very much more than an industry sector’s own estimation of its costs in administering WHS policies and procedures [43]. Within Australia, various case studies show that companies that implement preventative road safety measures for their employees tend to not perceive these measures as cost imposts, but simply as good business that affords increased efficiency and reduced operating costs among other benefits [44]. An alternative approach for WHS to consider when assigning monetary value on life could be to use willingness-to-pay calculations based on surveys of what individuals are willing to pay for reduced levels of risk. Australia’s Bureau of Infrastructure, Transport and Regional Economics considers willingnessto-pay approaches are being used increasingly in road safety cost analyses to support policy development as they are widely regarded in road safety and other circles as a superior methodology [45]. Workplace inspections and auditing are valued for the reductions they bring in claim costs and for their specific and general deterrence effects [24]. But case studies of WHS management systems in Denmark found that among the chief limitations of WHS audits are that they focus on easy to access safety issues, and reduce auditable items into standardised cause-effect constructs that are objectively measurable and which can result in a preference for standardised solutions to complex safety problems [46; see also 4]. Moreover, WHS audit and inspection programs are often targeted at industries or employers that have demonstrated substantial regulatory non-compliances [47]. Unfortunately, as noted in a best practice review of WHS compliance, this brings a danger of focussing on a small number of large WHS risks to the exclusion of under-enforcement of a large number of low WHS risks [22]. Reflecting such wisdom, and based on robust research on the crash-reduction potential [48] yet despite its unpopularity [7], Australian road safety authorities now tend to focus enforcement initiatives on speeding behaviour by paying better attention to both common ‘low-level’ speeding as well as to the relatively fewer incidents of excessive speed. The Danish review of WHS management systems also found that too narrowly-focussed WHS inspections or audits can deny the dynamic psycho-social relations in workplaces, and discourage innovation, flexibility and personal judgment in solving WHS issues [46; see also 4]. In road safety, the psycho-social construct of shared ownership of road safety problems and solutions is often associated with better safety outcomes [49]. An intention towards a sense of shared ownership appears in Australia’s National Road Safety Strategy [3] and in current jurisdictional road safety strategies. TruckSafe, the national alternative compliance approach in the heavy vehicle transport industry, recognises the importance of a shared ownership of safety because government regulators cannot assure heavy vehicle safety simply by enforcing one size fits all road rules and regulations [4]. The essential element of TruckSafe is that, under the National Heavy Vehicle Accreditation Scheme (NHVAS), it can allow workplace accredited yet mutually negotiated choice in adopting either a fixed driving hours fatigue management system or a more flexible hours advanced fatigue management system. TruckSafe is permitted to conduct NHVAS audits as part of its own audits, but it does not take the prime responsibility for the permitted flexibility in fatigue management provision. (Moreover, TruckSafe provides no benefits other than public acknowledgement of a company’s safety management.) A review of WHS auditing practices noted that allowing some negotiated tailoring in how audits are conducted builds shared ownership of safety at the same time as reducing some of the disadvantages often experienced in WHS auditing [50]. However, alternative approaches in WHS audits can create ambiguity, which can undermine intended protections and accountability, allowing firms to get away with the minimum level of conduct possible, thus providing inadequate protection to consumers and others [51]. This suggests that alternative approaches may not be appropriate in all WHS situations. Conclusion Several areas where WHS policy and practice could be examined in relation to the road safety experience were identified: WHS enforcement activity could be enhanced by being accorded a higher public profile and some instances of WHS non-compliance might be better served by focussing on punitive rather than educational interventions. Grounds were given for examining the effective use of WHS rewards and incentives and in improving the safety acclimatisation of young workers. More systems-oriented perspectives and better feedback loops in approaches to reduce WHS violations are needed, particularly for workrelated road safety. WHS data collection capability could be improved to enable it to more productively contribute to WHS policy development. The scope of WHS auditing could become more inclusive in addressing complex safety issues compared to simpler ones, and more inclusive in attending to larger numbers of low-level risks in addition to the fewer incidents of high-level risk. There may also be opportunities for negotiated tailoring of how audits of WHS compliance are conducted. Ideally, the aim of such examinations should be to gauge if current WHS policies and practices are appropriately balanced. If an imbalance is found, it may be of some benefit to undertake further examination in light of the road safety experience. The identified commonalities between WHS and road safety should facilitate this process. While there has been some prior work exploring lessons WHS could offer road safety, this paper has explored the 31 Journal of the Australasian College of Road Safety – Volume 26 No.2, 2015 reverse possibility ― that there are lessons road safety can offer WHS. It may be, however, that the more appropriate question regarding links between WHS and road safety should not be what can one learn from the other, but what can each learn from each other? This would surely be a move towards achieving the degree of ‘cooperation and coordination’ envisioned by Johnston et al. [7] in their ‘six vital steps towards zero’ deaths and injury in road safety a vision that is equally applicable to WHS. Acknowledgements This study was funded by SafeWork South Australia (SafeWork SA) through a Project Grant to CASR. CASR is supported by both the South Australian Department of Planning, Transport and Infrastructure and the South Australian Motor Accident Commission. The views expressed in this article are those of the authors and do not necessarily represent those of the University of Adelaide or the funding organisations. References 1. World Health Organisation (WHO). Preamble to the Constitution of the World Health Organization as adopted by the International Health Conference, New York, 19 June - 22 July 1946. (Official records of the World Health Organization, no. 2, pg. 100). 2. Safe Work Australia. Australian work health and safety strategy 2012-2022. Canberra: Safe Work Australia, 2012. 3. Australian Transport Council (ATC). National road safety strategy 2011-2020. Canberra: ATC, 2011. 4. Mooren L, Grzbieta RH, Williamson A. Lessons from occupational safety for work-related road safety. In Australasian Road Safety Research, Policing and Education Conference. Sydney, 2009. 5. International Organization for Standards (ISO). ISO 39001: Road traffic safety (RTS) management systems – Requirements with guidance for use. Geneva: International Standards Organisation, 2012. Viewed 26 November 2012. http://www.iso.org/iso/catalogue_detail?csnumber=44958 6. Nӕvestad T, Bjørnskau, T. How can the safety culture perspective be applied to road traffic? Transport Reviews: A Transnational Transdisciplinary Journal 2012; (32)(2):139154. 7. Johnston IR, Muir C, Howard EW. Eliminating serious injury and death from road transport: A crisis of complacency. Florida: CRC Press, 2014. 8. Hughes B. Workplace transport safety: The mobile financial crisis. Perth: Curtin-Monash Accident Research Centre, Curtin University of Technology, 2010. 9. Cullen W. The development of safety legislation. Royal Academy of Engineering and Royal Society of Edinburgh Lecture, 1996. Viewed 12 November 2012. http://www. scribd.com/doc/57924918/THE-DEVELOPMENT-OFSAFETY-LEGISLATION 10. Regulatory Institutions Network (RegNet). Overview of work health and safety regulation in Australia. Canberra: Australian National University, 2012. Viewed 21 May 2012. http://regnet.anu.edu.au/nrcohsr/overview-work-health-andsafety-regulation-Australia. 11. Williams AF. The Haddon matrix: its contribution to injury prevention and control. In McClure, Roderick (Ed.) Third National Conference on Injury Prevention and Control, 9-12 May 1999, Brisbane. 12. Mooren L, Searles B, Benc A, Creef K, Wall J. Benchmarking for effective work related road safety management. In 1st Occupational Safety & Transport Conference. Gold Coast, Queensland, 2012. 13. Dekker S. The criminalization of human error in aviation and healthcare: A review. Safety Science, 2011; 49:121-127. 14. Stewart AE, Lord JH. Motor vehicle crash versus accident: a change in terminology is necessary. Journal of Traumatic Stress 2002; 15(4):333-335. 15. Johnstone R. Decriminalisation of health and safety at work in Australia. Regulatory Institutions Network (RegNet). Working Paper 86. Canberra: Australian National University, 2012. 16. Wegman F. Driving down the road toll by building a safe system. Adelaide: Adelaide Thinkers in Residence, Government of South Australia, 2012. 17. Safe Work Australia. How to manage work health and safety risks: Code of practice. Canberra: Safe Work Australia, 2011. 18. Standards Australia / Standards New Zealand. Australian/ New Zealand standard: Occupational health and safety management systems―Specification with guidance for use. Sydney and Wellington: Standards Australia / Standards New Zealand, 2001. 19. ISO standards. First draft of ISO’s occupational health and safety standard now available. Viewed 25 February 2015 from: http://www.iso.org/iso/home/news_index/news_ archive/news.htm?refid=Ref1874 20. Cunningham, S. Driving offences: Law, policy and practice. Aldershot, UK: Ashford Publishing Company, 2008. 21. Purse K, Dorrian J. Deterrence and enforcement of occupational health and safety law. International Journal of Comparative Labour Law and Industrial Relations, 2011: 27(1):23-39. 22. Gunningham N. Regulatory compliance best practice review. Melbourne: National Transport Commission, 2011. 23. Elvik R, Vaa T. (eds). The handbook of road safety measures, Chapter 8: Police enforcement and sanctions. Oxford: Elsevier, 2004. 24. Safe Work Australia. The effectiveness of work health and safety interventions by regulators: A literature review. Canberra: Safe Work Australia, 2013. 25. Mischke C, Verbeek JH, Job J, Morata TC, Alvesalo-Kuusi A, Neuvonen K, Clarke S, Pedlow RI. Occupational safety and health regulation and legislation enforcement tools for preventing occupational diseases and injuries. Cochrane Database of Systematic Reviews 2012; 2. Art. CD010183. DOI: 10.1002/14651858.CD010183. 26. Williams H. Innovation inducement prizes: Connecting research to policy. Journal of Policy Analysis and Management, 2012; 31(1):1-25. 32 Journal of the Australasian College of Road Safety – Volume 26 No.2, 2015 27. Mellstrom C, Johannesson M. (2008) Crowding out in blood donation: Was Titmuss right? Journal of the European Economic Association, 2008; 6(4):845-863. 28. Carlson RN, Heth CD. Psychology the science of behaviour. New Jersey: Pearson Education, 2007. 29. Haworth N, Tingvall C, Kowaldo N. Review of best practice fleet safety initiatives in the corporate/business environment. Report No. 166. Melbourne: Monash University Accident Research Centre, 2000. 30. Agerholm N, Tradisauskas N, Juhl J, Berthelsen K, Lahrmann H. Intelligent speed adaptation for involuntary drivers ― final results. In 19th ITS World Congress, Vienna, 2012. 31. Safe Work Australia. Australian work-related injury experience by sex and age 2009 10. Canberra: Safe Work Australia, 2012. 32. Williams AF, Tefft, BC, Grabowski, JC. (2012). Graduated driver licensing research, 2010-present. Journal of Safety Research, 2012; 43:195-203. 33. Wundersitz L, Baldock, M, Raftery, S. The relative contribution of system failures and extreme behaviour in South Australian crashes. Accident Analysis and Prevention, 2014; 73:163-169. 34. Alper SJ, Karsh B-T. A systematic review of safety violations in industry. Accident Analysis and Prevention, 2009; 41:739-754. 35. Labib A, Read M. Not just rearranging the deckchairs on the Titanic: learning from failures through risk and reliability analysis. Safety Science, 2013; 51:397-413. 36. Byrne R. Creating a just culture. The RoSPA Occupational Safety & Health Journal, 2012, July:27-29. 37. MacDonald W, Driscoll T, Stuckey R, Oakman J. Occupational health and safety in Australia. Industrial Health, 2012; 50:172-179. 38. Stuckey R, Pratt SG, Murray W. Work-related road safety in Australia, the United Kingdom and the United States of America: An overview of regulatory approaches and recommendations to enhance strategy and practice. Journal of the Australasian College of Road Safety, 2013; 24(3):1018. 39. Australasian College of Road Safety (ACRS). Submission to Safe Work Australia: Draft Australian Work Health and Safety Strategy. Canberra: ACRS, 2012. Viewed 18 February 2013. http://acrs.org.au 40. OECD/ITF. Reporting on serious road traffic casualties. Traffic and Safety Data Analysis Group. Paris: Organisation for Economic Cooperation and Development / International Transport Forum, 2011. 41. Koornstra MJ, Lynam D, Nilsson G, Noordzj P, Petterson H, Wegman F, Wouters P. SUNflower: A Comparative Study of the Development of Road Safety in Sweden, the United Kingdom and the Netherlands. Leidschendam, The Netherlands: Institute for Road Safety Research (SWOV), 2002. 42. Wegman F, Eksler V, Hayes S, Lynam D, Morsink P, Oppe S. SUNflower+6: A comparative study of the development of road safety in European countries. Leidschendam, The Netherlands: Institute for Road Safety Research (SWOV), 2005. 43. Bibbings R. Ragnar reregulates! The RoSPA Occupational Safety & Health Journal, 2012; January:34-35. 44. Carslake J, Cureton J, Potter J. Corporate initiatives to improve road safety and the associated productivity and environmental benefits. In 12th International Symposium on Heavy Vehicle Transport Technology. Sweden, 2012. 45. Bureau of Infrastructure, Transport and Regional Economics (BITRE). Cost of road crashes in Australia 2006. Report 118. Canberra: BITRE, 2009. 46. Hohnen P, Hasle P. Making work environment auditable – a critical case study of certified occupational health and safety management systems in Denmark. Safety Science, 2011; 49:1022-1029. 47. Mustard C. The effectiveness of targeted labour inspections in occupational health and safety. Issue Briefing September 2012, Institute for Work & Health (IWH). Toronto, Canada: IWH. Viewed 27 February 2013. http://www.iwh.on.ca/ issue-briefings 48. Kloeden CN, McLean AJ, Moore VM, Ponte G. Travelling speed and the risk of crash involvement: Findings. Volume 1. Canberra: Federal Office of Road Safety, 1997. 49. Banks TD, Davey JD, Biggs HC. The influence of safety ownership on occupational road safety outcomes. Journal of the Australasian College of Road Safety, 2010; 21(4):36-42. 50. Blewett V, O’Keeffe V. Weighing the pig never made it heavier: Auditing OHS, social auditing as verification of process in Australia. Safety Science, 2012; 49:1014-1021. 51. Black J. Principles based regulation: Risks, challenges and opportunities. London: London School of Economics and Political Science, 2007. 33 Journal of the Australasian College of Road Safety – Volume 26 No.2, 2015 Contributed articles Review of the impacts of road trauma: summary of report 140 By Tim Risbey Research Manager, Bureau of Infrastructure, Transport and Regional Economics Department of Infrastructure and Regional Development [email protected] the two influences of distance driven and vehicle type. The more distance travelled, the higher the risk of a road crash occasioning fatalities. Vkt driven is modified by the type of vehicles doing the travelling. A motorcycle rider/passenger runs 26 times the fatality risk per kilometre of a car driver/passenger. A change in the percentage of motorcycle kilometres versus total kilometres will thus increase the risk of fatalities). This article summarises Bureau of Infrastructure, Transport and Regional Economics (BITRE) Report 140 which presents the results of a BITRE review of the impacts of road trauma. This review was a Coalition election commitment that tasked the Bureau with undertaking a review of the full impacts of road trauma, including the benefits and costs of measures to encourage safer drivers, build safer roads and drive safer cars. The Bureau’s review evaluated different road safety approaches, both internationally and domestically, and provided a timely stock take of measures that road safety experts believe can reduce deaths and serious injuries on our roads. The report is available for download from www. bitre.gov.au. Trends in road trauma The trends in Australian road deaths, population and registered vehicles since 1950 are shown in Figure 1. While population has increased by 66 per cent (+1.3 per cent per year) and vehicle registrations have increased by 174 per cent (+2.5 per cent per year), road crash deaths have decreased by 68 per cent (–2.9 per cent per year). Road deaths per 100 000 population have decreased from 26.6 to 5.1 (–4.2 per cent per year). The main influences on this long term reduction are seat belts, random breath testing and speed cameras. BITRE [11] found that: • 34 Seat belts alone were responsible for reducing the safety-weighted road fatality rate from 38 per billion safety-weighted vehicle kilometres travelled (vkt) in 1965 to 12.5 in 2013 - a 67 per cent reduction in the fatality rate. (The safety weighted vkt combines • Blood alcohol legislation and enforcement (random breath testing) has lowered the road fatality rate further, from 12.5 with seatbelts alone to 7.5 fatalities per billion safety-weighted vkt with alcohol limit enforcement (RBT) added - a 40 per cent reduction. • Speed limit legislation and enforcement (speed camera checks) has lowered the road fatality rate still further, from 7.5 to 5 fatalities per billion safetyweighted vkt a 33 per cent reduction. Internationally, the annual number of road deaths in International Traffic Safety Data and Analysis Group countries fell nearly 40 per cent between 2000 and 2012. Australia’s decline in the rate of deaths per 100 000 population between 2000 and 2012 has been similar to the OECD’s median rate for several years (see Figure 2). In 2012 Australia’s rate of 5.72 deaths per 100,000 population was the sixteenth lowest rate out of the 33 OECD nations with available data (see Figure 3). The nations with the two lowest rates were Iceland (2.81) and United Kingdom (2.83). However, there has been limited success in saving lives among vulnerable road users and the share of fatalities among elderly road users is slowly increasing in many countries. The OECD/ITF [17] found for International Traffic Safety Data and Analysis Group countries: Journal of the Australasian College of Road Safety – Volume 26 No.2, 2015 Figure 1. Australian road deaths, vehicles and population Source: [11, BITRE Road Deaths in Australia 1925–2008, Information Sheet 38, Canberra; Australian Road Deaths Database; Australian Bureau of Statistics Cat No. 3101.0 and 9309.0]. Figure 2. Road deaths per 100 000 population: OECD and Australia, 2000 to 2012 [12] • • • Pedestrians are the largest group of vulnerable road users in most countries and account for around 19 per cent of all fatalities in member countries following a slightly increasing trend. Close to 40 per cent of all pedestrians killed belong to the 65+ age group. The share of fatalities among elderly road users is slowly increasing in many member countries, reflecting the changing age structure of populations. In 2012, for European members the share of fatalities in the 65+ age group was for the first time in excess of 30 per cent. In Japan, this share is even higher, at around 55 per cent. Cycling is an increasingly popular alternative transport mode for short trips. The increased number of cyclists has been accompanied by a slowing of the rate of improvement, or even an increase in cycling fatalities, in member countries over the past decade. In Australia over the ten years to June 2014, the key trends for road deaths were: Figure 3. Road deaths per 100 000 population: OECD countries and Australian states and territories, 2012 [12] • The number of road deaths has reduced by 26.6 per cent. • Road deaths per 100 000 population declined for all age groups over the decade, with the strongest falls for young adults (17 to 25) and children (16 years and under). • There have been increased injuries and deaths for older road users. Deaths in the 55 and over age groups increased marginally over the decade and the last few years have seen no reduction in age-specific rates per 100 000 population. • Motorcyclist deaths increased by a net 8 per cent. After increasing in the first half of the decade, motorcyclist deaths subsequently fell. Deaths in the 55 and over age group increased; now accounting for almost a quarter of all motorcycle deaths. • Pedal cyclist deaths have increased since 2008, with significant increases in the last two years. Deaths in the 25 and under age group have fallen marginally and all older ages have seen annual deaths increase. 35 Journal of the Australasian College of Road Safety – Volume 26 No.2, 2015 • Pedestrian deaths have decreased by 20 per cent over the decade. Deaths have fallen in New South Wales and Queensland, with no consistent falls in other jurisdictions. Key trends for traffic-related hospitalised injuries since 2001 include: • An increase in traffic hospitalised injuries of 22 per cent from 2002 to 2011. • High threat-to-life injuries reduced by 21 per cent for children (to 2008-09). • High threat-to-life injuries increased by 29 per cent for people aged 65 and over (to 2008-09). • High threat-to-life injuries increased by 27 per cent for all age groups to 2008-09. • Hospitalised motorcyclist injuries increased 52 per cent in the five years to 2008-09. Around half of all hospitalised motorcyclist injuries are from noncollision crashes. • High threat-to-life injuries to pedal cyclists increased over 80 per cent between 2001 and 2009. More than half of traffic-related hospitalised injuries to pedal cyclists are the result of non-collision crashes.[4] • High threat-to-life injuries to pedestrians remained stable between 2001 and 2009. Best practice approaches to reducing road trauma A Safe System approach is at the core of the Plan of Action of the UN Decade of Action, which states that for all countries, whatever their level of development, the guiding principles underlying the Plan for the Decade of Action are those included in the “Safe System”. The Safe System vision is based on ambitious targets and the aspiration to progressively eliminate all fatalities and serious injuries. A Safe System approach is based on the underlying principles that: • human beings can make mistakes that can lead to road crashes; • the human body by nature has a limited ability to sustain crash forces; and • it is a shared responsibility between stakeholders (road users, road managers and vehicle manufacturers) to take appropriate actions to ensure that road crashes do not lead to serious or fatal injuries. Australia was amongst the first to adopt a Safe System approach, with the National Road Safety Strategy 2011– 36 2020 (NRSS) firmly based on Safe System principles and framed by the guiding vision that no person should be killed or seriously injured on Australia’s roads. The NRSS sets out a range of high-level directions and priority actions to drive national road safety performance to 2020. The NRSS commits federal, state and territory governments to a national collaboration on road safety improvement, with a 10-year plan to reduce the annual numbers of deaths and serious injuries on Australian roads by at least 30 per cent. Individual state and territory governments have direct responsibility for most areas of road safety regulation and management. Western Australia (Box 3 in Report 140) and Victoria (Box 4 in Report 140) have taken different approaches to implementing a Safe System approach. At the national level there has been significant progress made towards the National Road Safety Strategy 2011-2020 target of a 30 per cent reduction in casualties. While vehicle occupant deaths have trended down, the analysis confirms the relatively high risk for motorcyclists, pedal cyclists, older drivers and remote communities as shown in Figure 4. Measures with the most potential to reduce road trauma There have been impressive road safety improvements over the last 40 years, but road crashes remain a huge cost at an estimated $27 billion per year. This is the equivalent of 18 per cent of health expenditure and 1.8 per cent of Gross Domestic Product (2012-13). Stable or increasing trends for vulnerable road user groups, combined with population increases, makes the search for ways to further reduce road trauma even more challenging. As the measures such as seat belts, random breath testing, speed cameras and air bags that have driven past reductions in road trauma reach maximum effect, and traffic grows, previous road safety measures will need to be ramped up and new measures found to further reduce road deaths and injury. In order to identify measures with the most potential, BITRE commissioned consulting firm Jacobs to interview road safety experts to identify initiatives they considered had the most potential to reduce road injury and deaths. Collectively, over 400 initiatives were suggested [16]. A workshop of road safety experts held on 16 May 2014 narrowed this to the top initiatives with the most potential to save lives and reduce injuries. The top ten ranked initiatives as voted by workshop participants are summarised in Table 1, with a number of initiatives receiving the same number of votes. Journal of the Australasian College of Road Safety – Volume 26 No.2, 2015 Figure 4. Vulnerable road user groups: road deaths and high threat-to-life injuries Source BITRE Australian Road Deaths Database; Australian Institute of Health and Welfare Table 1. Summary of workshop voting on initiatives to reduce road trauma Initiative 1. 2. =3. =3. 5 =6. =6. =8. =8. =8. Note Number of votes 27 Improved road infrastructure safety standards (26) Safety in capital investment (1) Research Platform 19 Management capacity 13 Safer Intersections–new/existing 13 Distraction (BAD) mobile phone 12 usage: enforcement Police enforcement to maximise 11 general deterrence Autonomous braking vehicle based 11 crash avoidance Leadership 10 Drug driving initiatives 10 Insurance Incentives 10 For a full list of initiatives proposed and voting results see Table 5.1 in Jacobs [16] Three of the top measures suggested - research, management and leadership - are strategic and not amenable to economic analysis. These important strategic issues were addressed in the broader Review of the National Road Safety Strategy [5]. Another, the general enforcement of road rules, was not amenable to BITRE’s analysis. BITRE’s analysis therefore focused on four priorities identified by road safety experts: infrastructure, safer intersections, distraction from mobile phones and autonomous emergency braking. BITRE’s initial assessment of the top ranking measures takes account of: • Expected timing of some measures currently being implemented and; • Expected future changes in trauma outcomes that are expected with the current approach. The primary basis of assessment is the expected reduction in road trauma outcomes - that is, the avoided loss of life and injuries - compared to what would have happened otherwise (the base case). The base case projects future levels of road trauma taking account of population and economic growth as well as technologies in passenger vehicles such as ESC, side airbags and Autonomous Emergency Braking (AEB). Taking account of both costs and benefits is important as it is likely that different measures could achieve similar reductions in trauma but with very different costs. BITRE has assessed measures based on expected safety outcome (benefit) which is the avoided number of road deaths and hospitalised injuries as a proxy measure of 37 Journal of the Australasian College of Road Safety – Volume 26 No.2, 2015 serious injury outcomes, combined with the expected implementation costs where these can be identified. Only real losses are considered and not financial transfers. (Financial transfers include payments from insurers for loss of personal income or vehicle repairs, and government payments to people who suffer an on-going disability as a result of an injury from a road crash. In an economic costing framework, the losses are attributed to the individual rather than the financial loss to company shareholders or taxpayers). Counting both income losses and compensation payments would result in double counting. Key assumptions used in the costing are: • A real, risk-free discount rate of 4 per cent to reflect social time preference. This is broadly consistent with the Department’s guidelines which recommend rates of 4 per cent and 7 per cent when calculating benefit cost ratios [15]. • The social willingness-to-pay to avoid road trauma is $7.7 million for preventing a fatality and $259 000 for preventing a hospitalised injury (Appendix A, Report 140). In assessing these measures, the primary basis of assessment was the expected reduction in road trauma - the avoided loss of life and injuries - compared to what would have happened otherwise (the base case). The base case used is built on a BITRE research report [11] which looked at the expected uptake of various safetyenhancing vehicle technologies and projected fatality and injury rate, assuming no major change in roads, vehicles and driver behaviour. This updated base case projected future levels of road trauma taking account of population and economic growth as well as currently planned measures to reduce road trauma, including electronic stability control, side airbags and autonomous emergency braking in passenger vehicles. Figure 5 shows the projected reduction expected in fatality risk per kilometre from new technologies in base case. As several measures that might reduce trauma rates are not included in this base case, it should not be taken as a forecast. Rather, it is a conservative projection of the expected reduction in fatal risk taking into account the impacts of vehicle measures already implemented and expected future economic activity. Some of the major trends that have not been explicitly included in this base case include: • Improved enforcement; • Additional infrastructure improvements and; • Any further increase in distracted driving (including from mobile devices). Figure 5. Projected reduction in fatality risk per kilometre from new technologies in base case Source: BITRE estimates 38 Journal of the Australasian College of Road Safety – Volume 26 No.2, 2015 Infrastructure measures • Improved road infrastructure safety standards - a group of 27 related measures excluding intersection safety - was the highest ranking measure in the final workshop rankings of identified road safety related measures. AusRAP uses the total number of fatalities and serious injuries and crash types across the road network to calibrate the fatality estimation model, but does not rely on the spatial location of crashes [1]. • In ANRAM the spatial location of crashes is used to achieve a more accurate estimate of expected fatal and serious injury crashes for a given road network or route. • Unlike ANRAM, the AusRAP model is used to produce star ratings for roads as a method to assess safety of road infrastructure, at 100 metre intervals, with 1 star being the least safe, and 5 stars being the most safe. The proposed infrastructure measures as summarised by Jacobs [16] were: • 5 star safety rated roads over 15 years. • All new roads 4+ stars. • All maintenance raises at least 1 star. • No road user group less than 3 star. (Note that separate star ratings can be calculated for different road user groups, including car occupants, motorcyclists, cyclists and pedestrians). BITRE analysed two paths to partially achieve the goal of 5 star safety-rated national land transport roads over 15 years: • • Improving 85 per cent of the national land transport network to 3 stars or above. While not a specific measure suggested in Jacobs [16], this would be a significant step towards 5 star safety rated roads over 15 years and; Reducing speed limits to improve road safety star ratings. Improving the National Land Transport Network to 3 stars or above The National Land Transport Network is defined under the Auslink (National Land Transport) Act and is the network of roads and rail funded by the state, territory and federal governments. Roads that are part of the National Land Transport Network carry an estimated 20 per cent of Australian vehicle kilometres [13]. There are two main risk assessment systems for roads available in Australia: the Australian Road Assessment Programme (AusRAP) based on the International Road Assessment Programme (iRap), and the Australian National Risk Assessment Model (ANRAM) which is a related model developed by ARRB Group [6, 1]. There are important differences between the models: • ANRAM takes AusRap scores as an input to the model and uses benefit-cost analysis and benefit-cost ratios to refine the mix of treatment options. • ANRAM also uses a different treatment of traffic volumes and past crash history. The Australian Automobile Association (AAA) has advocated that the national highway network be rated at a minimum of 3 stars by 2020 and that new road sections should be a minimum of 4 stars [3]. The AAA present an analysis of investment in the national road network which would upgrade it to a point where 85 per cent of roads are rated at 3 stars or above, and estimate this measure would reduce serious injuries and fatalities by over 36 000 over a 20 year period with an overall benefit-cost ratio of 3.49 [2]. The key areas contributing to AAA’s estimate of the net benefits of infrastructure upgrades are roadside barriers, central median barriers and shoulder rumble strips. These measures reduce road trauma, however, these are specific to site and traffic conditions. While some issues were identified with AAA’s modelling assumptions BITRE’s analysis confirms that infrastructure measures can reduce road trauma. The use of ANRAM with Australian parameters and traffic volumes, with programme BCR analysis [6], would help in prioritising infrastructure investments to achieve the best safety and benefit-cost outcomes. Reducing speed limits Safety outcomes can be improved by lowering speed limits as well as investing in road infrastructure. Lowering speed limits would have an impact on both the number and severity of crashes, as lower speeds in general lower casualty rates, reduce the severity of injuries, and facilitate evasive action thereby avoiding some crashes. In 2003 BITRE looked at the economics of lowering speed limits and concluded that, in the context of all roads in Australia, ‘there are likely to be many more roads that would warrant a lower average speed than the number that would warrant a higher speed regime’. However, it did not make recommendations for particular roads or classes of roads such as the National Highway Network. [8] Reducing speed limits can increase road safety and will reduce road trauma, but this will also increase travel times on uncongested roads. 39 Journal of the Australasian College of Road Safety – Volume 26 No.2, 2015 BITRE’s analysis suggests that reductions in speed limits may be warranted on some rural roads. However, whether it would be warranted on any particular stretch would depend on specific crash rates and characteristics of that road. The option of reducing speed limits may therefore be of benefit pending infrastructure investment. Intersection measures Measures to improve safety at intersections ranked equal third in the final workshop rankings of identified road safety related measures (see Table 1). The main proposed intersection measures as summarised by Jacobs [16] were: • More roundabouts and more control over right turning movements (that is, either signalised or an outright ban on filter turns) and; • Focus on worst rated intersections [16, Table 3.4]. Over the five year period from 2008 to 2012, twentytwo per cent of fatal crashes in Australia were at intersections. In major urban areas, this increases to forty per cent of fatal crashes. BITRE [10] found that roundabouts were generally the most effective Black Spot programme treatment, reducing casualty crashes by over 70 per cent and property damage only crashes by about 50 per cent. The average benefit cost ratio for single treatment sites was 11.3 at a 4 per cent discount rate. When traffic impacts are taken into account (for a subset of analysed projects), the estimated benefit cost ratios from the subset of roundabout treatments are lower, ranging from -5.4 to 9.3, with an average across four projects of 3.0 [10, pg. 182). There is significant evidence that roundabouts bring large benefits compared with unsignalised intersections, and more limited evidence that roundabouts are safer than signalisation for low traffic volumes. A potentially addressable class of intersection crash is a ‘filter turn’, in which right turning traffic has to ‘filter’ through oncoming traffic, without a dedicated green light. It was not possible to identify the number of intersections where filter turns are currently allowed. While it is not possible to identify the number of crashes of this type, the proportion of fatalities resulting from right-turning intersection crashes is between 2.3 per cent and 3.5 per cent across three jurisdictions. Right-turning intersection crashes also result in between eight to nine per cent of reported injuries (including nonhospitalised). Possible ways of addressing dangerous filter turning are converting the intersection to fully controlled right turns, or disallowing right turns altogether. Costs will depend on the treatment chosen, the location and the affected traffic volumes. 40 Mobile phone distraction Addressing mobile phone distraction ranked equal fifth place in the final workshop rankings of identified road safety related measures (see Table 1). It is illegal in all Australian states and territories to use a hand-held mobile phone while driving, or when a vehicle is stationary but not parked. Some jurisdictions have extended these laws to make it illegal for probationary or provisional licence holders to use fixed (hands-free) mobile phones, or to interact with other units that have visual displays while driving (for example, DVD players or tablet computers) that are not driver’s aids. While research shows clear links between mobile phone use and crash events, it is difficult to determine the involvement of mobile phone distraction in real world crashes. The best estimates indicate that seven per cent of casualty crashes may have distraction from mobile devices (including GPS and other in car device use) as a contributory factor. Seven per cent of casualty crashes equates to 83 deaths and an estimated 2300 hospitalised injuries in 2013. However, stopping drivers using a mobile device would not necessarily have avoided all crashes as this may not have been the only contributory factor. The World Health Organisation suggests that a comprehensive strategy combining legislation, strong and sustained enforcement, and continuing campaigns to support enforcement and increase public awareness of risks and penalties is likely to be effective in tackling mobile phone use [18]. BITRE finds that best practice in reducing the road trauma from mobile device distraction is a comprehensive strategy. BITRE was unable to model specific measures identified by Road Safety experts [16]. Autonomous emergency braking Autonomous emergency braking - a component of emerging vehicle based collision avoidance systems ranked equal sixth place in the workshop rankings of identified road safety related measures (see Table 1). Most current light vehicle autonomous emergency braking systems are low speed. In the base case the number of light vehicles equipped with basic AEB is assumed to gradually increase, reaching approximately 80 per cent of the light passenger vehicle fleet in 2033. In assessing the impact of AEB, BITRE has assumed that it has the most potential to reduce collision crashes and - where applicable - crashes involving pedestrians and pedal cyclists. BITRE has modelled low and high speed autonomous emergency braking systems with different subsets of crashes for both low speed and high speed contexts. Journal of the Australasian College of Road Safety – Volume 26 No.2, 2015 BITRE finds that, even without mandating, the technology is expected to save 1200 lives and prevent 54 000 hospitalised injuries by 2033. There is however a significant lag before autonomous emergency braking-equipped light vehicles comprise a significant proportion of the fleet. BITRE modelling of a hypothetical scenario bringing forward autonomous emergency braking to all new light vehicles from 2018 results suggests an additional saving of 597 deaths and 24,100 hospitalised injuries by 2033. Based on the assumed unit costs, autonomous emergency braking in the scenario has a BCR of 1.3. While autonomous emergency braking is expected to generate significant benefits over the decade to 2030, selfdriving vehicles may be available by 2033 with even larger expected safety benefits (see Box 8 in Report 140). Report 140 key findings • • • • • BITRE’s analysis has confirmed that roadside barriers, median barriers and rumble strips are measures that reduce road trauma. However, to maximise road safety benefits they need to be implemented taking account of specific road conditions. Use of the Australian National Risk Assessment Model with Australian parameters and programme benefit-cost analysis would facilitate prioritising these infrastructure investments from a safety perspective. Lower speed limits can be a valuable option to help achieve improved road safety outcomes where low traffic volumes mean that infrastructure upgrades are not currently economically justified. Intersection treatments can be very effective. Roundabouts can be particularly effective, reducing casualty crashes by over 70 per cent. However, the safety benefits can be partly offset by traffic impacts and there can be negative impacts on motorcyclists, pedal cyclists and pedestrians. Autonomous emergency braking systems will save lives as they are introduced to the vehicle fleet: it is expected to save over 1200 lives and prevent 54 000 hospitalised injuries by 2033. Over 400 of these deaths and 10 000 of these hospitalised injures are pedestrians and pedal cyclists. There is value in a comprehensive mobile phone strategy. While it is difficult to determine how important mobile phone distraction is in real world crashes, mobile devices more broadly may be a factor in 7 per cent of crashes. In 2013, seven per cent of crashes accounted for 83 deaths and 2300 hospitalised injuries. No specific measures have yet been identified that could be modelled by BITRE to test their effectiveness. Table 2, shown on the following page (page 42) summarises BITRE findings. It shows all measures would save lives and reduce the number of hospitalised injuries, and that all measures are warranted on economic grounds with benefits exceeding costs. For example, upgrading the National Land Transport Network, as modelled, returns more than $3 for every dollar invested. References 1. ARRB Group. ANRAM FAQs, 2014. 2. Australian Automobile Association (AAA). Star rating Australia’s National Land Transport Network, AAA, Canberra, 2013. 3. Australian Automobile Association (AAA) . Action for road safety, 2014.. 4. Australian Institute of Health and Welfare. Unpublished data. 5. Austroads. Review of the National Road Safety Strategy, AP-R477-15, 2015.. 6. Bekavac, M., Excell, R., Jurewicz, C. and Winker, E. ANRAM: a case study of integrating asset management into road safety, ARRB Group, 2012. 7. Bradshaw, C.L., Bui, B., and Jurewicz, C. Vehicle Activated Signs: An emerging treatment at high risk rural intersections. Proceedings of the 2013 Australasian Road Safety Research, Policing and Education Conference 28 - 30 August, Brisbane, 2013. 8. Bureau of Infrastructure, Transport and Regional Economics (BITRE). Road speed limits: economic effects of allowing more flexibility, Working Paper 59, Canberra, 2003. 9. BITRE. Effectiveness of measures to reduce road fatality rates, Information Sheet 39, Canberra, 2010. 10. BITRE. Evaluation of the National Black Spot Program, Volume 1, Report 126, Canberra, 2012. 11. BITRE. Road Safety: Modelling a Global Phenomenon, Research Report 141, Canberra, 2014. 12. BITRE. International Road Safety Comparisons Report 2012, Canberra, 2014. 13. BITRE. Traffic on the national road network, 2011–12, Information Sheet 63, BITRE, Canberra, 2014. 14. Chen H.Y. and Meuleners L. The effectiveness of dedicated right turn signals at signalised intersections: Perth Western Australia, Curtin-Monash Accident Research Centre, School of Public Health, Curtin University, 2013. 15. Department of Infrastructure and Regional Development. Overview of project appraisal, Canberra, 2014. 16. Jacobs Group (Australia). National Road Trauma Review: Analysis of Surveys and Workshop Outcomes, 2014. 17. OECD/ITF. Road Safety Annual Report 2014: Summary, 2014. 18. World Health Organisation. Mobile phone use: a growing problem of driver distraction, Geneva, Switzerland, 2011. 41 Journal of the Australasian College of Road Safety – Volume 26 No.2, 2015 Table 2. Summary of measures, Australia Measure Upgrade national land transport network: 85% 3 stars or above, 20 year timeframe • Centre median Potential reduction Deaths Hospitalised injuries 86/year 2,259/year Average cost (millions)a Indicative benefit-cost ratio (BCR)a Notes $236.6/year 3.5 Australian Automobile Association fatality and BITRE hospitalised injury estimates. Australian Automobile Association costs and BITRE BCR estimates. 46/year 1,195/year $116.4/year 3.8 13/year 353/year $26.1/year 5.0 • Rumble strips Reduce speed limits on national land transport network roads More roundabouts 10/year –17 per centc 253/year –17 per centc $37.3/year negligible 2.5 1.9 –72 per centb –79 per centb $0.1–0.6/site 11.3 (3.0) Eliminate filter turns Require Autonomous Emergency Braking in all light vehicles, 16 year timeframe - (d) –58 per centd - 2.6 37/year 1,506/year 1.3 • Roadside barriers Note $339.8/year For a hypothetical rural highway with high crash risk. Higher BCR compares safety benefits with implementation costs. Lower BCR includes possible traffic impacts. Negative impact for some road users. BCR includes traffic impacts Scenario: Autonomous Emergency Braking with vulnerable road user protection by 2018 and high speed Autonomous Emergency Braking by 2020 There was insufficient data to identify sites/sections where speed limit reductions, roundabouts and filter turn measures would apply. It is therefore not possible to calculate expected national reductions in road trauma and the associated total costs. a. Discounted to present values using a real, risk-free discount rate of 4 per cent, consistent with Department of Infrastructure and Regional Development [15] guidelines for calculating benefit-cost ratios. b. BITRE 2012 [10], Table T6.T01 pg.72. c. BITRE estimates based on Austroads Impact of Lower Speed Limits for Road Safety on Network Operations, Sydney, 2010. and an average mean speed reduction of 4.25 kilometres/hour. BITRE has assumed the same proportional reduction in hospitalised injuries. d. Chen and Meuleners [14] found a reduction of 58 per cent in serious injury crashes, but was not able to estimate the reduction for fatal crashes. Source: BITRE estimates 42 Journal of the Australasian College of Road Safety – Volume 26 No.2, 2015 Using statistical modelling to predict crash risks, injury outcomes and compensation costs in Victoria by Renee Schuster1, Michael Nieuwesteeg1, Amanda Northrop1, Cameron Lucas2 and Daniel Smith2 1. Transport Accident Commission, Victoria, Australia 2. Taylor Fry Consulting Actuaries This paper was presented at the Australasian Road Safety Research, Policing and Education Conference (RSRPE) in November 2014. Abstract In 2011, Victoria’s Transport Accident Commission (TAC) built a rich linked crash database to explore the research question: “What are the significant variables in predicting crash risk, injury outcomes and compensation costs when controlling for all other variables”? The core aims of the TAC Road Safety Risk Models project were to conduct sophisticated analyses of available data to identify key drivers of road trauma, injury severity and compensation costs, as well as to identify key target markets. The project began with an intense data build involving the sourcing, linking and cleansing of road safety and related data. This included crash and compensation data, as well as exposure data on Victorian licence holders and registered vehicles. Detailed injury data was also obtained. A series of statistical models were then developed to examine the relationship between person, vehicle and crash variables, along with injury severity and compensation costs. A number of pre-crash variables were found to be significant predictors of crash risk and severity including vehicle, person and geo-demographic variables. Injury severity was found to be the most significant variable at predicting compensation costs. The established database provides a benchmark for future Road Safety policy analysis, particularly with consideration given to the cost of injury to society. With the prospect of new and improved data availability for key input datasets, the TAC has begun to update the linked dataset and refresh the models to identify new relationships. Introduction TAC is a “no-fault” insurance scheme. The reference to “no-fault” means that medical benefits will be paid to an injured person regardless of who caused the crash. The TAC is funded by compulsory payments made by Victorian motorists as part of the vehicle registration and annual renewal process. A key function of the TAC is “to promote the prevention of transport accidents and safety in use of transport” (Transport Accident Act 1986). This means that the TAC is also responsible for delivering public education and Road Safety programs aimed at reducing road trauma. The TAC works in partnership with Victoria Police (Police), VicRoads and the Department of Justice (DoJ) to deliver these objectives. Research has always played a significant role in developing TAC Road Safety and Marketing initiatives. The TAC and other Road Safety agencies rely heavily on police reported crash data to inform strategies and measure progress. The TAC has long maintained a link between data held on its claimants and data recorded by police about the crash. This enables the construction of a linked dataset, thus providing a rich source of crash information supplemented with injury outcomes. In recent years the TAC has engaged widely with its stakeholders to increase its evidence base and enhance analytics. More recent acquisitions include regular snapshots of the VicRoads Vehicle Registration and Licence Holder databases, more detailed information on injury classifications and severity and estimates of lifetime cost of TAC claims. The TAC has also utilised geocoding software to improve address accuracy and append geographic based socio-demographic data. The research strategy has now begun to move beyond the acquisition and improvement of data towards data exploration, and the discovery of insights that provide clear direction to the Road Safety and Marketing program. Transport Accident Commission road safety research Road Safety Risk Models Project The Transport Accident Commission (TAC) is a statutory no-fault compensation scheme that provides coverage for all persons injured in transport accidents in Victoria. The In 2011, the TAC compiled a rich multi-source crash database to explore the research question: “What are the significant variables in predicting crash risk, injury 43 Journal of the Australasian College of Road Safety – Volume 26 No.2, 2015 outcomes and compensation costs when controlling for all other variables”? The core aims of the TAC Road Safety Risk Models project were to conduct sophisticated analyses of Road Safety and related data to identify: • key target markets and; • key drivers of road trauma, injury severity and TAC compensation costs. The project progressed throughout 2011 and involved building a suite of statistical models to identify significant variables when predicting crash probability and crash severity. The TAC contracted Taylor-Fry Consulting Actuaries to work with analysts from the Road Safety and Marketing Team to develop and deploy the models. Method Data Build, Exploration and Preparation During the data build phase, multiple data sources were used to create a database of all persons and vehicles involved in Victorian road crashes between 2006 and 2010. In addition to the linked crash database, the TAC Project team also prepared exposure datasets to facilitate estimates of crash probability. A diagram of the data build phase including administrative input datasets, data enhancements and output datasets is provided as Appendix 1. A broad overview for each of the elements of the data build phase is also provided. The project then progressed to the data exploration and preparation phase, which involved data familiarisation, assessment of data quality and suitability for modelling, data cleansing and the preparation of final datasets. During this phase, the project teams worked together to develop an optimal modelling plan that met the objectives of the project while fitting within the limitations of the available data. For example, it was necessary to separate out the probability modelling into person and vehicle models as we had no information on the usual driver(s) of a given vehicle for those vehicles that are not crash involved; that is, it could not be assumed that a registered vehicle owner was the usual driver of that vehicle. Furthermore, a decision was made to separate out the person and vehicle probability models into single and multiple vehicle crashes as “fault” information was not always available in the crash data; however fault could be assumed in the single vehicle crash models. Modelling The series of models that were subsequently developed are shown in Table 1. The first step of the modelling phase involved variable testing and selection. A large number of variables from the input data sets were initially included in the models. The modelling then undertook an iterative approach whereby the least significant variables were omitted one at a time. Once insignificant variables were omitted, the process progressed to the simplification of continuous and categorical variables. The continuous variables (such as age Table 1: Summary of TAC road safety risk model Model Details Input Data Model Notes 44 Cost Severity Injury Severity Vehicle Probability Person Probability Generalised Linear Model (GLM) fitting the natural log of cost. A series of binomial GLM models using a logit link function. Two binomial GLM models using a logit link function. Two binomial GLM models using a logit link function. Models the no-fault lifetime cost of a TAC claim. Models the probability of a TAC claim being minor / moderate / serious / severe injury. Models the probability of a registered vehicle being involved in a road accident which resulted in a TAC claim in a single year. Models the probability of a licence holder having a road accident and making a claim where they were the driver of a vehicle in a 5 year period. A series of models were developed. Separate models for single vehicle and multiple vehicle crashes. Separate models for single vehicle and multiple vehicle crashes. Claimants. Claimants. (Crashed and claimed) Vehicles. Registered Vehicles (Exposure). Claimants. Licence Holders (Exposure). Includes pre and post crash variables. Used only variables known prior to the crash. Used only variables known prior to the crash. Used only variables known prior to the crash. Only variables relating to the claimant and the vehicle they were occupying were used. Details of other vehicles involved in the crash were not. Only variables relating to the claimant and the vehicle they were occupying were used. Details of other vehicles involved in the crash were not. Only variables available in both the “crashed and claimed vehicles” file and VicRoads registration file were used. Only variables available in both the claimants file and VicRoads licence file were used. Very high and low cost claims were excluded (nb: removed 9%). Only uses claims where an injury score was available (approx 55%). Only used claimant records where the claimant was the driver or rider. Journal of the Australasian College of Road Safety – Volume 26 No.2, 2015 and income) were split into two or more ranges based on a visual analysis of the plotted observations. Splines were then fitted and tested to ensure the slope of each range was statistically different from the next. Categorical variables (such as vehicle make and model) were “grouped” where they were not significantly different from each other. Interaction effects between variables were also examined. Interaction effects are used when the effect of two variables combined is significantly different to the sum of the effects of each individual variable. Results Unlike the Cost Severity Model, the Injury Severity Models used variables known prior to the crash only; thereby identifying some useful risk variables to consider in developing future road trauma prevention strategies. Furthermore, unlike the probability models where the variables we could include were greatly constrained by the exposure datasets, we were able to test many more variables with the Injury Severity Models. For these reasons, this paper presents more detailed results on the Injury Severity Model. High level results only from the other models are summarised thereafter. Injury severity modelling results The Injury Severity Models predict the probability of a TAC Claim being minor, moderate, serious and severe injury severities; using Maximum Abbreviated Injury Score (AIS). AIS is an anatomical-based coding system to classify and describe the severity of specific individual injuries. A score of between one and six (labelled as minor, moderate, serious, severe, critical and maximum) is assigned to each individual injury. Maximum AIS is the score of the person’s most severe injury. Due to the very small number of high severity claims in the input datasets, claimants with a Maximum AIS score of four and above were grouped into the “severe” injury group for the purpose of these models. Table 2: Injury severity models - significant variables Person Geo-demographic Crash Vehicle Age Gender Licence Type Seatbelt / Child Restraint / Helmet Seating Position Proportion with at least a bachelors degree (in local area) Crash Date Speed Zone Vehicle Intent Vehicle Offending Vehicle Type Year of Manufacture The following charts present raw probabilities and pure effect relativities for selected significant variables in the Injury Severity Models. The probability charts on the left show the actual relationship between the predictor variable (e.g. age) and the modelled variable (in this case, injury severity). This is equivalent to the raw, unmodelled data without controlling for other predictor variables. The relativity charts on the right hand side show the pure effect on the model (after controlling for other significant predictors) for values of the predictor variable. For continuous variables, a value of 100% translates to no effect, a value of less than 100% translates to a lower severity and values greater than 100% translate to a higher severity. For categorical variables, one factor was chosen as a base which would obtain 100% relativity, and the other factors would be given a relativity score in relation to it. Selected observations from the results of the Injury Severity Modelling include: • Severity of injury increases with age. • Males were at a significantly higher risk of serious injury than females. • Learner drivers have relatively more severe crashes, but unlicensed drivers are far more likely to have serious or severe crashes. • Passengers in general are worse off than drivers. Rear seat occupants specifically were at 50% higher risk of severe injury than drivers. • Seat belt use and helmet use is extremely protective, particularly for children. • Motorcyclists have more severe injuries, particularly if a helmet is not worn. • Pedestrians are slightly worse off than a motorcyclist not wearing a helmet. • The faster the speed, the more severe the injuries. • Risk of serious injury was 4.5 times higher in truck involved crashes compared to standard vehicles. Overall project findings Injury severity was found to be the most significant variable at predicting TAC compensation costs. As expected, the cost of a claim grows with increasing injury severity. By far the most at risk are 18 year olds. Males are worse than females in terms of probability of single vehicle crashes and severity of all crashes. Motorcyclists contribute significantly to the probability of a claim for males, especially in the 30-50 age group. When motorcyclists are excluded, males and females have a similar claim 45 Journal of the Australasian College of Road Safety – Volume 26 No.2, 2015 Figure 1: Injury severity models – the effect of age at crash Figure 2: Injury severity models – the effect of gender Figure 3: Injury severity models – the effect of licence type probability distribution when single and multiple vehicle crashes are combined. Motorcyclists in general have a higher claim probability, are more likely to be involved in single vehicle crashes, have more severe injuries (which are exacerbated if a helmet is not worn) and have slightly higher compensation costs for similar severity of injury. Geo-demographic variables, and particularly socioeconomic variables, have a significant influence on injury severity, claim probability and compensation costs. Language barriers tend to increase claim costs but 46 potentially lead to a lower probability. Increased income and education in the area where a claimant lives lead to lower probability, lower severity and lower costs for injuries of the same severity. Newer cars are less likely to be involved in a serious crash, and when they are, the compensation costs are relatively lower. Some vehicle makes, models and types are more prone to single or multiple vehicle crashes. For example, Commodores and Falcons are more likely to be involved in single vehicle crashes than small or expensive cars. The Journal of the Australasian College of Road Safety – Volume 26 No.2, 2015 Figure 4: Injury severity models – the effect of seating position and seatbelt/helmet Figure 5: Injury severity models – the effect of speed zone Figure 6: Injury severity models – the effect of truck involvement impact of different vehicles is typically watered down in multiple vehicle crashes given that fault was not considered. It is important to note the potential bias in interpreting the results of the vehicle probability model and the impact of different vehicles given that driver characteristics were not included. For example, the results indicating Commodores and Falcons are high risk vehicles may be caused by the types of drivers of these vehicles, rather than the vehicles themselves. Conclusions The established database provides a benchmark for future Road Safety policy analysis, particularly with consideration given to the cost of injury to society. The TAC has begun to update the linked dataset with updated data, and some new and improved data acquisitions. This includes updated TAC lifetime compensation cost estimates, updated ABS Census data, more detailed vehicle specification data and vehicle crash worthiness ratings. The TAC now also 47 Journal of the Australasian College of Road Safety – Volume 26 No.2, 2015 has more regular snapshots and a wider range of data on Victorian licence holders from VicRoads, including demerit point history and licence conditions. Future work will also explore utilising self-reported injury data collected by the TAC claims department, in addition to injury codes obtained from the hospitals, to create a richer dataset of injury severity. Future work may also entail sourcing private car insurance data to better understand the population of road users that are not involved in crashes. Although a large suite of variables were tested in the initial models, many more will be tested in future. These include whether the claim had previous psychology, chiropractic or physiotherapy treatment and whether they had pre-existing drug or alcohol issues. Limitations of previous models will be explored and many aspects of the models will be reviewed and refreshed. This will ensure the models reflect the current state of play and new relationships are identified. Administrative Datasets TAC Claims Data: data is largely collected for the purpose of claims management and processing. The dataset includes demographic data, residential address at claim lodgement, occupation, injuries sustained, medical treatments received and selected crash related information. Medical Care Provider Data: For each TAC claimant, the TAC receives detailed data on injuries being treated by medical care providers. These providers include the Department of Health, surgeons, doctors, physiotherists and counsellors. Victoria Police Traffic Incident System (TIS): Contains information on all traffic accidents reported to Victoria Police. This includes information on crash involved persons and vehicles, crash circumstances, crash location, road (and roadside) features and conditions, and weather conditions. VicRoads Road Crash Information System: Contains a subset of TIS; all persons involved in accidents where at least one person was injured. VicRoads has a team of coders that validates and revises selected data collected by police members, particularly in relation to crash location and road characteristics. The VicRoads Vehicle Registration Information System: Holds information on all vehicles registered in Victoria. It includes information such as registration number, Vehicle Identification Number (VIN), vehicle specifications (e.g. make, model, type, class etc.), garage address and details of the vehicle owner. The VicRoads Driver Licensing System: Holds information on all persons holding a Victorian Driver/ Rider licence. This includes (for each licence holder) basic demographic information, residential address, and licence type and proficiency. 48 Data Enhancements Monash University Accident Research Centre (MUARC) Injury Severity Coding: MUARC assisted with mapping hospital injury codes to a range of injury severity measures; including the Abbreviated Injury Scale (AIS). AIS is an anatomical-based coding system to classify and describe the severity of specific individual injuries. This new data provided a more simple numerical method for grading and comparing claimant injuries by severity. TAC Modelled Lifetime Claim Costs: TAC actuaries calculated estimates of outstanding claim liabilities, which were added to “to date” claim payments to estimate the lifetime cost of individual claims. These costs were all indexed to values as at June 2011. Intech IQ Standardiser: a software package designed to validate and correct address data, and subsequently undertake geocoding; which involves assigning geographic coordinates and other geographic codes (including ABS Census Collection District (CCD)) to each address. Claimant first known address, the residential address of all licence holders and garage address for all vehicles were validated and geocoded where possible. The Australian Bureau of Statistics 2006 Census data, aggregated to Collection District and postal area was obtained. Socio-demographic data (such as ancestry, income and education) was appended to person and vehicle level address data where possible; including claimant address, licence holder address and vehicle garage address. Output Files The Claimants file contains a record for each claim in the period 2006 to 2010 from all persons who had a claim accepted by the TAC. This dataset contained approximately 85,000 records. The Non-Claimants file contains all persons who were involved in a road traffic accident in the period 2006 to 2010 but did not have an accepted claim with the TAC. This dataset contained approximately 470,000 records. The Vehicle file contains a list of all vehicles involved in a transport accident (with or without a TAC claim), which was reported to Victoria Police and/or the TAC over the study period. This dataset contained around 400,000 records. The Crash file contains a list of all transport accidents (with or without a TAC claim), which was reported to Victoria Police and/or the TAC over the 5 years of interest. The final dataset contained approximately 240,000 records. Journal of the Australasian College of Road Safety – Volume 26 No.2, 2015 Appendix 1 49 Journal of the Australasian College of Road Safety – Volume 26 No.2, 2015 Reducing trauma in the youth of Australia by Janet McLeod Senior P.A.R.T.Y. Coordinator National Trauma Research Institute (NTRI) The Alfred, Melbourne [email protected] As clinicians we know that injuries are often preventable, particularly those acquired through the toxic combination of alcohol and/or drugs and risk-related behaviour. The inaugural report of the Australian Trauma Registry (Alfred Health) shows that 15-25 year olds are the most likely to be admitted in an Australian designated trauma centre. Males were 3.8 times more likely to suffer major injuries than females. It also shows that approximately half of all trauma patient admissions are road-transport related. P.A.R.T.Y. (Prevent Alcohol and Risk-related Trauma in Youth) is one of many programs seeking to reduce the overrepresentation of youth in the trauma statistics. Unlike other programs with this goal however, P.A.R.T.Y. occurs in a hospital, not at a school or in a classroom and is led and delivered by clinical staff. The Program is a full day trauma prevention experience aimed at senior school students, young offenders, trainees and apprentices. It seeks to give participants a snapshot of the possible traumatic and often preventable consequences of risk-related behaviour through vivid clinical reality. A standard P.A.R.T.Y. program day incorporates short visual presentations in the first half of the day by a range of health professionals to prepare the participants for what they will see and experience in the hospital environment, giving context to injury, risk, choices, and consequences. The second part of the day sees P.A.R.T.Y. participants spend time with staff and those effected by trauma in the Emergency/Trauma Centre, the Intensive Care Unit, trauma wards, and rehabilitation units of the hospital getting an up front, true to life experience of the impact of trauma on young lives. Many hospitals have also developed specifically tailored programs designed to appeal to and engage with particular participant populations. For example the Royal Perth Hospital has a much sought after presentation that engages Aboriginal youth in the community and the Royal Melbourne Hospital deliver a program for young offenders. P.A.R.T.Y. has been delivered at Trauma centres in Australia since 2006 when 652 participants visited the Royal Perth Hospital and in 2015 over 10,000 participants are expected to be exposed to its key messages of “Choice, Risk and Consequence” amongst the 15 sites running the program. 50 The Australian hospitals undertaking P.A.R.T.Y. are: • The Royal Perth Hospital (WA) • The Royal Perth Hospital - Bunbury Health Campus, Denmark Campus, Albany Campus (WA) • The Alfred (VIC) • The Royal Melbourne Hospital (VIC) • The Royal Brisbane and Women’s Hospital (QLD) • Nambour General hospital (QLD) • Gold Coast (QLD) • The Royal North Shore Hospital (NSW) • Liverpool Hospital ( NSW) • Royal Adelaide Hospital ( SA) • The Canberra Hospital (ACT) • University of Tasmania and Royal Hobart Hospital (TAS) Each facility has its own site licence purchased from Sunnybrook Medical Centre, Canada where the program originated in 1986. Each Program differs based on the hospital resources, staff, and local hospital environment but all follow a similar format and are based on the same trauma prevention messages of smart choices, the Journal of the Australasian College of Road Safety – Volume 26 No.2, 2015 Research is being planned and undertaken at many sites in Australia at the present time. With the continued connection between site coordinators and the establishment of more sites across Australia, the opportunities for multisite research initiatives will become a possibility. Testimonials “Makes people realise outcomes of making stupid decisions and who it affects. The real life situations, families, patients, and equipment proved that these things could happen to any of us” – Student - Year 10 perception of what constitutes risky behaviour, and the lived experience of traumatic consequences. It is hoped that exposing young people to the possible traumatic consequences of risk-related behaviour will have an impact on their perceptions and the choices they may make in the future. Research to date A study conducted at Ottawa Hospital in Ontario, Canada sought to determine whether the P.A.R.T.Y. program had an impact on injury prevention knowledge, attitudes or behaviours of youth at six weeks after completion of the program and found that youth have significantly improved knowledge about risk factors for injury and more positive attitudes towards safe behaviour [5]. In addition, an analysis of 10 years of the P.A.R.T.Y Program in Canada concluded that P.A.R.T.Y effectively reduced the incidence of traumatic injuries by 4% (5% in females) among 1281 of its participants compared to a matched control group of teens who did not participate [2]. Another study published in 2012 has demonstrated a reduction in the acuity and rate of recidivism in Juvenile Justice Offenders who attended P.A.R.T.Y. in WA. [3, 4] “Brilliant! Well organised day broken up with appropriate amounts of theory and practical components. I know a couple of the students have the tendency to be quite apathetic. To see their engagement is a testimony to the program” – Teacher - Year 10 [My staff and I] all agreed [The Program] was a stunning and inspirational experience and amazingly, the students have been talking to other students about it ever since. I have rarely known in my career an experience like it.” Vice Principal It has influenced me and my thoughts about taking risks and may save someone’s life – Student - Year 11 “It’s an exciting program to be involved with and a great opportunity and platform to highlight the consequences that can occur when things go wrong - every session has made me feel that maybe we have helped just a little bit to decrease teenage trauma” Emergency Nurse “….it was hard having my son lying still in the ICU (Intensive Care Unit) not knowing if he would wake up. But, I had a story to tell and if telling our story can save another mum from the same pain and the awful phone call….I will keep on telling it” Mother of Patient visited by group. Contact details: An economic analysis found that the P.A.R.T.Y. injury prevention program involving real like trauma scenarios was cost-effective in reducing subsequent risk of committing violence or traffic related offences, injuries, and death for juvenile justice offenders in Western Australia. [3, 4] P.A.R.T.Y. HQ http://www.partyprogram.com/ Currently evaluation of impact is measured at all sites with an average across Australia of 97% of participants and 99% of supervisory staff saying via an anonymous feedback form that they would recommend the program to others. VIC: Royal Melbourne Hospital: Natalie Cooke (03) 9342 4294 [email protected] WA: Michaela Copeland (08) 9224 1429 [email protected] The Alfred: Janet McLeod (03) 9076 8888 [email protected] 51 Journal of the Australasian College of Road Safety – Volume 26 No.2, 2015 QLD: Nambour: Shane Convey (07) 54705219 [email protected] ACT: The Canberra Hospital; Nardine Johnson (02) 62442638 P.A.R.T.Y. [email protected] Brisbane: Jodie Ross and Tracey Daelman (07) 36460864 [email protected] NSW: Royal North Shore: Maura Desmond (02) 94632213 [email protected] Gold Coast: Matt Scott (07)56872668 [email protected] Liverpool: Nevenka Francis (02) 8738 3428 [email protected] Royal Perth Hospital leading the way in road safety by Dr Sudhakar Rao MBBS FRACS HepatoBiliaryPancreatic Surgery Director of Trauma, Royal Perth Hospital As a surgeon for more than 20 years, I have seen firsthand the impact of road trauma. The injuries that I have seen at Royal Perth Hospital’s State Adult Major Trauma Unit have been some of the most devastating youth related road trauma that I have encountered. Already this year more than 30 people have lost their lives on Western Australian roads. Added to this terrible toll, more than 100 others have sustained critical injuries in road crashes. Last year, WA had the worse fatality rate of any other Australian State, with young males continuing to be overrepresented with 80 to 86 percent of major trauma aged between 15 to 24 years of age. My experience in seeing the impact of road trauma on young people led me to look at ways that we could raise awareness about the importance of road safety. Royal Perth Hospital is the first hospital in Australia to roll out the P.A.R.T.Y (Prevent Alcohol and Risk Related Youth) Program which is a licensed Canadian Program running in around 100 hospitals globally. The success of the Royal Perth Hospital Program has seen us expand it into regional areas including Bunbury, Denmark, Geraldton and Albany, and after our success, a number of States across Australia have also established the program. 52 Since commencing in 2006, our reality-based Program has won numerous awards and we have seen more than 8,500 Western Australian teenagers come through the program. Attendees learn about traumatic brain and spinal cord injuries, and meet trauma patients in the intensive care and trauma wards. The Program addresses social and safety issues around drug and alcohol use, violence, aggression, and encourages teenagers to learn first aid. The 2014 Royal Perth Hospital Trauma Registry data shows that road safety continues to be a key issue for youth aged between 15 and 24 involved in a major trauma. The Program content therefore includes a significant focus on road safety including seatbelts, safe cars, driver behaviour/distraction, helmets and other protective gear for motorcyclists and cyclists. We continue to evolve our program to ensure that it is evidence based and reaches our vulnerable teens that are most likely to exhibit risk-taking behaviour. The Program continues to be overwhelmingly popular and evidence to date has shown that it is not only costeffective but also reduces the risk of youth committing to violence or traffic related offences, injuries and death. The Royal Perth Hospital team is proud of our program as we are making a real difference in raising awareness of the impact of reckless decisions on the road. It is a very rewarding experience as we have changed lives and witnessed the impact the Program has on participants, some of which may have ended up in our in our care if they didn’t experience the reality of road trauma. Journal of the Australasian College of Road Safety – Volume 26 No.2, 2015 TAS: Royal Hobart/ UTAS: Melanie Greenwood and Gill Course (03) 62264732 [email protected] 2. Banfield J., et al.Effectiveness of the P.A.R.T.Y. (Prevent Alcohol and Risk- related Trauma in Youth) Program in Preventing Traumatic Injuries: A 10- Year Analysis. The Journal of Trauma: Injury, Infection, and Critical Care. 2011, 70:3, pp732-35. SA: Royal Adelaide (08) 8222 2112 [email protected] 3. Ho K. M., et al. Effect of an Injury Awareness Education Program on Risk-Taking Behaviors and Injuries in Juvenile Justice Offenders: A Retrospective Cohort Study, 2012. At: www.plosone.org/article/ info%3Adoi%2F10.1371%2Fjournal.pone.0031776 4. Ho K. M., et al. An injury awareness education program on the outcomes of juvenile justice offenders in Western Australia: an economic analysis, 2012. At: http://www. biomedcentral.com/1472-6963/12/279 5. Nuth J., et al. An Evaluation of P.A.R.T.Y.: A Canadian Injury prevention program for teenagers. Academic Emergency Medicine,1999. 6:5, pp 494. References 1. Alfred Health. Caring for the Severely Injured in Australia: Inaugural Report of the Australian Trauma Registry 20102012. Alfred Health, Melbourne, Victoria, 2014. The social and economic cost of road related injury and death by Dr John Crozier Chair of the Trauma Committee Royal Australasian College of Surgeons College of Surgeons Gardens 250 - 290 Spring Street, East Melbourne VIC 3002 Introduction ¾¾ 15-24 year olds had the highest incidence of injury The Royal Australasian College of Surgeons was integral in 1960’s and 1970’s working alongside pioneers dedicated to bringing an end to the escalating carnage on the roads. Pioneering Fellows of the College advocated to change public opinion, public behaviour and influence legislators. The resulting radical changes included mandatory seat belts, helmets for cyclists and drink driving laws - all of which accounted for the massive downturn in the rates of road trauma. ¾¾ Over half of all injured patients admitted were the result of vehicle-related accidents The collection of trauma data has been on the radar of trauma professionals since the recommendations of the National Road Trauma Advisory Council report on Trauma Systems in 1993, and the Victorian Review of Trauma and Emergency Services in 1999 which recognised trauma registries as having the potential to improve care of the injured patent. The Australian Trauma Registry delivered its inaugural report in 2014 (http://www.ntri.org.au/ quality-improvement/austqip) which, through data entry and analysis, provided an opportunity for comprehensive analysis of injury - the first time such an analysis has been possible. The report highlighted: ¾¾ Nine-in-10 seriously injured patients survived their trauma after receiving hospital care The quality assurance of the registry, benchmarks performance against national and international standards, which, through consistency and high performance trauma care throughout the country, effects improved patient outcomes and ensures all future seriously injured people have the best chance of survival and recovery from injury. The Trauma Committee is committed to supporting the sustainment of the Australian Trauma Registry and the further maturation of the registry, data entry and data analysis to help effect Australian trauma system quality improvement. The College is committed to ensuring the highest standard of safety and comprehensive surgical care for the community we serve through excellence in surgical education, training, professional development and support. As part of the commitment the College strives to take 53 Journal of the Australasian College of Road Safety – Volume 26 No.2, 2015 informed and principled positions on issues of public health. In February 2015 it submitted the following response to the Senate Inquiry into aspects of road safety in Australia. We believe that, if addressed by the Government, the road safety initiatives contained within the submission could make a significant difference to public safety and well-being. Executive summary The governments of the last decade should be congratulated for prioritising road safety and producing the National Road Safety Strategy 2011-2020 [1]. The Strategy is an excellent document which analyses road safety risks in terms of the elements of the Safe Systems Approach to Road Safety and makes good recommendations as to how individual components of these major elements can contribute to reductions in fatalities and serious injuries. ill health and premature death for adult men aged 15 - 44 years. [2] In Australia, on average four people die and 90 people are seriously injured every day. However Australia has achieved substantial reductions in road crash fatalities over the last 30 years. Evaluation evidence indicates that many of these gains can be attributed to specific road safety interventions, such as the introduction of seatbelt laws and random breath testing.[3] More can be done to reduce the number of road-related injuries and deaths. Greater efforts to reduce speed Recognising the major role that excessive speed plays in the causation of serious road crashes, the College recommends that: The College of Surgeons believes that the target of a 30% reduction in fatalities will still result in over 800 deaths per year (and possibly 4,000 to 5,000 serious injuries). For surgeons who see road trauma victims on a daily basis, this is unacceptable. We urge the Government to implement the recommendations in the strategy as a major priority. Key initiatives, aligned to the Senate Terms of Reference, include (but are not limited to): • Appropriate speed limits be adopted having regard to the environment, traffic density and other relevant considerations. • Enforcement programs and initiatives be intensified so that there will be a higher chance of detection and penalties for drivers and riders who exceed the speed limit. -- Greater efforts to reduce speed • Ban radar detection devices in vehicles. -- Greater efforts to reduce the role of alcohol in roadrelated injuries and deaths • Cancellation of licence for drivers and riders exceeding the speed limit by a specified margin. -- Separate vulnerable road users from motor vehicles • -- Rapid introduction of life-saving technologies in all new cars, and policies which encourage consumer uptake of newer vehicles Gradation of speed penalties commensurate to the level of danger. • Regular reviews of speed limits using input from road users. -- Compulsory introduction of ‘black box’ technology in all heavy vehicles and cars • Prominent display of signage relating to speed limit changes. -- Cease the open speed limit trial in the Northern Territory Greater efforts to reduce the role of alcohol in road-related injuries and deaths -- Vehicle safety and licensing Because of the continuing major influence of the misuse of alcohol in road crash causation, assault and violence, the College supports countermeasures aimed at drink drivers, riders and the general community. These countermeasures include: The College of Surgeons has a long history of road safety advocacy. It regularly revises and updates its positions in accordance with safety measures which undergo ongoing research and development by a large ‘road safety’ industry. Social and economic cost of road-related injury and death Road traffic injuries are the leading cause of death by injury worldwide (one fifth of all deaths from injury) and the tenth leading cause of all deaths (2.2% of all deaths). Road traffic injuries rank second to HIV/AIDS as the leading cause of 54 • Fitting alcohol ignition locks to commercial vehicles such as trucks, passenger coaches and buses, taxis, trams and trains. • Intensification of random breath testing of drivers and riders. Journal of the Australasian College of Road Safety – Volume 26 No.2, 2015 • Compulsory breath testing of all drivers, riders and pedestrians involved in an injury-producing crash or charged with a moving traffic offence. of the devastating effects of injury. These include design features such as airbags, seat belt reminder systems, electronic stability control and anti-lock braking systems. • Compulsory breath testing of all adults 16 years and older who attend hospital for treatment, for the purposes of data collection to inform future policy. The impact of new technologies and advancement in understanding of vehicle design and road safety. • Improved drink driving education programs. • Including knowledge of how alcohol will affect driving ability as part of driver’s and rider’s licence tests. • Relicensing of drivers or riders disqualified for driving with a BAC above 0.15g/100mls, or for a second offence, compulsory installation of an alcohol ignition lock. • • Research to address the incidence of alcohol-impaired pedestrians. Strategies to reduce the rate of reoffending in relation to drink driving. The College also supports measures to reduce the problem of alcohol abuse and/or misuse throughout the community more generally, in particular reducing the number of Hours alcohol is available for, reducing the number of Outlets where alcohol is sold, and introducing a volumetric Tax on alcohol (HOT issues). Separate vulnerable road users from motor vehicles More than one fifth of the road traffic deaths that occur worldwide are pedestrians. [4] Separation is essential to ensure the safety of our most vulnerable road users, for example pedestrians and cyclists. Increases in our population will only exacerbate this vulnerability, as people seek alternative, inexpensive and efficient forms of transport, while seeking to improve their health and wellbeing. Where separation is not feasible, it is vital that efforts are made to control the speed environment. Roadway design is also an important factor and should be undertaken to maximise pedestrian safety. The World Health Organization’s Pedestrian Safety manual has assessed the effectiveness of specific interventions that can be undertaken. [5] The importance of design standards on imported vehicles, as Australian vehicle manufacturing winds down The College supports all evidence-based initiatives that assist in the prevention of road trauma and the reduction Rapid introduction of life-saving technologies in all new cars, and policies which encourage consumer uptake of newer vehicles. Mandating proven life-saving technologies (for example reversing cameras) in all new cars, including fleet cars, will significantly improve the safety of Australian vehicles overall and decrease the average age of Australian fleet vehicles. Compulsory introduction of ‘black box’ technology in all heavy vehicles and cars Having black boxes installed in all vehicles may act as a deterrent to unsafe driving practices, particularly with respect to truck drivers. In addition to improving law enforcement, the technology can be useful in the analysis of crashes, facilitating a better understanding of crash and injury risk factors and mechanisms. New knowledge can be utilised by the insurance industry to improve overall standards. The different considerations affecting road safety in urban, regional and rural areas Cease the open speed limit trial in the Northern Territory Numerous international studies have shown conclusively that the introduction of point to point speed monitoring for all vehicles on lengths of road known to have a high crash risk reduces the number of crashes occurring and also the severity where crashes do occur. The Northern Territory ‘unlimited speed’ trial contradicts the goals and recommendations of the National Road Safety Strategy (to which the Northern Territory Government is a signatory) - primarily the recommendation that speeds should be reduced on high risk roads. The stretch of highway involved in the ‘trial’ has been assessed by the Australian Road Assessment Program (AusRAP) as a high risk road. Vehicle safety and licensing In remote Australia, where there is a high rate of injury per capita, risk factors which have improved in metropolitan areas are still very relevant. These include vehicle roadworthiness, driver training and licensing, seatbelt use and alcohol. These issues are compounded by barriers in cross-cultural communication and access to services, 55 Journal of the Australasian College of Road Safety – Volume 26 No.2, 2015 but can be rectified with appropriate communication and resources. In terms of road trauma prevention, the Royal Australasian College of Surgeons recognises the need for a range of measures as outlined in the following position paper. stability control and countermeasures for alcohol and driver distraction can all make a difference to reduce the road toll. The College regularly revises and updates its positions in accordance with safety measures that are being constantly researched and developed by a growing industry. The College recommends and supports the following positions: Position paper: road trauma prevention Frontal Protection Systems (FPS) Background • Australasian FPS be compliant with standards that offer the best outcome for pedestrians e.g. the current Economic Commission for Europe (ECE) pedestrian impact standard. • Policies to reduce the number of non-conforming FPS particularly in the metropolitan-based fleet, perhaps including the prohibition of sale and use of noncompliant FPS to all vehicles from a specified date. • Consideration be given as to the legality of some FPS in urban areas where the probability of a crash occurring involving a pedestrian is much higher. • Consideration be given to research and development of removable FPS for use by vehicles that are used in both urban and rural areas. In 1965 the Royal Australasian College of Surgeons (the College) recognised that road trauma was a serious public health problem reaching epidemic proportions. A Road Trauma Committee was appointed to report to Council on measures needed to prevent or reduce serious injury (trauma). The College has been influential with policy makers and legislators and was a major contributor towards mandatory seat-belt wearing, drink driving countermeasures and the compulsory wearing of helmets by pedal cyclists. Since the mid-1980’s the College saw that it would need to widen its role in trauma prevention and management beyond those injuries which resulted from road crashes. In July 1991, the College Trauma Committee was formed which continued the College’s double commitment: prevention and mitigation of injuries, and management of injuries - encompassing injuries resulting from all sources. The College’s position on road trauma has been developed and continually updated since the original standing committee was formed in 1970. Many of the recommendations have been introduced around Australia and New Zealand although some jurisdictions are slow to take up new initiatives – such as graduated licensing and even BAC (blood alcohol content) in drivers; which the College recommends should remain at .05. The College continues to play an active role in road trauma prevention. The College Trauma Committee hosts annual trauma workshops, holds regular meetings, engages with the media, hosts international speakers at the annual scientific congress, supports research, prepares submissions to inquiries and promotes and participates in trauma training such as EMST (Early Management of Severe Trauma and DSTC (Definitive Surgical Trauma Care) courses. It also plays an important advocacy role regarding issues such as quad bikes, speed, vehicle safety and alcohol. Many Fellows of the College see the effects of road safety issues on a regular basis and in the case of trauma surgeons, almost daily. The College supports all evidence-based initiatives that assist in the prevention of road trauma and the reduction of the devastating effects of injury. Initiatives such as speed control, airbags, seat belt reminder system, electronic 56 The College supports the following safety measures that: Railway Crossings Recognising the seriousness and frequency of trauma associated with Railway Crossings, the College recommends the following safety measures: • A program to eliminate level crossings be pursued and, where this is not possible, that automatic boom gates, rumble strips, warning signs with flashing lights and speed restriction zones be installed. • Level crossings frequented by heavy vehicles be prioritised for safety improvement. • All level crossings be illuminated when trains are crossing. • All rail cars and engines be marked with appropriate reflector tape along the sides. • When railway crossings are used infrequently and seasonally, the decision to use the crossing should be assessed by safety officers from the road traffic authority, police and rail authorities before and during use, and signage and illumination be installed. • Police be given powers to veto the use of such a crossing if considered unsafe. • A campaign be run to educate drivers about the dangers of level crossings. Journal of the Australasian College of Road Safety – Volume 26 No.2, 2015 Pedal Cycling The very nature of cycling makes riders extremely vulnerable to injury either by falls or collisions. The College supports the following safety measures: • Support for graduated licensing programs which require a minimum age for solo riding equal to the minimum age for obtaining a probationary car driver’s licence with longer probationary periods. • Support for increasing restrictions regarding alcohol and other drugs, in light of the knowledge that riding a motorcycle requires higher levels of vehicle control and cognitive skill than driving a motor vehicle. • Adequate enforcement of legislation for mandatory wearing of nationally approved safety helmets with regular review of compliance. • Continued promotion of bicycle helmet wearing by national, state and local campaigns, through community road safety councils, municipal councils, school authorities and parents. • Support for governments to view motorcycles as a significant, increasing and distinct mode of transport and form of recreation when planning roads and safety strategies. • Expansion of bicycle path networks in cooperation with local government and other agencies, supporting those networks that separate motor vehicles, bicycles and pedestrians. • • Mandatory use of approved tail lights, fixed reflectors, light-coloured clothing and reflectors on clothing and helmets particularly for night cycling. Support for governments to place emphasis on offroad motorcycle strategies and measures such as age restrictions, mandatory helmet wearing, appropriate training and supervision, particularly for younger riders, to reduce off-road motorcycle injuries. • Support for identifiers on all motorcycles. • Support for initiatives which encourage all road users to ‘share the road.’ • Development of national primary school bicycle education programs. Vehicle safety features such as, but not limited to, front, side and curtain airbags, anti-lock braking systems, electronic stability control and aggressive seat belt reminder systems be installed in all new cars. • Close liaison between vehicle designers, road engineers and those who treat road trauma victims to ensure vehicle safety improvements are in line with world’s best practice. • Support for further research into injury patterns of motorcycle riders, pillion and sidecar passengers and motorcycle protective clothing suitable for Australasian conditions. Clinical representation on National Design Rules Committees. • Support for further research into the effectiveness of Daytime Running Lights for all motorcycles in Australasia. Programs such as the Australian New Car Assessment Program (ANCAP) and mandatory display of car safety ratings at point of sale to communicate the importance of safety. • Vehicle safety advertising codes that place safety as the highest priority. • Mandatory wearing of approved seat belts or other restraints by all occupants wherever seated in a motor vehicle including buses, and there be no exemption from wearing a restraint on medical grounds. • Mandatory wearing of approved child restraints and use of booster seats for all children up to 135 cm. • Support for Government loan and community-based schemes designed to improve availability of approved infant and child restraints. After a crash motorcycle death and injury rates are significantly higher than those involving motor vehicles. The College supports the following strategies to reduce the risk of death or injury to motorcycle riders: • • Recognising the major role that vehicle standards and features play in the reduction of road trauma, the College recommends the following measures be supported: • Motor Cycling • Vehicle Safety - Car Mandatory wearing of approved helmets by all motorcycle riders and pillion passengers on and off public roads - with no exemptions on medical grounds. • Support for further development and research into other safety features such as motorcycle airbags, airbag jackets, ABS (automatic braking systems). • Motorcycle licensing programs to take into account the higher levels of vehicle control and cognitive skill required to ride a motorcycle compared to driving a vehicle. 57 Journal of the Australasian College of Road Safety – Volume 26 No.2, 2015 Speed • Recognising the major role that excessive speed plays in the causation of serious road crashes; particularly in combination with alcohol, the College supports the following, that: A national minimum learner driver age of 16 years and at least 120 hours of supervised pre-licence driving (a minimum of 10% of these to be with a fully qualified driving instructor) in varying conditions. • Passenger restrictions, particularly in the first year of licenced driving. • Night time curfews, particularly in the first year of licenced driving. • Zero blood alcohol for all probationary drivers. • Prohibition of use of telephones within motor vehicles by learner or probationary drivers. • Vehicle power restrictions for all learner and probationary drivers. • A graded demerit point allowance system for drivers up to the age of 25 years. • Appropriate speed limits be adopted having regard to the environment, traffic density and such other considerations as may be relevant to safe road usage. • Enforcement programs and initiatives be intensified so that there will be a higher chance of detection and penalties for drivers and riders who exceed the posted limits. • • • • Radar detection devices in vehicles be banned. Speed limits be reduced on both urban non-arterial roads and regional/small towns, and that there be consistency of speed limits in shopping centres, school zones and precincts of high risk to pedestrians, and cyclists. Cancellation of licence for drivers and riders exceeding the speed limit by the specified margin be supported. The gradation of speed penalties be commensurate with the level of danger. All heavy vehicles such as trucks, coaches and buses be fitted with speed governors and effective monitoring programs and adequate penalties for tampering with such devices be enforced. • Regular reviews of speed limits occur, taking into consideration what road users suggest are appropriate in the particular situation. • Signs advising changes in speed limits be prominently displayed on all roads. Licensing The College, aware of the diversity of licence regulations in various jurisdictions, recommends the following licensing initiatives: Older and impaired drivers • Policies which strike a balance between the rights of our senior community for mobility and independence and their responsibilities as safe drivers. • Further research and development into effective methods of identifying hazardous drivers. • Self-assessment style tools which older drivers should be asked to consider at licence renewal. These could also have potential for use by a General Practitioner. For example a driver could be asked to respond to a health questionnaire either by themselves or in conjunction with their regular medical practitioner which would provide the driver with an opportunity to seriously consider their driving ability on a regular basis. A General Practitioner could use these tools to monitor a patient on a regular basis. • Restricted licences which can allow drivers to maintain mobility and independence in lower risk situations. An ‘R plate’ system is supported. • Policies which improve the availability of alternative transport options and encourage their use by senior community members. Policies which improve the safety of the Australasian vehicle fleet and encourage their purchase by older drivers as a way of reducing injury severity. Young Drivers • The application of a graduated licensing system whereby newly licensed drivers have a period of time in which to gain experience. • • Increasing the probationary period to an age which research shows a greater ability to assess risks, control impulsive behaviour and handle distractions. References • A national minimum driving age of 18 years. 58 1. National Road Safety Strategy 2011-2010, http://www. infrastructure.gov.au/roads/safety/national_road_safety_ strategy/files/NRSS_2011_2020.pdf Journal of the Australasian College of Road Safety – Volume 26 No.2, 2015 2. Youth and Road Safety Report, World Health Organisation, 2007. 4. Pedestrian Safety: a road safety manual for decision-makers and practitioners, 2013. 3. National Road Safety Strategy (pg 7) 5. Pedestrian Safety (pg 64) http://www.grsproadsafety.org/ sites/grsp.drupalgardens.com/files/201304/PedestrianSafety_ eng.pdf Enhanced road safety data in NSW – serious injuries experience By Hassan Raisianzadeh1 Centre for Road Safety, Transport for NSW, [email protected] 1 Access to relevant, timely and reliable data on road traffic crashes is essential for road safety improvement and effectively reducing road trauma on roads. The quality and completeness of the data and information available to decision makers is critical for success in achieving road safety outcomes. While, in most jurisdictions, the primary source of road crash information is police reports, often they don’t have the required dimensions and depth to cover all aspects of road safety management. Research into best practice in road safety data management systems suggests that additional data is required to provide context for crashes [1] [2]. A data management manual for road safety data managers recommends the following attributes for a good road safety data system: • It must capture all crashes that result in death and a significant proportion of those that result in serious injuries; • Must provide adequate detail on the vehicle, the road user (and vehicle controllers) and the road/ environment to assist with identification of causes, and selection of countermeasures; • Accurate crash location information is essential; • A responsive Business Intelligence (BI) system that provides information and reports in a timely manner to facilitate evidence-based decisions [1]. In NSW, a robust system is in place through Centre for Road Safety (CRS) at Transport for NSW to extract road safety data and information from police reports. For many years this process has provided a reliable and solid foundation for identifying road safety risk factors and developing strategies and policies to address them. Like any other data system, an effective road safety data structure should follow and support the road safety business model. Road safety practice in NSW is structured on the Safe Systems approach, so the information landscape to support this must have adequate coverage of the main aspects of the system (with data sources providing specific data on roads, vehicles and road users). Recognising the need to invest effort and time into improvement and enhancement of existing data systems, CRS developed an information capability road map in 2013 to enhance and better integrate road safety data in line with Safe System components and requirements. A series of relevant data sources were identified to provide context, complement and enhance NSW crash data, among which hospital records were targeted as a priority. The information capability road map implementation, so far, has resulted in a transformed road safety data system as depicted in figure 1. This figure represents the data sources currently being linked with crash data to complement and enhance road safety data structures in NSW. Each one of those data sources either addresses a gap in crash data or supplements and verifies existing crash information from police reports. There are still a few data sources which will be investigated for data linkage in the future. Among those are Ambulance Service of NSW (to address the gap in data in terms of postcrash response), WorkCover NSW (to cover employment related road trauma), and Health data from Queensland, Victoria and South Australia (for crashes occurring in NSW where casualties are treated in interstate hospitals). Identifying serious injuries in NSW Serious injuries are a key focus in the NSW Road Safety Strategy 2012-21. A main goal of the strategy is 30% reduction in the number of serious injuries resulting from road crashes by 2021. Until very recently NSW was not collecting serious injury data as part of the road safety data collection. In late 2011, Transport and Road Safety (TARS) Research at UNSW 59 Journal of the Australasian College of Road Safety – Volume 26 No.2, 2015 Figure 1. NSW road safety information landscape, current state MAA - Motor Accidents Authority of NSW LTCSA – Lifetime Care and Support Authority FASS - NSW Forensic & Analytical Science Service RMS – Roads and Maritime Services was commissioned by CRS to investigate methodologies to define, identify and analyse serious injuries through linking road crash casualty data with the hospital admissions dataset from NSW Health. From this exercise, a methodology and definition of serious injuries were adopted by CRS to use as a starting point in establishing ongoing data linkage with hospital records in support of serious injury prevention strategies and countermeasures. Serious injuries were defined as a person who was hospitalised as a result of a crash (on the same day or next), and did not die as a result of those injuries within 30 days of the crash. Based on emergency department admission data, a second degree of injury severity (moderate injuries) was defined as those people who are admitted into a hospital emergency department as a result of a road crash and not admitted to the hospital as a patient. Based on the above, a research framework was developed for ongoing monitoring, analysis and research into serious and moderate injuries at CRS. Under the provisions of the Health Records and Information Privacy Act, to access health related records several approvals had to be obtained before the project could commence. To do so, in mid- 60 2013, a formal application was made to NSW and ACT Health Data Custodians and relevant ethics committees (NSW Population and Health Services Research Ethics Committee, Aboriginal Health and Medical Research Council Ethics Committee, ACT Health – Human Research Ethics Committee) to request approval for ongoing quarterly data linkage of crash data with the following datasets: • NSW Admitted Patient Data Collection (APDC) • NSW Emergency Department Data Collection (EDDC) • Mortality data – • NSW Registry of Births, Deaths and Marriages Death registrations (RBDM) • Australian Bureau of Statistics – NSW Deaths (ABS) • ACT Admitted Patient Care (ACT APC) data • ACT Emergency Department Information System (ACT ED) Journal of the Australasian College of Road Safety – Volume 26 No.2, 2015 The application approval process was completed in early 2014 and included historic data linkage from 2005 to 2014 and then a regular quarterly data linkage process. The initial data linkage was conducted by the Centre for Health Record Linkage (CHeReL) and then the deidentified (all identifying fields removed), matched and unmatched records were released to the Centre for Road Safety for conducting the research. The process of data preparation, finding and addressing data quality issues and data derivations took a year to complete. During this time the methodology had to be refined and modified a few times and because of this the entire data linkage process had to be repeated. One of the key changes which resulted in an improved match rate between crash records and hospital admissions was the inclusion of traffic unit controllers who were not identified as “injured” in the NSW Police reports but were matched to an APDC or EDDC record through the linkage process. In addition to identifying a few hundred more serious injuries every year, this change resulted in a few thousand more injuries being identified each year which either were not reported to police or CRS did not receive them through weekly data loads from NSW Police. Researchers consider this to be a value-add from data linkage process through making the gaps in the collection of road crash data more evident [3]. Another important outcome of data linkage with hospital records was quantifying the proportion of road crash injuries that are not reported to NSW Police or reported with incorrect or inadequate level of details. Like in most other jurisdictions, the CRS study found that each year there are around 4000 cases of hospitalisations resulting from road transport crashes (based hospital admission classification) which are not included in crash data from Police. A separate study into the reasons for this commenced later in 2014 which found a range of possible scenarios to explain why they could not be linked to police reported crashes. An in-depth research framework has been developed for implementation in 2015 to examine this further and be able to quantify the proportion of real unlinked hospital records which are missing from the NSW serious injury dataset. This should provide more clarity around circumstances under which a linkage can or cannot be expected and a more accurate picture of serious injuries in NSW. It is also anticipated that the data linkage with Motor Accidents Authority of NSW and Lifetime Care and Support Authority will help identify more linked serious injuries as well as moderate and minor injuries especially for passengers in a crash. The centre also aims (as part of their information capability road map) to obtain data from hospitals on borders with Victoria, Queensland and South Australia to uncover the serious injuries resulting from crashes in NSW in which the injured people are transported to hospitals outside NSW. This should also help to further narrow the gap between linked and unlinked serious injuries. In the meantime, there is a wealth of data on confirmed cases of serious injuries from the data linkage process. This will be used by the Centre for Road Safety, road safety stakeholders and business partners in NSW to guide strategies and programs aiming to reduce serious injuries by 30% by 2021. References 1. Department of Violence and Injury Prevention and Disability. Data systems: a road safety manual for decisionmakers and practitioners. France: World Health Organisation, 2010. 2. D’Elia A, Newstead S. An Enhanced Road Safety Information System for Western Australia. Bentley (AU): Curtin University, Curtin-Monash Accident Research Centre (C-MARC); 2011. 75 p. Report No: D10#158249 3. Watson A. Piecing the puzzle together: enhancing the quality of road trauma surveillance through linkage of police and health data. PhD Thesis. Brisbane, Australia: Queensland University of Technology, 2014. Time for a new public debate about the state of road safety by Professor Ian Johnston AM Principal Ian Johnston Transport Safety Pty Ltd – [email protected] Every time a politician cuts a ribbon at a road upgrade or opens a road safety conference we are told of our wonderful progress in reducing deaths from road crashes. But let’s not blame the politicians - we write the speeches for them! And the claims are, in a narrow sense, accurate, albeit misleading. In Australia, in 1970, almost 50 persons were killed in road crashes for every billion kilometres driven. Forty years later the rate was below six; an almost 90% 61 Journal of the Australasian College of Road Safety – Volume 26 No.2, 2015 reduction. Moreover, despite the enormous growth in road use the absolute number of deaths had fallen from close to 3,800 in 1970 to under 1,200 in 2013. The latest official federal government statistical summary states: “Over the last decade (to 2013), national annual fatalities decreased by 25 per cent, fatalities per population decreased by 35 per cent, and annual fatal crashes decreased by 23 per cent [1]. In short, we tell the public of our continuous incremental gains and they are real. What is misleading is the implication being that the problem is under control and that there is no cause for public concern. Would the public remain complacent if they saw things from the perspective of the level of trauma they are being asked to accept? The current national road safety strategy has a target of reducing serious injuries and deaths by 30% by 2020 (over its 10 year life). Since the total annual number of serious injuries and deaths in the baseline period was over 30,000 the target implies that we plan to accept that some 20,000 persons will be seriously injured or killed in 2020. Further, suppose the 30% reduction was achieved in year one of the strategy (which it wasn’t) and then maintained for the decade (which it can’t be) the minimum total of serious injuries and deaths that we are planning to accept over the decade is over 200,000. No other daily activity demands such a level of trauma. If we stop and reflect on the timing of the introduction of our most effective (traditional) countermeasure packages we notice that each followed a publicly perceived road trauma crisis. The following figure illustrates this for 62 Victoria. Deaths climbed steadily from the post-war motorisation boom through to the early 1970’s when the 1000 deaths barrier was breached. There was a huge public outcry which culminated in the introduction of legislation to make the wearing of seat belts compulsory. There was an immediate reduction, sustained for a few years. When an aberrantly low number in the mid-70’s was followed by a return to the prevailing trend a second crisis was perceived, largely because the media and public commentators focus on the year to year “scoreboard”. Random Breath Testing (RBT) dramatically impacted alcohol-related crashes and a new “normal” was established until another apparent crisis occurred. The next “normal” in Victoria was around 400 deaths a year until yet another spike led to the speed enforcement packages of the 2000’s. I grant my interpretation is speculative, but I am in no doubt that governments respond to public concern and that that concern is driven by media coverage. Unfortunately, media coverage is (largely) confined to fatal crashes, especially those involving blameworthy behaviour. There is solid scientific evidence that only around half of fatal crashes and only around ten per cent of non-fatal casualty crashes involve the kinds of behaviour most associate with crash causation – drugs, alcohol, illegal speeding, and so on. Of course, human behaviour is implicated in all crashes but the vast majority of behavioural issues are mistakes made by imperfect humans. This realisation spawned the Safe System approach in which road, traffic and vehicle engineers are encouraged to change designs to be errortolerant for road users behaving legally. But it also explains Journal of the Australasian College of Road Safety – Volume 26 No.2, 2015 why most of the packages were built around behavioural control. Legislation and its enforcement and public education can be implanted quickly and bring more or less immediate results. Changes to road, traffic and vehicle engineering have long lead times. As Fred Wegman commented after his time as a Thinker in Residence in Adelaide: While the Safe System concept has been present in Australia for many years, its implementation still proves a challenge to everyone involved in road safety” [2, pg. 65]. Why is this the case, despite encouraging signs in several road and traffic agencies? In my view the two key reasons are cost and potential liability. Our road transport system evolved at breakneck speed during rapid motorisation. The imperative was to provide capacity. Crashes were seen as an unfortunate by-product of a system whose primary objective was to stimulate economic growth through effective mobility for goods and people. We did not - or even understand that we had to - design an error-tolerant system at the outset, and to retrofit what we have now seems prohibitively expensive. In addition, if governments accept greater responsibility for errortolerance (as factory managers must) there is a risk of liability in the event of poor design. Compounding these barriers is the ignorance of the public concerning Safe System principles and practice. The widespread community view is that crashes result primarily from bad behaviour; a view reinforced by daily media coverage of crashes. The public debates are, for example, about the “unfairness” of low-level speed enforcement, the case against lowering the blood alcohol level and the constraints on employment of youth if novice drivers cannot carry passengers or drive late at night in their first few months. Invariably, when politicians are proudly pointing to the reductions in road crash deaths over the decades they cite all the behavioural control measures (RBT, seat belt and helmet use laws, speed enforcement, etc.) as the keys to success, thereby reinforcing the public view that safety is all about controlling the behaviour of the other road users. I would argue that the potential for major new behavioural measures is limited. The public debate is at an impasse. Governments assure the public that we are winning and that there is no cause for concern. Because there seems no cause for concern the debate cannot go to a new level. Governments understand the costs of a fundamental shift to a Safe System and therefore limit themselves to incremental advances as they can be afforded. Expenditure priorities, however, are exactly that – prioritising where to spend scarce resources. The public demands nothing since they do not know that road use is among the major public health problems we face. While casualties per unit road use are low, the sheer volume of what is an essential daily activity for all citizens means that the absolute numbers are very large. We need a new kind of public debate. The public needs to understand the level of trauma its governments accept on its behalf and decide whether implementing the Safe System needs a leg up the priority ladder. References 1. Department of Infrastructure and Regional Development. Road deaths Australia 2013 – statistical summary. Canberra, 2014. 2. Taken from Johnston, I. R., Muir, C. and Howard, E. W. Eliminating Serious Injury and Death from Road Transport: A Crisis of Complacency. CRC Press, Florida, 2014. The ACRS Journal needs you! Have you thought about contributing to the journal? All readers are encouraged to help make the journal more valuable to our members and to the road safety community. By writing for the journal, you have the opportunity to contribute to the important exchange of views and information on road safety. Articles on any aspect of road safety are welcome and may be submitted as papers for the peer-reviewed section of the journal or as contributed articles. Articles are now invited for issues in 2015. When preparing articles for submission, authors are asked to download and follow the ACRS Instructions for authors, available at http://acrs.org.au/publications/ journals/author-guidelines. Please contact the Managing Editor for further information, and for publication dates and deadlines. Letters to the Editor and items for the News section will also be considered for publication; feedback or suggestions about journal content are also welcome. Please submit all articles/contributions to the Managing Editor at [email protected]. The next issue of the Journal will be a feature on safe roads and infrastructure. Articles are invited on this theme or other road safety topics to be published in 2015. 63 Conference Gala Dinner & Award Ceremony Thursday 15 October 2015 Gold Coast – Australia A Celebration of Excellence in Road Safety! ARSC2015 will include the Australasian College of Road Safety Awards, recognising and celebrating exemplary projects and people working so hard across our region to save lives and reduce injuries on our roads. This prestigious award ceremony will take place at the inaugural 2015 Australasian Road Safety Conference, which is the result of a successful merger of Australasia’s two premier road safety conferences: the Australasian College of Road Safety Conference, and the Australasian Road Safety Research, Policing and Education Conference. The 2015 Australasian College of Road Safety Awards will continue the tradition of the original Australasian road safety awards and conferences by recognising and celebrating exemplary projects and people working hard across our region to save lives and reduce injuries on our roads. These awards will include the following presentations: • • The prestigious Australasian College of Road Safety Fellowship Award in recognition of exemplary contribution being made by an individual to road safety in Australasia. This award has been recognising outstanding individuals since its inception in 1991. In 2014 the ACRS Patron, the Governor-General of Australia Sir Peter Cosgrove presented this award. Australasia’s premier road safety award recognising projects that exhibit exemplary innovation and effectiveness to save lives and injuries on roads – the 3M-ACRS Diamond Road Safety Awards. This award is entering its 5th year and is recognised as Australasia’s premier road safety award recognising an outstanding road trauma reduction project. In 2014 the ACRS Patron, the Governor-General of Australia Sir Peter Cosgrove presented this award. • ARSC2015 Conference Awards (presented in the closing session of the conference). • Other awards as deemed appropriate by the joint hosts for 2015: ACRS, Austroads and CARRS-Q. We look forward to bringing you more information about the awards shortly. Most importantly we encourage your participation at this important event, which recognises our outstanding individuals, organisations and projects as we all strive to reduce road trauma. Austroads, CARRS-Q and the ACRS look forward to your participation in this important event which aligns with international, Australasian and national road safety efforts, and is a significant step forward in Australasia’s road safety strategy. More information is available at: http://theaustralasianroadsafetyconference.com.au To join the mailing list contact: [email protected] Award Entries Open 1 May 2015 and close 5pm EST 1 August 2015 65 Journal of the Australasian College of Road Safety – Volume 26 No.2, 2015 67 Australasian College of Road Safety Inc. ACRS, PO Box 198, Mawson ACT 2607 Australia Tel 02 6290 2509 Fax 02 6290 0914 Email [email protected] Head Office Pearce Centre, Collett Place, Pearce ACT Australia Visit the College website at www.acrs.org.au Proudly sponsored by LB Australia New South Wales Government and ANCAP

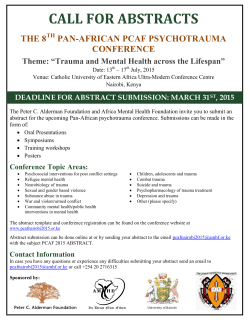


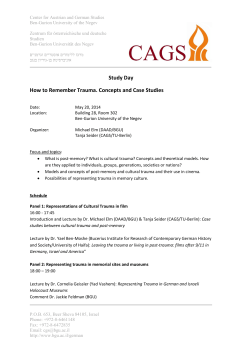


© Copyright 2026