
Building a Leading Presence in Global Markets Annual Report 2006
Annual Report 2006
For the year ended March 31, 2006
TERUMO CORPORATION ANNUAL REPORT 2006
Building a Leading Presence
in Global Markets
Profile
Kinder, Gentler Medicine with Terumo Technology
T
erumo contributes to society by providing unique, innovative medical
products that makes medicine kinder and gentler by lessening the pain of
patients. Contributing to society through health care—this is the vision Terumo
has held since its establishment in 1921.
To realize this vision, Terumo operates under the principles of providing
lifestyle medicine, nurturing global technology, and developing people-friendly
products. We continue to create new corporate value by inventing lifestyle
medical products that aim to improve quality of life, by engaging in R&D on
the cutting edge of medicine, and by delivering products and information that
make treatment safer and more secure.
Contents
1
2
4
6
11
12
14
18
20
22
30
Financial Highlights
Terumo at a Glance
Message from the Chairman
Message from the President
Board of Directors and Auditors
Corporate Governance
The History of Terumo’s Intellectual Asset
Research and Development
Close-Up
Review of Operations
Environmental Initiatives and Social Contributions
32
34
39
40
42
43
44
45
56
57
58
60
61
64
Consolidated Eight-year Summary
Management’s Discussion and Analysis of Operating Results and Financial Condition
Risk Factors
Consolidated Balance Sheets
Consolidated Statements of Income
Consolidated Statements of Stockholders’ Equity
Consolidated Statements of Cash Flows
Notes to Consolidated Financial Statements
Independent Auditors’ Report
Subsidiaries and Affiliates
Corporate Data
Investor Information
Topics
Financial Highlights of the Fiscal Year Ended March 31, 2006
Terumo Corporation and subsidiaries
Net sales, operating income, and net income reset record highs
Net Sales
247
Billion ¥
230
● Net sales grow 7.4%, to ¥247.0 billion, for 12th straight year of increase
215
187
201
● Gross profit margin improves 1.1 percentage points, to 54.9%
● Operating income grows 2.4%, to ¥48.3 billion
● Net income jumps 19.6%, to ¥32.5 billion
● Annual dividend boosted ¥4, to ¥24 per share
02
03
04
05
Thousands of
U.S. dollars
(Note 1)
06
Millions of yen
2006
Years ended March 31
2005
2004
2006
For the period:
Operating Income
Billion ¥
47.1
48.3
Total assets . . . . . . . . . . . . . . . . . . . . . . . .
Total stockholders’ equity. . . . . . . . . . . . . .
28.0
20.5
15.6
¥ 247,049
48,252
32,457
18,025
14,248
15,181
¥ 230,003
47,108
27,135
13,739
10,998
15,581
¥ 215,196
36,653
19,792
14,700
11,456
14,881
$ 2,111,530
412,410
277,410
154,060
121,778
129,752
¥ 354,648
273,309
¥ 312,456
219,873
¥ 293,866
195,075
$ 3,031,179
2,335,974
At year-end:
36.7
31.3
15.0
Net sales . . . . . . . . . . . . . . . . . . . . . . . . . .
Operating income. . . . . . . . . . . . . . . . . . . .
Net income . . . . . . . . . . . . . . . . . . . . . . . .
R&D expenditure . . . . . . . . . . . . . . . . . . . .
Capital expenditure . . . . . . . . . . . . . . . . . .
Depreciation and amortization (Note 2). . . .
19.5
17.0
Per share of common stock:
02
03
04
05
06
Operating Margin Ratio (%)
Net income–basic . . . . . . . . . . . . . . . . . . .
Cash dividends . . . . . . . . . . . . . . . . . . . . .
Stockholders’ equity . . . . . . . . . . . . . . . . .
¥ 160.45
24.00
1,345.52
¥ 136.03
20.00
1,107.88
19.5%
13.2%
9.7%
20.5%
13.1%
9.0%
¥
98.45
16.00
982.62
$
1.37
0.21
11.50
Other statistics:
Operating margin ratio . . . . . . . . . . . . . . . .
ROE . . . . . . . . . . . . . . . . . . . . . . . . . . . . . .
ROA. . . . . . . . . . . . . . . . . . . . . . . . . . . . . .
17.0%
10.4%
6.8%
Notes: 1. All dollar figures herein refer to U.S. currency. Yen amounts have been translated, for convenience only,
at ¥117=$1, the approximate exchange rate at March 31, 2006.
2. Write-down of goodwill excluded from depreciation and amortization was ¥2,180 million in the year ended March 31,
2005.
ROE and ROA
%
13.1
10.0
U.S. dollars
(Note 1)
Yen
10.4
13.2
9.7
9.0
8.2
6.3
6.8
5.1
NOTICE REGARDING FORWARD-LOOKING STATEMENTS
02
ROE
ROA
03
04
05
06
The statements made in this Annual Report are based on the Company’s current plans, outlooks, strategies and convictions. All figures and statements besides historical facts and figures are merely forward-looking statements based on the
information available at the time of the printing of this report and the judgment of the management group. The Company,
therefore, cannot guarantee any of the financial or nonfinancial targets stated in this Annual Report.
1
Terumo at a Glance
Products
General hospital products
• Disposable medical equipment and medical electronic products
• Pharmaceuticals
• Blood transfusion systems
Cardiac and vascular products
• Catheter systems
• Cardiovascular systems
• Vascular grafts
Home health care products
• Continuous ambulatory peritoneal dialysis (CAPD) systems
• Diabetes care products
• Other products
2
Revenues/
Sales Breakdown by Segments
Business Description
T
erumo manufactures medical equipment for hospitals, pharmaceuticals
and blood transfusion systems, and sells its products to hospitals, clinics,
doctors’ offices and other establishments mainly through medical industry
Sales and Operating Income from
General Hospital Products
Billion ¥
110.4 112.6
129.9
119.9 124.1
distributors.
The main general hospital products are syringes,
needles, infusion sets, winged catheters, intravenous
16.3
15.2
18.9
21.2
25.4
02
03
04
05
06
Sales
(IV) catheters, blood collection tubes, infusion pumps,
Operating Income
Ratio of General Hospital
Product Sales to Net Sales
syringe pumps, IV solutions, total parenteral nutrition,
prefilled syringes, nutritional foods, blood bags,
52.6%
apheresis systems and sterile tubing welders.
FULCALIQ, total parenteral nutrition
T
erumo manufactures catheter systems, cardiovascular
systems and vascular grafts, and sells its products to
Sales and Operating Income from
Cardiac and Vascular Products
Billion ¥
hospitals, clinics, doctors’ offices and other establishments
53.1
through medical industry distributors.
The main cardiac and vascular products include
percutaneous transluminal coronary angioplasty (PTCA)
catheters, coronary stents, guide wires, angiographic catheters,
oxygenators, external circulation systems and vascular grafts.
61.8
71.0
18.0
21.1
22.8
02
03
04
Sales
80.9
88.9
29.6
25.9
05
06
Operating Income
Ratio of Cardiac and Vascular
Product Sales to Net Sales
36.0%
CAPIOX RX25, oxygenator
T
erumo manufactures peritoneal dialysis systems, diabetes care systems
and other types of products for sale to hospitals, clinics, doctors’ offices,
Sales and Operating Income from
Home Health Care Products
Billion ¥
23.6
pharmacies and other outlets through medical industry
26.3
24.3
25.0
28.2
and general consumer product distributors.
The core products in this division are peritoneal
3.1
dialysis systems, diabetes monitoring equipment,
02
Sales
home infusion systems, home oxygen therapy
systems, digital thermometers and electronic blood
4.8
5.0
03
04
6.6
7.6
05
06
Operating Income
Ratio of Home Health Care
Product Sales to Net Sales
pressure monitors.
11.4%
ARM IN MEMO, blood pressure monitor
From 2004, we changed the categorization of nutritional foods from Home
health care products to General hospital products.
3
Message from the Chairman
Promotion of Growth and Global Strategies
medical technologies which reduce the burden of medicine
on a patient’s body. Terumo’s new therapeutic devices are
The March 2006 term marked the 12th straight year of higher
making medicine less painful, reducing the size of surgical
net sales for the Terumo Group, as well as record operating
cuts and ensuring faster recovery, through the use of new
and net income. The results leave no doubt about the
technologies. The “Systemization and Service Enhancement”
effectiveness of the global growth strategy being undertaken
strategy provides a system that improves efficiency and
by the Group. We continue to forge ahead with the medium-
safety in medial institutions and training medical staff in
term management plan, STeP UP 2007, which will end with
the use of the technology. The strategy “Fusion between
the March 2008 term.
Drugs and Devices” seeks to promote the development of
The Terumo Group is pursuing four major growth
innovative combinations of pharmaceuticals and medical
strategies. The first, “Development of New Therapeutic
technologies in this burgeoning new market of combined
Devices,” aims to provide patients with minimally invasive
products. Finally, “Preventive Medicine” recognizes and
addresses the modern problem of higher medical costs and
the particular burden on senior citizens.
It’s impossible to overstate the importance of the shift in
medicine from pharmaceuticals to medical devices and how
this shift is changing the medical industry. Our confidence
in our growth strategies reflects our belief that progress in
medical equipment technology will contribute to society
from both medical economies and patient’s quality of life
perspectives.
The global strategy of enlarging our presence in markets
worldwide necessarily means developing business in the
United States, the world’s largest medical market and source
of information on industry advancements. To this end, we
have begun direct sales of interventinal systems in the U.S.
Takashi Wachi
Representative Director & Chairman
4
market, and we have acquired the U.S. firm MicroVention,
Increasing Investment Value: Annual Dividends Raised
Inc. in order to enter the neurovascular treatment market
to ¥24.00 per Share
using this company’s innovative technology. These measures
will also boost our business and presence in Europe. In Asia,
The Terumo Group aims to maintain both high profitability
we expect tremendous growth in the coming years and our
and strong growth into the future. To this end, the Company
goal is to grow at a even faster pace than the market to
actively spends capital expenditures while striving to boost
expand market share.
corporate value. It is a basic policy of the Company to
provide a stable dividend to investors. For the year under
People-centered Management and Development of
review, the Company increased the annual dividend to
No. 1 Global Products
¥24.00 per common share, which includes a ¥2.00 increase
in regular dividends and a special payment of ¥2.00 a share
The Terumo Group promotes a philosophy of “people-
in commemoration of the 85th anniversary of the Company’s
centered management.” To develop cutting-edge products,
establishment.
we focus on nurturing a workforce with leading technical
The sound execution of management strategy is earning
skills and expertise. This philosophy has engendered a
the Company high marks from the capital markets, leading
profound level of implicit knowledge within the Company
to maximization of stockholder value.
and become a source of our high quality. At the same time,
Terumo’s close connection to the medical institutions has
July 2006
enabled us to create a product development system that
starts with the needs of the market.
These two advantages—people-centered management
and market-based product development—are helping us to
deliver products of unsurpassed quality on a global scale.
Product quality will be a key lever as we continue to expand
the Terumo brand with leading global products and build a
market-leading presence.
Takashi Wachi
Representative Director & Chairman
5
Message from the President
Goals of STeP UP 2007
Asia presents great opportunities for growth—-not just
in terms of product sales but also in terms of low-cost
The Terumo Group remains a leader in Japan’s medical
production. We intend to analyze the opportunities in each
equipment industry. The three-year STeP UP 2007 medium-
country carefully to realize the strong growth potential.
term management plan, implemented from April 2005, aims
to secure a strong position for the Group in the worldwide
Strategies for Each Business Area
market through robust sales growth and profitability.
The three pillars of the plan are “Solution,” referring to
In the general hospital product business, we are
systemization and service enhancement; “Technology,”
concentrating on products that contribute to the safety and
standing for the development of new therapeutic devices;
efficiency of medical institutions, including prefilled syringes
and “Professional,” representing the concept of the
and infusion equipment with infection-prevention features.
development of an in-house company system. The plan will
Sales will also be driven by new products such as total
come to full fruition in the year ending March 2008, when
parenteral nutrition products, along with blood- bag systems
the Company targets net sales of ¥300 billion, and operating
that remove white blood cells and others.
income of ¥63 billion.
In our cardiac and vascular product business, in April
2006 we began direct sales of our interventional products
Global Strategy
in the United States, ending a sales agreement with Boston
Scientific Corp. Our presence in the U.S. market will grow
Developing a global strategy that leverages the unique
even further with the sales of coils to treat carebral aneurysms,
characteristics of each region will be critical in developing
produced by the U.S. firm MicroVention, Inc. In Europe, sales
Terumo into a more global company.
of interventional systems and stent grafts for aortic treatment
In Japan, the Company holds a strong share in its key
markets and aims for continued stable growth. One of the
devices will be the main engines of growth.
In our home health care product business, we look
core functions of the Japanese operations is also to utilize its
forward to robust sales of blood glucose monitors for
production and quality management technologies to provide
diabetes patients, highly functional body meters for women,
the global markets with products of the highest quality.
and home-use digital blood pressure monitors.
The United States represents the largest medical
equipment market in the world and the market in which we
aim to boost our competitiveness. The Company has been
aggressive in realizing growth by acquiring new technologies
STeP UP 2007 Quantitative Targets
Billion ¥
300.0
through M&A and other means. We will continue to explore
growth opportunities in the U.S. market while also carrying
out business expansion in South America.
267.0
247.0
230.0
More than any other region, Europe offers the possibility
for rapid introduction of new technologies. We are active in
conducting clinical trials in Europe, along with marketing of
new products.
2005/3
Net sales
6
48.3
47.1
2006/3
Operating Income
54.7
2007/3
63.0
2008/3
Raising Corporate Value through Continual Profit
on pharmaceuticals. In addition, the Japanese industry has
Growth
been beset by efforts to control medical spending amid the
graying of Japanese society.
Our primary strategies for improving profitability are to
In this environment, the Terumo Group increased net sales
focus more intensively on sales of high-value-added
by 7.4%, to ¥247.0 billion, operating income rose 2.4%, and
products, strengthen overseas business, and reduce costs
net income rose by 19.6%, to ¥32.5 billion. Both net sales
while thoroughly managing quality, which we are doing
and net income reached record levels.
by leveraging Terumo’s world-class technology. These will
remain our key strategies going forward.
In this environment, in the second year of the STeP UP
2007 plan, Terumo targets net sales of ¥267.0 billion, with
The Terumo Group is expanding its manufacturing sites
operating income of ¥54.7 billion and net income of ¥33.7
to key areas of the globe to realize lower-cost production. A
billion, all of which would represent record results for the
new plant in Vietnam is scheduled to begin operations in the
Company.
year ending March 2008. Southeast Asia presents numerous
advantages, including the ability to procure high-quality
parts and materials at a low cost. The combination of low
labor and materials costs at our Asian sites outside Japan is
helping to improve profitability.
In addition, we are undertaking business reforms in the
pursuit of continual profitability improvement and higher
corporate value.
Progress in Achieving Goals of STeP UP 2007
Aiming for Record Net Sales and Operating Income in
the Year Ending March 2007
The medical equipment industry continued to witness major
change during the year ended March 2006, both in and
outside Japan. Around the world, competition intensified
on both the research and development and marketing
fronts, with major mergers among equipment makers. In
Japan, which represents about 60% of the Group’s sales,
a revision to the Pharmaceutical Affairs Law imposed the
same level of safety measures on medical equipment as
Akira Takahashi
Representative Director & President
7
General Hospital Product Business
(2) Nurturing growth of promising nutrition and
infusion markets
• Performance in the Year Ended March 2006
We aim to grow the market for nutritional foods. The
Company offers one-pack complete nutrition products, and
In Asia, health standards are rising every year, creating
will add to the lineup in summer 2006 with the launch of
vigorous demand for medical equipment. General hospital
AMIGRAND, a peripheral parenteral nutrition solution offering
product sales were strong in Asia, which includes Oceania.
greater safety.
Sales in the United States were also higher. Altogether,
(3) Expanding sales of filter-equipped blood bags
syringes, intravenous needles and other blood transfusion
From December 2006, the Japan Red Cross plans to have
equipment sold briskly overseas during the year.
its blood banks switch over to new blood bags featuring
In Japan, sales of medical equipment that improves
filters that eliminate white blood cells, thereby providing safer
hospital safety and efficiency are increasing. Terumo has
transfusions. Terumo is aiming to meet the need with higher
responded to this need with such products as prefilled
sales and a strong share of the market for filter-equipped
syringes and infusion pumps and other infusion equipment
blood bags.
with safety features. Acquisition of sales rights to nutritional
(4) Raising sales and production in Asia
foods from Hisamitsu Pharmaceutical Co., Inc. and the
In the Asian region excluding Japan, the market for hospital
domestic sales rights to contrast agents from Guerbet SA of
goods is climbing quickly. Sales rose in China, Southeast
France also aided sales.
Asia, and the Middle East in the previous year, and we
As a result, overall net sales in the divisionthis business
expect similar performance in the current year ending
jumped 4.7%, to ¥129.9 billion, while operating income
March 2007. We will increase production at our China and
jumped 19.5%, to ¥25.4 billion.
Philippine plants and construct a new plant in Vietnam.
• Strategy for Year Ending March 2007:
Supply the Market Even Safer Products
Net sales target: ¥136.5 billion, up 5.1%.
Strategy for General Hospital Products and
Net Sales Target for the Year Ending March 2007
Billion ¥
Annual sales
increase: 4.7%
(1) Offering products to make medicine safer
124.1
In markets around the world, we are selling a wide range
Annual sales
increase: 5.1%
129.9
136.5
of medical equipment that raises the bar for safe medical
treatment. In Japan, we are widening the sales of leases
for pumps with accident-prevention features. In addition,
demand is growing for prefilled syringes, which reduce
the chance of infection and mistaken administration. The
Company helps with risk mitigation by offering training for
2005/3
nurses in the area of IV needles and transfusions.
Solution
• Expand sales of HEPAFLUSH
• Maintenance leases and training services
Technology
• Expand sales of total parenteral solutions
• Begin sales of contrast agents
8
2006/3
2007/3
Cardiac and Vascular Product divisionBusiness
(3) Expansion in cardiopulmonary and graft markets
The Company will promote sales of cardiopulmonary
• Performance in the Year Ended March 2006
systems for extracorporeal circulation, endoscopic vein
harvesting (EVH) systems for cardiovascular surgeries (heart
Sales of catheters and grafts were brisk in Asia and Europe.
bypass), and products such as stent graft ANACONDA.
In Japan, catheter systems and related equipment used to
(4) Expansion of arm-entry cardiac catheter Trans-Radial
treat cardiac infarction and other ailments are selling well.
Coronary Intervention (TRI) to global markets
In January 2005, we acquired the Japan sales rights to the
The TRI treatment method reduces patients’ pain and even
cardiopulmonary products of Edwards Lifesciences Corp.
allows them to walk back to their hospital room after surgery.
of the United States, and this had a substantial effect on the
The method also shortens hospital stays for patients and
full-year results.
contributes to more efficient surgery. We have held seminars
As a result, overall sales in this business grew 9.9%, to
to promote the use of Terumo products for TRI treatment.
¥88.9 billion during the year. Operating income, however,
(5) Wider adoption of solution packs
dipped 12.5%, to ¥25.9 billion, mainly due to a one-time
We began full-scale sales of catheter kit solution packs in
expense for acquiring the U.S. firm MicroVention, Inc. and for
October 2005, and plan to drive sales higher in the year
implementing a structure for direct sales of catheter systems
ending March 2007.
in the United States.
• Strategy for the Year Ending March 2007:
Support Minimally Invasive Medicine
Net sales target: ¥99.3 billion, up 11.6%.
(1) Direct sales of catheters in United States
In the United States, we previously sold our catheter-related
products through the U.S. firm Boston Scientific Corp. From
April 2006, we implemented a direct sales organization to
Strategy for Cardiac and Vascular Products and
Net Sales Target for the Year Ending March 2007
Billion ¥
Annual sales
increase: 9.9%
expand our U.S. presence. This is expected to increase the
80.9
Terumo brand presence across the U.S. market.
Annual sales
increase: 11.6%
88.9
99.3
(2) Full-scale entry into neurovascular treatments
The acquisition of MicroVention provides us with innovative
technology and products such as expansive coated coils
for neurovascular treatment. Terumo will make a full-fledged
entry into the market for neurovascular coils, using the global
sales network of MicroVention. This will act as a new pillar of
2005/3
the business, with net sales forecast to be ¥5.0 billion in the
year ending March 2007.
2006/3
2007/3
Solution
• Solution packs
• Popularize TRI surgical method (entry through arm)
Technology
• Expand sales of PTCA related products
• Expand sales of surgical products (ANACONDA, EVH, etc.)
• Acquisition of MicroVention (neurology)
9
Home Health Care Product Business
MEDISAFE blood glucose monitor and the NANOPASS
insulin syringe. Sales of these products will also begin in
•Performance in the Year Ended March 2006
Europe and the United States.
(2) Expand home treatment
Diabetes treatment products such as blood glucose monitors
Home medical treatment is expected to expand due to
have shown explosive growth. We are also expanding sales
changes to the national health insurance system in Japan,
of such products as small home oxygen concentrators,
providing opportunities for growth in this area.
backlit digital thermometers, highly functional body meters
(3) Develop the women’s health management market
for women, and easy-to-use home blood pressure monitors
Promote the WOMAN°C brand for women’s health
by launching competitive products at the right time. Net sales
management products.
in the business rose 12.9% during the year under review,
to ¥28.2 billion, with operating income growing 15.5%,
July 2006
to ¥7.6 billion.
• Strategy for the Year Ending March 2007:
Akira Takahashi
Raising QOL
Representative Director & President
Net sales target: ¥31.2 billion, up 10.5%.
(1) Reinforce diabetes treatment products
We aim for a larger share of Japan’s diabetes treatment
market by capitalizing on the synergies between the
Strategy for Home Health Care Products and
Net Sales Target for the Year Ending March 2007
Billion ¥
Annual sales
increase: 12.9%
25.0
2005/3
Annual sales
increase: 10.5%
28.2
2006/3
Solution
• Strengthen sales structure for home medicine
• Understand importance of home blood pressure monitoring
Technology
• Less painful NANOPASS needle
• Commercialization of WOMAN°C by female research team
• ARM IN, Blood pressure monitors
10
31.2
2007/3
Board of Directors and Auditors
As of June 29, 2006
Directors
Corporate Auditors
Takashi Wachi
Shigeru Miura
Representative Director & Chairman
Standing Corporate Auditor
Akira Takahashi
Kenji Tada
Representative Director & President
Chief Member of Internal Control Committee
Director of R&D Center
Standing Corporate Auditor
Takahiro Kugo
Nobuyuki Takai
Director & Senior Managing Executive Officer
Chief member of Investment Committee
Domestic Sales Div., Asia & Middle East Business Div., Accounting & Finance
Dept., Business Service Center
Corporate Auditor
Fumio Sugizaki
Corporate Auditor
Executive Officers
Hachiro Hara
Kiyoshi Uesugi
Director & Senior Managing Executive Officer
Production Dept., China Business Div., General Affairs Dept., Logistic Dept.
Executive Officer
General Manager of Kansai Block, Branch Manager of Osaka Branch
Koji Nakao
Katsuhiko Miyaguchi
Director & Managing Executive Officer
Chairman & President & CEO, Terumo Medical Corporation
European and Americas Business Div.
Executive Officer
General Manager of Kofu Factory
Hiroshi Matsumura
Executive Officer
General Manager of Shutoken Block, Branch Manager of Tokyo Branch
Director & Managing Executive Officer
Chief member of Contract Committee, Chief member of Information
Disclosure Committee, General Manager of Strategy Planning Dept., Human
Resources Dept., Legal Dept., Marketing Dept., Regulatory Affairs Dept.,
Clinical Development Dept., Intellectual Property Dept.
Takayoshi Mimura
Director & Senior Executive Officer
President of General Hospital Products Group, OTC Business Div., Terumo
Call Center
Akira Oguma
Director & Senior Executive Officer
General Manager of Quality Assurance Dept., General Manager of
Environmental Management Dept., Academic Information Dept.
Shogo Ninomiya
Director & Executive Officer
General Manager of European & Americas Business Div.
Yutaro Shintaku
Director & Executive Officer
President of Cardiac & Vascular Products Group
Takeshi Isayama
Director
Vice Chairman, Nissan Motor Co., Ltd.
Tetsuo Seki
Director
Senior Corporate Auditor, Nippon Steel Corporation
Chikao Umezu
Kazuo Chiku
Executive Officer
Deputy Director of R&D Center
Tamotsu Takeuchi
Executive Officer
General Manager of Production Dept. (Global Equipment Engineering)
Chisato Nojiri
Executive Officer
President & CEO of Terumo Heart, Inc., Leader of L-VAS team, R&D Center
Yoshiaki Shiraishi
Executive Officer
General Manager of Human Resources Dept.
Kuniko Shoji
Executive Officer
General Manager of Regulatory Affairs Dept., General Manager of Clinical
Development Dept.
Norihito Tokonami
Executive Officer
President of Home Healthcare Products Group
Kazuho Oishi
Executive Officer
Managing Director of Terumo Medical Products (Hangzhou) Co., Ltd.
Managing Director of Changchun Terumo Medical Products Co., Ltd.
Managing Director of Terumo Medical (Shanghai) Co., Ltd., Managing Director
of Terumo China (Hong Kong) Ltd.
Kenji Sekine
Executive Officer
President of General Hospital Products Company
Kenichi Kida
Executive Officer
General Manager of OTC Business Div., General Manager of Marketing Dept
11
Corporate Governance
Basic Stance on Corporate Governance
receive support from the Auditors Office, which has a full-
Terumo has established a comprehensive corporate
time staff working independently of the directors.
governance structure to ensure that we maintain the trust
of society.
The Board of Corporate Auditors meets six times a
year with the independent auditor to exchange views and
Based on our corporate philosophy of contributing to
information. The board requests reports on the outside
society through health care, Terumo seeks to continually
auditing process as necessary, ensuring that there is a
raise corporate value by providing products and services
structure in place to carry out fair audits. In addition, the
with value to the medical world. At the same time, we have
Board of Corporate Auditors holds a monthly meeting
set in place a Terumo Code of Ethics that aims for open
with the Internal Audit Department, a five-member internal
management and good corporate citizenship and ensures
auditors body that maintains close relations with the board
that the Company operates in a sound and transparent
by submitting reports and providing other information.
manner.
4. Independent Auditor
Putting the Policies into Practice
Terumo abides by the auditing requirements set forth in
both the Corporation Law and the Securities and Exchange
1. Directors, Board of Directors, and Executive Officers
Law of Japan. The Company has appointed AZSA & Co.
As of July 2006, Terumo maintains a Board of Directors
as its independent auditor as part of a system to guarantee
consisting of 12 directors, including two independent
that independent audits are conducted appropriately and in
directors. The appointment of independent directors has
compliance with applicable laws. No business relationships
helped to ensure better management oversight. Although the
or conflicts of interest exist between AZSA & Co. and the
independent directors do not have their own staff, they are
auditors of AZSA & Co. engaged in the auditing of Terumo.
supported by the Secretary Office and the Strategy Planning
Department.
In 2002, we reclassified directorships into representative
5. Internal Control System
Terumo maintains a number of different internal bodies
directors and directors whose primary responsibility is to
that together create a strong internal control structure. An
determine management policies and provide oversight of the
Internal Control Committee works to strengthen ethics
entire Company. The executive officer system, meanwhile,
and compliance measures in the Company and reports its
was subsequently improved by making executive officers
findings directly to the Board of Directors. In addition, the
accountable for executing business operations under their
Investment Committee provides valuable advice and analysis
purview.
into the disposition of assets and evaluation of investments.
The Business Auditing Department has a wider purview,
2. Compensation and Nominating Committee
examining the appropriateness of daily business activities.
The Compensation and Nominating Committee was formed
Finally, the Information Disclosure Committee ensures that
with the purpose of raising the transparency of management.
information is disclosed to the public in a fair and timely
The committee, which is comprised of independent directors
manner. The committee comprises executives from various
and experts, is tasked with recommending candidates for
related departments, including the president as its chair.
directorships and evaluating director performance.
On May 18, 2006, the Company held a Board of Directors
meeting to discuss a basic policy on the establishment of
3. Board of Corporate Auditors
an internal control system. The board decided to maintain
The Board of Corporate Auditors comprises two internal
the Terumo Code of Ethics as the standard for employee
corporate auditors and two external corporate auditors.
conduct, while utilizing the Internal Control Committee
The primary responsibility of the auditors is to ensure the
and the Internal Control Department, which will act as the
appropriateness of management decisions, including the
administrative body for internal control activities, to undertake
management function of the Board of Directors. External
initiatives in the following areas:
corporate auditors do not have a full-time staff, but do
12
Corporate Governance Structure
Third-Party Oversight
General Meeting of Shareholders
Board of Corporate
Auditors
Board of Directors
Auditors Office
Advisory Board
• Independent auditor
• Outside attorney
Internal Control Committee
Internal Control Department
Compensation and
Nominating Committee
Executive Management
Meeting
Internal Audit Department
Investment Committee
(1) Compliance structure
Details of compensation to independent auditor:
Manage employees’ signing of the Terumo Code of Ethics
Compensation to independent auditor AZSA & Co.
Declaration; promote usage of the ethics hotline; and
Contractual payment for independent auditing
thoroughly reinforce compliance activities,
services ....................................¥32 million
including internal auditing conducted by Business
No compensation besides the above amount was
Auditing Department.
provided to the independent auditor.
(2) Risk management
Create an optimal risk management structure for the entire
Company to supplement the risk management activities
being conducted by individual departments.
(3) Information storage and management
Executive retirement benefits system were abolished, and
executive compensation system were reformed:
In June 2006, Terumo eliminated its retirement benefits
system for directors and corporate auditors. Upon retirement,
directors and corporate auditors will be paid a retirement
Manage the storage of documents and various other
benefits covering the period from when they assumed their
materials created by the executive officers, in accordance
executive position to the day the system was abolished.
with document management standards; and create a
In addition, from July 2006, a part of the monthly
structure to enable board members and auditors to view
compensation for directors except independeint directors will
these documents.
be made in Company stock, purchased through the executive
(4) Group internal control system
stockholding association. Directors must hold the stock until
Provide reports and instructions to Group companies
their retirement. The compensation plan is therefore linked to
inside and outside Japan on appropriate operations
the long-term performance (stock price) of the Company.
management.
(5) Effective structure for auditing
Support corporate auditing carried out by the Auditors
7. Relationship between Terumo and Independent
Directors and External Corporate Auditors
Office, overseen by an executive independent from the
No business relationships or other conflicts of interest exist
Board of Directors.
between Terumo and its independent directors and external
corporate auditors.
6. Compensation for Officers and Corporate Auditors
Details of compensation to officers in the year ended
8. Other Measures to Strengthen Corporate Governance
March 2006:
Every two months, the Advisory Board comprised of
Directors ..................... 14 .......¥277 million
outside experts holds a seminar to exchange opinions with
Corporate Auditors ....... 4 .........¥38 million
management on a specified topic. Terumo regularly receives
valuable, objective comments from the advisors.
13
Intellectual Asset
The History of Terumo’s Intellectual Asset
Since its establishment in 1921, Terumo has maintained its position as Japan’s leading supplier of medical
equipment for 85 years. Outside of Japan, the Company has developed a strong presence by delivering
top quality and unique “only one” products to customers around the world. What is the source of Terumo’s
growth? Nearly a century of innovative intellectual asset.
Terumo Medical Pranex,
an exhibition hall
14
IA History Starts with Glass Mercury Thermometer
the 1950s and started local production in the United States
Terumo was established in 1921 as a manufacturer of
glass mercury thermometers. The Company remained the
top domestic maker of mercury thermometers until 1984,
when production ceased and a full switchover was made to
digital thermometers, which had debuted the previous year.
in 1972. Overseas business grew steadily from there, and
now comprises about 40% of all net sales.
At the same stage in its history, Terumo debuted a
number of revolutionary medical products, including Japan’s
first disposable plastic syringe in 1963. The disposable
Although Terumo no longer relies on glass thermometer
production technology, we have accumulated a wealth of
technology related to body temperature measurement,
including equilibrium body temperature prediction
technology found in digital thermometers. This technology
syringe was a significant invention in the formation of our
intellectual asset portfolio in that it signified the potential of
disposable technology. Currently, nearly all of our products
are disposable.
The nurturing of Japan’s disposable product market
will serve as the basis of various new inventions to measure
the body’s vital signs, having already found its way into
such mainstay products as blood pressure and blood
glucose monitors.
helped the Company establish close business relationships
with almost all major medical institutions in Japan. These
close business relationships have formed the basis of the
Company’s consistently high market share and are a source
Terumo began exporting glass mercury thermometers in
of our competitiveness.
Technology Timelines for Terumo’s Main Business Areas
1921
Business Area
1965
1970
1975
1980
1985
1990
1995
2000
2005
2010
2015
Company establishment
Home health care products
Glass mercury thermometer launched
Digital thermometer launched
Terumo offers a range of thermometers, from mercury to digital
General hospital products
Disposable syringe launched
The disposable syringe: Single usage ensures safety
All-in-one high-calorie transfusion product launched
Innovative approach to transfusions: The all-in-one high-calorie transfusion is born
Transfusion products
Soft blood transfusion bag launched
From bottle to bag: Innovative closed system launched
Cardiac and vascular products
Hollow-fiber artificial lung launched
Aiming to be the world’s artificial lung leader
New aqueous polymer coating guide wire launched
Developing the minimally invasive guide wire market
New business areas
Continuous flowing magnetic levitation
left ventricular assist device
Artificial heart: New hope in cardiac treatment
(Initial launch planned for Europe)
First in Japan
First in the world
15
Core Technology for Disposable Medical Devices
A number of basic technologies are required to develop
disposable medical devices:
(1) Technology for developing plastics (polymers) and
technologies with pharmaceuticals.
In 1973, Terumo applied the polymer technology
developed originally for medical equipment to the invention
of Japan’s first soft infusion bag. Until then, glass infusion
other materials with high biocompatibility
(2) Technology for selecting, processing and forming these
materials
(3) Technology for conducting biological evaluations
(4) Technology for conducting physical evaluations
(5) Sterilization technology
These are among the core technologies on which Terumo
relies to develop new products in all its main business areas.
The successful application of these technologies has
delivery systems had required the injection of air pressure to
drip-feed infusion liquid to the patient. Soft plastic bags rely
instead on air pressure to drip the liquid. The introduction
of a soft, flexible and easy-to-use
infusion delivery system has reduced
the risk of contamination at hospitals.
Unlike many other pharmaceutical
companies, Terumo does not start
with the development of synthesized
made Terumo a market leader in a number of key product
areas. In 1985, for example, the Company developed a
drugs, but instead applies its core
medical equipment technology to new
guide wire that has maintained a large global market share
since its debut.
A guide wire is a thin metal device used to guide
drug development. The approach
has given Terumo a distinct advantage in the pharmaceutical
market.
catheters and other treatment devices to a specific area
within the body. Terumo’s guide wire product is made of a
Consider the product FULCALIQ®, which has the top
share of the high-calorie transfusion agent market in Japan.
super elastic metal alloy, which provides both body stiffness
and flexibility. A hydrophilic polymer coating with lubricant
Terumo designed a three-chambered bag that contains a
high-calorie transfusion liquid with all the nutrients a patient
needs.
Terumo has also become the domestic leader in the
prefilled syringe market and attracted the attention of
Guide Wire Patent Application Map
Number in ( ) is number of applications in Japan
Angiographic structure (5)
Core structure (15)
Coating (15)
Visual mark (3)
Tip structure (11)
FULCALIQ, total parenteral nutrition
containing multivitamins, glucose,
amino acids and electrolytes
Joining technology (17)
pharmaceutical makers around the world. In this market as
well, the Company replaced the traditional glass syringe with
an innovative and safe plastic syringe.
Drug delivery systems (DDS) using nanotechnology
represent an exciting new field of health care development
MRI applicability (3), Extension system (4), Other (9)
fusing pharmaceuticals with medical equipment. One method
of treatment involves injecting drugs into a liposome, using
polyethylene glycols to coat the surface of the liposome
properties enables easier guiding to the treatment area.
During x-ray angiography, for example, the catheter can be
and then targeting the drug on a specific area of infection
or cancerous tissue. Key benefits of DDS are the improved
smoothly guided through the body, reducing the diagnosis
and treatment time and the physical burden on the patient.
In addition, since the guide wire can navigate through
response and the mitigation of side effects.
The fusion between pharmaceuticals and medical
equipment will be critical to successful development of
treatment systems in the future. In the past few years,
narrow vessels, in addition to angiography, the device is
being utilized for cardiac infarction and various other cardiac
procedures. A number of key technologies are concentrated
in a diameter of 0.014 mm to 1 mm. Patent applications
associated with the guide wire are shown above.
Fusing Medical Equipment with Pharmaceuticals
Terumo leads the world in the development of core
technologies in its main business areas. In addition, the
Company is taking a leading role in combining these core
16
drug-eluting stents (DES) have grown to become a major
treatment for cardiac infarction. With DES, a reticulated
stainless steel stent is coated with immune-suppressing
drugs and other agents.
Terumo has also married transfusion agents with the
transfusion pumps and sets required to deliver the agents.
No other health care company in Japan can provide both
the agents and the delivery systems, with the result that no
company can offer the same level of safety and efficiency
in the transfusion field. This has become a key competitive
advantage for us.
New Ideas from the Source
Company begins quality
control at the design stage,
and this approach has won
it a long-standing reputation
For development of new products, Terumo relies heavily on
its close bonds to the medical industry. The Company has
close relations with doctors, nurses, pharmacologists, clinical
engineers and other professionals supporting the industry,
garnering information on their needs and for the development
of its business. In the home care and other health care
areas, Terumo often contacts patients directly. This type of
business model enables the Company to monitor the true
needs of treatment facilities and patients and to develop
among medical professional and patients for easy-to-use
and high-quality equipment. Quality is a core component of
the Terumo brand.
medical equipment that addresses these needs. Merging this
information into new product development is keeping Terumo
development, an intellectual property team draws up a
patent portfolio needed to fully protect the new product. The
a step ahead of the field.
One example is the need of treatment facilities to
prevent accidents. Over the past several years, Terumo
approach is critical to the creations of our R&D teams.
During the fiscal year under review, Terumo filed 471
patent applications worldwide: 397 applications in Japan
has developed new medical equipment based on an exact
understanding of the needs of medical institutions and
and 74 overseas. A high percentage of the Company’s filings
continued to be made in the United States and Europe,
patients. Net sales and net income in the general hospital
division have improved markedly as a result.
but in line with the globalization of business, an increasing
number of applications were filed in Asia, particularly China
and South Korea.
Uniting Technologies to Create New Products
Medical equipment represents the union of a number of
In 2003, Terumo introduced a new patent evaluation
system in which all patent applications undergo a 16-item
different sciences, including physiology, biochemistry,
pharmacology, cell technology, polymer technology, metal
processing, electronics and sensor technology, to name
assessment to determine their inventive value. This system
helps to determine whether a foreign patent application will
be filed after the filing of the Japanese application. The results
only a few. One of Terumo’s major strengths, however, is
the capability to add to the development process a number
of the evaluation are also used to assess the performance of
our researchers. The patent evaluation results are combined
of related processes that are critical to the success of new
products. These include technology to evaluate the physical,
chemical and biological properties of new products, the
with our incentive system, so that researchers who produce
a steady stream of good inventions benefit from positive
personnel evaluations, which supports a high level of work
implementation of clinical testing, the ability to receive
approval for products in various countries with different
and leads to increased salaries.
Terumo is leveraging its wealth of development
regulations, and the ability to conduct post-launch surveys to
ensure the safety and effectiveness of products.
In addition, Terumo provides unique sales know-how,
including unique training mechanisms to ensure that the
technology in the areas of disposable medical products,
medical equipment and pharmaceuticals and its reputation
for quality. The Company has formed strong bonds with
medical institutions and trading partners in Japan and built
doctors, nurses and other medical professionals who use our
products employ them correctly.
Quality control is the basis for the successful
implementation of our technology and know-how. Medical
equipment poses a number of risks because of the direct
a high market share in key product areas. Terumo’s 13
plants and 33 sales offices overseas form the backbone of
a global sales and production network. This network keeps
employees close to medical professionals and patients, and
enables us to build an intellectual asset portfolio that reflects
influence it has on human life. Advanced quality control
technology is critical to reducing the number of defective
products. Terumo has been able to keep the level of
defective products to about one out of 10 million. The
their needs. Staying close to the medical world, developing
new technologies and applying those technologies to the
development of innovative medical equipment is one of our
key competitive advantages.
The Protection and Strategic Use of Intellectual Property
Terumo aims to make product development as efficient as
possible by analyzing laid-open patent applications to collect
important patent-related information and find high-growth
areas ripe for new development. During actual product
17
Research and Development
A Global R&D Structure Leveraging the Strengths
of Each Region
Terumo promotes an R&D structure that leverages the unique
characteristics of each global region. In the United States,
R&D staffs are actively pursuing the acquisition of new
technologies. In Europe, we have developed an environment
in which clinical trials can be conducted as early as possible
in the development cycle. In Japan, Terumo has developed
a portfolio of strong elemental technology and is working to
combine these to create new products. The goal is to rapidly
develop new technology of high quality.
undergoing design improvements to improve reliability as
clinical trials continue. In another area, clinical trials for drugeluting (DE) stents for treatment of cardiac infanction are
Japan
Technological
Fusion
underway in comparison with a competing product. We
are now preparing for the launch of a DE stent after having
brought the production completely in-house to ensure
competitiveness and safety.
Global
Development
Strategy
Europe
Clinical Trials
ANACONDA, a stent graft for the treatment of abdominal
United States
Pursuit of
New Technologies
aortic aneurysm, was launched in Europe last year after
completing clinical trials there. New clinical trials have begun
in the largest health market, the United States.
The Research and Development Center in Japan is the
focal point at Terumo for the combination of a wide range
of elemental core technologies developed locally over the
Advances in Development of Global R&D Structure
years, and new technologies being invented primarily in
At Terumo, the advancement of a global-scale R&D structure
the United States. Our R&D style is to bring forth a range
is critical to the expansion of therapeutic equipment with high
of fusion technologies, including artificial oxygen bodies
value.
carrier and drug delivery systems (DDS) which are utilizing
In Europe, one of our key bases for conducting clinical
trials, we are nearing the completion of development of
two major products. DURAHEART, a left ventricular assist
device for patients with serious heart failure, has been
18
nanocapsule technology Laparoscopic manipulator and
cardiac regenerative medicine.
Product Improvement and Training: Key Factors
R&D through Partnership
in Medical Equipment Development
A strategy for tie-ups with other companies will be
Medical equipment development encompasses more than
increasingly important in the future as we pursue the
simply the innovation of cutting-edge technologies. At
development of products with global competitiveness.
Terumo, we continually make development improvements
In August 2005, Terumo and Olympus Corp. strengthened
to syringes, infusion sets and other basic products. New
their strategic partnership. The aim behind the tie-up is to
valuable function, like safety features to prevent the infection
combine the two firms’ core technologies and know-how for
and medical accsidents and which make it easier to use
the joint development of innovative products.
equipment, is being added to a wide variety of products.
One of the unique aspects of the medical equipment
In other areas, Terumo has joined with more than 10
pharmaceutical firms to jointly develop prefilled syringes, a
business is that the success of the product treatment is often
major growth products for the Company. The importance of
closely linked to the skills of the medical professionals using
these and other collaborative businesses is increasing as we
the equipment. In 2002, we established the Terumo Medical
pursue continued growth.
Pranex in a new complex adjacent to the Research and
Development Center. The Medical Pranex is the site of joint
Status of R&D
development projects between our development staff and
In the fiscal year under review, Terumo’s R&D expenditures
outside medical professionals, along with training courses on
increased 31.2% over the previous year to ¥18.0 billion,
the use of our equipment.
which included a ¥2.3 billion charge for the acquisition of
MicroVention. The ratio of R&D expenditures to net sales
increased 1.3 percentage points to 7.3%. The number of
employees involved in R&D activities rose 5.1%, to 696 staff.
R&D Expenditure and Ratio of
R&D Expenditure to Net Sales
Number of R&D Personnel
Billion ¥
7.3
6.8
5.5
5.7
Terumo Medical Pranex
14.7
10.3
02
626
6.0
18.0
542
06
02
662
696
574
13.7
11.4
03
04
05
03
04
05
06
R&D Expenditure
Ratio of R&D Expenditure to Net Sales (%)
19
Close-Up
U.S. Firm MicroVention Wholly Acquired:
Terumo Obtains Catheter Lineup to Enter Neurovascular Market
Specialized Maker of Coils to Treat Brain Aneurysms
MicroVention has excelled in the field with proprietary
In March 2006, Terumo wholly acquired MicroVention, Inc.,
coatings. Its global competitiveness has made it a leader in
a U.S. manufacturer of coils to treat cerebral aneurysms that
a global market worth ¥22 billion and growing at more than
holds about a 15% share of the world market.
15% a year.
Some 80,000 patients a year worldwide receive treatment
for cerebral aneurysms, which are cause, brain hemorrhaging
Treatment of Cerebral Aneurysms
and other afflictions with a high mortality rate. Doctors
currently treat the malady through two methods: open brain
Cerebral aneurysms
surgery and intravascular therapy using a catheter. In recent
Brain blood vessel
years, intravascular therapy has been the preferred method
worldwide, because of the better clinical efficacy minimized
the burden on the patient.
Intravascular surgery
The coils produced by MicroVention are used during
Surgical remedy
intravascular therapy for aneurysms by insertion into the
Platinum coils
aneurysm to prevent it from rupturing. Recently, new types
of coated coils have been developed to improve the clinical
outcome. As the blood touches the coil, it begins to swell.
Micro catheter
The coated coils have superb filling volume is the aneurysm
and prove far more efficient than conventional types.
Neuro Interventions Market
Billion ¥
Trend in Cerebral Aneurysm Treatment
Procedures (Worldwide)
Assist Device
(Stent, etc.)
Other Device
100,000
Coils
Catheter
(Delivery)
80,000
60,000
¥22.0
40,000
20,000
Other Embolic Material
0
04
Global market scale: ¥36 billion
(Worldwide 2005)
Source: Millennium Research Group
20
05
Coated Coils
Bare Platinum Coils
Neurosurgical Clipping Procedure
06
07
08
09
10
Clip
Expanding Interventional Business to Neurovascular
a surgical approach to replace the diseased vessels with
Treatment
artificial vascular grafts. With ANACONDA, doctors use
Terumo has positioned interventional systems as a major
an endovascular approach to deliver the stent graft to the
growth area for the Company.
diseased area. This procedure eliminates a major surgical
With the acquisition of MicroVention, Terumo can add
neurovascular catheter products to its current lineup ranging
from angiographic catheters used in the radiology field and
incision and significantly reduces the burden on the patient
with a minimally invasive treatment.
In the year ended March 2006, the abdominal aortic
various cardiovascular interventional products. The Company
aneurysm treatment market was worth ¥73 billion worldwide,
looks forward to stronger competitiveness and higher growth
and is expected to grow to ¥94 billion for the year ending
with the addition of coils to treat cerebral aneurysms.
March 2008. Terumo believes Anaconda will occupy a solid
market share in coming years. Clinical trials are continuing in
the United States for planned market launch in the area.
Hydro Coil, coated coils
Stent Graft ANACONDA, Used in Treatment of
Abdominal Aortic Aneurysm, Hits Market
In April 2005, Terumo began sales of ANACONDA, a stent
graft used to treat abdominal aortic aneurysms, in Europe.
In conventional treatments for the disease, doctors perform
The Abdominal Aortic Aneurysm
Treatment Market
Billion ¥
ANACONDA, stent graft
79.0
57.0
16.0
15.0
06
08
Stent graft
Artificial graft
Source: Terumo estimates
21
Review of Operations
General Hospital Products
Business Strategy
M
edical equipment currently installed at hospitals often does not meet all the needs of
medical professionals and patients, because such needs are constantly changing.
Terumo aims to develop and supply the medical industry with top-quality equipment that
Sales of General Hospital
Products
Billion ¥
73.9
77.2
73.5
73.3
prevents accidents and infection. In recent years, demand has grown for total solutions to
the requirements of medical safety. For instance, for infusion equipment, the demand has
extended to the infusion pumps and to the infusion liquids.
The Company has taken steps to respond to rising demand for total safety solutions by
supplying, for example, not simply high-added-value pumps but also maintenance leases
to ensure the safety of the hospital environment in which the pumps are used. In addition,
31.8
34.9
35.8
23.9
14.7
14.9
15.7
16.9
we are offering medical professionals training sites where they can build surgical, injection
and other skills. The general hospital pruduct business division will seek continued growth
by anticipating the needs of medical establishments with new products and services.
General Hospital Product Business Highlights
•Net sales grew 4.7%, to ¥129.9 billion
•Operating income surged 19.5%, to ¥25.4 billion
•Operating income margin rose 2.4 percentage points, to 19.5%
22
03
04
05
Disposable medical equipment and
medical electronic products
Pharmaceuticals
Blood transfusion systems
06
Performance
•Disposable medical equipment
and medical electronic products
Terumo is the dominant leader in the
hospital syringe market in Japan,
with about a 70% share. Sales of
TE-161S, infusion pump
syringes jumped 11.4% over the
previous year, to ¥19.6 billion. Sales of needles also grew
well, up 14.6%, to ¥5.6 billion.
Net sales improved 5.0% over the previous year, to ¥77.2
billion.
Demand was also robust for risk management products
that prevent accidents and contribute to higher management
efficiency. In the IV catheter market, sales grew 10.7%,
to ¥9.1 billion, thanks largely to healthy demand for
SURSHIELD SURFLO II, an IV catheter with a safety feature
to prevent needlestick injuries to medical professionals, and
SURSHIELD SV, a safety winged infusion set. In the infusion
and syringe pump area, sales improved by 9.9%, to ¥5.9
billion. Demand was strong for both TE-161S, an infusion
pump with accident-prevention features, and the syringe
pump TE-331S/332S, for which the Company has begun
offering a maintenance lease contract.
In December 2005, Terumo launched the TE-261, an
infusion pump with multiple safety features, to prevent an
oversupply of fluid and other accidents.
•Pharmaceuticals
Net sales grew 2.6%, to ¥35.8 billion.
FULCALIQ, a total parenteral nutrition product developed
with Tanabe Seiyaku Co., Ltd., continued to post robust
sales. FULCALIQ is a unique product containing all the
multivitamins, glucose, amino acids and electrolytes that
patients require in a three-chambered pack. The world’s
first total nutrition product in a single pack, FULCALIQ
ensures that patients receive complete nutrition, reduces the
chances of mistaken combinations of solutions or infection,
and eases the burden on medical professionals with simple
administration. In July 2005, we expanded the lineup to
include a large-sized pack that requires replacement only
once a day, as opposed to the previous twice-aday replacement size. FULCALIQ is being sold with
Tanabe Seiyaku, but Terumo alone claims more than
30% of the total parenteral nutrition market in Japan.
Prefilled syringes have been well received by
hospitals for their ability to prevent the administration
of the wrong drugs and eliminate the need to mix
drugs. Since Terumo began sales of prefilled syringes
in 1999, sales have grown consistently, expanding in
the previous year alone by 13.9%, to ¥9.0 billion. In addition,
Terumo has obtained the exclusive domestic sales rights
to three drugs from Guerbet SA of France. From January
2006, we began selling the MAGNESCOPE syringe, an
MRI contrast medium; HEXABRIX 320, a urologic and
angiographic contrast medium; and the lymphatic system
and uterotubal contrast medium LIPIODOL ULTRA FLUIDE.
Our lineup of nutritional foods has been augmented. In
November 2005, the Company acquired three hospital-use
nutritional foods from Hisamitsu Pharmaceutical Co., Inc.
Tapion, Imun, F2α—to provide more comprehensive
nutritional support to medical institutions. In addition, we
began selling TERUMEAL PG SOFT, a high-calorie, liquid
nutritional food for aged customers. In the year under review,
nutritional food sales grew
23.8%, to ¥3.5 billion.
Terumo now has a 13%
share of the Japanese
market, placing it No. 3
Prefilled syringe
among sellers.
•Blood Transfusion Systems
Sales of blood transfusion equipment grew 7.9%, to ¥16.9
billion.
Sales of blood bags jumped 12.4%, to ¥11.1 billion.
From December 2006, the Japan Red Cross’s blood banks
are expected to adopt in-line-filter blood bags that remove
leukocytes during blood collection, thereby reducing sideeffects.
Sales of Main General Hospital Products
Sales of Pefilled Syringes
Billion ¥
9.0
7.9
6.1
3.6
03
04
05
06
TERUMEAL, a high-calorie
liquid nutritional food
23
Cardiac and Vascular Products
Business Strategy
T
he cardiac and vascular market is being transformed by a wave of minimally invasive
therapy. Historically, major surgeries have been the standard course for many kinds
Sales of Cardic and Vascular
Products
Billion ¥
49.2
of ailments. More and more case, however, are treated with new interventional products
44.8
such as catheters, which allow doctors to carry out treatment via blood vessels.
Terumo entered this market with development of a guide wire for vascular treatments.
Currently, the main markets are cardiovascular and abdominal treatment, along with
37.7
34.7
25.0
27.3
29.9
32.3
cerebrovascular and other newer areas of treatment. In pursuit of growth in these areas,
from April 2006 we began selling our interventional products directly in the United
States, ending our marketing relationship with Boston Scientific Corp. The direct sales
customer relationships are very important for new product development that enhances
U.S. business. In addition, we acquired the U.S. firm MicroVention Inc. in March 2006 and
have begun selling its coils used in the treatment of cerebral aneurysms. These moves
will help to expand our presence in the U.S. interventional products market, which will
be key to enlarging our position in the global market. Terumo plans to leverage its R&D
structure tailored to each market to introduce a wider lineup of attractive products.
24
7.4
6.2
5.9
structure will enable us to gather more information from vanguard customers. Such
2.0
03
04
05
Catheter systems
Cardiovascular systems
Vascular grafts
06
Cardiac and Vascular Product Business Highlights
•Net sales increased 9.9%, to ¥88.9 billion
•Operating income declined 12.5%, to ¥25.9 billion
•Operating income margin fell 7.5 percentage points,
to 29.1%
Performance
•Interventional Systems
Net sales of interventional
products rose 9.8%, to
Coronary stent TSUNAMI
¥49.2 billion.
Angiographic interventional
system sales expanded 7.3%, to ¥27.6 billion. Sales of
percutaneous transluminal coronary angioplasty (PTCA)
interventional extension systems used in the treatment of
angina, cardiac infarction and other diseases, along with
coronary stents, grew 9.7%, to ¥12.5 billion. Sales of other
types of interventional products increased 18.1%, to ¥9.1
billion.
In July 2005, we launched a SOLUTION PACK in Japan
to provide physicians with a handy package of interventional
products required in angiography.
expand both in Japan and overseas. In January 2005, we
acquired the Japan cardiopulmonary business of Edwards
Lifesciences Corp. of the United States, which made a
sizeable contribution to sales in this market. From September
2005, Terumo launched the CAPIOX RX15 oxygenator,
which combines the function of controlling the blood flow
to the oxygenator and its traditional function of exchanging
carbon dioxide with oxygen. The product can be adapted to
a wide range of patients, from children to adults.
•Vascular Grafts
Net sales of vascular grafts surged 19.5%, to ¥7.4 billion.
The stent graft ANACONDA, which is used to treat
abdominal and thoracic
aortic aneurysm was
launched in Europe in
April 2005. The product is
undergoing clinical trials in
the United States.
CAPIOX RX15, oxygenator
Sales of Main Cardiac and Vascular Products
Sales of Catheter Systems
SOLUTION PACK
Achieving Top Share in the Global
Cardiopulmonary Systems Market
Billion ¥
49.2
44.8
•Cardiovascular Systems
Net sales of cardiovascular systems grew 8.1%, to ¥32.3
billion.
Terumo enjoys the largest share of the world’s
cardiopulmonary market. Sales of SPEEDPACK, a
combination of oxygenator and blood lines, continued to
34.7
Terumo
Others
18%
31%
37.7
Medtronic
22%
03
04
05
06
Sorin
29%
Source: Terumo estimates
25
Home Health Care Products
Business Strategy
T
he home health care business is developing primarily in Japan, where the population
is aging quickly and attention is being focused on how to rein in soaring health care
Sales of Home Health Care
Products
Billion ¥
12.0
costs with more efficient solutions. One way to control costs has been to reduce the
length of hospital stays and promote home-based medicine. Terumo has responded to
this trend by offering a range of products with the same safety standards as those used
in hospitals. Currently, the home health care lineup includes self-monitoring equipment
10.5
10.0
9.5
8.2
8.1
6.2
9.2
8.0 7.8
7.7
6.6
such as blood pressure monitors and urine test papers to help control lifestyle diseases,
along with peritoneal dialysis equipment, diabetes care equipment, nutrition and oxygen
supply equipment.
In the future, more patients are expected to make their own decisions about the best
form of treatment to match their needs and stage of life. Terumo will meet patients’
growing needs with safe and comfortable medical solutions for the home.
03
04
05
06
CAPD systems
Diabetes care products
Other products
Home Health Care Product Business Highlights
•Net sales improved 12.9%, to ¥28.2 billion
•Operating income surged 15.5%, to ¥7.6 billion
•Operating income margin increased 0.6 percentage point, to 26.8%
26
From 2004, We changed the categorization of
nutritious foods from Home Health Care Products
to General Hospital Products.
Performance
•Peritoneal Dialysis Systems
Net sales of peritoneal dialysis systems declined 3.5%, to
¥7.7 billion.
Demand for MIDPELIQ, a close-to-neutral peritoneal
dialysis solution with a light burden on a patient’s peritoneum,
decreased due to a drop in the number of peritoneal dialysis
patients in Japan, a trend caused by problems with the
medical insurance system.
•Diabetes Care Products
Net sales of diabetes care systems
jumped 28.6%, to ¥10.0 billion.
The number of diabetics in Japan is
said to have increased to about 2.28
million and is expected to rise further in
NANOPASS 33, insulin
the coming years. Demand has grown
needle
strongly for MEDISAFE MINI, a blood
glucose monitoring system that enables patients to quickly
and safely measure glucose levels by extracting only a trace
of blood. Patients appreciate the convenience and safety of
the product, as from extraction to disposal, no handling of
blood is needed.
In July 2005, we introduced the NANOPASS 33 insulin
needle. With a tip of but 0.2 mm, the needle is the smallest
in the world. Typically, with a needle this fine, the resistance
during injection is too strong and patients encounter
problems. NANOPASS 33 features the world’s first doubletapered structure on the inside and outside of the needle,
an innovation that both reduces the pain for the patient and
injection resistance. With some 900,000 patients in Japan
alone self-administering their insulin injections, NANOPASS
33 represents a major step in reducing patient pain and fear.
•Other Products
Sales of other products in the home health care business
grew 13.9%, to ¥10.5 billion.
Home Transfusion and Oxygen Therapy Systems
Net sales of home transfusion and oxygen therapy systems
jumped 12.6%, to ¥3.9 billion.
In Japan, the number of patients with chronic obstructive
pulmonary disease, such as emphysema and chronic
bronchitis, is rising annually. It is estimated that some
120,000 patients are receiving home-based treatment for
these diseases. Terumo has widened its lineup of SHIZUNE
oxygen therapy systems by introducing in August 2005 the
O2 GREEN SHIZUNE IT-5L, which can supply up to five liters
of oxygen per minute.
Blood Pressure Monitors
Net sales of electric blood
pressure monitors increased
22.0%, to ¥2.8 billion.
In November 2005, Terumo
launched two new products
ARM IN MEMO, blood pressure
that built on its lineup of models
monitor
which patients can use simply by
slipping their arm into the monitor: ARM IN MEMO, which
allows patients to download their data onto portable media,
and the ARM IN PLUS, which has a data recording feature.
Digital Thermometers, Other
Sales of digital thermometers and other home health care
products grew 9.8%, to ¥3.8 billion.
In September 2005, we launched the TERUMO DIGITAL
THERMOMETER C220, which offers a backlit screen and
other convenient features.
In addition, in December 2005, the Company introduced
WOMAN°C C520, a women’s health management product
that meets women’s increasing demand for highly functional
monitors by measuring basal body temperature in 25 to 40
seconds and making various other measurements.
WOMAN°C C520, basal body thermometer
Sales of Main Home Health Care Products
Second Largest Share in Japanese
Market for Glucose Monitors
Others
19%
Sanwa Kagaku
Kenkyusho
39%
Rosh
5%
O2 GREEN SHIZUNE IT-5L,
oxygen therapy systems
Aventis
16%
Terumo
21%
Japanese market scale: ¥45 billion
Source: Terumo estimates
27
Performance by Geographic Segment
Business Strategy
I
n Japan, Terumo’s products maintain a high market share. We aim for stable growth in
Japan as we shift to the development of high-value-added products.
In overseas markets, the challenge is to expand sales and profits. The U.S. market
remains the highest priority, as it is the largest market for medical products and a source
Terumo’s Overseas Sales and
Production (Share of Total)
%
39.5
36.6
37.3
37.7
28.0
28.8
28.9
29.7
03
04
05
06
of advanced information. Europe is also the source of high-value-added products
on the cutting edge of development, and its importance for us is growing. China and
other markets in Asia promise strong growth opportunities, and the challenge will be to
accurately gauge the expansion opportunity in each market and realize its promise.
The Company will continue to develop its global business promotion structure to
execute its strategy in each country based on the characteristics of each individual market.
Sales ratio
Production ratio
Global Business Promotion Structure
Japan
Highlights
high quality manufacturing
expertise
•Net sales grew 4.3%, to ¥149.5 billion*
•Operating income increased 5.7%, to ¥52.5 billion
disseminating to overseas units
our high quality standards
North & South America
Europe
rich in information
clinical trials
acquiring and
developing new treatment
technologies
Asia & Others
expanding our business
expanding our manufacturing
plants
Consolidated Net Sales Share
by Region
Production Share by Region
North and South America
15.6%
Asia and Others
7.9%
North and South America
13.9%
Asia and Others
6.3%
Performance
Net sales in the general hospital products business in Japan were on
a par with last year, at ¥89.8 billion. Sales of pharmaceuticals grew
thanks to higher demand for nutritional foods and prefilled syringes,
but demand for hospital equipment and blood transfusion equipment
declined. Sales of cardiac and vascular products increased 11.0%, to
¥32.4 billion. A major contributor to the growth was cardiopulmonary
systems, sales of which jumped 35.5% thanks to the full-year
contribution of income from the acquisition of the cardiopulmonary
business of Edwards Lifesciences in January 2005. Domestic demand
for home health care products rose 11.7%, to ¥27.2 billion thanks to
higher demand for diabetes treatment products, home infusion and
oxygen therapy equipment, and digital blood pressure monitors.
Overseas Performance
Highlights
•Net sales increased 12.6%, to ¥97.5 billion*
•Operating income declined by ¥1.9 billion, from ¥8.9 billion to ¥7.0
billion
Europe
16.0%
Japan
60.5%
Europe
9.5%
Japan
70.3%
Performance in Japan
Business Strategy
Japan is Terumo’s largest market. The broad product lineup enables
us to leverage synergies in each division and the strong presence
we have developed at hospitals. Our operations in Japan are also
responsible for disseminating to overseas units our high quality
standards and product development and manufacturing expertise.
28
Performance
Net sales of general hospital products in overseas rose 17.1%,
to ¥40.1 billion, with hospital equipment and blood transfusion
equipment performing well. Net sales of cardiac and vascular products
grew 9.2%, to ¥56.6 billion, driven by robust demand for interventional
products and vascular grafts.
Demand for diabetes treatment products, digital thermometers,
and digital blood pressure monitors rose, lifting net sales by 54.7%, to
¥1.0 billion.
Highlights
•Europe
Business Strategy
Europe is a market where the newest products reach patients quickly.
In recent years, Terumo has been investing more resources into
cutting-edge equipment, and the importance of clinical trials in Europe
has risen. Europe will continue to play an important role in marketing
products worldwide after clinical trials and government approval, in
the end contributing to the Company’s rising sales and profits.
•Net sales jumped 7.9%, to ¥38.6 billion*
•Operating loss was ¥1.2 billion, compared with operating income
of ¥2.7 billion a year earlier
Performance
The operating loss can be attributed to expenses incurred from the
change to a direct sales structure for catheter systems, along with
one-time expenses linked to corporate acquisitions.
Highlights
•Net sales surged 13.9%, to ¥39.6 billion*
•Operating income grew 41.1%, to ¥3.8 billion
•Asia & Others
Performance
Sales of catheter systems and vascular grafts were robust.
ANACONDA, a stent graft used for treatment of abdominal aortic
aneurysms, has been well received since its launch in April 2005,
and we are targeting sales of ¥600 million for the current year ending
March 2007.
•North & South America
Business Strategy
The United States is the largest medical market in the world. Medical
equipment companies are acquiring and developing new treatment
technologies there, as the United States has traditionally been rich in
information and infrastructure. Terumo intends to reap the benefits of
this environment and thereby develop and market innovative products.
As we expect large growth in this market, we are investing aggressively.
Two major investments are the switchover in sales of catheter systems
from indirect sales to a direct sales structure, and the acquisition in
March 2006 of MicroVention Inc.
Business Strategy
In Asia, we are expanding our manufacturing plants. Terumo already
has manufacturing plants in China and the Philippines, and we are
now planning for a Vietnam plant to start operations in March 2008.
With its growing demand for medical equipment, Asia also offers lowcost procurement of high-quality materials. The cost efficiency of both
materials and labor will contribute to raising operating margins. The
Company plans to focus on expanding sales of high-value-added
products, such as medical equipment with safety features, catheter
systems and blood sucrose monitors, while keeping tabs on the
changing circumstances of each individual market in the region.
Highlights
•Net sales jumped 20.2%, to ¥19.3 billion*
•Operating income surged 23.2%, to ¥4.4 billion
Performance
Sales of hospital equipment and catheter systems grew strongly
during the year.
* Sales to third parties
Consolidated Net Sales* and
Operating Income in Japan
Billion ¥
127.2
134.2
143.4
Consolidated Net Sales* and
Operating Income in Europe
149.5
Consolidated Net Sales* and
Operating Income in North and
South America
Billion ¥
Billion ¥
39.6
32.3
33.2
33.9
35.8
38.6
49.7
19.3
13.7
14.8
16.1
52.5
38.9
2.3
1.5
03
Billion ¥
34.8
26.5
35.6
Consolidated Net Sales* and
Operating Income in Asia and
Others
04
05
06
03
2.4
04
2.7
05
3.1
2.7
3.8
1.7
2.6
3.5
4.4
-1.2
06
03
04
05
06
03
04
Net sales
Net sales
Net sales
Net sales
Operating Income
Operating Income
Operating Income
Operating Income
05
06
29
Eniviromental Initiatives and Social Contributions
Environmental Initiatives
Basic Policy on the Environment
The Terumo Group aims to earn the trust of society by
•Recycling and Energy Conservation Achievements
at Terumo Europe N.V.’s Belgium Plant
conducting business activities on the basis of the corporate
The Terumo Group is undertaking environmental
philosophy of contributing to society through health care. As
conservation initiatives not just in Japan, but also in Europe,
a Group, our primary mission is to supply safe and trusted
the United States, Asia and other areas around the globe.
medical equipment to the world. As a leading company in
The Belgium plant operated by Terumo Europe N.V. has
this field, we also take seriously our responsibility to protect
produced particularly
and conserve the environment.
impressive results
from its recycling and
Environmental Conservation Activities
energy conservation
•Mitigating Global Warming by Reducing CO2 Emissions
initiatives.
In the year ended March 2006, Terumo emitted 120,000
The amount of
tons of CO2. Our CO2 emissions have risen 33% since 1991,
waste has been
compared to a 75% increase in domestic net sales. This was
reduced significantly
achieved through the elimination of the use of heavy oil in
Terumo Europe N.V.
1998, the promotion of gas cogeneration systems, and the
of special mobile containers that collect waste from the
conversion to city gas.
manufacturing process for direct shipment to recyclers.
In comparison with the year ended March 1991, Terumo
with the introduction
In addition, the plant has found ways to recycle packaged
aims to reduce the emissions of CO2 per basic unit amount
goods by establishing new recycling routes. As a result,
by 25% by the year ending March 2011. As a result of energy
the plan has been able to reduce the amount of incineration
conservation activities at plants and offices, CO2 emissions
waste to 34% of all waste, and has raised the amount
per unit of sales in the year ended March 2006 stood at 72%
of plastic, cardboard, wood materials, metals and other
of the amount in the year ended March 1990.
materials recycled to 507 tons.
The plant is also making headway in conserving energy,
setting a goal of reducing energy consumption by 10%.
Efficiency measures include adjusting the relative humidity
Emissions of Carbon Dioxide
and optimizing the air circulation rate of clean rooms, along
with using special care in the operation of compressor air
Thousand tons of CO2, %
Reduction target in
terms of basic units,
using March 2000 term
for comparison
100
92
92
85
80
124
72
and sterilizer heating systems.
The emission of wastewater at the plant is being gradually
reduced, with a target of halving emissions in the year ended
March 2007 to 200m . Some of the measures being used to
3
127
125
125
125
meet the target are reuse of cooling water used in extrusion
89
molding machines and for washing glass tubes, along
with cutting off the flow of rainwater runoff into the sewage
02
03
Total emissions
Basic units (%)
30
04
05
06
system.
Social Contributions
Basic Policy on Social Contributions
the establishment of the fund, Takashi Wachi, Terumo’s
The Terumo Group is making a wide range of social
Representative Director & chairman, noted that young
contributions to improve the health of people around the
Chinese students share the dream of discovering unique
world. Our corporate philosophy of contributing to society
types of medicine yet unknown to the world.
through health care drives our desire to act as a good
corporate citizen by supporting healthy living.
•Terumo Donates ¥15 Million to the Hurricane Katrina
Relief Effort
Social Contributions
In the aftermath of Hurricane Katrina, which struck New
•Terumo Fund Established at Zhejiang University
Orleans and surrounding areas in October 2005, Terumo
In May 2006, Terumo established the Terumo Fund
and its local U.S. subsidiary provided syringes, infusion sets
at Zhejiang University to provide research grants and
and other medical equipment to the relief effort, along with
scholarship assistance to promising students. The fund will
donations from employees and matching gift from Terumo.
begin operating in 2007.
Altogether, the Terumo Group provided some ¥15 million in
The Terumo Group
funds and equipment.
began constructing a
Terumo began doing business in the United States in
plant in Hangzhou City,
the 1970s, and currently operates production plants and
Zhejiang Province, in
sales offices there. The Group responded to the hurricane
1995 for production of IV
quickly, with necessary medical equipment, donations from
drip and blood transfusion
employees and matching gifts from the Company.
tubes, blood pressure
monitors and other
Terumo Fund signing ceremony
equipment. Operations started in 1997, and currently the
•Terumo Health and Weather Forecast: Providing
“Healthy” News
plant has about 2,000 employees and an annual production
For many people, their
of about ¥7.7 billion. Equipment produced by the plant has
health is closely related
won accolades for quality from Japanese medical institutions.
to weather and climate.
The Terumo Fund at the university, considered one of the top
Terumo has been
three universities in China, will commemorate the 10th year
providing information on
of operations in Zhejiang Province and the excellent relations
weather forecasts, and
the Group has developed with the provincial government
illnesses influenced by
over the past decade.
changes in the weather,
Under the Terumo Fund, Terumo Research Grants will be
Terumo Health and Weather Forecast:
Providing “healthy” news
through Japanese television, radio and on the Company’s
provided to encourage the innovation of new medicine that
website. This activity is part of our efforts to achieve our
combines the traditions of Western and Eastern medicines.
corporate philosophy of contributing to society through
In addition, the fund will provide three-year Terumo
health care.
Scholarships worth 1.5 million yuan ($187,000) to some 300
promising students.
In a speech given on
Terumo-sponsored weather updates include information
on pollen counts, UV rays, heat exhaustion during exercise,
heat exhaustion during living hoursamong the elderly, joint
April 5, 2006 at Zhejiang
ailments, influenza, the common cold and asthma, pollen
University to announce
counts and UV rays.
Hangzhou plant
31
Consolidated Eight-Year Summary
Terumo Corporation and subsidiaries
Years ended March 31
2006
2005
2004
For the period:
Net sales . . . . . . . . . . . . . . . . . . . . . . . . . . . . . . . . . . . . . . . . . . . . . . . . . .
¥247,049
¥230,003
¥ 215,196
Operating income . . . . . . . . . . . . . . . . . . . . . . . . . . . . . . . . . . . . . . . . . . .
48,252
47,108
36,653
Income before income taxes and minority interests . . . . . . . . . . . . . . . . . .
51,589
43,654
33,743
Net income . . . . . . . . . . . . . . . . . . . . . . . . . . . . . . . . . . . . . . . . . . . . . . . .
32,457
27,135
19,792
Net cash flow from operating activities. . . . . . . . . . . . . . . . . . . . . . . . . . . .
43,380
43,725
41,497
Net cash flow from investing activities . . . . . . . . . . . . . . . . . . . . . . . . . . . .
(54,391)
(15,636)
(11,639)
Free cash flow . . . . . . . . . . . . . . . . . . . . . . . . . . . . . . . . . . . . . . . . . . . . . .
(11,011)
28,089
29,858
Net cash flow from financing activities . . . . . . . . . . . . . . . . . . . . . . . . . . . .
371
(12,343)
(19,216)
R&D expenditure . . . . . . . . . . . . . . . . . . . . . . . . . . . . . . . . . . . . . . . . . . . .
18,025
13,739
14,700
Capital expenditure . . . . . . . . . . . . . . . . . . . . . . . . . . . . . . . . . . . . . . . . . .
14,248
10,998
11,456
Depreciation and amortization (Note 4) . . . . . . . . . . . . . . . . . . . . . . . . . . .
15,181
15,581
14,881
Net income—basic . . . . . . . . . . . . . . . . . . . . . . . . . . . . . . . . . . . . . . . . . .
¥ 160.45
¥ 136.03
Cash dividends . . . . . . . . . . . . . . . . . . . . . . . . . . . . . . . . . . . . . . . . . . . . .
24.00
20.00
16.00
Stockholders’ equity . . . . . . . . . . . . . . . . . . . . . . . . . . . . . . . . . . . . . . . . .
1,345.52
1,107.88
982.62
Current assets . . . . . . . . . . . . . . . . . . . . . . . . . . . . . . . . . . . . . . . . . . . . . .
¥165,487
¥161,504
¥ 142,560
Current liabilities . . . . . . . . . . . . . . . . . . . . . . . . . . . . . . . . . . . . . . . . . . . .
66,876
70,653
71,189
Working capital . . . . . . . . . . . . . . . . . . . . . . . . . . . . . . . . . . . . . . . . . . . . .
98,611
90,851
71,371
Total assets (Note 3) . . . . . . . . . . . . . . . . . . . . . . . . . . . . . . . . . . . . . . . . .
354,648
312,456
293,866
Total stockholders’ equity . . . . . . . . . . . . . . . . . . . . . . . . . . . . . . . . . . . . .
273,309
219,873
195,075
Common stock . . . . . . . . . . . . . . . . . . . . . . . . . . . . . . . . . . . . . . . . . . . . .
38,716
38,716
38,716
ROE . . . . . . . . . . . . . . . . . . . . . . . . . . . . . . . . . . . . . . . . . . . . . . . . . . . . .
13.2%
13.1%
10.4%
ROA . . . . . . . . . . . . . . . . . . . . . . . . . . . . . . . . . . . . . . . . . . . . . . . . . . . . .
9.7%
9.0%
6.8%
Stockholders’ equity ratio . . . . . . . . . . . . . . . . . . . . . . . . . . . . . . . . . . . . .
77.1%
70.4%
66.4%
Number of common shares issued at year-end (in thousand shares) . . . . .
203,027
198,320
198,382
Number of associates (in persons) . . . . . . . . . . . . . . . . . . . . . . . . . . . . . . .
10,825
9,624
9,094
Per share of common stock (Note 2):
¥
98.45
At year-end:
Other statistics:
Notes: 1. All dollar figures herein refer to U.S. currency. Yen amounts have been translated, for convenience only, at ¥117=$1, the approximate exchange rate at
March 31, 2006.
2. Effective April 1,
financial summary have not been restated.
3. Effective April 1, 2000
financial summary have been restated to conform to the 2001 presentation.
4. Write-down of goodwill exclu
March 31, 2003.
32
Thousands of
U.S. dollars
(Note 1)
Millions of yen
2006
2003
2002
2001
2000
¥ 200,625
¥ 187,082
¥ 176,050
¥ 171,179
¥ 160,682
$ 2,111,530
31,299
28,039
28,800
29,151
30,247
412,410
33,505
24,802
29,013
11,282
29,172
440,931
18,155
14,441
16,639
6,284
14,834
277,410
36,825
28,566
25,222
27,753
–
370,769
(31,720)
(15,420)
(14,144)
(32,457)
–
(464,880)
5,105
13,146
11,078
(4,704)
–
(94,111)
(5,977)
(21,053)
(3,372)
(2,204)
–
3,171
11,390
10,290
8,897
9,686
7,328
154,060
12,574
12,857
14,871
19,812
–
121,778
14,716
14,289
14,070
13,260
10,809
129,752
1999
U.S. dollars
(Note 1)
Yen
¥
88.65
¥
68.88
¥
78.91
¥
29.80
¥
71.94
$
1.37
11.00
11.00
8.50
8.50
8.50
0.21
917.69
873.61
816.93
771.58
750.78
11.50
Thousands of
U.S. dollars
(Note 1)
Millions of yen
¥ 131,910
¥ 135,978
¥ 135,197
¥ 116,169
¥ 116,229
$ 1,414,419
78,653
82,422
79,147
69,693
67,066
571,590
53,257
53,556
56,050
46,476
49,163
842,829
288,184
284,736
281,660
273,126
250,604
3,031,179
184,464
179,854
172,271
162,707
158,319
2,335,974
38,716
38,716
38,716
38,716
38,716
330,906
10.0%
8.2%
9.9%
3.9%
10.4%
6.3%
5.1%
5.6%
2.4%
6.3%
64.0%
63.2%
61.2%
59.6%
63.2%
200,847
205,874
210,876
210,876
210,876
8,749
8,062
7,412
6,898
5,849
33
Management’s Discussion and Analysis of Operating Results and
Financial Condition
Market Trends
previous year, to ¥247.0 billion (US$2,112 million), for the
The business environment in the medical industry is
12th straight year of increase.
undergoing major change. Outside Japan, major mergers
have taken place in Europe and the United States. In Japan,
Net Sales in Japan
the April 2005 revision to the Pharmaceutical Affairs Law
In Japan, net sales increased 4.2%, to ¥149.4 billion
requires the same level of safety of medical equipment as is
(US$1,277 million), thanks to robust demand for prefilled
in place for pharmaceuticals.
syringes and other general hospital products, interventional
Revisions to NHI drug prices, medical treatment fees
systems, cardiopulmonary systems and other cardiac and
and special medical equipment in April 2006 are aimed
vascular products, and a wide range of home health care
at restraining medical costs and are also expected to
products, including blood glucose monitors, oxygen therapy
encourage greater specialization among hospitals.
systems and digital blood pressure monitors. The ratio of net
sales to overall net sales in Japan is to 60.5%.
Operating Results
From April 2005, Terumo began the STeP UP 2007 medium-
Net Sales Overseas
term management plan, which focuses on the themes of “safe
Despite the effects of changing foreign exchange rates, net
and efficient medicine,” “the development of new treatment
sales of general hospital products increased in the United
systems” and “promotion of an in-house company system.”
States and Asia, while steady growth in interventional
In the first year of the plan, the Company posted record net
systems, cardiopulmonary systems and stent grafts was
sales and profits.
seen in the cardiac and vascular products area in Europe and
Asia. Altogether, net sales overseas grew 12.7%, to ¥97.7
Income and Expenses
billion (US$835 million), raising the ratio of net sales overseas
1. Net Sales
to total net sales by 1.8 percentage points, to 39.5%.
Net sales in the year under review grew 7.4% over the
Sales Results by Product Segment
Years ended March 31, 2006, 2005 and 2004
Thousands of
U.S. dollars
Millions of yen
2006
2005
2004
2006
%
•Disposable medical equipment and
medical electronic products . . . . . . . . . . . . . . . . . . . . . . .
•Pharmaceuticals. . . . . . . . . . . . . . . . . . . . . . . . . . . . . . . .
•Blood transfusion systems . . . . . . . . . . . . . . . . . . . . . . . .
¥ 77,156
35,814
16,913
¥ 73,491
34,904
15,673
¥ 73,294
31,772
14,872
$ 659,453
306,103
144,555
General hospital products. . . . . . . . . . . . . . . . . . . . . . . . . . . .
129,883
124,068
119,938
1,110,111
52.6
•Catheter systems . . . . . . . . . . . . . . . . . . . . . . . . . . . . . . .
•Cardiovascular systems . . . . . . . . . . . . . . . . . . . . . . . . . .
•Vascular grafts . . . . . . . . . . . . . . . . . . . . . . . . . . . . . . . . .
49,227
32,279
7,425
44,845
29,867
6,215
37,728
27,348
5,891
420,743
275,889
63,462
19.9
13.1
3.0
Cardiac and vascular products. . . . . . . . . . . . . . . . . . . . . . . .
88,931
80,927
70,967
760,094
36.0
•CAPD systems . . . . . . . . . . . . . . . . . . . . . . . . . . . . . . . . .
•Diabetes care products . . . . . . . . . . . . . . . . . . . . . . . . . .
•Other products . . . . . . . . . . . . . . . . . . . . . . . . . . . . . . . . .
7,739
10,026
10,470
8,016
7,799
9,193
8,213
6,597
9,481
66,146
85,692
89,487
3.1
4.1
4.2
Home health care products . . . . . . . . . . . . . . . . . . . . . . . . . .
28,235
25,008
24,291
241,325
11.4
Total . . . . . . . . . . . . . . . . . . . . . . . . . . . . . . . . . . . . . . . . . . . . .
¥ 247,049
¥ 230,003
¥ 215,196
$ 2,111,530
34
31.2%
14.5
6.9
100.0%
Net Sales by Business
Net Sales
Net sales of general hospital products rose 4.7%, to ¥129.9
billion (US$1,110 million), while sales of cardiac and vascular
products grew 9.9%, to ¥88.9 billion (US$760 million), and
sales of home health care products rose 12.9%, to ¥28.2
247
Billion ¥
230
215
187
201
billion (US$241 million).
2. Cost of Sales, Gross Profit Margin
Cost of sales increased 4.8%, to ¥111.4 billion (US$952
million), and gross profit rose 9.6%, to ¥135.7 billion
(US$1,160 million). The gross profit margin subsequently
02
03
04
05
06
improved by 1.1 percentage points, to 54.9%, reflecting
strong sales of high-profit products, and the promotion of
higher-quality and lower-cost manufacturing using Terumo’s
proprietary manufacturing technology.
Gross Profit Ratio and
SGA Expenses Ratio
3. Selling, General and Administrative Expenses
%
Selling, general and administrative (SG&A) expenses grew
14.0%, to ¥87.4 billion (US$747 million), mainly due to costs
51.3
53.8
48.3
49.2
33.3
33.6
34.3
33.3
02
03
04
05
54.9
for the development of sales structures in the United States
and Europe and ¥2.3 billion (US$19 million) in expenses
35.4
linked to the acquisition of MicroVention, Inc. of the United
States.
4. Operating Income
Operating income in the term rose 2.4%, to ¥48.3 billion
(US$412 million), while the operating income margin fell 1.0
percentage point, to 19.5%.
5. Other Expenses
The Company posted other income of ¥3.3 billion (US$29
million) compared with other expenses of ¥3.5 billion in the
06
Gross Profit Ratio
SGA Expenses Ratio
Operating Income and
Operating Margin Ratio
Billion ¥
47.1
48.3
previous term. Losses in the term under review included a
36.7
loss of ¥0.7 billion (US$6 million) on disposal of property,
plant and equipment, an impairment loss of ¥0.6 billion (US$5
31.3
28.0
million) on property, plant and equipment, and a loss of ¥0.6
billion (US$5 million) on restructuring in overseas operation,
15.0
15.6
02
03
20.5
19.5
05
06
17.0
for total losses of ¥4.2 billion (US$36 million). On the other
hand, the Company booked a gain of ¥5.0 billion (US$42
million) on the contribution of securities to the retirement
pension trust, along with a foreign exchange gain of ¥0.8
billion (US$7 million) and other profits totaling ¥7.6 billion
04
Operating Income
Operating Margin Ratio (%)
(US$65 million).
35
6. Income before Taxes and Minority Interests
In Japan, we increased investment in the Fujinomiya and
Income before taxes and minority interests rose 18.2%, to
Kofu plants to expand production of pharmaceuticals and
¥51.6 billion (US$441 million).
diabetes treatment products. Outside Japan, we continued
to inject money into the second-stage expansion of the
7. Corporate, Residential and Other Taxes
Philippines plant, an effort that started in the previous fiscal
Corporate and other taxes increased 15.8%, to ¥19.1 billion
year as part of the production shift of products with built-in
(US$163 million). Minority interests totaled ¥0.014 billion
safety devices to overseas plants.
(US$0.12 million).
Financial Position
8. Net Income
1. Total Assets
Net income rose 19.6%, to ¥32.5 billion (US$277 million), the
At the end of the term under review, the Company had total
fourth straight term of increase and a record high. The ratio
assets of ¥354.6 billion (US$3,031 million), an increase of
of net income to net sales improved 1.3 percentage points,
13.5% from the previous year.
to 13.1%. Return on equity rose 0.1 percentage point, to
13.2%, and return on assets increased 0.7 percentage point,
Total Current Assets
to 9.7%.
Total current assets increased 2.5%, to ¥165.5 billion
(US$1,414 million). Cash and cash equivalents declined
9. Management Targets
16.7%, to ¥48.0 billion (US$410 million), as the Company
Terumo’s management aims to increase corporate value
used its own funds for the acquisition of MicroVention,
through consistent improvements in profitability. In the
Inc.. The addition of new businesses, however, increased
coming years, it will be particularly important to strengthen
inventories by 17.7%, to ¥40.9 billion (US$350 million), while
the Company to deal with increased global competition in
trade receivables (notes and accounts) grew 5.1%, to ¥63.9
the medical equipment market. In this environment, Terumo
billion (US$547 million) and deferred income tax assets
views double-digit growth in operating income as a key
jumped 44.5%, to ¥8.6 billion (US$74 million).
target.
Net Property, Plant and Equipment
Per Share Data
Net property, plant and equipment grew 2.6%, to ¥109.8
Basic net income per share rose 18.0%, to ¥160.45
billion (US$939 million). The impairment of leisure-related
(US$1.37), and stockholders’ equity per share grew 21.4%,
assets reduced the value of land by 6.5%, to ¥20.4 billion
to ¥1,345.52 (US$11.50). Cash dividends per common share
(US$174 million). On the other hand, the value of construction
for the year totaled ¥24.00 (US$0.21), including an interim-
in progress jumped 44.4%, to ¥10.7 billion (US$91 million),
term payout of ¥10.00 (US$0.09) per share. Dividends were
due to the increased investment in the Fujinomiya and
increased by ¥4.00 (US$0.03) per share above the previous
Kofu plants to expand production of pharmaceuticals and
term, consisting of ¥2.00 (US$0.02) in consideration of
diabetes treatment products and the ongoing second-stage
operating results and ¥2.00 (US$0.02) to commemorate the
expansion of the Philippines plant.
85th anniversary of the Company.
Investments and Other Assets
Capital Investment
The value of investments and other assets rose 80.7%,
Capital investment was ¥15.3 billion (US$131 million).
to ¥79.3 billion (US$678 million). Deferred income taxes
Terumo continued to make investments aimed at adding
declined 66.2%, to ¥2.8 billion (US$24 million), but
new value to products, increasing the number of products
investment securities, including affiliated companies, jumped
with improved safety features, raising quality, developing
216.8%, to ¥32.2 billion (US$275 million) on account of the
entirely new products and making operations more efficient.
capital tie-up with Olympus, the purchase of MicroVention
36
and other factors. Another cause behind the large increase
was goodwill and intangibles recognized in acquisitions, up
95.8%, to ¥36.2 billion (US$309 million).
Net Income and ROE
Billion ¥
32.5
27.1
2. Total Liabilities
Total liabilities declined 12.2%, to ¥81.3 billion (US$695
million), improving the debt to equity ratio by 12.4 percentage
18.2
19.8
14.4
points, to 29.7%.
8.2
10.0
10.4
03
04
13.1
13.2
05
06
Total Current Liabilities
Total current liabilities edged down 5.3%, to ¥66.9 billion
02
(US$572 million), mainly due to the repayment short-term
Net Income
ROE (%)
debt.
Total Long-Term Liabilities
Total long-term liabilities at the end of the term were down
34.2%, to ¥14.4 billion (US$123 million), mainly as a result
Total Assets and ROA
Billion ¥
354.6
of a 37.2% decline in accrued employee retirement and
severance benefits, to ¥12.2 billion (US$104 million).
284.7
288.2
293.9
312.5
3. Total Stockholders’ Equity
Total stockholders’ equity grew 24.3% at the end of the
fiscal year, to ¥273.3 billion (US$2,336 million). Retained
earnings rose 17.9%, to ¥183.4 billion (US$1,567 million),
9.0
5.1
6.3
9.7
6.8
capital surplus increased 13.3%, to ¥59.0 billion (US$505
02
million), the other securities valuation difference rose to ¥7.4
billion (US$63 million), treasury stock declined to ¥13.5
03
04
05
06
Total Assets
ROA (%)
billion (US$115 million), and foreign currency translation
adjustments fell to ¥1.7 billion (US$15 million). The equity
ratio improved to 77.1%, up 6.7 percentage points.
Cash Flows
Cash Dividends per Share
¥
The amount of cash and cash equivalents declined by ¥9.6
24.0
billion (US$82 million) in the year to total ¥48.0 billion (US$410
20.0
million) at year-end.
Cash Flow from Operating Activities
16.0
11.0
11.0
02
03
Net cash flow provided by operating activities declined 0.8%,
to ¥43.4 billion (US$371 million).
On the plus side, income before taxes and minority
interests grew 18.2% over the previous year, to ¥51.6
04
05
06
billion (US$441 million); and trade payables increased ¥1.5
billion (US$12 million). On the minus side, trade receivables
37
increased ¥1.8 billion (US$15 million); inventories increased
¥4.9 billion (US$42 million) due to the acquisition of other
businesses; and income taxes paid rose 2.3%, to ¥18.6
Total Stockholders’ Equity and
Stockholders’ Equity Ratio
273.3
Billion ¥
billion (US$159 million).
The interest coverage ratio improved to 151.4 times, from
133.9 times.
219.9
195.1
179.9
184.5
63.2
64.0
66.4
02
03
04
70.4
77.1
Cash Flow from Investing Activities
Net cash flow used in investing activities soared 247.9%, to
¥54.4 billion (US$465 million).
Acquisition of investment securities totaled ¥15.0
billion (US$128 million) as a result of the capital tie-up with
05
06
Total Stockholders’ Equity
Stockholders’ Equity Ratio (%)
Olympus. In addition, acquisition of shares in consolidated
subsidiaries, net of cash acquired, totaled ¥23.5 billion
(US$201 million) as a result of the purchase of MicroVention.
Capital expenditure (purchase of tangible assets) totaled
¥14.2 billion (US$122 million), linked to the purchase of
Free Cash Flow
Billion ¥
equipment for the expansion of the Fujinomiya, Kofu and
29.9
28.1
Philippines plants. In addition, acquisition of intangible
fixed assets totaled ¥1.3 billion (US$11 million), for total
13.1
expenditures in fixed assets of ¥15.5 billion (US$133 million).
5.1
Cash Flow from Financing Activities
Net cash flow provided by financing activities totaled ¥0.4
-11.0
billion (US$3 million). The repayment of debt included a
decrease in short-term bank loans of ¥4.8 billion (US$41
02
03
04
05
06
million) and repayment of long-term debt of ¥5.3 billion
(US$46 million). Proceeds from the sale of treasury stock,
sold in connection with the capital tie-up with Olympus,
totaled ¥15.0 billion (US$128 million). Dividends paid rose
30.8%, to ¥4.4 billion (US$38 million).
Depreciation and Amortization,
Investment in Property, Plant and
Equipment
Billion ¥
14.3
14.7 14.7
14.9
15.6
12.1
15.2 15.3
12.1
10.1
5.6
5.1
6.3
6.8
9.0
02
03
04
05
06
Depreciation and Amortization
Investment in Property, Plant and Equipment
38
Risk Factors
The following factors could affect Terumo’s operating results and financial position.
Changes in Government Health Care Policies
Risks Associated with Overseas Operations
In the health care industry, the Japanese government
Terumo supplies products to more than 150 countries. It
continues to restrain health care costs and implement other
is possible that recessions in the markets Terumo serves,
reforms intended to raise the quality of health care. Large
and a resulting contraction in demand, or the unanticipated
and unforeseen changes in government health care policy
imposition of government regulations in those countries
to which Terumo cannot respond could adversely affect the
could negatively impact the Company’s operating results and
Company’s operating results and financial position.
financial position.
Market Price Fluctuations
Quality Control
As part of its measures to restrain health care costs, the
Terumo manufactures its products based on stringent
Japanese government implements biennial revisions to
quality control principles that are in accordance with good
government reimbursements for drugs, medical treatment,
manufacturing practice (GMP) standards for pharmaceuticals
and medical equipment covered by the national health
and medical equipment and with the ISO quality
insurance scheme. In addition, intense competition could
management system standards.
serve to greatly lower prices and adversely affect the
Company’s operating results and financial position.
However, it is conceivable that the quality of our products
could be questioned if complications occur during the use
of the products. Such occurrences could lead to a decrease
Raw Material Price Fluctuations
in sales or rise in costs, which would adversely affect the
Many of the raw materials Terumo uses for product
Company’s operating results and financial position.
manufacture are plastics and other materials derived from
petrochemicals. A steep rise in the price of petrochemicals
Legal Proceedings
could increase the raw materials costs and adversely affect
Terumo faces the risk of being involved in lawsuits, disputes,
the Company’s operating results and financial position.
and other types of legal proceedings both in Japan and
overseas. The Company strives to minimize legal risks
Exchange Rate Fluctuations
through such measures as continuous research efforts
Because Terumo’s headquarters is located in Japan, all
on the part of the Legal, Intellectual Property, and other
financial accounts of overseas subsidiaries are converted
departments and a system of internal checks. Reports
from local currencies into Japanese yen for the preparation
on the risk management structure are provided to the
of consolidated financial statements and other purposes.
Board of Directors and the Board of Corporate Auditors
Exchange rate fluctuations therefore influence the conversion
as needed. However, if the Company were sued by a third
of those accounts into yen and result in either a gain or a
party for damages or an injunction against sales or any other
loss for the Company.
major legal action were taken, it could adversely affect the
We are coping with these fluctuations with structural
Company’s operating results and financial position.
methods such as transferring production to overseas
factories and importing raw materials, along with the
Other Risks
utilization of contracts to hedge against exchange rate
Other factors that could negatively impact Terumo’s operating
volatility for trade receivables.
results and financial position include changes in trade
However, it is possible that unexpected exchange rate
practices, terrorism, war, epidemics, and other disasters.
fluctuations could negatively impact the Company’s operating
results and financial position.
39
Consolidated Balance Sheets
Terumo Corporation and subsidiaries
March 31, 2006 and 2005
ASSETS
Thousands of
U.S. dollars
(Note 2)
Millions of yen
2006
2005
¥ 47,964
¥ 57,558
Notes . . . . . . . . . . . . . . . . . . . . . . . . . . . . . . . . . . . . . . . . . . . . .
4,140
4,333
35,384
Accounts . . . . . . . . . . . . . . . . . . . . . . . . . . . . . . . . . . . . . . . . . .
59,801
56,477
511,120
63,941
60,810
546,504
Less allowance for doubtful receivables . . . . . . . . . . . . . . . . . . . . . .
(916)
(988)
(7,829)
Net trade receivables . . . . . . . . . . . . . . . . . . . . . . . . . . . . . .
63,025
59,822
538,675
Inventories (Note 4) . . . . . . . . . . . . . . . . . . . . . . . . . . . . . . . . . . . . .
40,941
34,781
349,923
Deferred income taxes-current (Note 8) . . . . . . . . . . . . . . . . . . . . . .
8,605
5,956
73,547
Other current assets (Note 18) . . . . . . . . . . . . . . . . . . . . . . . . . . . . .
4,952
3,387
42,325
Total current assets . . . . . . . . . . . . . . . . . . . . . . . . . . . . . . .
165,487
161,504
1,414,419
Land (Note 11). . . . . . . . . . . . . . . . . . . . . . . . . . . . . . . . . . . . . . . . .
20,385
21,802
174,231
Buildings (Note 11). . . . . . . . . . . . . . . . . . . . . . . . . . . . . . . . . . . . . .
104,518
100,587
893,316
Machinery and equipment . . . . . . . . . . . . . . . . . . . . . . . . . . . . . . . .
160,328
149,948
1,370,325
Construction in progress . . . . . . . . . . . . . . . . . . . . . . . . . . . . . . . . .
10,698
7,406
91,436
295,929
279,743
2,529,308
Less accumulated depreciation . . . . . . . . . . . . . . . . . . . . . . . . . . . .
(186,091)
(172,700)
(1,590,522)
Net property, plant and equipment . . . . . . . . . . . . . . . . . . . .
109,838
107,043
938,786
Investment securities, including affiliated companies (Note 5). . . . . . . .
32,162
10,152
274,889
Goodwill and intangibles recognized in acquisitions (Note 3) . . . . . .
36,182
18,477
309,248
Deferred income taxes-noncurrent (Note 8) . . . . . . . . . . . . . . . . . . .
2,830
8,380
24,188
Other assets . . . . . . . . . . . . . . . . . . . . . . . . . . . . . . . . . . . . . . . . . .
8,149
6,900
69,649
Total investments and other assets . . . . . . . . . . . . . . . . . . . .
79,323
43,909
677,974
¥ 354,648
¥ 312,456
$ 3,031,179
2006
Current assets:
Cash and cash equivalents . . . . . . . . . . . . . . . . . . . . . . . . . . . . . . .
$
409,949
Trade receivables: . . . . . . . . . . . . . . . . . . . . . . . . . . . . . . . . . . . . . .
Property, plant and equipment:
Investments and other assets:
See accompanying notes to consolidated financial statements.
40
Thousands of
U.S. dollars
(Note 2)
Millions of yen
LIABILITIES AND STOCKHOLDERS’ EQUITY
2005
2006
2006
Current liabilities:
Short-term bank loans (Note 6) . . . . . . . . . . . . . . . . . . . . . . . . . . . .
Current installments of long-term debt (Note 6) . . . . . . . . . . . . . . . .
¥
3,975
¥
8,539
$
33,975
–
5,322
–
Notes . . . . . . . . . . . . . . . . . . . . . . . . . . . . . . . . . . . . . . . . . . . . .
1,750
1,733
14,957
Accounts . . . . . . . . . . . . . . . . . . . . . . . . . . . . . . . . . . . . . . . . . .
22,108
20,078
188,957
Total trade payables . . . . . . . . . . . . . . . . . . . . . . . . . . . . . . .
23,858
21,811
203,914
Accrued income taxes (Note 8) . . . . . . . . . . . . . . . . . . . . . . . . . . . .
11,398
10,414
97,419
Accrued expenses . . . . . . . . . . . . . . . . . . . . . . . . . . . . . . . . . . . . . .
12,137
11,349
103,735
Other current liabilities (Note 18). . . . . . . . . . . . . . . . . . . . . . . . . . . .
15,508
13,218
132,547
Total current liabilities . . . . . . . . . . . . . . . . . . . . . . . . . . . . . .
66,876
70,653
571,590
Retirement and severance benefits (Note 7) . . . . . . . . . . . . . . . . . . .
12,172
19,386
104,034
Other long-term liabilities (Note 8) . . . . . . . . . . . . . . . . . . . . . . . . . .
2,241
2,511
19,154
Total long-term liabilities . . . . . . . . . . . . . . . . . . . . . . . . . . . .
14,413
21,897
123,188
Total liabilities . . . . . . . . . . . . . . . . . . . . . . . . . . . . . . . . . . . .
81,289
92,550
694,778
Minority interests. . . . . . . . . . . . . . . . . . . . . . . . . . . . . . . . . . . . . . . . .
50
33
427
2005: issued 210,876,260 shares in 2006 and 2005 (Note 12) . . .
38,716
38,716
330,906
Capital surplus (Note 13) . . . . . . . . . . . . . . . . . . . . . . . . . . . . . . . . .
59,031
52,104
504,538
Retained earnings (Note 13). . . . . . . . . . . . . . . . . . . . . . . . . . . . . . .
183,392
155,502
1,567,453
Other securities valuation difference . . . . . . . . . . . . . . . . . . . . . . . . .
7,367
1,876
62,966
Translation adjustments . . . . . . . . . . . . . . . . . . . . . . . . . . . . . . . . . .
(1,747)
(6,832)
(14,931)
286,759
241,366
2,450,932
(13,450)
(21,493)
(114,958)
273,309
219,873
2,335,974
¥354,648
¥ 312,456
$ 3,031,179
Trade payables (Note 18):
Long-term liabilities:
Stockholders’ equity:
Common stock,
Authorized 840,000,000 shares in 2006 and 500,000,000 shares in
Less treasury stock, at cost (Note 12) . . . . . . . . . . . . . . . . . . . . . . .
Total stockholders’ equity . . . . . . . . . . . . . . . . . . . . . . . . . .
Contingencies (Note 16)
41
Consolidated Statements of Income
Terumo Corporation and subsidiaries
Years ended March 31, 2006, 2005 and 2004
Thousands of
U.S. dollars
(Note 2)
Millions of yen
2006
2006
2004
2005
Net sales . . . . . . . . . . . . . . . . . . . . . . . . . . . . . . . . . . . . . . . . .
¥ 247,049
¥ 230,003
¥ 215,196
$ 2,111,530
Cost of sales (Note 18) . . . . . . . . . . . . . . . . . . . . . . . . . . . . . .
Gross profit . . . . . . . . . . . . . . . . . . . . . . . . . . . . . . . . . .
111,378
135,671
106,238
123,765
104,903
110,293
951,949
1,159,581
Selling, general and administrative expenses
(Notes 9, 10 and 18) . . . . . . . . . . . . . . . . . . . . . . . . . . . . . . .
Operating income. . . . . . . . . . . . . . . . . . . . . . . . . . . . . .
87,419
48,252
76,657
47,108
73,640
36,653
747,171
412,410
539
(286)
837
80
178
(662)
–
(6)
(575)
349
(326)
286
19
188
(229)
–
(10)
–
213
(357)
(854)
78
211
(641)
20
(2)
(1,164)
4,607
(2,444)
7,154
684
1,521
(5,658)
–
(51)
(4,915)
4,967
156
–
–
–
–
42,453
1,333
(474)
71
–
–
3
(2,180)
–
295
–
(4,051)
607
–
(593)
(1,435)
–
(5,069)
–
(895)
3,337
538
(657)
(3,454)
–
(709)
(2,910)
–
(7,650)
28,521
51,589
43,654
33,743
440,931
20,198
(1,080)
19,118
14
¥ 32,457
17,372
(858)
16,514
5
¥ 27,135
12,509
1,473
13,982
(31)
¥ 19,792
172,632
(9,231)
163,401
120
277,410
Other income (expense):
Interest and dividend income . . . . . . . . . . . . . . . . . . . . . . . .
Interest expense . . . . . . . . . . . . . . . . . . . . . . . . . . . . . . . . .
Exchange gain (loss) . . . . . . . . . . . . . . . . . . . . . . . . . . . . . .
Royalty income . . . . . . . . . . . . . . . . . . . . . . . . . . . . . . . . . .
Equity in profit of affiliated companies . . . . . . . . . . . . . . . . .
Loss on disposal of property, plant and equipment . . . . . . .
Gain (loss) on sales of investment securities. . . . . . . . . . . . .
Loss on sales and impairment of golf memberships . . . . . . .
Loss on restructuring in overseas operation . . . . . . . . . . . . .
Gain on contribution of securities to retirement
benefit trust (Notes 5 and 7). . . . . . . . . . . . . . . . . . . . . . .
Gain on sales of trade receivables written off . . . . . . . . . . . .
Expense relating to acquisition of newly
consolidated subsidiary. . . . . . . . . . . . . . . . . . . . . . . . . . .
Gain on sales of property, plant and equipment . . . . . . . . . .
Write-down of goodwill (Note 3) . . . . . . . . . . . . . . . . . . . . . .
Impairment loss on property, plant and equipment
(Note 11). . . . . . . . . . . . . . . . . . . . . . . . . . . . . . . . . . . . . .
Gain on reversal of loss on restructuring in overseas
operation . . . . . . . . . . . . . . . . . . . . . . . . . . . . . . . . . . . . .
Other, net (Note 18) . . . . . . . . . . . . . . . . . . . . . . . . . . . . . .
Income before income taxes and minority interests . . . .
Income taxes (Note 8):
Current . . . . . . . . . . . . . . . . . . . . . . . . . . . . . . . . . . . . . . . .
Deferred. . . . . . . . . . . . . . . . . . . . . . . . . . . . . . . . . . . . . . . .
Minority interests. . . . . . . . . . . . . . . . . . . . . . . . . . . . . . . . . . .
Net income. . . . . . . . . . . . . . . . . . . . . . . . . . . . . . . .
Yen
$
U.S. dollars (Note 2)
Net income per common share:
Basic . . . . . . . . . . . . . . . . . . . . . . . . . . . . . . . . . . . . . . .
¥ 160.45
¥136.03
¥98.45
$ 1.37
Cash dividends per common share . . . . . . . . . . . . . . . . . . . .
24.00
20.00
16.00
0.21
See accompanying notes to consolidated financial statements.
42
Consolidated Statements of Stockholders’ Equity
Terumo Corporation and subsidiaries
Years ended March 31, 2006, 2005 and 2004
Thousands of
U.S. dollars
( Note 2)
Millions of yen
2006
2005
2004
2006
Common stock:
Balance at beginning of period . . . . . . . . . . . . . . . .
¥ 38,716
¥ 38,716
¥ 38,716
$ 330,906
Balance at end of period . . . . . . . . . . . . . . . . . . . .
38,716
38,716
38,716
330,906
Balance at beginning of period . . . . . . . . . . . . . . . .
52,104
52,104
52,104
445,333
Increase (decrease) during period. . . . . . . . . . . . . .
6,927
–
–
59,205
Balance at end of period . . . . . . . . . . . . . . . . . . . .
59,031
52,104
52,104
504,538
Balance at beginning of period . . . . . . . . . . . . . . . .
155,502
131,880
114,740
1,329,077
Net income . . . . . . . . . . . . . . . . . . . . . . . . . . . . . .
32,457
27,135
19,792
277,410
Dividends paid . . . . . . . . . . . . . . . . . . . . . . . . . . . .
(4,410)
(3,372)
(2,505)
(37,692)
Officers’ bonuses . . . . . . . . . . . . . . . . . . . . . . . . . .
(157)
(141)
(147)
(1,342)
Balance at end of period . . . . . . . . . . . . . . . . . . . .
183,392
155,502
131,880
1,567,453
Balance at beginning of period . . . . . . . . . . . . . . . .
1,876
1,963
(642)
16,034
Increase (decrease) during period. . . . . . . . . . . . . .
5,491
(87)
2,605
46,932
Balance at end of period . . . . . . . . . . . . . . . . . . . .
7,367
1,876
1,963
62,966
Balance at beginning of period . . . . . . . . . . . . . . . .
(6,832)
(8,243)
(4,001)
(58,393)
Adjustments for period . . . . . . . . . . . . . . . . . . . . . .
5,085
1,411
(4,242)
43,462
Balance at end of period . . . . . . . . . . . . . . . . . . . .
(1,747)
(6,832)
(8,243)
(14,931)
Balance at beginning of period . . . . . . . . . . . . . . . .
(21,493)
(21,345)
(16,453)
(183,701)
Decrease (increase) during period . . . . . . . . . . . . .
8,043
(148)
(4,892)
68,743
Balance at end of period . . . . . . . . . . . . . . . . . . . .
(13,450)
(21,493)
(21,345)
(114,958)
Total stockholders’ equity . . . . . . . . . . . . . . . . .
¥ 273,309
¥ 219,873
¥ 195,075
$ 2,335,974
Capital surplus:
Retained earnings:
Other securities valuation difference:
Translation adjustments:
Treasury stock:
See accompanying notes to consolidated financial statements.
43
Consolidated Statements of Cash Flows
Terumo Corporation and subsidiaries
Years ended March 31, 2006, 2005 and 2004
Thousands of
U.S. dollars
(Note 2)
Millions of yen
2006
2005
2004
2006
¥ 51,589
¥43,654
¥ 33,743
$ 440,931
15,181
–
593
15,581
2,180
1,435
14,881
–
–
129,752
–
5,069
591
(178)
(539)
286
6
(7,215)
226
(188)
(349)
326
10
(200)
346
(211)
(213)
357
2
2,806
5,051
(1,521)
(4,607)
2,444
51
(61,667)
474
–
–
4,051
(4,967)
7,110
(1,753)
(4,924)
1,461
(157)
3,897
61,455
788
(293)
(18,570)
43,380
–
–
(1,783)
(635)
239
(141)
1,317
61,672
534
(327)
(18,154)
43,725
–
–
(1,992)
370
1,824
(147)
1,446
53,212
395
(361)
(11,749)
41,497
(42,453)
60,769
(14,983)
(42,085)
12,487
(1,342)
33,309
525,256
6,735
(2,504)
(158,718)
370,769
(14,248)
987
(1,278)
(15,000)
(919)
(10,998)
4
(1,823)
(102)
(956)
(11,456)
797
(1,056)
(13)
–
(121,778)
8,436
(10,923)
(128,205)
(7,855)
(23,461)
(474)
2
(54,391)
(1,761)
–
–
(15,636)
(49)
–
138
(11,639)
(200,521)
(4,051)
17
(464,880)
Cash flow from financing activities:
Increase (decrease) in short-term bank loans . . . . . . . . . . . . . . . . . . .
Repayment of long-term debt . . . . . . . . . . . . . . . . . . . . . . . . . . . . . .
Payment for acquisition of treasury stock . . . . . . . . . . . . . . . . . . . . . .
Proceeds from sale of treasury stock . . . . . . . . . . . . . . . . . . . . . . . . .
Dividends paid . . . . . . . . . . . . . . . . . . . . . . . . . . . . . . . . . . . . . . . . . .
Net cash flow provided by (used in) financing activities . . . . . .
(4,848)
(5,340)
(29)
14,998
(4,410)
371
(7,963)
(860)
(148)
–
(3,372)
(12,343)
(11,311)
(508)
(4,892)
–
(2,505)
(19,216)
(41,436)
(45,641)
(248)
128,188
(37,692)
3,171
Effect of exchange rate changes on cash and cash equivalents . . . .
Net increase (decrease) in cash and cash equivalents . . . . . . . . . . . .
Cash and cash equivalents at beginning of the year. . . . . . . . . . . . . .
Cash and cash equivalents at end of the year. . . . . . . . . . . . . . . . . . .
1,046
(9,594)
57,558
¥ 47,964
279
16,025
41,533
¥57,558
(723)
9,919
31,614
¥ 41,533
8,940
(82,000)
491,949
$ 409,949
Cash flow from operating activities:
Income before income taxes and minority interests . . . . . . . . . . . . . .
Adjustments to reconcile income before income taxes and minority
interests to net cash flow provided by operating activities:
Depreciation and amortization . . . . . . . . . . . . . . . . . . . . . . . . . . .
Write-down of goodwill. . . . . . . . . . . . . . . . . . . . . . . . . . . . . . . . .
Impairment loss on property, plant and equipment (Note 11) . . . .
Loss (gain) on sales and disposal of property, plant
and equipment, net . . . . . . . . . . . . . . . . . . . . . . . . . . . . . . . . . .
Equity in profit of affiliated companies. . . . . . . . . . . . . . . . . . . . . .
Interest and dividend income . . . . . . . . . . . . . . . . . . . . . . . . . . . .
Interest expense. . . . . . . . . . . . . . . . . . . . . . . . . . . . . . . . . . . . . .
Loss on sales and impairment of golf memberships . . . . . . . . . . .
Increase (decrease) in retirement and severance benefits . . . . . . .
Expense relating to acquisition of newly consolidated
subsidiary. . . . . . . . . . . . . . . . . . . . . . . . . . . . . . . . . . . . . . . . . .
Gain on contribution of securities to retirement benefit trust
(Notes 5 and 7) . . . . . . . . . . . . . . . . . . . . . . . . . . . . . . . . . . . . .
Transfer of securities to retirement benefit trust (Notes 5 and 7) . . .
Decrease (increase) in trade receivables . . . . . . . . . . . . . . . . . . . .
Decrease (increase) in inventories. . . . . . . . . . . . . . . . . . . . . . . . .
Increase (decrease) in trade payables. . . . . . . . . . . . . . . . . . . . . .
Officers’ bonuses . . . . . . . . . . . . . . . . . . . . . . . . . . . . . . . . . . . . .
Other, net . . . . . . . . . . . . . . . . . . . . . . . . . . . . . . . . . . . . . . . . . . .
Subtotal . . . . . . . . . . . . . . . . . . . . . . . . . . . . . . . . . . . . . . . . .
Interest and dividend received . . . . . . . . . . . . . . . . . . . . . . . . . . .
Interest paid . . . . . . . . . . . . . . . . . . . . . . . . . . . . . . . . . . . . . . . . .
Income taxes paid . . . . . . . . . . . . . . . . . . . . . . . . . . . . . . . . . . . .
Net cash flow provided by operating activities . . . . . . . . . . . .
Cash flow from investing activities:
Capital expenditure . . . . . . . . . . . . . . . . . . . . . . . . . . . . . . . . . . . . . .
Proceeds from sales of property, plant and equipment. . . . . . . . . . . .
Acquisition of intangible fixed assets . . . . . . . . . . . . . . . . . . . . . . . . .
Acquisition of investment securities . . . . . . . . . . . . . . . . . . . . . . . . . .
Acquisition of business (Note 3) . . . . . . . . . . . . . . . . . . . . . . . . . . . . .
Acquisition of shares in consolidated subsidiaries
net of cash acquired (Note 3) . . . . . . . . . . . . . . . . . . . . . . . . . . . . . .
Expense relating to acquisition of newly consolidated subsidiary . . . .
Other, net. . . . . . . . . . . . . . . . . . . . . . . . . . . . . . . . . . . . . . . . . . . . . .
Net cash flow used in investing activities. . . . . . . . . . . . . . . . .
See accompanying notes to consolidated financial statements.
44
Notes to Consolidated Financial Statements
Terumo Corporation and subsidiaries
1. Summary of Significant Accounting Policies
(a) Basis of Presenting Consolidated Financial Statements
Terumo Corporation (the “Company”) and its consolidated domestic
subsidiaries maintain their official accounting records in Japanese
yen and in accordance with the provisions set forth in the Japanese
Securities and Exchange Law and its related accounting regulations,
and in conformity with accounting principles generally accepted in
Japan (“Japanese GAAP”), which are different in certain respects as
to application and disclosure requirements of International Financial
Reporting Standards. The accounts of overseas subsidiaries are
based on their accounting records maintained in conformity with
generally accepted accounting principles and practices prevailing in
the respective countries of domicile.
The accompanying consolidated financial statements have been
reformatted and translated into English (with some expanded descriptions and the inclusion of consolidated statements of stockholders’
equity) from the consolidated financial statements of the Company
prepared in accordance with Japanese GAAP and filed with the appropriate Local Finance Bureau of the Ministry of Finance as required
by the Securities and Exchange Law. Some supplementary information included in the statutory Japanese language consolidated financial statements, but not required for fair presentation, is not presented
in the accompanying consolidated financial statements.
(b) Principles of Consolidation
The consolidated financial statements include the accounts of the
Company and its subsidiaries, except for an immaterial subsidiary.
All significant intercompany balances and transactions have been
eliminated in consolidation. Investments in 20% to 50% affiliates
and the immaterial subsidiary not consolidated are stated at their
underlying net equity value.
(c) Foreign Currency Translation
All short-term and long-term receivables and payables denominated
in foreign currencies are translated into Japanese yen at the exchange rates at the balance sheet date. The foreign exchange gains
and losses from transactions are recognized in the accompanying
consolidated statements of income to the extent that they are not
hedged by foreign exchange derivatives.
The balance sheet accounts of the consolidated foreign subsidiaries
are translated into Japanese yen at exchange rates as of the balance
sheet date except for stockholders’ equity, which is translated at historical rates. Differences arising from such transactions are shown as
“Translation adjustments” in a separate component of stockholders’
equity.
Revenue and expense accounts of the consolidated foreign subsidiaries are translated into Japanese yen at an annual average exchange rate.
(e) Investments
The accounting standard for financial instruments requires the
Company to classify its securities into one of the following three
categories: trading, held-to-maturity or other securities. Based on
the classification, all securities are classified as other securities and
included in investment securities.
To comply with the accounting standard for financial instruments,
other securities with a market value are principally carried at market
value. The difference, net of tax, between the acquisition cost and the
carrying value of other securities, including unrealized gains and losses, is recognized in “Other securities valuation difference” in a separate
component of stockholders’ equity. Other securities without a market
value are principally carried at cost. The cost of other securities sold is
principally computed based on the moving average method.
(f) Inventories
Inventories are stated at cost, determined principally by the average
method, and stated at lower of cost or market value for overseas
subsidiaries.
(g) Property, Plant and Equipment
Property, plant and equipment are stated at cost. Routine
maintenance and repairs and minor replacement costs are charged
to expenses as incurred. Depreciation is computed principally by the
declining-balance method based on the following estimated useful
lives.
Buildings .................................. 5-50 years
Machinery and equipment ........ 3-20 years
However, buildings acquired by the Company on or after April 1,
1998 are depreciated by the straight-line method.
(h) Impairment of Long-Lived Assets
On August 9, 2002, the Business Council of Japan issued new
accounting standard entitled “Statement of Opinion on the
Establishment of Accounting Standards for Impairment of Fixed
Assets”. Further, on October 31, 2003, the Accounting Standards
Board of Japan issued Financial Accounting Standards Implementation
Guidance No. 6 - “Application Guidance on Accounting Standards
for Impairment of Fixed Assets”. Effective April 1, 2004, the Company
and consolidated domestic subsidiaries have elected to early adopt
these new accounting standards for impairment of fixed assets. As
a result of adopting the new accounting standards, property, plant
and equipment at March 31, 2005 decreased by ¥1,435 million and
income before income taxes and minority interests for the year ended
March 31, 2005 decreased by the same amount, as compared with
the amount which would have been reported if the previous standards
had been applied consistently.
(d) Cash and Cash Equivalents
The Company considers cash and time deposits, which may be withdrawn on demand without diminution of principal and with original
maturities of three months or less, to be cash and cash equivalents.
45
(i) Goodwill and Intangibles Recognized in Acquisitions
Goodwill, which represents the excess cost over the book value
of the net assets acquired at acquisition dates of investments in
subsidiaries, is principally amortized on a straight-line basis over
5 or 20 years which is the expected period to be benefited.
All amount of goodwill recognized at acquisition of Mission
Medical INC. on February 25, 2005, which was allocable to a
research and development project of high-technology medical
devices, was charged to income for the year ended March 31,
2005, since realizabilitity of its benefits is not certain. (See Note 3.)
A portion of assets relating to in-process research and development expense, which was recognized at acquisition of Micro Vention INC. on March 28, 2006, was charged into selling, general and
administrative expense.
(j) Income Taxes
Income taxes are accounted for under the asset and liability method.
Deferred tax assets and liabilities are recognized for the future tax
consequences attributable to differences between the financial statement carrying amounts of existing assets and liabilities and their
respective tax bases and operating loss and tax credit carryforwards.
Deferred tax assets and liabilities are measured using enacted tax
rates expected to apply to taxable income in the years in which those
temporary differences are expected to be recovered or settled. The
effect on deferred tax assets and liabilities of a change in tax rates is
recognized in income in the period that includes the enactment date.
(See Note 8.)
In accordance with Practical Guidance Report No.12, “Treatment of
the Pro Forma Standard Tax Portion of Corporate Tax in the Statements
of Income”, announced by the Accounting Standards Board of Japan
on February 13, 2004, the amount of ¥64 million and ¥405 million levied
in proportion to added value and capital as enterprise taxes were treated
as a part of selling, general and administrative expenses and as a part of
cost of sales, respectively, for the year ended March 31, 2005.
(k) Retirement and Severance Benefits
The Company and certain of its subsidiaries have contributory and noncontributory defined benefit plans that provide for pension or lump-sum
benefit payments, based on length of service and certain other factors,
to employees who retire or terminate their employment for reasons
other than dismissal for cause. The allowance for retirement benefits
for employees is provided based on the estimated retirement benefit
obligation and the fair value of the plan assets. The contributory plan
included a portion of the governmental welfare pension benefits which
would otherwise be provided by the Japanese government in accordance with the Welfare Pension Insurance Law in Japan. Management
considered that a portion of the contributory plan, which was administered by the board of trustees composed of management and labor
representatives, represented a welfare pension plan carried on behalf
of the Japanese government. These contributory and noncontributory
plans were funded in conformity with the funding requirements of
applicable Japanese governmental regulations.
The Company transferred certain marketable securities worth ¥7,110
million ($60,769 thousand) to an employee retirement benefit trust during
the year ended March 31, 2006. Gain on the contribution of securities to
retirement benefit trust was ¥4,967 million ($42,453 thousand).
Directors and certain employees are not covered by the plans described above. Benefits paid to such persons and meritorious service
awards paid to certain other employees in excess of the prescribed
formula are charged to income as paid, since amounts vary with circumstances, and it is not practicable to compute the liability for future
payments.
(l) Leases
Financial leases of the Company and its domestic subsidiaries, except for those where the legal title of the underlying property is transferred from the lessor to the lessee at the end of the lease term, are
accounted for as operating leases.
(m) Derivatives
The Company and its subsidiaries do not hold derivative financial instruments for trading purposes. Derivative financial instruments held
by the Company and its subsidiaries are foreign exchange contracts
to manage currency risk.
Derivatives are, in principle, stated at market value.
The Company has developed a hedging policy to control various
aspects of derivative transactions, including authorization levels and
transaction volumes. Based on this policy, the Company hedges,
within certain scopes, risks arising from changes in foreign currency
exchange rates. The Company reviews, every six months, the effectiveness of all hedging policies to take account of the cumulative cash
flows and any changes in the market.
(n) Appropriation of Retained Earnings
Under the Commercial Code of Japan, the appropriation of retained
earnings with respect to a given financial period is made by resolution of
the stockholders at a general meeting held subsequent to the close of
such financial period. The accounts for that period do not, therefore,
reflect such appropriation. (See Note 13.)
(o) Net Income and Cash Dividends per Common Share
Net income per share is computed by dividing net income available to
common stockholders by the weighted-average number of common
shares outstanding during the year. (See Note 13.)
Diluted net income per share for the years ended March 31, 2006,
2005 and 2004 is not presented since the Company had no securities
with dilutive effect to net income per share.
Cash dividends per share are computed based on dividends
declared with respect to income for the year.
(p) Research and Development Costs
Research and development costs are charged to income when
incurred.
2. Financial Statement Translation
The translations of the Japanese yen amounts into U.S. dollars are
included solely for the convenience of readers outside Japan, using
the prevailing exchange rate at March 31, 2006, which was ¥117 to
46
U.S. $1. Such translations should not be construed as representations
that the Japanese yen amounts have been, could have been, or could
be, converted into U.S. dollars at this or any other rate of exchange.
3. Acquisition
On March 28, 2006, the Company acquired 100% of outstanding
shares of MicroVention INC. and its subsidiaries. The acquisition was
accounted for as a purchase transaction, a portion of assets relating
to in-process research and development expense was charged into
selling, general and administrative expense for the year ended March
31, 2006.
On February 25, 2005, the Company acquired additional shares
of Mission Medical INC., and, as a result, Mission Medical INC. has
become a wholly owned subsidiary of the Company. The acquisition was accounted for as a purchase transaction. The excess of
the purchase price over the book value of the net assets acquired is
recorded as goodwill. All amount of goodwill, which was allocable
to a research and development project of high-technology medical
devices, was charged to income for the year ended March 31, 2005.
In the year ended March 31, 2004, the Company acquired 53% of
the interest of Changchun Terumo Medical Products Co., Ltd., which
has become a wholly owned subsidiary of the Company.
The excess of the purchase price over the book value of the net
assets acquired is recorded as goodwill and is principally being
amortized over 20 years.
Details of assets and liabilities of the newly consolidated subsidiaries for the years ended March 31, 2006, 2005 and 2004 are as follows:
Thousands of
U.S. dollars (Note 2)
Millions of yen
Current assets . . . . . . . . . . . . . . . . . . . . . . . . . . . . . . . . . . . . . . . . .
Property, plant and equipment. . . . . . . . . . . . . . . . . . . . . . . . . . . . .
Current liabilities . . . . . . . . . . . . . . . . . . . . . . . . . . . . . . . . . . . . . . .
Long-term liabilities . . . . . . . . . . . . . . . . . . . . . . . . . . . . . . . . . . . . .
Goodwill . . . . . . . . . . . . . . . . . . . . . . . . . . . . . . . . . . . . . . . . . . . . .
Purchase cost of the subsidiary . . . . . . . . . . . . . . . . . . . . . . . . . . . .
Cash and cash equivalents of the subsidiary . . . . . . . . . . . . . . . . . .
Cash outflow for the purchase of the subsidiary. . . . . . . . . . . . . . . .
2006
2005
2004
2006
¥ 1,648
4,676
(945)
–
18,746
24,125
(664)
¥23,461
¥ 167
11
(63)
(398)
2,180
1,897
(136)
¥ 1,761
¥ 255
146
(145)
–
(129)
127
(78)
¥ 49
$ 14,085
39,966
(8,077)
–
160,222
206,196
(5,675)
$ 200,521
On November 1, 2005 and January 26, 2005, the Company made acquisitions of businesses. These acquisitions were accounted for as
purchase transactions. The excess of the purchase price over the book value of the net assets acquired are recorded as goodwill and are
principally amortized over 5 years.
Detail of assets and liabilities of the businesses acquired for the years ended March 31, 2006, 2005 and 2004 are as follows:
Thousands of
U.S. dollars (Note 2)
Millions of yen
2005
2006
Property, plant and equipment. . . . . . . . . . . . . . . . . . . . . . . . . . . . .
Goodwill . . . . . . . . . . . . . . . . . . . . . . . . . . . . . . . . . . . . . . . . . . . . .
Others . . . . . . . . . . . . . . . . . . . . . . . . . . . . . . . . . . . . . . . . . . . . . . .
Total assets . . . . . . . . . . . . . . . . . . . . . . . . . . . . . . . . . . . . . . . . . . .
Accounts payable . . . . . . . . . . . . . . . . . . . . . . . . . . . . . . . . . . . . . .
Cash outflow for the purchase of the business . . . . . . . . . . . . . . . .
¥
–
221
19
240
–
¥240
¥ 87
1,611
45
1,743
(787)
¥ 956
2004
¥
¥
–
–
–
–
–
–
2006
$
–
1,889
162
2,051
–
$ 2,051
4. Inventories
Inventories at March 31, 2006 and 2005 are summarized as follows:
Thousands of
U.S. dollars (Note 2)
Millions of yen
Finished goods and merchandise . . . . . . . . . . . . . . . . . . . . . . . . . . . . . . . . . . . . . .
Work in process . . . . . . . . . . . . . . . . . . . . . . . . . . . . . . . . . . . . . . . . . . . . . . . . . . .
Raw materials and supplies . . . . . . . . . . . . . . . . . . . . . . . . . . . . . . . . . . . . . . . . . . .
2006
2005
2006
¥ 25,376
4,298
11,267
¥ 40,941
¥ 20,832
4,108
9,841
¥ 34,781
$ 216,889
36,735
96,299
$ 349,923
47
5. Investment Securities
Investment securities at March 31, 2006 and 2005 consist of other securities.
The original cost, carrying amount (market value) and gross unrealized holding gain (loss) for marketable other securities are summarized
as follows:
Millions of yen
Original cost
2006:
Other securities:
Equity securities. . . . . . . . . . . . . . . . . . . . . . . . . . . . . . . . . . . . . . .
Others . . . . . . . . . . . . . . . . . . . . . . . . . . . . . . . . . . . . . . . . . . . . . .
2005:
Other securities:
Equity securities. . . . . . . . . . . . . . . . . . . . . . . . . . . . . . . . . . . . . . .
Others . . . . . . . . . . . . . . . . . . . . . . . . . . . . . . . . . . . . . . . . . . . . . .
Gross unrealized
holding gain
Gross unrealized
holding loss
Carrying amount
(market value)
¥ 17,796
100
¥ 17,896
¥12,347
–
¥12,347
¥ (7)
–
¥ (7)
¥ 30,136
100
¥ 30,236
¥ 4,939
100
¥ 5,039
¥ 3,148
–
¥ 3,148
¥ (5)
–
¥ (5)
¥ 8,082
100
¥ 8,182
Thousands of U.S. dollars (Note 2)
2006:
Other securities:
Equity securities. . . . . . . . . . . . . . . . . . . . . . . . . . . . . . . . . . . . . . .
Others . . . . . . . . . . . . . . . . . . . . . . . . . . . . . . . . . . . . . . . . . . . . . .
Original cost
Gross unrealized
holding gain
Gross unrealized
holding loss
Carrying amount
(market value)
$ 152,102
855
$ 152,957
$ 105,530
–
$ 105,530
$ (60)
–
$ (60)
$ 257,572
855
$ 258,427
Proceeds from the sale of other securities during the years ended March 31, 2006 and 2004 were ¥2 million ($17 thousand) and ¥138 million
respectively. There was no sale of other securities during the year ended March 31, 2005.
Realized gains and losses from the sale of other securities during the year ended March 31, 2004 was ¥20 million gain. No gain nor loss
occured from the sale of other securities during the years ended March 31, 2006 and 2005.
The Company transferred certain marketable securities worth ¥7,110 million ($60,769 thousand) to an employee retirement benefit trust
during the year ended March 31, 2006. Gain on the contribution of securities to retirement benefit trust was ¥4,967 million ($42,453 thousand).
The carrying amount of significant non-marketable securities is as follows:
Thousands of
U.S. dollars (Note 2)
Millions of yen
Other securities:
Unlisted stocks (excluding stocks traded in OTC market) . . . . . . . . . . . . . . . . . . . . . .
2006
2005
2006
¥1,573
¥1,575
$13,444
Among other securities, scheduled redemption amount of bonds intended to be held to maturity and of instruments that have maturities are
as follows:
Millions of yen
Within one year
2006:
Other securities . . . . . . . . . . . . . . . . . . . . . . . . . . . . . . . . . . . . . . . . . . . . . . . . . . . . .
¥
2005:
Other securities . . . . . . . . . . . . . . . . . . . . . . . . . . . . . . . . . . . . . . . . . . . . . . . . . . . . .
One to five years
–
¥100
–
–
Over five years
¥
–
¥100
Thousands of U.S. dollars (Note 2)
Within one year
2006:
Other securities . . . . . . . . . . . . . . . . . . . . . . . . . . . . . . . . . . . . . . . . . . . . . . . . . . . . .
48
$
–
One to five years
$855
Over five years
$
–
6. Short-Term and Long-Term Debt
Long-term debt at March 31, 2006 and 2005 is summarized as follows:
Thousands of
U.S. dollars (Note 2)
Millions of yen
2005
2006
Unsecured loans, principally from banks:
Second series, due 2005-2006, interest rate of 4.54% . . . . . . . . . . . . . . . . . . . . . . .
Third series, due in 2005, interest rate of 0.395% . . . . . . . . . . . . . . . . . . . . . . . . . . .
Total long-term debt . . . . . . . . . . . . . . . . . . . . . . . . . . . . . . . . . . . . . . . . . . . . . . . .
Less current installments . . . . . . . . . . . . . . . . . . . . . . . . . . . . . . . . . . . . . . . . . . . .
¥
–
–
–
–
–
¥
Short-term debt at March 31, 2006 and 2005 were unsecured bank
borrowings and were ¥3,975 million ($33,975 thousand) and ¥8,539
million, respectively. The weighted-average interest rates applicable to
the bank borrowings were 4.48% and 2.77% at March 31, 2006 and
2005, respectively.
¥ 322
5,000
5,322
(5,322)
¥
–
2006
$
–
–
–
–
–
$
As is customary in Japan, short-term bank loans are made under
general agreements which provide that security and guarantees for
present and future indebtedness will be given upon request of the
bank, and that the bank shall have the right to offset cash deposits
against obligations that have become due or, in the event of default,
against all obligations due to the bank.
7. Retirement and Severance Benefits
Based on the enforcement of Defined Benefit Corporation Law, the Company received approval from the Minister of Health, Labour and Welfare on
April 1, 2004. Concurrently, the welfare pension fund plan was changed to the defined benefit corporate pension fund plan. Extra payment may be
added upon retirement of employees. Several consolidated subsidiaries provide defined contribution plans and / or defined benefits plans.
The Company transferred certain marketable securities worth ¥7,110 million ($60,769 thousand) to an employee retirement benefit trust during
the year ended March 31, 2006. Gain on the contribution of securities to retirement benefit trust was ¥4,967 million ($42,453 thousand).
The plan’s funded status and amounts recognized in the accompanying consolidated balance sheets at March 31, 2006 and 2005 are
as follows:
Thousands of
U.S. dollars (Note 2)
Millions of yen
Employee retirement and severance benefits:
Projected benefit obligation . . . . . . . . . . . . . . . . . . . . . . . . . . . . . . . . . . . . . . . . .
Plan assets at fair value . . . . . . . . . . . . . . . . . . . . . . . . . . . . . . . . . . . . . . . . . . . .
Retirement benefit trust at fair value . . . . . . . . . . . . . . . . . . . . . . . . . . . . . . . . . . .
Projected benefit obligation in excess of plan assets . . . . . . . . . . . . . . . . . . . . . .
Unrecognized actuarial loss . . . . . . . . . . . . . . . . . . . . . . . . . . . . . . . . . . . . . . . . .
Unrecognized prior service cost . . . . . . . . . . . . . . . . . . . . . . . . . . . . . . . . . . . . . .
Accrued retirement and severance benefits . . . . . . . . . . . . . . . . . . . . . . . . . . .
2006
2005
2006
¥ (49,157)
27,134
–
(22,023)
15,301
(12,664)
¥ (19,386)
¥ (54,185)
36,645
7,248
(10,292)
9,376
(11,256)
¥ (12,172)
$ (463,120)
313,205
61,949
(87,966)
80,137
(96,205)
$ (104,034)
Net periodic cost for the employee retirement and severance benefits for the years ended March 31, 2006, 2005 and 2004 consisted
of the following:
Thousands of
U.S. dollars (Note 2)
Millions of yen
Service cost for benefits earned, net of employee contributions. . . . . . . . . .
Interest cost on projected benefit obligation. . . . . . . . . . . . . . . . . . . . . . . . .
Estimated return on plan assets. . . . . . . . . . . . . . . . . . . . . . . . . . . . . . . . . .
Amortization of unrecognized actuarial loss . . . . . . . . . . . . . . . . . . . . . . . . .
Amortization of unrecognized prior service cost . . . . . . . . . . . . . . . . . . . . . .
Net periodic cost . . . . . . . . . . . . . . . . . . . . . . . . . . . . . . . . . . . . . . . . . . . . .
2006
2005
¥ 2,562
1,193
(771)
2,223
(1,408)
¥ 3,799
¥ 2,339
1,032
(581)
2,168
(1,408)
¥ 3,550
2004
¥ 2,692
1,367
(447)
1,890
(3)
¥ 5,499
2006
$ 21,897
10,197
(6,590)
19,000
(12,034)
$ 32,470
49
Several consolidated subsidiaries have defined contribution plans, which provide retirement benefits for their employees who meet certain
eligibility requirements. Expenses under the plans for the years ended March 31, 2006, 2005 and 2004 were ¥239 million ($2,043 thousand),
¥231 million and ¥191 million, respectively.
Actuarial assumptions and basis for the calculation of retirement and severance benefits are as follows:
Net periodic cost of employee retirement and severance
benefit for the year ended March 31, 2001 consisted of the following;
Method of the benefit attribution . . . . . . . . . . . . . . . . . . . . . . . . . . . . . . . .
Discount rate . . . . . . . . . . . . . . . . . . . . . . . . . . . . . . . . . . . . . . . . . . . . . . .
Estimated rate of return on plan assets . . . . . . . . . . . . . . . . . . . . . . . . . . .
Period of amortization of unrecognized prior service cost . . . . . . . . . . . . .
Period of amortization of unrecognized actuarial gain or loss . . . . . . . . . . .
2006
“Benefit / year-of-service” approach
Mainly 2.0%
Mainly 2.0%
10 Years
10 Years
2005
Net periodic cost of employee retirement and severance
benefit for the year ended March 31, 2001 consisted of the following;
Method of the benefit attribution . . . . . . . . . . . . . . . . . . . . . . . . . . . . . . . .
Discount rate . . . . . . . . . . . . . . . . . . . . . . . . . . . . . . . . . . . . . . . . . . . . . . .
Estimated rate of return on plan assets . . . . . . . . . . . . . . . . . . . . . . . . . . .
Period of amortization of unrecognized prior service cost . . . . . . . . . . . . .
Period of amortization of unrecognized actuarial gain or loss . . . . . . . . . . .
“Benefit / year-of-service” approach
Mainly 2.0%
Mainly 2.0%
10 Years
10 Years
Net periodic cost of employee retirement and severance
benefit for the year ended March 31, 2001 consisted of the following;
Method of the benefit attribution . . . . . . . . . . . . . . . . . . . . . . . . . . . . . . . .
Discount rate . . . . . . . . . . . . . . . . . . . . . . . . . . . . . . . . . . . . . . . . . . . . . . .
Estimated rate of return on plan assets . . . . . . . . . . . . . . . . . . . . . . . . . . .
Period of amortization of unrecognized prior service cost . . . . . . . . . . . . .
Period of amortization of unrecognized actuarial gain or loss . . . . . . . . . . .
2004
“Benefit / year-of-service” approach
Mainly 2.0%
Mainly 2.0%
10 Years
10 Years
8. Income Taxes
The Company is subject to Japanese corporate, inhabitant and enterprise taxes based on income, which in the aggregate resulted in a normal tax rate of approximately 40.3% during the years ended March 31,
2006 and 2005, and 41.7% during the year ended March 31, 2004.
A reconciliation between the Japanese normal income tax rate and
the effective income tax rate calculated as a percentage of income
before income taxes and minority interests for the years ended March
31, 2006, 2005 and 2004 are as follows, which are not disclosed for
the years when differences between the normal and effective tax rates
are less than 5% of normal tax rate.
Japanese normal income tax rate . . . . . . . . . . . . . . . . . . . . . . . . . . . . . . . . . . . . . . . . .
Increase (reduction) in income taxes resulting from:
Expenses not deductible for tax purposes . . . . . . . . . . . . . . . . . . . . . . . . . . . . . . . . .
Dividend income, non-taxable . . . . . . . . . . . . . . . . . . . . . . . . . . . . . . . . . . . . . . . . . .
Income of foreign subsidiaries taxed at lower rate than Japanese normal tax rate . . .
Amortization of goodwill. . . . . . . . . . . . . . . . . . . . . . . . . . . . . . . . . . . . . . . . . . . . . . .
Tax credit . . . . . . . . . . . . . . . . . . . . . . . . . . . . . . . . . . . . . . . . . . . . . . . . . . . . . . . . . .
Other . . . . . . . . . . . . . . . . . . . . . . . . . . . . . . . . . . . . . . . . . . . . . . . . . . . . . . . . . . . . .
Effective income tax rate . . . . . . . . . . . . . . . . . . . . . . . . . . . . . . . . . . . . . . . . . . . .
50
2006
2005
40.3%
40.3%
–%)
2.4
(0.1)
(2.1)
0.6
(3.4)
(0.6)
37.1%)
2.7
(0.0)
(2.5)
0.8
(3.0)
(0.5)
37.8%
–)
–)
–)
–)
–)
–)
–%)
2004
The tax effects of temporary differences that give rise to significant portions of the deferred tax assets and deferred tax liabilities at March 31,
2006 and 2005 are presented below:
Thousands of
U.S. dollars (Note 2)
Millions of yen
Deferred tax assets:
Allowance for doubtful receivables . . . . . . . . . . . . . . . . . . . . . . . . . . . . . . . . . . . . . . .
Accrued expenses . . . . . . . . . . . . . . . . . . . . . . . . . . . . . . . . . . . . . . . . . . . . . . . . . . .
Accrued business tax. . . . . . . . . . . . . . . . . . . . . . . . . . . . . . . . . . . . . . . . . . . . . . . . .
Retirement and severance benefits . . . . . . . . . . . . . . . . . . . . . . . . . . . . . . . . . . . . . .
Impairment loss on investment securities . . . . . . . . . . . . . . . . . . . . . . . . . . . . . . . . . .
Losses sustained by overseas subsidiaries . . . . . . . . . . . . . . . . . . . . . . . . . . . . . . . .
Unrealized profit in inventories and property, plant and equipment . . . . . . . . . . . . . . .
Impairment loss on property, plant and equipment . . . . . . . . . . . . . . . . . . . . . . . . . . .
Other . . . . . . . . . . . . . . . . . . . . . . . . . . . . . . . . . . . . . . . . . . . . . . . . . . . . . . . . . . . . .
Total gross deferred tax assets . . . . . . . . . . . . . . . . . . . . . . . . . . . . . . . . . . . . . . . .
Less valuation allowance . . . . . . . . . . . . . . . . . . . . . . . . . . . . . . . . . . . . . . . . . . . .
Net deferred tax assets . . . . . . . . . . . . . . . . . . . . . . . . . . . . . . . . . . . . . . . . . . . . .
Deferred tax liabilities:
Depreciation and amortization . . . . . . . . . . . . . . . . . . . . . . . . . . . . . . . . . . . . . . . . . .
Other securities valuation difference . . . . . . . . . . . . . . . . . . . . . . . . . . . . . . . . . . . . . .
Gain on contribution of securities to retirement benefit trust . . . . . . . . . . . . . . . . . . . .
Other . . . . . . . . . . . . . . . . . . . . . . . . . . . . . . . . . . . . . . . . . . . . . . . . . . . . . . . . . . . . .
Total gross deferred tax liabilities . . . . . . . . . . . . . . . . . . . . . . . . . . . . . . . . . . . . . .
Net deferred tax assets . . . . . . . . . . . . . . . . . . . . . . . . . . . . . . . . . . . . . . . . . . . . .
Net deferred tax liabilities included in “Other long-term liabilities” are
¥91 million ($777 thousand) and ¥476 million as of March 31, 2006
and 2005.
The valuation allowance for deferred tax assets as of March 31,
2006 and 2005, are ¥4,957 million ($42,367 thousand) and ¥4,941
million, respectively. Valuation allowance for deferred tax assets is
provided primarily for the losses sustained by overseas subsidiaries.
Based upon the level of historical taxable income and projections
¥
280
4,929
939
7,324
382
5,520
1,435
471
3,164
24,444
(4,957)
19,487
(656)
(4,973)
(2,002)
(512)
(8,143)
¥ 11,344
2006
2005
2006
¥
295
3,600
719
7,461
382
4,701
1,119
578
2,189
21,044
(4,941)
16,103
(505)
(1,267)
–
(471)
(2,243)
¥ 13,860
$
2,393
42,128
8,026
62,598
3,265
47,179
12,265
4,026
27,043
208,923
(42,367)
166,556
(5,607)
(42,504)
(17,111)
(4,376)
(69,598)
$ 96,958
for future taxable income over the periods which the net deductible
temporary differences are expected to reverse, management believes
that the Company will realize the benefits of these deferred tax assets, net of the existing valuation allowance, at March 31, 2006.
The aggregate statutory income tax rate used for calculation of deferred income tax assets and liabilities was 40.3% for the years ended
March 31, 2006 and 2005.
9. Selling, General and Administrative Expenses
Significant components of selling, general and administrative expenses for the years ended March 31, 2006, 2005 and 2004 are as follows:
Thousands of
U.S. dollars (Note 2)
Millions of yen
Marketing expenses . . . . . . . . . . . . . . . . . . . . . . . . . . . . . . . . . . . . . . . . . . .
Salaries and wages . . . . . . . . . . . . . . . . . . . . . . . . . . . . . . . . . . . . . . . . . . . .
Freight and other delivery costs . . . . . . . . . . . . . . . . . . . . . . . . . . . . . . . . . . .
Research and development costs . . . . . . . . . . . . . . . . . . . . . . . . . . . . . . . . .
2006
2005
¥ 9,078
19,254
7,431
18,025
¥ 8,247
16,271
7,097
13,739
2004
¥ 6,791
15,082
6,835
14,700
2006
$ 77,590
164,564
63,513
154,060
10. Research and Development Costs
Research and development costs charged to income for the years ended March 31, 2006, 2005 and 2004 are ¥18,025 million ($154,060 thousand), ¥13,739 million and ¥14,700 million, respectively.
51
11. Impairment Loss on Property and Equipment
In the years ended March 31, 2006 and 2005, the Company and its subsidiaries recognized ¥593 million ($5,069 thousand) and ¥1,435 million,
respectively, of impairment loss on the following group of assets.
Millions of yen
2006:
Location
Classification
Kanagawa Pref.
Land (Idle asset)
Hyogo Pref. and other 4 locations
Hyogo Pref.
Land (Idle asset)
Buildings and structures (Idle asset)
Impairment loss
¥
¥
593
593
2005:
¥ 1,417
18
¥ 1,435
Thousands of U.S. dollars (Note 2)
2006:
Location
Classification
Impairment loss
Kanagawa Pref.
Land (Idle asset)
$ 5,069
$ 5,069
The company and its subsidiaries group their fixed assets by business
groups continuously managing its income and expenditures, such as
General hospital products segment, Cardiac and vascular products
segment, and Home health care products segment. Idle assets are
each grouped into an asset group.
In addition, assets belonging to Headquarters and R&D center,
company housing and dormitories are included in common assets
due to the fact that they do not generate identifiable cash flows.
For idle assets not in the ordinary course of business and the asset values significantly depreciated, the book value were reduced to
recoverable amounts, and such reduced amounts were recorded as
impairment loss.
The Company and its subsidiaries mainly use net selling values for
calculating recoverable amounts, which are mainly based on tax basis
for property taxes.
12. Common Stock
On March 31, 2006, the Company holds 7,848,741 shares of the
Company’s common stock for an aggregate cost of ¥13,450 million
($114,958 thousand). The repurchase cost of the holding shares is
deducted from stockholders’ equity as treasury stock at March 31,
2006.
The Ordinary General Meeting of Stockholders held on June 29,
2004 approved that, in accordance with Japanese Commercial Code
Article 211-3, the Company changed the Article of corporation so
that the Company may acquire its common stock to be held in treasury based on decision on directors’ meeting.
The Ordinary General Meeting of Stockholders held on June 29,
2005 approved that the Company changed the Articles of corporation
so that the Company may publish up to 840 million shares of
common stock.
13. Retained Earnings and Dividends
Effective from October 1, 2001, the revised Japanese Commercial
Code was adopted. The previous Japanese Commercial Code provided that an amount equal to at least 10% of appropriations paid
in cash be appropriated as a legal reserve until such reserve equals
25% of common stock. This reserve is not available for payment of
dividends but may be used to reduce a deficit or may be transferred
to capital. The revised Japanese Commercial Code provides that an
amount equal to at least 10% of appropriations paid in cash be appropriated as a legal reserve until such reserve plus capital surplus
equals 25% of stated capital. If the total of legal reserves and capital
surplus exceeds 25% of stated capital, such excess amount can be
reversed without limit of utilization.
Legal reserves, which are included in retained earnings, amount to
¥3,946 million ($33,726 thousand) and ¥3,783 million at March 31,
2006 and 2005, respectively.
52
In accordance with the Commercial Code, proposed appropriations
of retained earnings have not been reflected in the financial statements
at the end of each fiscal year. The proposed appropriations
of retained earnings at March 31, 2006 are cash dividends of
¥2,842 million ($24,291 thousand) and officers’ bonuses of
¥132 million ($1,128 thousand). The proposal was approved by the
Ordinary General Meeting of Stockholders held on June 29, 2006.
The maximum amount that the Company can distribute as dividends
is calculated based on the non-consolidated financial statements of the
Company in accordance with the Commercial Code.
14. Leases
The Company and its subsidiaries lease certain machinery and equipment under various lease arrangements.
Finance leases, except for those where the legal title of the underlying property is transferred from the lessor to the lessee at the end of the
lease term, are accounted for as operating leases.
Leased machinery and equipment under such finance leases at March 31, 2006 and 2005 are as follows:
Thousands of
U.S. dollars (Note 2)
Millions of yen
Market value at inception of leases . . . . . . . . . . . . . . . . . . . . . . . . . . . . . . . . . . . . . . . .
Less accumulated depreciation . . . . . . . . . . . . . . . . . . . . . . . . . . . . . . . . . . . . . . . . . . .
Assets under finance leases, net . . . . . . . . . . . . . . . . . . . . . . . . . . . . . . . . . . . . . . . . . .
2006
2005
2006
¥ 2,194
1,405
¥ 789
¥2,291
1,377
¥ 914
$ 18,752
12,008
$ 6,744
Future minimum payments required under such finance leases at March 31, 2006 and 2005 are as follows:
Thousands of
U.S. dollars (Note 2)
Millions of yen
Within one year . . . . . . . . . . . . . . . . . . . . . . . . . . . . . . . . . . . . . . . . . . . . . . . . . . . . . . .
Over one year . . . . . . . . . . . . . . . . . . . . . . . . . . . . . . . . . . . . . . . . . . . . . . . . . . . . . . . .
2006
2005
2006
¥ 386
403
¥ 789
¥ 383
531
¥ 914
$3,299
3,445
$6,744
The lease expenses for such finance leases for the years ended March 31, 2006, 2005 and 2004 amounted to ¥449 million ($3,838
thousand), ¥487 million and ¥583 million, respectively.
The minimum rental commitments under noncancellable operating leases at March 31, 2006 and 2005 are as follows:
Thousands of
U.S. dollars (Note 2)
Millions of yen
Within one year . . . . . . . . . . . . . . . . . . . . . . . . . . . . . . . . . . . . . . . . . . . . . . . . . . . . . . .
Over one year . . . . . . . . . . . . . . . . . . . . . . . . . . . . . . . . . . . . . . . . . . . . . . . . . . . . . . . .
2006
2005
2006
¥ 161
198
¥ 359
¥ 77
87
¥ 164
$ 1,376
1,692
$ 3,068
15. Foreign Exchange Risk Management
The Company and its subsidiaries operate internationally which expose
them to the risk of a change in foreign exchange rates. Derivative financial
instruments are comprised of foreign exchange contracts utilized by the
Company to reduce such risks. The Company and its subsidiaries do
not hold or issue financial instruments for trading purposes.
The contract amounts of derivative financial instruments are not a
measure of the exposure of the Company through its use of derivative
financial instruments. The Company is exposed to the risk of creditrelated or debit-related losses in the event of nonperformance by
counterparties to the foreign exchange contracts, but does not expect
any counterparties to fail given their high credit ratings.
The Company enters into foreign exchange contracts to hedge
against the risk of fluctuation in foreign currency exchange rates associated with certain trade receivables and payables denominated in
foreign currencies. At March 31, 2006 and 2005, outstanding foreign
exchange currency contracts are used for the translation of hedged
trade receivables and payables. The Company is required to disclose
certain information with respect to derivatives. Contract amounts and
fair value of foreign exchange contracts at March 31, 2006 and 2005
are set forth below.
Thousands of
U.S. dollars (Note 2)
Millions of yen
Foreign exchange contracts:
2006
2005
2006
Trade receivables
Contract amount . . . . . . . . . . . . . . . . . . . . . . . . . . . . . . . . . . . . . . . . . . . . . . . . . . . .
Estimated fair value . . . . . . . . . . . . . . . . . . . . . . . . . . . . . . . . . . . . . . . . . . . . . . . . . .
Unrealized gain (loss) . . . . . . . . . . . . . . . . . . . . . . . . . . . . . . . . . . . . . . . . . . . . . . . . .
¥ 4,341
4,410
(69)
¥ 6,393
6,483
(90)
$ 37,103
37,693
(590)
Trade payables
Contract amount . . . . . . . . . . . . . . . . . . . . . . . . . . . . . . . . . . . . . . . . . . . . . . . . . . . .
Estimated fair value . . . . . . . . . . . . . . . . . . . . . . . . . . . . . . . . . . . . . . . . . . . . . . . . . .
Unrealized gain (loss) . . . . . . . . . . . . . . . . . . . . . . . . . . . . . . . . . . . . . . . . . . . . . . . . .
¥ 504
505
1
¥ 831
800
(31)
$ 4,308
4,317
9
16. Contingencies
The Company and its consolidated subsidiaries had no significant contingent liabilities at March 31, 2006 and 2005, respectively.
53
17. Segment Information
Operations by business group and geographic area are summarized as follows:
(a) Industry Segments
Industry segment information as of and for the years ended March 31, 2006, 2005 and 2004 are as follows:
Thousands of
U.S. dollars (Note 2)
Millions of yen
Sales:
General hospital products . . . . . . . . . . . . . . . . . . . . . . . . . . . . .
Cardiac and vascular products. . . . . . . . . . . . . . . . . . . . . . . . . .
Home health care products . . . . . . . . . . . . . . . . . . . . . . . . . . . .
Operating income:
General hospital products . . . . . . . . . . . . . . . . . . . . . . . . . . . . .
Cardiac and vascular products. . . . . . . . . . . . . . . . . . . . . . . . . .
Home health care products . . . . . . . . . . . . . . . . . . . . . . . . . . . .
Corporate expenses. . . . . . . . . . . . . . . . . . . . . . . . . . . . . . . . . .
Assets:
General hospital products . . . . . . . . . . . . . . . . . . . . . . . . . . . . .
Cardiac and vascular products. . . . . . . . . . . . . . . . . . . . . . . . . .
Home health care products . . . . . . . . . . . . . . . . . . . . . . . . . . . .
Corporate assets . . . . . . . . . . . . . . . . . . . . . . . . . . . . . . . . . . . .
Depreciation:
General hospital products . . . . . . . . . . . . . . . . . . . . . . . . . . . . .
Cardiac and vascular products. . . . . . . . . . . . . . . . . . . . . . . . . .
Home health care products . . . . . . . . . . . . . . . . . . . . . . . . . . . .
Corporate depreciation . . . . . . . . . . . . . . . . . . . . . . . . . . . . . . .
Impairment loss:
General hospital products . . . . . . . . . . . . . . . . . . . . . . . . . . . . .
Cardiac and vascular products. . . . . . . . . . . . . . . . . . . . . . . . . .
Home health care products . . . . . . . . . . . . . . . . . . . . . . . . . . . .
Corporate impairment loss . . . . . . . . . . . . . . . . . . . . . . . . . . . . .
Capital expenditures:
General hospital products . . . . . . . . . . . . . . . . . . . . . . . . . . . . .
Cardiac and vascular products. . . . . . . . . . . . . . . . . . . . . . . . . .
Home health care products . . . . . . . . . . . . . . . . . . . . . . . . . . . .
Corporate expenditures . . . . . . . . . . . . . . . . . . . . . . . . . . . . . . .
Corporate assets consist primarily of surplus money (cash and
cash equivalents), long-term investment funds (investment
securities), deferred income taxes and general and administrative
division’s assets.
Depreciation for the year ended March 31, 2005, includes ¥2,180
million write-down of goodwill, which is included in “General hospital
2006
2005
2004
2006
¥ 129,883
88,931
28,235
¥ 247,049
¥ 124,068
80,927
25,008
¥ 230,003
¥ 119,938
70,967
24,291
¥ 215,196
$ 1,110,111
760,094
241,325
$ 2,111,530
¥ 25,382
25,923
7,574
58,879
(10,627)
¥ 48,252
¥ 21,232
29,622
6,557
57,411
(10,303)
¥ 47,108
¥ 18,864
22,760
5,008
46,632
(9,979)
¥ 36,653
$
¥ 135,012
119,053
21,449
79,134
¥ 354,648
¥ 130,686
87,976
20,420
73,374
¥ 312,456
¥
9,226
4,435
948
572
¥ 15,181
¥ 11,763
4,382
1,181
435
¥ 17,761
¥
9,314
4,245
1,175
147
¥ 14,881
$
¥
–
–
–
593
593
¥
–
–
–
1,435
1,435
¥
–
–
–
–
–
$
9,746
27,717
2,024
235
¥ 39,722
¥
8,604
3,574
1,240
509
¥ 13,927
¥
9,822
2,055
989
290
¥ 13,156
$
¥
¥
¥
$ 1,153,948
1,017,547
183,325
676,359
$ 3,031,179
¥
2006
Corporate expenses and eliminations. . . . . . . . . . . . . . . . . . . . .
54
$
$
–
–
–
5,069
5,069
83,299
236,897
17,299
2,009
339,504
Thousands of
U.S. dollars (Note 2)
Millions of yen
Operating income:
Japan. . . . . . . . . . . . . . . . . . . . . . . . . . . . . . . . . . . . . . . . . . . . .
Europe . . . . . . . . . . . . . . . . . . . . . . . . . . . . . . . . . . . . . . . . . . . .
North and South America. . . . . . . . . . . . . . . . . . . . . . . . . . . . . .
Asia and Others . . . . . . . . . . . . . . . . . . . . . . . . . . . . . . . . . . . .
$
78,855
37,906
8,102
4,889
129,752
products”. Capital expenditures for the year ended March 31, 2005,
includes ¥2,180 million payment for acquisition of goodwill, which
is included in “General hospital products”. All amount of impairment
loss for the years ended March 31, 2006 and 2005 are in corporate
impairment loss.
(b) Geographic Segments
Sales:
Japan. . . . . . . . . . . . . . . . . . . . . . . . . . . . . . . . . . . . . . . . . . . . .
Europe . . . . . . . . . . . . . . . . . . . . . . . . . . . . . . . . . . . . . . . . . . . .
North and South America. . . . . . . . . . . . . . . . . . . . . . . . . . . . . .
Asia and Others . . . . . . . . . . . . . . . . . . . . . . . . . . . . . . . . . . . . .
$
216,940
221,564
64,735
503,239
(90,829)
412,410
2005
2004
2006
¥ 149,531
39,588
38,605
19,325
¥ 247,049
¥ 143,390
34,764
35,771
16,078
¥ 230,003
¥ 134,219
32,296
33,876
14,805
¥ 215,196
$ 1,278,043
338,359
329,957
165,171
$ 2,111,530
¥ 52,492
3,770
(1,166)
4,373
59,469
(11,217)
¥ 48,252
¥ 49,672
2,671
2,672
3,548
58,563
(11,455)
¥ 47,108
¥ 38,865
2,354
3,149
2,649
47,017
(10,364)
¥ 36,653
$
$
448,650
32,222
(9,966)
37,376
508,282
(95,872)
412,410
Thousands of
U.S. dollars (Note 2)
Millions of yen
Assets:
Japan. . . . . . . . . . . . . . . . . . . . . . . . . . . . . . . . . . . . . . . . . . . . .
Europe . . . . . . . . . . . . . . . . . . . . . . . . . . . . . . . . . . . . . . . . . . . .
North and South America. . . . . . . . . . . . . . . . . . . . . . . . . . . . . .
Asia and Others . . . . . . . . . . . . . . . . . . . . . . . . . . . . . . . . . . . . .
Corporate assets and eliminations . . . . . . . . . . . . . . . . . . . . . . .
2006
2005
2004
¥ 259,004
47,871
55,965
30,060
392,900
(38,252)
¥ 354,648
¥ 226,551
47,573
30,631
22,818
327,573
(15,117)
¥ 312,456
2006
$ 2,213,710
409,154
478,333
256,923
3,358,120
(326,941)
$ 3,031,179
Each overseas geographic segment mainly consists of the following:
Europe: Belgium, United Kingdom and Germany
North and South America: United States of America, Canada and Mexico
Asia and Others: Australia, Thailand and Taiwan
(c) Overseas Sales
Thousands of
U.S. dollars (Note 2)
Millions of yen
Overseas sales:
Europe. . . . . . . . . . . . . . . . . . . . . . . . . . . . . . . . . . . . . . . . . . . . . .
North and South America . . . . . . . . . . . . . . . . . . . . . . . . . . . . . . .
Asia and Others . . . . . . . . . . . . . . . . . . . . . . . . . . . . . . . . . . . . . . .
2006
2005
2004
2006
¥ 39,588
38,617
19,457
¥ 97,662
¥ 34,764
35,771
16,112
¥ 86,647
¥ 31,440
33,876
15,030
¥ 80,346
$ 338,359
330,060
166,299
$ 834,718
39.5%
37.7%
37.3%
Ratio to total sales . . . . . . . . . . . . . . . . . . . . . . . . . . . . . . . . . . . . . . .
Each overseas sales destination mainly consists of the following:
Europe: Germany, France and Italy
North and South America: United States of America, Canada and Mexico
Asia and Others: Australia, Thailand and Taiwan
18. Balances and Transactions with Unconsolidated Subsidiary and Affiliated Companies
Balances as of March 31, 2006 and 2005 and transactions for the years ended March 31, 2006, 2005 and 2004 with unconsolidated subsidiary and affiliated companies are summarized as follows:
Thousands of
U.S. dollars (Note 2)
Millions of yen
2006
2005
Other current assets:
Terumo BSN K.K. . . . . . . . . . . . . . . . . . . . . . . . . . . . . . . . . . . . . . . . . . . . . . . . .
¥
8
¥ 18
$
Trade payables and other current liabilities:
Terumo Business Support Corporation . . . . . . . . . . . . . . . . . . . . . . . . . . . . . . . .
Terumo BSN K.K. . . . . . . . . . . . . . . . . . . . . . . . . . . . . . . . . . . . . . . . . . . . . . . . .
¥ 37
284
¥ 21
251
$ 316
2,427
68
Thousands of
U.S. dollars ( Note 2)
Millions of yen
2005
2006
2006
2004
2006
Income from other services:
Terumo BSN K.K. . . . . . . . . . . . . . . . . . . . . . . . . . . . . . . . . . . . . . . . . . . . . . . . .
¥
Purchase:
Terumo BSN K.K. . . . . . . . . . . . . . . . . . . . . . . . . . . . . . . . . . . . . . . . . . . . . . . . .
¥1,600
¥1,940
¥1,712
$13,675
Insurance premium and other expenses:
Terumo Business Support Corporation . . . . . . . . . . . . . . . . . . . . . . . . . . . . . . . .
¥1,234
¥ 910
¥ 988
$10,547
31
¥
34
¥
33
$
265
55
Independent Auditors’ Report
To the Stockholders and Board of Directors of
Terumo Corporation:
We have audited the accompanying consolidated balance sheets of Terumo Corporation and subsidiaries as of March 31, 2006 and
2005, and the related consolidated statements of income, stockholders’ equity and cash flows for each of the three years in the period ended March 31, 2006, expressed in Japanese yen. These consolidated financial statements are the responsibility of the Company’s management. Our responsibility is to independently express an opinion on these consolidated financial statements based on
our audits.
We conducted our audits in accordance with auditing standards generally accepted in Japan. Those standards require that we plan
and perform the audit to obtain reasonable assurance about whether the financial statements are free of material misstatement. An
audit includes examining, on a test basis, evidence supporting the amounts and disclosures in the financial statements. An audit
also includes assessing the accounting principles used and significant estimates made by management, as well as evaluating the
overall financial statement presentation. We believe that our audits provide a reasonable basis for our opinion.
In our opinion, the consolidated financial statements referred to above present fairly, in all material respects, the consolidated financial position of Terumo Corporation and subsidiaries as of March 31, 2006 and 2005, and the consolidated results of their operations and their cash flows for each of the three years in the period ended March 31, 2006, in conformity with accounting principles
generally accepted in Japan.
Without qualifying our opinion, we draw attention to the following. As discussed in Note 1(h), effective April 1, 2004, Terumo Corporation and consolidated domestic subsidiaries adopted early the new accounting standards for impairment of fixed assets.
The U.S. dollar amounts in the accompanying consolidated financial statements with respect to the year ended March 31, 2006 are
pr
ion, such translation has been made on the basis described in Note 2 to the consolidated financial statements.
Tokyo, Japan
June 30, 2006
56
Subsidiaries and Affiliates
As of March 31, 2006
Name of Company
Japan
Terumo Trading Co., Ltd.1
Terumo Medical Care K.K.1
Ikiken Co., Ltd.1
Terumo Lease Co., Ltd.1
Terumo BSN K.K.2
Capital Stock
(Thousands)
Percentage Owned
Directly or Indirectly
by the Company
Principal Business
¥50,000
¥200,000
¥290,000
¥10,000
¥100,000
100.0%
100.0%
100.0%
100.0%
50.0%
General hospital products
Home health care products
Home health care products
General leasing
General hospital products
EUR301,195
100.0%
EUR363
100.0%
Laboratoires Terumo France S.A. (France)1
EUR3,775
100.0%
Terumo Cardiovascular Systems Europe GmbH (Germany)1
Terumo Italia SRL (Italy)1
EUR1,503
EUR60
100.0%
100.0%
EUR78
100.0%
SEK100
100.0%
£1
100.0%
£0.1
EUR25
£15
EUR40
EUR25
100.0%
100.0%
100.0%
100.0%
100.0%
General hospital products,
Cardiac and vascular products
General hospital products,
Cardiac and vascular products
General hospital products,
Cardiac and vascular products
Cardiac and vascular products
General hospital products,
Cardiac and vascular products
General hospital products,
Cardiac and vascular products
General hospital products,
Cardiac and vascular products
General hospital products,
Cardiac and vascular products
Cardiac and vascular products
Cardiac and vascular products
Cardiac and vascular products
Cardiac and vascular products
Cardiac and vascular products
US$116,868
100.0%
US$40,000
MXN10,220
100.0%
100.0%
US$2,000
100.0%
BRL50
100.0%
US$1
US$53,746
US$1
US$20,599
100.0%
100.0%
100.0%
100.0%
CNY389,569
CNY61,290
PHP2,900,000
PHP30,000
PHP13,500
100.0%
100.0%
100.0%
97.0%
100.0%
THB30,625
100.0%
PT. Terumo Indonesia (Indonesia)1
IDR5,250,000
100.0%
Terumo Korea Corporation (Korea)1
KRW885,000
100.0%
HK$11,700
100.0%
CNY1,655
100.0%
INR128,308
US$4,326
74.0%
100.0%
Europe
Terumo Europe N.V. (Belgium)1
Terumo (Deutschland) GmbH (Germany)1
Terumo Europe España SL (Spain)1
Terumo Sweden Private AB (Sweden)1
Terumo UK Ltd. (U.K.)1
Vascutek Ltd. (U.K.)1
Vascutek Deutschland GmbH (Germany)1
MicroVentionUK, Ltd. (U.K.)1
MicroVention France S.A. (France)1
MicroVention Deutschland GmbH (Germany)1
North and South America
Terumo Medical Corporation (U.S.A.)1
Terumo Cardiovascular Systems Corporation (U.S.A.)1
Terumo Medical de Mexico S.A. de C.V. (Mexico)1
Terumo Latin Ameica Corporation (U.S.A.)1
Terumo Medical do Brasil Ltda. (Brazil)1
Vascutek U.S.A., Inc. (U.S.A.)1
MicroVention, Inc. (U.S.A.)1
Terumo Heart, Inc. (U.S.A.)1
Mission Medical, Inc. (U.S.A.)1
Asia
Terumo Medical Products (Hangzhou) Co., Ltd. (China)1
Changchun Terumo Medical Products Co., Ltd. (China)1
Terumo (Philippines) Corporation (Philippines)1
TP Estate, Inc. (Philippines)1
Terumo Marketing Philippines, Inc. (Philippines)1
Terumo (Thailand) Co., Ltd. (Thailand)1
Terumo China (Hong Kong) Ltd. (China)1
Terumo Medical (Shanghai) Co., Ltd. (China)1
Terumo Penpol Ltd. (India)1
Terumo Mauritius Holding Ltd. (Mauritius)1
General hospital products,
Cardiac and vascular products
Cardiac and vascular products
General hospital products,
Cardiac and vascular products
General hospital products,
Cardiac and vascular products
General hospital products,
Cardiac and vascular products
Cardiac and vascular products
Cardiac and vascular products
Cardiac and vascular products
General hospital products
General hospital products
General hospital products
General hospital products
Other
General hospital products,
Cardiac and vascular products
General hospital products,
Cardiac and vascular products
General hospital products,
Cardiac and vascular products
General hospital products,
Cardiac and vascular products
General hospital products,
Cardiac and vascular products
General hospital products,
Cardiac and vascular products
General hospital products
Other
Notes: 1. Consolidated subsidiary
2. Affiliate accounted for by the equity method
57
Corporate Data
As of March 31, 2006
Head Office
44-1, 2-chome, Hatagaya, Shibuya-ku,
Tokyo 151-0072, Japan
TEL +81-3-3374-8111
R&D
Date of Establishment
September 17, 1921
Europe
Vascutek Ltd.
Paid-in Capital
¥38,716 million
Americas
Terumo Cardiovascular Systems Corporation
Terumo Heart, Inc.
MicroVention, Inc.
Japan
Terumo Corporation R&D Center
Principal Factories
Japan
Terumo Corporation Fujinomiya Factory
Terumo Corporation Ashitaka Factory
Terumo Corporation Kofu Factory
Ikiken Co., Ltd.
Glasgow
Liverpool
Paris
Madrid
Goteborg
Brussels
Frankfult
Hamburg
Changchun
Rome
Beijing
Dubai
Chennai
Trivandrum
Seoul
Tokyo
Shanghai
Hangzhou
Taipei
Guangzhou
Hong Kong
Hanoi
Bangkok
Pasig City
Ho Chi Minh City
Kuala Lumpur
Laguna
Singapore
Jakarta
Sydney
Factory
58
Sales Office
Head Office
Principal Factories
Europe
Terumo Europe N.V. (Brussels, Liverpool)
Vascutek Ltd. (Glasgow)
Principal Sales Offices
Japan
46 Branches
Americas
Terumo Medical Corporation (Maryland)
Terumo Cardiovascular Systems Corporation
(Michigan, Massachusetts, Maryland, California)
MicroVention, Inc.
China
Terumo Medical Products (Hangzhou) Co., Ltd.
Changchun Terumo Medical Products Co., Ltd.
Asia
Terumo (Philippines) Corporation
Terumo Penpol Ltd.
Americas
Terumo Medical Corporation
Terumo Latin America Corporation
Terumo Medical de Mexico S.A. de C.V.
Terumo Medical do Brasil Ltda.
Terumo Cardiovascular Systems Corporation
Vascutek U.S.A. Inc.
Massachusetts
Michigan
California
Europe
Terumo Europe N.V.
Terumo Italia SRL
Terumo España SL
Terumo UK Ltd.
Terumo Sweden Private AB
Laboratoires Terumo France S.A.
Terumo (Deutschland) GmbH
Vascutek Ltd.
Vascutek Deutschland GmbH
New Jersey
Maryland
Phoenix
Florida
Asia
Terumo Corporation Australian Branch
Terumo Corporation Taipei Branch
Terumo Korea Corporation
PT. Terumo Indonesia
Terumo Marketing Philippines Inc.
Terumo Corporation Singapore Branch
Terumo (Thailand) Co., Ltd.
Terumo (Thailand) Co., Ltd. Hanoi Representative Office
Terumo (Thailand) Co., Ltd. Ho Chi Minh City
Representative Office
Terumo Corporation Kuala Lumpur Branch
Terumo Corporation Dubai Branch
Terumo Corporation Chennai Branch
China
Terumo China (Hong Kong) Ltd.
Terumo Medical (Shanghai) Co.,Ltd
Mexico City
Sao Paulo
59
Investor Information
As of March 31, 2006
Number of Shares Authorized . . . . .
Number of Shares Issued . . . . . . . .
Number of Stockholders . . . . . . . . .
Stock Listing . . . . . . . . . . . . . . . . . .
Security Code . . . . . . . . . . . . . . . . .
Trading Unit . . . . . . . . . . . . . . . . . . .
840,000,000 shares
210,876,260 shares
26,823
First Section of Tokyo Stock Exchange
4543.t
100 shares
Principal Stockholders
Number of Shares Held
(Thousands)
Percentage of
Total Shares Issued
24,842
10,877
9,806
8,271
7,258
5,611
4,715
4,675
11.8%
5.2%
4.7%
3.9%
3.4%
2.7%
2.2%
2.2%
The Master Trust Bank of Japan, Ltd. (trust account). . . . . . . . . . . .
Japan Trustee Services Bank, Ltd. (trust account) . . . . . . . . . . . . . .
The Dai-ichi Mutual Life Insurance Company . . . . . . . . . . . . . . . . . .
The Tokyo Marine & Nichido Fire Insurance Co., Ltd. . . . . . . . . . . . .
Meiji Yasuda Life Insurance Company . . . . . . . . . . . . . . . . . . . . . . .
The Bank of Tokyo-Mitsubishi UFJ, Ltd. . . . . . . . . . . . . . . . . . . . . .
Olympus Corporation . . . . . . . . . . . . . . . . . . . . . . . . . . . . . . . . . . .
Mizuho Corporate Bank, Ltd.. . . . . . . . . . . . . . . . . . . . . . . . . . . . . .
Note: The Company retained 7,848 thousand shares of common stock.
Composition of Issued Shares
by Type of Stockholder
Composition of Stockholders
■ Individuals and others— 96.7%
■ Trust and banking companies— 29.2%
■ Securities companies— 0.1%
■ Other financial institutions— 20.4%
■ Trust and banking
companies— 0.2%
■ Securities companies— 1.3%
Number of
Stockholders:
26,823
■ Other financial
institutions— 0.4%
Number of
Shares Issued:
210,876,260
■ Other companies— 8.5%
■ Foreign companies— 26.2%
■ Individuals and others— 10.7%
■ Foreign companies— 1.4%
■ Treasury shares— 3.7%
■ Other companies— 1.2%
Stock Price
(Yen)
4,000
3,500
3,000
2,500
(Yen)
12,500
(Yen)
2000 2,000
10,000
Nikkei stock average
1500 1,500
Topix
1000 1,000
500
500
0
0
(Thousands)
7,500 30,000
5,000 20,000
Traded value
2,500 10,000
04/4
5
6
7
8
9
10
11
12
05/1
2
3
4
5
6
7
8
9
10
11
12
06/1
2
3
For further information, please contact: Corporate Communication Department Email: [email protected] URL: http://www.terumo.com/
60
0
0
Topics
March 2006
October 2005
• Acquired all shares of U.S. firm
MicroVention, Inc., signaling entrance
into the market for Neurovasculars.
• NANOPASS 33, the world’s smallest
insulin injection needle, won the Good
Design Award 2005.
December 2005
• Donated ¥15 million in medical
equipment and matching relief funds
to victims of Hurricane Katrina.
• Launched TERUMEAL PG SOFT, a
high-calorie, liquid nutritional food
ideal for older customers.
• Launched WOMAN°C C520, a highly
functional basal body thermometer.
• Launched infusion pump TE-261,
which prevents excessive amounts
of infusion liquid from being supplied
during infusion drips.
• Christmas illumination presents were
given to hospice patients.
November 2005
• Acquired rights to three medical
institution-use nutritional food
products from Hisamitsu
Pharmaceutical Co., Ltd.
• Donated ¥5 million worth of blood
bags and other equipment to
the Pakistan earthquake victim
relief effort.
• Launched digital new model blood
pressure monitors ARM IN MEMO
and ARM IN PLUS, which can
connect doctors and patients using
the devices at home.
• Launched Heartrail II, a PTCA
guiding catheter with a fine tip and
powerful shaft.
September 2005
• Acquired domestic sales rights
to medical-use contrast media of
Guerbet SA of France.
• Launched C220 digital thermometer
with new functions and better
usability.
• Launched CAPIOX RX15 oxygenator
for all types of patients, from children
to adults.
• Introduced a new corporate
recognition program, the Workplace
Pride Award.
August 2005
• Conducted the third annual Mt. Fuji
reforestation activities through the
Terumo Mt. Fuji Reforestation Project.
• Formed a capital partnership
with Olympus Corp. as part of a
strengthened business relationship.
• Introduced a new home oxygen
concentrator, the five-liter SHIZUNE,
the quietest concentrator in Japan.
• Conducted clinical trials for
DuraHeart, the world’s first
magnetically levitating, pumpmethod left ventricular assist device,
completing 20 implant surgeries.
• Launched CV LEGAFORCE SX
catheter for central venous injection.
• Added large-volume FULCALIQ, a
high-calorie IV solution containing
vitamins, sugars, amino acids, and
electrolytes, to the product lineup.
June 2005
• The Articles of Incorporation were
amended at the general shareholders
meeting, in line with the Company’s
strengthening of corporate
governance.
May 2005
• Launched LinearGuide V, a gastral
endoscope guide wire that reduces
the burden on doctors and medical
staff while helping to shorten the time
needed for surgical procedures.
April 2005
• All plants and the head office in
Japan achieved zero emissions by
the end of fiscal 2004
July 2005
• Continued the development of a
less painful injection needle with the
launch of NANOPASS 33, the world’s
smallest insulin injection needle with a
tip of but 0.2 mm.
61
62
Printed on 100% recycled paper
44-1, 2-chome, Hatagaya, Shibuya-ku, Tokyo 151-0072, Japan Tel: +81-3-3374-8111
URL: http://www.terumo.com/
Printed in Japan
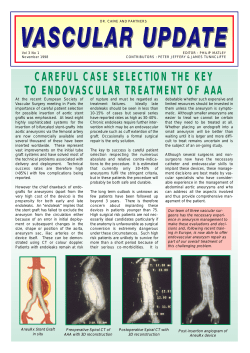


© Copyright 2026