
Spis treÅci
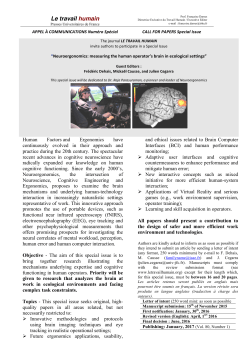
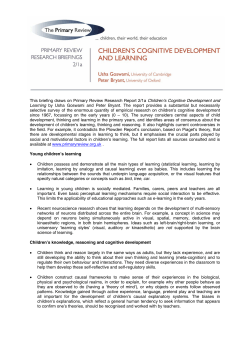
MULTIPLE CRITERIA DECISION Vol. 9 MAKING 2014 Jerzy Michnik* M U L T IP L E C R IT E R IA C H O IC E O F R & D O R G A N IZ A T IO N W IT H T H E A ID O F S T R U C T U R A L M E T H O D S A bstract T echnology-intensive firm s need to organize th eir R & D o n a global scale. T his is an im portant and com plicated task th at requires an explicit m odel and a thorough evaluation. D ue to the com plexity o f the decisions about the global R & D organization and interrelations am ong the underlying issues, a structural approach is recom m ended. A detailed study o f global R & D projects presented in the literature is u sed fo r structuring the pro b lem w ith the aid o f cognitive m ap ping. B ased o n this, tw o qualitative approaches: the R oberts m odel and the W IN G S m ethod are applied to and the m ost suitable solution. K ey w o rd s: cognitive m aps, M ultiple C riteria D ecision A iding, research & developm ent, structural m ethods, W IN G S. 1. In trod u ction R&D is a costly and risky activity but every company has to keep pace with the rapid development of technology. Running a project for a new product or a new technology/process demands extensive R&D and cooperation with other busi ness units (e.g. marketing, manufacturing). The organization of R&D should fit the tasks undertaken by the firm and be flexible fit should change when the environment changes. It is observed that an increasing amount of technical work is carried out abroad (Tidd and Bessant, 2009). Firms recognized that skills and talents needed to produce new technolo gies often develop locally and alocal presence facilitates and accelerates the * Department of Operations Research, University of Economics in Katowice, ul. 1 Maja 50, 40-287 Katowice, Poland, e-mail: [email protected]. Multiple Criteria Choice of R&D Organization. 73 processes of learning and knowledge absorption from foreign sources (De Meyer, 1993). This means that a large technology-intensive firm has to consider the organization of its R&D on a global scale. All that makes the R&D organization one of the most important issues in the innovation process. The key question is how to support the decision of the choice of a suitable R&D organization. There is a broad spectrum of available Multiple Criteria Decision Aiding (MCDA) methods. Taking into account the complexity of the problem, the interrelations between its components and the in terests of many stakeholders with various views and conflicting objectives, the author advocates the use of a structural (or systemic) approach. In this paper a series of related methods are presented. The use of a cognitive map is suggested to reveal the main objectives and their relations with the underlying issues. This tech nique provides a framework for quantitative approaches capable of diferentiating among the potential solutions. The content of the decision model has been derived from a detailed study of global R&D projects (Chiesa, 2000). The next section presents the different R&D structures observed in multina tional companies. An example of problem setting is described in Section 3. The cognitive map technique is used to structure the problem and as a basis for a quantitative model (Section 4). It is followed by a more advanced approach us ing the WINGS method (Section 5). The last section contains conclusions. 2. M ajor C ategories o f G lobal R & D Structures Chiesa examined 12 multinational companies covering different industries: automotive, chemicals, electro-mechanical, electronics, pharmaceutical, telecom munications, white goods, and concluded that multinational firms create global R&D organizations (Chiesa, 2000). All these firms conduct their R&D on an in ternational scale and technology is important for their business. His paper focused on the management and organization of global R&D projects and aimed to classify the structures of global R&D. Chiesa discerned two major categories of global R&D structures: specialization-based structure and integration-based structure. In both, two sub-cases were found. Specialization-based structure can be divided into center o f excellence and supported specialization structure, while integrationbased structure, into network structure and specialized contributors structure. Be low we briefly present these four solutions observed by Chiesa. 2.1. Specialization-based structure This approach is based on the specialization of units and usually leads to concen tration of the resources and R&D activities in one location. During the project 74 J. Michnik development process there is no cross-border management. Only one foreign lab (the firm’s center of excellence) is assigned the full responsibility for developing a new product/process/technology on the basis of a global mandate. 2.1.1. Center of excellence In this structure there is only one center in the firm that does R&D in a certain field and acts as the firm’s center of excellence or center of competence in that field. The objective of this solution is to increase the R&D efficiency at the global level. The concentration of the resources allows to achieve economies of scale and greatly facilitates coordination. This structure is preferable when: • The country hosting the center is a leading producer of market/technical knowl edge useful for innovation in the given product/process/technology area. • The product is global and markets are undifferentiated. • The R&D resources of the firm in that field are concentrated or can be con centrated in one location. Obviously, there are also disadvantages of such a structure. For example, the R&D center is isolated from divisions which are spread out around the world. Dif ferences of culture and motivations between R&D and manufacturing and marketing units can create barriers when an innovation is introduced in the market. Chiesa mentioned a few practical examples of such solutions. These are: • A photoresistant and separation materials center of Hoechst in the U.S. (a case of undifferentiated products). • A U.S. subsidiary of Alcatel responsible for the telecommunication transmis sion systems (the U.S. market is the most advanced in that field). • Matsushita’s microwave oven business unit whose R&D is concentrated in Japan (home country): this product is global and requires only small adapta tion to the local market. 2.1.2. Supported specialization structure This is a structure comprising a center of excellence that is assigned the global re sponsibility for R&D in a certain area, and a number of small units supporting the center. The small units are dispersed worldwide to supply market and technical in formation to the global center. Usually there are two kinds of auxiliary units: • Units supporting product development; they are located close to the major customers to monitor trends and evolution, especially aesthetic and industrial design requirements of foreign markets. • Units supporting research; they are located close to the technology centers of excellence in selected countries to monitor the technical progress and basic research advancements. Multiple Criteria Choice of R&D Organization. 75 This kind of organization benefits from specialization and concentration without missing innovation opportunities that may arise worldwide. This struc ture is preferable when: • Sources of innovation (customers, suppliers, research institutions, etc.) are dispersed but the degree of market differentiation is rather limited. • The resources of the firm are concentrated or can be concentrated in one location. The advantages and disadvantages of this solution are similar to those previ ously mentioned, but they are weaker than in the previous case. An example of supported specialization is that of Japanese consumer elec tronics companies (Toshiba, Matsushita). They have kept their R&D in their home country, while locating a number of small units in foreign countries close to key customers or technology centers of excellence. 2.2. Integration-based structure This solution is based on integration of work of different units that are involved in all phases of the project, including project development. Global innovations are the result of joint work of these units. This kind of organization requires the management of dispersed resources and activities and a much stronger coordination. 2.2.1. Network structure In this structure various foreign labs develop innovations in the same techno logical field or product area. The labs may undertake their own R&D initiatives and allocate a certain amount of resources to local projects. They are supervised centrally to avoid duplications and to coordinate the distributed activities. The coordinating unit is also responsible for leading joint R&D programs aimed to exploit the results across different markets. This structure is preferable when: • The firm’s resources are distributed and a permanent concentration in one lo cation would result in suppressing pockets of technological excellence within the organization. • Markets are differentiated and/or external sources of critical knowledge (key customers, centers of technological excellence) are dispersed. The network structure can accelerate the process of learning because different units approach the same problem in different ways. It also promotes creativity as a result of internal competition among units. The main problem with the network structure is the creation of mechanisms to coordinate these distributed activities and avoid duplications. Communication becomes a critical issue and frequent interactions between units are needed. It is obvious that this structure results in higher costs. 76 J. Michnik Among the firms that apply the network structure for their R&D are Ericsson, ABB and IBM. 2.2.2. Specialized contributors structure This structure is based on structural division of labor among units. Each unit specializes in a certain technological discipline or product component. The struc ture is star-shaped with a central unit responsible for coordination and control of other units working on a specific part of the R&D program. An innovation ap pears as the result of the common effort of the component units. This structure is preferable when: • A new product or production process can be divided into modules or subsystems. • Different units can specialize in different technological or sub-product areas. With this solution the specialized centers can be located close to external sources of knowledge and innovation. But again, as in the previous structure, problems with communication and coordination can occur. This structure puts also more demand on employee mobility. A good example of this structure is that of the Ford Mondeo project (“a world car”). This R&D structure can be also convenient in the development of tele communication systems. 3. P roblem Setting To show the potential of decision aiding in the organization of R&D we present the following case. A Europe-based company has a large R&D unit in Europe. Its manufacturing units are located in Europe and Asia. Most of the suppliers are located in Asia and some in Europe. Products are sold around the world, but the most important market is North America, with Europe the second, and Asia the third. The company is going to develop its R&D significantly and therefore it plans to design several global products aimed at moderately differentiated mar kets. The technological clusters that can be the sources of new knowledge are lo cated in all developed regions, of which the most important is the Unites States, then Europe and Asia. The company considers seven alternatives for the reorganization of its R&D. The first three options represent the ‘center of excellence structure’, with a cen ter located: in Europe - alternative W1, in the U.S. - W2, or in Asia - W3. By “location in Europe” we mean that the existing center is to be expanded and modernized. The other locations need to be built from scratch. T’ coordinated by the center: in Europe - alternative W4, in the U.S. - W5, or in Asia - W6. The last alternative consists in a transition to the network structure compounded from the independent labs in Europe, the U.S. and Asia. The European head office will be responsible for coordination. 77 Multiple Criteria Choice of R&D Organization. 4. D ecision Sup port w ith C ogn itive M ap 4.1. Structuring the problem The cognitive map has been elaborated according to the results of a study of global R&D projects (Chiesa, 2000). Its main role is to serve as a convenient tool for structuring the problem of choosing a suitable R&D organization. The map has been drawn so as to aid in decision making (Eden, 2004). The nodes at the bottom of the map represent the alternatives considered nodes in the middle correspond to the direct and indirect consequences of the chosen alternatives (di rect consequences may be regarded as attributes of the alternatives). The top nodes reflect the ultimate goals, and therefore they have no outcoming arrows. In our example two conflicting goals are considered: ‘lower R&D costs’ and ‘expanded and more effcient R&D’. The cognitive map is a point of departure for the decision model proposed by Roberts (1976). That model uses quantitative information about the strength of influence between the concepts (nodes) on the map. If we wanted to better re flect user preferences we would need to take into account the different weights of concepts that appear on the map. This will lead us to the WINGS method. Figure 1 presents the cognitive map for our R&D organization1. To keep the figure clear, only one alternative (W1) and its influences are shown. The data gathered for all alternatives and presented in Table 1 allow the reader to easily reconstruct the full map. All valuations of influences presented on the map came from the same integer scale: from 1 - the lowest influence to 9 - the strongest influence. Obviously, if there is no direct influence (represented by 0), the corre sponding arrow is not drawn. Table 1 Impacts of the alternatives Alternative Adaptation to manufacturing units localization Adaptation to competence localization Lower costs of duplications Suppliers Technology sources Customers Task duplications Ease of coordination W1 8 9 9 5 3 6 0 8 W2 0 2 9 2 7 8 0 8 W3 6 2 9 7 5 4 0 8 W4 6 7 8 6 5 7 2 7 W5 0 3 8 3 9 9 2 7 W6 5 4 8 8 7 5 2 7 W7 4 4 0 8 7 7 9 2 1 Map has been drawn with the aid of CmapTools v. 5.05, Institute for Human and Machine Co gnition (USA), http://cmap.ihmc.us. 78 J. Michnik Figure 1. Cognitive Map of the R&D organization problem (Scale: integers from 1 - lowest influ ence to 9 - highest influence, 0 - no direct influence = no arrow) 4.2. Results of Cognitive M ap analysis Following Roberts’ proposal one can calculate the total influence of each alter native on the ultimate goals. First, the partial influence for each path leading from the alternative to the ultimate goal is calculated by multiplying all the val ues along that path. The total influence of the given alternative on the chosen goal is the sum of the partial influences from all paths linking the alternative with the goal. A convenient way for doing calculations is to use the adjacency matrix corresponding to the map (see e.g.: Bang-Jensen and Gutin, 2008; Wallis, 2010). The results are presented in Table 2. Table 2 Total impact of alternatives on final concepts (objectives) Alternative Lower R&D costs Expanded and more efficient R&D W1 646 542 W2 60 719 W3 312 621 W4 462 1413 W5 90 1595 W6 330 1497 W7 288 4062 The figures in Table 2 clearly show that alternative W2 is dominated by W4-W7, W3 is dominated by W4 and W6, and W5 is dominated by W7. Hence, the non-dominated set contains four alternatives: W1, W4, W6 and W7. Among them alternative W1 has the highest score for the goal ‘Lower R&D costs’ and W7 has the highest score for ‘Expanded and more effcient R&D’. The main drawback of the method is visible at first sight. Longer paths get higher scores which is counterintuitive. Consequently, differences in path Multiple Criteria Choice of R&D Organization. 79 lengths can bias the results. Another important weakness of this model is that it does not provide any way for differentiating the importance of the intermediate and ultimate criteria which are at the top of the map. 5. D ecision Sup port w ith W IN G S WINGS (Weighted Influence Non-linear Gauge System) has been introduced to help solving complicated problems comprising many interrelated factors (Mich nik, 2013a). It can be applied to multiple criteria problems as a special case. WINGS does not need the limiting assumption of criteria independence which is often unrealistic in practical applications. 5.1. WINGS Procedure Based on the original paper (Michnik, 2013a) we briefly present here the steps of the WINGS procedure. At the beginning the user selects n components that constitute the system and analyzes the important interdependencies among them. The result of this step is presented as a digraph in which nodes represent components and arrows repre sent influences between two nodes. In our case the cognitive map developed ear lier will serve as a model of the system also for WINGS. Then, the user chooses verbal scales for both: strength of components and their influence. Again, to keep consistency with the previous model, we will use integers from 1 to 9. Zero will represent no influence. In the case of multiple cri teria decision making the strengths play the role of weights assigned to criteria at various levels. As the alternatives do not have weights assigned in advance, their strengths (weights) are all set to zero. The next stages of the WINGS procedure are as follows: 1. All numbers are inserted into the direct strength-influence matrix D, which is an n x n matrix with elements dij. • Values representing strengths of components are inserted into the main di agonal, i.e. dii = strength of component i. • Values representing influences are inserted so that for i ^ j, dij = influence of component i on component j. 2. The matrix D is scaled according to the following formula: 1 C = -D s where the scaling factor is defined as the sum of all elements of the matrix D, i.e.: n n i=1 j=1 80 J. Michnik 3. Calculate the total strength-influence matrix T from the formula (thanks to the scaling defined in Eq. (1) the series in the following formula converges, and thus the matrix T always exists): T = C + C2 + C3 + ... = C (I - C)-1 4. For each element in the system the row sum ri and the column sum Cj of the matrix T are calculated: n n ri = ^ j=1 tij, cj = ^ tij, i=1 where tij are the elements of the matrix T. 5. For each element in the system ri + ci and ri - ci are calculated. 6. The WINGS output for each component is: • ri - total impact, • ci - total receptivity, • ri + ci - total involvement, • sgn(r - ci) indicates the role (position) of the component in the system: positive ^ influencing (cause) group, negative ^ influenced (result) group; • | ri - ci | indicates the level of the role. Table 3 Weights for higher level intermediate and final concepts Lower B&R costs Lower internal transactions cost Lower costs of specialists’ transfers Lower costs of duplications Expanded and more efficient R&D Adaptation to external sources of innovation Knowledge acquisition speed Creativity Ease of coordination 4 4 4 2 7 7 7 7 4 5.2. Results of WINGS To apply the WINGS method to our case we need to asses the weights of the cri teria. Table 3 shows the numerical values of weights for the two ultimate criteria and for seven sub-criteria at the second-highest level. Now we use all the data: influences assigned in the previous model (Figure 1 and Table 1) and weights from Table 3 to do calculations in WINGS. In Table 4 there are values of ‘total involvement’ (r + c) for all alternatives (they are equal to ‘total im pact’ (r) because the alternatives have no incoming arrows). Ordering the alterna tives from the highest value of ‘total involvement’ to the lowest gives a ranking of 81 Multiple Criteria Choice of R&D Organization. the alternatives. When we compare it to the results of the previous model we can ob serve that WINGS ranks the alternatives differently. Alternative W1 is the leader, followed by W4, W6 and W7 respectively. However, there are some similarities. In both models W1 and W4 rank high while W2 and W3 rank lowest. Table 4 Ranking of alternatives Alternative W1 r+c 0,1299 1 Place in ranking W2 0,0819 7 W3 0,0933 6 W4 0,1093 2 W5 0,0934 5 W6 0,1048 3 W7 0,0937 4 It is possible to acquire some additional knowledge from the WINGS output. For example, it might be useful to analyze the role of the elements that constitute the system of R&D organization. The influences of alternatives would distort the evaluation so they need to be excluded from the network. WINGS calculations have been performed for 17 elements included in the model of R&D reorganization. The final scores have been re-scaled so that the highest absolute value of r + c or r - c is set to 10. The complete results are pre sented in Table 5 and in Figure 2 (for clarity, only selected points are labeled on the map). It is obvious that the ultimate goals have the highest values of both ‘involvement’ (r + c) and ‘role’ (r - c). Among other elements, ‘Adaptation to external sources of innovation’ and ‘Creativity’ have the highest involvement which suggests that these issues are very important for a successful R&D reor ganization and deserve the highest attention. Table 5 The involvement and role of the elements in WINGS model No. 1 2 3 4 5 6 7 8 9 10 11 12 13 14 15 16 17 Element Adaptation to manufacturing units localization Adaptation to competence localization Lower costs of duplications Suppliers Technology sources Customers Adaptation to external sources of innovation Task duplications Creativity Internal rivarly Knowledge acquiring speed Easiness of coordination Lower internal transactions cost Lower costs of specialists’ transfers Lower costs of duplications Lower R&D costs Expanded and more efficient R&D r+c 1,858 1,581 1,000 1,096 1,918 1,370 9,712 3,187 7,696 4,134 5,559 3,369 5,377 4,862 2,550 6,086 10,000 r-c 2,920 2,485 0,000 1,722 3,014 2,153 -3,518 5,008 -1,212 0,303 0,425 2,104 -0,326 -0,338 1,632 -6,374 -10,000 82 J. Michnik ‘Task duplications’ has the highest value of r - c. It is followed by ‘Technol ogy sources’ and ‘Adaptation to manufacturing units localization’. This means that these elements are among the most sensitive points of the system. It should be noted that the element ‘Task duplications’ is related to higher costs but its positive effects overcome that drawback. Figure 2. The map presenting the involvement and role of elements in the WINGS model (only se lected points are labeled) 6. C on clusions Reorganization of R&D, as any other significant change in a firm, is a compli cated organizational process that comprises many important issues and involves many people. Previous studies have shown how various aspects need to be con sidered when decisions about the most suitable way of conducting R&D are to be taken. Since there are strong relationships between the elements that are im portant for the underlying decisions, it is unlikely that the classic multiple criteria approach can be a suitable model for decision-aiding. Instead, the structural (or sys temic) approach can be much more adequate, especially when there are many sub jects with various views and different interests participating in a process. In this paper a decision-aiding procedure for the choice of R&D organization has been proposed. It starts with the construction of a cognitive map which is a powerful technique for structuring the problem and coordinating the various views of the participants. Since a cognitive map by itself is a qualitative tool with limited ability to differentiate among the decision alternatives (see e.g. Michnik, 2013b) it has been proposed to complement it by a quantitative as sessment of influences that formally led to the model proposed by Roberts. However, this approach has also some drawbacks, so the WINGS method is ad Multiple Criteria Choice of R&D Organization. 83 vocated as the most suitable method to help in decision-making. It also gives more insight into the problem by showing explicitly those issues that are the strongest influencers and those that are the most susceptible. It is worth noting that WINGS is technically simpler than other similar methods, such as ANP. Acknowledgements This research was supported by National Science Centre, Poland under the deci sion No. DEC-2013/09/B/HS4/01102. R eferences Bang-Jensen J., Gutin G.Z. (2008), Digraphs: Theory, Algorithms and Applica tions, Springer. Chiesa V. (2000), Global R&D Project Management and Organization: A Tax onomy, Journal of Product Innovation Management, 17(5), 341-359. De Meyer A. (1993), Management o f an International Network o f Industrial R&D Laboratories, R&D Management, 23(2), 109-120. Eden C. (2004), Analyzing Cognitive Maps to Help Structure Issues or Prob lems, European Journal of Operational Research, 159(3), 673-686. Michnik J. (2013a), Weighted Influence Non-linear Gauge System (WINGS) An Analysis Method fo r the Systems o f Interrelated Components, European Journal of Operational Research, 228(3), 536-544. Michnik J. (2013b), Wielokryterialne metody wspomagania decyzji w procesie innowacji, Wydawnictwo Uniwersytetu Ekonomicznego, Katowice. Roberts F.S. (1976), The Questionnaire Method [in:] Structure o f Decision: The Cognitive Maps o f Political Elites, R. Axelrod (ed.), Princeton University Press, Princeton, 333-342. Tidd J., Bessant J. (2009), Managing Innovation: Integrating Technological, Market and Organizational Change, 4th ed., John Wiley & Sons, Hoboken, NJ. Wallis W.D. (2010), A Beginner’s Guide to Graph Theory, Springer Science & Business Media.


© Copyright 2026