
Document 10133
December 2010
Series 13, Number 168
National Hospital
Discharge Survey:
2006 Annual Summary
Copyright information
All material appearing in this report is in the public domain and may be
reproduced or copied without permission; citation as to source, however, is
appreciated.
Suggested citation
Buie VC, Owings MF, DeFrances CJ, Golosinskiy A. National Hospital
Discharge Survey: 2006 summary. National Center for Health Statistics. Vital
Health Stat 13(168). 2010.
Library of Congress Catalog Card Number 97–10617
For sale by the U.S. Government Printing Office
Superintendent of Documents
Mail Stop: SSOP
Washington, DC 20402-9328
Printed on acid-free paper.
Series 13, Number 168
National Hospital
Discharge Survey:
2006 Annual Summary
Data From the National Health Care
Surveys
U.S. DEPARTMENT OF HEALTH AND HUMAN SERVICES
Centers for Disease Control and Prevention
National Center for Health Statistics
Hyattsville, Maryland
December 2010
DHHS Publication No. (PHS) 2011–1739
National Center for Health Statistics
Edward J. Sondik, Ph.D., Director
Jennifer H. Madans, Ph.D., Associate Director for Science
Division of Health Care Statistics
Jane E. Sisk, Ph.D., Director
Contents
Abstract . . . . . . . . . . . . . . . . . . . . . . . . . . . . . . . . . . . . . . . . . . . . . . . . . . . . . . . . . . . . . . . . . . . . . . . . . . . . . . . . . . . . . . . . . . . . . . . . . .
1
Highlights. . . . . . . . . . . . . . . . . . . . . . . . . . . . . . . . . . . . . . . . . . . . . . . . . . . . . . . . . . . . . . . . . . . . . . . . . . . . . . . . . . . . . . . . . . . . . . . . .
Patient and Hospital Characteristics . . . . . . . . . . . . . . . . . . . . . . . . . . . . . . . . . . . . . . . . . . . . . . . . . . . . . . . . . . . . . . . . . . . . . . . . . .
Diagnoses. . . . . . . . . . . . . . . . . . . . . . . . . . . . . . . . . . . . . . . . . . . . . . . . . . . . . . . . . . . . . . . . . . . . . . . . . . . . . . . . . . . . . . . . . . . . . . .
Procedures . . . . . . . . . . . . . . . . . . . . . . . . . . . . . . . . . . . . . . . . . . . . . . . . . . . . . . . . . . . . . . . . . . . . . . . . . . . . . . . . . . . . . . . . . . . . . .
Deliveries and Newborn Infants . . . . . . . . . . . . . . . . . . . . . . . . . . . . . . . . . . . . . . . . . . . . . . . . . . . . . . . . . . . . . . . . . . . . . . . . . . . . .
1
1
1
2
2
Introduction . . . . . . . . . . . . . . . . . . . . . . . . . . . . . . . . . . . . . . . . . . . . . . . . . . . . . . . . . . . . . . . . . . . . . . . . . . . . . . . . . . . . . . . . . . . . . . .
2
Methods . . . . . . . . . . . . . . . . . . . . . . . . . . . . . . . . . . . . . . . . . . . . . . . . . . . . . . . . . . . . . . . . . . . . . . . . . . . . . . . . . . . . . . . . . . . . . . . . . .
Data Source . . . . . . . . . . . . . . . . . . . . . . . . . . . . . . . . . . . . . . . . . . . . . . . . . . . . . . . . . . . . . . . . . . . . . . . . . . . . . . . . . . . . . . . . . . . . .
Estimation . . . . . . . . . . . . . . . . . . . . . . . . . . . . . . . . . . . . . . . . . . . . . . . . . . . . . . . . . . . . . . . . . . . . . . . . . . . . . . . . . . . . . . . . . . . . . .
Use of Tables . . . . . . . . . . . . . . . . . . . . . . . . . . . . . . . . . . . . . . . . . . . . . . . . . . . . . . . . . . . . . . . . . . . . . . . . . . . . . . . . . . . . . . . . . . . .
3
3
4
4
References . . . . . . . . . . . . . . . . . . . . . . . . . . . . . . . . . . . . . . . . . . . . . . . . . . . . . . . . . . . . . . . . . . . . . . . . . . . . . . . . . . . . . . . . . . . . . . . .
5
Appendix. Technical Notes . . . . . . . . . . . . . . . . . . . . . . . . . . . . . . . . . . . . . . . . . . . . . . . . . . . . . . . . . . . . . . . . . . . . . . . . . . . . . . . . . .
53 Text Figures
1.
2.
3.
4.
5.
Inpatient discharges by size of hospital and metropolitan status of hospital: United States, 2006 . . . . . . . . . . . . . . . . . . . .
Age distribution for hospital discharges, days of care, and the civilian population: United States, 2006 . . . . . . . . . . . . . . .
Rate of discharges age 65 and over with a first-listed diagnosis of stroke (cerebrovascular disease), by age group:
United States, 1996–2006. . . . . . . . . . . . . . . . . . . . . . . . . . . . . . . . . . . . . . . . . . . . . . . . . . . . . . . . . . . . . . . . . . . . . . . . . . . . . .
Discharges and days of care, by first-listed diagnosis ICD–9–CM chapters: United States, 2006 . . . . . . . . . . . . . . . . . . . .
Number and type of procedures for inpatient discharges, by age group: United States, 2006. . . . . . . . . . . . . . . . . . . . . . . .
2
2
3
3
4
Detailed Tables
Tables on Patient and Hospital Characteristics
1.
2.
3.
4.
5.
6.
7.
8.
Number and rate of discharges from short-stay hospitals and of days of care with average length of stay, by age:
United States, selected years 1970–2006. . . . . . . . . . . . . . . . . . . . . . . . . . . . . . . . . . . . . . . . . . . . . . . . . . . . . . . . . . . . . . . . . .
Number, percent distribution, and rate of discharges from short-stay hospitals and of days of care with average length
of stay, by sex and age: United States, 2006 . . . . . . . . . . . . . . . . . . . . . . . . . . . . . . . . . . . . . . . . . . . . . . . . . . . . . . . . . . . . . .
Number and rate of discharges from short-stay hospitals and of days of care with average length of stay, by sex, age,
and geographic region: United States, 2006 . . . . . . . . . . . . . . . . . . . . . . . . . . . . . . . . . . . . . . . . . . . . . . . . . . . . . . . . . . . . . . .
Number of discharges from short-stay hospitals and of days of care with average length of stay, by principal expected
source of payment, sex, age, and geographic region: United States, 2006 . . . . . . . . . . . . . . . . . . . . . . . . . . . . . . . . . . . . . .
Number and percent distribution of discharges from short-stay hospitals and of days of care with average length of
stay, by bed size of hospital, according to sex, age, and geographic region: United States, 2006 . . . . . . . . . . . . . . . . . . .
Number and percent distribution of discharges from short-stay hospitals and of days of care, with average length
of stay, by hospital ownership, according to sex and age: United States, 2006 . . . . . . . . . . . . . . . . . . . . . . . . . . . . . . . . . .
Number and percent distribution of discharges by type and source of admission to short-stay hospitals, according to
sex and age: United States, 2006. . . . . . . . . . . . . . . . . . . . . . . . . . . . . . . . . . . . . . . . . . . . . . . . . . . . . . . . . . . . . . . . . . . . . . .
Number and percent distribution of discharges from short-stay hospitals and of days of care, with average length
of stay, by disposition of patient, according to sex, age, and geographic region: United States, 2006 . . . . . . . . . . . . . . . .
7
8
9
11 14 16 17 18 iii
Diagnosis Tables
9.
10.
11.
12.
13.
14.
15.
16.
17.
18.
19.
20.
21.
22.
23.
24.
25.
Number and rate of discharges from short-stay hospitals and of days of care, with average length of stay, by selected
first-listed diagnostic categories: United States, 2006 . . . . . . . . . . . . . . . . . . . . . . . . . . . . . . . . . . . . . . . . . . . . . . . . . . . . . .
Number and rate of discharges from short-stay hospitals with average length of stay, for patients age 65 and over,
by age and selected first-listed diagnostic categories: United States, 2006. . . . . . . . . . . . . . . . . . . . . . . . . . . . . . . . . . . . . .
Number of discharges from short-stay hospitals, by age and first-listed diagnosis: United States, 2006 . . . . . . . . . . . . . .
Rate of discharges from short-stay hospitals, by age and first-listed diagnosis: United States, 2006 . . . . . . . . . . . . . . . . .
Average length of stay for discharges from short-stay hospitals, by age and first-listed diagnosis: United States, 2006. .
Number of discharges from short-stay hospitals, by sex and first-listed diagnosis: United States, 2006 . . . . . . . . . . . . . .
Rate of discharges from short-stay hospitals, by sex and first-listed diagnosis: United States, 2006 . . . . . . . . . . . . . . . . .
Average length of stay for discharges from short-stay hospitals, by sex and first-listed diagnosis: United States, 2006 . .
Number of discharges from short-stay hospitals, by geographic region and first-listed diagnosis: United States, 2006 . .
Rate of discharges from short-stay hospitals, by geographic region and first-listed diagnosis: United States, 2006 . . . . .
Average length of stay for discharges from short-stay hospitals, by geographic region and first-listed diagnosis:
United States, 2006. . . . . . . . . . . . . . . . . . . . . . . . . . . . . . . . . . . . . . . . . . . . . . . . . . . . . . . . . . . . . . . . . . . . . . . . . . . . . . . . . .
Number of all-listed diagnoses for discharges from short-stay hospitals, by age and diagnosis: United States, 2006 . . . .
Number of all-listed diagnoses for discharges from short-stay hospitals, by sex and diagnosis: United States, 2006 . . . .
Number of all-listed diagnoses for discharges from short-stay hospitals, by geographic region and diagnosis:
United States, 2006. . . . . . . . . . . . . . . . . . . . . . . . . . . . . . . . . . . . . . . . . . . . . . . . . . . . . . . . . . . . . . . . . . . . . . . . . . . . . . . . . .
Number and rate of discharges from short-stay hospitals with a human immunodeficiency virus diagnosis, by selected
characteristics: United States, selected years 1990–2006 . . . . . . . . . . . . . . . . . . . . . . . . . . . . . . . . . . . . . . . . . . . . . . . . . . . .
Annual average number and rate of discharges from short-stay hospitals with a first-listed injury diagnosis, by Barell
injury diagnosis matrix categories: United States, 2004–2006. . . . . . . . . . . . . . . . . . . . . . . . . . . . . . . . . . . . . . . . . . . . . . . .
Number and rate of deaths for discharges from short-stay hospitals, by age and selected first-listed diagnosis:
United States, 2006. . . . . . . . . . . . . . . . . . . . . . . . . . . . . . . . . . . . . . . . . . . . . . . . . . . . . . . . . . . . . . . . . . . . . . . . . . . . . . . . . .
20 21 23 24 25
26 27 28
29
30 31 32 33 34 35 36 37 Procedure Tables
26.
27.
28.
29.
30.
31.
32.
33.
34.
35.
Number of discharges from short-stay hospitals with and without procedures and percentage with procedures, by
selected characteristics: United States, 2006 . . . . . . . . . . . . . . . . . . . . . . . . . . . . . . . . . . . . . . . . . . . . . . . . . . . . . . . . . . . . . .
Number and rate of all-listed surgical and nonsurgical procedures for discharges from short-stay hospitals, by selected
procedure categories: United States, 2006. . . . . . . . . . . . . . . . . . . . . . . . . . . . . . . . . . . . . . . . . . . . . . . . . . . . . . . . . . . . . . . .
Number and rate of all-listed surgical and nonsurgical procedures for patients age 65 and over discharged from
short-stay hospitals, by age and selected procedure categories: United States, 2006 . . . . . . . . . . . . . . . . . . . . . . . . . . . . . .
Number and rate of discharges from short-stay hospitals with a coronary artery bypass graft and number and rate of
procedures, by sex, age, and geographic region: United States, 2006 . . . . . . . . . . . . . . . . . . . . . . . . . . . . . . . . . . . . . . . . . .
Number of all-listed procedures for discharges from short-stay hospitals, by age and procedure category: United States,
2006. . . . . . . . . . . . . . . . . . . . . . . . . . . . . . . . . . . . . . . . . . . . . . . . . . . . . . . . . . . . . . . . . . . . . . . . . . . . . . . . . . . . . . . . . . . . . .
Rate of all-listed procedures for discharges from short-stay hospitals, by age and procedure category: United States,
2006. . . . . . . . . . . . . . . . . . . . . . . . . . . . . . . . . . . . . . . . . . . . . . . . . . . . . . . . . . . . . . . . . . . . . . . . . . . . . . . . . . . . . . . . . . . . . .
Number of all-listed procedures for discharges from short-stay hospitals, by sex and procedure category: United States,
2006. . . . . . . . . . . . . . . . . . . . . . . . . . . . . . . . . . . . . . . . . . . . . . . . . . . . . . . . . . . . . . . . . . . . . . . . . . . . . . . . . . . . . . . . . . . . . .
Rate of all-listed procedures for discharges from short-stay hospitals, by sex and procedure category: United States,
2006. . . . . . . . . . . . . . . . . . . . . . . . . . . . . . . . . . . . . . . . . . . . . . . . . . . . . . . . . . . . . . . . . . . . . . . . . . . . . . . . . . . . . . . . . . . . . .
Number of all-listed procedures for discharges from short-stay hospitals, by geographic region and procedure category:
United States, 2006. . . . . . . . . . . . . . . . . . . . . . . . . . . . . . . . . . . . . . . . . . . . . . . . . . . . . . . . . . . . . . . . . . . . . . . . . . . . . . . . . .
Rate of all-listed procedures for discharges from short-stay hospitals, by geographic region and procedure category:
United States, 2006. . . . . . . . . . . . . . . . . . . . . . . . . . . . . . . . . . . . . . . . . . . . . . . . . . . . . . . . . . . . . . . . . . . . . . . . . . . . . . . . . .
37 38 39 40 41 42 43 44 45 46 Tables on Deliveries and Newborn Infants
36.
37.
38.
39.
iv
Number, percent distribution, and rate of discharges and days of care, with average length of stay for females with
deliveries discharged from short-stay hospitals, by type of delivery, age, and geographic region: United States, 2006 . .
Number and percent distribution of females with deliveries discharged from short-stay hospitals, by length of stay
and type of delivery: United States, selected years 1980–2006 . . . . . . . . . . . . . . . . . . . . . . . . . . . . . . . . . . . . . . . . . . . . . . .
Number and rate of selected obstetrical procedures for females with deliveries discharged from short-stay hospitals:
United States, selected years 1980–2006. . . . . . . . . . . . . . . . . . . . . . . . . . . . . . . . . . . . . . . . . . . . . . . . . . . . . . . . . . . . . . . . .
Number and rate of females with deliveries discharged from short-stay hospitals, by type of delivery: United States,
selected years 1980–2006. . . . . . . . . . . . . . . . . . . . . . . . . . . . . . . . . . . . . . . . . . . . . . . . . . . . . . . . . . . . . . . . . . . . . . . . . . . . .
47
48 49 49 40.
41.
42.
43.
44.
Number and rate of females with deliveries discharged from short-stay hospitals, by type of delivery, age, and
geographic region: United States, 2006. . . . . . . . . . . . . . . . . . . . . . . . . . . . . . . . . . . . . . . . . . . . . . . . . . . . . . . . . . . . . . . . . .
Number, percent distribution, and average length of stay for newborn infants discharged from short-stay hospitals,
by sex, geographic region, and health status: United States, 2006 . . . . . . . . . . . . . . . . . . . . . . . . . . . . . . . . . . . . . . . . . . . .
Number and percent distribution of newborn infants discharged from short-stay hospitals, by length of stay, and
average length of stay, by health status: United States, selected years 1980–2006 . . . . . . . . . . . . . . . . . . . . . . . . . . . . . . .
Number of all-listed diagnoses for sick newborn infants discharged from short-stay hospitals, by sex and selected
diagnostic categories: United States, 2006 . . . . . . . . . . . . . . . . . . . . . . . . . . . . . . . . . . . . . . . . . . . . . . . . . . . . . . . . . . . . . . .
Number and percentage of male newborn infants circumcised during hospitalization, by geographic region:
United States, selected years 1980–2006. . . . . . . . . . . . . . . . . . . . . . . . . . . . . . . . . . . . . . . . . . . . . . . . . . . . . . . . . . . . . . . . .
50 51 51 52 52 Appendix Tables
I.
II.
III.
IV.
V.
VI.
Civilian population by age, geographic region, and sex: United States, 2006 . . . . . . . . . . . . . . . . . . . . . . . . . . . . . . . . . . .
Estimated parameters for approximate relative standard error equations for National Hospital Discharge Survey
statistics, by selected characteristics: United States, 2006 . . . . . . . . . . . . . . . . . . . . . . . . . . . . . . . . . . . . . . . . . . . . . . . . . . .
Code numbers for Barell injury diagnosis matrix categories in Table 24 . . . . . . . . . . . . . . . . . . . . . . . . . . . . . . . . . . . . . . .
Code numbers for procedures considered nonsurgical in the National Hospital Discharge Survey, by ICD–9–CM
category, 2006. . . . . . . . . . . . . . . . . . . . . . . . . . . . . . . . . . . . . . . . . . . . . . . . . . . . . . . . . . . . . . . . . . . . . . . . . . . . . . . . . . . . . .
Changes in ICD–9–CM diagnosis codes, 1986–2005. . . . . . . . . . . . . . . . . . . . . . . . . . . . . . . . . . . . . . . . . . . . . . . . . . . . . . .
Changes in ICD–9–CM procedure codes, 1986–2005 . . . . . . . . . . . . . . . . . . . . . . . . . . . . . . . . . . . . . . . . . . . . . . . . . . . . . .
53 56 58 59 61 68 Appendix Figure
Medical abstract form for the National Hospital Discharge Survey, 2006 . . . . . . . . . . . . . . . . . . . . . . . . . . . . . . . . . . . . . .
54 v
Objectives
National Hospital Discharge
Survey: 2006 Annual Summary
This report presents 2006 national
estimates and selected trend data on
the use of nonfederal short-stay
hospitals in the United States.
Estimates are provided by selected
patient and hospital characteristics,
diagnoses, and surgical and
nonsurgical procedures performed.
Estimates of diagnoses and procedures
are presented according to the
International Classification of Diseases,
Ninth Revision, Clinical Modification
codes.
by Verita C. Buie, Dr.P.H.; Maria F. Owings, Ph.D.; Carol J.
DeFrances, Ph.D.; and Alexander Golosinskiy, M.S., Division of
Health Care Statistics
Methods
Patient and Hospital
Characteristics
The estimates are based on data
collected through the National Hospital
Discharge Survey (NHDS). The survey
has been conducted annually since
1965. In 2006, data were collected for
approximately 376,000 discharges. Of
the 478 eligible nonfederal short-stay
hospitals in the sample, 438
(92 percent) responded to the survey.
Results
An estimated 34.9 million inpatients
were discharged from nonfederal
short-stay hospitals in 2006. These
discharges used 166.3 million days of
care and had an average length of stay
of 4.8 days. In 2006, hospitals with
under 100 beds accounted for
77 percent of inpatient discharges in
nonmetropolitan areas, but only
13 percent of inpatient discharges in
metropolitan areas. Forty-three percent
of the total days of care were
accounted for by persons age 65 and
over, although this age group
represented only 12 percent of the
population. The rate of discharges with
a first-listed diagnosis of stroke among
persons age 65–74, 75–84, and 85 and
over dropped significantly from 1996 to
2006. The leading diagnostic category
was diseases of the circulatory system.
Among the 8.7 million inpatient
discharges age 45–64, 4.2 million
(48 percent) had at least one surgical
procedure.
Keywords: hospitalization c inpatient
c diagnoses c procedures
Highlights
+ There were an estimated 34.9
million discharges from nonfederal
short-stay hospitals in 2006. Those
discharges used an estimated 166.3
million days of care and were
hospitalized for an average of 4.8
days per stay.
+ About 77 percent of inpatients
discharged from nonmetropolitan
hospitals were from facilities with
fewer than 100 beds, while hospitals
of the same bed size accounted for
only 13 percent of all inpatient
discharges among metropolitan
hospitals (Figure 1). Sixteen percent
of all discharges from nonfederal
short-stay hospitals in 2006 were
from hospitals not in metropolitan
areas.
+ In 2006, 12 percent of the U.S.
population was age 65 and over;
however, this age group used
approximately 43 percent of the total
days of care and comprised
38 percent of all inpatient
discharges. This compares to
20 percent of the U.S. population
who were under age 15 who
accounted for only 7 percent of the
total days of care and 7 percent of
all inpatient discharges (Figure 2).
+ Regionally, the average length of
stay in days for nonfederal
short-stay hospitals in the United
States ranged from 4.2 in the
Midwest to 5.3 in the Northeast.
+ The status at discharge for
77.2 percent of all inpatients was
described as routine or discharged to
home.
Diagnoses
+ From 1996 to 2006 the rate of
discharges with a first-listed
diagnosis of stroke (cardiovascular
disease) declined 18 percent for
those age 65–74, 34 percent for
those age 75–84, and 29 percent for
those age 85 and over (Figure 3).
+ The leading cause of children’s
hospitalizations was respiratory
diseases, which accounted for
576,000 (25 percent) of discharges
under age 15.
+ Inpatients under age 65 with a
first-listed diagnosis of heart disease
were less likely to die during
hospitalization (1.2 per 100
discharges) than those age 65 and
over (3.5 per 100 discharges).
+ Circulatory diseases accounted for
both the greatest number of total
days of care (27.4 million days) and
the largest number of discharges
(6.2 million discharges) among the
major diagnostic categories
(Figure 4).
This report was prepared in the Division of Health Care Statistics. The report was edited by Betsy M.
Finley, Laura Drescher, and Demarius V. Miller, CDC/CCHIS/NCHM/Division of Creative Services,
Writer-Editor Services Branch; typeset by Annette F. Holman, and graphics produced by Sarah M. Hinkle,
CDC/OSELS/NCHS/OD/Office of Information Services, Information Design and Publishing Staff.
Page 1
Page 2 [ Series 13, No. 168
200–
299
beds
100–199 9%
beds
14%
500 beds Under 100
beds
or more
16%
13%
100–199
beds
22%
300–499
beds
28%
Under 100 beds
77%
200–299
beds
21%
Hospitals in metropolitan areas
Hospitals not in metropolitan areas
SOURCE: CDC/NCHS, National Hospital Discharge Survey, 2006.
Figure 1. Inpatient discharges by size of hospital and metropolitan status of hospital:
United States, 2006
+ Over one-half of all deliveries
resulted in a length of stay of 2 or
fewer days.
+ The rate of episiotomies per 100
vaginal deliveries decreased from
43.2 in 1996 to 16.0 in 2006.
+ Fifty-four percent of newborn
infants were discharged in 2006
without any illness or risk-related
diagnoses. These newborn infants
had an average length of stay of 2.1
days compared with 4.9 days among
newborns with at least one illness or
risk-related diagnosis.
+ In 2006, 56.1 percent of all male
newborn infants were circumcised
during the birth hospitalization
compared with 60.2 in 1996.
Introduction
Under 15 years
15–44 years
45–64 years
65 years and over
Discharges
Days of care
Population
0
10
20
30
40
50
60
Percent
70
80
90
100
SOURCE: CDC/NCHS, National Hospital Discharge Survey, 2006.
Figure 2. Age distribution for hospital discharges, days of care, and the civilian population:
United States, 2006
Procedures
+ In 2006, 28.1 million surgical
procedures and 17.9 million
nonsurgical procedures were
performed on hospital inpatients.
+ Of the 8.7 million discharges of
inpatients age 45–64, 4.2 million
(48%) had at least one surgical
procedure (Figure 5).
+ Among the 444,000 coronary artery
bypass grafts performed in 2006,
only 27.7 percent were performed on
women.
+ The rate of total hip replacement
among inpatients age 65 and over
(33.8 per 10,000 population) was
over 2 times that of their
counterparts age 45–64 (12.3 per
10,000 population).
Deliveries and Newborn
Infants
+ In 2006, approximately 4.1 million
discharges were for delivery; their
average stay was 2.6 days.
This report presents data from the
2006 National Hospital Discharge
Survey (NHDS). The survey has been
conducted continuously by the Centers
for Disease Control and Prevention’s
(CDC) National Center for Health
Statistics (NCHS) since 1965. National
estimates of hospital use derived from
NHDS are published for each calendar
year by NCHS. This report provides a
summary of the 2006 data, including
estimates of diagnoses and procedures
by the International Classification of
Diseases, Ninth Revision, Clinical
Modification (ICD–9–CM) codes (1).
NHDS is the principal source for
national data on the characteristics of
inpatients discharged from nonfederal
short-stay hospitals. Data from NHDS
are used for evaluating the health status
of the population, planning programs to
improve health status, studying trends in
morbidity, and carrying out research
activities in the health field (2–6). The
Department of Health and Human
Services uses NHDS data in the
development and monitoring of goals
for the Healthy People 2010 health
objectives. Other CDC centers,
including the National Center for Injury
Prevention and Control, and the
National Center for Chronic Disease
Prevention and Health Promotion, use
NHDS to track a variety of conditions,
including injuries and chronic diseases.
Series 13, No. 168 [ Page 3
450
Rate per 10,000 population
400
85 years and over
350
300
75–84 years 250
200
65–74 years
150
100
50
0
1996 1997 1998 1999 2000 2001 2002 2003 2004 2005 2006
Year
SOURCE: CDC/NCHS, National Hospital Discharge Survey, 1996–2006.
Figure 3. Rate of discharges age 65 and over with a first-listed diagnosis of stroke
(cerebrovascular disease), by age group: United States, 1996–2006
Discharges
Methods
Days of care
Circulatory
diseases
Supplemental
classifications
Data Source
Digestive
diseases
Respiratory
diseases
Injury and
poisoning
Mental
disorders
Genitourinary
diseases
Musculoskeletal
diseases
Endocrine, nutritional,
and metabolic diseases
Neoplasms
Infectious and
parasitic diseases
7
short-stay hospitals. Data on ambulatory
medical care services are collected in
other NCHS surveys. Data on
ambulatory surgery performed in
hospitals and freestanding surgery
centers were collected in the National
Survey of Ambulatory Surgery from
1994 through 1996 and in 2006 (9,10).
The National Ambulatory Medical Care
Survey obtains information on visits to
physicians’ offices (11). The National
Hospital Ambulatory Medical Care
Survey (NHAMCS) collects data on
visits to hospital outpatient and
emergency departments (12,13).
NHAMCS started covering hospitalbased ambulatory surgery centers in
2009, and will add freestanding centers
in 2010. Information about long-term
care is collected in the National Nursing
Home Survey (14) and the National
Home and Hospice Care Survey (15).
2
0
13
3
8
Number in millions
18
23
28
SOURCE: CDC/NCHS, National Hospital Discharge Survey, 2006.
Figure 4. Discharges and days of care, by first-listed diagnosis ICD–9–CM chapters:
United States, 2006
The National Institutes of Health make
extensive use of NHDS data on heart
disease and cancer. The Veterans
Administration and Department of
Defense compare NHDS data with
statistics on the inpatient care provided
in their hospitals (7–8).
NHDS produces estimates of
utilization by inpatients in nonfederal
NHDS data are collected from a
sample of inpatient records acquired
from a national probability sample of
hospitals. Because persons with multiple
discharges during the year can be
sampled more than once, NHDS
produces estimates for discharges, not
people. General hospitals, children’s
general hospitals, or hospitals with an
average length of stay of fewer than 30
days for all patients are eligible for
inclusion in the survey. Federal, military,
and Department of Veterans Affairs
hospitals, as well as hospital units of
institutions (such as prison hospitals)
and hospitals with fewer than six beds
staffed for patient use, are excluded.
From 1988 until 2003, the hospital
sampling frame for NHDS was
constructed from the SMG Hospital
Market Database (16). In 2003 and
2006, the sampling frame was
constructed from products of Verispan,
L.L.C., specifically their ‘‘Healthcare
Market Index’’ and their ‘‘Hospital
Market Profiling Solution’’ (17). These
two products were formerly known as
the SMG Hospital Market Database. The
sampling frame and sample are updated
Page 4 [ Series 13, No. 168
12
Only nonsurgical procedures
At least one surgical procedure
Number in millions
10
No procedures
8
6
For manual data collection in
NHDS, an ongoing quality control
program is utilized for medical coding
and data entry of abstraction forms.
Approximately 10 percent of abstract
forms are independently recoded, with
discrepancies resolved by a chief coder.
The overall 2006 error rate for records
manually coded was 0.3 percent for data
entry of medical (ICD–9–CM) coding
and 0.3 percent for data entry of
demographic information.
4
Estimation
2
0
Under 15
15–44
45–64
65–74
Age in years
75–84
85 and over
SOURCE: CDC/NCHS, National Hospital Discharge Survey, 1996–2006.
Figure 5. Number and type of procedures for inpatient discharges, by age group:
United States, 2006
every 3 years to include hospitals that
opened or changed their eligibility status
since the previous update (18).
Since 1988, NHDS has used a
modified three-stage sample design.
Units selected at the first stage consist
of either hospitals or geographic areas,
such as counties, groups of counties, or
metropolitan statistical areas in the 50
states and the District of Columbia.
Within sampled geographic areas,
additional hospitals are selected. Finally,
at the last stage, discharges are selected
within sampled hospitals using
systematic random sampling.
For 2006, the sample consisted of
501 hospitals, of which 23 were out of
scope because they had gone out of
business or were otherwise ineligible to
be in the NHDS universe. Of the 478
in-scope (eligible) hospitals, 438
(92 percent) responded to the survey.
Data were collected for approximately
376,000 discharges from the 438
responding hospitals.
Two data collection procedures are
used for the survey. One is a manual
system in which sample selection and
transcription of information from
medical records are performed by
hospital staff or by staff of the U.S.
Census Bureau on behalf of NCHS. In
addition, NCHS purchases electronic
files containing medical record data
from commercial organizations, state
data systems, hospitals, or hospital
associations. Discharges from these files
are systematically sampled.
Approximately 45 percent of respondent
hospitals provided data through this
automated system for the 2006 survey.
The NHDS medical abstract form
(Appendix figure) and the automated
data contain items that relate to the
personal characteristics of the patient.
These include birth date (converted to
age), sex, race, ethnicity, marital status,
ZIP Code, and expected sources of
payment. Administrative items such as
admission and discharge dates,
admission type and source, and
discharge status are also included. The
medical information includes final
medical diagnoses, procedures
performed, and dates of surgery.
Medical data are coded according to the
International Classification of Diseases,
Ninth Revision, Clinical Modification
(ICD–9–CM) (1). Date of birth and ZIP
Code are confidential information and
are not available to the public, though
they can be used, with privacy
safeguards, through the NCHS Research
Data Center: http://www.cdc.gov/rdc/.
Because they are sample data, the
survey data must be inflated or weighted
to produce national estimates. The
estimation procedure produces
essentially unbiased national estimates
and has three basic components:
inflation by reciprocals of the
probabilities of sample selection,
adjustment for nonresponse, and
population weighting ratio adjustments.
These three components of the final
weight are described in more detail in
another report (18). Information about
the standard errors of statistics for the
2006 NHDS is found in Table II.
Use of Tables
Demographic information about
patients and utilization estimates by
hospital characteristics are shown in
Tables 1–8. Diagnostic data are included
in Tables 9–25 and information about
procedures is found in Tables 26–35.
Tables 36–44 present data on deliveries
and newborn infants. Beginning with
2006 NHDS data, estimates of
diagnoses, days of care by diagnosis,
and procedures shown by ICD–9–CM
codes previously referred to as detailed
Tables 45–48 are available only on the
Web at http://www.cdc.gov/nchs/nhds/
nhds_products.htm. Figures 1–5
highlight findings from the survey data.
Definitions of terms used in these tables
and figures are presented in the
appendix.
Diagnostic and procedure data are
presented by chapter using the
ICD–9–CM classification system with
frequently occurring broad and specific
subcategories within chapters also
shown (Tables 11–22 and 30–35). The
Series 13, No. 168 [ Page 5
diagnostic categories shown in Table 9
are the same as the subcategories within
chapters shown in Tables 11–18.
Categories shown in Table 10 become
subcategories in Tables 11–18 for the
estimates of 100,000 or more for
patients age 65 and over.
The procedure categories shown in
Table 27 are the same as subcategories
in Tables 30–35, except that they are
divided into surgical and nonsurgical
components. The categories in Table 28
are subcategories in Tables 30–35 for
patients age 65 and over, divided into
surgical and nonsurgical components
with estimates of 100,000 or more. In
2006, the list of nonsurgical procedures
was updated (see Table IV for the
current list of procedure codes
considered nonsurgical).
In 2002, the ICD–9–CM
Coordination and Maintenance
Committee created Chapter 00,
‘‘Procedures and Interventions Not
Elsewhere Classified,’’ as a way to
handle space limitations of the existing
hierarchical structure. From 2003
through 2005, NHDS included this new
chapter in the miscellaneous diagnostic
and therapeutic procedures and new
technologies category. Beginning with
the 2006 NHDS, 00 codes that had
previous code assignments in other
chapters are included in the categories
and chapters of their previous codes. For
example, ‘‘Balloon angioplasty of
coronary artery or coronary
atherectomy’’ has been reassigned
ICD–9–CM code 00.66, but it is
included with other operations of the
cardiovascular system. This approach
has been adopted to preserve
comparability in procedure categories
over time.
Diagnoses assigned ICD–9–CM
codes E800–E999 (supplementary
classification of external causes of
injury and poisoning) are not included
in this report. However, detailed
information about injury diagnoses and
E codes has been published (19).
Injury data are presented in this
report using the Barell injury diagnosis
matrix (Table 24). This is a twodimensional array of ICD–9–CM codes
(excluding external cause codes) that
groups injuries by body site and type of
injury. The codes for the matrix are
shown in Table III. The matrix provides
a standard format for reporting injury
data that improves the usefulness and
comparability of epidemiological and
clinical analyses (20). Data categorized
using the Barell matrix are included in
this report to provide a national
benchmark for states and localities.
Table 29 compares the number of
coronary artery bypass graft (CABG)
procedures to the number of discharges
of inpatients who received them.
Multiple codes are often assigned to a
single patient to indicate the number and
type of bypasses performed during a
single operation, resulting in a much
larger number of procedures than of
discharges who had them.
Beginning with 2003 NHDS data,
estimates for the procedure of ‘‘Insertion
of coronary artery stent(s)’’ are shown
separately from estimates for ‘‘Balloon
angioplasty of coronary artery or
coronary atherectomy’’ (Tables 27–28
and 30–35). Previously, these were
combined in the category ‘‘Removal of
coronary artery obstruction and insertion
of stent(s).’’
Tables 8 and 25 show death rates
per 100 hospital discharges, based on
the first-listed diagnosis of a patient
who dies in the hospital. These rates are
different from mortality rates published
regularly by NCHS (21), which are
ratios of deaths to the population.
Mortality rates include deaths that occur
in hospitals and other settings and are
for the underlying cause of death, which
may differ from the first-listed diagnosis
of a patient who dies in the hospital.
Data for newborn infants are
included only in Tables 41–44. Because
estimates of newborn infants are based
on a sample and because they do not
include out-of-hospital births, these
estimates may not agree with data on
births published in the National Vital
Statistics Reports (22), which are based
on birth certificate data.
Tables that provide information by
three-digit, four-digit, and five-digit
ICD–9–CM diagnostic codes, as well as
two-digit, three-digit, and four-digit
procedure codes are no longer included
in this report. These tables are now
available on the Web at http://www.
cdc.gov/nchs/nhds/nhds_products.htm.
Estimates in all tables are rounded
to the nearest thousand. Totals may
include data for categories that are not
shown individually in the tables. For
these reasons, figures within tables do
not always add to the totals. Rates,
percentages, and average lengths of stay
are calculated from unrounded figures
and may not precisely agree with
measures calculated from rounded data.
Because of low reliability, estimates
in Tables 1–44 are suppressed if they
have relative standard errors of more
than 30 percent or are based on fewer
than 30 records; only an asterisk (*)
then appears in the tables. Estimates
based on 30–59 records are presented
but are preceded by an asterisk (*) to
indicate that they also may have low
reliability.
The population estimates used to
compute rates are shown in Appendix
Table I. These are postcensal estimates for
July 1, 2006 based on the 2000 census.
A weighted least squares regression
method (23) was used to test the
significance of trend data shown in
Figure 3. Throughout the report, the
two-sided t test was used to test for
differences among NHDS estimates.
Terms that express differences such as
higher, lower, largest, smallest, leading,
increased, or decreased were used in this
report only when the differences were
statistically significant at the 0.05 level.
References
1.
2.
3.
4.
National Center for Health Statistics.
International Classification of Diseases,
Ninth Revision, Clinical Modification,
6th ed. Washington, DC: Public Health
Service. 2004. Available from:
http://www.cdc.gov/nchs/icd/
icd9cm.htm.
Oliphant SS, Wang L, Bunker CH,
Lowder JL. Trends in stress urinary
incontinence inpatient procedures in the
United States, 1979–2004. Am J Obstet
Gynecol 200(5):521.e1–6. 2009.
Frankman EA, Wang L, Bunker CH,
Lowder JL. Episiotomy in the United
States: Has anything changed? Am J
Obstet Gynecol 200(5):573.e1–7. 2009.
Stein PD, Goldman J, Matta F,
Yaekoub AY. Diabetes mellitus and risk
of venous thromboembolism. Am J
Med Sci 337(4):259–64. 2009.
Page 6 [ Series 13, No. 168
5.
6.
7.
8.
9.
10.
11.
12.
13.
14.
Turaga K, Kaushik M, Forse RA,
Sasson AR. In hospital outcomes after
pancreatectomies: An analysis of a
national database from 1996 to 2004. J
Surg Oncol 98(3):156–60. 2008.
Fang J, Mensah GA, Croft JB, Keenan
NL. Heart failure-related hospitalization
in the U.S., 1979 to 2004. J Am Coll
Cardiol 52(6):428–34. 2008.
Rosenthal GE, Kaboli PJ, Barnett MJ.
Differences in length of stay in
Veterans Health Administration and
other United States hospitals: Is the gap
closing? Med Care 41(8):882–94. 2003.
Jackson JL, Cheng EY, Jones DL,
Meyer G. Comparison of discharge
diagnoses and inpatient procedures
between military and civilian health
care systems. Mil Med 164(10):701–4.
1999.
Owings MF, Kozak LJ. Ambulatory
and inpatient procedures in the United
States, 1996. National Center for
Health Statistics. Vital Health Stat
13(139). 1998. Available from:
http://www.cdc.gov/nchs/data/series/
sr_13/sr13_139.pdf.
Cullen KA, Hall MJ, Golosinskiy A.
Ambulatory surgery in the United
States, 2006. National health statistics
reports; no 11. Hyattsville, MD:
National Center for Health Statistics.
2009. Available from: http://www.
cdc.gov/nchs/data/nhsr/nhsr011.pdf.
Cherry DK, Hing E, Woodwell DA,
Rechtsteiner EA. National Ambulatory
Medical Care Survey: 2006 summary.
National health statistics reports; no 3.
Hyattsville, MD: National Center for
Health Statistics. 2008. Available from:
http://www.cdc.gov/nchs/data/nhsr/
nhsr003.pdf.
Hing E, Hall MJ, Xu J. National
Hospital Ambulatory Medical Care
Survey: 2006 outpatient department
summary. National health statistics
reports; no 4. Hyattsville, MD: National
Center for Health Statistics. 2008.
Available from: http://www.cdc.gov/
nchs/data/nhsr/nhsr004.pdf.
Pitts SR, Niska RW, Xu J, Burt CW.
National Hospital Ambulatory Medical
Care Survey: 2006 emergency
department summary. National health
statistics reports; no 7. Hyattsville, MD:
National Center for Health Statistics.
2008. Available from: http://www.
cdc.gov/nchs/data/nhsr/nhsr007.pdf.
Jones AL, Dwyer LL, Bercovitz AR,
Strahan GW. The National Nursing
Home Survey: 2004 overview. National
Center for Health Statistics. Vital
Health Stat 13(167). 2009. Available
15.
16.
17.
18.
19.
20.
21.
22.
23.
24.
25.
from: http://www.cdc.gov/nchs/data/
series/sr_13/sr13_167.pdf.
Haupt BJ. Characteristics of hospice
care discharges and their length of
service: United States, 2000. National
Center for Health Statistics. Vital
Health Stat 13(154). 2003. Available
from: http://www.cdc.gov/nchs/data/
series/sr_13/sr13_154.pdf.
SMG Marketing Group, Inc. Hospital
Market Database. Chicago, IL:
Healthcare Information Specialists.
April 1987, April 1991, April 1994,
April 1997, April 2000.
Verispan, L.L.C. Releases of the
healthcare market index and hospital
market profiling solution. 2003, 2006.
Dennison CF, Pokras R. Design and
operation of the National Hospital
Discharge Survey: 1988 redesign.
National Center for Health Statistics.
Vital Health Stat 1(39). 2000. Available
from: http://www.cdc.gov/nchs/data/
series/sr_01/sr01_039.pdf.
Heinen M, Hall MJ, Boudreault MA,
Fingerhut LA. National trends in injury
hospitalizations, 1979–2001.
Hyattsville, MD: National Center for
Health Statistics. 2005. Available from:
http://www.cdc.gov/nchs/data/injury/
InjuryChartbook79–01.pdf.
Barell V, Aharonson-Daniel L,
Fingerhut LA, Mackenzie EJ, Ziv A,
Boyko V, et al. An introduction to the
Barell body region by nature of injury
diagnosis matrix. Inj Prev 8(2):91–6.
2002.
Heron M, Hoyert DL, Murphy SL, et
al. Deaths: Final data for 2006.
National vital statistics reports; vol 57
no 14. Hyattsville, MD: National
Center for Health Statistics. 2009.
Available from: http://www.cdc.gov/
nchs/data/nvsr/nvsr57/nvsr57_14.pdf.
Martin JA, Hamilton BE, Sutton PD, et
al. Births: Final data for 2006. National
vital statistics reports; vol 57 no 7.
Hyattsville, MD: National Center for
Health Statistics. 2009. Available from:
http://www.cdc.gov/nchs/data/nvsr/
nvsr57/nvsr57_07.pdf.
Gillum BS, Graves EJ, Kozak LJ.
Trends in hospital utilization: United
States, 1988–92. National Center for
Health Statistics. Vital Health Stat
13(124). 1996. Available from:
http://www.cdc.gov/nchs/data/series/
sr_13/sr13_124.pdf.
Research Triangle Institute. SUDAAN
language manual, release 9.0. Research
Triangle Park, NC: Research Triangle
Institute. 2004.
Hansen MH, Hurwitz WN, Madow
WG. Sample survey methods and
theory, vol 1, methods and applications.
Wiley Classics Library Ed. New York,
NY: John Wiley & Sons. 1993.
26. Cochran WG. Sampling techniques, 3rd
edition. New York, NY: John Wiley &
Sons. 1977.
Series 13, No. 168 [ Page 7
Table 1. Number and rate of discharges from short-stay hospitals and of days of care with average length of stay, by age: United States,
selected years 1970–2006
[Discharges of inpatients from nonfederal hospitals. Excludes newborn infants]
Age
1970
1980
1985
1990
All ages . . . . . . . . . . . . . . . . . . . . . . . . . . . . . . . . .
29,127
37,832
35,056
30,788
Under 15 years . . . .
15–44 years . . . . . .
45–64 years . . . . . .
65 years and over . .
65–74 years . . . .
75–84 years . . . .
85 years and over .
3,873
12,664
6,693
5,897
3,163
2,099
635
3,672
15,635
8,660
9,864
4,943
3,611
1,310
2,972
13,966
7,610
10,508
5,011
3,969
1,528
2,412
11,799
6,244
10,333
4,689
3,949
1,694
1995
2000
2005
2006
30,722
31,706
34,667
34,854
2,405
10,593
6,168
11,556
4,832
4,590
2,134
2,383
9,969
6,958
12,396
4,678
5,119
2,599
2,431
10,659
8,349
13,228
4,900
5,394
2,934
2,298
10,800
8,686
13,070
4,793
5,252
3,025
Number of discharges in thousands
.
.
.
.
.
.
.
.
.
.
.
.
.
.
.
.
.
.
.
.
.
.
.
.
.
.
.
.
.
.
.
.
.
.
.
.
.
.
.
.
.
.
.
.
.
.
.
.
.
.
.
.
.
.
.
.
.
.
.
.
.
.
.
.
.
.
.
.
.
.
.
.
.
.
.
.
.
.
.
.
.
.
.
.
.
.
.
.
.
.
.
.
.
.
.
.
.
.
.
.
.
.
.
.
.
.
.
.
.
.
.
.
.
.
.
.
.
.
.
.
.
.
.
.
.
.
.
.
.
.
.
.
.
.
.
.
.
.
.
.
.
.
.
.
.
.
.
.
.
.
.
.
.
.
.
.
.
.
.
.
.
.
.
.
.
.
.
.
.
.
.
.
.
.
.
Rate of discharges per 1,000 population1
All ages . . . . . . . . . . . . . . . . . . . . . . . . . . . . . . . . .
144.3
167.7
148.4
122.3
115.7
112.8
117.4
116.9
Under 15 years . . . .
15–44 years . . . . . .
45–64 years . . . . . .
65 years and over . .
65–74 years . . . .
75–84 years . . . .
85 years and over .
.
.
.
.
.
.
.
66.8
154.6
159.6
293.3
253.2
339.5
443.7
71.6
150.1
194.8
383.7
315.8
463.9
576.4
57.7
125.0
170.8
369.8
297.3
446.4
572.9
43.1
99.3
135.5
334.1
261.6
395.7
560.6
40.4
87.8
118.5
347.7
260.0
415.6
592.5
39.5
80.9
111.4
353.4
254.6
412.4
605.1
40.0
85.3
114.7
359.6
262.9
413.2
575.8
37.8
86.1
116.1
350.8
253.4
402.6
571.1
All ages . . . . . . . . . . . . . . . . . . . . . . . . . . . . . . . . .
226,445
274,508
226,217
197,422
164,627
155,857
165,925
166,342
.
.
.
.
.
.
.
18,189
71,605
62,419
74,232
37,873
27,633
8,726
16,191
81,951
71,008
105,358
49,253
40,355
15,750
13,554
67,397
53,541
91,726
41,090
36,024
14,612
11,655
54,062
42,153
89,552
37,422
35,926
16,204
10,715
40,825
34,207
78,880
31,310
31,974
15,597
10,734
36,593
34,443
74,086
26,438
31,525
16,123
11,371
39,786
41,619
73,149
26,068
30,228
16,853
10,990
40,486
43,335
71,530
24,914
29,579
17,037
All ages . . . . . . . . . . . . . . . . . . . . . . . . . . . . . . . . .
1,121.6
1,216.7
957.7
784.0
620.2
554.6
562.1
557.8
Under 15 years . . . .
15–44 years . . . . . .
45–64 years . . . . . .
65 years and over . .
65–74 years . . . .
75–84 years . . . .
85 years and over .
.
.
.
.
.
.
.
313.9
874.0
1,488.8
3,691.9
3,031.6
4,469.2
6,102.1
315.7
786.8
1,596.9
4,098.4
3,147.0
5,183.7
6,932.1
263.0
603.3
1,201.6
3,228.0
2,437.3
4,052.2
5,478.7
208.4
454.9
914.4
2,895.6
2,087.8
3,599.5
5,361.7
179.9
338.4
657.5
2,373.7
1,684.7
2,894.7
4,330.6
178.0
297.1
551.5
2,111.9
1,439.0
2,539.8
3,753.8
187.3
318.5
571.7
1,988.3
1,398.5
2,315.5
3,307.1
180.9
322.9
579.3
1,919.7
1,317.0
2,267.2
3,216.5
All ages . . . . . . . . . . . . . . . . . . . . . . . . . . . . . . . . .
7.8
7.3
6.5
6.4
5.4
4.9
4.8
4.8
4.7
5.7
9.3
12.6
12.0
13.2
13.7
4.4
5.2
8.2
10.7
10.0
11.2
12.0
4.6
4.8
7.0
8.7
8.2
9.1
9.6
4.8
4.6
6.8
8.7
8.0
9.1
9.6
4.5
3.9
5.5
6.8
6.5
7.0
7.3
4.5
3.7
5.0
6.0
5.7
6.2
6.2
4.7
3.7
5.0
5.5
5.3
5.6
5.7
4.8
3.7
5.0
5.5
5.2
5.6
5.6
.
.
.
.
.
.
.
.
.
.
.
.
.
.
.
.
.
.
.
.
.
.
.
.
.
.
.
.
.
.
.
.
.
.
.
.
.
.
.
.
.
.
.
.
.
.
.
.
.
.
.
.
.
.
.
.
.
.
.
.
.
.
.
.
.
.
.
.
.
.
.
.
.
.
.
.
.
.
.
.
.
.
.
.
.
.
.
.
.
.
.
.
.
.
.
.
.
.
.
.
.
.
.
.
.
.
.
.
.
.
.
.
.
.
.
.
.
.
.
.
.
.
.
.
.
.
.
.
.
.
.
.
.
.
.
.
.
.
.
.
.
.
.
.
.
.
.
.
.
.
.
.
.
.
.
.
.
.
.
.
.
.
.
.
.
.
.
.
Number of days of care in thousands
Under 15 years . . . .
15–44 years . . . . . .
45–64 years . . . . . .
65 years and over . .
65–74 years . . . .
75–84 years . . . .
85 years and over .
.
.
.
.
.
.
.
.
.
.
.
.
.
.
.
.
.
.
.
.
.
.
.
.
.
.
.
.
.
.
.
.
.
.
.
.
.
.
.
.
.
.
.
.
.
.
.
.
.
.
.
.
.
.
.
.
.
.
.
.
.
.
.
.
.
.
.
.
.
.
.
.
.
.
.
.
.
.
.
.
.
.
.
.
.
.
.
.
.
.
.
.
.
.
.
.
.
.
.
.
.
.
.
.
.
.
.
.
.
.
.
.
.
.
.
.
.
.
.
.
.
.
.
.
.
.
.
.
.
.
.
.
.
.
.
.
.
.
.
.
.
.
.
.
.
.
.
.
.
.
.
.
.
.
.
.
.
.
.
.
.
.
.
.
.
.
.
.
Rate of days of care per 1,000 population1
.
.
.
.
.
.
.
.
.
.
.
.
.
.
.
.
.
.
.
.
.
.
.
.
.
.
.
.
.
.
.
.
.
.
.
.
.
.
.
.
.
.
.
.
.
.
.
.
.
.
.
.
.
.
.
.
.
.
.
.
.
.
.
.
.
.
.
.
.
.
.
.
.
.
.
.
.
.
.
.
.
.
.
.
.
.
.
.
.
.
.
.
.
.
.
.
.
.
.
.
.
.
.
.
.
.
.
.
.
.
.
.
.
.
.
.
.
.
.
.
.
.
.
.
.
.
.
.
.
.
.
.
.
.
.
.
.
.
.
.
.
.
.
.
.
.
.
.
.
.
.
.
.
.
.
.
.
.
.
.
.
.
.
.
.
.
.
.
Average length of stay in days
Under 15 years . . . .
15–44 years . . . . . .
45–64 years . . . . . .
65 years and over . .
65–74 years . . . .
75–84 years . . . .
85 years and over .
.
.
.
.
.
.
.
.
.
.
.
.
.
.
.
.
.
.
.
.
.
.
.
.
.
.
.
.
.
.
.
.
.
.
.
.
.
.
.
.
.
.
.
.
.
.
.
.
.
.
.
.
.
.
.
.
.
.
.
.
.
.
.
.
.
.
.
.
.
.
.
.
.
.
.
.
.
.
.
.
.
.
.
.
.
.
.
.
.
.
.
.
.
.
.
.
.
.
.
.
.
.
.
.
.
.
.
.
.
.
.
.
.
.
.
.
.
.
.
.
.
.
.
.
.
.
.
.
.
.
.
.
.
.
.
.
.
.
.
.
.
.
.
.
.
.
.
.
.
.
.
.
.
.
.
.
.
.
.
.
.
.
.
.
.
.
.
.
.
.
.
.
.
.
.
1
Rates were calculated using the U.S. Census Bureau estimates of the civilian population. Rates for 1990 and 1995 were based on population estimates adjusted for the net underenumeration in the
1990 census. Rates for 2000, 2005, and 2006 were calculated using 2000-based postcensal estimates. Rates for 2000 differ from the ones shown in earlier reports because they were calculated using
revised population estimates.
Page 8 [ Series 13, No. 168
Table 2. Number, percent distribution, and rate of discharges from short-stay hospitals and of days of care with average length of stay, by
sex and age: United States, 2006
[Discharges of inpatients from nonfederal hospitals. Excludes newborn infants]
Discharges
Days of care
Number in
thousands
Percent
distribution
Rate per
1,000
population1
Number in
thousands
Percent
distribution
All ages . . . . . . . . . . . . . . . . . . . . . . . . . . . . . . . . .
34,854
100.0
116.9
166,342
100.0
557.8
4.8
Under 15 years . . .
Under 1 year . . .
1–4 years . . . . .
5–14 years . . . . .
15–44 years . . . . .
15–19 years . . . .
20–24 years . . . .
25–34 years . . . .
35–44 years . . . .
45–64 years . . . . .
45–54 years . . . .
55–64 years . . . .
65 years and over . .
65–74 years . . . .
75–84 years . . . .
85 years and over
.
.
.
.
.
.
.
.
.
.
.
.
.
.
.
.
2,298
751
682
865
10,800
1,200
1,932
4,045
3,623
8,686
4,195
4,491
13,070
4,793
5,252
3,025
6.6
2.2
2.0
2.5
31.0
3.4
5.5
11.6
10.4
24.9
12.0
12.9
37.5
13.8
15.1
8.7
37.8
181.8
41.9
21.4
86.1
56.5
93.1
101.1
83.5
116.1
97.0
142.2
350.8
253.4
402.6
571.1
10,990
4,801
2,289
3,900
40,486
4,734
6,354
13,850
15,548
43,335
20,174
23,161
71,530
24,914
29,579
17,037
6.6
2.9
1.4
2.3
24.3
2.8
3.8
8.3
9.3
26.1
12.1
13.9
43.0
15.0
17.8
10.2
180.9
1,162.4
140.5
96.7
322.9
222.8
306.3
346.2
358.2
579.3
466.7
733.4
1,919.7
1,317.0
2,267.2
3,216.5
4.8
6.4
3.4
4.5
3.7
3.9
3.3
3.4
4.3
5.0
4.8
5.2
5.5
5.2
5.6
5.6
All ages . . . . . . . . . . . . . . . . . . . . . . . . . . . . . . . . .
Sex and age
Rate per
1,000
population1
Average
length of
stay in days
Both sexes
.
.
.
.
.
.
.
.
.
.
.
.
.
.
.
.
.
.
.
.
.
.
.
.
.
.
.
.
.
.
.
.
.
.
.
.
.
.
.
.
.
.
.
.
.
.
.
.
.
.
.
.
.
.
.
.
.
.
.
.
.
.
.
.
.
.
.
.
.
.
.
.
.
.
.
.
.
.
.
.
.
.
.
.
.
.
.
.
.
.
.
.
.
.
.
.
.
.
.
.
.
.
.
.
.
.
.
.
.
.
.
.
.
.
.
.
.
.
.
.
.
.
.
.
.
.
.
.
.
.
.
.
.
.
.
.
.
.
.
.
.
.
.
.
.
.
.
.
.
.
.
.
.
.
.
.
.
.
.
.
.
.
.
.
.
.
.
.
.
.
.
.
.
.
.
.
.
.
.
.
.
.
.
.
.
.
.
.
.
.
.
.
.
.
.
.
.
.
.
.
.
.
.
.
.
.
.
.
.
.
.
.
.
.
.
.
.
.
.
.
.
.
.
.
.
.
.
.
.
.
.
.
.
.
.
.
.
.
.
.
.
.
.
.
.
.
.
.
.
.
.
.
.
.
.
.
.
.
.
.
.
.
.
.
.
.
.
.
.
.
.
.
.
.
.
.
.
.
.
.
.
.
.
.
.
.
.
.
.
.
.
.
.
.
.
.
.
.
.
.
.
.
.
.
.
.
.
.
.
.
.
.
.
.
.
.
.
.
.
.
.
.
.
.
.
.
.
.
.
.
.
.
.
.
.
.
.
.
.
.
.
.
.
.
.
.
.
.
.
.
.
.
.
.
.
.
.
.
.
.
.
.
.
.
.
.
.
.
.
.
.
.
.
.
.
.
.
.
.
.
.
.
.
.
Male
13,990
100.0
95.5
72,483
100.0
494.7
5.2
.
.
.
.
.
.
.
.
.
.
.
.
.
.
.
.
1,295
424
377
495
2,922
360
383
824
1,355
4,287
2,031
2,255
5,487
2,241
2,236
1,010
9.3
3.0
2.7
3.5
20.9
2.6
2.7
5.9
9.7
30.6
14.5
16.1
39.2
16.0
16.0
7.2
41.7
200.5
45.2
24.0
46.2
33.1
36.1
40.8
62.7
117.6
95.6
148.2
350.4
258.4
422.0
598.4
6,312
2,778
1,226
2,309
14,574
1,834
1,915
3,970
6,854
21,893
10,189
11,704
29,705
11,499
12,702
5,504
8.7
3.8
1.7
3.2
20.1
2.5
2.6
5.5
9.5
30.2
14.1
16.1
41.0
15.9
17.5
7.6
203.1
1,314.6
147.1
111.8
230.2
168.8
180.7
196.4
317.0
600.4
479.6
769.0
1,897.2
1,326.2
2,397.3
3,260.4
4.9
6.6
3.3
4.7
5.0
5.1
5.0
4.8
5.1
5.1
5.0
5.2
5.4
5.1
5.7
5.4
All ages . . . . . . . . . . . . . . . . . . . . . . . . . . . . . . . . .
20,864
100.0
137.5
93,858
100.0
618.7
4.5
1,003
327
306
370
7,878
841
1,549
3,221
2,268
4,399
2,163
2,236
7,584
2,552
3,016
2,015
4.8
1.6
1.5
1.8
37.8
4.0
7.4
15.4
10.9
21.1
10.4
10.7
36.3
12.2
14.5
9.7
33.8
162.3
38.4
18.8
126.9
81.0
152.7
162.8
104.1
114.7
98.4
136.6
351.0
249.1
389.3
558.4
4,678
2,023
1,064
1,592
25,913
2,900
4,439
9,879
8,694
21,442
9,985
11,456
41,826
13,415
16,878
11,533
5.0
2.2
1.1
1.7
27.6
3.1
4.7
10.5
9.3
22.8
10.6
12.2
44.6
14.3
18.0
12.3
157.7
1,003.0
133.6
80.8
417.3
279.5
437.7
499.3
399.1
559.2
454.3
700.2
1,936.1
1,309.2
2,178.2
3,196.0
4.7
6.2
3.5
4.3
3.3
3.5
2.9
3.1
3.8
4.9
4.6
5.1
5.5
5.3
5.6
5.7
Under 15 years . . .
Under 1 year . . .
1–4 years . . . . .
5–14 years . . . . .
15–44 years . . . . .
15–19 years . . . .
20–24 years . . . .
25–34 years . . . .
35–44 years . . . .
45–64 years . . . . .
45–54 years . . . .
55–64 years . . . .
65 years and over . .
65–74 years . . . .
75–84 years . . . .
85 years and over
.
.
.
.
.
.
.
.
.
.
.
.
.
.
.
.
.
.
.
.
.
.
.
.
.
.
.
.
.
.
.
.
.
.
.
.
.
.
.
.
.
.
.
.
.
.
.
.
.
.
.
.
.
.
.
.
.
.
.
.
.
.
.
.
.
.
.
.
.
.
.
.
.
.
.
.
.
.
.
.
.
.
.
.
.
.
.
.
.
.
.
.
.
.
.
.
.
.
.
.
.
.
.
.
.
.
.
.
.
.
.
.
.
.
.
.
.
.
.
.
.
.
.
.
.
.
.
.
.
.
.
.
.
.
.
.
.
.
.
.
.
.
.
.
.
.
.
.
.
.
.
.
.
.
.
.
.
.
.
.
.
.
.
.
.
.
.
.
.
.
.
.
.
.
.
.
.
.
.
.
.
.
.
.
.
.
.
.
.
.
.
.
.
.
.
.
.
.
.
.
.
.
.
.
.
.
.
.
.
.
.
.
.
.
.
.
.
.
.
.
.
.
.
.
.
.
.
.
.
.
.
.
.
.
.
.
.
.
.
.
.
.
.
.
.
.
.
.
.
.
.
.
.
.
.
.
.
.
.
.
.
.
.
.
.
.
.
.
.
.
.
.
.
.
.
.
.
.
.
.
.
.
.
.
.
.
.
.
.
.
.
.
.
.
.
.
.
.
.
.
.
.
.
.
.
.
.
.
.
.
.
.
.
.
.
.
.
.
.
.
.
.
.
.
.
.
.
.
.
.
.
.
.
.
.
.
.
.
.
.
.
.
.
.
.
.
.
.
.
.
.
.
.
.
.
.
.
.
.
.
.
.
.
.
.
.
.
.
.
.
.
.
.
.
.
.
.
.
.
.
.
.
.
.
Female
Under 15 years . . .
Under 1 year . . .
1–4 years . . . . .
5–14 years . . . . .
15–44 years . . . . .
15–19 years . . . .
20–24 years . . . .
25–34 years . . . .
35–44 years . . . .
45–64 years . . . . .
45–54 years . . . .
55–64 years . . . .
65 years and over . .
65–74 years . . . .
75–84 years . . . .
85 years and over
1
.
.
.
.
.
.
.
.
.
.
.
.
.
.
.
.
.
.
.
.
.
.
.
.
.
.
.
.
.
.
.
.
.
.
.
.
.
.
.
.
.
.
.
.
.
.
.
.
.
.
.
.
.
.
.
.
.
.
.
.
.
.
.
.
.
.
.
.
.
.
.
.
.
.
.
.
.
.
.
.
.
.
.
.
.
.
.
.
.
.
.
.
.
.
.
.
.
.
.
.
.
.
.
.
.
.
.
.
.
.
.
.
.
.
.
.
.
.
.
.
.
.
.
.
.
.
.
.
.
.
.
.
.
.
.
.
.
.
.
.
.
.
.
.
.
.
.
.
.
.
.
.
.
.
.
.
.
.
.
.
.
.
.
.
.
.
.
.
.
.
.
.
.
.
.
.
.
.
.
.
.
.
.
.
.
.
.
.
.
.
.
.
.
.
.
.
.
.
.
.
.
.
.
.
.
.
.
.
.
.
.
.
.
.
.
.
.
.
.
.
.
.
.
.
.
.
.
.
.
.
.
.
.
.
.
.
.
.
.
.
.
.
.
.
.
.
.
.
.
.
.
.
.
.
.
.
.
.
.
.
.
.
.
.
.
.
.
.
.
.
.
.
.
.
.
.
.
.
.
.
.
.
.
.
.
.
.
.
.
.
.
.
.
.
.
.
.
.
.
.
.
.
.
.
.
.
.
.
.
.
.
.
.
.
.
.
.
.
.
.
.
.
.
.
.
.
.
.
.
.
.
.
.
.
.
.
.
.
.
.
.
.
.
.
.
.
.
.
.
.
.
.
.
.
.
.
.
.
.
.
.
.
.
.
.
.
.
.
.
.
.
.
.
.
.
.
.
.
.
.
.
.
.
.
.
.
.
.
.
.
.
.
.
.
.
.
.
.
.
.
Rates were calculated using U.S. Census Bureau 2000-based postcensal estimates of the civilian population as of July 1, 2006.
Series 13, No. 168 [ Page 9
Table 3. Number and rate of discharges from short-stay hospitals and of days of care with average length of stay, by sex, age, and
geographic region: United States, 2006
[Discharges of inpatients from nonfederal hospitals. Excludes newborn infants]
Discharges
Sex, age, and region
Days of care
Number in
thousands
Rate per
1,000
population1
Number in
thousands
Rate per
1,000
population1
Average
length of
stay in days
Both sexes
All ages:
United States
Northeast .
Midwest . .
South . . .
West . . .
.
.
.
.
.
.
.
.
.
.
.
.
.
.
.
.
.
.
.
.
.
.
.
.
.
.
.
.
.
.
.
.
.
.
.
.
.
.
.
.
.
.
.
.
.
.
.
.
.
.
.
.
.
.
.
.
.
.
.
.
.
.
.
.
.
.
.
.
.
.
.
.
.
.
.
.
.
.
.
.
.
.
.
.
.
.
.
.
.
.
.
.
.
.
.
.
.
.
.
.
.
.
.
.
.
.
.
.
.
.
.
.
.
.
.
.
.
.
.
.
.
.
.
.
.
.
.
.
.
.
.
.
.
.
.
.
.
.
.
.
.
.
.
.
.
.
.
.
.
.
34,854
7,277
7,951
13,140
6,486
116.9
133.1
120.2
121.2
94.0
166,342
38,454
33,585
64,474
29,828
557.8
703.2
507.8
594.7
432.3
4.8
5.3
4.2
4.9
4.6
Under 15 years:
United States . .
Northeast . . .
Midwest . . . .
South . . . . .
West . . . . .
.
.
.
.
.
.
.
.
.
.
.
.
.
.
.
.
.
.
.
.
.
.
.
.
.
.
.
.
.
.
.
.
.
.
.
.
.
.
.
.
.
.
.
.
.
.
.
.
.
.
.
.
.
.
.
.
.
.
.
.
.
.
.
.
.
.
.
.
.
.
.
.
.
.
.
.
.
.
.
.
.
.
.
.
.
.
.
.
.
.
.
.
.
.
.
.
.
.
.
.
.
.
.
.
.
.
.
.
.
.
.
.
.
.
.
.
.
.
.
.
.
.
.
.
.
.
.
.
.
.
.
.
.
.
.
.
.
.
.
.
2,298
475
235
938
*
37.8
46.1
17.7
42.0
*
10,990
2,632
820
4,092
*
180.9
255.4
61.6
183.0
*
4.8
5.5
3.5
4.4
5.3
15–44 years:
United States
Northeast .
Midwest . .
South . . .
West . . .
.
.
.
.
.
.
.
.
.
.
.
.
.
.
.
.
.
.
.
.
.
.
.
.
.
.
.
.
.
.
.
.
.
.
.
.
.
.
.
.
.
.
.
.
.
.
.
.
.
.
.
.
.
.
.
.
.
.
.
.
.
.
.
.
.
.
.
.
.
.
.
.
.
.
.
.
.
.
.
.
.
.
.
.
.
.
.
.
.
.
.
.
.
.
.
.
.
.
.
.
.
.
.
.
.
.
.
.
.
.
.
.
.
.
.
.
.
.
.
.
.
.
.
.
.
.
.
.
.
.
.
.
.
.
.
.
.
.
.
.
.
.
.
.
.
.
.
.
.
.
10,800
2,049
2,236
4,364
2,151
86.1
90.7
81.4
96.0
72.0
40,486
8,939
7,200
17,024
7,323
322.9
395.7
262.1
374.5
245.1
3.7
4.4
3.2
3.9
3.4
45–64 years:
United States
Northeast .
Midwest . .
South . . .
West . . .
.
.
.
.
.
.
.
.
.
.
.
.
.
.
.
.
.
.
.
.
.
.
.
.
.
.
.
.
.
.
.
.
.
.
.
.
.
.
.
.
.
.
.
.
.
.
.
.
.
.
.
.
.
.
.
.
.
.
.
.
.
.
.
.
.
.
.
.
.
.
.
.
.
.
.
.
.
.
.
.
.
.
.
.
.
.
.
.
.
.
.
.
.
.
.
.
.
.
.
.
.
.
.
.
.
.
.
.
.
.
.
.
.
.
.
.
.
.
.
.
.
.
.
.
.
.
.
.
.
.
.
.
.
.
.
.
.
.
.
.
.
.
.
.
.
.
.
.
.
.
8,686
1,872
1,948
3,385
1,481
116.1
130.6
115.4
125.3
89.4
43,335
9,854
8,464
17,939
7,077
579.3
687.4
501.3
664.1
427.1
5.0
5.3
4.3
5.3
4.8
65 years and over:
United States . . . .
Northeast . . . . .
Midwest . . . . . .
South . . . . . . .
West . . . . . . .
.
.
.
.
.
.
.
.
.
.
.
.
.
.
.
.
.
.
.
.
.
.
.
.
.
.
.
.
.
.
.
.
.
.
.
.
.
.
.
.
.
.
.
.
.
.
.
.
.
.
.
.
.
.
.
.
.
.
.
.
.
.
.
.
.
.
.
.
.
.
.
.
.
.
.
.
.
.
.
.
.
.
.
.
.
.
.
.
.
.
.
.
.
.
.
.
.
.
.
.
.
.
.
.
.
.
.
.
.
.
.
.
.
.
.
.
.
.
.
.
.
.
.
.
.
.
.
.
.
.
13,070
2,881
3,532
4,452
2,205
350.8
386.9
416.8
327.6
284.6
71,530
17,029
17,101
25,420
11,980
1,919.7
2,286.2
2,018.1
1,870.5
1,546.2
5.5
5.9
4.8
5.7
5.4
Male
All ages:
United States
Northeast .
Midwest . .
South . . .
West . . .
.
.
.
.
.
.
.
.
.
.
.
.
.
.
.
.
.
.
.
.
.
.
.
.
.
.
.
.
.
.
.
.
.
.
.
.
.
.
.
.
.
.
.
.
.
.
.
.
.
.
.
.
.
.
.
.
.
.
.
.
.
.
.
.
.
.
.
.
.
.
.
.
.
.
.
.
.
.
.
.
.
.
.
.
.
.
.
.
.
.
.
.
.
.
.
.
.
.
.
.
.
.
.
.
.
.
.
.
.
.
.
.
.
.
.
.
.
.
.
.
.
.
.
.
.
.
.
.
.
.
.
.
.
.
.
.
.
.
.
.
.
.
.
.
.
.
.
.
.
.
13,990
3,045
3,136
5,220
2,589
95.5
114.7
96.4
98.5
75.3
72,483
17,193
13,780
28,225
13,285
494.7
647.4
423.5
532.4
386.2
5.2
5.6
4.4
5.4
5.1
Under 15 years:
United States . .
Northeast . . .
Midwest . . . .
South . . . . .
West . . . . .
.
.
.
.
.
.
.
.
.
.
.
.
.
.
.
.
.
.
.
.
.
.
.
.
.
.
.
.
.
.
.
.
.
.
.
.
.
.
.
.
.
.
.
.
.
.
.
.
.
.
.
.
.
.
.
.
.
.
.
.
.
.
.
.
.
.
.
.
.
.
.
.
.
.
.
.
.
.
.
.
.
.
.
.
.
.
.
.
.
.
.
.
.
.
.
.
.
.
.
.
.
.
.
.
.
.
.
.
.
.
.
.
.
.
.
.
.
.
.
.
.
.
.
.
.
.
.
.
.
.
.
.
.
.
.
.
.
.
.
.
1,295
271
133
519
*
41.7
51.5
19.5
45.4
*
6,312
1,605
437
2,372
*
203.1
304.5
64.2
207.6
*
4.9
5.9
3.3
4.6
5.1
15–44 years:
United States
Northeast .
Midwest . .
South . . .
West . . .
.
.
.
.
.
.
.
.
.
.
.
.
.
.
.
.
.
.
.
.
.
.
.
.
.
.
.
.
.
.
.
.
.
.
.
.
.
.
.
.
.
.
.
.
.
.
.
.
.
.
.
.
.
.
.
.
.
.
.
.
.
.
.
.
.
.
.
.
.
.
.
.
.
.
.
.
.
.
.
.
.
.
.
.
.
.
.
.
.
.
.
.
.
.
.
.
.
.
.
.
.
.
.
.
.
.
.
.
.
.
.
.
.
.
.
.
.
.
.
.
.
.
.
.
.
.
.
.
.
.
.
.
.
.
.
.
.
.
.
.
.
.
.
.
.
.
.
.
.
.
2,922
674
586
1,174
488
46.2
59.6
42.1
51.5
31.9
14,574
3,717
2,330
6,176
2,351
230.2
328.7
167.6
270.9
153.6
5.0
5.5
4.0
5.3
4.8
45–64 years:
United States
Northeast .
Midwest . .
South . . .
West . . .
.
.
.
.
.
.
.
.
.
.
.
.
.
.
.
.
.
.
.
.
.
.
.
.
.
.
.
.
.
.
.
.
.
.
.
.
.
.
.
.
.
.
.
.
.
.
.
.
.
.
.
.
.
.
.
.
.
.
.
.
.
.
.
.
.
.
.
.
.
.
.
.
.
.
.
.
.
.
.
.
.
.
.
.
.
.
.
.
.
.
.
.
.
.
.
.
.
.
.
.
.
.
.
.
.
.
.
.
.
.
.
.
.
.
.
.
.
.
.
.
.
.
.
.
.
.
.
.
.
.
.
.
.
.
.
.
.
.
.
.
.
.
.
.
.
.
.
.
.
.
4,287
918
955
1,653
760
117.6
132.5
115.2
126.4
93.1
21,893
4,911
4,187
9,068
3,727
600.4
708.4
504.8
693.5
456.7
5.1
5.3
4.4
5.5
4.9
See footnotes at end of table.
Page 10 [ Series 13, No. 168
Table 3. Number and rate of discharges from short-stay hospitals and of days of care with average length of stay, by sex, age, and
geographic region: United States, 2006—Con.
[Discharges of inpatients from nonfederal hospitals. Excludes newborn infants]
Discharges
Sex, age, and region
65 years and over:
United States . . . .
Northeast . . . . .
Midwest . . . . . .
South . . . . . . .
West . . . . . . .
.
.
.
.
.
.
.
.
.
.
.
.
.
.
.
.
.
.
.
.
.
.
.
.
.
.
.
.
.
.
.
.
.
.
.
.
.
.
.
.
.
.
.
.
.
Days of care
Number in
thousands
Rate per
1,000
population1
Number in
thousands
Rate per
1,000
population1
Average
length of
stay in days
.
.
.
.
.
.
.
.
.
.
.
.
.
.
.
.
.
.
.
.
.
.
.
.
.
.
.
.
.
.
.
.
.
.
.
.
.
.
.
.
.
.
.
.
.
.
.
.
.
.
.
.
.
.
.
.
.
.
.
.
.
.
.
.
.
.
.
.
.
.
.
.
.
.
.
.
.
.
.
.
.
.
.
.
.
5,487
1,182
1,463
1,873
970
350.4
387.6
414.4
327.9
288.0
29,705
6,961
6,826
10,609
5,309
1,897.2
2,283.6
1,934.0
1,857.2
1,576.8
5.4
5.9
4.7
5.7
5.5
Female
All ages:
United States
Northeast .
Midwest . .
South . . .
West . . .
.
.
.
.
.
.
.
.
.
.
.
.
.
.
.
.
.
.
.
.
.
.
.
.
.
.
.
.
.
.
.
.
.
.
.
.
.
.
.
.
.
.
.
.
.
.
.
.
.
.
.
.
.
.
.
.
.
.
.
.
.
.
.
.
.
.
.
.
.
.
.
.
.
.
.
.
.
.
.
.
.
.
.
.
.
.
.
.
.
.
.
.
.
.
.
.
.
.
.
.
.
.
.
.
.
.
.
.
.
.
.
.
.
.
.
.
.
.
.
.
.
.
.
.
.
.
.
.
.
.
.
.
.
.
.
.
.
.
.
.
.
.
.
.
.
.
.
.
.
.
20,864
4,232
4,815
7,920
3,898
137.5
150.4
143.3
143.0
112.7
93,858
21,261
19,805
36,249
16,543
618.7
755.9
589.5
654.3
478.3
4.5
5.0
4.1
4.6
4.2
Under 15 years:
United States . .
Northeast . . .
Midwest . . . .
South . . . . .
West . . . . .
.
.
.
.
.
.
.
.
.
.
.
.
.
.
.
.
.
.
.
.
.
.
.
.
.
.
.
.
.
.
.
.
.
.
.
.
.
.
.
.
.
.
.
.
.
.
.
.
.
.
.
.
.
.
.
.
.
.
.
.
.
.
.
.
.
.
.
.
.
.
.
.
.
.
.
.
.
.
.
.
.
.
.
.
.
.
.
.
.
.
.
.
.
.
.
.
.
.
.
.
.
.
.
.
.
.
.
.
.
.
.
.
.
.
.
.
.
.
.
.
.
.
.
.
.
.
.
.
.
.
.
.
.
.
.
.
.
.
.
.
1,003
204
102
419
*
33.8
40.5
15.8
38.3
*
4,678
1,027
383
1,719
*
157.7
204.0
59.0
157.4
*
4.7
5.0
3.7
4.1
5.6
15–44 years:
United States
Northeast .
Midwest . .
South . . .
West . . .
.
.
.
.
.
.
.
.
.
.
.
.
.
.
.
.
.
.
.
.
.
.
.
.
.
.
.
.
.
.
.
.
.
.
.
.
.
.
.
.
.
.
.
.
.
.
.
.
.
.
.
.
.
.
.
.
.
.
.
.
.
.
.
.
.
.
.
.
.
.
.
.
.
.
.
.
.
.
.
.
.
.
.
.
.
.
.
.
.
.
.
.
.
.
.
.
.
.
.
.
.
.
.
.
.
.
.
.
.
.
.
.
.
.
.
.
.
.
.
.
.
.
.
.
.
.
.
.
.
.
.
.
.
.
.
.
.
.
.
.
.
.
.
.
.
.
.
.
.
.
7,878
1,375
1,650
3,190
1,663
126.9
121.8
121.7
140.8
114.1
25,913
5,223
4,869
10,848
4,972
417.3
462.8
359.1
478.7
341.0
3.3
3.8
3.0
3.4
3.0
45–64 years:
United States
Northeast .
Midwest . .
South . . .
West . . .
.
.
.
.
.
.
.
.
.
.
.
.
.
.
.
.
.
.
.
.
.
.
.
.
.
.
.
.
.
.
.
.
.
.
.
.
.
.
.
.
.
.
.
.
.
.
.
.
.
.
.
.
.
.
.
.
.
.
.
.
.
.
.
.
.
.
.
.
.
.
.
.
.
.
.
.
.
.
.
.
.
.
.
.
.
.
.
.
.
.
.
.
.
.
.
.
.
.
.
.
.
.
.
.
.
.
.
.
.
.
.
.
.
.
.
.
.
.
.
.
.
.
.
.
.
.
.
.
.
.
.
.
.
.
.
.
.
.
.
.
.
.
.
.
.
.
.
.
.
.
4,399
953
993
1,732
721
114.7
128.7
115.6
124.3
85.7
21,442
4,944
4,277
8,871
3,350
559.2
667.6
497.9
636.5
398.3
4.9
5.2
4.3
5.1
4.6
65 years and over:
United States . . . .
Northeast . . . . .
Midwest . . . . . .
South . . . . . . .
West . . . . . . .
.
.
.
.
.
.
.
.
.
.
.
.
.
.
.
.
.
.
.
.
.
.
.
.
.
.
.
.
.
.
.
.
.
.
.
.
.
.
.
.
.
.
.
.
.
.
.
.
.
.
.
.
.
.
.
.
.
.
.
.
.
.
.
.
.
.
.
.
.
.
.
.
.
.
.
.
.
.
.
.
.
.
.
.
.
.
.
.
.
.
.
.
.
.
.
.
.
.
.
.
.
.
.
.
.
.
.
.
.
.
.
.
.
.
.
.
.
.
.
.
.
.
.
.
.
.
.
.
.
.
7,584
1,700
2,069
2,579
1,235
351.0
386.3
418.5
327.4
281.9
41,826
10,067
10,275
14,811
6,672
1,936.1
2,288.1
2,078.1
1,880.2
1,522.7
5.5
5.9
5.0
5.7
5.4
* Figure does not meet standards of reliability or precision.
1
Rates were calculated using U.S. Census Bureau 2000-based postcensal estimates of the civilian population as of July 1, 2006.
Series 13, No. 168 [ Page 11
Table 4. Number of discharges from short-stay hospitals and of days of care with average length of stay, by principal expected source of
payment, sex, age, and geographic region: United States, 2006
[Discharges of inpatients from nonfederal hospitals. Excludes newborn infants]
Worker’s
compensation
and other
government
payments
Blue Cross
Blue Shield
and other
private
insurance
All principal
expected
sources of
payment1
Medicare
Medicaid
. . . . . . . . . . . . . . . . . . . . . . . . . . . . . . . . . . . .
34,854
13,523
5,913
726
4,866
Male . . . . . . . . . . . . . . . . . . . . . . . . . . . . . . . . . . .
Female . . . . . . . . . . . . . . . . . . . . . . . . . . . . . . . . .
13,990
20,864
5,786
7,737
1,906
4,007
408
319
1,764
3,102
Under 15 years .
15–44 years . . .
45–64 years . . .
65 years and over
2,298
10,800
8,686
13,070
9
621
1,707
11,187
1,130
3,311
1,259
212
36
303
301
86
360
2,147
1,711
648
499
2,738
2,605
652
Region, sex, and age
United States
All
.
.
.
.
.
.
.
.
.
.
.
.
.
.
.
.
.
.
.
.
.
.
.
.
.
.
.
.
.
.
.
.
.
.
.
.
.
.
.
.
.
.
.
.
.
.
.
.
HMO or
PPO2
Self-pay
Other
payments
and no
charge
6,494
1,627
1,146
2,583
3,911
820
807
478
668
55
923
583
65
*
566
352
83
Number of discharges in thousands
.
.
.
.
.
.
.
.
.
.
.
.
.
.
.
.
.
.
.
.
.
.
.
.
.
.
.
.
.
.
.
.
.
.
.
.
.
.
.
.
.
.
.
.
.
.
.
.
.
.
.
.
.
.
.
.
.
.
.
.
Northeast
All
. . . . . . . . . . . . . . . . . . . . . . . . . . . . . . . . . . . .
7,277
2,787
1,108
93
1,064
1,540
261
168
Male . . . . . . . . . . . . . . . . . . . . . . . . . . . . . . . . . . .
Female . . . . . . . . . . . . . . . . . . . . . . . . . . . . . . . . .
3,045
4,232
1,185
1,601
475
633
56
37
402
662
629
910
136
124
64
103
Under 15 years .
15–44 years . . .
45–64 years . . .
65 years and over
475
2,049
1,872
2,881
*
119
343
2,323
182
579
304
43
*
36
34
*
78
436
380
170
141
599
605
194
18
137
88
*
*
70
46
*
.
.
.
.
.
.
.
.
.
.
.
.
.
.
.
.
.
.
.
.
.
.
.
.
.
.
.
.
.
.
.
.
.
.
.
.
.
.
.
.
.
.
.
.
.
.
.
.
.
.
.
.
.
.
.
.
.
.
.
.
.
.
.
.
.
.
.
.
.
.
.
.
.
.
.
.
.
.
.
.
.
.
.
.
.
.
.
.
.
.
.
.
.
.
.
.
.
.
.
.
.
.
.
.
.
.
.
.
Midwest
All
. . . . . . . . . . . . . . . . . . . . . . . . . . . . . . . . . . . .
7,951
3,772
991
*
974
1,566
307
178
Male . . . . . . . . . . . . . . . . . . . . . . . . . . . . . . . . . . .
Female . . . . . . . . . . . . . . . . . . . . . . . . . . . . . . . . .
3,136
4,815
1,575
2,197
279
711
56
*
345
628
611
955
161
146
83
95
Under 15 years .
15–44 years . . .
45–64 years . . .
65 years and over
.
.
.
.
235
2,236
1,948
3,532
*
143
371
3,257
98
645
224
24
*
*
*
*
*
452
397
78
81
685
685
116
*
164
126
12
*
86
76
15
. . . . . . . . . . . . . . . . . . . . . . . . . . . . . . . . . . . .
13,140
4,924
2,383
354
1,485
2,466
796
*
Male . . . . . . . . . . . . . . . . . . . . . . . . . . . . . . . . . . .
Female . . . . . . . . . . . . . . . . . . . . . . . . . . . . . . . . .
5,220
7,920
2,120
2,804
656
1,727
205
150
527
958
996
1,470
388
408
*
*
Under 15 years .
15–44 years . . .
45–64 years . . .
65 years and over
.
.
.
.
938
4,364
3,385
4,452
*
282
757
3,879
479
1,367
462
75
15
151
152
36
100
681
528
176
176
1,059
1,008
223
21
476
274
25
*
*
*
21
. . . . . . . . . . . . . . . . . . . . . . . . . . . . . . . . . . . .
6,486
2,041
1,430
175
1,344
923
263
256
Male . . . . . . . . . . . . . . . . . . . . . . . . . . . . . . . . . . .
Female . . . . . . . . . . . . . . . . . . . . . . . . . . . . . . . . .
2,589
3,898
906
1,135
*
936
92
83
490
853
347
576
134
128
101
155
Under 15 years .
15–44 years . . .
45–64 years . . .
65 years and over
.
.
.
.
*
2,151
1,481
2,205
*
76
236
1,727
*
720
269
70
12
78
68
17
*
578
406
224
*
396
308
119
11
146
95
*11
*
130
86
*
. . . . . . . . . . . . . . . . . . . . . . . . . . . . . . . . . . . .
166,342
76,143
28,247
3,615
18,896
25,616
6,467
4,929
Male . . . . . . . . . . . . . . . . . . . . . . . . . . . . . . . . . . .
Female . . . . . . . . . . . . . . . . . . . . . . . . . . . . . . . . .
72,483
93,858
32,191
43,952
12,087
16,160
2,237
1,377
7,595
11,301
11,490
14,126
3,516
2,951
2,273
2,656
Under 15 years .
15–44 years . . .
45–64 years . . .
65 years and over
10,990
40,486
43,335
71,530
*
3,875
10,572
61,647
6,174
12,879
7,850
1,344
255
1,418
1,494
448
1,535
6,833
7,280
3,248
1,853
9,232
11,114
3,417
186
3,313
2,645
323
*
2,240
1,584
424
.
.
.
.
.
.
.
.
.
.
.
.
.
.
.
.
.
.
.
.
.
.
.
.
.
.
.
.
.
.
.
.
.
.
.
.
.
.
.
.
.
.
.
.
.
.
.
.
.
.
.
.
.
.
.
.
.
.
.
.
.
.
.
.
.
.
.
.
.
.
.
.
.
.
.
.
.
.
.
.
.
.
.
.
.
.
.
.
.
.
.
.
.
.
.
.
.
.
.
.
.
.
.
.
South
All
.
.
.
.
.
.
.
.
.
.
.
.
.
.
.
.
.
.
.
.
.
.
.
.
.
.
.
.
.
.
.
.
.
.
.
.
.
.
.
.
.
.
.
.
.
.
.
.
.
.
.
.
.
.
.
.
.
.
.
.
.
.
.
.
.
.
.
.
.
.
.
.
.
.
.
.
.
.
.
.
.
.
.
.
.
.
.
.
.
.
.
.
.
.
.
.
.
.
.
.
.
.
.
.
West
All
.
.
.
.
.
.
.
.
.
.
.
.
.
.
.
.
.
.
.
.
.
.
.
.
.
.
.
.
.
.
.
.
.
.
.
.
.
.
.
.
.
.
.
.
.
.
.
.
.
.
.
.
.
.
.
.
.
.
.
.
.
.
.
.
.
.
.
.
.
.
.
.
.
.
.
.
.
.
.
.
.
.
.
.
.
.
.
.
.
.
.
.
.
.
.
.
.
.
.
.
.
.
.
.
United States
All
.
.
.
.
.
.
.
.
.
.
.
.
.
.
.
.
See footnotes at end of table.
.
.
.
.
.
.
.
.
.
.
.
.
.
.
.
.
.
.
.
.
.
.
.
.
.
.
.
.
.
.
.
.
Number of days of care in thousands
.
.
.
.
.
.
.
.
.
.
.
.
.
.
.
.
.
.
.
.
.
.
.
.
.
.
.
.
.
.
.
.
.
.
.
.
.
.
.
.
.
.
.
.
.
.
.
.
.
.
.
.
.
.
.
.
.
.
.
.
Page 12 [ Series 13, No. 168
Table 4. Number of discharges from short-stay hospitals and of days of care with average length of stay, by principal expected source of
payment, sex, age, and geographic region: United States, 2006—Con.
[Discharges of inpatients from nonfederal hospitals. Excludes newborn infants]
Worker’s
compensation
and other
government
payments
Blue Cross
Blue Shield
and other
private
insurance
All principal
expected
sources of
payment1
Medicare
Medicaid
. . . . . . . . . . . . . . . . . . . . . . . . . . . . . . . . . . . .
38,454
16,934
6,635
441
4,622
6,623
1,217
775
Male . . . . . . . . . . . . . . . . . . . . . . . . . . . . . . . . . . .
Female . . . . . . . . . . . . . . . . . . . . . . . . . . . . . . . . .
17,193
21,261
7,229
9,706
3,361
3,274
280
161
1,822
2,800
2,980
3,643
723
493
352
424
Under 15 years .
15–44 years . . .
45–64 years . . .
65 years and over
.
.
.
.
2,632
8,939
9,854
17,029
*
807
2,177
13,943
1,237
3,068
2,043
287
*
148
156
*
*
1,582
1,759
973
691
2,237
2,655
1,040
87
583
461
*
*
269
223
*
. . . . . . . . . . . . . . . . . . . . . . . . . . . . . . . . . . . .
33,585
18,641
3,865
*
3,298
5,437
978
694
Male . . . . . . . . . . . . . . . . . . . . . . . . . . . . . . . . . . .
Female . . . . . . . . . . . . . . . . . . . . . . . . . . . . . . . . .
13,780
19,805
7,452
11,189
1,372
2,493
*
*
1,287
2,011
2,403
3,035
537
441
361
333
Under 15 years .
15–44 years . . .
45–64 years . . .
65 years and over
820
7,200
8,464
17,101
*
680
2,100
15,861
414
2,165
1,179
107
*
*
*
*
*
1,352
1,455
334
228
1,997
2,665
547
*
468
458
42
*
313
300
*
Region, sex, and age
Northeast
All
.
.
.
.
.
.
.
.
.
.
.
.
.
.
.
.
.
.
.
.
.
.
.
.
.
.
.
.
.
.
.
.
.
.
.
.
.
.
.
.
.
.
.
.
HMO or
PPO2
Self-pay
Other
payments
and no
charge
Number of days of care in thousands
.
.
.
.
.
.
.
.
.
.
.
.
.
.
.
.
.
.
.
.
.
.
.
.
.
.
.
.
.
.
.
.
.
.
.
.
.
.
.
.
.
.
.
.
.
.
.
.
.
.
.
.
.
.
.
.
.
.
.
.
Midwest
All
.
.
.
.
.
.
.
.
.
.
.
.
.
.
.
.
.
.
.
.
.
.
.
.
.
.
.
.
.
.
.
.
.
.
.
.
.
.
.
.
.
.
.
.
.
.
.
.
.
.
.
.
.
.
.
.
.
.
.
.
.
.
.
.
.
.
.
.
.
.
.
.
.
.
.
.
.
.
.
.
.
.
.
.
.
.
.
.
.
.
.
.
.
.
.
.
.
.
.
.
.
.
.
.
.
.
.
.
South
All
. . . . . . . . . . . . . . . . . . . . . . . . . . . . . . . . . . . .
64,474
29,010
10,884
1,923
5,917
10,293
3,178
*
Male . . . . . . . . . . . . . . . . . . . . . . . . . . . . . . . . . . .
Female . . . . . . . . . . . . . . . . . . . . . . . . . . . . . . . . .
28,225
36,249
12,476
16,534
4,117
6,767
1,256
667
2,429
3,488
4,699
5,594
1,689
1,489
*
*
Under 15 years .
15–44 years . . .
45–64 years . . .
65 years and over
4,092
17,024
17,939
25,420
*
1,951
4,818
22,210
2,309
5,138
3,004
432
68
810
845
201
405
2,152
2,420
940
632
3,739
4,622
1,299
53
1,739
1,243
144
*
*
*
115
. . . . . . . . . . . . . . . . . . . . . . . . . . . . . . . . . . . .
29,828
11,557
6,863
815
5,059
3,263
1,094
1,005
Male . . . . . . . . . . . . . . . . . . . . . . . . . . . . . . . . . . .
Female . . . . . . . . . . . . . . . . . . . . . . . . . . . . . . . . .
13,285
16,543
5,034
6,523
*
3,626
441
374
2,057
3,003
1,408
1,854
567
527
463
541
Under 15 years .
15–44 years . . .
45–64 years . . .
65 years and over
*
7,323
7,077
11,980
*
437
1,477
9,633
*
2,508
1,624
*
*
318
276
93
*
1,746
1,646
1,002
*
1,259
1,172
531
*
523
483
*53
*
445
345
*
.
.
.
.
.
.
.
.
.
.
.
.
.
.
.
.
.
.
.
.
.
.
.
.
.
.
.
.
.
.
.
.
.
.
.
.
.
.
.
.
.
.
.
.
.
.
.
.
.
.
.
.
.
.
.
.
.
.
.
.
.
.
.
.
.
.
.
.
.
.
.
.
.
.
.
.
.
.
.
.
.
.
.
.
.
.
.
.
.
.
.
.
.
.
.
.
.
.
.
.
.
.
.
.
.
.
.
.
West
All
.
.
.
.
.
.
.
.
.
.
.
.
.
.
.
.
.
.
.
.
.
.
.
.
.
.
.
.
.
.
.
.
.
.
.
.
.
.
.
.
.
.
.
.
.
.
.
.
.
.
.
.
.
.
.
.
.
.
.
.
.
.
.
.
.
.
.
.
.
.
.
.
.
.
.
.
.
.
.
.
.
.
.
.
.
.
.
.
.
.
.
.
.
.
.
.
.
.
.
.
.
.
.
.
.
.
.
.
United States
All
Average length of stay in days
. . . . . . . . . . . . . . . . . . . . . . . . . . . . . . . . . . . .
4.8
5.6
4.8
5.0
3.9
3.9
4.0
4.3
Male . . . . . . . . . . . . . . . . . . . . . . . . . . . . . . . . . . .
Female . . . . . . . . . . . . . . . . . . . . . . . . . . . . . . . . .
5.2
4.5
5.6
5.7
6.3
4.0
5.5
4.3
4.3
3.6
4.4
3.6
4.3
3.7
4.8
4.0
Under 15 years .
15–44 years . . .
45–64 years . . .
65 years and over
4.8
3.7
5.0
5.5
5.3
6.2
6.2
5.5
5.5
3.9
6.2
6.3
7.1
4.7
5.0
5.2
4.3
3.2
4.3
5.0
3.7
3.4
4.3
5.2
3.4
3.6
4.5
4.9
4.7
4.0
4.5
5.1
.
.
.
.
.
.
.
.
.
.
.
.
.
.
.
.
.
.
.
.
.
.
.
.
.
.
.
.
.
.
.
.
.
.
.
.
.
.
.
.
.
.
.
.
.
.
.
.
.
.
.
.
.
.
.
.
.
.
.
.
.
.
.
.
.
.
.
.
.
.
.
.
.
.
.
.
.
.
.
.
.
.
.
.
.
.
.
.
.
.
.
.
.
.
.
.
.
.
.
.
.
.
.
.
.
.
.
.
Northeast
All
. . . . . . . . . . . . . . . . . . . . . . . . . . . . . . . . . . . .
5.3
6.1
6.0
4.7
4.3
4.3
4.7
4.6
Male . . . . . . . . . . . . . . . . . . . . . . . . . . . . . . . . . . .
Female . . . . . . . . . . . . . . . . . . . . . . . . . . . . . . . . .
5.6
5.0
6.1
6.1
7.1
5.2
5.0
4.3
4.5
4.2
4.7
4.0
5.3
4.0
5.5
4.1
Under 15 years .
15–44 years . . .
45–64 years . . .
65 years and over
5.5
4.4
5.3
5.9
*
6.8
6.3
6.0
6.8
5.3
6.7
6.6
7.5
4.1
4.5
5.3
3.9
3.6
4.6
5.7
4.9
3.7
4.4
5.4
4.9
4.3
5.2
4.8
5.7
3.8
4.8
5.3
.
.
.
.
.
.
.
.
.
.
.
.
.
.
.
.
See footnotes at end of table.
.
.
.
.
.
.
.
.
.
.
.
.
.
.
.
.
.
.
.
.
.
.
.
.
.
.
.
.
.
.
.
.
.
.
.
.
.
.
.
.
.
.
.
.
.
.
.
.
.
.
.
.
.
.
.
.
.
.
.
.
.
.
.
.
.
.
.
.
.
.
.
.
.
.
.
.
.
.
.
.
.
.
.
.
.
.
.
.
.
.
.
.
Series 13, No. 168 [ Page 13
Table 4. Number of discharges from short-stay hospitals and of days of care with average length of stay, by principal expected source of
payment, sex, age, and geographic region: United States, 2006—Con.
[Discharges of inpatients from nonfederal hospitals. Excludes newborn infants]
Worker’s
compensation
and other
government
payments
Blue Cross
Blue Shield
and other
private
insurance
All principal
expected
sources of
payment1
Medicare
Medicaid
. . . . . . . . . . . . . . . . . . . . . . . . . . . . . . . . . . . .
4.2
4.9
3.9
4.2
3.4
3.5
3.2
3.9
Male . . . . . . . . . . . . . . . . . . . . . . . . . . . . . . . . . . .
Female . . . . . . . . . . . . . . . . . . . . . . . . . . . . . . . . .
4.4
4.1
4.7
5.1
4.9
3.5
4.7
3.6
3.7
3.2
3.9
3.2
3.3
3.0
4.4
3.5
Under 15 years .
15–44 years . . .
45–64 years . . .
65 years and over
.
.
.
.
3.5
3.2
4.3
4.8
*
4.7
5.7
4.9
4.2
3.4
5.3
4.5
*
3.8
4.6
4.2
3.4
3.0
3.7
4.3
2.8
2.9
3.9
4.7
*2.1
2.8
3.6
3.5
*
3.7
4.0
5.2
. . . . . . . . . . . . . . . . . . . . . . . . . . . . . . . . . . . .
4.9
5.9
4.6
5.4
4.0
4.2
4.0
4.5
Male . . . . . . . . . . . . . . . . . . . . . . . . . . . . . . . . . . .
Female . . . . . . . . . . . . . . . . . . . . . . . . . . . . . . . . .
5.4
4.6
5.9
5.9
6.3
3.9
6.1
4.5
4.6
3.6
4.7
3.8
4.4
3.7
4.8
4.3
Under 15 years .
15–44 years . . .
45–64 years . . .
65 years and over
4.4
3.9
5.3
5.7
5.3
6.9
6.4
5.7
4.8
3.8
6.5
5.8
4.6
5.4
5.6
5.5
4.1
3.2
4.6
5.3
3.6
3.5
4.6
5.8
2.5
3.7
4.5
5.8
4.1
4.3
5.0
5.4
Region, sex, and age
Midwest
All
.
.
.
.
.
.
.
.
.
.
.
.
.
.
.
.
.
.
.
.
.
.
.
.
.
.
.
.
.
.
.
.
.
.
.
.
.
.
.
.
HMO or
PPO2
Self-pay
Other
payments
and no
charge
Average length of stay in days
.
.
.
.
.
.
.
.
.
.
.
.
.
.
.
.
.
.
.
.
.
.
.
.
.
.
.
.
.
.
.
.
.
.
.
.
.
.
.
.
.
.
.
.
.
.
.
.
.
.
.
.
.
.
.
.
.
.
.
.
.
.
.
.
South
All
.
.
.
.
.
.
.
.
.
.
.
.
.
.
.
.
.
.
.
.
.
.
.
.
.
.
.
.
.
.
.
.
.
.
.
.
.
.
.
.
.
.
.
.
.
.
.
.
.
.
.
.
.
.
.
.
.
.
.
.
.
.
.
.
.
.
.
.
.
.
.
.
.
.
.
.
.
.
.
.
.
.
.
.
.
.
.
.
.
.
.
.
.
.
.
.
.
.
.
.
.
.
.
.
.
.
.
.
West
All
. . . . . . . . . . . . . . . . . . . . . . . . . . . . . . . . . . . .
4.6
5.7
4.8
4.7
3.8
3.5
4.2
3.9
Male . . . . . . . . . . . . . . . . . . . . . . . . . . . . . . . . . . .
Female . . . . . . . . . . . . . . . . . . . . . . . . . . . . . . . . .
5.1
4.2
5.6
5.7
6.5
3.9
4.8
4.5
4.2
3.5
4.1
3.2
4.2
4.1
4.6
3.5
Under 15 years .
15–44 years . . .
45–64 years . . .
65 years and over
5.3
3.4
4.8
5.4
*
5.7
6.3
5.6
6.0
3.5
6.0
7.4
*
4.1
4.1
5.4
4.9
3.0
4.1
4.5
3.0
3.2
3.8
4.5
3.2
3.6
5.1
*4.9
*
3.4
4.0
4.7
.
.
.
.
.
.
.
.
.
.
.
.
.
.
.
.
.
.
.
.
.
.
.
.
.
.
.
.
.
.
.
.
.
.
.
.
.
.
.
.
.
.
.
.
.
.
.
.
.
.
.
.
.
.
.
.
.
.
.
.
.
.
.
.
.
.
.
.
.
.
.
.
.
.
.
.
.
.
.
.
.
.
.
.
.
.
.
.
.
.
.
.
.
.
.
.
.
.
.
.
.
.
.
.
.
.
.
.
* Figure does not meet standards of reliability or precision.
1
Includes discharges for which no expected source of payment was provided.
2
HMO is health maintenance organization; PPO is preferred provider organization.
Page 14 [ Series 13, No. 168
Table 5. Number and percent distribution of discharges from short-stay hospitals and of days of care with average length of stay, by bed
size of hospital, according to sex, age, and geographic region: United States, 2006
[Discharges of inpatients from nonfederal hospitals. Excludes newborn infants]
Sex, age, and region
All bed
sizes
6–99
beds
100–199
beds
34,854
7,997
7,308
13,990
20,864
3,108
4,889
200–299
beds
300–499
beds
500 beds
or more
6,719
8,053
4,777
2,804
4,504
2,740
3,979
3,229
4,823
2,109
2,668
Number of discharges in thousands
All
. . . . . . . . . . . . . . . . . . . . . . . . . . . . . . . . . . . .
Sex
Male . . . . . . . . . . . . . . . . . . . . . . . . . . . . . . . . . . .
Female . . . . . . . . . . . . . . . . . . . . . . . . . . . . . . . . .
Age
Under 15 years .
15–44 years . . .
45–64 years . . .
65 years and over
.
.
.
.
.
.
.
.
.
.
.
.
.
.
.
.
.
.
.
.
Northeast
Midwest .
South . .
West . . .
.
.
.
.
.
.
.
.
.
.
.
.
.
.
.
.
.
.
.
.
.
.
.
.
.
.
.
.
.
.
.
.
.
.
.
.
.
.
.
.
.
.
.
.
.
.
.
.
.
.
.
.
.
.
.
.
.
.
.
.
.
.
.
.
.
.
.
.
.
.
.
.
.
.
.
.
.
.
.
.
.
.
.
.
.
.
.
.
.
.
.
.
.
.
.
.
.
.
.
.
.
.
.
.
.
.
.
.
2,298
10,800
8,686
13,070
352
2,353
1,793
3,499
370
2,335
1,817
2,786
*
1,945
1,582
2,542
628
2,624
2,087
2,715
298
1,542
1,408
1,529
.
.
.
.
.
.
.
.
.
.
.
.
.
.
.
.
.
.
.
.
.
.
.
.
.
.
.
.
.
.
.
.
.
.
.
.
.
.
.
.
.
.
.
.
.
.
.
.
.
.
.
.
.
.
.
.
.
.
.
.
.
.
.
.
.
.
.
.
7,277
7,951
13,140
6,486
1,420
2,944
2,970
*
1,659
1,387
2,624
1,639
1,358
*
2,375
1,578
1,439
*
2,901
2,408
1,401
906
2,270
200
. . . . . . . . . . . . . . . . . . . . . . . . . . . . . . . . . . . .
100.0
22.9
21.0
19.3
23.1
13.7
100.0
100.0
22.2
23.4
20.0
21.6
19.6
19.1
23.1
23.1
15.1
12.8
Region
.
.
.
.
.
.
.
.
.
.
.
.
.
.
.
.
.
.
.
.
.
.
.
.
.
.
.
.
.
.
.
.
.
.
.
.
.
.
.
.
Percent distribution of discharges
All
Sex
Male . . . . . . . . . . . . . . . . . . . . . . . . . . . . . . . . . . .
Female . . . . . . . . . . . . . . . . . . . . . . . . . . . . . . . . .
Age
Under 15 years .
15–44 years . . .
45–64 years . . .
65 years and over
.
.
.
.
.
.
.
.
.
.
.
.
.
.
.
.
.
.
.
.
Northeast
Midwest .
South . .
West . . .
.
.
.
.
.
.
.
.
.
.
.
.
.
.
.
.
.
.
.
.
.
.
.
.
.
.
.
.
.
.
.
.
.
.
.
.
.
.
.
.
.
.
.
.
.
.
.
.
.
.
.
.
.
.
.
.
.
.
.
.
.
.
.
.
.
.
.
.
.
.
.
.
.
.
.
.
.
.
.
.
.
.
.
.
.
.
.
.
.
.
.
.
.
.
.
.
.
.
.
.
.
.
.
.
.
.
.
.
100.0
100.0
100.0
100.0
15.3
21.8
20.6
26.8
16.1
21.6
20.9
21.3
*
18.0
18.2
19.4
27.3
24.3
24.0
20.8
13.0
14.3
16.2
11.7
.
.
.
.
.
.
.
.
.
.
.
.
.
.
.
.
.
.
.
.
.
.
.
.
.
.
.
.
.
.
.
.
.
.
.
.
.
.
.
.
.
.
.
.
.
.
.
.
.
.
.
.
.
.
.
.
.
.
.
.
.
.
.
.
.
.
.
.
100.0
100.0
100.0
100.0
19.5
37.0
22.6
*
22.8
17.4
20.0
25.3
18.7
17.7
18.1
24.3
19.8
16.4
22.1
37.1
19.3
11.4
17.3
3.1
. . . . . . . . . . . . . . . . . . . . . . . . . . . . . . . . . . . .
166,342
33,468
33,097
32,024
40,823
26,930
72,483
93,858
13,630
19,838
13,663
19,434
13,990
18,034
18,097
22,726
13,103
13,826
Region
.
.
.
.
.
.
.
.
.
.
.
.
.
.
.
.
.
.
.
.
.
.
.
.
.
.
.
.
.
.
.
.
.
.
.
.
.
.
.
.
Number of days of care in thousands
All
Sex
Male . . . . . . . . . . . . . . . . . . . . . . . . . . . . . . . . . . .
Female . . . . . . . . . . . . . . . . . . . . . . . . . . . . . . . . .
Age
Under 15 years .
15–44 years . . .
45–64 years . . .
65 years and over
.
.
.
.
.
.
.
.
.
.
.
.
.
.
.
.
.
.
.
.
Northeast
Midwest .
South . .
West . . .
.
.
.
.
.
.
.
.
.
.
.
.
.
.
.
.
.
.
.
.
.
.
.
.
.
.
.
.
.
.
.
.
.
.
.
.
.
.
.
.
.
.
.
.
.
.
.
.
.
.
.
.
.
.
.
.
.
.
.
.
.
.
.
.
.
.
.
.
.
.
.
.
.
.
.
.
.
.
.
.
.
.
.
.
.
.
.
.
.
.
.
.
.
.
.
.
.
.
.
.
.
.
.
.
.
.
.
.
10,990
40,486
43,335
71,530
1,466
8,330
7,628
16,043
*
8,038
8,407
15,204
*
7,004
7,624
14,015
3,192
10,142
11,331
16,159
1,503
6,973
8,345
10,109
.
.
.
.
.
.
.
.
.
.
.
.
.
.
.
.
.
.
.
.
.
.
.
.
.
.
.
.
.
.
.
.
.
.
.
.
.
.
.
.
.
.
.
.
.
.
.
.
.
.
.
.
.
.
.
.
.
.
.
.
.
.
.
.
.
.
.
.
38,454
33,585
64,474
29,828
7,234
10,632
13,110
*
8,347
5,973
11,828
6,949
6,865
*
11,645
*
8,256
*
14,570
11,910
7,752
4,702
13,322
1,154
Region
.
.
.
.
.
.
.
.
.
.
.
.
.
.
.
.
.
.
.
.
See footnote at end of table.
.
.
.
.
.
.
.
.
.
.
.
.
.
.
.
.
.
.
.
.
Series 13, No. 168 [ Page 15
Table 5. Number and percent distribution of discharges from short-stay hospitals and of days of care with average length of stay, by bed
size of hospital, according to sex, age, and geographic region: United States, 2006—Con.
[Discharges of inpatients from nonfederal hospitals. Excludes newborn infants]
Sex, age, and region
All bed
sizes
6–99
beds
100–199
beds
100.0
20.1
19.9
100.0
100.0
18.8
21.1
200–299
beds
300–499
beds
500 beds
or more
19.3
24.5
16.2
18.8
20.7
19.3
19.2
25.0
24.2
18.1
14.7
Percent distribution of days of care
All
. . . . . . . . . . . . . . . . . . . . . . . . . . . . . . . . . . . .
Sex
Male . . . . . . . . . . . . . . . . . . . . . . . . . . . . . . . . . . .
Female . . . . . . . . . . . . . . . . . . . . . . . . . . . . . . . . .
Age
Under 15 years .
15–44 years . . .
45–64 years . . .
65 years and over
.
.
.
.
.
.
.
.
.
.
.
.
.
.
.
.
.
.
.
.
Northeast
Midwest .
South . .
West . . .
.
.
.
.
.
.
.
.
.
.
.
.
.
.
.
.
.
.
.
.
.
.
.
.
.
.
.
.
.
.
.
.
.
.
.
.
.
.
.
.
.
.
.
.
.
.
.
.
.
.
.
.
.
.
.
.
.
.
.
.
.
.
.
.
.
.
.
.
.
.
.
.
.
.
.
.
.
.
.
.
.
.
.
.
.
.
.
.
.
.
.
.
.
.
.
.
.
.
.
.
.
.
.
.
.
.
.
.
100.0
100.0
100.0
100.0
*
20.6
17.6
22.4
*
19.9
19.4
21.3
*
17.3
17.6
19.6
29.0
25.1
26.1
22.6
13.7
17.2
19.3
14.1
.
.
.
.
.
.
.
.
.
.
.
.
.
.
.
.
.
.
.
.
.
.
.
.
.
.
.
.
.
.
.
.
.
.
.
.
.
.
.
.
.
.
.
.
.
.
.
.
.
.
.
.
.
.
.
.
.
.
.
.
.
.
.
.
.
.
.
.
100.0
100.0
100.0
100.0
18.8
31.7
20.3
*
21.7
17.8
18.3
23.3
17.9
18.4
18.1
24.6
21.5
18.1
22.6
39.9
20.2
14.0
20.7
3.9
. . . . . . . . . . . . . . . . . . . . . . . . . . . . . . . . . . . .
4.8
4.2
4.5
4.8
5.1
5.6
5.2
4.5
4.4
4.1
4.9
4.3
5.1
4.5
5.6
4.7
6.2
5.2
Region
.
.
.
.
.
.
.
.
.
.
.
.
.
.
.
.
.
.
.
.
.
.
.
.
.
.
.
.
.
.
.
.
.
.
.
.
.
.
.
.
Average length of stay in days
All
Sex
Male . . . . . . . . . . . . . . . . . . . . . . . . . . . . . . . . . . .
Female . . . . . . . . . . . . . . . . . . . . . . . . . . . . . . . . .
Age
Under 15 years .
15–44 years . . .
45–64 years . . .
65 years and over
.
.
.
.
.
.
.
.
.
.
.
.
.
.
.
.
.
.
.
.
Northeast
Midwest .
South . .
West . . .
.
.
.
.
.
.
.
.
.
.
.
.
.
.
.
.
.
.
.
.
.
.
.
.
.
.
.
.
.
.
.
.
.
.
.
.
.
.
.
.
.
.
.
.
.
.
.
.
.
.
.
.
.
.
.
.
.
.
.
.
.
.
.
.
.
.
.
.
.
.
.
.
.
.
.
.
.
.
.
.
.
.
.
.
.
.
.
.
.
.
.
.
.
.
.
.
.
.
.
.
.
.
.
.
.
.
.
.
4.8
3.7
5.0
5.5
4.2
3.5
4.3
4.6
3.9
3.4
4.6
5.5
5.2
3.6
4.8
5.5
5.1
3.9
5.4
6.0
5.0
4.5
5.9
6.6
.
.
.
.
.
.
.
.
.
.
.
.
.
.
.
.
.
.
.
.
.
.
.
.
.
.
.
.
.
.
.
.
.
.
.
.
.
.
.
.
.
.
.
.
.
.
.
.
.
.
.
.
.
.
.
.
.
.
.
.
.
.
.
.
.
.
.
.
5.3
4.2
4.9
4.6
5.1
3.6
4.4
3.8
5.0
4.3
4.5
4.2
5.1
4.4
4.9
4.6
5.7
4.7
5.0
4.9
5.5
5.2
5.9
5.8
Region
.
.
.
.
.
.
.
.
.
.
.
.
.
.
.
.
.
.
.
.
.
.
.
.
.
.
.
.
.
.
.
.
.
.
.
.
.
.
.
.
* Figure does not meet standards of reliability or precision.
Page 16 [ Series 13, No. 168
Table 6. Number and percent distribution of discharges from short-stay hospitals and of days of care, with average length of stay, by
hospital ownership, according to sex and age: United States, 2006
[Discharges of inpatients from nonfederal hospitals. Excludes newborn infants]
Sex and age
All
Proprietary
Government
Nonprofit
Number of discharges in thousands
All
. . . . . . . . . . . . . . . . . . . . . . . . . . . . . . . . . . . .
34,854
4,107
4,279
26,468
Sex
Male . . . . . . . . . . . . . . . . . . . . . . . . . . . . . . . . . . .
Female . . . . . . . . . . . . . . . . . . . . . . . . . . . . . . . . .
13,990
20,864
1,523
2,583
1,791
2,487
10,676
15,793
.
.
.
.
2,298
10,800
8,686
13,070
*
1,535
955
1,338
233
1,485
1,164
1,397
1,785
7,780
6,567
10,336
. . . . . . . . . . . . . . . . . . . . . . . . . . . . . . . . . . . .
100.0
11.8
12.3
75.9
100.0
100.0
10.9
12.4
12.8
11.9
76.3
75.7
100.0
100.0
100.0
100.0
*
14.2
11.0
10.2
10.2
13.7
13.4
10.7
77.7
72.0
75.6
79.1
Age
Under 15 years .
15–44 years . . .
45–64 years . . .
65 years and over
.
.
.
.
.
.
.
.
.
.
.
.
.
.
.
.
.
.
.
.
.
.
.
.
.
.
.
.
.
.
.
.
.
.
.
.
.
.
.
.
.
.
.
.
.
.
.
.
.
.
.
.
.
.
.
.
.
.
.
.
.
.
.
.
.
.
.
.
.
.
.
.
.
.
.
.
.
.
.
.
.
.
.
.
.
.
.
.
.
.
.
.
.
.
.
.
.
.
.
.
.
.
.
.
Percent distribution of discharges
All
Sex
Male . . . . . . . . . . . . . . . . . . . . . . . . . . . . . . . . . . .
Female . . . . . . . . . . . . . . . . . . . . . . . . . . . . . . . . .
Age
Under 15 years .
15–44 years . . .
45–64 years . . .
65 years and over
.
.
.
.
.
.
.
.
.
.
.
.
.
.
.
.
.
.
.
.
.
.
.
.
.
.
.
.
.
.
.
.
.
.
.
.
.
.
.
.
.
.
.
.
.
.
.
.
.
.
.
.
.
.
.
.
.
.
.
.
.
.
.
.
.
.
.
.
.
.
.
.
.
.
.
.
.
.
.
.
.
.
.
.
.
.
.
.
.
.
.
.
.
.
.
.
.
.
.
.
.
.
.
.
.
.
.
.
Number of days of care in thousands
All
. . . . . . . . . . . . . . . . . . . . . . . . . . . . . . . . . . . .
166,342
21,041
22,053
123,248
72,483
93,858
8,555
12,486
10,201
11,852
53,728
69,520
.
.
.
.
10,990
40,486
43,335
71,530
*
6,229
5,481
8,167
876
6,414
6,564
8,199
8,950
27,844
31,290
55,164
. . . . . . . . . . . . . . . . . . . . . . . . . . . . . . . . . . . .
100.0
12.6
13.3
74.1
100.0
100.0
11.8
13.3
14.1
12.6
74.1
74.1
.
.
.
.
100.0
100.0
100.0
100.0
*
15.4
12.6
11.4
8.0
15.8
15.1
11.5
81.4
68.8
72.2
77.1
. . . . . . . . . . . . . . . . . . . . . . . . . . . . . . . . . . . .
4.8
5.1
5.2
4.7
5.2
4.5
5.6
4.8
5.7
4.8
5.0
4.4
4.8
3.7
5.0
5.5
4.2
4.1
5.7
6.1
3.8
4.3
5.6
5.9
5.0
3.6
4.8
5.3
Sex
Male . . . . . . . . . . . . . . . . . . . . . . . . . . . . . . . . . . .
Female . . . . . . . . . . . . . . . . . . . . . . . . . . . . . . . . .
Age
Under 15 years .
15–44 years . . .
45–64 years . . .
65 years and over
.
.
.
.
.
.
.
.
.
.
.
.
.
.
.
.
.
.
.
.
.
.
.
.
.
.
.
.
.
.
.
.
.
.
.
.
.
.
.
.
.
.
.
.
.
.
.
.
.
.
.
.
.
.
.
.
.
.
.
.
.
.
.
.
.
.
.
.
.
.
.
.
.
.
.
.
.
.
.
.
.
.
.
.
.
.
.
.
.
.
.
.
.
.
.
.
.
.
.
.
.
.
.
.
Percent distribution of days of care
All
Sex
Male . . . . . . . . . . . . . . . . . . . . . . . . . . . . . . . . . . .
Female . . . . . . . . . . . . . . . . . . . . . . . . . . . . . . . . .
Age
Under 15 years .
15–44 years . . .
45–64 years . . .
65 years and over
.
.
.
.
.
.
.
.
.
.
.
.
.
.
.
.
.
.
.
.
.
.
.
.
.
.
.
.
.
.
.
.
.
.
.
.
.
.
.
.
.
.
.
.
.
.
.
.
.
.
.
.
.
.
.
.
.
.
.
.
.
.
.
.
.
.
.
.
.
.
.
.
.
.
.
.
.
.
.
.
.
.
.
.
.
.
.
.
.
.
.
.
.
.
.
.
.
.
.
.
.
.
.
.
Average length of stay in days
All
Sex
Male . . . . . . . . . . . . . . . . . . . . . . . . . . . . . . . . . . .
Female . . . . . . . . . . . . . . . . . . . . . . . . . . . . . . . . .
Age
Under 15 years .
15–44 years . . .
45–64 years . . .
65 years and over
.
.
.
.
.
.
.
.
.
.
.
.
.
.
.
.
.
.
.
.
.
.
.
.
.
.
.
.
.
.
.
.
.
.
.
.
.
.
.
.
.
.
.
.
.
.
.
.
.
.
.
.
.
.
.
.
.
.
.
.
.
.
.
.
.
.
.
.
.
.
.
.
.
.
.
.
.
.
.
.
* Figure does not meet standards of reliability or precision.
.
.
.
.
.
.
.
.
.
.
.
.
.
.
.
.
.
.
.
.
.
.
.
.
.
.
.
.
Series 13, No. 168 [ Page 17
Table 7. Number and percent distribution of discharges by type and source of admission to short-stay hospitals, according to sex and age:
United States, 2006
[Discharges of inpatients from nonfederal hospitals. Excludes newborn infants]
Under
15 years
Admission type and source
All ages
Male
Female
All types and sources . . . . . . . . . . . . . . . . . . . . . . . . .
34,854
13,990
20,864
2,298
15–44
years
45–64
years
65 years
and over
10,800
8,686
13,070
Number of discharges in thousands
Type of admission
Emergency . . . .
Urgent . . . . . . .
Elective . . . . . .
Item not available
.
.
.
.
.
.
.
.
.
.
.
.
.
.
.
.
.
.
.
.
.
.
.
.
.
.
.
.
.
.
.
.
.
.
.
.
.
.
.
.
.
.
.
.
.
.
.
.
.
.
.
.
.
.
.
.
.
.
.
.
.
.
.
.
.
.
.
.
.
.
.
.
.
.
.
.
.
.
.
.
.
.
.
.
.
.
.
.
.
.
.
.
.
.
.
.
.
.
.
.
.
.
.
.
.
.
.
.
14,781
8,500
8,383
3,190
6,766
3,079
2,819
1,326
8,015
5,420
5,564
1,864
865
744
*
207
3,422
3,099
3,113
1,166
4,015
1,723
2,126
822
6,479
2,933
2,663
996
.
.
.
.
.
.
.
.
.
.
.
.
.
.
.
.
.
.
.
.
.
.
.
.
.
.
.
.
.
.
.
.
.
.
.
.
.
.
.
.
.
.
.
.
.
.
.
.
.
.
.
.
.
.
.
.
.
.
.
.
.
.
.
.
.
.
.
.
.
.
.
.
.
.
.
.
.
.
13,759
14,921
1,069
429
614
4,061
4,450
6,867
527
192
228
1,725
9,309
8,054
542
237
385
2,337
786
913
150
17
*
381
5,589
3,278
182
51
330
1,369
3,130
4,057
276
89
127
1,007
4,254
6,673
462
272
106
1,304
All types and sources . . . . . . . . . . . . . . . . . . . . . . . . .
100.0
100.0
100.0
100.0
100.0
100.0
100.0
Source of admission
Physician referral1 . . . . . . . . . .
Emergency department . . . . . .
Transfer from a hospital . . . . . .
Transfer from other health facility2
Other sources3 . . . . . . . . . . . .
Item not available . . . . . . . . . .
.
.
.
.
.
.
.
.
.
.
.
.
.
.
.
.
.
.
.
.
.
.
.
.
Percent distribution
Type of admission
Emergency . . . .
Urgent . . . . . . .
Elective . . . . . .
Item not available
.
.
.
.
.
.
.
.
.
.
.
.
.
.
.
.
.
.
.
.
.
.
.
.
.
.
.
.
.
.
.
.
.
.
.
.
.
.
.
.
.
.
.
.
.
.
.
.
.
.
.
.
.
.
.
.
.
.
.
.
.
.
.
.
.
.
.
.
.
.
.
.
.
.
.
.
.
.
.
.
.
.
.
.
.
.
.
.
.
.
.
.
.
.
.
.
.
.
.
.
.
.
.
.
.
.
.
.
42.4
24.4
24.1
9.2
48.4
22.0
20.1
9.5
38.4
26.0
26.7
8.9
37.7
32.4
20.9
9.0
31.7
28.7
28.8
10.8
46.2
19.8
24.5
9.5
49.6
22.4
20.4
7.6
.
.
.
.
.
.
.
.
.
.
.
.
.
.
.
.
.
.
.
.
.
.
.
.
.
.
.
.
.
.
.
.
.
.
.
.
.
.
.
.
.
.
.
.
.
.
.
.
.
.
.
.
.
.
.
.
.
.
.
.
.
.
.
.
.
.
.
.
.
.
.
.
.
.
.
.
.
.
39.5
42.8
3.1
1.2
1.8
11.7
31.8
49.1
3.8
1.4
1.6
12.3
44.6
38.6
2.6
1.1
1.8
11.2
34.2
39.7
6.5
0.8
*
16.6
51.8
30.4
1.7
0.5
3.1
12.7
36.0
46.7
3.2
1.0
1.5
11.6
32.5
51.1
3.5
2.1
0.8
10.0
Source of admission
Physician referral1 . . . . .
Emergency department .
Transfer from a hospital .
Transfer from other health
Other sources3 . . . . . . .
Item not available . . . . .
. . . . .
. . . . .
. . . . .
facility2
. . . . .
. . . . .
.
.
.
.
.
.
.
.
.
.
.
.
.
.
.
.
.
.
.
.
.
.
.
.
* Figure does not meet standards of reliability or precision.
1
Referral from personal physician, clinic physician, or health maintenance organization physician.
2
Transfer from skilled nursing facility or other health facility.
3
Includes admissions directed by a court of law or requested by a law enforcement agent and other sources.
Page 18 [ Series 13, No. 168
Table 8. Number and percent distribution of discharges from short-stay hospitals and of days of care, with average length of stay, by
disposition of patient, according to sex, age, and geographic region: United States, 2006
[Discharges of inpatients from nonfederal hospitals. Excludes newborn infants]
Discharged alive
Transferred to
All
dispositions
Routine or
discharged
home
. . . . . . . . . . . . . . . . . . . . . . . . . . . . . . . . . . . .
34,854
26,906
1,535
3,161
2,009
730
514
Sex
Male . . . . . . . . . . . . . . . . . . . . . . . . . . . . . . . . . . .
Female . . . . . . . . . . . . . . . . . . . . . . . . . . . . . . . . .
13,990
20,864
10,549
16,357
712
823
1,185
1,976
922
1,087
359
372
264
249
Sex, age, and region
Other
short-term
hospital
Long-term
care
institution
Other
Died
Status
not
stated
Number of discharges in thousands
All
Age
Under 65 years . . .
Under 15 years . .
15–44 years . . . .
45–64 years . . . .
65 years and over . .
65–74 years . . . .
75–84 years . . . .
85 years and over
.
.
.
.
.
.
.
.
.
.
.
.
.
.
.
.
.
.
.
.
.
.
.
.
.
.
.
.
.
.
.
.
.
.
.
.
.
.
.
.
.
.
.
.
.
.
.
.
.
.
.
.
.
.
.
.
.
.
.
.
.
.
.
.
.
.
.
.
.
.
.
.
.
.
.
.
.
.
.
.
.
.
.
.
.
.
.
.
.
.
.
.
.
.
.
.
.
.
.
.
.
.
.
.
.
.
.
.
.
.
.
.
.
.
.
.
.
.
.
.
.
.
.
.
.
.
.
.
.
.
.
.
.
.
.
.
.
.
.
.
.
.
.
.
.
.
.
.
.
.
.
.
.
.
.
.
.
.
.
.
.
.
.
.
.
.
.
.
.
.
.
.
.
.
.
.
21,783
2,298
10,800
8,686
13,070
4,793
5,252
3,025
19,073
2,150
9,862
7,061
7,833
3,402
3,112
1,319
638
45
190
403
897
309
369
219
550
11
116
424
2,610
567
1,059
984
973
45
426
502
1,035
314
433
289
206
15
46
145
524
133
213
179
343
32
160
151
171
69
67
36
Northeast
Midwest .
South . .
West . . .
.
.
.
.
.
.
.
.
.
.
.
.
Region
. . . . .
. . . . .
. . . . .
. . . . .
.
.
.
.
.
.
.
.
.
.
.
.
.
.
.
.
.
.
.
.
.
.
.
.
.
.
.
.
.
.
.
.
.
.
.
.
.
.
.
.
.
.
.
.
.
.
.
.
.
.
.
.
.
.
.
.
.
.
.
.
.
.
.
.
.
.
.
.
7,277
7,951
13,140
6,486
5,471
5,867
10,372
5,196
280
360
547
348
846
962
969
383
486
524
630
369
148
164
268
150
45
*
353
*
.
.
.
.
.
.
.
.
.
.
.
.
.
.
.
.
.
.
.
.
.
.
.
.
.
.
.
.
.
.
.
.
.
.
.
.
.
.
.
.
.
.
.
.
.
.
.
.
.
.
.
.
Percent distribution of discharges
All
. . . . . . . . . . . . . . . . . . . . . . . . . . . . . . . . . . . .
100.0
77.2
4.4
9.1
5.8
2.1
1.5
Sex
Male . . . . . . . . . . . . . . . . . . . . . . . . . . . . . . . . . . .
Female . . . . . . . . . . . . . . . . . . . . . . . . . . . . . . . . .
100.0
100.0
75.4
78.4
5.1
3.9
8.5
9.5
6.6
5.2
2.6
1.8
1.9
1.2
Age
. . .
. . .
. . .
. . .
. . .
. . .
. . .
. . .
Under 65 years . . .
Under 15 years . .
15–44 years . . . .
45–64 years . . . .
65 years and over . .
65–74 years . . . .
75–84 years . . . .
85 years and over
.
.
.
.
.
.
.
.
.
.
.
.
.
.
.
.
.
.
.
.
.
.
.
.
.
.
.
.
.
.
.
.
.
.
.
.
.
.
.
.
.
.
.
.
.
.
.
.
.
.
.
.
.
.
.
.
.
.
.
.
.
.
.
.
.
.
.
.
.
.
.
.
.
.
.
.
.
.
.
.
.
.
.
.
.
.
.
.
.
.
.
.
.
.
.
.
.
.
.
.
.
.
.
.
.
.
.
.
.
.
.
.
.
.
.
.
.
.
.
.
.
.
.
.
.
.
.
.
.
.
.
.
.
.
.
.
.
.
.
.
.
.
.
.
.
.
.
.
.
.
.
.
.
.
.
.
.
.
.
.
.
.
.
.
.
.
.
.
.
.
.
.
.
.
.
.
100.0
100.0
100.0
100.0
100.0
100.0
100.0
100.0
87.6
93.6
91.3
81.3
59.9
71.0
59.3
43.6
2.9
2.0
1.8
4.6
6.9
6.4
7.0
7.3
2.5
0.5
1.1
4.9
20.0
11.8
20.2
32.5
4.5
2.0
3.9
5.8
7.9
6.5
8.2
9.5
0.9
0.7
0.4
1.7
4.0
2.8
4.0
5.9
1.6
1.4
1.5
1.7
1.3
1.4
1.3
1.2
Northeast
Midwest .
South . .
West . . .
.
.
.
.
.
.
.
.
.
.
.
.
Region
. . . . .
. . . . .
. . . . .
. . . . .
.
.
.
.
.
.
.
.
.
.
.
.
.
.
.
.
.
.
.
.
.
.
.
.
.
.
.
.
.
.
.
.
.
.
.
.
.
.
.
.
.
.
.
.
.
.
.
.
.
.
.
.
.
.
.
.
.
.
.
.
.
.
.
.
.
.
.
.
100.0
100.0
100.0
100.0
75.2
73.8
78.9
80.1
3.8
4.5
4.2
5.4
11.6
12.1
7.4
5.9
6.7
6.6
4.8
5.7
2.0
2.1
2.0
2.3
*
*
2.7
*
.
.
.
.
.
.
.
.
.
.
.
.
.
.
.
.
.
.
.
.
.
.
.
.
.
.
.
.
Number of days of care in thousands
All
. . . . . . . . . . . . . . . . . . . . . . . . . . . . . . . . . . . .
166,342
109,771
9,176
24,864
12,801
6,080
3,649
72,483
93,858
46,817
62,954
4,272
4,905
10,240
14,624
5,957
6,844
3,121
2,959
2,077
1,572
94,811
10,990
40,486
43,335
71,530
24,914
29,579
17,037
75,053
9,473
34,754
30,826
34,718
14,654
13,951
6,113
3,884
*
973
2,459
5,292
1,843
2,193
1,256
5,444
*
1,121
4,104
19,420
4,651
8,243
6,526
5,955
357
2,191
3,406
6,846
1,990
2,971
1,886
2,152
*
398
1,408
3,928
1,180
1,721
1,027
2,323
142
1,050
1,131
1,326
596
499
231
Sex
Male . . . . . . . . . . . . . . . . . . . . . . . . . . . . . . . . . . .
Female . . . . . . . . . . . . . . . . . . . . . . . . . . . . . . . . .
Age
Under 65 years . . .
Under 15 years . .
15–44 years . . . .
45–64 years . . . .
65 years and over . .
65–74 years . . . .
75–84 years . . . .
85 years and over
.
.
.
.
.
.
.
.
.
.
.
.
.
.
.
.
See footnote at end of table.
.
.
.
.
.
.
.
.
.
.
.
.
.
.
.
.
.
.
.
.
.
.
.
.
.
.
.
.
.
.
.
.
.
.
.
.
.
.
.
.
.
.
.
.
.
.
.
.
.
.
.
.
.
.
.
.
.
.
.
.
.
.
.
.
.
.
.
.
.
.
.
.
.
.
.
.
.
.
.
.
.
.
.
.
.
.
.
.
.
.
.
.
.
.
.
.
.
.
.
.
.
.
.
.
.
.
.
.
.
.
.
.
.
.
.
.
.
.
.
.
.
.
.
.
.
.
.
.
.
.
.
.
.
.
.
.
.
.
.
.
.
.
.
.
.
.
.
.
.
.
.
.
.
.
.
.
.
.
.
.
.
.
.
.
.
.
.
.
.
.
.
.
.
.
.
.
.
.
.
.
.
.
.
.
Series 13, No. 168 [ Page 19
Table 8. Number and percent distribution of discharges from short-stay hospitals and of days of care, with average length of stay, by
disposition of patient, according to sex, age, and geographic region: United States, 2006—Con.
[Discharges of inpatients from nonfederal hospitals. Excludes newborn infants]
Discharged alive
Transferred to
All
dispositions
Sex, age, and region
Routine or
discharged
home
Region
Northeast
Midwest .
South . .
West . . .
.
.
.
.
.
.
.
.
.
.
.
.
.
.
.
.
.
.
.
.
.
.
.
.
.
.
.
.
.
.
.
.
.
.
.
.
.
.
.
.
.
.
.
.
.
.
.
.
.
.
.
.
.
.
.
.
.
.
.
.
Other
short-term
hospital
Long-term
care
institution
Other
Died
Status
not
stated
1,480
941
2,356
1,303
311
*
2,547
*
Number of days of care in thousands
.
.
.
.
.
.
.
.
.
.
.
.
.
.
.
.
.
.
.
.
.
.
.
.
.
.
.
.
.
.
.
.
.
.
.
.
.
.
.
.
.
.
.
.
.
.
.
.
.
.
.
.
.
.
.
.
.
.
.
.
.
.
.
.
.
.
.
.
38,454
33,585
64,474
29,828
24,736
20,817
43,709
20,509
1,721
1,664
3,423
2,368
6,965
6,599
7,979
3,321
3,241
3,028
4,461
2,071
Percent distribution of days of care
All
. . . . . . . . . . . . . . . . . . . . . . . . . . . . . . . . . . . .
100.0
66.0
5.5
14.9
7.7
3.7
2.2
100.0
100.0
64.6
67.1
5.9
5.2
14.1
15.6
8.2
7.3
4.3
3.2
2.9
1.7
Sex
Male . . . . . . . . . . . . . . . . . . . . . . . . . . . . . . . . . . .
Female . . . . . . . . . . . . . . . . . . . . . . . . . . . . . . . . .
Age
Under 65 years . . .
Under 15 years . .
15–44 years . . . .
45–64 years . . . .
65 years and over . .
65–74 years . . . .
75–84 years . . . .
85 years and over
.
.
.
.
.
.
.
.
.
.
.
.
.
.
.
.
.
.
.
.
.
.
.
.
.
.
.
.
.
.
.
.
.
.
.
.
.
.
.
.
.
.
.
.
.
.
.
.
.
.
.
.
.
.
.
.
.
.
.
.
.
.
.
.
.
.
.
.
.
.
.
.
.
.
.
.
.
.
.
.
.
.
.
.
.
.
.
.
.
.
.
.
.
.
.
.
.
.
.
.
.
.
.
.
.
.
.
.
.
.
.
.
.
.
.
.
.
.
.
.
.
.
.
.
.
.
.
.
.
.
.
.
.
.
.
.
.
.
.
.
.
.
.
.
.
.
.
.
.
.
.
.
.
.
.
.
.
.
.
.
.
.
.
.
.
.
.
.
.
.
.
.
.
.
.
.
100.0
100.0
100.0
100.0
100.0
100.0
100.0
100.0
79.2
86.2
85.8
71.1
48.5
58.8
47.2
35.9
4.1
4.1
2.4
5.7
7.4
7.4
7.4
7.4
5.7
*
2.8
9.5
27.1
18.7
27.9
38.3
6.3
3.2
5.4
7.9
9.6
8.0
10.0
11.1
2.3
*
1.0
3.2
5.5
4.7
5.8
6.0
2.4
1.3
2.6
2.6
1.9
2.4
1.7
1.4
Northeast
Midwest .
South . .
West . . .
.
.
.
.
.
.
.
.
.
.
.
.
Region
. . . . .
. . . . .
. . . . .
. . . . .
.
.
.
.
.
.
.
.
.
.
.
.
.
.
.
.
.
.
.
.
.
.
.
.
.
.
.
.
.
.
.
.
.
.
.
.
.
.
.
.
.
.
.
.
.
.
.
.
.
.
.
.
.
.
.
.
.
.
.
.
.
.
.
.
.
.
.
.
100.0
100.0
100.0
100.0
64.3
62.0
67.8
68.8
4.5
5.0
5.3
7.9
18.1
19.6
12.4
11.1
8.4
9.0
6.9
6.9
3.8
2.8
3.7
4.4
0.8
*
3.9
*
.
.
.
.
.
.
.
.
.
.
.
.
.
.
.
.
.
.
.
.
.
.
.
.
.
.
.
.
.
.
.
.
.
.
.
.
.
.
.
.
.
.
.
.
.
.
.
.
.
.
.
.
Average length of stay in days
All
. . . . . . . . . . . . . . . . . . . . . . . . . . . . . . . . . . . .
4.8
4.1
6.0
7.9
6.4
8.3
7.1
5.2
4.5
4.4
3.8
6.0
6.0
8.6
7.4
6.5
6.3
8.7
8.0
7.9
6.3
Sex
Male . . . . . . . . . . . . . . . . . . . . . . . . . . . . . . . . . . .
Female . . . . . . . . . . . . . . . . . . . . . . . . . . . . . . . . .
Age
Under 65 years . . .
Under 15 years . .
15–44 years . . . .
45–64 years . . . .
65 years and over . .
65–74 years . . . .
75–84 years . . . .
85 years and over
.
.
.
.
.
.
.
.
.
.
.
.
.
.
.
.
.
.
.
.
.
.
.
.
.
.
.
.
.
.
.
.
.
.
.
.
.
.
.
.
.
.
.
.
.
.
.
.
.
.
.
.
.
.
.
.
.
.
.
.
.
.
.
.
.
.
.
.
.
.
.
.
.
.
.
.
.
.
.
.
.
.
.
.
.
.
.
.
.
.
.
.
.
.
.
.
.
.
.
.
.
.
.
.
.
.
.
.
.
.
.
.
.
.
.
.
.
.
.
.
.
.
.
.
.
.
.
.
.
.
.
.
.
.
.
.
.
.
.
.
.
.
.
.
.
.
.
.
.
.
.
.
.
.
.
.
.
.
.
.
.
.
.
.
.
.
.
.
.
.
.
.
.
.
.
.
.
.
.
.
.
.
.
.
.
.
.
.
.
.
.
.
.
.
.
.
.
.
.
.
4.4
4.8
3.7
5.0
5.5
5.2
5.6
5.6
3.9
4.4
3.5
4.4
4.4
4.3
4.5
4.6
6.1
10.0
5.1
6.1
5.9
6.0
6.0
5.7
9.9
*
9.7
9.7
7.4
8.2
7.8
6.6
6.1
7.9
5.1
6.8
6.6
6.3
6.9
6.5
10.5
23.2
8.7
9.7
7.5
8.9
8.1
5.8
6.8
4.5
6.6
7.5
7.8
8.7
7.5
6.5
.
.
.
.
.
.
.
.
.
.
.
.
.
.
.
.
.
.
.
.
.
.
.
.
.
.
.
.
.
.
.
.
.
.
.
.
.
.
.
.
.
.
.
.
.
.
.
.
.
.
.
.
.
.
.
.
.
.
.
.
.
.
.
.
.
.
.
.
5.3
4.2
4.9
4.6
4.5
3.5
4.2
3.9
6.1
4.6
6.3
6.8
8.2
6.9
8.2
8.7
6.7
5.8
7.1
5.6
10.0
5.7
8.8
8.7
6.8
7.2
7.2
6.2
Region
Northeast
Midwest .
South . .
West . . .
.
.
.
.
.
.
.
.
.
.
.
.
.
.
.
.
.
.
.
.
.
.
.
.
.
.
.
.
.
.
.
.
.
.
.
.
.
.
.
.
.
.
.
.
.
.
.
.
.
.
.
.
.
.
.
.
.
.
.
.
* Figure does not meet standards of reliability or precision.
Page 20 [ Series 13, No. 168
Table 9. Number and rate of discharges from short-stay hospitals and of days of care, with average length of stay, by selected first-listed
diagnostic categories: United States, 2006
[Discharges of inpatients from nonfederal hospitals. Excludes newborn infants. Diagnostic groupings and code numbers are based on the International Classfication of
Diseases, Ninth Revision, Clinical Modification (ICD–9–CM)]
Discharges
Days of care
Number in
thousands
Rate per
10,000
population1
Average
length
of stay
in days
Category of first-listed diagnosis and ICD–9–CM code
Number in
thousands
Rate per
10,000
population1
All conditions2 . . . . . . . . . . . . . . . . . . . . . . . . . . . . . . . . . . . . . . . . . . . .
34,854
1,168.7
166,342
5,577.8
4.8
Heart disease . . . . . . . . . . . . . . .391–392.0,393–398,402,404,410–416,420–429
Acute myocardial infarction . . . . . . . . . . . . . . . . . . . . . . . . . . . . . . . .410
Coronary atherosclerosis . . . . . . . . . . . . . . . . . . . . . . . . . . . . . . . .414.0
Other ischemic heart disease . . . . . . . . . . . . . . . . . . . .411–413,414.1–414.9
Cardiac dysrhythmias . . . . . . . . . . . . . . . . . . . . . . . . . . . . . . . . . . . .427
Congestive heart failure . . . . . . . . . . . . . . . . . . . . . . . . .428.0,428.2–428.4
Females with deliveries . . . . . . . . . . . . . . . . . . . . . . . . . . . . . . . . . . . .V27
Psychoses . . . . . . . . . . . . . . . . . . . . . . . . . . . . . . . . . . . . . . . . .290–299
Schizophrenic disorders . . . . . . . . . . . . . . . . . . . . . . . . . . . . . . . . . .295
Major depressive disorder . . . . . . . . . . . . . . . . . . . . . . . . . . .296.2–296.3
Pneumonia . . . . . . . . . . . . . . . . . . . . . . . . . . . . . . . . . . . . . . . .480–486
Malignant neoplasms . . . . . . . . . . . . . . . . . . . . . . . . . . . .140–208,230–234
Malignant neoplasm of large intestine and rectum . . . . . . . . . . .153–154,197.5
Malignant neoplasm of trachea, bronchus, and lung . . . . .162,176.4,197.0,197.3
Fractures, all sites3 . . . . . . . . . . . . . . . . . . . . . . . . . . . . . . . . . . .800–829
Fracture of neck of femur3 . . . . . . . . . . . . . . . . . . . . . . . . . . . . . . . . .820
Certain complications of surgical and medical care . . . . . . . . . . . . . . . .996–999
Cerebrovascular disease . . . . . . . . . . . . . . . . . . . . . . . . . . . . . . . .430–438
Osteoarthrosis and allied disorders . . . . . . . . . . . . . . . . . . . . . . . . . . . . .715
Cellulitis and abscess . . . . . . . . . . . . . . . . . . . . . . . . . . . . . . . . . .681–682
Diabetes mellitus . . . . . . . . . . . . . . . . . . . . . . . . . . . . . . . . . . . . . . . .250
Septicemia . . . . . . . . . . . . . . . . . . . . . . . . . . . . . . . . . . . . . . . . . . . .038
Chronic bronchitis . . . . . . . . . . . . . . . . . . . . . . . . . . . . . . . . . . . . . . .491
Volume depletion. . . . . . . . . . . . . . . . . . . . . . . . . . . . . . . . . . . . . . .276.5
Urinary tract infection . . . . . . . . . . . . . . . . . . . . . . . . . . . . . . . . . . . .599.0
Asthma . . . . . . . . . . . . . . . . . . . . . . . . . . . . . . . . . . . . . . . . . . . . . .493
Benign neoplasms . . . . . . . . . . . . . . . . . . . . . . . . . . . . . . . . . .210–229
Benign neoplasm of uterus. . . . . . . . . . . . . . . . . . . . . . . . . . . . . . .218–219
Noninfectious enteritis and colitis . . . . . . . . . . . . . . . . . . . . . . . . . . .555–558
Cholelithiasis . . . . . . . . . . . . . . . . . . . . . . . . . . . . . . . . . . . . . . . . . .574
Intervertebral disc disorders . . . . . . . . . . . . . . . . . . . . . . . . . . . . . . . . .722
Intestinal obstruction . . . . . . . . . . . . . . . . . . . . . . . . . . . . . . . . . . . . . .560
Appendicitis . . . . . . . . . . . . . . . . . . . . . . . . . . . . . . . . . . . . . . . .540–543
Anemias . . . . . . . . . . . . . . . . . . . . . . . . . . . . . . . . . . . . . . . . . .280–285
Diverticula of intestine . . . . . . . . . . . . . . . . . . . . . . . . . . . . . . . . . . . . .562
Essential hypertension . . . . . . . . . . . . . . . . . . . . . . . . . . . . . . . . . . . .401
Poisonings. . . . . . . . . . . . . . . . . . . . . . . . . . . . . . . . . . . . . . . . .960–989
Acute pancreatitis . . . . . . . . . . . . . . . . . . . . . . . . . . . . . . . . . . . . . .577.0
Acute bronchitis and bronchiolitis . . . . . . . . . . . . . . . . . . . . . . . . . . . . . .466
Calculus of kidney and ureter . . . . . . . . . . . . . . . . . . . . . . . . . . . . . . . .592
4,202
647
953
160
772
1,102
4,127
1,747
333
459
1,232
1,208
154
166
1,074
330
912
889
753
589
584
530
513
480
479
444
378
211
356
335
324
323
318
315
314
293
271
233
217
166
140.9
21.7
32.0
5.4
25.9
36.9
138.4
58.6
11.2
15.4
41.3
40.5
5.2
5.6
36.0
11.1
30.6
29.8
25.3
19.7
19.6
17.8
17.2
16.1
16.0
14.9
12.7
7.1
11.9
11.2
10.9
10.8
10.7
10.6
10.5
9.8
9.1
7.8
7.3
5.6
18,528
3,512
3,081
402
2,626
5,668
10,868
13,420
3,910
3,067
6,308
7,908
1,209
1,188
5,734
2,032
5,580
4,389
2,832
2,603
2,742
4,589
2,397
1,663
2,224
1,426
1,262
510
1,510
1,279
1,005
1,993
993
1,268
1,512
653
787
1,216
692
403
621.3
117.8
103.3
13.5
88.1
190.1
364.4
450.0
131.1
102.8
211.5
265.2
40.5
39.8
192.3
68.1
187.1
147.2
94.9
87.3
92.0
153.9
80.4
55.8
74.6
47.8
42.3
17.1
50.6
42.9
33.7
66.8
33.3
42.5
50.7
21.9
26.4
40.8
23.2
13.5
4.4
5.4
3.2
2.5
3.4
5.1
2.6
7.7
11.7
6.7
5.1
6.5
7.8
7.2
5.3
6.2
6.1
4.9
3.8
4.4
4.7
8.7
4.7
3.5
4.6
3.2
3.3
2.4
4.2
3.8
3.1
6.2
3.1
4.0
4.8
2.2
2.9
5.2
3.2
2.4
1
Rates were calculated using U.S. Census Bureau 2000-based postcensal estimates of the civilian population as July 1, 2006.
Includes data for diagnostic conditions not shown in table.
2
3
Excludes fractures coded as 733.1, ‘‘pathologic fracture.’’
Series 13, No. 168 [ Page 21
Table 10. Number and rate of discharges from short-stay hospitals with average length of stay, for patients age 65 and over, by age and
selected first-listed diagnostic categories: United States, 2006
[Discharges of inpatients from nonfederal hospitals. Diagnostic groupings and code numbers are based on the International Classfication of Diseases, Ninth Revision,
Clinical Modification (ICD–9–CM)]
Category of first-listed diagnosis and ICD–9–CM code
65 years
and over
65–74
years
75–84
years
85 years
and over
All conditions1 . . . . . . . . . . . . . . . . . . . . . . . . . . . . . . . . . . . . . . . . . . . .
13,070
4,793
5,252
3,025
Heart disease . . . . . . . . . . . . . . .391–392.0,393–398,402,404,410–416,420–429
Acute myocardial infarction . . . . . . . . . . . . . . . . . . . . . . . . . . . . . . . .410
Coronary atherosclerosis . . . . . . . . . . . . . . . . . . . . . . . . . . . . . . . .414.0
Cardiac dysrhythmias . . . . . . . . . . . . . . . . . . . . . . . . . . . . . . . . . . . .427
Congestive heart failure . . . . . . . . . . . . . . . . . . . . . . . . .428.0,428.2–428.4
Pneumonia . . . . . . . . . . . . . . . . . . . . . . . . . . . . . . . . . . . . . . . .480–486
Malignant neoplasms . . . . . . . . . . . . . . . . . . . . . . . . . . . .140–208,230–234
Cerebrovascular disease . . . . . . . . . . . . . . . . . . . . . . . . . . . . . . . .430–438
Fractures, all sites2 . . . . . . . . . . . . . . . . . . . . . . . . . . . . . . . . . . .800–829
Fracture of neck of femur2 . . . . . . . . . . . . . . . . . . . . . . . . . . . . . . . . .820
Osteoarthrosis and allied disorders . . . . . . . . . . . . . . . . . . . . . . . . . . . . .715
Certain complications of surgical and medical care . . . . . . . . . . . . . . . .996–999
Septicemia . . . . . . . . . . . . . . . . . . . . . . . . . . . . . . . . . . . . . . . . . . . .038
Urinary tract infection . . . . . . . . . . . . . . . . . . . . . . . . . . . . . . . . . . . .599.0
Chronic bronchitis . . . . . . . . . . . . . . . . . . . . . . . . . . . . . . . . . . . . . . .491
Volume depletion. . . . . . . . . . . . . . . . . . . . . . . . . . . . . . . . . . . . . . .276.5
Psychoses . . . . . . . . . . . . . . . . . . . . . . . . . . . . . . . . . . . . . . . . .290–299
Diabetes mellitus . . . . . . . . . . . . . . . . . . . . . . . . . . . . . . . . . . . . . . . .250
Diverticula of intestine . . . . . . . . . . . . . . . . . . . . . . . . . . . . . . . . . . . . .562
Cellulitis and abscess . . . . . . . . . . . . . . . . . . . . . . . . . . . . . . . . . .681–682
Intestinal obstruction . . . . . . . . . . . . . . . . . . . . . . . . . . . . . . . . . . . . . .560
Anemias . . . . . . . . . . . . . . . . . . . . . . . . . . . . . . . . . . . . . . . . . .280–285
Noninfectious enteritis and colitis . . . . . . . . . . . . . . . . . . . . . . . . . . .555–558
Essential hypertension . . . . . . . . . . . . . . . . . . . . . . . . . . . . . . . . . . . .401
Cholelithiasis . . . . . . . . . . . . . . . . . . . . . . . . . . . . . . . . . . . . . . . . . .574
Asthma . . . . . . . . . . . . . . . . . . . . . . . . . . . . . . . . . . . . . . . . . . . . . .493
2,624
394
496
522
803
704
636
606
566
293
452
365
345
343
333
240
191
188
174
169
167
152
126
125
116
88
925
137
249
169
218
211
311
210
114
41
249
173
96
76
146
56
82
88
71
66
54
52
43
57
50
46
1,066
155
195
232
317
279
240
247
238
128
169
148
140
134
143
96
72
73
64
63
75
58
54
41
50
29
633
101
52
121
268
214
86
148
214
125
34
44
109
132
44
88
37
27
38
40
38
42
29
27
16
13
Discharges in thousands
Discharge rate per 10,000 population3
1
All conditions . . . . . . . . . . . . . . . . . . . . . . . . . . . . . . . . . . . . . . . . . . . .
3,507.9
2,533.6
4,025.9
5,711.4
Heart disease . . . . . . . . . . . . . . .391–392.0,393–398,402,404,410–416,420–429
Acute myocardial infarction . . . . . . . . . . . . . . . . . . . . . . . . . . . . . . . .410
Coronary atherosclerosis . . . . . . . . . . . . . . . . . . . . . . . . . . . . . . . .414.0
Cardiac dysrhythmias . . . . . . . . . . . . . . . . . . . . . . . . . . . . . . . . . . . .427
Congestive heart failure . . . . . . . . . . . . . . . . . . . . . . . . .428.0,428.2–428.4
Pneumonia . . . . . . . . . . . . . . . . . . . . . . . . . . . . . . . . . . . . . . . .480–486
Malignant neoplasms . . . . . . . . . . . . . . . . . . . . . . . . . . . .140–208,230–234
Cerebrovascular disease . . . . . . . . . . . . . . . . . . . . . . . . . . . . . . . .430–438
Fractures, all sites2 . . . . . . . . . . . . . . . . . . . . . . . . . . . . . . . . . . .800–829
Fracture of neck of femur2 . . . . . . . . . . . . . . . . . . . . . . . . . . . . . . . . .820
Osteoarthrosis and allied disorders . . . . . . . . . . . . . . . . . . . . . . . . . . . . .715
Certain complications of surgical and medical care . . . . . . . . . . . . . . . .996–999
Septicemia . . . . . . . . . . . . . . . . . . . . . . . . . . . . . . . . . . . . . . . . . . . .038
Urinary tract infection . . . . . . . . . . . . . . . . . . . . . . . . . . . . . . . . . . . .599.0
Chronic bronchitis . . . . . . . . . . . . . . . . . . . . . . . . . . . . . . . . . . . . . . .491
Volume depletion. . . . . . . . . . . . . . . . . . . . . . . . . . . . . . . . . . . . . . .276.5
Psychoses . . . . . . . . . . . . . . . . . . . . . . . . . . . . . . . . . . . . . . . . .290–299
Diabetes mellitus . . . . . . . . . . . . . . . . . . . . . . . . . . . . . . . . . . . . . . . .250
Diverticula of intestine . . . . . . . . . . . . . . . . . . . . . . . . . . . . . . . . . . . . .562
Cellulitis and abscess . . . . . . . . . . . . . . . . . . . . . . . . . . . . . . . . . .681–682
Intestinal obstruction . . . . . . . . . . . . . . . . . . . . . . . . . . . . . . . . . . . . . .560
Anemias . . . . . . . . . . . . . . . . . . . . . . . . . . . . . . . . . . . . . . . . . .280–285
Noninfectious enteritis and colitis . . . . . . . . . . . . . . . . . . . . . . . . . . .555–558
Essential hypertension . . . . . . . . . . . . . . . . . . . . . . . . . . . . . . . . . . . .401
Cholelithiasis . . . . . . . . . . . . . . . . . . . . . . . . . . . . . . . . . . . . . . . . . .574
Asthma . . . . . . . . . . . . . . . . . . . . . . . . . . . . . . . . . . . . . . . . . . . . . .493
704.2
105.7
133.2
140.2
215.5
189.0
170.6
162.5
151.8
78.7
121.3
98.1
92.5
92.0
89.4
64.5
51.2
50.4
46.6
45.5
44.8
40.9
33.7
33.7
31.1
23.7
489.0
72.6
131.8
89.4
115.2
111.3
164.1
111.2
60.1
21.5
131.6
91.4
50.8
40.4
77.2
29.9
43.5
46.5
37.5
35.1
28.7
27.4
22.7
30.2
26.6
24.3
817.2
118.8
149.4
178.0
243.0
214.1
183.6
189.2
182.7
98.0
129.7
113.6
107.3
102.6
109.7
73.5
55.2
55.6
49.2
48.6
57.2
44.8
41.2
31.6
38.3
22.4
1,194.3
191.3
98.3
228.5
506.3
404.5
161.9
280.1
403.6
235.7
63.7
83.7
205.3
250.1
83.4
166.3
69.1
51.5
72.4
74.9
71.7
79.6
55.0
51.4
29.5
25.1
See footnotes at end of table.
Page 22 [ Series 13, No. 168
Table 10. Number and rate of discharges from short-stay hospitals with average length of stay, for patients age 65 and over, by age and
selected first-listed diagnostic categories: United States, 2006—Con.
[Discharges of inpatients from nonfederal hospitals. Diagnostic groupings and code numbers are based on the International Classfication of Diseases, Ninth Revision,
Clinical Modification (ICD–9–CM)]
Category of first-listed diagnosis and ICD–9–CM code
65 years
and over
65–74
years
75–84
years
85 years
and over
All conditions1 . . . . . . . . . . . . . . . . . . . . . . . . . . . . . . . . . . . . . . . . . . . .
5.5
5.2
5.6
5.6
Heart disease . . . . . . . . . . . . . . .391–392.0,393–398,402,404,410–416,420–429
Acute myocardial infarction . . . . . . . . . . . . . . . . . . . . . . . . . . . . . . . .410
Coronary atherosclerosis . . . . . . . . . . . . . . . . . . . . . . . . . . . . . . . .414.0
Cardiac dysrhythmias . . . . . . . . . . . . . . . . . . . . . . . . . . . . . . . . . . . .427
Congestive heart failure . . . . . . . . . . . . . . . . . . . . . . . . .428.0,428.2–428.4
Pneumonia . . . . . . . . . . . . . . . . . . . . . . . . . . . . . . . . . . . . . . . .480–486
Malignant neoplasms . . . . . . . . . . . . . . . . . . . . . . . . . . . .140–208,230–234
Cerebrovascular disease . . . . . . . . . . . . . . . . . . . . . . . . . . . . . . . .430–438
Fractures, all sites2 . . . . . . . . . . . . . . . . . . . . . . . . . . . . . . . . . . .800–829
Fracture of neck of femur2 . . . . . . . . . . . . . . . . . . . . . . . . . . . . . . . . .820
Osteoarthrosis and allied disorders . . . . . . . . . . . . . . . . . . . . . . . . . . . . .715
Certain complications of surgical and medical care . . . . . . . . . . . . . . . .996–999
Septicemia . . . . . . . . . . . . . . . . . . . . . . . . . . . . . . . . . . . . . . . . . . . .038
Urinary tract infection . . . . . . . . . . . . . . . . . . . . . . . . . . . . . . . . . . . .599.0
Chronic bronchitis . . . . . . . . . . . . . . . . . . . . . . . . . . . . . . . . . . . . . . .491
Volume depletion. . . . . . . . . . . . . . . . . . . . . . . . . . . . . . . . . . . . . . .276.5
Psychoses . . . . . . . . . . . . . . . . . . . . . . . . . . . . . . . . . . . . . . . . .290–299
Diabetes mellitus . . . . . . . . . . . . . . . . . . . . . . . . . . . . . . . . . . . . . . . .250
Diverticula of intestine . . . . . . . . . . . . . . . . . . . . . . . . . . . . . . . . . . . . .562
Cellulitis and abscess . . . . . . . . . . . . . . . . . . . . . . . . . . . . . . . . . .681–682
Intestinal obstruction . . . . . . . . . . . . . . . . . . . . . . . . . . . . . . . . . . . . . .560
Anemias . . . . . . . . . . . . . . . . . . . . . . . . . . . . . . . . . . . . . . . . . .280–285
Noninfectious enteritis and colitis . . . . . . . . . . . . . . . . . . . . . . . . . . .555–558
Essential hypertension . . . . . . . . . . . . . . . . . . . . . . . . . . . . . . . . . . . .401
Cholelithiasis . . . . . . . . . . . . . . . . . . . . . . . . . . . . . . . . . . . . . . . . . .574
Asthma . . . . . . . . . . . . . . . . . . . . . . . . . . . . . . . . . . . . . . . . . . . . . .493
4.7
6.1
3.4
3.7
5.1
5.6
6.9
4.8
5.6
6.2
3.9
6.3
8.4
4.9
4.8
4.1
8.3
5.3
4.9
5.1
6.8
3.8
4.8
2.3
5.2
4.5
4.5
5.8
3.3
3.4
5.1
5.5
6.8
4.6
5.2
6.3
3.7
6.7
9.2
4.5
4.5
3.7
8.7
5.2
4.8
4.8
5.9
3.6
4.1
1.9
4.9
4.4
4.8
6.5
3.6
3.7
5.3
5.6
7.2
4.6
5.9
6.4
4.1
6.1
8.8
5.0
5.1
4.0
8.8
5.8
5.1
5.4
7.2
4.0
5.6
2.6
5.3
4.6
4.8
5.7
3.6
4.2 4.8
5.8
6.4
5.3
5.6
6.1 4.0 5.8
7.2 5.1
4.7
4.6
6.5
4.6 4.6 5.0
7.2 3.9
4.1
2.9 5.9 4.7 Average length of stay in days
1
Includes data for diagnostic conditions not shown in table.
Excludes fractures coded as 733.1, ‘‘pathologic fracture.’’
3
Rates were calculated using U.S. Census Bureau 2000-based postcensal estimates of the civilian population as of July 1, 2006.
2
Series 13, No. 168 [ Page 23
Table 11. Number of discharges from short-stay hospitals, by age and first-listed diagnosis: United States, 2006
[Discharges of inpatients from nonfederal hospitals. Excludes newborn infants. Diagnostic groupings and code numbers are based on the International Classfication of
Diseases, Ninth Revision, Clinical Modification (ICD–9–CM)]
Category of first-listed diagnosis and ICD–9–CM code
All ages
Under
15 years
All conditions . . . . . . . . . . . . . . . . . . . . . . . . . . . . . . . . . . . . . . . . . . . .
34,854
2,298
Infectious and parasitic diseases . . . . . . . . . . . . . . . . . . . . . . . . . . .001–139
Septicemia . . . . . . . . . . . . . . . . . . . . . . . . . . . . . . . . . . . . . . . . . .038
Neoplasms . . . . . . . . . . . . . . . . . . . . . . . . . . . . . . . . . . . . . . . .140–239
Malignant neoplasms . . . . . . . . . . . . . . . . . . . . . . . . . . .140–208,230–234
Malignant neoplasm of large intestine and rectum . . . . . . . . . .153–154,197.5
Malignant neoplasm of trachea, bronchus, and lung . . . .162,176.4,197.0,197.3
Benign neoplasms . . . . . . . . . . . . . . . . . . . . . . . . . . . . . . . . . .210–229
Benign neoplasm of uterus . . . . . . . . . . . . . . . . . . . . . . . . . . . .218–219
Endocrine, nutritional and metabolic diseases, and immunity disorders. . . .240–279
Diabetes mellitus . . . . . . . . . . . . . . . . . . . . . . . . . . . . . . . . . . . . . .250
Volume depletion . . . . . . . . . . . . . . . . . . . . . . . . . . . . . . . . . . . . .276.5
Diseases of the blood and blood-forming organs . . . . . . . . . . . . . . . . .280–289
Anemias. . . . . . . . . . . . . . . . . . . . . . . . . . . . . . . . . . . . . . . . .280–285
Mental disorders . . . . . . . . . . . . . . . . . . . . . . . . . . . . . . . . . . . . .290–319
Psychoses . . . . . . . . . . . . . . . . . . . . . . . . . . . . . . . . . . . . . . .290–299
Schizophrenic disorders . . . . . . . . . . . . . . . . . . . . . . . . . . . . . . . . .295
Major depressive disorder . . . . . . . . . . . . . . . . . . . . . . . . . .296.2–296.3
Diseases of the nervous system and sense organs. . . . . . . . . . . . . . . .320–389
Diseases of the circulatory system . . . . . . . . . . . . . . . . . . . . . . . . . .390–459
Essential hypertension . . . . . . . . . . . . . . . . . . . . . . . . . . . . . . . . . . .401
Heart disease . . . . . . . . . . . . .391–392.0,393–398,402,404,410–416,420–429
Acute myocardial infarction . . . . . . . . . . . . . . . . . . . . . . . . . . . . . . .410
Coronary atherosclerosis . . . . . . . . . . . . . . . . . . . . . . . . . . . . . . .414.0
Other ischemic heart disease . . . . . . . . . . . . . . . . . .411–413,414.1–414.9
Cardiac dysrhythmias . . . . . . . . . . . . . . . . . . . . . . . . . . . . . . . . . .427
Congestive heart failure. . . . . . . . . . . . . . . . . . . . . . . .428.0,428.2–428.4
Cerebrovascular disease. . . . . . . . . . . . . . . . . . . . . . . . . . . . . . .430–438
Diseases of the respiratory system . . . . . . . . . . . . . . . . . . . . . . . . . .460–519
Acute bronchitis and bronchiolitis . . . . . . . . . . . . . . . . . . . . . . . . . . . .466
Pneumonia . . . . . . . . . . . . . . . . . . . . . . . . . . . . . . . . . . . . . . .480–486
Chronic bronchitis . . . . . . . . . . . . . . . . . . . . . . . . . . . . . . . . . . . . . .491
Asthma . . . . . . . . . . . . . . . . . . . . . . . . . . . . . . . . . . . . . . . . . . . .493
Diseases of the digestive system . . . . . . . . . . . . . . . . . . . . . . . . . . .520–579
Appendicitis. . . . . . . . . . . . . . . . . . . . . . . . . . . . . . . . . . . . . . .540–543
Noninfectious enteritis and colitis . . . . . . . . . . . . . . . . . . . . . . . . .555–558
Intestinal obstruction . . . . . . . . . . . . . . . . . . . . . . . . . . . . . . . . . . . .560
Diverticula of intestine . . . . . . . . . . . . . . . . . . . . . . . . . . . . . . . . . . .562
Cholelithiasis . . . . . . . . . . . . . . . . . . . . . . . . . . . . . . . . . . . . . . . . .574
Acute pancreatitis . . . . . . . . . . . . . . . . . . . . . . . . . . . . . . . . . . . . .577.0
Diseases of the genitourinary system . . . . . . . . . . . . . . . . . . . . . . . .580–629
Calculus of kidney and ureter . . . . . . . . . . . . . . . . . . . . . . . . . . . . . . .592
Urinary tract infection. . . . . . . . . . . . . . . . . . . . . . . . . . . . . . . . . . .599.0
Complications of pregnancy, childbirth, and the puerperium1 . . . . . . . . . .630–677
Diseases of the skin and subcutaneous tissue. . . . . . . . . . . . . . . . . . .680–709
Cellulitis and abscess . . . . . . . . . . . . . . . . . . . . . . . . . . . . . . . .681–682
Diseases of the musculoskeletal system and connective tissue . . . . . . . .710–739
Osteoarthrosis and allied disorders . . . . . . . . . . . . . . . . . . . . . . . . . . .715
Intervertebral disc disorders . . . . . . . . . . . . . . . . . . . . . . . . . . . . . . . .722
Congenital anomalies . . . . . . . . . . . . . . . . . . . . . . . . . . . . . . . . . .740–759
Certain conditions originating in the perinatal period . . . . . . . . . . . . . . .760–779
Symptoms, signs, and ill-defined conditions . . . . . . . . . . . . . . . . . . . .780–799
Injury and poisoning . . . . . . . . . . . . . . . . . . . . . . . . . . . . . . . . . . .800–999
Fractures, all sites2 . . . . . . . . . . . . . . . . . . . . . . . . . . . . . . . . . .800–829
Fracture of neck of femur2 . . . . . . . . . . . . . . . . . . . . . . . . . . . . . . .820
Poisonings . . . . . . . . . . . . . . . . . . . . . . . . . . . . . . . . . . . . . . .960–989
Certain complications of surgical and medical care . . . . . . . . . . . . . .996–999
Supplementary classifications . . . . . . . . . . . . . . . . . . . . . . . . . . . . .V01–V85
Females with deliveries . . . . . . . . . . . . . . . . . . . . . . . . . . . . . . . . . .V27
1,088
530
1,641
1,208
154
166
378
211
1,663
584
480
451
315
2,419
1,747
333
459
615
6,161
293
4,202
647
953
160
772
1,102
889
3,485
217
1,232
513
444
3,517
318
356
323
314
335
233
1,974
166
479
519
780
589
1,969
753
324
193
200
189
2,968
1,074
330
271
912
5,022
4,127
138
9
34
23
*
*
10
*
160
22
112
55
22
*
*
*
*
83
29
*
16
*
*
*
5
*
*
576
152
172
*
145
219
71
44
15
*
*
*2
75
*
27
*
*
56
40
*
*
131
200
42
211
63
*1
16
34
70
*
15–44
years
45–64
years
65 years
and over
10,800
8,686
13,070
193
43
257
111
8
*5
137
103
365
169
46
98
75
1,332
952
178
256
134
452
45
277
34
42
17
50
49
46
376
10
107
16
89
858
163
95
38
42
117
82
498
58
32
517
233
179
298
21
102
28
*
63
846
243
*6
157
191
4,253
4,112
262
134
628
438
46
51
173
106
483
205
81
102
65
717
522
134
140
151
1,880
122
1,285
218
415
67
193
246
236
804
18
250
163
121
1,111
63
91
103
99
99
92
524
71
77
*
224
184
720
280
148
25
*
44
764
202
28
73
322
246
9
495
345
723
636
101
109
58
*
655
188
240
196
152
239
191
20
42
246
3,801
125
2,624
394
496
76
522
803
606
1,729
36
704
333
88
1,329
21
126
167
174
116
56
877
36
343
...
223
169
911
452
73
8
*
40
1,147
566
293
26
365
453
...
Number in thousands
* Figure does not meet standards of reliability or precision.
. . . Category not applicable.
1
First-listed diagnosis for females with deliveries is coded as V27, shown under ‘‘Supplementary classifications.’’
2
Excludes fractures coded as 733.1, ‘‘pathologic fracture.’’
Page 24 [ Series 13, No. 168
Table 12. Rate of discharges from short-stay hospitals, by age and first-listed diagnosis: United States, 2006
[Discharges of inpatients from nonfederal hospitals. Excludes newborn infants. Diagnostic groupings and code numbers are based on the International Classfication of
Diseases, Ninth Revision, Clinical Modification (ICD–9–CM)]
Category of first-listed diagnosis and ICD–9–CM code
All ages
Under
15 years
15–44
years
45–64
years
65 years
and over
Rate per 10,000 population1
All conditions . . . . . . . . . . . . . . . . . . . . . . . . . . . . . . . . . . . . . . . . . . . .
1,168.7
378.2
861.2
1,161.2
3,507.9
Infectious and parasitic diseases . . . . . . . . . . . . . . . . . . . . . . . . . . .001–139
Septicemia . . . . . . . . . . . . . . . . . . . . . . . . . . . . . . . . . . . . . . . . . .038
Neoplasms . . . . . . . . . . . . . . . . . . . . . . . . . . . . . . . . . . . . . . . .140–239
Malignant neoplasms . . . . . . . . . . . . . . . . . . . . . . . . . . .140–208,230–234
Malignant neoplasm of large intestine and rectum . . . . . . . . . .153–154,197.5
Malignant neoplasm of trachea, bronchus, and lung . . . .162,176.4,197.0,197.3
Benign neoplasms . . . . . . . . . . . . . . . . . . . . . . . . . . . . . . . . . .210–229
Benign neoplasm of uterus . . . . . . . . . . . . . . . . . . . . . . . . . . . .218–219
Endocrine, nutritional and metabolic diseases, and immunity disorders. . . .240–279
Diabetes mellitus . . . . . . . . . . . . . . . . . . . . . . . . . . . . . . . . . . . . . .250
Volume depletion . . . . . . . . . . . . . . . . . . . . . . . . . . . . . . . . . . . . .276.5
Diseases of the blood and blood-forming organs . . . . . . . . . . . . . . . . .280–289
Anemias. . . . . . . . . . . . . . . . . . . . . . . . . . . . . . . . . . . . . . . . .280–285
Mental disorders . . . . . . . . . . . . . . . . . . . . . . . . . . . . . . . . . . . . .290–319
Psychoses . . . . . . . . . . . . . . . . . . . . . . . . . . . . . . . . . . . . . . .290–299
Schizophrenic disorders . . . . . . . . . . . . . . . . . . . . . . . . . . . . . . . . .295
Major depressive disorder . . . . . . . . . . . . . . . . . . . . . . . . . .296.2–296.3
Diseases of the nervous system and sense organs. . . . . . . . . . . . . . . .320–389
Diseases of the circulatory system . . . . . . . . . . . . . . . . . . . . . . . . . .390–459
Essential hypertension . . . . . . . . . . . . . . . . . . . . . . . . . . . . . . . . . . .401
Heart disease . . . . . . . . . . . . .391–392.0,393–398,402,404,410–416,420–429
Acute myocardial infarction . . . . . . . . . . . . . . . . . . . . . . . . . . . . . . .410
Coronary atherosclerosis . . . . . . . . . . . . . . . . . . . . . . . . . . . . . . .414.0
Other ischemic heart disease . . . . . . . . . . . . . . . . . .411–413,414.1–414.9
Cardiac dysrhythmias . . . . . . . . . . . . . . . . . . . . . . . . . . . . . . . . . .427
Congestive heart failure. . . . . . . . . . . . . . . . . . . . . . . .428.0,428.2–428.4
Cerebrovascular disease. . . . . . . . . . . . . . . . . . . . . . . . . . . . . . .430–438
Diseases of the respiratory system . . . . . . . . . . . . . . . . . . . . . . . . . .460–519
Acute bronchitis and bronchiolitis . . . . . . . . . . . . . . . . . . . . . . . . . . . .466
Pneumonia . . . . . . . . . . . . . . . . . . . . . . . . . . . . . . . . . . . . . . .480–486
Chronic bronchitis . . . . . . . . . . . . . . . . . . . . . . . . . . . . . . . . . . . . . .491
Asthma . . . . . . . . . . . . . . . . . . . . . . . . . . . . . . . . . . . . . . . . . . . .493
Diseases of the digestive system . . . . . . . . . . . . . . . . . . . . . . . . . . .520–579
Appendicitis. . . . . . . . . . . . . . . . . . . . . . . . . . . . . . . . . . . . . . .540–543
Noninfectious enteritis and colitis . . . . . . . . . . . . . . . . . . . . . . . . .555–558
Intestinal obstruction . . . . . . . . . . . . . . . . . . . . . . . . . . . . . . . . . . . .560
Diverticula of intestine . . . . . . . . . . . . . . . . . . . . . . . . . . . . . . . . . . .562
Cholelithiasis . . . . . . . . . . . . . . . . . . . . . . . . . . . . . . . . . . . . . . . . .574
Acute pancreatitis . . . . . . . . . . . . . . . . . . . . . . . . . . . . . . . . . . . . .577.0
Diseases of the genitourinary system . . . . . . . . . . . . . . . . . . . . . . . .580–629
Calculus of kidney and ureter . . . . . . . . . . . . . . . . . . . . . . . . . . . . . . .592
Urinary tract infection. . . . . . . . . . . . . . . . . . . . . . . . . . . . . . . . . . .599.0
Complications of pregnancy, childbirth, and the puerperium2 . . . . . . . . . .630–677
Diseases of the skin and subcutaneous tissue. . . . . . . . . . . . . . . . . . .680–709
Cellulitis and abscess . . . . . . . . . . . . . . . . . . . . . . . . . . . . . . . .681–682
Diseases of the musculoskeletal system and connective tissue . . . . . . . .710–739
Osteoarthrosis and allied disorders . . . . . . . . . . . . . . . . . . . . . . . . . . .715
Intervertebral disc disorders . . . . . . . . . . . . . . . . . . . . . . . . . . . . . . . .722
Congenital anomalies . . . . . . . . . . . . . . . . . . . . . . . . . . . . . . . . . .740–759
Certain conditions originating in the perinatal period . . . . . . . . . . . . . . .760–779
Symptoms, signs, and ill-defined conditions . . . . . . . . . . . . . . . . . . . .780–799
Injury and poisoning . . . . . . . . . . . . . . . . . . . . . . . . . . . . . . . . . . .800–999
Fractures, all sites3 . . . . . . . . . . . . . . . . . . . . . . . . . . . . . . . . . .800–829
Fracture of neck of femur3 . . . . . . . . . . . . . . . . . . . . . . . . . . . . . . .820
Poisonings . . . . . . . . . . . . . . . . . . . . . . . . . . . . . . . . . . . . . . .960–989
Certain complications of surgical and medical care . . . . . . . . . . . . . .996–999
Supplementary classifications . . . . . . . . . . . . . . . . . . . . . . . . . . . . .V01–V85
Females with deliveries . . . . . . . . . . . . . . . . . . . . . . . . . . . . . . . . . .V27
36.5
17.8
55.0
40.5
5.2
5.6
12.7
7.1
55.8
19.6
16.1
15.1
10.6
81.1
58.6
11.2
15.4
20.6
206.6
9.8
140.9
21.7
32.0
5.4
25.9
36.9
29.8
116.9
7.3
41.3
17.2
14.9
117.9
10.7
11.9
10.8
10.5
11.2
7.8
66.2
5.6
16.0
17.4
26.2
19.7
66.0
25.3
10.9
6.5
6.7
6.3
99.5
36.0
11.1
9.1
30.6
168.4
138.4
22.7
1.5
5.5
3.7
*
*
*
*
26.3
3.7
18.4
9.0
3.6
*
*
*
*
13.7
4.8
*
2.7
*
*
*
0.9
*
*0.4
94.9
25.0
28.3
*
23.9
36.1
11.7
7.2
2.4
*
*0.4
*0.5
12.4
*
4.4
*
*
9.2
6.5
*
*
21.6
32.9
7.0
34.7
10.4
*
2.6
5.6
11.6
*
15.4
3.4
20.5
8.8
*
*0.4
10.9
8.2
29.1
13.4
3.7
7.8
6.0
106.2
75.9
14.2
20.4
10.7
36.0
3.6
22.1
2.7
3.3
1.3
4.0
3.9
3.6
30.0
0.8
8.5
1.3
7.1
68.4
13.0
7.6
3.1
3.3
9.4
6.5
39.7
4.7
2.5
41.2
18.6
14.3
23.8
1.7
8.1
2.2
*
5.0
67.4
19.4
*0.5
12.5
15.2
339.1
327.9
35.1
17.9
83.9
58.6
6.1
6.8
23.2
14.2
64.6
27.4
10.8
13.6
8.7
95.8
69.8
18.0
18.7
20.2
251.3
16.4
171.7
29.2
55.5
9.0
25.9
32.9
31.5
107.5
2.4
33.4
21.7
16.2
148.6
8.4
12.2
13.7
13.3
13.3
12.3
70.1
9.5
10.4
*
29.9
24.6
96.3
37.4
19.7
3.4
*
5.9
102.1
27.0
3.8
9.8
43.1
32.8
1.1
132.8
92.5
194.0
170.6
27.1
29.3
15.5
*
175.8
50.4
64.5
52.6
40.9
64.1
51.2
5.3
11.3
65.9
1,020.0
33.7
704.2
105.7
133.2
20.4
140.2
215.5
162.5
464.1
9.8
189.0
89.4
23.7
356.7
5.6
33.7
44.8
46.6
31.1
15.1
235.4
9.6
92.0
...
59.7
45.5
244.5
121.3
19.6
2.2
*
10.7
307.9
151.8
78.7
6.9
98.1
121.6
...
* Figure does not meet standards of reliability or precision.
. . . Category not applicable.
1
Rates were calculated using U.S. Census Bureau 2000-based postcensal estimates of the civilian population as July 1, 2006.
2
First-listed diagnosis for females with deliveries is coded as V27, shown under ‘‘Supplementary classifications.’’
3
Excludes fractures coded as 733.1, ‘‘pathologic fracture.’’
Series 13, No. 168 [ Page 25
Table 13. Average length of stay for discharges from short-stay hospitals, by age and first-listed diagnosis: United States, 2006
[Discharges of inpatients from nonfederal hospitals. Excludes newborn infants. Diagnostic groupings and code numbers are based on the International Classfication of
Diseases, Ninth Revision, Clinical Modification (ICD–9–CM)]
Category of first-listed diagnosis and ICD–9–CM code
All ages
Under
15 years
15–44
years
45–64
years
65 years
and over
All conditions . . . . . . . . . . . . . . . . . . . . . . . . . . . . . . . . . . . . . . . . . . . .
4.8
4.8
3.7
5.0
5.5
Infectious and parasitic diseases . . . . . . . . . . . . . . . . . . . . . . . . . . .001–139
Septicemia . . . . . . . . . . . . . . . . . . . . . . . . . . . . . . . . . . . . . . . . . .038
Neoplasms . . . . . . . . . . . . . . . . . . . . . . . . . . . . . . . . . . . . . . . .140–239
Malignant neoplasms . . . . . . . . . . . . . . . . . . . . . . . . . . .140–208,230–234
Malignant neoplasm of large intestine and rectum . . . . . . . . . .153–154,197.5
Malignant neoplasm of trachea, bronchus, and lung . . . .162,176.4,197.0,197.3
Benign neoplasms . . . . . . . . . . . . . . . . . . . . . . . . . . . . . . . . . .210–229
Benign neoplasm of uterus . . . . . . . . . . . . . . . . . . . . . . . . . . . .218–219
Endocrine, nutritional and metabolic diseases, and immunity disorders. . . .240–279
Diabetes mellitus . . . . . . . . . . . . . . . . . . . . . . . . . . . . . . . . . . . . . .250
Volume depletion . . . . . . . . . . . . . . . . . . . . . . . . . . . . . . . . . . . . .276.5
Diseases of the blood and blood-forming organs . . . . . . . . . . . . . . . . .280–289
Anemias. . . . . . . . . . . . . . . . . . . . . . . . . . . . . . . . . . . . . . . . .280–285
Mental disorders . . . . . . . . . . . . . . . . . . . . . . . . . . . . . . . . . . . . .290–319
Psychoses . . . . . . . . . . . . . . . . . . . . . . . . . . . . . . . . . . . . . . .290–299
Schizophrenic disorders . . . . . . . . . . . . . . . . . . . . . . . . . . . . . . . . .295
Major depressive disorder . . . . . . . . . . . . . . . . . . . . . . . . . .296.2–296.3
Diseases of the nervous system and sense organs. . . . . . . . . . . . . . . .320–389
Diseases of the circulatory system . . . . . . . . . . . . . . . . . . . . . . . . . .390–459
Essential hypertension . . . . . . . . . . . . . . . . . . . . . . . . . . . . . . . . . . .401
Heart disease . . . . . . . . . . . . .391–392.0,393–398,402,404,410–416,420–429
Acute myocardial infarction . . . . . . . . . . . . . . . . . . . . . . . . . . . . . . .410
Coronary atherosclerosis . . . . . . . . . . . . . . . . . . . . . . . . . . . . . . .414.0
Other ischemic heart disease . . . . . . . . . . . . . . . . . .411–413,414.1–414.9
Cardiac dysrhythmias . . . . . . . . . . . . . . . . . . . . . . . . . . . . . . . . . .427
Congestive heart failure. . . . . . . . . . . . . . . . . . . . . . . .428.0,428.2–428.4
Cerebrovascular disease. . . . . . . . . . . . . . . . . . . . . . . . . . . . . . .430–438
Diseases of the respiratory system . . . . . . . . . . . . . . . . . . . . . . . . . .460–519
Acute bronchitis and bronchiolitis . . . . . . . . . . . . . . . . . . . . . . . . . . . .466
Pneumonia . . . . . . . . . . . . . . . . . . . . . . . . . . . . . . . . . . . . . . .480–486
Chronic bronchitis . . . . . . . . . . . . . . . . . . . . . . . . . . . . . . . . . . . . . .491
Asthma . . . . . . . . . . . . . . . . . . . . . . . . . . . . . . . . . . . . . . . . . . . .493
Diseases of the digestive system . . . . . . . . . . . . . . . . . . . . . . . . . . .520–579
Appendicitis. . . . . . . . . . . . . . . . . . . . . . . . . . . . . . . . . . . . . . .540–543
Noninfectious enteritis and colitis . . . . . . . . . . . . . . . . . . . . . . . . .555–558
Intestinal obstruction . . . . . . . . . . . . . . . . . . . . . . . . . . . . . . . . . . . .560
Diverticula of intestine . . . . . . . . . . . . . . . . . . . . . . . . . . . . . . . . . . .562
Cholelithiasis . . . . . . . . . . . . . . . . . . . . . . . . . . . . . . . . . . . . . . . . .574
Acute pancreatitis . . . . . . . . . . . . . . . . . . . . . . . . . . . . . . . . . . . . .577.0
Diseases of the genitourinary system . . . . . . . . . . . . . . . . . . . . . . . .580–629
Calculus of kidney and ureter . . . . . . . . . . . . . . . . . . . . . . . . . . . . . . .592
Urinary tract infection. . . . . . . . . . . . . . . . . . . . . . . . . . . . . . . . . . .599.0
Complications of pregnancy, childbirth, and the puerperium1 . . . . . . . . . .630–677
Diseases of the skin and subcutaneous tissue. . . . . . . . . . . . . . . . . . .680–709
Cellulitis and abscess . . . . . . . . . . . . . . . . . . . . . . . . . . . . . . . .681–682
Diseases of the musculoskeletal system and connective tissue . . . . . . . .710–739
Osteoarthrosis and allied disorders . . . . . . . . . . . . . . . . . . . . . . . . . . .715
Intervertebral disc disorders . . . . . . . . . . . . . . . . . . . . . . . . . . . . . . . .722
Congenital anomalies . . . . . . . . . . . . . . . . . . . . . . . . . . . . . . . . . .740–759
Certain conditions originating in the perinatal period . . . . . . . . . . . . . . .760–779
Symptoms, signs, and ill-defined conditions . . . . . . . . . . . . . . . . . . . .780–799
Injury and poisoning . . . . . . . . . . . . . . . . . . . . . . . . . . . . . . . . . . .800–999
Fractures, all sites2 . . . . . . . . . . . . . . . . . . . . . . . . . . . . . . . . . .800–829
Fracture of neck of femur2 . . . . . . . . . . . . . . . . . . . . . . . . . . . . . . .820
Poisonings . . . . . . . . . . . . . . . . . . . . . . . . . . . . . . . . . . . . . . .960–989
Certain complications of surgical and medical care . . . . . . . . . . . . . .996–999
Supplementary classifications . . . . . . . . . . . . . . . . . . . . . . . . . . . . .V01–V85
Females with deliveries . . . . . . . . . . . . . . . . . . . . . . . . . . . . . . . . . .V27
6.7
8.7
5.8
6.5
7.8
7.2
3.3
2.4
3.9
4.7
3.5
4.3
4.0
7.0
7.7
11.7
6.7
5.7
4.5
2.2
4.4
5.4
3.2
2.5
3.4
5.1
4.9
5.1
3.2
5.1
4.7
3.2
4.6
3.1
4.2
6.2
4.8
3.8
5.2
3.9
2.4
4.6
2.7
4.9
4.4
3.9
3.8
3.1
6.3
10.7
2.4
5.4
5.3
6.2
2.9
6.1
3.8
2.6
3.3
9.0
6.5
7.7
*
*
4.0
*
3.1
2.8
2.4
4.1
3.6
9.7
9.2
*
8.8
5.6
7.3
*
9.5
*
*
*
3.2
*
*
3.2
3.2
3.4
*
2.2
3.6
3.2
2.7
3.8
*
*2.6
*
3.3
*
3.2
*
2.6
3.2
3.6
*
*
6.3
10.7
2.1
4.4
2.9
*
2.3
6.3
4.6
*2.6
5.8
8.5
3.9
5.4
7.2
*7.7
2.7
2.4
3.4
3.9
3.1
4.6
4.4
6.6
7.2
11.6
5.7
3.5
3.8
2.0
3.6
3.9
2.6
1.9
2.3
4.6
5.8
4.4
3.3
5.0
5.1
2.7
3.7
2.6
3.7
4.4
4.2
2.8
4.8
2.6
1.9
3.8
2.8
4.6
3.8
3.7
3.3
2.6
3.5
*
2.5
4.7
5.2
*4.9
2.4
5.9
2.8
2.6
7.2
9.3
5.5
6.2
6.9
7.1
3.1
2.4
3.9
5.0
3.1
4.4
4.1
7.1
8.2
12.1
6.9
5.5
4.1
2.2
3.9
4.5
3.0
2.3
2.8
5.3
5.1
5.4
3.2
5.0
4.3
3.8
4.7
3.6
4.8
6.2
4.9
3.5
5.0
3.7
2.5
4.4
*
5.4
4.7
3.7
3.6
2.9
*
*
2.0
5.9
5.5
5.7
3.6
6.0
7.8
2.7
7.6
8.4 6.7
6.9
8.3
7.2
5.4
*
4.4
5.3 4.1
4.1
3.8
7.6
8.3
10.4 10.8
7.1
4.7
2.3 4.7
6.1 3.4
2.8
3.7 5.1
4.8
5.7
3.1 5.6
4.8 4.5 5.4
5.9
4.8
6.8 4.9 5.2 6.1
4.7
3.0 4.9
. . .
5.7
5.1
4.1
3.9 4.4 4.7
*
2.9
5.8
5.6
6.2 4.2
6.3
10.8
... Average length of stay in days
* Figure does not meet standards of reliability or precision.
. . . Category not applicable.
1
First-listed diagnosis for females with deliveries is coded as V27, shown under ‘‘Supplementary classifications.’’
2
Excludes fractures coded as 733.1, ‘‘pathologic fracture.’’
Page 26 [ Series 13, No. 168
Table 14. Number of discharges from short-stay hospitals, by sex and first-listed diagnosis: United States, 2006
[Discharges of inpatients from nonfederal hospitals. Excludes newborn infants. Diagnostic groupings and code numbers are based on the International Classfication of
Diseases, Ninth Revision, Clinical Modification (ICD–9–CM)]
Category of first-listed diagnosis and ICD–9–CM code
Both sexes
Male
Female
All conditions . . . . . . . . . . . . . . . . . . . . . . . . . . . . . . . . . . . . . . . . . . . .
34,854
13,990
20,864
Infectious and parasitic diseases . . . . . . . . . . . . . . . . . . . . . . . . . . .001–139
Septicemia . . . . . . . . . . . . . . . . . . . . . . . . . . . . . . . . . . . . . . . . . .038
Neoplasms . . . . . . . . . . . . . . . . . . . . . . . . . . . . . . . . . . . . . . . .140–239
Malignant neoplasms . . . . . . . . . . . . . . . . . . . . . . . . . . .140–208,230–234
Malignant neoplasm of large intestine and rectum . . . . . . . . . .153–154,197.5
Malignant neoplasm of trachea, bronchus, and lung . . . .162,176.4,197.0,197.3
Benign neoplasms . . . . . . . . . . . . . . . . . . . . . . . . . . . . . . . . . .210–229
Benign neoplasm of uterus . . . . . . . . . . . . . . . . . . . . . . . . . . . .218–219
Endocrine, nutritional and metabolic diseases, and immunity disorders. . . .240–279
Diabetes mellitus . . . . . . . . . . . . . . . . . . . . . . . . . . . . . . . . . . . . . .250
Volume depletion . . . . . . . . . . . . . . . . . . . . . . . . . . . . . . . . . . . . .276.5
Diseases of the blood and blood-forming organs . . . . . . . . . . . . . . . . .280–289
Anemias. . . . . . . . . . . . . . . . . . . . . . . . . . . . . . . . . . . . . . . . .280–285
Mental disorders . . . . . . . . . . . . . . . . . . . . . . . . . . . . . . . . . . . . .290–319
Psychoses . . . . . . . . . . . . . . . . . . . . . . . . . . . . . . . . . . . . . . .290–299
Schizophrenic disorders . . . . . . . . . . . . . . . . . . . . . . . . . . . . . . . . .295
Major depressive disorder . . . . . . . . . . . . . . . . . . . . . . . . . .296.2–296.3
Diseases of the nervous system and sense organs. . . . . . . . . . . . . . . .320–389
Diseases of the circulatory system . . . . . . . . . . . . . . . . . . . . . . . . . .390–459
Essential hypertension . . . . . . . . . . . . . . . . . . . . . . . . . . . . . . . . . . .401
Heart disease . . . . . . . . . . . . .391–392.0,393–398,402,404,410–416,420–429
Acute myocardial infarction . . . . . . . . . . . . . . . . . . . . . . . . . . . . . . .410
Coronary atherosclerosis . . . . . . . . . . . . . . . . . . . . . . . . . . . . . . .414.0
Other ischemic heart disease . . . . . . . . . . . . . . . . . .411–413,414.1–414.9
Cardiac dysrhythmias . . . . . . . . . . . . . . . . . . . . . . . . . . . . . . . . . .427
Congestive heart failure. . . . . . . . . . . . . . . . . . . . . . . .428.0,428.2–428.4
Cerebrovascular disease. . . . . . . . . . . . . . . . . . . . . . . . . . . . . . .430–438
Diseases of the respiratory system . . . . . . . . . . . . . . . . . . . . . . . . . .460–519
Acute bronchitis and bronchiolitis . . . . . . . . . . . . . . . . . . . . . . . . . . . .466
Pneumonia . . . . . . . . . . . . . . . . . . . . . . . . . . . . . . . . . . . . . . .480–486
Chronic bronchitis . . . . . . . . . . . . . . . . . . . . . . . . . . . . . . . . . . . . . .491
Asthma . . . . . . . . . . . . . . . . . . . . . . . . . . . . . . . . . . . . . . . . . . . .493
Diseases of the digestive system . . . . . . . . . . . . . . . . . . . . . . . . . . .520–579
Appendicitis. . . . . . . . . . . . . . . . . . . . . . . . . . . . . . . . . . . . . . .540–543
Noninfectious enteritis and colitis . . . . . . . . . . . . . . . . . . . . . . . . .555–558
Intestinal obstruction . . . . . . . . . . . . . . . . . . . . . . . . . . . . . . . . . . . .560
Diverticula of intestine . . . . . . . . . . . . . . . . . . . . . . . . . . . . . . . . . . .562
Cholelithiasis . . . . . . . . . . . . . . . . . . . . . . . . . . . . . . . . . . . . . . . . .574
Acute pancreatitis . . . . . . . . . . . . . . . . . . . . . . . . . . . . . . . . . . . . .577.0
Diseases of the genitourinary system . . . . . . . . . . . . . . . . . . . . . . . .580–629
Calculus of kidney and ureter . . . . . . . . . . . . . . . . . . . . . . . . . . . . . . .592
Urinary tract infection. . . . . . . . . . . . . . . . . . . . . . . . . . . . . . . . . . .599.0
Complications of pregnancy, childbirth, and the puerperium1 . . . . . . . . . .630–677
Diseases of the skin and subcutaneous tissue. . . . . . . . . . . . . . . . . . .680–709
Cellulitis and abscess . . . . . . . . . . . . . . . . . . . . . . . . . . . . . . . .681–682
Diseases of the musculoskeletal system and connective tissue . . . . . . . .710–739
Osteoarthrosis and allied disorders . . . . . . . . . . . . . . . . . . . . . . . . . . .715
Intervertebral disc disorders . . . . . . . . . . . . . . . . . . . . . . . . . . . . . . . .722
Congenital anomalies . . . . . . . . . . . . . . . . . . . . . . . . . . . . . . . . . .740–759
Certain conditions originating in the perinatal period . . . . . . . . . . . . . . .760–779
Symptoms, signs, and ill-defined conditions . . . . . . . . . . . . . . . . . . . .780–799
Injury and poisoning . . . . . . . . . . . . . . . . . . . . . . . . . . . . . . . . . . .800–999
Fractures, all sites2 . . . . . . . . . . . . . . . . . . . . . . . . . . . . . . . . . .800–829
Fracture of neck of femur2 . . . . . . . . . . . . . . . . . . . . . . . . . . . . . . .820
Poisonings . . . . . . . . . . . . . . . . . . . . . . . . . . . . . . . . . . . . . . .960–989
Certain complications of surgical and medical care . . . . . . . . . . . . . .996–999
Supplementary classifications . . . . . . . . . . . . . . . . . . . . . . . . . . . . .V01–V85
Females with deliveries . . . . . . . . . . . . . . . . . . . . . . . . . . . . . . . . . .V27
1,088
530
1,641
1,208
154
166
378
211
1,663
584
480
451
315
2,419
1,747
333
459
615
6,161
293
4,202
647
953
160
772
1,102
889
3,485
217
1,232
513
444
3,517
318
356
323
314
335
233
1,974
166
479
519
780
589
1,969
753
324
193
200
189
2,968
1,074
330
271
912
5,022
4,127
514
250
665
579
67
81
55
...
673
283
185
194
128
1,222
833
185
174
254
3,121
101
2,213
358
616
81
372
521
404
1,653
110
589
240
177
1,610
190
136
142
124
102
117
635
87
145
...
427
327
823
290
154
101
104
88
1,522
478
92
129
458
385
...
573
280
976
629
87
85
323
211
990
301
294
257
187
1,198
914
148
285
361
3,040
192
1,988
289
337
79
400
581
486
1,832
107
643
273
266
1,908
129
220
180
191
234
116
1,339
79
333
519
354
262
1,145
463
170
92
96
100
1,446
596
238
142
455
4,636
4,127
Number in thousands
. . . Category not applicable.
1
First-listed diagnosis for females with deliveries is coded as V27, shown under ‘‘Supplementary classifications.’’
2
Excludes fractures coded as 733.1, ‘‘pathologic fracture.’’
Series 13, No. 168 [ Page 27
Table 15. Rate of discharges from short-stay hospitals, by sex and first-listed diagnosis: United States, 2006
[Discharges of inpatients from nonfederal hospitals. Excludes newborn infants. Diagnostic groupings and code numbers are based on the International Classfication of
Diseases, Ninth Revision, Clinical Modification (ICD–9–CM)]
Category of first-listed diagnosis and ICD–9–CM code
Both sexes
Male
Female
Rate per 10,000 population1
All conditions . . . . . . . . . . . . . . . . . . . . . . . . . . . . . . . . . . . . . . . . . . . .
1,168.7
954.9
Infectious and parasitic diseases . . . . . . . . . . . . . . . . . . . . . . . . . . .001–139
Septicemia . . . . . . . . . . . . . . . . . . . . . . . . . . . . . . . . . . . . . . . . . .038
Neoplasms . . . . . . . . . . . . . . . . . . . . . . . . . . . . . . . . . . . . . . . .140–239
Malignant neoplasms . . . . . . . . . . . . . . . . . . . . . . . . . . .140–208,230–234
Malignant neoplasm of large intestine and rectum . . . . . . . . . .153–154,197.5
Malignant neoplasm of trachea, bronchus, and lung . . . .162,176.4,197.0,197.3
Benign neoplasms . . . . . . . . . . . . . . . . . . . . . . . . . . . . . . . . . .210–229
Benign neoplasm of uterus . . . . . . . . . . . . . . . . . . . . . . . . . . . .218–219
Endocrine, nutritional and metabolic diseases, and immunity disorders. . . .240–279
Diabetes mellitus . . . . . . . . . . . . . . . . . . . . . . . . . . . . . . . . . . . . . .250
Volume depletion . . . . . . . . . . . . . . . . . . . . . . . . . . . . . . . . . . . . .276.5
Diseases of the blood and blood-forming organs . . . . . . . . . . . . . . . . .280–289
Anemias. . . . . . . . . . . . . . . . . . . . . . . . . . . . . . . . . . . . . . . . .280–285
Mental disorders . . . . . . . . . . . . . . . . . . . . . . . . . . . . . . . . . . . . .290–319
Psychoses . . . . . . . . . . . . . . . . . . . . . . . . . . . . . . . . . . . . . . .290–299
Schizophrenic disorders . . . . . . . . . . . . . . . . . . . . . . . . . . . . . . . . .295
Major depressive disorder . . . . . . . . . . . . . . . . . . . . . . . . . .296.2–296.3
Diseases of the nervous system and sense organs. . . . . . . . . . . . . . . .320–389
Diseases of the circulatory system . . . . . . . . . . . . . . . . . . . . . . . . . .390–459
Essential hypertension . . . . . . . . . . . . . . . . . . . . . . . . . . . . . . . . . . .401
Heart disease . . . . . . . . . . . . .391–392.0,393–398,402,404,410–416,420–429
Acute myocardial infarction . . . . . . . . . . . . . . . . . . . . . . . . . . . . . . .410
Coronary atherosclerosis . . . . . . . . . . . . . . . . . . . . . . . . . . . . . . .414.0
Other ischemic heart disease . . . . . . . . . . . . . . . . . .411–413,414.1–414.9
Cardiac dysrhythmias . . . . . . . . . . . . . . . . . . . . . . . . . . . . . . . . . .427
Congestive heart failure. . . . . . . . . . . . . . . . . . . . . . . .428.0,428.2–428.4
Cerebrovascular disease. . . . . . . . . . . . . . . . . . . . . . . . . . . . . . .430–438
Diseases of the respiratory system . . . . . . . . . . . . . . . . . . . . . . . . . .460–519
Acute bronchitis and bronchiolitis . . . . . . . . . . . . . . . . . . . . . . . . . . . .466
Pneumonia . . . . . . . . . . . . . . . . . . . . . . . . . . . . . . . . . . . . . . .480–486
Chronic bronchitis . . . . . . . . . . . . . . . . . . . . . . . . . . . . . . . . . . . . . .491
Asthma . . . . . . . . . . . . . . . . . . . . . . . . . . . . . . . . . . . . . . . . . . . .493
Diseases of the digestive system . . . . . . . . . . . . . . . . . . . . . . . . . . .520–579
Appendicitis. . . . . . . . . . . . . . . . . . . . . . . . . . . . . . . . . . . . . . .540–543
Noninfectious enteritis and colitis . . . . . . . . . . . . . . . . . . . . . . . . .555–558
Intestinal obstruction . . . . . . . . . . . . . . . . . . . . . . . . . . . . . . . . . . . .560
Diverticula of intestine . . . . . . . . . . . . . . . . . . . . . . . . . . . . . . . . . . .562
Cholelithiasis . . . . . . . . . . . . . . . . . . . . . . . . . . . . . . . . . . . . . . . . .574
Acute pancreatitis . . . . . . . . . . . . . . . . . . . . . . . . . . . . . . . . . . . . .577.0
Diseases of the genitourinary system . . . . . . . . . . . . . . . . . . . . . . . .580–629
Calculus of kidney and ureter . . . . . . . . . . . . . . . . . . . . . . . . . . . . . . .592
Urinary tract infection. . . . . . . . . . . . . . . . . . . . . . . . . . . . . . . . . . .599.0
Complications of pregnancy, childbirth, and the puerperium2 . . . . . . . . . .630–677
Diseases of the skin and subcutaneous tissue. . . . . . . . . . . . . . . . . . .680–709
Cellulitis and abscess . . . . . . . . . . . . . . . . . . . . . . . . . . . . . . . .681–682
Diseases of the musculoskeletal system and connective tissue . . . . . . . .710–739
Osteoarthrosis and allied disorders . . . . . . . . . . . . . . . . . . . . . . . . . . .715
Intervertebral disc disorders . . . . . . . . . . . . . . . . . . . . . . . . . . . . . . . .722
Congenital anomalies . . . . . . . . . . . . . . . . . . . . . . . . . . . . . . . . . .740–759
Certain conditions originating in the perinatal period . . . . . . . . . . . . . . .760–779
Symptoms, signs, and ill-defined conditions . . . . . . . . . . . . . . . . . . . .780–799
Injury and poisoning . . . . . . . . . . . . . . . . . . . . . . . . . . . . . . . . . . .800–999
Fractures, all sites3 . . . . . . . . . . . . . . . . . . . . . . . . . . . . . . . . . .800–829
Fracture of neck of femur3 . . . . . . . . . . . . . . . . . . . . . . . . . . . . . . .820
Poisonings . . . . . . . . . . . . . . . . . . . . . . . . . . . . . . . . . . . . . . .960–989
Certain complications of surgical and medical care . . . . . . . . . . . . . .996–999
Supplementary classifications . . . . . . . . . . . . . . . . . . . . . . . . . . . . .V01-V85
Females with deliveries . . . . . . . . . . . . . . . . . . . . . . . . . . . . . . . . . .V27
36.5
17.8
55.0
40.5
5.2
5.6
12.7
7.1
55.8
19.6
16.1
15.1
10.6
81.1
58.6
11.2
15.4
20.6
206.6
9.8
140.9
21.7
32.0
5.4
25.9
36.9
29.8
116.9
7.3
41.3
17.2
14.9
117.9
10.7
11.9
10.8
10.5
11.2
7.8
66.2
5.6
16.0
17.4
26.2
19.7
66.0
25.3
10.9
6.5
6.7
6.3
99.5
36.0
11.1
9.1
30.6
168.4
138.4
35.1
17.1
45.4
39.5
4.6
5.5
3.7
...
45.9
19.3
12.6
13.2
8.7
83.4
56.9
12.7
11.9
17.3
213.0
6.9
151.1
24.4
42.1
5.6
25.4
35.5
27.6
112.8
7.5
40.2
16.4
12.1
109.9
13.0
9.3
9.7
8.4
6.9
8.0
43.3
6.0
9.9
...
29.1
22.3
56.2
19.8
10.5
6.9
7.1
6.0
103.9
32.7
6.3
8.8
31.2
26.3
...
. . . Category not applicable.
1
Rates were calculated using U.S. Census Bureau 2000-based postcensal estimates of the civilian population as of July 1, 2006.
2
First-listed diagnosis for females with deliveries is coded as V27, shown under ‘‘Supplementary classifications.’’
3
Excludes fractures coded as 733.1, ‘‘pathologic fracture.’’
1,375.3
37.8
18.5 64.4
41.5
5.7
5.6
21.3
13.9
65.3
19.9 19.4
17.0
12.3
78.9
60.2
9.7 18.8
23.8
200.4
12.7 131.1
19.0 22.2
5.2
26.4 38.3
32.0
120.8
7.0 42.4
18.0 17.6 125.7
8.5
14.5
11.9 12.6 15.4 7.6
88.3
5.2 22.0
34.2
23.3
17.3
75.5
30.5 11.2 6.1
6.3
6.6
95.3
39.3
15.7 9.3
30.0
305.6
272.1
Page 28 [ Series 13, No. 168
Table 16. Average length of stay for discharges from short-stay hospitals, by sex and first-listed diagnosis: United States, 2006
[Discharges of inpatients from nonfederal hospitals. Excludes newborn infants. Diagnostic groupings and code numbers are based on the International Classfication of
Diseases, Ninth Revision, Clinical Modification (ICD–9–CM)]
Category of first-listed diagnosis and ICD–9–CM code
Both sexes
Male
Female
All conditions . . . . . . . . . . . . . . . . . . . . . . . . . . . . . . . . . . . . . . . . . . . .
4.8
5.2
4.5
Infectious and parasitic diseases . . . . . . . . . . . . . . . . . . . . . . . . . . .001–139
Septicemia . . . . . . . . . . . . . . . . . . . . . . . . . . . . . . . . . . . . . . . . . .038
Neoplasms . . . . . . . . . . . . . . . . . . . . . . . . . . . . . . . . . . . . . . . .140–239
Malignant neoplasms . . . . . . . . . . . . . . . . . . . . . . . . . . .140–208,230–234
Malignant neoplasm of large intestine and rectum . . . . . . . . . .153–154,197.5
Malignant neoplasm of trachea, bronchus, and lung . . . .162,176.4,197.0,197.3
Benign neoplasms . . . . . . . . . . . . . . . . . . . . . . . . . . . . . . . . . .210–229
Benign neoplasm of uterus . . . . . . . . . . . . . . . . . . . . . . . . . . . .218–219
Endocrine, nutritional and metabolic diseases, and immunity disorders. . . .240–279
Diabetes mellitus . . . . . . . . . . . . . . . . . . . . . . . . . . . . . . . . . . . . . .250
Volume depletion . . . . . . . . . . . . . . . . . . . . . . . . . . . . . . . . . . . . .276.5
Diseases of the blood and blood-forming organs . . . . . . . . . . . . . . . . .280–289
Anemias. . . . . . . . . . . . . . . . . . . . . . . . . . . . . . . . . . . . . . . . .280–285
Mental disorders . . . . . . . . . . . . . . . . . . . . . . . . . . . . . . . . . . . . .290–319
Psychoses . . . . . . . . . . . . . . . . . . . . . . . . . . . . . . . . . . . . . . .290–299
Schizophrenic disorders . . . . . . . . . . . . . . . . . . . . . . . . . . . . . . . . .295
Major depressive disorder . . . . . . . . . . . . . . . . . . . . . . . . . .296.2–296.3
Diseases of the nervous system and sense organs. . . . . . . . . . . . . . . .320–389
Diseases of the circulatory system . . . . . . . . . . . . . . . . . . . . . . . . . .390–459
Essential hypertension . . . . . . . . . . . . . . . . . . . . . . . . . . . . . . . . . . .401
Heart disease . . . . . . . . . . . . .391–392.0,393–398,402,404,410–416,420–429
Acute myocardial infarction . . . . . . . . . . . . . . . . . . . . . . . . . . . . . . .410
Coronary atherosclerosis . . . . . . . . . . . . . . . . . . . . . . . . . . . . . . .414.0
Other ischemic heart disease . . . . . . . . . . . . . . . . . .411–413,414.1–414.9
Cardiac dysrhythmias . . . . . . . . . . . . . . . . . . . . . . . . . . . . . . . . . .427
Congestive heart failure. . . . . . . . . . . . . . . . . . . . . . . .428.0,428.2–428.4
Cerebrovascular disease. . . . . . . . . . . . . . . . . . . . . . . . . . . . . . .430–438
Diseases of the respiratory system . . . . . . . . . . . . . . . . . . . . . . . . . .460–519
Acute bronchitis and bronchiolitis . . . . . . . . . . . . . . . . . . . . . . . . . . . .466
Pneumonia . . . . . . . . . . . . . . . . . . . . . . . . . . . . . . . . . . . . . . .480–486
Chronic bronchitis . . . . . . . . . . . . . . . . . . . . . . . . . . . . . . . . . . . . . .491
Asthma . . . . . . . . . . . . . . . . . . . . . . . . . . . . . . . . . . . . . . . . . . . .493
Diseases of the digestive system . . . . . . . . . . . . . . . . . . . . . . . . . . .520–579
Appendicitis. . . . . . . . . . . . . . . . . . . . . . . . . . . . . . . . . . . . . . .540–543
Noninfectious enteritis and colitis . . . . . . . . . . . . . . . . . . . . . . . . .555–558
Intestinal obstruction . . . . . . . . . . . . . . . . . . . . . . . . . . . . . . . . . . . .560
Diverticula of intestine . . . . . . . . . . . . . . . . . . . . . . . . . . . . . . . . . . .562
Cholelithiasis . . . . . . . . . . . . . . . . . . . . . . . . . . . . . . . . . . . . . . . . .574
Acute pancreatitis . . . . . . . . . . . . . . . . . . . . . . . . . . . . . . . . . . . . .577.0
Diseases of the genitourinary system . . . . . . . . . . . . . . . . . . . . . . . .580–629
Calculus of kidney and ureter . . . . . . . . . . . . . . . . . . . . . . . . . . . . . . .592
Urinary tract infection. . . . . . . . . . . . . . . . . . . . . . . . . . . . . . . . . . .599.0
Complications of pregnancy, childbirth, and the puerperium1 . . . . . . . . . .630–677
Diseases of the skin and subcutaneous tissue. . . . . . . . . . . . . . . . . . .680–709
Cellulitis and abscess . . . . . . . . . . . . . . . . . . . . . . . . . . . . . . . .681–682
Diseases of the musculoskeletal system and connective tissue . . . . . . . .710–739
Osteoarthrosis and allied disorders . . . . . . . . . . . . . . . . . . . . . . . . . . .715
Intervertebral disc disorders . . . . . . . . . . . . . . . . . . . . . . . . . . . . . . . .722
Congenital anomalies . . . . . . . . . . . . . . . . . . . . . . . . . . . . . . . . . .740–759
Certain conditions originating in the perinatal period . . . . . . . . . . . . . . .760–779
Symptoms, signs, and ill-defined conditions . . . . . . . . . . . . . . . . . . . .780–799
Injury and poisoning . . . . . . . . . . . . . . . . . . . . . . . . . . . . . . . . . . .800–999
Fractures, all sites2 . . . . . . . . . . . . . . . . . . . . . . . . . . . . . . . . . .800–829
Fracture of neck of femur2 . . . . . . . . . . . . . . . . . . . . . . . . . . . . . . .820
Poisonings . . . . . . . . . . . . . . . . . . . . . . . . . . . . . . . . . . . . . . .960–989
Certain complications of surgical and medical care . . . . . . . . . . . . . .996–999
Supplementary classifications . . . . . . . . . . . . . . . . . . . . . . . . . . . . .V01–V85
Females with deliveries . . . . . . . . . . . . . . . . . . . . . . . . . . . . . . . . . .V27
6.7
8.7
5.8
6.5
7.8
7.2
3.3
2.4
3.9
4.7
3.5
4.3
4.0
7.0
7.7
11.7
6.7
5.7
4.5
2.2
4.4
5.4
3.2
2.5
3.4
5.1
4.9
5.1
3.2
5.1
4.7
3.2
4.6
3.1
4.2
6.2
4.8
3.8
5.2
3.9
2.4
4.6
2.7
4.9
4.4
3.9
3.8
3.1
6.3
10.7
2.4
5.4
5.3
6.2
2.9
6.1
3.8
2.6
6.7
8.8
6.8
6.9
8.3
7.5
4.6
...
4.2
4.9
3.2
4.6
4.4
6.9
7.7
11.2
6.7
5.7
4.3
2.0
4.2
5.3
3.2
2.7
3.1
5.1
4.7
5.0
3.3
4.9
4.3
2.6
4.6
3.1
4.4
6.0
5.0
4.3
5.0
4.4
2.3
4.6
...
4.9
4.4
3.9
3.7
3.0
5.8
10.7
2.3
5.5
5.5
6.3
3.1
6.2
9.0
...
6.6
8.5 5.2
6.2
7.4
6.9
3.1
2.4
3.8
4.5 3.6
4.1
3.8
7.1
7.7
12.4 6.7
5.7
4.6
2.3 4.6
5.6 3.4
2.4
3.7 5.2
5.1
5.2
3.1 5.3
5.0 3.6 4.7
3.2
4.2
6.3 4.7 3.6 5.4
3.6
2.6 4.7
2.7
4.8
4.5
3.9
3.8 3.2 7.0
10.6
2.4
5.2
5.2
6.1 2.7
6.1
3.3
2.6 Average length of stay in days
. . . Category not applicable.
1
First-listed diagnosis for females with deliveries is coded as V27, shown under ‘‘Supplementary classifications.’’
2
Excludes fractures coded as 733.1, ‘‘pathologic fracture.’’
Series 13, No. 168 [ Page 29
Table 17. Number of discharges from short-stay hospitals, by geographic region and first-listed diagnosis: United States, 2006
[Discharges of inpatients from nonfederal hospitals. Excludes newborn infants. Diagnostic groupings and code numbers are based on the International Classfication of
Diseases, Ninth Revision, Clinical Modification (ICD–9–CM)]
Category of first-listed diagnosis and ICD–9–CM code
United
States
Northeast
All conditions . . . . . . . . . . . . . . . . . . . . . . . . . . . . . . . . . . . . . . . . . . . . . . . . .
34,854
7,277
Infectious and parasitic diseases . . . . . . . . . . . . . . . . . . . . . . . . . . . . . . . .001–139
Septicemia . . . . . . . . . . . . . . . . . . . . . . . . . . . . . . . . . . . . . . . . . . . . . . .038
Neoplasms . . . . . . . . . . . . . . . . . . . . . . . . . . . . . . . . . . . . . . . . . . . . .140–239
Malignant neoplasms . . . . . . . . . . . . . . . . . . . . . . . . . . . . . . . .140–208,230–234
Malignant neoplasm of large intestine and rectum. . . . . . . . . . . . . . .153–154,197.5
Malignant neoplasm of trachea, bronchus, and lung. . . . . . . . .162,176.4,197.0,197.3
Benign neoplasms . . . . . . . . . . . . . . . . . . . . . . . . . . . . . . . . . . . . . . .210–229
Benign neoplasm of uterus. . . . . . . . . . . . . . . . . . . . . . . . . . . . . . . . .218–219
Endocrine, nutritional and metabolic diseases, and immunity disorders . . . . . . .240–279
Diabetes mellitus . . . . . . . . . . . . . . . . . . . . . . . . . . . . . . . . . . . . . . . . . .250
Volume depletion. . . . . . . . . . . . . . . . . . . . . . . . . . . . . . . . . . . . . . . . .276.5
Diseases of the blood and blood-forming organs . . . . . . . . . . . . . . . . . . . . . .280–289
Anemias . . . . . . . . . . . . . . . . . . . . . . . . . . . . . . . . . . . . . . . . . . . . .280–285
Mental disorders . . . . . . . . . . . . . . . . . . . . . . . . . . . . . . . . . . . . . . . . . .290–319
Psychoses . . . . . . . . . . . . . . . . . . . . . . . . . . . . . . . . . . . . . . . . . . . .290–299
Schizophrenic disorders. . . . . . . . . . . . . . . . . . . . . . . . . . . . . . . . . . . . . .295
Major depressive disorder . . . . . . . . . . . . . . . . . . . . . . . . . . . . . . .296.2–296.3
Diseases of the nervous system and sense organs . . . . . . . . . . . . . . . . . . . .320–389
Diseases of the circulatory system . . . . . . . . . . . . . . . . . . . . . . . . . . . . . . .390–459
Essential hypertension . . . . . . . . . . . . . . . . . . . . . . . . . . . . . . . . . . . . . . . .401
Heart disease . . . . . . . . . . . . . . . . . .391–392.0,393–398,402,404,410–416,420–429
Acute myocardial infarction. . . . . . . . . . . . . . . . . . . . . . . . . . . . . . . . . . . .410
Coronary atherosclerosis . . . . . . . . . . . . . . . . . . . . . . . . . . . . . . . . . . . .414.0
Other ischemic heart disease . . . . . . . . . . . . . . . . . . . . . . .411–413,414.1–414.9
Cardiac dysrhythmias . . . . . . . . . . . . . . . . . . . . . . . . . . . . . . . . . . . . . . .427
Congestive heart failure . . . . . . . . . . . . . . . . . . . . . . . . . . . .428.0,428.2–428.4
Cerebrovascular disease . . . . . . . . . . . . . . . . . . . . . . . . . . . . . . . . . . .430–438
Diseases of the respiratory system . . . . . . . . . . . . . . . . . . . . . . . . . . . . . .460–519
Acute bronchitis and bronchiolitis . . . . . . . . . . . . . . . . . . . . . . . . . . . . . . . . .466
Pneumonia . . . . . . . . . . . . . . . . . . . . . . . . . . . . . . . . . . . . . . . . . . . .480–486
Chronic bronchitis . . . . . . . . . . . . . . . . . . . . . . . . . . . . . . . . . . . . . . . . . . .491
Asthma . . . . . . . . . . . . . . . . . . . . . . . . . . . . . . . . . . . . . . . . . . . . . . . . .493
Diseases of the digestive system. . . . . . . . . . . . . . . . . . . . . . . . . . . . . . . .520–579
Appendicitis . . . . . . . . . . . . . . . . . . . . . . . . . . . . . . . . . . . . . . . . . . .540–543
Noninfectious enteritis and colitis . . . . . . . . . . . . . . . . . . . . . . . . . . . . . .555–558
Intestinal obstruction . . . . . . . . . . . . . . . . . . . . . . . . . . . . . . . . . . . . . . . . .560
Diverticula of intestine . . . . . . . . . . . . . . . . . . . . . . . . . . . . . . . . . . . . . . . .562
Cholelithiasis . . . . . . . . . . . . . . . . . . . . . . . . . . . . . . . . . . . . . . . . . . . . . .574
Acute pancreatitis. . . . . . . . . . . . . . . . . . . . . . . . . . . . . . . . . . . . . . . . . .577.0
Diseases of the genitourinary system . . . . . . . . . . . . . . . . . . . . . . . . . . . . .580–629
Calculus of kidney and ureter. . . . . . . . . . . . . . . . . . . . . . . . . . . . . . . . . . . .592
Urinary tract infection . . . . . . . . . . . . . . . . . . . . . . . . . . . . . . . . . . . . . . .599.0
Complications of pregnancy, childbirth, and the puerperium1 . . . . . . . . . . . . . . .630–677
Diseases of the skin and subcutaneous tissue . . . . . . . . . . . . . . . . . . . . . . .680–709
Cellulitis and abscess . . . . . . . . . . . . . . . . . . . . . . . . . . . . . . . . . . . . .681–682
Diseases of the musculoskeletal system and connective tissue . . . . . . . . . . . . .710–739
Osteoarthrosis and allied disorders . . . . . . . . . . . . . . . . . . . . . . . . . . . . . . . .715
Intervertebral disc disorders. . . . . . . . . . . . . . . . . . . . . . . . . . . . . . . . . . . . .722
Congenital anomalies . . . . . . . . . . . . . . . . . . . . . . . . . . . . . . . . . . . . . . .740–759
Certain conditions originating in the perinatal period . . . . . . . . . . . . . . . . . . . .760–779
Symptoms, signs, and ill-defined conditions . . . . . . . . . . . . . . . . . . . . . . . . .780–799
Injury and poisoning. . . . . . . . . . . . . . . . . . . . . . . . . . . . . . . . . . . . . . . .800–999
Fractures, all sites2 . . . . . . . . . . . . . . . . . . . . . . . . . . . . . . . . . . . . . . .800–829
Fracture of neck of femur2 . . . . . . . . . . . . . . . . . . . . . . . . . . . . . . . . . . . .820
Poisonings . . . . . . . . . . . . . . . . . . . . . . . . . . . . . . . . . . . . . . . . . . . .960–989
Certain complications of surgical and medical care . . . . . . . . . . . . . . . . . . .996–999
Supplementary classifications . . . . . . . . . . . . . . . . . . . . . . . . . . . . . . . . .V01–V85
Females with deliveries . . . . . . . . . . . . . . . . . . . . . . . . . . . . . . . . . . . . . . .V27
1,088
530
1,641
1,208
154
166
378
211
1,663
584
480
451
315
2,419
1,747
333
459
615
6,161
293
4,202
647
953
160
772
1,102
889
3,485
217
1,232
513
444
3,517
318
356
323
314
335
233
1,974
166
479
519
780
589
1,969
753
324
193
200
189
2,968
1,074
330
271
912
5,022
4,127
245
109
340
255
32
38
75
39
370
133
80
108
76
653
445
101
92
160
1,370
83
943
140
197
36
196
251
178
744
40
233
120
122
717
60
78
65
71
64
41
379
39
93
79
157
124
406
155
56
50
32
42
613
212
67
60
208
811
618
Midwest
South
West
7,951
13,140
6,486
242
133
362
273
38
41
74
46
360
107
130
96
68
536
409
52
113
134
1,528
61
1,065
164
242
39
201
280
214
857
40
351
126
94
834
71
89
88
89
67
57
468
48
116
92
164
130
493
214
77
25
22
25
681
280
89
65
190
1,033
849
391
188
611
439
56
63
151
85
646
244
192
175
124
*
*
153
*
212
2,250
107
1,508
221
367
60
252
415
331
1,290
85
438
214
146
1,305
100
132
112
111
140
96
761
58
185
245
328
228
667
238
117
58
70
90
1,081
364
119
89
343
1,933
1,613
209
100
329
241
28
24
77
40
287
100
77
72
47
206
155
26
31
108
1,012
42
685
121
148
25
123
156
167
594
*
210
53
*
661
88
56
58
43
63
39
366
21
84
104
132
107
403
146
74
*
*
32
593
217
55
57
171
1,244
1,047
Number in thousands
* Figure does not meet standards of reliability or precision.
1
First-listed diagnosis for females with deliveries is coded as V27, shown under ‘‘Supplementary classifications.’’
2
Excludes fractures coded as 733.1, ‘‘pathologic fracture.’’
Page 30 [ Series 13, No. 168
Table 18. Rate of discharges from short-stay hospitals, by geographic region and first-listed diagnosis: United States, 2006
[Discharges of inpatients from nonfederal hospitals. Excludes newborn infants. Diagnostic groupings and code numbers are based on the International Classfication of
Diseases, Ninth Revision, Clinical Modification (ICD–9–CM)]
Category of first-listed diagnosis and ICD–9–CM code
United
States
Northeast
Midwest
South
West
Rate per 10,000 population1
All conditions . . . . . . . . . . . . . . . . . . . . . . . . . . . . . . . . . . . . . . . . . . . . . . . . .
1,168.7
1,330.7
1,202.3
1,212.0
940.2
Infectious and parasitic diseases . . . . . . . . . . . . . . . . . . . . . . . . . . . . . . . .001–139
Septicemia . . . . . . . . . . . . . . . . . . . . . . . . . . . . . . . . . . . . . . . . . . . . . . .038
Neoplasms . . . . . . . . . . . . . . . . . . . . . . . . . . . . . . . . . . . . . . . . . . . . .140–239
Malignant neoplasms . . . . . . . . . . . . . . . . . . . . . . . . . . . . . . . .140–208,230–234
Malignant neoplasm of large intestine and rectum. . . . . . . . . . . . . . .153–154,197.5
Malignant neoplasm of trachea, bronchus, and lung. . . . . . . . .162,176.4,197.0,197.3
Benign neoplasms . . . . . . . . . . . . . . . . . . . . . . . . . . . . . . . . . . . . . . .210–229
Benign neoplasm of uterus. . . . . . . . . . . . . . . . . . . . . . . . . . . . . . . . .218–219
Endocrine, nutritional and metabolic diseases, and immunity disorders . . . . . . .240–279
Diabetes mellitus . . . . . . . . . . . . . . . . . . . . . . . . . . . . . . . . . . . . . . . . . .250
Volume depletion. . . . . . . . . . . . . . . . . . . . . . . . . . . . . . . . . . . . . . . . .276.5
Diseases of the blood and blood-forming organs . . . . . . . . . . . . . . . . . . . . . .280–289
Anemias . . . . . . . . . . . . . . . . . . . . . . . . . . . . . . . . . . . . . . . . . . . . .280–285
Mental disorders . . . . . . . . . . . . . . . . . . . . . . . . . . . . . . . . . . . . . . . . . .290–319
Psychoses . . . . . . . . . . . . . . . . . . . . . . . . . . . . . . . . . . . . . . . . . . . .290–299
Schizophrenic disorders. . . . . . . . . . . . . . . . . . . . . . . . . . . . . . . . . . . . . .295
Major depressive disorder . . . . . . . . . . . . . . . . . . . . . . . . . . . . . . .296.2–296.3
Diseases of the nervous system and sense organs . . . . . . . . . . . . . . . . . . . .320–389
Diseases of the circulatory system . . . . . . . . . . . . . . . . . . . . . . . . . . . . . . .390–459
Essential hypertension . . . . . . . . . . . . . . . . . . . . . . . . . . . . . . . . . . . . . . . .401
Heart disease . . . . . . . . . . . . . . . . . .391–392.0,393–398,402,404,410–416,420–429
Acute myocardial infarction. . . . . . . . . . . . . . . . . . . . . . . . . . . . . . . . . . . .410
Coronary atherosclerosis . . . . . . . . . . . . . . . . . . . . . . . . . . . . . . . . . . . .414.0
Other ischemic heart disease . . . . . . . . . . . . . . . . . . . . . . .411–413,414.1–414.9
Cardiac dysrhythmias . . . . . . . . . . . . . . . . . . . . . . . . . . . . . . . . . . . . . . .427
Congestive heart failure . . . . . . . . . . . . . . . . . . . . . . . . . . . .428.0,428.2–428.4
Cerebrovascular disease . . . . . . . . . . . . . . . . . . . . . . . . . . . . . . . . . . .430–438
Diseases of the respiratory system . . . . . . . . . . . . . . . . . . . . . . . . . . . . . .460–519
Acute bronchitis and bronchiolitis . . . . . . . . . . . . . . . . . . . . . . . . . . . . . . . . .466
Pneumonia . . . . . . . . . . . . . . . . . . . . . . . . . . . . . . . . . . . . . . . . . . . .480–486
Chronic bronchitis . . . . . . . . . . . . . . . . . . . . . . . . . . . . . . . . . . . . . . . . . . .491
Asthma . . . . . . . . . . . . . . . . . . . . . . . . . . . . . . . . . . . . . . . . . . . . . . . . .493
Diseases of the digestive system. . . . . . . . . . . . . . . . . . . . . . . . . . . . . . . .520–579
Appendicitis . . . . . . . . . . . . . . . . . . . . . . . . . . . . . . . . . . . . . . . . . . .540–543
Noninfectious enteritis and colitis . . . . . . . . . . . . . . . . . . . . . . . . . . . . . .555–558
Intestinal obstruction . . . . . . . . . . . . . . . . . . . . . . . . . . . . . . . . . . . . . . . . .560
Diverticula of intestine . . . . . . . . . . . . . . . . . . . . . . . . . . . . . . . . . . . . . . . .562
Cholelithiasis . . . . . . . . . . . . . . . . . . . . . . . . . . . . . . . . . . . . . . . . . . . . . .574
Acute pancreatitis. . . . . . . . . . . . . . . . . . . . . . . . . . . . . . . . . . . . . . . . . .577.0
Diseases of the genitourinary system . . . . . . . . . . . . . . . . . . . . . . . . . . . . .580–629
Calculus of kidney and ureter. . . . . . . . . . . . . . . . . . . . . . . . . . . . . . . . . . . .592
Urinary tract infection . . . . . . . . . . . . . . . . . . . . . . . . . . . . . . . . . . . . . . .599.0
Complications of pregnancy, childbirth, and the puerperium2 . . . . . . . . . . . . . . .630–677
Diseases of the skin and subcutaneous tissue . . . . . . . . . . . . . . . . . . . . . . .680–709
Cellulitis and abscess . . . . . . . . . . . . . . . . . . . . . . . . . . . . . . . . . . . . .681–682
Diseases of the musculoskeletal system and connective tissue . . . . . . . . . . . . .710–739
Osteoarthrosis and allied disorders . . . . . . . . . . . . . . . . . . . . . . . . . . . . . . . .715
Intervertebral disc disorders. . . . . . . . . . . . . . . . . . . . . . . . . . . . . . . . . . . . .722
Congenital anomalies . . . . . . . . . . . . . . . . . . . . . . . . . . . . . . . . . . . . . . .740–759
Certain conditions originating in the perinatal period . . . . . . . . . . . . . . . . . . . .760–779
Symptoms, signs, and ill-defined conditions . . . . . . . . . . . . . . . . . . . . . . . . .780–799
Injury and poisoning. . . . . . . . . . . . . . . . . . . . . . . . . . . . . . . . . . . . . . . .800–999
Fractures, all sites3 . . . . . . . . . . . . . . . . . . . . . . . . . . . . . . . . . . . . . . .800–829
Fracture of neck of femur3 . . . . . . . . . . . . . . . . . . . . . . . . . . . . . . . . . . . .820
Poisonings . . . . . . . . . . . . . . . . . . . . . . . . . . . . . . . . . . . . . . . . . . . .960–989
Certain complications of surgical and medical care . . . . . . . . . . . . . . . . . . .996–999
Supplementary classifications . . . . . . . . . . . . . . . . . . . . . . . . . . . . . . . . .V01–V85
Females with deliveries . . . . . . . . . . . . . . . . . . . . . . . . . . . . . . . . . . . . . . .V27
36.5
17.8
55.0
40.5
5.2
5.6
12.7
7.1
55.8
19.6
16.1
15.1
10.6
81.1
58.6
11.2
15.4
20.6
206.6
9.8
140.9
21.7
32.0
5.4
25.9
36.9
29.8
116.9
7.3
41.3
17.2
14.9
117.9
10.7
11.9
10.8
10.5
11.2
7.8
66.2
5.6
16.0
17.4
26.2
19.7
66.0
25.3
10.9
6.5
6.7
6.3
99.5
36.0
11.1
9.1
30.6
168.4
138.4
44.9
19.9
62.1
46.7
5.9
6.9
13.7
7.2
67.7
24.4
14.7
19.8
13.9
119.4
81.4
18.5
16.9
29.3
250.5
15.2
172.4
25.6
36.1
6.6
35.8
45.8
32.5
136.1
7.2
42.6
21.9
22.4
131.2
10.9
14.3
12.0
13.0
11.8
7.5
69.4
7.2
16.9
14.4
28.7
22.7
74.2
28.3
10.3
9.2
5.8
7.7
112.1
38.8
12.3
11.0
38.0
148.2
113.0
36.5
20.2
54.7
41.3
5.8
6.2
11.2
7.0
54.5
16.2
19.6
14.5
10.3
81.0
61.8
7.9
17.0
20.3
231.1
9.3
161.1
24.8
36.6
5.8
30.4
42.3
32.3
129.5
6.1
53.0
19.0
14.3
126.1
10.8
13.5
13.3
13.5
10.2
8.6
70.8
7.2
17.6
13.9
24.8
19.6
74.5
32.3
11.6
3.7
3.4
3.8
102.9
42.4
13.5
9.8
28.7
156.2
128.4
36.1
17.3
56.3
40.5
5.2
5.8
14.0
7.8
59.6
22.5
17.7
16.2
11.4
*
*
14.1
*
19.5
207.6
9.9
139.1
20.4
33.8
5.6
23.3
38.3
30.5
119.0
7.8
40.4
19.7
13.5
120.4
9.2
12.2
10.3
10.2
12.9
8.9
70.2
5.4
17.1
22.6
30.2
21.0
61.6
22.0
10.8
5.4
6.5
8.3
99.7
33.6
11.0
8.2
31.7
178.3
148.8
30.4
14.5
47.6
34.9
4.1
3.5
11.2
5.9
41.6
14.5
11.2
10.4
6.9
29.9
22.5
3.8
4.5
15.7
146.7
6.0
99.3
17.6
21.4
3.7
17.8
22.6
24.3
86.1
*
30.5
7.7
*
95.8
12.7
8.2
8.4
6.2
9.2
5.7
53.0
3.1
12.2
15.0
19.1
15.5
58.4
21.2
10.7
*
*
4.6
85.9
31.5
7.9
8.3
24.8
180.4
151.7
* Figure does not meet standards of reliability or precision.
1
Rates were calculated using U.S. Census Bureau 2000-based postcensal estimates of the civilian population as of July 1, 2006.
2
First-listed diagnosis for females with deliveries is coded as V27, shown under ‘‘Supplementary classifications.’’
3
Excludes fractures coded as 733.1, ‘‘pathologic fracture.’’
Series 13, No. 168 [ Page 31
Table 19. Average length of stay for discharges from short-stay hospitals, by geographic region and first-listed diagnosis: United States,
2006
[Discharges of inpatients from nonfederal hospitals. Excludes newborn infants. Diagnostic groupings and code numbers are based on the International Classfication of
Diseases, Ninth Revision, Clinical Modification (ICD–9–CM)]
Category of first-listed diagnosis and ICD–9–CM code
United
States
Northeast
All conditions . . . . . . . . . . . . . . . . . . . . . . . . . . . . . . . . . . . . . . . . . . . . . . . . .
4.8
5.3
Infectious and parasitic diseases . . . . . . . . . . . . . . . . . . . . . . . . . . . . . . . .001–139
Septicemia . . . . . . . . . . . . . . . . . . . . . . . . . . . . . . . . . . . . . . . . . . . . . . .038
Neoplasms . . . . . . . . . . . . . . . . . . . . . . . . . . . . . . . . . . . . . . . . . . . . .140–239
Malignant neoplasms . . . . . . . . . . . . . . . . . . . . . . . . . . . . . . . .140–208,230–234
Malignant neoplasm of large intestine and rectum. . . . . . . . . . . . . . .153–154,197.5
Malignant neoplasm of trachea, bronchus, and lung. . . . . . . . .162,176.4,197.0,197.3
Benign neoplasms . . . . . . . . . . . . . . . . . . . . . . . . . . . . . . . . . . . . . . .210–229
Benign neoplasm of uterus. . . . . . . . . . . . . . . . . . . . . . . . . . . . . . . . .218–219
Endocrine, nutritional and metabolic diseases, and immunity disorders . . . . . . . .240–279
Diabetes mellitus . . . . . . . . . . . . . . . . . . . . . . . . . . . . . . . . . . . . . . . . . . .250
Volume depletion . . . . . . . . . . . . . . . . . . . . . . . . . . . . . . . . . . . . . . . . . .276.5
Diseases of the blood and blood-forming organs . . . . . . . . . . . . . . . . . . . . . .280–289
Anemias . . . . . . . . . . . . . . . . . . . . . . . . . . . . . . . . . . . . . . . . . . . . .280–285
Mental disorders . . . . . . . . . . . . . . . . . . . . . . . . . . . . . . . . . . . . . . . . . .290–319
Psychoses . . . . . . . . . . . . . . . . . . . . . . . . . . . . . . . . . . . . . . . . . . . .290–299
Schizophrenic disorders. . . . . . . . . . . . . . . . . . . . . . . . . . . . . . . . . . . . . .295
Major depressive disorder . . . . . . . . . . . . . . . . . . . . . . . . . . . . . . .296.2–296.3
Diseases of the nervous system and sense organs . . . . . . . . . . . . . . . . . . . .320–389
Diseases of the circulatory system . . . . . . . . . . . . . . . . . . . . . . . . . . . . . . .390–459
Essential hypertension . . . . . . . . . . . . . . . . . . . . . . . . . . . . . . . . . . . . . . . .401
Heart disease . . . . . . . . . . . . . . . . . .391–392.0,393–398,402,404,410–416,420–429
Acute myocardial infarction. . . . . . . . . . . . . . . . . . . . . . . . . . . . . . . . . . . .410
Coronary atherosclerosis . . . . . . . . . . . . . . . . . . . . . . . . . . . . . . . . . . . .414.0
Other ischemic heart disease . . . . . . . . . . . . . . . . . . . . . . .411–413,414.1–414.9
Cardiac dysrhythmias . . . . . . . . . . . . . . . . . . . . . . . . . . . . . . . . . . . . . . .427
Congestive heart failure . . . . . . . . . . . . . . . . . . . . . . . . . . . .428.0,428.2–428.4
Cerebrovascular disease . . . . . . . . . . . . . . . . . . . . . . . . . . . . . . . . . . .430–438
Diseases of the respiratory system . . . . . . . . . . . . . . . . . . . . . . . . . . . . . .460–519
Acute bronchitis and bronchiolitis . . . . . . . . . . . . . . . . . . . . . . . . . . . . . . . . .466
Pneumonia . . . . . . . . . . . . . . . . . . . . . . . . . . . . . . . . . . . . . . . . . . . .480–486
Chronic bronchitis . . . . . . . . . . . . . . . . . . . . . . . . . . . . . . . . . . . . . . . . . . .491
Asthma . . . . . . . . . . . . . . . . . . . . . . . . . . . . . . . . . . . . . . . . . . . . . . . . .493
Diseases of the digestive system. . . . . . . . . . . . . . . . . . . . . . . . . . . . . . . .520–579
Appendicitis . . . . . . . . . . . . . . . . . . . . . . . . . . . . . . . . . . . . . . . . . . .540–543
Noninfectious enteritis and colitis . . . . . . . . . . . . . . . . . . . . . . . . . . . . . .555–558
Intestinal obstruction . . . . . . . . . . . . . . . . . . . . . . . . . . . . . . . . . . . . . . . . .560
Diverticula of intestine . . . . . . . . . . . . . . . . . . . . . . . . . . . . . . . . . . . . . . . .562
Cholelithiasis . . . . . . . . . . . . . . . . . . . . . . . . . . . . . . . . . . . . . . . . . . . . . .574
Acute pancreatitis. . . . . . . . . . . . . . . . . . . . . . . . . . . . . . . . . . . . . . . . . .577.0
Diseases of the genitourinary system . . . . . . . . . . . . . . . . . . . . . . . . . . . . .580–629
Calculus of kidney and ureter. . . . . . . . . . . . . . . . . . . . . . . . . . . . . . . . . . . .592
Urinary tract infection . . . . . . . . . . . . . . . . . . . . . . . . . . . . . . . . . . . . . . .599.0
Complications of pregnancy, childbirth, and the puerperium1 . . . . . . . . . . . . . . .630–677
Diseases of the skin and subcutaneous tissue . . . . . . . . . . . . . . . . . . . . . . .680–709
Cellulitis and abscess . . . . . . . . . . . . . . . . . . . . . . . . . . . . . . . . . . . . .681–682
Diseases of the musculoskeletal system and connective tissue . . . . . . . . . . . . .710–739
Osteoarthrosis and allied disorders . . . . . . . . . . . . . . . . . . . . . . . . . . . . . . . .715
Intervertebral disc disorders. . . . . . . . . . . . . . . . . . . . . . . . . . . . . . . . . . . . .722
Congenital anomalies . . . . . . . . . . . . . . . . . . . . . . . . . . . . . . . . . . . . . . .740–759
Certain conditions originating in the perinatal period . . . . . . . . . . . . . . . . . . . .760–779
Symptoms, signs, and ill-defined conditions . . . . . . . . . . . . . . . . . . . . . . . . .780–799
Injury and poisoning. . . . . . . . . . . . . . . . . . . . . . . . . . . . . . . . . . . . . . . .800–999
Fractures, all sites2 . . . . . . . . . . . . . . . . . . . . . . . . . . . . . . . . . . . . . . .800–829
Fracture of neck of femur2 . . . . . . . . . . . . . . . . . . . . . . . . . . . . . . . . . . . .820
Poisonings . . . . . . . . . . . . . . . . . . . . . . . . . . . . . . . . . . . . . . . . . . . .960–989
Certain complications of surgical and medical care . . . . . . . . . . . . . . . . . . .996–999
Supplementary classifications . . . . . . . . . . . . . . . . . . . . . . . . . . . . . . . . .V01–V85
Females with deliveries . . . . . . . . . . . . . . . . . . . . . . . . . . . . . . . . . . . . . . .V27
6.7
8.7
5.8
6.5
7.8
7.2
3.3
2.4
3.9
4.7
3.5
4.3
4.0
7.0
7.7
11.7
6.7
5.7
4.5
2.2
4.4
5.4
3.2
2.5
3.4
5.1
4.9
5.1
3.2
5.1
4.7
3.2
4.6
3.1
4.2
6.2
4.8
3.8
5.2
3.9
2.4
4.6
2.7
4.9
4.4
3.9
3.8
3.1
6.3
10.7
2.4
5.4
5.3
6.2
2.9
6.1
3.8
2.6
7.2
10.0
6.3
7.1
8.8
7.8
3.6
2.4
4.4
5.1
3.8
4.6
4.3
8.5
9.6
14.8
8.7
5.3
4.8
2.6
4.7
5.5
3.3
2.5
3.8
5.6
5.3
5.4
3.1
5.6
5.0
3.4
5.0
3.0
4.4
6.5
5.4
4.2
5.6
4.4
2.4
5.3
2.8
5.4
4.6
4.2
3.9
3.6
5.8
8.4
2.3
5.5
5.5
6.9
3.1
6.3
4.2
2.9
Midwest
South
West
4.2
4.9
4.6
6.0
7.4
5.0
5.5
6.8
6.3
3.0
2.3
3.6
4.0
3.5
4.0
3.5
5.4
5.9
9.9
5.2
4.4
4.1
2.0
4.1
5.3
2.9
2.2
3.2
4.7
4.1
4.4
2.8
4.5
4.0
2.9
4.1
2.9
3.5
4.8
4.3
3.3
4.7
3.5
2.3
4.1
2.6
4.7
4.3
3.7
3.7
3.3
10.3
6.8
2.7
4.6
4.7
5.6
2.6
5.4
3.6
2.5
6.7
8.7
6.4
7.3
8.2
7.7
3.4
2.5
4.0
5.1
3.4
4.3
4.3
7.0
7.6
10.5
6.7
4.9
4.6
2.2
4.5
5.6
3.5
2.7
3.4
5.3
5.2
5.3
2.9
5.4
5.0
3.5
4.9
3.4
4.5
7.0
5.1
4.0
5.3
4.0
2.5
4.8
2.7
4.8
4.5
3.9
3.7
2.7
5.2
10.2
2.4
6.1
6.1
6.3
3.1
6.7
3.7
2.7
6.7
8.8
5.2
5.9
7.3
6.5
3.2
2.3
3.4
3.9
3.1
4.1
3.4
6.4
7.1
10.8
6.0
9.4
4.2
1.8
4.1
5.3
3.0
2.7
3.1
4.7
5.0
5.0
4.1
5.2
4.1
2.7
4.4
3.0
4.7
6.2
3.9
3.5
5.4
3.7
2.5
4.3
3.0
4.7
4.4
3.7
3.7
3.1
6.3
13.2
2.1
5.0
4.8
5.8
2.7
5.5
3.8
2.5
Average length of stay in days
1
First-listed diagnosis for females with deliveries is coded as V27, shown under ‘‘Supplementary classifications.’’
2
Excludes fractures coded as 733.1, ‘‘pathologic fracture.’’
Page 32 [ Series 13, No. 168
Table 20. Number of all-listed diagnoses for discharges from short-stay hospitals, by age and diagnosis: United States, 2006
[Discharges of inpatients from nonfederal hospitals. Excludes newborn infants. Diagnostic groupings and code numbers are based on the International Classfication of
Diseases, Ninth Revision, Clinical Modification (ICD–9–CM)]
All-listed diagnoses and ICD–9–CM code
All
ages
Under
15 years
All conditions . . . . . . . . . . . . . . . . . . . . . . . . . . . . . . . . . . . . . . . . . . . . . . . . .
174,522
7,103
Infectious and parasitic diseases . . . . . . . . . . . . . . . . . . . . . . . . . . . . . . . .001–139
Septicemia . . . . . . . . . . . . . . . . . . . . . . . . . . . . . . . . . . . . . . . . . . . . . . .038
Neoplasms . . . . . . . . . . . . . . . . . . . . . . . . . . . . . . . . . . . . . . . . . . . . .140–239
Malignant neoplasms . . . . . . . . . . . . . . . . . . . . . . . . . . . . . . . .140–208,230–234
Malignant neoplasm of large intestine and rectum. . . . . . . . . . . . . . .153–154,197.5
Malignant neoplasm of trachea, bronchus, and lung. . . . . . . . .162,176.4,197.0,197.3
Benign neoplasms . . . . . . . . . . . . . . . . . . . . . . . . . . . . . . . . . . . . . . .210–229
Benign neoplasm of uterus. . . . . . . . . . . . . . . . . . . . . . . . . . . . . . . . .218–219
Endocrine, nutritional and metabolic diseases, and immunity disorders . . . . . . . .240–279
Diabetes mellitus . . . . . . . . . . . . . . . . . . . . . . . . . . . . . . . . . . . . . . . . . . .250
Volume depletion . . . . . . . . . . . . . . . . . . . . . . . . . . . . . . . . . . . . . . . . . .276.5
Diseases of the blood and blood-forming organs . . . . . . . . . . . . . . . . . . . . . .280–289
Anemias . . . . . . . . . . . . . . . . . . . . . . . . . . . . . . . . . . . . . . . . . . . . .280–285
Mental disorders . . . . . . . . . . . . . . . . . . . . . . . . . . . . . . . . . . . . . . . . . .290–319
Psychoses . . . . . . . . . . . . . . . . . . . . . . . . . . . . . . . . . . . . . . . . . . . .290–299
Schizophrenic disorders. . . . . . . . . . . . . . . . . . . . . . . . . . . . . . . . . . . . . .295
Major depressive disorder . . . . . . . . . . . . . . . . . . . . . . . . . . . . . . .296.2–296.3
Diseases of the nervous system and sense organs . . . . . . . . . . . . . . . . . . . .320–389
Diseases of the circulatory system . . . . . . . . . . . . . . . . . . . . . . . . . . . . . . .390–459
Essential hypertension . . . . . . . . . . . . . . . . . . . . . . . . . . . . . . . . . . . . . . . .401
Heart disease . . . . . . . . . . . . . . . . . .391–392.0,393–398,402,404,410–416,420–429
Acute myocardial infarction. . . . . . . . . . . . . . . . . . . . . . . . . . . . . . . . . . . .410
Coronary atherosclerosis . . . . . . . . . . . . . . . . . . . . . . . . . . . . . . . . . . . .414.0
Other ischemic heart disease . . . . . . . . . . . . . . . . . . . . . . .411–413,414.1–414.9
Cardiac dysrhythmias . . . . . . . . . . . . . . . . . . . . . . . . . . . . . . . . . . . . . . .427
Congestive heart failure . . . . . . . . . . . . . . . . . . . . . . . . . . . .428.0,428.2–428.4
Cerebrovascular disease . . . . . . . . . . . . . . . . . . . . . . . . . . . . . . . . . . .430–438
Diseases of the respiratory system . . . . . . . . . . . . . . . . . . . . . . . . . . . . . .460–519
Acute bronchitis and bronchiolitis . . . . . . . . . . . . . . . . . . . . . . . . . . . . . . . . .466
Pneumonia . . . . . . . . . . . . . . . . . . . . . . . . . . . . . . . . . . . . . . . . . . . .480–486
Chronic bronchitis . . . . . . . . . . . . . . . . . . . . . . . . . . . . . . . . . . . . . . . . . . .491
Asthma . . . . . . . . . . . . . . . . . . . . . . . . . . . . . . . . . . . . . . . . . . . . . . . . .493
Diseases of the digestive system. . . . . . . . . . . . . . . . . . . . . . . . . . . . . . . .520–579
Appendicitis . . . . . . . . . . . . . . . . . . . . . . . . . . . . . . . . . . . . . . . . . . .540–543
Noninfectious enteritis and colitis . . . . . . . . . . . . . . . . . . . . . . . . . . . . . .555–558
Intestinal obstruction . . . . . . . . . . . . . . . . . . . . . . . . . . . . . . . . . . . . . . . . .560
Diverticula of intestine . . . . . . . . . . . . . . . . . . . . . . . . . . . . . . . . . . . . . . . .562
Cholelithiasis . . . . . . . . . . . . . . . . . . . . . . . . . . . . . . . . . . . . . . . . . . . . . .574
Acute pancreatitis. . . . . . . . . . . . . . . . . . . . . . . . . . . . . . . . . . . . . . . . . .577.0
Diseases of the genitourinary system . . . . . . . . . . . . . . . . . . . . . . . . . . . . .580–629
Calculus of kidney and ureter. . . . . . . . . . . . . . . . . . . . . . . . . . . . . . . . . . . .592
Urinary tract infection . . . . . . . . . . . . . . . . . . . . . . . . . . . . . . . . . . . . . . . . .599.0
Complications of pregnancy, childbirth, and the puerperium1 . . . . . . . . . . . . . . .630–677
Diseases of the skin and subcutaneous tissue . . . . . . . . . . . . . . . . . . . . . . .680–709
Cellulitis and abscess . . . . . . . . . . . . . . . . . . . . . . . . . . . . . . . . . . . . .681–682
Diseases of the musculoskeletal system and connective tissue . . . . . . . . . . . . .710–739
Osteoarthrosis and allied disorders . . . . . . . . . . . . . . . . . . . . . . . . . . . . . . . .715
Intervertebral disc disorders. . . . . . . . . . . . . . . . . . . . . . . . . . . . . . . . . . . . .722
Congenital anomalies . . . . . . . . . . . . . . . . . . . . . . . . . . . . . . . . . . . . . . .740–759
Certain conditions originating in the perinatal period . . . . . . . . . . . . . . . . . . . .760–779
Symptoms, signs, and ill-defined conditions . . . . . . . . . . . . . . . . . . . . . . . . .780–799
Injury and poisoning. . . . . . . . . . . . . . . . . . . . . . . . . . . . . . . . . . . . . . . .800–999
Fractures, all sites2 . . . . . . . . . . . . . . . . . . . . . . . . . . . . . . . . . . . . . . .800–829
Fracture of neck of femur2 . . . . . . . . . . . . . . . . . . . . . . . . . . . . . . . . . . . .820
Poisonings . . . . . . . . . . . . . . . . . . . . . . . . . . . . . . . . . . . . . . . . . . . .960–989
Certain complications of surgical and medical care . . . . . . . . . . . . . . . . . . .996–999
Supplementary classifications . . . . . . . . . . . . . . . . . . . . . . . . . . . . . . . . . .V01-V85
Females with deliveries . . . . . . . . . . . . . . . . . . . . . . . . . . . . . . . . . . . . . . .V27
4,364
910
4,495
3,449
268
488
879
445
20,812
5,501
2,596
5,189
3,885
13,115
4,148
592
631
4,337
35,396
9,058
19,842
838
4,213
1,935
4,520
4,214
1,895
12,209
355
2,254
1,147
1,911
11,233
353
719
792
642
570
333
10,007
299
2,350
10,602
2,725
1,257
7,090
1,774
605
758
646
8,918
7,416
1,733
368
473
2,209
15,209
4,127
439
25
115
93
*
*
*
*
590
36
299
186
99
372
119
*
*
366
163
18
97
*
*
*
33
14
11
1,118
190
241
*
317
533
75
100
33
*
*5
4
167
*
52
*22
207
77
94
*
*
429
642
729
431
88
*2
23
78
499
*
15–44
years
45–64
years
65 years
and over
43,409
45,764
78,246
979
95
600
290
13
24
291
216
2,810
653
359
1,113
837
5,536
1,492
251
335
751
2,229
759
956
43
119
94
203
140
89
1,503
26
219
38
513
2,312
183
184
117
60
179
110
2,023
106
238
10,547
584
320
1,047
68
161
138
*
1,958
2,205
481
9
286
416
7,069
4,112
1,223
250
1,591
1,187
87
158
364
215
6,564
1,937
519
1,324
928
4,203
1,038
243
197
1,151
9,560
2,999
4,809
269
1,247
688
817
842
471
3,111
51
476
323
568
3,613
70
186
241
177
165
128
2,640
113
434
32
806
415
2,212
513
264
112
*
2,620
1,981
379
32
119
744
3,019
9
1,724
541
2,188
1,879
167
304
206
14
10,848
2,876
1,419
2,565
2,021
3,004
1,498
97
75
2,068
23,445
5,281
13,980
524
2,843
1,150
3,468
3,218
1,325
6,477
88
1,318
785
514
4,775
24
249
401
405
221
91
5,177
78
1,627
...
1,128
446
3,736
1,192
178
78
*
3,611
2,800
784
324
45
971
4,622
...
Number in thousands
* Figure does not meet standards of reliability or precision.
. . . Category not applicable.
1
First-listed diagnosis for females with deliveries is coded as V27, shown under ‘‘Supplementary classifications.’’
2
Excludes fractures coded as 733.1, ‘‘pathologic fracture.’’
Series 13, No. 168 [ Page 33
Table 21. Number of all-listed diagnoses for discharges from short-stay hospitals, by sex and diagnosis: United States, 2006
[Discharges of inpatients from nonfederal hospitals. Excludes newborn infants. Diagnostic groupings and code numbers are based on the International Classfication of
Diseases, Ninth Revision, Clinical Modification (ICD–9–CM)]
All-listed diagnoses and ICD–9–CM code
Both
sexes
All conditions . . . . . . . . . . . . . . . . . . . . . . . . . . . . . . . . . . . . . . . . . . . . . . . . .
174,522
71,673
102,849
Infectious and parasitic diseases . . . . . . . . . . . . . . . . . . . . . . . . . . . . . . . .001–139
Septicemia . . . . . . . . . . . . . . . . . . . . . . . . . . . . . . . . . . . . . . . . . . . . . . .038
Neoplasms . . . . . . . . . . . . . . . . . . . . . . . . . . . . . . . . . . . . . . . . . . . . .140–239
Malignant neoplasms . . . . . . . . . . . . . . . . . . . . . . . . . . . . . . . .140–208,230–234
Malignant neoplasm of large intestine and rectum. . . . . . . . . . . . . . .153–154,197.5
Malignant neoplasm of trachea, bronchus, and lung. . . . . . . . .162,176.4,197.0,197.3
Benign neoplasms . . . . . . . . . . . . . . . . . . . . . . . . . . . . . . . . . . . . . . .210–229
Benign neoplasm of uterus. . . . . . . . . . . . . . . . . . . . . . . . . . . . . . . . .218–219
Endocrine, nutritional and metabolic diseases, and immunity disorders . . . . . . . .240–279
Diabetes mellitus . . . . . . . . . . . . . . . . . . . . . . . . . . . . . . . . . . . . . . . . . . .250
Volume depletion . . . . . . . . . . . . . . . . . . . . . . . . . . . . . . . . . . . . . . . . . .276.5
Diseases of the blood and blood-forming organs . . . . . . . . . . . . . . . . . . . . . .280–289
Anemias . . . . . . . . . . . . . . . . . . . . . . . . . . . . . . . . . . . . . . . . . . . . .280–285
Mental disorders . . . . . . . . . . . . . . . . . . . . . . . . . . . . . . . . . . . . . . . . . .290–319
Psychoses . . . . . . . . . . . . . . . . . . . . . . . . . . . . . . . . . . . . . . . . . . . .290–299
Schizophrenic disorders. . . . . . . . . . . . . . . . . . . . . . . . . . . . . . . . . . . . . .295
Major depressive disorder . . . . . . . . . . . . . . . . . . . . . . . . . . . . . . .296.2–296.3
Diseases of the nervous system and sense organs . . . . . . . . . . . . . . . . . . . .320–389
Diseases of the circulatory system . . . . . . . . . . . . . . . . . . . . . . . . . . . . . . .390–459
Essential hypertension . . . . . . . . . . . . . . . . . . . . . . . . . . . . . . . . . . . . . . . .401
Heart disease . . . . . . . . . . . . . . . . . .391–392.0,393–398,402,404,410–416,420–429
Acute myocardial infarction. . . . . . . . . . . . . . . . . . . . . . . . . . . . . . . . . . . .410
Coronary atherosclerosis . . . . . . . . . . . . . . . . . . . . . . . . . . . . . . . . . . . .414.0
Other ischemic heart disease . . . . . . . . . . . . . . . . . . . . . . .411–413,414.1–414.9
Cardiac dysrhythmias . . . . . . . . . . . . . . . . . . . . . . . . . . . . . . . . . . . . . . .427
Congestive heart failure . . . . . . . . . . . . . . . . . . . . . . . . . . . .428.0,428.2–428.4
Cerebrovascular disease . . . . . . . . . . . . . . . . . . . . . . . . . . . . . . . . . . .430–438
Diseases of the respiratory system . . . . . . . . . . . . . . . . . . . . . . . . . . . . . .460–519
Acute bronchitis and bronchiolitis . . . . . . . . . . . . . . . . . . . . . . . . . . . . . . . . .466
Pneumonia . . . . . . . . . . . . . . . . . . . . . . . . . . . . . . . . . . . . . . . . . . . .480–486
Chronic bronchitis . . . . . . . . . . . . . . . . . . . . . . . . . . . . . . . . . . . . . . . . . . .491
Asthma . . . . . . . . . . . . . . . . . . . . . . . . . . . . . . . . . . . . . . . . . . . . . . . . .493
Diseases of the digestive system. . . . . . . . . . . . . . . . . . . . . . . . . . . . . . . .520–579
Appendicitis . . . . . . . . . . . . . . . . . . . . . . . . . . . . . . . . . . . . . . . . . . .540–543
Noninfectious enteritis and colitis . . . . . . . . . . . . . . . . . . . . . . . . . . . . . .555–558
Intestinal obstruction . . . . . . . . . . . . . . . . . . . . . . . . . . . . . . . . . . . . . . . . .560
Diverticula of intestine . . . . . . . . . . . . . . . . . . . . . . . . . . . . . . . . . . . . . . . .562
Cholelithiasis . . . . . . . . . . . . . . . . . . . . . . . . . . . . . . . . . . . . . . . . . . . . . .574
Acute pancreatitis. . . . . . . . . . . . . . . . . . . . . . . . . . . . . . . . . . . . . . . . . .577.0
Diseases of the genitourinary system . . . . . . . . . . . . . . . . . . . . . . . . . . . . .580–629
Calculus of kidney and ureter. . . . . . . . . . . . . . . . . . . . . . . . . . . . . . . . . . . .592
Urinary tract infection . . . . . . . . . . . . . . . . . . . . . . . . . . . . . . . . . . . . . . .599.0
Complications of pregnancy, childbirth, and the puerperium1 . . . . . . . . . . . . . . .630–677
Diseases of the skin and subcutaneous tissue . . . . . . . . . . . . . . . . . . . . . . .680–709
Cellulitis and abscess . . . . . . . . . . . . . . . . . . . . . . . . . . . . . . . . . . . . .681–682
Diseases of the musculoskeletal system and connective tissue . . . . . . . . . . . . .710–739
Osteoarthrosis and allied disorders . . . . . . . . . . . . . . . . . . . . . . . . . . . . . . . .715
Intervertebral disc disorders. . . . . . . . . . . . . . . . . . . . . . . . . . . . . . . . . . . . .722
Congenital anomalies . . . . . . . . . . . . . . . . . . . . . . . . . . . . . . . . . . . . . . .740–759
Certain conditions originating in the perinatal period . . . . . . . . . . . . . . . . . . . .760–779
Symptoms, signs, and ill-defined conditions . . . . . . . . . . . . . . . . . . . . . . . . .780–799
Injury and poisoning. . . . . . . . . . . . . . . . . . . . . . . . . . . . . . . . . . . . . . . .800–999
Fractures, all sites2 . . . . . . . . . . . . . . . . . . . . . . . . . . . . . . . . . . . . . . .800–829
Fracture of neck of femur2 . . . . . . . . . . . . . . . . . . . . . . . . . . . . . . . . . . . .820
Poisonings . . . . . . . . . . . . . . . . . . . . . . . . . . . . . . . . . . . . . . . . . . . .960–989
Certain complications of surgical and medical care . . . . . . . . . . . . . . . . . . .996–999
Supplementary classifications . . . . . . . . . . . . . . . . . . . . . . . . . . . . . . . . . .V01-V85
Females with deliveries . . . . . . . . . . . . . . . . . . . . . . . . . . . . . . . . . . . . . . .V27
4,364
910
4,495
3,449
268
488
879
445
20,812
5,501
2,596
5,189
3,885
13,115
4,148
592
631
4,337
35,396
9,058
19,842
838
4,213
1,935
4,520
4,214
1,895
12,209
355
2,254
1,147
1,911
11,233
353
719
792
642
570
333
10,007
299
2,350
10,602
2,725
1,257
7,090
1,774
605
758
646
8,918
7,416
1,733
368
473
2,209
15,209
4,127
2,003
452
1,978
1,735
129
257
159
...
8,700
2,492
1,075
2,040
1,410
6,296
1,870
319
237
1,910
16,992
3,841
9,992
457
2,456
1,145
2,227
1,855
852
5,715
166
1,092
549
657
4,870
201
283
352
244
184
168
3,815
138
660
...
1,376
660
2,496
630
273
388
355
3,984
4,006
859
103
222
1,104
4,750
...
2,361
458
2,517
1,714
139
231
720
445
12,112
3,009
1,521
3,149
2,475
6,820
2,279
273
394
2,427
18,405
5,217
9,850
381
1,757
790
2,293
2,359
1,043
6,494
189
1,162
598
1,254
6,363
151
436
440
398
386
165
6,193
162
1,690
10,602
1,349
598
4,593
1,144
332
370
291
4,934
3,411
874
265
251
1,105
10,459
4,127
Male
Female
Number in thousands
. . . Category not applicable.
1
First-listed diagnosis for females with deliveries is coded as V27, shown under ‘‘Supplementary classifications.’’
2
Excludes fractures coded as 733.1, ‘‘pathologic fracture.’’
Page 34 [ Series 13, No. 168
Table 22. Number of all-listed diagnoses for discharges from short-stay hospitals, by geographic region and diagnosis: United States, 2006
[Discharges of inpatients from nonfederal hospitals. Excludes newborn infants. Diagnostic groupings and code numbers are based on the International Classfication of
Diseases, Ninth Revision, Clinical Modification (ICD–9–CM)]
All-listed diagnoses and ICD–9–CM code
United
States
Northeast
All conditions . . . . . . . . . . . . . . . . . . . . . . . . . . . . . . . . . . . . . . . . . . . . . . . . .
174,522
36,561
Infectious and parasitic diseases . . . . . . . . . . . . . . . . . . . . . . . . . . . . . . .001–139
Septicemia . . . . . . . . . . . . . . . . . . . . . . . . . . . . . . . . . . . . . . . . . . . . . . .038
Neoplasms . . . . . . . . . . . . . . . . . . . . . . . . . . . . . . . . . . . . . . . . . . . . .140–239
Malignant neoplasms . . . . . . . . . . . . . . . . . . . . . . . . . . . . . . . 140–208,230–234
Malignant neoplasm of large intestine and rectum . . . . . . . . . . . . . . 153–154,197.5
Malignant neoplasm of trachea, bronchus, and lung . . . . . . . . 162,176.4,197.0,197.3
Benign neoplasms . . . . . . . . . . . . . . . . . . . . . . . . . . . . . . . . . . . . . . 210–229
Benign neoplasm of uterus . . . . . . . . . . . . . . . . . . . . . . . . . . . . . . . .218–219
Endocrine, nutritional and metabolic diseases, and immunity disorders . . . . . . . .240–279
Diabetes mellitus . . . . . . . . . . . . . . . . . . . . . . . . . . . . . . . . . . . . . . . . . . .250
Volume depletion . . . . . . . . . . . . . . . . . . . . . . . . . . . . . . . . . . . . . . . . . .276.5
Diseases of the blood and blood-forming organs . . . . . . . . . . . . . . . . . . . . . 280–289
Anemias . . . . . . . . . . . . . . . . . . . . . . . . . . . . . . . . . . . . . . . . . . . . 280–285
Mental disorders . . . . . . . . . . . . . . . . . . . . . . . . . . . . . . . . . . . . . . . . .290–319
Psychoses . . . . . . . . . . . . . . . . . . . . . . . . . . . . . . . . . . . . . . . . . . . .290–299
Schizophrenic disorders . . . . . . . . . . . . . . . . . . . . . . . . . . . . . . . . . . . . . 295
Major depressive disorder . . . . . . . . . . . . . . . . . . . . . . . . . . . . . . 296.2–296.3
Diseases of the nervous system and sense organs . . . . . . . . . . . . . . . . . . . 320–389
Diseases of the circulatory system . . . . . . . . . . . . . . . . . . . . . . . . . . . . . . 390–459
Essential hypertension . . . . . . . . . . . . . . . . . . . . . . . . . . . . . . . . . . . . . . . 401
Heart disease. . . . . . . . . . . . . . . . . . 391–392.0,393–398,402,404,410–416,420–429
Acute myocardial infarction . . . . . . . . . . . . . . . . . . . . . . . . . . . . . . . . . . . 410
Coronary atherosclerosis . . . . . . . . . . . . . . . . . . . . . . . . . . . . . . . . . . . 414.0
Other ischemic heart disease. . . . . . . . . . . . . . . . . . . . . . . 411–413,414.1–414.9
Cardiac dysrhythmias . . . . . . . . . . . . . . . . . . . . . . . . . . . . . . . . . . . . . . 427
Congestive heart failure . . . . . . . . . . . . . . . . . . . . . . . . . . . . 428.0,428.2–428.4
Cerebrovascular disease . . . . . . . . . . . . . . . . . . . . . . . . . . . . . . . . . . 430–438
Diseases of the respiratory system . . . . . . . . . . . . . . . . . . . . . . . . . . . . . . 460–519
Acute bronchitis and bronchiolitis . . . . . . . . . . . . . . . . . . . . . . . . . . . . . . . . 466
Pneumonia . . . . . . . . . . . . . . . . . . . . . . . . . . . . . . . . . . . . . . . . . . . 480–486
Chronic bronchitis . . . . . . . . . . . . . . . . . . . . . . . . . . . . . . . . . . . . . . . . . . 491
Asthma . . . . . . . . . . . . . . . . . . . . . . . . . . . . . . . . . . . . . . . . . . . . . . . . 493
Diseases of the digestive system . . . . . . . . . . . . . . . . . . . . . . . . . . . . . . . 520–579
Appendicitis . . . . . . . . . . . . . . . . . . . . . . . . . . . . . . . . . . . . . . . . . . 540–543
Noninfectious enteritis and colitis . . . . . . . . . . . . . . . . . . . . . . . . . . . . . 555–558
Intestinal obstruction . . . . . . . . . . . . . . . . . . . . . . . . . . . . . . . . . . . . . . . . 560
Diverticula of intestine . . . . . . . . . . . . . . . . . . . . . . . . . . . . . . . . . . . . . . . 562
Cholelithiasis . . . . . . . . . . . . . . . . . . . . . . . . . . . . . . . . . . . . . . . . . . . . . 574
Acute pancreatitis . . . . . . . . . . . . . . . . . . . . . . . . . . . . . . . . . . . . . . . . . 577.0
Diseases of the genitourinary system . . . . . . . . . . . . . . . . . . . . . . . . . . . . .580–629
Calculus of kidney and ureter . . . . . . . . . . . . . . . . . . . . . . . . . . . . . . . . . . . 592
Urinary tract infection . . . . . . . . . . . . . . . . . . . . . . . . . . . . . . . . . . . . . . . 599.0
Complications of pregnancy, childbirth, and the puerperium1 . . . . . . . . . . . . . . 630–677
Diseases of the skin and subcutaneous tissue . . . . . . . . . . . . . . . . . . . . . . 680–709
Cellulitis and abscess . . . . . . . . . . . . . . . . . . . . . . . . . . . . . . . . . . . . 681–682
Diseases of the musculoskeletal system and connective tissue . . . . . . . . . . . . 710–739
Osteoarthrosis and allied disorders . . . . . . . . . . . . . . . . . . . . . . . . . . . . . . . .715
Intervertebral disc disorders . . . . . . . . . . . . . . . . . . . . . . . . . . . . . . . . . . . . 722
Congenital anomalies . . . . . . . . . . . . . . . . . . . . . . . . . . . . . . . . . . . . . . 740–759
Certain conditions originating in the perinatal period . . . . . . . . . . . . . . . . . . . 760–779
Symptoms, signs, and ill-defined conditions . . . . . . . . . . . . . . . . . . . . . . . . 780–799
Injury and poisoning . . . . . . . . . . . . . . . . . . . . . . . . . . . . . . . . . . . . . . . 800–999
Fractures, all sites2 . . . . . . . . . . . . . . . . . . . . . . . . . . . . . . . . . . . . . . 800–829
Fracture of neck of femur2 . . . . . . . . . . . . . . . . . . . . . . . . . . . . . . . . . . . 820
Poisonings . . . . . . . . . . . . . . . . . . . . . . . . . . . . . . . . . . . . . . . . . . . 960–989
Certain complications of surgical and medical care . . . . . . . . . . . . . . . . . . 996–999
Supplementary classifications . . . . . . . . . . . . . . . . . . . . . . . . . . . . . . . . . V01–V85
Females with deliveries . . . . . . . . . . . . . . . . . . . . . . . . . . . . . . . . . . . . . . V27
4,364
910
4,495
3,449
268
488
879
445
20,812
5,501
2,596
5,189
3,885
13,115
4,148
592
631
4,337
35,396
9,058
19,842
838
4,213
1,935
4,520
4,214
1,895
12,209
355
2,254
1,147
1,911
11,233
353
719
792
642
570
333
10,007
299
2,350
10,602
2,725
1,257
7,090
1,774
605
758
646
8,918
7,416
1,733
368
473
2,209
15,209
4,127
937
183
968
762
55
104
170
84
4,380
1,227
487
1,001
735
3,209
1,024
168
127
953
7,807
1,999
4,463
188
960
424
1,014
908
378
2,610
64
440
244
499
2,331
66
151
143
140
116
60
2,002
67
483
1,671
609
272
1,451
372
106
179
92
1,885
1,459
317
74
97
506
3,018
618
* Figure does not meet standards of reliability or precision.
1
First-listed diagnosis for females with deliveries is coded as V27, shown under ‘‘Supplementary classifications.’’
Excludes fractures coded as 733.1, ‘‘pathologic fracture.’’
2
Midwest
Number in thousands
42,612
869
209
1,055
825
70
129
184
93
5,248
1,306
643
1,276
976
3,323
1,013
107
159
1,080
9,164
2,293
5,264
210
1,138
501
1,244
1,169
485
3,024
74
610
276
439
2,726
79
187
200
183
123
76
2,392
79
569
2,227
621
285
1,917
520
155
102
*
2,359
1,717
440
100
122
469
3,456
849
South
West
63,874
31,476
1,679
345
1,624
1,221
95
179
347
177
7,658
2,098
1,012
1,944
1,454
4,734
1,573
246
289
1,517
12,744
3,346
7,019
282
1,508
716
1,506
1,527
662
4,501
142
807
478
640
4,136
111
259
299
217
229
135
3,786
113
882
4,081
1,046
484
2,422
597
219
238
225
3,143
2,742
625
135
156
812
5,653
1,613
880
172
848
641
48
76
177
92
3,526
871
453
969
720
1,850
539
72
57
786
5,682
1,420
3,096
157
607
295
757
610
370
2,074
*
396
149
333
2,040
96
123
151
102
102
62
1,827
40
416
2,622
449
216
1,300
284
125
*
*
1,531
1,498
351
59
99
421
3,083
1,047
Series 13, No. 168 [ Page 35
Table 23. Number and rate of discharges from short-stay hospitals with a human immunodeficiency virus diagnosis, by selected
characteristics: United States, selected years 1990–2006
[Discharges of inpatients from nonfederal hospitals. Excludes newborn infants. Data are for discharges with at least one of the following International Classification of
Diseases, Ninth Revision, Clinical Modification (ICD–9–CM) codes: 042–044, 279.19, 795.8 (prior to 1995); 042, V08 (beginning in 1995)]
Characteristic
1990
1995
2000
2001
2002
146
249
173
185
189
114
32
183
66
115
58
115
70
2003
2004
2005
2006
207
204
185
223
124
65
136
71
132
73
113
72
145
78
Number in thousands
All HIV discharges1 . . . . . . . . . . . . . . . . . . . . . . . . . .
Sex
Male . . . . . . . . . . . . . . . . . . . . . . . . . . . . . . . . . . .
Female . . . . . . . . . . . . . . . . . . . . . . . . . . . . . . . . . .
Age
Under 25 years . .
25–29 years . . . .
30–34 years . . . .
35–39 years . . . .
40–44 years . . . .
45 years and over
.
.
.
.
.
.
.
.
.
.
.
.
.
.
.
.
.
.
.
.
.
.
.
.
.
.
.
.
.
.
Northeast
Midwest .
South . . .
West . . .
.
.
.
.
.
.
.
.
.
.
.
.
.
.
.
.
.
.
.
.
.
.
.
.
.
.
.
.
.
.
.
.
.
.
.
.
.
.
.
.
.
.
.
.
.
.
.
.
.
.
.
.
.
.
.
.
.
.
.
.
.
.
.
.
.
.
.
.
.
.
.
.
.
.
.
.
.
.
.
.
.
.
.
.
.
.
.
.
.
.
.
.
.
.
.
.
.
.
.
.
.
.
.
.
.
.
.
.
.
.
.
.
.
.
.
.
.
.
.
.
.
.
.
.
.
.
.
.
.
.
.
.
.
.
.
.
.
.
.
.
.
.
.
.
.
.
.
.
.
.
.
.
14
20
38
36
17
21
17
26
48
59
49
51
7
11
28
35
34
58
10
8
28
41
43
56
10
11
23
35
42
68
9
13
21
38
38
87
10
8
15
35
46
90
8
9
11
26
45
85
6
13
17
26
61
99
.
.
.
.
.
.
.
.
.
.
.
.
.
.
.
.
.
.
.
.
.
.
.
.
.
.
.
.
.
.
.
.
.
.
.
.
.
.
.
.
.
.
.
.
.
.
.
.
.
.
.
.
.
.
.
.
.
.
.
.
.
.
.
.
.
.
.
.
66
20
37
24
95
27
87
41
68
20
64
21
61
18
86
21
57
20
81
31
70
17
94
27
67
21
99
17
71
18
79
17
70
20
107
27
Region
.
.
.
.
.
.
.
.
.
.
.
.
.
.
.
.
.
.
.
.
.
.
.
.
.
.
.
.
.
.
.
.
.
.
.
.
.
.
.
.
Rate per 100,000 population2
1
All HIV discharges . . . . . . . . . . . . . . . . . . . . . . . . . .
58.1
93.9
61.6
65.2
65.8
71.6
69.9
62.6
74.9
93.4
24.7
141.6
48.4
83.9
40.1
82.8
48.2
88.5
44.1
95.9
48.2
91.7
48.9
77.7
48.1
99.3
51.4
Sex
Male . . . . . . . . . . . . . . . . . . . . . . . . . . . . . . . . . . .
Female . . . . . . . . . . . . . . . . . . . . . . . . . . . . . . . . . .
Age
Under 25 years . .
25–29 years . . . .
30–34 years . . . .
35–39 years . . . .
40–44 years . . . .
45 years and over
.
.
.
.
.
.
.
.
.
.
.
.
.
.
.
.
.
.
.
.
.
.
.
.
.
.
.
.
.
.
Northeast
Midwest .
South . . .
West . . .
.
.
.
.
.
.
.
.
.
.
.
.
.
.
.
.
.
.
.
.
.
.
.
.
.
.
.
.
.
.
.
.
.
.
.
.
.
.
.
.
.
.
.
.
.
.
.
.
.
.
.
.
.
.
.
.
.
.
.
.
.
.
.
.
.
.
.
.
.
.
.
.
.
.
.
.
.
.
.
.
.
.
.
.
.
.
.
.
.
.
.
.
.
.
.
.
.
.
.
.
.
.
.
.
.
.
.
.
.
.
.
.
.
.
.
.
.
.
.
.
.
.
.
.
.
.
.
.
.
.
.
.
.
.
.
.
.
.
.
.
.
.
.
.
.
.
.
.
.
.
.
.
14.8
95.1
172.8
179.0
94.8
27.4
17.6
132.2
216.2
262.7
241.4
60.2
7.5
56.6
134.9
154.4
152.6
59.8
10.1
41.3
137.6
182.9
187.4
55.8
9.5
57.5
113.0
159.7
185.2
66.6
8.9
71.3
104.6
180.8
166.6
83.1
10.2
38.9
71.9
168.3
201.3
84.6
8.2
43.3
56.6
125.8
197.6
77.9
5.9
65.3
88.6
125.3
272.8
88.6
.
.
.
.
.
.
.
.
.
.
.
.
.
.
.
.
.
.
.
.
.
.
.
.
.
.
.
.
.
.
.
.
.
.
.
.
.
.
.
.
.
.
.
.
.
.
.
.
.
.
.
.
.
.
.
.
.
.
.
.
.
.
.
.
.
.
.
.
128.8
33.6
42.1
44.1
183.3
43.5
93.1
69.5
126.6
30.8
64.2
33.4
112.3
27.9
84.5
32.6
107.9
31.7
81.7
49.9
129.4
25.9
90.1
40.2
122.1
32.6
94.3
25.7
130.2
26.8
74.3
24.7
127.5
30.2
98.4
39.2
Region
.
.
.
.
.
.
.
.
.
.
.
.
.
.
.
.
.
.
.
.
.
.
.
.
.
.
.
.
.
.
.
.
.
.
.
.
.
.
.
.
1
HIV is human immunodeficiency virus.
Rates are based on the U.S. Census Bureau estimates of the civilian population. Populations for 1990–1995 were adjusted for the net underenumeration in the 1990 census. Populations for
2000–2006 were 2000-based postcensal estimates.
2
NOTE: HIV data are for discharges with an HIV diagnosis listed in any position among the coded diagnoses.
Page 36 [ Series 13, No. 168
Table 24. Annual average number and rate of discharges from short-stay hospitals with a first-listed injury diagnosis, by Barell injury
diagnosis matrix categories: United States, 2004–2006
[Discharges of inpatients from nonfederal hospitals. Excludes newborn infants. International Classification of Diseases, Ninth Revision, Clinical Modification code numbers
for Barell matrix categories are shown in Table III.]
Nature of injury
All body
regions
Traumatic
brain injury
Other head,
face, and
neck
Spinal
cord
1,964
1,041
18
49
240
93
9
8
65
*4
*
*
34
312
202
52
...
...
150
...
...
...
...
...
...
*
...
...
126
37
*
...
37
...
*
15
*
*
*
19
...
11
*8
...
...
*4
...
...
...
...
...
...
...
...
...
Vertebral
column
Torso
Upper
extremities
Lower
extremities
Other and
unspecified
252
165
*6
15
...
23
*7
*
*6
*
*
*
*
...
684
586
8
19
...
20
*
*
22
*
*
...
*
...
*
*
*
*
*
...
*
*
*
*
*
...
8.5
5.6
*0.2
0.5
...
0.8
*0.2
*
*0.2
*
*
*
*0.0
...
23.2
19.9
0.3
0.6
...
0.7
*
*0.0
0.7
*
*
...
*
...
*
*
*
*
*0.0
...
*
*
*
*0.0
*
...
Number in thousands1
All injuries . . . . . . . . . .
Fracture . . . . . . . . . . .
Dislocation . . . . . . . . .
Sprains and strains . . . .
Internal . . . . . . . . . . .
Open wound . . . . . . . .
Amputation . . . . . . . . .
Blood vessels . . . . . . .
Contusions and superficial
Crush . . . . . . . . . . . .
Burns . . . . . . . . . . . .
Nerves and spinal cord . .
Unspecified . . . . . . . . .
System-wide . . . . . . . .
. . . . .
. . . . .
. . . . .
. . . . .
. . . . .
. . . . .
. . . . .
. . . . .
injuries
. . . . .
. . . . .
. . . . .
. . . . .
. . . . .
.
.
.
.
.
.
.
.
.
.
.
.
.
.
.
.
.
.
.
.
.
.
.
.
.
.
.
.
.
.
.
.
.
.
.
.
.
.
.
.
.
.
.
.
.
.
.
.
.
.
.
.
.
.
.
.
.
.
.
.
.
.
.
.
.
.
.
.
.
.
.
.
.
.
.
.
.
.
.
.
.
.
.
.
.
.
.
.
.
.
.
.
.
.
.
.
.
.
.
.
.
.
.
.
.
.
.
.
.
.
.
.
.
.
.
.
.
.
.
.
.
.
.
.
.
.
.
.
.
.
.
.
.
.
.
.
.
.
.
.
.
.
.
.
.
.
.
.
.
.
.
.
.
.
.
.
.
.
.
.
.
.
.
.
.
.
.
.
.
.
.
.
.
.
.
.
.
.
.
.
.
.
.
.
.
.
.
.
.
.
.
.
.
.
.
.
.
.
.
.
.
.
.
.
.
.
.
.
.
.
.
.
.
.
.
.
.
.
.
.
.
.
.
.
.
.
.
.
.
.
.
.
.
.
.
.
.
.
106
94
*
9
...
...
...
...
...
...
...
...
...
...
245
98
*
*
87
11
...
*
19
*
*
*
*8
...
Rate per 10,000 population2
All injuries . . . . . . . . . .
Fracture . . . . . . . . . . .
Dislocation . . . . . . . . .
Sprains and strains . . . .
Internal . . . . . . . . . . .
Open wound . . . . . . . .
Amputation . . . . . . . . .
Blood vessels . . . . . . .
Contusions and superficial
Crush . . . . . . . . . . . .
Burns . . . . . . . . . . . .
Nerves and spinal cord . .
Unspecified . . . . . . . . .
System-wide . . . . . . . .
. . . . .
. . . . .
. . . . .
. . . . .
. . . . .
. . . . .
. . . . .
. . . . .
injuries
. . . . .
. . . . .
. . . . .
. . . . .
. . . . .
.
.
.
.
.
.
.
.
.
.
.
.
.
.
.
.
.
.
.
.
.
.
.
.
.
.
.
.
.
.
.
.
.
.
.
.
.
.
.
.
.
.
.
.
.
.
.
.
.
.
.
.
.
.
.
.
.
.
.
.
.
.
.
.
.
.
.
.
.
.
.
.
.
.
.
.
.
.
.
.
.
.
.
.
.
.
.
.
.
.
.
.
.
.
.
.
.
.
.
.
.
.
.
.
.
.
.
.
.
.
.
.
.
.
.
.
.
.
.
.
.
.
.
.
.
.
.
.
.
.
.
.
.
.
.
.
.
.
.
.
.
.
.
.
.
.
.
.
.
.
.
.
.
.
.
.
.
.
.
.
.
.
.
.
.
.
.
.
.
.
.
.
.
.
.
.
.
.
.
.
.
.
.
.
.
.
.
.
.
.
.
.
.
.
.
.
.
.
.
.
.
.
.
.
.
.
.
.
.
.
.
.
.
.
.
.
.
.
.
.
.
.
.
.
.
.
.
.
.
.
.
.
.
.
.
.
.
.
66.5
35.3
0.6
1.7
8.1
3.2
0.3
0.3
2.2
*0.1
*
*
1.2
10.6
6.8
1.8
...
...
5.1
...
...
...
...
...
...
*
...
...
4.3
1.3
*
...
1.3
...
*0.0
0.5
*
*
*
0.6
...
0.4
*0.3
...
...
*0.1
...
...
...
...
...
...
...
...
...
3.6
3.2
*
0.3
...
...
...
...
...
...
...
...
...
...
8.3
3.3
*0.0
*
2.9
0.4
...
*
0.6
*
*
*
*0.3
...
* Figure does not meet standards of reliability or precision.
. . . Category not applicable.
– Quantity zero.
0.0 Quantity more than zero but less than 0.05.
1
The annual average number of discharges was computed by adding the number of discharges with a first-listed injury diagnosis during the 3-year period and dividing by three.
2
Rates were calculated by dividing the annual average number of discharges by the 2005 population. The population is the U.S. Census Bureau 2000-based postcensal estimate of the civilian
population.
Series 13, No. 168 [ Page 37
Table 25. Number and rate of deaths for discharges from short-stay hospitals, by age and selected first-listed diagnosis: United States,
2006
[Discharges of inpatients from nonfederal hospitals. Diagnostic groups and code numbers are based on the International Classification of Diseases, Ninth Revision, Clinical
Modification (ICD–9–CM)]
All
ages
First-listed diagnosis and ICD–9–CM code
Under
65 years
65 years
and over
All
ages
Number of deaths in thousands
Under
65 years
65 years
and over
Rate per 100 discharges
All conditions1 . . . . . . . . . . . . . . . . . . . . . . . . . . . . . . . . . . . . . . . . . . . .
730
206
524
2.1
0.9
4.0
Heart disease . . . . . . . . . . . . . . .391–392.0,393–398,402,404,410–416,420–429
Acute myocardial infarction . . . . . . . . . . . . . . . . . . . . . . . . . . . . . . . .410
Cardiac dysrhythmias . . . . . . . . . . . . . . . . . . . . . . . . . . . . . . . . . . . .427
Congestive heart failure . . . . . . . . . . . . . . . . . . . . . . . . .428.0,428.2–428.4
Septicemia . . . . . . . . . . . . . . . . . . . . . . . . . . . . . . . . . . . . . . . . . . . .038
Malignant neoplasms . . . . . . . . . . . . . . . . . . . . . . . . . . . .140–208,230–234
Malignant neoplasm on trachea, bronchus, and lung . . . . .162,176.4,197.0,197.3
Respiratory failure . . . . . . . . . . . . . . . . . . . . . . . . . . . .518.81,518.83,518.84
Cerebrovascular disease . . . . . . . . . . . . . . . . . . . . . . . . . . . . . . . .430–438
Pneumonia . . . . . . . . . . . . . . . . . . . . . . . . . . . . . . . . . . . . . . . .480–486
Fractures, all sites2 . . . . . . . . . . . . . . . . . . . . . . . . . . . . . . . . . . .800–829
Fracture of neck of femur2 . . . . . . . . . . . . . . . . . . . . . . . . . . . . . . . . .820
Nephritis, nephrotic syndrome and nephrosis . . . . . . . . . . . . . . . . . . .580–589
Pneumonitis due to solids and liquids . . . . . . . . . . . . . . . . . . . . . . . . . . .507
110
44
15
31
87
79
19
61
47
42
23
11
22
21
19
5
*
*
21
27
5
19
11
8
*6
*
*5
*
91
39
10
27
66
52
13
41
37
34
17
11
18
18
2.6
6.8
2.0
2.8
16.4
6.5
11.3
19.2
5.3
3.4
2.2
3.4
5.9
11.8
1.2
2.1
*
*
11.1
4.7
9.7
14.9
3.8
1.5
*1.3
*
*3.4
*
3.5
9.8
1.9
3.4
19.2
8.2
12.2
22.1
6.0
4.8
3.0
3.8
7.4
13.7
* Figure does not meet standards of reliability or precision.
1
Includes data for deaths not shown in table.
2
Excludes fractures coded as 733.1, ‘‘pathologic fracture.’’
Table 26. Number of discharges from short-stay hospitals with and without procedures and percentage with procedures, by selected
characteristics: United States, 2006
Discharges with procedures
All
discharges
Characteristic
Discharges
without
procedures
Total
With
surgical
procedures
Total
Number in thousands
All patients . . . . . . . . . . . . . . . . . . . . . . . . . . . . . . .
With
surgical
procedures
Percent
34,854
13,178
21,675
16,064
62.2
46.1
.
.
.
.
.
.
.
2,298
10,800
8,686
13,070
4,793
5,252
3,025
1,197
3,081
3,198
5,703
1,761
2,305
1,637
1,101
7,719
5,488
7,367
3,032
2,947
1,388
642
6,028
4,175
5,219
2,258
2,117
844
47.9
71.5
63.2
56.4
63.3
56.1
45.9
27.9
55.8
48.1
39.9
47.1
40.3
27.9
Male . . . . . . . . . . . . . . . . . . . . . . . . . . . . . . . . . . .
Female . . . . . . . . . . . . . . . . . . . . . . . . . . . . . . . . .
13,990
20,864
5,711
7,468
8,279
13,396
5,944
10,120
59.2
64.2
42.5
48.5
7,277
7,951
13,140
6,486
2,613
3,408
5,119
2,039
4,664
4,544
8,020
4,448
3,062
3,486
6,129
3,387
64.1
57.1
61.0
68.6
42.1
43.8
46.6
52.2
Age
Under 15 years . . .
15–44 years . . . . .
45–64 years . . . . .
65 years and over . .
65–74 years . . . .
75–84 years . . . .
85 years and over
.
.
.
.
.
.
.
.
.
.
.
.
.
.
.
.
.
.
.
.
.
.
.
.
.
.
.
.
.
.
.
.
.
.
.
.
.
.
.
.
.
.
.
.
.
.
.
.
.
.
.
.
.
.
.
.
.
.
.
.
.
.
.
.
.
.
.
.
.
.
.
.
.
.
.
.
.
.
.
.
.
.
.
.
.
.
.
.
.
.
.
.
.
.
.
.
.
.
.
.
.
.
.
.
.
.
.
.
.
.
.
.
.
.
.
.
.
.
.
.
.
.
.
.
.
.
.
.
.
.
.
.
.
.
.
.
.
.
.
.
.
.
.
.
.
.
.
.
.
.
.
.
.
.
.
.
.
.
.
.
.
.
.
.
.
.
.
.
Sex
Region
Northeast
Midwest .
South . .
West . . .
.
.
.
.
.
.
.
.
.
.
.
.
.
.
.
.
.
.
.
.
.
.
.
.
.
.
.
.
.
.
.
.
.
.
.
.
.
.
.
.
.
.
.
.
.
.
.
.
.
.
.
.
.
.
.
.
.
.
.
.
.
.
.
.
.
.
.
.
.
.
.
.
.
.
.
.
.
.
.
.
.
.
.
.
.
.
.
.
.
.
.
.
.
.
.
.
.
.
.
.
.
.
.
.
.
.
.
.
.
.
.
.
.
.
.
.
.
.
.
.
.
.
.
.
.
.
.
.
NOTE: All procedures except those listed under ‘‘nonsurgical procedures’’ in the appendix are surgical procedures.
Page 38 [ Series 13, No. 168
Table 27. Number and rate of all-listed surgical and nonsurgical procedures for discharges from short-stay hospitals, by selected procedure
categories: United States, 2006
[Discharges of inpatients from nonfederal hospitals. Excludes newborn infants. Procedure groupings and code numbers are based on the International Classification of
Diseases, Ninth Revision, Clinical Modification (ICD–9–CM)]
Procedure category and ICD–9–CM code
Number in
thousands
Rate per
10,000
population1
Surgical procedures2 . . . . . . . . . . . . . . . . . . . . . . . . . . . . . . . . . . . . . . . . . . . . . . . . . . . . . . . . . . .
28,052
940.7
Repair of current obstetric laceration3 . . . . . . . . . . . . . . . . . . . . . . . . . . . . . . . . . . . . . . . . . .75.5–75.6
Cesarean section3 . . . . . . . . . . . . . . . . . . . . . . . . . . . . . . . . . . . . . . . . . . . . . . .74.0–74.2,74.4,74.99
Cardiac catheterization . . . . . . . . . . . . . . . . . . . . . . . . . . . . . . . . . . . . . . . . . . . . . . . . . .37.21–37.23
Artificial rupture of membranes3 . . . . . . . . . . . . . . . . . . . . . . . . . . . . . . . . . . . . . . . . . . . . . . . . .73.0
Reduction of fracture. . . . . . . . . . . . . . . . . . . . . . . . . . . . . . . . . . . . . . . . . . . . . . . . . .76.7,79.0–79.3
Open reduction of fracture with internal fixation. . . . . . . . . . . . . . . . . . . . . . . . . . . . . . . . . . . . . . .79.3
Balloon angioplasty of coronary artery or coronary atherectomy . . . . . . . . . . . . . . . . . . . . . . . . . . . . .00.66
Insertion of coronary artery stent(s) . . . . . . . . . . . . . . . . . . . . . . . . . . . . . . . . . . . . . . . . . .36.06–36.07
Endoscopy of small intestine with biopsy . . . . . . . . . . . . . . . . . . . . . . . . . . . . . . . . . . . . . . .45.14,45.16
Hysterectomy . . . . . . . . . . . . . . . . . . . . . . . . . . . . . . . . . . . . . . . . . . . . . . . . . . . . . .68.3–68.7,68.9
Total knee replacement . . . . . . . . . . . . . . . . . . . . . . . . . . . . . . . . . . . . . . . . . . . . . . . . . . . . . .81.54
Episiotomy with or without forceps or vacuum extraction3 . . . . . . . . . . . . . . . . . . .72.1,72.21,72.31,72.71,73.6
Coronary artery bypass graft4 . . . . . . . . . . . . . . . . . . . . . . . . . . . . . . . . . . . . . . . . . . . . . . . . . . .36.1
Oophorectomy and salpingo-oophorectomy . . . . . . . . . . . . . . . . . . . . . . . . . . . . . . . . . . . . . . .65.3–65.6
Insertion, replacement, removal, and revision of pacemaker leads or device . . . . . . . . . . .37.7–37.8,00.50,00.53
Cholecystectomy . . . . . . . . . . . . . . . . . . . . . . . . . . . . . . . . . . . . . . . . . . . . . . . . . . . . . . . . . . .51.2
Debridement of wound, infection, or burn . . . . . . . . . . . . . . . . . . . . . . . . . . . . . . . . . . . . . . .86.22,86.28
Bilateral destruction or occlusion of fallopian tubes . . . . . . . . . . . . . . . . . . . . . . . . . . . . . . . . . .66.2–66.3
Lysis of peritoneal adhesions . . . . . . . . . . . . . . . . . . . . . . . . . . . . . . . . . . . . . . . . . . . . . . . . . . .54.5
Appendectomy, excluding incidental . . . . . . . . . . . . . . . . . . . . . . . . . . . . . . . . . . . . . . . . . . . . . . .47.0
Excision or destruction of intervertebral disc . . . . . . . . . . . . . . . . . . . . . . . . . . . . . . . . . . . . . . . . . .80.5
Partial excision of large intestine . . . . . . . . . . . . . . . . . . . . . . . . . . . . . . . . . . . . . . . . . . . . . . . . .45.7
Total hip replacement . . . . . . . . . . . . . . . . . . . . . . . . . . . . . . . . . . . . . . . . . . . . . . . . . . . . . . .81.51
Endoscopy of large intestine with biopsy . . . . . . . . . . . . . . . . . . . . . . . . . . . . . . . . . . . . . . . . . . .45.25
Bronchoscopy with biopsy . . . . . . . . . . . . . . . . . . . . . . . . . . . . . . . . . . . . . . . . . . . . . . . .33.24,33.27
Partial excision of bone. . . . . . . . . . . . . . . . . . . . . . . . . . . . . . . . . . . . . . . . . . . . .76.2–76.3,77.6–77.8
Prostatectomy . . . . . . . . . . . . . . . . . . . . . . . . . . . . . . . . . . . . . . . . . . . . . . . . . . . . . . . . .60.2–60.6
Cystoscopy with biopsy . . . . . . . . . . . . . . . . . . . . . . . . . . . . . . . . . . . . . . . . . . . . . . . . . . . . . .57.33
1,308
1,295
1,115
960
672
439
661
652
625
569
542
454
444
418
418
414
402
351
344
341
280
252
231
215
197
171
168
13
Nonsurgical procedures5 . . . . . . . . . . . . . . . . . . . . . . . . . . . . . . . . . . . . . . . . . . . . . . . . . . . . . . . . .
17,911
Transfusion of blood and blood components . . . . . . . . . . . . . . . . . . . . . . . . . . . . . . . . . . . . . . . . . .99.0
Arteriography and angiocardiography using contrast material . . . . . . . . . . . . . . . . . . . . . . . . . . . .88.4–88.5
Respiratory therapy . . . . . . . . . . . . . . . . . . . . . . . . . . . . . . . . . . . . . . . . . . . . . . . . . .93.9,96.7,00.12
Diagnostic ultrasound6 . . . . . . . . . . . . . . . . . . . . . . . . . . . . . . . . . . . . . . . . . . . . . . . . . . . . . . .88.7
Computerized axial tomography . . . . . . . . . . . . . . . . . . . . . . . . . . . . . . . . .87.03,87.41,87.71,88.01,88.38
Medical induction of labor3 . . . . . . . . . . . . . . . . . . . . . . . . . . . . . . . . . . . . . . . . . . . . . . . . . . . . .73.4
Hemodialysis . . . . . . . . . . . . . . . . . . . . . . . . . . . . . . . . . . . . . . . . . . . . . . . . . . . . . . . . . . . .39.95
Insertion of endotracheal tube . . . . . . . . . . . . . . . . . . . . . . . . . . . . . . . . . . . . . . . . . . . . . . . . . .96.04
Endoscopy of small intestine without biopsy . . . . . . . . . . . . . . . . . . . . . . . . . . . . . . . . . . . . .45.11–45.13
Physical therapy procedures . . . . . . . . . . . . . . . . . . . . . . . . . . . . . . . . . . . . . . . . . . . . . . . .93.1–93.3
Spinal tap . . . . . . . . . . . . . . . . . . . . . . . . . . . . . . . . . . . . . . . . . . . . . . . . . . . . . . . . . . . . . .03.31
Endoscopy of large intestine without biopsy . . . . . . . . . . . . . . . . . . . . . . . . . . . . . . . . . . . . .45.21–45.24
Injection or infusion of cancer chemotherapeutic substance6 . . . . . . . . . . . . . . . . . . . . . . . . . . . . . . .99.25
Cystoscopy without biopsy . . . . . . . . . . . . . . . . . . . . . . . . . . . . . . . . . . . . . . . . . . . . . . . .57.31–57.32
Bronchoscopy without biopsy . . . . . . . . . . . . . . . . . . . . . . . . . . . . . . . . . . . . . . . . . . . . . .33.21–33.23
1,968
1,698
1,088
874
740
653
645
476
419
386
315
308
220
133
84
43.9
43.4
37.4
32.2 22.5
14.7 22.2 21.9
21.0 19.1
18.2 15.2 14.9 14.0
14.0
13.9 13.5 11.8
11.5 11.5 9.4 8.4 7.7 7.2 6.6 5.7
5.6
0.4 600.6
66.0 56.9
36.5 29.3 24.8 21.9 21.6 16.0 14.1
12.9
10.6 10.3
7.4 4.5
2.8
1
Rates were calculated using U.S. Census Bureau 2000-based postcensal estimates of the civilian population as of July 1, 2006.
Includes data for surgical procedures not shown in table. All procedures except those listed under ‘‘nonsurgical procedures’’ in the appendix are surgical procedures.
3
See Table 38 for rate per 100 deliveries.
2
4
See Table 29 for comparison of number of procedures with number of discharges with procedures.
Includes data for nonsurgical procedures not shown in table. The ICD–9–CM codes for nonsurgical procedures are listed in the appendix.
6
Estimates and rates of nonsurgical procedures for these categories differ from estimates and rates for the same categories included in tables of all-listed procedures shown elsewhere in this report
because these categories include both surgical and nonsurgical procedure codes.
5
Series 13, No. 168 [ Page 39
Table 28. Number and rate of all-listed surgical and nonsurgical procedures for patients age 65 and over discharged from short-stay
hospitals, by age and selected procedure categories: United States, 2006
[Discharges of inpatients from nonfederal hospitals. Procedure groupings and code numbers are based on the International Classification of Diseases, Ninth Revision,
Clinical Modification (ICD–9–CM)]
Procedure category and ICD–9–CM code
65 years
and over
65–74
years
75–84
years
85 years
and over
Number in thousands
Surgical procedures1 . . . . . . . . . . . . . . . . . . . . . . . . . . . . . . . . . . . . . . . . . . . . . . . . . . . . . .
9,465
4,288
3,839
1,338
Cardiac catheterization . . . . . . . . . . . . . . . . . . . . . . . . . . . . . . . . . . . . . . . . . . . . .37.21–37.23
Insertion, replacement, removal, and revision of pacemaker leads or device . . . . . .37.7–37.8,00.50,00.53
Endoscopy of small intestine with biopsy . . . . . . . . . . . . . . . . . . . . . . . . . . . . . . . . . .45.14,45.16
Total knee replacement . . . . . . . . . . . . . . . . . . . . . . . . . . . . . . . . . . . . . . . . . . . . . . . . .81.54
Balloon angioplasty of coronary artery or coronary atherectomy . . . . . . . . . . . . . . . . . . . . . . . .00.66
Insertion of coronary artery stent(s) . . . . . . . . . . . . . . . . . . . . . . . . . . . . . . . . . . . . .36.06–36.07
Reduction of fracture . . . . . . . . . . . . . . . . . . . . . . . . . . . . . . . . . . . . . . . . . . . . .76.7,79.0–79.3
Open reduction of fracture with internal fixation . . . . . . . . . . . . . . . . . . . . . . . . . . . . . . . . . .79.3
Coronary artery bypass graft2 . . . . . . . . . . . . . . . . . . . . . . . . . . . . . . . . . . . . . . . . . . . . . .36.1
Partial excision of large intestine . . . . . . . . . . . . . . . . . . . . . . . . . . . . . . . . . . . . . . . . . . . .45.7
Cholecystectomy . . . . . . . . . . . . . . . . . . . . . . . . . . . . . . . . . . . . . . . . . . . . . . . . . . . . . .51.2
Total hip replacement . . . . . . . . . . . . . . . . . . . . . . . . . . . . . . . . . . . . . . . . . . . . . . . . . .81.51
Debridement of wound, infection, or burn . . . . . . . . . . . . . . . . . . . . . . . . . . . . . . . . . .86.22,86.28
Prostatectomy . . . . . . . . . . . . . . . . . . . . . . . . . . . . . . . . . . . . . . . . . . . . . . . . . . . .60.2–60.6
529
361
336
328
327
324
273
183
237
135
129
126
122
103
273
92
129
188
167
168
66
46
133
60
64
68
51
55
210
174
136
122
133
129
113
74
96
54
50
45
47
35
46
95
71
18
27
27
94
62
9
21
15
14
24
13
Nonsurgical procedures3 . . . . . . . . . . . . . . . . . . . . . . . . . . . . . . . . . . . . . . . . . . . . . . . . . . . .
6,772
2,686
2,680
1,407
Transfusion of blood and blood components . . . . . . . . . . . . . . . . . . . . . . . . . . . . . . . . . . . . .99.0
Arteriography and angiocardiography using contrast material . . . . . . . . . . . . . . . . . . . . . . .88.4–88.5
Respiratory therapy . . . . . . . . . . . . . . . . . . . . . . . . . . . . . . . . . . . . . . . . . . . . .93.9,96.7,00.12
Diagnostic ultrasound4 . . . . . . . . . . . . . . . . . . . . . . . . . . . . . . . . . . . . . . . . . . . . . . . . . .88.7
Computerized axial tomography . . . . . . . . . . . . . . . . . . . . . . . . . . . .87.03,87.41,87.71,88.01,88.38
Hemodialysis . . . . . . . . . . . . . . . . . . . . . . . . . . . . . . . . . . . . . . . . . . . . . . . . . . . . . . .39.95
Physical therapy procedures . . . . . . . . . . . . . . . . . . . . . . . . . . . . . . . . . . . . . . . . . . .93.1–93.3
Endoscopy of small intestine without biopsy . . . . . . . . . . . . . . . . . . . . . . . . . . . . . . . .45.11–45.13
Insertion of endotracheal tube . . . . . . . . . . . . . . . . . . . . . . . . . . . . . . . . . . . . . . . . . . . . .96.04
Endoscopy of large intestine without biopsy . . . . . . . . . . . . . . . . . . . . . . . . . . . . . . . .45.21–45.24
1,191
790
476
425
312
295
249
234
221
189
406
382
200
167
119
159
75
80
97
65
486
329
184
165
117
110
104
93
83
81
299
79
92
93
76
26
71
61
41
44
Rate per 10,000 population5
1
Surgical procedures . . . . . . . . . . . . . . . . . . . . . . . . . . . . . . . . . . . . . . . . . . . . . . . . . . . . . .
2,540.3
2,266.8
2,942.5
2,526.8
Cardiac catheterization . . . . . . . . . . . . . . . . . . . . . . . . . . . . . . . . . . . . . . . . . . . . .37.21–37.23
Insertion, replacement, removal, and revision of pacemaker leads or device . . . . . .37.7–37.8,00.50,00.53
Endoscopy of small intestine with biopsy . . . . . . . . . . . . . . . . . . . . . . . . . . . . . . . . . .45.14,45.16
Total knee replacement . . . . . . . . . . . . . . . . . . . . . . . . . . . . . . . . . . . . . . . . . . . . . . . . .81.54
Balloon angioplasty of coronary artery or coronary atherectomy . . . . . . . . . . . . . . . . . . . . . . . .00.66
Insertion of coronary artery stent(s) . . . . . . . . . . . . . . . . . . . . . . . . . . . . . . . . . . . . .36.06–36.07
Reduction of fracture . . . . . . . . . . . . . . . . . . . . . . . . . . . . . . . . . . . . . . . . . . . . .76.7,79.0–79.3
Open reduction of fracture with internal fixation . . . . . . . . . . . . . . . . . . . . . . . . . . . . . . . . . .79.3
Coronary artery bypass graft2 . . . . . . . . . . . . . . . . . . . . . . . . . . . . . . . . . . . . . . . . . . . . . .36.1
Partial excision of large intestine . . . . . . . . . . . . . . . . . . . . . . . . . . . . . . . . . . . . . . . . . . . .45.7
Cholecystectomy . . . . . . . . . . . . . . . . . . . . . . . . . . . . . . . . . . . . . . . . . . . . . . . . . . . . . .51.2
Total hip replacement . . . . . . . . . . . . . . . . . . . . . . . . . . . . . . . . . . . . . . . . . . . . . . . . . .81.51
Debridement of wound, infection, or burn . . . . . . . . . . . . . . . . . . . . . . . . . . . . . . . . . .86.22,86.28
Prostatectomy . . . . . . . . . . . . . . . . . . . . . . . . . . . . . . . . . . . . . . . . . . . . . . . . . . . .60.2–60.6
142.0
96.9
90.2
88.0
87.7
87.0
73.3
49.0
63.7
36.2
34.5
33.8
32.8
27.5
144.4
48.9
68.0
99.3
88.3
89.0
35.0
24.4
70.3
31.9
33.6
35.8
27.1
29.0
161.0
133.1
104.5
93.4
102.0
99.0
86.7
56.8
73.2
41.1
38.4
34.2
36.0
26.6
86.8
179.2
134.4
34.6
50.5
50.5
177.1
117.5
16.9
39.5
28.4
25.8
45.4
24.6
Nonsurgical procedures3 . . . . . . . . . . . . . . . . . . . . . . . . . . . . . . . . . . . . . . . . . . . . . . . . . . . .
1,817.6
1,419.8
2,054.0
2,655.9
Transfusion of blood and blood components . . . . . . . . . . . . . . . . . . . . . . . . . . . . . . . . . . . . .99.0
Arteriography and angiocardiography using contrast material . . . . . . . . . . . . . . . . . . . . . . .88.4–88.5
Respiratory therapy . . . . . . . . . . . . . . . . . . . . . . . . . . . . . . . . . . . . . . . . . . . . .93.9,96.7,00.12
Diagnostic ultrasound4 . . . . . . . . . . . . . . . . . . . . . . . . . . . . . . . . . . . . . . . . . . . . . . . . . .88.7
Computerized axial tomography . . . . . . . . . . . . . . . . . . . . . . . . . . . .87.03,87.41,87.71,88.01,88.38
Hemodialysis . . . . . . . . . . . . . . . . . . . . . . . . . . . . . . . . . . . . . . . . . . . . . . . . . . . . . . .39.95
Physical therapy procedures . . . . . . . . . . . . . . . . . . . . . . . . . . . . . . . . . . . . . . . . . . .93.1–93.3
Endoscopy of small intestine without biopsy . . . . . . . . . . . . . . . . . . . . . . . . . . . . . . . .45.11–45.13
Insertion of endotracheal tube . . . . . . . . . . . . . . . . . . . . . . . . . . . . . . . . . . . . . . . . . . . . .96.04
Endoscopy of large intestine without biopsy . . . . . . . . . . . . . . . . . . . . . . . . . . . . . . . .45.21–45.24
319.7
212.1
127.7
114.0
83.8
79.3
67.0
62.7
59.3
50.8
214.7
201.9
105.9
88.0
63.1
84.1
39.5
42.3
51.3
34.1
372.5
252.4
140.9
126.8
89.7
84.2
79.8
70.9
63.4
62.0
564.2
149.2
173.4
174.9
142.9
49.8
133.4
115.8
77.6
82.8
1
Includes data for surgical procedures not shown in table. All procedures except those listed under ‘‘nonsurgical procedures’’ in the appendix are surgical procedures.
See Table 29 for comparison of number of procedures with number of discharges with procedures.
3
Includes data for nonsurgical procedures not shown in table. The ICD–9–CM codes for nonsurgical procedures are listed in the appendix.
4
Estimates and rates of nonsurgical procedures for these categories differ from estimates and rates for the same categories included in tables of all-listed procedures shown elsewhere in this report
because these categories include both surgical and nonsurgical procedure codes.
2
5
Rates were calculated using U.S. Census Bureau 2000-based postcensal estimates of the civilian population as of July 1, 2006.
Page 40 [ Series 13, No. 168
Table 29. Number and rate of discharges from short-stay hospitals with a coronary artery bypass graft and number and rate of procedures,
by sex, age, and geographic region: United States, 2006
[Discharges of inpatients from nonfederal hospitals. Excludes newborn infants. Procedure groupings and code numbers are based on the International Classification of
Diseases, Ninth Revision, Clinical Modification]
Discharges with procedures
Number in
thousands
Sex, age, and region
Total
. . . . . . . . . . . . . . . . . . . . . . . . . . . . . . . . . . . . . . . . . . . . . . . . .
Rate per
10,000
population1
Procedures
Number in
thousands
Rate per
10,000
population1
253 8.5
444 14.9
180 73 12.3
4.8
320 123 21.9
8.1
*
0.7
14.1
37.3
40.1
44.2
10.5
*
15
191
237
133
96
9
*
1.2
25.5
63.7
70.3
73.2
16.9
6.8
10.4
9.5
6.4
64
122
181
76
Sex
Male . . . . . . . . . . . . . . . . . . . . . . . . . . . . . . . . . . . . . . . . . . . . . . . . .
Female . . . . . . . . . . . . . . . . . . . . . . . . . . . . . . . . . . . . . . . . . . . . . . . .
Age
Under 15 years . . .
15–44 years . . . . .
45–64 years . . . . .
65 years and over .
65–74 years . . .
75–84 years . . .
85 years and over
.
.
.
.
.
.
.
.
.
.
.
.
.
.
.
.
.
.
.
.
.
.
.
.
.
.
.
.
.
.
.
.
.
.
.
.
.
.
.
.
.
.
.
.
.
.
.
.
.
.
.
.
.
.
.
.
.
.
.
.
.
.
.
.
.
.
.
.
.
.
.
.
.
.
.
.
.
Northeast
Midwest .
South . . .
West . . .
.
.
.
.
.
.
.
.
.
.
.
.
.
.
.
.
.
.
.
.
.
.
.
.
.
.
.
.
.
.
.
.
.
.
.
.
.
.
.
.
.
.
.
.
.
.
.
.
.
.
.
.
.
.
.
.
.
.
.
.
.
.
.
.
.
.
.
.
.
.
.
.
.
.
.
.
.
.
.
.
.
.
.
.
.
.
.
.
.
.
.
.
.
.
.
.
.
.
.
.
.
.
.
.
.
.
.
.
.
.
.
.
.
.
.
.
.
.
.
.
.
.
.
.
.
.
.
.
.
.
.
.
.
.
.
.
.
.
.
.
.
.
.
.
.
.
.
.
.
.
.
.
.
.
.
.
.
.
.
.
.
.
.
.
.
.
.
.
.
.
.
.
.
.
.
.
.
.
.
.
.
.
.
.
.
.
.
.
.
.
.
.
.
.
.
.
.
.
.
.
.
.
.
.
.
.
.
.
.
.
.
.
.
.
.
.
.
.
.
.
.
.
.
.
.
.
.
.
.
.
.
.
.
.
.
.
.
.
.
.
.
.
.
.
.
.
.
*
8
105
139
76
58
6
.
.
.
.
.
.
.
.
.
.
.
.
.
.
.
.
.
.
.
.
.
.
.
.
.
.
.
.
.
.
.
.
.
.
.
.
.
.
.
.
.
.
.
.
.
.
.
.
.
.
.
.
.
.
.
.
.
.
.
.
.
.
.
.
.
.
.
.
.
.
.
.
.
.
.
.
.
.
.
.
.
.
.
.
.
.
.
.
.
.
.
.
.
.
.
.
37
69
103
44
Region
.
.
.
.
.
.
.
.
.
.
.
.
.
.
.
.
.
.
.
.
.
.
.
.
.
.
.
.
.
.
.
.
.
.
.
.
.
.
.
.
.
.
.
.
11.6
18.5
16.7
11.1
* Figure does not meet standards of reliability or precision.
1
Rates were calculated using U.S. Census Bureau 2000-based postcensal estimates of the civilian population as of July 1, 2006.
NOTES: The number of procedures exceeds the number of discharges because these procedures are often assigned more than one code for a single operation. See ‘‘Methods’’ section. CABG is
coronary artery bypass graft.
Series 13, No. 168 [ Page 41
Table 30. Number of all-listed procedures for discharges from short-stay hospitals, by age and procedure category: United States, 2006
[Discharges of inpatients from nonfederal hospitals. Excludes newborn infants. Procedure groupings and code numbers are based on the International Classification of
Diseases, Ninth Revision, Clinical Modification (ICD–9–CM)]
Procedure category and ICD–9–CM code
All
ages
Under
15 years
15–44
years
45–64
years
65 years
and over
All procedures1 . . . . . . . . . . . . . . . . . . . . . . . . . . . . . . . . . . . . . . . . . . . . . . . . . . . . . . .
45,963
2,159
15,012
12,555
16,238
Operations on the nervous system . . . . . . . . . . . . . . . . . . . . . . . . . . . . . . . . . . . . . . .01–05
Spinal tap . . . . . . . . . . . . . . . . . . . . . . . . . . . . . . . . . . . . . . . . . . . . . . . . . . . . . .03.31
Operations on the endocrine system . . . . . . . . . . . . . . . . . . . . . . . . . . . . . . . . . . . . . .06–07
Operations on the eye . . . . . . . . . . . . . . . . . . . . . . . . . . . . . . . . . . . . . . . . . . . . . . .08–16
Operations on the ear . . . . . . . . . . . . . . . . . . . . . . . . . . . . . . . . . . . . . . . . . . . . . . .18–20
Operations on the nose, mouth, and pharynx . . . . . . . . . . . . . . . . . . . . . . . . . . . . . . . . .21–29
Operations on the respiratory system . . . . . . . . . . . . . . . . . . . . . . . . . . . . . . . . . . . . . .30–34
Bronchoscopy with or without biopsy . . . . . . . . . . . . . . . . . . . . . . . . . . . . .33.21–33.24,33.27
Operations on the cardiovascular system . . . . . . . . . . .35–39,00.50–00.51,00.53–00.55,00.61–00.66
Balloon angioplasty of coronary artery or coronary atherectomy . . . . . . . . . . . . . . . . . . . .00.66
Insertion of coronary artery stent(s) . . . . . . . . . . . . . . . . . . . . . . . . . . . . . . . . . .36.06–36.07
Coronary artery bypass graft2 . . . . . . . . . . . . . . . . . . . . . . . . . . . . . . . . . . . . . . . . . .36.1
Cardiac catheterization . . . . . . . . . . . . . . . . . . . . . . . . . . . . . . . . . . . . . . . . .37.21–37.23
Insertion, replacement, removal, and revision of pacemaker leads or device . .37.7–37.8,00.50,00.53
Hemodialysis . . . . . . . . . . . . . . . . . . . . . . . . . . . . . . . . . . . . . . . . . . . . . . . . . . . .39.95
Operations on the hemic and lymphatic system . . . . . . . . . . . . . . . . . . . . . . . . . . . . . . .40–41
Operations on the digestive system . . . . . . . . . . . . . . . . . . . . . . . . . . . . . . . . . . . . . . .42–54
Endoscopy of small intestine with or without biopsy . . . . . . . . . . . . . . . . . . . .45.11–45.14,45.16
Endoscopy of large intestine with or without biopsy . . . . . . . . . . . . . . . . . . . . . . . .45.21–45.25
Partial excision of large intestine . . . . . . . . . . . . . . . . . . . . . . . . . . . . . . . . . . . . . . . .45.7
Appendectomy, excluding incidental . . . . . . . . . . . . . . . . . . . . . . . . . . . . . . . . . . . . . .47.0
Cholecystectomy . . . . . . . . . . . . . . . . . . . . . . . . . . . . . . . . . . . . . . . . . . . . . . . . . .51.2
Lysis of peritoneal adhesions. . . . . . . . . . . . . . . . . . . . . . . . . . . . . . . . . . . . . . . . . . .54.5
Operations on the urinary system . . . . . . . . . . . . . . . . . . . . . . . . . . . . . . . . . . . . . . . .55–59
Cystoscopy with or without biopsy . . . . . . . . . . . . . . . . . . . . . . . . . . . . . . . . . .57.31–57.33
Operations on the male genital organs . . . . . . . . . . . . . . . . . . . . . . . . . . . . . . . . . . . . .60–64
Prostatectomy . . . . . . . . . . . . . . . . . . . . . . . . . . . . . . . . . . . . . . . . . . . . . . . .60.2–60.6
Operations on the female genital organs . . . . . . . . . . . . . . . . . . . . . . . . . . . . . . . . . . . .65–71
Oophorectomy and salpingo-oophorectomy . . . . . . . . . . . . . . . . . . . . . . . . . . . . . .65.3–65.6
Bilateral destruction or occlusion of fallopian tubes . . . . . . . . . . . . . . . . . . . . . . . . . .66.2–66.3
Hysterectomy. . . . . . . . . . . . . . . . . . . . . . . . . . . . . . . . . . . . . . . . . . . . . .68.3–68.7,68.9
Obstetrical procedures . . . . . . . . . . . . . . . . . . . . . . . . . . . . . . . . . . . . . . . . . . . . . . .72–75
Episiotomy with or without forceps or vacuum extraction . . . . . . . . . . .72.1,72.21,72.31,72.71,73.6
Artificial rupture of membranes. . . . . . . . . . . . . . . . . . . . . . . . . . . . . . . . . . . . . . . . . .73.0
Medical induction of labor . . . . . . . . . . . . . . . . . . . . . . . . . . . . . . . . . . . . . . . . . . . . .73.4
Cesarean section . . . . . . . . . . . . . . . . . . . . . . . . . . . . . . . . . . . . . . .74.0–74.2,74.4,74.99
Repair of current obstetric laceration . . . . . . . . . . . . . . . . . . . . . . . . . . . . . . . . . .75.5–75.6
Operations on the musculoskeletal system . . . . . . . . . . . . . . . . . .76–84,00.70–00.73,00.80–00.84
Partial excision of bone . . . . . . . . . . . . . . . . . . . . . . . . . . . . . . . . . . . .76.2–76.3,77.6–77.8
Reduction of fracture . . . . . . . . . . . . . . . . . . . . . . . . . . . . . . . . . . . . . . . . .76.7,79.0–79.3
Open reduction of fracture with internal fixation . . . . . . . . . . . . . . . . . . . . . . . . . . . . . .79.3
Excision or destruction of intervertebral disc . . . . . . . . . . . . . . . . . . . . . . . . . . . . . . . . .80.5
Total hip replacement. . . . . . . . . . . . . . . . . . . . . . . . . . . . . . . . . . . . . . . . . . . . . . .81.51
Total knee replacement . . . . . . . . . . . . . . . . . . . . . . . . . . . . . . . . . . . . . . . . . . . . .81.54
Operations on the integumentary system. . . . . . . . . . . . . . . . . . . . . . . . . . . . . . . . . . . .85–86
Debridement of wound, infection, or burn . . . . . . . . . . . . . . . . . . . . . . . . . . . . . .86.22,86.28
Miscellaneous diagnostic and therapeutic procedures and new technologies3 . . . . . . . . . . .87–99,00
Computerized axial tomography. . . . . . . . . . . . . . . . . . . . . . . . .87.03,87.41,87.71,88.01,88.38
Arteriography and angiocardiography using contrast material . . . . . . . . . . . . . . . . . . .88.4–88.5
Diagnostic ultrasound . . . . . . . . . . . . . . . . . . . . . . . . . . . . . . .88.7,00.21–00.25,00.28–00.29
Physical therapy procedures . . . . . . . . . . . . . . . . . . . . . . . . . . . . . . . . . . . . . . .93.1–93.3
Respiratory therapy. . . . . . . . . . . . . . . . . . . . . . . . . . . . . . . . . . . . . . . . . .93.9,96.7,00.12
Insertion of endotracheal tube . . . . . . . . . . . . . . . . . . . . . . . . . . . . . . . . . . . . . . . . .96.04
Transfusion of blood and blood components . . . . . . . . . . . . . . . . . . . . . . . . . . . . . . . . .99.0
Injection or infusion of cancer chemotherapeutic substance . . . . . . . . . . . . . . . . . . .99.25,00.10
1,155
315
101
76
53
298
1,167
282
7,235
661
652
444
1,115
418
645
371
5,571
1,045
522
252
341
414
344
1,025
146
250
168
1,957
418
351
569
7,076
454
960
653
1,295
1,308
4,254
171
672
439
280
231
542
1,598
402
13,775
740
1,698
888
386
1,088
476
1,968
221
184
124
*
*
*
67
73
*
210
*
*
*
12
*
*
21
243
*
7
*
74
*
7
26
*
28
*
9
*
*
*
*9
*
*
*
*
*
166
9
43
14
*
*
*
*
*
885
35
18
34
*
165
49
66
42
343
77
33
19
11
89
188
44
734
33
33
15
87
*9
102
57
1,267
151
68
30
178
155
120
203
29
16
*
1,073
147
349
260
7,049
453
956
650
1,290
1,304
909
42
196
130
85
13
11
510
124
2,511
174
188
149
33
159
74
224
36
304
64
37
19
*8
74
362
88
2,633
301
294
191
487
46
244
147
1,743
307
150
83
66
128
117
355
42
82
65
638
207
*
250
17
*
*
*
*3
*
1,513
68
159
113
137
92
204
473
121
4,150
219
701
273
95
288
132
487
88
324
50
29
26
*
67
544
132
3,658
327
324
237
529
361
295
146
2,319
570
297
135
24
129
101
442
72
123
103
237
61
*
59
...
...
...
...
...
...
1,666
52
273
183
55
126
328
417
122
6,230
312
790
432
249
476
221
1,191
55
Number in thousands
* Figure does not meet standards of reliability or precision.
. . . Category not applicable.
1
In 2002, the Chapter 00 codes were established. For reporting purposes, between 2003 and 2005, all Chapter 00 codes were grouped with the miscellaneous diagnostic and therapeutic procedures
and new technologies category. Beginning in 2006, the 00 codes are included in the categories and chapters of their previous codes, where applicable. See ‘‘Use of Tables.’’
2
See Table 29 for comparison of number of procedures with number of discharges with procedures.
Chapter 00 codes included in this category: 00.01–00.03, 00.09, 00.10–00.18, 00.21–00.25, 00.28–00.29, 00.31–00.35, 00.39, 00.40–00.43, 00.45–00.48, 00.52, 00.74–00.76, 00.91–00.93.
3
Page 42 [ Series 13, No. 168
Table 31. Rate of all-listed procedures for discharges from short-stay hospitals, by age and procedure category: United States, 2006
[Discharges of inpatients from nonfederal hospitals. Excludes newborn infants. Procedure groupings and code numbers are based on the International Classification of
Diseases, Ninth Revision, Clinical Modification (ICD–9–CM)]
Procedure category and ICD–9–CM code
All
ages
Under
15 years
15–44
years
45–64
years
65 years
and over
Rate per 10,000 population1
All procedures2 . . . . . . . . . . . . . . . . . . . . . . . . . . . . . . . . . . . . . . . . . . . . . . . . . . . . . . . . . .
1,541.3
355.3
1,197.1
1,678.4
Operations on the nervous system . . . . . . . . . . . . . . . . . . . . . . . . . . . . . . . . . . . . . . . . . .01–05
Spinal tap . . . . . . . . . . . . . . . . . . . . . . . . . . . . . . . . . . . . . . . . . . . . . . . . . . . . . . . .03.31
Operations on the endocrine system. . . . . . . . . . . . . . . . . . . . . . . . . . . . . . . . . . . . . . . . .06–07
Operations on the eye . . . . . . . . . . . . . . . . . . . . . . . . . . . . . . . . . . . . . . . . . . . . . . . . .08–16
Operations on the ear . . . . . . . . . . . . . . . . . . . . . . . . . . . . . . . . . . . . . . . . . . . . . . . . . .18–20
Operations on the nose, mouth, and pharynx . . . . . . . . . . . . . . . . . . . . . . . . . . . . . . . . . . .21–29
Operations on the respiratory system . . . . . . . . . . . . . . . . . . . . . . . . . . . . . . . . . . . . . . . .30–34
Bronchoscopy with or without biopsy . . . . . . . . . . . . . . . . . . . . . . . . . . . . . . .33.21–33.24,33.27
Operations on the cardiovascular system . . . . . . . . . . . . .35–39,00.50–00.51,00.53–00.55,00.61–00.66
Balloon angioplasty of coronary artery or coronary atherectomy . . . . . . . . . . . . . . . . . . . . . . .00.66
Insertion of coronary artery stent(s) . . . . . . . . . . . . . . . . . . . . . . . . . . . . . . . . . . . .36.06–36.07
Coronary artery bypass graft3 . . . . . . . . . . . . . . . . . . . . . . . . . . . . . . . . . . . . . . . . . . . . .36.1
Cardiac catheterization . . . . . . . . . . . . . . . . . . . . . . . . . . . . . . . . . . . . . . . . . . . .37.21–37.23
Insertion, replacement, removal, and revision of pacemaker leads or device. . . . .37.7–37.8,00.50,00.53
Hemodialysis . . . . . . . . . . . . . . . . . . . . . . . . . . . . . . . . . . . . . . . . . . . . . . . . . . . . . .39.95
Operations on the hemic and lymphatic system . . . . . . . . . . . . . . . . . . . . . . . . . . . . . . . . . .40–41
Operations on the digestive system . . . . . . . . . . . . . . . . . . . . . . . . . . . . . . . . . . . . . . . . .42–54
Endoscopy of small intestine with or without biopsy . . . . . . . . . . . . . . . . . . . . . .45.11–45.14,45.16
Endoscopy of large intestine with or without biopsy . . . . . . . . . . . . . . . . . . . . . . . . . .45.21–45.25
Partial excision of large intestine . . . . . . . . . . . . . . . . . . . . . . . . . . . . . . . . . . . . . . . . . . .45.7
Appendectomy, excluding incidental . . . . . . . . . . . . . . . . . . . . . . . . . . . . . . . . . . . . . . . . .47.0
Cholecystectomy. . . . . . . . . . . . . . . . . . . . . . . . . . . . . . . . . . . . . . . . . . . . . . . . . . . . .51.2
Lysis of peritoneal adhesions . . . . . . . . . . . . . . . . . . . . . . . . . . . . . . . . . . . . . . . . . . . . .54.5
Operations on the urinary system. . . . . . . . . . . . . . . . . . . . . . . . . . . . . . . . . . . . . . . . . . .55–59
Cystoscopy with or without biopsy . . . . . . . . . . . . . . . . . . . . . . . . . . . . . . . . . . . . .57.31–57.33
Operations on the male genital organs . . . . . . . . . . . . . . . . . . . . . . . . . . . . . . . . . . . . . . .60–64
Prostatectomy . . . . . . . . . . . . . . . . . . . . . . . . . . . . . . . . . . . . . . . . . . . . . . . . . . .60.2–60.6
Operations on the female genital organs . . . . . . . . . . . . . . . . . . . . . . . . . . . . . . . . . . . . . .65–71
Oophorectomy and salpingo-oophorectomy . . . . . . . . . . . . . . . . . . . . . . . . . . . . . . . . .65.3–65.6
Bilateral destruction or occlusion of fallopian tubes . . . . . . . . . . . . . . . . . . . . . . . . . . . .66.2–66.3
Hysterectomy . . . . . . . . . . . . . . . . . . . . . . . . . . . . . . . . . . . . . . . . . . . . . . . .68.3–68.7,68.9
Obstetrical procedures . . . . . . . . . . . . . . . . . . . . . . . . . . . . . . . . . . . . . . . . . . . . . . . . .72–75
Episiotomy with or without forceps or vacuum extraction . . . . . . . . . . . . .72.1,72.21,72.31,72.71,73.6
Artificial rupture of membranes . . . . . . . . . . . . . . . . . . . . . . . . . . . . . . . . . . . . . . . . . . . .73.0
Medical induction of labor . . . . . . . . . . . . . . . . . . . . . . . . . . . . . . . . . . . . . . . . . . . . . . .73.4
Cesarean section . . . . . . . . . . . . . . . . . . . . . . . . . . . . . . . . . . . . . . . . . .74.0–74.2,74.4,74.99
Repair of current obstetric laceration . . . . . . . . . . . . . . . . . . . . . . . . . . . . . . . . . . . . .75.5–75.6
Operations on the musculoskeletal system . . . . . . . . . . . . . . . . . . . .76–84,00.70–00.73,00.80–00.84
Partial excision of bone . . . . . . . . . . . . . . . . . . . . . . . . . . . . . . . . . . . . . .76.2–76.3,77.6–77.8
Reduction of fracture . . . . . . . . . . . . . . . . . . . . . . . . . . . . . . . . . . . . . . . . . . .76.7,79.0–79.3
Open reduction of fracture with internal fixation . . . . . . . . . . . . . . . . . . . . . . . . . . . . . . . .79.3
Excision or destruction of intervertebral disc . . . . . . . . . . . . . . . . . . . . . . . . . . . . . . . . . . . .80.5
Total hip replacement . . . . . . . . . . . . . . . . . . . . . . . . . . . . . . . . . . . . . . . . . . . . . . . . .81.51
Total knee replacement . . . . . . . . . . . . . . . . . . . . . . . . . . . . . . . . . . . . . . . . . . . . . . . .81.54
Operations on the integumentary system . . . . . . . . . . . . . . . . . . . . . . . . . . . . . . . . . . . . . .85–86
Debridement of wound, infection, or burn . . . . . . . . . . . . . . . . . . . . . . . . . . . . . . . . .86.22,86.28
Miscellaneous diagnostic and therapeutic procedures and new technologies4 . . . . . . . . . . . . .87–99,00
Computerized axial tomography . . . . . . . . . . . . . . . . . . . . . . . . . . .87.03,87.41,87.71,88.01,88.38
Arteriography and angiocardiography using contrast material . . . . . . . . . . . . . . . . . . . . . .88.4–88.5
Diagnostic ultrasound . . . . . . . . . . . . . . . . . . . . . . . . . . . . . . . . .88.7,00.21–00.25,00.28–00.29
Physical therapy procedures . . . . . . . . . . . . . . . . . . . . . . . . . . . . . . . . . . . . . . . . . .93.1–93.3
Respiratory therapy . . . . . . . . . . . . . . . . . . . . . . . . . . . . . . . . . . . . . . . . . . . .93.9,96.7,00.12
Insertion of endotracheal tube . . . . . . . . . . . . . . . . . . . . . . . . . . . . . . . . . . . . . . . . . . . .96.04
Transfusion of blood and blood components. . . . . . . . . . . . . . . . . . . . . . . . . . . . . . . . . . . .99.0
Injection or infusion of cancer chemotherapeutic substance. . . . . . . . . . . . . . . . . . . . . .99.25,00.10
38.7
10.6
3.4
2.6
1.8
10.0
39.1
9.4
242.6
22.2
21.9
14.9
37.4
14.0
21.6
12.4
186.8
35.0
17.5
8.4
11.5
13.9
11.5
34.4
4.9
8.4
5.6
65.6
14.0
11.8
19.1
237.3
15.2
32.2
21.9
43.4
43.9
142.6
5.7
22.5
14.7
9.4
7.7
18.2
53.6
13.5
461.9
24.8
56.9
29.8
12.9
36.5
16.0
66.0
7.4
30.3
20.3
*
*
*
11.1
12.0
*
34.5
*
*
*
2.0
*
*
3.4
40.1
*
1.2
*
12.1
*
1.2
4.2
*0.4
4.6
*
1.4
*
*
*
*
*
*
*
*
*
27.2
1.6
7.1
2.2
*
*
*
*
*
145.6
5.8
3.0
5.7
*
27.2
8.0
10.9
6.9
27.3
6.2
2.6
1.5
*
7.1
15.0
3.5
58.6
2.6
2.6
1.2
7.0
*0.7
8.2
4.6
101.0
12.0
5.4
2.4
14.2
12.3
9.6
16.2
2.3
1.3
*
85.5
11.7
27.8
20.7
562.2
36.1
76.3
51.8
102.9
104.0
72.5
3.4
15.6
10.4
6.8
1.0
0.8
40.6
9.9
200.2
13.9
15.0
11.8
2.6
12.7
5.9
17.9
2.9
40.7
8.5
4.9
2.5
*1.0
10.0
48.4
11.7
352.0
40.2
39.4
25.5
65.1
6.2
32.6
19.6
233.0
41.0
20.1
11.1
8.9
17.1
15.6
47.4
5.6
11.0
8.7
85.3
27.7
*
33.4
2.3
*
*
*
*0.4
*
202.3
9.0
21.3
15.1
18.4
12.3
27.3
63.3
16.1
554.7
29.2
93.7
36.5
12.7
38.5
17.7
65.1
11.7
4,357.9
87.0
13.4 7.8
7.1
*
18.0
146.1
35.4
981.8
87.7 87.0
63.7 142.0
96.9
79.3 39.2
622.3
153.0
79.6
36.2 6.4 34.5 27.0 118.5
19.3
33.1
27.5
63.6
16.5
*
15.9
. . .
... ... ... . . .
. . .
447.2
13.9
73.3
49.0 14.9 33.8 88.0 112.0
32.8 1,672.0
83.8 212.1
116.0
67.0
127.7
59.3 319.7
14.7 * Figure does not meet standards of reliability or precision.
. . . Category not applicable.
1
Rates were calculated using U.S. Census Bureau 2000-based postcensal estimates of the civilian population as of July 1, 2006.
2
In 2002, the Chapter 00 codes were established. For reporting purposes, between 2003 and 2005, all Chapter 00 codes were grouped with the miscellaneous diagnostic and therapeutic procedures
and new technologies category. Beginning in 2006, the 00 codes are included in the categories and chapters of their previous codes, where applicable. See ‘‘Use of Tables.’’
3
See Table 29 for comparison of rate of procedures with rate of discharges with procedures.
Chapter 00 codes included in this category: 00.01–00.03, 00.09, 00.10–00.18, 00.21–00.25, 00.28–00.29, 00.31–00.35, 00.39, 00.40–00.43, 00.45–00.48, 00.52, 00.74–00.76, 00.91–00.93.
4
Series 13, No. 168 [ Page 43
Table 32. Number of all-listed procedures for discharges from short-stay hospitals, by sex and procedure category: United States, 2006
[Discharges of inpatients from nonfederal hospitals. Excludes newborn infants. Procedure groupings and code numbers are based on the International Classification of
Diseases, Ninth Revision, Clinical Modification (ICD–9–CM)]
Procedure category and ICD–9–CM code
Both
sexes
All procedures1 . . . . . . . . . . . . . . . . . . . . . . . . . . . . . . . . . . . . . . . . . . . . . . . . . . . . . . . . . . . . . .
45,963
18,482
27,482
Operations on the nervous system. . . . . . . . . . . . . . . . . . . . . . . . . . . . . . . . . . . . . . . . . . . . . . .01–05
Spinal tap . . . . . . . . . . . . . . . . . . . . . . . . . . . . . . . . . . . . . . . . . . . . . . . . . . . . . . . . . . . . .03.31
Operations on the endocrine system . . . . . . . . . . . . . . . . . . . . . . . . . . . . . . . . . . . . . . . . . . . . .06–07
Operations on the eye . . . . . . . . . . . . . . . . . . . . . . . . . . . . . . . . . . . . . . . . . . . . . . . . . . . . . .08–16
Operations on the ear . . . . . . . . . . . . . . . . . . . . . . . . . . . . . . . . . . . . . . . . . . . . . . . . . . . . . .18–20
Operations on the nose, mouth, and pharynx . . . . . . . . . . . . . . . . . . . . . . . . . . . . . . . . . . . . . . . .21–29
Operations on the respiratory system . . . . . . . . . . . . . . . . . . . . . . . . . . . . . . . . . . . . . . . . . . . . .30–34
Bronchoscopy with or without biopsy . . . . . . . . . . . . . . . . . . . . . . . . . . . . . . . . . . . .33.21–33.24,33.27
Operations on the cardiovascular system . . . . . . . . . . . . . . . . . .35–39,00.50–00.51,00.53–00.55,00.61–00.66
Balloon angioplasty of coronary artery or coronary atherectomy. . . . . . . . . . . . . . . . . . . . . . . . . . . .00.66
Insertion of coronary artery stent(s) . . . . . . . . . . . . . . . . . . . . . . . . . . . . . . . . . . . . . . . . .36.06–36.07
Coronary artery bypass graft2 . . . . . . . . . . . . . . . . . . . . . . . . . . . . . . . . . . . . . . . . . . . . . . . . .36.1
Cardiac catheterization. . . . . . . . . . . . . . . . . . . . . . . . . . . . . . . . . . . . . . . . . . . . . . . . .37.21–37.23
Insertion, replacement, removal, and revision of pacemaker leads or device . . . . . . . . .37.7–37.8,00.50,00.53
Hemodialysis . . . . . . . . . . . . . . . . . . . . . . . . . . . . . . . . . . . . . . . . . . . . . . . . . . . . . . . . . . .39.95
Operations on the hemic and lymphatic system . . . . . . . . . . . . . . . . . . . . . . . . . . . . . . . . . . . . . . .40–41
Operations on the digestive system . . . . . . . . . . . . . . . . . . . . . . . . . . . . . . . . . . . . . . . . . . . . . .42–54
Endoscopy of small intestine with or without biopsy . . . . . . . . . . . . . . . . . . . . . . . . . . .45.11–45.14,45.16
Endoscopy of large intestine with or without biopsy . . . . . . . . . . . . . . . . . . . . . . . . . . . . . . .45.21–45.25
Partial excision of large intestine. . . . . . . . . . . . . . . . . . . . . . . . . . . . . . . . . . . . . . . . . . . . . . . .45.7
Appendectomy, excluding incidental. . . . . . . . . . . . . . . . . . . . . . . . . . . . . . . . . . . . . . . . . . . . . .47.0
Cholecystectomy . . . . . . . . . . . . . . . . . . . . . . . . . . . . . . . . . . . . . . . . . . . . . . . . . . . . . . . . .51.2
Lysis of peritoneal adhesions . . . . . . . . . . . . . . . . . . . . . . . . . . . . . . . . . . . . . . . . . . . . . . . . . .54.5
Operations on the urinary system . . . . . . . . . . . . . . . . . . . . . . . . . . . . . . . . . . . . . . . . . . . . . . .55–59
Cystoscopy with or without biopsy. . . . . . . . . . . . . . . . . . . . . . . . . . . . . . . . . . . . . . . . . .57.31–57.33
Operations on the male genital organs . . . . . . . . . . . . . . . . . . . . . . . . . . . . . . . . . . . . . . . . . . . .60–64
Prostatectomy. . . . . . . . . . . . . . . . . . . . . . . . . . . . . . . . . . . . . . . . . . . . . . . . . . . . . . . .60.2–60.6
Operations on the female genital organs . . . . . . . . . . . . . . . . . . . . . . . . . . . . . . . . . . . . . . . . . . .65–71
Oophorectomy and salpingo-oophorectomy. . . . . . . . . . . . . . . . . . . . . . . . . . . . . . . . . . . . . .65.3–65.6
Bilateral destruction or occlusion of fallopian tubes . . . . . . . . . . . . . . . . . . . . . . . . . . . . . . . . .66.2–66.3
Hysterectomy . . . . . . . . . . . . . . . . . . . . . . . . . . . . . . . . . . . . . . . . . . . . . . . . . . . . .68.3–68.7,68.9
Obstetrical procedures . . . . . . . . . . . . . . . . . . . . . . . . . . . . . . . . . . . . . . . . . . . . . . . . . . . . . .72–75
Episiotomy with or without forceps or vacuum extraction . . . . . . . . . . . . . . . . . .72.1,72.21,72.31,72.71,73.6
Artificial rupture of membranes . . . . . . . . . . . . . . . . . . . . . . . . . . . . . . . . . . . . . . . . . . . . . . . . .73.0
Medical induction of labor . . . . . . . . . . . . . . . . . . . . . . . . . . . . . . . . . . . . . . . . . . . . . . . . . . . .73.4
Cesarean section. . . . . . . . . . . . . . . . . . . . . . . . . . . . . . . . . . . . . . . . . . . . . . .74.0–74.2,74.4,74.99
Repair of current obstetric laceration. . . . . . . . . . . . . . . . . . . . . . . . . . . . . . . . . . . . . . . . . .75.5–75.6
Operations on the musculoskeletal system . . . . . . . . . . . . . . . . . . . . . . . . .76–84,00.70–00.73,00.80–00.84
Partial excision of bone . . . . . . . . . . . . . . . . . . . . . . . . . . . . . . . . . . . . . . . . . . .76.2–76.3,77.6–77.8
Reduction of fracture . . . . . . . . . . . . . . . . . . . . . . . . . . . . . . . . . . . . . . . . . . . . . . . .76.7,79.0–79.3
Open reduction of fracture with internal fixation . . . . . . . . . . . . . . . . . . . . . . . . . . . . . . . . . . . . .79.3
Excision or destruction of intervertebral disc. . . . . . . . . . . . . . . . . . . . . . . . . . . . . . . . . . . . . . . . .80.5
Total hip replacement . . . . . . . . . . . . . . . . . . . . . . . . . . . . . . . . . . . . . . . . . . . . . . . . . . . . . .81.51
Total knee replacement. . . . . . . . . . . . . . . . . . . . . . . . . . . . . . . . . . . . . . . . . . . . . . . . . . . . .81.54
Operations on the integumentary system . . . . . . . . . . . . . . . . . . . . . . . . . . . . . . . . . . . . . . . . . . .85–86
Debridement of wound, infection, or burn . . . . . . . . . . . . . . . . . . . . . . . . . . . . . . . . . . . . . .86.22,86.28
Miscellaneous diagnostic and therapeutic procedures and new technologies3 . . . . . . . . . . . . . . . . . .87–99,00
Computerized axial tomography . . . . . . . . . . . . . . . . . . . . . . . . . . . . . . . .87.03,87.41,87.71,88.01,88.38
Arteriography and angiocardiography using contrast material. . . . . . . . . . . . . . . . . . . . . . . . . . .88.4–88.5
Diagnostic ultrasound . . . . . . . . . . . . . . . . . . . . . . . . . . . . . . . . . . . . . .88.7,00.21–00.25,00.28–00.29
Physical therapy procedures . . . . . . . . . . . . . . . . . . . . . . . . . . . . . . . . . . . . . . . . . . . . . . .93.1–93.3
Respiratory therapy . . . . . . . . . . . . . . . . . . . . . . . . . . . . . . . . . . . . . . . . . . . . . . . . .93.9,96.7,00.12
Insertion of endotracheal tube . . . . . . . . . . . . . . . . . . . . . . . . . . . . . . . . . . . . . . . . . . . . . . . .96.04
Transfusion of blood and blood components . . . . . . . . . . . . . . . . . . . . . . . . . . . . . . . . . . . . . . . .99.0
Injection or infusion of cancer chemotherapeutic substance . . . . . . . . . . . . . . . . . . . . . . . . . .99.25,00.10
1,155
315
101
76
53
298
1,167
282
7,235
661
652
444
1,115
418
645
371
5,571
1,045
522
252
341
414
344
1,025
146
250
168
1,957
418
351
569
7,076
454
960
653
1,295
1,308
4,254
171
672
439
280
231
542
1,598
402
13,775
740
1,698
888
386
1,088
476
1,968
221
534
158
29
45
36
183
641
152
4,116
429
425
320
666
198
325
186
2,431
457
212
115
192
134
80
491
69
250
168
...
...
...
...
...
...
...
...
...
...
2,005
95
326
203
135
102
199
806
236
6,729
366
938
411
154
561
247
851
130
621
156
72
31
17
115
526
129
3,119
232
227
123
450
219
320
185
3,140
588
311
137
150
280
264
534
77
...
...
1,957
418
351
569
7,076
454
960
653
1,295
1,308
2,249
76
346
237
145
129
344
792
166
7,046
374
760
477
232
527
229
1,117
90
Male
Female
Number in thousands
. . . Category not applicable.
1
In 2002, the Chapter 00 codes were established. For reporting purposes, between 2003 and 2005, all Chapter 00 codes were grouped with the miscellaneous diagnostic and therapeutic procedures
and new technologies category. Beginning in 2006, the 00 codes are included in the categories and chapters of their previous codes, where applicable. See ‘‘Use of Tables.’’
2
See Table 29 for comparison of number of procedures with number of discharges with procedures.
3
Chapter 00 codes included in this category: 00.01–00.03, 00.09, 00.10–00.18, 00.21–00.25, 00.28–00.29, 00.31–00.35, 00.39, 00.40–00.43, 00.45–00.48, 00.52, 00.74–00.76, 00.91–00.93.
Page 44 [ Series 13, No. 168
Table 33. Rate of all-listed procedures for discharges from short-stay hospitals, by sex and procedure category: United States, 2006
[Discharges of inpatients from nonfederal hospitals. Excludes newborn infants. Procedure groupings and code numbers are based on the International Classification of
Diseases, Ninth Revision, Clinical Modification (ICD–9–CM)]
Procedure category and ICD–9–CM code
Both
sexes
Male
Female
Rate per 10,000 population1
All procedures2 . . . . . . . . . . . . . . . . . . . . . . . . . . . . . . . . . . . . . . . . . . . . . . . . . . . . . . . . . . . . . .
1,541.3
1,261.5
Operations on the nervous system. . . . . . . . . . . . . . . . . . . . . . . . . . . . . . . . . . . . . . . . . . . . . . .01–05
Spinal tap . . . . . . . . . . . . . . . . . . . . . . . . . . . . . . . . . . . . . . . . . . . . . . . . . . . . . . . . . . . . .03.31
Operations on the endocrine system . . . . . . . . . . . . . . . . . . . . . . . . . . . . . . . . . . . . . . . . . . . . .06–07
Operations on the eye . . . . . . . . . . . . . . . . . . . . . . . . . . . . . . . . . . . . . . . . . . . . . . . . . . . . . .08–16
Operations on the ear . . . . . . . . . . . . . . . . . . . . . . . . . . . . . . . . . . . . . . . . . . . . . . . . . . . . . .18–20
Operations on the nose, mouth, and pharynx . . . . . . . . . . . . . . . . . . . . . . . . . . . . . . . . . . . . . . . .21–29
Operations on the respiratory system . . . . . . . . . . . . . . . . . . . . . . . . . . . . . . . . . . . . . . . . . . . . .30–34
Bronchoscopy with or without biopsy . . . . . . . . . . . . . . . . . . . . . . . . . . . . . . . . . . . .33.21–33.24,33.27
Operations on the cardiovascular system . . . . . . . . . . . . . . . . . .35–39,00.50–00.51,00.53–00.55,00.61–00.66
Balloon angioplasty of coronary artery or coronary atherectomy. . . . . . . . . . . . . . . . . . . . . . . . . . . .00.66
Insertion of coronary artery stent(s) . . . . . . . . . . . . . . . . . . . . . . . . . . . . . . . . . . . . . . . . .36.06–36.07
Coronary artery bypass graft3 . . . . . . . . . . . . . . . . . . . . . . . . . . . . . . . . . . . . . . . . . . . . . . . . .36.1
Cardiac catheterization. . . . . . . . . . . . . . . . . . . . . . . . . . . . . . . . . . . . . . . . . . . . . . . . .37.21–37.23
Insertion, replacement, removal, and revision of pacemaker leads or device . . . . . . . . .37.7–37.8,00.50,00.53
Hemodialysis . . . . . . . . . . . . . . . . . . . . . . . . . . . . . . . . . . . . . . . . . . . . . . . . . . . . . . . . . . .39.95
Operations on the hemic and lymphatic system . . . . . . . . . . . . . . . . . . . . . . . . . . . . . . . . . . . . . . .40–41
Operations on the digestive system . . . . . . . . . . . . . . . . . . . . . . . . . . . . . . . . . . . . . . . . . . . . . .42–54
Endoscopy of small intestine with or without biopsy . . . . . . . . . . . . . . . . . . . . . . . . . . .45.11–45.14,45.16
Endoscopy of large intestine with or without biopsy . . . . . . . . . . . . . . . . . . . . . . . . . . . . . . .45.21–45.25
Partial excision of large intestine. . . . . . . . . . . . . . . . . . . . . . . . . . . . . . . . . . . . . . . . . . . . . . . .45.7
Appendectomy, excluding incidental. . . . . . . . . . . . . . . . . . . . . . . . . . . . . . . . . . . . . . . . . . . . . .47.0
Cholecystectomy . . . . . . . . . . . . . . . . . . . . . . . . . . . . . . . . . . . . . . . . . . . . . . . . . . . . . . . . .51.2
Lysis of peritoneal adhesions . . . . . . . . . . . . . . . . . . . . . . . . . . . . . . . . . . . . . . . . . . . . . . . . . .54.5
Operations on the urinary system . . . . . . . . . . . . . . . . . . . . . . . . . . . . . . . . . . . . . . . . . . . . . . .55–59
Cystoscopy with or without biopsy. . . . . . . . . . . . . . . . . . . . . . . . . . . . . . . . . . . . . . . . . .57.31–57.33
Operations on the male genital organs . . . . . . . . . . . . . . . . . . . . . . . . . . . . . . . . . . . . . . . . . . . .60–64
Prostatectomy. . . . . . . . . . . . . . . . . . . . . . . . . . . . . . . . . . . . . . . . . . . . . . . . . . . . . . . .60.2–60.6
Operations on the female genital organs . . . . . . . . . . . . . . . . . . . . . . . . . . . . . . . . . . . . . . . . . . .65–71
Oophorectomy and salpingo-oophorectomy. . . . . . . . . . . . . . . . . . . . . . . . . . . . . . . . . . . . . .65.3–65.6
Bilateral destruction or occlusion of fallopian tubes . . . . . . . . . . . . . . . . . . . . . . . . . . . . . . . . .66.2–66.3
Hysterectomy . . . . . . . . . . . . . . . . . . . . . . . . . . . . . . . . . . . . . . . . . . . . . . . . . . . . .68.3–68.7,68.9
Obstetrical procedures . . . . . . . . . . . . . . . . . . . . . . . . . . . . . . . . . . . . . . . . . . . . . . . . . . . . . .72–75
Episiotomy with or without forceps or vacuum extraction . . . . . . . . . . . . . . . . . .72.1,72.21,72.31,72.71,73.6
Artificial rupture of membranes . . . . . . . . . . . . . . . . . . . . . . . . . . . . . . . . . . . . . . . . . . . . . . . . .73.0
Medical induction of labor . . . . . . . . . . . . . . . . . . . . . . . . . . . . . . . . . . . . . . . . . . . . . . . . . . . .73.4
Cesarean section. . . . . . . . . . . . . . . . . . . . . . . . . . . . . . . . . . . . . . . . . . . . . . .74.0–74.2,74.4,74.99
Repair of current obstetric laceration. . . . . . . . . . . . . . . . . . . . . . . . . . . . . . . . . . . . . . . . . .75.5–75.6
Operations on the musculoskeletal system . . . . . . . . . . . . . . . . . . . . . . . . .76–84,00.70–00.73,00.80–00.84
Partial excision of bone . . . . . . . . . . . . . . . . . . . . . . . . . . . . . . . . . . . . . . . . . . .76.2–76.3,77.6–77.8
Reduction of fracture . . . . . . . . . . . . . . . . . . . . . . . . . . . . . . . . . . . . . . . . . . . . . . . .76.7,79.0–79.3
Open reduction of fracture with internal fixation . . . . . . . . . . . . . . . . . . . . . . . . . . . . . . . . . . . . .79.3
Excision or destruction of intervertebral disc. . . . . . . . . . . . . . . . . . . . . . . . . . . . . . . . . . . . . . . . .80.5
Total hip replacement . . . . . . . . . . . . . . . . . . . . . . . . . . . . . . . . . . . . . . . . . . . . . . . . . . . . . .81.51
Total knee replacement. . . . . . . . . . . . . . . . . . . . . . . . . . . . . . . . . . . . . . . . . . . . . . . . . . . . .81.54
Operations on the integumentary system . . . . . . . . . . . . . . . . . . . . . . . . . . . . . . . . . . . . . . . . . . .85–86
Debridement of wound, infection, or burn . . . . . . . . . . . . . . . . . . . . . . . . . . . . . . . . . . . . . .86.22,86.28
Miscellaneous diagnostic and therapeutic procedures and new technologies4 . . . . . . . . . . . . . . . . . .87–99,00
Computerized axial tomography . . . . . . . . . . . . . . . . . . . . . . . . . . . . . . . .87.03,87.41,87.71,88.01,88.38
Arteriography and angiocardiography using contrast material. . . . . . . . . . . . . . . . . . . . . . . . . . .88.4–88.5
Diagnostic ultrasound . . . . . . . . . . . . . . . . . . . . . . . . . . . . . . . . . . . . . .88.7,00.21–00.25,00.28–00.29
Physical therapy procedures . . . . . . . . . . . . . . . . . . . . . . . . . . . . . . . . . . . . . . . . . . . . . . .93.1–93.3
Respiratory therapy . . . . . . . . . . . . . . . . . . . . . . . . . . . . . . . . . . . . . . . . . . . . . . . . .93.9,96.7,00.12
Insertion of endotracheal tube . . . . . . . . . . . . . . . . . . . . . . . . . . . . . . . . . . . . . . . . . . . . . . . .96.04
Transfusion of blood and blood components . . . . . . . . . . . . . . . . . . . . . . . . . . . . . . . . . . . . . . . .99.0
Injection or infusion of cancer chemotherapeutic substance . . . . . . . . . . . . . . . . . . . . . . . . . .99.25,00.10
38.7
10.6
3.4
2.6
1.8
10.0
39.1
9.4
242.6
22.2
21.9
14.9
37.4
14.0
21.6
12.4
186.8
35.0
17.5
8.4
11.5
13.9
11.5
34.4
4.9
8.4
5.6
65.6
14.0
11.8
19.1
237.3
15.2
32.2
21.9
43.4
43.9
142.6
5.7
22.5
14.7
9.4
7.7
18.2
53.6
13.5
461.9
24.8
56.9
29.8
12.9
36.5
16.0
66.0
7.4
36.4
10.8
2.0
3.1
2.5
12.5
43.7
10.4
280.9
29.3
29.0
21.9
45.4
13.5
22.2
12.7
166.0
31.2
14.4
7.8
13.1
9.2
5.5
33.5
4.7
17.1
11.5
...
...
...
...
...
...
...
...
...
...
136.8
6.5
22.3
13.8
9.2
7.0
13.6
55.0
16.1
459.3
25.0
64.0
28.1
10.5
38.3
16.9
58.1
8.9
1,811.5
41.0
10.3 4.8
2.1
1.1
7.6
34.7
8.5
205.6
15.3 15.0
8.1 29.6
14.5
21.1 12.2
207.0
38.7
20.5
9.0 9.9 18.5 17.4 35.2
5.1
. . .
. . .
129.0
27.6
23.1
37.5
466.4
29.9 63.2 43.0 85.3
86.2
148.3
5.0
22.8
15.6 9.5 8.5 22.7 52.2
10.9 464.5
24.7 50.1
31.4
15.3
34.7 15.1 73.6 6.0 . . . Category not applicable.
1
Rates were calculated using U.S. Census Bureau 2000-based postcensal estimates of the civilian population as of July 1, 2006.
2
In 2002, the Chapter 00 codes were established. For reporting purposes, between 2003 and 2005, all Chapter 00 codes were grouped with the miscellaneous diagnostic and therapeutic procedures
and new technologies category. Beginning in 2006, the 00 codes are included in the categories and chapters of their previous codes, where applicable. See ‘‘Use of Tables.’’
3
See Table 29 for comparison of rate of procedures with rate of discharges with procedures.
4
Chapter 00 codes included in this category: 00.01–00.03, 00.09, 00.10–00.18, 00.21–00.25, 00.28–00.29, 00.31–00.35, 00.39, 00.40–00.43, 00.45–00.48, 00.52, 00.74–00.76, 00.91–00.93.
Series 13, No. 168 [ Page 45
Table 34. Number of all-listed procedures for discharges from short-stay hospitals, by geographic region and procedure category:
United States, 2006
[Discharges of inpatients from nonfederal hospitals. Excludes newborn infants. Procedure groupings and code numbers are based on the International Classification of
Diseases, Ninth Revision, Clinical Modification (ICD–9–CM)]
Procedure category and ICD–9–CM code
United
States
Northeast
All procedures1 . . . . . . . . . . . . . . . . . . . . . . . . . . . . . . . . . . . . . . . . . . . . . . . . . . . . . . . . . . . .
45,963
10,025
9,584
16,909
9,445
Operations on the nervous system . . . . . . . . . . . . . . . . . . . . . . . . . . . . . . . . . . . . . . . . . . . .01–05
Spinal tap. . . . . . . . . . . . . . . . . . . . . . . . . . . . . . . . . . . . . . . . . . . . . . . . . . . . . . . . . . .03.31
Operations on the endocrine system . . . . . . . . . . . . . . . . . . . . . . . . . . . . . . . . . . . . . . . . . . .06–07
Operations on the eye . . . . . . . . . . . . . . . . . . . . . . . . . . . . . . . . . . . . . . . . . . . . . . . . . . . .08–16
Operations on the ear . . . . . . . . . . . . . . . . . . . . . . . . . . . . . . . . . . . . . . . . . . . . . . . . . . . .18–20
Operations on the nose, mouth, and pharynx . . . . . . . . . . . . . . . . . . . . . . . . . . . . . . . . . . . . . .21–29
Operations on the respiratory system. . . . . . . . . . . . . . . . . . . . . . . . . . . . . . . . . . . . . . . . . . .30–34
Bronchoscopy with or without biopsy . . . . . . . . . . . . . . . . . . . . . . . . . . . . . . . . . .33.21–33.24,33.27
Operations on the cardiovascular system . . . . . . . . . . . . . . . .35–39,00.50–00.51,00.53–00.55,00.61–00.66
Balloon angioplasty of coronary artery or coronary atherectomy . . . . . . . . . . . . . . . . . . . . . . . . .00.66
Insertion of coronary artery stent(s) . . . . . . . . . . . . . . . . . . . . . . . . . . . . . . . . . . . . . .36.06–36.07
Coronary artery bypass graft2 . . . . . . . . . . . . . . . . . . . . . . . . . . . . . . . . . . . . . . . . . . . . . . .36.1
Cardiac catheterization . . . . . . . . . . . . . . . . . . . . . . . . . . . . . . . . . . . . . . . . . . . . . .37.21–37.23
Insertion, replacement, removal, and revision of pacemaker leads or device . . . . . . .37.7–37.8,00.50,00.53
Hemodialysis . . . . . . . . . . . . . . . . . . . . . . . . . . . . . . . . . . . . . . . . . . . . . . . . . . . . . . . .39.95
Operations on the hemic and lymphatic system . . . . . . . . . . . . . . . . . . . . . . . . . . . . . . . . . . . .40–41
Operations on the digestive system . . . . . . . . . . . . . . . . . . . . . . . . . . . . . . . . . . . . . . . . . . . .42–54
Endoscopy of small intestine with or without biopsy . . . . . . . . . . . . . . . . . . . . . . . . .45.11–45.14,45.16
Endoscopy of large intestine with or without biopsy . . . . . . . . . . . . . . . . . . . . . . . . . . . . .45.21–45.25
Partial excision of large intestine . . . . . . . . . . . . . . . . . . . . . . . . . . . . . . . . . . . . . . . . . . . . .45.7
Appendectomy, excluding incidental . . . . . . . . . . . . . . . . . . . . . . . . . . . . . . . . . . . . . . . . . . .47.0
Cholecystectomy . . . . . . . . . . . . . . . . . . . . . . . . . . . . . . . . . . . . . . . . . . . . . . . . . . . . . . .51.2
Lysis of peritoneal adhesions . . . . . . . . . . . . . . . . . . . . . . . . . . . . . . . . . . . . . . . . . . . . . . .54.5
Operations on the urinary system . . . . . . . . . . . . . . . . . . . . . . . . . . . . . . . . . . . . . . . . . . . . .55–59
Cystoscopy with or without biopsy . . . . . . . . . . . . . . . . . . . . . . . . . . . . . . . . . . . . . . .57.31–57.33
Operations on the male genital organs . . . . . . . . . . . . . . . . . . . . . . . . . . . . . . . . . . . . . . . . . .60–64
Prostatectomy . . . . . . . . . . . . . . . . . . . . . . . . . . . . . . . . . . . . . . . . . . . . . . . . . . . . .60.2–60.6
Operations on the female genital organs. . . . . . . . . . . . . . . . . . . . . . . . . . . . . . . . . . . . . . . . .65–71
Oophorectomy and salpingo-oophorectomy . . . . . . . . . . . . . . . . . . . . . . . . . . . . . . . . . . .65.3–65.6
Bilateral destruction or occlusion of fallopian tubes. . . . . . . . . . . . . . . . . . . . . . . . . . . . . . .66.2–66.3
Hysterectomy . . . . . . . . . . . . . . . . . . . . . . . . . . . . . . . . . . . . . . . . . . . . . . . . . .68.3–68.7,68.9
Obstetrical procedures . . . . . . . . . . . . . . . . . . . . . . . . . . . . . . . . . . . . . . . . . . . . . . . . . . . .72–75
Episiotomy with or without forceps or vacuum extraction . . . . . . . . . . . . . . . .72.1,72.21,72.31,72.71,73.6
Artificial rupture of membranes . . . . . . . . . . . . . . . . . . . . . . . . . . . . . . . . . . . . . . . . . . . . . .73.0
Medical induction of labor . . . . . . . . . . . . . . . . . . . . . . . . . . . . . . . . . . . . . . . . . . . . . . . . .73.4
Cesarean section . . . . . . . . . . . . . . . . . . . . . . . . . . . . . . . . . . . . . . . . . . . .74.0–74.2,74.4,74.99
Repair of current obstetric laceration . . . . . . . . . . . . . . . . . . . . . . . . . . . . . . . . . . . . . . .75.5–75.6
Operations on the musculoskeletal system . . . . . . . . . . . . . . . . . . . . . . .76–84,00.70–00.73,00.80–00.84
Partial excision of bone . . . . . . . . . . . . . . . . . . . . . . . . . . . . . . . . . . . . . . . . .76.2–76.3,77.6–77.8
Reduction of fracture . . . . . . . . . . . . . . . . . . . . . . . . . . . . . . . . . . . . . . . . . . . . . .76.7,79.0–79.3
Open reduction of fracture with internal fixation . . . . . . . . . . . . . . . . . . . . . . . . . . . . . . . . . . .79.3
Excision or destruction of intervertebral disc . . . . . . . . . . . . . . . . . . . . . . . . . . . . . . . . . . . . . .80.5
Total hip replacement . . . . . . . . . . . . . . . . . . . . . . . . . . . . . . . . . . . . . . . . . . . . . . . . . . .81.51
Total knee replacement . . . . . . . . . . . . . . . . . . . . . . . . . . . . . . . . . . . . . . . . . . . . . . . . . .81.54
Operations on the integumentary system . . . . . . . . . . . . . . . . . . . . . . . . . . . . . . . . . . . . . . . .85–86
Debridement of wound, infection, or burn . . . . . . . . . . . . . . . . . . . . . . . . . . . . . . . . . . .86.22,86.28
Miscellaneous diagnostic and therapeutic procedures and new technologies3 . . . . . . . . . . . . . . . .87–99,00
Computerized axial tomography . . . . . . . . . . . . . . . . . . . . . . . . . . . . .87.03,87.41,87.71,88.01,88.38
Arteriography and angiocardiography using contrast material . . . . . . . . . . . . . . . . . . . . . . . .88.4–88.5
Diagnostic ultrasound . . . . . . . . . . . . . . . . . . . . . . . . . . . . . . . . . . . .88.7,00.21–00.25,00.28–00.29
Physical therapy procedures . . . . . . . . . . . . . . . . . . . . . . . . . . . . . . . . . . . . . . . . . . . .93.1–93.3
Respiratory therapy . . . . . . . . . . . . . . . . . . . . . . . . . . . . . . . . . . . . . . . . . . . . . .93.9,96.7,00.12
Insertion of endotracheal tube . . . . . . . . . . . . . . . . . . . . . . . . . . . . . . . . . . . . . . . . . . . . . .96.04
Transfusion of blood and blood components . . . . . . . . . . . . . . . . . . . . . . . . . . . . . . . . . . . . . .99.0
Injection or infusion of cancer chemotherapeutic substance . . . . . . . . . . . . . . . . . . . . . . . .99.25,00.10
1,155
315
101
76
53
298
1,167
282
7,235
661
652
444
1,115
418
645
371
5,571
1,045
522
252
341
414
344
1,025
146
250
168
1,957
418
351
569
7,076
454
960
653
1,295
1,308
4,254
171
672
439
280
231
542
1,598
402
13,775
740
1,698
888
386
1,088
476
1,968
221
253
64
24
16
*
65
263
62
1,367
123
109
64
201
103
127
76
1,168
217
115
49
62
76
66
243
39
49
34
295
58
43
84
1,080
75
120
98
206
204
828
42
129
85
48
57
103
289
69
3,998
377
328
318
113
310
102
357
57
239
46
14
*
*
55
247
62
1,620
168
203
122
258
94
113
73
1,207
249
116
61
80
79
76
202
32
53
38
441
111
63
143
1,590
93
267
160
236
302
1,003
39
162
107
59
57
163
271
74
2,545
*
405
132
*
184
90
399
21
381
118
42
31
*
100
431
99
2,816
239
221
181
458
147
262
130
2,058
381
182
93
110
181
133
385
54
86
54
826
175
171
228
2,558
178
322
217
536
451
1,529
62
241
159
105
69
178
794
209
4,717
144
675
279
*
373
180
800
93
282
*
21
*11
*
78
226
58
1,432
130
119
76
199
73
143
91
1,139
197
110
49
89
78
70
195
21
63
43
395
75
74
114
1,848
107
251
178
318
351
894
29
139
89
69
48
98
244
49
2,516
103
290
159
*
221
104
412
51
Midwest
South
West
Number in thousands
* Figure does not meet standards of reliability or precision.
1
In 2002, the Chapter 00 codes were established. For reporting purposes, between 2003 and 2005, all Chapter 00 codes were grouped with the miscellaneous diagnostic and therapeutic procedures
and new technologies category. Beginning in 2006, the 00 codes are included in the categories and chapters of their previous codes, where applicable. See ‘‘Use of Tables.’’
2
See Table 29 for comparison of number of procedures with number of discharges with procedures.
Chapter 00 codes included in this category: 00.01–00.03, 00.09, 00.10–00.18, 00.21–00.25, 00.28–00.29, 00.31–00.35, 00.39, 00.40–00.43, 00.45–00.48, 00.52, 00.74–00.76, 00.91–00.93.
3
Page 46 [ Series 13, No. 168
Table 35. Rate of all-listed procedures for discharges from short-stay hospitals, by geographic region and procedure category:
United States, 2006
[Discharges of inpatients from nonfederal hospitals. Excludes newborn infants. Procedure groupings and code numbers are based on the International Classification of
Diseases, Ninth Revision, Clinical Modification (ICD–9–CM)]
Procedure category and ICD–9–CM code
United
States
All procedures2 . . . . . . . . . . . . . . . . . . . . . . . . . . . . . . . . . . . . . . . . . . . . . . . . . . . . . . . . . . . . . .
1,541.3
1,833.3
1,449.1
1,559.7
Operations on the nervous system. . . . . . . . . . . . . . . . . . . . . . . . . . . . . . . . . . . . . . . . . . . . . . .01–05
Spinal tap . . . . . . . . . . . . . . . . . . . . . . . . . . . . . . . . . . . . . . . . . . . . . . . . . . . . . . . . . . . . .03.31
Operations on the endocrine system . . . . . . . . . . . . . . . . . . . . . . . . . . . . . . . . . . . . . . . . . . . . .06–07
Operations on the eye . . . . . . . . . . . . . . . . . . . . . . . . . . . . . . . . . . . . . . . . . . . . . . . . . . . . . .08–16
Operations on the ear . . . . . . . . . . . . . . . . . . . . . . . . . . . . . . . . . . . . . . . . . . . . . . . . . . . . . .18–20
Operations on the nose, mouth, and pharynx . . . . . . . . . . . . . . . . . . . . . . . . . . . . . . . . . . . . . . . .21–29
Operations on the respiratory system . . . . . . . . . . . . . . . . . . . . . . . . . . . . . . . . . . . . . . . . . . . . .30–34
Bronchoscopy with or without biopsy . . . . . . . . . . . . . . . . . . . . . . . . . . . . . . . . . . . .33.21–33.24,33.27
Operations on the cardiovascular system . . . . . . . . . . . . . . . . . .35–39,00.50–00.51,00.53–00.55,00.61–00.66
Balloon angioplasty of coronary artery or coronary atherectomy. . . . . . . . . . . . . . . . . . . . . . . . . . . .00.66
Insertion of coronary artery stent(s) . . . . . . . . . . . . . . . . . . . . . . . . . . . . . . . . . . . . . . . . .36.06–36.07
Coronary artery bypass graft3 . . . . . . . . . . . . . . . . . . . . . . . . . . . . . . . . . . . . . . . . . . . . . . . . .36.1
Cardiac catheterization. . . . . . . . . . . . . . . . . . . . . . . . . . . . . . . . . . . . . . . . . . . . . . . . .37.21–37.23
Insertion, replacement, removal, and revision of pacemaker leads or device . . . . . . . . .37.7–37.8,00.50,00.53
Hemodialysis . . . . . . . . . . . . . . . . . . . . . . . . . . . . . . . . . . . . . . . . . . . . . . . . . . . . . . . . . . .39.95
Operations on the hemic and lymphatic system . . . . . . . . . . . . . . . . . . . . . . . . . . . . . . . . . . . . . . .40–41
Operations on the digestive system . . . . . . . . . . . . . . . . . . . . . . . . . . . . . . . . . . . . . . . . . . . . . .42–54
Endoscopy of small intestine with or without biopsy . . . . . . . . . . . . . . . . . . . . . . . . . . .45.11–45.14,45.16
Endoscopy of large intestine with or without biopsy . . . . . . . . . . . . . . . . . . . . . . . . . . . . . . .45.21–45.25
Partial excision of large intestine. . . . . . . . . . . . . . . . . . . . . . . . . . . . . . . . . . . . . . . . . . . . . . . .45.7
Appendectomy, excluding incidental. . . . . . . . . . . . . . . . . . . . . . . . . . . . . . . . . . . . . . . . . . . . . .47.0
Cholecystectomy . . . . . . . . . . . . . . . . . . . . . . . . . . . . . . . . . . . . . . . . . . . . . . . . . . . . . . . . .51.2
Lysis of peritoneal adhesions . . . . . . . . . . . . . . . . . . . . . . . . . . . . . . . . . . . . . . . . . . . . . . . . . .54.5
Operations on the urinary system . . . . . . . . . . . . . . . . . . . . . . . . . . . . . . . . . . . . . . . . . . . . . . .55–59
Cystoscopy with or without biopsy. . . . . . . . . . . . . . . . . . . . . . . . . . . . . . . . . . . . . . . . . .57.31–57.33
Operations on the male genital organs . . . . . . . . . . . . . . . . . . . . . . . . . . . . . . . . . . . . . . . . . . . .60–64
Prostatectomy. . . . . . . . . . . . . . . . . . . . . . . . . . . . . . . . . . . . . . . . . . . . . . . . . . . . . . . .60.2–60.6
Operations on the female genital organs . . . . . . . . . . . . . . . . . . . . . . . . . . . . . . . . . . . . . . . . . . .65–71
Oophorectomy and salpingo-oophorectomy. . . . . . . . . . . . . . . . . . . . . . . . . . . . . . . . . . . . . .65.3–65.6
Bilateral destruction or occlusion of fallopian tubes . . . . . . . . . . . . . . . . . . . . . . . . . . . . . . . . .66.2–66.3
Hysterectomy . . . . . . . . . . . . . . . . . . . . . . . . . . . . . . . . . . . . . . . . . . . . . . . . . . . . .68.3–68.7,68.9
Obstetrical procedures . . . . . . . . . . . . . . . . . . . . . . . . . . . . . . . . . . . . . . . . . . . . . . . . . . . . . .72–75
Episiotomy with or without forceps or vacuum extraction . . . . . . . . . . . . . . . . . .72.1,72.21,72.31,72.71,73.6
Artificial rupture of membranes . . . . . . . . . . . . . . . . . . . . . . . . . . . . . . . . . . . . . . . . . . . . . . . . .73.0
Medical induction of labor . . . . . . . . . . . . . . . . . . . . . . . . . . . . . . . . . . . . . . . . . . . . . . . . . . . .73.4
Cesarean section. . . . . . . . . . . . . . . . . . . . . . . . . . . . . . . . . . . . . . . . . . . . . . .74.0–74.2,74.4,74.99
Repair of current obstetric laceration. . . . . . . . . . . . . . . . . . . . . . . . . . . . . . . . . . . . . . . . . .75.5–75.6
Operations on the musculoskeletal system . . . . . . . . . . . . . . . . . . . . . . . . .76–84,00.70–00.73,00.80–00.84
Partial excision of bone . . . . . . . . . . . . . . . . . . . . . . . . . . . . . . . . . . . . . . . . . . .76.2–76.3,77.6–77.8
Reduction of fracture . . . . . . . . . . . . . . . . . . . . . . . . . . . . . . . . . . . . . . . . . . . . . . . .76.7,79.0–79.3
Open reduction of fracture with internal fixation . . . . . . . . . . . . . . . . . . . . . . . . . . . . . . . . . . . . .79.3
Excision or destruction of intervertebral disc. . . . . . . . . . . . . . . . . . . . . . . . . . . . . . . . . . . . . . . . .80.5
Total hip replacement . . . . . . . . . . . . . . . . . . . . . . . . . . . . . . . . . . . . . . . . . . . . . . . . . . . . . .81.51
Total knee replacement. . . . . . . . . . . . . . . . . . . . . . . . . . . . . . . . . . . . . . . . . . . . . . . . . . . . .81.54
Operations on the integumentary system . . . . . . . . . . . . . . . . . . . . . . . . . . . . . . . . . . . . . . . . . . .85–86
Debridement of wound, infection, or burn . . . . . . . . . . . . . . . . . . . . . . . . . . . . . . . . . . . . . .86.22,86.28
Miscellaneous diagnostic and therapeutic procedures and new technologies4 . . . . . . . . . . . . . . . . . .87–99,00
Computerized axial tomography . . . . . . . . . . . . . . . . . . . . . . . . . . . . . . . .87.03,87.41,87.71,88.01,88.38
Arteriography and angiocardiography using contrast material. . . . . . . . . . . . . . . . . . . . . . . . . . .88.4–88.5
Diagnostic ultrasound . . . . . . . . . . . . . . . . . . . . . . . . . . . . . . . . . . . . . .88.7,00.21–00.25,00.28–00.29
Physical therapy procedures . . . . . . . . . . . . . . . . . . . . . . . . . . . . . . . . . . . . . . . . . . . . . . .93.1–93.3
Respiratory therapy . . . . . . . . . . . . . . . . . . . . . . . . . . . . . . . . . . . . . . . . . . . . . . . . .93.9,96.7,00.12
Insertion of endotracheal tube . . . . . . . . . . . . . . . . . . . . . . . . . . . . . . . . . . . . . . . . . . . . . . . .96.04
Transfusion of blood and blood components . . . . . . . . . . . . . . . . . . . . . . . . . . . . . . . . . . . . . . . .99.0
Injection or infusion of cancer chemotherapeutic substance . . . . . . . . . . . . . . . . . . . . . . . . . .99.25,00.10
38.7
10.6
3.4
2.6
1.8
10.0
39.1
9.4
242.6
22.2
21.9
14.9
37.4
14.0
21.6
12.4
186.8
35.0
17.5
8.4
11.5
13.9
11.5
34.4
4.9
8.4
5.6
65.6
14.0
11.8
19.1
237.3
15.2
32.2
21.9
43.4
43.9
142.6
5.7
22.5
14.7
9.4
7.7
18.2
53.6
13.5
461.9
24.8
56.9
29.8
12.9
36.5
16.0
66.0
7.4
46.2
11.7
4.4
2.9
*
11.8
48.2
11.3
250.0
22.6
19.8
11.6
36.7
18.9
23.1
13.9
213.6
39.7
21.0
9.1
11.3
13.8
12.1
44.5
7.1
8.9
6.2
54.0
10.5
7.8
15.3
197.5
13.8
21.9
18.0
37.6
37.3
151.4
7.6
23.7
15.5
8.7
10.3
18.9
52.8
12.7
731.1
68.9
60.0
58.1
20.7
56.7
18.6
65.2
10.4
36.2
7.0
2.2
*
*
8.4
37.3
9.4
245.0
25.4
30.7
18.5
39.0
14.2
17.0
11.0
182.5
37.7
17.6
9.2
12.2
12.0
11.4
30.6
4.9
8.0
5.7
66.6
16.8
9.6
21.7
240.4
14.1
40.4
24.2
35.6
45.7
151.7
5.9
24.5
16.2
8.9
8.6
24.7
40.9
11.2
384.8
*
61.2
19.9
*
27.8
13.7
60.4
3.1
35.1
10.9
3.9
2.9
*
9.3
39.7
9.1
259.8
22.1
20.4
16.7
42.3
13.5
24.2
12.0
189.8
35.1
16.7
8.5
10.1
16.7
12.3
35.5
5.0
7.9
4.9
76.2
16.2
15.8
21.0
236.0
16.4
29.7
20.0
49.4
41.6
141.0
5.7
22.3
14.7
9.7
6.4
16.4
73.3
19.3
435.1
13.3
62.2
25.8
*
34.4
16.6
73.8
8.5
Northeast
Midwest
South
West
Rate per 10,000 population1
1,369.1
40.9
* 3.0
*1.6
*
11.3
32.7
8.5
207.5
18.8 17.3
11.1 28.8
10.6
20.7 13.2
165.0
28.6
15.9
7.1 12.9 11.4 10.1 28.2
3.0
9.1
6.3
57.2
10.9
10.7
16.6
267.9
15.5 36.4 25.7 46.1
50.8
129.6
4.2
20.2
12.8 9.9 7.0 14.2 35.4
7.1 364.6
14.9 42.1
23.1
*
32.0 15.1 59.7 7.3 * Figure does not meet standards of reliability or precision.
1
Rates were calculated using U.S. Census Bureau 2000-based postcensal estimates of the civilian population as of July 1, 2006.
2
In 2002, the Chapter 00 codes were established. For reporting purposes, between 2003 and 2005, all Chapter 00 codes were grouped with the miscellaneous diagnostic and therapeutic procedures
and new technologies category. Beginning in 2006, the 00 codes are included in the categories and chapters of their previous codes, where applicable. See ‘‘Use of Tables.’’
3
See Table 29 for comparison of rate of procedures with rate of discharges with procedures.
Chapter 00 codes included in this category: 00.01–00.03, 00.09, 00.10–00.18, 00.21–00.25, 00.28–00.29, 00.31–00.35, 00.39, 00.40–00.43, 00.45–00.48, 00.52, 00.74–00.76, 00.91–00.93.
4
Series 13, No. 168 [ Page 47
Table 36. Number, percent distribution, and rate of discharges and days of care, with average length of stay for females with deliveries
discharged from short-stay hospitals, by type of delivery, age, and geographic region: United States, 2006
[Discharges of inpatients from nonfederal hospitals. Data are for discharges 10–54 years of age with International Classification of Diseases, Ninth Revision, Clinical
Modification (ICD–9–CM) code V27, ‘‘females with deliveries’’]
Discharges
Age and region
Days of care
Number in
thousands
Percent
distribution
Rate per
1,000
population1
Number in
thousands
Percent
distribution
Rate per
1,000
population1
Average
length
of stay
in days
All deliveries
10–54 years .
10–19 years
20–24 years
25–29 years
30–34 years
35–39 years
40–54 years
.
.
.
.
.
.
.
.
.
.
.
.
.
.
.
.
.
.
.
.
.
.
.
.
.
.
.
.
.
.
.
.
.
.
.
.
.
.
.
.
.
.
.
.
.
.
.
.
.
.
.
.
.
.
.
.
.
.
.
.
.
.
.
.
.
.
.
.
.
.
.
.
.
.
.
.
.
.
.
.
.
.
.
.
.
.
.
.
.
.
.
.
.
.
.
.
.
.
.
.
.
.
.
.
.
.
.
.
.
.
.
.
.
.
.
.
.
.
.
.
.
.
.
.
.
.
.
.
.
.
.
.
.
.
.
.
.
.
.
.
.
.
.
.
.
.
.
.
.
.
.
.
.
.
.
.
.
.
.
.
.
.
.
.
.
.
.
.
.
.
.
.
.
.
.
.
.
.
.
.
.
.
.
.
.
.
.
.
.
.
.
.
.
.
.
.
.
.
.
.
.
.
.
4,127
428
1,047
1,135
928
478
112
100.0
10.4
25.4
27.5
22.5
11.6
2.7
43.8
20.9
103.3
112.5
95.6
45.4
3.4
10,868
1,087
2,681
2,926
2,469
1,375
330
100.0
10.0
24.7
26.9
22.7
12.7
3.0
115.5
53.2
264.3
290.1
254.5
130.8
9.9
2.6
2.5
2.6
2.6
2.7
2.9
2.9
All regions
Northeast
Midwest .
South . .
West . .
.
.
.
.
.
.
.
.
.
.
.
.
.
.
.
.
.
.
.
.
.
.
.
.
.
.
.
.
.
.
.
.
.
.
.
.
.
.
.
.
.
.
.
.
.
.
.
.
.
.
.
.
.
.
.
.
.
.
.
.
.
.
.
.
.
.
.
.
.
.
.
.
.
.
.
.
.
.
.
.
.
.
.
.
.
.
.
.
.
.
.
.
.
.
.
.
.
.
.
.
.
.
.
.
.
.
.
.
.
.
.
.
.
.
.
.
.
.
.
.
.
.
.
.
.
.
.
.
.
.
.
.
.
.
.
.
.
.
.
.
.
.
.
.
.
4,127
618
849
1,613
1,047
100.0
15.0
20.6
39.1
25.4
43.8
35.7
40.9
47.2
47.8
10,868
1,792
2,108
4,321
2,647
100.0
16.5
19.4
39.8
24.4
115.5
103.6
101.5
126.4
121.0
2.6
2.9
2.5
2.7
2.5
.
.
.
.
.
.
.
.
.
.
Vaginal deliveries2
10–54 years .
10–19 years
20–24 years
25–29 years
30–34 years
35–39 years
40–54 years
.
.
.
.
.
.
.
.
.
.
.
.
.
.
.
.
.
.
.
.
.
.
.
.
.
.
.
.
.
.
.
.
.
.
.
.
.
.
.
.
.
.
.
.
.
.
.
.
.
.
.
.
.
.
.
.
.
.
.
.
.
.
.
.
.
.
.
.
.
.
.
.
.
.
.
.
.
.
.
.
.
.
.
.
.
.
.
.
.
.
.
.
.
.
.
.
.
.
.
.
.
.
.
.
.
.
.
.
.
.
.
.
.
.
.
.
.
.
.
.
.
.
.
.
.
.
.
.
.
.
.
.
.
.
.
.
.
.
.
.
.
.
.
.
.
.
.
.
.
.
.
.
.
.
.
.
.
.
.
.
.
.
.
.
.
.
.
.
.
.
.
.
.
.
.
.
.
.
.
.
.
.
.
.
.
.
.
.
.
.
.
.
.
.
.
.
.
.
.
.
.
.
.
2,833
335
755
801
599
278
64
100.0
11.8
26.7
28.3
21.1
9.8
2.3
30.1
16.4
74.5
79.4
61.7
26.5
1.9
6,164
765
1,645
1,716
1,279
607
151
100.0
12.4
26.7
27.8
20.7
9.9
2.5
65.5
37.4
162.2
170.2
131.8
57.7
4.5
2.2
2.3
2.2
2.1
2.1
2.2
2.3
All regions
Northeast
Midwest .
South . .
West . .
.
.
.
.
.
.
.
.
.
.
.
.
.
.
.
.
.
.
.
.
.
.
.
.
.
.
.
.
.
.
.
.
.
.
.
.
.
.
.
.
.
.
.
.
.
.
.
.
.
.
.
.
.
.
.
.
.
.
.
.
.
.
.
.
.
.
.
.
.
.
.
.
.
.
.
.
.
.
.
.
.
.
.
.
.
.
.
.
.
.
.
.
.
.
.
.
.
.
.
.
.
.
.
.
.
.
.
.
.
.
.
.
.
.
.
.
.
.
.
.
.
.
.
.
.
.
.
.
.
.
.
.
.
.
.
.
.
.
.
.
.
.
.
.
.
2,833
413
614
1,078
729
100.0
14.6
21.7
38.0
25.7
30.1
23.9
29.5
31.5
33.3
6,164
985
1,309
2,382
1,488
100.0
16.0
21.2
38.6
24.1
65.5
57.0
63.0
69.7
68.0
2.2
2.4
2.1
2.2
2.0
.
.
.
.
.
.
.
.
.
.
Cesarean deliveries3
10–54 years .
10–19 years
20–24 years
25–29 years
30–34 years
35–39 years
40–54 years
.
.
.
.
.
.
.
.
.
.
.
.
.
.
.
.
.
.
.
.
.
.
.
.
.
.
.
.
.
.
.
.
.
.
.
.
.
.
.
.
.
.
.
.
.
.
.
.
.
.
.
.
.
.
.
.
.
.
.
.
.
.
.
.
.
.
.
.
.
.
.
.
.
.
.
.
.
.
.
.
.
.
.
.
.
.
.
.
.
.
.
.
.
.
.
.
.
.
.
.
.
.
.
.
.
.
.
.
.
.
.
.
.
.
.
.
.
.
.
.
.
.
.
.
.
.
.
.
.
.
.
.
.
.
.
.
.
.
.
.
.
.
.
.
.
.
.
.
.
.
.
.
.
.
.
.
.
.
.
.
.
.
.
.
.
.
.
.
.
.
.
.
.
.
.
.
.
.
.
.
.
.
.
.
.
.
.
.
.
.
.
.
.
.
.
.
.
.
.
.
.
.
.
1,295
93
292
334
329
199
48
100.0
7.2
22.6
25.8
25.4
15.4
3.7
13.8
4.5
28.8
33.1
33.9
19.0
1.4
4,704
321
1,036
1,210
1,190
768
179
100.0
6.8
22.0
25.7
25.3
16.3
3.8
50.0
15.7
102.1
119.9
122.7
73.0
5.4
3.6
3.5
3.5
3.6
3.6
3.8
3.7
All regions
Northeast
Midwest .
South . .
West . .
.
.
.
.
.
.
.
.
.
.
.
.
.
.
.
.
.
.
.
.
.
.
.
.
.
.
.
.
.
.
.
.
.
.
.
.
.
.
.
.
.
.
.
.
.
.
.
.
.
.
.
.
.
.
.
.
.
.
.
.
.
.
.
.
.
.
.
.
.
.
.
.
.
.
.
.
.
.
.
.
.
.
.
.
.
.
.
.
.
.
.
.
.
.
.
.
.
.
.
.
.
.
.
.
.
.
.
.
.
.
.
.
.
.
.
.
.
.
.
.
.
.
.
.
.
.
.
.
.
.
.
.
.
.
.
.
.
.
.
.
.
.
.
.
.
1,295
206
236
536
318
100.0
15.9
18.2
41.4
24.5
13.8
11.9
11.3
15.7
14.5
4,704
806
799
1,939
1,159
100.0
17.1
17.0
41.2
24.6
50.0
46.6
38.5
56.7
53.0
3.6
3.9
3.4
3.6
3.6
.
.
.
.
.
.
.
.
.
.
1
Rates were calculated using U.S. Census Bureau 2000-based postcensal estimates of the civilian population as of July 1, 2006.
Discharges of females with deliveries except those with cesarean deliveries.
2
3
Discharges of females with deliveries with ICD–9–CM procedure codes 74.0–74.2, 74.4, or 74.99.
Page 48 [ Series 13, No. 168
Table 37. Number and percent distribution of females with deliveries discharged from short-stay hospitals, by length of stay and type of
delivery: United States, selected years 1980–2006
[Discharges of inpatients from nonfederal hospitals. Data are for discharges 10–54 years of age with International Classification of Diseases, Ninth Revision, Clinical
Modification (ICD–9–CM) code V27, ‘‘females with deliveries’’]
Length of stay
1980
1985
1990
1995
2000
2005
2006
Number in thousands
All deliveries. . . .
Less than 1 day
1 day. . . . . . .
2 days . . . . . .
3 days . . . . . .
4 days . . . . . .
5–7 days . . . .
8 days or more.
.
.
.
.
.
.
.
.
.
.
.
.
.
.
.
.
.
.
.
.
.
.
.
.
.
.
.
.
.
.
.
.
.
.
.
.
.
.
.
.
.
.
.
.
.
.
.
.
.
.
.
.
.
.
.
.
.
.
.
.
.
.
.
.
.
.
.
.
.
.
.
.
.
.
.
.
.
.
.
.
.
.
.
.
.
.
.
.
.
.
.
.
.
.
.
.
.
.
.
.
.
.
.
.
.
.
.
.
.
.
.
.
.
.
.
.
.
.
.
.
.
.
.
.
.
.
.
.
.
.
.
.
.
.
.
.
.
.
.
.
.
.
.
.
.
.
.
.
.
.
.
.
.
.
.
.
.
.
.
.
.
.
.
.
.
.
.
.
.
.
.
.
.
.
.
.
.
.
.
.
.
.
.
.
.
.
.
.
.
.
.
.
.
.
.
.
.
.
.
.
.
.
.
.
.
.
.
.
.
.
.
.
.
.
.
.
3,762
23
216
747
1,205
691
726
154
3,854
34
373
1,037
1,140
586
598
86
4,025
37
623
1,649
900
468
282
67
3,766
36
1,368
1,418
606
193
100
46
3,738
16
551
1,863
863
292
112
41
4,038
11
481
1,880
1,111
368
145
43
4,127 11 472 1,927
1,143
371
156
48 Vaginal deliveries1
Less than 1 day
1 day. . . . . . .
2 days . . . . . .
3 days . . . . . .
4 days . . . . . .
5–7 days . . . .
8 days or more.
.
.
.
.
.
.
.
.
.
.
.
.
.
.
.
.
.
.
.
.
.
.
.
.
.
.
.
.
.
.
.
.
.
.
.
.
.
.
.
.
.
.
.
.
.
.
.
.
.
.
.
.
.
.
.
.
.
.
.
.
.
.
.
.
.
.
.
.
.
.
.
.
.
.
.
.
.
.
.
.
.
.
.
.
.
.
.
.
.
.
.
.
.
.
.
.
.
.
.
.
.
.
.
.
.
.
.
.
.
.
.
.
.
.
.
.
.
.
.
.
.
.
.
.
.
.
.
.
.
.
.
.
.
.
.
.
.
.
.
.
.
.
.
.
.
.
.
.
.
.
.
.
.
.
.
.
.
.
.
.
.
.
.
.
.
.
.
.
.
.
.
.
.
.
.
.
.
.
.
.
.
.
.
.
.
.
.
.
.
.
.
.
.
.
.
.
.
.
.
.
.
.
.
.
.
.
.
.
.
.
.
.
.
.
.
.
3,143
23
215
743
1,185
618
317
42
2,977
33
371
1,030
1,054
338
125
26
3,080
35
620
1,624
618
106
55
23
2,981
34
1,362
1,271
228
39
27
21
2,882
14
546
1,726
500
53
25
17
2,776
*8
467
1,653
558
51
23
15
2,833 9 462 1,669
594
57
31
12 Cesarean deliveries2 . . . . . . . . . . . . . .
Less than 1 day . . . . . . . . . . . . . . .
1 day. . . . . . . . . . . . . . . . . . . . . .
2 days . . . . . . . . . . . . . . . . . . . . .
3 days . . . . . . . . . . . . . . . . . . . . .
4 days . . . . . . . . . . . . . . . . . . . . .
5–7 days . . . . . . . . . . . . . . . . . . .
8 days or more. . . . . . . . . . . . . . . .
.
.
.
.
.
.
.
.
.
.
.
.
.
.
.
.
.
.
.
.
.
.
.
.
.
.
.
.
.
.
.
.
.
.
.
.
.
.
.
.
.
.
.
.
.
.
.
.
.
.
.
.
.
.
.
.
.
.
.
.
.
.
.
.
.
.
.
.
.
.
.
.
.
.
.
.
.
.
.
.
.
.
.
.
.
.
.
.
.
.
.
.
.
.
.
.
619
*
*
*
20
73
409
112
877
*
*
*
86
249
473
60
945
*
*
25
283
361
227
44
855
*
*
137
363
239
87
24
1,262
*
*
227
553
317
122
28
1,295 *
*10 258
549
315
125
36 All deliveries. . . .
Less than 1 day
1 day. . . . . . .
2 days . . . . . .
3 days . . . . . .
4 days . . . . . .
5–7 days . . . .
8 days or more.
.
.
.
.
.
.
.
.
.
.
.
.
.
.
.
.
.
.
.
.
.
.
.
.
.
.
.
.
.
.
.
.
.
.
.
.
.
.
.
.
.
.
.
.
.
.
.
.
.
.
.
.
.
.
.
.
.
.
.
.
.
.
.
.
.
.
.
.
.
.
.
.
.
.
.
.
.
.
.
.
.
.
.
.
.
.
.
.
.
.
.
.
.
.
.
.
.
.
.
.
.
.
.
.
785
*
*6
147
379
154
73
25
Percent distribution
.
.
.
.
.
.
.
.
.
.
.
.
.
.
.
.
.
.
.
.
.
.
.
.
.
.
.
.
.
.
.
.
.
.
.
.
.
.
.
.
.
.
.
.
.
.
.
.
.
.
.
.
.
.
.
.
.
.
.
.
.
.
.
.
.
.
.
.
.
.
.
.
.
.
.
.
.
.
.
.
.
.
.
.
.
.
.
.
.
.
.
.
.
.
.
.
.
.
.
.
.
.
.
.
.
.
.
.
.
.
.
.
100.0
0.6
5.7
19.9
32.0
18.4
19.3
4.1
100.0
0.9
9.7
26.9
29.6
15.2
15.5
2.2
100.0
0.9
15.5
41.0
22.4
11.6
7.0
1.7
100.0
1.0
36.3
37.7
16.1
5.1
2.7
1.2
100.0
0.4
14.7
49.9
23.1
7.8
3.0
1.1
100.0
0.3
11.9
46.6
27.5
9.1
3.6
1.1
100.0
0.3 11.4 46.7
27.7
9.0
3.8
1.2 Vaginal deliveries1. . . . . . . . . . . . . ..
Less than 1 day . . . . . . . . . . . . . .
1 day. . . . . . . . . . . . . . . . . . . . .
2 days . . . . . . . . . . . . . . . . . . . .
3 days . . . . . . . . . . . . . . . . . . . .
4 days . . . . . . . . . . . . . . . . . . . .
5–7 days . . . . . . . . . . . . . . . . . .
8 days or more. . . . . . . . . . . . . . .
.
.
.
.
.
.
.
.
.
.
.
.
.
.
.
.
.
.
.
.
.
.
.
.
.
.
.
.
.
.
.
.
.
.
.
.
.
.
.
.
.
.
.
.
.
.
.
.
.
.
.
.
.
.
.
.
.
.
.
.
.
.
.
.
.
.
.
.
.
.
.
.
.
.
.
.
.
.
.
.
.
.
.
.
.
.
.
.
.
.
.
.
.
.
.
.
.
.
.
.
.
.
.
.
100.0
0.7
6.8
23.6
37.7
19.7
10.1
1.3
100.0
1.1
12.5
34.6
35.4
11.4
4.2
0.9
100.0
1.1
20.1
52.7
20.1
3.4
1.8
0.7
100.0
1.1
45.7
42.6
7.6
1.3
0.9
0.7
100.0
0.5
19.0
59.9
17.3
1.8
0.9
0.6
100.0
*0.3
16.8
59.5
20.1
1.9
0.8
0.5
100.0
0.3 16.3 58.9
21.0
2.0
1.1
0.4 Cesarean deliveries2 . . . . . . . . . . . . . .
Less than 1 day . . . . . . . . . . . . . . .
1 day. . . . . . . . . . . . . . . . . . . . . .
2 days . . . . . . . . . . . . . . . . . . . . .
3 days . . . . . . . . . . . . . . . . . . . . .
4 days . . . . . . . . . . . . . . . . . . . . .
5–7 days . . . . . . . . . . . . . . . . . . .
8 days or more. . . . . . . . . . . . . . . .
.
.
.
.
.
.
.
.
.
.
.
.
.
.
.
.
.
.
.
.
.
.
.
.
.
.
.
.
.
.
.
.
.
.
.
.
.
.
.
.
.
.
.
.
.
.
.
.
.
.
.
.
.
.
.
.
.
.
.
.
.
.
.
.
.
.
.
.
.
.
.
.
.
.
.
.
.
.
.
.
.
.
.
.
.
.
.
.
.
.
.
.
.
.
.
.
100.0
*
*
*
3.2
11.8
66.1
18.1
100.0
*
*
*
9.8
28.4
53.9
6.8
100.0
*
*
2.6
29.9
38.2
24.0
4.7
100.0
*
*0.8
18.7
48.3
19.6
9.3
3.2
100.0
*
*
16.0
42.4
27.9
10.2
2.8
100.0
*
*
18.0
43.8
25.1
9.7
2.2
100.0
*
*0.8 19.9
42.4
24.3
9.6
2.8 Type of delivery
All deliveries. . . . . . . . . . . . . . . . . . . . . . . . . . . . . . .
3.8
3.3
Average length of stay in days
2.8
2.1
2.5
2.6
2.6 Vaginal deliveries1. . . . . . . . . . . . . .. . . . . . . . . . . . . .
Cesarean deliveries2 . . . . . . . . . . . . . . . . . . . . . . . . . .
3.2
6.5
2.7
5.2
2.3
4.5
2.2
3.5
2.2 3.6 * Figure does not meet standards of reliability or precision.
1
Discharges of females with deliveries except those with cesarean deliveries.
2
Discharges of females with deliveries with ICD–9–CM procedure codes 74.0–74.2, 74.4, or 74.99.
1.7
3.6
2.1
3.7
Series 13, No. 168 [ Page 49
Table 38. Number and rate of selected obstetrical procedures for females with deliveries discharged from short-stay hospitals:
United States, selected years 1980–2006
[Discharges of inpatients from nonfederal hospitals. Procedure groupings and code numbers are based on the International Classification of Diseases, Ninth Revision,
Clinical Modification (ICD–9–CM). Data are for selected procedures performed on discharges with code V27, ‘‘females with deliveries’’]
Procedure category and ICD–9–CM code
1980
1985
1990
1995
All obstetrical procedures . . . . . . . . . . . . . . . . . . . . . . . . . . . . . . . . . . . . . . . .72–75
3,526
4,239
6,660
6,282
Repair of current obstetric laceration . . . . . . . . . . . . . . . . . . . . . . . . . . . . . . .75.5–75.6
Cesarean section . . . . . . . . . . . . . . . . . . . . . . . . . . . . . . . . . . . .74.0–74.2,74.4,74.99
Manually assisted delivery . . . . . . . . . . . . . . . . . . . . . . . . . . . . . . . . . . . . . . . . .73.5
Artificial rupture of membranes . . . . . . . . . . . . . . . . . . . . . . . . . . . . . . . . . . . . . .73.0
Medical induction of labor . . . . . . . . . . . . . . . . . . . . . . . . . . . . . . . . . . . . . . . . .73.4
Episiotomy . . . . . . . . . . . . . . . . . . . . . . . . . . . . . . . . . . . .72.1,72.21,72.31,72.71,73.6
Vacuum extraction1 . . . . . . . . . . . . . . . . . . . . . . . . . . . . . . . . . . . . . . . . . . . . .72.7
Forceps delivery1 . . . . . . . . . . . . . . . . . . . . . . . . . . . . .72.0–72.4,72.51,72.53,72.6,73.3
350
619
70
120
42
2,012
22
555
543
877
193
315
66
1,820
66
376
789
945
750
691
225
1,714
190
269
961
785
866
752
366
1,410
279
176
2000
2005
2006
6,145
6,781
7,007
1,134
855
898
833
435
944
245
117
1,255
1,262
1,022
928
608
537
237
66
1,306
1,295
1,207
960
647
454
229
52
Number of procedures in thousands
Rate per 100 deliveries2
All obstetrical procedures . . . . . . . . . . . . . . . . . . . . . . . . . . . . . . . . . . . . . . . .72–75
93.7
110.0
165.5
166.8
164.4
167.9
169.8
Cesarean section . . . . . . . . . . . . . . . . . . . . . . . . . . . . . . . . . . . .74.0–74.2,74.4,74.99
Artificial rupture of membranes . . . . . . . . . . . . . . . . . . . . . . . . . . . . . . . . . . . . . .73.0
Medical induction of labor . . . . . . . . . . . . . . . . . . . . . . . . . . . . . . . . . . . . . . . . .73.4
16.5
3.2
1.1
22.7
8.2
1.7
23.5
17.2
5.6
20.8
20.0
9.7
22.9
22.3
11.7
31.3
23.0
15.0
31.4
23.2
15.7
45.0
36.8
19.3
8.2
2.3
46.1
42.6
16.0
8.1
1.8
Rate per 100 vaginal deliveries3
Repair of current obstetric laceration . . . . . . . . . . . . . . . . . . . . . . . . . . . . . . .75.5–75.6
Manually assisted delivery . . . . . . . . . . . . . . . . . . . . . . . . . . . . . . . . . . . . . . . . .73.5
Episiotomy . . . . . . . . . . . . . . . . . . . . . . . . . . . . . . . . . . . .72.1,72.21,72.31,72.71,73.6
Vacuum extraction1 . . . . . . . . . . . . . . . . . . . . . . . . . . . . . . . . . . . . . . . . . . . . .72.7
Forceps delivery1 . . . . . . . . . . . . . . . . . . . . . . . . . . . . .72.0–72.4,72.51,72.53,72.6,73.3
11.1
2.2
64.0
0.7
17.6
18.1
6.5
61.1
2.2
12.5
25.5
24.3
55.6
6.1
8.6
32.0
29.0
47.2
9.2
5.8
39.2
31.1
32.7
8.4
4.0
1
Forceps delivery and vacuum extraction with episiotomy are also included in the episiotomy category.
Procedures per 100 discharges of females with deliveries.
3
Procedures for females with vaginal deliveries per 100 discharges with vaginal deliveries. Vaginal deliveries are all deliveries except those with a cesarean section.
2
Table 39. Number and rate of females with deliveries discharged from short-stay hospitals, by type of delivery: United States, selected
years 1980–2006
[Discharges of inpatients from nonfederal hospitals. Data are for discharges with International Classification of Diseases, Ninth Revision, Clinical Modification (ICD–9–CM)
code V27, ‘‘females with deliveries’’]
Type of delivery
1980
1985
1990
1995
.
.
.
.
.
.
.
.
.
3,762
192
3,571
3,143
*6
3,137
619
434
185
3,854
324
3,530
2,977
21
2,956
877
574
303
4,025
426
3,600
3,080
87
2,993
945
606
339
Cesarean deliveries per 100 deliveries . . . . . . . . . . . . . . . . . . . . . . . . . . . . . . . . . . . .
Primary cesarean deliveries per 100 deliveries without previous cesarean delivery . . . . . . .
Vaginal birth after cesarean deliveries (VBACs) per 100 deliveries with previous cesarean
delivery . . . . . . . . . . . . . . . . . . . . . . . . . . . . . . . . . . . . . . . . . . . . . . . . . . . . .
16.5
12.1
22.7
16.3
23.5
16.8
20.8
15.5
*3.4
6.6
20.4
35.5
2000
2005
2006
4,038
571
3,468
2,776
62
2,715
1,262
753
509
4,127
614
3,513
2,833
52
2,781
1,295
732
563
22.9
16.1
31.3
21.7
31.4
20.8
27.6
10.8
8.4
Number in thousands
Females with deliveries . . . . . . . . . . . . . .
Previous cesarean delivery . . . . . . . . . . .
No previous cesarean delivery . . . . . . . . .
Vaginal deliveries . . . . . . . . . . . . . . . . . .
Vaginal birth after cesarean delivery (VBAC)
Other vaginal deliveries . . . . . . . . . . . . .
Cesarean deliveries . . . . . . . . . . . . . . . . .
No previous cesarean delivery (primary). . .
Previous cesarean delivery (repeat) . . . . .
.
.
.
.
.
.
.
.
.
.
.
.
.
.
.
.
.
.
.
.
.
.
.
.
.
.
.
.
.
.
.
.
.
.
.
.
.
.
.
.
.
.
.
.
.
.
.
.
.
.
.
.
.
.
.
.
.
.
.
.
.
.
.
.
.
.
.
.
.
.
.
.
.
.
.
.
.
.
.
.
.
.
.
.
.
.
.
.
.
.
.
.
.
.
.
.
.
.
.
.
.
.
.
.
.
.
.
.
.
.
.
.
.
.
.
.
.
.
.
.
.
.
.
.
.
.
.
.
.
.
.
.
.
.
.
.
.
.
.
.
.
.
.
.
.
.
.
.
.
.
.
.
.
.
.
.
.
.
.
.
.
.
.
.
.
.
.
.
.
.
.
.
.
.
.
.
.
.
.
.
.
.
.
.
.
.
.
.
.
.
.
.
.
.
.
.
.
.
.
.
.
.
.
.
.
.
.
.
.
.
.
.
.
.
.
.
.
.
.
.
.
.
.
.
.
.
.
.
.
.
.
.
.
.
.
.
.
.
.
.
.
.
.
.
.
.
.
.
.
.
.
.
.
.
.
.
.
.
.
.
.
.
.
.
.
.
.
.
.
.
3,766
413
3,353
2,981
147
2,835
785
519
266
3,738
447
3,290
2,882
123
2,759
855
531
324
Rate per 100 deliveries
* Figure does not meet standards of reliability or precision.
NOTES: Previous cesarean deliveries are discharges with ICD–9–CM diagnostic code 654.2. Cesarean deliveries are discharges with ICD–9–CM procedure codes 74.0–74.2, 74.4 or 74.99. Because
estimates of newborn infants are based on a sample and because they do not include out-of-hospital births, these estimates may not agree with data on births published in the National Vital Statistics
Reports (see text reference 22), which are based on birth certificate data.
Page 50 [ Series 13, No. 168
Table 40. Number and rate of females with deliveries discharged from short-stay hospitals, by type of delivery, age, and geographic region:
United States, 2006
[Discharges of inpatients from nonfederal hospitals. Data are for discharges with International Classification of Diseases, Ninth Revision, Clinical Modification (ICD–9–CM)
code V27, ‘‘females with deliveries’’]
Cesarean deliveries
Total1
Age and region
Primary2
VBAC3,4
Number in thousands
10–54 years .
10–19 years
20–24 years
25–29 years
30–34 years
35–39 years
40–54 years
All regions . .
Northeast .
Midwest . .
South . . . .
West . . . .
. .
.
.
.
.
.
.
. .
. .
. .
. .
. .
.
.
.
.
.
.
.
.
.
.
.
.
.
.
.
.
.
.
.
.
.
.
.
.
.
.
.
.
.
.
.
.
.
.
.
.
.
.
.
.
.
.
.
.
.
.
.
.
.
.
.
.
.
.
.
.
.
.
.
.
.
.
.
.
.
.
.
.
.
.
.
.
.
.
.
.
.
.
.
.
.
.
.
.
.
.
.
.
.
.
.
.
.
.
.
.
.
.
.
.
.
.
.
.
.
.
.
.
.
.
.
.
.
.
.
.
.
.
.
.
.
.
.
.
.
.
.
.
.
.
.
.
.
.
.
.
.
.
.
.
.
.
.
.
.
.
.
.
.
.
.
.
.
.
.
.
.
.
.
.
.
.
.
.
.
.
.
.
.
.
.
.
.
.
.
.
.
.
.
.
.
.
.
.
.
.
.
.
.
.
.
.
.
.
.
.
.
.
.
.
.
.
.
.
.
.
.
.
.
.
.
.
.
.
.
.
.
.
.
.
.
.
.
.
.
.
.
.
.
.
.
.
.
.
.
.
.
.
.
.
.
.
.
.
.
.
.
.
.
.
.
.
.
.
.
.
.
.
.
.
.
.
.
.
.
.
.
.
.
.
.
.
.
.
.
.
.
.
.
.
.
.
.
.
.
.
.
.
.
.
.
.
.
.
.
.
.
.
.
.
.
.
.
.
.
.
.
.
.
.
.
.
.
.
.
.
.
.
.
.
.
.
.
.
.
.
.
.
.
.
.
.
.
.
.
.
.
.
.
.
.
.
.
.
.
.
.
.
.
.
.
.
.
.
.
.
.
.
.
.
.
.
.
.
.
.
.
.
.
.
.
.
.
.
.
.
.
.
.
.
.
.
.
.
.
.
.
.
.
.
.
.
.
.
.
.
.
.
.
.
.
.
.
.
.
.
.
.
.
.
.
.
.
.
.
.
.
.
.
.
.
.
.
.
.
.
.
.
.
.
.
.
.
.
.
.
.
.
.
.
.
.
.
.
1,295
93
292
334
329
199
48
1,295
206
236
536
318
10–54 years .
10–19 years
20–24 years
25–29 years
30–34 years
35–39 years
40–54 years
All regions . .
Northeast .
Midwest . .
South . . . .
West . . . .
. .
.
.
.
.
.
.
. .
. .
. .
. .
. .
.
.
.
.
.
.
.
.
.
.
.
.
.
.
.
.
.
.
.
.
.
.
.
.
.
.
.
.
.
.
.
.
.
.
.
.
.
.
.
.
.
.
.
.
.
.
.
.
.
.
.
.
.
.
.
.
.
.
.
.
.
.
.
.
.
.
.
.
.
.
.
.
.
.
.
.
.
.
.
.
.
.
.
.
.
.
.
.
.
.
.
.
.
.
.
.
.
.
.
.
.
.
.
.
.
.
.
.
.
.
.
.
.
.
.
.
.
.
.
.
.
.
.
.
.
.
.
.
.
.
.
.
.
.
.
.
.
.
.
.
.
.
.
.
.
.
.
.
.
.
.
.
.
.
.
.
.
.
.
.
.
.
.
.
.
.
.
.
.
.
.
.
.
.
.
.
.
.
.
.
.
.
.
.
.
.
.
.
.
.
.
.
.
.
.
.
.
.
.
.
.
.
.
.
.
.
.
.
.
.
.
.
.
.
.
.
.
.
.
.
.
.
.
.
.
.
.
.
.
.
.
.
.
.
.
.
.
.
.
.
.
.
.
.
.
.
.
.
.
.
.
.
.
.
.
.
.
.
.
.
.
.
.
.
.
.
.
.
.
.
.
.
.
.
.
.
.
.
.
.
.
.
.
.
.
.
.
.
.
.
.
.
.
.
.
.
.
.
.
.
.
.
.
.
.
.
.
.
.
.
.
.
.
.
.
.
.
.
.
.
.
.
.
.
.
.
.
.
.
.
.
.
.
.
.
.
.
.
.
.
.
.
.
.
.
.
.
.
.
.
.
.
.
.
.
.
.
.
.
.
.
.
.
.
.
.
.
.
.
.
.
.
.
.
.
.
.
.
.
.
.
.
.
.
.
.
.
.
.
.
.
.
.
.
.
.
.
.
.
.
.
.
.
.
.
.
.
.
.
.
.
.
.
.
.
.
.
.
.
.
.
.
.
.
.
.
.
.
.
.
.
.
.
.
.
.
.
.
.
.
.
.
.
.
31.4
21.7
27.9
29.4
35.4
41.7
42.7
31.4
33.3
27.7
33.2
30.4
732
78
178
174
170
104
27
732
123
126
297
185
52
* 7 15 17 11 * 52 7 * 17 14 Rate per 100 deliveries
20.8
18.9
19.2
18.2
22.6
28.0
30.2
20.8
23.3
17.3
21.9
20.6
8.4
* 5.7 8.7 9.4 10.5 * 8.4 7.7 * 6.8 9.8 * Figure does not meet standards of reliability or precision.
1
Discharges with ICD–9–CM procedure codes 74.0–74.2, 74.4, or 74.99. Rate per 100 total deliveries.
2
Cesarean deliveries without ICD–9–CM diagnostic code 654.2. Rate per 100 deliveries without previous cesarean delivery.
3
VBAC is vaginal birth after cesarean delivery.
4
Vaginal deliveries with ICD–9–CM diagnostic code 654.2. Rate per 100 deliveries with previous cesarean delivery.
NOTE: Because estimates of newborn infants are based on a sample and because they do not include out-of-hospital births, these estimates may not agree with data on births published in the
National Vital Statistics Reports (see text reference 22), which are based on birth certificate data.
Series 13, No. 168 [ Page 51
Table 41. Number, percent distribution, and average length of stay for newborn infants discharged from short-stay hospitals, by sex,
geographic region, and health status: United States, 2006
[Infants born in nonfederal hospitals]
Discharges
Sex, region, and health status
Number in
thousands
Percent
distribution
Average
length
of stay
in days
All newborn infants . . . . . . . . . . . . . . . . . . . . . . . . . . . . . . . . . . . .
4,020
100.0
3.4
2,041
1,979
50.8
49.2
3.6
3.2
Sex
Male . . . . . . . . . . . . . . . . . . . . . . . . . . . . . . . . . . . . . . . . . . . . .
Female . . . . . . . . . . . . . . . . . . . . . . . . . . . . . . . . . . . . . . . . . . .
Region
Northeast
Midwest .
South . .
West . .
.
.
.
.
.
.
.
.
.
.
.
.
.
.
.
.
.
.
.
.
.
.
.
.
.
.
.
.
.
.
.
.
.
.
.
.
.
.
.
.
.
.
.
.
.
.
.
.
.
.
.
.
.
.
.
.
Well1 . . .
Male .
Female
Sick2 . . .
Male .
Female
.
.
.
.
.
.
.
.
.
.
.
.
.
.
.
.
.
.
.
.
.
.
.
.
.
.
.
.
.
.
.
.
.
.
.
.
.
.
.
.
.
.
.
.
.
.
.
.
.
.
.
.
.
.
.
.
.
.
.
.
.
.
.
.
.
.
.
.
.
.
.
.
.
.
.
.
.
.
.
.
.
.
.
.
.
.
.
.
.
.
.
.
.
.
.
.
.
.
.
.
.
.
.
.
.
.
.
.
.
.
.
.
.
.
.
.
.
.
.
.
.
.
.
.
.
.
.
.
.
.
.
.
.
.
.
.
.
.
.
.
.
.
.
.
.
.
.
.
.
.
.
.
.
.
.
.
.
.
.
.
.
.
.
.
.
.
.
.
.
.
.
.
.
.
.
.
.
.
.
.
.
.
.
.
.
.
.
.
.
.
.
.
.
.
.
.
722
833
1,464
1,000
18.0
20.7
36.4
24.9
3.6
2.8
3.8
3.2
.
.
.
.
.
.
.
.
.
.
.
.
.
.
.
.
.
.
.
.
.
.
.
.
.
.
.
.
.
.
.
.
.
.
.
.
.
.
.
.
.
.
.
.
.
.
.
.
.
.
.
.
.
.
.
.
.
.
.
.
.
.
.
.
.
.
.
.
.
.
.
.
.
.
.
.
.
.
.
.
.
.
.
.
.
.
.
.
.
.
.
.
.
.
.
.
.
.
.
.
.
.
.
.
.
.
.
.
.
.
.
.
.
.
.
.
.
.
.
.
2,171
1,071
1,099
1,849
970
880
54.0
26.6
27.4
46.0
24.1
21.9
2.1
2.1
2.1
4.9
5.3
4.5
Health status
.
.
.
.
.
.
.
.
.
.
.
.
.
.
.
.
.
.
.
.
.
.
.
.
.
.
.
.
.
.
.
.
.
.
.
.
.
.
.
.
.
.
.
.
.
.
.
.
1
Without any illness or risk-related diagnoses.
With at least one illness or risk-related diagnosis, International Classification of Diseases, Ninth Revision, Clinical Modification codes 001–999.
2
Table 42. Number and percent distribution of newborn infants discharged from short-stay hospitals, by length of stay, and average length of
stay, by health status: United States, selected years 1980–2006
[Infants born in nonfederal hospitals]
Length of stay and health status
1980
1985
1990
Length of stay
1995
2000
2005
2006
Number in thousands
All newborn infants. . . . . . . . . . . . . . . . . . . . . . . . . . .
3,824
3,794
3,869
3,631
3,643
3,999
4,020
Less than 1 day
1 day . . . . . . .
2 days . . . . . .
3 days . . . . . .
4 days . . . . . .
5–7 days . . . . .
8 days or more .
.
.
.
.
.
.
.
69
270
842
1,175
618
633
218
84
428
1,057
1,034
528
497
167
79
693
1,624
636
447
232
157
87
1,523
1,145
486
134
106
149
45
722
1,877
546
205
94
153
44
674
1,967
720
286
122
185
46
614
2,064
705
279
120
193
All newborn infants. . . . . . . . . . . . . . . . . . . . . . . . . . .
100.0
100.0
100.0
100.0
100.0
100.0
100.0
.
.
.
.
.
.
.
1.8
7.1
22.0
30.7
16.2
16.5
5.7
2.2
11.3
27.9
27.3
13.9
13.1
4.4
2.0
17.9
42.0
16.4
11.6
6.0
4.1
2.4
41.9
31.5
13.4
3.7
2.9
4.1
1.2
19.8
51.5
15.0
5.6
2.6
4.2
1.1
16.9
49.2
18.0
7.2
3.1
4.6
1.1
15.3
51.3
17.5
6.9
3.0
4.8
All newborn infants. . . . . . . . . . . . . . . . . . . . . . . . . . .
Well1 . . . . . . . . . . . . . . . . . . . . . . . . . . . . . . . . . . .
Sick2 . . . . . . . . . . . . . . . . . . . . . . . . . . . . . . . . . . .
4.3
3.2
7.1
3.8
2.8
5.7
3.3
2.3
4.8
3.4
2.1
5.0
3.4
2.1
4.9
.
.
.
.
.
.
.
.
.
.
.
.
.
.
.
.
.
.
.
.
.
.
.
.
.
.
.
.
.
.
.
.
.
.
.
.
.
.
.
.
.
.
.
.
.
.
.
.
.
.
.
.
.
.
.
.
.
.
.
.
.
.
.
.
.
.
.
.
.
.
.
.
.
.
.
.
.
.
.
.
.
.
.
.
.
.
.
.
.
.
.
.
.
.
.
.
.
.
.
.
.
.
.
.
.
.
.
.
.
.
.
.
.
.
.
.
.
.
.
.
.
.
.
.
.
.
.
.
.
.
.
.
.
.
.
.
.
.
.
.
.
.
.
.
.
.
.
.
.
.
.
.
.
.
.
.
.
.
.
.
.
.
.
.
.
.
.
.
.
.
.
.
.
.
.
.
.
.
.
.
.
.
.
.
.
.
.
.
.
Percent distribution
Less than 1 day
1 day . . . . . . .
2 days . . . . . .
3 days . . . . . .
4 days . . . . . .
5–7 days . . . . .
8 days or more .
.
.
.
.
.
.
.
.
.
.
.
.
.
.
.
.
.
.
.
.
.
.
.
.
.
.
.
.
.
.
.
.
.
.
.
.
.
.
.
.
.
.
.
.
.
.
.
.
.
.
.
.
.
.
.
.
.
.
.
.
.
.
.
.
.
.
.
.
.
.
.
.
.
.
.
.
.
.
.
.
.
.
.
.
.
.
.
.
.
.
.
.
.
.
.
.
.
.
.
.
.
.
.
.
.
.
.
.
.
.
.
.
.
.
.
.
.
.
.
.
.
.
.
.
.
.
.
.
.
.
.
.
.
.
.
.
.
.
.
.
.
.
.
.
.
.
.
.
.
.
.
.
.
.
.
.
.
.
.
.
.
.
.
.
.
.
.
.
.
.
.
.
.
.
.
.
.
.
.
.
.
.
.
.
.
.
.
.
.
Health status
1
Average length of stay in days
2.8
1.7
4.4
Without any illness or risk-related diagnoses.
With at least one illness or risk-related diagnosis, International Classification of Diseases, Ninth Revision, Clinical Modification codes 001–999.
2
3.2
2.1
5.1
Page 52 [ Series 13, No. 168
Table 43. Number of all-listed diagnoses for sick newborn infants discharged from short-stay hospitals, by sex and selected diagnostic
categories: United States, 2006
[Infants born in nonfederal hospitals. Diagnostic groupings and code numbers are based on the International Classification of Diseases, Ninth Revision, Clinical Modification
(ICD–9–CM)]
Diagnostic category and ICD–9–CM code
Both
sexes
Sick newborn diagnoses . . . . . . . . . . . . . . . . . . . . . . . . . . . . . . . . . . . . . . . . . . . . . . . . . . . . . . . .001–999
3,947
2,132
1,815
Hemolytic disease of fetus or newborn, due to isoimmunization, and other perinatal jaundice . . . . . . . . . . . . . .773–774
Hemolytic disease due to ABO isoimmunization . . . . . . . . . . . . . . . . . . . . . . . . . . . . . . . . . . . . . . . . . .773.1
Neonatal jaundice associated with preterm delivery . . . . . . . . . . . . . . . . . . . . . . . . . . . . . . . . . . . . . . . .774.2
Unspecified fetal and neonatal jaundice . . . . . . . . . . . . . . . . . . . . . . . . . . . . . . . . . . . . . . . . . . . . . . .774.6
Respiratory conditions of fetus and newborn . . . . . . . . . . . . . . . . . . . . . . . . . . . . . . . . . . . . . . . . . . . .768–770
Respiratory distress syndrome . . . . . . . . . . . . . . . . . . . . . . . . . . . . . . . . . . . . . . . . . . . . . . . . . . . . . .769
Transitory tachypnea of newborn . . . . . . . . . . . . . . . . . . . . . . . . . . . . . . . . . . . . . . . . . . . . . . . . . . .770.6
Congential anomalies . . . . . . . . . . . . . . . . . . . . . . . . . . . . . . . . . . . . . . . . . . . . . . . . . . . . . . . . . .740–759
Congential anomalies of circulatory system . . . . . . . . . . . . . . . . . . . . . . . . . . . . . . . . . . . . . . . . . . .745–747
Congential anomalies of musculoskeletal system. . . . . . . . . . . . . . . . . . . . . . . . . . . . . . . . . . . . . . . .754–756
Congential anomalies of the integument (skin) . . . . . . . . . . . . . . . . . . . . . . . . . . . . . . . . . . . . . . . . . . . .757
Disorders relating to short gestation and low birthweight (prematurity) . . . . . . . . . . . . . . . . . . . . . . . . . .765.0–765.1
Disorders relating to long gestation and high birthweight. . . . . . . . . . . . . . . . . . . . . . . . . . . . . . . . . . . . . . . .766
Maternal causes of perinatal morbidity and mortality . . . . . . . . . . . . . . . . . . . . . . . . . . . . . . . . . . . . . . .760–763
Endocrine and metabolic disturbances specific to the fetus and newborn . . . . . . . . . . . . . . . . . . . . . . . . . . . . .775
Neonatal hypoglycemia . . . . . . . . . . . . . . . . . . . . . . . . . . . . . . . . . . . . . . . . . . . . . . . . . . . . . . . . .775.6
Birth trauma . . . . . . . . . . . . . . . . . . . . . . . . . . . . . . . . . . . . . . . . . . . . . . . . . . . . . . . . . . . . . . . . . . .767
Injuries to scalp . . . . . . . . . . . . . . . . . . . . . . . . . . . . . . . . . . . . . . . . . . . . . . . . . . . . . . . . . . . . . .767.1
Conditions involving the integument (skin) and temperature regulation of fetus and newborn . . . . . . . . . . . . . . . . .778
Feeding problems in newborn . . . . . . . . . . . . . . . . . . . . . . . . . . . . . . . . . . . . . . . . . . . . . . . . . . . . . . .779.3
Infections specific to the perinatal period . . . . . . . . . . . . . . . . . . . . . . . . . . . . . . . . . . . . . . . . . . . . . . . . .771
Septicemia (sepsis) of newborn . . . . . . . . . . . . . . . . . . . . . . . . . . . . . . . . . . . . . . . . . . . . . . . . . . .771.81
Slow fetal growth and fetal malnutrition . . . . . . . . . . . . . . . . . . . . . . . . . . . . . . . . . . . . . . . . . . . . . . . . . .764
Fetal and neonatal hemorrhage . . . . . . . . . . . . . . . . . . . . . . . . . . . . . . . . . . . . . . . . . . . . . . . . . . . . . . .772
831
59
152
603
403
84
115
347
94
53
77
304
286
145
135
55
113
91
111
111
94
82
65
58
437
28
86
315
232
50
68
204
49
29
35
164
164
69
72
29
56
44
68
63
50
43
29
33
394
31
67
288
171
34
47
143
45
24
41
139
122
76
62
26
57
46
43
48
44
38
36
25
Male
Female
Number in thousands
Table 44. Number and percentage of male newborn infants circumcised during hospitalization, by geographic region: United States,
selected years 1980–2006
[Infants born in nonfederal hospitals with International Classification of Diseases, Ninth Revision, Clinical Modification procedure code 64.0]
Region
1980
1985
1990
2000
2005
2006
Number circumcised in thousands
1,169
1,200
1,166
238
249
256
341
317
330
396
454
438
195
180
143
1,172
254
330
422
166
1,145
224
330
421
170
57.3
66.9
78.7
58.7
31.5
56.1
63.6
77.9
55.3
33.8
United States
Northeast . .
Midwest . . .
South . . . . .
West . . . . .
.
.
.
.
.
.
.
.
.
.
.
.
.
.
.
.
.
.
.
.
.
.
.
.
.
.
.
.
.
.
.
.
.
.
.
.
.
.
.
.
.
.
.
.
.
.
.
.
.
.
.
.
.
.
.
.
.
.
.
.
.
.
.
.
.
.
.
.
.
.
.
.
.
.
.
.
.
.
.
.
.
.
.
.
.
.
.
.
.
.
.
.
.
.
.
.
.
.
.
.
.
.
.
.
.
.
.
.
.
.
.
.
.
.
.
.
.
.
.
.
.
.
.
.
.
.
.
.
.
.
.
.
.
.
.
.
.
.
.
.
.
.
.
.
.
.
.
.
.
.
1,261
253
403
379
226
1,162
221
331
393
218
United States
Northeast . .
Midwest . . .
South . . . . .
West . . . . .
.
.
.
.
.
.
.
.
.
.
.
.
.
.
.
.
.
.
.
.
.
.
.
.
.
.
.
.
.
.
.
.
.
.
.
.
.
.
.
.
.
.
.
.
.
.
.
.
.
.
.
.
.
.
.
.
.
.
.
.
.
.
.
.
.
.
.
.
.
.
.
.
.
.
.
.
.
.
.
.
.
.
.
.
.
.
.
.
.
.
.
.
.
.
.
.
.
.
.
.
.
.
.
.
.
.
.
.
.
.
.
.
.
.
.
.
.
.
.
.
.
.
.
.
.
.
.
.
.
.
.
.
.
.
.
.
.
.
.
.
.
.
.
.
.
.
.
.
.
.
64.7
67.4
75.9
56.0
61.8
59.5
65.2
70.5
56.0
49.0
1995
Percent circumcised
59.0
62.6
76.0
57.1
42.4
64.1
68.3
79.8
66.1
42.6
62.4
64.6
81.4
63.9
37.3
Series 13, No. 168 [ Page 53
Appendix. Technical Notes
Abstract Form
The figure shows the medical
abstract form used for the 2006 National
Hospital Discharge Survey (NHDS). The
hospital number, date of birth, and
patient ZIP Code are confidential
information and are not released to the
public, although they can be used with
privacy safeguards through the Centers
for Disease Control and Prevention’s
National Center for Health Statistics
(NCHS) Research Data Center.
Population Estimates
Population estimates used to
compute rates are shown in Table I.
These estimates are for the civilian
population of the United States,
including institutionalized persons, as of
July 1, 2006. The data are postcensal
estimates based on the 2000 census and
are from unpublished tabulations
provided by the U.S. Census Bureau.
Reliability of Estimates
The statistics presented in this
report are based on a sample survey, and
therefore may differ from the figures
that would be obtained if a complete
census had been taken. The standard
error is primarily a measure of sampling
variability that occurs by chance
because only a sample rather than an
entire universe is surveyed. Standard
errors for the estimates from NHDS
were calculated with SUDAAN
software, which takes into account the
complex sample design. A description of
the software and the approach it uses
has been published (24).
The chances are about 32 out of
100 that an estimate from the sample
would differ from a complete census by
more than the standard error. The
chances are 5 out of 100 that the
difference would be more than twice the
standard error and about 1 out of 100
that the difference would be more than
2.5 times as large as the standard error.
The relative standard error (RSE)
expresses the standard error as a percent
Table I. Civilian population by age, geographic region, and sex: United States, 2006
Age and geographic region
Both
sexes
Male
Female
All ages
Total . . . . . . . . . . . . . . . . . . . . . . . . . .
298,219
Number in thousands
146,511
151,708
Region:
Northeast
Midwest .
South . . .
West . . .
.
.
.
.
.
.
.
.
.
.
.
.
.
.
.
.
.
.
.
.
.
.
.
.
.
.
.
.
.
.
.
.
.
.
.
.
.
.
.
.
.
.
.
.
.
.
.
.
.
.
.
.
.
.
.
.
.
.
.
.
.
.
.
.
.
.
.
.
.
.
.
.
.
.
.
.
.
.
.
.
.
.
.
.
54,683
66,133
108,410
68,992
26,557
32,539
53,013
34,402
28,126
33,594
55,398
34,590
Under 15 years
Total . . . . . . .
Under 1 year
1–4 years . .
5–14 years. .
.
.
.
.
.
.
.
.
.
.
.
.
.
.
.
.
.
.
.
.
.
.
.
.
.
.
.
.
.
.
.
.
.
.
.
.
.
.
.
.
.
.
.
.
.
.
.
.
.
.
.
.
.
.
.
.
.
.
.
.
.
.
.
.
.
.
.
.
.
.
.
.
.
.
.
.
60,755
4,130
16,287
40,337
31,082
2,113
8,329
20,640
29,673
2,017
7,959
19,697
Region:
Northeast
Midwest .
South . . .
West . . .
.
.
.
.
.
.
.
.
.
.
.
.
.
.
.
.
.
.
.
.
.
.
.
.
.
.
.
.
.
.
.
.
.
.
.
.
.
.
.
.
.
.
.
.
.
.
.
.
.
.
.
.
.
.
.
.
.
.
.
.
.
.
.
.
.
.
.
.
.
.
.
.
.
.
.
.
.
.
.
.
10,304
13,310
22,352
14,789
5,270
6,810
11,429
7,574
5,035
6,500
10,923
7,215
Total . . . . . . .
15–24 years .
25–34 years .
35–44 years .
.
.
.
.
.
.
.
.
.
.
.
.
.
.
.
.
.
.
.
.
.
.
.
.
.
.
.
.
.
.
.
.
.
.
.
.
.
.
.
.
.
.
.
.
.
.
.
.
.
.
.
.
.
.
.
.
.
.
.
.
.
.
.
.
.
.
.
.
.
.
.
.
.
.
.
.
125,399
41,989
40,003
43,407
63,310
21,471
20,215
21,624
62,089
20,519
19,787
21,783
Region:
Northeast
Midwest .
South . . .
West . . .
.
.
.
.
.
.
.
.
.
.
.
.
.
.
.
.
.
.
.
.
.
.
.
.
.
.
.
.
.
.
.
.
.
.
.
.
.
.
.
.
.
.
.
.
.
.
.
.
.
.
.
.
.
.
.
.
.
.
.
.
.
.
.
.
.
.
.
.
.
.
.
.
.
.
.
.
22,594
27,466
45,456
29,883
11,308
13,906
22,795
15,301
11,286
13,560
22,660
14,582
45–64 years
Total . . . . . . . . . . . . . . . . . . . . . . . . . .
45–54 years . . . . . . . . . . . . . . . . . . . .
55–64 years . . . . . . . . . . . . . . . . . . . .
74,805
43,223
31,581
36,462
21,243
15,219
38,342
21,980
16,362
Region:
Northeast
Midwest .
South . . .
West . . .
.
.
.
.
15–44 years
.
.
.
.
.
.
.
.
.
.
.
.
.
.
.
.
.
.
.
.
.
.
.
.
.
.
.
.
.
.
.
.
.
.
.
.
.
.
.
.
.
.
.
.
.
.
.
.
14,337
16,884
27,013
16,572
6,932
8,294
13,076
8,161
7,405
8,590
13,937
8,411
65 years and
Total . . . . . . . . . . . . . .
65–74 years . . . . . . . .
75–84 years . . . . . . . .
85 years and over . . . .
over
. . . .
. . . .
. . . .
. . . .
.
.
.
.
.
.
.
.
.
.
.
.
.
.
.
.
.
.
.
.
.
.
.
.
.
.
.
.
.
.
.
.
37,261
18,917
13,047
5,297
15,657
8,670
5,298
1,688
21,603
10,247
7,748
3,609
Region:
Northeast
Midwest .
South . . .
West . . .
.
.
.
.
.
.
.
.
.
.
.
.
.
.
.
.
.
.
.
.
.
.
.
.
.
.
.
.
.
.
.
.
.
.
.
.
7,448
8,474
13,590
7,748
3,048
3,529
5,712
3,367
4,400
4,945
7,878
4,381
.
.
.
.
.
.
.
.
.
.
.
.
.
.
.
.
.
.
.
.
.
.
.
.
.
.
.
.
.
.
.
.
.
.
.
.
.
.
.
.
.
.
.
.
.
.
.
.
.
.
.
.
.
.
.
.
.
.
.
.
.
.
.
.
.
.
.
.
.
.
.
.
.
.
.
.
.
.
.
.
.
.
.
.
.
.
.
.
.
.
.
.
NOTE: Unpublished 2000-based postcensal estimates from the U.S. Census Bureau.
of the estimate and can be multiplied by
the estimate to obtain the standard error.
To derive approximate standard
errors for the estimates in this report,
first calculate the approximate RSE of
the estimate using the parameters shown
in Table II. Then multiply the
approximate RSE by the estimate. The
approximate RSE of an estimate X, may
be estimated from the formula
RSE(X) = √ a + b/X ,
where a and b are defined in Table II.
Page 54 [ Series 13, No. 168
OMB No. 0920-0212: Approval Expires 08/31/2008
Notice – All information which would permit identification of an individual or an establishment will be held confidential, will be used only by persons engaged in and
for the purposes of the survey, and will not be disclosed or released to other persons or used for any other purpose. Public reporting burden of this collection of
information is estimated to average 4 minutes per response, including the time for reviewing instructions, searching existing data sources, gathering and
maintaining the data needed, and completing and reviewing the collection of information. An agency may not conduct or sponsor, and a person is not required to
respond to a collection of information unless it displays a currently valid OMB control number. Send comments regarding this burden estimate or any other aspect
of this collection of information, including suggestions for reducing this burden to CDC/ATSDR Reports Clearance Officer; 1600 Clifton Road, MS D-74, Atlanta,
GA 30333, ATTN: PRA (0920-0212)
FORM HDS-1
9-9-2005)
U.S. DEPARTMENT OF COMMERCE
Economics and Statistics Administration
U.S. CENSUS BUREAU
ACTING AS COLLECTING AGENT FOR
DEPARTMENT OF HEALTH AND HUMAN SERVICES
CENTERS FOR DISEASE CONTROL AND PREVENTION
NATIONAL CENTER FOR HEALTH STATISTICS
MEDICAL ABSTRACT – NATIONAL HOSPITAL DISCHARGE SURVEY
A. PATIENT IDENTIFICATION
Month
1. Hospital number
4. Date of admission
2. HDS number
5. Date of discharge
3. (Item deleted)
6. Residence ZIP Code
Day
Year
–
–
–
–
6
Other – Specify
7
Not stated
B. PATIENT CHARACTERISTICS
7. Date of birth
Month
Day
–
8. Age – Complete
only if date of
birth not given
11. Race – Mark all that apply
Year
1
–
Units
2
{
1
2
3
3
Years
Months
Days
4
5
9. Sex – Mark (X) one
1
Male
Female
2
3
Not stated
12. Marital status – Mark (X) one
10. Ethnicity – Mark (X) one
1
Hispanic
or Latino
Not Hispanic
or Latino
2
White
Black or
African American
American Indian
or Alaska Native
Asian
Native Hawaiian
or Other Pacific
Islander
3
1
Not stated
2
Married
Single
3
4
Widowed
Divorced
5
6
Separated
Not stated
C. ADMINISTRATIVE INFORMATION
13. Type of Admission – Mark (X) one
1
2
Emergency
Urgent
3
4
Elective
Newborn
16. Expected source(s) of payment
5
Items not available/
unknown
Mark
one only
14. Source of Admission – Mark (X) one
1
2
3
4
5
6
Physician referral
Clinical referral
HMO referral
Transfer from a hospital
Transfer from SNF
Transfer from other
health facility
7
8
9
10
Emergency room
Court/Law enforcement
Other – Specify
Item not available
15. Status/Disposition of patient – Mark (X) appropriate box(es)
Status
1
Alive
Disposition
a.
b.
c.
d.
2
3
e.
Died
Status not stated
Routine discharge/discharged home
Left against medical advice
Discharged, transferred to another
short-term hospital
Discharged, transferred to
long-term care institution
Other disposition/not stated
Principal
1. Worker’s
compensation
2. Medicare
3. Medicaid
4. Other government payments
5. Blue Cross/Blue Shield
6. HMO/PPO
7. Other private or
commercial insurance
8. Self pay
9. No charge
10. Other –Specify
No source of payment indicated
(Over)
Figure. Medical abstract form for the National Hospital Discharge Survey, 2006
Other
additional
sources
Mark all
that
apply
Series 13, No. 168 [ Page 55
D. MEDICAL INFORMATION
17. Final Diagnoses (including E-code diagnoses) (Enter ICD-9-CM codes as well as narrative if available)
Principal:
Other/additional:
18. Surgical and Diagnostic Procedures (Enter ICD-9-CM codes as well as narrative if
available)
Date of procedure(s)
Month
Day
Year
Principal:
Other/additional:
NONE
Completed by
Page 2
Figure. Medical abstract form for the National Hospital Discharge Survey, 2006—Con.
Date
FORM HDS-1 (9-9-2005)
Page 56 [ Series 13, No. 168
Table II. Estimated parameters for approximate relative standard error equations for National Hospital Discharge Survey statistics, by
selected characteristics: United States, 2006
Discharges or firstlisted diagnoses
Days of care
All-listed diagnoses
All-listed procedures
Characteristic
a
b
a
b
a
b
a
b
Total. . . . . . . . . . . . . . . . . . . . . . . . . . . . . . . . . . . .
0.00203
346.658
0.00265
1048.885
0.00210
340.544
0.00411
285.906
0.00233
0.00204
321.677
335.486
0.00326
0.00284
1048.558
1229.584
0.00223
0.00486
385.004
331.276
0.00354
0.00382
414.588
336.057
Sex
Male . . . . . . . . . . . . . . . . . . . . . . . . . . . . . . . . . . .
Female . . . . . . . . . . . . . . . . . . . . . . . . . . . . . . . . . .
Age
Under 15 years . .
15–44 years . . . .
45–64 years . . . .
65 years and over
.
.
.
.
.
.
.
.
.
.
.
.
.
.
.
.
.
.
.
.
.
.
.
.
.
.
.
.
.
.
.
.
.
.
.
.
.
.
.
.
.
.
.
.
.
.
.
.
.
.
.
.
.
.
.
.
.
.
.
.
.
.
.
.
.
.
.
.
.
.
.
.
.
.
.
.
.
.
.
.
.
.
.
.
.
.
.
.
.
.
.
.
.
.
.
.
0.02734
0.00233
0.00193
0.00216
220.637
294.541
309.675
337.597
0.04430
0.00353
0.00349
0.00298
299.840
1060.103
961.964
1570.563
0.03159
0.00228
0.00217
0.00234
175.490
306.103
302.140
307.562
0.04016
0.00280
0.00420
0.00270
212.752
331.208
303.910
350.029
Northeast
Midwest .
South . . .
West . . .
.
.
.
.
.
.
.
.
.
.
.
.
.
.
.
.
.
.
.
.
Region
. . . . .
. . . . .
. . . . .
. . . . .
.
.
.
.
.
.
.
.
.
.
.
.
.
.
.
.
.
.
.
.
.
.
.
.
.
.
.
.
.
.
.
.
.
.
.
.
.
.
.
.
.
.
.
.
.
.
.
.
.
.
.
.
.
.
.
.
.
.
.
.
.
.
.
.
.
.
.
.
0.00680
0.01430
0.00330
0.00631
188.911
212.247
336.326
357.712
0.00945
0.01655
0.00461
0.01283
568.080
431.979
1362.983
788.148
0.01020
0.01490
0.00371
0.00713
173.480
309.321
282.142
384.090
0.01935
0.01752
0.00419
0.00826
222.379
196.701
332.265
404.867
Principal expected source of payment
Medicare . . . . . . . . . . . . . . . . . . . . . . . . . . . . . .
Medicaid . . . . . . . . . . . . . . . . . . . . . . . . . . . . . .
Worker’s compensation and other government payment .
HMO and PPO1 . . . . . . . . . . . . . . . . . . . . . . . . .
Blue Cross Blue Shield and other private insurance . . .
Self-pay . . . . . . . . . . . . . . . . . . . . . . . . . . . . . .
No charge and other. . . . . . . . . . . . . . . . . . . . . . .
.
.
.
.
.
.
.
.
.
.
.
.
.
.
.
.
.
.
.
.
.
0.00256
0.00718
0.00641
0.00651
0.00255
0.00438
0.02094
308.113
271.894
326.968
249.205
356.134
235.273
245.828
0.00350
0.01017
0.01263
0.00870
0.00419
0.00837
0.03074
1187.919
845.987
1536.898
687.995
993.237
506.645
658.388
0.00261
0.00667
0.00904
0.00713
0.00296
0.00610
0.01895
296.990
274.905
347.481
298.372
348.198
240.669
248.794
0.00575
0.00807
0.00594
0.00888
0.00402
0.00441
0.02223
402.437
281.606
381.945
296.655
310.888
305.267
243.282
.
.
.
.
.
.
.
.
.
.
.
.
.
.
.
.
.
.
.
.
.
.
.
.
.
.
.
.
.
.
.
.
1
HMO is health maintenance organization and PPO is preferred provider organization.
NOTE: The relative standard error (RSE) can be determined from the equation RSE(x) = SQRT(a + b/X).
When multiplied by 100, RSE(X) is
expressed as a percentage of X.
The approximate RSE for a
percentage, 100p, in which the
numerator is a subclass of the
denominator, may be calculated directly
using the formula
RSE(p) = √ b (1−p) / (pX) ,
where 100p is the percentage of interest,
X is the denominator of the percentage,
and b is the parameter b in the formula
for approximating the RSE(X). The
values for b are given in Table II. When
multiplied by 100, RSE(p) is expressed
as a percentage of p. This approximation
is valid if the RSE of the denominator is
less than 5 percent or the RSEs of the
numerator and denominator are both less
than 10 percent (25,26).
The approximate RSE of a
population-based rate is equivalent to
the approximate RSE of the numerator
(obtained by the method described
above using figures from Table II), if the
denominator is an estimate produced by
the U.S. Census Bureau for the total
population or one or more of the
age-sex groups of the total population.
The approximate RSE of a ratio
(X/Y) in which the numerator (X) and
the denominator (Y) are both estimated
from the same survey, but the numerator
is not a subclass of the denominator,
and is calculated using the formula
reimbursement of hospital inpatient care.
The categories for admission source
shown in this report include:
RSE(X/Y) = √[RSE(X)]2 + [RSE(Y)]2 .
Physician referral—The patient was
admitted to the hospital upon the
recommendation of his or her
personal physician, a hospital’s
clinic physician, or a health
maintenance organization (HMO)
physician.
When multiplied by 100, the RSE(X/Y)
is expressed as a percentage of the ratio
X/Y. This approximation is valid if the
RSE of the denominator is less than
5 percent or the RSEs of the numerator
and denominator are both less than
10 percent (25,26).
Emergency department—The patient
was admitted to the hospital upon
the recommendation of a hospital’s
emergency department physician.
The terms ‘‘emergency department’’
and ‘‘emergency room’’ are used
interchangeably in this report.
Definitions of Selected
Terms
Admission source—The source of
admission variable was added to NHDS
beginning in 2001 and was modeled
after the variable in the National
Uniform Bill (UB–92), the standard
billing form used by Medicare for
Transfer from a hospital—The
patient was admitted to the hospital
as a transfer from an acute care
hospital where he or she was an
inpatient.
Transfer from other health
facility—The patient was admitted
to the hospital as a transfer from a
skilled nursing facility or other
Series 13, No. 168 [ Page 57
health facility where he or she was
an inpatient.
Other sources—The patient was
admitted to the hospital upon the
direction of a court of law, on the
request of a law enforcement
agency representative, or for other
reasons not categorized above.
Item not available—Information
about the source of admission to the
hospital was not available for the
patient.
Admission type—Like admission
source, the admission type variable was
added to NHDS in 2001 and is modeled
after the variable in the UB–92. Four
admission types are shown in this
report:
Emergency—The patient required
immediate medical intervention as a
result of severe life threatening or
potentially disabling conditions.
Patients in this group are generally
admitted through the emergency
room.
Urgent—The patient required
immediate care and treatment of a
physical or mental disorder. Patients
in this group are usually admitted to
the first available and suitable
accommodation.
Elective—The patient’s condition
permitted adequate time to schedule
the availability of suitable
accommodation.
Newborn—The patient is a baby
born within the hospital.
Item not available—Information
about the admission type for the
patient was not available.
Age—The patient’s age at the
birthday prior to admission to the
hospital.
Average length of stay—The mean
length of stay for discharges, which is
calculated by dividing the number of
days of care by the number of
discharges.
Barell injury diagnosis matrix—A
two-dimensional array that includes all
the International Classification of
Diseases, Ninth Revision, Clinical
Modification (ICD–9–CM) codes
describing injury (20). The code
numbers from the matrix are shown in
Table III. This matrix was developed to
provide a standard format for describing
the site and type of injuries for use in
epidemiological and clinical analyses of
injury data.
Bed size of hospital—The number
of beds, cribs, and pediatric bassinets
regularly maintained (set up and staffed
for use) for patients, not including
bassinets for newborn infants. In this
report, the classification of hospitals by
bed size is based on the number of beds
listed in the Verispan files (17).
Days of care—The total number of
days a patient spent in the hospital. A
stay of less than 1 day (patient admitted
as an inpatient and discharged on the
same day) is counted as 1 day. For
patients admitted and discharged on
different days, the number of days of
care is computed by counting all the
days from (and including) the day of
admission to (but not including) the day
of discharge.
Death rate—Calculated by dividing
the number of deaths for a category by
the total number of discharges in that
category and multiplying by 100.
Discharges whose status is unknown
(1.5 percent) were assumed to be
discharged alive.
Diagnosis—A disease or injury (or
other factor that influences a patient’s
health status or causes contact with
health services) that is listed on the
medical record of the patient at
discharge. The principal diagnosis is the
diagnosis established after the study to
be chiefly responsible for the admission
of the patient to the hospital. In this
report, the first-listed diagnosis is
defined as that specified as the principal
diagnosis on the face sheet or discharge
summary of the medical record, or, if
the principal diagnosis is not specified,
it is the first diagnosis listed on the face
sheet or discharge summary of the
medical record. The first-listed diagnosis
is usually the main cause of the
hospitalization. The number of
first-listed diagnoses is the same as the
number of discharges. All-listed
diagnoses include first-listed diagnoses
and secondary diagnoses and are
included for users who want to know
the total number of times conditions
have been reported for hospitalized
patients. A minimum of one and a
maximum of seven diagnoses are coded
per discharge in NHDS. Human
immunodeficiency virus (HIV) data
(Table 23) are for discharges with an
HIV diagnosis listed in any position
among the coded diagnoses.
Discharge—A completed inpatient
hospitalization. A hospitalization may be
completed by death or by releasing the
patient to the customary place of
residence, a nursing home, another
hospital, or another location.
Disposition—The placement or
status of the patient when discharged
from the hospital. Six disposition
categories are shown in this report:
Routine or discharged home—
Patients who were discharged to
return to their homes, including
those referred to home care
services, discharged to a relative or
foster home, or transferred to a
corrections institution.
Transferred to other short-term
hospital—Patients discharged and
transferred to another short-term
hospital for additional care.
Transferred to long-term care
institution—Patients discharged and
transferred or returned to a nursing
home, skilled nursing facility,
extended care facility, intermediate
care facility, or custodial care
facility.
Other discharged alive—Includes
patients discharged alive whose
disposition is unknown; patients
who left the hospital against
medical advice; patients transferred
to another facility who could not be
classified as short-term or
long-term; and patients transferred
to a state facility, psychiatric
facility, terminal care or hospice
facility, rehabilitation facility, or
specialty hospital.
Died—Patients who died while
hospitalized as inpatients.
Status not stated—No information
was available on whether the patient
was discharged alive or died in the
hospital.
[Code numbers are based on the International Classification of Diseases, Ninth Revision, Clinical Modification]
Type of injury
All body sites
Traumatic
brain injury
Other head, face,
and neck
Spinal
cord
Vertebral
column
All types of injury . . . .
800–908, 909.0–909.2,
909.4, 909.9, 910–994,
995.50–995.59,
995.80–995.85
800–801, 803,
804, 850–854,
950.1–950.3,
995.55
802, 807.5–807.6,
830, 848.0–848.2,
870–874, 900, 910,
918, 920–921, 925,
940–941, 947.0,
950.0, 950.9, 951,
953.0, 954.0,
957.0, 959.0
806, 952
805, 839.0–
839.5,
847.0–847.4
Fracture . . . . . . . . .
800–829
802, 807.5–807.6
806
805
Dislocation . . . . . . .
Sprains and strains . .
830–839
840–848
800–801, 803,
804
None
None
830
848.0–848.2
None
None
839.0–839.5
847.0–847.4
Internal . . . . . . . . .
850–854,
995.55
None
None
952
None
Open wound. . . . . . .
850–854, 860–869,
952, 995.55
870–884, 890–894
870–874
None
None
Amputation . . . . . . .
Blood vessels . . . . .
885–887, 895–897
900–904
None
None
None
900
None
None
None
None
Contusions and
superficial injuries . .
Crush . . . . . . . . . .
Burns . . . . . . . . . .
910–924
925–929
940–949
None
None
None
910, 918,
920–921
925
940–941, 947.0
None
None
None
None
None
None
950.1–950.3
None
950.0, 950.9, 951,
953.0, 954.0,
957.0
959.0
None
None
None
None
Nerves and spinal
cord . . . . . . . . . . .
Unspecified . . . . . . .
System–wide . . . . . .
950–951, 953–957
959
905–908, 909.0–909.2,
909.4, 909.9, 930–939,
958, 960–994, 995.50–
995.54, 995.59,
995.80–995.85
Upper
extremities
Lower
extremities
Other and
unspecified
807.0–807.4, 808–809,
839.6–839.7, 846, 847.9,
848.3–848.5, 860–868,
875–878, 879.0–879.7,
901, 902.0–902.5,
902.81–902.82, 911, 922,
926, 942, 947.3–947.4,
953.1–953.3, 953.5,
954.1–954.9, 959.1
810–818, 831–834,
840–842, 880–887,
903, 912–915, 923,
927, 943–944,
953.4, 955,
959.2–959.5
820–827, 835–838,
843–845, 890–897,
904.0–904.8, 916,
917, 924.0–924.5,
928, 945,
959.6–959.7
807.0–807.4,
808, 809
839.6–839.7
846, 847.9,
848.3–848.5
860–868
810–818
820–827
819, 828–829, 839.8–
839.9, 848.8–848.9,
869, 879.8–879.9,
902.87, 902.89,
902.9, 904.9, 919,
924.8–924.9, 929,
946, 947.1–947.2,
947.8–947.9, 948,
949, 953.8–953.9,
956, 957.1–957.9,
959.8–959.9
819, 828–829
831–834
840–842
835–838
843–845
839.8–839.9
848.8–848.9
None
None
869
880–884
890–894
879.8–879.9
885–887
903
895–897
904.0–904.8
912–915,
923
927
943–944
916–917,
924.0–924.5
928
945
None
902.87, 902.89,
902.9, 904.9
919,
924.8–924.9
929
946, 947.1–947.2,
947.8–947.9,
948–949
953.4, 955
959.2–959.5
None
959.6–959.7
Torso
875–878,
879.0–879.7
None
901, 902.0–902.5,
902.81–902.82
911, 922
926
942,
947.3–947.4
953.1–953.3,
953.5, 954.1–954.9
959.1
SOURCE: CDC/NCHS, the Barrell injury diagnosis matrix, classification by body region and nature of the injury. Available from http://www.cdc.gov/nchs/about/otheract/ice/barellmatrix.htm.
953.8–953.9, 956,
957.1–957.9
959.8–959.9
Page 58 [ Series 13, No. 168
Table III. Code numbers for Barell injury diagnosis matrix categories in Table 24
Series 13, No. 168 [ Page 59
Hospital—Those with an average
length of stay for all inpatients fewer
than 30 days (short stay) or those whose
specialty is general (medical or surgical)
or children’s general. Federal hospitals,
hospital units of institutions, and
hospitals with fewer than six beds
staffed for patient use are excluded.
Newborn infant—Inpatients
admitted to a hospital by birth. Sick
newborn infants are those that had at
least one of the ICD–9–CM (1)
diagnostic codes 001–999.
Ownership of hospital—Ownership
type is determined by the organization
that controls and operates the hospital.
Hospitals are grouped as follows:
included in this category only if
Medicare is reported as the principal
expected source of payment.
Medicaid—A jointly funded
federal-state health insurance
program providing medical care to
those unable to afford it. If
Medicaid and an HMO or preferred
provider organization (PPO) are
reported, the discharge is included
in the category listed first.
Worker’s compensation—A state or
municipal disability insurance or
industrial accident insurance.
Other government—Includes
payments under the Title V
Program, the state-funded Maternal
and Child Health Program that
provides coverage for children up to
age 21 with specific chronic
medical conditions, CHAMPUS
(Civilian Health and Medical
Program of the Uniformed Services)
or TRICARE (the Defense
Department’s health care program
for service families), casualty
insurance paid by the state,
vocational rehabilitation, federal or
state research grant (medical
research), or legal hold (prisoner in
medical detention).
Proprietary—Hospitals operated by
individuals, partnerships, or
corporations for profit.
Government—Hospitals operated by
state or local governments.
Nonprofit—Hospitals operated by a
nonprofit organization or church.
Principal expected source of
payment—The primary expected method
of payment for the hospitalization as
reported on the patient’s medical record.
Types of payment include:
Medicare—The health insurance
program for the aged and disabled
administered by the Centers for
Medicare & Medicaid Services
(CMS). A person age 65 and over is
HMO or PPO—Any HMO or PPO
sponsored by consumers, insurers,
organizations, physicians, or
hospitals. Medicare and Medicaid
discharges are included in this
category when HMO or PPO is
reported as the principal expected
source of payment.
Blue Cross Blue Shield and other
private—A private insurance plan
not specified as an HMO or PPO.
This includes Blue Cross Blue
Shield plans, medical coverage
provided by life insurance
companies, private casualty
insurance companies, health
insurance companies, and
independent plans such as
employer- and union-sponsored
plans and self-funded plans (partial
or total).
Self-pay—The majority of the costs
for the hospitalization were
expected to be paid by the patient,
spouse, family, or next of kin.
No charge—Patients admitted with
the understanding that the medical
services would be free. This
includes hospital-sponsored special
research or teaching patients.
Other—Includes any nonprofit
source of payment, such as church
welfare, United Way (United
Appeal), or Shriner’s Hospitals for
Children.
Procedure—Surgical procedures
(such as appendectomy), diagnostic
procedures (such as spinal tap), and
Table IV. Code numbers for procedures considered nonsurgical in the National Hospital Discharge Survey, by ICD–9–CM category, 2006
Procedure categories and code numbers are based on the International Classification of Diseases, Ninth Revision, Clinical Modification (ICD–9–CM)]
Procedure category and ICD–9–CM code
Operations
Operations
Operations
Operations
Operations
Operations
Operations
Operations
Operations
on
on
on
on
on
on
on
on
on
the
the
the
the
the
the
the
the
the
nervous system . . . . . . . .
endocrine system . . . . . . .
eye . . . . . . . . . . . . . . .
ear . . . . . . . . . . . . . . . .
nose, mouth, and pharynx . .
respiratory system. . . . . . .
cardiovascular system . . . .
hemic and lymphatic system
digestive system . . . . . . .
.
.
.
.
.
.
.
.
.
.
.
.
.
.
.
.
.
.
.
.
.
.
.
.
.
.
.
.
.
.
.
.
.
.
.
.
.
.
.
.
.
.
.
.
.
.
.
.
.
.
.
.
.
.
Nonsurgical codes
.
.
.
.
.
.
.
.
.
.
.
.
.
.
.
.
.
.
.
.
.
.
.
.
.
.
.
.
.
.
.
.
.
.
.
.
.
.
.
.
.
.
.
.
.
.01–05
.06–07
.08–16
.18–20
.21–29
.30–34
.35–39
.40–41
.42–54
Operations on the urinary system . . . . . . . . . . . . . . . . . . . . .55–59
Operations on the male genital organs . . . . . . . . . . . . . . . . .60–64
Operations on the female genital organs . . . . . . . . . . . . . . . .65–71
Obstetrical procedures . . . . . . . . . . . . . . . . . . . . . . . . . . .72–75
Operations on the musculoskeletal system . . . . . . . . . . . . . . .76–84
Operations on the integumentary system . . . . . . . . . . . . . . . .85–86
Miscellaneous diagnostic and therapeutic procedures and new
technologies . . . . . . . . . . . . . . . . . . . . . . . . . . . . . . .87–99,00
01.18–01.19,03.31,03.39,04.19,05.19
06.19,07.19
08.19,09.19,09.41–09.44,09.49,10.29,11.29,12.29,14.19,15.09,16.21,16.29
18.01,18.11,18.19,20.31,20.39
21.00–21.02,21.21,21.29,22.19,24.19,25.09,26.19,27.29,28.19,29.11,29.19
31.41–31.42,31.48–31.49,33.21–33.23,33.29,34.21–34.22,34.28–34.29
37.26–37.28,37.29,38.29,39.95
40.19,41.38–41.39
42.22–42.23,42.29,44.11–44.13,44.19,44.32,45.11–45.13,45.19,45.21–45.24,
45.28–45.29, 48.21–48.23,48.29,49.21,49.29,50.19,51.10–51.11,51.19,52.19,
54.21, 54.29
55.21–55.22,55.29,56.31,56.35,56.39,57.31–57.32,57.39,57.94–57.95,
58.21–58.22,58.29,59.29
60.18–60.19,61.19,62.19,63.09,64.19,64.94
65.19,66.19,67.19,68.11,68.19,69.92,70.21–70.22,70.29,71.19
73.4–73.59,73.91–73.92,75.31–75.32,75.34–75.35,75.38,75.94
76.19,78.80–78.89,80.20–80.29,81.98,83.29,84.41–84.43,84.45–84.47
85.19,86.19,86.92
87.01–99.99,00.01–00.03, 00.09, 00.11–00.15, 00.17–00.18
Page 60 [ Series 13, No. 168
therapeutic treatments (such as injection
or infusion of cancer chemotherapeutic
substance) reported on a patient’s
medical record. Data are for all-listed
procedures, which include all
occurrences of the procedure coded,
regardless of the order in the medical
record. Up to four procedures are coded
per discharge in NHDS. Procedures
classified as nonsurgical in this report
are listed in Table IV by ICD–9–CM
code numbers (1). This table was
updated for use with the 2006 data. All
other procedures were considered
surgical. This classification began in
1979 for the presentation of NHDS data
and still remains an important
distinction. However, the development
of minimally invasive and noninvasive
procedures has resulted in less
difference between surgical and
nonsurgical procedures with regard to
operative or anesthetic risk and
requirements for highly trained
personnel or special equipment.
Region—Hospitals are classified by
location in one of the four geographic
regions of the United States that
correspond to those used by the U.S.
Census Bureau.
Region
States included
Northeast Maine, Vermont, New
Hampshire, Massachusetts,
Connecticut, Rhode Island,
New York, New Jersey, and
Pennsylvania
Midwest Ohio, Illinois, Indiana,
Michigan, Wisconsin,
Minnesota, Iowa, Missouri,
North Dakota, South Dakota,
Kansas, and Nebraska
South
Delaware, Maryland, District
of Columbia, West Virginia,
Virginia, Kentucky,
Tennessee, North Carolina,
South Carolina, Georgia,
Florida, Alabama,
Mississippi, Louisiana,
Oklahoma, Arkansas, and
Texas
West
Washington, Oregon,
California, Nevada, New
Mexico, Arizona, Idaho,
Utah, Colorado, Montana,
Wyoming, Alaska, and
Hawaii
Changes in ICD–9–CM
Codes
Although the ICD–9–CM
classification system has been used for
coding NHDS data since 1979, the
classification system undergoes annual
updating. Assignment of new diagnostic
and procedure codes and fourth- and
fifth-digit expansion of codes, as well as
code deletions, are contained in addenda
developed by the ICD–9–CM
Coordination and Maintenance
Committee and approved by the
Director of NCHS and the Administrator
of CMS (formerly Health Care
Financing Administration). Addenda to
the ICD–9–CM have become effective
October 1 of each year since 1986,
except in 1999. No addendum was
released in 1999 because of concerns
about instituting coding changes before
the millennium crossover.
The data in this report were coded
using the addenda for October 1,
1986–2005. When hospitals reported
data using code changes introduced in
the October 1, 2006 addendum, the new
codes were converted to their previous
code assignments so that the annual
estimates would be based on consistent
coding.
The new ICD–9–CM codes from
the 1986–2005 addenda, the date each
code was introduced, and the code to
which the diagnosis or procedure was
assigned before development of the new
code are shown in Table V (diagnoses
codes) and Table VI (procedure codes).
Specific titles and more detailed
information about the coding system can
be found in appropriate volumes of the
ICD–9–CM (1).
Series 13, No. 168 [ Page 61
Table V. Changes in ICD–9–CM diagnosis codes, 1986–2005
Current code(s) assignment
Effective
October 1
Previous code(s)
assignment
005.8
007.8
007.8
008.0
008.49
008.6
031.8
038.1
040.89
041.0
041.04
041.1
041.8
041.84
042.0–042.2, 042.9,
043.0–043.3, 043.9,
044.0, 044.9
(Codes deleted)
279.19
066.3
066.4
070.2
070.20
070.21
070.3
070.30
070.31
070.4
070.41
070.4
070.5
070.51
070.5
070.51
070.41
077.9
078.1
078.89
079.8
079.8
079.89
079.89
079.89
079.8
079.9
082.8
088.8
088.89
099.4
078.89
112.89
114.3
173.0–173.9
203.0
V10.79
203.1
V10.79
203.8
V10.79
204.0
V10.61
204.1
V10.61
204.2
V10.61
204.8
V10.61
204.9
005.81, 005.89 . . . . . . . . .
007.4 . . . . . . . . . . . . . .
007.5. . . . . . . . . . . . . . .
008.00–008.09 . . . . . . . . .
008.43–008.47 . . . . . . . . .
008.6–008.69. . . . . . . . . .
031.2. . . . . . . . . . . . . . .
038.10–038.11, 038.19 . . . .
040.82 . . . . . . . . . . . . . .
041.00–041.05, 041.09 . . . .
041.04 (Code title restated) .
041.10–041.19 . . . . . . . . .
041.81–041.85, 041.89 . . . .
041.86 . . . . . . . . . . . . . .
042 . . . . . . . . . . . . . . . .
.
.
.
.
.
.
.
.
.
.
.
.
.
.
.
.
.
.
.
.
.
.
.
.
.
.
.
.
.
.
.
.
.
.
.
.
.
.
.
.
.
.
.
.
.
.
.
.
.
.
.
.
.
.
.
.
.
.
.
.
.
.
.
.
.
.
.
.
.
.
.
.
.
.
.
.
.
.
.
.
.
.
.
.
.
.
.
.
.
.
1995
1997
2000
1992
1992
1992
1997
1997
2002
1992
1997
1992
1992
1995
1994
042.0–044.9 . . . . . . .
066.4. . . . . . . . . . . .
066.40–066.42, 066.49 .
070.20–070.21 . . . . . .
070.22 . . . . . . . . . . .
070.23 . . . . . . . . . . .
070.30–070.31 . . . . . .
070.32 . . . . . . . . . . .
070.33 . . . . . . . . . . .
070.41–070.43 . . . . . .
070.44 . . . . . . . . . . .
070.49 . . . . . . . . . . .
070.51–070.53 . . . . . .
070.54 . . . . . . . . . . .
070.59 . . . . . . . . . . .
070.70 . . . . . . . . . . .
070.71 . . . . . . . . . . .
077.98–077.99 . . . . . .
078.10–078.11, 078.19 .
078.88 . . . . . . . . . . .
079.4. . . . . . . . . . . .
079.50–079.53, 079.59 .
079.6. . . . . . . . . . . .
079.81 . . . . . . . . . . .
079.82 . . . . . . . . . . .
079.88–079.89 . . . . . .
079.98–079.99 . . . . . .
082.40–082.41, 082.49 .
088.81, 088.89 . . . . . .
088.82 . . . . . . . . . . .
099.40–099.49 . . . . . .
099.50–099.59 . . . . . .
112.84–112.85 . . . . . .
114.4–114.5. . . . . . . .
176.0–176.9 . . . . . . .
203.00 . . . . . . . . . . .
203.01 . . . . . . . . . . .
203.10 . . . . . . . . . . .
203.11 . . . . . . . . . . .
203.80 . . . . . . . . . . .
203.81 . . . . . . . . . . .
204.00 . . . . . . . . . . .
204.01 . . . . . . . . . . .
204.10 . . . . . . . . . . .
204.11 . . . . . . . . . . .
204.20 . . . . . . . . . . .
204.21 . . . . . . . . . . .
204.80 . . . . . . . . . . .
204.81 . . . . . . . . . . .
204.90 . . . . . . . . . . .
.
.
.
.
.
.
.
.
.
.
.
.
.
.
.
.
.
.
.
.
.
.
.
.
.
.
.
.
.
.
.
.
.
.
.
.
.
.
.
.
.
.
.
.
.
.
.
.
.
.
.
.
.
.
.
.
.
.
.
.
.
.
.
.
.
.
.
.
.
.
.
.
.
.
.
.
.
.
.
.
.
.
.
.
.
.
.
.
.
.
.
.
.
.
.
.
.
.
.
.
.
.
.
.
.
.
.
.
.
.
.
.
.
.
.
.
.
.
.
.
.
.
.
.
.
.
.
.
.
.
.
.
.
.
.
.
.
.
.
.
.
.
.
.
.
.
.
.
.
.
.
.
.
.
.
.
.
.
.
.
.
.
.
.
.
.
.
.
.
.
.
.
.
.
.
.
.
.
.
.
.
.
.
.
.
.
.
.
.
.
.
.
.
.
.
.
.
.
.
.
.
.
.
.
.
.
.
.
.
.
.
.
.
.
.
.
.
.
.
.
.
.
.
.
.
.
.
.
.
.
.
.
.
.
.
.
.
.
.
.
.
.
.
.
.
.
.
.
.
.
.
.
.
.
.
.
.
.
.
.
.
.
.
.
.
.
.
.
.
.
.
.
.
.
.
.
.
.
.
.
.
.
.
.
.
.
.
.
.
.
.
.
.
.
.
.
.
.
.
.
1986
2002
2004
1991
1994
1994
1991
1994
1994
1991
1994
1991
1991
1994
1991
2004
2004
1993
1993
1993
1993
1993
1996
1995
2003
1993
1993
2000
1989
1993
1992
1992
1992
1993
1991
1991
1991
1991
1991
1991
1991
1991
1991
1991
1991
1991
1991
1991
1991
1991
.
.
.
.
.
.
.
.
.
.
.
.
.
.
.
.
.
.
.
.
.
.
.
.
.
.
.
.
.
.
.
.
.
.
.
.
.
.
.
.
.
.
.
.
.
.
.
.
.
.
.
.
.
.
.
.
.
.
.
.
.
.
.
.
.
.
.
.
.
.
.
.
.
.
.
.
.
.
.
.
.
.
.
.
.
.
.
.
.
.
.
.
.
.
.
.
.
.
.
.
.
.
.
.
.
.
.
.
.
.
.
.
.
.
.
.
.
.
.
.
.
.
.
.
.
.
.
.
.
.
.
.
.
.
.
.
.
.
.
.
.
.
.
.
.
.
.
.
.
.
Effective
October 1
Current code(s) assignment
204.91 . . . . . . . . . . .
205.00 . . . . . . . . . . .
205.01 . . . . . . . . . . .
205.10 . . . . . . . . . . .
205.11 . . . . . . . . . . .
205.20 . . . . . . . . . . .
205.21 . . . . . . . . . . .
205.30 . . . . . . . . . . .
205.31 . . . . . . . . . . .
205.80 . . . . . . . . . . .
205.81 . . . . . . . . . . .
205.90 . . . . . . . . . . .
205.91 . . . . . . . . . . .
206.00 . . . . . . . . . . .
206.01 . . . . . . . . . . .
206.10 . . . . . . . . . . .
206.11 . . . . . . . . . . .
206.20 . . . . . . . . . . .
206.21 . . . . . . . . . . .
206.80 . . . . . . . . . . .
206.81 . . . . . . . . . . .
206.90 . . . . . . . . . . .
206.91 . . . . . . . . . . .
207.00 . . . . . . . . . . .
207.01 . . . . . . . . . . .
207.10 . . . . . . . . . . .
207.11 . . . . . . . . . . .
207.20 . . . . . . . . . . .
207.21 . . . . . . . . . . .
207.80 . . . . . . . . . . .
207.81 . . . . . . . . . . .
208.00 . . . . . . . . . . .
208.01 . . . . . . . . . . .
208.10 . . . . . . . . . . .
208.11 . . . . . . . . . . .
208.20 . . . . . . . . . . .
208.21 . . . . . . . . . . .
208.80 . . . . . . . . . . .
208.81 . . . . . . . . . . .
208.90 . . . . . . . . . . .
208.91 . . . . . . . . . . .
237.70–237.72 . . . . . .
250.02 . . . . . . . . . . .
250.03 . . . . . . . . . . .
250.12 . . . . . . . . . . .
250.13 . . . . . . . . . . .
250.22 . . . . . . . . . . .
250.23 . . . . . . . . . . .
250.32 . . . . . . . . . . .
250.33 . . . . . . . . . . .
250.42 . . . . . . . . . . .
250.43 . . . . . . . . . . .
250.52 . . . . . . . . . . .
250.53 . . . . . . . . . . .
250.62 . . . . . . . . . . .
250.63 . . . . . . . . . . .
250.72 . . . . . . . . . . .
250.73 . . . . . . . . . . .
250.82 . . . . . . . . . . .
250.83 . . . . . . . . . . .
250.92 . . . . . . . . . . .
250.93 . . . . . . . . . . .
252.00–252.02, 252.08 .
255.10–255.14 . . . . . .
256.31–256.39 . . . . . .
259.5. . . . . . . . . . . .
273.4. . . . . . . . . . . .
.
.
.
.
.
.
.
.
.
.
.
.
.
.
.
.
.
.
.
.
.
.
.
.
.
.
.
.
.
.
.
.
.
.
.
.
.
.
.
.
.
.
.
.
.
.
.
.
.
.
.
.
.
.
.
.
.
.
.
.
.
.
.
.
.
.
.
.
.
.
.
.
.
.
.
.
.
.
.
.
.
.
.
.
.
.
.
.
.
.
.
.
.
.
.
.
.
.
.
.
.
.
.
.
.
.
.
.
.
.
.
.
.
.
.
.
.
.
.
.
.
.
.
.
.
.
.
.
.
.
.
.
.
.
.
.
.
.
.
.
.
.
.
.
.
.
.
.
.
.
.
.
.
.
.
.
.
.
.
.
.
.
.
.
.
.
.
.
.
.
.
.
.
.
.
.
.
.
.
.
.
.
.
.
.
.
.
.
.
.
.
.
.
.
.
.
.
.
.
.
.
.
.
.
.
.
.
.
.
.
.
.
.
.
.
.
.
.
.
.
.
.
.
.
.
.
.
.
.
.
.
.
.
.
.
.
.
.
.
.
.
.
.
.
.
.
.
.
.
.
.
.
.
.
.
.
.
.
.
.
.
.
.
.
.
.
.
.
.
.
.
.
.
.
.
.
.
.
.
.
.
.
.
.
.
.
.
.
.
.
.
.
.
.
.
.
.
.
.
.
.
.
.
.
.
.
.
.
.
.
.
.
.
.
.
.
.
.
.
.
.
.
.
.
.
.
.
.
.
.
.
.
.
.
.
.
.
.
.
.
.
.
.
.
.
.
.
.
.
.
.
.
.
.
.
.
.
.
.
.
.
.
.
.
.
.
.
.
.
.
.
.
.
.
.
.
.
.
.
.
.
.
.
.
.
.
.
.
.
.
.
.
.
.
.
.
.
.
.
.
.
.
.
.
.
.
.
.
.
.
.
.
.
.
.
.
.
.
.
.
.
.
.
.
.
.
.
.
.
.
.
.
.
.
.
.
.
.
.
.
.
.
.
.
.
.
.
.
.
.
.
.
.
.
.
.
.
.
.
.
.
.
.
.
.
.
.
.
.
.
.
.
.
.
.
.
.
.
.
.
.
.
.
.
.
.
.
.
.
.
.
.
.
.
.
.
.
.
.
.
.
.
.
.
.
.
.
.
.
.
.
.
.
.
.
.
.
.
.
.
.
.
.
.
.
.
.
.
.
.
.
.
.
.
.
.
.
.
.
.
.
.
.
.
.
.
.
.
.
.
.
.
.
.
.
.
.
.
.
.
.
.
.
.
.
.
.
.
.
.
.
.
.
.
.
.
.
.
.
.
.
.
.
.
.
.
.
.
.
.
.
.
.
.
.
.
.
.
.
.
.
.
.
1991
1991
1991
1991
1991
1991
1991
1991
1991
1991
1991
1991
1991
1991
1991
1991
1991
1991
1991
1991
1991
1991
1991
1991
1991
1991
1991
1991
1991
1991
1991
1991
1991
1991
1991
1991
1991
1991
1991
1991
1991
1990
1993
1993
1993
1993
1993
1993
1993
1993
1993
1993
1993
1993
1993
1993
1993
1993
1993
1993
1993
1993
2004
2003
2001
2005
2004
Previous code(s)
assignment
V10.61
205.0
V10.62
205.1
V10.62
205.2
V10.62
205.3
V10.62
205.8
V10.62
205.9
V10.62
206.0
V10.63
206.1
V10.63
206.2
V10.63
206.8
V10.63
206.9
V10.63
207.0
V10.69
207.1
V10.69
207.2
V10.69
207.8
V10.69
208.0
V10.60
208.1
V10.60
208.2
V10.60
208.8
V10.60
208.9
V10.60
237.7
250.90
250.91
250.10
250.11
250.20
250.21
250.30
250.31
250.40
250.41
250.50
250.51
250.60
250.61
250.70
250.71
250.80
250.81
250.90
250.91
252.0
255.1
256.3
257.8
277.6
Page 62 [ Series 13, No. 168
Table V. Changes in ICD–9–CM diagnosis codes, 1986–2005—Con.
Effective
October 1
Current code(s) assignment
275.40–275.42, 275.49 .
276.50–276.52 . . . . . .
277.02–277.03, 277.09 .
277.7. . . . . . . . . . . .
277.81–277.84, 277.89 .
277.85–277.86 . . . . . .
277.87 . . . . . . . . . . .
278.00–278.01 . . . . . .
278.02 . . . . . . . . . . .
282.41–282.42, 282.49 .
282.64 . . . . . . . . . . .
282.68 . . . . . . . . . . .
283.10–283.11, 283.19 .
285.21–285.22, 285.29 .
287.30–287.33, 287.39 .
289.52 . . . . . . . . . . .
289.81–289.82, 289.89 .
291.81 . . . . . . . . . . .
291.82 . . . . . . . . . . .
291.89 . . . . . . . . . . .
292.85 . . . . . . . . . . .
293.84 . . . . . . . . . . .
294.10–294.11 . . . . . .
300.82 . . . . . . . . . . .
305.1. . . . . . . . . . . .
.
.
.
.
.
.
.
.
.
.
.
.
.
.
.
.
.
.
.
.
.
.
.
.
.
.
.
.
.
.
.
.
.
.
.
.
.
.
.
.
.
.
.
.
.
.
.
.
.
.
.
.
.
.
.
.
.
.
.
.
.
.
.
.
.
.
.
.
.
.
.
.
.
.
.
.
.
.
.
.
.
.
.
.
.
.
.
.
.
.
.
.
.
.
.
.
.
.
.
.
.
.
.
.
.
.
.
.
.
.
.
.
.
.
.
.
.
.
.
.
.
.
.
.
.
.
.
.
.
.
.
.
.
.
.
.
.
.
.
.
.
.
.
.
.
.
.
.
.
.
.
.
.
.
.
.
.
.
.
.
.
.
.
.
.
.
.
.
.
.
.
.
.
.
.
.
.
.
.
.
.
.
.
.
.
.
.
.
.
.
.
.
.
.
.
.
.
.
.
.
.
.
.
.
.
.
.
.
.
.
.
.
.
.
.
.
.
.
.
.
.
.
.
.
.
1997
2005
2002
2001
2003
2004
2004
1995
2005
2003
2003
2003
1993
2000
2005
2003
2003
1996
2005
1996
2005
1996
2000
1996
1994
312.81–312.82, 312.89 .
315.32 . . . . . . . . . . .
320.81–320.89 . . . . . .
327.00 . . . . . . . . . . .
327.01 . . . . . . . . . . .
327.02 . . . . . . . . . . .
327.09 . . . . . . . . . . .
327.10–327.14 . . . . . .
327.15 . . . . . . . . . . .
327.19 . . . . . . . . . . .
327.20–327.27 . . . . . .
327.29 . . . . . . . . . . .
.
.
.
.
.
.
.
.
.
.
.
.
.
.
.
.
.
.
.
.
.
.
.
.
.
.
.
.
.
.
.
.
.
.
.
.
.
.
.
.
.
.
.
.
.
.
.
.
.
.
.
.
.
.
.
.
.
.
.
.
.
.
.
.
.
.
.
.
.
.
.
.
.
.
.
.
.
.
.
.
.
.
.
.
.
.
.
.
.
.
.
.
.
.
.
.
.
.
.
.
.
.
.
.
.
.
.
.
1994
1996
1992
2005
2005
2005
2005
2005
2005
2005
2005
2005
327.30–327.37; 327.39 .
327.40–327.44; 327.49 .
327.51 . . . . . . . . . . .
327.52 . . . . . . . . . . .
327.53 . . . . . . . . . . .
327.59 . . . . . . . . . . .
327.8. . . . . . . . . . . .
331.11, 331.19 . . . . . .
331.82 . . . . . . . . . . .
333.92–333.93 . . . . . .
337.20–337.22, 337.29 .
337.3. . . . . . . . . . . .
342.00–342.02 . . . . . .
342.10–342.12 . . . . . .
342.80–342.82 . . . . . .
342.90–342.92 . . . . . .
344.00–344.04, 344.09 .
344.30–344.32 . . . . . .
344.40–344.42 . . . . . .
344.81, 344.89 . . . . . .
345.00–345.01 . . . . . .
345.10–345.11 . . . . . .
345.40–345.41 . . . . . .
345.50–345.51 . . . . . .
345.60–345.61 . . . . . .
345.70–345.71 . . . . . .
345.80–345.81 . . . . . .
345.90–345.91 . . . . . .
.
.
.
.
.
.
.
.
.
.
.
.
.
.
.
.
.
.
.
.
.
.
.
.
.
.
.
.
.
.
.
.
.
.
.
.
.
.
.
.
.
.
.
.
.
.
.
.
.
.
.
.
.
.
.
.
.
.
.
.
.
.
.
.
.
.
.
.
.
.
.
.
.
.
.
.
.
.
.
.
.
.
.
.
.
.
.
.
.
.
.
.
.
.
.
.
.
.
.
.
.
.
.
.
.
.
.
.
.
.
.
.
.
.
.
.
.
.
.
.
.
.
.
.
.
.
.
.
.
.
.
.
.
.
.
.
.
.
.
.
.
.
.
.
.
.
.
.
.
.
.
.
.
.
.
.
.
.
.
.
.
.
.
.
.
.
.
.
.
.
.
.
.
.
.
.
.
.
.
.
.
.
.
.
.
.
.
.
.
.
.
.
.
.
.
.
.
.
.
.
.
.
.
.
.
.
.
.
.
.
.
.
.
.
.
.
.
.
.
.
.
.
.
.
.
.
.
.
.
.
.
.
.
.
.
.
.
.
.
.
.
.
.
.
.
.
.
.
.
.
.
.
2005
2005
2005
2005
2005
2005
2005
2003
2003
1994
1993
1998
1994
1994
1994
1994
1994
1994
1994
1993
1989
1989
1989
1989
1989
1989
1989
1989
Previous code(s)
assignment
275.4
276.5
277.00
277.8
277.8
277.89
277.89, 758.89
278.0
278.00
282.4
282.63
282.69
283.1
285.8
287.3
289.59
289.8
291.8
291.89
291.8
292.89
293.89
294.1
300.81
305.10, 305.11,
305.12,
305.13 (Codes
deleted)
312.8
315.39
320.8
780.51; 780.52
780.51; 780.52
307.41
780.51; 780.52
780.53; 780.54
307.43
780.53; 780.54
780.57
780.51; 780.53;
780.57
307.45
780.59
780.58
729.82
306.8
780.58
780.50
331.1
331.89
333.99
337.9
337.9
342.0
342.1
342.9
342.9
344.0
344.3
344.4
344.8
345.0
345.1
345.4
345.5
345.6
345.7
345.8
345.9
Effective
October 1
Current code(s) assignment
346.00–346.01 . . . . . .
346.10–346.11 . . . . . .
346.20–346.21 . . . . . .
346.80–346.81 . . . . . .
346.90–346.91 . . . . . .
347.00–347.01 . . . . .
347.10–347.11 . . . . . .
348.30–348.31, 348.39 .
355.71 . . . . . . . . . . .
355.79 . . . . . . . . . . .
357.81–357.82, 357.89 .
358.00–358.01 . . . . . .
359.81, 359.89 . . . . . .
362.03–362.07 . . . . . .
365.83 . . . . . . . . . . .
371.82 . . . . . . . . . . .
372.81, 372.89 . . . . . .
374.87 . . . . . . . . . . .
380.03 . . . . . . . . . . .
403.00–403.01 . . . . . .
403.10–403.11 . . . . . .
403.90–403.91 . . . . . .
404.00–404.03 . . . . . .
404.10–404.13 . . . . . .
404.90–404.93 . . . . . .
410.00–410.02 . . . . . .
410.10–410.12 . . . . . .
410.20–410.22 . . . . . .
410.30–410.32 . . . . . .
410.40–410.42 . . . . . .
410.50–410.52 . . . . . .
410.60–410.62 . . . . . .
410.70–410.72 . . . . . .
410.80–410.82 . . . . . .
410.90–410.92 . . . . . .
411.81 . . . . . . . . . . .
411.89 . . . . . . . . . . .
414.00–414.01 . . . . . .
414.02–414.03 . . . . . .
414.04–414.05 . . . . . .
414.06 . . . . . . . . . . .
414.07 . . . . . . . . . . .
414.12 . . . . . . . . . . .
415.11 . . . . . . . . . . .
415.19 . . . . . . . . . . .
426.82 . . . . . . . . . . .
428.20–428.23 . . . . . .
428.30–428.33 . . . . . .
428.40–428.43 . . . . . .
429.71, 429.79 . . . . . .
433.00–433.01 . . . . . .
433.10–433.11 . . . . . .
433.20–433.21 . . . . . .
433.30–433.31 . . . . . .
433.80–433.81 . . . . . .
433.90–433.91 . . . . . .
434.00–434.01 . . . . . .
434.10–434.11 . . . . . .
434.90–434.91 . . . . . .
435.3. . . . . . . . . . . .
437.7. . . . . . . . . . . .
438.0. . . . . . . . . . . .
438.10 . . . . . . . . . . .
438.11 . . . . . . . . . . .
438.12 . . . . . . . . . . .
438.19 . . . . . . . . . . .
438.20 . . . . . . . . . . .
438.21 . . . . . . . . . . .
.
.
.
.
.
.
.
.
.
.
.
.
.
.
.
.
.
.
.
.
.
.
.
.
.
.
.
.
.
.
.
.
.
.
.
.
.
.
.
.
.
.
.
.
.
.
.
.
.
.
.
.
.
.
.
.
.
.
.
.
.
.
.
.
.
.
.
.
.
.
.
.
.
.
.
.
.
.
.
.
.
.
.
.
.
.
.
.
.
.
.
.
.
.
.
.
.
.
.
.
.
.
.
.
.
.
.
.
.
.
.
.
.
.
.
.
.
.
.
.
.
.
.
.
.
.
.
.
.
.
.
.
.
.
.
.
.
.
.
.
.
.
.
.
.
.
.
.
.
.
.
.
.
.
.
.
.
.
.
.
.
.
.
.
.
.
.
.
.
.
.
.
.
.
.
.
.
.
.
.
.
.
.
.
.
.
.
.
.
.
.
.
.
.
.
.
.
.
.
.
.
.
.
.
.
.
.
.
.
.
.
.
.
.
.
.
.
.
.
.
.
.
.
.
.
.
.
.
.
.
.
.
.
.
.
.
.
.
.
.
.
.
.
.
.
.
.
.
.
.
.
.
.
.
.
.
.
.
.
.
.
.
.
.
.
.
.
.
.
.
.
.
.
.
.
.
.
.
.
.
.
.
.
.
.
.
.
.
.
.
.
.
.
.
.
.
.
.
.
.
.
.
.
.
.
.
.
.
.
.
.
.
.
.
.
.
.
.
.
.
.
.
.
.
.
.
.
.
.
.
.
.
.
.
.
.
.
.
.
.
.
.
.
.
.
.
.
.
.
.
.
.
.
.
.
.
.
.
.
.
.
.
.
.
.
.
.
.
.
.
.
.
.
.
.
.
.
.
.
.
.
.
.
.
.
.
.
.
.
.
.
.
.
.
.
.
.
.
.
.
.
.
.
.
.
.
.
.
.
.
.
.
.
.
.
.
.
.
.
.
.
.
.
.
.
.
.
.
.
.
.
.
.
.
.
.
.
.
.
.
.
.
.
.
.
.
.
.
.
.
.
.
.
.
.
.
.
.
.
.
.
.
.
.
.
.
.
.
.
.
.
.
.
.
.
.
.
.
.
.
.
.
.
.
.
.
.
.
.
.
.
.
.
.
.
.
.
.
.
.
.
.
.
.
.
.
.
.
.
.
.
.
.
.
.
.
.
.
.
.
.
.
.
.
.
.
.
.
.
.
.
.
.
.
.
.
.
.
.
.
.
.
.
.
.
.
.
.
.
.
.
.
.
.
.
.
.
.
.
.
.
.
.
.
.
.
.
.
.
.
.
.
.
.
.
.
.
.
.
.
.
.
.
.
.
.
.
.
.
.
.
.
.
.
.
.
.
.
.
.
.
.
.
.
.
.
.
.
.
.
.
.
1992
1992
1992
1992
1992
2004
2004
2003
1993
1993
2002
2003
2002
2005
2002
1992
2000
1990
2004
1989
1989
1989
1989
1989
1989
1989
1989
1989
1989
1989
1989
1989
1989
1989
1989
1989
1989
1994
1994
1996
2002
2003
2002
1995
1995
2005
2002
2002
2002
1989
1993
1993
1993
1993
1993
1993
1993
1993
1993
1995
1992
1997
1997
1997
1997
1997
1997
1997
Previous code(s)
assignment
346.0
346.1
346.2
346.8
346.9
347
347
348.3
354.4
355.7
357.8
358.0
359.8
362.02
365.89
371.89
372.8
374.89
733.99
403.0
403.1
403.9
404.0
404.1
404.9
410.0
410.1
410.2
410.3
410.4
410.5
410.6
410.7
410.8
410.9
410.9
411.8
414.0
996.03
414.00
414.00
414.06
414.11
997.3 + 415.1
415.1
794.31
428.0
428.0
428.0
410.0–410.9
433.0
433.1
433.2
433.3
433.8
433.9
434.0
434.1
434.9
435.0 + 435.1
780.9
294.9 + 438
784.5 + 438
784.3 + 438
784.4 + 438
784.5 + 438
342.90 + 438
342.91 + 438
Series 13, No. 168 [ Page 63
Table V. Changes in ICD–9–CM diagnosis codes, 1986–2005—Con.
Effective
October 1
Current code(s) assignment
.
.
.
.
.
.
.
.
.
.
.
.
.
.
.
.
.
.
.
.
.
.
.
.
.
.
.
.
.
.
.
.
.
.
.
.
.
.
.
.
.
.
.
.
.
.
.
.
.
.
.
.
.
.
.
.
.
.
.
.
.
.
.
.
.
.
.
.
.
.
.
.
.
.
.
.
.
.
.
.
.
.
.
.
.
.
.
.
.
.
.
.
.
.
.
.
.
.
.
.
.
.
.
.
.
.
.
.
.
.
.
.
.
.
.
.
.
.
.
.
.
.
.
.
.
.
.
.
.
.
.
.
.
.
.
.
1997
1997
1997
1997
1997
1997
1997
1997
1998
2002
1997
1997
2002
1997
1997
1992
1993
440.24 . . . . . . . . . . . . .
440.29 . . . . . . . . . . . . .
440.30–440.32 . . . . . . . .
441.00–441.03 . . . . . . . .
441.6. . . . . . . . . . . . . .
441.7. . . . . . . . . . . . . .
443.21 . . . . . . . . . . . . .
443.22 . . . . . . . . . . . . .
443.23 . . . . . . . . . . . . .
443.24, 443.29 . . . . . . . .
443.82 . . . . . . . . . . . . .
445.01–445.02 . . . . . . . .
445.81 . . . . . . . . . . . . .
445.89 . . . . . . . . . . . . .
446.20–446.21, 446.29 . . .
451.82–451.84 . . . . . . . .
453.40–453.42 . . . . . . . .
454.8. . . . . . . . . . . . . .
458.2. . . . . . . . . . . . . .
458.21, 458.29 . . . . . . . .
458.8. . . . . . . . . . . . . .
464.00–464.01 . . . . . . . .
464.50–464.51 . . . . . . . .
466.11, 466.19 . . . . . . . .
474.0 (Code title restated) .
474.00–474.02 . . . . . . . .
477.1. . . . . . . . . . . . . .
477.2. . . . . . . . . . . . . .
480.3. . . . . . . . . . . . . .
482.30–482.39 . . . . . . . .
482.40–482.41, 482.49 . . .
482.81–482.83, 482.89 . . .
482.84 . . . . . . . . . . . . .
483.0. . . . . . . . . . . . . .
483.1. . . . . . . . . . . . . .
483.8. . . . . . . . . . . . . .
491.20–491.21 . . . . . . . .
491.22 . . . . . . . . . . . . .
493.02 . . . . . . . . . . . . .
493.12 . . . . . . . . . . . . .
493.20 . . . . . . . . . . . . .
493.21 . . . . . . . . . . . . .
493.22 . . . . . . . . . . . . .
493.81 . . . . . . . . . . . . .
493.82 . . . . . . . . . . . . .
493.92 . . . . . . . . . . . . .
494.0–494.1 . . . . . . . . .
512.1. . . . . . . . . . . . . .
517.3. . . . . . . . . . . . . .
518.6. . . . . . . . . . . . . .
518.81 . . . . . . . . . . . . .
.
.
.
.
.
.
.
.
.
.
.
.
.
.
.
.
.
.
.
.
.
.
.
.
.
.
.
.
.
.
.
.
.
.
.
.
.
.
.
.
.
.
.
.
.
.
.
.
.
.
.
.
.
.
.
.
.
.
.
.
.
.
.
.
.
.
.
.
.
.
.
.
.
.
.
.
.
.
.
.
.
.
.
.
.
.
.
.
.
.
.
.
.
.
.
.
.
.
.
.
.
.
.
.
.
.
.
.
.
.
.
.
.
.
.
.
.
.
.
.
.
.
.
.
.
.
.
.
.
.
.
.
.
.
.
.
.
.
.
.
.
.
.
.
.
.
.
.
.
.
.
.
.
.
.
.
.
.
.
.
.
.
.
.
.
.
.
.
.
.
.
.
.
.
.
.
.
.
.
.
.
.
.
.
.
.
.
.
.
.
.
.
.
.
.
.
.
.
.
.
.
.
.
.
.
.
.
.
.
.
.
.
.
.
.
.
.
.
.
.
.
.
.
.
.
.
.
.
.
.
.
.
.
.
.
.
.
.
.
.
.
.
.
.
.
.
.
.
.
.
.
.
.
.
.
.
.
.
.
.
.
.
.
.
.
.
.
.
.
.
.
.
.
.
.
.
.
.
.
.
.
.
.
.
.
.
.
.
.
.
.
.
.
.
.
.
.
.
.
.
.
.
.
.
.
.
.
.
.
.
.
.
.
.
.
.
.
.
.
.
.
.
.
.
.
.
.
.
.
.
.
.
.
.
.
.
.
.
.
.
.
.
.
.
.
.
.
.
.
.
.
.
.
.
.
.
.
1993
1993
1994
1994
1993
1993
2002
2002
2002
2002
2005
2002
2002
2002
1990
1993
2004
2002
1995
2003
1997
2001
2001
1996
1997
1997
2000
2004
2003
1992
1998
1992
1997
1992
1996
1992
1991
2004
2000
2000
1989
1989
2000
2003
2003
2000
2000
1994
2003
1997
1987
438.22 . . . . . .
438.30 . . . . . .
438.31 . . . . . .
438.32 . . . . . .
438.40 . . . . . .
438.41 . . . . . .
438.42 . . . . . .
438.50–438.52 .
438.53 . . . . . .
438.6–438.7 . .
438.81 . . . . . .
438.82 . . . . . .
438.83–438.85 .
438.89 . . . . . .
438.9. . . . . . .
440.20–440.22 .
440.23 . . . . . .
.
.
.
.
.
.
.
.
.
.
.
.
.
.
.
.
.
.
.
.
.
.
.
.
.
.
.
.
.
.
.
.
.
.
.
.
.
.
.
.
.
.
.
.
.
.
.
.
.
.
.
.
.
.
.
.
.
.
.
.
.
.
.
.
.
.
.
.
.
.
.
.
.
.
.
.
.
.
.
.
.
.
.
.
.
.
.
.
.
.
.
.
.
.
.
.
.
.
.
.
.
.
Previous code(s)
assignment
342.92 + 438
344.40 + 438
344.41 + 438
344.42 + 438
344.30 + 438
344.31 + 438
344.32 + 438
344.89 + 438
438.50
438.89
784.69 + 438
787.2 + 438
438.89
438
438
440.2
440.20 + (707.1 or
707.8 or 707.9)
440.20 + 785.4
440.2
996.1
441.0
441.1 + 441.3
441.2 + 441.4
442.81
442.2
442.1
442.89
443.89
440.29
440.1
440.8
446.2
451.89
453.8
454.9
997.9 + 458.9
458.2
458.9
464.0
464.0
466.1
474.0
474.0
477.8
477.8
480.8
482.3
482.4
482.8
482.83
483
078.88 + 484.8
483
491.2
491.21
493.00
493.10
493.90
493.91
493.20
519.1
493.90–493.91
493.90
494
997.3
282.62
518.89
799.1
Effective
October 1
Current code(s) assignment
518.82–518.89 . . . . . . . .
518.83–518.84 . . . . . . . .
519.00–519.02, 519.09 . . .
521.00–521.05, 521.09 . . .
521.06–521.08 . . . . . . . .
521.10–521.15 . . . . . . . .
521.20–521.25 . . . . . . . .
521.30–521.35 . . . . . . . .
521.40–521.45 . . . . . . . .
523.20–523.25 . . . . . . . .
524.00–524.06, 524.09 . . .
524.07 . . . . . . . . . . . . .
524.10–524.12, 524.19 . . .
524.20–524.29 . . . . . . . .
524.30–524.37, 524.39 . . .
524.50–524.57, 524.59 . . .
524.60–524.63, 524.69 . . .
524.64 . . . . . . . . . . . . .
524.70–524.77, 524.79 . . .
524.75–524.76 . . . . . . . .
524.81–524.82, 524.89 . . .
525.10–525.19 . . . . . . . .
525.20–525.26 . . . . . . . .
525.40–525.44 . . . . . . . .
525.50–525.54 . . . . . . . .
528.71–528.72, 528.79 . . .
530.10–530.11, 530.19 . . .
530.12 . . . . . . . . . . . . .
530.20–530.21 . . . . . . . .
530.81 . . . . . . . . . . . . .
530.82–530.84, 530.89 . . .
530.85 . . . . . . . . . . . . .
530.86–530.87 . . . . . . . .
535.00–535.01 . . . . . . . .
535.10–535.11 . . . . . . . .
535.20–535.21 . . . . . . . .
535.30–535.31 . . . . . . . .
535.40–535.41 . . . . . . . .
535.50–535.51 . . . . . . . .
535.60–535.61 . . . . . . . .
536.3. . . . . . . . . . . . . .
536.40–536.42, 536.49 . . .
537.82 . . . . . . . . . . . . .
537.83 . . . . . . . . . . . . .
537.84 . . . . . . . . . . . . .
556.0–556.6, 556.8–556.9 .
558.3. . . . . . . . . . . . . .
562.02 . . . . . . . . . . . . .
562.03 . . . . . . . . . . . . .
562.12 . . . . . . . . . . . . .
562.13 . . . . . . . . . . . . .
564.00–564.09 . . . . . . . .
564.81, 564.89 . . . . . . . .
567.21–567.23, 567.29 . . .
567.31 . . . . . . . . . . . . .
567.38 . . . . . . . . . . . . .
567.39 . . . . . . . . . . . . .
567.81–567.82, 567.89 . . .
569.60–569.61, 569.69 . . .
569.62 . . . . . . . . . . . . .
569.84 . . . . . . . . . . . . .
569.85 . . . . . . . . . . . . .
569.86 . . . . . . . . . . . . .
574.60 . . . . . . . . . . . . .
574.61 . . . . . . . . . . . . .
574.70 . . . . . . . . . . . . .
574.71 . . . . . . . . . . . . .
574.80 . . . . . . . . . . . . .
.
.
.
.
.
.
.
.
.
.
.
.
.
.
.
.
.
.
.
.
.
.
.
.
.
.
.
.
.
.
.
.
.
.
.
.
.
.
.
.
.
.
.
.
.
.
.
.
.
.
.
.
.
.
.
.
.
.
.
.
.
.
.
.
.
.
.
.
.
.
.
.
.
.
.
.
.
.
.
.
.
.
.
.
.
.
.
.
.
.
.
.
.
.
.
.
.
.
.
.
.
.
.
.
.
.
.
.
.
.
.
.
.
.
.
.
.
.
.
.
.
.
.
.
.
.
.
.
.
.
.
.
.
.
.
.
.
.
.
.
.
.
.
.
.
.
.
.
.
.
.
.
.
.
.
.
.
.
.
.
.
.
.
.
.
.
.
.
.
.
.
.
.
.
.
.
.
.
.
.
.
.
.
.
.
.
.
.
.
.
.
.
.
.
.
.
.
.
.
.
.
.
.
.
.
.
.
.
.
.
.
.
.
.
.
.
.
.
.
.
.
.
.
.
.
.
.
.
.
.
.
.
.
.
.
.
.
.
.
.
.
.
.
.
.
.
.
.
.
.
.
.
.
.
.
.
.
.
.
.
.
.
.
.
.
.
.
.
.
.
.
.
.
.
.
.
.
.
.
.
.
.
.
.
.
.
.
.
.
.
.
.
.
.
.
.
.
.
.
.
.
.
.
.
.
.
.
.
.
.
.
.
.
.
.
.
.
.
.
.
.
.
.
.
.
.
.
.
.
.
.
.
.
.
.
.
.
.
.
.
.
.
.
.
.
.
.
.
.
.
.
.
.
.
.
.
.
.
.
.
.
.
.
.
.
.
.
.
.
.
.
.
.
.
.
.
.
.
.
.
.
.
.
.
.
.
.
.
.
.
.
.
.
.
.
.
.
.
.
.
.
.
.
.
.
.
.
.
.
.
.
.
.
.
.
.
.
.
.
.
.
.
.
.
.
.
.
.
.
.
.
.
.
.
.
.
.
.
.
.
.
.
.
.
.
.
.
.
.
.
.
.
.
.
.
.
.
.
.
.
.
.
.
.
.
.
.
.
.
.
.
.
.
.
.
.
1987
1998
1998
2001
2004
2004
2004
2004
2004
2004
1992
2004
1992
2004
2004
2004
1991
2004
1992
2004
2004
2001
2004
2005
2005
2004
1993
2001
2003
1993
1993
2003
2004
1991
1991
1991
1991
1991
1991
1991
1994
1998
1990
1991
2002
1994
2000
1991
1991
1991
1991
2001
1998
2005
2005
2005
2005
2005
1995
1998
1990
1991
2002
1996
1996
1996
1996
1996
Previous code(s)
assignment
518.8
518.81
519.0
521.0
521.09
521.1
521.2
521.3
521.4
523.2
524.0
524.09
524.1
524.2
524.3
524.5
524.6
524.69
524.8
524.79
524.8
525.1
525.2
525.10
525.10
528.7
530.1
530.10
530.2
530.1
530.8
530.2
997.4
535.0
535.1
535.2
535.3
535.4
535.5
535.6
536.8
997.4
537.89
537.82
531.00
556
558.9
562.00
562.01
562.10
562.11
564.0
564.8
567.2
728.89
567.2
567.9
567.8
569.6
569.69
557.1
569.84
569.82
574.00 + 574.30
574.01 + 574.31
574.10 + 574.40
574.11 + 574.41
574.00 + 574.10 +
574.30 + 574.40
Page 64 [ Series 13, No. 168
Table V. Changes in ICD–9–CM diagnosis codes, 1986–2005—Con.
Effective
October 1
Current code(s) assignment
574.81 . . . . . . . . . . . . . . . . . . . . 1996
574.90 . . . . . . . . . . .
574.91 . . . . . . . . . . .
575.10–575.11 . . . . . .
575.12 . . . . . . . . . . .
585.1–585.6, 585.9 . . .
588.81, 588.89 . . . . . .
593.70–593.73 . . . . . .
596.51–596.53 . . . . . .
596.54 . . . . . . . . . . .
596.55–596.59 . . . . . .
599.60 . . . . . . . . . . .
599.69 . . . . . . . . . . .
599.81–599.89 . . . . . .
600.0–600.3, 600.9 . . .
600.00–600.01 . . . . . .
600.10–600.11 . . . . . .
600.20–600.21 . . . . . .
600.90–600.91 . . . . . .
602.3. . . . . . . . . . . .
607.85 . . . . . . . . . . .
608.82 . . . . . . . . . . .
608.87 . . . . . . . . . . .
618.00–618.05, 618.09 .
618.81–618.83, 618.89 .
621.30–621.33 . . . . . .
622.10–622.12 . . . . . .
629.20–629.23 . . . . . .
633.00–633.01 . . . . . .
633.10–633.11 . . . . . .
633.20–633.21 . . . . . .
633.80–633.81 . . . . . .
633.90–633.91 . . . . . .
645.00–645.01, 645.03 .
645.10–645.11, 645.13 .
1996
1996
1996
1996
2005
2004
1994
1992
1992
1992
2005
2005
1992
2000
2003
2003
2003
2003
2001
2003
2001
2001
2004
2004
2004
2004
2004
2002
2002
2002
2002
2002
1991
2000
645.20–645.21, 645.23 . . . . . . . . . . 2000
651.30–651.31, 651.33 . . . . . . . . . . 1989
651.40–651.41, 651.43 . . . . . . . . . . 1989
651.50–651.51, 651.53 . . . . . . . . . . 1989
651.60–651.61, 651.63 . . . . . . . . . . 1989
651.70–651.71, 651.73 .
654.20–654.21, 654.23 .
654.90–654.94 . . . . . .
655.70–655.71, 655.73 .
657.00–657.01, 657.03 .
659.60–659.61, 659.63 .
2005
1990
1990
1997
1991
1992
659.70–659.71, 659.73 . . . . . . . . . . 1998
665.10–665.11 . . . . . . . . . . . . . . . 1992
670.00, 670.02, 670.04. . . . . . . . . . 672.00, 672.02, 672.04. . . . . . . . . . 674.50–674.54 . . . . . . . . . . . . . . . 1991
1991
2003
677 . . . . . . . . . . . . .
686.00–686.01, 686.09 .
690.10, 690.18 . . . . . .
690.11 . . . . . . . . . . .
690.12 . . . . . . . . . . .
690.8. . . . . . . . . . . .
1994
1997
1995
1995
1995
1995
.
.
.
.
.
.
.
.
.
.
.
.
.
.
.
.
.
.
.
.
.
.
.
.
.
.
.
.
.
.
.
.
.
.
.
.
.
.
.
.
.
.
.
.
.
.
See footnotes at end of table.
.
.
.
.
.
.
.
.
.
.
.
.
.
.
.
.
.
.
.
.
.
.
.
.
.
.
.
.
.
.
.
.
.
.
.
.
.
.
.
.
.
.
.
.
.
.
.
.
.
.
.
.
.
.
.
.
.
.
.
.
.
.
.
.
.
.
.
.
.
.
.
.
.
.
.
.
.
.
.
.
.
.
.
.
.
.
.
.
.
.
.
.
.
.
.
.
.
.
.
.
.
.
.
.
.
.
.
.
.
.
.
.
.
.
.
.
.
.
.
.
.
.
.
.
.
.
.
.
.
.
.
.
.
.
.
.
.
.
.
.
.
.
.
.
.
.
.
.
.
.
.
.
.
.
.
.
.
.
.
.
.
.
.
.
.
.
.
.
.
.
.
.
.
.
.
.
.
.
.
.
.
.
.
.
.
.
.
.
.
.
.
.
.
.
.
.
.
.
.
.
.
.
.
.
.
.
.
.
.
.
.
.
.
.
.
.
.
.
.
.
.
.
.
.
.
.
.
.
.
.
.
.
.
.
.
.
.
.
.
.
.
.
.
.
.
.
.
.
.
.
.
.
.
.
.
.
.
.
.
.
.
.
.
.
.
.
.
.
.
.
.
.
.
.
.
.
.
.
.
.
.
.
.
.
.
.
.
.
.
.
.
.
.
.
.
.
.
.
.
.
.
.
.
.
.
.
.
.
.
.
.
.
.
.
.
.
.
.
.
.
.
.
.
.
.
.
.
.
.
.
.
.
.
.
.
.
.
.
.
.
.
.
.
.
.
.
.
.
.
.
.
.
.
.
.
.
.
.
.
.
.
.
.
.
.
.
.
.
Previous code(s)
assignment
574.01 + 574.11 +
574.31 + 574.41
574.20 + 574.50
574.21 + 574.51
575.1
575.0 + 575.1
585
588.8
593.7
596.5
344.61
596.5
599.6
599.6
599.8
600
600.0
600.1
600.2
600.9
602.8
607.89
608.83
608.89
618.0
618.8
621.3
622.1
629.8
633.0
633.1
633.2
633.8
633.9
645.0–645.1, 645.3
645.00–645.01,
645.03
645.00–645.01,
645.03
651.00–651.01,
651.03
651.10–651.11,
651.13
651.20–651.21,
651.23
651.80–651.81,
651.83
651.8
654.2, 654.9
654.2, 654.9
655.8
657.0–657.1, 657.3
659.80–659.81,
659.83
656.30–656.31,
656.33
665.10–665.12,
665.1411
670.0–670.1, 670.3
672.0–672.1, 672.3
674.80, 674.82,
674.84
None
686.0
690
691.8 + 704.8
691.8
690
Effective
October 1
Current code(s) assignment
692.72–692.74 . . . . . .
692.75 . . . . . . . . . . .
692.76–692.77 . . . . . .
692.82–692.83 . . . . . .
692.84 . . . . . . . . . . .
702.0–702.8 . . . . . . .
702.11, 702.19 . . . . . .
704.02 . . . . . . . . . . .
705.21–705.22 . . . . . .
707.00–707.07, 707.09 .
707.10–707.15, 707.19 .
709.00–709.01, 709.09 .
710.5. . . . . . . . . . . .
718.70–718.79 . . . . . .
719.7. . . . . . . . . . . .
.
.
.
.
.
.
.
.
.
.
.
.
.
.
.
.
.
.
.
.
.
.
.
.
.
.
.
.
.
.
.
.
.
.
.
.
.
.
.
.
.
.
.
.
.
.
.
.
.
.
.
.
.
.
.
.
.
.
.
.
.
.
.
.
.
.
.
.
.
.
.
.
.
.
.
.
.
.
.
.
.
.
.
.
.
.
.
.
.
.
.
.
.
.
.
.
.
.
.
.
.
.
.
.
.
.
.
.
.
.
.
.
.
.
.
.
.
.
.
.
.
.
.
.
.
.
.
.
.
.
.
.
.
.
.
1992
2000
2001
1992
2004
1991
1994
1993
2004
2004
2000
1994
1992
2001
2003
727.83 . . . . . . . . . . .
728.86 . . . . . . . . . . .
728.87 . . . . . . . . . . .
728.88 . . . . . . . . . . .
733.10–733.16, 733.19 .
733.93 . . . . . . . . . . .
733.94–733.95 . . . . . .
738.10–738.19 . . . . . .
747.60–747.64, 747.69 .
747.82 . . . . . . . . . . .
747.83 . . . . . . . . . . .
752.51–752.52 . . . . . .
752.61–752.63 . . . . . .
752.64–752.65, 752.69 .
752.81, 752.89 . . . . . .
753.10–753.17, 753.19 .
753.20–753.23, 753.29 .
756.70–756.71, 756.79 .
758.31–758.33, 758.39 .
758.81 . . . . . . . . . . .
758.89 . . . . . . . . . . .
759.81–759.82 . . . . . .
759.83 . . . . . . . . . . .
759.89 . . . . . . . . . . .
760.75 . . . . . . . . . . .
760.76 . . . . . . . . . . .
760.77–760.78 . . . . . .
763.81–763.83, 763.89 .
763.84 . . . . . . . . . . .
764.00–764.09 . . . . . .
764.10–764.19 . . . . . .
764.20–764.29 . . . . . .
764.90–764.99 . . . . . .
765.00–765.09 . . . . . .
765.10–765.19 . . . . . .
765.20–765.24 . . . . . .
765.25–765.29 . . . . . .
766.21–766.22 . . . . . .
767.11–767.19 . . . . . .
770.10–770.18 . . . . . .
770.81–770.84, 770.89 .
770.85–770.86 . . . . . .
771.81–771.83, 771.89 .
772.10–772.14 . . . . . .
779.7. . . . . . . . . . . .
779.81–779.82 . . . . . .
779.83 . . . . . . . . . . .
779.84 . . . . . . . . . . .
779.89 . . . . . . . . . . .
780.01–780.02, 780.09 .
.
.
.
.
.
.
.
.
.
.
.
.
.
.
.
.
.
.
.
.
.
.
.
.
.
.
.
.
.
.
.
.
.
.
.
.
.
.
.
.
.
.
.
.
.
.
.
.
.
.
.
.
.
.
.
.
.
.
.
.
.
.
.
.
.
.
.
.
.
.
.
.
.
.
.
.
.
.
.
.
.
.
.
.
.
.
.
.
.
.
.
.
.
.
.
.
.
.
.
.
.
.
.
.
.
.
.
.
.
.
.
.
.
.
.
.
.
.
.
.
.
.
.
.
.
.
.
.
.
.
.
.
.
.
.
.
.
.
.
.
.
.
.
.
.
.
.
.
.
.
.
.
.
.
.
.
.
.
.
.
.
.
.
.
.
.
.
.
.
.
.
.
.
.
.
.
.
.
.
.
.
.
.
.
.
.
.
.
.
.
.
.
.
.
.
.
.
.
.
.
.
.
.
.
.
.
.
.
.
.
.
.
.
.
.
.
.
.
.
.
.
.
.
.
.
.
.
.
.
.
.
.
.
.
.
.
.
.
.
.
.
.
.
.
.
.
.
.
.
.
.
.
.
.
.
.
.
.
.
.
.
.
.
.
.
.
.
.
.
.
.
.
.
.
.
.
.
.
.
.
.
.
.
.
.
.
.
.
.
.
.
.
.
.
.
.
.
.
.
.
.
.
.
.
.
.
.
.
.
.
.
.
.
.
.
.
.
.
.
.
.
.
.
.
.
.
.
.
.
.
.
.
.
.
.
.
.
.
.
.
.
.
.
.
.
.
.
.
.
.
.
.
.
.
.
.
.
.
.
.
.
.
.
.
.
.
.
.
.
.
.
.
.
.
.
.
.
.
.
.
.
.
.
.
.
.
.
.
.
.
.
.
.
.
.
.
.
.
.
.
.
.
.
.
.
.
.
.
.
.
.
.
.
.
.
.
.
.
.
.
.
.
.
.
.
.
.
.
.
.
.
.
.
.
.
.
.
.
.
.
.
.
.
.
.
.
.
.
.
.
2000
1995
2003
2003
1993
2001
2001
1992
1993
1993
2002
1996
1996
1996
2003
1990
1996
1997
2004
1996
1996
1989
1994
1989
1991
1994
2005
1998
2005
1988
1988
1988
1988
1988
1988
2002
2002
2003
2003
2005
2002
2005
2002
2001
2001
2002
2003
2005
2002
1992
Previous code(s)
assignment
692.79
692.79
692.71
692.89
692.89
702
702.1
704.09
780.8
707.0
707.1
709.0
288.3, 729.1
718.80–718.89
719.70, 719.75–
719.79 (Codes
deleted)
727.89
729.4
728.9
728.89
733.1
733.16
733.19
738.1
747.6
747.89
747.89, 747.9
752.5
752.6
752.8
752.8
753.1
753.2
756.7
758.3
758.8
758.9
759.8
759.89
759.8
760.79
760.79
760.79
763.8
770.1
764.0
764.1
764.2
764.9
765.0
765.1
765.00–765.09
765.10–765.19
766.2
767.1
770.1
770.8
770.1
771.8
772.1
772.1
779.8
779.89
None (omit code)
779.8
780.0
Series 13, No. 168 [ Page 65
Table V. Changes ICD–9–CM in diagnosis codes, 1986–2005—Con.
Effective
October 1
Current code(s) assignment
780.03 . . . . . . . . . . . .
780.31, 780.39 . . . . . . .
780.57 . . . . . . . . . . . .
780.58 . . . . . . . . . . . .
780.71, 780.79 . . . . . . .
780.91–780.92 . . . . . . .
780.93–780.94 . . . . . . .
780.95 . . . . . . . . . . . .
780.99 . . . . . . . . . . . .
781.8. . . . . . . . . . . . .
781.91–781.92, 781.99 . .
781.93 . . . . . . . . . . . .
781.94 . . . . . . . . . . . .
783.21 . . . . . . . . . . . .
783.22 . . . . . . . . . . . .
783.40–783.43 . . . . . . .
783.7. . . . . . . . . . . . .
785.52 . . . . . . . . . . . .
786.03–786.07 . . . . . . .
787.01–787.03 . . . . . . .
787.91 . . . . . . . . . . . .
787.99 . . . . . . . . . . . .
788.20–788.21, 788.29 . .
788.30–788.39 . . . . . . .
788.38 . . . . . . . . . . . .
788.41–788.43 . . . . . . .
788.61–788.62, 788.69 . .
788.63 . . . . . . . . . . . .
789.00–789.07, 789.09 . .
789.30–789.37, 789.39 . .
789.40–789.47, 789.49 . .
789.60–789.67, 789.69 . .
790.01, 790.09 . . . . . . .
790.21–790.22, 790.29 . .
790.91,790.93, 790.99 . .
790.92 . . . . . . . . . . . .
790.94 . . . . . . . . . . . .
790.95 . . . . . . . . . . . .
792.5. . . . . . . . . . . . .
793.80–793.81, 793.89 . .
795.00–795.02, 795.09 . .
795.03, 795.04 . . . . . . .
795.05, 795.08 . . . . . . .
795.31–795.39 . . . . . . .
795.71 . . . . . . . . . . . .
795.79 . . . . . . . . . . . .
795.8. . . . . . . . . . . . .
796.5. . . . . . . . . . . . .
796.6. . . . . . . . . . . . .
799.01–799.02 . . . . . . .
799.81, 799.89 . . . . . . .
813.45 . . . . . . . . . . . .
823.40–823.42 . . . . . . .
840.7. . . . . . . . . . . . .
850.11–850.12 . . . . . . .
864.05 . . . . . . . . . . . .
864.15 . . . . . . . . . . . .
909.5. . . . . . . . . . . . .
922.31–922.33 . . . . . . .
925.1–925.2 . . . . . . . .
959.0 (code title restated)
959.01 . . . . . . . . . . . .
959.09 . . . . . . . . . . . .
959.11–959.14, 959.19 . .
965.61, 965.69 . . . . . . .
989.81–989.84, 989.89 . .
.
.
.
.
.
.
.
.
.
.
.
.
.
.
.
.
.
.
.
.
.
.
.
.
.
.
.
.
.
.
.
.
.
.
.
.
.
.
.
.
.
.
.
.
.
.
.
.
.
.
.
.
.
.
.
.
.
.
.
.
.
.
.
.
.
.
.
.
.
.
.
.
.
.
.
.
.
.
.
.
.
.
.
.
.
.
.
.
.
.
.
.
.
.
.
.
.
.
.
.
.
.
.
.
.
.
.
.
.
.
.
.
.
.
.
.
.
.
.
.
.
.
.
.
.
.
.
.
.
.
.
.
.
.
.
.
.
.
.
.
.
.
.
.
.
.
.
.
.
.
.
.
.
.
.
.
.
.
.
.
.
.
.
.
.
.
.
.
.
.
.
.
.
.
.
.
.
.
.
.
.
.
.
.
.
.
.
.
.
.
.
.
.
.
.
.
.
.
.
.
.
.
.
.
.
.
.
.
.
.
.
.
.
.
.
.
.
.
.
.
.
.
.
.
.
.
.
.
.
.
.
.
.
.
.
.
.
.
.
.
.
.
.
.
.
.
.
.
.
.
.
.
.
.
.
.
.
.
.
.
.
.
.
.
.
.
.
.
.
.
.
.
.
.
.
.
.
.
.
.
.
.
.
.
.
.
.
.
.
.
.
.
.
.
.
.
.
.
.
.
.
.
.
.
.
.
.
.
.
.
.
.
.
.
.
.
.
.
.
.
.
.
.
.
.
.
.
.
.
.
.
.
.
.
.
.
.
.
.
.
.
.
.
.
.
.
.
.
.
.
.
.
.
.
.
.
.
.
.
.
.
.
.
.
.
.
.
.
.
.
.
.
.
.
.
.
.
.
.
.
.
.
.
.
.
.
.
.
.
.
.
.
.
.
.
.
.
.
.
.
.
.
.
.
.
.
.
.
.
.
.
.
.
.
.
.
.
.
.
.
.
.
.
.
.
.
.
.
.
.
.
.
.
.
.
.
.
.
.
.
.
.
.
.
.
.
.
.
.
.
.
.
.
.
.
.
.
.
.
.
.
.
.
.
.
.
.
.
.
.
.
.
.
.
.
.
.
.
.
.
.
.
.
.
.
.
.
.
.
.
.
.
.
.
.
.
.
.
.
.
.
.
.
.
.
.
.
.
.
.
.
.
.
.
.
.
.
.
.
.
.
.
.
.
.
.
.
.
1993
1997
1992
2004
1998
2002
2003
2005
2002
1994
2000
2002
2003
2000
2000
2000
2000
2003
1998
1994
1995
1995
1993
1992
2004
1993
1993
2003
1994
1994
1994
1994
2000
2003
1993
1993
1997
2004
2000
2001
2002
2004
2004
2002
1994
1994
1986
1997
2004
2005
2003
2002
2002
2001
2003
1992
1992
1994
1996
1993
1997
1997
1997
2003
1998
1995
Previous code(s)
assignment
780.01
780.3
780.51, 780.53
780.59
780.7
780.9
780.99
780.99
780.9
781.9
781.9
723.5
781.99
783.2
783.4
783.4
783.4
785.59
786.09
787.0
558.9
787.9
788.2
788.3
788.39
788.4
788.6
788.69
789.0
789.3
789.4
789.6
790.0
790.2
790.9
286.9
790.99
790.99
792.9
793.8
795.0
622.1
795.09
795.3
795.8 (Code deleted)
795.7
795.7
796.9
796.9
799.0
799.8
813.42
823.80–823.82
840.8
850.1
864.09
864.19
909.9
922.3
925
959.0
854.00
959.0
959.1
965.6
989.8
Current code(s) assignment
Effective
October 1
Previous code(s)
assignment
995.5
995.5
995.0
None
995.81
995.81
995.89
038.0–038.9
996.09
996.4
996.5
996.52
996.59
996.59
996.6
996.69
996.7
996.8
996.89
996.89
997.0
997.9 + 430 434, 436
997.4
997.5
997.2
997.9
998.1
998.89
998.3
998.5
998.8
998.89
V01.7
V01.8
V01.89
V01.89
V02.5
V02.6
V03.8
V04.8
V05.8
V06.8
V07.3
V07.8
044.9, 795.8 (Codes
deleted)
None
V10.49
V10.59
V12.0
V12.4
V12.49
V12.5
V12.6V
V12.7
V13.0
V13.09
V13.2
V13.6
V15.0
V15.4
305.13 (Code deleted)
V15.89
V15.89
V15.49
V16.4
995.50–995.55, 995.59 . . . . . .
995.59 . . . . . . . . . . . . . . . .
995.60–995.69 . . . . . . . . . . .
995.7. . . . . . . . . . . . . . . . .
995.80, 995.82–995.85 . . . . . .
995.81 (code title restated) . . .
995.86 . . . . . . . . . . . . . . . .
995.90–995.94 . . . . . . . . . . .
996.04 . . . . . . . . . . . . . . . .
996.40–996.47, 996.49 . . . . . .
996.51–996.59 . . . . . . . . . . .
996.55 . . . . . . . . . . . . . . . .
996.56 . . . . . . . . . . . . . . . .
996.57 . . . . . . . . . . . . . . . .
996.60–996.69 . . . . . . . . . . .
996.68 . . . . . . . . . . . . . . . .
996.70–996.79 . . . . . . . . . . .
996.80–996.84, 996.86, 996.89.
996.85 . . . . . . . . . . . . . . . .
996.87 . . . . . . . . . . . . . . . .
997.00–997.01, 997.09 . . . . . .
997.02 . . . . . . . . . . . . . . . .
997.71 . . . . . . . . . . . . . . . .
997.72 . . . . . . . . . . . . . . . .
997.79 . . . . . . . . . . . . . . . .
997.91, 997.99 . . . . . . . . . . .
998.11–998.12 . . . . . . . . . . .
998.13 . . . . . . . . . . . . . . . .
998.31–998.32 . . . . . . . . . . .
998.51, 998.59 . . . . . . . . . . .
998.81–998.82, 998.89 . . . . . .
998.83 . . . . . . . . . . . . . . . .
V01.71, V01.79 . . . . . . . . . .
V01.81, V01.89 . . . . . . . . . .
V01.82 . . . . . . . . . . . . . . . .
V01.83–V01.84 . . . . . . . . . .
V02.51–V02.52, V02.59 . . . . .
V02.60–V02.62, V02.69 . . . . .
V03.81–V03.82, V03.89 . . . . .
V04.81–V04.82, V04.89 . . . . .
V05.3–V05.4 . . . . . . . . . . . .
V06.5–V06.6 . . . . . . . . . . . .
V07.31, V07.39 . . . . . . . . . .
V07.4 . . . . . . . . . . . . . . . .
V08. . . . . . . . . . . . . . . . . .
.
.
.
.
.
.
.
.
.
.
.
.
.
.
.
.
.
.
.
.
.
.
.
.
.
.
.
.
.
.
.
.
.
.
.
.
.
.
.
.
.
.
.
.
.
.
.
.
.
.
.
.
.
.
.
.
.
.
.
.
.
.
.
.
.
.
.
.
.
.
.
.
.
.
.
.
.
.
.
.
.
.
.
.
.
.
.
.
.
.
.
.
.
.
.
.
.
.
.
.
.
.
.
.
.
.
.
.
.
.
.
.
.
.
.
.
.
.
.
.
.
.
.
.
.
.
.
.
.
.
.
.
.
.
.
.
.
.
.
.
.
.
.
.
.
.
.
.
.
.
.
.
.
.
.
.
.
.
.
.
.
.
.
.
.
.
.
.
.
.
.
.
.
.
.
.
.
.
.
.
1996
1996
1993
2000
1996
1996
1998
2002
1994
2005
1987
1998
1998
2003
1989
1998
1989
1987
1990
2000
1995
1995
2001
2001
2001
1995
1996
1996
2002
1996
1994
1996
2004
2002
2003
2004
1998
1997
1994
2003
1993
1994
1994
1992
1994
V09.0–V09.91 . . . . . .
V10.48 . . . . . . . . . . .
V10.53 . . . . . . . . . . .
V12.00–V12.03, V12.09
V12.40–V12.41, V12.49
V12.42 . . . . . . . . . . .
V12.50–V12.52, V12.59
V12.60–V12.61; V12.69
12.70–V12.72, V12.79 .
V13.00–V13.01, V13.09
V13.02–V13.03 . . . . .
V13.21, V13.29 . . . . .
V13.61, V13.69 . . . . .
V15.01–V15.09 . . . . .
V15.41–V15.42, V15.49
V15.82 . . . . . . . . . . .
V15.84–V15.86 . . . . .
V15.87 . . . . . . . . . . .
V15.88 . . . . . . . . . . .
V16.40–V16.43, V16.49
.
.
.
.
.
.
.
.
.
.
.
.
.
.
.
.
.
.
.
.
.
.
.
.
.
.
.
.
.
.
.
.
.
.
.
.
.
.
.
.
.
.
.
.
.
.
.
.
.
.
.
.
.
.
.
.
.
.
.
.
.
.
.
.
.
.
.
.
.
.
.
.
.
.
.
.
.
.
.
.
1993
1998
2001
1994
1997
2005
1995
2005
1994
1994
2005
2002
1998
2000
1996
1994
1995
2003
2005
1997
.
.
.
.
.
.
.
.
.
.
.
.
.
.
.
.
.
.
.
.
.
.
.
.
.
.
.
.
.
.
.
.
.
.
.
.
.
.
.
.
.
.
.
.
.
.
.
.
.
.
.
.
.
.
.
.
.
.
.
.
.
.
.
.
.
.
.
.
.
.
.
.
.
.
.
.
.
.
.
.
.
.
.
.
.
.
.
.
.
.
.
.
.
.
.
.
.
.
.
.
Page 66 [ Series 13, No. 168
Table V. Changes in ICD–9–CM diagnosis codes, 1986–2005—Con.
Effective
October 1
Previous code(s)
assignment
1998
2005
1998
2005
2000
2002
1989
1998
2003
1992
1992
2000
2005
1998
1997
1992
1994
1998
1992
1989
1989
1989
1989
1989
1989
1989
1989
1989
1997
2000
2003
1994
1995
1998
1998
1994
1994
1994
1994
1997
1997
1997
1997
2000
2000
2000
2000
V45.78 . . . . . . . . . . . . . . . . . . . . V45.79 . . . . . . . . . . . . . . . . . . . . 2000
2000
V45.82 . . . . . .
V45.83 . . . . . .
V45.84 . . . . . .
V45.85 . . . . . .
V46.11–V46.12.
V46.13–V46.14
V46.2 . . . . . .
V49.60–V49.67
V49.70–V49.77
V49.81 . . . . . .
V49.82 . . . . . .
V49.83 . . . . . .
V49.84 . . . . . .
V49.89 . . . . . .
V50.41–V50.42,
1994
1995
2001
2003
2004
2005
2002
1994
1994
2000
2001
2004
2005
2000
1994
V16.5
V17.8
V18.6
V19.8
None
V23.4
V23.8
V23.8
V25.01
V25.49
V25.8
V26.2
V26.3
None
V28.8
V71.8
V29.8
V29.8
V71.9
V30.0
V31.0
V32.0
V33.0
V34.0
V35.0
V36.0
V37.0
V39.0
V42.8
V42.89
V43.2
V43.6
V43.8
V43.89
V44.5
V45.89
V45.0
V45.5
V45.89
V45.6
611.8
569.89
593.89
593.89, 596.8
V45.89
518.89
602.8, 607.89,
608.89, 620.8,
621.8, 622.8
360.89
255.8, 289.59, 388.8,
569.49, 577.8
V45.89
V45.89
V45.89
None
V45.89
V46.1
V46.11
V46.8
V49.5
V49.5
None
None
None
V49.89
V49.8
V50.8
Current code(s) assignment
V16.51, V16.59 . . . . .
V17.81; V17.89 . . . . .
V18.61, V18.69 . . . . .
V18.9 . . . . . . . . . . .
V21.30–V21.35 . . . . .
V23.41, V23.49 . . . . .
V23.7 . . . . . . . . . . .
V23.81–V23.84, V23.89
V25.03 . . . . . . . . . . .
V25.43 . . . . . . . . . . .
V25.5 . . . . . . . . . . .
V26.21–V26.22, V26.29
V26.31–V26.33 . . . . .
V26.51, V26.52 . . . . .
V28.6 . . . . . . . . . . .
V29.0–V29.1, V29.8. . .
V29.2 . . . . . . . . . . .
V29.3 . . . . . . . . . . .
V29.9 . . . . . . . . . . .
V30.00–V30.01 . . . . .
V31.00–V31.01 . . . . .
V32.00–V32.01 . . . . .
V33.00–V33.01 . . . . .
V34.00–V34.01 . . . . .
V35.00–V35.01 . . . . .
V36.00–V36.01 . . . . .
V37.00–V37.01 . . . . .
V39.00 –V39.01 . . . . .
V42.81–V42.83, V42.89
V42.84 . . . . . . . . . . .
V43.21–V43.22 . . . . .
V43.60–43.66, V43.69 .
V43.81–V43.82, V43.89
V43.83 . . . . . . . . . . .
V44.50–V44.52, V44.59
V45.00, V45.02, V45.09
V45.01 . . . . . . . . . . .
V45.51 . . . . . . . . . . .
V45.52, V45.59 . . . . .
V45.61, V45.69 . . . . .
V45.71 . . . . . . . . . . .
V45.72 . . . . . . . . . . .
V45.73 . . . . . . . . . . .
V45.74 . . . . . . . . . . .
V45.75 . . . . . . . . . . .
V45.76 . . . . . . . . . . .
V45.77 . . . . . . . . . . .
. . . . .
. . . . .
. . . . .
. . . . .
. . . . .
. . . . .
. . . . .
. . . . .
. . . . .
. . . . .
. . . . .
. . . . .
. . . . .
. . . . .
V50.49
.
.
.
.
.
.
.
.
.
.
.
.
.
.
.
.
.
.
.
.
.
.
.
.
.
.
.
.
.
.
.
.
.
.
.
.
.
.
.
.
.
.
.
.
.
.
.
.
.
.
.
.
.
.
.
.
.
.
.
.
.
.
.
.
.
.
.
.
.
.
.
.
.
.
.
.
.
.
.
.
.
.
.
.
.
.
.
.
.
.
.
.
.
.
.
.
.
.
.
.
.
.
.
.
.
.
.
.
.
.
.
.
.
.
.
.
.
.
.
.
.
.
.
.
.
.
.
.
.
.
.
.
.
.
.
.
.
.
.
.
.
.
.
.
.
.
.
.
.
.
.
.
.
.
.
.
.
.
.
.
.
.
.
.
.
.
.
.
.
.
.
.
.
.
.
.
.
.
.
.
.
.
.
.
.
.
.
.
.
.
.
.
.
.
.
.
.
.
.
.
.
.
.
.
.
.
.
.
.
.
.
.
.
.
.
.
.
.
.
.
.
.
.
.
.
.
.
.
.
.
.
.
.
.
.
.
.
.
.
.
.
.
.
.
.
.
.
.
.
.
.
.
.
.
.
.
.
.
.
.
.
.
.
.
.
.
.
.
.
.
.
.
.
.
.
.
.
.
.
.
.
.
.
.
.
.
.
.
.
.
.
.
.
.
.
.
.
.
.
.
.
.
.
.
.
.
.
.
.
.
.
.
.
.
.
.
.
.
.
.
.
.
.
.
.
.
.
.
.
.
.
.
.
.
.
.
.
.
.
.
.
.
.
.
.
.
.
.
.
.
.
.
.
.
.
.
.
.
.
.
.
.
.
.
.
.
.
.
.
.
.
.
.
.
.
.
.
.
.
.
.
.
.
.
.
.
.
.
.
.
.
.
.
.
.
.
.
.
.
.
.
.
.
.
.
.
.
.
.
.
.
.
.
.
.
.
.
.
.
.
.
.
.
.
.
.
.
.
.
.
.
.
.
.
.
.
.
.
.
.
.
.
.
.
.
.
.
.
.
.
.
.
.
.
.
.
.
.
.
.
.
.
.
.
.
.
.
.
.
.
.
.
.
.
.
.
.
.
.
.
.
.
.
.
.
.
.
.
.
.
.
.
.
.
.
.
.
.
.
.
.
.
.
.
.
.
.
.
.
.
.
.
.
.
.
.
.
.
.
.
.
.
.
.
.
.
.
.
.
.
.
.
.
.
.
.
.
.
.
.
.
.
.
.
.
.
.
.
.
.
.
.
.
.
.
.
.
.
Effective
October 1
Current code(s) assignment
V53.01–V53.02, V53.09 . .
V53.31 . . . . . . . . . . . . .
V53.32, V53.39 . . . . . . .
V53.90–V53.91, V53.99 . .
V54.01–V54.02, V54.09 . .
V54.10–V54.17, V54.19 . .
V54.20–V54.27, V54.29 . .
V54.81, V54.89 . . . . . . .
V56.1 . . . . . . . . . . . . .
V56.1 (Code title restated).
V56.2 . . . . . . . . . . . . .
V56.31–V56.32 . . . . . . .
V57.21–V57.22 . . . . . . .
V58.11 . . . . . . . . . . . . .
V58.12 . . . . . . . . . . . . .
V58.41, V58.49 . . . . . . .
V58.42–V58.43 . . . . . . .
V58.44 . . . . . . . . . . . . .
V58.61, V58.69 . . . . . . .
V58.62 . . . . . . . . . . . . .
V58.63–V58.65 . . . . . . .
V58.66–V58.67 . . . . . . .
V58.71–V58.78 . . . . . . .
V58.81, V58.89 . . . . . . .
V58.82 . . . . . . . . . . . . .
V58.83 . . . . . . . . . . . . .
V59.01–V59.02, V59.09 . .
V59.6 . . . . . . . . . . . . .
V59.70–V59.74 . . . . . . .
V61.10–V61.12 . . . . . . .
V61.22 . . . . . . . . . . . . .
V62.83 . . . . . . . . . . . . .
V62.84 . . . . . . . . . . . . .
V64.00–V64.05 . . . . . . .
V64.06 . . . . . . . . . . . . .
V64.07–V64.09 . . . . . . .
V64.4 . . . . . . . . . . . . .
V64.41–V64.43 . . . . . . .
V65.11, V65.19 . . . . . . .
V65.40–V65.45, V65.49 . .
V65.46 . . . . . . . . . . . . .
V66.7 . . . . . . . . . . . . .
V67.00–V67.01, V67.09 . .
V69.0–V69.3 . . . . . . . . .
V69.4 . . . . . . . . . . . . .
V69.5 . . . . . . . . . . . . .
V69.8–V69.9 . . . . . . . . .
V71.81, V71.89 . . . . . . .
V71.82–V71.83 . . . . . . .
V72.31–V72.32 . . . . . . .
V72.40–V72.41 . . . . . . .
V72.42 . . . . . . . . . . . . .
V72.81 V72.85 . . . . . . . .
V72.86 . . . . . . . . . . . . .
V73.88–V73.89 . . . . . . .
V73.98–V73.99 . . . . . . .
V76.10–V76.12, V76.19 . .
V76.44–V76.45 . . . . . . .
V76.46–V76.47 . . . . . . .
V76.50–V76.52 . . . . . . .
V76.81, V76.89 . . . . . . .
V77.91, V77.99 . . . . . . .
V82.81, V82.89 . . . . . . .
V83.01–V83.02 . . . . . . .
V83.81 . . . . . . . . . . . . .
V83.89 . . . . . . . . . . . . .
.
.
.
.
.
.
.
.
.
.
.
.
.
.
.
.
.
.
.
.
.
.
.
.
.
.
.
.
.
.
.
.
.
.
.
.
.
.
.
.
.
.
.
.
.
.
.
.
.
.
.
.
.
.
.
.
.
.
.
.
.
.
.
.
.
.
.
.
.
.
.
.
.
.
.
.
.
.
.
.
.
.
.
.
.
.
.
.
.
.
.
.
.
.
.
.
.
.
.
.
.
.
.
.
.
.
.
.
.
.
.
.
.
.
.
.
.
.
.
.
.
.
.
.
.
.
.
.
.
.
.
.
.
.
.
.
.
.
.
.
.
.
.
.
.
.
.
.
.
.
.
.
.
.
.
.
.
.
.
.
.
.
.
.
.
.
.
.
.
.
.
.
.
.
.
.
.
.
.
.
.
.
.
.
.
.
.
.
.
.
.
.
.
.
.
.
.
.
.
.
.
.
.
.
.
.
.
.
.
.
.
.
.
.
.
.
.
.
.
.
.
.
.
.
.
.
.
.
.
.
.
.
.
.
.
.
.
.
.
.
.
.
.
.
.
.
.
.
.
.
.
.
.
.
.
.
.
.
.
.
.
.
.
.
.
.
.
.
.
.
.
.
.
.
.
.
.
.
.
.
.
.
.
.
.
.
.
.
.
.
.
.
.
.
.
.
.
.
.
.
.
.
.
.
.
.
.
.
.
.
.
.
.
.
.
.
.
.
.
.
.
.
.
.
.
.
.
.
.
.
.
.
.
.
.
.
.
.
.
.
.
.
.
.
.
.
.
.
.
.
.
.
.
.
.
.
.
.
.
.
.
.
.
.
.
.
.
.
.
.
.
.
.
.
.
.
.
.
.
.
.
.
.
.
.
.
.
.
.
.
.
.
.
.
.
.
.
.
.
.
.
.
.
.
.
.
.
.
.
.
.
.
.
.
.
.
.
.
.
.
.
.
.
.
.
.
.
.
.
.
.
.
.
.
.
.
.
.
.
.
.
.
.
.
.
.
.
.
.
.
.
.
.
.
.
.
.
.
.
.
.
.
1997
1994
1994
2003
2003
2002
2002
2002
1995
1998
1998
2000
1994
2005
2005
1994
2002
2004
1995
1998
2003
2004
2002
1994
1995
2000
1995
1995
2005
1996
1996
1996
2005
2005
2005
2005
1997
2003
2003
1994
2003
1996
2000
1994
2004
2005
1994
2000
2002
2004
2004
2005
1993
2005
1993
1993
1997
1998
2000
2000
2000
2000
2000
2001
2002
2002
Previous code(s)
assignment
V53.0
V53.3
V53.9
V53.9
V54.0
V54.8
V54.8
V54.8
V58.89
V56.1
V56.1
V56.8
V57.2
V58.1
140–208; 230–239
V58.4
V58.49
V58.71–V58.78
V67.51
V58.69
V58.69
V58.69
V58.49
V58.8
V58.89
V58.89
V59.0
V59.8
V59.8
V61.1
V61.21
V65.49
V62.89
V64.0
V64.2
V64.0
None
V64.4
V65.1
V65.4
V65.1
None
V67.0
None
V69.8
V69.8
None
V71.8
V71.89
V72.3
V72.4
V22.0–V22.1
V72.8
V72.83
V73.8
V73.9
V76.1
V76.49
V76.49
V76.49
V76.8
V77.9
V82.8
None
None
V19.8
Series 13, No. 168 [ Page 67
Table V. Changes in ICD–9–CM diagnosis codes, 1986–2005—Con.
Effective
October 1
Current code(s) assignment
V84.01–V84.04, V84.09 . . . . .
V84.8 . . . . . . . . . . . . . . . .
V85.0 . . . . . . . . . . . . . . . .
V85.1 . . . . . . . . . . . . . . . .
V85.21–V85.25 . . . . . . . . . .
V85.30–V85.39 . . . . . . . . . .
V85.4 . . . . . . . . . . . . . . . .
E854.8 . . . . . . . . . . . . . . . .
E869.4 . . . . . . . . . . . . . . . .
E880.1 . . . . . . . . . . . . . . . .
E884.3-E884.4 . . . . . . . . . . .
E884.5-E884.6 . . . . . . . . . . .
E885.0 . . . . . . . . . . . . . . . .
E885.1-E885.4, E885.9 . . . . .
E888.0 . . . . . . . . . . . . . . . .
E888.1, E888.8-E888.9 . . . . .
E906.5 . . . . . . . . . . . . . . . .
E908.0-E908.4, E908.8-E908.9.
E909.0-E909.4, E909.8-E909.9.
E917.3-E917.4 . . . . . . . . . . .
E917.5 . . . . . . . . . . . . . . . .
E917.6 . . . . . . . . . . . . . . . .
.
.
.
.
.
.
.
.
.
.
.
.
.
.
.
.
.
.
.
.
.
.
.
.
.
.
.
.
.
.
.
.
.
.
.
.
.
.
.
.
.
.
.
.
.
.
.
.
.
.
.
.
.
.
.
.
.
.
.
.
.
.
.
.
.
.
.
.
.
.
.
.
.
.
.
.
.
.
.
.
.
.
.
.
.
.
.
.
2004
2004
2005
2005
2005
2005
2005
1995
1994
1995
1995
1995
2002
2000
2001
2001
1995
1995
1995
2001
2001
2001
Previous code(s)
assignment
None
None
None
None
None
None
None
E858.8
E869.8
E884.9
E884.2
E884.9
E885.9
E885
E920
E888
E906.3
E908
E909
E917.9
E886.0
E917.1
1
E917.7-E917.8 .
E920.5 . . . . . .
E922.4 . . . . . .
E922.5 . . . . . .
E924.2 . . . . . .
E928.3 . . . . . .
E928.4-E928.5 .
E955.6 . . . . . .
E955.7 . . . . . .
E967.2 . . . . . .
E967.3 . . . . . .
E967.4-E967.8 .
E968.5 . . . . . .
E968.6 . . . . . .
E968.7 . . . . . .
E985.6 . . . . . .
E985.7 . . . . . .
E979.0-E979.9 .
.
.
.
.
.
.
.
.
.
.
.
.
.
.
.
.
.
.
2001
1995
1997
2002
1995
2000
2003
1997
2002
1996
1996
1996
1995
1997
2000
1997
2002
2002
E999.0 . . . . . . . . . . . . . . . . . . . .
E999.1 . . . . . . . . . . . . . . . . . . . .
2002
2002
The title for the subcategory 665.1 has been changed, making the fifth-digit subclassifications 665.12 and 665.14 invalid.
NOTE: ICD–9–CM is the International Classification of Diseases, Ninth Revision, Clinical Modification.
Effective
October 1
Current code(s) assignment
.
.
.
.
.
.
.
.
.
.
.
.
.
.
.
.
.
.
.
.
.
.
.
.
.
.
.
.
.
.
.
.
.
.
.
.
.
.
.
.
.
.
.
.
.
.
.
.
.
.
.
.
.
.
.
.
.
.
.
.
.
.
.
.
.
.
.
.
.
.
.
.
.
.
.
.
.
.
.
.
.
.
.
.
.
.
.
.
.
.
.
.
.
.
.
.
.
.
.
.
.
.
.
.
.
.
.
.
.
.
.
.
.
.
.
.
.
.
.
.
.
.
.
.
.
.
.
.
.
.
.
.
.
.
.
.
.
.
.
.
.
.
.
.
.
.
.
.
.
.
.
.
.
.
.
.
.
.
.
.
.
.
.
.
.
.
.
.
.
.
.
.
.
.
.
.
.
.
.
.
.
.
.
.
.
.
.
.
.
.
.
.
.
.
.
.
.
.
.
.
.
.
.
.
.
.
.
.
.
.
.
.
.
.
.
.
.
.
.
.
.
.
.
.
.
.
.
.
.
.
.
.
.
.
Previous code(s)
assignment
E888
E920.4
E917.9
E922.8
E924.0
E928.8
E928.8
E955.9
E955.4
E967.0
None
E967.1
E968.8
E968.8
E968.8
E985.4
E985.4
E960.0-E966,
E968.0-E968.9
E999
E969
Page 68 [ Series 13, No. 168
Table VI. Changes in ICD–9–CM procedure codes, 1986–2005
Current code(s) assignment
Effective
October 1
Previous code(s)
assignment
99.99
99.25
99.19
93.98
99.29
99.21
99.28
None
99.29
99.29
88.71
88.73
88.77
88.72
88.75
88.79
None
None
37.70–37.74, 37.76, 37.80–37.87
37.94
None
37.80–37.87
37.96
39.90
39.50
00.55, 39.90
36.01 (deleted), 36.02 (deleted),
36.05 (deleted)
81.53
None
81.55
None
None
89.19
03.99 (Insertion of catheter)
39.7
11.79
11.62
20.95
22.11
26.11
27.69
83.02
29.3
31.43–31.44
31.75
32.0
32.29, 32.9
32.29
33.22 + 33.27
33.27
33.28 33.29
33.5
33.5 + 37.5
34.99
35.82
35.03
36.0
39.97
36.011, 36.02
36.01
36.01, 36.02, 36.03, 36.05
36.06
36.0
36.00 (Code deleted)
36.19
36.3
00.01–00.03,
00.10. . . . .
00.11 . . . . .
00.12. . . . .
00.13. . . . .
00.14. . . . .
00.15. . . . .
00.16. . . . .
00.17. . . . .
00.18. . . . .
00.21. . . . .
00.22. . . . .
00.23. . . . .
00.24. . . . .
00.25. . . . .
00.28–00.29
00.31–00.35,
00.40–00.43,
00.50. . . . .
00.51. . . . .
00.52. . . . .
00.53. . . . .
00.54. . . . .
00.55. . . . .
00.61–00.62
00.63–00.65
00.66. . . . .
00.09 . . . . .
. . . . . . . . .
. . . . . . . . .
. . . . . . . . .
. . . . . . . . .
. . . . . . . . .
. . . . . . . . .
. . . . . . . . .
. . . . . . . . .
. . . . . . . . .
. . . . . . . . .
. . . . . . . . .
. . . . . . . . .
. . . . . . . . .
. . . . . . . . .
. . . . . . . . .
00.39 . . . . .
00.45–00.48 .
. . . . . . . . .
. . . . . . . . .
. . . . . . . . .
. . . . . . . . .
. . . . . . . . .
. . . . . . . . .
. . . . . . . . .
. . . . . . . . .
. . . . . . . . .
.
.
.
.
.
.
.
.
.
.
.
.
.
.
.
.
.
.
.
.
.
.
.
.
.
.
.
.
.
.
.
.
.
.
.
.
.
.
.
.
.
.
.
.
.
.
.
.
.
.
.
.
.
.
.
.
.
.
.
.
.
.
.
.
.
.
.
.
.
.
.
.
.
.
.
.
.
.
.
.
.
.
.
.
.
.
.
.
.
.
.
.
.
.
.
.
.
.
.
.
.
.
.
.
.
.
.
.
.
.
.
.
.
.
.
.
.
.
.
.
.
.
.
.
.
.
.
.
.
.
.
.
.
.
.
.
.
.
.
.
.
.
.
.
.
.
.
.
.
.
.
.
.
.
.
.
.
.
.
.
.
.
.
.
.
.
.
.
.
.
.
.
.
.
.
.
.
.
.
.
.
.
.
.
.
.
.
.
.
2002
2002
2002
2002
2002
2002
2003
2004
2004
2005
2004
2004
2004
2004
2004
2004
2004
2005
2002
2002
2002
2002
2002
2002
2004
2004
2005
00.70–00.73
00.74–00.76
00.80–00.84
00.91–00.93
01.26–01.27
02.96. . . . .
03.90. . . . .
05.25. . . . .
11.75 . . . . .
11.76 . . . . .
20.96–20.98
22.12. . . . .
26.12. . . . .
27.64. . . . .
29.31. . . . .
29.32–29.33,
31.45. . . . .
31.95. . . . .
32.01, 32.09
32.22. . . . .
32.28. . . . .
33.27. . . . .
33.28. . . . .
33.29. . . . .
33.50–33.52
33.6 . . . . .
34.05. . . . .
35.84. . . . .
35.96. . . . .
36.00–36.03
36.04. . . . .
36.05. . . . .
36.05. . . . .
36.06. . . . .
36.07. . . . .
36.09. . . . .
36.09. . . . .
36.17. . . . .
36.31–36.32,
. . . .
. . . .
. . . .
. . . .
. . . .
. . . .
. . . .
. . . .
. . . .
. . . .
. . . .
. . . .
. . . .
. . . .
. . . .
29.39
. . . .
. . . .
. . . .
. . . .
. . . .
. . . .
. . . .
. . . .
. . . .
. . . .
. . . .
. . . .
. . . .
. . . .
. . . .
. . . .
. . . .
. . . .
. . . .
. . . .
. . . .
. . . .
36.39
.
.
.
.
.
.
.
.
.
.
.
.
.
.
.
.
.
.
.
.
.
.
.
.
.
.
.
.
.
.
.
.
.
.
.
.
.
.
.
.
.
.
.
.
.
.
.
.
.
.
.
.
.
.
.
.
.
.
.
.
.
.
.
.
.
.
.
.
.
.
.
.
.
.
.
.
.
.
.
.
.
.
.
.
.
.
.
.
.
.
.
.
.
.
.
.
.
.
.
.
.
.
.
.
.
.
.
.
.
.
.
.
.
.
.
.
.
.
.
.
.
.
.
.
.
.
.
.
.
.
.
.
.
.
.
.
.
.
.
.
.
.
.
.
.
.
.
.
.
.
.
.
.
.
.
.
.
.
.
.
.
.
.
.
.
.
.
.
.
.
.
.
.
.
.
.
.
.
.
.
.
.
.
.
.
.
.
.
.
.
.
.
.
.
.
.
.
.
.
.
.
.
.
.
.
.
.
.
.
.
.
.
.
.
.
.
.
.
.
.
.
.
.
.
.
.
.
.
.
.
.
.
.
.
.
.
.
.
.
.
.
.
.
.
.
.
.
.
.
.
.
.
.
.
.
.
.
.
.
.
.
.
.
.
.
.
.
.
.
.
.
.
.
2005
2005
2005
2004
2005
1992
1987
1995
1989
1989
1986
1988
1988
2004
1991
1991
1988
1989
1989
1995
1989
1987
1987
1987
1995
1990
1994
1988
1986
1986
1986
1986
1987
1995
2002
1986
1991
1996
1998
.
.
.
.
.
.
.
.
.
.
.
.
.
.
.
.
.
.
.
.
.
.
.
.
.
.
.
.
.
.
.
.
.
.
.
.
.
.
.
.
.
.
.
.
.
.
.
.
.
.
.
.
.
.
.
.
.
.
.
.
.
.
.
.
.
.
.
.
.
.
.
.
.
.
.
.
.
.
.
.
.
.
.
.
.
.
.
.
.
.
.
.
.
.
.
.
.
.
.
.
.
.
.
.
.
.
.
.
.
.
.
.
.
.
.
.
.
.
.
.
.
.
.
.
.
.
.
.
.
.
.
.
.
.
.
.
.
.
.
.
.
.
.
.
.
.
.
.
.
.
.
.
.
.
.
.
See footnotes at end of table.
.
.
.
.
.
.
.
.
.
.
.
.
.
.
.
.
.
.
.
.
.
.
.
.
.
.
.
.
.
.
.
.
.
.
.
.
.
.
.
Effective
October 1
Current code(s) assignment
37.26–37.27 . . . . . . . . .
37.28. . . . . . . . . . . . . .
37.34. . . . . . . . . . . . . .
37.35. . . . . . . . . . . . . .
37.41, 37.49 . . . . . . . . .
37.51. . . . . . . . . . . . . .
37.52. . . . . . . . . . . . . .
37.53–37.54 . . . . . . . . .
37.65–37.66 . . . . . . . . .
37.67. . . . . . . . . . . . . .
37.68. . . . . . . . . . . . . .
37.70 (Leads only) . . . . .
37.71–37.72 (Leads only) .
37.73 (Leads only) . . . . .
37.74 (Leads only) . . . . .
37.75 (Leads only) . . . . .
37.76 (Leads only) . . . . .
37.77 (Leads only) . . . . .
37.78. . . . . . . . . . . . . .
37.79. . . . . . . . . . . . . .
37.80–37.83 (Device only).
37.85–37.87 . . . . . . . . .
37.80–37.87 . . . . . . . . .
.
.
.
.
.
.
.
.
.
.
.
.
.
.
.
.
.
.
.
.
.
.
.
.
.
.
.
.
.
.
.
.
.
.
.
.
.
.
.
.
.
.
.
.
.
.
.
.
.
.
.
.
.
.
.
.
.
.
.
.
.
.
.
.
.
.
.
.
.
.
.
.
.
.
.
.
.
.
.
.
.
.
.
.
.
.
.
.
.
.
.
.
.
.
.
.
.
.
.
.
.
.
.
.
.
.
.
.
.
.
.
.
.
.
.
.
.
.
.
.
.
.
.
.
.
.
.
.
.
.
.
.
.
.
.
.
.
.
.
.
.
.
.
.
.
.
.
.
.
.
.
.
.
.
.
.
.
.
.
.
.
1988
2001
1988
1997
2005
2003
2003
2003
1995
1998
2004
1987
1987
1987
1987
1987
1987
1987
1987
1987
1987
1987
1992
37.89. . . . . . . . . . . . . . . . . . .
37.90. . . . . . . . . . . . . . . . . . .
37.94–37.98 . . . . . . . . . . . . . .
38.22. . . . . . . . . . . . . . . . . . .
38.44 (Abdominal aorta only) . . . .
38.45 (Thoracic aorta added) . . . .
38.95. . . . . . . . . . . . . . . . . . .
39.28. . . . . . . . . . . . . . . . . . .
39.50. . . . . . . . . . . . . . . . . . .
39.65. . . . . . . . . . . . . . . . . . .
39.66. . . . . . . . . . . . . . . . . . .
39.71, 39.79 . . . . . . . . . . . . . .
39.73. . . . . . . . . . . . . . . . . . .
39.90. . . . . . . . . . . . . . . . . . .
41.00–41.03 . . . . . . . . . . . . . .
41.04. . . . . . . . . . . . . . . . . . .
41.05–41.06 . . . . . . . . . . . . . .
41.07. . . . . . . . . . . . . . . . . . .
41.08. . . . . . . . . . . . . . . . . . .
41.09. . . . . . . . . . . . . . . . . . .
42.25. . . . . . . . . . . . . . . . . . .
42.33. . . . . . . . . . . . . . . . . . .
42.33. . . . . . . . . . . . . . . . . . .
43.11 . . . . . . . . . . . . . . . . . . .
43.19. . . . . . . . . . . . . . . . . . .
43.41. . . . . . . . . . . . . . . . . . .
44.21, 44.29 . . . . . . . . . . . . . .
44.22. . . . . . . . . . . . . . . . . . .
44.32. . . . . . . . . . . . . . . . . . .
44.38. . . . . . . . . . . . . . . . . . .
44.43. . . . . . . . . . . . . . . . . . .
44.44. . . . . . . . . . . . . . . . . . .
44.49. . . . . . . . . . . . . . . . . . .
44.67. . . . . . . . . . . . . . . . . . .
44.68. . . . . . . . . . . . . . . . . . .
44.93–44.94 . . . . . . . . . . . . . .
44.95–44.96 . . . . . . . . . . . . . .
44.97–44.98 . . . . . . . . . . . . . .
45.16. . . . . . . . . . . . . . . . . . .
45.30. . . . . . . . . . . . . . . . . . .
45.42. . . . . . . . . . . . . . . . . . .
45.43. . . . . . . . . . . . . . . . . . .
45.75 (Hartmann resection added).
.
.
.
.
.
.
.
.
.
.
.
.
.
.
.
.
.
.
.
.
.
.
.
.
.
.
.
.
.
.
.
.
.
.
.
.
.
.
.
.
.
.
.
.
.
.
.
.
.
.
.
.
.
.
.
.
.
.
.
.
.
.
.
.
.
.
.
.
.
.
.
.
.
.
.
.
.
.
.
.
.
.
.
.
.
.
1987
2004
1986
1986
1986
1989
1989
1991
1995
1988
1990
2000
2005
1996
1988
1994
1997
2000
2000
2000
1988
1989
1990
1989
1989
1989
1986
1986
2001
2004
1989
1989
1989
2004
2004
1986
2004
2004
1988
1989
1988
1989
1988
Previous code(s)
assignment
37.29
88.72
37.33
37.33
37.99
37.5
37.62
37.63
37.62
37.4
37.62
37.70 (Leads/device)
37.74 (Leads/device)
37.73 (Leads/device)
37.76 (Leads/device)
37.89 (Leads/device)
37.81 (Leads/device)
37.83–37.84 (Leads/device)
37.71–37.72
86.09
37.73–37.77 (Leads/device)
37.85
89.49 (Code deleted; this
procedure is included in the
code for pacemaker insertion/
replacement)
37.86 + 37.89
37.99
37.99
38.29
38.44 (Entire aorta)
38.44–38.45
38.93
39.29
39.59
39.61
39.65
39.52
39.79
39.50
41.0
99.79
None
41.04
41.05
41.01
42.24
42.32, 42.39
42.91
43.1
43.1, 43.2
43.41, 43.49
44.2
44.99
44.39
44.39
43.49, 45.32
38.86
43.0
44.66
44.69
44.99
44.69
44.99
45.14 (45.15 before 1987)
45.31, 45.32
45.41
45.49
48.66 (Code deleted)
Series 13, No. 168 [ Page 69
Table VI. Changes in ICD–9–CM procedure codes, 1986–2005—Con.
Effective
October 1
Current code(s) assignment
45.95. . . . .
46.13. . . . .
46.32. . . . .
46.85. . . . .
46.97. . . . .
47.01, 47.09
47.11, 47.19
48.36. . . . .
49.31, 49.39
49.75–49.76
51.10. . . . .
51.11 . . . . .
51.14. . . . .
51.15. . . . .
51.21. . . . .
51.22. . . . .
51.23. . . . .
51.24. . . . .
51.64. . . . .
51.84–51.88
51.97. . . . .
51.98. . . . .
52.13. . . . .
52.14. . . . .
52.21–52.22
52.84–52.86
52.93. . . . .
52.94. . . . .
52.97–52.98
52.99. . . . .
54.24. . . . .
54.25. . . . .
54.51, 54.59
55.03–55.04
56.33–56.34
56.35. . . . .
57.17–57.18
57.22. . . . .
58.31, 58.39
58.93. . . . .
59.03. . . . .
59.12. . . . .
59.72. . . . .
59.96. . . . .
60.21, 60.29
60.95. . . . .
60.96–60.97
64.97. . . . .
65.01, 65.09
65.13. . . . .
65.14. . . . .
65.23. . . . .
65.24. . . . .
65.25. . . . .
65.31, 65.39
65.41, 65.49
65.53. . . . .
65.54. . . . .
65.63. . . . .
65.64. . . . .
65.74. . . . .
65.75. . . . .
65.76. . . . .
65.81, 65.89
66.01. . . . .
66.02. . . . .
67.51, 67.59
68.15. . . . .
68.16. . . . .
.
.
.
.
.
.
.
.
.
.
.
.
.
.
.
.
.
.
.
.
.
.
.
.
.
.
.
.
.
.
.
.
.
.
.
.
.
.
.
.
.
.
.
.
.
.
.
.
.
.
.
.
.
.
.
.
.
.
.
.
.
.
.
.
.
.
.
.
.
.
.
.
.
.
.
.
.
.
.
.
.
.
.
.
.
.
.
.
.
.
.
.
.
.
.
.
.
.
.
.
.
.
.
.
.
.
.
.
.
.
.
.
.
.
.
.
.
.
.
.
.
.
.
.
.
.
.
.
.
.
.
.
.
.
.
.
.
.
.
.
.
.
.
.
.
.
.
.
.
.
.
.
.
.
.
.
.
.
.
.
.
.
.
.
.
.
.
.
.
.
.
.
.
.
.
.
.
.
.
.
.
.
.
.
.
.
.
.
.
.
.
.
.
.
.
.
.
.
.
.
.
.
.
.
.
.
.
.
.
.
.
.
.
.
.
.
.
.
.
.
.
.
.
.
.
.
.
.
.
.
.
.
.
.
.
.
.
.
.
.
.
.
.
.
.
.
.
.
.
.
.
.
.
.
.
.
.
.
.
.
.
.
.
.
.
.
.
.
.
.
.
.
.
.
.
.
.
.
.
.
.
.
.
.
.
.
.
.
.
.
.
.
.
.
.
.
.
.
.
.
.
.
.
.
.
.
.
.
.
.
.
.
.
.
.
.
.
.
.
.
.
.
.
.
.
.
.
.
.
.
.
.
.
.
.
.
.
.
.
.
.
.
.
.
.
.
.
.
.
.
.
.
.
.
.
.
.
.
.
.
.
.
.
.
.
.
.
.
.
.
.
.
.
.
.
.
.
.
.
.
.
.
.
.
.
.
.
.
.
.
.
.
.
.
.
.
.
.
.
.
.
.
.
.
.
.
.
.
.
.
.
.
.
.
.
.
.
.
.
.
.
.
.
.
.
.
.
.
.
.
.
.
.
.
.
.
.
.
.
.
.
.
.
.
.
.
.
.
.
.
.
.
.
.
.
.
.
.
.
.
.
.
.
.
.
.
.
.
.
.
.
.
.
.
.
.
.
.
.
.
.
.
.
.
.
.
.
.
.
.
.
.
.
.
.
.
.
.
.
.
.
.
.
.
.
.
.
.
.
.
.
.
.
.
.
.
.
.
.
.
.
.
.
.
.
.
.
.
.
.
.
.
.
.
.
.
.
.
.
.
.
.
.
.
.
.
.
.
.
.
.
.
.
.
.
.
.
.
.
.
.
.
.
.
.
.
.
.
.
.
.
.
.
.
.
.
.
.
.
.
.
.
.
.
.
.
.
.
.
.
.
.
.
.
.
.
.
.
.
.
.
.
.
.
.
.
.
.
.
.
.
.
.
.
.
.
.
.
.
.
.
.
.
.
.
.
.
.
.
.
.
.
.
.
.
.
.
.
.
.
.
.
.
.
.
.
.
.
.
.
.
.
.
.
.
.
.
.
.
.
.
.
.
.
.
.
.
.
.
.
.
.
.
.
.
.
.
.
.
.
.
.
.
.
.
.
.
.
.
.
.
.
.
.
.
.
.
.
.
.
.
.
.
.
.
.
.
.
.
.
.
.
.
.
.
.
.
.
.
.
.
.
.
.
.
.
.
.
.
.
.
.
.
.
.
.
.
.
.
.
.
.
.
.
.
.
.
.
.
.
.
.
.
.
.
.
.
.
.
.
.
.
.
.
.
.
.
.
.
.
.
.
.
.
.
.
.
.
.
.
.
.
.
.
.
.
.
.
.
.
.
.
.
.
.
.
.
.
.
.
.
.
.
.
.
.
.
.
.
.
.
.
.
.
.
.
.
.
.
.
.
.
.
.
.
.
.
.
.
.
.
.
.
.
.
.
.
.
.
.
.
.
.
.
.
.
.
.
.
.
.
.
.
.
.
.
.
.
.
.
.
.
.
.
.
.
.
.
.
.
.
.
.
.
.
.
.
.
.
.
.
.
.
.
.
.
.
.
.
.
.
.
.
.
.
.
.
.
.
.
.
.
.
.
.
.
.
.
.
.
.
.
.
.
.
.
.
.
.
.
.
.
.
.
.
.
.
.
.
.
.
.
.
.
.
.
.
.
.
.
.
.
.
.
.
.
.
.
.
.
.
.
.
.
.
.
.
.
.
.
.
.
.
.
.
.
.
.
.
.
.
.
.
.
.
.
.
.
.
.
.
.
.
.
.
.
.
.
.
.
.
.
.
.
.
.
.
.
.
.
.
.
.
.
.
.
.
.
.
.
.
.
.
.
.
.
.
.
.
.
.
.
.
.
.
.
.
.
.
.
.
.
.
.
.
.
.
.
.
.
.
.
.
.
.
.
.
.
.
.
.
.
.
.
.
.
.
.
.
.
.
.
.
.
.
.
.
.
.
.
.
.
.
.
.
.
.
.
.
.
.
.
.
.
.
.
.
.
.
.
.
.
.
.
.
.
.
.
.
.
.
.
.
.
1987
1992
1989
1989
2000
1996
1996
1995
1989
2002
1989
1989
1989
1989
1996
1991
1991
1996
1989
1989
1986
1986
1989
1989
1989
1996
1989
1989
1989
1989
1987
1993
1996
1986
1987
1987
1989
1989
1990
1986
1996
1996
1995
1986
1995
1991
2000
1986
1996
1996
1996
1996
1996
1996
1996
1996
1996
1996
1996
1996
1996
1996
1996
1996
1992
1992
2001
1987
1987
Previous code(s)
assignment
45.93
46.12 (Code deleted)
46.39
46.99
46.99
47.0
47.1
45.42
49.3
49.79
51.97
51.11, 51.97
51.12
51.97
51.22, 51.23
51.21 (Code deleted), 51.22
51.22
51.22, 51.23
51.69
51.97
52.91, 51.99, 51.82
51.99
51.97, 52.91
52.11
52.2
99.29
52.93 + 52.91
52.09
52.91
52.93, 52.94, 52.99
54.23
54.98
54.5
55.02
56.33
45.12
57.21
57.22, 57.82
58.3
57.99
59.02
59.11
59.79
59.95
60.2
60.99
60.29
64.95
65.0
65.12
65.19
65.21
65.22
65.29
65.3
65.4
65.51
65.52
65.61
65.62
65.71
65.72
65.73
65.8
66.0
66.73
67.5
68.14
68.13
Effective
October 1
Current code(s) assignment
68.23. . . . .
68.31, 68.39
68.51, 68.59
68.9 . . . . .
74.3 . . . . .
75.37. . . . .
75.38. . . . .
77.56. . . . .
77.57. . . . .
77.58. . . . .
78.10. . . . .
78.11 . . . . .
78.12. . . . .
78.13. . . . .
78.14. . . . .
78.15. . . . .
78.16. . . . .
78.17. . . . .
78.18. . . . .
78.19. . . . .
78.20. . . . .
78.21. . . . .
78.22. . . . .
78.23. . . . .
78.24. . . . .
78.25. . . . .
78.27. . . . .
78.28. . . . .
78.29. . . . .
.
.
.
.
.
.
.
.
.
.
.
.
.
.
.
.
.
.
.
.
.
.
.
.
.
.
.
.
.
.
.
.
.
.
.
.
.
.
.
.
.
.
.
.
.
.
.
.
.
.
.
.
.
.
.
.
.
.
.
.
.
.
.
.
.
.
.
.
.
.
.
.
.
.
.
.
.
.
.
.
.
.
.
.
.
.
.
.
.
.
.
.
.
.
.
.
.
.
.
.
.
.
.
.
.
.
.
.
.
.
.
.
.
.
.
.
.
.
.
.
.
.
.
.
.
.
.
.
.
.
.
.
.
.
.
.
.
.
.
.
.
.
.
.
.
.
.
.
.
.
.
.
.
.
.
.
.
.
.
.
.
.
.
.
.
.
.
.
.
.
.
.
.
.
.
.
.
.
.
.
.
.
.
.
.
.
.
.
.
.
.
.
.
.
.
.
.
.
.
.
.
.
.
.
.
.
.
.
.
.
.
.
.
.
.
.
.
.
.
.
.
.
.
.
.
.
.
.
.
.
.
.
.
.
.
.
.
.
.
.
.
.
.
.
.
.
.
.
.
.
.
.
.
.
.
.
.
.
.
.
.
.
.
.
.
.
.
.
.
.
.
.
.
.
.
.
.
.
.
.
.
.
.
.
.
.
.
.
.
.
.
.
.
.
.
.
.
.
.
.
.
.
.
.
.
.
.
.
.
.
.
.
.
.
.
.
.
.
.
.
.
.
.
.
.
.
.
.
.
.
.
.
.
.
.
.
.
.
.
.
.
.
.
.
.
.
.
.
.
.
.
.
.
.
.
.
.
.
.
.
.
.
.
.
.
.
.
.
.
.
.
.
.
.
.
.
.
.
.
.
.
.
.
.
.
.
.
.
.
.
.
.
.
.
.
.
.
.
.
.
.
.
.
.
.
.
1996
2003
1996
1992
1992
1998
2001
1989
1989
1989
1991
1991
1991
1991
1991
1991
1991
1991
1991
1991
1991
1991
1991
1991
1991
1991
1991
1991
1991
78.39. . . . . . . . . . . . . . . .
78.902 . . . . . . . . . . . . . . .
78.912 . . . . . . . . . . . . . . .
78.922 . . . . . . . . . . . . . . .
78.932 . . . . . . . . . . . . . . .
78.942 . . . . . . . . . . . . . . .
78.952 . . . . . . . . . . . . . . .
78.962 . . . . . . . . . . . . . . .
78.972 . . . . . . . . . . . . . . .
78.982 . . . . . . . . . . . . . . .
78.992 . . . . . . . . . . . . . . .
80.50–80.59 . . . . . . . . . . .
81.03. . . . . . . . . . . . . . . .
81.04–81.05 . . . . . . . . . . .
81.06–81.07 . . . . . . . . . . .
81.08. . . . . . . . . . . . . . . .
81.09. . . . . . . . . . . . . . . .
81.18. . . . . . . . . . . . . . . .
81.30–81.39 . . . . . . . . . . .
81.40. . . . . . . . . . . . . . . .
81.51. . . . . . . . . . . . . . . .
81.52. . . . . . . . . . . . . . . .
81.53. . . . . . . . . . . . . . . .
81.54–81.55 . . . . . . . . . . .
81.56. . . . . . . . . . . . . . . .
81.57. . . . . . . . . . . . . . . .
81.59. . . . . . . . . . . . . . . .
81.61 (code deleted 10/01/05)
81.62–81.64 . . . . . . . . . . .
81.65–81.66 . . . . . . . . . . .
81.72. . . . . . . . . . . . . . . .
81.73–81.74 . . . . . . . . . . .
81.75. . . . . . . . . . . . . . . .
81.79. . . . . . . . . . . . . . . .
81.80. . . . . . . . . . . . . . . .
81.97. . . . . . . . . . . . . . . .
84.51–84.52 . . . . . . . . . . .
.
.
.
.
.
.
.
.
.
.
.
.
.
.
.
.
.
.
.
.
.
.
.
.
.
.
.
.
.
.
.
.
.
.
.
.
.
.
.
.
.
.
.
.
.
.
.
.
.
.
.
.
.
.
.
.
.
.
.
.
.
.
.
.
.
.
.
.
.
.
.
.
.
.
.
.
.
.
.
.
.
.
.
.
.
.
.
.
.
.
.
.
.
.
.
.
.
.
.
.
.
.
.
.
.
.
.
.
.
.
.
.
.
.
.
.
.
.
.
.
.
.
.
.
.
.
.
.
.
.
.
.
.
.
.
.
.
.
.
.
.
.
.
.
.
.
.
.
.
.
.
.
.
.
.
.
.
.
.
.
.
.
.
.
.
.
.
.
.
.
.
.
.
.
.
.
.
.
.
.
.
.
.
.
.
1991
1987
1987
1987
1987
1987
1987
1987
1987
1987
1987
1986
1989
1989
1989
1989
1989
2005
2001
1989
1989
1989
1989
1989
1989
1989
1989
2002
2003
2004
1989
1989
1989
1989
1989
1992
2002
See footnotes at end of table.
.
.
.
.
.
.
.
.
.
.
.
.
.
.
.
.
.
.
.
.
.
.
.
.
.
.
.
.
.
.
.
.
.
.
.
.
.
.
.
.
.
.
.
.
.
.
.
.
.
.
.
.
.
.
.
.
.
.
Previous code(s)
assignment
68.29
68.3
68.5
68.4
69.11 (Code deleted)
99.29
75.34
77.89, 78.49, 81.18
77.89, 80.48, 81.18, 83.85
77.59, 81.18
78.40
78.41
78.42
78.43
78.44
78.45
78.46
78.47
78.48
78.49
78.10, 78.20, 78.30
78.11, 78.31
78.12, 78.22, 78.32
78.13, 78.23, 78.33
78.14, 78.34
78.15, 78.25, 78.35
78.17, 78.27, 78.37
78.18, 78.38
78.11, 78.16, 78.19, 78.29,
78.39
78.31
78.40
78.41
78.42
78.43
78.44
78.45
78.46
78.47
78.48
78.49
80.5
81.02
81.03, 81.04, 81.05
81.06, 81.07
81.06, 81.07, 81.08
81.08
81.99
81.09
81.69
81.51, 81.59
81.61–81.64
81.51, 81.59, 81.61–81.64
81.41
81.48
81.31, 81.39
81.39
81.00–81.08, 81.30–81.39
None
78.49
81.79
81.86 (Code deleted)
81.87 (Code deleted)
81.79, 81.87
81.81
81.59
None
Page 70 [ Series 13, No. 168
Table VI. Changes in ICD–9–CM procedure codes, 1986–2005—Con.
Current code(s) assignment
84.53–84.54
84.55, 84.59
84.56–84.57
84.58. . . . .
84.60–84.69
84.71–84.73
85.95–85.96
86.06. . . . .
86.07. . . . .
86.27. . . . .
86.28. . . . .
86.67. . . . .
86.93. . . . .
86.94–86.96
86.97. . . . .
86.98. . . . .
88.90. . . . .
88.91. . . . .
88.92. . . . .
88.93. . . . .
88.94. . . . .
88.95. . . . .
88.96. . . . .
88.97. . . . .
88.98. . . . .
88.99. . . . .
89.10, 89.19
89.17–89.18
.
.
.
.
.
.
.
.
.
.
.
.
.
.
.
.
.
.
.
.
.
.
.
.
.
.
.
.
.
.
.
.
.
.
.
.
.
.
.
.
.
.
.
.
.
.
.
.
.
.
.
.
.
.
.
.
.
.
.
.
.
.
.
.
.
.
.
.
.
.
.
.
.
.
.
.
.
.
.
.
.
.
.
.
.
.
.
.
.
.
.
.
.
.
.
.
.
.
.
.
.
.
.
.
.
.
.
.
.
.
.
.
.
.
.
.
.
.
.
.
.
.
.
.
.
.
.
.
.
.
.
.
.
.
.
.
.
.
.
.
.
.
.
.
.
.
.
.
.
.
.
.
.
.
.
.
.
.
.
.
.
.
.
.
.
.
.
.
.
.
.
.
.
.
.
.
.
.
.
.
.
.
.
.
.
.
.
.
.
.
.
.
.
.
.
.
.
.
.
.
.
.
.
.
.
.
.
.
.
.
.
.
.
.
.
.
.
.
.
.
.
.
.
.
.
.
.
.
.
.
.
.
.
.
.
.
.
.
.
.
.
.
.
.
.
.
.
.
.
.
.
.
.
.
.
.
.
.
.
.
.
.
.
.
.
.
.
.
.
.
.
.
.
.
.
.
.
.
.
.
.
.
.
.
.
.
.
.
.
.
.
.
.
.
.
.
.
.
.
.
.
.
.
.
.
.
.
.
.
.
.
.
.
.
.
.
.
.
.
.
.
.
.
.
.
.
.
.
.
.
.
.
.
.
.
.
.
.
.
.
.
.
.
.
.
.
.
.
.
.
.
.
.
.
.
.
.
.
.
.
.
.
.
.
.
.
.
.
.
.
.
.
.
.
.
.
.
.
.
.
.
.
.
.
.
.
.
.
.
.
.
.
.
.
.
.
.
.
.
.
.
.
.
.
.
.
.
.
.
.
.
.
.
.
.
.
.
.
.
.
.
.
.
.
.
.
.
.
.
.
.
.
.
.
.
.
.
.
.
.
.
.
.
.
.
.
.
.
Effective
October 1
Previous code(s)
assignment
2004
2004
2005
2005
2004
2005
1987
1987
1990
1986
1988
1998
1987
2004
2005
2005
1986
1986
1986
1986
1986
1986
2002
1989
1989
1986
1989
1988
78.30, 78.32–78.35, 78.37–78.39
None
None
84.59
80.51
None
85.99
86.09
86.09
86.22–86.23
86.22
86.65
86.89
02.93, 03.93, 04.92
86.94
86.95
88.39
89.15
89.39
89.15
89.39
89.29
88.91–88.97
88.99
88.90
89.39
89.15
89.15
1
Effective
October 1
Current code(s) assignment
89.49. . . . . . . . .
89.50. . . . . . . . .
89.60. . . . . . . . .
92.20. . . . . . . . .
92.3 . . . . . . . . .
92.30–92.33, 92.39
93.90. . . . . . . . .
94.61–94.69 . . . .
96.29. . . . . . . . .
96.6 . . . . . . . . .
96.70–96.72 . . . .
97.05. . . . . . . . .
97.44. . . . . . . . .
98.51–98.52, 98.59
99.00. . . . . . . . .
99.10. . . . . . . . .
99.15. . . . . . . . .
99.20. . . . . . . . .
99.28. . . . . . . . .
99.71–99.793 . . . .
99.75. . . . . . . . .
99.76. . . . . . . . .
99.77. . . . . . . . .
99.78. . . . . . . . .
99.85. . . . . . . . .
99.86. . . . . . . . .
99.88. . . . . . . . .
.
.
.
.
.
.
.
.
.
.
.
.
.
.
.
.
.
.
.
.
.
.
.
.
.
.
.
.
.
.
.
.
.
.
.
.
.
.
.
.
.
.
.
.
.
.
.
.
.
.
.
.
.
.
.
.
.
.
.
.
.
.
.
.
.
.
.
.
.
.
.
.
.
.
.
.
.
.
.
.
.
.
.
.
.
.
.
.
.
.
.
.
.
.
.
.
.
.
.
.
.
.
.
.
.
.
.
.
.
.
.
.
.
.
.
.
.
.
.
.
.
.
.
.
.
.
.
.
.
.
.
.
.
.
.
.
.
.
.
.
.
.
.
.
.
.
.
.
.
.
.
.
.
.
.
.
.
.
.
.
.
.
.
.
.
.
.
.
.
.
.
.
.
.
.
.
.
.
.
.
.
.
.
.
.
.
.
.
.
.
.
.
.
.
.
.
.
.
.
.
.
.
.
.
.
.
.
.
.
.
.
.
.
.
.
.
.
.
.
.
.
.
.
.
.
.
.
.
.
.
.
.
.
.
.
.
.
.
.
.
.
.
.
.
.
.
.
.
.
.
.
.
.
.
.
.
.
.
.
.
.
.
.
.
.
.
.
.
.
.
.
.
.
.
.
.
.
.
.
.
.
.
.
.
.
.
.
.
.
.
.
.
.
.
.
.
.
.
.
.
.
.
.
.
.
.
.
.
.
.
.
.
.
.
.
.
.
.
.
.
.
.
.
.
2004
1991
2002
2005
1995
1998
1988
1989
1998
1986
1991
1989
2001
1989
1995
1998
1986
1998
1994
1988
2000
2002
2002
2004
1987
1987
1988
Previous code(s)
assignment
89.59
89.54
89.65
92.28
01.59, 04.07, 07.63, 07.68
92.3
93.92
94.25
96.39
96.35
93.92 (Code deleted)
51.97
37.64
59.96 (Code deleted)
99.02
99.29
99.29
99.29
99.25
99.07
99.29
99.79
None
99.71
93.35
93.39
99.83
Before October 1986, contents of current code 36.05 would have been assigned to 36.0.
Codes 78.90–78.99 were retitled as ‘‘Insertion of bone growth stimulator’’ in October 1987; the previous contents of codes 78.90–78.99 were reassigned to codes 78.40–78.49.
Codes 99.71–99.79 were deleted in October 1987; their contents were not transferred elsewhere. In the October 1988 revision, codes 99.71–99.79 were reclassified as ‘‘Therapeutic apheresis.’’
2
3
NOTE: ICD–9–CM is the International Classification of Diseases, Ninth Revision, Clinical Modification.
Vital and Health Statistics
Series Descriptions
ACTIVE SERIES
DISCONTINUED SERIES
Series 1.
Programs and Collection Procedures—This type of report
describes the data collection programs of the National Center
for Health Statistics. Series 1 includes descriptions of the
methods used to collect and process the data, definitions, and
other material necessary for understanding the data.
Series 4.
Series 2.
Data Evaluation and Methods Research—This type of
report concerns statistical methods and includes analytical
techniques, objective evaluations of reliability of collected
data, and contributions to statistical theory. Also included are
experimental tests of new survey methods, comparisons of
U.S. methodologies with those of other countries, and as of
2009, studies of cognition and survey measurement, and final
reports of major committees concerning vital and health
statistics measurement and methods.
Documents and Committee Reports—These are final
reports of major committees concerned with vital and health
statistics and documents. The last Series 4 report was
published in 2002. As of 2009, this type of report is included
in Series 2 or another appropriate series, depending on the
report topic.
Series 5.
International Vital and Health Statistics Reports—This
type of report compares U.S. vital and health statistics with
those of other countries or presents other international data of
relevance to the health statistics system of the United States.
The last Series 5 report was published in 2003. As of 2009,
this type of report is included in Series 3 or another series,
depending on the report topic.
Series 6.
Cognition and Survey Measurement—This type of report
uses methods of cognitive science to design, evaluate, and
test survey instruments. The last Series 6 report was
published in 1999. As of 2009, this type of report is included
in Series 2.
Series 12.
Data From the Institutionalized Population Surveys—
The last Series 12 report was published in 1974. Reports
from these surveys are included in Series 13.
Series 14.
Data on Health Resources: Manpower and Facilities—
The last Series 14 report was published in 1989. Reports on
health resources are included in Series 13.
Series 15.
Data From Special Surveys—This type of report contains
statistics on health and health-related topics collected in
special surveys that are not part of the continuing data
systems of the National Center for Health Statistics. The last
Series 15 report was published in 2002. As of 2009, reports
based on these surveys are included in Series 3.
Series 16.
Compilations of Advance Data From Vital and Health
Statistics—The last Series 16 report was published in 1996.
All reports are available online, and so compilations of
Advance Data reports are no longer needed.
Series 22.
Data From the National Mortality and Natality Surveys—
The last Series 22 report was published in 1973. Reports
from these sample surveys, based on vital records, are
published in Series 20 or 21.
Compilations of Data on Natality, Mortality, Marriage, and
Divorce—The last Series 24 report was published in 1996.
All reports are available online, and so compilations of reports
are no longer needed.
Series 3.
Series 10.
Series 11.
Analytical and Epidemiological Studies—This type of
report presents analytical or interpretive studies based on vital
and health statistics. As of 2009, Series 3 also includes
studies based on surveys that are not part of continuing data
systems of the National Center for Health Statistics and
international vital and health statistics reports.
Data From the National Health Interview Survey—This
type of report contains statistics on illness; unintentional
injuries; disability; use of hospital, medical, and other health
services; and a wide range of special current health topics
covering many aspects of health behaviors, health status, and
health care utilization. Series 10 is based on data collected in
this continuing national household interview survey.
Data From the National Health Examination Survey, the
National Health and Nutrition Examination Surveys, and
the Hispanic Health and Nutrition Examination Survey—
In this type of report, data from direct examination, testing,
and measurement on representative samples of the civilian
noninstitutionalized population provide the basis for (1)
medically defined total prevalence of specific diseases or
conditions in the United States and the distributions of the
population with respect to physical, physiological, and
psychological characteristics, and (2) analyses of trends and
relationships among various measurements and between
survey periods.
Series 13.
Data From the National Health Care Survey—This type of
report contains statistics on health resources and the public’s
use of health care resources including ambulatory, hospital,
and long-term care services based on data collected directly
from health care providers and provider records.
Series 24.
Series 20.
Data on Mortality—This type of report contains statistics on
mortality that are not included in regular, annual, or monthly
reports. Special analyses by cause of death, age, other
demographic variables, and geographic and trend analyses
are included.
For answers to questions about this report or for a list of reports published
in these series, contact:
Series 21.
Series 23.
Data on Natality, Marriage, and Divorce—This type of
report contains statistics on natality, marriage, and divorce
that are not included in regular, annual, or monthly reports.
Special analyses by health and demographic variables and
geographic and trend analyses are included.
Data From the National Survey of Family Growth—These
reports contain statistics on factors that affect birth rates,
including contraception and infertility; factors affecting the
formation and dissolution of families, including cohabitation,
marriage, divorce, and remarriage; and behavior related to
the risk of HIV and other sexually transmitted diseases.
These statistics are based on national surveys of women and
men of childbearing age.
Information Dissemination Staff
National Center for Health Statistics
Centers for Disease Control and Prevention
3311 Toledo Road, Room 5412
Hyattsville, MD 20782
1–800–232–4636
E-mail: [email protected]
Internet: http://www.cdc.gov/nchs
FOLD
U.S. DEPARTMENT OF
HEALTH & HUMAN SERVICES
FOLD
S
P
I
N
E
MEDIA MAIL
POSTAGE & FEES PAID
CDC/NCHS
PERMIT NO. G-284
Centers for Disease Control and Prevention
National Center for Health Statistics
3311 Toledo Road
Hyattsville, MD 20782
OFFICIAL BUSINESS
PENALTY FOR PRIVATE USE, $300
CS213808
T37784 (12/2010)
DHHS Publication No. (PHS) 2011–1739, Series 13, No. 168
COVER 4
PRINTER: ADJUST SPINE TO FIT
PRINTER:
POSITIVE ART FOR BACK COVER (cover 4): PRINT SOLID PMS
NEGATIVE ART FOR FRONT COVER (cover 1): PRINT SOLID PMS

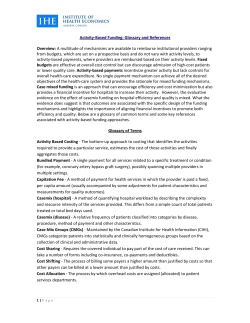
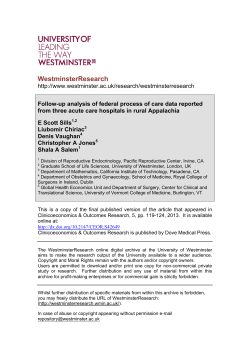
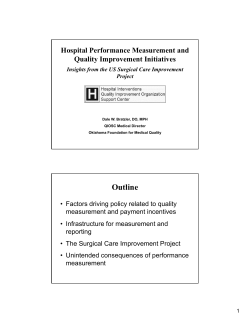
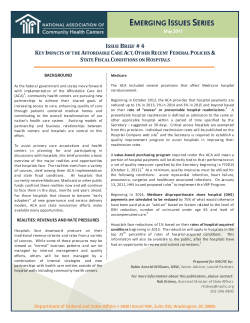

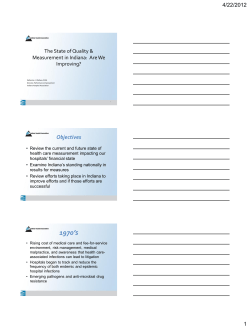
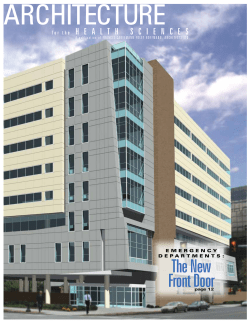
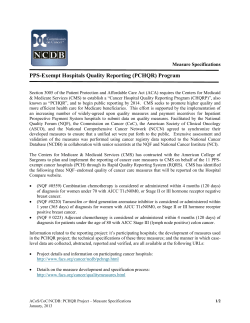
© Copyright 2026