
A u s t r a l i a n
EMBARGO: 11.30 AM (CANBERRA TIME) THU 24 JUN 1999
Australian
Social Trends
1999
W. McLennan
Australian Statistician
AUSTRALIAN BUREAU OF STATISTICS
CATALOGUE NO. 4102.0
© Commonwealth of Australia 1999
This work is copyright. Apart from any use as permitted under the Copyright Act 1968, no part may be
reproduced by any process without permission from AusInfo. Requests and inquiries concerning
reproduction rights should be directed to the Manager, Legislative Services, AusInfo, GPO Box 84,
Canberra ACT 2601.
The Australian Bureau of Statistics has catalogued this publication as follows:
Australian social trends / Australian Bureau of Statistics. — 1994- . — Canberra : Australian
Bureau of Statistics, 1994- . — v. : ill.; 30 cm.
Annual
Catalogue no. 4102.0
ISSN: 1321-1781
1. Social indicators — Australia — Statistics — Periodicals.
2. Australia — Social conditions — Statistics — Periodicals.
I. Australian Bureau of Statistics.
319.4
The photograph of Sri Lankan mother and son was reproduced with the permission of the Department of
Immigration and Multicultural Affairs. Other photographs reproduced with permission of Catriona Bate,
Natalie Bobbin, Christine Fernon, Norman Pearl, Horst Posselt and Glenice Taylor.
Contents
Page
Preface . . . . . . . . . . . . . . . . . . . . . . . . . . . . . . . . . . . . . . . . . . . . . . . . . . . . . . . . . . . . . . . . . . . . . . . v
General information
Population
...................................................
..................................................................
vi
1
Our ageing population — Languages spoken in Australia — Indigenous languages
— Island populations
Family
......................................................................
27
Spending time alone — Looking after the children — Caring for children after
parents separate — Remarriage trends of divorced people
Health
......................................................................
49
Health of older people — Health and socio-economic disadvantage of area —
Mental health — Asthma
Education
.................................................................
75
Educational profile of Australians — Destinations of school leavers — Educating
and training Australia's workers
Work
.........................................................................
97
Decline of the standard working week — Men and women wanting work — Older
jobseekers — How couples share domestic work
Income and expenditure
..........................................
123
Income sharing and income distribution — Lower income working families —
Economic resources of older Australians — Expenditure on gambling
Housing
..................................................................
147
First home buyers — Home care, hostels and nursing homes — Rental investors
— Inner city residential development
Culture and leisure
.................................................
171
How Australians use their free time — Interests in the arts and cultural activities
— Sporting Australians — Information technology in the home
International
...........................................................
195
Population — Health — Work
Cumulative topic list
...............................................
ABS information services
........................................
204
208
ABS • AUSTRALIAN SOCIAL TRENDS • 4102.0 • 1999 •
iii
Preface
Australian Social Trends 1999 is the sixth of an annual series presenting information on
contemporary social issues and areas of public policy concern. By drawing on a wide range of ABS
statistics, as well as those from other official sources, it describes many of the circumstances that set
the course for on-going social change. Australian Social Trends is designed to assist and encourage
informed decision-making and is intended for use by a wide audience, including those involved in
social policy, research, journalism, marketing and teaching, as well as anyone interested in how we
live today.
The articles in Australian Social Trends 1999 are organised into eight chapters, each representing
an area of social concern: population, family, health, education, work, income and expenditure,
housing, and culture and leisure. Through extensive referencing to other articles, including those
presented in previous editions of Australian Social Trends, connections between issues have also
been highlighted.
As 1999 is the International Year of Older Persons, several articles in this edition address themes
relevant to the wellbeing of older people. The first article sets the scene by describing changes in
the representation of older people in the population and some of the implications this has for the
broader community. Other articles discuss the health of older people, the use of home care, hostel
and nursing home services, and the financial circumstances of older Australians.
As in 1995, the feature chapter in this year's edition takes a look at Australians' involvement in
culture and leisure activities. Here, information is presented about the availability and use of free
time, people's involvement and interests in cultural activities, the use of computers and the internet
in the home, and involvement in sporting activities.
As well as the 31 analytical reviews, Australian Social Trends includes a set of national and State
summary tables, which present key social indicators in each of the major areas of concern. These
show at a glance how aspects of social wellbeing have been changing over time and how
circumstances differ between States. This edition has again extended the range of indicators
previously presented in these tables. Also provided is a set of tables of international comparisons
for 18 countries, including major OECD countries and Australia's nearest neighbours and trading
partners. Finally, there is a cumulative index to the 200 articles that have now been presented
within the six editions.
Many organisations have assisted in compiling this volume. These include: the Aboriginal and
Torres Strait Islander Commission; the Australian Institute of Health and Welfare; Centrelink; the
Confederation of Australian Sport Inc.; the Department of Family and Community Services; the
Department of Health and Aged Care; and the Organisation for Economic Cooperation and
Development. As well as thanking these oganisations, I would also like to thank
Mr Gerry Redmond of the Social Policy Research Centre at the University of New South Wales for
his contribution in preparing an article, and Mr Mike Giles, who provided editorial comment on
this report.
The Australian Bureau of Statistics welcomes readers' suggestions on how the publication could be
improved. To express your views or to ask for more information, please contact
the Director, Social Analysis and Reporting, at the address below.
W. McLennan
Australian Statistician
Australian Bureau of Statistics
PO Box 10
Belconnen ACT 2616
June 1999
ABS • AUSTRALIAN SOCIAL TRENDS • 4102.0 • 1998 •
v
General information
Inquiries about these statistics
General inquiries about the content and interpretation of statistics in this publication should be addressed
to:
Director
Social Analysis and Reporting Section
ABS
PO Box 10
Belconnen ACT 2616
Telephone Canberra 02 6252 7187
Inquiries about the availability of more recent data from ABS should be directed to Information Services in
your nearest ABS office (see p. 208).
ABS publications and services
A complete list of ABS publications produced in Canberra and each of the State Offices is contained in the
ABS Catalogue of Publications and Products (Cat. no. 1101.0), which is available from any ABS office.
In many cases, the ABS can also provide information which is not published or which is historical or
compiled from a variety of published and unpublished sources. Information of this kind may be obtained
through the Information Consultancy Service. This information may be made available in one or more of
the following forms: consultancy reports, microfiche, floppy disk, magnetic tape, computer printout or
photocopy. Charges are generally made for such information. Inquiries may be made by contacting
Information Services in your nearest ABS office (see p. 208).
vi
• ABS • AUSTRALIAN SOCIAL TRENDS • 4102.0 • 1999
Abbreviations
The following abbreviations have been used in graphics and tables throughout this publication.
Australia, States and Territories of Australia
Aust.
NSW
Vic.
Qld
SA
WA
Tas.
NT
ACT
Australia
New South Wales
Victoria
Queensland
South Australia
Western Australia
Tasmania
Northern Territory
Australian Capital Territory
Other abbreviations
NZ
OECD
PNG
UK
UN
UNICEF
USA
USSR
WHO
New Zealand
Organisation for Economic Cooperation and Development
Papua New Guinea
United Kingdom
United Nations
United Nations International Children's Emergency Fund
United States of America
Union of Soviet Socialist Republics
World Health Organisation
Symbols and usages
The following symbols and usages mean:
billion
n.a.
n.y.a.
p
r
*
**
..
—
1,000 million
not available
not yet available
preliminary — figures or series subject to revision
figures or series revised since previous edition
subject to high sampling variability
data suppressed due to unacceptably high sampling variability
not applicable
nil or rounded to zero
Where figures have been rounded, discrepancies may occur between the sums of the component items
and totals.
ABS • AUSTRALIAN SOCIAL TRENDS • 4102.0 • 1998 •
vii
Population
National and State summary tables
Page
2
POPULATION PROJECTIONS
Our ageing population
6
Australia's population is projected to age rapidly into the next century.
This article describes past and projected trends in population ageing, and
discusses some of the possible implications for Australian society as the
baby-boom generation grows older.
POPULATION COMPOSITION
Languages spoken in Australia
11
This review presents an overview of the leading languages other than
English used at home in Australia in 1996, their geographic distribution
and changes since the last Census. Census data is also used to give an
indication of the extent to which people from different language
backgrounds have shifted to speaking only English at home.
Indigenous languages
16
The 1996 Census of Population and Housing was the first in which
speakers of 48 Indigenous languages and 2 Australian creoles were
separately counted. This review gives an overview of the numbers of
speakers of Indigenous languages and their location. It also presents
information relevant to the maintenance of these languages and their
co-existence with English.
POPULATION DISTRIBUTION
Island populations
21
Using 1996 Census data, this review presents demographic and
socio-economic characteristics of the residents of some of Australia's most
populated islands that are located more than 5 kilometres from the
mainland. Those islands with large Indigenous and visitor populations are
separately identified.
ABS • AUSTRALIAN SOCIAL TRENDS • 4102.0 • 1999 •
1
Population — national summary
COMPOSITION
Total population
Male population
Female population
Indigenous population(b)
Overseas-born population
Born in the
United Kingdom and Ireland
Born in Europe and the former USSR
Born in East and Southern Asia
Population living in capital cities
Population aged 0–14
Population aged 15–64
Population aged 65 and over
Population aged 80 and over
Median age of total population
Median age of Indigenous population
Sex ratio of population aged 0–64
Sex ratio of population
aged 65 and over
Units
1988
1989
1990
1991
1992
1993
1994(a)
1995
1996
1997
1998p
'000
16 532
16 814
17 065
17 284
17 495
17 667
17 855
18 072
18 311
r18 524
18 751
'000
8 249
8 388
8 511
8 615
8 716
8 798
8 888
8 994
9 108
r9 214
9 330
'000
8 283
8 427
8 554
8 669
8 779
8 869
8 967
9 078
9 203
r9 310
9 421
'000
n.a.
n.a.
n.a.
345.4
352.9
360.7
368.8
377.1
386.0
394.2
402.4
22.0
22.4
22.8
22.9
23.0
22.9
22.9
23.0
23.3
23.3
23.4
%
%
7.3
7.3
7.3
7.2
7.1
7.0
6.9
6.9
6.8
6.7
6.7
%
14.5
14.4
14.2
14.0
13.8
13.6
13.5
13.3
13.2
13.1
12.9
%
3.2
3.5
3.8
4.2
4.4
4.5
4.7
4.9
5.1
5.2
5.4
%
63.7
63.7
63.6
63.6
63.5
63.5
63.5
63.5
63.6
63.7
63.7
%
22.4
22.2
22.0
21.9
21.8
21.7
21.6
21.5
21.4
21.2
20.9
%
66.8
66.9
66.9
66.8
66.7
66.6
66.6
66.6
66.6
66.7
66.9
%
10.8
11.0
11.1
11.3
11.5
11.6
11.8
11.9
12.0
12.1
12.2
%
2.1
2.1
2.2
2.2
2.3
2.4
2.5
2.6
2.6
2.7
2.8
31.6
31.8
32.1
32.4
32.7
33.0
33.4
33.7
34.0
34.3
34.6
years
n.a.
n.a.
n.a.
19.8
19.8
19.9
20.0
20.0
20.1
19.8
19.8
ratio
103.3
103.2
103.1
103.0
102.8
102.7
102.6
102.5
102.4
102.3
102.4
ratio
73.7
74.1
74.5
75.0
75.5
75.9
76.3
76.7
77.1
77.5
77.8
POPULATION GROWTH
Units
1988
1989
1990
1991
1992
1993
1994(a)
1995
1996
1997
1998p
Population growth
Births
Deaths
Natural increase
Net overseas migration
Population growth rate
Net overseas
migration to total growth
'000
268.3
282.3
250.7
218.9
210.6
172.4
187.6
217.0
239.0
r213.4
226.8
'000
r246.2
r250.2
r257.5
r261.2
259.2
260.0
258.3
258.2
250.4
r253.7
249.2
'000
r120.5
r118.8
r125.1
r119.6
120.8
121.3
123.5
126.2
126.4
r127.3
128.6
'000
r125.7
r131.4
r132.4
r141.6
138.4
138.6
134.8
132.0
124.0
r126.4
120.6
'000
149.3
157.4
124.6
86.4
68.6
30.0
46.5
80.1
104.1
r87.1
106.2
%
r1.62
r1.68
r1.47
r1.27
r1.20
0.99
1.06
1.22
1.32
1.21
1.22
%
55.7
55.8
49.7
39.5
32.6
17.4
24.8
36.9
43.6
40.8
46.8
Units
1988
1989
1990
1991
1992
1993
1994(a)
1995
1996
1997
1998
'000
MIGRATION
Total settler arrivals(c)
Skilled settler arrivals
Family settler arrivals
Humanitarian settler arrivals
PROJECTIONS — SERIES II
Total population
Population aged 0–14
Population aged 15–64
Population aged 65 and over
Population aged 80 and over
Median age of total population
Population living in capital cities
years
143.5
145.3
121.2
121.7
107.4
76.3
69.8
87.4
99.1
85.8
77.3
%
24.1
30.0
35.3
39.8
37.6
29.0
18.3
23.1
20.2
23.0
33.6
%
48.5
41.0
41.2
44.3
45.3
42.1
48.1
42.4
46.9
42.6
27.3
%
7.7
7.5
9.9
6.4
6.7
14.3
16.3
15.6
13.9
11.5
11.4
Units
2001
2006
2011
2016
2021
2026
2031
2036
2041
2046
2051
'000
19 297
20 189
21 017
21 792
22 519
23 173
23 720
24 149
24 476
24 731
24 945
%
20.3
19.3
18.3
17.6
17.1
16.8
16.5
16.2
15.9
15.7
15.6
%
67.3
67.8
67.7
66.4
65.0
63.4
62.2
61.4
60.8
60.6
60.2
%
12.4
12.9
14.0
16.0
17.9
19.8
21.3
22.4
23.3
23.7
24.2
%
3.0
3.4
3.7
3.8
4.1
4.7
5.8
6.7
7.5
8.0
8.4
years
35.5
36.8
38.3
39.4
40.4
41.3
42.2
42.9
43.5
43.9
44.1
%
63.8
64.0
64.1
64.3
64.5
64.7
64.9
65.1
65.3
65.5
65.7
(a) From 1994, includes Christmas and Cocos Islands.
(b) From 1997, figures are projections.
(c) Total settler arrivals includes special eligibility and non-program migration, in addition to family, skilled and humanitarian migration.
Reference periods:
2
•
Population composition and projection figures are at 30 June. Growth and migration figures are for the year
ended 30 June.
ABS • AUSTRALIAN SOCIAL TRENDS • 4102.0 • 1999
Population — State summary
COMPOSITION
Units
Years
NSW
Vic.
Qld
SA
WA
Tas.
NT
ACT
Aust.
Total population
'000
1998p
6 342
4 661
3 456
1 487
1 831
472
190
308
18 751
Male population
'000
1998p
3 151
2 304
1 731
735
922
233
100
154
9 330
Female population
'000
1998p
3 191
2 357
1 726
752
910
239
90
155
9 421
Indigenous population(a)
'000
1998
114.4
23.4
110.3
23.0
58.3
15.8
53.7
3.3
402.4
Overseas-born population
%
1996
24.5
25.1
17.7
22.3
29.3
10.8
16.8
23.7
23.3
Born in the
United Kingdom and Ireland
Born in Europe and the former USSR
%
1996
5.4
5.5
6.0
10.0
13.2
5.4
4.9
6.7
6.7
%
1996
11.7
15.2
9.4
17.5
18.9
8.0
8.2
13.6
13.2
Born in East and Southern Asia
%
1996
6.7
5.8
2.8
2.7
5.3
1.0
4.5
5.6
5.1
Population living in capital cities
%
1998p
62.9
72.3
45.6
73.2
73.3
41.3
45.6
99.9
63.7
Population aged 0–14
%
1998p
20.8
20.4
21.5
19.9
21.7
21.6
26.5
21.2
20.9
Population aged 15–64
%
1998p
66.5
67.0
67.2
65.8
67.9
65.2
70.1
71.0
66.9
Population aged 65 and over
%
1998p
12.7
12.6
11.3
14.3
10.5
13.2
3.3
7.8
12.2
Population aged 80 and over
%
1998p
2.9
2.9
2.5
3.4
2.4
3.1
0.5
1.5
2.8
Median age of total population
years
1998p
35.0
34.8
33.9
36.3
33.6
35.6
28.3
32.1
34.6
Sex ratio of population aged 0–64
Sex ratio of population
aged 65 and over
ratio
1998p
102.3
101.3
103.0
101.9
104.1
100.7
111.7
101.2
102.4
ratio
1998p
77.1
76.4
81.1
76.4
80.0
76.8
109.1
77.2
77.8
Years
NSW
Vic.
Qld
SA
WA
Tas.
NT
ACT
Aust.
POPULATION GROWTH
Units
Population growth
'000
1997–98p
68.8
55.7
59.3
7.6
33.5
–1.6
3.1
0.4
226.8
Births
'000
1997–98p
85.1
61.1
46.9
18.0
24.5
5.9
3.6
4.0
249.2
Deaths
'000
1997–98p
45.4
32.3
22.5
11.4
11.0
3.8
0.9
1.3
128.6
Natural increase
'000
1997–98p
39.6
28.8
24.4
6.6
13.6
2.1
2.7
2.7
120.6
Net overseas migration
'000
1997–98p
42.7
25.6
16.9
4.3
15.2
0.2
0.8
0.4
106.2
Net interstate migration
'000
1997–98p
–13.5
1.2
18.0
–3.3
4.7
–4.0
–0.4
–2.7
..
Population growth rate
%
1997–98p
1.10
1.21
1.74
0.51
1.86
–0.34
1.65
0.13
1.22
Net interstate migration rate
%
1997–98p
–0.21
0.03
0.52
–0.22
0.26
–0.84
–0.23
–0.87
..
Tas.
NT
ACT
Aust.
PROJECTIONS — SERIES II
Units
Years
NSW
Vic.
Qld
SA
WA
Total population
'000
2051
7 861
5 242
6 203
1 400
3 098
310
440
387
24 945
Population aged 0–14
%
2051
15.6
14.8
16.1
14.0
16.2
13.9
21.8
16.1
15.6
Population aged 15–64
%
2051
59.8
59.4
61.0
57.1
61.6
54.2
68.7
63.0
60.2
Population aged 65 and over
%
2051
24.6
25.8
23.0
28.9
22.2
31.9
9.6
20.9
24.2
Population aged 80 and over
%
2051
8.6
9.3
7.7
11.0
7.4
12.2
1.9
7.2
8.4
Median age of total population
Population living in capital cities
years
2051
44.5
45.3
43.4
48.0
42.6
51.0
33.9
40.6
44.1
%
2051
67.0
77.9
47.1
75.7
74.3
40.5
53.5
(b)
65.7
(a) Population projections.
(b) Capital city/balance of Territory projections were not generated for the ACT.
Reference periods:
Population composition and projection figures are at 30 June. Growth figures are for the year ended 30 June.
ABS • AUSTRALIAN SOCIAL TRENDS • 4102.0 • 1999 •
3
Population — definitions and references
Births — live births occurring in that year.
Reference: Births, Australia (Cat. no. 3301.0).
Deaths — deaths occurring in that year.
Reference: Deaths, Australia (Cat. no. 3302.0).
East and Southern Asia — including the countries of
North-East, South-East and Southern Asia.
Countries are classified according to the Standard
Australian Classification of Countries (SACC),
1998 (Cat. no. 1269.0).
Reference: Migration, Australia (Cat. no. 3412.0).
Europe and the Former USSR — including the
United Kingdom and Ireland, the former USSR
and the Baltic States.
Reference: Migration, Australia (Cat. no. 3412.0).
Family settler arrivals — migrants who have been
sponsored by a relative who is an Australian
citizen, or permanent resident of Australia, under
the family stream of the migration program.
Reference: Immigration Update, June Quarter
1998, Department of Immigration and
Multicultural Affairs.
Humanitarian settler arrivals — comprises: those who
arrive under the refugee program (which provides
protection for people who have fled their country
because of persecution); those who arrive under
the special humanitarian programs (those
suffering persecution within their own country or
who have left their country because of significant
discrimination amounting to gross violation of
human rights); and those who arrive under the
special assistance category (groups determined by
the Minister to be of special concern to Australia
and in real need, but who do not come under the
traditional humanitarian categories. It includes
those internally and externally displaced people
who have close family links with Australia).
Reference: Immigration Update, June Quarter
1998, Department of Immigration and
Multicultural Affairs.
Indigenous population — estimates of the resident
Aboriginal and Torres Strait Islander population.
Estimates are experimental in that the standard
approach to population estimation is not possible
because satisfactory data on births, deaths and
migration are not generally available. Further,
there is significant intercensal volatility in census
counts of the Indigenous population, due in part
to changes in the propensity of persons to
identify as being of Indigenous origin.
Reference: Experimental Estimates of the
Aboriginal and Torres Strait Islander Population
(Cat. no. 3230.0).
Long-term arrivals and departures — Long-term
arrivals comprise overseas visitors who intend to
stay in Australia for one year or more (but not
permanently) and Australian residents returning
from an overseas visit of one year or more.
Long-term departures comprise Australian
residents who intend to stay abroad for one year
or more (but not permanently), and overseas
visitors departing who stayed a year or more.
Reference: Migration, Australia (Cat. no. 3412.0).
4
•
ABS • AUSTRALIAN SOCIAL TRENDS • 4102.0 • 1999
Median age — the age at which half the population
is older and half is younger.
Reference: Population by Age and Sex:
Australian States and Territories
(Cat. no. 3201.0).
Natural increase — the excess of births over
deaths during the year.
Reference: Australian Demographic Statistics
(Cat. no. 3101.0).
Net interstate migration — interstate arrivals
minus interstate departures during the year. Net
interstate migration rate expresses this as a
proportion (per cent) of the population at the
beginning of the year.
Reference: Australian Demographic Statistics
(Cat. no. 3101.0).
Net overseas migration — permanent and
long-term arrivals minus permanent and
long-term departures during the year, plus an
adjustment for the net effect of category jumping.
This net effect may be either positive or negative.
Reference: Australian Demographic Statistics
(Cat. no. 3101.0).
Permanent arrivals and departures — Permanent
arrivals comprise travellers who hold migrant visas
and other persons eligible to settle, and
permanent departures comprise Australian
residents who intend to settle in another country.
Reference: Migration, Australia (Cat. no. 3412.0).
Population — estimated resident population.
Quarterly estimates of the Australian population
are obtained by adding to the estimated
population at the beginning of each period the
components of natural increase (on a usual
residence basis) and net overseas migration. For
the States and Territories, account is also taken of
estimated interstate movements involving a
change of usual residence.
Reference: Australian Demographic Statistics
(Cat. no. 3101.0).
Population growth — increase in the population
during the year, measured as the sum of natural
increase and net overseas migration. For dates
prior to 1996, differences between growth and the
sum of natural increase and net overseas
migration arise from retrospective adjustments to
population estimates (which are made after each
census) to compensate for intercensal
discrepancy. Population growth rate expresses the
increase as a proportion (per cent) of the
population at the beginning of the year.
Reference: Australian Demographic Statistics
(Cat. no. 3101.0).
Population — definitions and references continued
Population projections — ABS population
projections take the base year population for each
sex by single years of age and advance it year by
year by applying assumptions about future
mortality and migration. Assumed age-specific
fertility rates are applied to the female
populations of child-bearing ages to provide the
estimates of new births for each year. The ABS
produces several series of population projections
based on different combinations of assumptions
about mortality, fertility and migration. The
assumptions underlying Series II most closely
reflect prevailing trends and comprise: declining
rates of mortality; the total fertility rate for
Australia falling to 1.75 by 2005–06, and then
remaining constant; low levels of overseas
migration (annual net gain of 70,000 from
1998–99); and medium levels of interstate
migration.
Reference: Projections of the Populations of
Australia, States and Territories, 1997 to 2051
(Cat. no. 3222.0).
Sex ratio — the ratio of males to females multiplied
by 100.
Reference: Australian Demographic Statistics
(Cat. no. 3101.0).
Skilled settler arrivals — the skill stream component
of the migration program is designed to
contribute to Australia's economic growth. Settlers
under this program meet a demand in Australia
for their particular occupational skills, outstanding
talents or business skills.
Reference: Immigration Update, June Quarter
1998, Department of Immigration and
Multicultural Affairs.
Total settler arrivals — comprised largely of those
who arrived under the migration and
humanitarian programs. These programs include
the following categories: the family stream; the
skilled stream; special eligibility migrants;
refugees; special humanitarian and special
assistance migrants. Special eligibility migrants are
those within the migration program, not in the
family and skill stream, and are generally former
Australian citizens, residents, or family of New
Zealand citizens. The remaining settler arrivals are
those who have arrived under non-program
migration. They are New Zealand citizens;
children born to Australian citizens overseas;
residents of Cocos (Keeling) Islands, Norfolk
Island, etc; and persons granted Australian
citizenship overseas.
Reference: Immigration Update, June Quarter
1998, Department of Immigration and
Multicultural Affairs.
ABS • AUSTRALIAN SOCIAL TRENDS • 4102.0 • 1999 •
5
Our ageing population
P O P U L A T I O N
As the youngest of the
baby-boom generation
turns 65 in 2031, the
median age of the
population is projected
to reach 42–43 years,
and the proportion of
the population aged 65
and over is projected to
reach between 21%
and 22%.
P R O J E C T I O N S
Population ageing is a major focus of social
and economic planners and policy makers in
Australia, as it is throughout the more
developed regions of the world. Of particular
concern is the anticipated increase in costs
associated with the care and income support
of a rapidly growing aged population, and
how much Australians will be willing and/or
able to pay. Much of recent government
policy has focused on cost reduction as well
as shifting costs and responsibility from the
public sector to individuals, families,
community groups and private business. For
example, recent reforms to the system of
retirement income support include:
mandatory occupational superannuation for
all workers (Superannuation Guarantee
Charge) introduced in 1992; tightening of the
means test on the age pension; and the
introduction, in July 1995, of a progressive
increase in the pension age for women from
60 to 65 by 2012.
Australia's population has aged steadily
throughout this century, apart from a
temporary reversal due to the post-war baby
boom. During the 25 years after World War II
the median age declined, reaching a low of
27.5 years in 1971 as the first of the baby
boomers began to have children of their own.
Since then it has risen to 34.3 years in 1997
and is projected to reach between 42 and
43 years in 2031 (as the youngest baby
boomers turn 65). The proportion of the
Population projections
This review makes use of the latest series of ABS
population projections (1997 to 2051).1 The base
population for the projections is the estimated
resident population at 30 June 1997. The
projections are estimates of future populations
based on a combination of assumptions about
future levels of births, deaths and migration. As
such, they provide an indication of what could
reasonably happen to Australia's population over
the next 50 years. Population projections are not
predictions or forecasts.
Three main series (high, medium and low
population growth) have been produced which
cover three sets of possible future outcomes. For
the sake of simplicity, most of the analysis in this
review is based on the medium series (Series II).
Series II is based on the following assumptions:
total fertility rate will continue to fall during
the next decade – to 1.75 births per woman
by 2006 – then remain constant at 1.75 until
2051;
age-specific death rates will continue to
decline, resulting in life expectancy at birth
increasing by 5–7 years by 2051; and
net overseas migration of 78,000 in 1998
then 70,000 per year from 1999 to 2051.
population aged 65 years or older
(12% in 1997) is projected to increase to
between 21% and 22% by 2031.
Age composition of the population, estimates and projections(a)
1946
1961
1971
1997
2001
2011
2031
2051
%
%
%
%
%
%
%
%
Under 15
24.5
30.3
28.7
21.2
20.3
18.3
16.5
15.6
15–64
67.6
61.2
63.0
66.7
67.3
67.7
62.2
60.2
8.0
8.5
8.3
12.1
12.4
14.0
21.3
24.2
..
30.3
36.5
30.0
29.0
26.3
18.7
4.5
Proportion aged
65 and over
Baby boom age cohort(b)
Median age
Total population
years
years
years
years
years
years
years
years
30.8
29.3
27.5
34.3
35.5
38.3
42.2
44.1
million
million
million
million
million
million
million
million
10.5
13.1
18.5
19.3
21.0
23.7
24.9
7.5
(a) Data for 2001 to 2051 are projections (Series II).
(b) Australian residents who were born in Australia or overseas during the years 1946 to 1965.
Source: Demography, 1961; Population by Age and Sex, Australian States and Territories, June 1992 to June 1997 (Cat. no. 3201.0); Population Projections,
1997 to 2051 (Cat. no. 3222.0).
6
• ABS • AUSTRALIAN SOCIAL TRENDS • 4102.0 • 1999
POPU LATION PROJECTIONS
Age distribution of the population
'000
1600
1400
1200
1000
800
600
400
200
0
Baby boom
1961
The period from the end of World War II until
around the mid 1960's, has come to be known as
the baby boom in Australia and in several other
countries such as New Zealand, Canada and the
United States. After the war, these were all
relatively prosperous, industrially advanced
countries with rapidly expanding economies,
rising living standards and serious labour
shortages. These countries welcomed high levels
of immigration, and a rapidly growing population
was seen as essential to continued economic
progress.3
Baby
boomers
1
2
3
4
85 and
5 5 year
6 age
7 groups
8 9 up
10to 11
12 85+
13 14 15 16 17 18
2001(a)
'000
1600
1400
1200
1000
800
600
400
200
0
Baby boomers
1
2
3
4
5 year
6 age
7 groups
8 9 up10to 85
11 and
12 85+
13 14 1
16 17 18
2031(a)
'000
1600
1400
1200
1000
800
600
400
200
0
Baby boomers
While the end of the baby boom is not as exactly
defined as the beginning, it is clear that a change
began to take place in the 1960s. With the
introduction of oral contraceptives, changing
perceptions of desired family size, and growing
acceptance of women's participation in paid
employment, birth rates declined. (See Australian
Social Trends 1998, Family Planning pp. 29–32.)
In Australia, the fertility rate peaked in 1961 and
by 1965 had dropped back to just below the 1946
level.4
In this review, baby boomers refers to Australian
residents who were born in Australia or overseas
during the years 1946 to 1965. This group
includes people in the baby-boom age cohort who
immigrated to Australia from countries which did
not experience a post-war baby boom.
nineties.4 Based on assumptions of continued
low fertility, and continued small declines in
mortality, Australia's population is projected
to continue ageing into the next half century.
Baby boomers and ageing
1
2
3
4
85 and
55 year
6 age
7 groups
8 9 up10to 11
12 85+
13 14 15 16 17 18
(a) Projections (Series II).
Source: Demography, 1961; Population Projections, 1997 to 2051 (Cat. no. 3222.0).
Why is the population ageing?
Structural ageing in Australia (i.e. the
declining proportion of the population to be
found in younger age groups and the
consequent increase in the proportion found
in older age groups)2 is mainly due to the
sustained decline in fertility which followed
the post-war baby boom. In 1961, at the
height of the baby boom, the total fertility rate
peaked at 3.6 babies per woman. By the late
1970s, it had fallen to around half that level
and has continued to decline (at a much
slower rate) throughout the eighties and
The baby-boom generation, the result of a
period of high fertility and high levels of
immigration which followed the Second
World War, is significantly larger than
preceding cohorts. Because of this, it has
made, and will continue to make, a large
impact on the absolute size of a range of
population groups of specific policy interest
as it progresses through the age structure. For
example, in 1961, baby boomers formed a
prominent bulge at the younger end of the
age distribution (all children under 15). At the
other end of the spectrum, between 2011 and
2031, baby boomers will make a significant
contribution to the numbers of people aged
65 years and over. During this period, the
population aged 65 and over is projected to
grow from 3 to 5 million. By 2031, all
surviving baby boomers will be 65–84 years of
age. Between 2031 and 2051, baby boomers
are projected to swell the population aged 85
and over from 612,000 to 1.1 million.
ABS • AUSTRALIAN SOCIAL TRENDS • 4102.0 • 1999
•
7
POPULATION PROJECTIONS
Immigration and ageing
Immigration has played an important role in
Australia's population growth and economic
and social development. During the post
World War II period, high levels of
immigration, combined with high fertility,
contributed to a more youthful age structure.
Since immigrants have a younger age profile
than the general population, the initial effect
of any migrant intake is to delay the ageing
process, but this effect is relatively small over
the long term. For example, if net migration
were assumed to be zero (instead of
70,000 per year) from 1999–2051, the median
age of the projected population in 2051
would be 47 years (instead of 44 years).1
Ageing in States and Territories
Population age profiles vary between States
and Territories as a result of past differences
in fertility, mortality and migration trends.
Nevertheless, all of the State and Territory
populations are projected to continue ageing
into the next half century, some more rapidly
than others. Tasmania's population is
projected to age the most rapidly, overtaking
South Australia as the ‘oldest’ State in about
twenty years' time and reaching a median age
of around 51 years by 2051. By 2051, the
proportion of the population aged 65 and
over is projected to reach 32% in Tasmania
and 29% in South Australia, well above the
average of 24% for total Australia. (See
Australian Social Trends 1999, Population —
State summary table, p. 3.)
Population in selected age groups (years)
million
16
Aged 65 and over
Aged 15 to 64
Aged 0 to 14
14
12
10
8
6
4
2
0
1976 1986
1996 2006
2016 2026
2036 2046
1946 1956 1966
1971
1991
2011(a)
2031(a)
2051(a)
At 30 June
(a) Projections (Series II).
Source: Demography, 1961; Population by Age and Sex, Australian States and Territories, June 1992
to June 1997 (Cat. no. 3201.0); Population Projections, 1997 to 2051 (Cat. no. 3222.0).
8
• ABS • AUSTRALIAN SOCIAL TRENDS • 4102.0 • 1999
Supporting a growing aged
population
Australia's changing age structure has
implications both for the level of social
expenditure that might be required in future,
and the level of resources that might be
available to fund it. For example, as the
population aged 65 and over increases in size,
associated social expenditures on income
support, care and health services can be
expected to increase. However, since the
potential labour force (roughly represented
by the population aged 15–64) is projected to
grow at a slower rate after 2011, it may be
more difficult to generate the level of
resources and public support needed to
maintain a large aged population with an
acceptable standard of living and quality of
life. The most rapid change in the relative size
of these two age groups is projected to occur
between 2011 and 2031 as the baby-boom
generation moves out of the labour force and
into retirement. During this period, the
population aged 0–14 is projected to remain
fairly stable so there is unlikely to be a
compensating decline in demand for social
expenditures associated with this group.
In addition to the changing age structure of
the population, there are many other factors,
social and economic, which could also have
an important bearing on future levels of social
expenditure and how it is distributed. For
example, future rates of economic growth,
productivity improvements and taxation levels
will affect the level of resources potentially
available.5 At the same time, the
circumstances of future older generations
(e.g. labour force participation, level of
private income and asset holdings, health
status, availability of family/community
support networks) will influence the level of
resources that will be needed for aged care,
health, housing and income support. On the
other hand, future trends in education,
labour force participation, unemployment
rates and income distribution among the
younger age groups will influence the level
and nature of competing demands (e.g.
university funding, employment programs,
unemployment benefits, support for
low-income families) on available resources.
Changes in social values, attitudes and
government policy will also influence the
level of support provided for older people
(and other groups such as children,
unemployed people and people with
disabilities) as well as the respective roles of
government, private business, community
groups, families and individuals in
providing it.6
POPU LATION PROJECTIONS
Ageing world
Australia's population is relatively old by world
standards and the proportion aged 65 and over is
projected to double between 2001 and 2051 to
around 24%. However, compared to many other
more developed countries, Australia's population is
relatively young and will remain so for some time.
For example, in Italy, Greece and Japan, the
proportion of the population aged 65 and over is
projected by the UN to exceed 30% by 2050. (See
Australian Social Trends 1999, International —
Population projections, page 198.)
Ageing populations are not unique to the more
developed countries, though they currently have
the world's oldest populations. All of the world's
populations are projected to age rapidly during the
first half of next century as mortality and fertility
rates continue to decline.
UN projections indicate that, between 2000 and
2050, the median age could increase by an average
of 7 years in the more developed regions; 11 years
in the less developed regions; and 12 years in the
least developed countries of the world. During the
same period, the proportion of the population aged
65 years and over is projected to almost double in
the more developed countries and almost treble in
the less developed countries of the world.
While the more developed regions are projected to
age less rapidly than the less developed regions,
they will still be significantly older in 2050. The
median age in the more developed regions is
projected to reach about 44 years, on average,
compared to 36 years in the less developed regions,
and 30 years in the least developed countries. The
proportion of the population aged 65 years and
over is projected to reach 25% in the more
developed regions, 14% in the less developed
regions, and 8% in the least developed countries of
the world.
Population projections(a) for world regions
Median age of population
Proportion aged 65 and over
2000
2030
2050
2000
2030
2050
World regions
years
years
years
%
%
%
More developed regions(b)
37.4
43.8
43.9
14.2
21.8
24.7
Less developed regions(c)
24.3
31.5
35.6
5.0
9.4
13.8
Least developed countries(d)
18.3
23.6
30.1
3.0
4.4
7.7
World
26.5
33.0
36.5
6.8
11.2
15.1
(a) Medium-variant projection.
(b) Northern America, Japan, Europe, Australia and New Zealand.
(c) All regions of Africa, Asia (excluding Japan), Latin America and the Caribbean, and Oceania (excluding Australia and
New Zealand).
(d) The 48 least developed countries in the world (of which 33 are in Africa, 9 in Asia, 5 in Oceania, and 1 in Latin
America and the Caribbean).
Source: United Nations World Population Prospects: 1996 revision.
Baby boomers in retirement
It appears likely that many, though not all,
baby boomers will be in a better position than
the current older generation to provide for a
financially secure retirement without relying
on the age pension for most of their income.
This is particularly so for those individuals
and households who have been able to
benefit from the relatively favourable
economic conditions and low unemployment
rates during the seventies and eighties to
accumulate significant assets such as
superannuation, the family home, investment
property, stocks, shares, etc. Higher rates of
labour force participation among women
baby boomers, and the consequent high rates
of two-income families, have put this group in
a better position than previous generations to
accumulate such assets.
However, not all baby boomers have had
these opportunities, and it will take at least 20
years of contributions under the
Superannuation Guarantee Charge
arrangements for these funds to mature into a
significant retirement income for most
employees. Those with lower incomes and/or
discontinuous employment may never be able
to accumulate enough superannuation to
replace the age pension as the primary source
of retirement income.7 It is possible that the
recent trend towards early retirement (see
Australian Social Trends 1994, Early
retirement among men, pp. 126–129) will be
offset to some extent in the future as some
baby boomers choose to extend their working
lives beyond the current expected retirement
ages. Compulsory retirement has been
abolished in all Australian States (except
Tasmania) and Territories.
ABS • AUSTRALIAN SOCIAL TRENDS • 4102.0 • 1999
•
9
POPULATION PROJECTIONS
However, if recent trends in economic
restructuring, technological change and
rapidly changing skill requirements in the
workplace continue, job opportunities for
older people could be limited. (See
Australian Social Trends 1999, Older job
seekers, pp. 114–118.) On the other hand,
large numbers of older people wishing to
update their skills, or to acquire new
qualifications which would enable them to
compete in the labour market for longer,
could have significant implications for the
future education market.
Not only are baby boomers expected to live
longer than the current older generation but
to remain healthier for longer. The period of
life for which older people make the most
intensive use of health care resources, i.e. the
two years preceding death,8 is not expected to
widen significantly in the future. A
combination of better health, higher incomes,
and government policy designed to reduce
costs associated with institutional care of the
aged, could see baby boomers remaining in
their own homes and living relatively
independent lives with the aid of family, paid
help, and community support programs. They
may also have access to a broader range of
supported housing options between fully
independent living and full nursing home
care. (See Australian Social Trends 1999,
Home care, hostels and nursing homes,
pp. 157–161.)
A largely healthy, active older population
could make a valuable contribution, either as
private individuals or through voluntary
organisations, to the care and support of the
very old or infirm (and to the welfare sector
in general). Currently, about 17% of people
aged 65 years and over donate time to
voluntary organisations (see Australian
Social Trends 1997, Voluntary work, pp.
109–112). Older volunteers work more hours,
on average, than their younger counterparts
and are much more likely to be involved in
the welfare and community fields. In addition
to formal volunteer work, older people
provide a range of unpaid services to family,
friends and neighbours. The 1998 Survey of
Disability, Ageing and Carers9 estimated that
people aged 65 and over accounted for 21%
of all people who were the primary providers
of informal care to someone needing help
with self-care, mobility or verbal
communication. The majority of older
primary carers were providing care to another
older person – 75% were caring for their
partner and 10% were caring for a parent.
10
• ABS • AUSTRALIAN SOCIAL TRENDS • 4102.0 • 1999
While much of the current research and
policy on ageing tends to focus on the
potential ‘burden’ to society of a large older
population, the potential economic stimulus
created by a growing demand for services
(e.g. home help, specialised housing, financial
and personal services) has been largely
overlooked.6 Better educated and more
affluent than their parents' generation, baby
boomers are currently a large and influential
market sector and could remain so well into
their retirement years. Also, as the population
ages, it is to be expected that public debate
and government policy on ageing will be
increasingly influenced by the views of older
people.6 By 2031, over a quarter (27%) of all
Australians of voting age (18 years and over)
will be aged 65 or older.
Endnotes
1 Australian Bureau of Statistics 1998, Population
Projections 1997 to 2051, Cat. no. 3222.0, ABS,
Canberra.
2 Jackson, N. 1999, Understanding Population
Ageing, paper presented to Department of
Family and Community Services Seminar,
Canberra.
3 Statistics New Zealand 1995, New Zealand Now:
Baby Boomers, Wellington.
4 Australian Bureau of Statistics 1997, Australian
Demographic Trends, Cat. no. 3102.0, ABS,
Canberra.
5 Clare, R. and Tulpule, A. 1994, Australia's
Ageing Society, Background Paper No. 37, Office
of Economic Planning Advisory Council,
Canberra.
6 Saunders, P. 1996, Dawning of a New Age? The
Extent, Causes and Consequences of Ageing in
Australia, Discussion paper no. 75, Social Policy
Research Centre, Sydney.
7 Rosenman, L. and Warburton J. 1997,
‘Retirement Policy, Retirement Incomes and
Women’ in Ageing and Social Policy in
Australia, Cambridge University Press,
Melbourne.
8 Goss, J. 1994, Population Ageing and Its Impact
on Health Expenditure to 2031, paper
presented to Australian Instititute of Health and
Welfare Seminar, Canberra.
9 Australian Bureau of Statistics 1999,
Disability, Ageing and Carers: Summary of
Findings, 1998, Cat. no. 4430.0, ABS,
Canberra.
Languages spoken in
Australia
P O P U L A T I O N
In 1996, 15% of
Australia's population
spoke a language other
than English at home.
C O M P O S I T I O N
English is regarded as the national
language of Australia.1 In 1996, 85% of the
population spoke only English at home and
less than 1% of the population could not
speak English at all. However, apart from
English and Indigenous languages (see
Australian Social Trends 1999, Indigenous
languages, pp. 16–20), more than 160 other
languages were also spoken in the home.
Although languages other than English, such
as German and Chinese languages, were
spoken in Australia after European
settlement, today's linguistic diversity stems
largely from immigration since 1945. (For
information on the changing sources of
immigrants since 1945, see Australian Social
Trends 1994, Birthplaces of Australia's
settlers, pp. 9–12.)
People whose English language skills are
lacking face practical problems in education,
employment, and access to services. Where
there is a lack of a common language there is
also a need for interpreter and translation
services, and programs of English instruction
in schools and in other educational
institutions. At the same time, many people
from a non-English speaking background
desire to see the use of their home language
continue in Australia, for reasons of cultural
continuity and identity.
Leading five languages other than English spoken at home(a),
by birthplace, 1996
no.
250000
Overseas-born
Australian-born
200000
Data sources
This article is based on data collected in the 1996
Census of Population and Housing, which
included the question 'Does the person speak a
language other than English at home?'. If more
than one language other than English was used at
home, people were asked to record only the one
that was most commonly used.
Definitions
Language shift – the process by which speakers
of a language gradually replace it with another
language. In this article, the extent of shift from
using languages other than English at home to
using only English at home is estimated indirectly,
by calculating the proportion of people born in
particular countries, or with parents born in
particular countries, who said they only spoke
English at home at the 1996 Census. This method
has been used by Clyne and Kipp in a more
detailed examination of Census data.2
Language maintenance – the retention of a
language within a community through people
continuing to speak it and to pass it on to
successive generations.
Main English-speaking countries – United
Kingdom, Ireland, United States of America,
Canada, New Zealand, South Africa and Australia.
First generation Australians – people living in
Australia who were born overseas.
Second generation Australians – Australian-born
people with at least one parent born overseas.
Languages other than English
spoken at home
In 1996, 2.5 million people aged five years or
over (15% of Australia's total population in
that age range) spoke a language other than
English at home. Of these, 74% were people
born overseas (first generation Australians)
and 22% were children of people born
overseas (second generation Australians).
150000
100000
50000
0
Italian
Greek
Cantonese(b)
Arabic
(a) By people aged five years and over.
(b) Excludes people who did not specify which Chinese language they spoke.
Source: Unpublished data, 1996 Census of Population and Housing.
Vietnamese
The most commonly spoken language was
Italian, its 367,300 speakers making up 2.3%
of the Australian population aged five years or
more. Greek (1.6% of Australians), Cantonese
(1.2%), Arabic (1.0%), and Vietnamese (0.8%)
ranked next. These five languages were each
spoken at home by more than 100,000
people. A further 10 languages were each
spoken by more than 40,000 people. In total,
people who spoke one of the 15 most
ABS • AUSTRALIAN SOCIAL TRENDS • 4102.0 • 1999 •
11
POPULATION COMPOSITION
Languages other than English spoken at home(a), Australia,
1996
Language speakers
Number of speakers
Language
'000
Proportion born
in Australia
As a proportion
of the Australian
population
%
%
Italian
367.3
40.7
2.3
Greek
259.0
46.7
1.6
Cantonese(b)
190.1
12.9
1.2
Arabic
162.0
37.8
1.0
Vietnamese
134.0
12.6
0.8
German
96.7
18.9
0.6
Mandarin(b)
87.3
6.4
0.5
Spanish
86.9
17.6
0.5
Macedonian
68.1
34.9
0.4
Tagalog (Filipino)
67.3
5.0
0.4
Croatian
66.7
32.4
0.4
Polish
61.0
16.2
0.4
Maltese
44.7
27.9
0.3
Turkish
42.2
31.3
0.3
Netherlandic
All other
Total
40.2
12.4
0.3
696.8
20.0
4.4
2 470.2
26.0
15.5
(a) Languages with more than 40,000 speakers aged five years and over.
(b) People who specified Cantonese or Mandarin have been separately classified; people who
specified another Chinese language (eg Hokkien) or simply wrote 'Chinese' are included in
'All other'.
Source: Unpublished data, 1996 Census of Population and Housing.
common languages accounted for 72% of
speakers of a language other than English,
and 11% of Australia's population.
The ranking of languages partly reflects the
greater numbers of immigrants who have
arrived from particular countries, and the
number of children they have had in Australia.
However, not all immigrants who speak a
language other than English continue to use it
at home throughout their life; nor do their
children always learn the language or
continue to speak it throughout their lives.
Some languages have been maintained in the
home to a greater extent than have others,
and this contributes to their higher ranking
among languages spoken in Australia.
Language maintenance among the
first generation
Information about first language spoken is
not collected in the Census. Nevertheless, the
extent to which first generation Australians
have maintained particular languages can be
12
• ABS • AUSTRALIAN SOCIAL TRENDS • 4102.0 • 1999
estimated indirectly by combining
information on birthplace with information
on the main language other than English that
people spoke at home.
The proportion of overseas-born people who
spoke only English at home increased with
period of residence in Australia. Of people
born overseas in a country other than one of
the main English-speaking countries, 23% said
that they spoke only English at home. Of
those who had been in Australia for a short
time (5 years or less), 9% spoke only English,
rising steadily to 31% of those who had been
in Australia for 15 years or more.
There were differences among people born in
the major source countries for the 15 most
common languages other than English. The
greatest shift to English was by people from
the Netherlands, 63% of whom spoke only
English at home. The smallest shift to English
was by people from Vietnam (3%).
Differences in average period of residence
would explain some of this, given that only
23% of Vietnamese-born people arrived prior
to 1981 compared to 90% of those born in the
Netherlands. Consistent with these
differences in period of residence, the median
age of the Vietnamese-born was 33 while it
was 53 for those born in the Netherlands.
However, there were also differences in the
rate of shift to English between birthplace
groups where the difference in period of
residence was less dramatic. For example,
around 95% of people born in Italy and
Greece had arrived before 1981, compared to
84% of those born in Germany, and 58% of
those born in Poland. The median age of each
group was between 52 (Germany) and
58 (Italy). Nevertheless, a smaller proportion
of people born in Italy and Greece (15% and
6% respectively) spoke only English at home,
than those born in Germany (49%) or Poland
(20%). This suggests that factors other than
period of residence are also important.
There are many differences between
birthplace groups. For example, there are
broad cultural and socio-economic variations
among countries of origin, and different
circumstances encouraging migration from
particular countries. Migration from different
countries has occurred in various periods,
and the social and economic conditions
immigrant groups have found in Australia
therefore differ. Furthermore, a greater
proportion of some groups had English
language skills before arrival (an early
language survey, in 1983, found that people
whose first language was Maltese or a Chinese
language were most likely to have been taught
English overseas).3
POPULATION COMPOSITION
Shift to English in first and second generation Australians, by selected countries
of origin(a), with related demographic information, 1996
Proportion who spoke
only English at home(b)
All persons – demographic information
Birthplace
(associated language)(a)
First
generation
Median age
Median age of of second
first generation generation
%
%
years
years
%
Netherlands (Netherlandic)
62.9
95.9
53
26
72.7
Germany (German)
48.9
91.1
52
25
83.6
Malta (Maltese)
37.0
82.8
51
23
52.1
Philippines (Tagalog)
25.0
84.2
35
8
69.9
Spain (Spanish)
22.7
63.6
48
18
67.4
Poland (Polish)
20.1
77.6
53
33
55.8
Second
generation
Proportion of
mixed
parentage(c)
Italy (Italian)
14.8
57.4
58
27
40.6
Croatia (Croatian)
13.9
41.7
50
20
37.2
South and
Central America (Spanish)
13.1
36.6
37
10
56.1
Hong Kong (Chinese languages,
especially Cantonese)
8.8
52.7
29
10
55.6
Greece (Greek)
6.4
27.9
54
26
33.2
Turkey (Turkish)
5.9
16.4
36
10
24.2
Lebanon (Arabic)
5.6
21.7
38
12
26.9
China(d) (Chinese languages)
4.8
48.6
40
13
56.6
Taiwan (Chinese languages,
especially Mandarin)
3.4
29.3
23
7
62.9
FYROM (Macedonian)(e)
3.1
14.7
44
17
23.7
Vietnam (Vietnamese)
2.7
10.6
33
7
15.6
23.1
64.9
43
20
45.6
Total (countries other than main
English speaking countries)
(a) Birthplaces most commonly associated with the leading fifteen languages (according to Census data). They are not
necessarily the main language in the birthplace.
(b) Data relate to people aged five years and over. Those whose language was not stated were excluded.
(c) Proportion of the second generation whose parents did not have the same country of birth.
(d) Excludes Hong Kong and Taiwan.
(e) Former Yugoslav Republic of Macedonia.
Source: Unpublished data, 1996 Census of Population and Housing.
One broad area of explanation for differences
in language shift is the theory of 'cultural
distance', which holds that differences in
culture rather than language explain the
differences in shift to English by different
immigrant groups internationally.2 Another
way of viewing this theory is that when
people share many customs, beliefs and
lifestyles with the majority culture, language
barriers are more easily overcome. A further
important factor is the number of people who
speak the language and their settlement
pattern. Larger numbers of speakers, and
their concentration within a city or region, is
thought to reinforce the use of a language
other than the majority language.2
Language maintenance among the
second generation
In contrast to the first generation, the
majority of the second generation spoke only
English at home (67%). Older
second-generation Australians were more
likely to speak only English at home. The
proportion who spoke only English increased
steadily with age from 58% of those aged
5–14 years to 93% of those aged over 84. The
increase with age may be partly accounted for
by living arrangements. Many aged people
may live alone, or with younger third
generation family members who speak only
English, and therefore not have the
opportunity to speak a language other than
ABS • AUSTRALIAN SOCIAL TRENDS • 4102.0 • 1999 •
13
POPULATION COMPOSITION
ageing children of pre-war immigrants. There
were also substantial differences in the extent
of mixed parentage (parents born in different
countries) between second generation
Australians of different background. For
example, the median age of second
generation Australians with one or more
parents born in Vietnam was 7 and only 16%
were children of families in which the parents
were born in different countries. This
contrasted with a median age of 26 for second
generation Australians with one or more
parents born in the Netherlands, and the
much larger proportion (73%) who had
mixed parentage.
English. Conversely, a greater proportion of
second generation young people than any
other age group may live in their parents'
home, communicating with family members
who are more comfortable speaking a
language other than English.
Proportions who spoke only English were
substantially higher if only one parent was
born in a country other than one of the main
English-speaking countries. 91% of those
whose father only, and 89% of those whose
mother only, had been born in a country
other than a main English speaking country,
spoke only English at home. However, when
both parents were born in a non-main English
speaking country, 44% of the Australian-born
generation spoke only English at home.
State differences
The proportion of people who spoke a
language other than English at home ranged
from 3% for Tasmania to 25% for the
Northern Territory. The high proportion for
the Northern Territory reflected the large
number of people who spoke an Indigenous
language. Victoria (21%) and New South
Wales (19%) had the next highest
proportions, reflecting the historically high
levels of immigration to these States,
particularly to Sydney and Melbourne.
As with the first generation, there were large
variations between people from different
countries in the extent of shift to English. In
general, those countries which recorded the
greatest shifts to English in the first
generation also recorded the greatest shifts in
the second. For example, among countries
associated with the 15 leading languages,
people from the Netherlands recorded the
greatest shifts to English in both the first and
second generations (63% and 96%
respectively). People from Vietnam recorded
the smallest shifts (3% and 11% respectively).
The speakers of some languages were more
highly concentrated geographically than
others. In 1996, 71% of people who spoke
Arabic at home and 53% of those who spoke
Cantonese at home lived in New South Wales.
Second generation Australians are a diverse
group. In 1996, they ranged in age from the
young children of recent immigrants to
Languages other than English by State or Territory
Distribution of speakers of leading five languages and Indigenous languages by State or Territory(a)
NSW
Vic.
Qld
SA
WA
Tas.
NT
ACT
Australia
%
%
%
%
%
%
%
%
%
Italian
27.3
42.3
6.9
11.5
10.3
—
—
1.0
100.0
367.3
Greek
34.4
46.2
4.3
10.4
2.2
—
1.0
1.1
100.0
259.0
Cantonese(b)
52.7
26.5
8.0
3.3
7.3
—
—
1.2
100.0
190.1
'000
Arabic
70.8
22.1
2.0
2.1
2.1
—
—
0.6
100.0
162.0
Vietnamese
38.7
36.7
8.0
7.6
6.9
—
—
1.6
100.0
134.0
2.3
0.7
14.5
4.6
18.9
—
58.7
—
100.0
44.2
40.9
32.9
8.5
6.6
7.4
0.6
1.6
1.5
100.0
2 470.2
Indigenous
languages/creoles
All languages
other than English
Speakers of a language other than English as a proportion of the State or Territory populations(a)
All languages
other than English
%
%
%
%
%
%
%
%
%
18.7
20.7
7.1
12.6
11.8
3.4
24.5
14.1
15.5
(a) People aged five years and over who spoke a language other than English in the home.
(b) Excludes people who did not specify which Chinese language they spoke.
Source: Unpublished data, 1996 Census of Population and Housing.
14
• ABS • AUSTRALIAN SOCIAL TRENDS • 4102.0 • 1999
POPULATION COMPOSITION
Proportion of the population(a) who spoke a language other
than English at home, capital cities, 1996
%
30
20
10
0
Sydney Melbourne Brisbane Adelaide
Perth
Hobart
Darwin
Canberra
(a) Aged five years and over.
Source: Unpublished data, 1996 Census of Population and Housing.
Commonly spoken languages which were
concentrated in Victoria were the longer
established languages, Italian (42%) and
Greek (46%).
A greater proportion of people in capital
cities spoke a language other than English at
home than in other areas (21% compared to
5%). This pattern applied in every State and
Territory except the Northern Territory. For
example, in New South Wales 27% of people
in Sydney spoke a language other than
English compared to 5% of people who lived
elsewhere in the State. Melbourne (27%) had
the next highest proportion among capital
cities, and Hobart the lowest (5%). Within
cities, some areas had higher concentrations
than others.4
Recent trends
Out of the 25 leading languages in 1996, most
of those spoken by the longer established
immigrant groups had recorded a decrease,
since 1991, in the number of people who
spoke the language at home. French showed
the largest decrease (17%), followed by
German (16%), Netherlandic (15%), Maltese
(14%) and Hungarian (11%). Factors
contributing to these decreases would include
the death rate among the ageing first
generation, and language shift. In contrast,
most of the largest proportional increases
occurred in languages associated with more
recent immigrants. The greatest increase was
for Mandarin (65%), followed by Serbian
(52%), Korean (50%), Hindi (47%), and
Vietnamese (31%). Some of the less
commonly spoken languages also showed
large proportional increases in number of
speakers. These included Tamil (up 53% to
17,500), Sinhalese (up 53% to 14,700), and
Thai (up 36% to 12,800). On-going
immigration from countries where these
languages are spoken, and the birth of
children to speakers in Australia, would
contribute to these increases.
Comparisons between 1991 and 1996 Census
counts cannot be made for some languages,
because a more detailed language
classification was used in the 1996 Census. In
1996, the leading languages separately
counted for the first time were Samoan
(13,900), Assyrian (11,000), Punjabi (10,100),
the Chinese language Hokkien (9,800) and
Malay (9,700).
Endnotes
1. Lo Bianco, J. 1987, National Policy on
Languages, Commonwealth Department of
Education, AGPS, Canberra, p 71.
2. Clyne, M. and Kipp, S., 'Language maintenance
and language shift in Australia, 1996', People and
Place 1997, vol. 5, no. 4.
3. Australian Bureau of Statistics 1983, Language
Survey, Australia, May 1983 (Preliminary),
Cat. no. 4503.0, ABS, Canberra.
4. Australian Bureau of Statistics 1998, Australia in
Profile 1996, Cat. no. 2032.0, ABS, Canberra.
Major changes, leading languages, 1991 to 1996(a)
Languages with fewer speakers in 1996 than 1991
Number of
speakers
Language
'000
Languages with more speakers in 1996 than 1991
Decrease since
1991
Number of
speakers
'000
Increase
since 1991
%
Language
French
38.0
16.9
Mandarin
87.3
65.2
%
German
96.6
16.1
Serbian
35.4
52.3
49.9
Netherlandic
40.2
15.4
Korean
28.1
Maltese
44.7
14.2
Hindi
31.7
47.1
Hungarian
25.8
11.1
Vietnamese
134.0
31.3
(a) The languages showing the greatest decreases and increases since 1991, of the leading 25 languages in 1996, spoken at
home as the main language other than English by the population aged five years and over.
Source: Unpublished data, 1996 Census of Population and Housing.
ABS • AUSTRALIAN SOCIAL TRENDS • 4102.0 • 1999 •
15
Indigenous languages
P O P U L A T I O N
In 1996, about 48,200
people spoke an
Indigenous language at
home. Most speakers
lived in the more
remote central and
northern regions of
Australia.
C O M P O S I T I O N
At the time of the first European settlement,
more than 500 dialects may have been spoken
by the Indigenous population. These dialects
made up about 250 distinct languages (in
terms of groupings with similar grammar and
vocabulary).1 The subsequent expansion of
Europeans into the continent resulted in the
loss of many languages and dialects as many
speakers died and others shifted to speaking
other Indigenous languages, English or
creoles.
The importance of the maintenance of the
remaining Indigenous languages was affirmed
in Australia's language policy, formulated in
the 1980s.2 This policy recognised the central
importance of Indigenous languages in
conveying traditional knowledge and
expressing the world view of the people who
speak them. Recording languages no longer
in daily use and regaining knowledge of
languages of the past is also a cultural priority
of Indigenous Australians. The Aboriginal and
Torres Strait Islander Commission (ATSIC)
has funded community-initiated programs
aimed at the maintenance, retrieval and
revival of Indigenous languages, and
improving awareness and appreciation of
them in the wider community.3
Indigenous languages and Australian creoles spoken at
home, by number of speakers(a), 1996
Speakers
Indigenous languages and creoles
number
number
%
Individually classified:
50
36 400
75.4
> 3,000 speakers
2
7 400
15.4
2,000 – 2,999 speakers
3
7 000
14.4
7
10 300
21.4
500 –
999 speakers
9
6 700
13.9
250 –
499 speakers
9
3 000
6.3
100 –
249 speakers
9
1 400
2.8
< 100 speakers
Not individually classified(b)
Total
11
551
1.1
n.a.
11 800
24.6
48 200
100.0
(a) Persons who reported Indigenous languages and creoles as the main language other than
English spoken at home.
(b) Indigenous languages and creoles other than the 50 for which separate data were
compiled. People who described their language in general terms only (eg 'Aboriginal
language') are also included here.
Source: Unpublished data, 1996 Census of Population and Housing.
16
All statistics are from the 1996 Census of
Population and Housing unless otherwise
referenced.
Definitions
Indigenous person – are identified in Census data
through answers to the ABS standard question, 'Is
the person of Aboriginal or Torres Strait Islander
origin?'.
Indigenous language – those languages which
were spoken in Australia by the Indigenous
population prior to European settlement.
Languages are classified according to the ABS
Australian Standard Classification of Languages
1997 (Cat. no. 1267.0).
Dialect – a variety of a language, spoken in a
particular area, or by a particular group.
Pidgin – a limited form of language made up of
words from various languages and with simplified
grammar, used in restricted contexts such as trade
transactions between groups of people who do
not share a common language.
Creole – a full language which develops from a
pidgin, because people start to use the pidgin as a
general means of communication, and children
then grow up learning it as their first language.
Australian creoles combine characteristics of
English, Indigenous languages and other
languages.
Numbers of speakers and
languages
Languages
1,000 – 1,999 speakers
Data source
• ABS • AUSTRALIAN SOCIAL TRENDS • 4102.0 • 1999
Languages or dialects can be maintained by
very small groups of people. The small
number of speakers of some Indigenous
languages is not necessarily a result only of
declining use. However, Indigenous people
who speak Indigenous languages now have
increased contact with speakers of other
Indigenous languages, English and creoles.
They are also exposed to English through the
education system and the media. In this
context, the maintenance of Indigenous
languages with small numbers of speakers is
more difficult.
Each census collects information about the
main language other than English spoken in
the home. In 1996, just under 48,200 people
were recorded as speaking an Indigenous
language or Australian creole at home,
(including about 1,300 non-Indigenous
POPULATION COMPOSITION
people). Of the total Indigenous, and the total
Australian populations, 13% and 0.3%
respectively, spoke an Indigenous language or
creole at home.
For practical reasons, separate census counts
were held only for 48 of the more common
Indigenous languages and 2 creoles. About
100 other known Indigenous languages,
believed to be used by only a few people
each, were grouped into residual categories.
Those who spoke languages in these residual
categories, and speakers who did not identify
a specific Indigenous language, together
represented 25% of all speakers of Indigenous
languages and creoles.
The numbers of speakers of the 50 separately
counted languages (representing 75% of all
speakers of an Indigenous language or creole)
ranged from 11 to 3,800 people. Of these,
12 languages had more than 1,000 speakers,
18 had from 100 to 1,000 speakers and 11
had fewer than 100 speakers.
While giving an indication of the number of
people who spoke an Indigenous language at
home, and of the diversity of languages, the
Census did not measure the full knowledge or
use of Indigenous languages, particularly
creoles. Some languages may be much more
widely known, but no longer used at home.
In addition, only the most often used
language other than English spoken at home
could be recorded in the Census, but many
Indigenous speakers are thought to speak
more than one Indigenous language.1
Location of speakers
Most Indigenous people in Australia live in
the more populous eastern and southern
States (see Australian Social Trends 1998,
Growth and distribution of Indigenous
people, pp. 15–17). In contrast, almost all the
speakers of Indigenous languages and creoles
live in the more sparsely populated centre
and north of Australia.
In 1996, more than half (60%) of Indigenous
people who said they spoke an Indigenous
language at home lived in the Northern
Territory, where they made up 65% of the
Indigenous population. In no other State or
Territory did the majority of the Indigenous
Indigenous people who spoke an Indigenous language or creole at home(a),
1996
People
1,200
600
120
(a) By Indigenous Location and showing ATSIC region boundaries (Australian Indigenous Geographical Classification).
For some locations in the north of South Australia, Census data is not available.5
Source: Unpublished data, 1996 Census of Population and Housing.
ABS • AUSTRALIAN SOCIAL TRENDS • 4102.0 • 1999
•
17
POPULATION COMPOSITION
Proportions of Indigenous people who spoke an Indigenous language or
creole(a), 1996
DARWIN
BRISBANE
PERTH
SYDNEY
ADELAIDE
CANBERRA
Per cent
79 or more
30 to less than 79
7 to less than 30
Less than 7
(a) By Indigenous location (Australian Indigenous
5 L
B Classification).
d
I di
ti
Geographical
MELBOURNE
HOBART
Source: Unpublished data, 1996 Census of Population
and Housing.
population speak an Indigenous language.
The 19% of speakers who lived in Western
Australia made up 18% of the Indigenous
population in that State. About 14% lived in
Queensland, making up 7% of Indigenous
people there. The 4% of speakers who were
counted in South Australia made up 11% of
the State's Indigenous population. (This is an
under-estimate for that State, as no census
figures are available for 1996 in some areas
near the border with the Northern Territory.)
The remaining south-eastern States and the
Australian Capital Territory together
accounted for only 3% of Indigenous people
who spoke an Indigenous language at home.
These speakers made up 2% of the
Indigenous population of the Australian
Capital Territory and less than 1% of the
respective Indigenous populations of New
South Wales, Victoria and Tasmania.
Speakers of Indigenous languages tended to
be clustered in locations in the south and far
north of Northern Territory, and the Torres
Strait Islands. Within these areas, the great
18
• ABS • AUSTRALIAN SOCIAL TRENDS • 4102.0 • 1999
majority of the Indigenous population spoke
an Indigenous language (79% or more). In
most other areas, Indigenous language
speakers were outnumbered by Indigenous
people who spoke only English at home.
In most locations where 79% or more of the
Indigenous people spoke an Indigenous
language, these speakers also made up the
majority of the total population. In 79% of
these specific locations, Indigenous language
speakers made up more than three quarters
of the total population. In locations with
lower proportions of language speakers,
non-Indigenous people tended to make up a
larger proportion of the population.
Most commonly spoken languages
Out of the 50 individually classified
languages, there were 10 Indigenous
languages and two creoles which had more
than 1,000 speakers. Most of the 10 major
Indigenous languages were spoken in those
regions in the Northern Territory in which a
POPULATION COMPOSITION
larger proportion of the Indigenous people
spoke an Indigenous language. Four
languages: Dhuwal-Dhuwala, Anindilyakwa,
Murrinh-Patha and Kunwinjku were spoken in
Arnhem land and adjacent areas. Tiwi was
spoken on Bathurst and Melville islands.
Arrernte was spoken in locations in the
vicinity of Alice Springs and, like Anmatyerr
and Alyawarr, in more remote locations in the
arid central region. Warlpiri was spoken in
central western parts of the Northern
Territory while Pitjantjatjara was spoken
across the north-western parts of South
Australia and adjacent areas of Western
Australia and the Northern Territory.
Kriol (one of the two individually classified
creoles) was spoken in locations across the
north of Australia from the border of
Queensland and the Northern Territory to
Derby in Western Australia. Torres Strait
Creole was spoken on the Torres Strait
Islands and also, due to the migration of
Torres Strait Islanders, in centres in
Queensland such as Cooktown, Cairns,
Townsville and Brisbane. In total, creoles
were named by 4,200 people as the language
other than English that they spoke most often
at home. This is most likely a considerable
underestimate of total use, since creoles are
often used as an additional language by
people who speak an Indigenous language.
For example, many people who listed Torres
Strait Island languages such as Kalaw Lagaw
Ya (925 speakers) as the language other than
English they speak most often at home, might
also speak Torres Strait Creole. Creoles also
tend not to be recognised as distinct, bone
fide languages, even by the people who speak
Most commonly spoken Indigenous
languages and creoles(a), 1996
Language
no. of speakers
Indigenous languages
44 000
Arrernte (Aranda)
3 800
Dhuwal-Dhuwala
3 600
Warlpiri
2 700
Pitjantjatjara(b)
2 100
Tiwi
1 800
Alyawarr (Alyawarra)
1 400
Murrinh-Patha
1 400
Kunwinjku (Gunwinggu)
1 400
Anindilyakwa
1 200
Anmatyerr (Anmatyirra)
1 200
Australian creoles
4 200
Kriol
2 200
Torres Strait Creole (Broken)
1 700
Total
48 200
(a) Indigenous languages and creoles reported as the main
language other than English spoken at home.
(b) Data quality problems are thought to have resulted in an
underestimate of speakers of Pitjantjatjara.
Source: 1996 Census of Population and Housing.
them, and may not be recorded for this
reason. Rather, many speakers of creole might
identify themselves as speaking only English
at home. Indeed, language experts estimate
that as many as 15,000 people speak each of
the two major creoles, Kriol and Torres Strait
Creole.1
Indicators of maintenance
Median age of speakers, by number of speakers of
Indigenous languages(a), 1996
The maintenance of languages in everyday
use depends on their being passed on to new
generations of speakers. In 1996, 32% of all
speakers of Indigenous languages were
children under 15 years of age. However, this
proportion largely reflects the youthful age
structure of the Indigenous population. As
might be expected, older people were more
likely to speak an Indigenous language than
younger people. Thus while 12% of all
Indigenous children aged 5–14 spoke an
Indigenous language, the proportion was
about 14% for each 10 year age group aged
between 25 and 44, 15% for those aged 45–54
and 22% among those aged 65 and over.
These proportions and the degree of
difference between young and old Indigenous
people varied between the States and
Territories.
years
30
20
10
0
>3,000
2,000
–2,999
1,000
–1,999
500
–999
250
–499
(a) Creoles not included.
Source: Unpublished data, 1996 Census of Population and Housing.
100
–249
<100
In the Northern Territory, the proportions of
Indigenous people who spoke an Indigenous
language were much higher, and ranged from
ABS • AUSTRALIAN SOCIAL TRENDS • 4102.0 • 1999
•
19
POPULATION COMPOSITION
Proportion of Indigenous people who spoke an Indigenous
language at home(a), by age, selected States, 1996
%
80
NT
WA
QLD
SA
Among the most commonly spoken
languages, the proportion who spoke English
well or very well was highest for people who
spoke Tiwi (94%), followed by Anindilyakwa
(83%). It was lowest for Anmatyerr (41%) and
Kunwinjku (57%). Over three quarters (77%)
of speakers of each of the two creoles said
they spoke English well or very well.
60
40
20
0
5–14
15–24
25–34
35–44
45–54
Age group (years)
55–64
65+
(a) Creoles not included.
Source: Unpublished data, 1996 Census of Population and Housing.
60% of children aged 5–14 to 76% of those
aged 65 and over. Compared to the Northern
Territory, the difference between age groups
was more marked, and increased more
steadily with age, among Indigenous people
in Western Australia and Queensland. In
Western Australia, the proportions ranged
from 14% of children aged 5–14 to 43% of
those aged 65 and over. In Queensland the
proportions ranged from 2.5% of children
aged 5–14 to 13% of those aged 65 and over.
It is not possible to predict the future of
language use, although it might be expected
that those with smaller numbers of speakers
and those whose speakers have older age
profiles are likely to be those at greatest risk
of falling into disuse. The speakers of
Indigenous languages with fewer than
1,000 speakers had higher median ages than
those whose languages were more commonly
spoken.
Familiarity with English
The census question did not measure how
fluently people spoke an Indigenous language
or in what contexts at home they used it.
However, self-rated proficiency in spoken
English, and indications of the use of English
at home, may provide indirect indicators of
language displacement.
Certainly most Indigenous people who spoke
an Indigenous language also spoke English
(95%) and of these, 74% said they spoke
English well or very well. Proficiency in
English is a subjective measure. Some people
20
may consider they speak English well if they
can conduct basic transactions satisfactorily in
English while others might mean they can
converse fluently in English or that they
usually speak English.
• ABS • AUSTRALIAN SOCIAL TRENDS • 4102.0 • 1999
A greater proportion of people who spoke
languages with fewer than 1,000 speakers
rated themselves as speaking English well or
very well (78%) than did those whose
languages were spoken by 1,000 people or
more (63%).
It appears that many people who speak an
Indigenous language at home interact on a
daily basis with people who speak only
English. Of all Indigenous people who spoke
an Indigenous language at home, 27% lived in
a dwelling where at least one person was said
to speak only English.
Non-Indigenous speakers
At the 1996 Census, 1,300 non-Indigenous
people said they spoke an Indigenous
language at home. Non-Indigenous people
may speak Indigenous languages at home
when communicating with Indigenous
people, either other household members or
visitors. In addition to acquiring some ability
in Indigenous languages through everyday
interaction, people working in some
communities take intensive training in an
Indigenous language as part of their work
requirements.
Endnotes
1 Australian Institute of Aboriginal and Torres Strait
Islander Studies, 1994, Encyclopedia of
Aboriginal Australia, Aboriginal Studies Press,
Canberra, pp. 279, 601, 728, 867.
2 Lo Bianco, J. 1987, National Policy on
Languages, Commonwealth Dept. of Education,
AGPS, Canberra, pp. 8–14.
3 Aboriginal and Torres Strait Islander Commission
1998, Annual Report 1997–1998, AGPS,
pp. 77–78.
4 Australian Bureau of Statistics 1998, Australian
Indigenous Geographical Classification, Cat. no.
4706.0.30.001, ABS, Canberra.
Island populations
P O P U L A T I O N
Australia's territorial
boundaries extend to
islands located
hundreds of kilometres
off shore. Over
65,000 people were on
these islands on census
night in 1996.
D I S T R I B U T I O N
Most residents of Australia live either on the
mainland or in Tasmania. However, Australia
also has territorial control over hundreds of
small islands, some of which are also home to
small communities of people. Some of these
islands lie close to the mainland, yet others,
such as the Cocos (Keeling) Islands, lie many
hundreds of kilometres off shore. Some,
generally those in northern seas, are largely
occupied by Indigenous people, yet others
have become tourist destinations. Using
information from the 1996 Census of
Population and Housing, this review provides
a brief demographic and socio-economic
profile of people living on the most
populated islands.
While some information is provided for
islands close to the mainland, the profiles
relate primarily to those islands which are
likely, due to their distance off shore (more
than 5 km), to have greater difficulties
accessing the goods and services that are
more readily obtained in less remote areas of
mainland Australia. As well as distinguishing
between islands with large Indigenous and
non-Indigenous populations, and those with
large numbers of visitors, the statistics
presented in the tables show something of the
lifestyles and economic wellbeing of the usual
residents of the respective island populations,
and how they differ from those for Australia as
a whole. Differences in household per capita
incomes, for example, provide a view of the
living standards of people living on different
islands. Lifestyle differences are also indicated
by some of the large differences in
proportions of households that are family
households and differences in average
household size.
Counts of people on islands, August 1996
Islands –
distance from mainland
Selected characteristics
All of
Australia
Less than More than
5 km
5 km
Visitors (% of total population)(a)
15.2
19.6
5.4
Indigenous people
(% of resident population)(b)
11.6
43.3
2.0
Total population(a)('000)
32.8
32.7
17 892.4
(a) Persons present on census night, 6th August 1996.
(b) Resident population only. Excludes visitors.
Source: Unpublished data from 1996 Census of Population and Housing; Norfolk Island
Census of Population and Housing, Statistical Report, 1996 .
Identifying islands
In this review, islands are defined as those land
masses belonging to Australia other than the
Australian mainland and the island of Tasmania.
Neither the number of islands with one or more
residents, nor the total number of people living
on these islands, can be precisely determined.
The national Census of Population and Housing,
last conducted in August 1996, provides the most
comprehensive source of information about
Australia's people, and at its lowest level of
geographic detail presents information for those
living in small areas known as census collection
districts (CDs) – commonly areas of 200 or so
households. The availability of separate counts of
people living on some islands depends on
whether the island is close to the mainland and
large enough to make up at least one CD on its
own.
Some of the available Census data relates to
groups of islands. The islands that have been
named to represent the groups are generally the
only ones populated or, where there are large
numbers of islands within the group, those in the
group that are the most populated.
Visitors and residents
The Census counted visitors to private dwellings
on census night, as well as those staying in
camping grounds, hotels, and other non-private
dwellings. Visitor numbers do not necessarily
represent the total number of visitors (or tourists)
to an island as they may include some island
residents staying with another island household
on census night. In this review, islands where the
proportion of visitors was more than three times
the national average (5.4%) are identified as those
with large visitor (or tourist) populations.
Demographic characteristics for each island are
given only for the island's usual residents. Most
(11) of the 15 islands profiled include a number of
CDs and form larger areas known as Statistical
Local Areas. Resident population counts for these
islands include persons temporarily absent from
their usual place of residence. For the remaining
islands, resident population counts relate only to
people counted at home on census night. The
effect of these differences is considered to be
small.
Island populations
The 1996 Census counted 65,481 people on
islands around Australia, representing less
than 1% of Australia's total population. Of the
people counted on islands, one half (32,715)
were on islands more than 5 km from the
mainland. Many of the people (6,421) on
these more distant islands were visitors.
ABS • AUSTRALIAN SOCIAL TRENDS • 4102.0 • 1999
•
21
POPULATION DISTRIBUTION
Demographic profiles: Largest island communities located more than 5 km from the mainland, 1996
Location
Distance
from
mainland
Islands with
Persons
Nearest
State/
Territory
km
Age(a)
Total
persons(b)
Proportion
who were
visitors(b)
Sex ratio(a)
Proportion
who were
Indigenous(a)
0–14
years
65 years Median
and over age
Males to
100
females
%
years
no.
22
103
no.
%
%
%
6 708
12.6
84.4
38.5
Primarily Indigenous communities
Torres Strait Islands(c)
16
Qld
4.7
Mornington Island
28
Qld
1 114
6.7
89.2
30.1
3.3
25
99
Palm Island(c)
25
Qld
2 073
4.2
97.2
38.0
1.7
21
107
Groote Eylandt
40
NT
2 551
6.4
58.5
32.7
1.1
25
107
Bathurst and Melville Islands
24
NT
2 033
3.8
93.8
31.4
2.1
23
102
Christmas Island
1 540
WA
1 906
7.1
0.2
33.0
1.4
29
113
Cocos (Keeling) Islands
2 110
WA
655
13.6
2.9
30.1
4.9
32
102
Kangaroo Island
13
SA
4 118
10.3
0.8
23.5
12.8
37
106
King Island
85
Tas.
1 797
4.4
1.8
24.4
11.2
34
112
Flinders Island
53
Tas.
924
7.7
16.9
22.7
12.3
38
111
Primarily non-Indigenous
communities, mostly usual residents
Primarily non-Indigenous
communities, with many visitors
The Whitsundays(c)(d)
10
Qld
4 547
59.5
0.0
13.2
5.3
36
104
Moreton Island
15
Qld
455
71.9
0.7
5.3
8.8
36
166
97
Norfolk Island
1 600
NSW
2 181
18.8
n.a.
20.4
13.6
39
Lord Howe Island
570
NSW
369
27.6
0.3
19.8
11.8
35
97
Rottnest Island(c)
18
WA
412
58.5
0.0
16.5
0.0
27
110
..
..
17 892 423
5.4
2.0
21.6
12.1
34
98
Total Australia
(a) Resident population only. Excludes visitors.
(b) Persons present on census night, 6th August 1996.
(c) Except for total persons and the proportion who were visitors the figures only relate to the resident population in occupied private dwellings.
(d) Includes the Lindeman, Sir James Smith, and Cumberland groups.
Source: Unpublished data from 1996 Census of Population and Housing; Norfolk Island Census of Population and Housing, Statistical Report, 1996 .
Islands with large Indigenous
communities
Islands largely occupied by Indigenous
people are all located in the northern parts of
Australia, off the coast of Queensland and the
Northern Territory.
The most populated set of islands (with some
6,700 people on census night in August 1996)
is the Torres Strait Islands located between
the tip of Cape York and Papua New Guinea.
Of the hundred-plus islands in the group,
17 have communities on them. However, a
sizeable proportion (37%) of the population
were counted on Thursday Island, the
commercial centre of the region. Most (84%)
of the resident population on the islands
were Indigenous people, generally of Torres
Strait Islander origin. Like other islands with
large Indigenous communities, the age profile
of the population is young: 39% were under
22
• ABS • AUSTRALIAN SOCIAL TRENDS • 4102.0 • 1999
15 years of age compared to 22% for Australia
as a whole, and most people lived in family
households with relatively large numbers of
people. Living standards on the islands,
measured in terms of household per capita
income, were also well below those for
Australia's population as a whole
($186 per week compared to $310). The
Torres Strait Islands community has
maintained many aspects of its cultural
heritage.1 Only 32% of all residents of the
islands spoke English in the home – the
majority spoke creoles or traditional
languages (see Australian Social Trends
1999, Indigenous languages, pp. 16–20).
Mornington Island, to the south-west of the
Torres Strait Islands, is located among the
Wellesley Islands (a group of 22 islands, in
the south-east corner of the Gulf of
Carpentaria). The Mornington Island
community lives together in a settlement,
POPULATION DISTRIBUTION
Social characteristics: Largest island communities located more than 5 km from the mainland(a), 1996
Labour force status(b)
Language
Participation Unemployment
rate
rate(c)
Proportion
who spoke
English(d)
%
%
%
Households(e)
Total
no.
Household type(e)
Household
income
per capita
Average
size
Family
Lone
person
Group
$ / week
persons
%
%
%
Primarily Indigenous communities
Torres Strait Islands(e)
61.4
8.6
31.6
1 355
186
4.2
82.2
15.1
2.7
Mornington Island
57.6
2.1
92.1
201
144
5.2
86.6
11.9
1.5
Palm Island(e)
58.8
4.6
97.0
336
127
5.8
85.1
10.7
4.2
Groote Eylandt
50.3
3.5
43.8
474
311
4.7
89.7
9.9
0.4
Bathurst and Melville Islands
56.2
16.0
13.3
401
137
4.9
88.3
9.5
2.2
Primarily non-Indigenous
communities, mostly usual residents
Christmas Island
79.4
7.3
37.5
625
365
2.9
69.3
27.4
3.4
Cocos (Keeling) Islands
51.8
9.3
24.0
143
229
4.0
91.6
8.4
0.0
Kangaroo Island
63.6
14.0
98.6
1 464
230
2.6
75.0
22.8
2.2
King Island
70.4
4.1
97.0
Flinders Island
65.4
8.1
98.4
The Whitsundays(e)(f)
81.2
6.3
91.4
Moreton Island
74.5
3.7
Norfolk Island
n.a.
n.a.
Lord Howe Island
75.6
Rottnest Island(e)
92.5
61.9
684
263
2.6
73.0
23.2
3.8
261
2.4
66.4
32.5
1.2
170
460
2.3
71.2
18.8
10.0
98.7
47
267
1.5
40.4
55.3
4.3
n.a.
944
n.a.
2.2
n.a.
n.a.
n.a.
4.8
96.1
114
330
2.4
71.1
24.6
4.4
0.7
96.0
95
387
1.8
35.8
57.9
6.3
9.2
84.8
6 281 817
310
2.7
73.0
22.8
4.2
345
Primarily non-Indigenous
communities, with many visitors
Total Australia
(a) Resident population only. Excludes visitors.
(b) Persons aged 15 years and over.
(c) Unemployment rates on islands with large Indigenous communities do not provide a full picture of employment activity because many Indigenous people classified
as being employed work in specialised 'work for the dole' schemes, formally known as Community Development Employment Programs (CDEP).
(d) In the home.
(e) Resident population in occupied private dwellings only.
(f) Includes the Lindeman, Sir James Smith, and Cumberland groups.
Source: Unpublished data from 1996 Census of Population and Housing; Norfolk Island Census of Population and Housing, Statistical Report, 1996 .
called Gununa, founded by Presbyterian
missionaries in 1914, who drew together
Indigenous people from the surrounding
islands and the mainland.2 Unlike those on
the Torres Strait Islands, most people speak
English at home, although the traditional
languages of the Lardil people, and other
tribal groups from surrounding areas
continue to be spoken.2
On Groote Eylandt, located on the western
side of the Gulf of Carpentaria 40 km from
the Northern Territory coast, well over half
(59%) of the residents were Indigenous
people. There are two main Aboriginal
communities on the island, Angurugu and
Umbakumba, while most non-Indigenous
people live in Alyangula, a town built around
the mining industry.3 Household income per
capita in 1996 for Indigenous households
($107 per week) was low, and well below the
average for Australia's total population ($310)
and for non-Indigenous residents ($562) on
the island.
Bathurst and Melville Islands to the north of
Darwin, and some small surrounding islands,
form the homelands of the Tiwi people. Many
of these people live in the town of Nguiu, first
established as a mission in 1911.4 Tiwi is the
most commonly spoken language on the
islands; only a small proportion of residents
(13%) spoke English in the home.
Palm Island, some 25 km off the Queensland
coast, was mostly settled in the early 1900s
when Indigenous people were moved there
from the mainland.5 Nearly all (97%) of the
ABS • AUSTRALIAN SOCIAL TRENDS • 4102.0 • 1999
•
23
POPULATION DISTRIBUTION
there. In 1996, 45% of the usual residents
spoke a Chinese dialect, 38% spoke English,
and 12% spoke Malay.
Islands close to the mainland
There are many populated islands located within
5 km of the mainland (the most populated are
given in the table below). While the distance to
the closest port of call may in some cases be
more than 5 km, some, such as Bribie and Phillip
islands, are connected to the mainland by road.
With some exceptions, islands within 5 km of
the mainland typically have fewer visitors and
fewer Indigenous people than those on more
distant islands (see table on page 21).
Islands within 5 km of mainland,
with the largest populations, 1996
Nearest
State/
Territory
Total
persons(a)
Qld
12 946
Island
Bribie Island
no.
Phillip Island
Vic.
5 707
Magnetic Island
Qld
3 027
Russell–Macleay Islands Qld
2 939
North Stradbroke Island
Qld
2 435
Fraser Island
Qld
1 378
Galiwinku
NT
1 285
Milingimbi
NT
941
Bruny Island
Tas.
581
(a) Total number of persons present on census night,
6th August 1996.
Source: Unpublished data, 1996 Census of Population
and Housing.
1,986 residents, visitors excluded, counted at
the census were Indigenous people. The
small number of non-Indigenous people
living on the island were government workers
providing health and educational services.5
The island community is relatively poor,
recording the lowest per capita household
incomes of all the islands for which
information has been provided.
Islands with large non-Indigenous
populations
Communities on both the Christmas and
Cocos (Keeling) Islands are among Australia's
most remote and isolated. Christmas Island is
closer to Singapore and Indonesia, being
360 km south of Jakarta, than it is to the West
Australian coast (1,540 km off shore). Its
multicultural population of close to 1,800
usual residents (at the time of the census) is
reflected in the mix of languages spoken
24
• ABS • AUSTRALIAN SOCIAL TRENDS • 4102.0 • 1999
The main industries on Christmas Island are
phosphate mining and tourism.6 The
over-representation of men (113 males per
100 females) on the island, and above average
labour force participation rate, are likely to be
associated with the presence of skilled
workers (from other places), employed to
bring the island's infrastructure up to
mainland standards.6
The Cocos (Keeling) Islands are even more
remote, located some 2,110 km off the West
Australian coast and 900 km west of
Christmas Island. This group of 27 small
islands had a population of 655 people on
census night in 1996. Only two islands in the
group are populated, Home Island and West
Island. The majority of the permanent
population, mostly of Islander decent and of
Muslim faith, live on Home Island.7 West
Island is the main economic centre where
government employees on temporary
contracts live and work in administration of
the island or the quarantine service.6 Only
24% of its resident population spoke English
in 1996 – the rest spoke Malay.
Kangaroo Island is Australia's third largest
island, in area, after Tasmania and Melville
Island. It is 13 km off the South Australian
coast and connected by ferry. On census
night, there were 4,118 people on Kangaroo
Island, of whom 10% were visitors. The island
is well known for its wildlife and conservation
and national parks. As well as its tourist
industry, the island has both farming and
fishing industries.
King Island lies in Bass Strait, almost
equidistant from Victoria and Tasmania. It
had a population of 1,797 people on census
night, with an over-representation of men
(112 men to every 100 women) among its
resident population. King Island is best
known for its beef production, seafood and
dairy products. Besides these food producing
industries, it attracts tourists and has a
relatively new kelp industry.
Flinders Island is also in Bass Strait, 53 km
north-east of Tasmania, and is by far the most
populated of the 52 islands in the Furneaux
Group with which it is associated. It has a
tourist industry as the island is well known
for its beaches, wildlife and history of
Aboriginal settlement. In 1996, 17% of the
resident population were Indigenous people.
POPULATION DISTRIBUTION
Islands with large visitor numbers
The Whitsundays including islands in the
Lindeman, Sir James Smith, and Cumberland
groups, are a group of over 70 islands
clustered on Queensland's Great Barrier Reef,
mostly between 10 and 20 km off shore,
generally east/south-east from the town of
Proserpine. Many are national parks and
others, for example Hamilton, Hayman,
Daydream and Lindeman islands, have large
tourist resorts. Of the 4,547 people counted
on these islands on census night, 60% were
visitors. The labour force participation rate
among the resident community was high
(81% of residents aged 15 years and over
were in the labour force compared to 62% for
Australia as a whole).
Moreton Island is a sand island in Moreton
Bay, 15 km off the Queensland coast east of
Brisbane. The island is popular for its
nature-based recreation (e.g. camping, bush
walking, four-wheel drive expeditions), and
72% of people on the island on census night
in 1996 were visitors. The small resident
population of 128 people on census night
was mostly male (166 males to every 100
females). In common with Rottnest Island
near Perth, many residents who live there are
single people.
Two islands to the east of New South Wales,
Norfolk Island and Lord Howe Island, are
known to mainlanders as tourist destinations,
but are also home to long-established
communities. As well as being known for its
scenic beauty, Norfolk Island, 1,600 km
north-east of Sydney, attracts visitors because
of its history as a convict settlement. After the
establishment of the penal colony, it was
settled by Pitcairn Islanders from Polynesia,
some of whom were descendants from the
mutineers of HMS Bounty.7 Of the 2,181
people present on census night, 19% were
visitors. The island has a unique policy of
self-government, with relative independence
and some powers normally reserved for the
Commonwealth government.7 It conducted its
own census (also on 6 August 1996, but
independent of the national census), thereby
limiting the amount of comparable
information provided in the summary tables.
Lord Howe Island is a small island located
570 km east of the mid-north coast of New
South Wales, and is recorded as having the
southern-most coral reef in the world.8 It had
a population count of 369 people on census
night, 28% of whom (102 people) were
visitors. While many of the residents work to
support the tourist industry, Kentia palms are
also grown for export.
Australians on Antarctica
Australia has had responsibility for part of
Antarctica, called the Australian Antarctic
Territory, since 1933. Australia began its scientific
research in Antarctica in 1954, which continues at
the territory's three scientific stations – Mawson,
Davis and Casey. The remaining parts of Antarctica
are administered by other countries, e.g. France
and New Zealand.9
On census night, 6th August 1996, there were 61
men and 9 women in the Australian Antarctica
Territory. These people were undertaking
research on global climate change, marine biology
and Antarctica's natural resources, or providing
associated support services.
Known for its wildlife (mainly quokkas) and
nature reserves, Rottnest Island, 18 km from
Perth, is a popular destination for large
numbers of daytime and overnight-stay
visitors. Many of the people among the small
resident population (171 people on census
night) work on the island in support of the
tourist industry and often do so for limited
periods of time.
Endnotes
1 Ban P. 1993, 'Torres Strait Islanders and the
Torres Strait' Family Matters No.35, August
1993, Australian Institute of Family Studies.
2 Memmott P. and Horsman R. 1991, A Changing
Culture. The Lardil Aborigines of Mornington
Island, Social Science Press, NSW.
3 Cole, K. 1992, Groote Eylandt, Keith Cole
Publications, Victoria.
4 Stanley, O. 1983, An Aboriginal Economy:
Nguiu, Northern Territory, ANU North Australia
Research Unit Monograph, Darwin 1983.
5 Barber et al. 1988, 'Alcohol and Power on Palm
Island', Australian Journal of Social Issues,
Vol.23, No.2, May 1998.
6 Australian Bureau of Statistics 1995, Spending
and income: Christmas Island and the Cocos
(Keeling) Islands, Cat. no. 6552.9, ABS, Canberra.
7 Commonwealth Grants Commission 1997, Report
on Norfolk Island, Australian Government
Publishing Service, Canberra.
8 The Australian Encyclopaedia, 5th edition 1988,
Australian Geographic for the Australian
Geographic Society, Terrey Hills, NSW.
9 Camm, J. & McQuilton (eds) 1987, Australians:
A Historical Atlas, AGPS, Canberra.
ABS • AUSTRALIAN SOCIAL TRENDS • 4102.0 • 1999
•
25
Family
Page
National and State summary tables . . . . . . . . . . . . . . . . . . . . . . . . . . . 28
FAMILY FUNCTIONING
Spending time alone
.................................................
35
This article uses 1997 Time Use Survey data to report on how much time
people in different age groups spend alone. By looking at those who
spend a large proportion of their time alone and who also feel they have
too much spare time, groups who are more likely to be at risk of social
isolation are identified.
Looking after the children
.........................................
39
Again using data from the 1997 Time Use Survey, this review reports on
the time parents spend with their children, the types of childcare activities
they undertake, and how the patterns differ for mothers and fathers. It
also shows how these depend on factors such as the age of the youngest
child, the number of children in the family, and parents' work
commitments.
LIVING ARRANGEMENTS
Caring for children after parents separate
.................
42
A key objective of family law and government social policy in Australia is
to ensure the ongoing care and wellbeing of children after their parents
separate. Current living arrangements, contact with the natural parent
living elsewhere, and child support for these children are described in this
article.
FAMILY FORMATION
Remarriage trends of divorced people
.......................
45
In 1997, almost one third of registered marriages celebrated in Australia
involved at least one previously divorced partner. This is a consequence of
the increase in divorces over the past few decades, which has resulted in
more divorced people in the population. This review examines the growth
in remarriages of divorced people and reports on the age relationships of
remarrying brides and bridegrooms.
ABS • AUSTRALIAN SOCIAL TRENDS • 4102.0 • 1999 •
27
Family — national summary
LIVING ARRANGEMENTS
Units
1988
1989
1990
1991
1992
1993
1994
1995
1996
1997
1998
Total households
'000
n.a.
n.a.
n.a.
6 173
6 302
6 446
6 579
6 690
6 762
6 956
7 056
Lone-person households
Households with
three or more persons
Total families
%
n.a.
n.a.
n.a.
21.1
21.8
22.3
22.7
22.8
23.0
23.8
23.8
n.a.
n.a.
n.a.
47.0
46.3
45.5
44.8
44.5
44.5
43.6
43.2
'000
4 236
4 319
4 456
4 502
4 587
4 638
4 709
4 791
4 834
4 899
5 027
Families with children under 15
'000
1 962
1 947
1 999
2 002
2 048
2 038
2 041
2 100
2 092
2 130
2 160
Couple families
'000
3 660
3 729
3 812
3 849
3 883
3 929
3 998
4 051
4 080
4 090
4 158
%
n.a.
n.a.
n.a.
8.2
n.a.
n.a.
n.a.
n.a.
10.1
n.a.
n.a.
%
47.2
48.2
48.2
48.9
48.7
49.3
51.0
51.1
51.9
51.1
51.8
%
n.a.
n.a.
22.5
22.0
22.1
22.3
22.7
21.6
21.3
20.9
21.3
%
85.6
86.0
85.2
84.0
83.5
83.0
82.8
81.5
81.6
80.0
78.4
%
n.a.
1.4
1.6
1.8
1.5
1.7
1.8
1.9
2.0
2.3
2.0
%
n.a.
12.6
13.2
14.2
14.9
15.3
15.4
16.6
16.3
17.7
19.5
%
47.9
47.4
46.8
47.4
47.4
47.8
47.8
47.4
47.8
47.8
46.2
no.
3.2
3.2
3.2
3.2
3.2
3.2
3.1
3.1
3.1
3.1
3.1
%
n.a.
n.a.
12.7
13.6
14.4
14.8
15.3
16.4
16.3
18.0
19.5
%
43.3
44.7
46.8
47.2
47.4
46.1
44.7
45.2
44.5
46.2
48.0
%
8.5
8.5
9.5
10.7
10.5
10.7
10.5
10.6
10.7
11.5
12.4
%
6.0
5.9
5.7
6.0
6.3
6.8
7.0
7.4
7.6
7.9
8.1
%
29.6
28.6
29.0
29.4
29.3
31.0
29.4
29.3
29.8
30.7
29.0
Units
1988
1989
1990
1991
1992
1993
1994
1995
1996
1997
1998
%
50.4
52.6
54.7
51.8
51.7
50.6
51.1
56.2
54.5
54.4
55.6
%
7.1
6.9
6.3
8.1
9.8
10.8
10.0
8.4
7.9
8.6
8.5
%
n.a.
46.1
44.2
43.2
40.6
41.4
41.8
43.2
42.7
42.9
42.1
%
n.a.
n.a.
n.a.
n.a.
n.a.
18.8
18.5
17.1
17.2
18.1
19.7
De facto couple families
(of all couple families)(a)
Couple-only families
(of all couple families)
Couple-only families with female
partner aged under 40
(of all couple only families)
Couple families with children
under 15 (of all families with
children under 15)
Lone father families with children
under 15 (of all families with
children under 15)
Lone mother families with children
under 15 (of all families with
children under 15)
Families with at least one child aged
under 5 (of all families
with children under 15)
Average family size (persons)
Children under 15 living in
one-parent families
(of all children under 15)
Persons aged 20–24
living with parents
(of all persons aged 20–24)
Persons aged 25–34
living with parents
(of all persons aged 25–34)
Persons aged 15–64
who live alone
(of all persons aged 15–64)
Persons aged 65 and over
who live alone
(of all persons aged 65 and over)
FAMILIES AND WORK
Couple families with children under
15, both parents employed
(of all couple families
with children under 15)
Couple families with children under
15, neither parent employed
(of all couple families
with children under 15)
One-parent families with children
under 15, parent employed
(of all one-parent families
with children under 15)
Children under 15 living in families
where no parent is employed
(of all children under 15)
%
(a) Includes same-sex couples in 1996.
Reference periods:
28
Data on family formation are for the calendar year. Data on de facto couples are at census date. Data on
other living arrangements, families, and work are at June.
• ABS • AUSTRALIAN SOCIAL TRENDS • 4102.0 • 1999
Family — national summary
continued
Units
1987
1988
1989
1990
1991
1992
1993
1994
1995
1996
1997
'000
114.1
116.8
117.2
117.0
113.9
114.8
113.3
111.2
109.4
106.1
106.7
no.
7.0
7.1
7.0
6.9
6.6
6.6
6.4
6.2
6.1
5.8
5.8
%
67.2
67.1
67.3
67.4
67.5
67.2
67.1
67.5
67.5
66.4
66.6
years
25.9
26.1
26.3
26.5
26.7
26.9
27.0
27.2
27.3
27.6
27.8
years
23.8
24.0
24.2
24.3
24.5
24.7
24.8
25.1
25.3
25.7
25.9
years
38.6
38.9
39.3
39.6
39.7
40.1
40.4
40.9
41.1
41.6
41.8
years
35.1
35.3
35.6
36.0
36.1
36.5
36.8
37.4
37.6
38.0
38.2
'000
39.7
41.0
41.4
42.6
45.6
45.7
48.4
48.3
49.7
52.5
51.3
no.
2.4
2.5
2.5
2.5
2.6
2.6
2.7
2.7
2.8
2.9
2.8
years
7.3
7.3
7.3
7.3
7.4
7.4
7.6
7.7
7.6
7.6
7.7
%
58.6
57.5
55.3
55.6
54.2
52.9
52.6
52.4
n.a.
53.6
54.0
'000
44.1
44.4
43.3
44.9
46.7
45.7
48.1
47.5
n.a.
52.5
51.7
Fertility
Births
'000
244.0
246.2
250.9
262.6
264.2
260.2
258.1
256.2
253.8
251.8
251.8
Total fertility rate (per woman)
no.
1.85
1.84
1.84
1.91
1.86
1.89
1.86
1.85
1.83
1.80
1.78
%
5.7
5.7
5.7
5.8
5.7
5.4
5.1
5.0
4.9
4.9
4.9
%
8.5
9.0
9.6
10.0
10.7
11.4
11.9
12.9
13.7
14.6
15.3
%
18.0
19.0
20.2
21.9
23.0
24.0
24.9
25.6
26.6
27.4
28.1
%
73.0
74.4
75.9
77.1
79.5
81.0
81.7
82.2
83.3
84.2
85.5
%
n.a.
n.a.
n.a.
n.a.
12.7
19.9
19.8
20.8
20.8
21.2
n.a.
years
n.a.
n.a.
n.a.
n.a.
26.3
26.5
26.6
26.8
26.9
27.1
n.a.
1988
1989
1990
1991
1992
1993
1994
1995
1996
1997
1998
%
n.a.
n.a.
14.0
n.a.
n.a.
17.0
n.a.
n.a.
21.6
n.a.
n.a.
%
n.a.
n.a.
44.8
n.a.
n.a.
40.4
n.a.
n.a.
39.3
n.a.
n.a.
FAMILY FORMATION
Registered marriages
Number of marriages
Crude marriage rate
(per 1,000 population)
Marriages where both partners
married for the first time
(of all marriages)
Median age of men
at first marriage
Median age of women
at first marriage
Median age at remarriage
(divorced men)
Median age at remarriage
(divorced women)
Divorce
Number of divorces
Crude divorce rate
(per 1,000 population)
Median duration between
marriage and separation
Divorces involving children under 18
(of all divorces)
Children under 18 affected by divorce
Births to mothers aged under 20
(of all births)
Births to mothers aged 35
and over (of all births)
Births outside marriage
(of all births)
Births outside marriage
acknowledged by father
(of all births outside marriage)
Women aged 35 and over giving birth
for the first time (of all births to
women 35 and over)
Median age of mothers at first birth
CHILD CARE
Children aged under 3 using formal
care (of all children under 3)
Children aged under 3 using informal
care (of all children under 3)
Reference periods:
Units
Data on family formation are for the calendar year. Data on child care are at November 1990, June 1993
and March 1996.
ABS • AUSTRALIAN SOCIAL TRENDS • 4102.0 • 1999 •
29
Family — State summary
LIVING ARRANGEMENTS
Units
Years
NSW
Vic.
Qld
Total households
'000
1998
2 338
1 735
1 315
606
694
186
Lone-person households
Households with
three or more persons
Total families
%
1998
22.6
23.4
23.9
28.1
24.2
26.1
%
1998
44.9
44.1
42.8
37.1
41.7
38.9
50.2
42.0
43.2
'000
1998
1 720
1 249
928
411
481
131
33
75
5 027
Families with children under 15
'000
1998
737
526
403
171
216
57
17
33
2 160
Couple families
'000
1998
1 409
1 040
764
342
401
110
28
62
4 158
%
1996
9.4
8.4
11.9
9.8
12.0
11.1
19.6
11.3
10.1
%
1998
52.3
50.7
51.9
54.4
51.7
54.3
42.9
47.0
51.8
%
1998
19.4
23.2
21.5
19.2
23.3
17.4
37.4
28.9
21.3
%
1998
78.0
79.3
78.1
76.7
79.5
77.0
83.8
80.9
78.4
%
1998
1.7
2.4
1.9
2.0
2.0
2.4
**
3.5
2.0
%
1998
20.3
18.2
20.0
21.4
18.5
20.6
15.2
15.6
19.5
%
1998
46.9
46.2
47.5
45.4
42.5
43.4
54.2
43.0
46.2
no.
1998
3.1
3.1
3.1
3.0
3.1
3.0
3.3
3.1
3.1
%
1998
20.4
18.8
19.4
20.8
18.4
19.3
12.9
17.0
19.5
%
1998
52.5
55.0
36.8
45.6
42.5
44.3
31.2
39.4
48.0
%
1998
14.4
14.1
9.9
10.9
9.1
9.7
*3.5
7.2
12.4
%
1998
7.0
7.8
8.6
10.6
8.7
8.9
*8.7
9.6
8.1
%
1998
28.2
28.3
29.1
31.7
29.2
33.7
*14.1
33.5
29.0
Units
Years
NSW
Vic.
Qld
SA
WA
Tas.
NT(a)
ACT
Aust.
%
1998
54.6
55.8
57.0
53.6
55.5
51.9
67.0
71.3
55.6
%
1998
8.7
7.9
9.6
9.1
6.7
12.1
*6.3
3.3
8.5
%
1998
39.2
44.9
42.8
35.5
45.7
48.5
46.0
63.8
42.1
%
1998
21.0
18.4
20.4
22.4
16.4
21.6
14.6
8.9
19.7
De facto couple families
(of all couple families)(b)
Couple-only families
(of all couple families)
Couple-only families with female
partner aged under 40
(of all couple only families)
Couple families with children
under 15 (of all families
with children under 15)
Lone-father families with children
under 15 (of all families
with children under 15)
Lone-mother families with children
under 15 (of all families
with children under 15)
Families with at least one child aged
under 5 (of all families
with children under 15)
Average family size (persons)
Children under 15 living in
one-parent families
(of all children under 15)
Persons aged 20–24
living with parents
(of all persons aged 20–24)
Persons aged 25–34
living with parents
(of all persons aged 25–34)
Persons aged 15–64
who live alone
(of all persons aged 15–64)
Persons aged 65 and over
who live alone
(of all persons aged 65 and over)
FAMILIES AND WORK
Couple families with children under
15, both parents employed
(of all couple families
with children under 15)
Couple families with children under
15, neither parent employed
(of all couple families
with children under 15)
One-parent families with children
under 15, parent employed
(of all one-parent families
with children under 15)
Children under 15 living in families
where no parent is empoyed
(of all children under 15)
SA
WA
Tas.
NT(a)
ACT
Aust.
64
119
7 056
21.7
26.6
23.8
(a) All estimates for the Northern Territory other than household estimates and those for de facto couples, refer to mainly urban areas only.
(b) Includes same-sex couples.
Reference periods:
30
Data on family formation are for the calendar year. Data on de facto couples are at census date. Data on
other living arrangements, families, and work are at June.
• ABS • AUSTRALIAN SOCIAL TRENDS • 4102.0 • 1999
Family — State summary
FAMILY FORMATION
Registered marriages
Number of marriages
Crude marriage rate
(per 1,000 population)
Marriages where both partners
married for the first time
(of all marriages)
Median age of men
at first marriage
Median age of women
at first marriage
Median age at remarriage
(divorced men)
Median age at remarriage
(divorced women)
Divorce
Number of divorces
Crude divorce rate
(per 1,000 population)
Median duration between
marriage and separation
Divorces involving children
under 18 (of all divorces)
Children under 18
affected by divorce
continued
Units
Years
NSW
Vic.
Qld
SA
WA
Tas.
NT
ACT
Aust.
'000
1997
36.7
25.5
20.9
7.9
10.5
2.7
0.8
1.9
106.7
no.
1997
5.8
5.5
6.1
5.4
5.8
5.6
4.2
6.0
5.8
%
1997
67.7
69.4
63.8
64.9
64.1
62.3
59.9
66.2
66.6
27.8
28.0
27.5
27.7
28.1
27.5
28.8
27.4
27.8
years
1997
years
1997
25.9
26.2
25.7
25.7
26.1
25.6
26.7
25.9
25.9
years
1997
41.6
41.5
42.3
41.6
42.5
41.3
42.8
42.3
41.8
years
1997
37.9
38.1
37.9
38.8
39.2
37.9
40.0
38.4
38.2
'000
1997
14.7
12.5
11.7
4.1
5.0
1.3
0.4
1.5
51.3
no.
1997
2.3
2.7
3.5
2.8
2.8
2.8
2.2
(a)
2.8
years
1997
6.7
7.7
8.1
8.6
8.3
8.7
7.8
8.2
7.7
%
1997
51.3
53.4
55.7
56.5
53.8
62.9
56.0
56.7
54.0
'000
1997
13.7
12.5
12.4
4.3
5.0
1.6
0.5
1.7
51.7
Fertility
Births
'000
1997
87.2
60.7
47.0
18.4
24.8
6.0
3.6
4.2
251.8
Total fertility rate (per woman)
no.
1997
1.83
1.69
1.80
1.70
1.79
1.80
2.17
1.60
1.78
%
1997
4.7
3.1
6.6
4.2
5.4
7.6
14.0
3.9
4.9
%
1997
15.8
16.8
13.3
16.6
14.5
11.4
11.2
15.7
15.3
%
1997
26.7
22.3
33.3
29.6
30.8
35.6
57.6
25.0
28.1
%
1997
85.9
87.5
84.2
88.1
84.9
87.6
68.9
87.2
85.5
Units
Years
NSW
Vic.
Qld
SA
WA
Tas.
NT(b)
ACT
Aust.
1996
20.5
21.5
23.9
19.7
20.6
16.3
30.2
38.5
21.6
1996
39.8
41.5
34.2
45.2
39.2
41.6
26.7
33.3
39.3
Births to mothers aged
under 20 (of all births)
Births to mothers aged 35
and over (of all births)
Births outside
marriage (of all births)
Births outside marriage
acknowledged by father
(of all births outside marriage)
CHILD CARE
Children aged under 3 using formal
%
care (of all children under 3)
Children aged under 3 using informal
%
care (of all children under 3)
(a) Based on the location of the Family Court where the divorce is granted and registered. Due to the large number of divorces granted in the ACT to usual residents
of another State, the divorce rate for the ACT is not representative of the ACT population.
(b) Estimates for childcare for the Northern Territory refer to mainly urban areas only.
Reference periods:
Data on de facto couples are at census date. Data on other living arrangements are at June. Data on child
care are at March.
ABS • AUSTRALIAN SOCIAL TRENDS • 4102.0 • 1999 •
31
Family — definitions and references
Average family size — the total number of family
members divided by the number of families.
Reference: Labour Force Status and Other
Characteristics of Families, Australia
(Cat. no. 6224.0).
Birth — the delivery of a child irrespective of the
duration of pregnancy who, after being born,
breathes or shows any other evidence of life such as
a heart beat.
Reference: Births, Australia (Cat. no. 3301.0).
Births outside marriage — births where the father was
not registered as married to the mother at the time
of the birth, whether or not the parents were living
together at the time of the birth, and whether or not
the child may subsequently have been legitimated
or adopted.
Reference: Births, Australia (Cat. no. 3301.0).
Births outside marriage acknowledged by father —
births outside registered marriage where the father's
name is recorded on the birth certificate.
Reference: Births, Australia (Cat. no. 3301.0).
Child under 15 —a related or unrelated person under
15 years of age who forms a parent-child
relationship with one person over 15 years of age
resident in the household.
Reference: Labour Force Status and Other
Characteristics of Families, Australia
(Cat. no. 6224.0).
Couple family — a family based on two persons who
are in a registered or de facto marriage and who are
usually resident in the same household. The family
may include any number of dependents,
non-dependents and other related individuals. It is
not necessary for a parent-child relationship to be
formed, thus a couple family can consist of a couple
without children present in the household.
Reference: Labour Force Status and Other
Characteristics of Families, Australia
(Cat. no. 6224.0).
Couple-only family — a couple family with no
dependent children or other family members (e.g.
non-dependent children) present.
Reference: Labour Force Status and Other
Characteristics of Families, Australia
(Cat. no. 6224.0).
Crude divorce rate — the number of divorces
granted in the calendar year per 1,000 of the
estimated resident population at 30 June of that
year.
Reference: Marriages and Divorces, Australia
(Cat. no. 3310.0).
Crude marriage rate — the number of marriages
registered in the calendar year per 1,000 of the
estimated resident population at 30 June of that
year.
Reference: Marriages and Divorces, Australia (Cat.
no. 3310.0).
De facto marriage — the relationship between two
people who live together in a consensual union who
are not registered as married to each other.
Reference: 1996 Census of Population and Housing.
32
•
ABS • AUSTRALIAN SOCIAL TRENDS • 4102.0 • 1999
Divorces involving children — divorces of couples with
unmarried children of the registered marriage who
were under 18 at the time of application for divorce.
Under the Family Law Act 1975, adopted and
ex-nuptial children and children from a former
registered marriage may be included (in certain
cases). Children who are registered as married or
aged 18 or more are not subject to custody and
guardianship orders and are excluded.
Reference: Marriages and Divorces, Australia
(Cat. no. 3310.0).
Employed — persons aged 15 and over who
either worked during the reference week for pay,
profit, commission, payment in kind or without pay
in a family business, or who had a job but were not
at work.
Reference: Labour Force, Australia
(Cat. no. 6203.0).
Estimated Resident Population — quarterly estimates
of the Australian population are obtained by adding
to the estimated population at the beginning of
each period the components of natural increase (on
a usual residence basis) and net overseas migration.
For the States and Territories, account is also taken
of estimated interstate movements involving a
change of usual residence.
Reference: Australian Demographic Statistics
(Cat. no. 3101.0).
Family — two or more persons, one of whom is at least
15 years of age, who are related by blood, marriage
(registered or de facto), adoption, step or fostering;
and who are usually resident in the same
household. The basis of a family is formed by
identifying the presence of a couple relationship,
lone parent-child relationship or other blood
relationship. Some households will, therefore,
contain more than one family.
Reference: Labour Force Status and Other
Characteristics of Families, Australia
(Cat. no. 6224.0).
Formal child care — regulated care, away from the
child's home during the previous week. Includes
preschool; before and after school care program;
long-day care centre; family day care; occasional
care and other formal care.
Reference: Child Care, Australia (Cat no. 4402.0)
Household — a group of two or more related or
unrelated people who usually reside in the same
dwelling, who regard themselves as a household
and who make common provision for food or other
essentials for living; or a person living in a dwelling
who makes provision for his or her own food and
other essentials for living, without combining with
any other person.
Reference: Household Estimates, Australia
(Cat. no. 3229.0).
Informal child care — non-regulated care either in the
child's home or elsewhere, in the previous week. It
includes care by (step) brothers or sisters; care by
relatives (including non-custodial parents) and by
non-relatives such as friends, neighbours or baby
sitters. It may have been paid or unpaid.
Reference: Child Care, Australia (Cat. no. 4402.0).
Family — definitions and references
continued
Lone parent — a person who has no spouse or partner
present in the household but who forms a
parent-child relationship with at least one
dependent or non-dependent child usually resident
in the household.
Reference: Labour Force Status and Other
Characteristics of Families, Australia
(Cat. no. 6224.0).
Median — the value at which half the population
falls above and half falls below.
Median age of mothers at first birth—actually the
median age of mothers at first confinement. A
confinement is a pregnancy which results in at least
one live birth: multiple births (e.g. twins) may be
involved.
Reference: Australia's Mothers and Babies (1996)
Australian Institute of Health and Welfare. Median duration of marriage to separation — the
median interval between the date of registered
marriage and the date of separation.
Reference: Marriages and Divorces, Australia
(Cat. no. 3310.0).
One-parent family — a family consisting of a lone
parent with at least one dependent or
non-dependent child (regardless of age) who is also
usually resident in the household. The family may
also include any number of other dependent
children, non-dependent children and other related
individuals.
Reference: Labour Force Status and Other
Characteristics of Families, Australia
(Cat. no. 6224.0).
Persons who live alone — persons who are the only
member of a household.
Reference: Labour Force Status and Other
Characteristics of Families, Australia
(Cat. no. 6224.0).
Registered marriages — refers to formally registered
marriages for which the partners hold a certificate.
Reference: Marriages and Divorces, Australia
(Cat. no. 3310.0).
Total fertility rate — the average number of children a
woman would bear during her lifetime if she
conformed to the current age-specific fertility rates.
Reference: Births, Australia (Cat. no. 3301.0).
Women giving birth for the first time — Multiple births
(e.g. twins or triplets) may be involved at the time of
first birth.
Reference: Australia's Mothers and Babies (1996)
Australian Institute of Health and Welfare. ABS • AUSTRALIAN SOCIAL TRENDS • 4102.0 • 1999 •
33
Spending time alone
F A M I L Y F U N C T I O N I N G
In 1997, 32% of older
Interaction with others is generally seen as a
people aged 65 years
positive and necessary part of daily life.
Naturally, the level of social interaction a
person has can depend on a wide range of
factors, such as where they live, whether they
work, their health, and their personal
preferences and aptitude for social
interaction.
and over lived alone.
During their waking
hours, these people
Measuring time spent alone
This review uses data from the Time Use surveys
conducted by the ABS in 1997 and 1992. The data
was compiled from a household questionnaire
and a 48-hour diary of time use, filled out by
respondents aged 15 years and over. In addition
to changes in behaviour, some of the differences
in figures between 1992 and 1997 may be due to
minor differences in survey methodology.
spent an average of
79% of their time alone
(12 hours and 26
minutes per day).
In terms of broad social trends, various
changes in patterns of human activity suggest
that people are generally interacting with a
wider range of people than in the past. For
instance, the increased participation of
women in the labour force is likely to have
increased the time women of prime working
age spend with people outside their home.
High and increasing rates of residential
mobility would also have served to broaden
social contacts. Between 1991 and 1996, 43%
of people changed their address within
Australia, up from 41% between 1986 and
1991.1 More widely available
telecommunication services, such as cellular
phones and the internet, are also likely to
have assisted in this process of change.
Time spent alone per day is measured as the time
individuals were alone while they had an
opportunity for social interaction: that is, while
they were awake. If sleeping time had been
included in the measure of total time spent alone,
the difference in time spent alone between
persons living alone and those living with others
would have been substantially higher due to lone
people generally sleeping alone.
Time use data on social contact (time spent with
other people) cannot give an indication of the
degree and quality of interaction that takes place
between people. Individuals may be in the
company of others, but have little more than
superficial interaction with them. However, it is
likely that being in the company of others will
reduce the extent to which people feel lonely or
socially isolated.
At the same time, there is evidence that some
social bonds are weakening. Over recent
decades, divorce rates have risen and
increasing numbers of adults live as single
parents or by themselves (see Family —
national summary table, p. 28). As well as
increases in the proportion of people of all
ages who live alone, the amount of time
people spend by themselves has been
increasing. Overall, the average waking time
Average waking time spent alone and proportions of people living alone, 1997,
including changes since 1992
Average time spent alone
Persons living with others
Persons living alone
Proportion who lived alone
Males
Females
Males
Females
Males
Females
Age group (years)
hrs:mins
hrs:mins
hrs:mins
hrs:mins
%
%
15–24
1:54
1:40
7:39
6:34
3.4
3.2
25–44
2:26
1:43
8:23
7:34
10.5
5.8
45–64
2:41
2:28
10:24
9:35
11.5
12.9
65 and over
1:40
1:37
13:00
12:12
20.3
40.4
Change since 1992
Percentage point change
Age group (years)
hrs:mins
hrs:mins
15–24
+0:16
+0:14
hrs:mins
**
hrs:mins
**
%
**
%
**
25–44
+0:07
+0:03
+1:41
+0:58
+3.4
+1.2
45–64
+0:20
+0:03
+0:17
–0:11
+3.7
+3.7
65 and over
+0:14
–0:02
+0:46
+0:42
+1.9
+1.1
Source: Unpublished data, Time Use Survey, 1992 and 1997.
ABS • AUSTRALIAN SOCIAL TRENDS • 4102.0 • 1999
•
35
FAMILY FUNCTIONING
per day spent alone among people aged 15
years and over increased from 2 hrs:38 mins
in 1992 to 3 hrs:1 min in 1997, an increase of
23 minutes. The increases have been largest
for people who live alone, and more so for
men than women.
Measuring disability status
Disability is defined as the presence of one or
more impairments or restrictions (whether
physical, sensory, psychological or intellectual)
which has lasted, or is expected to last, for six
months or more.
Taken together, these trends could imply
increased loneliness and social isolation.
Within the context of these broader trends,
this review identifies those groups who may
be at risk of having low levels of social
interaction, mostly measured in terms of the
time spent alone.
In the Time Use Survey, disability status was
further defined according to the degree of
restriction the disability causes to personal
activity. The group identified in this review
includes people with a severe or profound
restriction in personal activity (i.e. people who
required personal assistance with personal care,
mobility and communication tasks), and people
with a moderate restriction (i.e. people who
required various aids, but not necessarily the
assistance of others, with tasks).
Who spends the most time alone?
Because of the opportunities to interact with
other people at home, people who live with
others generally spend less time by
themselves than those who live alone. On
average, in 1997, people who lived with
others spent just over 2 hours per day (14% of
their waking time) by themselves compared to
just over 10 hours (65% of their waking time)
for people who lived alone.
Among those who lived with others, the
amount of time spent alone varied little with
the age of the person (roughly between one
and a half and two and a half hours) with
those aged 15–24 and 65 and over spending
less time alone than those between these two
age groups. However, among those who lived
by themselves, the amount of time spent
alone increased steadily with age. Among men
aged 65 and over who lived by themselves,
the average time spent alone per day was
13 hours (83% of their waking time) and
among women who lived alone,
12 hrs:12 mins per day (78% of their waking
time). The likelihood of spending large
amounts of time alone also increases with age
in association with the increased chance of
living alone. Among people aged 65 and over
20% of men and 40% of women lived by
themselves.
Average waking time, spent alone and with others and incidence of having spare time, 1997
Persons living with others
Persons living alone
Spent with
nonhousehold
members(a)
Always or Total
often has living with
spare time others
Spent
alone
hrs:mins hrs:mins
hrs:mins
%
hrs:mins hrs:mins
15–24
1:47
6:24
6:24
11.6
Spent
alone
Age group (years)
Spent with
household
members
only
'000
Spent with
nonhousehold
members
Always or
often has
spare time
Total living
alone
%
'000
All persons
2 509.4
7:07
8:05
12.8*
85.4
25–44
2:04
8:35
4:56
3.5
5 138.4
8:05
7:25
9.1
453.9
45–64
2:35
8:52
4:14
3.4
3 504.2
9:58
5:47
7.9
488.0
65 and over
1:38
11:49
1:46
5.1
1 282.2
12:26
3:17
11.7
591.9
Persons with a disability(b)
15–44
2:05
9:02
4:08
10.7*
286.8
10:28*
4:48*
**
25.0*
45–64
2:16
10:18
2:56
11.6*
267.7
9:56
5:09
14.7*
66.7
65 and over
1:49
11:20
1:40
16.8*
185.7
13:31
2:25
21.4*
102.1
Total population
2:07
8:33
4:42
5.3
12 434.2
10:12
5:27
9.9
(a) Household members may also be present.
(b) Persons with a severe, profound or moderate restriction in personal activity.
Source: Unpublished data, Time Use Survey, 1997.
36
• ABS • AUSTRALIAN SOCIAL TRENDS • 4102.0 • 1999
1 619.2
FAMILY FUNCTIONING
People with moderate or more severe
disabilities (most commonly older people) are
at greater risk of social isolation than other
people. Among those aged 65 and over who
lived alone, the average time spent alone was
13 hrs:31 mins, 85% of their waking hours,
and over one hour longer than for the general
population in this age group.
Further identifying groups of
concern
Spending time alone, even for those who
spend large amounts of time alone, is not
itself an indicator of diminished life quality in
terms of feelings of loneliness or social
isolation.2 The simple expectation of having
families and friends available to meet with on
occasions or rely on when needed may well
diminish potential feelings of loneliness.
However, a likely symptom of loneliness is
the feeling of inactivity or boredom.2,3 One
measure of such feelings available from the
Time Use Survey is the extent to which people
report that they always or often have spare
time. The use of this measure in conjunction
with time spent alone may be an indicator of
the numbers of people who suffer from being
alone.
Despite being at least risk of social isolation
in terms of time spent alone, young people
aged 15–24 were the most likely of all age
groups to report that they always or often
have spare time, regardless of whether they
lived alone or not (13% and 12%
respectively). This finding is consistent with
other research which has identified youth,
along with elderly people, to be most at risk
of having feelings of loneliness.3,4
Nevertheless, after the formative years of
adulthood, feelings of loneliness (or as shown
here, feelings of always or often having spare
time) are less common, but increase with age
and are higher among older people who live
alone, particularly those with disabilities. In
1997, of people aged 65 and over identified
as having a moderate or more severe
disability, 21% of those living alone and
17% of those living with others felt that they
always or often had spare time. These
proportions were substantially higher than for
the general population in this age group
(12% and 5% respectively).
Spending time with others
Whether people live alone or with family
members, there is a general desire to spend
some of their time with others. Irrespective of
living arrangements, the proportion of time
spent with people outside the household
Social isolation
Although definitions vary, social isolation is
generally understood to occur when a person has
low levels of social participation and a perceived
inadequacy of social activity.2 This can happen
when a person spends a lot of time alone and little
time in social contact with family, friends and
other people. Social isolation is associated with
feelings of loneliness, boredom and lower
satisfaction with life.
Addressing concerns
The Department of Veterans' Affairs has identified
social isolation as a priority concern for the
veteran community, and the wider community in
general.2 It has responded to concerns by
establishing the Improving Social Networks
Program, including pilot interventions and
organising related research. It recognises that as
people age, they are more likely to experience
social isolation as a result of frailty, mobility
problems, and loss of family and friends. To
address this problem, the Department completed
an extensive research project on the causes and
effects of social isolation in the veteran
community in 1998. It found that social isolation is
a substantial problem and is mainly triggered by a
lack of social support, poor health and restricted
mobility.2
generally decreased with age. People aged
15–24 who live with others tend to spend
more time with non-household members than
any other age group (an average of
6 hrs:24 mins a day). Of those living with
others, people aged 25–44 (most commonly
families with young children, and in which
high proportions of men and women are
employed) spent less time with
non-household members (4 hrs:56 mins
per day) than those in the 15–24 year age
group. Interaction with others drops off
markedly among older age groups when most
people have retired from work.
Among people aged 65 and over, those who
live by themselves tend to spend more time
with friends, acquaintances and other people
than those who live with others
(3 hrs:17 mins and 1 hr:46 mins respectively).
However, those who live with others spend a
great deal of their time (on average, 78% of
their waking time) with other household
members, commonly their husband or wife.
Social interaction: focusing more
on older people
Patterns of social interaction with family and
friends change among older people with
increasing age. Slightly less time is spent
ABS • AUSTRALIAN SOCIAL TRENDS • 4102.0 • 1999
•
37
FAMILY FUNCTIONING
People aged 65–74 years and 75 years and over: average time spent, while
awake, in different social contexts, 1997
Social context
Alone
Partner only
Persons living with partner only
Persons living alone
65–74 years
75 years and over
65–74 years
75 years and over
hrs:mins
hrs:mins
hrs:mins
hrs:mins
1:29
1:20
12:32
12:18
11:13
12:05
n.a.
n.a.
Family outside household only
0:51
0:31
1:11
1:33
Family and friends(a)
1:03
0:45
0:11*
0:13*
Friends only
0:28
0:26
1:22
1:11
Other people only(b)
0:16
0:10
0:27
0:28
Total persons ('000)
'000
'000
'000
'000
674.8
280.7
333.9
258.0
(a) Administrative, service and shop personnel, crowd or undescribed people may also be present.
(b) Administrative, service and shop personnel, crowd or undescribed people present.
Source: Unpublished data, Time Use Survey, 1997.
alone among those aged 75 and over than
those aged 65–74, irrespective of living
arrangements.
For people aged 65 and over, living with their
partner, an increasing amount of time is spent
with their partner only as they grow older
(11 hrs:13 mins per day for those aged 65–74
and 12 hrs:5 mins per day for those aged over
75 years). Among those who live alone, on the
other hand, more time is spent with family
members who live in other households
(relatives, children and grandchildren). On
average, people aged over 75 years who lived
alone spent over one hour longer per day
with family members outside of the
household than those in the same age group
who live with their partner (1 hr:33 mins,
and 31 minutes per day, respectively).
These patterns of social interaction indicate
that with advancing age the loss of partners
impacts heavily on the amount of time older
people spend alone. They also indicate that
families living in other households spend
more of their time with elderly people when
these people are at greater risk of social
isolation.
38
• ABS • AUSTRALIAN SOCIAL TRENDS • 4102.0 • 1999
Endnotes
1 Australian Bureau of Statistics 1996, Population
Growth and Distribution (Cat. no. 2035.0), ABS,
Canberra.
2 Commonwealth Department of Veterans' Affairs
1998, Improving Social Networks: Improving
Health and Social Isolation in the Australian
Veteran Community, DVA, Canberra.
3 Weeks, D.J. 1994, A Review of Loneliness
Concepts, with Particular Reference to Old Age,
International Journal of Geriatric Psychiatry,
vol 9, 1994.
4 Wildermuth N.L. 1990, Loneliness in
adolescence: why it occurs and what to do about
it in Adolescence an Australian Perspective,
Callan Harcourt Brace Jovanovich, Sydney, 1990.
Looking after the children
F A M I L Y
F U N C T I O N I N G
In 1997, mothers with
children aged under five
spent more than three
times as much time per
day on child care, and
were less than half as
likely to work full-time
as mothers whose
youngest was aged
between 10 and 14
years.
One of the most important aspects of a
child's upbringing is their relationship with
their primary care givers – usually the child's
parents. Parents spend time with their
children for various reasons, including to
nurture them, be role models, help with
educational needs, and teach them life and
socialisation skills. Ultimately, this time
shapes the child's view of the world and lays
the foundations for adult independence.
Increasingly, families with children under
15 years have both parents in paid work. For
many, this introduces on-going challenges in
balancing their family responsibilities and
work commitments. Between 1988 and 1998,
the proportion of couple families with
children under 15, where both parents
worked increased from 50% to 56%.
This review focuses on the time parents in
couple families report being involved in child
care activities. In particular, it examines how
mothers and fathers differ in the time they
spend looking after their children and in the
types of child care activities they participate
in, as their children get older.
Major patterns and trends
In 1992, on average, mothers spent
6hrs:46mins per day on child care activities,
more than twice as much as fathers
Mothers and fathers: average reported time spent per day on
child care activities, and proportion employed full-time
Fathers
Mothers
Child care
Employed
full-time
Child care
Employed
full-time
hrs:mins
%
hrs:mins
%
3:06
82.6
8:27
15.5
Age of youngest child in 1997
0–4 years
5–9 years
2:13
81.9
4:58
21.5
10–14 years
1:06
84.3
2:11
37.2
Number of children in 1997
One
1:53
82.5
4:50
31.2
Two
2:43
86.7
6:33
18.8
Three or more
2:40
76.5
7:22
13.1
Total 1997
2:24
82.8
6:07
21.9
Total 1992
2:31
83.1
6:46
19.4
Source: Unpublished data, Time Use Survey, 1992 and 1997.
Child care activities
Information on time spent on different activities
is taken from the 1992 and 1997 Time Use
Surveys. Time use data was compiled from a
household questionnaire and a 48-hour diary of
time use, completed by respondents aged 15
years and over. For each five-minute time slot in
the diary, people could record up to two
concurrent activities. In this review, the amount
of time given to child care (as a main or
concurrent activity) is examined for men and
women in couple relationships (married or de
facto) with children aged 0–14.
Child care activities relate to activities parents
reported undertaking for their children. This
includes the time spent as a main activity, or in
association with another activity. In this article the
three broad categories of child care are:
Active child care – requires the physical
involvement of a parent such as the physical and
emotional care of children; teaching, helping and
reprimanding; and playing, reading and talking
with children;
Passive child care – are activities requiring only
the passive involvement of a parent such as
minding or supervising children. Excludes
minding children while parents are asleep;
Associated child care – activities such as any
travel or communication related to child care
activities and visiting child care establishments
(e.g. schools).
(2:hrs:31mins). On the other hand, reflecting
traditional roles and responsibilities, fathers
were far more likely to be employed full-time
(83% of fathers compared to 19% of mothers).
Nevertheless, the pattern has been changing.
As women have been entering the work force,
the time they spend with their children has
been decreasing (6hrs:7mins in 1997). Little
change was evident among fathers
(2hrs:24mins per day in 1997) whose
involvement in full-time work remained about
the same between 1992 and 1997.
As children grow older, mothers are more
likely to be employed (see Australian Social
Trends 1998, Trends in women's
employment, pp. 111–114), reflecting the
lower level of care and supervision needed by
children of school age. In 1997, mothers with
children less than 5 years old spent an
average of 8hrs:27mins per day on child care,
and only 16% worked full-time. In
comparison, mothers whose youngest child
ABS • AUSTRALIAN SOCIAL TRENDS • 4102.0 • 1999
•
39
FAMILY FUNCTIONING
mothers than fathers, both in terms of the
time spent with children and the likelihood of
being in full-time employment.
Fathers and mothers: average reported time spent on child
care activities, by employment status, 1997
Full-time
Part-time
Not employed(a)
Fathers
Mothers
0
125
250
Minutes per day
375
500
(a) Includes people unemployed and not in the labour force.
Source: Unpublished data, Time Use Survey, 1997.
was aged 10–14 reported spending less than a
third as much time on child care (2hrs:11mins
per day) and were more than twice as likely to
work full-time (37% compared to 16%).
Unlike mothers, the proportion of fathers in
full-time employment did not change much
with the age of the youngest child. 83% of
fathers with children aged 0–4 years worked
full-time compared to 82% whose youngest
was 5–9 and 84% whose youngest was 10–14.
As was the case for mothers, the average time
fathers spent on child care decreased as
children became older.
The time spent on child care was also higher
in families where several children were
present. As with age of children, the influence
of the number of children was greater for
Fathers and mothers: average reported time spent on child
care activities where the father was employed full-time, 1997
Mother full-time
Mother part-time
Mother
not employed(a)
Male partner
Female partner
0
125
250
Minutes per day
375
(a) Includes people unemployed and not in the labour force.
Source: Unpublished data, Time Use Survey, 1997.
40
• ABS • AUSTRALIAN SOCIAL TRENDS • 4102.0 • 1999
500
Both mothers and fathers who were
employed part-time, or not employed, spent
more time with their children than those
working full-time. However, the time spent by
parents on child care not only depends on
their own employment status, but also on
many other factors, including the
employment status of their partners. For
example, in the more usual situation, where
the father was working full-time, the mother
spent progressively less time with their
children as her hours of employment
increased. However, for fathers in such
families, the time spent with their children
bore little relationship to the mother's hours
of work. In fact, men spent slightly less time
with their children, on average, when women
worked full-time than when they worked
part-time.
Types of child care activities
Parents provide care for their children in
various ways, often just passively minding
them while they are attending to other
activities such as cooking or cleaning – or just
relaxing. However, they also spend time
actively looking after the personal needs of
their children, such as feeding, cuddling,
reading or talking to their children, as well as
some time on extra tasks such as organising
their daily activities. The extent to which
mothers and fathers share their time in
attending to various child care activities can
be demonstrated by focusing on parents with
similar work commitments – for example,
where both parents are employed full-time.
In general, in families where both parents
worked full-time, mothers spent about twice
as much time as fathers on child care (nearly
4hrs for mothers and 2hrs:4mins for fathers).
Moreover, mothers spent more time than
fathers on all types of child care activities, for
children of all age groups.
Children under school age commonly require
much more personal attention than older
children. Consequently, both mothers and
fathers (where both were working full-time)
spent more time with children aged 0–4 years.
For fathers, this time was fairly evenly divided
between active and passive child care
activities (1hr:27mins and 1hr:33mins,
respectively), while mothers spent more time
on active child care (3hrs:15mins, compared
with 2hrs:47mins on passive child care),
particularly on the physical and emotional
care of these children (1hr:50mins per day,
on average). Mothers spent more time than
FAMILY FUNCTIONING
Fathers and mothers: average reported time spent per day on child care activities in families where both
parents worked full-time, 1997
Age of youngest child
Total
0–4 years
5–9 years
10–14 years
0–14 years
Fathers
Mothers
Fathers
Mothers
Fathers
Mothers
Fathers
Mothers
Child care activity
hrs:mins
hrs:mins
hrs:mins
hrs:mins
hrs:mins
hrs:mins
hrs:mins
hrs:mins
Active child care(a)
1:27
3:15
0:36
1:29
0:18
0:52
0:48
1:53
Physical and emotional care
0:37
1:50
0:06
0:25
0:01*
0:10
0:15
0:50
Playing reading and talking with children
0:49
1:24
0:27
0:58
0:16
0:36
0:31
0:59
Passive child care
1:33
2:47
1:30
2:12
0:22*
0:33
1:07
1:48
Associated child care(b)
0:10
0:23
0:10*
0:17
0:07*
0:12
0:09
0:17
Total
3:10
6:26
2:17
3:59
0:47
1:37
2:04
3:58
(a) Includes time spent teaching, helping, or reprimanding children.
(b) Includes time spent visiting child care establishments, associated travel and communication, and child care activities not elsewhere classified, such as getting
children's things ready for the next day.
Source: Unpublished data, Time Use Survey, 1997.
fathers on the physical and emotional care of
older children, too, but for both partners this
declined sharply with the age of the child.
Time spent playing, reading and talking with
their children declined less sharply with the
age of the child, and became the dominant
type of active care for both parents of older
children, particularly fathers.
After children reach school age, parents spent
more time on passive than active child care –
almost as much for 5–9 year olds (1hr:30mins
Partners: proportions feeling rushed
for time(a), 1997
Men
Women
%
%
Employed full-time
55.6
69.5
Employed part-time
61.4
67.2
Not employed
47.2
51.3
Employed full-time
44.3
52.3
Employed part-time
40.1
34.8
Not employed
34.6
13.6
With children(b)
50.7
59.8
Without children(c)
23.4
25.9
Male partner employed full-time
Women with children(b)
Women without children(c)
All couples
(a) Proportion who stated they were always or often rushed
or pushed for time.
(b) Children aged 0–14 years.
(c) Children of any age (i.e. couple only families).
for fathers and 2hrs:12mins for mothers) as
for 0–4 year olds (1hr:33mins and
2hrs:47mins, respectively). Much less time
was spent on the passive care of children in
the 10–14 years age group (22mins and
33mins, respectively).
Other child care activities, such as getting
children's things ready for the next day,
visiting child care establishments and
associated travel, took up much less time –
less than 25 minutes per day for both parents,
for children of any age.
Juggling work and family
Managing work and family responsibilities can
often be difficult for parents, especially
mothers. This can be observed in terms of the
proportion of parents who state that they
always or often feel rushed or pushed for
time. In general, mothers were more likely
than fathers to report that they always or
often felt rushed or pushed for time, while
men and women without dependent children
were less likely to report this feeling. For
example, of couples where both worked
full-time, 70% of mothers stated they always
or often felt rushed or pushed for time,
compared to 56% of fathers and 52% of
women with no dependent children.
Similarly, of women who worked part-time
whose partners worked full-time, 67% of
mothers stated they always or often felt
rushed or pushed for time, compared to 35%
of women with no dependent children.
Source: Unpublished data, Time Use Survey, 1997.
ABS • AUSTRALIAN SOCIAL TRENDS • 4102.0 • 1999
•
41
Caring for children after
parents separate
L I V I N G
In April 1997, there
were 978,000
Australian children who
were living with one
natural parent and who
had a natural parent
living elsewhere. The
vast majority (88%)
lived with their natural
mother in either
one-parent families
(68%) or in
step or blended
families (20%).
A R R A N G E M E N T S
The family is the fundamental social unit for
the care and nurture of children. However the
capacity to care for children can come under
extreme stress when the parents' relationship
breaks down and the family unit is split due
to separation or divorce. A key objective of
family law and government social policy in
Australia is to ensure the ongoing care and
wellbeing of children after their parents
separate. The Child Support Agency was set
up in 1988 to ensure that children of
separated parents receive adequate financial
support, and that both parents share the cost
of supporting their children according to their
capacity to pay.1 Family law reforms
introduced in 1996 reinforce the rights of
children to have regular contact with both
parents and emphasise joint parental
responsibility for children following
separation.2
Family Characteristics Survey
The statistics on living arrangements, parental care
arrangements and child support payments
presented in this article are derived from the ABS
Family Characteristics Survey, 1997. They relate to
children with a natural parent living elsewhere.
Children with a natural parent living elsewhere
refers to children under 18 years of age who live
with one natural parent, either in a one-parent
family, a step-family or blended family, and have
another natural parent who is not usually resident
in the same household.
Natural parent/child refers to a parent/child, each
of whom is related to the other by either birth or
adoption.
Usual resident refers to a person who has lived, or
intends to live, with the household for a total of
six months or more and regards it as his or her
own (or main) household.
Children with a natural parent living
elsewhere
Step-family refers to a couple family with one or
more children, at least one of whom is the natural
child of either partner but not of the other
(step child), and none of whom is the natural
child of both partners.
When parents separate, the children generally
live with one parent, usually their mother, but
may continue to have contact with the other
parent on a more or less regular basis. In
April 1997, there were 978,000 Australian
children who were living with one natural
parent and who had a natural parent living
Blended family refers to a couple family with
two or more children, of whom at least one is the
natural child of both partners, and at least one is
the step-child of either partner.
Children with a natural parent living elsewhere, April 1997
Age of child (years)
Living with natural mother
One-parent family
0–4
5–11
12–17
Total
%
%
%
%
95.9
89.2
81.8
87.9
88.7
69.7
54.6
68.2
Step-family
5.6
10.7
15.3
11.3
Blended family
1.5*
8.8
11.9
8.4
4.1
10.8
18.2
12.1
3.7
8.7
12.6
9.1
Living with natural father
One-parent family
Step-family
**
**
3.7
2.0
Blended family
**
**
1.9
1.1
100.0
100.0
100.0
100.0
'000
'000
'000
'000
207.9
409.8
360.8
978.4
Total with a natural parent living elsewhere
Total with a natural parent living elsewhere
Source: Unpublished data, Family Characteristics Survey, April 1997.
42
• ABS • AUSTRALIAN SOCIAL TRENDS • 4102.0 • 1999
LIVING ARRANGEMENTS
elsewhere. The vast majority (88%) lived with
their mother in either one-parent families
(68%) or in step or blended families (20%).
Children of all ages were more likely to live
with their mother than their father, and this
was particularly so for younger children. In
1997, 96% of 0–4 year olds, 89% of 5–11 year
olds and 82% of 12–17 year olds whose
parents had separated were living with their
mother. Boys aged 12–17 were more likely to
live with their natural father than girls of the
same age (21% compared to 15%). In the
younger age groups, there was little
difference in the proportions of boys and girls
who lived with their father.
Contact with natural parent living
elsewhere
It is generally agreed that, in most cases,
children are better off when they have an
ongoing relationship with both their parents,
even after their parents have separated. A
recent report3 by the Family Law Council
concluded that ‘Most children want and need
contact with both parents. Their long term
development, education, capacity to adjust
and self esteem can be detrimentally affected
by the long-term or permanent absence of a
parent from their lives. The wellbeing of
children is generally advanced by their
maintaining links with both parents as much
as possible.’
In 1997, 3% of children whose parents had
separated were in a shared care arrangement,
(i.e. each natural parent cared for the child
for at least 30% of the time). The vast majority
(97%) were in a sole care arrangement
(i.e. the natural parent with whom they lived
cared for them for more than 70% of the
time). Of those children in a sole care
arrangement, 42% spent time with their other
Frequency of visits(a), April 1997
The Family Law Reform Act 1995, which came
into effect in June 1996, made significant changes
to the concepts used in the Family Law Act in
relation to caring for children after the separation
of their parents. In order to better reflect its focus
on the needs and rights of the children, rather
than the rights of parents, the traditional concepts
of custody, access and guardianship were replaced
by a broader concept of parental responsibility.4
The new principles now set out in section 60B(2)
of the Family Law Act are that, except where it is
or would be contrary to a child's best interests:
children have a right to know and be cared for
by both parents;
children have a right of contact, on a regular
basis, with both parents and any other person
significant to the care, welfare and
development of the child;
parents share the duties and responsibilities
concerning the care, welfare and
development of the child; and
parents should agree about the future
parenting of the child.4
natural parent fortnightly or more frequently.
However, over one third (36%) saw their
other natural parent rarely (once a year or
less) or never. Of those children (aged two
years or older) who saw their other natural
parent rarely or never, 33% had some contact
by telephone or letter.
As children get older they are less likely to see
their other natural parent on a frequent basis.
In 1997, more than half of 0–4 year olds in a
sole care arrangement visited their other
natural parent fortnightly or more often. The
proportion declined with age to about a third
of 12–17 year olds. This may be due to a
Fortnightly or more frequent
visits(a)(b), April 1997
%
60
%
Daily
Shared parental responsibility
4.4
Weekly
22.2
Fortnightly
15.6
Monthly
7.6
Once every three months
8.7
Once every six months
5.3
Once a year
40
20
5.4
Less than once a year/never
30.5
Total(b)
100.0
0
Under 3
3–4
5 –11 12 to 14 15–17
Age of child (years)
(a) With natural parent living elsewhere.
(b) Children in sole care arrangement.
(a) With natural parent living elsewhere.
(b) Children in sole care arrangement.
Source: Family Characteristics, Australia (Cat. no. 4442.0).
Source: Family Characteristics, Australia (Cat. no. 4442.0).
ABS • AUSTRALIAN SOCIAL TRENDS • 4102.0 • 1999
•
43
LIVING ARRANGEMENTS
number of factors which can come into play
as time passes after separation, including the
increasing independence of children,
conflicting commitments of children and the
non-resident parent, a change in locality of
either household, or the repartnering of
either parent. Older children (with a natural
parent living elsewhere) are more likely than
their younger counterparts to be living in step
or blended families. In 1997, 33% of those
aged 12–17 years were living in step or
blended families compared to 8% of 0–4 year
olds.
Child support
In 1997, 42% of all families (with at least one
child with a natural parent living elsewhere)
were receiving cash child support payments.
Over half (54%) of these families were paid
directly by the liable parent while over one
third (38%) were paid through the Child
Support Agency. The remainder used either a
combination of the above two methods (3%)
or some other method (4%) such as through a
solicitor. Most families (82%) received child
support payments on a monthly basis while
others received less frequent payments. Cash
payments ranged from under $50 to over
$600, on average, per child per month, with
over half (60%) of families receiving $200 or
less. Almost one third of families received an
average of $100 or less per child per month.
In 1997, one in three families (with at least
one child with a natural parent living
elsewhere) were receiving in-kind child
support (i.e. payment in the form of goods or
services used by the children and/or their
families). Families who received cash child
support were more likely to receive payment
Child Support Agency
The Child Support Agency (CSA) commenced
operations in June 1988 and is responsible for
administering the Child Support (Registration
and Collection) Act 1988 and the Child Support
(Assessment) Act 1989.5 The primary purpose of
the CSA is to ensure adequate financial support
for children of separated parents, and that both
parents share the cost of supporting their
children according to their capacity to pay. While
the CSA has the authority to collect child support
through the taxation system, liable parents are
encouraged to make payments directly to the
parent with whom their children live.1
Parents are also encouraged to make their own
arrangements about the amount and frequency of
child support payments.6 However, in cases
where parents are unable to reach a satisfactory
agreement, the CSA also has the role of assessing
the amount of child support regularly payable by
a liable parent. Parents who separated after
1 October 1989, or who had a child born after
that date, no longer have to go to court to get
child support (if unable to reach a private
agreement) though this option is still available.5
in kind (40%) than those who did not receive
cash payments (28%). For most families who
received in-kind support, the in-kind
payments were limited to clothes, pocket
money or other personal expenses for the
child. However, families who received both
cash and in-kind support were more likely to
receive in-kind payment in the form of other
expenses such as school fees, health
insurance or mortgage payments (46%) than
those families who received in-kind payments
only (33%).
Endnotes
Cash child support, April 1997
Average monthly payment per child
%
$1–50
13.3
$51–100
17.7
$101–150
14.2
$151–200
15.2
$201–250
6.9
$251–300
8.8
$301–350
4.8
$351–400
5.1
$401–600
6.8
$601 and over
2.8
Total families receiving
cash child support(a)
2 Carberry, F. 1998, Parents sharing care of
children – family law and income support,
paper presented at AIFS Conference, Melbourne,
November 1998.
3 Family Law Council 1992, Patterns of Parenting
after Separation, AGPS, Canberra.
4 Commonwealth of Australia 1997, Family Law
Council Annual Report 1996–97, AGPS,
Canberra.
5 Commonwealth of Australia 1990, Annual
Report of the Commissioner of Taxation
1989–90, AGPS, Canberra.
100.0
(a) Includes a small number of ‘not stated’ responses.
Source: Family Characteristics, Australia (Cat. no. 4442.0).
44
1 Australian Bureau of Statistics 1998, Family
Characteristics, Australia, Cat. no. 4442.0, ABS,
Canberra.
• ABS • AUSTRALIAN SOCIAL TRENDS • 4102.0 • 1999
6 Commonwealth of Australia 1996, Annual
Report of the Commissioner of Taxation
1995–96, AGPS, Canberra.
Remarriage trends of
divorced people
F A M I L Y
F O R M A T I O N
Currently, almost one third of registered
Of all marriages in
1997, 33% involved a
person who had
previously been
married. This
proportion was up from
14% in 1967.
marriages celebrated in Australia involve at
least one previously divorced partner. This is
a consequence of the increase in divorces
over the past few decades, which has resulted
in more divorced people in the population
(see Australian Social Trends 1995, Trends in
marriage and divorce, pp. 33–37). Among
people who were aged 20 years or over in
1997 and not married, 19% had been
divorced compared to 10% in 1976.
The remarriage of divorced people represents
an important form of family formation: one
that can often create complex family
interactions. Previously-divorced partners may
still have responsibilities from their earlier
marriage, such as the care or maintenance of
children. A remarriage may affect other family
relationships, such as that between
grandparents and grandchildren. Of course,
divorced people may choose to enter into a
de facto partnership rather than formally
remarry. However, these partnerships are not
discussed in this review because there is no
available data to support this analysis.
An increasing proportion of
remarriages
Remarriages represented 33% of marriages in
1997, increasing from 14% in 1967. Of
marriages celebrated in 1997, 67% were
couples who had both never married before;
Previous marital status of partners in marriages, proportion
of all marriages, 1967–1997
First marriage for both bridegroom and bride
Both bridegroom and bride previously divorced
One partner divorced the other never previously married
%
100
80
60
Remarriages
In this review, marriages are limited to registered
marriages carried out in accordance with the
Australian Marriage Act 1961. Marriage
registration forms are collected by the State and
Territory Registrars of Births, Deaths and
Marriages and collated into a national data set by
the Australian Bureau of Statistics. This
information is published annually in Marriages
and Divorces, Australia (Cat. no. 3310.0).
Although de facto partnerships are often included
with registered marriage to form a category of
social marriage, the lack of regular information on
the formation and dissolution of de facto
partnerships precludes their inclusion in this
review.
Information on the length of remarriages is
available only up to the year 1994 because the
previous marital status of each partner of a
divorcing couple is no longer collected by the
Family Court of Australia.
This review excludes a relatively small number of
remarriages that involved a divorced person and a
widowed person.
The introduction of the Family Law Act 1975,
which came into operation in January 1976, gave
rise to a large increase in the crude divorce rate in
1976. By 1979, once the backlog of applications
was cleared, the divorce rate dropped and
stabilised, but at a higher level than that which
had occurred prior to the introduction of the Act.
12% were couples who were both previously
divorced; 10% were celebrated by couples in
which the bridegroom had previously been
divorced and the bride had never previously
married; 8% were couples in which the
bridegroom had never previously married and
the bride had previously been divorced; and
4% involved a widowed partner.
Although the large majority of remarriages of
divorced people in 1997 were second
marriages, 13% of bridegrooms and brides
were marrying for the third time, and a
further 1%, the fourth time.
Remarriage rates for divorcees
40
20
0
1967
1972
1977
1982
1987
1992
Remarriage rates for divorcees express the
proportion of divorcees in a particular age
group that remarried in that year. For
example, in 1997 the overall remarriage rate
for divorced men was 54 marriages for every
1,000 divorced men in the population while
1997
Source: Marriages and Divorces, Australia, 1997 (Cat. no. 3310.0).
ABS • AUSTRALIAN SOCIAL TRENDS • 4102.0 • 1999
•
45
FAMILY FORMATION
Remarriage rates(a) for divorced men and women, 1976 and 1997
rate
400
Men 1976
Women 1976
Men 1997
Women 1997
300
200
100
0
19 & under 20–24
25–29
30–34
35–39
40–44
Age group
45–49
50–54
55–59
60 & over
(a) The number of men or women remarrying per 1,000 divorced of either sex.
Source: Marriages and Divorces, Australia, 1997 (Cat. no. 3310.0).
that for divorced women was 41 marriages for
every 1,000 divorced women in the
population.
The highest remarriage rates for divorced
people were 111 per 1,000 among men aged
30–34 and 122 per 1,000 among women aged
25–29. These rates represent a considerable
decline in remarriage rates from those
prevalent in 1976 when the highest rate for
Median age(a) of previously divorced
bridegrooms and brides, 1967–1997
Years
42
Divorced bridegroom
Divorced bride
men was 353 per 1,000 among those aged
25–29 and the highest rate for women was
326 per 1,000 among women aged 20–24.
However, since a large number of divorces
were granted soon after the introduction of
the Family Law Act in January 1976,
remarriage rates for 1976 were particularly
high. A large proportion of the decline in
remarriage rates, indicating fewer people
choosing to marry, can be attributed to the
growth in de facto partnering. More couples
are choosing a de facto relationship in
preference to registered marriage or as a
prelude to marriage (in 1997, about 78% of
marriages involving partners who were both
previously divorced were preceded by a
period of cohabitation1). The same
explanation probably underlies the similar
decline in marriage rates for first marriages.
40
Age at remarriage
38
36
34
32
1967 1972
1977 1982 1987
1992 1997
(a) At date of remarriage.
Source: Marriages and Divorces, Australia, 1997
(Cat. no. 3310.0).
46
• ABS • AUSTRALIAN SOCIAL TRENDS • 4102.0 • 1999
Over the past 30 years, the median age of
remarriage declined to 36 and 32 respectively
for remarrying bridegrooms and brides in
1977, before steadily rising to the ages of 42
and 38 years in 1997.
The age at which people remarry is
dependent on the age at which they first
married, the length of their first marriage and
the intervals between their separation,
divorce, and remarriage. Of these factors, the
age at first marriage is the main influence on
the age at remarriage, the other factors have
been more stable. The median age at first
marriage has been increasing since the mid
1970s: for bridegrooms it increased from
FAMILY FORMATION
Age distribution of previously divorced brides and bridegrooms who remarried,
1977 and 1997
%
30
Bridegrooms 1997
Brides 1997
Grooms 1977
Brides 1977
25
20
15
10
5
0
19 & under
25–29
35–39
45–49
Age group
55–59
65–69
75 & over
Source: Unpublished data, Marriages and Divorces, Australia.
23.3 years to 27.8 years between 1974 and
1997, and for brides from 20.9 years to 25.9
years (see Australian Social Trends 1997, Age
at first marriage, pp. 27–29). Among people
who divorced for the first time in 1994, the
median duration of marriage until final
separation was 9 years, the same as that
experienced by people who divorced in 1987,
and only one year longer than that
experienced by couples who divorced in
1977. For couples divorcing in 1997, the
median interval between separation and
divorce was 3 years while the median interval
between divorce and remarriage for people
remarrying in 1997 was also about 3 years.
These intervals have only increased slightly
from those experienced ten years ago.
The difference in age distributions between
1977 and 1997 of remarrying brides and
bridegrooms further illustrates the shift
towards older ages for remarrying. In 1977,
the most common age group for previously
divorced brides was 25–29 years and for
previously divorced bridegrooms,
30–34 years. In 1997, the most common age
groups had moved up to 30–34 years for
brides and 35–39 years for bridegrooms.
Differences in age between brides
and grooms
Among first marriages in 1997, the
bridegroom was on average older than the
bride by about two years, although the move
Distribution of the difference in age between couples remarrying, 1997
%
9
Groom older than bride
Groom younger than bride
8
7
6
Groom divorced, bride divorced
Groom never married, bride divorced
Groom divorced, bride never married
5
4
3
2
1
0
-20
-15
-10
-5
0
5
Years
10
15
20
25
30
Source: Unpublished data, Marriages and Divorces, Australia, 1997.
ABS • AUSTRALIAN SOCIAL TRENDS • 4102.0 • 1999
•
47
FAMILY FORMATION
towards an increasing proportion of
bridegrooms marrying older brides continued
(see Australian Social Trends 1997, Age at
first marriage, pp. 27–29). Among
remarriages, the difference between
bridegrooms and brides was on average about
four years. However, the age differences seem
to be related to whether both or only one
partner is divorced.
Children under 16 from
previous marriage
Bridegrooms
Brides
No children
14 484
13 482
9 405
9 127
Had children
When both the bridegroom and the bride
were remarrying after divorce, the
bridegroom was likely to be older than the
bride (69% were older): most commonly
about 1–4 years older than the bride. When
the bridegroom was divorced, and his bride
had not been married before, the bridegroom
was even more likely to be older than the
bride (87% were older): most commonly
about 4–7 years older.
Total(a)
23 940
22 634
Number of children(b)
15 662
15 267
However, when the bridegroom had not been
married before, but his bride was previously
divorced, the bridegroom was more likely to
be younger than the bride (53% were
younger): most commonly up to one year
younger. These patterns seem to be fairly
stable since the distributions of age difference
between partners in remarriages celebrated in
1977 were very similar.
Children and remarriages
Length of remarriages
The act of remarriage could be taken to
reaffirm a commitment to lifelong partnership
despite the experience of marriage
breakdown. However, the reality is that
couples that were previously divorced are
slightly more likely to divorce than those who
had not been previously married2.
Information on the length of remarriages that
ended recently is not available because the
previous marital status of divorcing couples is
no longer recorded. However, divorce data
from the last year of availability, 1994, can be
used to show the differences between the
lengths of first marriages and remarriages
among people who had been divorced.
Of the divorces made absolute in 1994, those
made between couples who had both been in
their first marriage had had a median
marriage length until separation of nine
years. Couples who had both been divorced
previously had had a shorter median length of
marriage until separation of five years.3
48
Previously divorced bridegrooms and
brides who remarried in 1997, children
from previous marriage
• ABS • AUSTRALIAN SOCIAL TRENDS • 4102.0 • 1999
(a) Includes not stated.
(b) Children of bridegrooms and brides should not be added
since double counting is possible if a divorced couple
with children remarried in the same year.
Source: Marriages and Divorces, Australia, 1997
(Cat. no. 3310.0).
Partners entering into a remarriage provide
some information about dependent children
from their previous marriage on the
registration form. Since this information is
asked only of previously married people,
information on children from de facto
relationships is not available.
The information supplied on the marriage
registration forms of previously divorced
people remarrying in 1997 indicates that
about 40% of brides and 39% of bridegrooms
had children under 16 from their previous
marriage. However, this information does not
indicate that these people had responsibility
for the day-to-day care of these children.
Endnotes
1 Australian Bureau of Statistics 1997, Marriages
and Divorces, Australia, unpublished data.
2 Australian Bureau of Statistics 1995, How many
marriages end in divorce? in Marriages and
Divorces, Australia, 1994, Cat. no. 3310.0, ABS,
Canberra.
3 Australian Bureau of Statistics 1994, Marriages
and Divorces, Australia, unpublished data.
Health
Page
National and State summary tables . . . . . . . . . . . . . . . . . . . . . . . . . . . 50
HEALTH STATUS
Health of older people
...............................................
57
In this report, the health of older people is explored, by providing
information on their mortality rates and disability status, their health
conditions and health-related risk factors, as well as on their recent health
actions.
Health and socio-economic disadvantage of area
......
62
.....................................................................
67
Information from the 1995 National Health Survey was linked to a
census-based ranking of small areas according to relative socio-economic
disadvantage. This review outlines differences in health status and
health-related behaviours according to socio-economic status by area.
MORTALITY AND MORBIDITY
Asthma
This article presents 1995 National Health Survey findings on self-reported
prevalence of asthma and the health-related actions that people took
because of their condition. It also examines the relationship between
smoking and asthma. Recent trends in deaths due to asthma are
discussed.
HEALTH STATUS
Mental health
...........................................................
71
In 1997, the prevalence of mental disorder was similar for men and
women (17% and 18% respectively). However, as this report shows, there
were differences in the types of mental disorders experienced by men and
women, and by people at different ages.
ABS • AUSTRALIAN SOCIAL TRENDS • 4102.0 • 1999 •
49
Health — national summary
HEALTH STATUS
Life expectancy
Male life expectancy at birth
Female life expectancy at birth
Male life expectancy at 65 years
Female life expectancy at 65 years
Male disability-free
life expectancy at birth
Female disability-free
life expectancy at birth
Mortality
Total number of deaths
Crude death rate
(per 1,000 population)
Standardised death rate
(per 1,000 population)
Infant mortality rate
(per 1,000 live births)
Perinatal mortality rate
(per 1,000 live births
and fetal deaths combined)
Disability
Disability with specific restrictions
(per 100 population)(a)
CAUSES OF DEATH
Units
1987
1988
1989
1990
1991
1992
1993
1994
1995
1996
1997
years
73.0
73.1
73.3
73.9
74.4
74.5
75.0
75.0
75.0
75.2
75.6
years
79.5
79.5
79.6
80.1
80.4
80.4
80.9
80.9
80.8
81.1
81.3
years
14.7
14.8
14.7
15.2
15.4
15.4
15.7
15.7
15.7
15.8
16.1
years
18.6
18.7
18.7
19.0
19.1
19.2
19.5
19.7
19.5
19.6
19.8
years
n.a.
58.4
n.a.
n.a.
n.a.
n.a.
58.4
n.a.
n.a.
n.a.
n.a.
years
n.a.
63.4
n.a.
n.a.
n.a.
n.a.
64.2
n.a.
n.a.
n.a.
n.a.
'000
117.3
119.9
124.2
120.1
119.1
123.7
121.6
126.7
125.1
128.7
129.4
no.
7.2
7.2
7.4
7.0
6.9
7.1
6.9
7.1
6.9
7.0
7.0
no.
7.6
7.5
7.6
7.2
6.9
6.9
6.6
6.7
6.5
6.4
6.2
no.
8.7
8.7
8.0
8.2
7.1
7.0
6.1
5.9
5.7
5.8
5.3
no.
11.5
11.6
11.0
11.3
10.6
10.7
9.2
9.1
9.4
10.0
9.2
%.
n.a.
13.6
n.a.
n.a.
n.a.
n.a.
13.6
n.a.
n.a.
n.a.
n.a.
1987
1988
1989
1990
1991
1992
1993
1994
1995
1996
1997
no.
180
184
183
181
181
181
180
181
r177
177
171
no.
208
199
200
186
176
177
162
161
151
145
137
no.
82
79
78
72
69
67
65
67
63
61
56
no.
64
65
64
60
60
59
57
59
56
55
52
no.
15
17
18
17
18
18
19
19
19
20
19
no.
27
27
27
27
27
25
27
27
26
25
24
no.
30
31
32
32
31
34
35
35
33
33
29
no.
6
6
6
7
6
7
7
7
7
7
6
no.
282
271
271
250
237
235
219
216
204
196
182
no.
150
143
145
136
127
130
117
118
109
105
101
no.
13
13
13
13
13
14
14
15
14
15
14
no.
17
19
17
15
13
12
11
11
11
11
10
no.
54
55
49
42
38
31
33
30
32
32
29
no.
18
18
18
14
12
12
10
10
11
8
10
no.
14
13
13
13
14
13
12
13
13
13
15
no.
24
28
24
27
27
27
25
27
25
25
31
no.
6
4
3
4
6
6
4
4
6
4
7
no.
n.a.
1
2
3
3
4
4
4
4
3
2
Units
Death rates per 100,000 population —
Leading causes(a)
Cancer
Ischaemic heart disease
Stroke
Selected cancers(a)
Male lung cancer
Female lung cancer
Female breast cancer
Prostate cancer
Skin cancer
Heart disease and diabetes(a)
Male ischaemic heart disease
Female ischaemic heart disease
Diabetes mellitus
Accidents and suicide
Motor vehicle traffic accident(a)
Male 15–24 years
motor vehicle traffic accident
Female 15–24 years
motor vehicle traffic accident
Suicide(a)
Male 15–24 years suicide
Female 15–24 years suicide
AIDS(a)
AIDS-related
(a) Rates are age-standardised.
Reference periods:
50
All health status data and causes of death data are for the calendar year.
• ABS • AUSTRALIAN SOCIAL TRENDS • 4102.0 • 1999
Health — national summary
RISK FACTORS
Immunisation status
Children not fully immunised
aged 3 months to 6 years
(of children 3 months to 6 years)
Drinking and smoking
Alcohol: apparent
consumption per person per day
Tobacco: apparent
consumption per person per day
Diet and exercise
Total fats: apparent
consumption per person per day
Persons who do not exercise
for sport, recreation or fitness
(of persons 18 years and over)(a)
SERVICES
Hospital separations
(per 1,000 population)
Hospital beds
(per 1,000 population)
Units
continued
1987
1988
1989
1990
1991
1992
1993
1994
1995
1996
1997
n.a.
n.a.
n.a.
45.9
n.a.
n.a.
n.a.
n.a.
47.9
n.a.
n.a.
30.4
30.7
30.2
29.9
28.6
27.3
26.5
27.3
r26.8
26.5
26.3
grams
6.1
5.8
5.5
5.6
5.2
5.3
4.7
4.3
4.1
3.9
3.9
grams
56.3
55.8
55.4
54.5
r53.5
r53.3
r52.2
r53.0
r51.8
r52.7
49.4
n.a.
n.a.
n.a.
35.8
n.a.
n.a.
n.a.
n.a.
34.0
n.a.
n.a.
1987
1988
1989
1990
1991
1992
1993
1994
1995
1996
1997
no.
n.a.
214
n.a.
225
n.a.
237
247
260
274
285
289
%
mls
%
Units
no.
5.4
5.3
5.2
5.0
5.0
4.5
4.4
4.2
4.3
4.3
4.2
Average length of stay in hospital
days
6.3
6.2
5.9
5.6
5.1
4.8
4.8
4.7
r4.5
4.3
4.2
Doctors (per 100,000 population)
no.
n.a.
n.a.
n.a.
n.a.
225
n.a.
n.a.
n.a.
n.a.
241
n.a.
Nursing home and hostel beds
(per 1,000 population
aged 70 years and over)
no.
n.a.
98.4
97.2
95.1
94.0
94.2
94.1
92.6
90.0
90.9
89.2
no.
8.0
8.2
8.5
8.5
8.5
8.9
9.7
10.0
10.3
10.5
10.5
no.
6.4
6.6
6.8
6.9
6.9
7.2
7.8
8.2
8.4
8.7
8.7
no.
9.6
9.8
10.2
10.1
10.1
10.6
11.5
11.8
12.2
12.4
12.4
no.
14.6
14.8
15.2
15.3
15.4
16.4
17.9
18.8
19.6
20.5
20.9
%
19.8
19.7
19.6
20.0
20.6
21.0
21.4
22.0
22.5
23.0
23.6
Units
1987
1988
1989
1990
1991
1992
1993
1994
1995
1996
1997
%
48.3
47.0
45.5
44.5
43.7
41.0
39.5
37.2
34.9
33.6
31.9
$
1 571
1 603
1 661
r1 700
r1 713
r1 736
r1 785
1 835
r1 891
p1 963
p1 996
%
8.0
7.8
7.7
7.8
r8.2
r8.5
8.6
8.5
r8.4
r8.4
p8.4
Medicare usage
Average Medicare services
processed per person(a)
Average Medicare services
processed per male(a)
Average Medicare services
processed per female(a)
Average Medicare services processed
per person aged 65 years and over
Proportion of Medicare services used
by persons aged 65 years and over
EXPENDITURE
Persons with private
health insurance
Total health expenditure per
person per year (1989–90 prices)
Total health expenditure
as a proportion of GDP
(a) Rates are age-standardised.
Reference periods:
Immunisation status data are at April. Apparent consumption and expenditure data (except private health
insurance data which are at the June quarter) and services data (except doctors per 100,000 population which is
at census date) are for the year ended 30 June.
ABS • AUSTRALIAN SOCIAL TRENDS • 4102.0 • 1999 •
51
Health — State summary
HEALTH STATUS
Life expectancy
Male life expectancy at birth
Female life expectancy at birth
Mortality
Total number of deaths
Crude death rate
(per 1,000 population)
Standardised death rate
(per 1,000 population)
Infant mortality rate
(per 1,000 live births)
Perinatal mortality rate
(per 1,000 live births
and fetal deaths combined)
Units
Years
NSW
Vic.
Qld
SA
WA
Tas.
NT(a)
ACT
Aust.
years
1997
75.4
75.8
75.4
75.7
75.7
74.8
70.0
77.1
75.6
years
1997
81.2
81.4
81.3
81.5
81.6
80.1
74.7
81.3
81.3
'000
1997
45.6
33.3
21.9
11.7
10.8
3.8
0.9
1.3
129.4
no.
1997
7.3
7.2
6.5
7.9
6.0
8.0
4.8
4.3
7.0
no.
1997
6.3
6.2
6.2
6.1
6.0
6.8
9.8
6.0
6.2
no.
1997
5.2
4.9
5.8
4.7
5.3
6.5
12.5
3.8
5.3
no.
1997
9.8
8.6
9.1
8.2
8.1
11.6
15.5
6.6
9.2
1995
2.1
1.8
2.6
1.9
2.1
2.4
2.0
1.9
2.1
1995
2.9
2.8
2.8
2.7
2.4
3.6
*1.4
2.7
2.8
Morbidity and disability (per 100 population)(b)
Cancer
Heart disease
Diabetes
Asthma
Injury
Disability with specific restrictions(b)
CAUSES OF DEATH
%
%
%
%
%
%
Units
1995
2.0
2.4
2.0
2.7
2.5
2.6
2.5
2.0
2.3
1995
10.4
11.2
13.3
11.2
11.5
10.2
12.7
11.2
11.3
1995
5.8
5.6
7.7
6.4
7.6
7.2
8.7
7.6
6.4
1998
16.6
15.7
17.8
18.9
17.6
18.7
16.1
16.7
16.9
NSW
Vic.
Qld
SA
WA
Tas.
NT
ACT
Aust.
Years
Death rates per 100,000 population —
Leading causes(b)
Cancer
Ischaemic heart disease
Stroke
Selected cancers(b)
Male lung cancer
Female lung cancer
Female breast cancer
Prostate cancer
Skin cancer
Heart disease and diabetes(b)
Male ischaemic heart disease
Female ischaemic heart disease
Diabetes mellitus
Accidents and suicide
Motor vehicle traffic accident(b)
Male 15–24 years
motor vehicle traffic accident(c)
Female 15–24 years
motor vehicle traffic accident(c)
Suicide(a)
Male 15–24 years suicide(c)
Female 15–24 years suicide(c)
AIDS(b)
AIDS-related
no.
1997
167
176
169
169
171
182
207
158
171
no.
1997
141
132
147
136
119
142
164
124
137
no.
1997
59
52
56
57
52
62
96
63
56
no.
1997
51
53
54
52
51
56
61
30
52
no.
1997
18
20
20
18
20
23
41
22
19
no.
1997
24
27
22
24
24
19
20
25
24
no.
1997
30
31
29
28
27
34
33
18
29
no.
1997
7
5
7
5
6
4
1
6
6
no.
1997
184
175
195
185
162
198
194
182
182
no.
1997
106
98
106
98
85
101
134
80
101
no.
1997
9
18
14
15
15
14
37
13
14
no.
1997
9
10
12
10
12
7
25
6
10
no.
1997
24
28
35
26
38
**
**
**
29
no.
1997
9
8
17
10
12
**
**
**
10
no.
1997
15
14
16
13
14
11
22
13
15
no.
1997
31
30
37
29
25
**
**
**
31
no.
1997
7
5
9
7
7
**
**
**
7
no.
1997
2
2
1
1
1
**
2
**
2
(a) Morbidity and disability estimates for Northern Territory relate to mainly urban areas only.
(b) Rates are age-standardised.
(c) Data for Tasmania, Northern Territory and Australian Capital Territory are not available as numbers are too low for reliable rates.
Reference periods:
52
All health status data and causes of death data are for the calendar year.
• ABS • AUSTRALIAN SOCIAL TRENDS • 4102.0 • 1999
Health — State summary
RISK FACTORS
Immunisation status
Children not fully immunised
aged 3 months to 6 years
(of children 3 months to 6 years)
Drinking and smoking(b)
Male medium/high-risk drinkers
(of males 18 years and over)
Female medium/high-risk drinkers
(of females 18 years and over)
Male current smokers
(of males 18 years and over)
Female current smokers
(of females 18 years and over)
Diet and exercise(b)
Male overweight/obese adults
(of males 18 years and over)
Female overweight/obese adults
(of females 18 years and over)
Males who do not exercise for
sport, recreation or fitness
(of males 18 years and over)
Females who do not exercise for
sport, recreation or fitness
(of females 18 years and over)
High blood pressure(b)
Male hypertension
(of males 18 years and over)
Female hypertension
(of females 18 years and over)
SERVICES
Hospital separations
(per 1,000 population)
Hospital beds
(per 1,000 population)
Average length of stay in hospital
Doctors (per 100,000 population)
Nursing home and hostel beds
(per 1,000 population
aged 70 years and over)
Medicare usage
Average Medicare services
processed per person(b)
Average Medicare services
processed per male(b)
Average Medicare services
processed per female(b)
Average Medicare services processed
per person aged 65 years and over
Proportion of Medicare services used
by persons aged 65 years and over
EXPENDITURE
Persons with private
health insurance(c)
Units
Years
continued
NSW
Vic.
Qld
SA
WA
Tas.
NT(a)
ACT
Aust.
%
1995
46.1
48.8
52.5
50.3
40.7
57.0
46.5
36.5
47.9
%
1995
10.9
8.9
11.4
10.2
11.4
9.6
24.6
12.2
10.6
%
1995
6.4
5.3
6.5
6.4
6.6
4.7
5.9
7.1
6.1
%
1995
27.1
26.7
29.0
26.6
26.6
27.2
30.2
23.6
27.3
%
1995
20.0
20.0
21.7
20.0
18.8
24.5
26.0
19.3
20.3
%
1995
62.5
64.6
62.1
64.7
60.5
66.4
58.9
63.1
63.0
%
1995
45.3
48.9
43.5
49.4
45.3
53.6
43.5
50.4
46.5
%
1995
34.5
34.2
33.8
34.0
29.7
33.8
42.6
22.6
33.7
%
1995
37.4
32.4
34.8
34.8
28.5
36.1
34.6
28.0
34.4
%
1995
17.1
17.1
19.6
18.3
15.6
17.7
17.3
16.9
17.6
%
1995
14.6
15.0
15.1
17.2
15.6
17.4
9.3
13.7
15.1
NSW
Vic.
Qld
SA
WA
Tas.
NT
ACT
Aust.
289
Units
Years
no.
1996–97
282
297
300
320
266
277
261
238
no.
1996–97
4.0
4.1
4.5
4.8
4.2
4.3
4.0
3.4
4.2
days
1996–97
4.3
4.0
4.4
4.2
4.0
5.1
3.8
3.9
4.2
no.
1996
250
237
233
264
221
220
249
259
241
no.
1996–97
89.0
84.7
95.0
90.6
91.4
88.0
102.8
87.3
89.2
no.
1996–97
11.3
10.6
10.5
9.7
9.6
9.5
6.4
9.4
10.5
no.
1996–97
9.4
8.8
8.4
8.1
7.7
7.4
5.1
7.7
8.7
no.
1996–97
13.1
12.4
12.4
11.3
11.6
11.5
8.0
11.1
12.4
no.
1996–97
22.0
21.1
20.7
19.4
19.3
17.8
12.3
19.1
20.9
%
1996–97
24.1
24.4
22.2
27.1
21.1
23.7
7.0
16.0
23.6
NSW
Vic.
Qld
SA
WA
Tas.
NT
ACT
Aust.
32.1
31.4
30.0
32.8
35.2
34.9
24.4
n.a.
31.9
Units
%
Years
1997
(a) Risk factor estimates for NT relate to mainly urban areas only.
(b) Rates are age-standardised.
(c) The ACT is included in NSW.
Reference periods:
Immunisation status data are at April. Overweight/obese and hypertension data are for the year ended
March 1996. Services data (except for doctors per 100,000 population which is at census date) are for the
year ended 30 June. Private health insurance data are at the June quarter.
ABS • AUSTRALIAN SOCIAL TRENDS • 4102.0 • 1999 •
53
Health — definitions and references
AIDS-related death — death where AIDS is
mentioned anywhere on the death certificate as a
contributing factor or an underlying cause.
Reference: Causes of Death, Australia
(Cat. no. 3303.0).
Alcohol: apparent consumption — millilitres of pure
alcohol (not total alcoholic beverages) consumed,
divided by the population 15 and over. Apparent
consumption of beer and spirits is based on the
quantities on which excise duty was paid, and imports
cleared for consumption. Apparent consumption of
wine comprises quantities sold by winemakers and
imports cleared for consumption. Home-made beer
and wine are included.
Reference: Apparent Consumption of Foodstuffs and
Nutrients, Australia (Cat. no. 4306.0).
Apparent consumption — equals (commercial
production + estimated home production + imports
+ opening stocks) minus (exports + usage for
processed food + non-food usage + wastage +
closing stocks) divided by the population.
Reference: Apparent Consumption of Foodstuffs and
Nutrients, Australia (Cat. no. 4306.0).
Asthma — the number of people per 1,000
population reporting asthma as a recent condition
(within two weeks) or a long-term condition (lasting
or expecting to last six months or more), asthma
being a narrowing of the airways within the lung.
Reference: National Health Survey: Users' Guide,
Australia 1995, (Cat. no. 4363.0).
Average length of stay in hospital — the total number
of occupied bed days in both public and private
hospitals divided by the total number of separations.
Reference: Private Hospitals, Australia
(Cat. no. 4390.0); Australian Hospital Statistics,
1996–97, Australian Institute of Health and Welfare.
Average Medicare services processed — average
number of services processed per Australian resident.
Reference: Health Insurance Commission, Financial
Statements and Statistical Tables, 1996-97
Breast cancer deaths — malignant neoplasm of the
female breast. ICD-9 code 174.
Reference: Causes of Death, Australia
(Cat. no. 3303.0).
Cancer deaths — malignant neoplasms. ICD-9 codes
140–208.
Reference: Causes of Death, Australia
(Cat. no. 3303.0).
Cancer — the number of people per 1,000 population
reporting cancer as a recent condition (within two
weeks) or a long-term condition (lasting or expecting
to last six months or more), including both benign
and malignant cancers.
Reference: National Health Survey: Users' Guide,
Australia 1995, (Cat. no. 4363.0).
Children not fully immunised — the proportion of
children reported as not having received all the
required vaccinations for diphtheria, tetanus,
poliomyelitis, whooping cough, measles and mumps
for their age. The required vaccinations are based on
the 1986 NH&MRC Standard Childhood Vaccination
Schedule.
Reference: Children's Immunisation, Australia
(Cat. no. 4352.0).
Coronary heart disease — coronary heart disease
includes heart attack (acute myocardial infarction,
coronary occlusion) and angina (angina pectoris).
ICD-9 codes 410–414.
Reference: Causes of Death, Australia
(Cat. no. 3303.0).
Crude death rate — number of deaths registered per
1,000 of the estimated resident population at 30 June
of that year.
Reference: Deaths, Australia (Cat. no. 3302.0).
54
•
ABS • AUSTRALIAN SOCIAL TRENDS • 4102.0 • 1999
Current smokers — persons aged 18 years and over
who smoke one or more manufactured (packet)
cigarettes, roll-your-own cigarettes, cigars or pipes per
day. Smoking excludes chewing tobacco and smoking
of non-tobacco products.
Reference: National Health Survey: Health Risk
Factors (Cat. no. 4380.0).
Diabetes mellitus deaths — deaths where diabetes
mellitus is mentioned on the death certificate as the
underlying cause. ICD-9 code 250.
Reference: Causes of Death, Australia
(Cat. no. 3303.0).
Diabetes — the number of people per 1,000
population reporting diabetes as a recent condition
(within two weeks) or a long-term condition (lasting
or expecting to last six months or more), including
Diabetes Mellitus Type 1 and 2 and unspecified
diabetes.
Reference: National Health Survey: Users' Guide,
Australia, 1995 (Cat. no. 4363.0).
Disability-free life expectancy — the average number
of years at birth a person might expect to live free of
disability. Disability is the presence of a limitation,
restriction or impairment due to a physical, emotional
or nervous condition which had lasted or was likely to
last 6 months or more.
Reference: Australian Health Trends, 1995, Australian
Institute of Health and Welfare.
Disability with specific restrictions — people with a
disability which causes difficulty or they need
assistance with, or use an aid for, self-care, mobility,
communication, employment and/or education
activities. Includes all children aged under 5 with a
disability .
Reference: Disability, Aging and Carers: Summary of
Findings, Australia, 1998 (Cat. no. 4430.0).
Doctors per 100,000 population — the number of
practising general and specialist medical practitioners
per 100,000 estimated mean resident population.
Reference: Australia's Health, 1998, Australian
Institute of Health and Welfare
Exercise (persons who do not exercise) — persons
who reported that within the two-week reference
period they did not undertake exercise activities for
sport, recreation or fitness, so as to cause a moderate
increase in heart rate or breathing.
Reference: National Health Survey: Users' Guide,
Australia, 1995 (Cat. no. 4363.0).
Fetal death — the delivery of a child weighing at least
400 grams at delivery (or, when birthweight is
unavailable, of at least 20 weeks gestation) which did
not, at any time after delivery, breathe or show any
other evidence of life such as a heart beat.
Reference: Causes of Death, Australia
(Cat. no. 3303.0).
Heart disease — the number of people per 1,000
population reporting heart disease as a recent
condition (within two weeks) or a long-term
condition (lasting or expecting to last six months or
more), including heart attack, coronary thrombosis,
angina and leaking valve.
Reference: National Health Survey: Users' Guide,
Australia, 1995 (Cat. no. 4363.0).
Hospital beds (per 1,000 population) — the total number
of beds in all hospitals (public and private) providing
acute care services per 1,000 estimated mean resident
population. Hospitals providing acute care services
are those in which the treatments typically require
short durations of stay.
Reference: Private Hospitals, Australia
(Cat. no. 4390.0); Australian Institute of Health and
Welfare, National Public Hospital Establishments
Database (unpublished data).
Health — definitions and references
Hospital separations (per 1,000 population) — the total
number of separations in all hospitals (public and
private) providing acute care services per 1,000
estimated resident population at 31 December of the
reference year. A separation is an episode of care
which can be a total hospital stay (from admission to
discharge, transfer or death) or a portion of a hospital
stay ending in a change of status (for example from
acute care to rehabilitation). The inclusion of status
changes has been progressively introduced since
1995–96. Hospitals providing acute care services are
those in which the treatments typically require short
durations of stay.
Reference: Australian Hospital Statistics 1996–97 and
earlier editions, Australian Institute of Health and
Welfare
Hypertension — high blood pressure, either treated or
untreated. People are considered hypertensive if they
are on tablets for blood pressure and/or their systolic
blood pressure is 160 mmHg or greater and/or their
diastolic blood pressure is 95 mmHg or greater.
Reference: National Nutrition Survey: Users' Guide,
Australia, 1995 (Cat. no. 4801.0)
ICD-9 — International Classification of Diseases 9th
revision, clinical modification.
Reference: International Classification of Diseases
9th Revision: (ICD-9) National Center for Health
Statistics, United States.
Infant mortality rate — the number of deaths of
children under one year of age per 1,000 live births.
Reference: Deaths, Australia (Cat. no. 3302.0).
Injury — the number of people per 1,000 population
reporting injury as a recent condition (within two
weeks) or a long-term condition (lasting or expecting
to last six months or more), including fractures,
dislocations, sprains, wounds, bruising, crushing,
burns, poisoning and surgical complications.
Reference: National Health Survey: Users' Guide,
Australia, 1995 (Cat. no. 4363.0).
Life expectancy — the average number of years a
newborn infant of a given sex would be expected to
live if the age-specific death rates of the reference
period continued throughout his or her lifetime.
For persons aged 65 of a given sex, it is the average
additional years of life expected if the age specific
death rates of the reference period continued
throughout his or her remaining life.
Reference: Deaths, Australia (Cat. no. 3302.0).
Live birth — the delivery of a child weighing at least
400 grams at delivery (or, when birthweight is
unavailable, of at least 20 weeks gestation) who after
being born, breathed or showed any other evidence
of life such as a heart beat.
Reference: Causes of Death, Australia
(Cat. no. 3303.0).
Lung cancer deaths — malignant neoplasm of the
trachea, bronchus and lung. ICD-9 code 162.
Reference: Causes of Death, Australia
(Cat. no. 3303.0).
Medium/high-risk drinkers — men aged 18 and over
who reported drinking 50–75ml of absolute alcohol
(medium-risk) or more than 75ml (high-risk) per day,
and women aged 18 and over who reported drinking
25–50ml of absolute alcohol (medium-risk) or more
than 50ml (high-risk) per day.
Reference: National Health Survey: Health Risk
Factors (Cat. no. 4380.0).
Motor vehicle traffic accident deaths — ICD-9 codes
E810–E819.
Reference: Causes of Death, Australia
(Cat. no. 3303.0).
Neonatal death — deaths of any child weighing at least
400 grams at delivery (or, when birthweight is
unavailable, of at least 20 weeks gestation) who was
born alive (as defined under live birth) and who died
within 28 days of birth.
Reference: Causes of Death, Australia
(Cat. no. 3303.0).
continued
Nursing home and hostel beds — the number of beds
which are provided for long-term nursing care to
chronically ill, frail or disabled persons, and beds
provided for people who are unable to live wholly
independently but do not require nursing care,
per 1,000 of the population aged 70 and over.
Reference: Nursing Homes in Australia 1996–97:
A statistical overview, AIHW; Hostels in Australia
1996–97: A statistical overview, AIHW and DHFS.
Overweight or obese adults — overweight is defined
by a body mass index (BMI) greater than or equal to
25 and less than 30, while obesity is defined by a BMI
greater than or equal to 30, as recommended by
WHO (1995). BMI is body weight in kilograms divided
by the square of the height in metres.
Reference: National Nutrition Survey Selected
Highlights, Australia, 1995 (Cat. no. 4802.0).
Perinatal mortality rate — the annual number of fetal
and neonatal deaths per 1,000 live births and fetal
deaths combined (where birthweight was at least
400 grams).
Reference: Causes of Death, Australia
(Cat. no. 3303.0).
Persons with private health insurance — proportion
of the total population with private basic hospital
insurance.
Reference: Private Health Insurance Administration
Council, Annual Reports.
Prostate cancer — malignant neoplasm of the
prostate gland. ICD-9 code 185.
Reference: Causes of Death, Australia
(Cat. no. 3303.0).
Skin cancer — malignant neoplasm of the skin,
including both melanoma and non-melanocytic skin
cancer. ICD-9 codes 172–173.
Reference: Causes of Death, Australia
(Cat. no. 3303.0).
Standardised rates — these enable the comparison of
rates between populations with differing age
structures by relating them to a standard population.
These rates are the overall rates that would have
prevailed in a standard population if it had
experienced at each age the rates of the population
being studied. Mortality and Medicare usage rates use
the 1991 Australian population as the standard
population. All other standardised rates use the
Australian population of the year that the survey was
last collected.
Reference: Deaths, Australia (Cat. no. 3302.0)
Stroke — cerebrovascular disease, being a diseased
condition of the brain due to an interruption of the
blood supply. Caused by a blockage (embolism) or
rupture (haemorrhage) of blood vessels within or
leading to the brain. ICD-9 codes 430-438.
Reference: Causes of Death, Australia
(Cat. no. 3303.0).
Suicide — ICD-9 codes E950–E959.
Reference: Causes of Death, Australia
(Cat. no. 3303.0).
Tobacco: apparent consumption — grams of tobacco
consumed divided by the population aged 15 and
over. Apparent consumption of tobacco is based on
the quantity on which import duty and excise (on
cigarettes only) was paid and does not include duty
or excise-free tobacco.
Reference: Unpublished ABS International Trade data.
Total fats: apparent consumption — the total fat
content of food apparently consumed, in grams,
divided by the total population.
Reference: Apparent Consumption of Foodstuffs and
Nutrients, Australia (Cat. no. 4306.0).
Total health expenditure as a proportion of GDP/per
person — total health expenditure as a proportion of
gross domestic product, in current prices. Total
health expenditure per person is expressed in
Australian dollars at constant 1989–90 prices.
Reference: Health Expenditure Bulletin, Australian
Institute of Health and Welfare.
A B S • A U S T R A L I A N S O C I A L T R E N D S • 4 1 0 2 . 0 • 1 9 99 •
55
Health of older people
H E A L T H
S T A T U S
As indicated by falling levels of mortality, the
In 1995, 64% of older
health of the population, including people
aged 65 years or more, has greatly improved
during this century. For example, a boy born
in Australia during 1995–97 could expect to
live to 76 years of age, and a girl to 81 years,
compared to 55 and 59 years respectively for
those born in the period 1901–10.1,2
people rated their
health as good, very
good or excellent.
Fewer older people
smoked (11%) than in
ABS population projections indicate that by
2051 the proportion of the total population
who are aged 65 years or more could almost
double (see Australian Social Trends 1999,
Our ageing population, pp. 6–10). This has
prompted community and government
concerns about future health care costs.
Health expenditure on older people (on
average $4,919 per person aged 65 or more
in 1993–94) was nearly four times that on
people aged under 65 years ($1,301).
However, the Australian Institute of Health
and Welfare has estimated that only 22% of
the total increase in health costs over the last
two decades (1975–76 to 1996–97), could be
accounted for by increases in the proportion
of older people in the population.3
1989–90 (14%), but
more of them were
likely to be overweight
or obese (45%, up from
41%).
Mortality trends and cause of death
Improvements in life expectancy are a direct
result of the lowering of mortality rates at all
ages. Over the last 30 years, improvements in
Health status
Older people in this review comprise people aged
65 years and over.
Standardised death rates enable the comparison
of rates between populations of differing age
structures by relating them to a standard
population. The population of men and women
aged 65 and over have different age profiles and,
in addition, their age profiles have changed over
time. Death rates in this review have been
standardised to take these factors into account.
Causes of death classifications used in this review
are based on the ninth revision of the
International Classification of Diseases (ICD–9
code) as follows: ischaemic heart disease
(410–414); cancer ((140–208); stroke (430–438);
respiratory disease (460–519); dementia (290,
294.1, 331.0); digestive system disease (520–579);
genitourinary disease (580–629); diabetes mellitus
(250); accidents, poisonings and violence
(E800–E999); accidents (E800–E949); and suicide
(E950–E959).
Recent or long-term conditions refer to medical
conditions (illness, injury or disability)
experienced in the two weeks prior to interview,
or to medical conditions which have lasted at least
six months or which the respondent expects to
last for six months or more.
Recent health actions refer to activities related to
a person's health taken during the two weeks
prior to interview, such as visiting a doctor, taking
medication, or changing daily routines in
response to a health condition.
Leading causes of death for persons aged 65 and over(a)
1986
1996
Males Females Persons
Males
Females Persons
rate
Causes of death
rate
rate
rate
Ischaemic heart disease
2 064 1 263
1 602
1 506
928
1 172
Cancer
1 541
797
1 104
1 571
815
1 124
Stroke
711
692
707
557
516
537
Respiratory disease
681
237
411
592
299
412
92
87
90
158
175
171
Digestive system disease
195
152
172
153
115
131
Diabetes mellitus
109
92
98
138
96
113
Genitourinary disease
118
86
97
113
84
94
Accidents, poison, violence
139
87
109
117
67
88
107
79
91
88
60
72
31
7
17
26
5
14
6 542 4 195
5 172
5 695 3 711
4 532
Dementia
Accidents
Suicide
All causes
rate
rate
(a) Age-standardised death rates per 100,000 of the 1996 population aged 65 years and over.
Source: Unpublished data, Causes of Death collection.
mortality rates for older people were most
marked for those aged in their mid to late
60s. Between 1967 and 1997, the death rate
for those aged 65–69 decreased by 47% (from
3,120 to 1,660 per 100,000 people), while
that for persons aged 85 and over declined by
29% (from 20,580 to 14,610 per 100,000
people).1 The faster decline among the
younger age group has been partly due to the
dramatic drop in deaths from cardiovascular
diseases.3 Over the last decade (1986 to
1996), the overall death rate for persons aged
65 and over (standardised for age
composition changes) fell by 12% to
4,532 deaths per 100,000 in 1996.
The leading causes of death for people aged
65 years and over did not change over the last
decade (1986 to 1996). There were, however,
some changes in their ranking, particularly for
older men. This was because of substantial
declines in deaths from some of these
ABS • AUSTRALIAN SOCIAL TRENDS • 4102.0 • 1999
•
57
HEALTH STATUS
diseases, such as ischaemic heart disease,
stroke and diseases of the digestive system.
The lower mortality rates for circulatory
diseases (which include ischaemic heart
disease and stroke) stemmed from reductions
in tobacco smoking, improvements in medical
treatments and control of some of the
cardiovascular risk factors, such as high blood
pressure and high cholesterol levels.3
In 1996, ischaemic heart disease remained the
leading cause of death for older people
(26% of all deaths, down from 31% in 1986).
Cancer deaths, the second most common
cause, contributed 25% of all deaths – up
from 22% in 1986. Older men in 1996 were
slightly more likely to die of cancer than of
ischaemic heart disease.
Between 1986 and 1996, the standardised
death rate for breast cancer declined, while
the rate for some other cancers increased, and
these varied between men and women. For
example, the standardised death rate for older
men from lung cancer decreased from 409 to
374 per 100,000, while that from prostate
cancer increased (245 to 287). During the
same period, the standardised death rate for
older women from lung cancer increased
(from 86 to 114 per 100,000) and that from
breast cancer declined (118 to 111).
Stroke remained the third leading cause of
death overall, although respiratory diseases,
as the fourth most common cause, were
closing the gap (and had become the third
most common cause of death for older men).
Dementia, which included Alzheimer's
disease, was the fifth leading cause of death.
This is a strongly age-related condition and as
the proportion of the elderly population aged
Long-term conditions(a) for persons aged 65 and over, 1995
Eye problems(b)
Arthritis
Hypertension
Ear or hearing problems
Self-assessed health status(a) of
persons aged 65 and over, 1995
%
80
Males
Females
60
40
20
0
65–74
75–84
Age group (years)
85+
(a) Proportion of persons in each age group who assessed
their own health as excellent, very good or good.
Source: Unpublished data, 1995 National Health Survey.
85 years and over increases, so will the
proportion of deaths from dementia. In 1996,
dementia deaths accounted for 3.8% of the
deaths of older people compared with 1.7%
in 1986. Some of this increase may be
because of changes in diagnostic practices.4
There were differences in the most common
cause of death depending on the age at which
people died. However, the patterns were the
same for both men and women. Deaths
among those aged 65–74 years were more
likely to have resulted from cancer than
ischaemic heart disease, whereas deaths
among those aged 85 years and over were
more likely to have been from ischaemic heart
disease than from cancer.
Self-assessed health status
Studies suggest that people's perceptions of
their own health generally give a good
indication of their mental and physical
condition and are also predictors of mortality
for those aged 65 and over.5 Information
collected from the 1995 National Health
Survey indicated that 63% of older men and
65% of older women rated their own health
as good, very good or excellent. However,
proportions with good to excellent self-rated
health decreased with age.
Heart disease
Recent and long-term conditions
Varicose veins
High cholesterol
Males
Females
0
20
40
60
80
100
%
(a) People may report more than one illness condition, therefore components may not add to total.
(b) Includes eye problems which can be corrected by glasses.
Source: Unpublished data, 1995 National Health Survey.
58
• ABS • AUSTRALIAN SOCIAL TRENDS • 4102.0 • 1999
In 1995, 89% of older people reported
experiencing a recent illness, or a recent or
recurrent episode of a long-term illness, in
the two weeks prior to the survey. Of those
who experienced a recent illness only, the
most common were fluid problems (11%),
HEALTH STATUS
Health risk factors, for persons aged 65 and over(a), 1989–90 and 1995
1989–90
Health risk factors
1995
Males
Females
Males
Females
%
%
%
%
Body mass(b)
Underweight
7.5
15.3
5.4
12.4
Acceptable weight
47.2
46.6
46.2
45.0
Overweight
37.4
27.5
39.3
29.9
8.0
10.5
9.1
12.7
17.2
10.9
14.4
8.8
Obese
Smoker status
Smoker
Ex-smoker
54.2
19.4
58.1
23.5
Never smoked
28.6
69.8
27.5
67.7
Did not consume alcohol
39.0
63.6
40.5
65.2
Low consumption level
Alcohol risk level(c)
53.8
31.9
53.0
29.6
Medium consumption level
4.4
3.7
3.5
4.5
High consumption level
2.8
0.8
3.0
0.6
Did not exercise
37.0
46.2
38.3
47.3
Exercise level(c)
Low exercise level
26.7
32.6
28.4
30.2
Medium exercise level
17.0
12.8
16.8
13.7
High exercise level
19.2
8.4
16.4
8.9
(a) Age and sex standardised to the 1995 Australian population.
(b) Calculated as reported weight in kilograms divided by the square of reported height in metres. Excludes not known and
not stated.
(c) Based on reported activity during the two weeks prior to interview.
Source: Unpublished data, 1989–90 and 1995 National Health Surveys.
headaches (9%), insomnia (9%), dental
problems (7%), hypertension (5%) and
nerves, tension and nervousness (5%).
Most older people (99%) had one or more
long-term health conditions. The four most
common long-term conditions reported by
older people were eye problems – including
problems corrected by glasses – (96%),
arthritis (49%), hypertension (38%) and ear or
hearing problems (32%). However, not all
people with these conditions had taken a
recent health action for them.
For example, very few older people (6% or
less) with long-term eye problems and ear or
hearing problems had taken a recent health
action in relation to these conditions.
However, 86% of older people with long-term
hypertension had taken some recent action
for that condition – commonly medication to
keep their blood pressure down. Fewer older
people with high cholesterol or arthritis had
recent treatment or medication for their
condition (44% and 37% respectively).
There were some differences over time in the
proportions of people with certain health
conditions (the combined total of recent and
long-term conditions). After allowing for
changes in age distribution, there were higher
proportions of older people reporting
hypertension (41%) and high cholesterol
(12%) in 1995, than in 1989–90 (37% and 5%
respectively). However, the increase may have
been because of factors such as greater public
awareness of the importance of regular blood
pressure and cholesterol checks to monitor
for potential heart disease. There was also a
substantial increase in the prevalence of
varicose veins in older women
(16% compared with 7% in 1989–90).
Health risk factors
There are a number of factors which are
known to have an impact on the general
health of the population and which can
contribute to an increased risk of diseases
such as cardiovascular disease and cancer.
These factors include cigarette smoking,
ABS • AUSTRALIAN SOCIAL TRENDS • 4102.0 • 1999
•
59
HEALTH STATUS
excessive alcohol and fat consumption, high
blood pressure and cholesterol levels, limited
exercise and being overweight.6
Between 1989–90 and 1995, the main
changes in risk behaviour by older people
were a reported reduction in cigarette
smoking from 17% to 14% for men, and from
11% to 9% for women, and an increase in the
proportion of people who reported being
overweight or obese (up from 45% to 48% for
men, and from 38% to 43% for women).
Increasing overweight and obesity levels in
the community could slow the current
reduction in cardiovascular mortality.
More objective measures of body mass
available from the 1995 National Nutrition
Survey indicated that a larger proportion of
older people were overweight or obese
(71% of men and 62% of women) than was
revealed by the self-reporting measures
obtained from the 1995 National Health
Survey.
For all risk factors shown, except
participation in exercise, older women
demonstrated lower levels of risk behaviours
than older men.
Recent health actions
Most older people spend some time taking
care of their health, whether it is preventative
or on-going care, or attention to a specific
health problem. In 1995, more than nine out
of ten older people took some type of
Disability status of persons aged 65 and over, 1998
Persons
Disability status
No disability
Disability
Core activity restriction(a)
Total
Females
65–74
years
75–84
years
85 years
and over
65 years
and over
65 years
and over
%
%
%
%
%
55.5
38.9
15.8
45.9
46.2
44.5
61.1
84.2
54.1
53.8
38.0
57.0
83.2
47.0
50.1
Self care
14.3
28.3
63.1
19.6
27.0
Mobility
32.6
50.6
80.0
39.4
46.3
Communication
10.7
23.8
48.5
20.8
17.2
6.5
4.2
1.0
7.1
3.7
100.0
100.0
100.0
100.0
100.0
'000
'000
'000
'000
'000
No core activity restriction
Total
Males
1 294.8
750.5
226.0
993.3
1 277.9
(a) People may have more than one type of restriction, therefore components may not add to
total.
Source: Unpublished data, 1998 Survey of Disability, Ageing and Carers.
60
• ABS • AUSTRALIAN SOCIAL TRENDS • 4102.0 • 1999
Health actions taken(a) by persons
aged 65 and over, 1995
Males
Females
%
%
Used medication
Vitamins/minerals
24.6
30.9
Natural/herbal medications 10.1
15.4
Other medications
92.6
92.4
Consulted doctor
42.3
40.7
Consulted
other health professionals
10.9
13.7
Days of reduced activity
10.5
12.7
6.3
5.6
Consulted dentist
Casualty/emergency/
outpatients visit
5.5
4.1
Other health related contact
3.3
3.8
Day clinic visit
2.1
2.3
Hospitalisation
1.9
2.0
'000
'000
851.9
1 146.7
Total who took action(b)
(a) Health actions taken in the two weeks prior to the
survey.
(b) Includes other health actions. People may undertake
more than one type of action, therefore components
may not add to total.
Source: Unpublished data, 1995 National Health Survey.
health-related action in the two weeks prior
to the survey. The most common
health-related actions taken were the use of
medication – excluding vitamins and herbal
medicines – (92%), and visiting the
doctor (41%). Of all older people, 28% took
vitamins or minerals and 13% used natural or
herbal medications.
Older women were about as likely as older
men to visit the doctor or take medication,
but more likely to take vitamins or minerals
(31%) or natural or herbal medications (15%)
than men (25% and 10% respectively).
Trends in disability
Older people with disabilities have particular
health care needs and are more likely to need
assistance (see Australian Social Trends
1995, Older people with disabilities,
pp. 55–57). As this care will need to be
provided by others, there is interest in the
effect increasing longevity may have on the
prevalence of disability.
Disability rates in Australia have been rising
since data first became available in 1981.7 In
1998, more than half of men and women aged
HEALTH STATUS
65 years and over had a disability (54% each).
Most of these also had a core activity
restriction (87% and 93% respectively) which
meant that they had difficulty with one or
more daily tasks such as bathing, dressing,
eating, getting out of a chair or bed, walking,
using public transport or communicating with
others.
Of core activity restrictions, mobility
restriction was the most common type of
restriction for older men and women (39%
and 46% respectively), followed by self-care
restriction for women (27%) and
communication restriction for men (21%).
There were higher proportions of women
than of men for self care and mobility
restrictions. This is partly because women are
more highly represented in the oldest age
group (85 and over), a group whose
disabilities tend to be more serious.
Both disability and core activity restriction
increase with age, so there was a greater
proportion of those aged 85 years and over
who felt they needed assistance (92%) than of
those aged between 65 and 74 years (32%).
Apparent trends in the United States of
America during the 1980s suggest that
disability-free life expectancy has increased.8
In this country, at 65 years of age the number
of remaining years of life expected to be
disability-free has remained much the same
for men (6.7 years in 1988 compared to
6.6 years in 1998, when adjusted to 1988
definitions of disability). For women, there
has been a slight increase, from 8.6 years to
9.0 years. Overall, at birth, boys in 1998 could
expect to have 58 years of disability-free life,
and girls 62 years.9
Endnotes
1 Australian Bureau of Statistics, Deaths, Australia,
Cat. no. 3302.0, various years, ABS, Canberra.
2 Australian Bureau of Statistics 1997, Australian
Demographic Trends 1997, Cat. no. 3102.0, ABS,
Canberra.
3 Australian Institute of Health and Welfare 1998,
Australia's Health 1998, AIHW, Canberra.
4 Australian Bureau of Statistics 1996, Causes of
Death, Australia, 1995, Cat. no. 3303.0, ABS,
Canberra.
5 McCallum, J. et al. 1994, 'Self-rated health and
survival: a 7-year follow-up study of Australian
elderly', in American Journal of Public Health,
vol. 84, 1994, pp.1100–1105.
6 Australian Institute of Health and Welfare and
Commonwealth Department of Health and
Family Services 1997, First Report on National
Health Priority Areas 1996, AIHW Cat. no. PHE 1,
AIHW and DHFS, Canberra.
7 Australian Bureau of Statistics 1999, Disability,
Ageing and Carers: Summary of Findings,
Australia, 1998, Cat. no. 4430.0, ABS, Canberra.
8 Crimmins E.M., Saito Y. and Ingegneri D. 1997,
Trends in disability-free life expectancy in the
United States, 1970–90 in NUPRI reprint series
no. 69, January 1998, NUPRI, Tokyo.
9 Australian Bureau of Statistics, 1998 Survey of
Disability, Ageing and Carers (unpublished data).
ABS • AUSTRALIAN SOCIAL TRENDS • 4102.0 • 1999
•
61
Health and
socio-economic
disadvantage of area
H E A L T H
Those living in areas of
greater socio-economic
disadvantage rated
their own health more
negatively, had higher
rates of some illnesses,
and had less healthy
lifestyles than those in
other areas. They
visited their doctors
more often, but made
less use of some
preventative health
measures.
S T A T U S
There is a substantial body of evidence that
people of lower socio-economic status have
worse health than others. One measure of
socio-economic status which combines
information regarding a number of relevant
variables, such as income, education and
occupation, is the index of relative
socio-economic disadvantage of area. Best
regarded as a measure of the economic and
social characteristics of a person's local
environment, and to an extent indicative of
individual socio-economic status, the index is
based on aggregate census data for small
areas. Two National Health Surveys, in
1989/90 and 1995, confirmed that those in
more disadvantaged areas scored more
negatively than others on several health
indicators.1
These results may partly reflect downward
mobility among people with disabling
conditions. Moreover, the survey data are
self-reported, and so any variation by
socio-economic status may result from
differences in reporting behaviour rather than
differences in health. However, it is widely
accepted that socio-economic status affects
health.
A number of ways in which this may happen
have been suggested.2 Different economic
resources may result in differences in
nutrition, the standard of housing and in
2nd
3rd
4th
5th
Self-rating of health
Males
Females
10
15
20
%
(a) Aged 15 years and over. Age-standardised rates.
(b) 1st quintile – most disadvantaged; 5th quintile – least disadvantaged.
Source: Unpublished data, National Health Survey, 1995.
62
• ABS • AUSTRALIAN SOCIAL TRENDS • 4102.0 • 1999
In this review, socio-economic status has been
determined using the index of relative
socio-economic disadvantage constructed for
Census Collection Districts (CDs). CDs are usually
clusters of approximately 200–250 dwellings. CDs
with the greatest relative disadvantage typically
have high proportions of low income families,
unemployed people, people without educational
qualifications, households renting public housing
and people in unskilled and semi-skilled
occupations. Conversely, the least disadvantaged
areas tend to have higher proportions of high
income earners, professional workers and more
highly qualified people, as well as low
unemployment rates.
access to medical care. Education appears to
have an effect, independent of its connection
to higher income, possibly related to the
ability to obtain information and services. The
general degree of security people have is seen
as influencing health, with policy analysts
concerned about the levels of anxiety, social
isolation and marginalisation among those of
lower socio-economic status. Many studies
show a higher level of health risk behaviours
among people of lower socio-economic
status.2
1st
5
The ABS has developed indexes to describe the
socio-economic status of populations living in
different geographic areas.3 Using 1991
population census data, these have been derived
by a multivariant technique known as principal
component analysis. This technique summarises a
large number of socio-economic variables into a
single measure which can then be used to rank
areas (from highest to lowest) on a broad
socio-economic scale. By allocating the index
value of each area to individuals living in those
areas, people in low socio-economic status areas
can be readily distinguished from those living in
high socio-economic status areas.
In this review, people have been ranked
according to their index score and divided into
five equal groups (quintiles) from highest to
lowest. The first quintile lived in the most
disadvantaged areas, the fifth quintile in the least
disadvantaged areas.
Proportion(a) who rated their own health as fair or poor, by
quintiles of socio-economic disadvantage of area(b), 1995
0
Measuring socio-economic status
25
A person's perception of their own general
health status is considered a useful measure
of their current physical and mental health,
and a predictor of mortality in people aged
60 and over.4 In 1995, a greater proportion of
both males and females in the areas of
HEALTH STATUS
Proportion(a) who had selected conditions(b) by quintile of
socio-economic disadvantage of area, 1995
Quintile of socio-economic disadvantage of area(c)
Conditions
1st
2nd
3rd
4th
5th
Total
%
%
%
%
%
%
Arthritis
16.6
15.7
15.0
13.8
13.2
14.7
Hayfever
12.4
13.0
12.7
14.0
16.8
13.9
Asthma
12.7
10.5
11.5
10.9
11.0
11.3
Hypertension
11.8
11.3
10.9
10.2
9.6
10.7
Deafness
10.3
9.5
10.1
9.1
9.0
9.5
Back problems
6.8
6.3
7.0
6.5
6.5
6.6
Injuries
6.4
6.5
6.2
6.1
6.4
6.4
Varicose veins
5.6
5.5
5.3
5.5
5.4
5.5
High cholesterol
5.3
5.5
4.7
5.3
5.1
5.1
Dental problems
4.9
4.6
5.0
4.9
5.7
5.1
Bronchitis/emphysema
5.2
4.6
4.1
4.2
3.7
4.3
Ulcer (gastro-intestinal)
3.7
3.4
2.7
2.4
2.5
2.9
Heart disease
2.8
2.9
2.8
2.9
2.6
2.8
Hernia
2.6
2.8
3.2
3.0
2.3
2.7
Diabetes
3.1
2.3
2.1
2.2
1.7
2.3
All other conditions(d)
82.6
82.1
83.3
83.6
85.2
83.5
Total (people with
at least one condition)(d)
87.4
87.1
87.8
88.3
89.6
88.1
(a) Of total population (all ages). Age-standardised rates.
(b) The fifteen most common conditions, excluding conditions classed as minor.1
(c) 1st quintile – most disadvantaged; 5th quintile – least disadvantaged.
(d) Includes minor conditions.
Source: Unpublished data, National Health Survey, 1995.
greatest disadvantage rated their health as
poor or fair (rather than good, very good or
excellent) than those from other areas. There
was a clear gradient of more negative
assessment of health with greater
disadvantage of area. Among all people, aged
15 years and over, 17% rated their health as
fair or poor, with this percentage ranging
from 12% of those in the least disadvantaged
areas to 22% of those in the most
disadvantaged areas.
Illness
Despite the clear gradient in negative
perception of health, there was no clear
gradient in the total rate of illness by
socio-economic disadvantage of area, after
adjustment for age differences. The great
majority of the population (88%) had at least
one condition in the two weeks prior to
interview, and proportions for each quintile
ranged between 87% and 90%.
The high proportion who had at least one
condition results partly from the prevalence
of some extremely common minor
conditions, both chronic and acute, such as
eyesight problems correctable by glasses,
headache and the common cold. Out of the
fifteen most common non-minor illnesses
recorded in the survey, five were more
common in the most disadvantaged areas.
These were: arthritis, asthma,
bronchitis/emphysema, ulcer and diabetes.
There were two conditions which showed the
reverse pattern: hayfever and dental problems
were more common in the least
disadvantaged areas. (The least disadvantaged
quintile also made more use of dental
services. The diagnosis of dental problems is
more likely when people visit the dentist
regularly.) For these seven conditions, the
rates for males and females followed a
generally similar pattern by quintile of
socio-economic disadvantage of area.
Those conditions which showed no clear
pattern by socio-economic status of area
included some serious conditions such as
heart disease. However, an examination of
mortality data for adults aged 25–64 years
found that death rates from ischaemic heart
disease were higher in more disadvantaged
areas (after adjusting for age differences
between quintiles).1 Other conditions or
causes with higher death rates in the most
disadvantaged areas included:
bronchitis/emphysema, pneumonia/influenza,
lung cancer, diabetes, cerebrovascular disease
(mostly strokes), suicide and traffic accidents.
Both the total death rate and the rate of
avoidable death in the most disadvantaged
areas were substantially higher than in the
least disadvantaged areas.
There are a number of possible reasons why
some illness rates recorded in the National
Health Survey may not show gradients similar
to death rates compiled from death
certificates. It may be that there are important
differences in the severity of particular
illnesses, or in the co-occurrence of illnesses,
which are not captured by the data on illness
rates, but contribute to higher death rates in
more disadvantaged areas. Some deaths, such
as deaths through injury, or some heart
attacks, are not necessarily preceded by
illness. Moreover, it is possible that the
likelihood of a condition being diagnosed,
and hence reported to interviewers, may vary
according to socio-economic disadvantage.
Finally, some serious conditions occur in
relatively small numbers in the population,
and for these conditions it is more difficult to
calculate a reliable rate from a sample survey.
ABS • AUSTRALIAN SOCIAL TRENDS • 4102.0 • 1999
•
63
HEALTH
STATUS
Proportion(a) with selected risk factors by quintile of relative socio-economic
disadvantage of area, 1995(b)
Current smoker
Medium/high risk
alcohol
Being
overweight/obese
Did not exercise
Males
Females
Males
Females
Males Females
Males Females
Quintile of disadvantage
%
%
%
%
%
%
%
%
1st (most disadvantaged)
35.9
27.1
7.3
3.5
44.4
33.6
35.8
37.7
2nd
30.9
22.6
4.4
2.4
47.1
33.6
35.0
34.6
3rd
27.2
20.1
5.7
2.6
44.9
32.1
35.1
32.7
4th
25.6
20.0
5.2
2.8
48.3
30.8
33.5
33.4
5th (least disadvantaged)
18.2
14.8
4.5
4.0
46.0
27.4
25.8
27.9
Total
27.0
20.6
5.4
3.1
46.2
31.2
32.7
33.1
(a) Age-standardised rates.
(b) For smoker status and alcohol consumption, data relate to the population aged 18 years and over. For weight and exercise,
data relate to the population aged 15 years and over.
Source: Unpublished data, National Health Survey, 1995.
Risk factors
A healthy lifestyle, comprising good nutrition,
regular exercise, and not smoking or drinking
alcohol at a high risk level, is promoted by
health experts in the interest of reducing the
incidence of some major causes of illness,
disability and death in the population.
Smoking has been associated with several
cancers and chronic lung disease. Excessive
intake of alcohol has been associated with
liver disease, high blood pressure, cancers of
the digestive system, and injuries from
accidents and violence. Lack of exercise and
being overweight have been associated with
mature onset diabetes. In addition, all four of
these risk factors have been associated with
coronary heart disease and stroke.5 In 1995,
the prevalence of these potentially modifiable
risk factors varied according to
socio-economic disadvantage of area.
In 1995, both males and females (aged 18
years and over) in more disadvantaged areas
were more likely to smoke. The lower
proportions who smoked in less
disadvantaged areas partly reflected the
higher proportions who had never smoked in
these areas. 48% of males and 62% of females
in the least disadvantaged areas had never
smoked, compared to 33% of males and
51% of females in the most disadvantaged
areas. Further, of those who had ever
smoked, a larger proportion in the least
disadvantaged areas were ex-smokers (65% of
males and 61% of females) compared to those
in the most disadvantaged areas
(47% of males and 45% of females).
64
• ABS • AUSTRALIAN SOCIAL TRENDS • 4102.0 • 1999
A small proportion of the population aged
18 years and over (4%) drank alcohol at a
medium or high risk level (based on
information they gave about alcohol
consumption in the week prior to interview).
For males, the proportion was highest among
those in the most disadvantaged areas (7%).
For females, the highest proportions were
recorded in the most and the least
disadvantaged quintiles (4%).
A larger proportion of females in the areas of
greatest disadvantage were overweight or
obese than in the least disadvantaged areas
(34% compared to 27%). However, this
pattern was not observed for males. A larger
proportion of both males and females in the
areas of greatest disadvantage did no exercise,
compared to those in the areas of least
disadvantage.
Preventative health care
In general, people from the more
disadvantaged areas were less likely to have
taken preventative health actions such as
immunising children against contagious
diseases, or having certain cancer screening
tests.
The Child Immunisation Survey, 1995, found
that the proportion of children fully
immunised against the seven diseases listed
on the National Health and Medical Research
Council immunisation schedule was lowest in
the areas of greatest disadvantage. The
highest rates of immunisation were recorded
for measles (92%) and mumps (90%) – for
these diseases the difference in the
immunisation rate by socio-economic
disadvantage of area was relatively small. The
lowest immunisation rate was recorded for
HEALTH STATUS
Proportion of children aged 3 months to 6 years fully immunised(a), by quintile of
socio-economic disadvantage of area, April 1995
Diptheria/ Whooping
Tetanus(b) cough
Polio
Measles
Mumps
Rubella
HIB
Quintile of disadvantage
%
%
%
%
%
%
%
1st (most disadvantaged)
61.9
54.6
75.9
89.5
87.0
72.2
39.9
2nd
67.4
58.9
81.4
90.8
88.2
72.5
44.0
3rd
68.5
59.0
81.0
90.7
88.2
75.4
49.9
4th
71.3
62.3
87.1
94..0
93.1
78.6
56.0
5th (least disadvantaged)
72.9
63.7
86.2
93.1
91.2
79.4
58.7
Total
68.6
59.9
82.6
91.7
89.7
75.9
50.2
(a) Children aged less than one year were excluded when calculating the rate of immunisation against Measles, Mumps and
Rubella.
(b) Vaccines for these diseases are usually given together.
Source: Unpublished data, Children's Immunisation Survey, Australia, April 1995.
the disease Haemophilus Influenzae type b
(Hib) (50%), which at the time of survey had
only recently been included in the
immunisation schedule. The proportion
immunised against HIB was 40% in the areas
of the greatest socio-economic disadvantage
and 59% in the areas of the least
socio-economic disadvantage. The difference
between the immunisation rate for the lowest
and highest quintiles was also relatively large
for whooping cough and diptheria/tetanus.
Women from the more disadvantaged areas
were less likely to have had certain
recommended cancer screening tests than
others. (Women who reported having had
Women in target age groups(a) who had had a cancer
screening test within the previous two years by quintile of
socio-economic disadvantage of area(b), 1995
%
80
Mammogram
Pap smear
these tests would have included some who
had them in response to symptoms or family
history rather than as a general screening
test.) In 1995, 51% of women aged 50–69 had
had a mammogram (to detect breast cancer)
within the last two years. The rate was highest
among women from the least disadvantaged
areas – 56% of the 4th quintile and 58% of the
fifth quintile – while the rate for the other
quintiles ranged between 44% and 48%. Of
women aged from 20 to 69 years, 66% had
had a pap smear (to detect cancer and
precancerous conditions of the cervix) within
the last two years. The rate was somewhat
lower in the most disadvantaged areas (63%
of the 1st and 2nd quintiles) than in other
areas (68% to 69% of the other quintiles).
Those in the most disadvantaged areas were
also less likely to check their skin regularly for
cancers, although the difference between
quintiles was relatively small. There were
54% of males and 62% of females in the most
disadvantaged areas who said that they
regularly checked their skin for cancers,
compared to 59% of males and 67% of
females in the least disadvantaged areas.
60
Health insurance
40
20
0
1st
2nd
3rd
4th
5th
(a) Women aged 20–69 years for pap smear tests; aged 50–69 years for mammograms.
(b) 1st quintile — most disadvantaged; 5th quintile — least disadvantaged.
Taking out private health insurance is one
way of planning for health expenses.
Depending on a person's insurance cover, this
may include planning for some services not
covered by Medicare (the public health
scheme), such as dental services,
physiotherapy services or the cost of
eye-glasses. Those with hospital cover may be
able to have some hospital-based services,
such as surgery, performed in a more timely
fashion, through recourse to services in
private hospitals.
Source: Unpublished data, National Health Survey, 1995.
ABS • AUSTRALIAN SOCIAL TRENDS • 4102.0 • 1999
•
65
HEALTH
STATUS
Proportion of the population who had private health insurance
by quintile of socio-economic disadvantage of area, 1995
Primary health care
(b) 1st quintile – most disadvantaged; 5th quintile – least disadvantaged.
People from the areas of greater
socio-economic disadvantage were more
likely than others to have visited a doctor in
the two weeks preceding interview. They
were also more likely to have used
outpatient/casualty services in the two weeks
prior to interview than those from less
disadvantaged areas. This pattern of greater
use of certain medical services confirms that
of other studies and is consistent with people
from more disadvantaged areas having poorer
health.1 In contrast, a greater proportion of
those in the least disadvantaged areas had
visited a dentist. As dental services are not
covered by public health arrangements to the
same extent as are the use of doctors or
hospital services, this is consistent with those
in less disadvantaged areas being more likely
to hold private medical insurance and to have
higher incomes.
Source: Unpublished data, National Health Survey, 1995.
Endnotes
Males
Females
1st
2nd
3rd
4th
5th
0
10
20
30
40
50
60
70
%
People in the areas of greatest disadvantage
were least likely to have private health
insurance. Of those in the most disadvantaged
areas, 24% had private health insurance
compared to 61% in the least disadvantaged
areas. The three middle quintiles were more
closely grouped: the proportion with private
health insurance ranged from 40% to 44%.
Apart from Medicare, there are some other
government health schemes which make it
easier to access some health services. Most of
these apply income tests to ensure that
assistance is restricted to those less able to
afford medical expenses. Data from the health
survey confirmed that those from the most
disadvantaged areas were most likely to be
covered by a government health care card or a
veteran's concession card. 53% of those in the
most disadvantaged areas were covered by
such a card compared to 22% of those in the
least disadvantaged areas.
1 Mathers, C. 1994, Health differentials among
adult Australians aged 25–64 years (Health
monitoring series no 1.) pp. 296–297.
2 Podger, A. 1998, Public health information:
Poverty and Health (paper presented to the 30th
Annual Public Health Association Conference).
3 Australian Bureau of Statistics 1991, Information
paper: 1991 Census – Socio-economic Indexes for
areas, Cat. no. 2912.0, ABS, Canberra..
4 McCallum, J. et al 'Self-rated health and survival: a
seven year follow up of Australian elderly'
American Journal of Public Health, vol 84, 1994,
pp. 1100–1105.
5 Australian Institute of Health and Welfare 1998,
Australia's Health 1998, AIHW, AGPS, Canberra.
Health service use(a) by quintile of socio-economic disadvantage of area, 1995
Doctor visits
Males
Dentist visits
Females
Males
Outpatient/casualty visits
Females
Males
Females
Quintiles of disadvantage
%
%
%
%
%
%
1st (most disadvantaged)
22.7
28.0
4.7
5.3
3.9
3.2
2nd
20.7
26.1
4.5
5.0
3.2
3.1
3rd
20.9
25.1
5.2
5.6
2.9
2.5
4th
20.0
25.5
4.7
6.0
2.7
2.4
5th (least disadvantaged)
20.1
24.9
6.8
7.2
1.9
2.1
Total
20.8
25.9
5.3
5.9
2.9
2.7
(a) Percentage of the population who said they had used this service in the two weeks prior to interview. Age standardised.
Source:Unpublished data, National Health Survey, 1995.
66
• ABS • AUSTRALIAN SOCIAL TRENDS • 4102.0 • 1999
Asthma
M O R T A L I T Y
In 1995, it was
estimated that over
two million Australians
(11% of the total
population) had
asthma. Between
1989–90 and 1995,
self-reported asthma
prevalence increased
by about one third.
A N D
M O R B I D I T Y
The risk of dying from asthma is low and
continues to decline in Australia. However,
prevalence of asthma appears to be increasing
and is a cause of concern for health
authorities and the general population
because of the personal, social and economic
costs associated with the disease.
Between the 1989–90 and the 1995 National
Health Surveys, the proportion of the
population reporting asthma (as a recent
illness and/or as a long term condition)
increased by about one third. The increase in
self-reported asthma prevalence was greater
among adults (41%) than among children
(17%) and, for both children and adults, the
increase was greater among females than
males. Improvements in identification and
treatment of asthma, increased public
awareness of the condition, and small
differences in survey methodology between
1989–90 and 1995 may all have contributed
to greater reporting of asthma in 1995.
However, it is not possible to measure how
much of the increase in reporting is due to
these factors and how much reflects actual
increases in asthma prevalence.
The 1995 National Health Survey (NHS)
estimated that over 2 million Australians
(11% of the total population) had asthma.
Prevalence rates were highest among
5–14 year olds (21% among boys and
17% among girls). Asthma prevalence was also
Self-reported prevalence of asthma among children and adults
Number
Children (0–14 years)
Prevalence rates
1995
1995
1989–90
Increase
1989–90
to 1995
'000
%
%
%
632.6
16.3
13.9
17.3
Boys
363.4
18.3
16.3
12.3
Girls
269.2
14.3
11.4
25.4
1 408.8
9.9
7.0
41.4
Adults (15 years and over)
Men
618.2
8.8
6.4
37.5
Women
790.6
11.0
7.5
46.7
Total
Males
Females
2 041.4
11.3
8.5
32.9
981.6
10.9
8.7
25.3
1 059.8
11.7
8.3
41.0
Source: 1995 National Health Survey: Asthma and Other Respiratory Conditions, Australia
(Cat. no. 4373.0); and unpublished data, 1989–90 National Health Survey.
Asthma
Asthma is a disease characterised by airway-wall
inflammation.1 It is a chronic (long-term)
condition which may be punctuated with acute
(short-term) episodes at varying intervals and
varying degrees of severity. Severe acute attacks
can result in death.
In the short term, asthma causes bronchial
hyperresponsiveness, variable airway narrowing
and mucus production, giving rise to the typical
symptoms of asthma – wheeze, dyspnoea
(difficult or painful breathing), and cough. Over
many years, persistent airway inflammation may
cause fixed airway narrowing, with a reduced
response to broncho-dilating agents.1
The underlying causes of asthma are not known,
but the combination of genetic factors and
exposure to allergens (e.g. house dust mite,
animal dander, moulds) or chemicals
(e.g. formaldehyde, PVC, latex) results in
sensitisation and airway inflammation.2 Acute
episodes may be triggered by exercise, some food
additives, some medications, and a range of
common irritants such as environmental tobacco
smoke (passive smoking), pressurised aerosols,
soap powders, solvents and airconditioning.1
Self-reported prevalence of asthma
Statistics on self-reported prevalence of asthma in
Australia were compiled by the ABS using
information collected from households in two
National Health Surveys – conducted in 1989–90
and 1995. Where possible, a personal interview
was conducted with each adult. A parent or
guardian was asked to provide information about
children in the household. Respondents may have
reported asthma as a recent illness, a long-term
condition, or both.
Recent illness – respondents may have reported
asthma as the reason for taking one or more
specified health-related actions during the two
weeks before interview (e.g. doctor consultation,
medication use, time away from work/school) or
as an illness episode in the two-week reference
period for which no specified action was taken.
Long-term condition – respondents also had the
opportunity to report having asthma as a
long-term health condition (i.e. a condition which
has lasted, or is likely to last, for six months or
more) regardless of whether they had
experienced a recent episode or taken any recent
health-related action for their asthma.
Reported information on medical conditions was
not medically verified, and was not necessarily
based on diagnosis by a medical practitioner.
Self-reported information on medical conditions
may differ from information which might be
obtained from other sources.
ABS • AUSTRALIAN SOCIAL TRENDS • 4102.0 • 1999
•
67
MORTALITY AND MORBIDITY
Self-reported asthma prevalence rates by age, 1995
%
21
Males
Females
18
problems including lower respiratory tract
disease and asthma in children. The NHMRC
estimates that children exposed to
environmental tobacco smoke are about
1.4 times as likely to suffer from asthma as
children who are not exposed, and that
around 8% of childhood asthma cases are
attributable to passive smoking.
15
12
9
6
Under 5
5–14
15–24
25–34 35–44 45–54
Age group (years)
55–64
65–74
75+
Source: 1995 National Health Survey: Asthma and Other Respiratory Conditions, Australia
(Cat. no. 4373.0).
relatively high among 15–24 year olds, with
16% of females and 14% of males in this age
group reporting that they had asthma in 1995.
Up to 15 years of age, asthma was more
common among boys than girls. In older age
groups, however, the condition was generally
more common among women than among
men, with prevalence rates converging for
persons aged 75 and over.
Smoking and asthma
A recent report3 by the National Health and
Medical Research Council (NHMRC) found
that passive smoking is firmly linked, as a
likely causal factor, to a range of health
The 1995 NHS found that prevalence of
asthma was higher (about 4 percentage
points) among young children living in
households with one or more smokers than
in households with no smokers present.
Among 10–14 year olds, however, prevalence
of asthma was lower in households with
smokers present. The Survey did not collect
any information about whether children had
ever been exposed to household smoking in
the past, or whether they were currently
exposed to smoking outside the home.
The 1995 NHS also found that asthma
prevalence was higher among women who
were either current smokers or ex-smokers
than among those who had never smoked.
For men, however, the relationship between
asthma and smoking status appeared to be
much weaker.
Treatment of asthma
Asthma can be controlled with preventive
medications and strategies to reduce airway
inflammation.1 In 1995, an estimated
1.1 million people (55% of all people with
asthma) reported using medication for their
asthma during the two weeks before
Smoking and self-reported asthma prevalence rates, 1995
%
25
No smokers in household
Smoker in household
Children(a)
%
25
20
20
15
15
10
10
5
5
Current smoker
Ex-smoker
Never smoked
Adults(b)
0
0
Under 5
5–9
Age group (years)
10–14
Men
Women
Smoker status
(a) Aged under 15 years.
(b) Aged 18 years and over. Prevalence rates have been age standardised to the total population (aged 18 years and over)
at 30 June 1995.
Source: 1995 National Health Survey: Asthma and other Respiratory Conditions, Australia (Cat. no. 4373.0).
68
• ABS • AUSTRALIAN SOCIAL TRENDS • 4102.0 • 1999
MORTALITY AND MORBIDITY
People who took recent(a) health-related actions because of their asthma, 1995
Age group (years)
Type of action taken
0–14
15–24
25–44
45–64
65 and
over
Total
%
%
%
%
%
%
Used medication
48.6
52.7
57.1
61.6
68.2
Consulted doctor
6.9
2.2
3.5
4.4
5.6
4.6
Took day(s) off work/school
3.8
1.2
0.8
0.5*
**
1.7
Other day(s) of reduced activity
2.5
0.7
1.3
1.5
2.5
1.7
Consulted other health professional
1.5
1.1
0.5
0.6*
**
1.0
Hospital casualty/emergency/outpatients
Total who took action for asthma(b)(c)
Total who had asthma
Total who had asthma
55.3
1.0
0.7
**
**
**
0.6
49.3
53.0
57.5
62.0
68.7
55.8
100.0
100.0
100.0
100.0
100.0
100.0
'000
'000
'000
'000
'000
'000
632.6
404.9
508.3
315.5
180.0
2 041.4
(a) During the two weeks before interview.
(b) People may have taken more than one type of action. Therefore components may not add to totals.
(c) Includes people who took vitamins/minerals, used natural/herbal medicines, visited a hospital day clinic or were admitted
to hospital as inpatients.
Source: Unpublished data, 1995 National Health Survey.
interview. The proportion using medication
increased steadily with age, from 49% of
0–14 year olds to 68% of those aged 65 years
and over.
While children were less likely than other age
groups to have used medication for their
asthma, they were more likely to have seen a
doctor. In 1995, 7% of 0–14 year olds with
asthma had seen a doctor about it in the
previous two weeks. Among adults, the
proportion who consulted a doctor increased
steadily with age, from 2% of 15–24 year olds
to 6% of those aged 65 years and over.
Even with careful management, acute attacks
of asthma cannot always be prevented and
severe attacks may require treatment in
hospital. The 1995 NHS estimated that 1% of
children with asthma (6,400) had visited
hospital casualty, emergency or outpatients
units for asthma treatment during the
two weeks before interview.
Hospital statistics compiled by the Australian
Institute of Health and Welfare4 show that
asthma is the most common medical
condition for which children are admitted to
hospital. For the year 1996–97, hospitals in
Australia recorded asthma as the primary
reason for 62,000 inpatient episodes, half of
which related to children under 15 years of
age. Asthma was the primary reason for 10%
of all hospital inpatient episodes among
1–4 year olds and 5% among 5–14 year olds.
Reduced activity due to asthma
The 1995 NHS estimated that 1 in 26 children
with asthma had taken one or more days off
school (in the past two weeks) because of
their asthma. Other than days away from
school, 1 in 40 children with asthma had
reduced their usual activities (e.g. sport,
exercise) or stayed in bed for one or more
days during the previous two weeks because
of their asthma.
On the whole, asthma appeared to cause less
disruption to the usual activities of adults
than of children. For example, fewer than
1% of 25–64 year olds with asthma had taken
a day off work in the past two weeks because
of their asthma. With the exception of older
people (aged 65 years and over), adults were
also less likely than children to have had
other days of reduced activity (i.e. other than
days away from work or school) because of
their asthma.
Deaths due to asthma
The risk of dying from asthma is relatively
low. In 1997, asthma was the underlying
cause of 715 deaths which represented 5% of
deaths from respiratory diseases and less than
1% of all deaths in Australia. Asthma was
recorded as a contributing cause in a further
1,157 deaths. As for most other causes of
death, the rate of asthma deaths increases
with age. In 1997, age-specific death rates
ABS • AUSTRALIAN SOCIAL TRENDS • 4102.0 • 1999
•
69
MORTALITY AND MORBIDITY
Endnotes
Deaths due to asthma: age-standardised rates(a)
rate per
100,000
6
5
4
Males
Females
1982
3
1985
1988
1991
1994
1997
(a) Age standardised death rate per 100,000 of the total population at 30 June 1991.
Source: Unpublished data, Causes of Death collection.
from asthma ranged from less than 1 death
per 100,000 of the population aged under
35 years, to just over 22 deaths per 100,000 of
the population aged 65 years and over.
Age-standardised death rates from asthma (as
the underlying cause of death) increased
during the 1980s, peaking in 1989, but have
since declined to below the 1982 rates for
both males and females. Several
researchers5,6,7 have found evidence to suggest
that some of the increase in asthma death
rates during the 1980s may have been due to
diagnostic transfer, resulting in overstatement
of asthma deaths, particularly among older
people. Diagnostic transfer refers to a
tendency to diagnose one condition rather
than another owing to similarities in
symptoms and changing recognition of
diseases.
70
• ABS • AUSTRALIAN SOCIAL TRENDS • 4102.0 • 1999
1 Jenkins, C.R. and Woolcock, A.J. 1997, ‘Asthma
in adults’, Medical Journal of Australia, vol. 167,
pp. 160–165.
2 Sporik, R., Holgate, S., Platt-Mills, T., Cogswell, J.
1990, ‘Exposure to house dust mite allergen
(Der p1) and the development of asthma in
childhood. A prospective study’, New England
Journal of Medicine, vol. 323, pp. 502–507
3 National Health and Medical Research Council
1997, The health effects of passive smoking, A
scientific information paper, AGPS, Canberra.
4 Australian Institute of Health and Welfare 1998,
Australian Hospital Statistics 1996–97, AIHW,
Canberra.
5 Jenkins, M.A., Rubinfeld, A., Robertson, C.F.,
Bowes, G. 1992, ‘Accuracy of asthma death
statistics in Australia’, Australian Journal of
Public Health, vol. 16, no. 4, pp. 427–429.
6 Campbell, D.A., McLennan, G., Coates, J.R., Frith,
P.A., Gluyas, P.A., Latimer, K.M.,
Martin, A.J., Roder, D.M., Ruffin, R.E., Yellowlees,
P.M. 1992, ‘Accuracy of asthma statistics from
death certificates in South Australia’, Medical
Journal of Australia, vol. 156, pp. 860–863.
7 National Health and Medical Research Council
1988, Asthma in Australia; Strategies for
reducing morbidity and mortality, Report of the
NHMRC Working Party on Asthma Associated
Deaths, Canberra.
Mental health
H E A L T H
In 1997, 2.4 million
people aged 18 years
and over (18% of all
adults) had
experienced a mental
disorder during the last
12 months.
S T A T U S
A mental disorder can occur at any age and
in any social group. Most people in Australia
enjoy good mental health. Nevertheless, in
1997, 2.4 million people aged 18 years and
over (18% of all adults) had experienced a
mental disorder during the last 12 months.
Many causal factors of mental disorders have
been identified (e.g. stress) although the links
between these factors and mental disorder is
not clear.
For society, mental disorders represent a
major expense through the loss of
productivity and the costs of treatment. For
the individual, it can affect the ability to work
and participate fully in society. In addition,
individuals may feel isolated and
discriminated against due to the attitudes of
many people who are uninformed about the
nature of mental disorders. In a severe form,
this may lead to suicide.
In recognition of the need to highlight issues
of quality of life and rights of people with
mental disorders, in 1992 the National Mental
Health Strategy was developed and in 1996
mental health was designated as a National
Health Priority Area.
Types of mental health disorders
The prevalence of mental disorder was similar
for men and women (17% and 18%
respectively). However, there were differences
Proportion of people with a mental
disorder(a), 1997
%
12.5
Men
Women
10.0
1997 Survey of Mental Health and
Wellbeing
This review presents information obtained from
the 1997 Survey of Mental Health and Wellbeing of
Adults (18 years and over). Measuring the
prevalence of mental disorders in the community
is a complex task, as mental disorders are usually
determined through clinical diagnosis. For this
reason, the survey did not attempt to cover all
disorders, only those considered to have the
highest prevalence in the community and which
were able to be identified in an interviewer-based
household survey. For this reason, the prevalence
of organic mental disorders, which, more
commonly affect older people (e.g. senile
dementia), were not collected.
The diagnostic component of the survey was
administered through a modified version of the
Composite International Diagnostic Interview (for
more detailed information refer to the 1997
Survey of Mental Health and Wellbeing of Adults,
User Guide, Cat. no. 4327.0).
Physical conditions refer to the presence of any of
the following: asthma, chronic bronchitis,
anaemia, high blood pressure, heart trouble,
arthritis, kidney disease, diabetes, cancer, stomach
or duodenal ulcer, chronic gall bladder or liver
trouble, hernia or rupture.
Mental disorder is a general term which implies
the existence of a clinically recognisable set of
symptoms or behaviour associated with
interference with personal functions.1 Disorders
can be broadly separated into three groups:
affective, anxiety, and substance abuse disorders.
Affective disorders are characterised by a
disturbance of mood accompanied by either
manic or depressive symptoms. They tend to be
recurrent and the onset of episodes can often be
related to stressful events. The affective disorders
in this review include depression, dysthymia
(depressive neurosis), mania, hypomania, and
bipolar (manic depressive illness).
Anxiety disorders are characterised by chronic
feelings of tension, distress or nervousness. These
include panic disorders, agoraphobia, social
phobia, obsessive-compulsive disorder,
generalised anxiety disorder and post-traumatic
stress disorder.
7.5
5.0
2.5
Substance-use disorders are harmful use or
dependence on drugs (illegal and prescription
drugs) or alcohol.
0.0
Anxiety
Affective
Substance use
Mental disorder
(a) Of persons aged 18 years and over and during the
12 months prior to interview.
Source: Mental Health and Wellbeing Profile of Adults,
Australia, 1997 (Cat. no. 4326.0).
in the prevalence of mental disorders of
different types among men and women and at
different ages. Women were more likely to
have experienced anxiety disorders (12% for
women compared to 7% for men) and
ABS • AUSTRALIAN SOCIAL TRENDS • 4102.0 • 1999
•
71
HEALTH STATUS
Prevalence of mental disorders(a), 1997
Women
Men
%
25
Anxiety
Affective
Substance use
%
25
20
20
15
15
10
10
5
5
0
18–24
25–34
35–44 45–54
Age group (years)
55–64
65+
0
18–24
Anxiety
Affective
Substance use
25–34
35–44 45–54
Age group (years)
55–64
65+
(a) During the 12 months prior to interview.
Source: Mental Health and Wellbeing Profile of Adults, Australia 1997 (Cat. no. 4326.0).
affective disorders (7% compared to 4%). On
the other hand, men were more than twice as
likely as women to have had a substance use
disorder (11% compared to 4%).
The prevalence of anxiety disorders for
women aged 18–44 ranged between 12% to
15%. Women aged 45–54 had the highest rate
of anxiety disorders, 16%, which steadily
declined in older age groups to 5% for those
aged over 64. For men, the prevalence of
anxiety disorders varied little with age until
age 55, after which it declined. The
prevalence of affective disorders was highest
at 11% for women aged 18–24, more than
three times the rate for men of this age. For
women, the prevalence of affective disorders
generally declined with age, while for men,
rates increased in the middle years before
declining after age 55.
Men aged 18–24 had the highest rate of
substance use disorders, particularly from
excessive alcohol intake, with more than one
in five being affected (22%). The equivalent
rate for women in this age group was half this
(11%). For men and women, the prevalence
of substance use disorders declined steadily
with age. Alcohol use disorders were about
three times more common than any other
substance use disorder (7% compared to 2%).
The presence of a mental disorder may
predispose individuals to other disorders. For
example, people who experience social
phobia may also experience depression and
alcohol dependence. People with an affective
disorder were the most likely to have more
than one mental disorder. Of those with an
affective disorder, 61% also had an anxiety or
72
• ABS • AUSTRALIAN SOCIAL TRENDS • 4102.0 • 1999
substance use disorder. In comparison, 43%
of those with an anxiety disorder also had an
affective or substance use disorder and 31% of
those with a substance use disorder had an
affective or anxiety disorder.
Impact on daily life
People with a mental disorder (or physical
condition) are not necessarily restricted in
their day to day activities. However, the
presence of mental and/or physical conditions
in combination often increases the likelihood
of disability, compounding the difficulties that
these people face.
The 1997 National Survey of Mental Health
and Wellbeing used the Brief Disability
Questionnaire (BDQ), based on a standard
international questionnaire, as a measure of
disability. The BDQ asks participants whether
they are limited in a number of activities, and
whether they have cut down or stopped
activities they were expected to do as part of
their routine. Participants were then allocated
a score characterising them as having a mild,
moderate or severe disability, or none.
People who reported physical conditions only
were more likely to have a disability than
those who reported mental disorders only
(55% compared to 30%). This may partly
reflect the emphasis the BDQ places on the
physical rather than the mental aspects of
disability. Even so, adults with mental
disorders, were on average more likely to be
disabled than adults in general
(44% compared to 34%).
HEALTH STATUS
Mental disorders and physical conditions(a) by disability status(b), 1997
None
Mental disorder(s) and/or physical condition(s) %
Physical condition(s) only
45.4
Mild
Moderate
Severe
Total
Total persons
%
%
%
%
'000
17.2
25.3
12.1
100.0
4 198.3
Mental disorders
Mental disorder(s) only
70.4
13.0
12.5
4.1
100.0
1 361.8
Mental disorder(s) and physical condition(s)
37.1
17.3
27.5
18.1
100.0
1 021.3
56.1
14.9
18.9
10.1
100.0
2 383.1
No mental disorder or physical condition
Total
81.8
9.6
6.7
1.9
100.0
6 883.4
Total
65.9
12.9
14.7
6.5
100.0
13 464.8
(a) During the twelve months prior to interview.
(b) During the four weeks prior to interview, according to the Brief Disability Questionnaire.
Source: Mental Health and Wellbeing Profile of Adults, Australia, 1997 (Cat. no. 4326.0).
Combinations of disorders have a cumulative
effect on disability. People with both physical
conditions and mental disorders were the
worst affected (63% had a disability and 18%
had a severe disability). Similarly, people
without chronic physical conditions but with
combinations of mental disorders were more
likely to be disabled than those with one
mental disorder only (45% compared to 30%).
Health service use
Some people experience a mental disorder
once and fully recover. For others, it recurs
throughout their lives or in episodes. The vast
majority of mental illnesses are able to be
treated if they have access to appropriate care
and services2.
Of those with mental disorders in 1997, 38%
used a health service for their mental health
problems in the previous 12 months. Women
People with a mental disorder by type of service used(a), 1997
were more likely than men to use health
services (46% of women compared to
29% of men). The most commonly used
health service for both men and women was
consulting a general practitioner
(22% and 37% respectively).
The likelihood of using health services for a
mental health problem was closely related to
the type of mental disorder. Of those with
affective disorders only, 56% used health
services, compared to 28% of those with
anxiety only and 14% of those with substance
use disorders only. Those with combinations
of mental disorders were the most likely to
use services for mental health problems
(66%).
For those with a disability, service use for
mental disorders increased with the severity
of the disability. A small proportion of people
with no mental disorders also used services
for mental health problems (5%). These
people may have consulted a health
professional for a sub-clinical mental disorder
such as stress, or for a mental disorder not
included in the analysis of the National Survey
of Mental Health and Wellbeing.
General practitioner
Living arrangements
Psychiatrist
Psychologist
Overall, the proportion of people with a
mental disorder decreased as the number of
people living in the household increased. This
may reflect the difficulties that some of these
people have in forming and maintaining
relationships.
Men
Women
Other mental health professional(b)
Other health professional(c)
None used
0
20
40
%
60
80
(a) In the last 12 months. A person may have used more than one service, therefore the
components do not add to the total.
(b) Includes social worker, welfare officer, drug and alcohol counsellor, and mental health team.
(c) Includes medical specialist, nurse, chemist, ambulance officer, etc.
After adjusting for age, the prevalence of
mental disorder was highest for both men and
women living alone. This was the case for
anxiety, affective and substance use disorders
individually.
Source: Mental Health and Wellbeing Profile of Adults, Australia, 1997 (Cat. no. 4326.0).
ABS • AUSTRALIAN SOCIAL TRENDS • 4102.0 • 1999
•
73
HEALTH STATUS
Proportion of people with a mental
disorder(a) by marital status, 1997
%
30
Men
Women
After adjusting for age, rates of mental
disorders were highest for men and women
who were unemployed or not in the labour
force. In particular, unemployed people had
relatively high rates of substance use
disorders (19% of men and 11% of women)
compared to employed people and people
not in the labour force. It is unclear whether
substance use predisposes people to
unemployment, unemployment predisposes
people to substance use, or both.
20
10
0
Married(b) Separated/
divorced
Widowed Never married
(a) Age-standardised rate of mental disorders from the major
groups (anxiety, affective and substance use).
(b) Includes de facto relationships.
Source: Mental Health and Wellbeing Profile of Adults,
Australia 1997 (Cat. no. 4326.0).
Age standardised rates were higher among
people who were separated or divorced (24%
of men and 27% of women) compared to
people who were married, widowed or never
married. In particular, people who were
separated or divorced had higher rates of
anxiety or affective disorders (18% and 12%
respectively) than the other groups. People
who had never married also had higher rates
of mental disorder than those who were
married. In particular, this group, had higher
rates of substance use disorders (14%).
Employment
People with mental disorders not only find it
more difficult to obtain jobs (see Australian
Social Trends 1997, Employment of people
Proportion of people with a mental
disorder(a) by labour force status,
1997
Age standardised rate
Men
Women
Labour force status
%
%
Employed full-time
15.1
14.7
Employed part-time
22.4
16.3
Unemployed
26.9
26.4
Not in the labour force
26.4
21.7
(a) Mental disorders from the major groups
(anxiety, affective and substance use disorders).
Source: Mental Health and Wellbeing Profile of Adults,
Australia 1997, (Cat. no. 4326.0).
74
with a handicap, pp. 104–108), but
unemployment may also contribute to their
disorder. Higher unemployment rates among
people with mental disorders could be the
result of a combination of factors including
the disabling effects of mental disorders, lack
of training and negative employer attitudes.
• ABS • AUSTRALIAN SOCIAL TRENDS • 4102.0 • 1999
Unemployed women also had relatively high
rates of anxiety disorders (20%) compared to
employed women and women not in the
labour force.
Suicide
Suicide is thought to be higher among people
with mental disorders. However, the
incidence of suicide among people with
mental disorders is not known.
Results from the 1997 Survey of Mental
Health and Wellbeing indicate that people
with a mental disorder were nearly four times
as likely to have thought about suicide since
the age of 18 as people without a mental
disorder (37% compared to 9%).
Furthermore, they were nearly 7 times more
likely to have attempted suicide (10%
compared to 1.5%).
Endnotes
1 World Health Organisation (WHO) 1992, The
ICD-10 Classification of Mental and Behavioural
Disorders, Clinical Descriptions and Diagnostic
Guidelines, WHO, Geneva.
2 National Mental Health Strategy brochure 1997,
Mental illness – facts, AGPS, Canberra.
Education
Page
National and State summary tables . . . . . . . . . . . . . . . . . . . . . . . . . . . 76
EDUCATIONAL ATTAINMENT
Educational profile of Australians
..............................
83
Using 1996 Census data, this review provides a picture of the levels and
fields of study of post-school educational qualifications held by the
population aged 15 years and over. Differences in attainment by men and
women in different age groups, and between the States and Territories,
are highlighted.
P A R T I C I P A T I O N IN E D U C A T I O N
Destinations of school leavers
..................................
87
The choices made by school leavers – whether to continue with their
studies, find a job, or both – are examined in this article. Differences
between boys and girls, between students from government and
non-government schools, and between those who left after or before
completing Year 12, are explored.
EDUCATION
AND WORK
Educating and training Australia's workers
.................
91
Between 1989 and 1997, the proportion of wage and salary earners
holding a post-school qualification increased. Using data from the 1997
Survey of Education and Training, information is presented about the
involvement in, and access to, education and training courses by wage and
salary earners. Information is also provided on financial support received
from employers and other sources.
ABS • AUSTRALIAN SOCIAL TRENDS • 4102.0 • 1999 •
75
Education — national summary
PARTICIPATION
School students
Students in government schools
Females – of all Year 11 and 12 students
Year 12 retention rate – males
Year 12 retention rate – females
Education participation of 15–19 year olds
(of all 15–19 year olds)
Education participation of 20–24 year olds
(of all 20–24 year olds)
15–24 year olds attending TAFE
15–24 year olds
attending higher education
Females—of all higher
education students aged 15–24(a)
Vocational Education
and Training (VET) clients(b)
Females – of all VET clients(b)
Higher education students
Overseas students
(of all higher education students)(c)
ATTAINMENT
With post-school educational
qualifications (of all aged 15–64)
Bachelor degree or higher
Undergraduate or associate diploma
Skilled or basic vocational qualification
Did not complete highest level of
secondary school (of all aged 15–64)
Females—of all with post-school
educational qualifications(a)
Higher education
students completing courses
EDUCATION AND LABOUR FORCE
Units
1988
1989
1990
1991
1992
1993
1994
1995
1996
1997
1998
'000
3 109 3 143
3 022
3 031
3 042
3 075
3 099
3 098
3 099
3 172
3 199
%
72.7
72.4
72.1
72.1
72.1
71.9
71.5
71.0
70.7
70.3
70.0
%
51.8
52.2
52.1
51.3
51.0
51.1
51.4
51.8
51.8
51.8
52.0
%
53.4
55.5
58.3
66.1
72.5
71.9
69.6
66.7
65.9
66.2
65.9
%
61.8
65.2
69.9
76.7
82.0
81.4
79.9
77.9
77.0
77.8
77.7
%
66.0
66.8
67.4
71.3
73.2
74.1
74.0
73.7
74.6
77.0
73.6
%
19.5
21.3
22.3
25.2
26.4
27.0
26.3
28.3
29.4
30.2
29.8
%
8.2
8.7
8.5
8.8
8.7
8.9
8.4
8.5
9.0
9.2
8.0
%
8.7
9.9
10.3
11.9
12.5
12.9
12.9
13.6
13.9
15.2
15.3
%
48.0
51.2
53.2
49.3
52.9
53.9
51.5
53.3
52.8
55.2
54.2
n.y.a.
'000
952
932
967
986
1 043
1 121
1 132
1 273
1 347
1 459
%
47.1
47.2
44.8
45.1
45.1
45.9
45.9
47.2
47.6
48.1
n.y.a.
420.9
441.1
485.1
534.5
559.4
575.6
585.4
604.2
634.1
658.8
671.9
n.a.
4.8
5.1
5.5
6.1
6.4
6.9
7.6
8.4
9.6
10.7
1988
1989
1990
1991
1992
1993
1994
1995
1996
1997
1998
%
n.a.
39.2
39.7
40.8
41.7
39.1
39.0
41.0
42.3
40.4
41.9
%
n.a.
7.9
8.4
9.0
9.6
10.1
11.5
11.9
12.8
13.6
14.3
%
n.a.
n.a.
n.a.
n.a.
n.a.
9.0
8.6
9.1
8.8
7.7
7.9
%
n.a.
n.a.
n.a.
n.a.
n.a.
20.0
18.9
19.9
20.6
19.1
19.7
n.a.
39.6
37.4
36.0
34.3
37.3
37.6
36.0
34.7
36.3
34.1
n.a.
41.8
42.4
43.0
43.6
42.6
44.0
44.0
44.1
44.6
45.1
'000
86.9
90.5
94.7
107.6
120.6
132.9
138.7
140.9
145.3
155.1
n.y.a.
Units
1988
1989
1990
1991
1992
1993
1994
1995
1996
1997
1998
%
n.a.
2.4
3.2
3.9
4.3
4.8
4.7
3.6
3.8
3.5
3.1
%
n.a.
n.a.
n.a.
n.a.
n.a.
5.9
5.8
5.4
5.2
4.7
4.6
%
n.a.
n.a.
n.a.
n.a.
n.a.
8.9
7.0
6.6
6.4
7.1
6.6
%
n.a.
7.9
8.2
12.0
13.4
13.7
12.6
10.7
10.9
11.2
10.5
156.3
163.9
172.8
160.2
151.9
137.5
131.1
135.8
158.0
175.4
195.5
'000
%
Units
%
%
Unemployment rate
With bachelor degree or higher
With undergraduate
or associate diploma
With skilled
or basic vocational qualifications
Without post-school qualifications(a)
Trainees and apprentices
'000
(a) From 1993, figures refer to participation/attainment in courses leading to recognised qualifications only.
(b) Data prior to 1994 are not strictly comparable to more recent data due to changes in scope and collection methodology. Community education providers were
included in the collection in 1995, and private providers were included in 1996.
(c) Prior to 1996, New Zealand students were counted as being overseas students.
Reference periods:
76
Schools data are at July, except for 1991 and 1995–1998 (August). TAFE data comprise enrolments
in the calendar year to 31 December. Higher education data are at 31 March from 1989; prior to that
the reference date was 30 April. Data on educational attainment, participation rates, unemployment
rates and apprentices are at May. Overseas student data are at 31 March. VET data are at
30 June.
• ABS • AUSTRALIAN SOCIAL TRENDS • 4102.0 • 1999
Education — national summary
EXPENDITURE
Units
continued
1988
1989
1990
1991
1992
1993
1994
1995
1996
1997
1998
%
r5.1
r5.0
r5.0
r5.4
r5.6
r5.6
r5.5
r5.4
r5.2
r5.4
n.y.a.
%
r4.7
r4.4
r4.3
r4.7
r4.9
r4.9
r4.8
r4.7
r4.5
r4.6
n.y.a.
EXPENDITURE
Total expenditure on education (of GDP)
Government expenditure
on education (of GDP)
Government outlay on education
Primary and secondary
Tertiary
RESOURCES
Schools
Government schools
School student/teaching staff ratio
All students
Government school students
Primary students
Secondary students
Females – of all primary teachers
Females – of all secondary teachers
Females – of all
higher education academic staff
Reference periods:
$'000m
8.4
9.4
9.9
10.7
11.6
12.0
12.2
12.5
13.0
13.9
n.y.a.
$'000m
4.6
4.7
5.0
5.9
6.4
6.9
7.1
7.6
7.6
8.1
n.y.a.
1988
1989
1990
1991
1992
1993
1994
1995
1996
1997
1998
10 054 10 036 10 007
Units
no.
9 980
9 957
9 865
9 679
9 648
9 630
9 609
9 587
%
74.9
74.9
74.8
74.8
74.8
74.7
74.0
73.8
73.6
73.2
73.0
ratio
15.3
15.3
15.3
15.4
15.3
15.3
15.5
15.4
15.4
15.3
15.3
ratio
15.0
14.9
15.0
15.2
15.1
15.2
15.4
15.4
15.4
15.3
15.3
ratio
18.5
18.7
18.4
18.5
18.4
18.4
18.5
18.1
18.1
17.9
17.9
ratio
12.6
12.6
12.4
12.5
12.4
12.4
12.6
12.6
12.7
12.7
12.7
%
71.7
72.3
73.5
73.7
74.2
74.4
74.7
76.1
76.2
76.9
77.5
%
48.3
48.8
50.1
50.4
50.6
51.1
51.3
52.3
52.6
53.1
53.5
%
27.3
27.8
30.1
30.8
31.9
32.6
32.8
33.5
34.1
34.4
35.1
Expenditure data are for financial years. Schools data are at July, except for 1991 and
1995–1998 (August). Higher education data are at 31 March from 1989; prior to that the
reference date was 30 April.
ABS • AUSTRALIAN SOCIAL TRENDS • 4102.0 • 1999 •
77
Education — State summary
PARTICIPATION
School students
Students in government schools
Females – of all Year 11 and 12 students
Year 12 retention rate – males
Year 12 retention rate – females
Education participation of 15–19
year olds (of all 15–19 year olds)
Education participation of 20–24
year olds (of all 20–24 year olds)
15–24 year olds attending TAFE
15–24 year olds
attending higher education
Females – of all higher
education students aged 15–24(b)
Vocational Education
and Training (VET) clients
Females – of all VET clients
Higher education students(b)
Overseas students
(of all higher education students)(b)
ATTAINMENT
With post-school educational qualifications
(of all aged 15–64)
Bachelor degree or higher
Undergraduate or associate diploma
Skilled or basic vocational qualification
Did not complete highest level of
secondary school (of all aged 15–64)
Females – of all with post-school
educational qualifications
Higher education
students completing courses
EDUCATION AND LABOUR FORCE
Units
Years
NSW
Vic.
Qld
SA
WA
Tas.
NT(a)
ACT
Aust.
'000
1998
1 081.6
787.4
584.6
249.5
314.0
84.1
36.7
60.8 3 198.7
%
1998
70.6
66.2
72.0
70.7
72.2
74.9
77.8
64.3
70.0
%
1998
52.3
52.7
51.1
51.9
51.3
52.3
52.7
48.8
52.0
%
1998
61.6
68.5
72.3
61.2
65.8
58.3
38.2
91.2
65.9
%
1998
73.0
83.7
82.6
72.4
76.8
66.0
48.0
90.7
77.7
%
1998
75.3
78.5
67.4
70.7
70.0
70.6
65.3
80.2
73.6
%
1998
31.6
32.8
26.1
25.6
26.6
24.4
n.a.
40.4
29.8
%
1998
9.4
8.2
5.1
7.8
9.0
7.8
n.a.
7.2
8.0
%
1998
15.1
17.4
15.8
10.8
13.3
10.7
n.a.
21.3
15.3
%
1997
55.8
52.8
53.7
59.2
60.2
51.0
*25.3
65.6
55.2
'000
1997
508.5
417.4
218.2
141.5
111.5
26.6
16.2
18.7
1458.6
%
1997
51.3
44.2
46.6
53.0
46.2
44.0
48.1
48.1
48.1
'000
1998
210.6
182.2
117.9
48.0
65.7
12.6
4.7
19.9
671.9
%
1998
9.3
13.1
9.7
9.1
14.9
9.6
3.7
7.9
10.7
NSW
Vic.
Qld
SA
WA
Tas.
NT(a)
ACT
Aust.
Units
Years
%
1998
44.2
41.0
40.0
38.3
42.8
37.1
42.3
50.6
41.9
%
1998
15.1
15.2
13.1
10.7
13.8
10.1
15.0
25.4
14.3
%
1998
8.0
8.4
7.3
7.0
8.1
6.2
8.6
8.5
7.9
%
1998
21.1
17.4
19.5
20.6
20.9
20.7
18.7
16.6
19.7
%
1998
32.9
34.0
35.5
37.8
34.0
41.4
33.3
18.2
34.1
%
1998
46.5
44.8
43.5
44.7
44.0
43.8
44.1
48.3
45.1
'000
1997
47.1
44.0
24.9
15.1
12.0
3.1
1.0
5.0
155.1
Units
Years
NSW
Vic.
Qld
SA
WA
Tas.
NT(a)
ACT
Aust.
%
1998
3.2
3.4
2.6
4.5
2.5
3.4
1.4
3.6
3.1
%
1998
3.8
4.6
6.3
4.9
4.4
3.3
1.5
3.3
4.6
%
1998
5.1
8.1
7.0
7.7
7.0
8.5
3.7
5.2
6.6
%
1998
10.8
10.2
10.8
12.8
8.2
11.8
6.7
9.0
10.5
'000
1998
53.1
48.9
46.3
17.5
19.0
5.5
2.3
3.0
195.5
Unemployment rate (aged 15–64)
With bachelor degree or higher
With undergraduate
or associate diploma
With skilled
or basic vocational qualifications
Without post-school qualifications
Trainees and apprentices
(a) Estimates for Northern Territory except all schools data and VET clients refer to mainly urban areas only.
(b) State totals exclude students of the Australian Catholic University which has campuses in more than one State.
Reference periods:
78
Schools data are at August. TAFE data comprise enrolments in the calendar year to 31 December.
Higher education data are at 31 March. Data on educational attainment, participation rates,
unemployment rates and apprentices are at May. Overseas student data are at 31 March. VET data
are at 30 June.
• ABS • AUSTRALIAN SOCIAL TRENDS • 4102.0 • 1999
Education — State summary
RESOURCES
Schools
Government schools
School student/teaching staff ratio
All students
Government school students
Primary students
Secondary students
Females – of all primary teachers
Females – of all secondary teachers
Females – of all
higher education academic staff(a)
Units
Years
NSW
Vic.
Qld
continued
SA
WA
Tas.
NT
ACT
Aust.
no.
1998
3 075
2 329
1 726
827
1 028
286
179
137
9 587
%
1998
71.1
70.6
75.8
76.2
74.3
76.9
83.2
70.8
73.0
ratio
1998
15.3
15.3
15.5
15.0
15.4
14.8
13.5
15.5
15.3
ratio
1998
15.3
15.4
15.6
14.7
15.5
14.7
13.3
15.3
15.3
ratio
1998
18.1
18.4
17.4
17.4
17.9
16.7
15.0
19.1
17.9
ratio
1998
12.7
12.6
13.3
12.0
12.6
13.0
11.0
12.8
12.7
%
1998
79.1
77.8
75.6
74.8
75.5
78.7
80.8
84.5
77.5
%
1998
54.0
54.2
54.4
47.3
51.2
52.3
57.5
61.4
53.5
%
1998
34.2
37.8
34.3
36.4
35.0
25.9
42.5
25.6
35.1
(a) State totals exclude students of the Australian Catholic University, which has campuses in more than one State.
Reference periods:
Schools data are at August. Higher education data are at 31 March.
ABS • AUSTRALIAN SOCIAL TRENDS • 4102.0 • 1999 •
79
Education — definitions and references
Associate diploma — course lasting from one
to two years full--time (or equivalent) providing skills
and knowledge for those wanting to work in
advanced trade, technical or associate professional
occupations.
Reference: Transition from Education to Work,
Australia (Cat. no. 6227.0).
Basic vocational qualification — award for
completion of a course lasting one semester to one
year full--time (or equivalent) providing practical
skills and knowledge for those wanting to work at
the operative level in various fields. Prior to 1993,
basic vocational qualifications were included with
undergraduate or associate diplomas.
Reference: Transition from Education to Work,
Australia (Cat. no. 6227.0).
Bachelor degree or higher — a bachelor degree
(including honours), a graduate or post-graduate
diploma, master's degree or a doctorate.
Reference: Transition from Education to Work,
Australia (Cat. no. 6227.0).
Did not complete highest level of secondary school —
a person without post-school qualifications who did
not complete the highest level of secondary
schooling available at the time they left school.
Reference: Transition from Education to Work,
Australia (Cat. no. 6227.0).
Full-time equivalent (FTE) — a measure of the total
level of staff resources used. The FTE of a full-time
staff member is equal to 1.0. The calculation of FTE
for part-time staff is based on the proportion of time
worked compared to that worked by full-time staff
performing similar duties. Casual staff are excluded.
Reference: Schools, Australia (Cat. no. 4221.0).
GDP (gross domestic product) — the current price
measure which is the sum of all final expenditure,
changes in stocks and imports less exports.
Reference: Expenditure on Education, Australia
(Cat. no. 5510.0).
Government expenditure on education — government
final expenditure, personal benefit payments,
advances to persons for the Higher Education
Contribution Scheme (HECS) and other
government expenditure.
Reference: Expenditure on Education, Australia
(Cat. no. 5510.0).
Government school — one administered by the
Department of Education in each State/Territory.
Reference: Schools, Australia (Cat. no. 4221.0).
Higher education institutions — includes all institutions
providing higher education courses e.g. universities
and university colleges, institutes of tertiary
education, agricultural colleges, and some institutes
of technology.
Reference: Participation in Education, Australia
(Cat. no. 6272.0).
80
•
ABS • AUSTRALIAN SOCIAL TRENDS • 4102.0 • 1999
Higher education student — a person for whom there
is a full-time, part-time or external enrolment in a
course at a higher education institution at the
reference date. Data for proportion of 15–24 year
olds attending higher education are from Transition
from Education to Work (Cat. no. 6227.0). State
totals are based on the student's usual State of
residence. Data for higher education students and
overseas higher education students are obtained
from Department of Education, Training and Youth
Affairs administrative data. State totals are the
number of students enrolled at all higher education
institutions within a particular State or Territory.
Department of Education,, Training and Youth
Affairs, Selected Higher Education Statistics.
Non-government school — any school not administered
by a Department of Education, but including special
schools administered by government authorities
other than the State and Territory education
departments.
Reference: Schools, Australia (Cat. no. 4221.0).
Overseas higher education students — full-fee paying
students at higher education institutions whose
residence is usually overseas.
Reference: Department of Education, Training and
Youth Affairs, Selected Higher Education Statistics.
Post-school educational qualification — an award for
attainment as a result of formal learning from an
accredited post-school institution. Educational
qualifications are classified according to the ABS
Classification of Qualifications (ABSCQ) (Cat. no.
1262.0). The level of attainment includes higher
degrees, postgraduate diplomas, bachelor degrees,
undergraduate and associate diplomas, and skilled
and basic vocational qualifications.
Reference: Transition from Education to Work,
Australia (Cat. no. 6227.0).
Primary education — full-time education which typically
commences around age five and lasts for seven to
eight years. It does not include sessional education
such as pre-school education.
Reference: Schools, Australia (Cat no. 4221.0)
School — an educational institution which provides
primary or secondary education on a full-time daily
basis, or by radio or correspondence.
Reference: Schools, Australia (Cat. no. 4221.0).
School student — a person who is enrolled in a school
and active in a course of study, other than
pre-school or Technical and Further Education
(TAFE) courses.
Reference: Schools, Australia (Cat. no. 4221.0).
School student/teaching staff ratio — number of
full-time school students divided by full-time
equivalent teaching staff.
Reference: Schools, Australia (Cat. no. 4221.0).
Secondary education — education which typically
commences after completion of primary education,
at around age 12, and lasts for five or six years.
Reference: Schools, Australia (Cat no. 4221.0).
Education — definitions and references
continued
Skilled vocational qualification — an award
for completion of a course lasting two to
four years, and typically involving some on-the-job
training, for those wanting to work in a specific
vocation, recognised trade or craft that requires a
high degree of skill in a range of related activities.
Prior to 1993, skilled vocational qualifications
referred to trade qualifications only.
Reference: Transition from Education to Work,
Australia (Cat. no. 6227.0).
Tertiary education — education provided by any
institution offering post-school courses. Includes
TAFE, higher education and other post-school
systems.
Reference: Transition from Education to Work,
Australia (Cat. no. 6227.0).
Total expenditure on education — government
expenditure on education plus private final
expenditure on education.
Reference: Expenditure on Education, Australia
(Cat. no. 5510.0).
Trainees and apprentices — persons undertaking
vocational training through contract of training
arrangements. Contracts of training are legal
agreements entered into by employers and
trainees who are engaged in employment-based
training. Under the terms of the contract, the
employer agrees to provide employment and
training in a particular vocation (on-the-job
training) and agrees to allow the trainee to attend
the appropriate course of instruction, or other
training, as determined by individual State and
Territory training authorities (off-the-job training).
In return, the trainee agrees to complete both the
on and off-job components of the training to the
best of his or her ability.
Reference: National Centre for Vocational
Education Research, Australian apprentice and
trainee statistics 1997/98.
Undergraduate diploma — course lasting three years
full-time (or equivalent) for those wanting to work
as professionals or associate professionals.
Reference: Transition from Education to Work,
Australia (Cat. no. 6227.0).
Unemployment rate — the number of unemployed
persons in any group expressed as a percentage of
the labour force in the same group.
Reference: Transition from Education to Work,
Australia (Cat. no. 6227.0).
Vocational Education and Training (VET) client —
a person aged 15–64 for whom there is a full-time
or part-time vocational stream enrolment in a
TAFE college or a course provided by some
private or adult and community education
providers in the reference year. Does not
necessarily equate to individuals, as some people
may have more than one enrolment.
Reference: National Centre for Vocational
Education Research, Australian Vocational
Education and Training Statistics: in detail.
Year 12 apparent retention rate — the percentage of
full-time students of a given cohort group who
continue from the first year of secondary
schooling to Year 12.
Reference: Schools, Australia (Cat. no. 4221.0).
ABS • AUSTRALIAN SOCIAL TRENDS • 4102.0 • 1999 •
81
Educational profile of
Australians
E D U C A T I O N A L A T T A I N M E N T
In 1996, among the
5.8 million people aged
15 years and over who
held a post-school
qualification,
1.5 million held a
bachelor degree or
higher as their highest
qualification, and
1.5 million held a
skilled vocational
qualification.
In 1996, 42% of the population aged 15 years
and over (5.8 million people) had at least one
post-school qualification – up from 39% in
1991. The proportion of men (aged 15 years
and over) with a qualification increased from
45% to 48%, and for women the proportion
increased from 33% to 36%.
Continuing increases in levels of educational
attainment over recent decades1 have
occurred because of progressive increases in
levels of participation in post-school
educational programs by school leavers;
greater opportunities for study for older
people; inflows of people with qualifications
from overseas (see Australian Social Trends
1996, Migrants and education, pp. 86–91);
and the mortality of people born before
World War II, who were less likely to have
obtained a post-school qualification.
Progressively higher levels of participation in
higher education among younger women (see
Australian Social Trends 1999, Education —
national summary table, pp. 76–77) reflect
significant changes in women's roles and
responsibilities in society.
The types of qualifications held by men and
women, in terms of level of attainment (e.g.,
whether they had a university degree or a
vocational certificate) and field of study, differ
substantially. Comparisons by age reveal that
some of the differences are a legacy of the
different patterns of involvement in education
among older generations of men and women.
Differences between younger men and
women, while reflecting traditional norms,
tend to be less marked.
People with a post-school qualification,
1991 and 1996
%
50
Males
Females
40
30
20
10
0
1991
1996
Source: Unpublished data, 1991 and 1996 Censuses of
Population and Housing.
Post-school qualifications
This review is based on data collected in the 1996
Census of Population and Housing, which asked
people aged 15 years and over a series of
questions about their highest qualification
obtained since leaving school. The questions (like
those in previous censuses) provided information
about the level and field of study in which the
qualification was held, as well as the year in which
the person completed their qualification. As the
information was obtained only for the highest
level of qualification, the Census provides an
incomplete picture of the full range of
qualifications held.
Levels of qualification are classified according to
the ABS Classification of Qualifications into:
bachelor degree and above, comprising
bachelor degree (including honours),
graduate or postgraduate diploma, master's
degree or doctorate;
undergraduate diploma, comprising courses
lasting three years full-time (or equivalent) for
professional or associate professional
occupations;
associate diploma, comprising courses
lasting from one to two years full-time (or
equivalent) for advanced trades, technical or
associate professional occupations;
skilled vocational qualification, which
requires two to four years study and is for
work in a high skilled trade or craft; and
basic vocational qualification, which
requires one semester to one year study for
those wanting to work at the operative level
in various fields.
Level of attainment
In 1996, the most common types of
qualifications held by men were skilled
vocational certificates (19%), bachelor or
higher degrees (11%) and, to a lesser extent,
associate or undergraduate diplomas (5%).
Among women, on the other hand, while
similar proportions had a bachelor degree or
higher (10%), and slightly higher proportions
had an associate or undergraduate diploma
(7%), relatively few had a skilled vocational
qualification (3%). Women were more likely
than men to have a basic vocational
qualification (4% and 2%, respectively).
Those aged between 25 and 44 years in 1996
were the most highly qualified – many of
those in younger age groups were still
students, and many of those in older age
groups had had fewer opportunities to obtain
a post-school qualification. Among those aged
ABS • AUSTRALIAN SOCIAL TRENDS • 4102.0 • 1999
•
83
EDUCATIONAL ATTAINMENT
Proportions with a post-school qualification, 1996
Age (years)
Bachelor
degree or
higher
Associate or
undergraduate
diploma
Skilled
vocational
Basic
vocational
Total with
post-school
qualifications(a)
%
%
%
%
%
Males
15–24
4.2
2.4
8.6
1.6
27.8
25–34
14.6
5.9
23.4
2.3
54.5
35–44
16.2
6.9
23.3
2.5
57.6
45–54
13.5
7.0
21.5
2.4
53.8
6.6
4.4
17.8
1.5
45.8
10.8
5.2
18.9
2.0
47.7
15–24
6.8
4.6
2.4
3.6
28.7
25–34
16.6
8.5
4.2
5.2
44.4
35–44
15.3
9.5
3.0
5.1
43.5
45–54
10.7
8.6
2.8
3.8
36.9
3.6
4.5
1.8
1.5
30.3
10.1
6.9
2.8
3.7
36.4
55 and over
Total
Females
55 and over
Total
(a) Includes those whose level of qualification was not stated or inadequately described.
Source: Unpublished data, 1996 Census of Population and Housing.
25–44, older men (those aged 35–44) were
more likely to have a post-school qualification
than those aged 25–34 (58% and 55%
respectively). For women, however, the
younger of the two age groups were more
likely to have a post-school qualification. The
difference by age is more pronounced among
men and women holding a degree or higher
qualification, to the extent that a higher
proportion of women aged 25–34 had a
degree or higher qualification than men.
The level of attainment of those aged 15–24
compared to those in older age groups
indicates further change. In the 15–24 years
age group, a slightly higher proportion of
women than men had attained a post-school
qualification, and women were more likely to
hold a bachelor or higher degree
(7% compared to 4%).
Field of study
Australia has a diverse economy and a
well-developed system of tertiary level
educational institutions allowing
qualifications to be obtained in a broad range
of fields. Some fields of study are associated
with courses conducted at particular levels of
study, and this is reflected in the types of
qualifications attained by men and women.
For example, in 1996, people who held
qualifications in the broad field of
architecture and building usually held them at
84
• ABS • AUSTRALIAN SOCIAL TRENDS • 4102.0 • 1999
Field of study
Fields of study are classified according to the ABS
Classification of Qualifications. The broad fields of
study are:
business and administration includes studies
in business management, management
support services, sales and marketing, and
financial services;
health comprises studies in medicine,
nursing, health sciences, dental and veterinary
fields, and health and safety services;
education includes school, post-school and
special education teacher training;
society and culture includes economics, law,
behaviour, welfare, languages, religion and
philosophy, librarianship, visual and
performing arts, geography, communication,
recreation and leisure, and policing;
natural and physical sciences includes life
and physical sciences, mathematics, statistics,
and computer science;
engineering includes electrical, electronic,
mechanical, aeronautical, metallurgical and
mining, automotive, chemical, industrial and
civil engineering, surveying and cartography,
textiles, and woodworking studies;
architecture and building includes
architecture and building design and
construction;
agriculture and related fields comprises
agriculture, horticulture, and fisheries and
forestry studies; and
miscellaneous fields includes studies in
hairdressing and beauty therapy, food and
hospitality services, transport, and plant and
machine operation.
EDUCATIONAL ATTAINMENT
the skilled vocational level (84% of those who
stated their level). On the other hand, people
qualified in natural and physical sciences
mostly did so at the bachelor degree level or
higher (72%). Other fields of study were more
evenly distributed. For example, people were
about as likely to hold a qualification in
business and administration at the associate
or undergraduate diploma level (31%) as at
the basic vocational level (28%) or at the
bachelor degree level or higher (36%).
Among people with bachelor degrees or
higher, the most commonly held
qualifications were in the fields of society and
culture (357,800 people), education
(278,500), business and administration
(227,000) and health (213,600). Aside from
the field of business and administration, there
were more women than men with higher
educational qualifications in these fields
(particularly in the fields of education and
health, where 70% and 66%, respectively, of
all those with degrees were women).
Among the 846,500 people whose highest
qualification was an associate or
undergraduate diploma, the three most
common fields of study, all dominated by
women, were business and administration
(194,700 people), health (176,200) and
education (155,400).
The two major fields of study among people,
mostly men, with skilled vocational
qualifications, were engineering (835,600
people, 96% of whom were men) and
architecture and building (291,800, 99% of
whom were men). These two fields alone,
while covering a diverse range of specialised
skills, accounted for 76% of all people with a
skilled vocational qualification.
Among the 398,700 people whose highest
qualification was from a course designed to
provide a basic vocational skill, almost two
thirds (65%) were women, most of whom had
completed courses in the fields of business
and administration, and health. Within the
broad field of business and administration
(142,300 women and 34,800 men), women
were more likely than men to have a
qualification concerned with providing
management support services (73% compared
with 9% for men), particularly keyboarding
and shorthand (56%, compared with 3%).
Men, on the other hand, were more likely to
have a basic qualification in management
(38%, compared with 4% for women), sales
and marketing (24%, compared with 8%) or
financial services (15%, compared with 3%).
State and Territory differences
The educational attainment profile of people
differs according to the geographical region in
which they live.2 The extent to which people
in the towns and cities of each State and
Territory have access to institutions offering
certain qualifications may be part of the
reason. However, as particular industries
need and attract people with specialised
skills, differences in the regional mix of
industries are likely to be important in
determining whether high proportions of
people in any one region have certain types of
qualifications. The populations of the States
People with post-school qualifications, by type of qualification(a), 1996
Bachelor degree
or higher
Broad field of study
'000
Associate or undergraduate diploma
Skilled vocational
% female
'000
% female
'000
% female
'000
% female
35.7
194.7
53.4
26.1
44.5
177.1
80.3
Basic vocational
Business and administration
227.0
Health
213.6
66.2
176.2
87.9
7.6
38.2
67.6
91.9
Education
278.5
70.0
155.4
78.2
..
..
0.7
55.7
Society and culture
357.8
54.8
98.9
68.6
32.3
72.7
30.1
70.4
Natural and physical sciences
182.2
35.8
42.5
36.4
6.2
38.7
20.8
48.2
Engineering
120.1
8.4
105.0
6.5
835.6
3.8
33.6
19.0
Architecture and building
21.9
24.2
21.4
17.0
291.8
1.3
11.5
6.9
Agriculture and related fields
17.7
23.8
23.5
21.2
33.2
12.0
17.6
23.3
1.3
17.5
18.6
27.1
209.5
51.9
34.7
33.9
1 450.9
49.4
846.5
57.8
1 483.0
13.2
398.7
65.4
Miscellaneous fields
Total(b)
(a) People aged 15 years and over.
(b) Includes those whose field of study was not stated or inadequately described.
Source: Unpublished data, 1996 Census of Population and Housing.
ABS • AUSTRALIAN SOCIAL TRENDS • 4102.0 • 1999
•
85
EDUCATIONAL ATTAINMENT
Proportion of people aged 15 years and over with the most common types of qualifications(a), by State
and Territory, 1996
NSW
Vic.
Qld
SA
WA
Tas.
NT
ACT
Aust.
Type of qualification
%
%
%
%
%
%
%
%
%
Bachelor degree or higher(b)
10.9
11.4
8.6
8.6
9.9
7.9
9.6
22.6
10.4
Society and culture
2.8
2.8
1.9
2.1
2.2
1.9
2.3
8.3
2.6
Education
1.9
2.3
1.8
1.7
2.0
2.0
2.3
2.7
2.0
Business and administration
1.8
1.9
1.4
1.0
1.6
0.8
1.2
2.6
1.6
Health
1.5
1.6
1.5
1.6
1.5
1.4
1.5
1.7
1.5
Natural and physical sciences
1.3
1.5
1.0
1.1
1.3
1.0
1.2
4.5
1.3
6.1
Associate or undergraduate diploma(b)
6.5
6.1
5.4
5.6
6.2
5.3
5.4
7.3
Business and administration
1.7
1.4
1.0
1.2
1.4
0.8
1.0
1.7
1.4
Health
1.3
1.2
1.2
1.4
1.4
1.4
1.1
1.4
1.3
Skilled vocational qualification(b)
10.9
10.0
11.3
10.6
11.4
10.0
10.6
6.9
10.7
Engineering
6.1
5.6
6.3
6.3
6.6
5.2
6.1
3.1
6.0
Architecture and building
2.1
2.0
2.6
1.6
2.1
2.3
1.9
1.6
2.1
Basic vocational qualifications(b)
3.3
2.5
2.3
3.1
3.2
2.7
2.8
3.8
2.9
1.7
0.9
0.9
1.1
1.4
1.1
1.1
2.0
1.3
44.4
41.7
39.0
38.5
42.1
37.5
42.0
51.2
41.9
'000
'000
'000
'000
'000
'000
'000
'000
'000
4 719.5
3 486.1 2 523.8
360.1
127.9
232.3
13 914.9
Business and administration
All persons with
post-school qualifications(c)
All persons aged 15 years and over
1 142.3 1 320.9
(a) Includes the ten most commonly held qualifications, Australia-wide (see previous table), when classified by broad fields of study and level of attainment.
(b) As a proportion of all persons. Includes those whose field of study was not stated or inadequately described.
(c) Includes those for whom both level of qualification and field of study was not stated or inadequately described.
Source: Unpublished data, 1996 Census of Population and Housing.
and Territories also have different age
profiles, affecting the proportions of people
with a post-school qualification.
highly represented (8%), as were those with a
degree in the natural and physical sciences
(4%).
In 1996, the proportion of people aged 15
years and over with a post-school
qualification was highest in the Australian
Capital Territory (51%). The proportions in
New South Wales, Western Australia, the
Northern Territory and Victoria ranged
between 42% to 44% while those in
Queensland, South Australia and Tasmania
ranged between 38% and 39%.
Among the other States and the Northern
Territory, the proportions of people with
degrees, diplomas and skilled vocational
qualifications were not greatly dissimilar. The
proportions of their populations with
qualifications in the most popular fields of
study were also much the same. In the field of
business and administration, Tasmania had a
lower representation of people with degrees
and diplomas, 1.6%, which in the other
populations ranged from 2.2% in South
Australia and the Northern Territory to 3.5%
in New South Wales. However, this was
among the larger of the differences.
The comparatively small, mostly urban
population of the Australian Capital Territory,
which has a high proportion of people
working in the government and education
sectors, had the highest proportion of people
with a bachelor degree or higher (23%) and
with an associate or undergraduate diploma
(7%). The proportion with a bachelor degree
or higher was generally more than twice the
proportion in each of the other States and
Territories. People with a degree in society
and culture (which includes arts, humanities,
social and behavioural sciences and law) were
86
• ABS • AUSTRALIAN SOCIAL TRENDS • 4102.0 • 1999
Endnotes
1 Australian Bureau of Statistics 1998, Social
Indicators 5, Australia (see p.127), Cat. no.
4101.0, ABS, Canberra.
2 Australian Bureau of Statistics 1998, Australia in
Profile: A Regional Analysis, Census 1996,
Cat. no. 2032.0, ABS, Canberra.
Destinations of school
leavers
P A R T I C I P A T I O N
Over the past decade,
school leavers have
increasingly favoured
going on to tertiary
education.
When teenagers leave school, they take one
of their first critical steps into the wider world
of adult life. The choices they make can have
a long-term influence on their future career
paths. A school leaver's range of options can
include work, university or vocational training
and many combinations of work and
education. In 1998, 257,800 students left
school and moved on to take up one of these
options. Of these students, 37% left school
early, before having completed Year 12. The
most common reason for leaving school given
by early school leavers was to take up, or look
for, employment, presumably to speed their
independence.1 However, early school leavers
would probably find that their options were
more limited than those of students who
completed Year 12.
In 1998, just under a third (30%) of the
students who had left school the previous
year had gone on to a higher education
institution: 24% had gone on to vocational
study at TAFE colleges, while 5% were
studying at other educational institutions
such as a business college etc. There were
42% of school leavers who were not attending
an educational institution (a small proportion
of whom would have been accepted into a
tertiary institution but had chosen to defer
their enrolment by a year).
School leavers
This review is mainly based on data from the ABS
Transition from Education to Work Survey carried
out in May 1998.
School leavers in this review refer to people aged
15–24 years who attended school in a certain year
but were not attending school by May of the
following year. School leavers have been divided
into the following two groups:
Year 12 leavers are those who last attended
Year 12 of school.
Early school leavers are those who last
attended Year 10, 11 or an earlier year of
school.
Occupations are ranked in the Australian Standard
Classification of Occupations (ASCO 2nd Edition)
on the basis of skill level, and for this review, have
been grouped into two broad skill categories.
High skilled – (Skill Levels 1, 2, and 3)
comprising professional, management,
associate professional, advanced clerical and
trade occupations.
Less skilled – (Skill Levels 4 and 5) comprising
intermediate clerical, intermediate production
and transport, elementary clerical and
labouring occupations.
School leavers by activity after leaving school, 1988–1998
%
60
Higher education
TAFE
Other study(a)
Not attending an educational institution
50
40
30
20
10
0
1988
1989
1990
1991
1992
1993
1994
1995
1996
1997
1998
(a) Includes business colleges, industry skills centres and other educational institutions.
Source: Transition from Education to Work, Australia (Cat. no. 6227.0).
ABS • AUSTRALIAN SOCIAL TRENDS • 4102.0 • 1999
•
87
PARTICIPATION IN EDUCATION
School leavers by type of school attended in the previous year
Type of institution
attending in May 1998
Year 12 leavers
Early school leavers
Government
school
Non-government
school
Total
Government
school
Non-government
school
Total
%
%
%
%
%
%
Higher education
37.6
61.2
46.8
1.9
3.2
2.0
TAFE
20.0
16.8
18.7
29.4
52.8
32.1
Other study(b)
3.2
5.9
4.2
4.4
9.1
4.9
Not attending
39.3
16.1
30.2
64.3
34.9
61.0
100.0
100.0
100.0
100.0
100.0
100.0
'000
'000
'000
'000
'000
'000
98.7
63.3
161.9
84.9
11.0
95.9
Total
Total
(b) Includes business colleges, industry skills centres and other educational institutions.
Source: Unpublished data, Transition from Education to Work, Australia, 1998.
Over the past decade, the destinations of
school leavers have shifted towards tertiary
education. Although not consistent over the
period, overall the proportion of school
leavers who chose to continue their studies
increased from 43% in 1988 to 58% in 1998.
Higher education has increased its share of
school leavers from 18% in 1988 to 30% in
1998.
Higher education
In 1998, higher education institutions
attracted 77,700 school leavers, 30% of
students who had left school the previous
year. These students were predominantly
studying towards a Bachelor degree and
would generally have had to complete their
Year 12 studies to attain admission to the
institution.
Year 12 school leavers from non-government
schools were more likely to attend a higher
education institution than those from
government schools (61% compared to 38%).
Overall, one half of school leavers attending a
higher education institution came from
non-government schools, even though school
leavers from non-government schools
represented only 29% of all school leavers.
There is no simple explanation for the greater
representation of school leavers from
non-government schools, though it is
probably related to factors such as their
parent's level of education and ability to
provide financial support.
Among Year 12 leavers, girls (49% of girls)
were slightly more likely to be undertaking
higher education than boys (45% of boys).
This reflects the trend towards females having
an increasingly higher participation rate in
School leavers by sex
Year 12 leavers
Type of institution
attending in May 1998
Early school leavers
All school leavers
Boys
Girls
Total
Boys
Girls
Total
Boys
Girls
Total
%
%
%
%
%
%
%
%
%
Higher education
44.8
48.6
46.8
2.4
1.4
2.0
26.6
33.9
30.2
TAFE
22.5
15.4
18.7
35.2
27.5
32.1
28.0
19.2
23.7
Other study(b)
3.1
5.2
4.2
2.8
8.1
4.9
3.0
6.1
4.5
Not attending
29.6
30.8
30.2
59.6
63.0
61.0
42.5
40.8
41.7
Total
Total
100.0 100.0 100.0
100.0 100.0 100.0
100.0 100.0 100.0
'000
'000
'000
75.5
'000
'000
86.5 161.9
56.9
'000
39.0
'000
95.9
(b) Includes business colleges, industry skills centres and other educational institutions.
Source: Unpublished data, Transition from Education to Work, Australia, 1998.
88
• ABS • AUSTRALIAN SOCIAL TRENDS • 4102.0 • 1999
'000
'000
132.3 125.5 257.8
PARTICIPATION IN EDUCATION
higher education than males, a trend that has
existed since 1989 (see Australian Social
Trends 1998, Gender differences in
educational achievement, pp. 81–85).
Technical and further education
In 1998, Colleges of Technical and Further
Education (TAFE) attracted 61,100 school
leavers, 24% of school leavers in 1998.
Proportionally, students from government
and non-government schools were similarly
represented: 24% of school leavers from
government schools and 22% of leavers from
non-government schools were attending a
TAFE institution. However, early school
leavers were more likely to attend (32%) than
Year 12 school leavers (19%). When looking
at both the type of school and the level of
schooling, the highest rate of attendance at
TAFE occurred among early school leavers.
Early school leavers from non-government
schools were more likely than those from
government schools to progress to a TAFE
institution.
Boys were more likely to attend a TAFE
institution than girls: 28% of male school
leavers compared to 19% of female school
leavers. These proportions were higher
among early school leavers, with 35% of boys
and 27% of girls attending a TAFE institution
in 1998.
The labour force
In 1998, about 107,400 school leavers were
not attending an educational institution,
representing 42% of all school leavers. The
majority of these school leavers, 85%, had a
job or were looking for work. That is, they
participated in the labour force.
The overall unemployment rate among these
school leavers who were not undertaking
tertiary studies was high (35%) though there
were considerable differences among
particular groups of school leavers. Early
school leavers had the highest rate of
unemployment (45%). This was about the
same, regardless of the type of school they
had attended or whether they were male or
female.
Year 12 leavers had an overall unemployment
rate of 23%. Those from non-government
schools had a lower unemployment rate
(12%) than those from government schools
(26%). Male Year 12 leavers had a lower rate
(19%) than females (27%).
When 1998 figures are compared to those of
school leavers in 1992, some distinct changes
are evident. Overall, labour force
participation rates have decreased from 91%
to 85% while unemployment rates have also
decreased from 42% overall to 35%. The
proportion of school leavers working full-time
has decreased from 64% overall to 52%, partly
reflecting the general trend towards part-time
School leavers not attending an educational institution in May 1998
Total
Year 12 leaver
1992
1998
'000
'000
65.0
48.9
Proportion
employed fulltime (of those
employed)
Unemployment
rate
Labour force
participation
rate
1992
1998
1992
1998
1992
%
%
%
%
%
%
56.7
49.9
34.7
23.3
94.5
89.0
1998
Government school
51.8
38.8
54.1
48.5
37.3
26.3
95.0
89.0
Non-government school
13.2
10.2
65.2
54.2
24.4
12.2
92.5
89.0
Boys
36.0
22.3
64.3
59.9
34.4
19.3
95.8
89.6
Girls
29.1
26.6
46.8
40.5
35.1
26.7
92.8
88.6
Early school leaver
Government school
Non-government school
59.3
58.4
76.4
54.0
50.0
45.3
87.3
80.8
51.2
54.6
76.2
57.0
51.0
45.3
87.0
80.1
43.8*
44.9*
89.1
90.9*
Boys
33.3
33.9
80.4
58.8
46.0
45.2
90.8
84.8
Girls
26.0
24.5
69.5
46.5
55.6
45.3
82.8
75.3
124.4
107.4
64.4
51.7
41.7
34.7
91.0
84.6
Total
8.1
3.8*
77.7*
**
Source: Unpublished data, Transition from Education to Work, Australia, 1998.
ABS • AUSTRALIAN SOCIAL TRENDS • 4102.0 • 1999
•
89
PARTICIPATION IN EDUCATION
employment (see Australian Social Trends
1999, Decline of the standard working week,
pp. 105–109).
Occupations of employed school
leavers not attending a tertiary
education institution, 1998
Year 12 Early
leavers leavers
Skill level(a)/occupation
High skill
%
%
9.3*
18.4
Skill level 1 and 2
Managers and
administrators;
professionals; and associate
professionals
3.8*
**
Skill level 3
Tradespersons
and related workers;
advanced clerical and
service workers
Less skilled
14.6
7.5*
81.6
90.7
Skill level 4
Intermediate clerical,
sales and service workers
Intermediate production
and transport workers
16.3
7.9*
9.0*
9.8*
Skill level 5
Total
Elementary clerical,
sales and service workers
35.7
36.6
Labourers and related
workers
20.6
36.4
100.0
100.0
(a) Australian Standard Classification of Occupations
(2nd Edition).
Source: Unpublished data, Transition from Education to
Work, Australia, 1998.
90
• ABS • AUSTRALIAN SOCIAL TRENDS • 4102.0 • 1999
Overall, in 1998, 82% of Year 12 leavers and
91% of early school leavers who were
employed, but not attending an educational
institution, were in less skilled occupations.
About 36% of both Year 12 leavers and early
leavers who were employed, were in the
elementary clerical, sales or service workers
category (in skill level 5). A further 36% of
early leavers were employed in the labourer
and related worker category (also in skill
level 5). This latter category also accounted
for 21% of Year 12 leavers. Year 12 leavers'
representation in the high skill occupations
was 18%.
Neither studying nor in the labour
force
Among school leavers not attending an
educational institution in 1998, 16,600 young
people were not working or looking for work.
That is, they were not participating in the
labour force. In 1998, these school leavers
represented 6% of all school leavers, or 15%
of school leavers not attending an educational
institution. These school leavers were
predominantly early school leavers (68%),
from government schools (91%) and slightly
more likely to be female (55%).
Endnotes
1 Australian Bureau of Statistics, Survey of
Education and Training Experience 1997,
Cat. no. 6278.0, ABS, Canberra.
Educating and training
Australia's workers
E D U C A T I O N
In 1997, workers in
more highly skilled
occupations, such as
professionals, were
more likely to have
undertaken study or
training courses (95%),
than workers in less
skilled occupations,
such as labourers and
related workers (69%).
A N D
W O R K
Gaining a qualification for a predetermined
career is not a guarantee of lifelong
employment. To keep pace with a changing
work environment (see Australian Social
Trends 1997, Changing industries, changing
jobs, pp. 93–98), and to help in both getting
and keeping a job, many workers study for an
educational qualification or participate in
training at various times throughout their
working lives. This training is often informal
while on-the-job, but also includes more
formal training, both in and outside of the
workplace. Some workers choose to gain an
initial or extra educational qualification
through studying at a TAFE or business
college, or at a university; while others begin
their studies after being retrenched or having
decided on a career change (see Australian
Social Trends 1997, Education and
employment, pp. 84–87).
It is in the interests of employers, too, to have
skilled workers. Many employers assist their
staff to develop their skills by arranging
training within the workplace or supporting
employees to gain qualifications at an
educational institution.
The 1997 Survey of Education and Training
showed that 4 million wage and salary earners
held a post-school qualification (54% of all
Wage and salary earners: level of educational attainment and
enrolment, selected years
With post-school qualifications
Higher
Vocational
All
education(a) qualification(b) qualifications(c)
Total
%
%
'000
%
1989
n.a.
n.a.
47.3
6 704.7
1993
24.2
22.8
47.8
7 078.7
1997
27.8
24.4
53.9
7 419.6
Males
23.8
29.0
54.5
3 943.7
Females
32.3
19.2
53.1
3 475.9
Enrolled for post-school qualifications
1997
9.9
3.8
14.2
7 419.6
(a) Comprises higher degree, postgraduate diploma, bachelor degree, undergraduate diploma or
associate diploma.
(b) Skilled or basic.
(c) Includes persons whose level of post-school qualification was not stated or inadequately
described.
Source: Education and Training Experience, Australia, 1997 (Cat. no. 6278.0); and unpublished
data, 1997 Survey of Education and Training.
Education, training and employment
The main source of data is the ABS Survey of
Education and Training, a household survey
conducted during the period March to May 1997.
Some time series data are also provided from the
1993 and 1989 surveys of education and training.
Wage and salary earners (more commonly
referred to as 'workers' in this review) are persons
aged 15–64 years who had worked as wage and
salary earners in the 12 months prior to the
surveys (March to May 1997, April to May 1993, or
March to July 1989). Persons aged 15–20 years and
still at secondary school are excluded in this
review.
Post-school education is defined as a course of
study through an educational institution, since
leaving school, for which an award is conferred
upon completion.
Training courses are activities undertaken to
obtain, maintain, or improve work-related skills,
conducted at a designated time, in a structured
format. On-the-job training, and study for an
educational qualification, are excluded.
On-the-job training refers to activities undertaken
to improve job skills, such as:
asking questions of co-workers or colleagues;
self teaching;
being shown how to do the job; and
watching others work.
A skilled vocational qualification requires two to
four years' study and is for work in a higher skilled
trade or craft. A basic vocational qualification
requires one semester to one year's study for
those wanting to work at the operative level in
various fields (see Education – definitions and
references pp. 80–81).
wage and salary earners) – almost 2.1 million
held a higher education qualification
(28% of all wage and salary earners), and a
further 1.8 million (24%) held a skilled or
basic vocational qualification. Women were
more likely than men to have a higher
education qualification (32% compared to
24%), and less likely to have a vocational
qualification (19% and 29%).
Recent education trends
The proportion of wage and salary earners
who had a post-school qualification increased
between 1989 and 1997 from 47% to 54%.
Since 1993, the increase has been more
substantial for those with a higher education
qualification (from 24% to 28%, than for those
with vocational qualifications (from 23% to
ABS • AUSTRALIAN SOCIAL TRENDS • 4102.0 • 1999
•
91
EDUCATION AND WORK
24%). The trend towards higher education
qualifications looks set to continue with more
enrolments in higher education courses than
in vocational courses. In 1997, there were just
over one million workers enrolled for a
post-school qualification. Over two thirds of
these were enrolled for a higher education
qualification, and just over one quarter for a
vocational qualification – similar proportions
as those for all students.1 Some of these were
full-time workers undertaking part-time study,
such as apprentices or mature-age university
students, and others were full-time students
with a part-time job, such as young people
studying at university.
The likelihood of workers undertaking
studies, whether for a first or subsequent
qualification, varied according to their
occupation, partly because some occupations
have requirements for formal qualifications
while others do not. In general, those in more
highly skilled occupations, for example
professionals, were more likely to be involved
in study or training courses, and to have
received employer support, than those in less
skilled occupations, such as labourers and
related workers.
One in six workers (16%) had studied for a
post-school qualification in 1996 – more
commonly professionals (21%) and
elementary clerical, sales and service workers
(19%). Of those who had studied, 61% of the
elementary clerical, sales and service workers
had studied for a bachelor degree or higher.
This suggests that many of them were
full-time university students working
part-time in lower skilled jobs until they had
completed their studies.
Recent training
In addition to any formal qualifications they
might have, many workers receive training
while employed. This may be in-house or
external training courses, or on-the-job
training – the most common type. In 1997,
74% of workers had received on-the-job
training during the previous 12 months –
similar to the proportions in 1989 (72%), but
lower than in 1993 (82%). Those in more
highly skilled occupations, such as
professionals, were most likely to have
received on-the-job training (90%), and those
in less skilled occupations, such as
intermediate production and transport
workers, the least likely (58%).
Participation in external training courses
(courses taken while not working or with
other attendees working for a different
employer) was less common, with one in
five workers receiving this type of training in
Wage and salary earners: study or training undertaken by occupation and selected years
Studied for a postschool qualification
in previous year(a)
Training(a)(b)
On-the-job In-house External
Total who did
any study or
training(c)
Total
%
%
%
%
%
Managers and administrators
12.0
84.2
44.0
35.8
91.9
350.6
Professionals
20.9
89.6
52.2
35.7
95.4
1 343.1
'000
Occupation in 1997
Associate professionals
17.1
80.9
44.6
24.5
89.2
695.5
Tradespersons and related workers
18.0
70.9
25.5
16.4
80.0
912.9
Advanced clerical and service workers
14.4
77.2
31.9
19.6
84.1
289.3
Intermediate clerical, sales and service workers
15.5
75.1
35.8
17.9
84.8
1 488.8
Intermediate production and transport workers
7.8
58.2
24.2
10.8
68.9
727.8
Elementary clerical, sales and service workers
18.8
71.3
26.5
15.1
81.6
778.3
9.1
58.6
15.8
10.9
69.1
833.4
15.6
74.4
34.2
20.7
83.2
7 419.6
Labourers and related workers
Total 1997
Total 1993
18.6
81.8
31.3
11.8
85.8
7 078.7
Total 1989
16.8
71.8
34.9
9.8
79.0
6 704.7
(a) In the 12 months prior to the relevant survey.
(b) On-the-job training undertaken, or in-house or external training courses completed.
(c) People may undertake more than one study or training course, therefore components may not add to total.
Source: Education and Training Experience, Australia, 1997 (Cat. no. 6278.0); and unpublished data, 1997 Survey of Education and Training.
92
• ABS • AUSTRALIAN SOCIAL TRENDS • 4102.0 • 1999
EDUCATION AND WORK
Wage and salary earners enrolled for post-school education(a): source of financial support, 1997
Source of support(b)
Study status
Level of qualification
Full-time Part-time External
Higher degree
and postgrad- Bachelor
uate diploma degree
Associate or
undergraduate Skilled
Basic
diploma
vocational vocational Total(c)
%
%
%
Employer
Other(d)
%
%
%
5.6
35.0
32.5
35.7
12.6
17.0
%
%
%
63.0
25.4
23.7
67.1
13.8
14.6
23.2
48.7
27.7
21.9
26.8
33.5
Family members
39.3
5.8
4.5
6.6
31.0
13.9
12.4
8.8
17.9
Government
32.2
5.9
6.2
12.1
20.5
13.5
7.9
16.0
15.6
29.1
55.6
57.3
48.3
40.0
56.8
51.9
52.5
46.2
100.0
100.0
100.0
100.0
100.0
100.0
100.0
100.0
100.0
Did not receive support
Total
'000
'000
'000
'000
'000
'000
'000
'000
'000
Total
387.3
468.4
199.0
151.9
396.3
186.4
121.9
161.6
1 054.7
%
%
%
%
%
%
%
%
%
Per cent aged 15–24 years
78.4
39.8
19.9
16.1
62.1
45.0
78.8
39.7
50.2
(a) Where more than one post-school qualification was enrolled for, details were collected about the most recent.
(b) People could report more than one type of financial support, therefore components may not add to total.
(c) Includes persons whose level of post-school qualification enrolled for was not stated or inadequately described.
(d) Comprises support from government, family members, union or professional organisations, other and not known.
Source: Unpublished data, 1997 Survey of Education and Training.
the previous 12 months (21%). However, this
represented a strong increase in external
training course participation since 1989 when
the participation rate was 10%. It may partly
reflect the trend towards outsourcing and
contracting of many of the functions
previously provided in-house. Levels of
participation in in-house training courses
were nevertheless similar in 1997 (34%) to
1989 (35%).
Support for education and training
People enrolled to obtain a post-school
qualification may support themselves during
their studies, but often obtain additional
funding to pay for their education and living
expenses. Of all workers enrolled in a
post-school program of education in 1997,
24% received financial support from an
employer, 18% from family and 16% from
government (through payments such as
Austudy or the Youth Training Allowance).
Full-time study for a post-school qualification
is more commonly undertaken by younger
workers (78% were aged 15–24 years in
1997), who usually support themselves with a
combination of part-time work, and/or
government and family assistance. Full-time
students were generally more likely to receive
support from family and from the government
than part-time students. In 1997, 32% of
workers studying full-time for a post-school
qualification obtained support from the
government and 39% from family members.
On the other hand, students studying
part-time, many of whom will have worked
for some time, were more likely to have
received support from employers (35%).
Training for a skilled vocational qualification
generally occurs while a student is employed
in the field in which the qualification is being
attained (often as apprentices or trainees). As
a result, workers enrolled in these courses
were much more likely to have received
employer support (63%) than those enrolled
for a bachelor degree (13%). Similarly, people
undertaking post-graduate studies usually do
so in order to progress further in their chosen
career. These courses are generally
undertaken by older workers (84% were aged
25 years or more), who were more likely to
have received support from their employer
(36%) than from other sources.
The 1997 Survey of Education and Training
also found that those enrolled for a
post-school qualification who received
financial support from their employer were
most likely to have received support in the
form of fee payments (62%) or paid study
leave (50%).
Workers can also improve their skills through
undertaking training courses that are related
to their employment. Employers are more
likely to provide support for courses where
the relevance to the skills their staff need are
ABS • AUSTRALIAN SOCIAL TRENDS • 4102.0 • 1999
•
93
EDUCATION AND WORK
Wage and salary earners: indicators of education and training experience and intentions, 1997
Selected population groups
With
post-school
qualifications
Undertaken
some study or
training(a)
Had employer
financial support for
external training
Enrolled for postschool qual. but
not completed(b)
Intends to
enrol for postschool qual.(c)
Total
%
%
%
%
%
'000
Males
54.5
82.9
11.8
8.9
16.1
3 943.7
Females
53.1
83.5
12.6
10.2
16.7
3 475.9
Indigenous
With post-school qualifications
34.6
84.0
15.0
21.9
71.1
100.0
87.8
16.6
9.6
19.5
3 997.5
3 422.0
Without post-school qualifications
9.1*
..
77.8
7.1
9.4
12.7
English not first language(d)
55.5
70.9
8.0
8.2
15.1
851.0
Persons with a disability
52.0
80.2
11.7
9.7
16.8
1 332.5
Persons aged 15–24 years
37.7
93.7
8.0
18.2
26.1
1 545.1
Persons aged 25–34 years
58.6
85.8
13.1
10.4
19.0
2 076.8
Persons aged 35–44 years
59.8
82.5
15.1
6.9
15.1
1 857.8
Persons aged 45–64 years
56.0
72.7
11.7
4.1
7.1
1 939.8
All wage and salary earners
53.9
83.2
12.2
9.5
16.4
7 419.6
(a) In the 12 months prior to the 1997 survey.
(b) In the last five years.
(c) In the next three years.
(d) For persons not born in Australia.
Source: Education and Training Experience, Australia, 1997 (Cat. no. 6278.0); and unpublished data, 1997 Survey of Education and Training.
more obvious. Of the 1.5 million workers who
undertook external training courses in the
12 months prior to the 1997 Survey,
59% received employer financial support
(that is, 12% of all workers).
Access to education and training
In general, actual or intended involvement in
study for an educational qualification or in
work-related training differs little between
men and women, but decreases with
increasing age. In 1997, 94% of workers aged
15–24 years had undertaken some study or
training in the 12 months prior to the survey
compared to 73% of those aged 45 years and
over. In contrast, the proportion of workers
who received employer financial support for
external training courses increased with age,
up to the 35–44 age group.
Apart from the differences by age, certain
groups of people, such as Indigenous
Australians or those with a disability, can
experience special difficulties in gaining
access to education or training opportunities.
Indigenous Australians commonly have had
lower levels of participation in
post-compulsory education than the rest of
the community (see Australian Social Trends
1996, The education of Indigenous people,
pp. 75–78), and in 1997 this was reflected in
the lower proportions of Indigenous workers
with a post-school qualification (35%)
94
• ABS • AUSTRALIAN SOCIAL TRENDS • 4102.0 • 1999
compared to all workers (54%). Indigenous
workers, however, were just as likely as all
workers to have undertaken some training or
study in the 12 months prior to the 1997
Survey (84% and 83% respectively). They were
also more likely to be intending to enrol for a
post-school qualification in the three years
following the survey (22%) than all workers
(16%). These results are, in part, affected by
the younger age structure of Indigenous
workers, with younger workers being more
likely than older workers to participate in
study or training courses.
Workers without post-school qualifications
undertook less study or training courses than
those with post-school qualifications
(78% versus 88%), and received less employer
support for external training courses
(7% and 17% respectively). They were also
less likely to intend to enrol than those who
already held a post-school qualification
(13% compared to 20%).
Overseas-born workers whose first language
was not English were just as likely to have a
post-school qualification as all workers
(55% and 54% respectively). For workers who
immigrated as adults, this reflects both the
immigration selection process which, in part,
favours those with post-school educational
qualifications, and also their older age profile
compared to the Australian-born population,
giving them more opportunity to have
completed a qualification. Overseas-born
EDUCATION AND WORK
workers (whose first language was not
English), however, did not participate in
in-house or external training courses
(22% and 14% respectively) to the same
extent as the general population of workers
(34% and 21%). In association with this lower
participation in training courses, a lower
proportion of overseas-born workers (8%)
received employer support for training than
all workers (12%). It is not clear whether the
lower employer support for training courses
is a cause or a consequence of the lower level
of participation.
Having a disability did not seem to affect the
level of training or education participation of
workers, possibly because those who were
able to find employment had lower levels of
disability than those who were not able to get
a job (see Australian Social Trends 1997,
Employment of people with a handicap,
pp. 104–108).
Endnotes
1 Australian Bureau of Statistics 1998, Education
and Training Experience, Australia 1997,
Cat. no. 6278.0, ABS, Canberra.
ABS • AUSTRALIAN SOCIAL TRENDS • 4102.0 • 1999
•
95
Work
Page
National and State summary tables . . . . . . . . . . . . . . . . . . . . . . . . . . . 98
PAID WORK
Decline of the standard working week
.....................
105
This article reveals the extent of the shift away from the 'standard' working
week of 35–40 hours between 1988 and 1998. It highlights the changes in
the proportions of men and women, by age group, who worked longer
hours and shorter hours. Changes by occupation and industry are also
examined.
UNDER-UTILISED LABOUR
Men and women wanting work
.................................
110
This review provides a picture of the extent of under-utilised labour in
Australia by profiling the men and women of working age (15–64 years)
who are unemployed, employed part-time but wanting to work more
hours, or marginally attached to the labour force. Barriers to finding work
and the effect of changing economic conditions on participation in the
labour force are also explored.
Older jobseekers
.....................................................
114
Although their overall unemployment rate is relatively low, older people
engaged in job search activities experience less success in obtaining work
than younger jobseekers, are more likely to drop out of the labour
market, and less likely to find a job as a result of a training course. Jobs
they do find are generally less favourable in terms of occupation, income
and job security than jobs held by other workers in the equivalent age
group.
UNPAID WORK
How couples share domestic work
...........................
119
By focussing on couples where partners worked similar hours to each
other, the time spent on domestic work by men and women in 1997 are
examined in this article. The degree of segregation in the specific types of
domestic work they undertook is also discussed.
ABS • AUSTRALIAN SOCIAL TRENDS • 4102.0 • 1999 •
97
Work — national summary
LABOUR FORCE
Units
1988
1989
1990
1991
1992
1993
1994
1995
1996
1997
1998
Total labour force
'000
7 867
8 083
8 346
r8 491
8 518
8 574
8 696
r8 886
9 066
r9 173
9 261
Females – (of total labour force)
Participation rate
Male participation rate
Female participation rate
Females in the labour force with
children aged 0–4 (of all
females with children aged 0–4)
Standardised participation rate
Participation rate
of persons aged 15–19 years
Participation rate
of persons aged 20–24 years
Median age of male labour force
Median age of female labour force
%
40.3
40.8
41.4
41.7
41.9
41.9
42.3
42.7
r43.0
43.1
43.2
%
62.2
62.6
63.5
63.6
63.0
62.6
62.8
63.3
63.7
63.5
63.1
%
75.3
75.2
75.5
75.3
74.4
73.9
73.6
73.8
r73.8
73.4
73.0
%
49.4
50.4
51.9
52.3
51.9
51.7
52.2
53.2
53.8
53.9
53.6
%
43.0
44.0
46.3
44.5
46.6
45.3
46.1
49.3
47.4
47.7
48.2
%
62.3
62.7
63.6
63.7
63.1
62.8
63.0
63.6
64.0
63.9
63.7
%
59.6
59.9
60.9
58.6
55.7
55.1
55.8
58.8
59.2
59.0
57.7
EMPLOYED PEOPLE
Total employed
%
83.6
83.7
83.9
84.0
82.6
82.1
82.1
82.8
83.0
82.5
82.0
years
35.5
35.6
35.8
36.1
36.3
36.5
36.7
36.9
37.1
37.2
37.5
years
33.0
33.4
33.7
34.2
34.6
34.9
35.1
35.3
35.7
36.1
36.2
Units
1988
1989
1990
1991
1992
1993
1994
1995
1996
1997
1998
'000
7 256
7 549
7 832
7 782
7 637
7 634
7 781
8 093
r8 301
r8 381
8 496
57.4
58.5
59.6
58.3
56.5
55.8
56.2
57.7
58.3
58.0
57.9
19.8
20.1
20.9
21.7
22.9
23.5
23.8
24.4
24.6
r25.2
25.6
7.1
7.2
8.0
8.5
9.7
10.2
10.4
10.9
11.0
11.7
12.0
38.7
38.9
39.5
40.2
41.1
41.7
42.0
42.5
42.5
42.9
43.3
78.3
78.6
77.6
77.2
75.6
75.1
75.0
74.5
74.6
73.7
73.4
15.2
15.3
15.2
15.3
15.4
15.4
15.5
15.7
15.6
15.8
16.0
18.7
17.6
18.0
21.7
26.4
29.2
28.3
26.1
26.1
26.2
25.8
54.3
53.6
54.1
53.9
53.3
53.4
52.8
51.8
52.1
51.1
50.8
39.7
39.7
39.9
r40.0
40.6
r40.4
40.7
r41.0
r40.6
r41.1
41.3
19.7
20.1
20.4
20.7
22.1
22.4
23.7
24.3
23.7
24.4
24.9
1.4
1.5
1.3
1.1
1.1
1.2
1.3
1.2
1.1
1.1
1.0
ratio
Employment/population ratio
Part-time work
Part-time workers
%
(of total employed)
Male part-time workers
%
(of total male employed)
Female part-time workers
%
(of total female employed)
Female part-time workers
%
(of total part-time employed)
Average hours worked per week
hours
by part-time workers
Part-time workers
who prefer more hours
%
(of all part-time employed)
Part-time workers who worked
15 hours or less per week
%
(of all part-time employed)
Average hours worked
hours
per week by full-time workers
Full-time workers working more
than 49 hours per week
%
(of all full-time employed)
Average weekly hours
hours
of paid overtime per employee
Casually employed
%
(of total employed)
%
Job mobile in previous year
Employers and own account
%
workers (of total employed)
Industry
Employed in service
%
industries (of total employed)
Employed in manufacturing industries
%
(of total employed)
Sector
Private sector employees
%
(of all employees)
Employed in small business
%
(of all private sector employed)
Reference periods:
98
18.9
20.0
19.4
20.3
22.3
22.7
23.7
24.0
26.1
25.7
26.9
r18.1
19.7
r18.3
r14.8
r12.8
n.a
r14.5
n.a
r15.8
n.a
14.3
14.9
14.6
14.2
14.6
15.0
15.2
15.2
14.6
14.6
13.9
14.3
67.7
67.7
68.7
69.5
70.9
70.6
70.9
71.4
r72.2
r72.4
72.6
16.0
15.9
15.3
14.7
14.2
14.2
14.0
13.8
13.4
13.5
13.2
72.0
73.0
73.3
72.5
72.6
73.5
75.1
76.0
77.0
78.4
78.8
n.a
n.a
n.a
n.a
50.5
51.2
52.7
51.3
50.7
50.2
50.8
All data are annual averages for the year ending 30 June except: average weekly hours of paid overtime
(year ending 31 December); Casual employment and job mobility (February); private sector employment
(June) and labour force participation of females with children (June).
• ABS • AUSTRALIAN SOCIAL TRENDS • 4102.0 • 1999
Work — national summary
EMPLOYED PEOPLE
continued
1988
1989
1990
1991
1992
1993
1994
1995
1996
1997
1998
%
23.3
22.9
23.7
24.4
24.9
25.1
24.9
24.4
24.2
25.2
25.2
%
19.0
19.4
19.3
18.9
19.1
19.1
19.3
19.7
20.4
20.3
20.1
%
35.5
35.6
37.0
37.8
38.4
39.1
38.0
39.2
41.2
41.9
41.0
Units
1988
1989
1990
1991
1992
1993
1994
1995
1996
1997
1998
Trade union membership
%
41.6
n.a.
40.5
n.a.
39.6
37.6
35.0
32.7
31.1
30.3
28.1
Median age of trade union members
Working days lost due to industrial
disputes (per 1,000 employees)
years
35
n.a.
36
n.a.
37
37
37
38
38
38
39
days
269
190
207
248
147
100
76
79
131
74
72
UNEMPLOYMENT
Units
1988
1989
1990
1991
1992
1993
1994
1995
1996
1997
1998
Total unemployed
Long-term unemployed
Unemployment rate
Male unemployment rate
Female unemployment rate
Full-time job seekers:
Persons aged 15–19 years
(of all persons aged 15–19)
Persons aged 20–24 years
(of all persons aged 20–24)
Median duration of
unemployment – males
Median duration of
unemployment – females
Unemployment rate –
capital cities
Unemployment rate –
balance of States and Territories
'000
NOT IN THE LABOUR FORCE
Occupation
Employed in highest skill (ASCO Skill
Level 1) occupations(a)
Employed in lowest skill (ASCO Skill
Level 5) occupations(a)
Females – of all employed in
highest skill (ASCO Skill
Level 1) occupations(a)
INDUSTRIAL RELATIONS
Units
continued
610.5
534.6
513.7
709.0
r881.6
940.5
r915.4
r793.7
r764.3
r792.4
764.2
%
27.7
27.2
22.7
21.1
29.0
35.8
36.6
34.4
29.5
29.2
31.6
%
7.8
6.6
6.2
8.4
10.4
11.0
10.5
8.9
r8.4
r8.6
8.3
%
7.3
6.2
5.8
8.4
10.8
11.7
10.9
9.1
8.8
8.8
8.5
%
8.4
7.3
6.7
8.2
9.7
10.0
10.0
8.7
8.0
8.4
8.0
%
7.9
6.3
5.8
7.7
9.1
9.0
8.6
7.4
7.2
7.0
6.5
%
8.2
6.7
6.3
9.1
11.4
11.8
10.9
8.8
8.6
9.0
8.7
weeks
24
23
18
19
29
34
35
31
26
25
28
weeks
14
12
11
14
21
25
24
21
18
18
20
%
7.1
5.9
5.6
8.1
10.2
10.8
10.3
8.8
8.2
8.2
7.6
%
8.8
7.8
7.1
8.7
10.6
11.2
11.0
9.2
8.9
9.4
9.4
Units
1988
1989
1990
1991
1992
1993
1994
1995
1996
1997
1998
'000
721.7
708.4
752.5
819.3
846.4
907.8
773.3
862.8
879.6
890.5
922.6
'000
83.8
76.1
100.9
138.2
145.6
147.4
106.5
111.9
118.9
118.4
110.9
TRANSITION TO RETIREMENT Units
1988
1989
1990
1991
1992
1993
1994
1995
1996
1997
1998
%
75.1
74.0
75.0
75.2
72.9
72.5
72.6
73.6
73.0
73.2
72.5
%
31.5
32.4
32.3
35.7
35.7
36.4
38.0
38.7
41.3
42.3
42.3
%
47.4
49.1
49.9
50.7
50.2
48.5
49.1
47.7
46.6
45.4
45.8
%
12.9
14.9
15.1
15.9
14.9
14.4
15.8
16.0
17.5
18.3
19.1
%
n.a
46.4
n.a
n.a
46.4
n.a
46.1
n.a
n.a
45.0
n.a.
Marginally attached
Discouraged jobseekers
Participation rate
of males aged 55–59 years
Participation rate
of females aged 55–59 years
Participation rate
of males aged 60–64 years
Participation rate
of females aged 60–64 years
Persons retired from full-time work
(of all persons aged 50–64 years)
(a) ASCO second edition was introduced in August 1996. Data prior to this date are concorded with ASCO second edition at the major group level.
Reference periods:
All data are annual averages for the year ending 30 June except: working days lost due to industrial
disputes (year ending 31 December); occupation and trade union membership (August); not in the
labour force data (September) and retirement data (October/November).
ABS • AUSTRALIAN SOCIAL TRENDS • 4102.0 • 1999
•
99
Work — State summary
LABOUR FORCE
Units
Total labour force
'000
Females – (of total labour force)
Participation rate
Male participation rate
Female participation rate
Females in the labour force with
children aged 0–4 years (of all
females with children aged 0–4)
Standardised participation rate
Participation rate
of persons aged 15–19 years
Participation rate
of persons aged 20–24 years
Median age of male labour force
Median age of female labour force
%
%
Years
NSW
Vic.
Qld
SA
WA
Tas.
1997–98
3 060
2 327
1 737
719
938
218
1997–98
42.9
43.5
43.4
43.2
42.3
42.4
1997–98
61.5
63.2
65.0
60.8
66.2
59.1
%
1997–98
71.6
73.1
74.3
70.6
76.5
%
1997–98
51.8
53.8
55.8
51.4
56.0
NT(a)
ACT
Aust.
94
166
9 261
42.9
47.3
43.2
70.3
71.4
63.1
69.7
76.7
78.1
73.0
49.0
63.3
65.1
53.6
%
1998
48.5
46.5
51.7
47.9
44.3
44.9
36.7
62.8
48.2
%
1997–98
61.6
63.3
65.0
60.9
66.1
59.2
70.0
71.5
63.7
%
1997–98
53.9
56.4
63.0
55.8
64.7
56.9
54.3
59.4
57.7
%
1997–98
80.4
83.6
82.8
83.2
81.7
79.3
75.1
83.7
82.0
years
1997–98
37.7
37.4
37.2
37.7
37.4
37.9
36.0
37.1
37.5
years
1997–98
36.3
36.0
36.1
37.1
36.2
36.9
35.0
36.9
36.2
EMPLOYED PEOPLE
Units
Years
NSW
Vic.
Qld
SA
WA
Tas.
NT(a)
ACT
Aust.
Total employed
'000
1997–98
2 826
2 129
1 582
649
872
194
90
154
8 496
Employment/population ratio
ratio
1997–98
56.8
57.9
59.2
54.8
61.6
52.6
66.8
66.0
57.9
%
1997–98
23.8
26.1
26.4
28.5
26.3
29.3
20.2
24.6
25.6
%
1997–98
11.0
12.5
12.6
13.3
11.5
13.6
11.1
13.9
12.0
%
1997–98
40.7
43.8
44.2
48.3
46.5
50.2
32.1
36.4
43.3
%
1997–98
73.6
73.0
73.1
73.6
74.8
73.6
68.7
70.4
73.4
hours
1997–98
16.1
15.6
16.3
16.5
15.4
15.9
17.3
15.7
16.0
%
1997–98
23.9
25.4
28.4
29.0
24.2
29.9
20.9
27.7
25.8
%
1997–98
49.1
52.7
50.3
49.0
54.2
50.1
41.0
52.2
50.8
hours
1997–98
41.2
41.3
41.8
41.3
41.5
40.0
41.2
39.7
41.3
%
1997–98
22.9
25.7
24.4
20.7
26.4
26.1
19.4
25.9
24.9
hours
1998
1.0
1.1
1.0
0.8
1.1
0.7
1.4
0.5
1.0
%
1997–98
13.9
12.9
16.1
16.1
15.7
15.9
8.1
9.4
14.3
%
1997–98
73.1
72.1
73.2
70.1
72.0
72.9
79.9
90.0
72.6
%
1997–98
13.6
10.6
11.0
15.6
10.2
12.0
3.8
3.0
13.2
%
1998
79.9
82.1
76.7
76.6
79.4
73.5
67.9
49.9
78.8
%
1998
49.2
49.1
54.8
52.4
51.1
54.0
47.1
58.5
50.8
Part-time work
Part-time workers
(of total employed)
Male part-time workers
(of total male employed)
Female part-time workers
(of total females employed)
Female part-time workers
(of total part-time employed)
Average hours worked per week
by part-time workers
Part-time workers
who prefer more hours
(of all part-time employed)
Part-time workers who worked
15 hours or less per week
(of all part-time employed)
Average hours worked
per week by full-time workers
Full-time workers working more
than 49 hours per week
(of all full-time employed)
Average weekly hours
of paid overtime per employee
Employers and own account
workers (of total employed)
Industry
Employed in service
industries (of total employed)
Employed in manufacturing
industries (of total employed)
Sector
Private sector employees
(of all employees)
Employed in small business
(of all private sector employed)
(a) Estimates for Northern Territory refer to mainly urban areas only.
Reference periods:
100
All data are annual averages for the year ending 30 June except: average weekly hours of paid overtime
(year ending 31 December); private sector employment (June) and labour force participation of females
with children (June).
• ABS • AUSTRALIAN SOCIAL TRENDS • 4102.0 • 1999
Work — State summary
EMPLOYED PEOPLE
continued
Occupation
Employed in highest skill (ASCO Skill
Level 1) occupations(b)
Employed in lowest skill (ASCO Skill
Level 5) occupations(b)
Females—of all employed in highest
skill (ASCO Skill Level 1)
occupations(b)
Units
Years
continued
NSW
Vic.
Qld
SA
WA
Tas.
NT(a)
ACT
Aust.
%
1998
26.7
26.3
22.8
23.7
23.2
21.2
23.8
32.4
25.2
%
1998
19.4
19.7
20.9
21.8
21.1
22.9
20.7
18.0
20.1
%
1998
40.7
40.7
42.5
40.6
39.5
42.0
47.7
44.4
41.0
INDUSTRIAL RELATIONS
Units
Years
NSW
Vic.
Qld
SA
WA
Tas.
NT(a)
ACT
Aust.
Trade union membership
Median age of trade union members
%
1998
29.4
27.6
28.2
30.9
21.8
34.7
24.2
28.4
28.1
years
1998
39
38
38
39
40
38
40
41
39
Working days lost due to industrial
disputes (per 1,000 employees)
days
1998
77
108
38
30
83
19
8
36
72
UNEMPLOYMENT
Units
Years
NSW
Vic.
Qld
SA
WA
Tas.
NT (a)
ACT
Aust.
Total unemployed
Long-term unemployed
Unemployment rate
Male unemployment rate
Female unemployment rate
Full-time job seekers:
Persons aged 15–19 years
(of all persons aged 15–19)
Persons aged 20–24 years
(of all persons aged 20–24)
Median duration of
unemployment – males
Median duration of
unemployment – females
Unemployment rate – capital cities
Unemployment rate –
balance of State
'000
1997–98
233.2
197.6
155.5
70.8
66.0
23.9
4.7
12.5
764.2
%
1997–98
33.8
32.7
27.8
38.7
22.1
39.7
*14.0
24.6
31.6
%
1997–98
7.6
8.5
8.9
9.8
7.0
11.0
5.0
7.5
8.3
%
1997–98
7.8
8.5
9.2
10.3
7.1
11.9
5.4
8.1
8.5
%
1997–98
7.3
8.4
8.6
9.2
6.9
9.7
4.4
6.9
8.0
%
1997–98
6.0
6.1
7.3
7.9
6.3
9.4
*3.3
6.2
6.5
%
1997–98
7.7
9.0
9.6
10.6
8.0
12.0
*4.0
8.4
8.7
weeks
1997–98
31
30
24
35
18
39
**
23
28
weeks
1997–98
20
21
17
27
13
25
**
14
20
%
1997–98
6.3
8.2
8.2
10.0
7.2
9.6
5.0
7.5
7.6
%
1997–98
10.2
9.3
9.6
9.3
6.5
11.0
n.a
n.a
9.4
NOT IN THE LABOUR FORCE
Units
Years
NSW
Vic.
Qld
SA
WA
Tas.
NT (a)
ACT
Aust.
Marginally attached
Discouraged jobseekers
'000
1998
294.1
221.7
185.7
77.9
96.1
27.6
4.3
15.3
922.6
'000
1998
38.1
26.8
20.1
10.4
11.1
2.8
*0.5
*1.0
110.9
TRANSITION TO RETIREMENT
Units
Years
NSW
Vic.
Qld
SA
WA
Tas.
NT (a)
ACT
Aust.
%
1997–98
70.5
75.2
73.2
68.9
77.8
63.3
67.7
71.7
72.5
%
1997–98
40.8
40.1
45.2
40.3
48.2
36.1
51.7
60.7
42.3
%
1997–98
43.6
46.5
47.9
42.4
51.8
38.1
*54.7
53.0
45.8
%
1997–98
20.2
17.5
18.8
17.0
21.2
14.7
22.6
34.7
19.1
%
1997
44.0
47.2
44.1
47.6
44.3
48.5
20.6
36.4
45.0
Participation rate
of males aged 55–59 years
Participation rate
of females aged 55–59 years
Participation rate
of males aged 60–64 years
Participation rate
of females aged 60–64 years
Persons retired from full-time work
(of all persons aged 50–64)
(a) Estimates for Northern Territory refer to mainly urban areas only.
(b) ASCO second edition was introduced in August 1996. Data prior to this date are concorded with ASCO second edition at the major group level.
Reference periods:
All data are annual averages for the year ending 30 June except: working days lost due to industrial
disputes (year ending 31 December); occupation and trade union membership (August); not in the
labour force data (September) and retirement data (October/November).
ABS • AUSTRALIAN SOCIAL TRENDS • 4102.0 • 1999
•
101
Work — definitions and references
Average hours worked per week by full-time workers —
average hours worked, including overtime, by
full-time workers during the survey reference week.
The hours are those actually worked and are not
necessarily the hours paid for.
Reference: Labour Force, Australia
(Cat. no. 6203.0).
Average weekly hours paid overtime per employee —
total overtime hours paid for divided by the total
number of employees (including those who were
not paid for any overtime). Overtime is time
worked in excess of award, standard or agreed
hours of work for which payment is received.
Reference: Job Vacancies and Overtime, Australia
(Cat. no. 6354.0).
Casually employed — employees who were not entitled
to either paid holiday leave or sick leave in their
main job.
Reference: Weekly Earnings of Employees,
Australia (Cat. no. 6310.0).
Discouraged jobseekers — people who were marginally
attached to the labour force, wanted to work and
who were available to start work within four weeks
but whose main reason for not actively seeking
work was that they believed they would not find a
job for any of the following reasons:
considered too old or too young by employers;
difficulties with language or ethnic background;
lacked necessary schooling, training, skills or
experience;
no jobs in their locality or line of work; or
they considered that there were no jobs at all
available.
Reference: Persons Not in the Labour Force,
Australia (Cat. no. 6220.0).
Employed — persons aged 15 and over who, during the
reference week, worked for one hour or more for
pay, profit, commission, payment in kind, or
worked without pay in a family business, or who
had a job but were not at work.
Reference: Labour Force, Australia
(Cat. no. 6203.0).
Employees — an employee is a person who works for a
public or private employer and receives
remuneration in wages, salary, a retainer fee by
their employer while working on a commission
basis, tips, piece rates or payment in kind, or a
person who operates his or her own incorporated
enterprise with or without hiring employees.
Reference: Labour Force, Australia
(Cat. no. 6203.0).
Employer — an employer is a person who operates his
or her own unincorporated economic enterprise or
engages independently in a profession or trade,
and hires one or more employees.
Reference: Labour Force, Australia
(Cat. no. 6203.0).
Employment/population ratio — the number of
employed persons in a group expressed as a
proportion of the civilian population in the same
group.
Reference: Labour Force, Australia
(Cat. no. 6203.0).
102
•
ABS • AUSTRALIAN SOCIAL TRENDS • 4102.0 • 1999
Full-time job seekers — for any group, unemployed
persons seeking full-time work, expressed as a
proportion of the civilian population in the same
group.
Reference: Labour Force, Australia
(Cat. no. 6203.0).
Full-time workers — employed persons who usually
worked 35 hours a week or more and others who,
although usually working less than 35 hours a
week, worked 35 hours or more during the
reference week.
Reference: Labour Force, Australia
(Cat. no. 6203.0).
Industrial dispute — a withdrawal from work by a group
of employees, or a refusal by an employer or a
number of employers to permit some or all of their
employees to work, made in order to enforce or
resist a demand, or to express a grievance.
Reference: Industrial Disputes, Australia
(Cat. no. 6322.0).
Job mobile — the proportion of people aged
15–69 who had worked at some time during the
previous year who were job mobile, that is, they
changed their job (employer/business or locality)
within the previous year.
Reference: Labour Mobility, Australia
(Cat. no. 6209.0).
Labour force — for any group, persons who were
employed or unemployed, as defined.
Reference: Labour Force, Australia
(Cat. no. 6203.0).
Long-term unemployed — people unemployed for
52 weeks or longer.
Reference: Labour Force, Australia
(Cat. no. 6203.0).
Manufacturing industries — the Manufacturing division
of the Australian and New Zealand Standard
Industrial Classification (ANZSIC) (Cat. no.
1292.0).
Reference: Labour Force, Australia
(Cat. no. 6203.0).
Marginally attached — persons aged 15–69 years who
were not in the labour force, wanted to work and:
were actively looking for work but were not
available to start; or were not actively looking for
work, but were available to start work.
Reference: Persons Not in the Labour Force,
Australia (Cat. no. 6220.0).
Median age — the age at which half the population
is older and half is younger.
Median age at retirement — the median divides the
population of persons who have retired from
full-time work in two. Half of the population retired
from full-time work at an age younger than the
median, with the other half retiring at an older age.
Reference: Retirement and Retirement Intentions,
Australia (Cat. no. 6238.0)
Median duration of unemployment — the period of
unemployment at which half of the unemployed
had been unemployed for more weeks and half had
been unemployed for fewer weeks.
Reference: Labour Force, Australia
(Cat. no. 6203.0).
Work — definitions and references
Occupation — a collection of jobs which are
sufficiently similar in their main tasks to be grouped
together for the purposes of classification. The
Australian Standard Classification of Occupations
(ASCO) Second Edition, which is used for the
classification of occupation, applies skill level and skill
specialisation as major criteria.
Skill level is measured by: formal education and
training, and previous experience usually required for
entry into an occupation. ASCO Second Edition assigns
each of the nine major groups in the classification to
one of five ranked skill levels.
Skill Level 1 comprises the major groups, managers and
administrators, and professionals; Skill Level 2 —
associate professionals; Skill Level 3 — tradespersons
and related workers and advanced clerical and service
workers; Skill Level 4 — intermediate production and
transport workers; and Skill Level 5 — elementary
clerical, sales and service workers and labourers and
related workers.
Reference: Australian Standard Classification of
Occupations, Second edition (Cat. no. 1220.0).
Own account worker — a person who operates his or her
own unincorporated economic enterprise or engages
independently in a profession or trade, and hires no
employees. (this category was formally entitled
self-employed.)
Reference: Labour Force, Australia (Cat. no. 6203.0).
Participation rate — for any group, the labour force
expressed as a percentage of the civilian population in
the same group.
Reference: Labour Force, Australia (Cat. no. 6203.0).
Part-time workers — employed persons who usually
worked less than 35 hours a week and who did so
during the reference week.
Reference: Labour Force, Australia (Cat. no. 6203.0).
Part-time workers who prefer more hours — part-time
employed who indicated they would prefer to work
more hours.
Reference: Labour Force, Australia (Cat. no. 6203.0).
Private sector — the public sector includes all employees of
local government authorities and government
departments, agencies and authorities created by, or
reporting to, the Commonwealth Parliament and State
and Territory Parliaments. All other employees are
classified as private sector.
Reference: Job Vacancies and Overtime, Australia
(Cat. no. 6354.0).
continued
Service industries — the combination of the following
divisions of the Australian and New Zealand Standard
Industrial Classification (ANZSIC) (Cat. no. 1292.0):
wholesale trade; retail trade; accommodation, cafes and
restaurants; transport and storage; communication
services; finance and insurance; property and business
services; government administration and defence;
education; health and community services; cultural and
recreational services; and personal and other services.
Reference: Labour Force, Australia (Cat. no. 6203.0).
Small business — businesses with fewer than 20 employees
in all industries except manufacturing where they have
fewer than 100 employees, and agriculture where they
have an estimated value of agricultural operations
between $22,500 and $400,000.
Reference: Small Business, Australia (Cat. no. 1321.0).
Standardised participation rate — age-specific labour force
participation rates expressed as a percentage of the
standard civilian population, to remove the effect of age
and sex composition of the population. The standard
population used is the 1991 Census population.
Trade union membership — employees with
membership of an organisation (or employee or
professional association), the principal activities of
which include the negotiation of rates of pay and
conditions of employment for its members.
Reference: Trade Union Members, Australia
(Cat. no. 6325.0).
Unemployed — persons aged 15 and over who were not
employed during the reference week, but who had
actively looked for work and were available to start
work.
Reference: Labour Force, Australia (Cat. no. 6203.0).
Unemployment rate — the number unemployed
expressed as a proportion of the labour force. Separate
rates are calculated for sub-groups of the population.
Reference: Labour Force, Australia (Cat. no. 6203.0).
Working days lost due to industrial disputes — total
working days lost by employees due to industrial
disputes during the year.
Reference: Industrial Disputes, Australia
(Cat. no. 6322.0).
Retired persons — persons aged 45 years and over, who
had a full-time job at some time and who had ceased
full-time labour force activity (i.e. were not working
full-time, were not looking for and did not intend to
work full-time at any time in the future). Unpaid
voluntary work was not considered full-time work.
Reference: Retirement and Retirement Intentions,
Australia (Cat. no. 6238.0).
ABS • AUSTRALIAN SOCIAL TRENDS • 4102.0 • 1999 •
103
Decline of the standard
working week
P A I D W O R K
The proportion of
employed people
working 35–44 hours a
week fell from 42% to
36% between 1988 and
1998. At the same
time, the proportions
who worked longer
hours and shorter
hours both increased.
In August 1998, of the 8.5 million people
who were employed, 37% worked less than
35 hours per week and 17% worked for less
than 16 hours per week. The proportion of
those working between 35 and 44 hours a
week (36%) was similar to those who worked
less than 35 hours, while 27% worked more
than 44 hours per week. There were 773,700
workers (9% of employed people) who
worked 60 or more hours per week.
The large disparities in hours worked among
employed people mark a shift away from the
norm of a full-time job of about 35–44 hours
(and most commonly 40 hours) observed
several decades ago, and away from industry
standards for shorter hours of full-time work
set in the 1980s (see Australian Social Trends
1995, The working week, pp. 91–93).
Moreover, this is a trend that has continued
over the last decade. Between 1988 and 1998,
both the proportion of people working
part-time hours and the proportion working
at least 45 hours per week increased. As a
result, the proportion working 35–44 hours
fell from 42% to 36%.
These changes have prompted expressions of
concern for workers, their families and social
cohesion. There are fears in some sectors of
the community that the workforce is
polarising into underemployed, low income
part-timers wanting to work more hours, and
overworked full-timers suffering ill health,
fatigue, and deteriorating quality of working
and family life, who want to work fewer
hours.1
Hours worked, August 1988 to August 1998
35-44
Less than 35
45 or more
%
45
40
35
30
25
20
1988
1990
1992
1994
1996
1998
Hours worked and related concepts
The main source of data for this review is from the
ABS Labour Force Survey conducted monthly
since February 1978.
Hours worked is measured in the survey as the
number of hours actually worked by an employed
person in all of his/her jobs in the survey
reference week. Hours actually worked may not
necessarily correspond to those usually worked,
due to paid and unpaid overtime, flextime,
rostered days off, public holidays, and time spent
not working because of bad weather or industrial
disputes. In August 1998, 4.8% of employed
people had not worked at least one hour during
the previous week. The survey also identifies
whether people usually work full-time
(35 or more hours per week) or part-time, but not
the number of hours usually worked.
An employee is a person who works for a public
or private employer and receives remuneration in
wages, salary, a retainer fee by their employer
while working on a commission basis, tips,
piece-rates or payment in kind, or a person who
operates his or her own incorporated enterprise
with or without hiring employees.
An employer is a person who operates his or her
own unincorporated economic enterprise or
engages independently in a profession or trade,
and hires at least one employee.
An own account worker is a person who operates
his or her own unincorporated economic
enterprise or engages independently in a
profession or trade, and hires no employees.
Changes in hours worked have occurred for
many reasons, which differ by industry,
occupation, and geographic area. Some, for
example, reflect the increased entry of women
into the labour force and the growth of
employment in service industries; both have
contributed to the increase in part-time
employment (see Australian Social Trends
1994, Trends in part-time work, pp. 103–108
and Australian Social Trends 1997, Changing
industries, changing jobs, pp. 93–98).
However, as reflected in government policies,
there has also been a general desire to
enhance flexibility in working arrangements
to suit the interests of employers concerned
with maintaining their competitiveness, and
to enable individual aspirations for diverse
working arrangements to be realised.
Source: Unpublished data, Labour Force Surveys, August 1988 to August 1998.
ABS • AUSTRALIAN SOCIAL TRENDS • 4102.0 • 1999
•
105
PAID WORK
Employed persons: hours worked, August 1988 and August 1998
Distribution of weekly hours worked in all jobs,
August 1998
Percentage point change in
distribution, 1988–1998
Less than
35 hours
35–44
hours
45 hours
or more
Total
persons
Less than
35 hours
35–44
hours
45 hours
or more
Sex and
age group (years)
%
%
%
'000
no.
no.
no.
Men(a)
24.4
37.9
37.7
4 809.4
3.4
–0.5
3.1
42.5
38.9
18.6
799.0
12.3
–10.3
–2.0
15–24
25–44
19.2
39.4
41.4
2 444.8
1.7
–4.0
2.4
45–64
21.8
35.5
42.7
1 478.7
1.6
–8.2
6.7
Women(a)
53.0
32.8
14.2
3 727.8
2.8
–5.9
3.1
15–24
58.7
33.1
8.2
737.7
16.5
–16.0
–0.5
25–44
49.9
34.4
15.7
1 888.2
–2.6
–1.2
3.8
45–64
54.0
30.1
15.8
1 064.0
0.1
–3.8
3.7
36.9
35.6
27.4
8 537.2
4.1
–6.4
2.3
Total(a)
(a) Includes persons 65 years or older.
Source: Unpublished data, Labour Force Surveys, August 1988 and August 1998.
Labour market reforms such as the Australian
Industrial Relations Commission's October
1991 National Wage Case Decision, and the
federal governments' Industrial Relations
Reform Act (1993) and Workplace Relations
Act 1996, have supported diversification of
employment conditions. These reforms have
promoted the decentralisation of decisions on
pay and working conditions (including hours
of work) to agreements between employers
and employees in the workplace.
Changes for men and women
Patterns of change have differed for men and
women in different age groups. The overall
shift in proportions working long hours
between 1988 and 1998 was about the same
for both men and women (3.1 percentage
points). However, the increased proportions
working longer hours were largely restricted
to those aged between 25 and 64. The
distributional shift was most pronounced for
men aged 45–64 (among whom the
proportion working 45 hours or more
increased by 6.7 percentage points).
Both young men and women (aged 15–24)
were considerably more likely to work
part-time than they were ten years earlier.
This shift reflects increased rates of
underemployment among these relatively less
experienced workers. Between August 1988
and August 1998, the proportion of young
workers employed part-time and preferring to
work more hours rose from 5% to 11%. The
shift is also likely to be partly due to rising
106
• ABS • AUSTRALIAN SOCIAL TRENDS • 4102.0 • 1999
levels of participation in education in this age
group (see Australian Social Trends 1999,
Education — national summary table,
pp. 76–77).
Modest movements towards both long-hour
employment (2.4 percentage points) and
part-time work (1.7 percentage points)
accounted for the 4.0 percentage point shift
away from the usual full-time working week
for men aged 25–44 years. For women in this
age group, there was a shift away from
part-time hours (2.6 percentage points) and
usual full-time hours (1.2 percentage points)
towards long full-time hours (3.8 percentage
points). These divergent trends may, in part,
be attributable to gender role change in
couple families containing one or more
dependent children as employed fathers
become more likely, and employed mothers
less likely, to work part-time to fulfil family
responsibilities such as child care. Part-time
employment among partnered and employed
fathers with at least one dependent child at
home increased from 3% to 6% between
August 1988 and August 1998. Over the same
period, part-time employment among
comparable mothers decreased from
59% to 56%.
Despite these trends, in 1998, employed men
aged 25–44 (41%) were marginally less likely
than older employed men (43%), and
considerably more likely than younger
employed men (19%) and women of any age
group, to be working long hours in paid
work.
PAID WORK
Hours worked(a) by status in employment and occupation in main job, August 1988 and August 1998
Percentage point change in
distribution of weekly hours worked
between 1988 and 1998
Distribution of weekly hours worked
in August 1998
Less than
35 hours
35–44
hours
45 hours
or more
Total
persons
Less than
35 hours
35–44
hours
45 hours
or more
%
%
%
'000
no.
no.
no.
Status in employment(b)
Employee
36.8
38.3
25.0
7 300.7
4.1
–7.9
3.8
Employer
22.4
18.7
58.8
349.6
–1.0
0.4
0.6
Own-account worker
40.6
21.4
38.0
819.2
6.0
–1.5
–4.5
19.2
22.2
58.6
625.2
0.3
Occupation
Managers and administrators
–1.4
1.1
Professionals
30.4
36.1
33.5
1 527.5
0.2
–3.5
3.3
Associate professionals
23.2
32.1
44.6
881.3
–3.6
–6.6
10.2
Tradespersons and related workers
23.5
45.1
31.4
1 150.2
1.2
–4.7
3.5
Advanced clerical and service workers
51.1
37.5
11.4
397.7
9.3
–10.9
1.6
Intermediate clerical, sales and service workers
47.9
38.9
13.2
1 451.1
6.5
–7.6
1.0
Intermediate production and transport workers
28.9
38.6
32.5
783.0
5.2
–10.6
5.4
Elementary clerical, sales and service workers
62.8
26.5
10.7
860.9
12.2
–10.0
–2.1
Labourers and related workers
49.7
35.6
14.7
860.3
4.7
–4.1
–0.6
36.9
35.6
27.4
8 537.2
4.1
–6.4
2.3
Total
(a) By employed persons in all jobs.
(b) Excludes contributing family worker.
Source: Unpublished data, Labour Force Surveys, August 1988 and August 1998.
The increased proportion of men and women
working part-time may have contributed to
the increased likelihood for workers to have
more than one job. In August 1997, 6.3% of
employed women and 4.4% of employed men
had more than one job. The respective
proportions ten years earlier were
4.1% and 3.4%.2
Status in employment and
occupation
The growth in long-hour employment has
been confined largely to people who were
employees in their main job (an increase of
3.8 percentage points). The proportion of
own-account workers working at least
45 hours a week declined between 1988 and
1998. Despite this trend, own-account
workers were still more likely than employees
to be working at least 45 hours a week
(38% of own-account workers compared with
25% of employees). Employers, and more
generally those whose occupations were
managers and administrators, were even more
likely to be working such hours (59% in
1998). Of all managers and administrators,
26% worked at least 60 hours a week. The
distribution of weekly hours worked by
employers, and managers and administrators,
changed little over the decade.
Other occupation groups displayed more
marked movements away from a standard
hours working week to part-time or long-hour
employment, with sharper movements
evident among less skilled occupations. More
highly skilled non-managerial occupations
tended to be shifting towards long-hour
employment while less skilled occupations
were generally more likely to be providing
part-time employment in 1998 than in 1988.
The exceptions to this trend were advanced
clerical and service workers, and intermediate
production and transport workers. Although
there was a small increase in the proportion
of advanced clerical and service workers
working long hours between 1988 and 1998
(1.6 percentage points increase), there was a
much larger increase in the proportion
working part-time (9.3 percentage points
increase, from 42% to 51% of workers over
the same time period).
ABS • AUSTRALIAN SOCIAL TRENDS • 4102.0 • 1999
•
107
PAID WORK
Industries with greatest proportional shift to very short or very
long hours of employment, 1988 to 1998
Percentage point
increase from
1988 to 1998
Proportion of
employed people
in 1998
no.
%
Working very
short hours
Industries shifting to very short hours(a)
Cultural and recreational services
4.9
27.7
Retail trade
3.9
29.8
Construction
2.3
14.0
Property and business services
2.1
16.6
Education
2.0
16.6
All industries
1.8
17.2
Working very
long hours
Industries shifting to very long hours(b)
Mining
13.4
Electricity, gas and water supply
7.5*
23.9
9.0
Communication services
5.0*
Transport and storage
4.1
14.1
6.8
Construction
3.0
11.5
Personal and other services
2.6
7.7
Government administration and defence
2.0
3.8
All industries
0.8
9.1
International comparison
Australia has a higher proportion of people
working long-hour jobs than many other OECD
countries. While the trend to working long hours
has also occurred in a number of other countries,
as shown below, this trend has not been uniform.
Employment in long-hour jobs has also been falling
in some countries.
Most OECD countries have legislated maximum
weekly working hours of between 48 and 60 hours.
Australia, like Canada, Japan, New Zealand, the
United Kingdom and the United States, has no
legal maximum. Employers are able to offer
employees heavy workloads and employees are
free to accept such offers.
The OECD Economic Outlook report, from which
these data have been obtained, also reveals that
like Australia, the trend to short-hour employment
has been occurring in many other countries.
Working time reforms in a number of contintental
European countries (e.g. France and Germany)
have, over recent years, sought to encourage
work-sharing arrangements. These reforms have
been oriented to realising working time reductions
3
for employees working long hours.
Employed people working at least 45
hours a week, 1985 and 1994,
selected countries
(a) Less than 16 hours per week, on average, for all jobs held by employees in the industry.
(b) 60 or more hours per week, on average, for all jobs held by employees in the industry.
Men
Women
1985
1994
1985 1994
%
%
%
Source: Unpublished data, Labour Force Surveys, August 1988 and August 1998.
Australia
Intermediate production and transport
workers were considerably less likely to be
working 35–44 hour weeks in 1998 (39%)
than a decade earlier (49%). Yet there were
similar rises in the proportions of this
occupation group working part-time hours
and long hours (just over 5 percentage points
each).
Industry
Changes in the distribution of weekly hours
worked in the past ten years have varied
considerably for different industries. These
trends are highlighted when focussing on
shifts in the proportion of employed people
working very short and very long hours
(i.e. less than 16 hours and at least 60 hours
per week, respectively).
Between 1988 and 1998, two service
industries, cultural and recreational services
(4.9 percentage points) and retail trade
(3.9 percentage points) exhibited the most
pronounced movement towards employing
108
• ABS • AUSTRALIAN SOCIAL TRENDS • 4102.0 • 1999
%
30.2
38.1
9.6
13.6
Belgium
5.0
5.5
1.6
3.0
Canada
20.1
23.1
6.1
7.7
8.6
15.0
2.1
5.6
France
12.1
15.0
4.7
6.1
Germany
10.0
8.3
4.3
3.0
Greece
17.3
20.2
8.6
13.2
Italy
11.5
13.6
4.5
5.7
Japan(a)
50.1
36.7
22.7
15.8
Netherlands
13.0
1.8
2.4
0.4
Portugal(b)
59.2
26.2
41.6
12.5
Spain
11.2
11.6
11.0
5.9
Denmark
Sweden(b)
15.3
17.1
4.5
5.5
United Kingdom
36.2
41.5
6.9
10.9
United States
of America(a)
24.7
27.0
8.8
11.1
(a) More than 48 hours a week.
(b) 1987 and 1994.
Source: OECD, 1998, Employment Outlook.
PAID WORK
people for very short hours. These industries
employ relatively high proportions of women
and of part-time workers. They are also
industries experiencing strong growth in
employment (see Australian Social Trends
1997, Changing industries, changing jobs,
pp. 93–98).
In contrast, two production industries,
mining (13.4 percentage points) and
electricity, gas and water supply
(7.5 percentage points) have experienced the
largest proportional shift to very long hour
employment. These industries continue to be
dominated by male full-time workers. They
are also industries in which employment has
been in decline. Employment in mining
declined by 9% between 1988 and 1998 and
in electricity, gas and water supply by 39%. It
may be that the need to cut costs in an
environment of increased competition, and
the associated employment decline, has
contributed to the increase in hours worked
among employees. Extending working hours
for fewer numbers of staff might, in many
instances, be less costly than the overheads
associated with recruiting, training,
equipping and retrenching staff engaged to
work more usual hours.
weekends) has also been increasing.
Information from ABS time use surveys
conducted in 1992 and 1997 indicate that this
has occurred, although the magnitude of
change over these five years has not been
large. For example, the proportion of people
working between 6pm and 6am increased
from 35% to 37%. A slight increase in the
proportion of people working on weekends
also occurred.
Between August 1993 and August 1997, the
proportion of employees able to work extra
hours to be able to take time off increased
from 34% to 38%.4 This more widespread
access to flexible working hours may mean
that a greater proportion of employees paid
to work approximately 40 hours a week are
able to work less than 35 hours in one week
and more than 44 the next according to
workload and personal preference. Wider
access to more flexible working hours may
have already had some impact on the number
of people working 35–44 hours in any given
week, and may contribute to further reduced
likelihood of employed persons consistently
working between 35 and 44 hours per week
in the future.
Endnotes
Working after hours
The growing diversity of working
arrangements, described above, suggests that
working 'unsocial hours' (in the evening or on
1 Australian Centre for Industrial Relations
Research and Training (ACCIRT) November 1998,
Work/Time/Life: Reclaiming the working time
agenda (An issues paper for the Australian
union movement), ACCIRT, Sydney.
People working in the evening, at night
and on the weekend, 1992 and 1997
2 Australian Bureau of Statistics 1998, Multiple
Jobholding, Australia, August 1997, Cat. no.
6216.0, ABS, Canberra.
Time of day and day of week
Outside daytime hours (6pm–6am)
1992
1997
%
%
35.1
36.7
Evening (6pm–10pm)
29.4
30.0
Night (10pm–6am)
16.1
17.4
Weekend
13.6
14.1
Weekday daytime (6am–6pm)
84.7
83.6
Persons reporting employment
3 Organisation for Economic Co-operation and
Development June 1998, 'Working hours: latest
trends and policy initiatives' in Employment
Outlook, pp. 153–188, OECD, Paris.
4 Australian Bureau of Statistics 1998, Working
Arrangements, Australia, August 1997, Cat. no.
6342.0, ABS, Canberra.
100.0 100.0
Source: Unpublished data, 1992 and 1997 Time Use
Surveys.
ABS • AUSTRALIAN SOCIAL TRENDS • 4102.0 • 1999
•
109
Men and women wanting
work
U N D E R - U T I L I S E D
In September 1998,
among people not fully
employed there were
more women than men
wanting work
– 1.2 million women
compared to 909,000
men. However, among
those wanting work, a
lower proportion of
women were part of the
labour force (50% of
women compared to
71% of men).
L A B O U R
Paid work provides many benefits: including
financial independence, extra family income,
opportunities for expanding social networks,
developing skills, enhancing personal status
and contributing to the community.
Circumstances such as ill health can prevent
people from having a job, and not all people
of working age need paid employment for
financial reasons. However, one of the more
pressing social issues, particularly affecting
those who do not have other means to
support themselves, is that there are large
numbers of people whose needs and interests
in obtaining work are not satisfied.
People wanting work
Through its program of monthly labour force and
supplementary surveys, the ABS collects a range of
information about the labour market activity and
work aspirations of people aged 15 years and
over. From these sources, this review identifies
three groups of people of working age (defined as
those aged 15–64 years), excluding those already
fully employed (defined below), with clearly
expressed interests in wanting work; namely the
underemployed, the unemployed and those
marginally attached to the labour force.
Fully employed – people who work in full-time
jobs (35 hours or more per week) and those in
part-time jobs in which they did not want to work
longer hours.
Unemployment provides a measure of people
at risk of being in financial or social distress.
However, while serving to identify those in
greatest need of support, it does not provide
a complete picture of the extent to which
people may want jobs. For example, there are
many people with part-time jobs who want to
work longer hours. There are also many
people, such as students and mothers with
young children, who want a paid job to suit
their circumstances but who are not actively
looking for work. Taking this broader
perspective, this review provides a profile of
men and women of working age (those aged
15–64 years) with clearly expressed interests
in finding work. It also provides a broader
view of the extent of under-utilised labour in
Australia than that obtained from counting
unemployed people alone.
Underemployed – people who usually work less
than 35 hours per week who want to work more
hours.
Unemployed – those who were not employed
during the survey reference week, but who had
actively looked for work in the last four weeks
and were available to start work.
Marginally attached to the labour force – people
not in the labour force who wanted to work and
were available to start work but were not actively
looking for work, or were actively looking for
work but unable to start work within four weeks.
Persons in the labour force, the economically
active population, are those who are either
employed or unemployed.
Employment profile of people aged 15–64 years, September 1998
Men
'000
Women
%
'000
Total
%
'000
%
In the labour force
Employed(a)
4 834.9
76.8
3 765.2
60.4
8 600.2
68.7
4 600.1
73.1
3 454.0
55.4
8 054.1
64.3
200.6
3.2
300.5
4.8
501.1
4.0
444.6
7.1
319.3
5.1
763.9
6.1
Marginally attached
263.8
4.2
629.7
10.1
893.5
7.1
Not available and
not actively looking for work(b)
749.1
11.9
1 516.3
24.3
2 265.4
18.1
6 292.5
100.0
6 230.5
100.0
12 522.9
100.0
Fully employed
Underemployed
Unemployed
Not in the labour force
Total(c)
(a) Includes people temporarily stood down from work.
(b) Includes persons permanently unable to work.
(c) Includes a small number of people not in the labour force for whom attachment to the labour force was not determined.
Source: Unpublished data, Labour Force Survey, September 1998; and Survey of Persons Not in the Labour Force,
September 1998.
110
• ABS • AUSTRALIAN SOCIAL TRENDS • 4102.0 • 1999
UNDER-UTILISED LABOUR
Numbers of people who want work
Most men of working age have paid jobs and
most are fully employed (either in full-time
jobs or in part-time jobs in which they do not
want to work longer hours). In September
1998, 77% of all men aged 15–64 were
employed – 73% were fully employed.
Among women, 60% were employed and
55% were fully employed.
Three groups of people with stated interests
in obtaining paid work can be identified – the
unemployed, those marginally attached to the
labour force and the underemployed. Of
these groups, the unemployed and the
underemployed are regarded as being part of
the labour force; that is, they are among the
economically active population.
In September 1998, there were 763,900
people aged 15–64 years who were
unemployed, 6% of all people aged 15–64.
(This proportion is not to be confused with
the official unemployment rate, which
measures the number of unemployed people
aged 15 years and over against the
economically active population – 8.0%
(seasonally adjusted) in September 1998.) Of
all unemployed people, 58% were men, and
men were more likely than women to be
unemployed (7% and 5% respectively).1
People aged 15–24 years, were more likely to
be unemployed than those in older age
groups (12% of men and 10% of women aged
15–24 were unemployed compared to 5% and
3% of those aged 45–64 years).
but would accept a job if the right one came
along (93%) or, were actively looking for
work but not available to commence work
within four weeks (the remaining 7%).
Overall, many people marginally attached to
the labour force did not have short-term
intentions of actively looking for work. The
September 1998 Survey of Persons Not in the
Labour Force showed that 25% of all people
who were marginally attached to the labour
force (while ready to start a job if the right
one came along) did not intend to look for
work within 12 months – a further 21% were
not sure if they would or not.
The third group of people identified as
wanting work, the underemployed, are
among those in part-time jobs. In September
1998, there were 501,100 people (60% were
women) in part-time jobs who wanted to
work longer hours. Those who were
underemployed represented 23% of all
people in part-time jobs and 4% of all people
aged 15–64.
Taking the three groups together, there were
more women than men wanting work
– 1.2 million women compared to
909,000 men. However, reflecting traditional
differences in the roles of men and women, a
lower proportion of women (50% compared
to 71% of men) in these groups were part of
the economically active population. Women
were also more likely than men to be neither
available to work nor looking for work
(24% compared to 12% of men).
Differences by age
The other major group of people wanting
work (893,500, in September 1998, of whom
70% were women) were not economically
active, but classified as being marginally
attached to the labour force. These people are
not recognised as being unemployed because
they are either not actively looking for work
The extent to which men and women not
fully employed want work and actively seek it
is affected by their life circumstances, as their
needs for income, giving care to other family
Proportion of people in different age groups wanting work, September 1998
15–24 years
Unemployed
25–44 years
45–64 years
Men
Women
Men
Women
Men
Women
%
%
%
%
%
%
11.8
9.5
6.2
4.8
5.2
2.8
Underemployed
6.4
7.5
2.5
4.5
2.0
3.6
Marginally attached(a)
9.7
10.8
2.0
12.1
3.6
6.8
27.9
27.8
10.8
21.4
10.7
13.2
'000
'000
'000
'000
'000
'000
1 356.3
1 302.1
2 857.9
2 888.4
2 078.3
2 039.9
Total wanting work
Total persons in age group
(a) Excludes a small number of people for whom marginal attachment to the labour force was not determined.
Source: Labour Force Survey (microfiche), Persons Not in the Labour Force, September 1998 (Cat. no. 6220.0)
ABS • AUSTRALIAN SOCIAL TRENDS • 4102.0 • 1999
•
111
UNDER-UTILISED LABOUR
Persons aged 15–64 wanting work, reported difficulties in finding /looking for work, 1998
Main difficulty in finding work
Main reason for not looking for work
Unemployed(a)
Underemployed(b)
Marginally attached(c)
Selected main difficulty/reason
Men
Men
Men
%
%
%
%
%
%
Lacked necessary skills/education/work experience
20.0
26.1
14.3
15.1
1.1*
3.6
yes
Considered too young or too old by employers
16.2
15.5
10.1
9.6
3.7
3.5
yes
1.4
3.7
0.8*
1.3*
1.2*
yes
No vacancies in line of work/at all
22.5
15.5
40.3
33.4
5.0
3.5
yes
Too many applicants
13.8
13.7
10.0
9.0
..
..
..
Travel/transport problems
7.3
4.5
4.0
3.4
Own ill health/disability
7.7
3.2
3.8*
0.9*
Child care, other family responsibilities
0.4*
3.8
0.7*
3.0
Difficulties with language or ethnic background
Attending educational institution
Total persons
Women
2.4*
Women
Women
Discouraged
Jobseekers(d)
(yes or no)
..
..
..
18.5
8.0
no
7.0
47.1
no
41.6
15.1
no
..
..
..
'000
'000
'000
'000
'000
'000
417.8
277.6
130.2
159.3
236.1
598.7
(a) Persons who were actively looking for work, at July 1998.
(b) Persons in part-time jobs who were actively looking for extra hours, at September 1998.
(c) Persons who wanted to work and were available to start work within four weeks but were not actively looking for work, at September 1998.
(d) This column identifies those among the marginally attached who, from their main reason for not looking for work are classified as being discouraged jobseekers.
Source: Unpublished data, Survey of Job Search Experience of Unemployed Persons, July 1998; Survey of Underemployed Workers, September 1998
and Survey of Persons Not in the Labour Force, September 1998.
members, and personal fulfilment change. A
broad view of such differences can be seen
among people in different age groups.
In general, the likelihood of men and women
wanting work tends to decline with increasing
age. In September 1998, 28% of men and
28% of women aged 15–24 wanted work.
Among men and women aged 45–64 years, on
the other hand, these proportions declined to
11% and 13% respectively.
For both men and women, the proportions
who were unemployed and underemployed
decreased with age. However, the extent to
which men and women were marginally
attached to the labour force diverged among
the group of people most likely to have
younger children – those aged 25–44 years.
Only 2% of men aged 25–44 were marginally
attached to the labour force compared with
12% of women.
The mix of reasons given for not looking for
work by women marginally attached to the
labour force – among those who would start a
job if one was available – highlights that a
major consideration for many women relates
their child care and family responsibilities. Of
the 598,700 women aged 15–64 wanting work
but not actively looking for it, 47% gave this
as their main reason for not looking for work.
The relatively high proportion of young
112
• ABS • AUSTRALIAN SOCIAL TRENDS • 4102.0 • 1999
people who were marginally attached to the
labour force corresponds with many of them
undertaking full-time studies. This
observation is supported by the fact that many
people ready to start a job stated that the
main reason they were not actively looking for
work was because they were attending an
educational institution (98,300 men and
90,300 women).
Barriers to finding work among the
unemployed and underemployed
For people in the labour force wanting work
(the unemployed and under-employed), the
limited supply of jobs is a key reason for not
being able to find work. However, the reasons
people wanting work give as their main
difficulty in getting a job differ according to
their individual circumstances. Barriers to
finding paid work can include factors related
to personal capabilities, ill health, and to
various forms of discrimination.
Of those unemployed, men were more likely
to attribute their difficulty to the state of the
job market – no vacancies in their line of
work or no vacancies at all (23% compared to
16%) – whereas women were more likely to
attribute their difficulty to their own lack of
skills (26% compared to 20%). Both men and
women were equally likely to see the level of
UNDER-UTILISED LABOUR
competition as their main difficulty in finding
a job – too many applicants for the available
jobs (both 14%).
Underemployed men and women were less
likely than unemployed people to report
personal capabilities as their main reason for
not finding work. However, this could be
expected, as these people were already in
employment.
Proportions of men and women aged
15–64 wanting work, 1988 to 1998
%
12
Males
Females
10
8
6
4
2
Discouraged jobseekers
Some of the people marginally attached to the
labour force (70,600 women and 26,400 men)
did not actively look for work, because they
believed they would not find a job. Men who
were discouraged jobseekers (a greater
proportion of whom were aged 55–64 years
– 51% compared to 30% of women) were
more likely to be discouraged because of
perceived job shortages or because they felt
they would be discriminated against because
of their age.
Responses to changing economic
conditions
Changes in the proportions of people
unemployed (or, as more commonly
described, changes in unemployment rates)
and in the numbers of discouraged jobseekers
(for both measures see Australian Social
Trends 1999, Work — national summary table
pp. 98–99), provide sensitive indicators of the
health of the economy.
Unemployed
1988
1990
1992 1994
Year
1996
0
1998
%
12
Males
Females
10
8
6
4
Marginally attached
1988
1990
1992 1994
Year
1996
2
0
1998
%
12
Males
Females
10
8
6
4
Underemployed
1988
1990
1992 1994
Year
1996
2
0
1998
As graphically illustrated by the changes that
occurred during the last economic recession,
during the early 1990s, unemployment levels
among men were particularly sensitive to
changing economic conditions. In contrast,
the changes in the proportions of people who
were marginally attached to the labour force
and underemployed (the groups in which
women predominate) were comparatively
small.
Nevertheless, as indicated by the greater
upward shift in the proportions of women
classified as being marginally attached to the
labour force during the recession, it appears
that women who want work have a greater
tendency than men to move out of the labour
force during periods when the over-supply of
labour is greatest. The different movements in
proportions of men and women identified as
being unemployed and marginally attached to
the labour force during the last recession
may, in part, reflect decisions within couple
families as to who should take the most active
steps in seeking to provide for the family.
Endnotes
1 Australian Bureau of Statistics 1999, Labour
Force Australia, April 1999, Cat. no. 6203.0,
ABS, Canberra.
Source: Labour Force Surveys (microfiche) and Persons Not in
the Labour Force, September 1988 (Cat. no. 6220.0).
ABS • AUSTRALIAN SOCIAL TRENDS • 4102.0 • 1999
•
113
Older jobseekers
U N D E R - U T I L I S E D
Older jobseekers are
less successful in
obtaining work than
young jobseekers, are
more likely to drop out
of the labour market
and less likely to find
a job as a result of a
training course.
Jobs they do find are
more likely to be parttime or casual, and
L A B O U R
The ongoing decline in employment in
goods production industries such as mining
and manufacturing (down from 17% of
Australia's workforce in November 1988 to
14% in November 1998) (see Australian
Social Trends 1997, Changing industries,
changing jobs, pp. 93–98 for further
information), combined with a lack of
transferable skills, has resulted in many older
persons who worked in these industries being
displaced from the workforce. As a result,
people from these industries are overrepresented among older jobseekers. For
example, although only 14% of employed
people in November 1998 were employed in
manufacturing or mining, 22% of older
jobseekers had been working in these
industries prior to September 1994.
There have been changes, too, in the sorts of
jobs that are offered – there is greater demand
for workers in high skill occupations, and less
for those requiring lower skills. 61% of older
jobseekers had been employed in less skilled
occupations compared with only 45% of the
same age group from the general population.
low-paid.
Although their overall unemployment rate is
relatively low (5%, compared to 15% for
people aged less than 25 at March 1999),
older people engaged in job search activities
experience less success in obtaining work
than younger jobseekers, possibly because of
factors such as outdated skills, relatively low
levels of education, competition with younger
jobseekers, discrimination and less flexibility
Labour market experience of the panel of older jobseekers
Absent from the labour market
Working(a)
Looking for work
%
80
60
40
20
0
M
1995
J
S
N
J
M
1996
M
J
S
N
J
M
1997
M
J
S
(a) Includes jobseekers who were working and looking for work at the same time.
Source: Unpublished data, Survey of Employment and Unemployment Patterns.
114
• ABS • AUSTRALIAN SOCIAL TRENDS • 4102.0 • 1999
The Survey of Employment and
Unemployment Patterns (SEUP)
SEUP was a longitudinal survey. That is,
information was collected from the same
individuals (called the panel) over three years. The
SEUP panel, who were selected in May 1995,
provided a range of social and demographic
information, including their employment history
before September 1994 and their level of
education. Subsequent interviews, in October
1995, 1996 and 1997, collected information about
their labour market activities since September
1994, and their labour force status at September
1997.
Jobseekers, the main component of the SEUP
panel, were persons aged 15–59 years who, at May
1995, were either unemployed, underemployed
(working less than 10 hours per week and looking
for a job with more hours), or not in the labour
force (but likely to enter it in the near future).
Older jobseekers were jobseekers aged 45–59
years. In this article, comparisons are drawn
between older jobseekers and a number of other
groups of people:
Other jobseekers were jobseekers aged 15–44;
Young jobseekers were jobseekers aged 15–24;
and
The general population were all persons aged
15–59 interviewed in SEUP.
Occupations
In this article, occupations are classified by skill
level according to the Australian Standard
Classification of Occupations (ASCO), second
edition, and are sometimes grouped as follows:
High skilled – comprising managers and
administrators; professionals; associate
professionals; tradespersons and related
workers; and advanced clerical and service
workers.
Less skilled – comprising intermediate clerical,
sales and service workers; intermediate
production and transport workers; elementary
clerical, sales and service workers; and
labourers and related workers.
to change location. They are more likely to
drop out of the labour market and less likely
to find a job as a result of a training course.
Labour market activities
In May 1995, there were 875,100 jobseekers
in Australia. The labour market activities of
this group were monitored from that date, up
to September 1997. Of these people, 168,000
(19%) were aged between 45 and 59.
UNDER-UTILISED LABOUR
Jobseekers: labour market outcomes, September 1997
Labour market outcomes
Labour market outcome
Stable
work
Unstable
work
No
longer
working
Had not
worked
Age (years)
%
%
%
15–24
33.7
23.1
28.0
Total
Total
%
'000
%
15.3
306.2
100.0
25–44
34.2
20.6
25.7
19.5
401.3
100.0
45–59
22.2
13.2
21.5
43.1
167.6
100.0
45–54
26.7
16.3
23.0
34.0
118.3
100.0
55–59
11.6
5.7
17.8
65.0
49.2
100.0
31.7
20.0
25.7
22.5
875.1
100.0
Total jobseekers
Based on their labour market activities between
May 1995 and September 1997 (the reference
period for this article), jobseekers were classified
into one of the following labour market outcomes
at September 1997:
stable work in which their current job had
lasted for six months or more and they were
not concurrently looking for work; or
unstable work where their current job had
lasted less than six months or they were
concurrently looking for work; or
no longer working but had found some work
during the reference period; or
not worked where they had not found any
work during the reference period.
Source: Unpublished data, Survey of Employment and Unemployment Patterns.
Between May 1995 and September 1997, the
proportion of these older jobseekers who
were looking for work fell steadily from 74%
to 32%. Movements either into work or out of
the labour market altogether contributed
almost equally to this decline in job search
activity.
Over this same period, there was an increase
in the proportion of older jobseekers who
were working, from 13% to 35%. However,
most of this increase was concentrated in a
relatively short period between May 1995 and
March 1996. This initial surge in employment
can be attributed to more employable older
jobseekers securing work after a relatively
short period of job search. These successful
jobseekers tended to then remain in
employment. For example, 74% of those
jobseekers who were working in March 1996
were also working 18 months later.
Jobseekers in this group were more likely to
have a post-school qualification (50%) than
other jobseekers (40%).
Those older jobseekers who did not have
early success finding work continued to have
difficulties in this regard. For example, of
jobseekers who were looking for work at
March 1996, only 22% were working at
September 1997. They were more likely to be
absent from the labour market (26%) or
looking for work (52%).
The proportion of older jobseekers who were
absent from the labour market rose steadily
from 13% to 32% between May 1995 and
September 1997. These jobseekers stated that
the main reasons for their absence included
illness (38%), age discrimination (10%), and
returning to studies (7%).
Between May 1995 and September 1997,
43% of older jobseekers had had no work at
all. This was more than double the
proportion for other jobseekers (18%). At the
end of the survey, only 22% of older
jobseekers were in stable work, and a further
13% were in unstable work. The remaining
21% of older jobseekers had obtained some
work over the reference period, but were not
currently working.
Jobseekers aged 55–59 were particularly
unsuccessful in obtaining employment.
Between May 1995 and September 1997,
65% of these jobseekers had obtained no
work at all. At September 1997, only 17% of
these jobseekers were working.
Characteristics and outcomes
The composition of the older jobseeker group
is quite different from the equivalent age
group in the general population, and their
labour market experiences varied according
to their characteristics. Older jobseekers were
more likely to be male, born overseas, living
alone, and divorced or separated. The
association between unemployment and
relationship breakups is not clear – it is not
possible to tell whether a relationship
breakup has contributed to unemployment,
was a result of it, or was of no relevance to it.
Men were over-represented among older
jobseekers compared with older men in the
general population (58% and 50%,
respectively). Labour market outcomes of
older jobseekers were similar for men and
women. For example, 21% of men had found
stable work at the end of the period
compared to 24% of women.
There were fewer older jobseekers born in
Australia (56%) than might be expected from
their representation in the general population
aged 45–59 (65%). In addition, success in
obtaining a job at some time over the
reference period was greater for older
jobseekers born in Australia (60%), and those
ABS • AUSTRALIAN SOCIAL TRENDS • 4102.0 • 1999
•
115
UNDER-UTILISED LABOUR
Older jobseekers: selected characteristics and outcomes, September 1997
Older jobseekers
General population aged 45–59
Labour market outcome
Characteristics
Stable
work
No
Unstable longer
work
working
Had not
worked
Total number Proportion of
of older
all older
jobseekers
jobseekers(a)
Total number
Proportion(a)
%
%
%
'000
%
'000
%
Males
21.3
13.7
%
22.0
43.1
97.5
58.1
1 496.6
50.4
Females
23.5
12.5
20.8
43.1
70.1
41.9
1 471.2
49.6
Born in Australia
23.1
14.6
21.9
40.4
93.9
56.0
1 927.8
65.0
Born in
main English-speaking countries
24.1
15.9
25.4
34.5
27.2
16.2
420.7
14.2
Born in other countries
19.4
8.7
18.3
53.6
46.6
27.8
619.2
20.9
Married/de facto(b)
22.5
13.1
19.7
44.8
113.1
67.5
2 358.1
79.5
Divorced/separated(b)
24.3
15.1
22.0
38.7
35.0
20.9
349.8
11.8
Living alone(b)
17.9
15.4*
22.6
44.0
26.5
15.8
284.4
9.6
Without post-school qualifications
18.3
11.1
18.3
52.3
96.0
57.3
1 480.8
49.9
With post-school qualifications
27.5
16.0
25.7
30.7
71.6
42.7
1 487.0
50.1
Qualified since 1990
23.3*
21.7*
26.9*
28.1*
12.1
7.2
200.6
6.8
Qualified before 1990
28.4
14.9
25.4
31.3
59.5
35.5
1 286.4
43.3
(a) Proportion in each group.
(b) Social marital status at September 1995.
Source: Unpublished data, Survey of Employment and Unemployment Patterns.
born in main English-speaking countries
(65%), than for those born in other
countries (46%).
Older jobseekers were less likely to be in a
married or de facto relationship (67%) and
more likely to be divorced or separated (21%)
than the general population aged 45–59 years
(79% and 12%, respectively). Among older
jobseekers there were only minor differences
in labour market outcomes between those
who were divorced or separated and those
who were in a married or de facto
relationship.
There were 16% of older jobseekers who lived
alone, compared with 10% of the general
population aged 45–59. A reduced motivation
to secure work, caused by fewer family
pressures and a lower level of family support
might explain why these jobseekers appeared
to have had worse labour market experiences
and outcomes. For example, 18% of those
who lived alone were in stable work
compared to 23% of other older jobseekers.
Among older jobseekers, very few (7%) had
obtained their highest qualification since
1990. Recent qualifications may be perceived
as being of more value to prospective
employers than older qualifications. Among
116
• ABS • AUSTRALIAN SOCIAL TRENDS • 4102.0 • 1999
older jobseekers, however, those with more
recent qualifications did not appear to fare
much better than those with older
qualifications. Of those older jobseekers who
had obtained their qualification since 1990,
45% were working at September 1997,
compared with 43% of jobseekers who had
obtained their qualification before 1990.
Nevertheless, having qualifications can still
assist older jobseekers in obtaining work —
69% of those who had post-school
qualifications had worked between May 1995
and September 1997, and 28% were in stable
employment at September 1997. In
comparison, of those without qualifications,
48% had worked between May 1995 and
September 1997, and only 18% were in stable
employment at September 1997.
Previous occupations
Older jobseekers came from a wide range of
occupation backgrounds. However, by
comparing their occupational profiles with
those of the general population in the
equivalent age group, it can be seen that older
jobseekers were more likely to be drawn from
less skilled occupations, such as labouring
(19% of jobs compared to 10%), and
intermediate production and transport
UNDER-UTILISED LABOUR
Jobs held by the panel of older jobseekers compared to other population groups
Jobs held prior to September 1994(a)
Occupation
Older
jobseekers
Older
persons
Young
jobseekers
%
%
%
Jobs held by older
jobseekers at
September 1997
%
Managers and administrators
3.2
8.0
0.2
3.1
Professionals
9.0
11.9
2.8
8.6
Associate professionals
10.5
12.9
3.4
10.6
Tradespersons and related workers
13.5
17.2
12.5
13.6
Advanced clerical and service workers
Intermediate clerical, sales and service workers
2.8
4.9
0.9
3.4
16.2
16.3
14.3
18.3
Intermediate production and transport workers
15.4
9.9
7.9
12.7
Elementary clerical, sales and service workers
10.4
8.9
30.4
10.4
Labourers and related workers
Total
19.0
10.0
27.6
19.3
100.0
100.0
100.0
100.0
(a) Excludes those who were not working prior to the survey.
Source: Unpublished data, Survey of Employment and Unemployment Patterns.
(15% of jobs compared to 10%), and less
likely to be from high-skill ones such as
management (3% of jobs compared to 8%).
Even so, older jobseekers tended to come
from more highly skilled occupations than
young jobseekers. A large proportion of the
jobs previously held by young jobseekers
were either elementary clerical (30%) or
labouring (28%).
Job search
Being considered too old by potential
employers was given as the main difficulty in
finding work for 47% of older jobseekers'
episodes of looking for work, while a lack of
vacancies was given for only 20% of their
job-search episodes.
Established mortgages and social networks,
school-aged children and working partners all
contribute to making people aged 45–59 less
geographically mobile. In only 23% of their
job search episodes did older jobseekers say
they would be prepared to move to obtain a
job. The equivalent figure for other
jobseekers was 43%.
Older jobseekers were more likely to have
received unemployment benefits over the
survey period than other jobseekers — 51%
compared to 46% — and tended to be on
benefits for longer (an average of 68% of the
survey period compared to 60% for other
jobseekers).
Training
In the SEUP, information was collected on
external training. External training consists
mainly of short courses, not conducted by
employers, taken to improve job skills. It
excludes courses of more than one semester
in duration and that lead to an educational
qualification. Between May 1995 and
September 1997, 19% of older jobseekers had
participated in at least one external training
course to help them get a job. This
participation rate was comparable with that of
other jobseekers (20%).
Although they had similar participation rates,
older jobseekers had less success than other
jobseekers in obtaining a job as a result of this
training. Only 11% of older jobseekers who
did external training indicated that the course
helped them get a job, compared with 19% of
other jobseekers.
Nature of work found
As well as being less successful in finding
jobs, job outcomes for older jobseekers were
also generally less favourable in terms of
occupation, income and job security. When
compared with jobs held during the survey
period by the general population in the
equivalent age group, older jobseekers who
found work between May 1995 and
September 1997 were more likely to have
been employed on a casual basis. Some 71%
ABS • AUSTRALIAN SOCIAL TRENDS • 4102.0 • 1999
•
117
UNDER-UTILISED LABOUR
Proportion of jobs found by older jobseekers which lasted less
than six months(a)
Older jobseekers with children
Children in families in which one or both parents
do not have paid employment are likely to be at
greater risk of socio-economic disadvantage than
children in other families (see Australian Social
Trends 1999, Lower income working families,
pp. 134–137).
Managers
Managersand
andadministrators
administrators
Professionals
Professionals
Associate
Associateprofessionals
professionals
Tradespersons
and
Tradespersons
and related
related workers
workers
Advanced
clerical
and
Advanced
clerical
and service
service workers
workers
Intermediate
clerical,clerical
sales
Intermediate
sales and
andservice
service workers
workers
Intermediate
Intermediateproduction
production
and transport workers
and transport workers
Elementary
clerical,
sales
Elementary
clerical,
sales
and service
workers
and service workers
Labourers
Labourersand
andrelated
related workers
workers
In September 1997, there were 39,500 older
jobseekers who were married or de facto with
dependent children, comprising 13,500 women and
26,000 men. Close to half (46%, or 18,300 in total)
of older jobseekers with dependent children did
not find any work at all between May 1995 and
September 1997.
0
20
40
%
60
80
Moreover, jobs which were found by older
jobseekers were likely to be short term. Over
half (54%) of the jobs found by older
jobseekers lasted less than six months.
(a) Excludes jobs lasting less than 6 months and continuing at September 1997.
Source: Unpublished data, Survey of Employment and Unemployment Patterns.
of jobs found by these jobseekers were casual
compared with 34% for older workers in the
general population.
During the survey period, the jobs found by
older male jobseekers were also less likely to
be full-time (61%) than those held by men
from the general population aged 45–59
(80%). Among women, the difference was
smaller – 35% compared with 36%.
Hourly earnings from wage and salary jobs
Jobs found by older jobseekers
Jobs held by the general population aged 45–59
% of
jobs
40
Older jobseekers did not always find work in
the same occupations they were in previously.
Of those older jobseekers who were working
at the end of the survey period, almost half
(45%) who had previously held high-skill jobs
were working in less skilled jobs. In contrast,
less than a quarter (23%) of those from less
skilled jobs had made the transition to
high-skill jobs.
Consistent with their less skilled occupational
background, hourly wage and salary earnings
for older jobseekers was, on average, about a
third lower ($13.25 gross) than for workers
aged 45–59 from the general population
($17.23 gross). Over half (52%) of jobs found
by older jobseekers paid less than $12 an
hour, compared with only a quarter (26%) of
jobs held by older people in the general
population.
35
30
25
20
15
10
5
0
<4
4 – <8
8 – <12
12 – <16 16 – <20 20 – <24
24 or
more
($)
Source: Unpublished data, Survey of Employment and Unemployment Patterns.
118
However, this varied according to their
occupation. For example, those jobs found in
management or associate professional
occupations were likely to last longer than six
months, although these were in the minority.
Many more found jobs as labourers or
tradespersons, and these were likely to last
less than six months. Those jobs found in
professional occupations (probably contract
work in professional fields) were also likely to
last less than six months.
• ABS • AUSTRALIAN SOCIAL TRENDS • 4102.0 • 1999
How couples share
domestic work
U N P A I D W O R K
In 1997, married women
spent an average of
1hr:47mins per day
more on domestic work
than men. This
difference, however,
was smaller (1hr:16
mins) for couples who
Even though social and economic changes
since the late 1960s have had substantial
effects on the traditional roles of men as
bread winners and women as home makers,
the time men spent on domestic work in
1997 was still markedly less than women.
Married women spent an average of 1 hour
and 47 minutes per day more on domestic
work, as a main activity, than their husbands.
Women were also more likely than men to
undertake some domestic work on an average
day (97% of women compared with
81% of men).
Measuring time use
Information on time spent on different activities
is taken from the 1997 Time Use Survey. Time use
data was compiled from a household
questionnaire and a 48-hour diary of time use,
completed by respondents aged 15 years and
over. For each five-minute time slot in the diary,
people could record up to two concurrent
activities. In this review, the amount of time given
to domestic work as a main activity (the first
activity people recorded) is examined for men
and women in couple relationships (married or
de facto).
spent similar time on
paid work.
However, men were more likely than their
partners to be employed, or if both were
employed, to work longer hours
(see Australian Social Trends 1997, Families
at work, pp. 30–33). As a result, women often
had more time for domestic work than men.
In order to counter the effects of different
employment patterns, time spent on domestic
work can be compared for those couples in
which both parties worked similar hours
(that is, couples in which the difference in
hours worked was less than 5 hours per
week, which is at most 1 hour per average
working weekday).
In such families, there was less difference in
the time spent by each partner on domestic
work than among couples in general.
However, women still averaged 1 hour
and 16 minutes more than their partners
(3hrs:46mins compared with 2hrs:30mins).
Domestic work refers to unpaid work about the
house, excluding most child care and shopping.
The types of domestic activities have been
classified into broad groups as follows:
Food preparation and clean up includes
cooking and serving meals, and washing dishes;
Laundry and clothes care includes washing,
ironing, mending and making clothes;
General housework includes cleaning the
bathroom/toilet, vacuuming, dusting and tidying;
Grounds and animal care includes gardening,
pool care and feeding and tending to animals;
Home maintenance includes repairs or
improvements to the home, equipment, and
motor vehicles and chopping wood; and
Household management includes paperwork,
bills, budgeting, organising, packing, selling
household assets and disposing of rubbish.
Partners in couple families: average daily reported involvement in domestic work, 1997
Partners who had similar hours of paid work
All couples
Time spent per day
Participation(a)
Time spent per day
Participation(a)
Men
Women
Men
Women
Men
Women
Men
Women
%
Type of domestic work
hrs:mins
hrs:mins
%
%
hrs:mins
hrs:mins
%
Food preparation and clean up
0:38
1:37
69.0
92.1
0:29
1:29
61.7
92.2
Laundry and clothes care
0:05
0:39
12.0
56.1
0:04
0:42
11.2
62.8
General housework
0:11
0:48
27.2
72.0
0:08
0:45
21.1
72.2
Grounds and animal care
0:49
0:23
51.2
39.7
0:32
0:22
38.1
40.4
Home maintenance
0:29
0:05
26.7
6.5
0:23
0:05
21.5
8.0
Household management
0:10
0:10
29.3
28.8
0:09
0:11
26.1
35.9
Total(b)
2:30
3:46
88.1
96.9
1:52
3:39
81.4
97.2
(a) Percentage of population who reported taking part in a particular activity per day.
(b) Total includes other miscellaneous domestic work.
Source: Unpublished data, Time Use Survey, 1997.
ABS • AUSTRALIAN SOCIAL TRENDS • 4102.0 • 1999
•
119
UNPAID WORK
Who does what?
Life stage
As well as differences in the amount of time
spent by men and women in couple families
on domestic work, there was also a high
degree of segregation in the specific types of
domestic work they undertook.
The time people spent on domestic work
generally increased with age.1 This might, in
part, have been associated with the increased
likelihood that older people own their homes
and gardens, and have more possessions
(e.g. furnishings, household equipment) – all
requiring care and maintenance. However, it
might also have been that older people prefer
certain types of domestic work (such as
cooking and gardening) to activities that
younger people might do in their free time.
In 1997, among couples with similar hours of
paid employment, women spent an average of
1hr:37mins per day on food preparation and
clean up, almost 1 hour more than their
partners. They also spent 34 minutes more
than their partners on laundry tasks
(39 minutes compared with 5 minutes spent
by men), and 37 minutes more on general
housework (48 minutes compared with
11 minutes). Men, on the other hand, spent
more time on grounds and animal care
(49 minutes compared with 23 minutes for
women), and general home maintenance
(29 minutes compared with 5 minutes).
Partners spent equal time on household
management tasks such as paying bills and
household budgeting (10 minutes per day).
Differences in time spent on various domestic
activities was also reflected in the extent to
which partners participated in these activities.
For example, in 1997 on an average day,
56% of women did laundry-related tasks
compared with 12% of men, and, 72% of
women compared with 27% of men
participated in general housework. Men were
more likely to undertake home maintenance
activities (27% compared with 7% of women),
and grounds and animal care
(51% compared with 40%).
The increasing time spent on domestic work
with age was evident among couples in which
both partners had similar hours of paid
employment. In 1997, women in couple
families with a male partner aged between
15 and 29 years spent 2hrs:9mins per day on
domestic work, while those with a male
partner aged over 60 spent nearly twice this
time (4hrs:12mins). While consistently lower
for the corresponding age groups, the time
spent by men on domestic work also
increased with age. Men aged over 60 spent
over twice as much time (2hrs:56mins per
day) on domestic work as men aged between
15 and 29 (1hr:14mins).
Differences between men and women in time
spent on various types of domestic tasks were
more evident among older couples than
among younger couples. With increasing age,
women did more of the housework such as
cooking and cleaning, while men gave
increasing amounts of time to general
maintenance and other activities. In fact,
older men spent only 10 minutes more time
on housework activities than younger men
while the time women spent on housework
increased substantially with age.
Couples in which both partners had similar hours of paid work: average time per day spent by each
partner on domestic work, 1997
Proportion with
dependent
children(d)
Proportion
employed
full-time
Housework(a)
Other domestic work(b)
Total(c)
Males
Females
Males
Females
Males
Females
Age of male partner (years)
hrs:mins
hrs:mins
hrs:mins
hrs:mins
hrs:mins
hrs:mins
%
%
15–29
0:48
1:56
0:25
0:12
1:14
2:09
20.7
80.8
30–39
0:58
2:30
0:54
0:31
1:57
3:12
68.9
52.3
40–49
0:42
2:27
1:01
0:35
1:52
3:05
50.1
67.5
50–59
0:49
3:02
1:40
0:50
2:34
3:53
11.2
33.8
60 and over
0:58
3:29
1:49
0:41
2:56
4:12
1.2
2.1
(a) Includes food preparation and clean up, laundry and clothes care, and general housework.
(b) Includes grounds and animal care, home maintenance, and household management.
(c) Total includes other miscellaneous domestic work.
(d) Children aged 0–14 at home.
Source: Unpublished data, Time Use Survey, 1997.
120
• ABS • AUSTRALIAN SOCIAL TRENDS • 4102.0 • 1999
UNPAID WORK
Couples in which both partners had similar hours of paid work: average time per
day spent by each partner(a) on domestic work, 1997
Housework(b)
Other domestic
work(c)
Total(d)
Males
Males
Males
Females
Females
Females
Proportion
employed
full-time
Family type
hrs:mins hrs:mins
hrs:mins hrs:mins
hrs:mins hrs:mins
%
Couples with children(e)
0:56
2:54
1:06
0:33
2:11
3:36
53.7
Couple only families
0:44
1:50
0:50
0:30
1:37
2:22
67.7
(a) Couples where the male reference person was aged 30–49.
(b) Includes food preparation and clean up, laundry and clothes care, and general housework.
(c) Includes grounds and animal care, home maintenance, and household management.
(d) Total includes other miscellaneous domestic work.
(e) Children aged 0–14.
Source: Unpublished data, Time Use Survey, 1997.
Whether a couple had dependent children or
not also had an effect on how much domestic
work was done on an average day. Of couples
aged between 30 and 49 years in which both
partners had similar hours of paid work,
those with children (aged 0–14) spent more
time on domestic work than couple-only
families. Moreover, mothers spent more time
than women without children on housework
such as cooking and cleaning (2hrs:54mins
compared with 1hr:50mins), while fathers
spent slightly more time than men without
children on domestic work such as home
maintenance tasks and grounds and
animal care.
In particular, of women in couple families,
mothers spent over one hour more on
housework than women without dependent
children. The time men spent on housework
changed by only 12 minutes, whether they
had children or not. Similarly, the time
mothers spent on other domestic work
changed little, whether they had children
or not.
The increased time spent on domestic work
by couples with dependent children,
compared with couple only families, is related
to the need to provide for more people
(e.g. more people to cook for and clean up
after). In addition, of couples who work
similar hours in paid work, couple-only
families are more likely to work longer hours
than couples with children. In 1997, 68% of
these couple-only families had both partners
working full-time compared to
54% of couples with children.
Endnotes
1 Australian Bureau of Statistics 1997, Time Use
Survey, Australia, Cat. no. 4153.0, ABS,
Canberra.
ABS • AUSTRALIAN SOCIAL TRENDS • 4102.0 • 1999
•
121
Income and expenditure
Page
National and State summary tables . . . . . . . . . . . . . . . . . . . . . . . . . 124
INCOME DISTRIBUTION
Income sharing and income distribution
..................
129
The choice of sharing unit has some impact on the degree of measured
inequality. Generally, estimates of income inequality decrease as the
scope of the sharing unit is expanded. This review illustrates possible
choices of sharing units and how these choices affect measurements of
the distribution of income within the population overall and within the
growing number of family households maintaining children who have
completed their education.
Lower income working families
................................
134
In this review, characteristics of working families in the lowest two
quintiles (40%) of the equivalent income distribution are compared with
those at the higher end of the distribution.
Economic resources of older Australians
.................
138
Older Australians, people aged 65 years and over, have an average weekly
income well below that of most other population groups, and are
generally reliant on some type of government support payment as their
regular income. This review looks at the level and sources of income of
this population group, and provides commentary on the living standards
of older Australians.
EXPENDITURE
Expenditure on gambling
.........................................
141
The recent rapid growth in legalised gambling in Australia is explored, as
well as current patterns of gambling expenditure and participation. State
and Territory comparisons are featured in the article.
ABS • AUSTRALIAN SOCIAL TRENDS • 4102.0 • 1999 •
123
Income — national summary
INCOME DISTRIBUTION
Units
GDP per capita (1989–90 prices)
Household
disposable income per capita
Personal income tax as a
proportion of taxable income
Share of equivalent
income going to top
quintile (of all income units)
Share of equivalent
income going to bottom
quintile (of all income units)
Gini coefficient
(of all income units)
Median gross weekly
income of couple with
dependants income units
Median gross weekly income
of one-parent income units
SOURCES OF INCOME
Units
Wages and salaries as main source
of income (of all income units)
Wages, salaries and supplements
as a proportion of GDP(I)
Main income source
from government
payments (of all income units)
Main income source from
government payments (of couples
with dependants income units)
Main income source from
government payments
(of one parent income units)
Mean total weekly
earnings of all employees
Mean total weekly earnings
of full-time adult employees
Mean weekly ordinary time
earnings of full-time
non-managerial adult employees
Female/male ratio of mean total
full-time adult weekly earnings
1987
1988
1989
1990
1991
1992
1993
1994
1995
1996
1997
$'000
20.3
21.0
21.5
21.9
21.5
21.4
21.9
22.6
23.4
24.0
24.4
$'000
10.4
11.3
12.5
13.7
14.2
14.6
15.0
15.5
16.5
17.4
18.1
%
24.8
23.8
24.1
23.1
22.4
21.9
22.2
22.0
22.1
22.7
23.3
%
n.a.
n.a.
n.a.
37.7
n.a.
n.a.
n.a.
n.a.
37.8
37.6
37.4
%
n.a.
n.a.
n.a.
7.6
n.a.
n.a.
n.a.
n.a.
7.2
7.3
7.6
no.
n.a.
n.a.
n.a.
0.42
n.a.
n.a.
n.a.
n.a.
0.44
0.44
0.44
$
n.a.
n.a.
n.a.
755
n.a.
n.a.
n.a.
n.a.
842
849
882
$
n.a.
n.a.
n.a.
279
n.a.
n.a.
n.a.
n.a.
349
352
349
1988
1989
1990
1991
1992
1993
1994
1995
1996
1997
1998
%
n.a.
n.a.
58.3
n.a.
n.a.
n.a.
n.a.
56.8
55.5
54.8
n.a.
%
49.0
48.3
49.3
50.2
50.1
49.6
49.1
49.0
49.0
50.1
49.9
%
n.a.
n.a.
26.7
n.a.
n.a.
n.a.
n.a.
28.8
29.0
30.0
n.a.
%
n.a.
n.a.
8.4
n.a.
n.a.
n.a.
n.a.
11.4
11.0
11.6
n.a.
%
n.a.
n.a.
61.3
n.a.
n.a.
n.a.
n.a.
59.4
58.7
64.8
n.a.
$
411
441
475
494
510
526
533
551
574
n.a.
610
$
497
538
571
597
616
641
658
690
724
n.a.
782
$
433
466
495
521
541
558
578
608
634
n.a.
692
no.
0.8
0.8
0.8
0.8
0.8
0.8
0.8
0.8
0.8
n.a.
0.8
1988
1989
1990
1991
1992
1993
1994
1995
1996
1997
1998
INCOME SUPPORT
Units
Aged on age pension
Age pensioners
Male age pensioners
Female age pensioners
Labour market allowance
Disability support pensioners
Single-parent payment
Full weekly benefit received
by a couple with two children
GDP(I) spent on income support
%
'000
'000
'000
'000
'000
'000
EXPENDITURE
Units
$
%
Consumer price index
(Base year 1989–90 = 100.0)
no.
Private final consumption expenditure
per capita (1989–90 prices)
$'000
Reference periods:
124
•
61.5
60.2
59.2
59.3
61.0
62.8
64.3
63.0
62.7
64.4
65.4
1 329
1 334
1 340
1 376
1 446
1 516
1 582
1 579
1 603
1 680
1 683
405
403
404
418
448
481
514
545
570
598
614
924
931
936
957
998
1 034
1 068
1 034
1 033
1 082
1 069
478.0
389.8
419.8
676.7
851.8
913.8
878.3
822.6
846.6
829.9
809.6
296.9
307.8
306.7
334.2
378.6
406.6
436.2
464.4
499.2
527.5
553.3
238.7
239.5
248.9
265.7
287.2
298.4
313.4
324.9
342.3
358.9
372.3
243
262
288
310
326
339
347
355
370
391
403
5.8
5.4
5.4
6.3
7.2
7.5
7.7
7.4
7.3
7.4
7.1
1988
1989
1990
1991
1992
1993
1994
1995
1996
1997
1998
86.3
92.6
100.0
105.3
107.3
108.4
110.4
113.9
118.7
120.3
120.3
12.1
12.5
12.8
12.7
12.9
13.2
13.4
13.9
14.3
14.7
15.2
Data for income distribution, sources of income (except mean weekly earnings data which are at May),
and expenditure are for the year ending 30 June. Income support data (except full benefit received and
GDP spent which are for the year ending 30 June) are at June.
ABS • AUSTRALIAN SOCIAL TRENDS • 4102.0 • 1999
Income — State summary
INCOME DISTRIBUTION
Gross State product
per capita (market price)
Household
disposable income per capita
Share of equivalent
income going to top
quintile (of all income units)
Share of equivalent
income going to bottom
quintile (of all income units)
Gini coefficient
(of all income units)
Median gross weekly
income of couple with
dependants income units
Median gross weekly income
of one-parent income units
SOURCES OF INCOME
Wages and salaries as main source
of income (of all income units)
Main income source from
government payments
(of all income units)
Main income source from
government payments
(of couple with
dependants income units)
Main income source from
government payments
(of one parent income units)
Mean total weekly
earnings of all employees
Mean total weekly earnings of
full-time adult employees
Mean weekly ordinary time
earnings of full-time nonmanagerial adult employees
Female/male ratio of mean total
full-time adult weekly earnings
INCOME SUPPORT
Aged on age pension
Age pensioners(a)
Male age pensioners
Female age pensioners
Labour market allowance
Disability support pensioners(a)
Single-parent payment(a)
Units
Years
NSW
Vic.
Qld
SA
WA
Tas.
NT
ACT
Aust.
$'000
1996–97
29.2
29.2
24.8
24.6
30.6
22.2
29.4
35.2
28.1
$'000
1996–97
19.2
18.7
16.4
16.8
17.3
15.3
18.4
23.2
18.1
%
1996–97
37.7
37.2
37.7
35.8
38.0
35.8
n.a.
37.1
37.4
%
1996–97
7.7
7.7
7.4
8.5
6.8
8.6
n.a.
6.8
7.6
no.
1996–97
0.45
0.42
0.44
0.42
0.46
0.40
n.a.
0.44
0.44
$
1996–97
881
861
877
855
960
831
n.a.
1157
882
$
1996–97
342
318
370
332
382
*415
n.a.
*374
349
Years
NSW
Vic.
Qld
SA
WA
Tas.
NT
ACT
Aust.
%
1996–97
55.1
55.9
53.9
48.2
55.9
52.5
n.a.
63.0
54.8
%
1996–97
30.8
28.4
30.6
37.0
26.2
35.4
n.a.
19.5
30.0
%
1996–97
12.5
11.2
13.0
*11.8
*6.9
*12.4
n.a.
**
11.6
%
1996–97
67.4
68.2
62.1
70.9
56.0
*50.8
n.a.
*51.0
64.8
$
1998
642
560
588
568
586
554
643
734
610
$
1998
817
767
757
729
781
712
782
874
782
$
1998
710
684
674
668
695
653
693
745
692
no.
1998
0.8
0.8
0.8
0.8
0.8
0.8
0.8
0.8
0.8
Units
Years
NSW
Vic.
Qld
SA
WA
Tas.
NT
ACT
Aust.
%
'000
'000
'000
'000
'000
'000
1998
1998
1998
1998
1998
1998
1998
Units
62.9
65.0
63.3
68.1
62.7
64.6
66.2
49.6
65.4
572.2
431.0
278.9
161.4
136.6
45.1
5.1
13.7
1 682.6
204.8
154.9
102.7
58.3
48.8
16.0
2.0
4.6
613.6
367.3
276.1
176.2
103.1
87.8
29.1
3.0
9.2
1 069.0
250.1
190.9
165.9
68.9
64.1
27.5
12.7
10.1
790.3
188.0
129.5
99.8
51.9
46.0
19.6
4.3
5.1
553.3
123.9
82.1
77.3
30.9
37.0
11.0
5.0
5.1
372.3
(a) Components do not add to total because total for Australia includes pensions paid to people living overseas.
Reference periods:
Data for income distribution, sources of income (except mean weekly earnings data which are at May) are
for the year ending 30 June. Income support data are at June, except labour market allowance recipients
which are at May.
ABS • AUSTRALIAN SOCIAL TRENDS • 4102.0 • 1999 •
125
Income — definitions and references
Adult employees — employees aged 21 or over, and
those under 21 who are paid at the full adult rate.
Reference: Employee Earnings and Hours,
Australia (Cat. no. 6306.0).
Age pension recipients — people receiving full or
partial Age pension excluding associated Wife's or
Carer's pension. The qualifying age for Age pension
eligibility for men is 65. Between 1 July 1995 and
2012, the qualifying age for women is gradually
being raised from 60 to 65 years. At 30 June 1998
the qualifying age for women was 61 years.
Reference: Commonwealth Department of Family
and Community Services, Commonwealth
Department of Family and Community Services
Customers: a statistical overview.
Aged — population meeting age criteria for the Age
pension, comprising men 65 and over and women
61 and over from 1998; men 65 and over and
women 60 and over prior to 1998.
Reference: Population by Age and Sex, Australian
States and Territories (Cat. no. 3201.0).
Consumer price index — a measure of change over
time in the retail price of a constant basket of goods
and services which is representative of consumption
patterns of employee households in metropolitan
areas.
Reference: The Australian Consumer Price Index:
Concepts, Sources and Methods (Cat. no. 6461.0).
Disability support pensioners — persons receiving a
pension on the basis of an assessed physical,
intellectual or psychiatric impairment and on their
continuing inability to work or be retrained to work
30 hours or more per week within the next two
years.
Reference: Commonwealth Department of Family
and Community Services, Commonwealth
Department of Family and Community Services
Customers: a statistical overview.
Disposable income — gross income less personal
income tax (including the Medicare levy).
Reference: Income Distribution, Australia
(Cat. no. 6523.0).
Employees — all wage and salary earners who received
pay for any part of the reference period.
Reference: Employee Earnings and Hours,
Australia (Cat. no. 6306.0).
Equivalent income — disposable income adjusted,
using simplified Henderson equivalence scales, to
allow comparison between different types of
income units. The scales reflect assumptions about
how different characteristics e.g. size and
composition, relate to the amount of income
different types of income units need to achieve an
equivalent standard of living.
Reference: Income Distribution, Australia
(Cat. no. 6523.0).
Female/male ratio of mean total full-time adult earnings
Reference: Employee Earnings and Hours,
Australia (Cat. no. 6306.0).
126
•
ABS • AUSTRALIAN SOCIAL TRENDS • 4102.0 • 1999
Full weekly benefit income received by a couple with
two children — the maximum weekly social security
benefit (including family allowances) available to an
adult couple, with one child aged under 5 years and
one child aged between 5 and 13 years. Excludes
any rent assistance which may be available.
Reference: Commonwealth Department of Family
and Community Services, unpublished data.
Full-time employees — employees who usually work
35 hours or more a week, or the agreed hours of a
full-time employee.
Reference: Employee Earnings and Hours,
Australia (Cat. no. 6306.0).
GDP (gross domestic product) — an aggregate measure
of the value of economic production in a year. The
series used are the average (GDP(A)) based on
1989–90 prices and the income-based measure,
(GDP(I)) calculated using current prices. All GDP
figures refer to GDP(A) except where GDP(I) is
specified.
Reference: Australian National Accounts: National
Income, Expenditure and Product
(Cat. no. 5204.0).
GDP(I) spent on income support — special
appropriations under the Social Security Act 1991
for income support as a proportion of GDP(I).
Reference: Department of Social Security, Annual
Report.
Gini coefficient — an index for measuring inequality
of income distribution. The index, always between
0 and 1, is low for populations with relatively equal
income distributions and high for populations with
relatively unequal income distributions.
Reference: Income Distribution, Australia
(Cat. no. 6523.0).
Gross income — cash receipts, that are of a regular and
recurring nature, before tax or any other deductions
are made.
Reference: Income Distribution, Australia
(Cat. no. 6523.0).
Gross State product — a similar measure to GDP but
based on State income estimates.
Reference: Australian National Accounts: State
Accounts (Cat. no. 5220.0).
Household disposable income per capita — where
household disposable income, as measured in the
Australian National Accounts, is household income
less income tax and other direct taxes, fees, fines
etc. charged by the government, consumer debt
interest and transfers overseas. The population used
is the mean resident population for the financial
year.
Reference: Australian National Accounts: National
Income, Expenditure and Product
(Cat. no. 5204.0); Australian National Accounts:
State Accounts (Cat. no. 5220.0).
Income unit — one person, or group of related persons
within a household, whose command over income
is assumed to be shared. Income sharing is
considered to take place between married
(registered or de facto) couples, and between
parents and dependent children.
Reference: Income Distribution, Australia
(Cat. no. 6523.0).
Income — definitions and references
Labour market allowance recipients — the number of
recipients of Unemployment benefit prior to 1991;
Job Search allowance, Newstart allowance and
Youth Training allowance from 1991 to 1996;
Newstart allowance and Youth Training allowance
from 1997.
Reference: Commonwealth Department of Family
and Community Services, Commonwealth
Department of Family and Community Services
Customers: a statistical overview.
Main income source from government payments —
government pensions or allowances form the
largest component of usual income.
Reference: Income Distribution, Australia
(Cat. no. 6523.0).
Managerial employees — managerial, executive
and senior professional employees who are in
charge of a significant number of employees or
have significant responsibilities in the conduct or
operations of the organisation and who may not
receive payment for overtime.
Reference: Employee Earnings and Hours,
Australia (Cat. no. 6306.0).
Mean total weekly earnings — average total weekly
earnings of employees including ordinary time
earnings plus overtime earnings.
Reference: Employee Earnings and Hours,
Australia (Cat. no. 6306.0).
Mean weekly ordinary time earnings of full-time
non-managerial adult employees
Reference: Employee Earnings and Hours,
Australia (Cat. no. 6306.0).
Median weekly income — the level of weekly income
at which half the income units have higher
incomes and half have lower incomes.
Reference: Income Distribution, Australia
(Cat. no. 6523.0).
continued
Private final consumption expenditure per capita —
expenditure on goods and services by persons and
private non-profit institutions serving households.
Includes personal expenditure on motor vehicles
and other durable goods and the imputed rent of
owner-occupied dwellings. Excludes the purchase
and maintenance of dwellings by persons and
capital expenditure by unincorporated businesses
and non-profit institutions. Private final
consumption expenditure per capita data are
expressed in Australian dollars at constant 1989–90
prices and are based on the mean resident
population of each year.
Reference: Australian National Accounts:
National Income, Expenditure and Product
(Cat. no. 5204.0).
Share of gross/equivalent income going to top/bottom
quintile — share of gross/equivalent income
received by the 20% of income units with the
highest/lowest incomes.
Reference: Income Distribution, Australia
(Cat. no. 6523.0).
Wages and salaries as a main source of income —
wages and salaries form the largest component of
usual income.
Reference: Income Distribution, Australia
(Cat. no. 6523.0).
Wages, salaries and supplements as a proportion
of GDP(I) — includes wages, salaries and employer
contributions to superannuation, lump sum
workers compensation, termination and
redundancy payments.
Reference: Australian National Accounts:
National Income, Expenditure and Product
(Cat. no. 5204.0).
Ordinary time — employee's agreed hours of work
including annual leave, paid sick leave and long
service leave.
Reference: Employee Earnings and Hours,
Australia (Cat. no. 6306.0).
Single-parent payment recipients — lone parents
receiving the Parenting payment. In 1989, the
Supporting Parent benefit and Class A Widow
pensions were combined to form the Sole Parent
pension. Figures prior to 1989 include these two
pensions. In March 1998 Parenting payment was
introduced and the Sole Parent pension became
known as Parenting payment (single).
Reference: Commonwealth Department of Family
and Community Services, Commonwealth
Department of Family and Community Services
Customers: a statistical overview.
Personal income tax as a proportion of taxable
income — net income tax levied on individuals
(including the Medicare levy minus rebates and
other credits) expressed as a percentage of taxable
income (i.e. gross income or profits minus
allowable tax deductions).
Reference: Australian Taxation Office, Taxation
Statistics; Government Finance Statistics,
Australia: Concepts, Sources and Methods (Cat.
no. 5514.0).
ABS • AUSTRALIAN SOCIAL TRENDS • 4102.0 • 1999 •
127
Income sharing and
income distribution
I N C O M E D I S T R I B U T I O N
Contributed by: Gerry Redmond, Social Policy Research Centre, The University of New South Wales
The choice of sharing
unit has some impact
on the degree of
measured inequality.
Generally, estimates of
inequality decrease as
the scope of the
sharing unit is
expanded.
Cash income is widely used as a measure of
living standards. This is because income is
used to meet day-to-day living expenses, and
provides the basis for increasing wealth and
purchasing more substantial goods and
services (such as household furnishings, cars,
and holiday trips). Although income is mostly
obtained by individuals, it is often used to
support others, particularly family members
with whom the individual lives. The
understanding that income is shared
underpins studies of how resources are
distributed in the community and assists with
identifying groups of people who may be in
need of income support (see Australian
Social Trends 1998, Poverty: different
assumptions, different profiles, pp. 125–129).
However, there is some debate among
income policy analysts as to the best choice of
unit that should be used. This review
illustrates possible choices of sharing units
and how these choices affect measurements
of the distribution of income within the
population overall and within the growing
number of family households maintaining
children who have completed their education.
Selecting a sharing unit
The choice of sharing unit for the provision of
social security benefits and, more generally,
for the analysis of income distribution is made
on the basis of assumptions about sharing.
Issues associated with sharing assumptions
and the choice of sharing units can be
illustrated by describing a hypothetical
household in which there are a variety of
relationships. The example involves a
seven-member household comprising a
married couple, their employed daughter, her
friend who is a boarder in the house, another
daughter who is aged 20 and a full-time
student, and the husband's parents (or
daughters' grandparents).
It could be assumed that the entire household
is a sharing unit – that is, all household
members pool their incomes. This may be
true to the extent that they all avail
themselves of the same household facilities
and domestic appliances, and may also share
other expenses. However, it is arguable that
other goods and services enjoyed by
individuals (e.g. spending on personal items
such as clothing, or the use of a car) will be
purchased according to family incomes.
Accordingly, it could be assumed that
individuals in the family unit comprising the
couple and their two daughters are likely to
share things among themselves, but not so
much with the individuals in the family unit
comprising the grandparents. In this case the
family unit (defined narrowly) may be seen as
the most appropriate sharing unit.
An example of a household with different sharing unit types
Households
Families
Single people
Income units
Couple with dependent
children income unit
Wife, husband and student
Couple family with children
Wife, husband, employed
daughter and student daughter
One-person income unit
Employed daughter
Sample
Household
Two families
with a boarder
Couple-only family
Grandmother and grandfather
Couple-only income unit
Grandmother and grandfather
Non-family household member
Boarder
One-person income unit
Boarder
Source: Based on a diagram presented in A Provisional Framework for Household Income, Consumption, Saving and Wealth, 1995 (Cat. no. 6549.0).
ABS • AUSTRALIAN SOCIAL TRENDS • 4102.0 • 1999
•
129
INCOME DISTRIBUTION
There are four income units in the household,
as shown in the diagram. Here, the family unit
consisting of the couple with two daughters is
split into two income units, the first
containing the couple and the student
daughter, who is a dependent child of the
couple, and the other containing the
employed daughter, who is a non-dependent
child. It is certainly possible to argue that the
employed daughter may have a higher
standard of living than the student daughter
to the extent that she may have more income
which she spends on herself, or may enjoy
more holidays or entertainment, and so on.
Many analysts argue that the income unit,
which comprises parent(s) and dependent
children only, is the most appropriate sharing
unit in the study of living standards, for two
reasons: first, it seems safest to assume that
the closer the relationship between
household members the more likely it is that
income will be shared1,2, and second, the
income unit is recognised by government
agencies as a unit of sharing. That is, in
assessing entitlement to some income tax
reliefs and to social security benefits (such as
unemployment benefits), the government
assumes that income is shared within the
income unit.
Each of the sharing units discussed above has
some validity, although it is possible to devise
other sharing units. For example, it could be
argued that in the case of the household
discussed above, the couple and their
children may share resources to a
considerably greater extent with the couple's
parents than with the boarder. At the other
extreme, some research has shown that
sharing between couples, or between couples
and their dependent children, cannot be
automatically assumed to take place.3
In practice, the choice of sharing unit is
governed by the concerns of policy (how the
unit is defined for social security or tax
purposes), convenience (according to
information available in the survey data) and
convention (in line with how other analysts
define the sharing unit).
Income distribution among
households, families and income
units
One commonly used measure of income
inequality is the share of total income
received by people in different income
quintile groups. If there were no inequality,
then the people in each quintile group would
each receive 20% of total income. To facilitate
comparisons in this analysis (both within and
130
• ABS • AUSTRALIAN SOCIAL TRENDS • 4102.0 • 1999
Sharing units
A sharing unit is defined as a group of people
who live together in a household who share
resources so that they all have the same standard
of living. The following standard ABS concepts are
used in this review to illustrate different sharing
unit types.
A household is a person living alone or a group of
related or unrelated people who usually reside
and eat together.
Family units contain two or more people related
by blood, marriage (registered or de facto),
adoption, step or fostering, who live in the same
household. A family unit cannot contain more
than one couple relationship or a couple
relationship plus a lone parent/child relationship.
Some households will, therefore, contain more
than one family.
Income units (sharing units used for
disseminating ABS income statistics) are based on
partner and specific parent/child relationships.
Partners (married or defacto) are assumed to be
interdependent, and children aged under 15 years
plus older full-time students (defined as
dependent children) are assumed to be
dependent on parents. Non-dependent children,
and others not having any of the above
relationships within a household, are recognised
as single-person income units.
Dependent children are those aged less than 15
years, or 15–24 and both studying full-time and
living with parent(s) and who do not have a
spouse or offspring of their own living with them.
Non-dependent children are those living with
parent(s) who do not have their own spouse or
offspring and are aged 25 or more or are aged
15–24 and are not studying full-time.
Measuring income
Income is gross income (that is, income before
taxes are deducted). Per capita income is the
total income of the sharing unit divided by the
number of people (adults and children) in the
sharing unit.
Income quintiles are formed by ranking all
sharing units in ascending order by level of per
capita income, and then dividing them into five
groups, each containing 20% of all people in the
population.
between types of sharing unit), incomes
within any sharing unit type are measured at
the per capita level.
In Australia in 1995–96, people in the bottom
quintile of the income distribution received
5.3% of all incomes if sharing among
individuals within income units is assumed.
Those in the second lowest quintile received
10.2%, while those in the top quintile
INCOME DISTRIBUTION
Income received by people(a) in different per capita quintiles of income
distribution in 1995–96 by sharing unit type
Income quintile
Lowest 20%
Second
Share of total income
Average per capita income
Income
units
Families and
single people(b) Households
Income
units
Families and
single people(b)
Households
%
%
$
$
$
%
5.3
5.9
6.0
81
89
91
10.2
10.6
10.9
155
161
163
Third
14.8
15.5
15.6
224
234
237
Fourth
23.6
23.3
23.3
355
354
353
Highest 20%
Total
46.1
44.7
44.3
703
678
671
100.0
100.0
100.0
303
303
303
(a) Per capita income of all people, including children and adults.
(b) Includes persons living alone, individuals in group households and non-family members living with families which are all
treated as separate sharing units.
Source: Unpublished data, Survey of Income and Housing Costs, 1995–96.
($91 compared to $671) – with the top
quintile being only 7.4 times higher than the
bottom.
received 46.1% of total income. While the
distributions are similar if sharing among
individuals within families, or among
individuals within households is assumed,
estimates of inequality decrease as the scope
of the sharing unit is expanded. Thus, income
shares were higher for people in the bottom
three quintiles of the income distribution if
sharing within households, rather than
income units, is assumed. Income shares
were correspondingly lower for people in the
top two quintiles if sharing is assumed to take
place within households.
Changes in living arrangements
Monitoring the circumstances of people with
low incomes in particular life situations
(school leavers, one-parent families, older
people who have retired) and how they live,
whether on their own or with others, is
important from a social policy perspective
because it provides information on how
support might best be targeted.
The lower level of income inequality when
larger sharing units are assumed can also be
seen by comparing average per capita
incomes of people in the lowest and highest
quintiles using different sharing assumptions.
When comparing income unit incomes, the
average per capita income of those in the
highest income quintile ($703) was 8.7 times
higher than those in the bottom quintile
($81). In contrast, when using households as
the sharing unit, the differences were smaller
More generally, changes in living
arrangements over time may indicate changes
in the way people share their resources. For
example, if the proportion of people living in
multi-income unit households (like the one
given in the earlier example) was increasing,
choosing income units to identify people in
relative poverty might be less relevant, simply
because the opportunity for people to share
resources with family or household members
will have increased. If, on the other hand, the
proportion of people living in single-income
Distribution of people by living arrangements, 1981–82 and 1995–96
1981–82
Household type
Households with:
Households with:
One
Two or more Total
income unit income units households
One
income unit
Two or more
income units
Total
households
%
%
%
%
Single family households 62.4
Other households
Total
1995–96
%
%
22.0
84.4
61.6
21.6
83.2
7.5
8.1
15.6
9.3
7.6
16.8
69.9
30.1
100.0
70.8
29.2
100.0
Source: Unpublished data. Income and Housing Survey, 1981–82; Survey of Income and Housing Costs, 1995–96.
ABS • AUSTRALIAN SOCIAL TRENDS • 4102.0 • 1999
•
131
INCOME DISTRIBUTION
unit households increased, the opportunities
for sharing resources will have decreased.
Differences in the sharing assumptions would
clearly be less relevant if more people were to
live in households with only one income unit,
since for these people income unit, family,
and household are the same.
Information from income surveys conducted
in 1981–82 and 1995–96 indicates that there
has been little change through the 1980s and
1990s in the distribution of people living in
different household types when classified
according to different types of sharing unit. In
both years, about seven in ten people lived in
single-income unit households, mostly as
single-family income units. Therefore, the
proportion of people living in households
with more than one income unit, for whom
various assumptions might be made about
sharing, was roughly the same in both years
(about three in ten). Some of these people
lived in group households or households with
more than one family. However, in both
years, most of the people in multi-income
unit households lived in single-family
households (typically families with
non-dependent children). People in
single-family households with more than
two income units comprised 22% of the
population in both 1981–82 and 1995–96.
Taken together, this information suggests that
the choice of sharing unit will have had little
effect when measuring changes in income
distribution over the last decade (the relative
number of different types of sharing units
remained much the same).
There have, nevertheless, been changes in
living arrangements not so apparent from the
sharing unit types commonly used for
analysis. For example, it is known that more
older children, including those aged 25 years
and over, are living in the family home in the
1990s (for changes in proportions of older
children living with their parents see
Australian Social Trends 1999, Family —
national summary table, p. 28), which
suggests that there has been an increase in
Comparisons over time
The comparisons provided in this review are
based on information obtained from the Income
and Housing Survey, 1981–82, and the 1995–96
Survey of Income and Housing Costs.
Comparisons between the two surveys have been
enabled by adjusting for various differences in the
available data. These adjustments included:
standardising the definition of dependants;
excluding the income of dependent children from
the income of the respective sharing unit types;
setting negative incomes to zero; and making
comparisons on the basis of current gross income,
rather than other measures of income available
from the respective sources. Although after-tax
income comparison would be desirable, data
limitations from these sources prevent that.
the proportion of people living in
single-family multi-income unit households.
However, as shown, the overall proportion of
multi- income unit families has remained
stable.
The anomaly relates to the fact that children
aged 15–24 years are increasingly likely to be
classified as dependants (that is, belonging to
a family income unit) rather than
non-dependent children (or single-income
units) because children of this age have been
staying in full-time education longer. In
1995–96, 50% of 15–24 year olds living with
their parents were classified as dependants,
compared with 39% in 1981–82.
Effect of sharing assumption within
single family households
The changing circumstances of youth, and
their financial dependency on parents, has
been a matter of social policy review.4 It is in
this context that is useful to examine how
different sharing assumptions have affected
per capita incomes of families with
non-dependent children (those not
considered to be sharing income) over the
1980s and 1990s.
Average income of people in single family households with non-dependants by sharing assumption,
1981–82 and 1995–96
1981–82
Per capita income of
each unit – no sharing
between units
Income unit type
$ per week
1995–96
Per capita income of
household members Per cent
after sharing
Difference
Per capita income of
each unit – no sharing
between units
Per capita income of
household members
after sharing
Per cent
Difference
$ per week
%
$ per week
$ per week
%
Primary income unit(a) 161
170
+5.6
343
341
–0.6
Non-dependants
170
–8.1
341
341
0.0
185
(a) Comprises income units containing the parent(s) of the non-dependant(s).
Source: Unpublished data.Income and Housing Survey, 1981–82; Survey of Income and Housing Costs, 1995–96.
132
• ABS • AUSTRALIAN SOCIAL TRENDS • 4102.0 • 1999
INCOME DISTRIBUTION
For this purpose, income units in these
households are divided into two groups:
income units containing the parent(s)
(defined as primary income units); and those
made up of non-dependent children.
In 1981–82, if sharing only among income
units is assumed, the average weekly per
capita income of people (parents and
dependants) living in primary income units
was $161, and the average income of
non-dependent income units was $185. If
equal sharing among all people in these
households is assumed, the average per capita
income was $170. Therefore, the per capita
incomes of non-dependants made a positive
contribution to the per capita incomes of the
family.
Between 1981–82 and 1995–96, primary
family income unit per capita incomes rose
from $161 per week to $343 per week. In
other words, they more than doubled
(up by a factor of 2.1). Aside from the general
inflationary increase in incomes, this increase
will, in part, be associated with factors such as
the increased participation of older women in
the workforce. In contrast, the income of
non-dependants did not increase to the same
extent (rising from $185 to $341, up by a
factor of 1.8). This trend reflects the relative
decline of young people's earnings in relation
to adult earnings (see also Australian Social
Trends 1997, Youth income, pp. 121–124).
As a result, the per capita incomes of
non-dependants did not increase family per
capita incomes. In contrast to 1981–82, the
average contribution of non-dependent per
capita incomes to household per capita
incomes in 1995–96 was largely neutral. The
findings indicate that the choice of sharing
unit has less effect on per capita incomes in
the mid 1990s than the early 1980s.
Thus, it appears that a relative decline in the
incomes of young people has coincided with
an increasing likelihood that they will remain
longer in the family home. This factor,
combined with increasing incomes among the
parents of young adults, suggests that the
nature of sharing within families may be
changing. In the analysis of income
distribution in Australia, it is important to
consider the likely impact of these changes,
and to constantly reassess assumptions about
sharing within households, families and
income units.
Endnotes
1 Australian Bureau of Statistics 1995, A
Provisional Framework of Household Income,
Consumption, Saving and Wealth,
Cat. no. 6549.0, ABS, Canberra.
2 Saunders P. 1994, Welfare and Inequality:
National and International Perspectives of the
Australian Welfare State, Cambridge University
Press.
3 Edwards M. 1982, 'Financial arrangements made
by Husbands and Wives: Findings of a Survey',
Australian and New Zealand Journal of
Sociology, vol. 18, no. 3, pp. 320–338.
4 Schneider J. 1999, 'The Increasing Financial
Dependency of Young People on their Parents',
Discussion paper No. 96, Social Policy Research
Centre, University of New South Wales.
ABS • AUSTRALIAN SOCIAL TRENDS • 4102.0 • 1999
•
133
Lower income working
families
I N C O M E
D I S T R I B U T I O N
Families with relatively low living standards
are of concern to government and
non-government organisations that aim to
minimise the effects of relative poverty on the
wellbeing of families. Low income is
commonly associated with people who do not
have jobs and who are consequently largely
dependent on pensions and benefits provided
by the social security system. However, there
are also working families with low income
whose resources are supplemented by
government and welfare organisations.
Identifying the types of families with relatively
low living standards (measured using income)
and their employment characteristics provides
insights into those families in greatest need of
support.
Lower income working
families are typically
families with one
earner and young
children. Many of them
are also families with
less skilled workers.
One commonly used method to identify
families likely to have relatively low living
standards is to examine those with relatively
low incomes. By ranking families according to
their equivalent income (see box) and
selecting those at the bottom of the
distribution, the circumstances of those with
limited economic resources can be compared
with those who are better off. In this review,
those in the lowest two quintiles (40%) of the
equivalent income distribution are compared
with those at the higher end of the
distribution.
In 1996–97, 30% of all families (excluding
those with business interests) received a
government pension or benefit as their largest
single source of income. Most (86%) of these
families had an equivalent income which
placed them in the lowest two quintiles (40%)
Families(a) in equivalent income quintiles, by principal source
of income, 1996–97
Lower income
Medium to high income
First
Third
Second
Fourth
Total
Fifth
Principal
source of income
'000
'000
'000
'000
'000
'000
Wages and salary
138.4
331.4
562.8
710.8
729.4
2 472.8
Government pensions
and allowances
581.7
426.3
143.6
24.2
**
1 176.5
52.3
29.8
83.9
54.8
59.9
280.8
772.5
787.5
790.3
789.7
790.1
3 930.0
Investments(b)
Total
(a) Excludes all families with business interests.
(b) Includes income from superannuation.
Source: Unpublished data, Survey of Income and Housing Costs, 1996–97.
134
• ABS • AUSTRALIAN SOCIAL TRENDS • 4102.0 • 1999
Identifying lower income families
This analysis is based on income data collected
by the ABS in the Survey of Income and Housing
Costs, 1996–97.
Families (actually family income units) are
defined as a group of related persons within a
household whose command over income is
assumed to be shared. Income sharing is
assumed to take place between married
(registered or de facto) couples, and between
parents and dependent children.
Because stated business income does not
necessarily reflect living standards, family income
units including a partner who has business
interests have been excluded.
Dependent children are those aged less than
15 years, or 15–24 and both studying full-time
and living with parent(s) and who do not have a
spouse or offspring of their own living with them.
Working families have been defined as those
whose principal source of income came from
wages and salaries (excluding families with
business interests). Lower income working
families are those whose income fell in the two
bottom equivalent income quintiles (lowest 40%)
for all families. Medium to high income working
families are those whose income fell in the top
three equivalent income quintiles for all families.
Principal source of income is that source from
which most income is received. This can
represent less than 50% of income.
Principal earner in a couple is the partner who
earned the most income from wages and salary.
Equivalent income
Lower income families have been identified on
the basis of their equivalent income rather than
actual income. Equivalent income adjusts actual
income on the basis of the income unit's
characteristics, such as size and composition, to
allow the standard of living of different family
types to be compared. For example, this adjusts
for the difference that would exist in the standard
of living between a couple with children and a
couple without children who both receive the
same combined income. Henderson Equivalence
Scales have been used (for further information
see Australian Social Trends 1998, Poverty:
different assumptions, different profiles, pp.
125–129).
INCOME DISTRIBUTION
Family type profile of working families, 1996–97
Lower income
Family type
Couple only
Medium to high income
Number
of
Families
Average
family size
Average
weekly
gross
income(a)
'000
persons
$
2.0
398
83.4
Proportion
with one
earner
Number
of
Families
Average
weekly
Average
gross
family size income(a)
Proportion
with one
earner
%
'000
persons
$
%
2.0
1 189
87.8
866.2
28.1
Reference person aged under 45
26.9
2.0
437
86.7
359.0
2.0
1 296
11.7
Reference person aged 45 or over
56.5
2.0
380
88.4
507.2
2.0
1 113
39.8
362.6
4.3
617
78.0
1 021.9
3.9
1 276
29.9
Couple with dependants
Youngest child aged 0–4 years
219.5
4.4
621
82.7
374.7
3.9
1 178
45.9
Youngest child aged 5–9 years
79.6
4.5
629
76.5
238.0
4.1
1 272
27.2
Youngest child aged 10–24 years
63.5
3.9
591
63.5
409.1
3.6
1 369
16.8
23.9
2.9
459
100.0
114.9
2.4
714
100.0
469.8
3.8
570
80.9
2 002.9
3.0
1 206
33.2
One-parent families
Total working families
(a) Average income before adjusting for different family size and composition.
Source: Unpublished data, Survey of Income and Housing Costs, 1996–97.
of the income distribution of all families.
However, also among those in the lowest
two quintiles of the equivalent income
distribution were 470,000 working families
(families whose principal source of income
was from wages and salaries). These families
represented 12% of all families (excluding
those with business interests) and 30% of
those in the lowest two quintiles of the
income distribution of all families.
Mainly one-earner families with
young children
The level of earnings from paid work can be
related to a person's age and work
experience, as well as a range of other factors.
Within families, involvement in paid work
(especially for mothers) can also be limited by
the need to care for young children. Because
limited work experience and early child
rearing often coincide, their combined impact
on the family's income can be substantial. In
1996–97, just over half (52%) of lower income
working families had only one employed
partner and a youngest child aged under
10 years.
As well as having a younger age profile,
families with low equivalent income were
larger than those with medium to high
income (an average of 3.8 people compared
to 3.0 people). This reflects the fact that larger
families tended not to have the higher income
needed to support the same standard of living
as smaller families.
Altogether, just over three quarters (77%) of
lower income working families were couple
families with dependent children – in 61% of
these families the youngest child was under
5 years old. In contrast, couple families with
dependent children represented 51% of
medium to high income working families –
in 37% of these families the youngest child
was under 5 years old.
Involvement of both partners in paid work is
becoming the social norm (see Australian
Social Trends 1997, Families and work,
pp. 30–33). Overall, 78% of lower income
working families with dependent children had
only one partner working, compared to 30%
of medium to high income working families
with dependent children. Lower income
working families whose youngest dependent
child was under 5 years old were least likely
to have two earners (17%), while those
families in which the youngest dependent
child was aged 10–24 years were most likely
to have two earners (36%).
Couple-only working families were generally
less likely to have lower equivalent incomes.
Couple-only families comprised 18% of lower
income working families compared to 43% of
medium to high income working families.
Once again, those couple-only working
families with lower income, predominantly
had only one earner (88%) whereas among
families that were in the medium to high
income group, two earner families
predominated (72%).
ABS • AUSTRALIAN SOCIAL TRENDS • 4102.0 • 1999
•
135
INCOME DISTRIBUTION
Distribution of employment arrangements in working families, 1996-97
Lower income
Working arrangements
One earner
Medium to high income
Couple only
Couple with
children
One-parent
family
Couple only
Couple with One-parent
children
family
%
%
%
%
%
%
87.8
78.0
100.0
28.1
29.9
100.0
Full-time
68.1
69.3
62.4
25.7
28.8
70.5
Part-time
19.8*
8.7
37.6
2.4
1.2
29.5
Two earners(a)
12.2*
22.0
..
71.9
70.1
..
..
48.7
30.4
..
100.0
100.0
100.0
100.0
Both full-time
5.8*
Total
100.0
4.9*
100.0
(a) Includes those families in which one or both partners worked part-time.
Source: Unpublished data, Survey of Income and Housing Costs, 1996–97.
Among couple-only working families, those
with lower incomes tended to be older than
those with medium to high incomes. Of those
with lower incomes, 68% were couples in
which the reference person was aged 45 years
or older, while among medium to high
income earners, the proportion was 59%.
Lone parents who were working and had
lower equivalent incomes were slightly more
likely to be working part-time (38%) than lone
parents who had medium to high equivalent
incomes (30%). They also tended to have
more children (an average of 1.9 compared
with 1.4).
Occupation, by skill level(a), of principal earner in working
families, 1996-97
Skill level (occupation groups)
Lower
income
Medium to
high income
%
%
Skill level 1:
(Managers and administrators, professionals)
13.9
32.8
Skill level 2:
(Associate professionals)
10.1
14.9
Skill level 3:
(Tradespersons & related workers, advanced
clerical and service workers)
26.7
19.2
Skill level 4:
(Intermediate clerical, sales & service workers
intermediate production and transport workers)
28.5
22.8
Skill level 5:
(Elementary clerical, sales and service workers,
labourers & related workers)
20.9
10.4
100.0
100.0
Total
(a) Skill level as classified in the Australian Standard Classification of Occupations
(ASCO) 2nd edition.
Source: Unpublished data, Survey of Income and Housing Costs, 1996–97.
136
• ABS • AUSTRALIAN SOCIAL TRENDS • 4102.0 • 1999
What jobs do they do?
People working in high-skill jobs generally
earn more income than those in less-skilled
jobs. As might be expected, principal earners
in lower income working families were more
likely to be working in less-skilled jobs than
those in higher income working families.
Nearly half (49%) of principal earners in
lower income working families had
occupations that are classified in the lowest
two skill occupation groups (skill levels 4
and 5). These occupations comprise
intermediate and elementary clerical, sales or
service workers; intermediate production and
transport workers; and labourers and related
workers. Only a small proportion (14%) of
principal earners in lower income working
families had occupations that were in the
highest skill level (level 1, which comprises
managers, administrators and professionals).
In comparison, a third (33%) of principal
earners in medium to high income working
families had occupations in the lowest
two skill levels. A further third (33%) of
principal earners in medium to high income
working families had occupations in the
highest skill level.
Sources of income other than
wages and salaries
Most working families had sources of income
other than wages and salaries. Among lower
income working families, 77% received some
income from government allowances,
compared to 39% of medium to high income
working families.
The majority (90%) of lower income working
families with dependent children received
income support through the social security
INCOME DISTRIBUTION
Government income support for lower income working families, 1996–97
Receiving income support
Proportion
receiving
income
support
Average
weekly
gross
income
Share of
income from
support(a)
Average
weekly gross
income of
those not
receiving
support
Total
Family type
%
$
%
$
Couple only
17.9*
372*
28.0*
404
'000
83.4
Reference person aged under 45
25.2*
384*
31.0*
455
26.9
Reference person aged 45 or over
14.4*
362*
25.4*
383
56.5
90.5
625
13.3
547
362.6
Couple with dependants
With one dependant
84.3
506
9.9
492*
80.2
With two dependants
91.0
600
11.0
562*
153.2
With three or more dependants
93.6
719
16.8
607*
129.2
One-parent families
73.5*
475*
17.9*
415*
23.9
Total lower income working families
76.7
607
13.8
450
469.8
(a) Proportion of gross income received as government pensions and allowances.
Source: Unpublished data, Survey of Income and Housing Costs, 1996–97.
system. The most common types of income
support received were family assistance
payments and the Parenting Payment. Larger
families were more likely to receive support
than smaller families. Among families with
one dependent child, 84% received
government income support which
represented an average of 10% of their
income. Among families with three or more
Income support for working families
with dependent children
The Department of Family and Community
Services (formerly Social Security) administers a
range of schemes which, subject to income and
assets tests, provide financial support to
individuals and families.1 The 1996–97 Income
and Housing Costs Survey found that family
assistance payments and the Parenting Payment
were those most commonly received by working
families.
Family assistance payments comprise a number
of payments made to help with the costs of
bringing up children. These include Family
Payment, Family Tax Payment, and Maternity
Allowance. Most families are entitled to Family
Payment at the minimum rate. However, those
with low incomes and those receiving other social
security pensions and benefits receive a rate
greater than the minimum.
Parenting payment gives an independent source
of income to the partner who is not in paid work,
or only getting a low income and mainly cares for
the children. It provides increased choice for
parents in balancing work and family
responsibilities.
dependent children, 94% received
government income support which
represented an average of 17% of their
income.
Although a smaller proportion of lower
income working couples without dependants
received government income support (18%),
the contribution it made, on average, to their
income was greater (28%).
In 1996–97, 74% of working lone-parent
families received income support from family
assistance through the social security system.
In addition, 23% of working lone-parent
families received income from a sole-parent
pension.
A small proportion of low-income working
families with dependent children were not
receiving government income support at the
time of the Survey. For these families, their
average gross weekly income was lower than
that for families receiving support. This could
be because of recent changes in the financial
or family circumstances of some families in
either group. For example, some of the
families not receiving income support may
recently have had their first child, or may not
yet have applied for government support after
a recent drop in their income. In some
families the children may have been outside
the eligibility age range.
Endnotes
1 Department of Social Security 1996, DSS
Customers: a Statistical Overview, DSS,
Canberra.
ABS • AUSTRALIAN SOCIAL TRENDS • 4102.0 • 1999
•
137
Economic resources
of older Australians
I N C O M E
The comparatively low
average income of
older Australians
reflects their
widespread reliance on
government pensions
for most of their
income.
D I S T R I B U T I O N
As with other members of the community,
the economic wellbeing of older persons
depends mainly on their regular income, and
how well this covers their living expenses.
Most people aged 65 and over are dependent
on government income support payments,
such as the age or service pension, or sources
other than wages or salaries for most of their
income.
Measuring income resources
This article uses data from the 1996–97 Survey of
Income and Housing Costs which collected data
on the sources and levels of cash income received
by Australian households. The Survey did not
collect information about people living in nursing
homes, hospitals, hostels and institutions.
Income unit is one person, or a group of related
persons within a household, whose command
over income is assumed to be shared. Income
sharing is considered to take place between
partners in a couple relationship, and between
parents and their dependants. In this review, the
very small number of one-parent units have been
included with one-person units.
The 1996–97 Survey of Income and Housing
Costs provided information about the
financial circumstances (levels and sources of
income) of people living in private dwellings.
Among the 2.3 million people (excluding
children) who formed income units in which
the reference person was aged 65 years or
older, 1.4 million were living with a spouse
(in 691,600 couple units) and 0.9 million
were living alone.
Older income units are those where the
reference person is aged 65 years or more.
Net income is gross cash income after income
taxes and the Medicare levy have been deducted.
Level of income
In 1996–97, the average gross weekly income
was $242 for older one-person income units
and $481 for older couple income units. This
was considerably lower than for most other
population groups, mainly reflecting their low
labour force participation. For example, in
1996–97, the average weekly income of all
couple units was $890 and of all one-person
units, $391.
The income distribution of older one-person
units was very concentrated, with 60% having
income in the range of $150–$224 per week.
Housing costs comprise housing loan payments
(principal and interest), council and other rates,
and rent payments.
This concentration is associated with the large
proportion of older one-person income units
who were dependent on the age or service
pension.
The distribution of income among older
couples covered a wider range than among
older one-person units, partly reflecting their
slightly more diverse sources of income.
Gross weekly income distribution, 1996–97
Older income units
Gross weekly income ($)
Couples
One-person
All older
income units
All income units
%
%
%
%
Less than 150
2.5*
6.0
4.4
7.2
150–224
3.3
60.3
35.0
14.5
225–299
24.4
18.5
21.1
9.5
300–374
27.0
6.7
15.7
8.6
375–449
13.5
1.7*
6.9
7.4
450 and over
29.4
6.9
16.9
52.8
100.0
100.0
100.0
100.0
'000
'000
'000
'000
691.6
870.3
1 561.9
9 083.3
Total
Total income units
Source: Unpublished data, Survey of Income and Housing Costs, 1996–97.
138
• ABS • AUSTRALIAN SOCIAL TRENDS • 4102.0 • 1999
INCOME DISTRIBUTION
Older income units by principal source of cash income,
1996–97
Couples
One-person
Total
%
%
%
Wages and salaries or own business
8.1
Government cash benefits
1.9*
64.9
81.3
4.7
74.1
Superannuation
11.6
6.6
8.8
Interest, rent and dividends
14.6
9.0
11.5
100.0
100.0
100.0
'000
'000
'000
691.6
870.3
1 561.9
Total
Total
Source: Unpublished data, Survey of Income and Housing Costs, 1996–97.
Nevertheless, compared with all income units,
there was still a high level of concentration at
the lower end of the income distribution. Just
over one half (51%) of older couple units
received income in the range of $225–$374
per week.
Sources of income
Most older people are not in paid
employment. In 1996–97, only 6% of the
population aged 65 and over were employed
– 10% of males and 3% of females – and half
of these worked part-time.1
At that time, the majority (87%) of older
income units living in private dwellings
received some cash income from government
pensions and allowances. This formed the
main source of income for 74% of older
Proportion of older income units
whose principal source of income was
from government cash benefits,
1996–97
Couples
One-person Total
Age of reference
person (years)
%
%
%
65–69
57.6
77.8
66.0
70–74
66.7
78.2
73.0
75–79
69.7
82.6
77.2
80–84
73.7
87.1
83.4
85 and over
78.2
84.0
82.5
Total
64.9
81.3
74.1
'000
'000
'000
691.6
870.3
1 561.9
Total
Source: Unpublished data, Survey of Income and Housing
Costs, 1996–97.
income units. Older one-person income units
were more likely to be receiving cash income
from this source than older couples (81% and
65% respectively).
Dependency on government cash benefits
increased with age. This was particularly the
case for couples, with 58% of 65–69 year old
couple units whose principal source of
income was from government cash benefits,
compared to 78% of couple units aged
85 years and over.
Despite this high dependency on government
cash benefits, a considerable number of older
income units live on private income. In
1996–97, approximately 8% of older couples
were mainly dependent on income from
employment in the form of wages and salaries
or business income. A further 12% were
mainly dependent on superannuation and
annuities, and 15% were mainly dependent
on property income in the form of interest,
rent or dividends. While 7% of older
one-person units relied mainly on income
from superannuation and 9% from property
income, a very small proportion relied on
employment income.
Over the coming decades, the effects of the
current compulsory superannuation
arrangements should increase the proportion
of persons of pension age funding their
retirement (see Australian Social Trends
1994, Retirement Income, pp. 143–146).
Comparison of living standards
The average income of older income units is
relatively low compared to those aged under
65. However, with fewer dependants to
support, reduced costs associated with going
to work, lower income tax and lower housing
costs, many of their expenses are also lower.
If gross cash income is used as a proxy for
living standards, it is more appropriate to
compare average incomes for units of similar
size. Using this comparison, the average
weekly cash income in 1996–97 for older
couples without children present was 52% of
that for couples under 65 years without
children present. Older one-person units
received 57% of the average gross weekly
income of one-person units under 65.
However, these differences in gross income
between older income units and those under
65 were not as large when net (i.e. after-tax)
income is compared. As a result of the small
amount of tax paid by many older units,
average net income for older couples without
children present was 60% of that of couples
under 65 years without children present.
ABS • AUSTRALIAN SOCIAL TRENDS • 4102.0 • 1999
•
139
INCOME DISTRIBUTION
Income of older income units relative to that of income units
aged under 65(a), 1996–97
Couples
without children
One-person
%
%
Gross income
52.1
56.5
Net (after tax) income
60.4
66.8
Net income after housing costs
67.0
73.0
Assets
(a) Average income of older income units as a percentage of average income of younger income
units of the same type.
Source: Unpublished data, Survey of Income and Housing Costs, 1996–97.
Older one-person units received an average
net income of 67% of that of one-person units
aged under 65.
Older income units have high rates of home
ownership. Consequently, they generally have
much lower housing costs than younger
income units, who are often paying
considerable sums of money in mortgage
repayments, or paying dwelling rents at
market rates.
Other older income units with relatively low
housing costs are tenants of public housing
(9% of older one-person units in 1996–97)
and non-standard accommodation such as
living with relatives (10%).
To allow for the effects of different levels of
housing costs, net income is often compared
after housing costs have been deducted.
Using this income measure, the position of
older income units relative to younger units
Older income units by housing tenure,
1996–97
Housing tenure
OneCouples person
Total
%
%
%
Owner
With mortgage
Without mortgage
improves considerably. In 1996–97, the
average net income after deducting housing
costs for older couples without children
present was 67% of that for couples under 65
years without children present. Older
one-person units had an average net weekly
income after housing costs of 73% of that of
one-person units aged under 65.
4.9
2.7
3.7
84.1
66.9
74.5
9.0
6.2
The ownership of assets confers advantages
on owners, as such assets may be sold or
borrowed against to finance an increase in
consumption. For most older income units,
the major part of their assets are tied up in
their homes. The average value of equity of
home owners in the older age group was
$155,100 in 1995–96 (see Australian Social
Trends, 1998, Wealth in the family home,
pp. 154–156).
Some older income units own other property
and financial assets, such as those whose
main source of income is from interest, rent
or dividends, or from superannuation and
annuities. There are little official data
available on the value of these types of assets
for the Australian population.
Income in kind
Living standards are determined not only by
cash income and asset holdings. For some
people, the value of in-kind and other indirect
benefits can provide for a substantial
improvement in economic wellbeing. For
example, older persons are more likely to
benefit from government expenditure on
health services provided at little or no cost to
the user, (see Australian Social Trends, 1996,
Household income redistribution,
pp. 117–120).
Many older people also receive substantial
levels of non-cash assistance through
pensioner concessions, subsidies and rebates
provided by the Australian government, State
and local governments and government
business enterprises. However, quantifying
the value of these benefits to income units is
difficult because of lack of data.
Renter
Public
2.5*
Other
4.6
11.5
8.4
Other tenure
3.9
9.8
7.2
100.0
100.0
100.0
'000
'000
'000
691.6
870.3
1 561.9
Total
Total
Source: Unpublished data, Survey of Income and Housing
Costs, 1996–97.
140
• ABS • AUSTRALIAN SOCIAL TRENDS • 4102.0 • 1999
Endnotes
1 Australian Bureau of Statistics 1998, Year Book
Australia 1998, Cat. no. 1301.0, ABS, Canberra.
Expenditure on gambling
E X P E N D I T U R E
In 1996–97,
expenditure on
legalised gambling
in Australia was
$10 billion. This
represented 3% of
household disposable
income, almost double
the proportion (1.6%)
spent on gambling in
1972–73.
Gambling in some form has long been a part
of the Australian lifestyle. Two-up games have
traditionally formed a part of Anzac Day
celebrations and the entire country practically
stops for a horse race (Melbourne Cup) each
year. Estimates of participation in gambling
for Brisbane (1994)1, New South Wales
(1995)2 and Victoria (1996)3 indicate that
80%–90% of the adult population participated
in one or more gambling activities in the
reference year.
Gambling
Gambling is the placement of a wager or bet on
the uncertain outcome of a future event.
The statistics on gambling expenditure presented
in this article are compiled by the Centre for
Regional Economic Analysis (University of
Tasmania) on behalf of the Tasmanian Gaming
Commission.5 The taxation data is compiled by
the ABS as part of its Government Finance
Statistics collection.
Gambling is also an expanding economic
activity and an important source of taxation
revenue for State and Territory governments.
However, concern about the social and
personal costs associated with ‘problem
gambling’ emerges in public debate whenever
a new form of legalised gambling becomes
available or when access is extended into
more venues, including private homes via
telephone, interactive TV and internet
facilities. Pressure on governments to weigh
the potential social costs of gambling against
the economic advantages, and to formulate
appropriate policy and programs to deal with
these issues, has gained momentum
throughout the nineties.4 In 1998, the
Productivity Commission commenced a wide
ranging inquiry into the economic and social
impacts of Australia's gambling industry
(report due in 1999).
Recent growth in gambling
In 1996–97, expenditure on gambling was
$10 billion. This represented 3% of
household disposable income (HDI), almost
double the proportion (1.6%) spent on
Both sets of statistics relate to the following types
of legalised gambling:
racing – relates to betting on the outcome of
horse and greyhound races and, in recent
times, on some other sporting events such as
football matches;
casino gaming – includes wagers on table
games, gaming machines and keno systems;
gaming machines (poker machines) – in
clubs and hotels. Excludes machine gaming in
casinos;
keno (club keno) – in clubs and hotels.
Excludes keno played in casinos and keno
tickets purchased in lottery outlets such as
newsagents;
lotteries, lotto, pools – includes a wide range
of lotteries and lotto games, instant lotteries
(scratchies), keno tickets purchased in lottery
outlets and soccer pools; and
bingo and minor gaming – includes bingo,
raffles, lucky envelopes and the like.
gambling in 1972–73. Most of this increase
occurred during the early to mid nineties with
the rapid expansion of electronic gaming
machines in Victoria (introduced in 1992),
Queensland (1992) and South Australia
(1994) and the opening of casinos in
Canberra (1992), Melbourne (1994), Sydney
Gambling expenditure as a proportion of household disposable income
%
3.5
3.0
2.5
2.0
1.5
1972–73
1976–77
1980–81
1984–85
1988–89
1992–93
1996–97
Source: Tasmanian Gaming Commission, Australian Gambling Statistics 1972–73 – 1996–97.
ABS • AUSTRALIAN SOCIAL TRENDS • 4102.0 • 1999
•
141
EXPENDITURE
(1995) and Brisbane (1995). However, the
recent rapid growth in gambling expenditure
has now begun to level out. In some cases
(e.g. Western Australia and the Australian
Capital Territory) expenditure on gambling
declined between 1995–96 and 1996–97.
Expenditure on gambling
Expenditure on gambling is the amount wagered
less the amount won. Statistics on gambling
expenditure in Australia include expenditure by
overseas visitors as well as Australian residents.
While there is no comprehensive measure of
gambling expenditure by overseas visitors to
Australia, results of the ABS census of Australian
casino businesses6 indicate that, in 1997–98,
overseas rated players (highrollers) alone
accounted for around 25% of total expenditure on
casino gaming in Australia. Gambling expenditure
by Australians while overseas is not within the
scope of Australian gambling statistics.
Taxation revenue from gambling
Gambling's contribution to combined State
and Territory taxation revenue hovered
around 9%–10% throughout the 1970s and
most of the 1980s. After declining to 8% in
the late 1980s, it has since risen to 11% in
1996–97. This recent increase in the
proportion of taxation revenue derived from
gambling taxes has occurred in most States
and Territories and is particularly notable in
Queensland, Victoria and South Australia. In
these States, gambling taxes currently
contribute around 13% of total taxation
revenue – more than anywhere else in
Australia, and about 50% more than in the
late 1980s.
State and Territory gambling statistics include
expenditure by overseas and interstate visitors as
well as residents of that State or Territory.
Gambling statistics for some States and Territories
are also affected by accounting arrangements (e.g.
expenditure on Tattslotto is credited to Victoria
regardless of where tickets are purchased).
Per capita expenditure on gambling is calculated
by dividing total expenditure on gambling for the
financial year by the resident population
(aged 18 years and over) at the commencement
of the financial year.
Per capita expenditure on gambling
Taxes on gambling
In 1996–97, expenditure on gambling in
Australia was $736, on average, for every
Australian resident aged 18 years and over.
Since 1972–73, New South Wales has
maintained the highest per capita gambling
expenditure (reaching $853 in 1996–97).
During the same period Victoria's ranking has
varied considerably; from second highest in
1972–73, down to the lowest between
1987–88 and 1991–92, and back up to almost
equal second in 1996–97 ($805 per capita,
Taxes on gambling are taxes levied on gambling
and betting stakes. Taxes may be collected either
from entities providing the gambling service, as a
licence fee or percentage of their gross income
from gambling, or from individual gamblers as a
percentage of their stake. Any taxes on individual
gains from gambling (collected through the
personal income tax system) are excluded.
Gambling expenditure and taxes on gambling, 1996–97
Expenditure on gambling
Total
$ million
As percentage
of household
disposable income
Taxes on gambling
Total
As percentage
of total
taxation revenue
%
$ million
%
New South Wales
3 958
3.4
1 209
10.2
Victoria
2 757
3.2
1 157
13.0
Queensland
1 561
2.9
547
12.8
13.0
South Australia
638
2.5
274
Western Australia
700
2.3
170
6.4
Tasmania
152
2.0
62
9.8
Northern Territory
100
3.3
28
9.4
Australian Capital Territory
172
2.3
49
8.6
10 037
3.0
3 497(a)
Australia
11.2(a)
(a) Combined State and Territory taxes. Excludes taxes levied by the Commonwealth Government or by local governments.
Source: Taxation Revenue, Australia, 1997–98 (Cat. no. 5506.0); Tasmanian Gaming Commission, Australian Gambling
Statistics 1972–73 – 1996–97.
142
• ABS • AUSTRALIAN SOCIAL TRENDS • 4102.0 • 1999
EXPENDITURE
Per capita expenditure on gambling
Total(a) gambling expenditure
Type of gambling, 1996–97
1972–73 1982–83 1987–88 1996–97
Gaming
machines
Casino
Racing
Lotteries,
lotto, pools
$
$
$
rank
rank
rank
rank
$
$
New South Wales
1
1
1
1
853
536
78
145
76
Victoria
2
5
8
3
805
425
169
124
84
Queensland
3
8
7
5
635
207
176
113
96
South Australia
7
6
5
6
572
326
63
84
63
Western Australia
4
7
6
7
540
..
290
107
122
Tasmania
5
4
4
8
436
16
214
70
55
Northern Territory
..
2
2
2
806
123
368
202
112
Australian Capital Territory
6
3
3
4
758
525
79
83
71
Australia
..
..
..
..
736
363
144
123
85
(a) Includes club keno, bingo and minor gaming.
Source: Tasmanian Gaming Commission, Australian Gambling Statistics 1972/73 – 1996/97.
and in the Australian Capital Territory
($525 per capita or 69% of total gambling
expenditure). Gaming machines in clubs/pubs
accounted for more expenditure than any
other type of gambling activity in all parts of
Australia except the Northern Territory,
Western Australia and Tasmania, where
availability of gaming machines in these
venues was limited. (In Western Australia,
gaming machines were available only at the
casino.) These States had the highest per
capita expenditure on casino gaming, which
may be partly due to the popularity of gaming
machines in their casinos. (Results of the ABS
census of Australian casino businesses6
indicate that, Australia-wide, expenditure on
gaming machines in casinos amounted to
which was only $1 less than the Northern
Territory). Since the early 1980s, per capita
gambling expenditure in the Northern
Territory has been relatively high compared
with most other States and Territories, while
in South Australia and Western Australia per
capita gambling expenditure has remained
relatively low.
People spend more on gaming machines
(poker machines) than any other form of
gambling. In 1996–97, expenditure on
gaming machines in clubs and pubs
represented almost half of total gambling
expenditure or $363 per capita. Expenditure
was highest in New South Wales ($536 per
capita or 63% of total gambling expenditure)
Gambling participation rates(a), 1996–97
Lotteries,
lotto, pools
Gaming
machines
Racing
Casino
Total(b)(c)
%
%
%
%
%
New South Wales
32.8
11.2
6.4
1.6
45.5
Victoria
31.3
9.7
5.6
2.9
43.9
Queensland
36.6
9.4
5.6
3.9
49.0
South Australia
30.7
11.1
3.9
2.4
44.6
Western Australia
44.7
1.2
4.8
3.2
52.3
Tasmania
31.0
3.8
5.8
6.4
45.6
Northern Territory
34.5
6.4
5.9
8.7
49.7
Australian Capital Territory
27.9
12.4
2.7
1.9
41.6
Australia
34.0
9.4
5.6
2.7
46.3
(a) Proportion of the population aged 18 years and over who gambled during the previous week.
(b) Includes club keno, bingo and minor gaming.
(c) The sum of the components is larger than the total as some people participated in more than one type of gambling.
Source: Unpublished data, Population Survey Monitor, 1996–97 annual sample.
ABS • AUSTRALIAN SOCIAL TRENDS • 4102.0 • 1999
•
143
EXPENDITURE
$556 million ($41 per capita) in 1996–97.
This represented 29% of total expenditure on
casino gaming and 10% of total expenditure
on gaming machines). In general, expenditure
on lotteries, lotto, pools etc. was relatively
low, averaging $85 per capita or 12% of total
gambling expenditure Australia-wide.
Western Australia is a notable exception
where lotteries, lotto, pools, etc. accounted
for 23% of total gambling expenditure in
1996–97, second only to casino gaming.
Recent participation in gambling
The statistics on recent participation in gambling
presented in this article are derived from the ABS
Population Survey Monitor. Estimates relate to
participation in gambling in the past week by
Australian residents aged 18 years and over. The
range of gambling activities is similar to that
covered by the aggregate expenditure and
taxation data.
Gambling participation rate – for any group, the
number of persons who participated in one or
more gambling activities in the week prior to
interview, expressed as a percentage of the
population in the same group.
Recent participation in gambling
ABS surveys of gambling participation show
that, in 1996–97, 46% of Australians aged
18 years and over had taken part in one or
more forms of gambling during the week
before they were interviewed. Lotteries, lotto,
pools and the like were by far the most
popular form of gambling throughout
Australia, even though they accounted for the
least expenditure. During 1996–97, 34% of
adults had taken part in this form of gambling
in the week prior to interview. The highest
rates of participation were in Western
Australia (45%), Queensland (37%) and the
Northern Territory (35%).
participation rates were more than triple the
national average) and Tasmania (where
participation rates were more than double the
national average).
Gambling patterns of men and
women
In 1996–97, rates of recent participation in
gambling activities increased steadily with age
for both men and women – from around
30% among 18–24 year olds, to over
55% among 55–64 year olds. Participation
rates then declined for people aged 65 and
over, particularly for women. Men were more
than twice as likely as women to gamble on
racing, particularly in the under 35 and the
65 and over age groups. On the other hand,
Playing gaming machines in clubs/pubs was
the second most popular gambling activity
(9% participation rate) followed by racing
(6%) and casino (3%). This pattern was true
for most of Australia. However, casino gaming
was the second most popular gambling
activity in the Northern Territory (where
Gambling patterns of men and women, 1996–97
Gambling participation rate by age group (years)
18–24
25–34
35–44
45–54
55–64
65 and over Total
%
%
%
%
%
%
%
Lotteries, lotto, pools
11.0
30.5
34.7
40.5
46.0
42.8
33.9
Gaming machines
12.9
9.0
7.0
6.5
8.3
10.2
8.8
Racing
7.6
7.8
8.1
7.6
8.2
8.9
8.0
Casino
4.2
2.8
1.7
2.8
3.1
2.6
2.8
30.2
43.4
46.8
52.1
55.7
53.5
46.6
Type of gambling
Men
Total gambling(a)(b)
Women
Lotteries, lotto, pools
16.3
31.3
36.3
37.8
43.3
39.3
34.1
Gaming machines
9.9
7.7
10.1
10.6
11.1
11.0
9.9
Racing
2.0
2.8
4.1
3.9
3.8
3.0
3.3
Casino
5.3
2.0
2.3
2.1
4.1
1.7*
2.7
30.5
42.6
47.6
50.8
55.2
Total gambling(a)(b)
49.6
(a) Includes club keno, bingo and minor gaming.
(b) The sum of the components is larger than the total as some people participated in more than one type of gambling.
Source: Unpublished data, Population Survey Monitor, 1996–97 annual sample.
144
• ABS • AUSTRALIAN SOCIAL TRENDS • 4102.0 • 1999
45.9
EXPENDITURE
in the 35 years and over age groups, women
were a little more likely than men to have
played gaming machines in the previous
week. Patterns of recent participation in
lotteries, lotto, pools, etc. were fairly similar
for men and women although women had
slightly higher participation rates in the
younger age groups (under 45 years) while
men had slightly higher participation rates in
the older age groups. Participation rates in
casino gambling were also fairly similar for
men and women and were highest among
18–24 year olds and 55–64 year olds.
ABS surveys of gambling participation did not
collect information about how often people
gambled or how much they spent. However,
several other studies have found that, on
average, men gambled more frequently than
women and spent significantly more on
gambling than women did.1,2,3 Recent studies
in New South Wales (1995) and Victoria
(1996) found that, on average, men spent
about twice as much as women on
gambling.2.3
Endnotes
1 Boreham, P., Dickerson, M., & Harley, B. 1996,
‘What are the Social Costs of gambling?: The
Case of the Queensland Machine Gaming
Industry’, Australian Journal of Social Issues,
vol. 31, no. 4, pp. 425–442.
2 Australian Institute for Gambling Research 1996,
Study 2; An Examination of the Socio-economic
Effects of Gambling on Individuals, Families
and the Community, Including Research into
the Costs of Problem Gambling in New South
Wales, prepared for the Casino Community
Benefit Fund Trustees, Sydney.
3 Market solutions (Australia) Pty Ltd 1997, VCGA
Survey of Community Gambling Patterns, Final
Report, prepared for the Victorian Casino and
Gaming Authority, Melbourne.
4 Dickerson, M. 1995, Problem Gambling: Future
Directions in Research, Treatment, Prevention
and Policy Initiatives, National Association for
Gambling Studies: Sixth Annual Conference,
Fremantle.
5 Tasmanian Gaming Commission 1998,
Australian Gambling Statistics
1972–73 – 1996–97, Hobart.
6 Australian Bureau of Statistics 1998, Casinos,
Australia, 1997–98 (Cat. no. 8683.0), ABS,
Canberra.
ABS • AUSTRALIAN SOCIAL TRENDS • 4102.0 • 1999
•
145
Housing
Page
National and State summary tables . . . . . . . . . . . . . . . . . . . . . . . . . 148
HOUSING AND LIFESTYLE
First home buyers
...................................................
153
Young Australians are delaying the purchase of their first home. This
review looks at trends in levels of home ownership among younger
people over the last decade, and gives information about their housing
preferences when they do purchase a home.
HOUSING ASSISTANCE
Home care, hostels and nursing homes
...................
157
In 1998, most people aged 65 years or more lived in private dwellings,
although a small proportion lived in hostels or nursing homes. This
review focuses on the number and characteristics of older people
receiving some type of formal assistance in the home, and those who live
in supported accommodation such as hostels or nursing homes.
HOUSING STOCK
Rental investors
......................................................
162
In 1997, over half a million income units, comprising couples, lone
parents or individuals, were investors in residential rental property. This
review uses data from the 1997 Household Investors in Rental Dwellings
Survey to report on types of residential rental properties and the
characteristics of people who invest in them.
Inner city residential development
...........................
167
Focussing on occupied private dwellings, this review uses information
from the 1986 and 1996 Censuses of Population and Housing to describe
housing trends in the inner city areas of Sydney, Melbourne, Brisbane,
Adelaide and Perth. It also describes some of the characteristics of the
people living in private dwellings in these areas.
ABS • AUSTRALIAN SOCIAL TRENDS • 4102.0 • 1999 •
147
Housing — national summary
HOUSING STOCK
Units
Number of occupied
private dwellings
'000
n.a.
Size of new public sector houses
m2
114
Size of new private sector houses
m2
186
no.
Average number of
persons per household
Average number of
bedrooms per dwelling
Number of public sector
dwellings completed
Number of private sector
dwellings completed
1988
1989
1990
1991
1992
1993
1994
1995
1996
1997
1998
n.a.
n.a.
6 173
r6 302
r6 446
r6 579
r6 690
r6 762
r6 956
n.y.a.
114
110
121
122
130
141
141
150
154
159
190
189
188
187
189
192
197
205
212
219
2.8
n.a.
2.8
2.8
2.7
n.a.
2.6
2.6
2.6
2.6
n.y.a.
no.
2.9
n.a.
2.9
2.9
n.a.
n.a.
2.9
2.9
2.9
2.9
n.y.a.
'000
10.7
11.0
12.5
11.5
9.7
11.1
9.9
7.8
6.8
6.0
4.4
'000
107.7
139.4
147.5
122.9
123.0
145.2
157.3
162.4
129.1
113.0
127.2
Dwelling structure(a)
Separate houses
%
80.8
n.a.
80.7
n.a.
78.2
n.a.
79.4
79.3
78.6
79.5
n.y.a.
Semi-detached/townhouses
%
n.a.
n.a.
7.1
n.a.
7.0
n.a.
7.9
7.9
8.1
7.9
n.y.a.
Flats or apartments
%
9.0
n.a.
11.5
n.a.
12.5
n.a.
12.5
11.9
12.4
11.9
n.y.a.
Tenure type(b)
Owner without a mortgage
%
43.0
n.a.
42.4
n.a.
41.6
n.a.
41.8
41.3
41.7
40.9
n.y.a.
Owner with a mortgage
%
29.4
n.a.
29.2
n.a.
27.6
n.a.
28.3
29.8
28.2
28.0
n.y.a.
Public renter
%
5.5
n.a.
5.8
n.a.
5.6
n.a.
6.2
4.9
5.9
5.4
n.y.a.
Private renter
%
17.3
n.a.
17.1
n.a.
18.9
n.a.
19.0
17.8
20.0
21.0
n.y.a.
HOUSING COSTS
Units
1988
1989
1990
1991
1992
1993
1994
1995
1996
1997
1998
Housing interest rate
%
14.2
15.3
16.9
15.1
11.9
9.9
8.9
10.0
10.3
8.3
6.7
Affordability index
no.
135.1
110.1
100.9
111.7
133.9
152.1
162.8
140.9
141.7
169.0
174.1
Average weekly earnings index
no.
87.2
93.5
100.0
106.6
111.5
113.5
116.9
121.7
127.2
132.1
137.6
Mean weekly public rent
$
47.0
n.a.
58.0
n.a.
66.0
n.a.
62.0
59.0
62.0
64.0
n.y.a.
Mean weekly private rent
$
106.0
n.a.
133.0
n.a.
127.0
n.a.
141.0
138.0
148.0
153.0
n.y.a.
Public rental cost index
no.
85.1
94.5
100.0
105.0
110.0
112.5
115.3
118.5
119.3
122.5
123.8
Private rental cost index
no.
83.7
92.7
100.0
104.7
106.3
106.7
107.1
108.1
112.4
115.8
119.6
Project home price index
no.
77.1
91.4
100.0
102.1
102.1
103.0
105.8
108.1
109.5
109.2
110.3
Established home price index
no.
69.5
92.2
100.0
100.8
104.6
106.0
109.1
112.6
112.7
115.1
122.8
Materials used in
house building price index
no.
83.8
92.9
100.0
104.6
104.9
106.9
112.0
115.4
115.7
116.1
118.2
85
95
77
80
94
111
124
103
85
89
97
4 278
5 263
4 621
5 141
6 464
8 200
10 522
9 500
8 264
9 303
11 287
287
265
203
214
285
342
420
348
367
393
385
$m
15 832
17 525
14 339
15 634
22 074
28 578
37 310
32 806
35 414
40 676
43 374
$m
707
998
905
983
1 359
1 642
2 899
3 477
3 509
3 039
2 779
Finance commitments
Number for construction or
purchase of new dwellings
Value for construction or
purchase of new dwellings
Number for purchase of
established dwellings
Value for purchase of
established dwellings
Value for
alterations and additions
'000
$m
'000
HOUSING ASSISTANCE
Units
1988
1989
1990
1991
1992
1993
1994
1995
1996
1997
1998
Public sector rental dwelling stock
Applicants on housing waiting lists
Applicants accommodated
Persons receiving
private rental assistance
'000
328
338
352
362
370
377
384
389
393
400
n.y.a
'000
198
201
195
202
216
232
235
235
236
221
n.y.a
'000
48
49
53
52
49
54
55
53
51
47
n.y.a
'000
713
651
674
646
868
941
976
931
1 042
1 049
979
(a) Components do not total 100% due to other dwellings (caravans or cabins in a caravan park, houseboats and houses or flats attached to shops) not being included.
(b) Components do not total 100% due to other renters (paying rent to the manager of a caravan park, an employer, a housing cooperative, or a church or community
group), as well as other types of tenure (rent free and others), not being included.
Reference periods:
148
•
Data are for the year ending 30 June except: average number of persons per household and bedrooms per
dwelling; dwelling structure; tenure type; and mean weekly rent, which vary according to the timing of the
surveys within each year.
ABS • AUSTRALIAN SOCIAL TRENDS • 4102.0 • 1999
Housing — State summary
HOUSING STOCK
Units
Years
NSW
Vic.
Qld
SA
WA
Tas.
NT(a)
ACT
Aust.
Number of occupied
private dwellings
Size of new public sector houses
'000
1997
2 340.0
1 713.8
1 261.7
592.9
682.1
187.3
62.5
115.5
6 955.8
m2
1998
191
136
176
173
145
178
153
117
159
Size of new private sector houses
2
m
1998
227
214
219
205
228
189
204
205
219
Number of dwellings completed
'000
1998
41.3
29.0
33.4
6.4
16.2
1.9
2.0
1.5
131.7
Dwelling structure(b)
Separate houses
%
1997
74.6
82.8
82.6
79.3
80.9
85.5
75.2
80.9
79.5
Semi-detached/townhouses
%
1997
8.4
5.6
6.2
11.9
11.6
5.1
**
11.2
7.9
Flats or apartments
%
1997
16.5
10.9
9.7
8.5
7.4
8.0
18.6
7.9
11.9
Tenure type(c)
Owner without a mortgage
%
1997
42.3
44.4
38.5
40.5
35.6
42.3
15.3
30.0
40.9
Owner with a mortgage
%
1997
24.7
29.6
27.5
28.4
34.0
27.1
32.3
37.7
28.0
Public renter
%
1997
5.6
3.7
4.0
10.7
4.6
8.0
19.5
11.5
5.4
Private renter
%
1997
23.2
19.1
24.6
15.9
18.5
16.2
18.7
18.0
21.0
HOUSING COSTS
Units
Years
NSW
Vic.
Qld
SA
WA
Tas.
NT(a)
ACT
Aust.
Affordability index(d)
no.
1998
121.9
171.0
179.0
228.6
196.6
232.9
n.a
185.2
174.1
Mean weekly public rent
$
1997
67
61
56
64
63
60
78
85
64
Mean weekly private rent
$
1997
177
144
140
122
125
117
193
167
153
Project home price index(d)
no.
1998
112.2
108.6
112.4
113.1
102.2
123.3
137.3
123.5
110.3
Established home price index(d)
no.
1998
128.5
114.3
138.9
112.1
113.3
125.4
198.9
126.2
122.8
Materials used in house
building price index(d)
no.
1998
119.7
117.1
117.1
123.3
115.9
121.0
n.a
n.a
118.2
'000
1998
28.4
26.9
19.3
5.5
14.2
1.3
0.9
1.2
97.5
$m
1998
3 907
2 951
2 154
497
1 438
102
104
132
11 287
'000
1998
130.1
92.8
60.0
31.9
50.9
8.4
3.4
7.2
384.7
$m
1998
18 018
9 637
6 246
2 631
5 045
634
364
797
43 374
$m
1998
1 174
670
374
140
282
60
25
51
2 779
HOUSING ASSISTANCE
Units
Years
NSW
Vic.
Qld
SA
WA
Tas.
NT
ACT
Aust.
Public sector rental dwelling stock
'000
1997
135.3
69.3
58.3
61.4
36.9
14.2
12.7
12.1
400.3
Applicants on housing waiting lists
'000
1997
89.1
53.4
25.8
32.2
11.1
2.1
3.8
4.0
221.4
Applicants accommodated
'000
1997
10.8
7.7
10.7
6.4
5.5
2.9
1.1
1.8
46.8
Persons receiving
private rental assistance
'000
1998
340.3
218.1
236.9
63.9
82.3
22.6
6.0
8.6
978.7
Finance commitments
Number for construction or
purchase of new dwellings
Value for construction
or purchase of new dwellings
Number for purchase of
established dwellings
Value for purchase of
established dwellings
Value for
alterations and additions
(a) Estimates for dwelling structure, tenure type and mean weekly public and private rent for Northern Territory relate to mainly urban areas only.
(b) Components do not total 100% due to other dwellings (caravans or cabins in a caravan park, houseboats, and houses or flats attached to shops) not being
included.
(c) Components do not total 100% due to other renters (paying rent to the manager of a caravan park, an employer, a housing cooperative, or a church or
community group), as well as other types of tenure (rent free and others), not being included.
(d) State and Territory data refer to capital cities only.
Reference periods:
Data are for the year ending 30 June.
ABS • AUSTRALIAN SOCIAL TRENDS • 4102.0 • 1999 •
149
Housing — definitions and references
Affordability index — the ratio of average household
income to the average income needed to meet
the repayments for an average established
dwelling purchased by a first home buyer. A value
of 100 indicates that a household with average
income would meet the average income
requirements to service the average mortgage. An
increase in the index represents an improvement
in affordability.
Reference: Commonwealth Bank of Australia and
the Housing Industry Association, Housing
Report.
Alterations and additions — all approved structural
and non-structural changes to a dwelling of a
value of not less than $10,000 which are integral
to the functional and structural design of the
dwelling, e.g. garages, carports, pergolas,
reroofing, recladding etc., but excluding
swimming pools, ongoing repairs, landscaping,
and maintenance and home improvements not
involving building work.
Reference: Housing Finance for Owner
Occupation, Australia (Cat. no. 5609.0).
Applicants accommodated — the number of public
rental applicants accommodated in a year.
Reference: Department of Family and Community
Services, Housing Assistance Act 1996 Annual
Report.
Applicants on housing waiting lists — the number of
applicants (households) waiting for public rental
accommodation on 30 June.
Reference: Department of Family and Community
Services, Housing Assistance Act 1996 Annual
Report.
Average number of bedrooms per dwelling — the
average number of bedrooms in occupied private
dwellings.
Reference: Income and Housing Surveys; 1991
Census of Population and Housing; and Surveys
of Income and Housing Costs.
Average number of persons per household — the
average number of usual residents in occupied
private dwellings.
Reference: Income and Housing Surveys; 1991
Census of Population and Housing; 1992 Family
Survey; and Surveys of Income and Housing
Costs.
Average weekly earnings index — the total weekly
ordinary time (before tax) earnings of full-time
adult employees divided by the total number of
full-time adult employees and expressed as an
index, with base year 1989–90=100.
Reference: Average Weekly Earnings, States and
Australia (Cat. no. 6302.0).
Established house price index — the price of
detached residential dwellings on their own block
of land, regardless of age (i.e. including new
houses sold as a house/land package as well as
older houses) expressed as an index, with base
year 1989–90=100.
Reference: House Price Indexes: Eight Capital
Cities (Cat. no. 6416.0).
150
•
ABS • AUSTRALIAN SOCIAL TRENDS • 4102.0 • 1999
Finance commitments — firm offers to provide
finance for owner-occupation or alterations and
additions which have been, or are normally
expected to be, accepted. Commitments to
provide housing finance to employees and
commitments accepted and cancelled in the same
month are included. Owner-occupied dwellings
being purchased can be either established
(completed for more than 12 months or
previously occupied) or new (completed for less
than 12 months with the borrower being the first
occupant).
Reference: Housing Finance for Owner
Occupation, Australia (Cat. no. 5609.0).
Flats or apartments — occupied private dwellings
contained in blocks of flats, units or apartments,
which do not have their own private grounds and
usually share a common entrance foyer or
stairwell. Includes flats attached to houses.
Reference: Income and Housing Surveys; 1992
Family Survey; and Surveys of Income and
Housing Costs.
Household — a group of two or more related or
unrelated people who usually reside in the same
dwelling, who regard themselves as a household
and who make common provision for food or
other essentials for living; or a person living in a
dwelling who makes provision for his or her own
food and other essentials for living, without
combining with any other person.
Reference: ABS, Household Type Standard.
Housing interest rate — the financial year annual
average of the interest rate applicable on the last
working day of each month to standard variable
rate loans for owner-occupation extended by large
bank housing lenders. It is the predominant or
representative rate of major banks, although some
banks may quote higher or lower rates.
Reference: Reserve Bank of Australia, Monthly
Bulletin.
Materials used in house building price index — prices
of selected materials used in the construction of
dwellings expressed as an index, with base year
1989–90=100. Data for national total is a
weighted average of six state capital cities.
Reference: Price Index of Materials Used in
House Building, Six State Capital Cities (Cat. no.
6408.0).
Mean weekly public/private rent — the average
weekly rent paid by renters of public/private
dwellings.
Reference: Income and Housing Surveys; 1992
Family Survey; and Surveys of Income and
Housing Costs.
Occupied private dwellings — the premises occupied
by a household. For population estimation
purposes, the total number of occupied private
dwellings is treated as being equal to the total
number of households of the usually resident
population.
Reference: Australian Demographic Statistics
(Cat. no. 3101.0).
Housing — definitions and references continued
Owner with a mortgage — a household where the
reference person or partner owes an amount on a
mortgage or loan secured against the dwelling.
Prior to 1995 known as 'being purchased', and
excluded dwellings with mortgages for
alteration/addition or other purposes.
Reference: Income and Housing Surveys; 1992
Family Survey; and Surveys of Income and Housing
Costs.
Owner without a mortgage — a household where the
reference person or partner does not owe any
amount on a mortgage or loan secured against the
dwelling. Includes persons who have repaid a
mortgage or loan but have not formally discharged
the associated mortgage. Prior to 1995 known as
'owned', and included dwellings whose only
mortgage was for alteration/addition or other
purposes.
Reference: Income and Housing Surveys; 1992
Family Survey; and Surveys of Income and Housing
Costs.
Persons receiving private rental assistance — persons
on low incomes who pay rent or similar payments
for private accommodation and receive a rental
assistance payment from the government. Rent
assistance may be payable to pensioners without
children, families receiving above the minimum
family payment and people already receiving a
government allowance or benefit.
Reference: Unpublished data from Centrelink.
Private/public sector dwellings completed — when
building activity has progressed to the stage where
the building can fulfil its intended function. The
ABS regards buildings as completed when notified
as such by the respondents (builders) to the
survey.
Reference: Building Activity, Australia
(Cat. no. 8752.0).
Private renter — a household paying rent to a
landlord who is a real estate agent, a parent or
other relative not in the same household or
another person not in the same household, to
reside in the dwelling.
Reference: Income and Housing Surveys; 1992
Family Survey; and Surveys of Income and Housing
Costs.
Private rental cost index — the average rent of privately
owned dwellings (rented through real estate agents
in each capital city) expressed as an index, with
base year 1989–90=100.
Reference: Consumer Price Index
(Cat. no. 6401.0).
Project home price index — the price of dwellings
available for construction on a client's block of land
expressed as an index, with base year
1989–90=100.
Reference: House Price Indexes: Eight Capital
Cities (Cat. no. 6416.0).
Public renter — a household paying rent to a State or
Territory housing authority or trust to reside in the
dwelling.
Reference: Income and Housing Surveys; 1992
Family Survey; and Surveys of Income and Housing
Costs.
Public rental cost index — the average rent of
government authority dwellings in metropolitan
areas expressed as an index, with base year
1989–90=100.
Reference: Consumer Price Index
(Cat. no. 6401.0).
Public sector dwelling stock — those rental
dwellings held by State and Territory housing
authorities.
Reference: Department of Family and Community
Services, Housing Assistance Act 1996 Annual
Report.
Semi-detached/row or terrace houses/townhouses —
occupied private dwellings with their own private
grounds and no dwelling above or below. A key
feature is that they are attached in some structural
way to one or more dwellings, or separated from a
neighbouring dwelling by less than half a metre.
Reference: Income and Housing Surveys; 1992
Family Survey; and Surveys of Income and Housing
Costs.
Separate houses — occupied private dwellings which
are self-contained and separated from other
structures by a space of at least half a metre to
allow access on all sides. Includes houses with an
attached flat.
Reference: Income and Housing Surveys; 1992
Family Survey; and Surveys of Income and Housing
Costs.
Size of new private/public sector houses — average
floor area of houses intended for private/public
ownership at building approval.
Reference: ABSDB (database), Building Approvals
Dataset: New houses by SLA, Materials and Floor
Area.
ABS • AUSTRALIAN SOCIAL TRENDS • 4102.0 • 1999 •
151
First home buyers
H O U S I N G
A N D
L I F E S T Y L E
Buying a first home represents a major
commitment for any couple or individual.
Those involved will generally need to have
accumulated funds to make the initial deposit
on the home and to have a steady income to
meet on-going mortgage repayments.
Young Australians are
staying in education
longer, marrying later,
having children later,
and buying their first
Despite a general increase in the affordability
of housing over the last decade (see
Australian Social Trends 1999, Housing —
national summary table, p. 148), young
Australians have become less likely to
embrace home ownership.
home later in life than
they used to. The
median age of recent
first home buyers rose
The reduced likelihood of young people
purchasing a home is evident from changes in
age-specific home ownership rates over the
last decade. Between 1988 and 1996–97,
home ownership rates among income units in
which the age of the reference person was
25–34 declined from 42% to 32%. Substantial
declines were also evident among those
aged 35–44 (70% in 1988 compared to
63% in 1996–97).
from 30.2 to 31.8 years
between 1988 and
1996–97.
These trends may in part be associated with
changing patterns of family formation among
young people, particularly since young
people are staying in education longer,
delaying marriage, and having their first child
later in life (see Australian Social Trends
Age distribution of first home buyers, and age-specific home
ownership rates(a), 1988 and 1996–97
Age of income unit
reference person
First home buyers
All owner occupiers
1988
1996–97
1988
1996–97
%
%
rate(a)
rate(a)
15–24
14.6
13.6
4.6
4.2
25–34
55.8
48.4
42.3
32.1
35–44
19.2
26.7
70.5
62.5
45–54
5.7
6.8
76.7
74.8
4.4*
55 or older
Total income units
78.4
77.7
100.0
4.7
100.0
53.9
52.8
'000
'000
'000
'000
Total income units
391.0
393.9
4 095.8
4 795.8
years
years
years
years
Median age
30.2
31.8
49.4
50.9
(a) As a proportion of all income units in each age group.
Home owners
The information for this review has mostly been
taken from the 1988 Housing Survey and the
1996–97 Survey of Income and Housing Costs.
Income units are single persons, or groups of
related persons within a household whose income
is assumed to be shared. Income sharing is
assumed to take place within couples and
between parents and dependent children. It is
assumed that decisions concerning the purchase
of a home are also generally made by adults in
such units.
Owner occupiers are income units who own their
home, with or without a mortgage. First home
buyers are a subset of owner occupiers.
First home buyers are income units who bought
their first home in the three years prior to the
survey reference period. The number of recent
home buyers should not be compared across
surveys as the nature of the three-year period is
different for the two surveys. To be regarded as a
first home buying income unit, neither the
income unit reference person nor the income unit
reference person's spouse could have owned a
home previously in Australia.
Changeover buyers are income units who bought
their home within the same periods described for
first home buyers. However, the income unit
reference person and/or the income unit
reference person's spouse had owned a home
previously in Australia.
1997, Age at first marriage, pp. 27–29 and
Australian Social Trends 1996, Trends in
fertility, pp. 36–40). Consistent with these
changes, young people have been delaying
buying their first home. Between 1988 and
1996–97, the proportion of first home buyer
income units whose reference person was
aged less than 35 declined from 70% to 62%.
As a result, the median age of first home
buyers (median age of reference person)
increased from 30.2 years to 31.8 years.
A declining home ownership rate for young
Australians means that they have become
more likely to rent, board or live rent free.
Part of the shift to these forms of tenure is
related to substantial increases in the
proportion of young adults, those aged in
their twenties, continuing to live with their
parents (see Australian Social Trends 1999,
Families — national summary table,
pp. 28–29).
Source: Unpublished data, 1988 Housing Survey; 1996–97 Survey of Income and Housing Costs.
ABS • AUSTRALIAN SOCIAL TRENDS • 4102.0 • 1999 •
153
HOUSING AND LIFESTYLE
First home buyer and overall home ownership rates(a) for selected income unit types, 1988 and
1996–97
Age of reference person
by income unit type
First home buyers
All owner occupiers
1988
1996–97
1988
1996–97
%(a)
%(a)
%(a)
%(a)
'000
Total income
units 1996–97
'000
'000
Less than 35 years
One-person
Men
Women
3.4
3.3
76.3
6.0
7.3
169.7
2 311.0
3.5
3.4
46.2
6.3
8.1
112.2
1 376.6
3.1
3.2
30.2
5.6
6.2
57.6
934.4
20.2
19.2
164.3
61.1
55.7
477.7
857.2
Registered marriage
20.7
18.6
123.7
66.1
62.0
412.3
664.7
De facto marriage
16.5
21.1
40.6
29.0
33.9
65.4
192.6
2.3
2.2
46.3
59.5
54.9
1 138.8
2 073.2
Couple
35 years or more
One-person
Couple
2.8
2.7
92.4
85.3
85.1
2 864.7
3 367.2
Registered marriage
2.7
2.6
83.7
86.0
85.7
2 776.7
3 239.6
De facto marriage
5.4*
6.8*
59.7
69.0
88.0
127.6
5.1
4.3
53.9
52.8
4 795.8
9 083.3
Total income units(b)
8.7*
393.9
(a) As a proportion of all income units of each type.
(b) Includes one-parent income units.
Source: Unpublished data, 1988 Housing Survey; 1996–97 Survey of Income and Housing Costs.
Changing pre-conditions for buying
the first home
Some young people purchase their first home
before they establish family relationships of
their own. In 1996–97, as in 1988, about 3%
of one-person income units aged under 35
(and slightly higher proportions of men than
women) had recently purchased their first
home. Although there were slightly more
owner occupiers among young people in this
age range in 1996–97 (7%) than in 1988 (6%),
there had been little change over the decade
to the strongly prevailing social norm of
partnering prior to purchasing property.
Of all income unit types, young couples are
most likely to be first home buyers. In
1996–97, 19% of all couples in which the
reference person was aged less than 35 were
first home buyers. Moreover, 56% of young
couples lived in a home that they owned with
or without a mortgage. Young couples who
were in a registered marriage were more
likely than those who were in a de facto
marriage to own their home (62% compared
to 34%). Nevertheless, while clearly still
strong, the importance of registered marriage
has diminished for making the commitment
that accompanies purchasing a home.
Between 1988 and 1996–97, the proportion
of young de facto married couples who
154
• ABS • AUSTRALIAN SOCIAL TRENDS • 4102.0 • 1999
owned their home increased (by 5 percentage
points, up from 29%), while it decreased
among young registered married couples
(by 4 percentage points, down from 66%).
Types and characteristics of
dwellings purchased
Although separate houses have continued to
be the most favoured form of housing, there
has been some shift among first home buyers
towards higher density housing. In 1996–97,
17% of first home buyers had purchased
medium-high density accommodation (such
as a semi-detached, row or terrace house, flat,
unit or high rise apartment) as opposed to a
separate house, up from 14% in 1988. A
similar shift has occurred among changeover
buyers.
Between 1988 and 1996–97, there was also,
among first home buyers, some movement
away from buying new homes towards buying
homes that had been lived in previously. The
proportion of first home buyers who bought a
new home fell from 23% in 1988 to 21% in
1996–97. This change, as well as the move
away from separate houses, suggests that
homes in more established areas have
become more popular with first home buyers
than homes in urban fringe developments.
HOUSING AND LIFESTYLE
Dwelling structure chosen by recent home buyers, 1988 and 1996–97
1988
Dwelling structure
1996–97
First home
buyers
Changeover
buyers
First home
buyers
Changeover
buyers
%
%
%
%
Separate house
85.3
85.3
82.1
83.3
Semi-detached houses and flats(a)
13.9
13.7
17.1
15.9
Total income units(b)
100.0
100.0
100.0
100.0
'000
'000
'000
'000
Total income units(b)
391.0
600.1
393.9
686.8
(a) Includes all semi-detached, row, terrace and townhouses, flats and units but excludes houses/flats attached to shops etc.
(b) Includes income units living in a dwelling structure other than a separate house, semi-detached house or flat.
Source: Unpublished data, 1988 Housing Survey; 1996–97 Survey of Income and Housing Costs.
Another trend has been for first home buyers
to purchase larger dwellings as measured by
the number of bedrooms. Higher proportions
of first home buyers bought a home with
more than three bedrooms in 1996–97 (20%)
than in 1988 (13%). Even though most first
home buyers purchase established homes,
this trend partly reflects an increase in the
size of new dwellings being built (see
Australian Social Trends 1998, Smaller
households, larger dwellings, pp. 157–159).
Dwelling problems
When buying a home, first home buyers have
appeared to be more likely than recent
second or subsequent home buyers to
Age and size of homes bought by first
home buyers, 1988 and 1996–97
1988
1996–97
%
%
Age of home
New home
23.1
21.0
Established home
76.9
79.0
Number of bedrooms
One(a)
4.2
3.1*
Two
23.0
21.1
Three
59.8
56.0
Four
11.8
18.1
Five or more
1.3
1.7*
Total income units
100.0
100.0
'000
'000
Total income units
391.0
393.9
(a) Includes bedsitters.
Source: Unpublished data, 1988 Housing Survey;
1996–97 Survey of Income and Housing Costs.
tolerate property troubled by problems such
as pests, electrical faults, draughts, defective
windows, mould and mildew. According to
the 1994 Australian Housing Survey, only 25%
of recent first home buyer income units
reported no problems with their home,
compared to 35% of recent changeover buyer
income units. At the same time, 11% of recent
first home buyers were troubled with 5 or
more problems, compared with only 7% of
recent changeover buyers. However, these
differences may also reflect relatively less
knowledge and experience of housing
problems among first home buyers.
Affordability
The cost of purchasing a home, and of
meeting the associated establishment costs, is
a major issue of concern to first home buyers.
Broad measures of housing affordability
suggest that purchase of a first home is within
much closer reach in the late 1990s than it
was in the late 1980s (see Housing — national
summary table, p. 148). Yet recent first home
buyers spent about the same share of their
income on housing in 1988 and 1996–97
(about 22%).
For some owner occupiers with a mortgage,
housing affordability problems may be
self-imposed. Such owner occupiers may
choose to repay large amounts in the short
term to acquire an asset that tends to
appreciate in value over the long term.
There is no single standard method for
defining people who are experiencing
housing affordability problems. However, one
measure used in housing research is the ratio
of housing costs to income for those income
units whose income is relatively low (that is,
those in the bottom 40% of the income unit
income distribution). Among these units,
those whose housing costs consume more
ABS • AUSTRALIAN SOCIAL TRENDS • 4102.0 • 1999 •
155
HOUSING AND LIFESTYLE
Housing costs as a proportion of
income, 1988 and 1996–97
1988
1996–97
Housing tenure
%
%
First home buyers
22.5
21.7
All owners without a mortgage
3.2
3.4
All owners with a mortgage
19.6
20.5
Renters
20.5
20.8
All income units(a)
12.4
13.3
(a) Includes other forms of housing tenure such as boarding
and living rent free.
Source: Unpublished data, 1988 Housing Survey;
1996–97 Survey of Income and Housing Costs.
156
• ABS • AUSTRALIAN SOCIAL TRENDS • 4102.0 • 1999
than 30% of their income, are considered to
be experiencing affordability problems.1 In
1996–97, 7% of first home buyers experienced
housing affordability problems according to
this criterion. One-parent income units (24%)
were more likely than one-person income
units (16%), and considerably more likely
than couple income units (5%) to be
experiencing such affordability problems.
Endnotes
1 National Housing Strategy 1992, The
Affordability of Australian Housing, Issues Paper
No.2, AGPS, Canberra.
Home care, hostels and
nursing homes
H O U S I N G
A S S I S T A N C E
In 1998, most people
Most people when they become older
aged 65 years or more
would prefer to continue living
independently in their own homes.1 Most
older people are able to do this. However, as
people age, their need for assistance
increases. This is often obtained from family,
friends and/or community and government
organisations, although some people may
enter one of various forms of supported
accommodation.
lived in private
dwellings (91%).
However, 6% lived in
hostels or nursing
homes.
Partly in recognition of the preferences of
older people for living independently, and
also on account of the large projected
increase in the size of the older population,
the Commonwealth government initiated a
process of aged care reforms in the mid
1980s. This included the expansion of
home-based care services and hostel
accommodation, and a reduction in the
proportion of older people being placed in
nursing home accommodation. More
recently, there has also been an increased
emphasis on user-pays issues. Changes have
also been made to the quality assurance
program for nursing homes and hostels, now
combined into one residential care stream.2,3
According to ABS population projections
(Series 2), the number of people aged 65 and
over is projected to increase from 2.3 million
people in 1998 to 5.1 million people by 2031
(up from 12% of the total population to 21%).
Living arrangements of older people, 1998
With partner(a)
With other relatives
With non-relatives
Alone
Nursing homes and hostels(b)
Total(c)
All persons 65 and over
65–79 years
80 years and over
65 years
and over
Males
Females
Males
Females
Persons
%
%
%
%
%
74.3
49.8
3.9
11.0
1.5
1.3
16.8
32.7
45.1
5.1*
1.5*
11.2
52.5
18.7
9.1
0.8*
29.7
38.3
1.3
27.6
1.5
2.2
13.4
22.8
5.9
100.0
100.0
100.0
100.0
100.0
'000
'000
'000
'000
'000
815.0
942.1
178.2
335.8
2 271.2
(a)Comprises people who live with their partner only, or with their partner and other people.
(b)Comprises establishments which are for the care of older people, and retirement homes,
which include a hostel and/or nursing home component such as nursing or medical care.
(c)Includes persons living in other non-private dwellings, such as boarding houses and hostels
for the homeless (4% of total population).
Source: Unpublished data, 1998 Survey of Disability, Ageing and Carers.
Residential care of older people
In this review, older people are people aged
65 years and over.
Supported or residential care accommodation
refers to nursing homes and hostels for the aged.
Nursing home refers to a facility for the aged
which provides 24-hour nursing care for its
residents. These homes generally provide a
higher level of care than hostels for the aged.4
Hostel refers to a care facility for the aged in
which residents receive personal care and
accommodation support. Most hostels also
provide some nursing care.5
Formal care refers to services provided to
persons with one or more disabilities by
government and private (for-profit and
not-for-profit) organisations.
A person with severe or profound core activity
restrictions refers to someone who sometimes or
always needs help with self-care, mobility or
communication activities.
Those aged 80 and over, the group most
likely to require nursing home or hostel
accommodation or other forms of support,
are projected to increase from 520,000
people to 1.4 million people (up from 3% of
the total population to 6%).
This review focuses on the number and
characteristics of older people receiving some
type of formal assistance in the home (which
includes those who live in self-cared
retirement villages), and who live in
supported accommodation such as hostels or
nursing homes. Information on the services
they receive, and the supported
accommodation in which they live, is also
provided. (For more general information on
older people's housing, see Australian Social
Trends 1996, Housing for older people,
pp. 150–155).
Living arrangements
There are many factors which influence
whether older people stay at home or
eventually transfer to other forms of
accommodation with different levels of care
provided, such as hostels or nursing homes.
These factors include their level of disability,
their current living arrangements, access to
support from family, friends or from
government and/or private organisations, and
ABS • AUSTRALIAN SOCIAL TRENDS • 4102.0 • 1999
•
157
HOUSING ASSISTANCE
their financial situation. Income levels can
determine their ability to pay for services they
can no longer do for themselves.
Disability status of all persons aged
65 and over, 1998
Results from the 1998 Survey of Disability,
Ageing and Carers indicated that most older
people lived in private dwellings with their
spouse or other relatives (62%). As the
likelihood of having a disability or becoming
widowed increases with age, people aged 80
and over were more likely to be living in a
hostel or nursing home (20%) or living alone
(35%) than those aged 65–79 (2% and 25%
respectively).
65–79 years
80 years and
over
Male
Female
Male
Female
%
%
%
%
The living arrangements of people aged 80
and over also varied for men and women. In
1998, there were greater proportions of
women in this age group than men who lived
alone (38% and 30% respectively). This
reflects the fact that women of this age are
less likely than men to have a partner (77% of
women aged 80 and over were widowed
compared to 36% of men of this age). There
were also greater proportions of women aged
80 and over than men who lived in hostels or
nursing homes (23% and 13% respectively).
Women in this age group were also more
likely than men to have severe or profound
core activity restrictions (51% and 37%
respectively). These patterns underline the
fact that more women live to advanced old
age (over 90 years) than men.
Persons aged 65 and over in households, 1998
65–79
years
80 years
and over
65 years
and over
Source of assistance(a)
%
%
Informal
82.9
84.2
83.3
76.1
76.8
76.3
Partner
42.9
16.7
34.5
Adult child
26.7
33.8
28.9
13.8
15.7
14.4
55.9
66.9
59.4
39.7
43.8
41.0
Family(b)
Friends
Formal
Private for-profit
Private not-for-profit
Government
%
6.5
13.5
8.7
24.1
35.8
27.8
'000
'000
'000
Persons receiving assistance
580.7
272.6
853.3
Persons requiring assistance(c)
609.4
278.5
887.9
1 712.3
392.1
2 104.4
Total persons
(a) As a proportion of people receiving assistance. People may receive assistance from more
than one source, therefore components do not add to totals.
(b) Total includes other family members.
(c) Comprises people who need help with self-care, mobility, communication activities, health
care, housework, property maintenance, meal preparation, paperwork or transport.
Source: Unpublished data, 1998 Survey of Disability, Ageing and Carers.
158
• ABS • AUSTRALIAN SOCIAL TRENDS • 4102.0 • 1999
No disability
49.7
53.7
28.5
25.1
Disability
50.3
46.3
71.5
74.9
Core activity
restrictions
42.6
41.7
67.1
73.5
Profound
6.4
8.9
26.7
40.5
Severe
Moderate
Mild
Total
Total persons
5.5
6.8
9.9
10.6
11.7
9.8
8.8
6.9
19.0
16.3
21.7
15.5
100.0 100.0
100.0 100.0
'000
'000
815.0
'000
942.1
178.2
'000
335.8
Source: Disability, Ageing and Carers: Summary of
Findings, Australia, 1998 (Cat. no. 4430.0).
Level of independence
In 1998, less than half of people aged 65 and
over in households required help with
everyday activities (42%), most commonly
property maintenance (30%), transport (22%)
and housework (19%). Many received help
from more than one person or organisation,
depending on the type of assistance needed.
However, most older people received help
from family or friends (83% of those who
received help), usually from a partner (35%)
or an adult child (29%), rather than from
formal sources (59%).
Formal care in the home
Most older people who need assistance are
able to remain at home, provided they can
obtain enough help of the type and level they
feel they need. Formal organisations provide
an important avenue of assistance, either as a
supplement to informal help from family or
friends or when no informal help is available.
Formal services are provided by government
and private (for-profit and not-for-profit)
organisations. Access by older people to these
services is dependent on their knowledge of
the existence of the services, their availability
and cost, and the financial circumstances of
the recipient – whether they can afford to pay
for private services if necessary.
In 1998, there were 853,300 people aged 65
and over who received assistance in the home
(41% of all persons aged 65 and over in
households). Of these, 59% received help
HOUSING ASSISTANCE
Distribution of government aged care
expenditure, 1985–86 and 1995–96
%
100
1985–86
1995–96
80
60
40
20
0
Nursing homes
HACC(a)
Hostels
(a) Available data suggested that 20–25% of HACC clients
were under 65 during this period, as well as a small
proportion of nursing home and hostel residents.
Expenditure on Community Aged Care packages and
assessments is included in HACC expenditure (2% of
total expenditure in 1995–96).
Source: Australian Institute of Health and Welfare 1995:
Services and Assistance; Australian Institute of Health and
Welfare 1997: Services and Assistance.
from formal sources. Help was commonly
received from more than one formal source,
with 41% receiving help from private
for-profit organisations, 9% from private
not-for-profit organisations, and 28% from
government organisations. For most people,
help was more likely to have been received
from family and friends than from formal
sources, although many used both avenues of
assistance. However, for those reporting a
need for assistance with health care (a more
specialised form of help), 67% obtained some
assistance from formal sources and 49% from
family and friends.
For people living at home, the major services
funded by the Commonwealth, State and
Territory governments included the Home
and Community Care (HACC) program and
Community Aged Care packages.3 The
majority of these services are provided by
government or community non-profit
organisations.6,7
Home and Community Care
The HACC program is a jointly funded
Commonwealth and State government
program which provides services to people in
their homes. HACC services are administered
by government departments (usually health
or community services, but sometimes local
government) in each State and Territory.4 The
program targets people of all ages who, due
to disability, have difficulty or require
assistance with self-care, mobility or
communication tasks – 26% of people aged
65 and over in 1998. Services provided
include personal (for example, washing and
dressing), health and respite care, home and
centre-based meals, home help and home
maintenance, centre day care and transport.2
It is estimated that up to 240,000 people
receive one or more HACC services in an
average month (based predominantly on 1997
patterns of use).7
As the population continues to age, there are
likely to be large increases in absolute
numbers in the HACC target group. In 1993,
there were 437,500 persons aged 65 years
and over in the target group. By 1998, this
had risen to 550,400. If current levels of need
for assistance or difficulty with personal care
tasks are maintained, and the proportion of
that group currently living in households
remains the same, then in 2031 (based on
current population projection assumptions)
there will be over 1.2 million people in this
group, an increase of 692,500 or 126% from
1998. If levels of informal assistance are
maintained, most of these people will receive
their main support from family or friends.
However, changes in female workforce
participation and in levels of volunteer labour
in the welfare industry, together with
increases in divorce and single-person
households, may reduce the amount of
informal support available.2
Between 1985–86, when the aged care reform
process started, and 1995–96, expenditure on
HACC services increased from $233.8 million
to $601.9 million (in real terms, i.e. constant
1989–90 values), an increase of 157%. HACC
services also increased their share of total
recurrent aged care expenditure during this
time from 15% to 22%, reflecting the shift
away from funding for supported
accommodation.2,8
Community Aged Care Package
An additional area of home-based care is the
Community Aged Care Package, which is a
Commonwealth-funded program, initiated in
1992, providing an alternative to residential
hostel care. The scheme provides an intensive
level of home care. The aim is to enable as
many older people as possible, even those
with more complex care needs, to remain at
home.6
Between 1993 and 1998, the number of
people receiving the Community Aged Care
Package increased from 211 to 8,831. Most of
the recipients were female, although during
this time their proportion of total recipients
decreased from 83% to 72%.7 In 1997–98,
the annual government outlay for each
ABS • AUSTRALIAN SOCIAL TRENDS • 4102.0 • 1999
•
159
HOUSING ASSISTANCE
Persons aged 65 and over in nursing homes and hostels, 1993 and 1998(a)
1993
1998(b)
Nursing homes
Hostels
'000
%(c)
'000
18.4
2.1
11.6
Nursing homes
Hostels
%(c)
'000
%(c)
'000
%(c)
1.3
18.9
1.9
14.1
1.4
Males
65 and over
65–79
80 and over
8.2
1.1
4.3
0.6
8.0
1.0
4.8
0.6
10.1
7.1
7.4
5.1
11.0
6.1
9.2
5.1
Females
65 and over
49.7
4.3
35.6
3.0
49.0
3.8
43.5
3.4
65–79
12.2
1.4
8.5
1.0
11.3
1.2
9.1
1.0
80 and over
37.6
13.4
27.1
9.7
37.7
11.2
34.4
10.2
All persons 65 and over
68.1
3.3
47.3
2.3
67.9
3.0
57.5
2.5
(a) As at June 30 in each year.
(b) Includes 1,480 residents classified under new scheme and allocated to nursing homes if rated high dependency, and to
hostels if rated low dependency.
(c) Per cent of all persons in each age/sex group.
Source: Australian Demographic Statistics, June Quarter 1998 (Cat. no. 3101.0); and unpublished data, DHAC.
Community Aged Care Package was $9,923 –
similar to the subsidy for a hostel place which
was $9,360.3
Hostels and nursing homes
Reflecting the change in emphasis from
intensive forms of residential care, such as
nursing homes, to community care programs
and hostel accommodation, hostels increased
their share of total aged care expenditure
between 1985–86 and 1995–96. Their share
increased from 5% to 13% over this period,
while nursing home expenditure declined as
Costs of residential aged care7
In 1998, the basic daily fee for nursing home and
hostel care was $21.69 for full and part pensioners
and $27.11 for self-funded retirees. More recently,
income-tested fees have also been applied to
residents with a greater capacity to pay. Since
March 1998, new residents with an income above
the income-test threshold have to pay an
additional fee averaging $4.50 per day. New
nursing home residents (those who have entered
care since October 1997), depending on assets,
may also pay up to $12 per day extra in
accommodation charges. Since 1997, hostel
residents may, depending on assets, pay an
accommodation bond from which providers may
keep up to $2,600 per year for up to 5 years.
No resident has to pay the new charges or bonds
if doing so would reduce their assets to less than
$23,000. In 1998, the average bond was $54,000
and the average daily charge in nursing homes
was $10.80 (in addition to the basic daily fee and
the income-tested fee).
160
• ABS • AUSTRALIAN SOCIAL TRENDS • 4102.0 • 1999
a proportion of the total (from 80% down to
63%). By 1997–98, the annual cost to
government (excluding capital funding) was
$29,648 for a utilised place in a nursing home
and $9,360 for a hostel. The cost to an
individual varied according to their income
and assets.
Since 1997, funding for hostels and nursing
homes has been based on the dependency
level of residents rather than accommodation
type, and entry to a nursing home or hostel is
governed by an assessment process. This
process, for example, enables residents in a
hostel to receive a higher level of care in the
hostel as they become more dependent,
rather than having to move to a nursing home
to receive this level of care.3
At 30 June 1998, there were about
57,500 people in hostels and 67,900 in
nursing homes. In 1998, the likelihood of
living in either a nursing home or a hostel
was greater for people aged 80 and over
(9% and 8% respectively) than for those aged
65–79 (1% in each case). Women aged 65 and
over were also more likely than men of this
age to live in these two types of care (4% and
3% compared to 2% and 1% respectively).
Since 1993, the proportion of people aged
65 and over in nursing homes has dropped
slightly from 3.3% to 3.0% in 1998, and there
has been a corresponding small increase for
hostel residents, from 2.3% to 2.5%.
Long-term targets have been set for the year
2011 to reduce the proportion of nursing
home beds and increase the proportion of
hostel beds and care packages.3 Between
HOUSING ASSISTANCE
Residential beds and community care
1985
1998
2011(a)
rate(b)
rate(b)
rate(b)
Nursing home beds
67
47
40
Hostel beds
32
41
50
0
6
10
100
94
100
Community
Aged Care Packages
Total
(a) Commonwealth government target for 2011.
(b) Number of beds or Community Aged Care Packages per
1,000 people aged 70 and over. Rates may not add to
total due to rounding.
Source: DHFS Annual Report 1997–98.
1985 and 1998, substantial progress (based
on the number and type of residential beds
and care packages available for those aged 70
and over) was made towards these targets.
For example, the number of hostel beds
increased from 32 per 1,000 persons aged 70
and over in 1985 to 41 per 1,000 by 1998.
The reduction in the number of nursing home
beds was greater than the increase in hostel
beds, and the supply of care packages had not
yet made up the shortfall. The level of need
for assistance (as measured by proportions
with severe to profound core activity
restrictions) did not decline during this time.9
However, there has been an increase in the
level of funding of HACC services over this
period, which may have been providing
increased community-based support in the
interim.
Endnotes
1 Kendig H. and Gardner I. 1997, 'Unravelling
housing policy for older people', in A. Borowski,
S. Encel and E. Ozanne (eds) Ageing and Social
Policy in Australia, Cambridge University Press,
Cambridge.
2 Australian Institute of Health and Welfare 1997,
Australia's Welfare 1997: Services and
Assistance, AIHW, Canberra.
3 Commonwealth Department of Health and
Family Services 1998, Annual Report 1997–98,
DHFS, Canberra.
4 Mathur, S. 1996, Aged Care Services in Australia's
States and Territories, Australian Institute of
Health and Welfare, Canberra.
5 Australian Institute of Health and Welfare and
Commonwealth Department of Health and
Family Services August 1998, Hostels in
Australia, 1995–96, AIHW and DHFS, Canberra.
6 Australian Institute of Health and Welfare and
Commonwealth Department of Health and
Family Services August 1997, Community Aged
Care Packages. How do they compare?, AGPS,
Canberra.
7 Commonwealth Department of Health and Aged
Care 1998, unpublished data, DHAC, Canberra.
8 Australian Institute of Health and Welfare 1995,
Australia's Welfare 1995: Services and
Assistance, AGPS, Canberra.
9 Australian Bureau of Statistics 1999, Disability,
Ageing and Carers: Summary of Findings,
Australia, 1998, Cat. no. 4430.0, ABS, Canberra.
ABS • AUSTRALIAN SOCIAL TRENDS • 4102.0 • 1999
•
161
Rental investors
H O U S I N G
In 1997, over half a
million income units
comprising couples,
lone parents or
individuals, were
investors in residential
rental property. Just
over three quarters had
invested in only one
rental property.
S T O C K
The private rental market provides housing
for approximately one fifth of Australian
households (21%). Householders, as well as
businesses and non-profit institutions, invest
in private rental housing. Estimates from the
1996–97 Survey of Income and Housing Costs
indicated that householders provided
approximately half the rental housing for
those who rented in the private market.
People rent for many reasons. For example,
they may choose to rent because they prefer
to keep their housing options open, or they
may be forced to rent because they cannot
afford to buy a home. People who rent may
be either in the private or the public rental
housing market.
Between 1988 and 1997, the apparent
demand for private rental housing increased.
The numbers of households renting privately
grew from 959,100 in 1988 to 1,448,800 in
1997 (from 17% to 21% of all households)
(see Australian Social Trends 1999, Housing
— national summary table, p. 148).
Persons(a) owning residential rental
property, July 1993 and June 1997
1993
Age group (years)
1997
%
%
18–34
22.6
19.4
35–44
26.7
27.8
45–54
27.3
31.6
55–64
14.9
14.0
8.4
7.2
100.0
100.0
65 and over
Total
Sex
Males
54.5
52.6
Females
45.5
47.4
100.0
100.0
Total
'000
Person investors
Total population(a)
'000
752.1
889.9
12 638.4
13 132.6
(a) Persons aged 18 years and over.
Source: Household Investors in Rental Dwellings,
June 1997 (Cat. no. 8711.0).
162
• ABS • AUSTRALIAN SOCIAL TRENDS • 4102.0 • 1999
Residential rental properties
This review uses data from both the July 1993 and
June 1997 Household Investors in Rental
Dwellings surveys, and relates only to people aged
18 years or more. Data from the 1993 survey is
available at the person level only, whereas the
1997 survey mainly collected information on
investments by income unit. This change
recognises that the benefits of income and rental
property ownership are often shared between
partners in couple families. Information on the
characteristics of residential rental properties was
also collected. Comparative figures for all income
units were obtained from the 1996–97 Survey of
Income and Housing Costs.
Dwelling units are the total number of units when
multiple dwelling units such as blocks of flats are
taken into account. That is, houses or flats etc. are
regarded as one dwelling unit each, but a block of
flats, containing for example, six flats, is counted
as six dwelling units.
Residential rental properties are private dwellings
for which rent was paid to the owner either
directly or through an agent. These properties
provide long-term accommodation and could be
single dwelling units such as a separate house, or
multiple dwelling units such as a block of flats.
Respondents reported data on properties up to a
maximum of three for one-parent and one-person
income units and up to six for couple income
units.
Income unit is one person, or a group of related
people within a household, whose command over
income is assumed to be shared.
Investor income units (also called investors) are
those income units who in June 1997 owned, or
owned a share in, a residential rental property.
Rental investment trends
Investment in private rental housing has
fluctuated over the last few decades (see
Australian Social Trends 1995, Investment in
residential rental property, pp. 139–142).
However, between July 1993 and June 1997
there was an 18% increase in the number of
rental investors – from 752,100 to 889,900.
This represented an increase, from 6.0% to
6.8%, in the proportion of all people in
private dwellings who had invested in
residential rental properties.
The age and sex profile of individuals with
investments in residential property in 1997
was similar to that in 1993; most investors
were aged between 35 and 54 and slightly
HOUSING STOCK
Income units with residential rental property, June 1997
Couple income units
Age(c)
One person
income units
All income units
No. of
investors
Per cent
investing(a)
No. of
investors
Per cent
investing(a)
Per cent
No. of
investinvestors(b) ing(a)
'000
%
'000
%
'000
%
18–34
61.5
6.7
49.0
2.4
113.4
3.6
35–44
128.9
11.8
21.9
5.2
155.5
9.1
45–54
144.8
15.0
27.1
7.0
177.6
12.3
55–64
73.5
11.8
13.9
4.0
88.1
9.0
65+
32.2
4.7
17.4
2.0
49.6
3.2
Total
440.9
10.3
129.3
3.2
584.2
6.6
(a) Investor income units as a proportion of all income units in group.
(b) Includes one-parent investor income units (14,000 income units).
(c) Age of reference person in income unit.
Source: Household Investors in Rental Dwellings, June 1997 (Cat. no. 8711.0).
more men than women were investors.
However, over the period there was a
decrease in the proportion of all investors
aged 18–34 years (from 23% to 19%) and in
those aged 55 and over (from 23% to 21%).
Investor income units
Investment decisions are often made by
income units, such as both people in a
couple, rather than individuals. The
investments may also be shared with other
income units (17% of investors owned their
most recently acquired property in
partnership with one or more other income
units in June 1997).
In June 1997, 584,200 income units had an
investment in at least one residential rental
property (7% of all income units). Most were
small investors, with just over three quarters
(76%) owning or partly owning only
one property.
Investment rates in residential property vary
according to life-cycle stage. As might be
expected, couples in their prime earning
years were most likely to have such an
investment. In 1997, income units in which
the reference person was aged 45–54 were
the group most likely to have a residential
rental property (12%), especially if the
income unit involved a couple (15%). More
generally, couples were over three times as
likely (10%) to have a residential rental
property as one-person (3%) or lone-parent
income units (3%).
Partly reflecting the concentration of investors
among people of prime working age, investor
income units had higher incomes than
income units in general, and were more likely
to have their main source of income from
employment or business. In June 1997, the
median gross weekly income of investor
income units was $1,009 – more than twice
the median of all income units ($486). Two
thirds (65%) of investors received their main
source of income from wages or salaries, and
18% from their own business or partnership.
The corresponding proportions among all
income units were 55% and 6% respectively,
largely because a much higher proportion of
the general population was dependent on
government pensions and allowances (30% of
all income units compared to 6% of investor
income units).
Investors were also more likely to own their
own home than the general population. In
June 1997, more than three quarters (76%) of
investors owned or were paying off their own
home, nearly half of investors owning their
own home outright (47%). In contrast, 54% of
Amount and principal source of cash income, June 1997
Investor income units
Principal source of income
All income units(a)
One-person Couple
All(a)
One-person Couple
All(b)
%
%
%
%
%
%
Wage or salary
67.0
64.6
64.9
Own business or partnership income
11.4
19.9
17.8
3.2
9.1
5.9
6.3
4.8
5.5
35.1
21.4
30.2
15.3
10.5
11.7
7.8
7.2
7.3
100.0
100.0
100.0
100.0
100.0
100.0
$
$
$
$
$
$
666
1 162
1 009
322
766
486
Government pensions and allowances
Other income
All sources
Median gross weekly income
51.0
61.2
54.7
(a) Includes one-parent investor income units (14,000 income units).
(b) Includes one-parent income units.
Source: Household Investors in Rental Dwellings, June 1997 (Cat. no. 8711.0);
Income Distribution, Australia, 1996–97 (Cat. no. 6523.0).
ABS • AUSTRALIAN SOCIAL TRENDS • 4102.0 • 1999
•
163
HOUSING STOCK
Tenure type of own home, June 1997
Tenure type
Owner(b)
Investor income
All income units
%
%
75.9
54.3
Without a mortgage
28.9
23.1
With a mortgage
47.0
31.2
Renter(c)
17.4
35.2
Rent free
5.9
7.6
100.0
100.0
'000
'000
584.2
8 965.3
Total(d)
Total(d)
(a) Investors in private residential rental property.
(b) Includes owners with and without a mortgage.
(c) Includes public renters.
(d) Includes other tenure e.g. being purchased under a rent/buy scheme or occupied under life
tenure.
Source: Household Investors in Rental Dwellings, June 1997 (Cat. no. 8711.0); and
unpublished data, Rental Investors Survey, June 1997.
all income units owned or were paying off
their own dwelling, and only 31% owned
their dwelling without a mortgage.
Buying and selling
Consistent with increases in demand for, and
investment in, private rental housing, in June
1997 there were more than twice as many
income units intending to buy a rental
property in the next two years (215,500) than
intending to sell (113,500). Over one quarter
(26%) of those intending to buy already
owned a residential rental property.
For just over one quarter of investors, their
most recently acquired rental property was a
home they had previously lived in (26%). This
was particularly so for those aged 18–34 years
with sole ownership of their property (42%).
The majority of investors obtained their most
recently acquired rental property by
purchasing it with a loan (59%). Very few had
purchased their rental property outright
(10%) although those aged 65 and over with
sole ownership were more likely to have done
so (39%). This group was also more likely to
have received the property as an inheritance
(13%) than the average rental property
investor (4%).
The most common reasons given by income
units intending to invest were the desire for a
long-term investment (80%) and for the
taxation benefits to be gained by negative
gearing (23%). In contrast, lower proportions
of existing investors gave these as reasons
(66% and 16%). Existing investors were more
likely to cite possible future home (15%) and
164
• ABS • AUSTRALIAN SOCIAL TRENDS • 4102.0 • 1999
rental income (15%) as their reasons than
intending investors (12% and 9%
respectively).
The most common reason reported by those
who had already sold (34%) their residential
rental property and those intending to sell
(22%) was that they needed the funds for
family or business purposes. Similar
proportions of both groups (16% and 14%
respectively) also reported that they had sold
or would sell because the property caused
them too much work and worry.
Type of investment property
People have different reasons for buying a
rental property than for buying their home,
and are therefore likely to choose different
types of property. Separate houses were the
most common type of private residential
dwelling for both groups, followed by units or
flats. However, investors were less likely to
have acquired a separate house (56% of all
rental dwellings in 1997) than were all
householders living in a separate house
(80% of all private dwellings). Conversely,
33% of rental dwellings were units or flats
(either single flats or within a whole block as
a number of flats) compared to 12% of private
dwellings. One reason for this may be that
units or flats tend to be cheaper than separate
houses (see Australian Social Trends 1998,
Wealth in the family home, pp. 154–159).
Investor income units were more likely to
invest in single flats or units rather than
blocks of flats. Of all residential rental
properties owned by investor units, 22% were
single flats or units and 4% were blocks of
Type of dwelling(a), June 1997
%
80
Residential rental dwellings
All occupied residential dwellings
60
40
20
0
Separate
house
Semidetached(b)
Unit or flat
(a) Comprises total number of individual residential dwellings,
including all units/flats within a block of units/flats.
(b) Comprises semi-detached/row or terrace
houses/townhouses.
Source: Unpublished data, Rental Investors Survey, June
1997; and unpublished data, Survey of Income and Housing
Costs, 1996–97.
HOUSING STOCK
flats. For their most recently acquired
property, rental investors with sole ownership
of this property were somewhat less likely to
invest in blocks of flats (3%) than investors
with shared ownership (7%), probably
because of the greater cost involved.
Statistical sub-divisions
Statistical sub-divisions (SSD) are defined as
socially and economically homogeneous regions
characterised by identifiable links between the
inhabitants. In July 1998, there were 194 SSDs in
Australia, ranging from 45 in Victoria to 8 in the
Australian Capital Territory.
Location of investment property
Potential rental properties are likely to be
easier to select, and then manage, when
situated close by. In 1997, nearly half of all
investment properties were located near the
homes of investors (48% in the same
statistical sub-division), and 88% were located
in the same State or Territory. The same
proportions of all dwellings and investment
dwellings were located in capital cities (63%),
although there was some variation between
the States and Territories.
Naturally, investors are more likely to buy a
rental property in an area where there are
many people wanting to rent. The inner areas
of capital cities, in particular, have higher
proportions of young singles or childless
couples, who are traditionally more mobile
and therefore more likely to rent (see
Australian Social Trends 1999, Inner city
residential development, pp. 167–170). In
contrast, rural areas have higher rates of
home ownership than urban areas, and
therefore a smaller potential rental market
(see Australian Social Trends 1998, Rural
families, pp. 42–45). Therefore, it might be
expected that a higher proportion of rental
dwellings than all private dwellings would be
located in the capital cities. However, this was
not true in every State. For example, there
were similar proportions of rental investment
dwellings in Sydney (60%) and Brisbane
(44%) as there were of all private dwellings
(61% and 44% respectively). The relatively
high proportions of people in New South
Wales and Queensland living in coastal towns
and cities may help to account for this
difference.1
Value of investment property
The value of rental properties differed from
that of owner-occupied properties. In 1997,
the estimated median value of investment
properties in Australia was $125,000. This
was lower than the estimated median value of
owner-occupied dwellings ($141,000 in
1995–96)2, partly because a greater
proportion of rental properties were flats and
units (33% in 1997) than were all
owner-occupied dwellings (5% in 1995–96).
Property values vary considerably according
to their location. In 1997, the median value of
rental properties in all capital cities was
$133,000 compared to $107,000 outside the
Location of residential dwellings, June 1997
Investment dwellings(a)
Total
All residential dwellings
Capital
cities
% in Capital
cities(b)
%
Total
Capital cities
% in Capital
cities(b)
%
'000
'000
'000
'000
New South Wales
196.6
117.7
59.9
2318.2
1 407.3
60.7
Victoria
170.3
128.4
75.4
1702.3
1 213.1
71.3
Queensland
210.2
92.0
43.8
1255.0
549.5
43.8
South Australia
66.3
51.5
77.7
589.6
441.1
74.8
Western Australia
79.2
61.2
77.3
674.5
493.1
73.1
Tasmania
18.9
8.5
45.0
185.7
75.3
40.5
8.1
n.a.
n.a.
485.8
n.a.
n.a.
16.3
16.3
100.0
115.5
115.5
100.0
765.9
480.9
62.8
6 889.3
4 326.0
62.8
Northern Territory(c)
Australian Capital
Territory
Australia
(a) Private residential rental dwellings – respondents reported details on a maximum of three rental properties.
(b) Proportion of total private residential dwellings which are in capital city statistical divisions.
(c) Available data refers to mainly urban areas.
Source: Household Investors in Rental Dwellings, June 1997 (Cat. no. 8711.0); and unpublished data, Survey of Income and
Housing Costs, 1996–97.
ABS • AUSTRALIAN SOCIAL TRENDS • 4102.0 • 1999
•
165
HOUSING STOCK
capital cities. The highest median value was in
Sydney ($192,000), reflecting its higher real
estate prices generally. Hobart had the lowest
median value of $97,000.
8
There are a number of ways in which
investors can receive a return on their
residential rental property. For example, the
capital value of their property can appreciate
over time, they can gain benefits of reduced
taxation through negative gearing, and they
can earn rental income from the investment.
6
In 1997, the average gross rate of return for
all private residential rental properties was 7%
per annum. Generally, properties with lower
gross rates of return tended to be the
Residential rental properties in capital cities(a), June 1997
Median weekly
rent(c)
Gross rate of
return(d)
$'000
$
%
192
197
5.9
Median value(b)
Melbourne
120
153
6.9
Brisbane
127
158
6.7
98
136
7.5
127
132
6.1
Adelaide
Perth
Hobart
97
133
7.6
Canberra
137
173
7.0
All capital cities(e)
133
161
6.6
Rest of State
107
141
7.3
Australia
125
154
6.8
(a) Respondents provided data on a maximum of three properties.
(b) Current market value of the property and its land as estimated and reported by respondent.
(c) Median weekly rent charged for the property regardless of whether the property was occupied
or vacant.
(d) Gross annual rent (i.e. weekly rent x 52) divided by the value of the property.
(e) Includes Darwin.
Source: Unpublished data, Rental Investors Survey, June 1997.
166
%
10
Investment return
A commonly used measure of return on
investments is the 'gross rate of return'. This is
calculated by dividing the gross annual rent
by the value of the property (as estimated by
the owner). While useful, it should be noted
that this measure is limited as it does not take
into account any capital gains (or losses) from
changes in the value of the property over
time. It also excludes the benefits received
from negative gearing.
Sydney
Average gross rate of return(a),
June 1997
• ABS • AUSTRALIAN SOCIAL TRENDS • 4102.0 • 1999
4
2
0
<$100 $100< $125< $150< $200+
125
150
200
$ Value of property ('000)
(a) Per cent annual return is gross annual rent divided by the
estimated value of the property.
Source: Household Investors in Rental Dwellings, June 1997
(Cat. no. 8711.0).
higher-priced properties. Of properties with
gross rates of return less than 5% per annum,
57% were valued at $200,000 or more. In
comparison, of properties with gross rates of
return of 8% or more, 63% were valued at less
than $100,000.
Properties in Hobart and Adelaide had the
highest rate of return (7.6% and 7.5%
respectively), reflecting their lower median
value.
For the 1995–96 financial year, investors
reported that they were more likely to have
made a profit on their rental property if they
did not have a mortgage (58%) or if the
mortgage was less than $50,000 (31%). For
investors with larger mortgages, over half had
made a loss (55%). Many of these, however,
would have invested to gain the reduction in
personal taxation from the negative gearing of
a rental property.
Endnotes
1 Australian Bureau of Statistics 1998, Australia in
Profile: A regional analysis, 1996, Cat. no.
2032.0, ABS, Canberra.
2 Australian Bureau of Statistics 1997, Housing
Occupancy and Costs 1995–96, Cat. no. 4130.0,
ABS, Canberra.
Inner city residential
development
H O U S I N G
Inner city living in
Sydney, Melbourne,
Brisbane, Adelaide and
Perth has become
more popular. Between
1986 and 1996, all of
these inner city areas
had growing
populations, with much
of the increase being
housed in high-rise
apartments.
S T O C K
Characterised by an agglomeration of
Inner city areas and places of
residence
offices, shops, hotels, theatres and restaurants
in a mix of modern high-rise and historic
buildings, inner city areas have a large daily
flow of commuters from suburban areas and
also provide places of residence for many
people. Many of the people who reside in
inner city areas, often for very short periods
(i.e. tourists and people on business), do so in
a variety of non-private dwellings such as
hotels, motels, boarding houses and hostels.
For instance in 1996, 41% of all people
counted in inner Sydney on census night, and
61% of those in inner Melbourne, were
residing in non-private dwellings. However,
supported by urban planning policies,1,2,3
inner city areas are also becoming home to a
growing number of residents living in private
dwellings, especially in high-rise apartments.
Focussing on occupied private dwellings, this
review uses information from the 1986 and
1996 Censuses of Population and Housing to
describe housing trends in the inner city areas
of Australia's five largest cities. It also
describes some of the characteristics of the
people living in private dwellings in these
areas.
Change in inner city areas
The extent of residential development can be
viewed in terms of the growth in the number
of occupied private dwellings in an area and
the number of people living in the area. It is
Inner city areas have been defined to include
census collection districts within a 1.5 km radius
of the General Post Office located within each
city's Central Business District (CBD). These
areas include the full CBD as well as the inner
areas of any surrounding suburbs.
Metropolitan areas include Sydney, Melbourne,
Brisbane, Adelaide and Perth as defined by their
statistical division boundaries.
Private dwellings are defined as premises,
typically a house or apartment, usually occupied
by households (a person living alone or a group
of related or unrelated people who usually reside
and eat together). Occupied private dwellings are
those that were occupied on census night by at
least one usual resident.
Non-private dwellings include premises (such as
hotels, boarding houses, hostels, hospitals and
prisons) designed to provide special-need
housing services for (often large) groups of
individuals.
evident from census data that more people
now live in inner city areas and that recently
the rate of residential development has usually
been higher in inner city areas than for
metropolitan areas as a whole.
Inner Sydney (already with the largest number
of inner city residents in 1986 – 12,100
people) recorded the highest growth in
Census population counts in 1996 and changes since 1986
All persons
Persons counted at home in private dwellings(a)
Inner city area
Population
in 1996
Proportion in
non-private
dwellings
Inner city area
Population
in 1996
Metropolitan area
Change since 1986
% increase
Change
since 1986
City
no.
%
no.
no.
Sydney
35 165
41.4
18 828
6 691
55.1
12.5
% increase
Melbourne
10 781
60.9
3 820
2 609
215.4
12.0
Brisbane
15 479
54.3
6 486
1 432
28.3
29.7
Adelaide
8 862
48.2
4 266
867
25.5
7.3
Perth(b)
8 654
57.1
3 393
n.a.
n.a.
28.2
(a) Excludes visitors.
(b) Figures showing change for Inner Perth have been omitted. Unlike the other cities, in Perth the 1986 Census coincided
with school holidays and does not allow reasonable comparisons to be made with respect to changes in numbers of people
for small geographic areas.
Source: Unpublished data, 1986 and 1996 Censuses of Population and Housing.
ABS • AUSTRALIAN SOCIAL TRENDS • 4102.0 • 1999
•
167
HOUSING STOCK
residents, adding about 6,700 people over the
decade. However, the proportionate increase
was largest in inner Melbourne, where the
number of people in occupied private
dwellings more than tripled (increasing from
about 1,200 to about 3,800 people). The
number of people in the inner city areas of
both Brisbane and Adelaide increased at a
more moderate rate; 28% in Brisbane (which
was on par with the high rate of growth for
the city as a whole), and 26% in Adelaide
(which was more than three times the growth
rate of the entire city).
For each city, the same trends are evident
when examining the overall growth in
numbers of private dwellings. The change in
dwellings counted in Perth over the decade
suggests that the rate of residential
development in inner Perth has been slower
than in other cities (12% compared to the
next lowest, 26% in Brisbane).
Dwelling types
While the mix of dwelling types in inner city
areas (such as separate houses, row and
terrace houses, flats and high-rise apartments)
varies between each city, a common feature of
inner city housing is the low proportion of
separate houses. On average, 7% of all
occupied private dwellings in the five inner
city areas were separate houses, compared to
74% for the metroplitan areas as a whole. As
well as the historical development of medium
density housing (e.g. terrace houses close to
the CBD in Sydney and Melbourne), the
on-going competition for land in inner city
areas has favoured the development of
adjoined dwellings and, increasingly,
dwellings in high-rise blocks.
Separate houses and adjoined
dwellings
Separate houses are those that stand on their
own grounds separated from other dwellings by
at least half a metre.
Adjoined dwellings are all dwellings other than
separate houses and have been classified in this
review as being in either high-rise blocks or an
"other adjoined dwelling type". Other adjoined
dwelling types include, row and terrace houses,
units/flats and other adjoined dwellings, as long
as the dwelling is in a building less than
four storeys high. Dwellings in high-rise blocks,
conversely, are those in residential buildings
four or more storeys high.
In 1996, the inner city areas of both Sydney
and Melbourne had very few separate houses
(both less than 40, representing 0.3% and
1.1% of all occupied private dwellings
respectively). In all cities, the number of
occupied separate houses declined between
1986 and 1996. Most of the losses were in
Brisbane (101), Perth (49), and Adelaide (39).
Nearly two thirds of all dwellings in inner
Sydney (64%) were in high-rise blocks
(i.e. dwellings in blocks four or more storeys
high), while in inner Melbourne, the
proportion of dwellings in high-rise blocks
and the other types of adjoined dwellings
were similar (45% and 50% respectively).
Inner Adelaide, in contrast, had relatively few
occupied dwellings within high-rise blocks
(10%).
Occupied private dwellings in inner city areas, 1996 and change since 1986
1996
Change since 1986
Adjoined dwellings
Inner city areas
Separate High-rise
house
blocks
Other
Total
dwellings
Adjoined
dwellings
in high-rise
blocks
Total
dwellings(b)
%(a)
%(a)
%(a)
no.(b)
no.
Sydney
0.3
64.2
34.7
11 028
3 042
% increase
79.9
no.
3 724
% increase
51.0
Melbourne
1.1
45.1
49.7
2 034
754
566.9
1 464
256.8
Brisbane
17.5
42.9
39.0
3 726
867
127.1
779(c)
26.4
Adelaide
12.1
9.5
74.9
2 587
147
156.4
633
32.4
Perth
21.2
26.8
49.8
1 960
113
27.9
205
11.7
(a) As a per cent of total dwellings, but excluding private dwellings with unknown structures and dwelling types such as
dwellings attached to shops.
(b) Includes private dwellings with unknown structures and dwelling types such as dwellings attached to shops.
(c) Increase is smaller than the increase in adjoined dwellings in high-rise blocks because the number of separate houses
declined.
Source: Unpublished data, 1986 and 1996 Censuses of Population and Housing.
168
• ABS • AUSTRALIAN SOCIAL TRENDS • 4102.0 • 1999
HOUSING STOCK
Proportion of dwellings rented, and median weekly rent
payments of those renting, 1996
Inner city area
Location
Metropolitan area
Proportion
rented
Median
rent
Proportion
rented
Median
rent
%
$ per week
%
$ per week
162
Sydney
71.0
210
31.3
Melbourne
65.4
222
24.7
137
Brisbane
62.4
152
30.4
135
Adelaide
65.2
120
28.2
102
Perth
69.2
102
26.5
126
Total
68.1
172
28.3
140
attracted to inner city areas (i.e. highly mobile,
young adults); the most common type of
dwelling available in inner city areas (smaller
adjoined dwelling types that are generally not
suited to families with dependants); and the
higher housing costs which is partly indicated
by higher rental payments in inner city areas
compared to metropolitan areas.
Characteristics of residents
Source: Unpublished data, 1996 Census of Population and Housing.
In all cities, the most rapid development
(measured in terms of percentage change)
occurred in the construction of
units/apartments within high-rise blocks. Over
the ten-year period 1986 to 1996, almost all of
the residential development in Brisbane's
inner city, and most of the development in
Sydney's inner area was in units in high-rise
blocks. In Adelaide, much of the growth
occurred in units in the other types of
adjoined dwellings (526 units compared to
147 in high-rise blocks).
Housing tenure and costs
Against the norm of high levels of home
ownership (with or without a mortgage) of
people in Australia, people living in inner city
areas were much more likely to be renting.
The low home ownership in inner city areas
may be associated with: the type of people
People living in inner city areas do so for
many reasons, such as being close to work
and places of entertainment, living near
friends or relatives, or simply having a
preference for the ambience of inner city
living. However, it is likely that the high costs
associated with inner city housing, and the
preferences for families with children to live in
suburbs, would lead to differences between
the socio-economic characteristics of inner
city residents and residents of metropolitan
areas generally. Various indicators reinforce
the popular stereotype that many inner city
residents are relatively young, financially
advantaged adults.
In 1996, all inner city areas had a greater
proportion of males than females, while the
reverse was true for the total population of
the five metropolitan areas. Inner city areas
also had larger proportions of people living
with unrelated adults (i.e. in group
households) and people living alone, and
lower proportions of family households. In
1996, lone-person households made up 49%
and group households made up 16% of inner
city households (compared to 23% and 5%
respectively in metropolitan areas). Family
households made up 35% of all households in
Selected characteristics of residents of private dwellings, 1996
Location
Males
per 100
females
Persons
Persons
aged
aged 0–9 20–29
Families with
Persons
Lone-person Group
Family
Couple-only dependent
aged 65+ households households households families
children
number
%(a)
%(a)
%(a)
%(b)
%(b)
%(b)
%(c)
%(c)
Inner city areas
Sydney
122
5.0
32.8
8.4
50.3
14.9
34.8
57.3
24.8
Melbourne
115
4.2
38.2
6.5
40.7
19.3
39.9
51.5
23.2
Brisbane
106
4.1
30.0
12.0
46.5
16.4
37.0
54.2
25.5
Adelaide
119
4.1
30.3
11.8
52.3
14.2
33.5
54.3
25.6
Perth
128
5.6
31.6
9.9
52.3
15.1
32.6
50.3
33.0
Total inner city areas
119
4.7
32.5
9.4
49.2
15.5
35.3
55.2
25.6
Total metropolitan areas
96
14.1
15.9
10.9
22.9
4.6
72.4
31.6
50.4
(a) Of all persons.
(b) Of all households.
(c) Of all families.
Source: Unpublished data, 1996 Census of Population and Housing.
ABS • AUSTRALIAN SOCIAL TRENDS • 4102.0 • 1999
•
169
HOUSING STOCK
Employment and income of people(a) living in private dwellings, 1996
Location
Unemployment
rate
Persons employed in Persons with gross Persons with gross
more highly skilled
income > $799
income < $300
occupations(b)
per week
per week
%
%(c)
%(c)
%(c)
53.4
29.6
12.7
Inner city areas
Sydney
8.4
Melbourne
8.8
64.2
36.4
18.5
Brisbane
9.3
57.6
26.9
16.0
Adelaide
10.8
58.2
25.1
18.1
Perth
14.5
48.7
20.5
26.8
Total inner city areas
9.4
55.4
28.5
15.7
Total metropolitan areas
8.3
39.0
19.5
20.8
(a) Aged 15 years and over.
(b) Managers and administrators, professionals and associate professionals (ASCO, Second Edition).
(c) Of all employed persons.
Source: Unpublished data, 1996 Census of Population and Housing.
inner city areas, compared to 72% in
metropolitan areas. Furthermore, among
family households, couple-only families made
up the largest proportion in inner city
areas (55%), whereas in metropolitan areas,
families with dependent children made up
the largest proportion (50%).
were employed as managers, administrators,
professionals or associate professionals. The
proportions in these more highly skilled
occupations ranged from 64% in inner
Melbourne to 49% in Perth; all higher
than the average of the five metropolitan
areas (39%).
Residents in inner city areas and metropolitan
areas also had different age profiles. For
example, in metropolitan areas the
proportion of children aged under 10 was
three times greater than that in inner city
areas (14% compared to 5%). In contrast,
inner city areas had a substantially higher
proportion of residents aged 20–29 years
(ranging between 30% and 38%) than in
metropolitan areas (an average of 16%).
Associated with differences in concentration
of people employed in more highly skilled
occupations, inner Melbourne had the highest
proportion of employed people who had a
gross weekly income of $800 or more (36%)
while inner Perth had the lowest (21%). Inner
Perth also had the highest proportion of
employed people with a weekly income of
less than $300 (27%). However, among inner
city residents who were employed, a greater
proportion were on high incomes compared
to the average of employed people living in
metropolitan areas.
Employment and income
In 1996, inner city areas tended to have a
higher unemployment rate than metropolitan
areas taken as a whole (with particularly high
rates in the inner city areas of Adelaide and
Perth – 11% and 15% respectively). However,
in all cities, among inner city residents who
were employed, relatively high proportions
Endnotes
1 Forster, C., & O'Connor, K. 1997, 'A new era for
the inner city?', Urban Policy and Research –
An Australian and New Zealand Guide to Urban
Affairs, vol. 15, no. 2, pp. 137–156.
2 Searle, G. 1991, 'Restructuring Sydney', New
Planner, December 1991, pp. 5–7.
3 Baird, M. 1994. 'Postcode 3000', Australian
Planner. 1994, vol. 31, no. 3, pp. 153–158.
170
• ABS • AUSTRALIAN SOCIAL TRENDS • 4102.0 • 1999
Culture and leisure
Page
RECREATION
How Australians use their free time
.........................
173
Using data from the 1997 Time Use Survey, this article examines some of
the factors, such as life stage and labour force status, that influence how
much free time we have and how we use it. The most popular free-time
activities enjoyed by Australians are also described.
CULTURE AND THE ARTS
Interests in the arts and cultural activities
...............
177
................................................
183
This article focuses on patterns of attendance at cultural venues,
participation in arts and cultural activities, numbers of people working in
cultural jobs, and those training to be artists. It also looks at people's
attitudes to the arts.
SPORT
Sporting Australians
While levels of participation in sport as a player have remained much the
same between 1993 and 1997, some changes have occurred. The most
popular sports played by children and adults (including Masters' sports)
are examined. Other involvements, such as coaching and refereeing, or
attending matches are discussed, as well as the costs associated with
sporting involvement and the reasons people discontinue playing sport.
LIFESTYLE
Information technology in the home
........................
189
During the 1990s, there has been rapid growth in household adoption of
computers and the internet. This article looks at how patterns of
computer ownership and usage vary in different households, between the
States and Territories, and by region. It also briefly looks at the use of
home computers for teleworking, electronic commerce and
internet-based shopping.
ABS • AUSTRALIAN SOCIAL TRENDS • 4102.0 • 1999 •
171
How Australians use
their free time
R E C R E A T I O N
In 1997, Australians
enjoyed an average of
over five hours of free
time per day. The most
popular free-time
activities were watching
TV and videos, and
socialising and talking.
Most people would agree that having free
time to relax, to enjoy the company of friends
and family, and to pursue interests beyond
their work, family or household commitments
(e.g. hobbies, entertainment, sport) is
important to their personal wellbeing.
However, individual perceptions about what
constitutes free time and how it is spent may
differ widely. For example, some people see
gardening as a chore (and time use surveys
generally classify it as a form of unpaid
household work) while others see gardening
as an absorbing and enjoyable hobby. On the
other hand, time use surveys generally classify
time spent on religious observance as free
time, while some people might view it as
committed time (see Types of free-time
activities box on page 175). Nevertheless,
time use data does provide a useful broad
indicator of how much free time Australians
have and how they use it.
How much free time do we have?
The amount of free time a person has is
largely determined by the nature and extent
of other demands on their time such as paid
work, education, family and household
commitments. ABS time use surveys define
free time as the amount of time left in the day
after time spent on sleeping, eating, personal
care (necessary time); paid work and formal
education (contracted time); and family and
household responsibilities and unpaid
Time use
Information on time spent on various activities is
taken from the 1997 ABS Time Use Survey. Time
use data was compiled from a household
questionnaire and a 48-hour diary of time use,
completed by respondents aged 15 years and
over. For each 5-minute time slot in the diary,
people could record up to 2 concurrent activities:
main activity refers to the first activity people
recorded;
secondary activity refers to the activity recorded
in response to the question, ‘What else were you
doing at the same time?’
Types of time
The entire day can be divided into the following
broad time use categories according to the types
of activities recorded as main activities:
necessary time refers to time spent on main
activities associated with personal care (e.g.
sleeping, eating and personal hygiene);
contracted time refers to time spent on main
activities such as paid work and formal education
where there are explicit contracts which control
the periods of time in which the activities are
performed;
committed time refers to time spent on main
activities to which a person has committed
him/herself through social or community
contracts. Includes time spent on family and
household responsibilities (e.g. child care,
housework, shopping) and unpaid voluntary
work; and
free time is the residual category and comprises
time spent on all other main activities including
religious observance, socialising and a range of
activities commonly associated with recreation
and leisure (e.g. sports, hobbies, watching TV).
See Types of free-time activities box on page 175.
Weekday/weekend time use, 1997
Weekday(a) Weekend(a) Total
Types of time
hrs:mins
hrs:mins
hrs:mins
Necessary
10:50
11:41
11:05
Contracted
4:36
1:26
3:41
Committed
3:45
4:12
3:53
Free
4:44
6:37
5:16
Men
4:48
7:07
5:29
Women
4:39
6:06
5:04
24:00
24:00
24:00
Total(b)
(a) Daily average for all persons aged 15 years and over.
(b) Includes a small amount of time unable to be classified
into a time use category.
Source: Unpublished data, Time Use Survey, 1997.
voluntary work (committed time). This
classification is based on the main activity
undertaken at any time.
In 1997, Australians enjoyed an average of
over 5 hours of free time per day –
4hrs:44mins on weekdays and 6hrs:37mins
on weekends. Men and women had roughly
the same amount of free time on weekdays,
but on weekends men averaged an hour more
free time per day than women. This is mainly
because women undertake a greater share of
child care and household work (see
Australian Social Trends 1999, Looking after
the children, pp. 39–41 and How couples
share domestic work, pp. 119–121) which,
unlike paid work, does not decrease on
weekends.
ABS • AUSTRALIAN SOCIAL TRENDS • 4102.0 • 1999
•
173
RECREATION
Free time and free-time activities, 1997
Average(a) daily
free time(b)
Free-time activities
Average(a) daily
time spent on all
free-time activities(c)
Men
Women
Men
Women
hrs:mins
hrs:mins
hrs:mins
hrs:mins
People with dependent children
4:15
4:03
7:59
7:42
Youngest child under 5 years
3:55
3:43
7:32
6:48
Youngest child 5–14 years
4:16
4:09
8:06
8:02
Youngest child 15–24 years(d)
5:05
4:41
8:46
9:12
People without dependent children 6:01
5:37
9:45
9:59
Main free-time activities refers to the first or only
free-time activity recorded in each time slot of the
time use diary. (See Time use box on previous
page.) For any person, the total amount of time
spent on main free-time activities is equal to their
total amount of free time.
Selected life stages
15–24 years
6:22
5:26
10:12
10:06
25–54 years
5:11
4:44
9:06
9:21
55–64 years
6:06
5:54
9:59
10:13
65 years and over
7:22
7:00
10:21
10:43
Employed full-time
4:23
4:00
8:16
8:13
Employed part-time
5:52
4:35
9:40
8:48
Not employed(e)
7:23
5:53
10:46
9:53
5:29
5:04
9:12
9:11
Labour force status
Total persons
(a) Daily average for all persons aged 15 years and over.
(b) Time spent on main free-time activities.
(c) Time spent on main free-time activities plus secondary free-time activities.
(d) Refers to full-time students (who are neither parents nor partners) living with their parents.
(e) Unemployed plus persons not in the labour force.
Source: Unpublished data, Time Use Survey, 1997.
A person's labour force status is a major
determinant of how much free time they have.
People who are not engaged in paid work
(unemployed or not in the labour force) have
more free time than those who work
part-time, and those who work part-time have
more free time than those employed full-time.
While this is true for both men and women,
the effect is less marked for women. Women
exchange less of their non-contracted time for
free time than men do (again reflecting
women's greater involvement in committed
activities).
Family responsibilities are also an important
determinant of how much free time a person
has. In 1997, people with dependent children
had significantly less free time than people
without dependent children. Women with
dependent children had an average of
1hr:34mins less free time per day than
women without dependent children. Men
with dependent children had 1hr:46mins less
free time per day than men without
dependent children. Parents with young
children (youngest under 5 years) had the
least free
174
• ABS • AUSTRALIAN SOCIAL TRENDS • 4102.0 • 1999
Secondary free-time activities were done at the
same time as some other main activity. Secondary
free-time activities may have been combined with
a main free-time activity (in free time) or a
different type of main activity such as work, child
care or eating (not in free time).
All free-time activities comprise main free-time
activities plus secondary free-time activities. For
most people, time spent on all free-time activities
is greater than their total amount of free time.
time. The amount of free time available to
parents with dependent children gradually
increased with the age of their youngest child.
The amount of free time available to people
without dependent children is largely a
function of their labour force participation,
household responsibilities and, to a lesser
extent, family responsibilities. Those aged
25–54 years had the least free time, reflecting
high labour force participation for both men
and women, some family commitments (since
most have partners) and substantial
household commitments. Despite their
relatively high rates of participation in formal
education, younger people (aged
15–24 years) without dependent children had
more free time than 25–54 year olds. This
reflects the younger group's relatively low
participation in full-time employment, and
fewer household responsibilities, since a
relatively high proportion are still single and
live with their parents. At the other end of the
age spectrum, people aged 65 and over
(without dependent children) had the most
free time, due to their having very few work
or family commitments.
Women have less free time than men
regardless of age, employment status or
family responsibilities. However, the
difference between men and women is much
less among those groups with the least free
time (parents with dependent children under
15 and people in full-time employment).
Free time and free-time activities
The amount of free time available has an
important influence on how much time a
person can spend on recreation, leisure and
other free-time activities. However, people
frequently undertake more than one activity
RECREATION
Average(a) daily time spent on free-time activities, 1997
Main activity
All activities(b)
Average daily
time
Average daily Participation
time
rate(c)
Free-time activities
hrs:mins
hrs:mins
%
Watching TV/videos
2:01
2:45
87.6
Socialising/talking (including phone)
0:47
2:07
74.7
Listening to radio/records/tapes/CDs
0:08
1:20
56.9
Reading
0:25
0:36
48.0
Sport and outdoor activities
0:27
0:28
27.1
Games/hobbies/arts/crafts
0:16
0:20
19.6
Resting/relaxing/doing nothing
0:13
0:16
21.2
Attending entertainment/sports events
0:07
0:07
5.8
Other
0:53
1:11
68.1
Total
5:16
9:11
99.4
(a) Daily average for all persons aged 15 years and over.
(b) Main free-time activities plus secondary free-time activities.
(c) The number of people who reported taking part in an activity over a two-day period,
expressed as a percentage of the population aged 15 years and over.
Source: Unpublished data, Time Use Survey, 1997.
at the same time (e.g. socialising while
playing tennis, watching TV while looking
after children, or listening to the radio while
travelling to work). Consequently, for most
people, the total amount of time spent on all
free-time activities is greater than their total
amount of free time (time spent on main
free-time activities). In 1997, people spent an
average of 9hrs:11mins per day on free-time
activities – 3hrs:55mins (74%) more than their
available free time.
Women are more likely than men to do more
than one thing at a time (or at least to report
having done so). Consequently, they managed
to spend about the same amount of time, on
average, as men on free-time activities even
though they had 25 minutes less free time per
day. In general people who had less free time,
spent proportionally more time on secondary
free-time activities. For example, people in
full-time employment spent 94% more than
their available free time on free-time activities,
while people who were not employed spent
59% more.
Some free-time activities were more often
undertaken as secondary activities than main
activities. For example, Australians spent an
average of 2hrs:7mins per day socialising or
talking but only 47 minutes per day as a main
activity. They also spent an average of
1hr:20mins per day listening to radio,
records, tapes or CDs but only 8 minutes per
day as a main activity. Watching TV or
Types of free-time activities
For the purposes of this article, free-time activities
were aggregated into the following groups:
Socialising/talking (including phone) –
includes entertaining guests at home, meeting
others away from home, conversations about
social/recreational activities, and all general
conversation;
Attending entertainment/sports events –
includes attendance at movies/cinema,
theatre, concert, library, museum, zoo/botanic
garden, amusement park, sports, racing and
other mass events;
Watching TV/videos – includes listening;
Listening to radio/records/tapes/CDs;
Reading – includes books, CD-ROM,
newspapers, magazines, brochures, etc.
Excludes letters. Excludes reading for
study/research purposes;
Resting/relaxing/doing nothing – includes
dozing, staying in bed or going back to bed;
Sport and outdoor activities – includes
participation in organised or informal sport,
exercising, walking, hiking/bushwalking,
fishing, holiday travel/driving for pleasure,
camping, spending time in an outdoor setting.
Excludes gardening;
Games/hobbies/arts/crafts – includes cards,
board games, puzzles, computer games,
arcade games, gambling, arts (e.g. painting
drawing, writing, composing, performing),
collecting, handwork and crafts such as
sewing, knitting (excluding clothing), wood
and metal work (excluding furniture and
home repairs), spinning, weaving, etc; and
Other – includes religious activities such as
prayer (alone or with others), attending
church services, wedding/funeral/christening
ceremonies; community participation (e.g.
community meetings); attendance at
recreational courses (e.g. art/craft/hobby
courses, do-it-yourself courses, personal
development courses); and other activities
such as thinking and worrying.
videos as a secondary activity also contributed
significantly (44 minutes per day) to the total
time spent watching TV or videos.
Most popular free-time activities
Australians prefer the more leisurely free-time
pursuits such as watching TV, talking,
socialising, listening to the radio and reading.
The 1997 Time Use Survey found that 88% of
the population spent some time watching TV
or videos during the two-day reference
period, 75% spent some time socialising or
talking, 57% listened to the radio, records,
tapes or CDs, and 48% spent some time
reading. Only 27% participated in sports or
outdoor activities and only 6% attended an
entertainment or sports event. However,
because of the relatively short reference
period (two days), participation rates for
ABS • AUSTRALIAN SOCIAL TRENDS • 4102.0 • 1999
•
175
RECREATION
Average daily time(a) spent on all free-time activities(b) for selected life stages, 1997
With dependent children
Without dependent children,
and aged 15–24 years
Without dependent children,
and aged 65 years and over
Average daily
time spent
Participation
rate(c)
Average daily
time spent
Participation
rate(c)
Average daily
time spent
Free-time activities
hrs:mins
%
hrs:mins
%
hrs:mins
Watching TV/videos
2:17
85.6
2:47
86.0
3:40
93.6
Socialising/talking (including phone)
2:06
78.7
2:35
76.0
1:36
68.4
Listening to radio/records/tapes/CDs
1:10
56.2
1:12
52.7
1:29
56.5
Reading
0:28
45.5
0:22
33.0
1:10
67.1
Participation
rate(c)
%
Sport and outdoor activities
0:21
23.2
0:37
31.5
0:30
30.0
Games/hobbies/arts/crafts
0:12
14.5
0:26
24.8
0:35
29.2
Resting/relaxing/doing nothing
0:13
19.4
0:12
15.1
0:34
35.7
Attending entertainment/sports events
0:06
5.1
0:12
8.8
0:05
4.5
Other
0:56
64.7
1:48
79.2
0:54
60.5
Total
7:50
99.1
10:09
99.7
10:33
99.9
(a) Daily average for all persons aged 15 years and over.
(b) Main free-time activities plus secondary free-time activities.
(c) For any group, the number of people who reported taking part in an activity over a two-day period, expressed as a percentage of the population in the same
group.
Source: Unpublished data, Time Use Survey, 1997.
some activities, particularly those which are
undertaken infrequently, are likely to be
lower than participation rates derived from
other surveys using longer reference periods
(e.g. two weeks or longer).
Australians spent more time watching TV and
videos (2hrs:45mins per day) than on any
other free-time activity. They spent
2hrs:7mins per day talking and socialising,
1hr:20mins listening to the radio, records,
tapes or CDs, and 36 mins per day reading.
On average, women spent more time than
men socialising and talking (27 minutes more
per day). Men spent more time than women
on sports and outdoor activities (14 minutes
more per day) and watching TV and videos
(8 minutes more per day).
Life stage and free-time activities
Regardless of life stage, the most popular
free-time activities are watching TV and
videos, talking and socialising, and listening
to the radio, records, tapes or CDs (in that
order). However there are differences
between life-stage groups in the amount of
time spent on various free-time activities. For
example, older people (aged 65 years and
over) without dependent children spend
more time than other life-stage groups on
most free-time activities, particularly watching
TV and videos, and reading. In 1997, they
spent an average of 3hrs:40mins per day
watching TV and videos, 53 minutes more
than young people (aged 15–24) without
176
• ABS • AUSTRALIAN SOCIAL TRENDS • 4102.0 • 1999
dependent children, and 1hr:23mins more
than parents with dependent children. Older
people without dependent children spent an
average of 1hr:10mins per day reading,
three times more than young people without
dependent children (who spent less time
reading, other than for study or research, than
any other life-stage group). Older people also
spent the most time on resting, relaxing,
doing nothing; games, hobbies, arts, crafts;
and listening to the radio, records, tapes or
CDs. On the other hand, they spent the least
time talking and socialising, an average of
1hr:36mins per day. This is because a
relatively large proportion of older people
live alone, and those who do, spend more
time alone than any other life-stage group
(see Australian Social Trends 1999, Spending
time alone, pp. 35–38).
In contrast, young people without dependent
children spent the most time socialising and
talking, an average of 2hrs:35mins per day.
They also spent more time than other
life-stage groups on sport and outdoor
activities (an average of 37 minutes per day)
and attending entertainment and sports
events (an average of 12 minutes per day).
Parents with dependent children spent the
least time watching TV and videos (an average
of 2hrs:17mins per day), sport and outdoor
activities (21 minutes per day) and games,
hobbies, arts and crafts (12 minutes per day).
They also spent the least time on free-time
activities overall.
Interests in the arts
and cultural activities
C U L T U R E
In the 12 months to
March 1995, around
11.7 million people
(83% of all people
aged 15 years and
over) had attended at
least one cultural
venue or activity.
Attendance was
A N D
T H E
A R T S
The arts in Australia reflect the diverse
cultural identity of its people. Information
about the arts and people's involvement in
cultural activities is fundamental to
developing an appreciation of our culture and
the impact it has in both social and economic
terms. People can be involved in cultural
activities in several ways – for example, by
attending performances or venues, or as a
performer, artist or other worker in the field.
This article focuses on patterns of patronage
for the arts, numbers of people working in
cultural jobs and those training to be artists.
It then looks at people's attitudes to the arts.
The arts and cultural activities
The information presented in this review
concerning levels of attendance at cultural and
leisure venues comes from the Survey of
Attendance at Selected Culture/Leisure Venues,
conducted in March 1995 as a supplement to the
Monthly Population Survey (MPS). The survey
provided data for people aged 15 and over in
private and non-private dwellings.
The information concerning public attitudes to the
arts comes from a set of questions included in the
November 1997 Population Survey Monitor (PSM).
The PSM is a quarterly household survey of people
aged 18 years and over from approximately 3,000
households, and covers rural and urban areas
across all States and Territories.
generally higher for
women, and lower for
Numbers attending
people aged 65
Cultural activities contribute to the quality of
life, and take many forms. They can range
from taking a stroll through a botanical
garden to watching an opera or ballet
performance.
and over.
popular cultural venue was the cinema, with
8.7 million people (62% of the population)
having gone to the cinema in the 12-month
reference period. Other venues which were
popular included botanical gardens, which
had been visited by 39% of the population,
libraries (38%) and animal and
marine parks (35%).
Around 11.7 million people (83% of all
people aged 15 years and over) had been to at
least one of the cultural venues and activities
included in the supplementary questions in
the Monthly Population Survey referring to
the 12 months to March 1995. The most
Attendance(a) at cultural venues, 1995
Attendance rate
Total attending
Males
Females
Capital city Rest of State Persons
Persons
%
%
%
'000
%
%
Cinema
58.8
65.2
67.0
54.1
62.1
8 733.8
Botanic garden
35.5
41.3
42.9
31.2
38.5
5 410.5
Library
32.2
44.4
..
..
38.4
5 403.1
Animal or marine park
32.8
37.7
38.3
30.4
35.3
4 966.0
Museum
27.0
28.5
28.7
26.1
27.8
3 905.6
Popular music concert
26.9
27.0
27.6
25.8
26.9
3 790.7
Art gallery
19.0
25.4
23.6
20.1
22.3
3 134.1
Opera or music theatre
14.7
23.8
22.1
14.8
19.3
2 722.1
Other performing arts
17.5
19.9
17.9
20.1
18.7
2 634.4
Theatre
13.1
20.0
17.8
14.7
16.6
2 336.3
Dance
7.4
12.5
11.1
8.2
10.0
1 407.5
Classical music concert
6.3
9.0
8.8
5.8
7.7
1 081.3
(a) Attendances are for those aged 15 years or over.
Source: Attendance at Selected Cultural Venues, March 1995 (Cat. no. 4114.0).
ABS • AUSTRALIAN SOCIAL TRENDS • 4102.0 • 1999
•
177
CULTURE AND THE ARTS
Attendance rates
Attendance at festivals
For each type of cultural venue identified in
the 1995 survey, women had a higher
attendance rate than men. The difference was
most marked for libraries (44% of women had
been to a library compared with 32% of men)
and opera and music theatre (24% and 15%
respectively).
According to information collected from the PSM,
about 2.9 million Australians (22% of the
population aged 18 years and over) attended at
least one art and cultural festival in the 12 months
prior to September 1996. These people
accounted for 4.1 million attendances at festivals,
an average of 1.4 attendances per person.
Attendance rates for people living in capital
cities were higher than those living elsewhere
for each of the venues (except those included
in the category 'other performing arts', which
were not separately identified). To some
extent, these differences would arise because
some venues are more accessible to people
living in capital cities. For example, most zoos
and major botanical gardens are located in
the capital cities. Similarly, performances such
as operas and musicals may be staged only in
capital cities.
Over half of attendances were at multi-arts
festivals (2.7 million attendances), such as the
Sydney Festival and Carnivale and the Melbourne
International Festival of the Arts. The next most
attended was popular music festivals (0.6 million
attendances) and film/video festivals (0.3 million
attendances). Attendance rates were highest
amongst the younger age groups (31% of 18–24
year olds) and declined steadily with age (10% of
persons aged 65 years and over).
Attendance at festivals, 1996
Attendance rate
Males
The slightly higher attendance rate of people
living outside the capital cities at other
performing arts (20%, compared with 18% of
those in capital cities) was mainly due to their
higher attendance at circuses (11% and 6%
respectively).
Females Persons
Age group (years)
%
%
%
18–24
28.5
33.4
30.9
25–34
25.5
25.2
25.3
35–44
21.8
23.6
22.7
In general, attendance rates at venues were
highest for people in the younger to middle
age groups, with persons 65 years and over
usually participating at much lower rates than
people in other age groups.
45–54
19.6
25.5
22.5
55–64
15.6
19.5
17.5
9.4
9.9
9.7
20.8
23.0
21.9
People aged 15–17 years had the highest
attendance rates at theatre (27%) and the
cinema (90%); those aged 18–24 were most
likely to attend popular music concerts (49%);
Source: Population Survey Monitor, November 1995 to
September 1996, published in Cultural Trends in
Australia No. 6: Attendance at Festivals, Australia,
Department of Communications and the Arts.
65 and over
Total
Attendance rates at cultural venues by age, 1997
Age group (years)
15–17
18–24
25–34
35–44
45–54
55–64
65+
%
%
%
%
%
%
%
Cinema
89.7
86.1
73.0
67.3
56.9
41.8
28.9
Botanic garden
39.1
42.7
41.5
41.4
39.0
36.0
27.8
Library
54.9
41.2
37.2
44.8
36.6
31.3
30.2
Animal or marine park
40.3
41.7
46.7
41.7
30.5
26.8
15.5
Museum
33.1
26.5
29.5
34.6
29.3
25.6
16.0
Popular music concert
36.1
48.7
34.5
26.9
22.5
14.4
7.5
Art gallery
24.9
22.6
21.3
23.7
26.8
23.3
15.2
Opera or music theatre
19.6
19.7
17.8
19.5
24.7
20.2
14.6
Other performing arts
22.3
25.8
25.2
21.7
15.8
11.2
7.1
Theatre
26.5
17.8
18.0
17.7
18.2
14.4
8.7
Dance
12.5
11.1
9.9
11.7
11.5
8.1
5.8
6.2
6.4
8.1
10.5
9.4
6.9
Classical music concert
5.6
Source: Public Attitudes to the Arts, Australia, November 1997 (Cat. no. 4157.0), jointly published with the Australia Council.
178
• ABS • AUSTRALIAN SOCIAL TRENDS • 4102.0 • 1999
CULTURE AND THE ARTS
and those aged 25–34 had the highest
attendance rate at animal and marine parks
(47%). This age group contains a substantial
number of people with young children.
People aged 35–44 years had the highest
attendance rate at museums (35%), possibly
because they take their teenage children there
(those aged 15–17 also had a high attendance
rate, 33%). Older people aged 45–54 years
had the highest attendance rates at art
galleries (27%), classical music concerts
(11%), and opera or music theatre (25%).
Attendance rates also varied according to
country of birth. Overseas-born people were
more likely to visit a botanical garden (41%
compared with 37% for Australian-born
people). On the other hand, Australian-born
people were more likely to go to cultural
activities such as popular music performances
(28% compared with 23% for overseas-born
people) and the cinema (65% compared
with 54%).
People with paid involvements in
culture/leisure activities(a), 1997
Paid
involvements(b)
Type of activity
Heritage organisations
no.
8 700
Proportion
paid as
part of
main job
%
55.2*
Museums
10 200
61.8*
Art galleries
12 600
54.0
Botanic gardens
3 700*
64.9*
Animal/marine parks
8 800
52.3*
Writing
213 600
59.7
Publishing
66 000
68.8
Libraries or archives
48 600
82.5
Music
73 800
27.6
Performing arts
37 500
35.7
Art activities
Drawing
48 600
56.4
Painting
48 700
42.7
Travelling time
Sculpture
13 600
52.9
The number and location of cultural venues
varies according to the type of venue (for
example, cinemas are located in most
regions), and travelling time can be an
important factor in deciding whether to
attend an arts event.
Photography
43 900
53.3
Print making
18 900
71.4
Electronic art
36 100
Travel time to the cinema appeared to be the
shortest. About 91% of those living in
metropolitan areas said they were able to get
to a cinema within half an hour; the
equivalent figure for rural dwellers was 74%.
Performing arts venues were the next most
convenient – 61% of metropolitan residents
said they could reach their performing arts
venue within half an hour, compared with
57% of rural residents.
Art galleries were recorded as the least
accessible, with 51% of people in
metropolitan areas, and 61% in rural areas
living within half an hour of their nearest
gallery.
Numbers undertaking cultural work
Excluding involvements undertaken solely as
a hobby (some 2.6 million people), the ABS
Survey of Work in Selected Culture/Leisure
Activities found that in the 12-month period
to March 1997, 2.2 million people (15% of all
people aged 15 years and over) had
undertaken some work in at least one of the
culture/leisure activities listed in the table
opposite. Many of these people did these
Other art
6 300*
71.7
57.1*
Craft activities
Pottery/ceramics
23 500
51.1
Textiles
24 800
52.0
Jewellery
11 500
59.1
Furniture/wood crafts
44 200
46.4
Glass crafts
Other crafts
Design
Film production
9 000
30 400
44.4*
43.8
161 700
72.2
18 700
54.5
Radio
22 900
54.6
Television
36 400
65.9
176 700
62.1
Teaching
cultural activities
Fete organising
9 200
54.3*
Festival organising
28 900
50.2
Art/craft
show organising
21 500
53.0
Arts organisations/
agencies
10 600
56.6*
877 000
60.0
All persons
(a) Persons aged 15 years and over involved at some time
in the 12-month period up to March 1997.
(b) As a person can work in more than one activity, the sum
of involvements exceeds the total number of persons
involved.
Source: Work in Selected Culture/Leisure Activities,
Australia, March 1997 (Cat. no. 6281.0)
ABS • AUSTRALIAN SOCIAL TRENDS • 4102.0 • 1999
•
179
CULTURE AND THE ARTS
archives (83% of involvements were part of a
main job), design (72%), electronic art (72%)
and print-making (71%). Paid cultural
activities that were least likely to be part of a
main job included those involved in music
(28%) and the performing arts (36%).
People training to be artists
In 1997, there were about 21,000 enrolments in
higher education courses in the field of visual and
performing arts1 in Australia. Enrolments in visual
arts courses dominated, with 13,200 enrolments
(62%). Fine arts was the most popular field of
study, representing 22% of all enrolments in visual
and performing arts, followed by visual arts
(general) (16%) and graphic arts and design
(15%). There were 6,500 enrolments (31%) in the
performing arts, where music was the main
activity with 4,200 enrolments (20% of all visual
and performing arts enrolments).
What is meant by 'the arts'?
'The arts' is an umbrella term, which people
interpret differently. The November 1997
Population Survey Monitor, which asked
questions about attitudes to the arts, showed
that people included different activities in
their definition of 'the arts'. When presented
with a list of activities, about eight in ten
people included more traditional forms of
cultural expression such as plays, ballet,
opera (81%) and music (80%), while fewer
than four in ten (35%) included architecture
and design.
In addition, there were close to 40,000
enrolments in 1997 in TAFE and private vocational
training colleges in the field of visual and
performing arts.2 Graphic arts and design, and
fine arts were the most popular courses,
representing 17% and 16% of all enrolments in
the field respectively.
Activities included in 'the arts' varied between
people in different age groups, and also
depended on their level of education. Those
with a bachelor degree or higher, and those in
the younger and middle age groups (18–34
and 35–54), included a wider range of
activities as part of the arts than others.
activities on a voluntary basis, and often for
only a short period of time.
The number of people who received some
payment for their work in these activities
totalled 877,000 – 523,400 (60%) received
payment for work done as part of their main
job. This included 127,500 people who had a
writing involvement as part of their main job
(e.g. a journalist or author) and 116,800
people whose design work was part of their
main job (e.g. a graphic, interior or fashion
designer). Another 109,800 people taught
cultural activities as part of their main job.
The importance of cultural venues
in communities
Despite varying opinions about what was
considered to be 'the arts', most people
thought it was important to have cultural
venues in their communities. More than nine
in ten (95%) of the population rated libraries
as important or very important, and more
than seven in ten thought the other venues
Some paid cultural activities were more likely
to be associated with a main job than others.
Those where a high proportion formed part
of a main job included jobs in libraries and
Activities that people included in 'the arts', 1997
Age group
Level of education
18–34
years
Bachelor
degree
or higher
35–54
years
55 years
and over
Other
post-school
qualification
No
post-school
qualification
Total
%
%
%
%
%
%
%
Plays, ballet, opera
82.4
83.3
75.5
94.9
85.0
74.7
80.9
Architecture, design
42.1
36.6
24.1
54.7
38.0
28.5
35.2
Painting, drawing, sculpture
79.4
80.8
69.2
91.0
80.6
71.8
77.2
Photography
Literature, books, poetry
60.7
67.1
55.2
65.3
41.8
49.1
78.2
91.0
57.2
66.3
45.1
51.3
53.5
61.6
Music (concerts, orchestra, singing)
79.9
84.3
72.6
97.2
83.7
72.9
79.7
Craft, pottery, weaving
57.6
54.5
48.1
66.6
58.1
48.1
53.9
'000
'000
'000
'000
'000
'000
'000
Persons
4 627.3
5 187.4
3 566.7
1 649.6
4 797.9
6 934.0
13 381.5
Source: Public Attitudes to the Arts, Australia, November 1997 (Cat. no. 4157.0), jointly published with the Australia Council.
180
• ABS • AUSTRALIAN SOCIAL TRENDS • 4102.0 • 1999
CULTURE AND THE ARTS
Importance of cultural venues(a), 1997
Did not
Attended attend
Total
%
%
%
Government funding for cultural
facilities and services, 1996–97
Level of government
funding
Libraries
99.7
92.3
95.4
Cultural facilities and services $m
Art galleries
91.1
65.4
71.5
Libraries and archives
696.8
44.4
Museums
85.7
74.0
76.6
Museums
216.7
13.8
76.1
Performing arts venues
and arts centres
188.3
12.0
Art galleries
Performing
arts venues
84.6
67.3
(a) Proportion of people perceiving cultural venues as
important or very important.
%
122.9
7.8
Cultural heritage
Other performing arts
89.8
89.9
5.7
5.7
Zoological
and botanic gardens
80.4
5.1
included in the survey (museums, performing
arts venues and art galleries) were either
important or very important.
Music (excluding opera)
40.2
2.6
Visual arts/crafts
and photography
28.7
1.8
This statement of support came from people
whether or not they attended or used these
facilities. For example, among those people
who had not been to an art gallery in the
previous 12 months, 65% rated them as being
important or very important in their
community, while 92% of those who had not
been to a library rated libraries in the same
way.
Literature and publishing
Source: Public Attitudes to the Arts, Australia, November
1997 (Cat. no. 4157.0), jointly published with the Australia
Council.
Funding for cultural activities and
services
Most people were also in favour of
governments providing some financial
support for the arts and cultural facilities.
Libraries were the most supported of the four
services and activities that were identified in
the survey. Over 90% of the population
Support for some government funding of selected cultural
facilities(a), 1997
Libraries
Total
14.5
0.9
1 568.1
100.0
Source: Cultural Funding, Australia, 1996–97
(Cat. no. 4183.0).
believed libraries should receive some
government funding, while more than half the
population thought live theatre, art galleries
and orchestras were also deserving of
financial assistance.
Governments support a wide range of cultural
activities and venues. For example, zoological
and botanic gardens, museums and historic
sites along with art galleries and libraries are
all supported. Government funding for
'cultural facilities and services' (facilities
included are listed in table above) totalled
$1,568 million in 1996–97. Of this,
approximately 16% ($253 million) was
provided by the Commonwealth Government,
48% ($752 million) by the State and Territory
governments and 36% ($564 million) by local
government. The largest proportion (44%) of
government funding for cultural activities and
services was directed to libraries. This was
followed by museums (14%) and performing
arts venues and arts centres (12%).
Art galleries
Being well-informed about the arts
Live theatre
Orchestras
0
20
40
60
Proportion of people (%)
80
100
(a) Proportion of people who support some government funding.
Source: Public Attitudes to the Arts, Australia, November 1997 (Cat. no 4157.0), jointly published
with the Australia Council.
Most people surveyed in the 1997 PSM
believed they were well-informed about sport
but many thought they were less informed
about the arts. A quarter of the population
(25%) felt they were not adequately informed
about the arts, whereas only 7% said they
were not adequately informed about sport.
These opinions varied between men and
women. Women were more likely than men
to say they were not well-informed about
ABS • AUSTRALIAN SOCIAL TRENDS • 4102.0 • 1999
•
181
CULTURE AND THE ARTS
'the arts' (28% and 21%, respectively).
However, a higher proportion of men (22%)
than women (14%) said they had no interest
in the arts.
The most commonly used sources of
information about the arts were newspapers,
magazines or books (69%). Television (63%)
was used slightly less as a source, and only
one third (35%) of the population said that
radio was a primary source for information
about arts activities.
182
• ABS • AUSTRALIAN SOCIAL TRENDS • 4102.0 • 1999
Endnotes
1 Department of Employment, Education, Training
and Youth Affairs 1997, Higher Education
Student Statistics, 1997 (unpublished data)
(excludes enrolments in courses such as arts
therapy and arts teaching).
2. National Centre for Vocational Education
Research Ltd. 1997, Australian Vocational
Education Training Statistics, 1997
(unpublished data).
Sporting Australians
S P O R T
The most popular
sports for players in
Australia in 1997–98
were swimming,
aerobics and golf. The
most popular sports for
spectators were
Australian Rules
football, horse racing
and Rugby League.
Australia has long been regarded as a
sporting nation. Its performance compared
with other countries in elite sports
competitions, such as the Commonwealth and
Olympic games, are testimony to the high
profile given to sport in Australia's culture. In
the most recent Commonwealth Games
(Kuala Lumpur, 1998), Australia won the most
medals. Australia also ranked among the
leading nations in the 1996 Olympic Games in
Atlanta (USA), where it finished with the fifth
highest number of medals won. Moreover, of
the top ten nations, Australia and Cuba won
the most medals per head of population
(2.3 medals per million people) – followed by
Germany (0.8) and France (0.6).1,2
Underpinning these successes are high levels
of participation among school children and
adults in a wide variety of sporting and
physical activities. Because of the health
benefits a physically active life-style promotes,
this is encouraged for all age groups as a
matter of public policy. Most recently, a
national framework for participation in
physical activity known as Active Australia,
was endorsed by the Commonwealth
Government in 1996. Active Australia has the
aim of encouraging people's active
involvement in sport, community recreation,
fitness, outdoor recreation and other physical
activities.3
Involvement in sport, 1993 and 1997
1993
Participation
Number
Participation
Type of involvement
'000
%
'000
%
Players
3 963.6
29.1
4 115.2
28.5
Paid
57.0
0.4
142.6
1.0
3 906.5
28.7
3 972.6
27.5
1 419.7
10.4
1 655.9
11.5
Unpaid
Paid(b)
166.1
1.2
203.9
1.4
Unpaid
1 253.6
9.2
1 452.0
10.1
4 504.9
33.1
4 669.8
32.4
213.3
1.6
328.5
2.3
4 291.6
31.6
4 341.3
30.1
Players and non-players(c)
Paid
Unpaid
This review draws on a number of recent ABS
surveys concerned with measuring people's
involvement in sporting and physical activities in
Australia. As the surveys have had different aims,
they were not conducted in a consistent way with
respect to the populations included, nor in the
way in which activities were defined.
Information from the two Involvement in Sport
surveys, conducted in March 1993 and March
1997, refers to people aged 15 years and over
who were involved in sport on one or more
occasions during the 12 months prior to the
survey. 'Involvement' in sport was defined to
include both playing and non-playing activities in
paid and unpaid capacities, excluding spectators.
It was also defined to generally include both
social and competition involvement. However,
participation in some sports (such as swimming,
aerobics and billiards) was recorded only when it
was undertaken for competitive reasons.
Two surveys of Participation in Sport and
Physical Activities were undertaken by the ABS in
1996–97 and 1997–98, both as part of the ABS
survey known as the Population Survey Monitor.
The data relating to 1996–97 refers to
participation in sport which was organised by a
club, association or school and included
additional information for children aged 5–14
years. Information from the 1997–98 survey, on
the other hand, was limited to persons aged 18
years of age and over. It defined sport to include
both social and organised activities, but excluded
running, jogging and walking activities that were
not organised by a club or association. For both
years, the term 'participant' is defined as a person
who physically undertakes the activity, excluding
persons involved in a non-playing capacity only.
1997
Number
Non-players(a)
Sport and physical activities
(a) Includes players with non-playing involvement.
(b) Refers to those who received some payment for their non-playing involvement only.
(c) Persons who are involved both as players and non-players are counted only once.
Source: Involvement in Sport, Australia, 1997 (Cat. no. 6285.0); and unpublished data, 1993
Involvement in Sport Survey.
Many businesses also contribute to the
promotion of sport and the support of elite
athletes – 22,700 businesses sponsored sport
in 1996–97, injecting more than $280 million
into sporting events, clubs, teams and
individuals.4 There are economic benefits for
these and other businesses and the
community at large through a diverse range of
commercial activities, including the
manufacture and sale of clothing and
equipment, attendance at sports events and
associated tourism.
Involvement in sport
In the 12-month period to the end of March
1997, the Involvement in Sport survey showed
that 4.7 million people (32% of all people
ABS • AUSTRALIAN SOCIAL TRENDS • 4102.0 • 1999
•
183
SPORT
Proportions of men and women playing sport, 1993 and
1997
1993
1997
Men
Women
Men
Women
Age group (years)
%
%
%
%
15–24
55.5
39.4
57.9
40.0
25–34
42.5
28.1
42.7
25.7
35–44
32.3
20.7
32.8
17.6
45–54
25.0
14.8
25.2
14.3
55–64
21.1
14.5
23.2
14.8
65 and over
20.3
12.2
22.2
12.9
Total
35.3
23.1
35.7
21.5
'000
'000
'000
'000
2 382.1
1 581.5
2 536.4
1 578.8
Total playing sport
Recent trends
Source: Involvement in Sport, Australia, 1997 (Cat. no. 6285.0); and unpublished data, 1993
Involvement in Sport Survey.
aged 15 years and over) were involved in
playing or organising a sport on at least one
occasion. Over 4.1 million people (29%) had
played a sport, and 1.7 million (12%) (many
of whom were also players) were involved as
coaches, referees, administrators or in some
other non-playing capacity.
The 1997–98 Survey of Sport and Physical
Activities recorded even higher participation
rates. This survey included social sports and
physical activities, but excluded running,
jogging or walking when it was not organised
by a club or association. In 1997–98, 48% of
persons aged 18 and over had participated, as
a player, in a sport or physical activity on at
least one occasion over the previous
12 months.
Irrespective of the measure used,
participation rates were substantially higher
for men than women and for young adults
than older people. Using the broader measure
Main organised sports played by children(a), 1996–97
Boys
Girls
Players
Players
Sport or activity
'000
Sport or activity
'000
Soccer (outdoor)
208.6
Netball
220.7
Australian Rules football
183.7
Swimming
177.7
Cricket (outdoor)
165.2
Dancing
133.5
Swimming
154.1
Tennis
99.3
Basketball
152.9
Basketball
82.6
Tennis
104.5
Gymnastics
57.5
(a) Children aged 5–14 years.
Source: Participation in Sport and Physical Activities, Australia, 1996–97 (Cat. no. 4177.0).
184
of participation from the 1997–98 survey, for
instance, participation rates among men
declined from 78% for those aged 18–24 to
25% for those aged 65 years and over, while
among women they declined from 64% to
19% for the equivalent age groups.
• ABS • AUSTRALIAN SOCIAL TRENDS • 4102.0 • 1999
Over the short period for which comparative
figures are available (1993 and 1997), levels
of participation in sport as a player remained
much the same (about 36% for men and
22% for women, as measured by the
Involvement in Sports surveys). However,
some small changes are apparent. This was
particularly so among women in the 25–34
and 35–44 year age ranges, where their levels
of participation in sport fell by about two
percentage points. Against this trend, small
increases appear to have occurred in
participation rates among older men and
women.
A notable change, among players in
particular, has been the increase in numbers
of people being paid for their involvement in
sport. In 1997, 142,600 people were paid for
playing a sport, compared with 57,000 in
1993. The number of paid players as a
proportion of all players (3.5% in 1997) has
nonetheless remained quite small. The
number of paid non-players also increased,
but to a lesser extent – an increase of 37,800
people to a total of 203,900 people in 1997.
Popular sports and physical
activities
The level of involvement in particular sports
varies greatly by the age of the players, and
although most sports are played by both men
and women, some, such as cricket and
netball, are much more likely to be
dominated by one group than another. A
feature of children's involvement in sport,
apart from having much greater participation
than adults, is that they are more likely to play
a team sport requiring larger numbers of
players. The opportunity that team sports
provides for teaching social skills and the
convenience of arranging group activities for
children, who have comparatively large blocks
of free time, are likely to be among the main
reasons for the difference.
.. played by children
In 1996–97, 61% of children aged 5–14
(1.6 million altogether) had played a sport
organised by a club, association or school in
the previous 12 months. As with adults, boys
(65%) were more likely to have participated
SPORT
Adult participation in main sports and physical
activities(a), 1997–98
Men
Women
Players
Sport or activity
Masters' sports
'000
Players
Sport or activity
'000
Golf
873.7
Swimming
896.0
Swimming
732.8
Aerobics/fitness
876.2
Aerobics/fitness
503.0
Tennis
474.2
Fishing
477.2
Netball
285.8
Tennis
463.6
Golf
242.5
Cycling
407.3
Cycling
218.6
Billiards/pool/snooker
242.6
Tenpin bowling
217.3
Cricket (outdoor)
229.4
Fishing
164.3
Surf sports
225.0
Horse riding
154.2
Tenpin bowling
220.7
Billiards/pool/snooker
130.5
(a) Refers to persons aged 18 and over.
Source: Participation in Sport and Physical Activities, Australia, 1997–98 (Cat. no. 4177.0).
than girls (57%). For the large majority of
children who had played an organised sport
(87%), it had been organised by a club.
However, 34% of children involved in an
organised sport had participated in a
school-organised sport out of school hours.
Taking boys and girls together, the two most
popular organised sports among children in
1996–97 were swimming and basketball
(331,900 and 235,500 participants) with
netball (233,700 participants – dominated by
girls) and outdoor soccer (228,800
participants – dominated by boys) following
closely behind. The most popular organised
sport among boys in 1996–97, with 208,600
participants, was outdoor soccer. Other
football codes including Australian Rules and
to a lesser extent Rugby League (183,700 and
84,400 participants) were also popular.
Cricket (outdoor – 165,200) was the third
most popular organised sport played by boys.
Dancing and gymnastics ranked among the six
most popular organised sports for girls, with
133,500 and 57,500 participants, respectively.
.. among adults
As with children, swimming was the most
popular sporting activity among adults (those
aged 18 years and over). In 1997–98,
1.6 million adults (12%) had been for a swim
on at least one occasion during the year (84%
of whom had been for a swim on more than
6 occasions). Swimming ranked among the
most popular sports for all age groups,
although aerobics/fitness was equally popular
with those aged 18–34 (both 18%), and golf
Older people who have enjoyed competitive
sport at younger ages are often keen to maintain
or renew their active involvement by competing
with their peers. The Australian Masters' Games
is a multi-sports festival for mature-aged people
conducted biennially in various locations
throughout Australia. Ownership of the Games
is held in trust by the Confederation of
Australian Sport (CAS). Competition in a variety
of sports (51 in Melbourne in 1995 and 39 in
Canberra in 1997) is usually offered in five-year
age spans, starting at 30 and continuing into the
90s. While the number of participants in Masters'
Games has increased substantially over the
decade to 1997, average ages have remained
fairly constant, indicating an increase in
participants over all ages.
The success of the Masters' Games reflects the
wider participation in Masters sports by
mature-aged people. Growth in the number of
sports providing participation was most rapid in
the 1980s, when 44 more sports were included
on top of the 17 that had started between 1950
and 1979. Reports from many sporting bodies to
the CAS indicate that Masters is the fastest
growing area in their sport, in terms of numbers
of participants.5
Australian Masters' Games,
1987–1997
Average age
Year held Venue
Players
Men
Women
no.
years years
1987
Tasmania
3 695 50
49
1989
Adelaide
7 415 46
45
1991
Brisbane
5 957
..
..
1993
Perth
5 759 46
44
1995
Melbourne 10 479 47
44
1997
Canberra
43
8 811 47
Source: Confederation of Australian Sport
1987–1997, Australian Masters Games Final Reports.
ranked as the most commonly played sport
among adults aged 45 years and over with 8%,
followed by swimming (7%).
Overall, with 1.4 million participants,
aerobics/fitness was the second most popular
sporting or physical activity with adults in
1997–98. This was followed by golf
(1.1 million participants) and tennis
(937,800 participants).
For men, the most popular sports were golf
(873,700 participants), swimming (732,800)
and aerobics/fitness (503,000). While no
single code of football was among the top ten
ABS • AUSTRALIAN SOCIAL TRENDS • 4102.0 • 1999
•
185
SPORT
Participation in sport, by
employment status(a), 1997–98
Men
Women
Employment status
%
%
Employed
60.4
53.6
Full-time
60.4
53.9
Part-time
60.5
53.2
Unemployed
49.6
45.9
Not in the labour force
30.8
29.6
Total
52.6
43.0
(a) Persons aged 18 years and over
Source: Participation in Sport and Physical Activities,
Australia, 1997–98 (Cat. no. 4177.0).
sports and physical activities undertaken by
men, a total of 660,900 men played some
form of football. Outdoor soccer was the most
popular code, with 199,700 participants,
followed by Australian Rules with 152,900.
Touch football (147,100) was more popular
than Rugby League (86,600) and Rugby Union
(41,400).
For women, swimming and aerobics/fitness
were by far the most popular physical
activities, with 896,000 and 876,200
participants respectively. Other popular
sports for women were tennis (474,200
participants) and netball (285,800).
Time and other costs
Sport and exercise take up time and often
cost money. Results from the 1997 ABS Time
Use Survey indicate that an average of
21 minutes each day is spent on sport or
physical exercise (excluding fishing) by
people aged 15 years and over, if all people in
this age group are included. If limited to
Participation in sport, States and Territories(a), 1997–98
Men
Women
Persons
State or Territory
%
%
%
New South Wales
50.4
39.3
44.7
Victoria
50.9
44.3
47.5
Queensland
56.0
45.6
50.8
South Australia
50.0
40.4
45.1
Western Australia
55.7
48.1
51.9
Tasmania
57.2
43.9
50.4
Northern Territory(b)
56.5
45.7
51.0
Australian Capital Territory
71.5
55.7
63.6
(a) Persons aged 18 and over.
(b) Figures for the Northern Territory refer to mainly urban areas only.
Source: Participation in Sport and Physical Activities, Australia, 1997–98 (Cat. no. 4177.0).
186
• ABS • AUSTRALIAN SOCIAL TRENDS • 4102.0 • 1999
Sydney 2000 Olympic Games
The largest sporting event in the world, involving
both the largest numbers of participants and
spectators, is the Olympic Games conducted
every four years, almost continuously, since 1896.
At the 1996 Games (in Atlanta, USA) 8.4 million
tickets were sold to spectators6 and 10,744
athletes participated7. Billions of people all over
the world viewed the games live through satellite
broadcasts to their TVs.
The Sydney Olympic Games will be held between
the 15th of September and 1st of October 2000,
and the Paralympics between 18th and 29th of
October. Up to 10,200 athletes from over 200
countries are expected to participate in these
games, and around 5.5 million tickets are
available for sale.8
those who participated, however,
considerably more time was allocated to these
activities – on average, 1hr:14mins each day.
According to the 1996–97 Survey of
Participation in Sport and Physical Activities,
an average of $693 was spent over the year by
each participant in organised sport on
membership and weekly fees, clothing and
equipment, and other related expenses.
Employment status of players
While unemployed people may have more
time for recreational activities such as sport, it
is also likely that they are less able to afford
the expense of organised sporting activities.
Employed people were more likely to
participate in sport (60% for men and 54% for
women) than those unemployed (50% and
46% respectively).
Men and women who were not in the labour
force were the least likely to play sport, with
only 31% and 30% participating, respectively.
However, many in this group would have
been older, retired people, who are less likely
to play sport than younger people.
State and Territory differences
Differences in levels of participation in sport
and physical activities in different parts of the
country are in part affected by the age profiles
of those populations, but other factors such
as climate and life-style preferences of
individuals may also be important. These
differences can be observed between the
States and Territories. In 1997–98, residents
of the ACT (aged 18 and over) recorded the
highest participation rate (64%). New South
Wales and South Australia, on the other hand,
recorded the lowest participation rates (both
45%). The biggest difference between the
SPORT
participation of men and women was in the
Australian Capital Territory (72% and 56%
respectively).
Main reason for discontinuing
organised sport(a)(b), 1996–97
Men
Women
Reasons for discontinuing sport
Reason
%
%
People may discontinue one sport and take
up another, or they may give up altogether.
Also, with increasing age, fewer people
engage in physical activities. The most
common reason for giving up a sporting
activity, among the 1.8 million people who
reported having discontinued an organised
activity during the two years prior to 1996–97,
was lack of time. Men (31%) were more likely
to give lack of time as a reason than women
(24%). With 228,800 people saying that they
had a sports-related injury in 19959, it is not
surprising that the presence of injury or
health problems was also commonly stated as
the reason for discontinuing a sporting
activity (21%).
No time/too busy
30.9
23.7
Injury/health problems
20.7
20.8
Moved away from club
13.9
8.6
Lost interest
Although women were more likely than men
to discontinue an organised sport or physical
activity because of child care problems, only a
small proportion (3.5%, or 36,600 women
altogether) gave this as a reason.
Non-player involvement in sport
In the 12 months to March 1997, 13% of
males and 10% of females aged 15 years and
over had been involved in sport as a
non-player. The most common type of
non-playing involvement was as a coach,
instructor or teacher, with 628,300 people
(4%) acting in this capacity. Almost as many
(605,800, or 4%) were members of a
committee.
Non-playing involvement in
sport(a), 1997
Type of involvement
Number
Participation
rate
'000
%
10.3
10.2
Too expensive
6.8
10.7
Change in employment
3.8
2.7
Child care problems
0.5
3.5
13.2
19.7
'000
'000
909.0
903.7
Other/don't know
Total discontinuing sport
(a) Persons aged 18 years and over.
(b) During the previous two years.
Source: Participation in Sport and Physical Activities,
Australia, 1996–97 (Cat. no. 4177.0).
Only a small minority (10%) were paid for
their non-playing involvement, mostly for
coaching (41%) or refereeing (31%).
Non-playing involvement in sport was most
common for persons aged 35–44 years, with a
participation rate of 18%. This group includes
many parents who are likely to be involved in
supporting their children's sporting interests
(see Australian Social Trends 1997, Voluntary
work, pp. 109–112).
Attendance at selected sporting
events, 1995
Persons
Attendance
rate
Sporting event
'000
%
Australian Rules
football
1 874
13.3
Horse racing
1 701
12.1
Rugby League
1 462
10.4
1 166
8.3
692
4.9
Coach/instructor/teacher
628.3
4.4
Cricket
Referee/umpire
456.8
3.2
Basketball
Committee member
605.8
4.2
Harness racing
600
4.3
Administrator
266.5
1.8
Soccer
559
4.0
Other involvement
569.9
3.9
Motor sports
452
3.2
1 655.9
11.5
Tennis
432
3.1
Total non-playing(b)
(a) Persons aged 15 years and over.
(b) Figures may not add to total as some people may have
more than one type of non-playing involvement.
Rugby Union
358
2.5
Netball
312
2.2
Source: Involvement in Sport, Australia, 1997
(Cat. no. 6285.0).
Source: Sports Attendance, Australia, 1995
(Cat. no. 4174.0).
ABS • AUSTRALIAN SOCIAL TRENDS • 4102.0 • 1999
•
187
SPORT
Attendance at sporting events
Endnotes
Australians enjoy watching sporting events.
According to a survey conducted by the ABS
in November 199710, sporting programmes
were the most commonly watched on
television after news and current affairs
programmes, and were viewed regularly by
over half of all Australians aged over 18
(55%). As well as watching sporting events on
television, attending sports events (such as
club matches and international competitions)
is also a popular pastime.
1 Clark, D. 1996, Australian Sports Almanac 1997,
Reed Reference, Port Melbourne.
During the 12 months ended March 1995,
6.2 million people, (44% of all people aged
15 and over), had attended a sporting event
(excluding junior and school sport). Men
(52%) were more likely to have attended than
women (37%). For both men and women,
attendance rates were highest for the
15–24 age group (63% and 55% respectively)
and steadily declined with age. Among men
aged 65 and over, the attendance rate was
28%, while for women in this age group it
was 15%.
The most popular spectator sport was
Australian Rules football, with almost
1.9 million people having attended this sport
on at least one occasion during the year.
Horse racing (1.7 million), Rugby League
(1.5 million) and cricket (1.2 million) were
also among the most popular spectator
sports.
2 Whitaker's Almanack, Information for a
Changing World, 129, 130, 131 edns, The
Stationery Office Ltd, London.
3 Sport and Recreation Ministers' Council
(Australia) 1997, Active Australia: A National
Participation Framework, Australian Sports
Commission, Canberra.
4 Australian Bureau of Statistics 1999, Business
Sponsorship, Australia, 1996–97, Cat. no. 4144.0,
ABS, Canberra.
5 Confederation of Australian Sport 1992, Play
On!, The Report of The Masters Sport Project on
Mature Age Sport in Australia, Confederation of
Australian Sport, Canberra, and associated
materials in possession of the Confederation of
Australian Sport.
6 Atlanta Committee for the Olympic Games 1997,
The Official Report of the Centennial Olympic
Games: Planning and Organizing, vol. 1, Atlanta:
Peachtree Publishers.
7 International Olympic Committee 1996, Results
of the Games of the XXVI Olympiad, The
Centennial Games, IOC, Lausanne.
8 Official Sydney Olympic Website
www.sydney.olympic.org/games_info/overview
/overview.html.com.au
9 Australian Bureau of Statistics 1998, National
Health Survey: Injuries, Australia, 1995,
Cat. no. 4384.0, ABS, Canberra.
10 Australian Bureau of Statistics 1998, Public
Attitudes to the Arts, Australia, November 1997,
Cat. no. 4157.0, ABS, Canberra.
188
• ABS • AUSTRALIAN SOCIAL TRENDS • 4102.0 • 1999
Information technology
in the home
L I F E S T Y L E
Between 1994 and
1998, the proportion of
all households with a
computer rose from
29% to 47%, while from
1996 to 1998 the
proportion with internet
access rose from 4%
to 19%.
Home computers and the internet are
rapidly becoming everyday tools for
communication, information gathering, study
and research, tele-working and operating
home-based businesses. At the same time, the
multi-media dimension of home computers
and the internet allows them to be used for a
wide range of cultural and recreational
activities: listening to music, watching
television and films, photography and art.
Growth in household adoption of
computers and the internet
The primary source of data for this article is
derived from responses to a set of questions first
included in the February 1994 Population Survey
Monitor (PSM), and included quarterly in 1996
and 1998. The PSM is an interviewer-based survey
of approximately 3,300 households, and relates to
usual residents aged 15 years and over. Data
referring to 1998 is taken from the publication,
Household Use of Information Technology, and
relates to the average of the four PSM surveys in
that year.
Access to the internet
In February 1994, there were
1.9 million households with a home
computer. By November 1998 this had risen
to 3.2 million – just under half (47%) of all
households.
The growth in the number of households with
access to the internet has been even more
rapid. In February 1996, there were around
262,000 households (4% of all households)
with access to the internet. This reached
1.3 million (19% of households) by
November 1998.
ABS time use surveys of persons aged 15 years
or more show that between 1992 and 1997
the average time spent using a computer
increased from 97 to 103 minutes per day for
those who used a home computer. In 1997,
on average, there were around
172,000 people each day who accessed the
internet at home. These people each spent
75 minutes daily on this activity, on average.
Households with home computers and
internet access
With
a computer
With
internet access
'000
'000
%(a)
Data sources
%(a)
February 1994
1 878
29.4
n.a.
February 1996
2 392
36.0
262
n.a.
3.9
February 1998
2 880
42.4
854
12.6
May 1998
2 879
42.1
971
14.2
August 1998
3 195
45.9
1 245
17.9
November 1998
3 240
47.4
1 272
18.6
(a) Of all households.
The internet is an interconnection of thousands of
computer networks throughout the world, linked
via a number of avenues, including telephone
cables and optic fibres. Often referred to as the
'information superhighway', it can be used to
communicate with others, to gather and provide
information, to conduct business and as a source
of entertainment. A home computer with a
modem can connect to an Internet Service
Provider to gain access to the internet.1
Questions on household access to the internet
were not asked in the 1994 PSM.
This rapid embrace of computer technology is
set to continue in the foreseeable future. In
1998, 12% of households currently without
computers said they intended to purchase
one in the following 12 months. If these
expectations are realised, nearly 3.5 million
households will have a home computer by the
end of 1999.
It is difficult to compare Australian household
computer ownership or usage with other
countries as there is very little data available
for a comparable reference period, and what
is available is derived from a variety of
different sources. However, computer
ownership in Australia appears to be ahead of
the United Kingdom (UK) and the United
States of America (USA). For example, in
1997, 33% of households in the UK, and
37% in the USA2 had a computer, compared
with 36% in Australia in the previous year.
Patterns of computer ownership and usage
vary, depending on household income,
household type, and the age, sex and level of
educational attainment of household
members.
Source: Unpublished data, Household Use of Information
Technology, 1998; Population Survey Monitor, Australia,
November 1998 (Cat. no. 4103.0).
ABS • AUSTRALIAN SOCIAL TRENDS • 4102.0 • 1999
•
189
LIFESTYLE
Home computer presence and usage, and internet access by
families in households, 1998
Computer present Frequent computer Internet
in home(b)
usage(a)(b)
access(b)
Family type
%
%
%
Couple with children
67.4
60.1
23.1
One-parent
42.8
35.8
11.0
Couple without children
32.8
26.8
12.8
Lone-person
19.4
14.8
6.9
Other
51.0
42.6
22.0
All households
44.6
38.1
15.9
(a) Used a computer at least once a week.
(b) Proportion of all households in each category.
Source: Household Use of Information Technology 1998, (Cat. no. 8146.0).
Income
Although a small basic computer can be
obtained fairly cheaply, additional equipment,
including software, and the on-going costs of
internet access can be expensive.
Consequently, households with higher
incomes are more likely to have a computer
and internet access. In 1998, 15% of
households with a gross annual income of
$14,000 or less had a computer, and 4% had
internet access, rising to 74% and 36%
respectively for those with incomes over
$66,000. For households with a computer but
without internet access, only 18% of those
Home computer usage and internet access, by age and sex,
1998
Frequent computer usage(a)
Accessed internet from home(b)
Males
Age group (years) %
Females
Persons
Males
Females
Persons
%
%
%
%
%
Children
5–9
39.3
35.9
37.6
2.5
1.4
2.0
10–14
62.8
59.8
61.4
13.2
10.6
11.9
15–17
66.5
64.5
65.5
17.9
15.4
16.7
18–24
40.8
38.1
39.5
16.2
10.4
13.3
25–39
36.6
34.1
35.3
15.1
9.4
12.2
40–54
38.8
32.2
35.5
14.1
6.7
10.4
55 and over
13.3
8.0
10.6
4.1
1.4
2.7
36.5
31.7
34.1
11.7
6.9
9.3
Adults
All persons
(a) People who used a computer at least once a week, as a proportion of all people in each age
group.
(b) People who used a computer at least once a week and also accessed the internet, of all
people in each age group.
Source: Household Use of Information Technology, 1998 (Cat. no. 8146.0).
190
• ABS • AUSTRALIAN SOCIAL TRENDS • 4102.0 • 1999
with a gross annual income up to $14,000
intended acquiring internet access in the next
12 months, compared with 40% among those
with income over $66,000.
The proportion of households without a
computer who identified cost as the main
barrier to acquiring one, declined from 31%
in February 1996 to 26% in February 1998,
partly attributable to the fall in computer
prices which occurred in this period.
Type of family
Differences in home computer usage among
family types indicates that the presence of
children is a key determinant in their decision
to acquire a computer or internet access. In
1998, 67% of all couple households with
children had a computer in their home, 60%
frequently used a computer at home, and 23%
had internet access. For one-parent families,
these proportions were lower (43%, 36% and
11% respectively). However, computer
ownership and usage was lower still for
couples without children and for lone-person
families.
Children and adults
The 1998 PSM questionnaires asked which
members of the household frequently used a
computer, and whether these people also
accessed the internet. As children get older,
their use of a home computer and the
internet increases. In 1998, 38% of 5–9 year
olds frequently used a computer at home,
and 2% also accessed the internet; for 15–17
year olds, the proportions increased to 66%
and 17%. These patterns were evident both
for boys and for girls.
In contrast, adult use of a home computer
and the internet declined with age, gradually
for those aged between 18 and 54, and then
more sharply after that. In 1998, the
proportion of those aged between 18 and 54
who used a home computer at least once a
week varied between 35% and 40%, while
only 11% of those aged 55 and over
frequently used a computer. Home internet
access in the 12 months to November 1998
also declined in the older age group.
These patterns of computer usage suggest
that adult usage may be related to the
presence of children at home and to
participation in the labour force. On the other
hand, many of those aged 55 and over may
have had little exposure to information
technology and may feel less comfortable
using a computer.
LIFESTYLE
Type of home computer usage(a), 1998
Males
Females
%
%
Used computer for games(b)
62.7
49.9
Used computer for study(b)
53.0
55.9
Used home computer for work(c)
72.9
65.9
(a) Of those who frequently used a computer.
(b) Refers to persons aged 5 years and over.
(c) Refers to employed persons over 18 years.
Home usage of internet(a), by level of
educational attainment, 1998
%
40
30
20
10
Source: Household Use of Information Technology, 1998 (Cat. no. 8146.0).
Male/female differences
In every age group, males were more likely
than females to use home computers. In
1998, 37% of all males and 32% of all females
aged 5 and over used a home computer at
least once a week, and among adults aged 18
and over, 14% of men and 8% of women used
a home computer daily. Part of the difference
might relate to how much time they had
available. In February–May 1998, 20% of
women aged 15 years and over, and 16% of
men in the same age range reported 'no time'
as the reason why they did not use an existing
home computer.
Males in every age group were more likely
than females to access the internet from their
home computer, although differences are
more marked for adults. In 1998, 12% of
males accessed the internet from home,
compared to 7% of females.
Males were also more interested in using their
home computer for games than for study,
whereas the reverse was true for females. In
1998, 63% of males aged over 5 years who
frequently used a home computer played
computer games on it and 53% used their
computer for study purposes, compared to
50% and 56% respectively for females.
Men were more likely than women to engage
in work-related activities on their home
computer. In 1998, 73% of employed men
aged 18 and over who frequently used a
home computer used it for work-related
activities, compared to 66% of employed
women.
Level of education
The higher their level of educational
attainment, the greater the likelihood that
adult members of the household would be
internet users. In 1998, 9% of Year 12
certificate holders had used the internet at
home, 10% of those with a trade or other
0
Year 12
Trade or other Associate/ Bachelor degree
certificate(b) certificate undergraduate
or higher
diploma
(a) Of those aged 18 years and over who frequently used a
computer.
(b) Includes those with a Year 12 certificate or equivalent.
Source: Household Use of Information Technology, 1998
(Cat. no. 8146.0).
certificate, 17% of those with an associate or
undergraduate diploma, and 30% of those
with a bachelor degree.
State, Territory and region
Differences in the socio-economic profile of
people living in the different States and
Territories (age, sex, income, households with
children, and education levels of household
members) may be among the reasons why the
proportion of households with computers
and internet access was not uniform
throughout Australia. For example, in 1998,
the ACT, which has a relatively young and
well educated population, had the highest
proportion of households who owned or
were buying a computer (66%), and the
highest proportion of households with
internet access (28%). Tasmania, on the other
hand, with a relatively older population,
recorded the lowest levels of computer
ownership (36%) and internet access (10%).
The ongoing deregulation of the Australian
telecommunications industry has aroused
community concerns in regional areas of
Australia about the level of services to inland
and sparsely populated areas. These concerns
have been reflected in the accompanying
debate3 over the Universal Service Obligation
(USO) (see box). Since 1994, when statistics
on household ownership and usage of
computers were first collected by the ABS, the
proportion of households with computers
and access to the internet has been higher in
the eight capital cities than in other regions.
In 1998, 48% of capital city households had a
computer, and 19% of their members
accessed the internet from home, compared
with 38% and 11% respectively, for
households outside of the capital cities.
ABS • AUSTRALIAN SOCIAL TRENDS • 4102.0 • 1999
•
191
LIFESTYLE
Households with computers and
internet access, by State and region,
1998
With
computers
Internet
access
%
%
44.3
17.7
State/Territory
New South Wales
Victoria
46.8
15.1
Queensland
43.2
15.1
South Australia
42.9
13.1
Western Australia
43.2
14.6
Tasmania
35.5
10.4
Northern Territory
44.7
16.1
Australian Capital Territory
66.1
28.2
The Universal Service Obligation
This is defined in the Telecommunications Act
1997. Under current arrangements, it obliges
Telstra to ensure that standard telephone services
and pay phones are reasonably accessible to all
people in Australia on an equitable basis, wherever
they reside or carry on business. The Government
has announced its intention to include a digital
data capability in the USO. This would effectively
make a 64 kbit/sec. digital data capability available,
on demand, throughout Australia.3
Tele-workers
Tele-workers are employees who have: a home
computer; a formal agreement with their
employer to work at home; and have a home
modem which enables them to access their
employer's computer.
Electronic commerce
Region
Capital city households
48.2
19.0
Other households
38.4
10.6
Source: Household Use of Information Technology, 1998
(Cat. no. 8146.0).
Home computers and work-related
activities
In 1998, 2.3 million people reported using a
home computer for work-related activities.
This included employees taking work home,
employees working from home
('tele-workers') and the self-employed. The
introduction of the modem and the internet
have increased opportunities to use home
computers for work-related activities. With a
home computer, modem and the internet,
people can access their work computer and
external data bases, and can communicate
cheaply and efficiently with any number of
other parties, at any time or location. In
1998, 386,000 people (5% of employed
persons) accessed their employer's computer
from a home modem, and 293,000 (4% of
employed persons) were tele-workers. Male
tele-workers substantially outnumbered
females, both absolutely (210,000 men and
82,000 women) and as a proportion of the
number of employed men and women
(4% and 2% respectively).
Private use of the internet for
electronic commerce
Although increasing, the number of private
individuals using the internet to pay bills or
transfer funds was still small when compared
to the numbers who use other forms of
electronic commerce ('e-commerce'). In the
three months preceding February 1998,
192
• ABS • AUSTRALIAN SOCIAL TRENDS • 4102.0 • 1999
In this review, electronic commerce
('e-commerce') refers to the use of the internet or
other on-line facilities to order or pay for goods or
services.
44,000 adults, or 0.3% of people aged
18 years and over, used the internet to pay
bills or transfer funds. In the three months
preceding November 1998, this number rose
to 112,000, or approximately 1% of adults. In
comparison, 4.8 million (36%) adults paid
bills or transferred funds by phone,
8.2 million (61%) via electronic funds transfer
at point of sale (EFTPOS), and 9.3 million
(68%) via automatic teller machines (ATMs).
Substantially more adults used the internet to
purchase goods or services for private use
than for paying bills or transferring funds. In
1998, approximately 286,000 adults, or 7% of
adult home internet users, used their internet
access to make one or more private
purchases. Of these on-line purchasers, 83%
paid on-line and 64% purchased from foreign
web sites – two developments which have
long-term implications for local business,
government revenue and Australia's balance
of payments.
There were, however, substantially more
people expressing an interest in
internet-based e-commerce than were
actually engaged in these activities. In
November 1998, 31% of men and 24% of
women reported an interest in internet-based
shopping, and 39% and 37%, respectively, in
internet-based banking.
In part, the difference between interest in,
and practice of, internet-based shopping,
reflected the fact that by November 1998, only
LIFESTYLE
19% of households had internet access. It has
also been argued that the current volume of
internet commerce (and internet adoption)
would be greater but for people's concerns
about consumer protection4 – that is, the
security of their financial transactions when
paying by credit or charge card; securing
redress and compensation for defective goods
and inferior services; response times (i.e. the
length of time from placing an order to
delivery); and confidentiality (fears that
personal information will be accessible by, or
provided to, third parties).
Endnotes
1 Honour Fiona August 1996, The Net Starter
Guide, Australia's guide to getting on the
internet, Next Publishing Pty Ltd.
2 U.S. Department of Commerce, National
Telecommunications and Information
Administration 1998, Falling through the net II:
New data on the digital divide, U.S. Department
of Commerce, National Telecommunications and
Information Administration, Washington D.C.
3 Australian Communications Authority August
1998, Digital Data Enquiry, Public Inquiry
under Section 486(1) of the Telecommunications
Act 1997, Report to the Minister for
Communications, the Information Economy and
the Arts, ACA, Melbourne.
4 The Parliament of the Commonwealth of
Australia Joint Committee of Public Accounts and
Audit 1998, Report 360, Internet Commerce: To
buy or not to buy?, May 1998, AGPS, Canberra.
ABS • AUSTRALIAN SOCIAL TRENDS • 4102.0 • 1999
•
193
International
Page
Population . . . . . . . . . . . . . . . . . . . . . . . . . . . . . . . . . . . . . . . . . . . . . . . . . . . . . . . . . . . . . . 196
Population composition; population growth; population projections.
Health
....................................................................
199
Health status; causes of death; health services and expenditure.
Work
.......................................................................
202
Labour force; employment and unemployment.
Caution
Statistics presented in this chapter have been reproduced from international statistical
compendia. National statistical systems differ from country to country and therefore
caution should be exercised when comparing international data. Details of national
differences can be found in the country notes in the source publications.
ABS • AUSTRALIAN SOCIAL TRENDS • 4102.0 • 1999 •
195
POPULATION
Population composition
Country
Reference
year
Total
population
0–14
years
15–64
years
65 years
and over
'000
%
%
%
Australia
1996
18 311
21.4
66.6
12.0
Canada
1996
29 680
20.3
67.6
12.1
China(a)
1996
1 232 083
26.1
67.6
6.2
France
1996
58 333
19.2
65.4
15.4
Greece
1996
10 490
16.4
67.2
16.4
Hong Kong
1996
6 191
19.1
70.9
10.1
Indonesia
1996
200 453
32.5
63.1
4.4
Italy
1996
57 226
14.8
68.9
16.4
Japan
1996
125 351
15.9
69.4
14.7
Korea (Republic of)
1996
45 314
22.8
71.4
5.8
Malaysia
1996
20 581
37.6
58.5
3.9
New Zealand
1996
3 602
23.2
65.4
11.4
Papua New Guinea
1996
4 400
39.4
57.7
3.0
Singapore
1996
3 384
22.6
71.0
6.5
Sweden
1996
8 819
18.9
63.9
17.1
United Kingdom
1996
58 144
19.3
65.0
15.8
United States of America
1996
269 444
22.1
65.4
12.5
Viet Nam
1996
75 181
36.5
58.6
5.0
(a) Excludes Hong Kong and Taiwan.
Source: World Health Organisation World Health Statistics Annual 1996; ABS, Population by Age and Sex, Australian States and Territories
(Cat. no. 3201.0).
196
•
ABS • AUSTRALIAN SOCIAL TRENDS • 4102.0 • 1999
POPULATION
Population growth
Country
Reference
year
Annual
average
growth rate
Reference
year
%
Annual rate
of natural
increase(a)
Crude
birth
rate(a)
Crude
death
rate(a)
no.
no.
no.
Reference
year
Total
fertility
rate
no.
Australia
1990–96
1.2
1995
7.3
14.2
6.9
1995
1.8
Canada
1990–96
1.3
1996
5.3
12.5
7.2
1994
1.7
China(b)
1990–96
1.1
1990–95
11.1
18.3
7.2
1990–95
1.9
France
1990–96
0.5
1996
3.4
12.6
9.2
1995
1.7
Greece
1990–96
0.5
1996
0.1
9.7
9.6
1995
1.3
Hong Kong
1990–96
1.7
1996
5.2
10.2
5.1
1995
1.2
Indonesia
1990–96
1.5
1990–95
16.2
24.6
8.4
1990–95
2.9
Italy
1990–96
–0.1
1995
–0.5
9.2
9.7
1994
1.2
Japan
1990–96
0.3
1996
2.4
9.6
7.1
1995
1.4
Korea (Republic of)
1990–96
1.0
1995
10.3
15.6
5.3
1995
1.7
Malaysia
1990–96
2.5
1990–95
23.6
28.7
5.1
1990–95
3.6
New Zealand
1990–96
1.0
1995
8.4
16.3
7.9
Papua New Guinea
1990–96
2.9
1990–95
22.7
33.4
10.7
1994
2.0
1990–95
5.1
Singapore
1990–96
2.0
1996
10.9
16.0
5.1
1996
1.7
Sweden
1990–96
0.5
1996
0.1
10.8
10.6
1994
1.9
United Kingdom
1990–96
0.4
1996
1.6
12.5
10.9
1995
1.7
United States of America
1990–96
1.1
1995
6.0
14.8
8.8
1994
2.0
Viet Nam
1990–96
2.1
1990–95
20.9
28.9
7.9
1990–95
3.4
(a) Per 1,000 population.
(b) Excludes Hong Kong and Taiwan.
Source: United Nations 1996 Demographic Yearbook.
ABS • AUSTRALIAN SOCIAL TRENDS • 4102.0 • 1999 •
197
POPULATION
Population projections(a)
Population
Country
Australia(b)
Canada
Median age
2000
2020
2050
million
million
million
18.8
22.9
2000
2020
0–14 years
2050
2000
2020
65 years and over
2050
2020
2050
years
years
years
%
%
%
%
%
%
25.3
35.1
38.8
41.1
21.0
19.4
18.3
11.9
15.9
22.3
30.7
35.3
36.4
36.9
41.5
43.2
19.3
17.3
17.5
12.6
18.1
24.5
1 276.3
1 448.8
1 516.7
30.0
36.9
40.3
24.9
19.6
18.7
6.7
10.8
19.2
France
59.1
60.3
58.4
37.8
43.2
44.5
18.3
16.4
17.1
16.2
20.8
26.4
Greece
10.6
10.2
9.0
39.3
45.4
47.9
15.3
14.3
15.3
17.8
21.6
30.4
China(c)
Hong Kong
Indonesia
Italy
6.4
6.5
5.6
36.5
45.9
50.7
17.2
13.5
14.1
11.1
18.4
32.3
212.6
263.8
318.3
24.7
31.4
37.7
30.7
23.5
20.1
4.7
7.0
15.8
57.2
53.2
42.1
39.9
48.7
53.5
14.2
11.7
12.4
17.7
23.6
35.7
126.4
123.8
109.5
40.8
46.4
47.5
15.1
14.2
15.8
16.5
25.4
30.4
Korea (Republic of)
46.9
51.9
52.1
31.5
39.8
42.9
21.3
17.6
17.5
6.7
11.8
23.1
Malaysia
22.3
29.8
38.1
22.5
29.6
37.8
35.2
24.7
19.8
4.1
7.0
15.0
New Zealand
3.8
4.6
5.3
33.4
36.8
40.3
23.0
20.4
18.7
11.3
14.5
20.4
Papua New Guinea
4.8
7.0
9.6
20.5
24.1
34.1
38.7
32.1
22.4
3.0
4.0
9.7
Singapore
3.6
4.1
4.2
34.3
41.8
43.1
22.6
16.8
17.1
7.1
15.6
23.6
Japan
Sweden
United Kingdom
United States
of America
Viet Nam
8.9
9.4
9.6
39.0
41.9
41.9
19.0
17.8
17.9
16.7
21.0
23.2
58.3
59.3
58.7
38.0
41.9
42.0
18.9
17.5
18.0
15.8
19.1
23.2
277.8
322.3
347.5
35.8
38.4
40.5
21.4
19.7
18.7
12.4
16.3
21.2
80.5
104.2
129.8
22.6
30.2
38.1
34.3
23.9
19.6
5.2
6.0
16.1
(a) Medium-variant projection.
(b) United Nations projections for Australia may not agree with ABS projections owing to differences in assumptions and methodology.
(c) Excludes Hong Kong and Taiwan.
Source: United Nations World Population Prospects: The 1996 Revision.
198
2000
•
ABS • AUSTRALIAN SOCIAL TRENDS • 4102.0 • 1999
HEALTH
Health status
Reference
year
Country
Infant mortality
rate(a)
Reference
year
no.
Life expectancy at birth
Males
Females
years
years
Australia
1995
5.7
1994
75.0
80.9
Canada
1994
6.3
1992
74.6
80.9
China(b)
1990–95
44.4
1990
66.9
70.5
France
1996
4.9
1993
73.3
81.4
Greece
1996
8.1
1995
75.0
80.2
Hong Kong
1995
4.6
1995
76.0
81.5
Indonesia
1990–95
1990–95
61.0
64.5
Italy
1995
6.1
1993
74.1
80.5
Japan
1995
4.3
1995
76.4
82.9
Korea (Republic of)
1990–95
11.0
1991
67.7
75.7
Malaysia
1990–95
13.0
1990–95
68.7
73.0
6.7
1992–94
73.4
79.1
68.3
1990–95
55.2
56.7
58.1
New Zealand
1995
Papua New Guinea
1990–95
Singapore
1996
3.8
1996
74.4
78.9
Sweden
1996
3.5
1994
76.1
81.4
United Kingdom
1996
6.1
1995
74.1
79.3
United States of America
1995
7.5
1994
72.4
79.0
Viet Nam
1990–95
42.0
1979
63.7
67.9
(a) Per 1,000 live births.
(b) Excludes Hong Kong and Taiwan.
Source: United Nations 1996 Demographic Yearbook.
ABS • AUSTRALIAN SOCIAL TRENDS • 4102.0 • 1999 •
199
HEALTH
Standardised death rates(a) for selected causes of death
Country
Reference
year
Malignant
neoplasms
(cancer)
Ischaemic
heart disease
Cerebrovascular disease
(stroke)
no.
no.
no.
Australia
1994
126.2
95.8
37.2
Motor vehicle
traffic
accidents
Suicide and
self-inflicted
injury(b)
All
causes
no.
no.
no.
10.0
11.2
440.6
Canada
1995
126.1
81.4
26.2
9.8
11.6
428.8
China (rural)(c)
1994
111.9
26.5
110.2
13.8
25.8
698.7
China (urban)(c)
1994
119.4
57.6
125.0
10.1
5.9
594.7
France
1994
130.8
33.2
26.7
12.9
15.8
423.9
Greece
1995
109.4
57.5
69.2
19.8
2.7
449.0
Hong Kong
1994
125.9
40.0
39.8
4.5
10.3
392.9
..
n.a.
n.a.
n.a.
n.a.
n.a.
n.a.
Italy
1993
133.7
55.0
48.5
12.4
5.8
450.0
Japan
1994
106.2
21.7
44.5
8.9
12.2
364.0
Korea (Republic of)(d)
1995
123.1
14.6
90.9
36.2
9.8
585.8
..
n.a.
n.a.
n.a.
n.a.
n.a.
n.a.
1993
142.2
119.7
44.0
16.8
11.7
509.9
..
n.a.
n.a.
n.a.
n.a.
n.a.
n.a.
Singapore
1995
130.8
96.7
57.0
7.6
12.0
517.7
Sweden
1995
106.6
94.1
34.7
4.9
11.8
408.6
Indonesia
Malaysia
New Zealand
Papua New Guinea
United Kingdom
1995
137.1
112.2
43.1
5.6
6.2
495.8
United States of America
1994
130.8
96.1
28.4
14.9
10.3
521.9
..
n.a.
n.a.
n.a.
n.a.
n.a.
n.a.
Viet Nam
(a) Standardised death rates are the overall death rates per 100,000 population that would have prevailed in a standard population if it had experienced at each
age the death rates of the population being studied. The standard population used in this table is the World Health Organisation world standard population.
Standardised death rates for Australia presented in the Health chapter of this publication or elsewhere in ABS publications are not comparable owing to the use
of a different standard population and different reference periods.
(b) It is generally acknowledged that suicides are under-reported as a cause of death. The degree of under-reporting varies from country to country, partly for social
and cultural reasons, but also because of differences in legal requirements and administrative procedures in arriving at a verdict of suicide.
(c) Excludes Hong Kong and Taiwan.
(d) Causes of death have been coded to the tenth edition of the International Classification of Diseases (ICD10). For all other countries, causes of death have been
coded to the ninth edition (ICD9).
Source: World Health Organisation World Health Statistics Annual 1996; World Health Organisation World Health Statistics Annual 1995.
200
•
ABS • AUSTRALIAN SOCIAL TRENDS • 4102.0 • 1999
HEALTH
Health services and expenditure
Health
expenditure
as % of GDP
Health
expenditure per
capita at PPP(a)
%
$US '000
Reference
year
Acute hospital
beds per 1 000
population
4.1
Country
Australia
1997
8.3
1.8
1996
2.5
1996
Canada
1997
9.3
2.1
1996
2.1
1993
3.6
..
n.a.
n.a.
..
n.a.
..
n.a.
China(b)
Reference
year
Doctors per
1,000
population
Reference
year
no.
no.
France
1997
9.9
2.1
1996
2.9
1996
4.5
Greece
1997
7.1
1.0
1995
3.9
1992
3.9
..
n.a.
n.a.
..
n.a.
..
n.a.
Hong Kong
Indonesia
Italy
..
n.a.
n.a.
..
n.a.
..
n.a.
1997
7.6
1.6
1996
5.5
1995
5.1
Japan
1997
7.3
1.7
1994
1.8
..
n.a.
Korea (Republic of)
1997
4.0
0.6
1995
1.1
1996
4.0
Malaysia
..
n.a.
n.a.
..
n.a.
..
n.a.
1997
7.6
1.4
1996
2.1
1991
7.1
Papua New Guinea
..
n.a.
n.a.
..
n.a.
..
n.a.
Singapore
..
n.a.
n.a.
..
n.a.
..
n.a.
New Zealand
Sweden
1997
8.6
1.7
1996
3.1
1996
2.8
United Kingdom
1997
6.7
1.3
1994
1.6
1996
2.0
United States of America
1997
14.0
4.1
1996
2.6
1995
3.4
..
n.a.
n.a.
..
n.a.
..
n.a.
Viet Nam
(a) PPP (purchasing power parities) are the rates of currency conversion which eliminate the differences in price levels between countries.
(b) Excludes Hong Kong and Taiwan.
Source: Organisation for Economic Co-operation and Development 1998, OECD Health Data 98: a comparative analysis of 29 countries, Paris: OECD.
ABS • AUSTRALIAN SOCIAL TRENDS • 4102.0 • 1999 •
201
WORK
Labour force
Country
Reference
year
Australia
1997
Canada
China(c)
Economically active
population(a)
'000
Participation rate of persons
aged 15 and over(a)
Total
Men
Women(b)
%
%
%
9 220.4
63.3
73.2
53.7
1997
15 354.1
64.8
72.5
57.4
1990
647 244.7
79.2
85.0
73.0
France
1997
26 403.7
55.0
62.3
48.1
Greece
1997
4 292.7
49.2
63.1
36.7
Hong Kong
1997
3 216.0
61.8
75.7
48.0
Indonesia
1997
89 602.8
66.3
83.4
49.9
Italy
1996
22 849.0
47.6
61.6
34.6
Japan
1997
67 870.0
63.7
77.8
50.4
Korea (Republic of)
1997
21 604.0
62.2
75.6
49.5
Malaysia
1997
8 569.2
39.6
51.1
27.5
New Zealand
1997
1 814.4
62.5
71.2
54.3
Papua New Guinea
Singapore
..
n.a.
n.a.
n.a.
n.a.
1997
1 876.0
64.2
78.3
51.1
Sweden
1997
4 264.0
76.8
79.1
74.5
United Kingdom
1997
28 715.9
62.6
71.7
53.9
United States of America
1997
136 297.0
67.1
75.0
59.8
Viet Nam
1989
29 525.5
77.2
81.5
73.6
(a) For most countries data are presented for the economically active population aged 15 and over. However, the age range
varies for some countries: Malaysia — 15–64; Sweden — 16–64; UK, USA — 16 and over. Definitions also vary in terms
of the inclusion or exclusion of certain other segments of the population such as the armed forces.
(b) Participation rates for women are frequently not comparable internationally since, in many countries, relatively large
numbers of women assist on farms or in other family enterprises without pay. There are differences between countries in
the criteria used to count economically active workers.
(c) Excludes Hong Kong and Taiwan.
Source: International Labour Office, Year Book of Labour Statistics, 1998.
202
•
ABS • AUSTRALIAN SOCIAL TRENDS • 4102.0 • 1999
WORK
Employment and unemployment(a)
Country
Reference
year
Australia
1997
Canada
China (c)
Employment
Reference
year
'000
Unemployment
Unemployment
rate
'000
%
8 394.1
1997
791.1
8.6
1997
13 940.6
1997
1 413.5
9.2
1997
696 000.0
1997
5 768.0
3.0
France
1997
22 430.0
1997
3 192.0
12.4
Greece
1996
3 871.9
1997
440.4
10.3
Hong Kong
1997
3 144.7
1997
71.3
2.2
Indonesia
1997
87 050.0
1996
3 624.8
4.0
Italy
1997
20 087.0
1997
2 805.0
12.3
Japan
1997
65 570.0
1997
2 300.0
3.4
Korea (Republic of)
1997
21 048.0
1996
425.0
2.0
Malaysia
1997
8 569.2
1997
216.4
2.5
New Zealand
1997
1 693.3
1997
120.9
6.7
..
n.a.
..
n.a.
n.a.
1997
1 830.5
1997
45.5
2.4
Papua New Guinea
Singapore
Sweden
1996
3 963.0
1996
347.0
8.0
United Kingdom
1997
26 681.6
1997
2 034.2
7.1
United States of America
1997
129 558.0
1997
6 739.0
4.9
Viet Nam
1994
33 664.0
..
n.a.
n.a.
(a) For most countries the employed and unemployed populations are aged 15 and over. However, the age range varies for
some countries: China and Viet Nam— Not specified; Greece — 14 and over; Indonesia — 10 and over;
Malaysia — 15–64; Sweden — 16–64; UK and USA — 16 and over. Definitions also vary in terms of the inclusion or
exclusion of certain other segments of the population such as the armed forces.
(b) Employment relates to total economy; unemployment relates to urban areas only.
(c) Excludes Hong Kong and Taiwan.
Source: International Labour Office, Year Book of Labour Statistics, 1998; International Labour Office, Year Book of Labour
Statistics, 1997.
ABS • AUSTRALIAN SOCIAL TRENDS • 4102.0 • 1999 •
203
CUMULATIVE INDEX 1994–1999
Cumulative topic list
Edition
Page
Edition
Population
Family –
Population composition
Family functioning
Aboriginal and Torres Strait
Islander people . . . . . . . . . . . . . . . . . . . .
Australian citizenship . . . . . . . . . . . . . . . . . .
Birthplaces of overseas-born Australians . . .
Changing links with Europe . . . . . . . . . . . . .
Expanding links with Asia . . . . . . . . . . . . . .
Indigenous languages . . . . . . . . . . . . . . . . .
Languages spoken in Australia . . . . . . . . . . .
Second generation Australians . . . . . . . . . . .
1994
1996
1997
1997
1996
1999
1999
1995
.... 5
.... 5
. . . 12
. . . 16
. . . 10
. . . 16
. . . 11
.... 5
1994
1995
1998
1999
1998
. . . 22
. . . 16
.... 5
. . . 21
. . . 10
1994
1997
1996
1994
1996
1998
1994
1998
1997
1995
. . . 18
.... 8
. . . 17
.... 9
. . . 23
. . . 18
. . . 13
. . . 15
.... 5
. . . 11
Page
continued
Families and work . . . . . . . . . . . . . . . . . . . .
Family support . . . . . . . . . . . . . . . . . . . . . . .
Looking after the children . . . . . . . . . . . . . .
Spending time alone . . . . . . . . . . . . . . . . . .
War veterans and their carers . . . . . . . . . . . .
1997
1995
1999
1999
1996
...
...
...
...
...
30
41
39
35
41
Family services
Child care . . . . . . . . . . . . . . . . . . . . . . . . . . 1994 . . . 47
Child care . . . . . . . . . . . . . . . . . . . . . . . . . . 1998 . . . 38
Principal carers and their caring roles . . . . . 1996 . . . 44
Population distribution
Aged Australia . . . . . . . . . . . . . . . . . . . . . . .
Internal migration . . . . . . . . . . . . . . . . . . . .
Interstate migration . . . . . . . . . . . . . . . . . . .
Island populations . . . . . . . . . . . . . . . . . . . .
Small towns: which ones are in decline? . . .
Population growth
Aboriginal and Torres Strait Islander fertility
Australia's child population . . . . . . . . . . . . .
Australia's population growth . . . . . . . . . . .
Birthplaces of Australia's settlers . . . . . . . . .
Capital city growth and development . . . . .
Changes in immigration intake . . . . . . . . . .
Emigration . . . . . . . . . . . . . . . . . . . . . . . . . .
Growth of the Indigenous population . . . . .
International population comparison . . . . .
Net overseas migration . . . . . . . . . . . . . . . .
Living arrangements
Caring for children after parents separate . .
Changes in living arrangements . . . . . . . . . .
Children in families . . . . . . . . . . . . . . . . . . .
Living with parents . . . . . . . . . . . . . . . . . . .
Lone fathers with dependent children . . . . .
One-parent families . . . . . . . . . . . . . . . . . . .
People who live alone . . . . . . . . . . . . . . . . .
Rural families . . . . . . . . . . . . . . . . . . . . . . . .
42
35
29
43
40
34
33
42
Health
Expenditure
Private health insurance: who has it? . . . . . . 1994 . . . 73
Health related actions
Our ageing population . . . . . . . . . . . . . . . . 1999 . . . . 6
Projections of the aged population . . . . . . . 1994 . . . 27
Projections of the working age population . 1995 . . . 21
Health services
Family
Health status
Family formation
204
...
...
...
...
...
...
...
...
Food and energy intake . . . . . . . . . . . . . . . . 1998 . . . 64
The use of medication . . . . . . . . . . . . . . . . . 1998 . . . 60
Population projections
Adoptions . . . . . . . . . . . . . . . . . . . . . . . . . .
Age at first marriage . . . . . . . . . . . . . . . . . . .
Family planning . . . . . . . . . . . . . . . . . . . . . .
Remarriage trends of divorced people . . . . .
Trends in de facto partnering . . . . . . . . . . .
Trends in fertility . . . . . . . . . . . . . . . . . . . . .
Trends in marriage and divorce . . . . . . . . . .
1999
1994
1995
1994
1994
1997
1996
1998
1998
1997
1998
1999
1995
1996
1995
...
...
...
...
...
...
...
33
27
29
45
38
36
33
Distribution of general practitioners . . . . . . 1994 . . . 70
Medicare: the first ten years . . . . . . . . . . . . . 1996 . . . 66
Health and socio-economic
disadvantage of area . . . . . . . . . . . . . . . . .
Health experiences of men and women . . . .
Health of older people . . . . . . . . . . . . . . . . .
Health of the population . . . . . . . . . . . . . . .
Health of Indigenous people . . . . . . . . . . . .
Mental health . . . . . . . . . . . . . . . . . . . . . . . .
Life expectancy trends . . . . . . . . . . . . . . . . .
Older people with disabilities . . . . . . . . . . .
Protecting the health of our children . . . . . .
• ABS • AUSTRALIAN SOCIAL TRENDS • 4102.0 • 1999
1999
1998
1999
1997
1996
1999
1995
1995
1997
...
...
...
...
...
...
...
...
...
62
55
57
45
55
71
51
55
49
CUMULATIVE INDEX 1994–1999
Edition
Health –
Page
Page
Work
continued
Mortality and morbidity
Accidental death of children . . . . . . . . . . . .
Acquired immunodeficiency syndrome . . . .
Asthma . . . . . . . . . . . . . . . . . . . . . . . . . . . . .
Cancer trends . . . . . . . . . . . . . . . . . . . . . . .
Diabetes . . . . . . . . . . . . . . . . . . . . . . . . . . . .
Infectious diseases . . . . . . . . . . . . . . . . . . . .
Youth suicide . . . . . . . . . . . . . . . . . . . . . . . .
Edition
Industrial relations
1996
1997
1999
1995
1998
1997
1994
...
...
...
...
...
...
...
59
60
67
58
68
54
55
Industrial disputes . . . . . . . . . . . . . . . . . . . . 1996 . . 109
Trends in trade union membership . . . . . . . 1994 . . 109
Labour force projections
Projections of the labour force . . . . . . . . . . . 1995 . . . 89
Not in the labour force
Early retirement among men . . . . . . . . . . . . 1994 . . 126
Risk factors
Alcohol use . . . . . . . . . . . . . . . . . . . . . . . . .
Children's immunisation . . . . . . . . . . . . . . .
Health risk factors and Indigenous people .
Tobacco use . . . . . . . . . . . . . . . . . . . . . . . . .
1995
1994
1996
1994
...
...
...
...
62
66
62
60
1997
1999
1995
1996
1995
1997
1998
...
...
...
...
...
...
...
79
91
81
79
78
75
91
Education
Education and work
Academics . . . . . . . . . . . . . . . . . . . . . . . . . .
Educating and training Australia's workers .
Employee training . . . . . . . . . . . . . . . . . . . .
From school to work . . . . . . . . . . . . . . . . . .
Qualified tradespeople . . . . . . . . . . . . . . . .
School teachers . . . . . . . . . . . . . . . . . . . . . .
Workplace training . . . . . . . . . . . . . . . . . . .
Educational attainment
Early school leavers . . . . . . . . . . . . . . . . . . .
Gender differences
in educational achievement . . . . . . . . . . .
Education and employment . . . . . . . . . . . . .
Educational profile of Australians . . . . . . . .
Literacy skills . . . . . . . . . . . . . . . . . . . . . . . .
Migrants and education . . . . . . . . . . . . . . . .
People with degrees . . . . . . . . . . . . . . . . . . .
1996 . . . 82
1998
1997
1999
1998
1996
1994
...
...
...
...
...
...
81
84
83
77
86
94
Expenditure
Paid work
Changing industries, changing jobs . . . . . . .
Decline of the standard working week . . . . .
Employment of people with a handicap . . .
Home workers . . . . . . . . . . . . . . . . . . . . . . .
Migrants in the labour force . . . . . . . . . . . . .
Public sector employment . . . . . . . . . . . . . .
Sick leave . . . . . . . . . . . . . . . . . . . . . . . . . . .
Small business . . . . . . . . . . . . . . . . . . . . . . .
The working week . . . . . . . . . . . . . . . . . . . .
Trends in part-time work . . . . . . . . . . . . . . .
Trends in women's employment . . . . . . . . .
Work and Indigenous people . . . . . . . . . . .
Youth employment . . . . . . . . . . . . . . . . . . .
1997
1999
1997
1995
1998
1998
1996
1997
1995
1994
1998
1996
1996
. . . 93
. . 105
. . 104
. . . 94
. . 107
. . 115
. . 105
. . . 99
. . . 91
. . 103
. . 111
. . 101
. . . 97
1994
1999
1999
1998
1995
. . 114
. . 110
. . 114
. . 103
. . . 98
Under-utilised labour
Long-term unemployment . . . . . . . . . . . . . .
Men and women wanting work . . . . . . . . . .
Older jobseekers . . . . . . . . . . . . . . . . . . . . .
Young jobseekers . . . . . . . . . . . . . . . . . . . . .
Youth unemployment . . . . . . . . . . . . . . . . .
Unpaid work
How couples share domestic work . . . . . . . 1999 . . 119
Unpaid household work . . . . . . . . . . . . . . . 1994 . . 120
Voluntary work . . . . . . . . . . . . . . . . . . . . . . 1997 . . 109
Expenditure on formal education . . . . . . . . 1998 . . . 86
Income and expenditure
Participation in education
Destinations of school leavers . . . . . . . . . . .
Education of Aboriginal and Torres Strait
Islander people . . . . . . . . . . . . . . . . . . . .
Education of Indigenous people . . . . . . . . .
Gender differences in higher education . . . .
Government and non-government schools .
Home-based higher education . . . . . . . . . . .
Overseas students in higher education . . . .
Time spent on education . . . . . . . . . . . . . . .
1999 . . . 87
1994
1996
1994
1997
1995
1995
1994
...
...
...
...
...
...
...
81
75
90
69
71
75
86
Income distribution
Charity at home and overseas aid . . . . . . . .
Differences in men's and women's earnings
Economic resources of older Australians . . .
Household income redistribution . . . . . . . .
Income distribution and lifecycle . . . . . . . . .
Income of Indigenous people . . . . . . . . . . .
Income sharing and income distribution . . .
1997
1995
1999
1996
1998
1996
1999
ABS • AUSTRALIAN SOCIAL TRENDS • 4102.0 • 1999
..
..
..
..
..
..
..
125
111
138
117
130
121
129
•
205
CUMULATIVE INDEX 1994–1999
Edition
Income and expenditure –
Page
Housing –
continued
Income distribution – continued
Lower income working families . . . . . . . . . .
Poverty: different assumptions,
different profiles . . . . . . . . . . . . . . . . . . .
Trends in earnings distribution . . . . . . . . . .
Trends in household disposable income . . .
Value of unpaid work . . . . . . . . . . . . . . . . . .
Women's contribution to couple earnings . .
Youth income . . . . . . . . . . . . . . . . . . . . . . .
Page
continued
Housing and lifestyle
1999 . . 134
1998
1994
1997
1995
1995
1997
..
..
..
..
..
..
125
137
117
118
115
121
Income support
Social security transfer payments . . . . . . . . . 1994 . . 147
Sources of income
Tertiary student income . . . . . . . . . . . . . . . .
Retirement income . . . . . . . . . . . . . . . . . . .
Special employee benefits . . . . . . . . . . . . . .
Superannuation: who will pay for the future?
Edition
1994
1994
1996
1995
..
..
..
..
139
143
126
120
Environment and the home . . . . . . . . . . . . .
First home buyers . . . . . . . . . . . . . . . . . . . .
Smaller households, larger dwellings . . . . .
Youth housing . . . . . . . . . . . . . . . . . . . . . . .
1997
1999
1998
1997
..
..
..
..
152
153
157
148
1994
1996
1996
1994
1999
1995
1999
1995
1995
1998
..
..
..
..
..
..
..
..
..
..
163
137
142
159
167
139
162
136
133
154
Housing stock
Caravan park residents . . . . . . . . . . . . . . . .
Home ownership . . . . . . . . . . . . . . . . . . . . .
Housing conditions of Indigenous people . .
Housing the population . . . . . . . . . . . . . . . .
Inner city residential development . . . . . . .
Investment in residential rental property . .
Rental investors . . . . . . . . . . . . . . . . . . . . . .
Safe as houses? . . . . . . . . . . . . . . . . . . . . . . .
Trends in housing . . . . . . . . . . . . . . . . . . . .
Wealth in the family home . . . . . . . . . . . . . .
Crime and justice
Taxation
How much tax do we pay? . . . . . . . . . . . . . . 1998 . . 139
Crime and justice
Expenditure
Expenditure on gambling . . . . . . . . . . . . . .
Household expenditure on recreation . . . . .
Purchasing power . . . . . . . . . . . . . . . . . . . .
Spending patterns and life cycle . . . . . . . . .
State differences in household expenditure .
The criminal justice system . . . . . . . . . . . . . 1997 . . 161
1999
1997
1995
1998
1996
..
..
..
..
..
141
130
124
134
129
Crime levels
Reported crimes . . . . . . . . . . . . . . . . . . . . . . 1997 . . 167
Corrective services
Prisoners in Australia . . . . . . . . . . . . . . . . . . 1997 . . 184
Housing
Violent crime
Housing arrangements
Murder and manslaughter . . . . . . . . . . . . . . 1997 . . 171
Victims of assault . . . . . . . . . . . . . . . . . . . . . 1997 . . 175
Violence against women . . . . . . . . . . . . . . . 1997 . . 179
Housing after separation . . . . . . . . . . . . . . . 1996 . . 146
Housing of recent immigrants . . . . . . . . . . . 1998 . . 149
Housing for older people . . . . . . . . . . . . . . 1996 . . 150
Culture and leisure
Housing assistance
Government assistance for housing . . . . . . . 1997 . . 143
Home care, hostels and nursing homes . . . . 1999 . . 157
Public tenants . . . . . . . . . . . . . . . . . . . . . . . 1994 . . 171
Culture and the arts
Culture-leisure workers . . . . . . . . . . . . . . . . 1995 . . 161
Interests in the arts and cultural activities . . 1999 . . 177
Music and performing arts . . . . . . . . . . . . . . 1995 . . 147
Housing costs
Housing affordability . . . . . . . . . . . . . . . . . . 1994 . . 167
Low income private renters . . . . . . . . . . . . . 1995 . . 143
Purchasing a home . . . . . . . . . . . . . . . . . . . . 1997 . . 139
206
Lifestyle
Household pets . . . . . . . . . . . . . . . . . . . . . . 1995 . . 168
Information technology in the home . . . . . . 1999 . . 189
Leisure at home . . . . . . . . . . . . . . . . . . . . . . 1995 . . 164
• ABS • AUSTRALIAN SOCIAL TRENDS • 4102.0 • 1999
CUMULATIVE INDEX 1994–1999
Edition
Culture and leisure –
Page
continued
Recreation
How Australians use their free time . . . . . . . 1999 . . 173
Travel and tourism in Australia . . . . . . . . . . 1995 . . 156
Sport
Sporting Australians . . . . . . . . . . . . . . . . . . . 1999 . . 183
Sporting nation . . . . . . . . . . . . . . . . . . . . . . 1995 . . 151
Special features
Environment
Household energy use . . . . . . . . . . . . . . . . .
Household waste management . . . . . . . . . .
People and the environment . . . . . . . . . . . .
People's concerns
about environmental problems . . . . . . . .
Transport choices and the environment . . .
1998 . . 171
1998 . . 180
1998 . . 163
1998 . . 167
1998 . . 175
Religion
Geographic distribution of religions . . . . . .
Religion and education . . . . . . . . . . . . . . . .
Religion and marriage . . . . . . . . . . . . . . . . .
Religious activity . . . . . . . . . . . . . . . . . . . . .
Trends in religious affiliation . . . . . . . . . . . .
1994
1994
1994
1994
1994
..
..
..
..
..
183
190
186
194
177
1996
1996
1996
1996
..
..
..
..
163
170
167
159
Transport
Car use . . . . . . . . . . . . . . . . . . . . . . . . . . . . .
Motor vehicle traffic accidents . . . . . . . . . . .
Public transport use . . . . . . . . . . . . . . . . . . .
Registered cars . . . . . . . . . . . . . . . . . . . . . . .
ABS • AUSTRALIAN SOCIAL TRENDS • 4102.0 • 1999
•
207
S E L F-H E L P AC C ESS TO STATISTIC S
DIAL-A-STATISTIC
For current and historical Consumer Price Index data,
call 1902 981 074.
For the latest figures for National Accounts, Balance of
Payments, Labour Force, Average Weekly Earnings,
Estimated Resident Population and the Consumer Price
Index call 1900 986 400.
These calls cost 75c per minute.
INTERNET
www.abs.gov.au
LIBRARY
A range of ABS publications is available from public and
tertiary libraries Australia wide. Contact your nearest library
to determine whether it has the ABS statistics you require.
WH Y NOT SUB SC R IB E?
PHONE
+61 1300 366 323
FAX
+61 3 9615 7848
CONS UL TANC Y SER VIC ES
ABS offers consultancy services on a user pays basis to
help you access published and unpublished data. Data that
are already published and can be provided within
5 minutes is free of charge. Statistical methodological
services are also available. Please contact:
City
By phone
By fax
Canberra
02 6252 6627
02 6207 0282
Sydney
02 9268 4611
02 9268 4668
Melbourne
03 9615 7755
03 9615 7798
Brisbane
07 3222 6351
07 3222 6283
Perth
08 9360 5140
08 9360 5955
Adelaide
08 8237 7400
08 8237 7566
Hobart
03 6222 5800
03 6222 5995
Darwin
08 8943 2111
08 8981 1218
POST
Client Services, ABS, PO Box 10, Belconnen ACT 2616
EMAIL
[email protected]

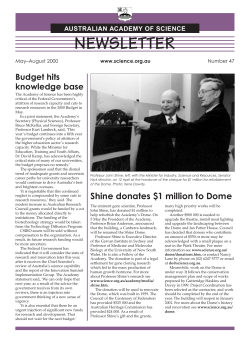
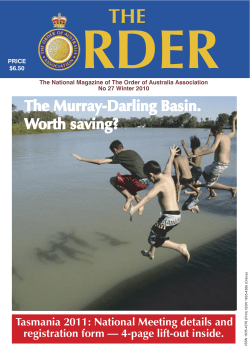
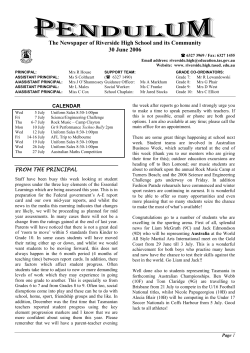


© Copyright 2026