
Medicaid Patients` Utilization of Outpatient and Emergency
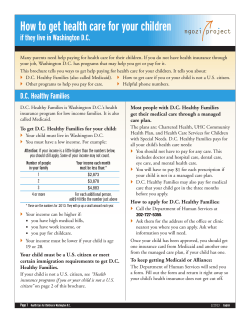
Medicaid Patients’ Utilization of Outpatient and
Emergency Department Services for
Cardiovascular and Diabetes-Related Conditions in
New York State
BACKGROUND
Low-income New Yorkers have higher rates of diabetes, obesity, cardiovascular disease, and coronary
heart disease than all other income groups. They are also less likely to have a regular source of care and
to obtain preventive screenings, including cholesterol testing.1 Additionally, low-income New Yorkers,
especially those on Medicaid, tend to use emergency departments for primary care.
Due to the increased cost for treatment in inpatient and emergency department settings, better
access to outpatient services that support chronic disease management could lower the cost of care and
improve health outcomes. Although New York’s Medicaid program is designed to increase access to care
for low-income New Yorkers, a number of barriers may limit this access. These barriers include:
physician maldistribution, with fewer physicians in rural areas compared with urban areas; an
insufficient number of physicians who accept Medicaid; lack of transportation; and limited ability to take
time off from work for medical appointments.2-4 This research brief reports on an analysis of Medicaid
patients’ use of outpatient and emergency department services for cardiovascular and diabetes-related
conditions in New York State, using claims data for patients ages 18 to 64 during the 2013 federal fiscal
year (FFY).
KEY FINDINGS
Medicaid patients in rural5,a areas are more likely than Medicaid patients in urban areas to
obtain cardiovascular and diabetes-related services from primary care physicians, physician
assistants, nurse practitioners, and in emergency departments.
Statewide, Medicaid patients received cardiovascular and diabetes-related services from cardiologists
and endocrinologists (11%), other medical specialists (34%) such as ophthalmologists and
gastroenterologists, primary care physicians (44%), other providers (5%) such as physician assistants
and nurse practitioners, and in emergency departments (6%) (Table 1). Patients in rural areas were
more likely to receive cardiovascular and diabetes-related services from primary care physicians (52%)
such as general internists and family or general practitioners, other providers (8%), and in emergency
departments (8%), compared with urban areas (42%, 5%, and 6%, respectively). By contrast, patients
receiving these services in urban areas were more likely to obtain them from cardiologists and
endocrinologists (12% compared with 7% in rural areas) or other medical specialists (36% compared
with 25% in rural areas).
Table 1. Percent Distribution of Who Provided Cardiovascular and Diabetes-Related Services by
Setting of Service, Specialty, and Rural/Urban Status, FFY 2013
Outpatient Physician Services
County of
Service
Cardiologists &
Endocrinologists
Other
Medical
Specialists
Primary Care
Physicians
Other
Providersa
Emergency
Department
Services
Rural
7.30%
25.00%
51.80%
7.90%
7.90%
Urban
11.50%
35.90%
42.10%
4.70%
5.80%
Statewide
10.90%
34.40%
43.50%
5.10%
6.10%
a
Other Providers includes: physician assistants, nurse practitioners, physical therapists, optometrists, podiatrists, registered nurses,
registered dietitians, occupational therapists, and diabetes educators.
a
This definition of rural and urban is based on Ebert’s Typology as outlined in Article 2, Title 2C, Section 235 of the New York State
Public Health Law.
Medicaid Patients’ Utilization of Outpatient/ED Services in New York, 2015
1
As noted above, Medicaid patients in rural areas tended to receive more cardiovascular and diabetesrelated services from emergency departments than did patients in urban areas. The rate of hospital
emergency department visits for these services was 18.3 per 1,000 Medicaid patients in rural areas,
compared with 13.8 visits per 1,000 Medicaid patients in urban areas (Figure 1).
Figure 1. Emergency Department Visit Rate for Cardiovascular and Diabetes-Related Services by
Rural/Urban Status (per 1,000 Medicaid Patients), FFY 2013
18.3
Rural
Urban
13.8
Blackb Medicaid patients were more likely to access cardiovascular and diabetes-related services
in hospital emergency departments than in outpatient settings.
Table 2 shows the race/ethnicity for Medicaid patients who received cardiovascular and diabetes-related
services in outpatient settings and hospital emergency departments by rural/urban status as well as
statewide. Differences in the race/ethnicity distribution across care settings (outpatient and emergency
departments) indicate that there are differences in access to care for particular racial/ethnic groups.
Statewide, white Medicaid patients were equally likely to access cardiovascular and diabetes-related
services in outpatient settings (30%) and in emergency departments (28%). Statewide, black Medicaid
patients were more likely to access these services in emergency departments (34%) than in outpatient
settings (22%). By contrast, statewide, Asian Medicaid patients with cardiovascular and diabetes-related
conditions were more likely to receive services in outpatient settings (14%) than in emergency
departments (4%). Statewide, Hispanic Medicaid patients accessed cardiovascular and diabetes-related
services similarly in outpatient settings (28%) and emergency departments (27%). Comparable patterns
were found in both rural and urban areas.
Table 2. Percent Distribution of Medicaid Patients with Cardiovascular and Diabetes-Related
Services by Race/Ethnicity and Rural/Urban Status, FFY 2013
County of Residence and
Type of Settings
White
Black
Asian
Hispanic
Othera
Outpatient Settings
85.40%
5.70%
0.80%
5.00%
3.00%
Emergency Departments
83.00%
7.80%
0.50%
5.90%
2.80%
Outpatient Settings
22.80%
23.70%
15.00%
30.20%
8.30%
Emergency Departments
19.40%
38.10%
4.00%
30.80%
7.70%
Outpatient Settings
29.50%
21.70%
13.50%
27.50%
7.80%
Emergency Departments
28.40%
33.80%
3.50%
27.30%
7.00%
Rural
Urban
Statewide
a
Includes patients who are non-Hispanic American Indian or Alaskan Native, multiple races, or whose race is unknown.
b
Hereafter, racial/ethnic categories are shortened: non-Hispanic white is referred to as white; non-Hispanic black/African
American is referred to as black; Asian/Pacific Islander is referred to as Asian; and Hispanic/Latino is referred to as Hispanic.
Medicaid Patients’ Utilization of Outpatient/ED Services in New York, 2015
2
In many rural counties, Medicaid patients obtain most of their cardiovascular and diabetesrelated services outside their county of residence.
In nearly a quarter of New York’s 62 counties, Medicaid patients received most (75% or more) of their
cardiovascular or diabetes-related services in their county of residence, although there were significant
differences by the urban/rural location (Table 3). Medicaid patients in 53% of urban counties received
most of their cardiovascular or diabetes-related services in their county of residence, ranging from 95%
of visits in Monroe, 93% in Erie, and 91% in Onondaga counties to 77% of visits each in Albany and
Rockland counties. In contrast, Medicaid patients in only 12% of rural counties received most of their
cardiology or diabetes-related services in their county of residence, whereas Medicaid patients in 12% of
rural counties received most of these services outside their county of residence, including Washington
(81% of visits), Hamilton (79%), and Tioga (78%) counties.
Table 3. Number and Percent Distribution of Counties by Patient Commuting Pattern and Rural/
Urban Status, FFY 2013
County of
Residence
Number of Counties and Percent of Patient Visits for Cardiovascular and
Diabetes-Related Services in County of Residence
0-24.9%
25-49.9%
50-74.9%
75% Plus
Rural
5 (11.6%)
15 (34.9%)
18 (41.9%)
5 (11.6%)
Urban
0 (0.0%)
1 (5.3%)
8 (42.1%)
10 (52.6%)
Statewide
5 (8.1%)
16 (25.8%)
26 (41.9%)
15 (24.2%)
Rural counties with small populations have the lowest average number of cardiovascular and
diabetes-related visits per physician.
The average number of cardiovascular and diabetes-related Medicaid visits statewide per physician
(cardiologists, endocrinologists, other medical specialists, and primary care physicians) was 101. The
counties with the lowest average number of cardiovascular and diabetes-related visits per physician
included Schoharie (26), Schuyler (27), Wayne (32), Tioga (33), Otsego (34), and Lewis (34) counties.
Figure 2. The Average Number of Outpatient Visits for Cardiovascular and Diabetes-Related
Services per Physician by County, FFY 2013
In contrast, all 5 counties with
an average higher than 85
cardiovascular and diabetesrelated visits per physician were
in New York City and the lower
Hudson Valley. Queens County
had the highest average
number of visits, at 186,
followed by Kings (176), Bronx
(118), New York (103), and
Rockland (91) counties.
METHODS
Medicaid claims data were
extracted using Salient
Medicaid Solutions Data,
Version 6.4, a database that
contains claims from the New
York Medicaid Data Warehouse. The study population was defined based on the following primary
diagnoses (1) International Classification of Diseases, Ninth Revision (ICD-9) codes 390 to 459 for
diseases of the circulatory system and (2) ICD-9 codes 249 to 250 for diabetes mellitus for individuals
Medicaid Patients’ Utilization of Outpatient/ED Services in New York, 2015
3
between the ages of 18 and 64 years. The service location was limited to outpatient settings (private
physicians, free-standing clinics, or hospital outpatient departments) or to hospital emergency
department visits that did not result in an inpatient stay.
The study focused on services that were provided by physicians and other providers, such as nurse
practitioners, physician assistants, podiatrists, optometrists, and dieticians/nutritionists. The study
population consisted of patients who made at least 1 visit to an outpatient setting or emergency
department located in the state and had a least 1 cardiovascular or diabetes-related service in FFY 2013
(October 2012 through September 2013).
The information extracted for this analysis included (1) patients’ characteristics, such as county of
residence at the date of service and race/ethnicity, (2) providers’ characteristics, such as service county,
national provider identifier number that was used, and type of specialist that provided the service, and
(3) number of visits for cardiovascular and diabetes-related conditions using both fee-for-service claims
and managed care encounters.
LIMITATIONS
It should be noted that the use of Medicaid data for workforce research has several limitations. Because
the intent of a claim is to be reimbursed for services provided, there is likely to be a certain level of
misclassification in a number of fields, including location of service, patient’s county of residence, and
provider specialty. Additionally, research findings are generalizable only to people with Medicaid
insurance and do not necessarily apply to people insured under Medicare, commercially insured, or
those without insurance.
CONCLUSIONS
There is great variation in Medicaid patient access to cardiovascular and diabetes-related services in
New York State. Cardiologists, endocrinologists, and other specialists tend not to practice in rural areas6;
as a result, Medicaid patients in rural areas are more likely to receive these services from primary care
practitioners than from specialists. There are also differences in access by race/ethnicity, with black
Medicaid patients receiving more services in hospital emergency departments. In addition, Medicaid
patients in many rural counties travel outside their county of residence for cardiovascular and diabetesrelated services.
This brief was prepared by the Center for Health Workforce Studies (CHWS) at the School of Public Health, University at
Albany, State University of New York. CHWS staff who worked on this brief include Simona Surdu, Robert Martiniano, and
Jean Moore. Support for this analysis was provided by the New York State Department of Health.
School of Public Health|University at Albany
http://chws.albany.edu
References
1. New York State Department of Health, Behavioral Risk Factor Surveillance System.
2. Paradise J, Garfield R. What is Medicaid’s impact on access to care, health outcomes, and quality of care? Setting the record straight on the
evidence. http://kff.org/medicaid/issue-brief/what-is-medicaids-impact-on-access-to-care-health-outcomes-and-quality-of-care-setting-the-recordstraight-on-the-evidence/. The Henry J. Kaiser Family Foundation, Commission on Medicaid and the Uninsured. Published 2013. Accessed April 27,
2015.
3. Dayaratna KD. Studies show: Medicaid patients have worse access and outcomes than the privately insured. http://www.heritage.org/research/
reports/2012/11/studies-show-medicaid-patients-have-worse-access-and-outcomes-than-the-privately-insured. The Heritage Foundation, Back
grounder, No. 2740. Published November 7, 2012. Accessed April 27, 2015.
4. Felland LE, Lechner AE, Sommers A. Improving access to specialty care for Medicaid patients: policy issues and options. http://www.chc1.com/
News/PressReleases/ImprovingAccessSpecialtyCare_CMWF_June_2013.pdf. The Commonwealth Fund. Published June 2013. Accessed April 27,
2015.
5. Eberts PR. Socioeconomic Trends in New York State: 1950-1990. 2nd ed. Albany, NY: New York State Legislative Commission on Rural Resources;
1994.
6. Armstrong, DP, Forte GJ. Annual New York Physician Workforce Profile, 2010 Edition. Rensselaer, NY: Center for Health Workforce Studies, School of
Public Health, University at Albany, State University of New York; 2010.
Medicaid Patients’ Utilization of Outpatient/ED Services in New York, 2015
4


© Copyright 2026