
Opportunities for Increasing Productivity & Profitability of Oil Palm
Opportunities for Increasing
Productivity & Profitability
of Oil Palm Smallholder
Farmers in Central
Kalimantan
Supported by:
DESCRIPTORS
Sector
Commodity Organizational Models , Production and Protection,
Landscape Management
Region
Central Kalimantan, Indonesia
Keywords
Sustainable Commodity Landscape, Smallholder Livelihoods, Supply Chain
Efficiency, Oil Palm, Indonesia
Related PILAR/ CPI projects
Study Team
HCV assessment (upcoming)
Legal Framework for land use revenue ( upcoming)
Dr.Ir.Suharno, MP; Dr.Yuprin Abel Dehen.,SP.,MP; Dr.Betrixia Barbara,SP.,Msi
Juliarta Bramansa Ottay [email protected]
Contacts
Dr.Ir.Suharno, MP [email protected]
[email protected]
ACKNOWLEDGEMENTS
First and foremost the authors would like to highlight the guidance and contributions provided by members
of the Central Kalimantan Production – Protection Working Group established by the Governor of Central
Kalimantan Decree number 188.44/265/2013: Dr. Yusurum Jagau, Faculty of Agriculture, University of
Palangka Raya; Lugi Kaeter, Plantation Agency; Adhiyaksa, Environment Agency; Halind Ardi, Executive
Secretary of GAPKI Central Kalimantan; Bismart Ferry Ibie, Lecturer,University of Palangka Raya; Farinthis
Sulaiman, MADN; Erman P. Ranan, DAD; Nurhanudin Achmad, Sawit Watch and Andi Kiki, Kemitraan. We
would further like to acknowledge the support of our technical advisory team: Budi Harjo Langen, Bappeda;
Humala Pontas, Environment Agency; Marline, Legal Bureau and Elsi, Finance Bureau.
The authors would also like to thank GreenWorksAsia and Climate Policy Initiative for their analytical support
and technical expertise and NORAD for providing funding for this project. Similarly we thank the survey
respondents from business and smallholder farmer communities for their valuable inputs and participation in
the study. Finally, the authors would like to make special acknowledgement of the analytical contributions
of students Laras Dwi Styawati, Mega Ratnasari, Eko Teguh Peristiwahyudi and Abertolomeus from the
Department of Social Economy, Faculty of Agriculture, University of Palangka Raya.
ABOUT US
Palangkaraya Institute for Land and Agricultural Research (PILAR) is a research foundation that supports
local experts, researchers, and students at the University of Palangkaraya to conduct analysis on land use
optimization in Central Kalimantan. PILAR has a particular focus on supporting the development of highproductivity, sustainable oil palm, while conserving valuable ecosystems in Central Kalimantan. The results of
PILAR analyses are used to develop recommendations for local policymakers and business investors.
Climate Policy Initiative (CPI) works to improve the most important energy and land use policies around
the world, with a particular focus on finance, through in-depth analysis on what works and what does not.
CPI works in places that provide the most potential for policy impact including Brazil, China, Europe, India,
Indonesia, and the United States. In Indonesia, CPI partners with the Ministry of Finance and Palangkaraya
Institute for Land-use and Agricultural Research at the University of Palangkaraya in Kalimantan. CPI is
supported by a grant from NORAD for the Central Kalimantan PALM project.
With funding from :
Opportunities for Increasing Productivity & Profitability of Oil Palm Smallholder Farmers in Central Kalimantan
II
Executive summary
The Governments of Indonesia and Central
Kalimantan have ambitious targets to both grow the
palm oil sector and improve environmental quality
by reducing deforestation. On the production side,
this includes a national target to increase crude
palm oil (CPO) production to 40 million tonnes
annually by 2020, and a provincial plan to triple the
oil palm production area in the same time frame.
On the protection side, there is a goal to reduce
emissions by 26% at the national and provincial level,
primarily by reducing deforestation. To achieve
these dual economic and environmental goals,
increasing productivity throughout the oil palm
value chain and ensuring plantations are located on
suitable lands will be essential.
independent smallholder farmers, to extract lessons
that could inform the development of guidelines for
improving smallholder farmer productivity through
strengthened organization of farmers and the
establishment of best practice company-community
partnerships.
We find that, as the plantation area managed by
smallholder farmers grows, there are opportunities to
improve productivity and farmer benefits within all
models that we examined, particularly for individual
partnership and independent farmers. Specifically,
our analysis suggests that:
• The cooperative plasma model that we
studied was highly successful in managing
both production and market risks. It reaches
the highest yields in the survey sample, at
95% of yield potential. The ability to spread
risks across cooperative members is an
important advantage of the cooperative;
Smallholder farmers are an important part of the
picture. In Central Kalimantan, they currently
manage an estimated 15% of the planted palm oil
area. However, given the ambitious sectoral growth
targets, coupled with the regulatory requirement23
that 20% of oil palm should be smallholder
managed, the plantation area managed by
smallholder farmers is expected to expand rapidly
between now and 2020. This report begins to explore
options for increasing productivity and profitability
of smallholder farmers in Central Kalimantan,
to align this growth with Indonesia’s economic,
environmental and development goals.
• The company-managed plasma model also
produced high yields.24 For the companymanaged model, high yields combined
with efficient operating cost management
contributed to strong profitability per
hectare;
• There is most scope to improve productivity
and profitability for the individual partnership
model, which is only achieving 52% of its
potential yield and the lowest profits for
farmers of the models sampled.
Smallholder farmers in Central Kalimantan have a
variety of different industrial organisation models,
which impact their productivity, profitability, and
risk exposure. These models can be separated
into two basic types: 1) independent smallholder
farmers and 2) smallholder partnership farmers,
which vary between different levels of collective
organisation, from individual or one-to-one
partnerships with oil palm companies, to farmer
groups and institutionalized cooperatives. This
study examines three company-smallholder farmer
partnership models in Central Kalimantan as well as
• Additional analysis by IPB suggests that
independent smallholders consistently display
lower yields than plasma farmers - up to
50% lower.25 Qualitative analysis conducted
through our study also highlighted the high
exposure of independent smallholder farmers
to a wide range of legal, supply, production
and market risks.
24
25
23
Article 58 under new Plantation Act Law Nr. 39 of 2014.
Concerns about low fertilizer application for immature plants
were noticed, however cannot be confirmed in the absence of
historical data.
Bogor Agricultural University, 2012, Reducing agricultural
expansion into forests in Central Kalimantan- Indonesia: Analysis of
implementation and financing gaps.
Opportunities for Increasing Productivity & Profitability of Oil Palm Smallholder Farmers in Central Kalimantan
III
Overall, the study findings provide a strong case for
larger scale, more integrated smallholder plantation
management. Both the cooperative and companymanaged plasma models contribute to better
performance in terms of yields and profitability per
hectare. Both models allow for better planning and
more efficient management, while also mutualizing
risks among a larger pool of members.
The cooperative model tends to be more
advantageous to smallholders, as it provides a
greater array of benefits and they retain greater
control over the plantation. However, field interviews
suggest that institutional weaknesses, lack of
financial transparency and budget accountability
can be barriers to the emergence of successful
cooperative models.
KEY FINDINGS FOR COOPERATIVE MODELS
Transparency and accountability are key
prerequisites for cooperative production to be
effective. Our analysis suggests that support from the
company partners’ operations personnel in building
the cooperative’s management capacity, including
developing operating procedures, reporting
mechanisms, transparency and accountability
can help to establish more effective plantation
A word on methodology
Our data samples were collected in four
districts of Central Kalimantan: Kotawaringin
Timur, Kotawaringin Barat, Seruyan, and
Katingan. Quantitative data on the main
productivity and cost drivers for each of the
smallholder models was compiled through
University of Palangka Raya-led field surveys
of smallholder farmers at the selected sites.
Qualitative questions were included in the
field survey to explore business risks and value
chain issues for each model. Focus group
discussions were held at each of the field site
to benchmark survey results. Analysis was then
conducted on the data set, the results of which
are detailed in Chapter 4.
management and administration practices,
which is perceived as a key success factor by
participating farmers. In addition, oversight from the
lending bank during the development and payback
period, through regular audits, also contributed to
high levels of transparency and accountability.
KEY FINDINGS FOR COMPANY-MANAGED MODELS
Company-managed production models are
generally cost effective and efficient. With the right
institutional settings, they can also provide a viable
model for reconciling local communities’ welfare
and efficient land use. This model of partnership
can benefit the company, which retains control
over management and value chain, as well as
smallholders, who receive benefits for leasing their
land.
Efforts to strengthen transparency and
accountability mechanisms, and address any land
ownership issues would help ensure that this model
delivers inclusive benefits and does not contribute to
social conflicts in the region. Plasma schemes were
initially developed as a model to raise the capacity
and productivity of local smallholder farmers. Under
the company-managed model, it is questionable
whether it contributes to this or the original goal of
improving farming practices.
IMPLICATIONS
Growing pressure for sustainable palm oil production
has resulted in many companies involved
throughout the oil palm value chain taking on
significant sustainability commitments.
To achieve these goals, it will be critical to increase
productivity throughout the value chain, in order
to reduce pressure for expansion into forest areas
to meet economic and production targets of the
business sector and governments. Given smallholder
farmers manage such a significant portion of oil
palm plantations, increasing their productivity and
integration into value chains, coupled with ensuring
their plantations are located on environmentally
suitable lands, is of increasing importance.
Otherwise, important gains in sustainability made by
companies may be offset.
Opportunities for Increasing Productivity & Profitability of Oil Palm Smallholder Farmers in Central Kalimantan
IV
Our analysis identifies opportunities to improve
productivity and profitability for smallholder farmers
through a combination of strengthening agricultural
practices and improving the organisational models
of farmers to better manage risk and maximise
benefits. We propose two streams of follow up
work, to support the development of successful
smallholder models:
• Case studies on cooperative models: a series
of case studies on cooperative models to
better understand the factors for establishing
a successful cooperative, including
examining value chain integration strategies,
scale, capacity requirements, legal and
institutional settings and governance
mechanisms to provide optimal productivity,
risk management, transparency, and
accountability.
• Toolkit for model selection: it is likely that
there is not a ‘one-size-fits-all’ model for
smallholder production. As such, we propose
to develop a toolkit to assist smallholder
farmers determining the most suitable model
and important partnership and governance
features for their circumstances. The model
will take into account economic, social and
environmental features for communities
that have already opted to engage in oil
palm activities as part of their development
planning.
These case studies and tool kits will support
communities engaged in oil palm production, as
well as governments and business, in meeting their
economic, development and environmental goals,
including:
• For communities: this will enable choices
about best organizational model for
communities engaged in oil palm, better
manage risks, increase benefits retained
locally (including economic, social and
environmental), and support improved
agricultural practices and market access
• For business: this will reduce community
conflict, help to manage supply chain
and reputational risks, ensure business
sustainability gains are not offset by
smallholder expansion into important
ecosystems, and increase business certainty
for downstream actors
• For governments: this will support sectoral
economic growth targets, promotion of rural
livelihoods and improved environmental
outcomes at scale.
Opportunities for Increasing Productivity & Profitability of Oil Palm Smallholder Farmers in Central Kalimantan
V
CONTENTS
1.Introduction
1
1.1
Central Kalimantan Context...................................................................................................... 2
1.2
About this study........................................................................................................................... 3
2.Methodology
4
2.1
Model Identification.................................................................................................................... 4
2.2
Sample selection......................................................................................................................... 4
2.3
Survey design............................................................................................................................... 4
2.4
Training for surveyors................................................................................................................... 4
2.5
Data collection and compilation............................................................................................. 4
2.6
Data analysis................................................................................................................................ 4
3. Partnership Models 6
3.1
Overview: Smallholder Farmer Partnership Models................................................................. 6
3.1.1 Cooperative Plasma Scheme .................................................................................................. 7
3.1.2 Individual Partnership Scheme.................................................................................................. 8
3.1.3 Company-Managed Scheme................................................................................................... 9
4. Analysis of Partnership Models 4.1
12
Productivity and profitability of smallholder models............................................................. 12
4.1.1 Individual partnership............................................................................................................... 13
4.1.2 Cooperative Plasma................................................................................................................. 13
4.1.3 Company-Managed................................................................................................................ 14
4.1.4 Opportunities to increase productivity................................................................................... 15
4.2
Risk management..................................................................................................................... 16
5. Summary of Findings: Smallholder Farmer Partnership Models19
5.1
Cooperative Model.................................................................................................................. 19
5.2
Individual Partnership Model .................................................................................................. 19
5.3
Company-managed Model.................................................................................................... 20
6. Independent Smallholder farmers21
6.1
Supply chain.............................................................................................................................. 21
6.2
Access to finance..................................................................................................................... 21
6.3
Access to markets and supporting infrastructure.................................................................. 21
6.4
Access to knowledge/extension services.............................................................................. 22
6.5
Risk exposure.............................................................................................................................. 22
6.6
Conclusions................................................................................................................................ 22
7. Conclusions and Recommendations
23
Opportunities for Increasing Productivity & Profitability of Oil Palm Smallholder Farmers in Central Kalimantan
VI
1. Introduction
Reconciling economic and environmental goals in
the land-use sector is a high priority for Indonesia,
which is both the world’s largest oil palm producer,
and is also home to 10% of the world’s tropical
forests. Currently, oil palm plantations cover
approximately 5% of Indonesia’s land area, and
are one of the most profitable agricultural crops
throughout much of Indonesia. Palm oil is the
third highest export,26 and the agriculture sector
contributed approximately 12% of Indonesia’s
GDP in 2013.27 Further, strong global demand for
palm oil, which is projected to increase, is creating
a powerful incentive for the oil palm industry
to expand production, sometimes threatening
and encroaching on high conservation value
environmental areas. Increasingly, the ability to
guarantee sustainability of products using palm oil is
becoming paramount to larger multi-national buyers
who produce consumer products.
26
27
Hence buyers are looking to oil palm plantations
in their supply chain to deliver high-productivity,
sustainable palm oil. However, plantation managers
are not a homogenous group. They range from
larger-multinationals, state-owned enterprises and
small-medium enterprises to smallholders.
This study is part of a series of analyses undertaken
by the Palangka Raya Institute for Land-use and
Agricultural Research (PILAR) and supported by
Climate Policy Initiative looking at the oil palm
value chain and land management practices in
Central Kalimantan. We aim to support government,
business, and community actors in the oil palm value
chain to increase productivity to meet economic
production goals, while also increasing protection of
valuable ecosystems and delivering local benefits.
In this study we focus on smallholders, who at the
national level manage more than 40% of Indonesia’s
oil palm plantations.
Ministry of Trade, January – September 2013.
BPS, 2014
Opportunities for Increasing Productivity & Profitability of Oil Palm Smallholder Farmers in Central Kalimantan
1
1.1
Central Kalimantan Context
Central Kalimantan’s economy is particularly
dominated by the agricultural sector, with 67% of
the population living in rural areas and agriculture
contributing 28% of its GDP. Of this, oil palm
plantations contributed approximately half, or 14%
of Central Kalimantan’s total GDP in 2013,28 while
the province of Central Kalimantan contains 10% of
Indonesia’s oil palm plantations. According to the
BPS, smallholders manage approximately 15% or
181,136 hectares of the total 1,168,451 hectares of
oil palm plantation in Central Kalimantan in 2013.29
Private companies manage the remaining 85% of
Central Kalimantan’s existing plantations.
There are an estimated 85,000 smallholders,30
amounting to an average of approximately 2
hectares per smallholder farmer.
Potential for oil palm expansion is still relatively high
in Central Kalimantan. To support the Government
of Indonesia’s national goal of 40 million tonnes of
CPO by 2020, the Central Kalimantan government
is planning to triple plantation area to reach above
3.5 million hectares by 2020. In addition, Article
58 under new Plantation Act Law Nr. 39 of 2014
sets a minimum of 20% of the total land bank to
be managed by smallholders. Therefore by 2020,
smallholder plantations would need to increase
approximately four-fold if the regulation and the
area growth targets are fulfilled.
However, Central Kalimantan also holds 10% of
Indonesia’s forests, and, these forests are shrinking
with deforestation, mostly caused by plantation
expansion, forest fires, and illegal logging. The
average rate of deforestation in the region has
been 1,900 km2 per year from 1996 to 2012.31 Local
communities’ livelihood strategies mostly rely on
forest resources and agriculture. This implies that
determining ways in which to protect forests while
meeting economic goals in Central Kalimantan is
critical for these communities’ development.
It should be highlighted that there is scope to
accommodate oil palm plantation expansion
without compromising environmental protection
goals, for example through the conversion of an
estimated 3.3 million hectares of suitable degraded
lands.32
31
28
29
30
GRDP central Kalimantan 2004-2013 , BPS Provinsi Kalimantan
Tengah
Central Statistical Agency, BPS, 2014, Stat Kelapa Sawit 2013
Available at http://www.bps.go.id/webbeta/website/
flipping_publikasi/stat_kelapa_sawit_2013/indexFlip.php
Tree Crop Estate Statistics of Indonesia 2012-2014
32
http://www.gcftaskforce-database.org/CarbonAccounting/
CentralKalimantan
Gingold, Beth, A. Rosenbarger, Y.I. K. D. Muliastra, F. Stolle, I. M.
Sudana, M. D. M. Manessa, A. Murdimanto, S. B. Tiangga, C.
C. Madusari, and P. Douard. (2012) “How to identify degraded
land for sustainable palm oil in Indonesia.” Working Paper. World
Resources Institute and Sekala, Washington D.C. Available at
http://wri.org/publication/identifyingdegraded-landsustainable-palm-oilindonesia
Opportunities for Increasing Productivity & Profitability of Oil Palm Smallholder Farmers in Central Kalimantan
2
1.2
About this study
Through the Central Kalimantan Production –
Protection Initiative, PILAR and CPI are partnering
with government and businesses in Central
Kalimantan to develop a plan and model for
sustainable oil palm production that can help to
increase agricultural productivity throughout the oil
palm value chain, while protecting natural resources
and delivering benefits to local communities.Under
this initiative, CPI is supporting PILAR to conduct
research and analysis on production and protection
issues for a multi-stakeholder working group that
was established by the Governor to help deliver
the Government of Central Kalimantan’s vision to
optimize land use and build a sustainable palm oil
sector. Initial research is identifying the most relevant
sectors, actors, and opportunities that could
become agents of change. We have identified
preliminary opportunities to adjust how land
resources are allocated and how fiscal policies can
incentivize more sustainable behaviour, as well as to
adapt business models to increase local agriculture
productivity and mechanisms for sharing benefits
more equitably among government, business and
community actors.
This study looks at opportunities for improving
agricultural productivity through improved business
models, particularly for smallholder farmers.
We begin with the methodology used to assess
smallholder business models in Central Kalimantan.
We then describe the forms of partnership models in
Chapter 3. In Chapter 4, we summarize our analysis
of the scale, operating costs, yields, and profits of
each smallholder farmer model. In Chapter 5 and
6, we draw conclusions around the opportunities for
strengthening company – community partnership
and independent smallholder farmer models,
respectively, before ending with overarching
conclusions and recommendations in Chapter 7.
Opportunities for Increasing Productivity & Profitability of Oil Palm Smallholder Farmers in Central Kalimantan
3
2. Methodology
2.1
Model Identification
The aim of the study is to identify the main types
of smallholder production models in Central
Kalimantan, describe how they operate, profile
production practices and effectiveness, and
provide a cost and productivity benchmark for each
model.
Preliminary scoping discussions with local experts
and stakeholders allowed us to identify the three
partnership production models mentioned above.
2.2
Sample selection
In order to cover each of the four production
models identified, survey samples were selected in
Kotawaringin Timur, Katowaringin Barat, Seruyan,
and Katingan. These districts were selected due
to their high numbers of oil palm plantations, and
their relative contribution to Central Kalimantan’s
Fresh Fruit Bunches (FFB) production. These districts’
GRDP33 heavily rely on palm oil – up to 40-50%.
Further, based on PILAR land use analysis, these
districts still have high potential for conducting land
swaps to mitigate deforestation risk. A target of 30
respondents across five sites was set (three different
partnership models and two independent sites),
hence 150 respondents in total.34
2.3
Survey design
Survey questionnaires and analytical models were
developed to compile quantitative data on the
main productivity and cost drivers for oil palm
plantations. Qualitative questions were also added
to explore business risks and supply chain issues for
each model considered.
2.4
Training for surveyors
Expert analysts from GreenWorksAsia provided a
series of trainings for the surveyors participating in
Program PILAR (UNPAR bachelor students in their
final semester). The training focused on building a
strong understanding of the oil palm value chain,
key performance and cost drivers, and training
surveyors in using questionnaire and input templates.
A simulation exercise was conducted to assure that
surveyors understood the data objectives.
33
34
2.5
Data collection and compilation
Data collection was conducted between July and
September 2014. Focus Group Discussions (FGD)
held with local farmers and community leaders in
the days prior to conducting the field surveys. The
FGD was intended to facilitate surveyors follow up
interviews, but also to try and establish reference of
benchmark values on key indicators such as yield
and fertilizer use, in order to identify outlier data.
The FGDs also allowed surveyors to explore some
key supply chain issues and business risks. In the
case of the cooperative and company-managed
plasma schemes, production data was compiled
respectively from the cooperative’s and inticompany’s production reports.
2.6
Data analysis
The first step consisted in identifying outlier data,
discussing data validity, and reconfirming key data
points, notably in relation to yields.
Subject matter experts, primarily agronomists and
plantation managers, developed a potential yield
projection for each category of seedlings, soil type,
and age profile as a reference to identify outlier
data. Based on the planting year recorded, it was
assumed that seedlings from the previous year
were used. It should be noted that the potential
yield value refers to the yield potential of specific
seedlings, planted in suitable soil condition and
under good management practices. Yield values
above 120% of that potential yield are considered
outlier/unreliable. This is a standard method utilized
to assess production performance in corporations’
plantation estates. Normally, smallholders produce
significantly lower yields than corporate estates. The
probability of reaching 100% of the yield potential
is small and 120% is deemed unrealistic. Analysis
of primary data underlined important limitations
in the data collection process. Most of the yield
data reported by respondents was considerably
above the 120% threshold, up to 60% in certain data
sets. The study team was not able to conduct field
verification of yields, and as such outlier data was
excluded from quantitive analysis component of this
study and only qualitative results were used in those
instances.
Gross Regional Domestic Product
To be noted that two samples of independent smallholders were
excluded from the quantitative analysis
Opportunities for Increasing Productivity & Profitability of Oil Palm Smallholder Farmers in Central Kalimantan
4
Table 1: Field trips and data collection exercise
TRIP 1
TRIP 2
TRIP 3
TRIP 4
TRIP 5
DATE
15-19
July 2014
13-17
August 2014
1-5
September 2014
10-13
September 2014
23-27
September 2014
RESPONDENTS
20 (10 were not
producing yet)
30
30
30
30
MODEL
Individual
Partnership
Cooperative
Companymanaged Plasma
Independent
Smallholders
Independent
Smallholders
DISTRICTS
Kotawaringin
Barat
Kotawaringin
Barat
Katingan
Kotawaringin
Timur
Seruyan
In order to analyze plantation management
practices and productivity drivers, inputs (labour,
fertilizer, pesticides and herbicides) were compared
to benchmark values developed by subject matter
experts. This analysis allowed us to put yield findings
into perspective and identify potential for yield
improvements or improved efficiency.
Although yield data on the individual Partnership
scheme sample were assessed as unreliable, analysis
of upkeep and cost data was in line with subject
matter experts’ benchmarks and considered usable.
Therefore, it was decided to use the FGD’s yield
benchmark (11.8 tonnes FFB / hectare) as the source
of yield data, as data from respondent interviews
were varied and included outliers.
Opportunities for Increasing Productivity & Profitability of Oil Palm Smallholder Farmers in Central Kalimantan
5
3. Partnership Models
3.1 Overview: Smallholder Farmer
Partnership Models
Within the smallholder category, farmers are not a
homogeneous group and significant differences
exist between different smallholder production
models. According to existing literature and our own
observations, current smallholder yields in Central
Kalimantan have a wide range, from 735 to 20 tonnes
of fresh fruit bunches36 per hectare. As such, there is
significant scope to prioritize improving smallholder
productivity to meet economic and production
goals.
Smallholders can be divided into independent
and partnership farmers. Partnership programs
are any smallholder farmers associated with a
core “inti” plantation, collectively or individually.
Partnership schemes vary between different
levels of collective organisation, from individual
partnerships with oil palm companies, to farmers
groups and institutionalized cooperatives. However
the low yields from individual partnerships indicate
lower productivity and profitability than other
partnership models studied. According to Yahya
and Basyaruddin (2015)37 one of the conditions and
challenges faced by the smallholders, independent
of age, is that more often than not farmers are not
able to fully implement good agricultural practices
(GAP) and good farm management practices
(GMP). Existing research and literature has also
established that independent smallholders remain
significantly less productive than smallholders
working through a partnership with inti-companies38.
The qualitative analysis conducted through this study
also highlighted the high exposure of independent
smallholder farmers to a wide range of legal, supply,
production, and market risks.
35
36
37
38
For instance many small independent farmers have
developed their palm oil in non-contiguous plots
depending on where they happen to own land, and
they cannot afford land near an inti plantation or
have joined partnerships. This is because firstly, many
smallholders were encouraged by government
led plasma partnerships with farmers with little land
(2 Ha), low skills, and limited access to market, to
develop new oil palm plantations on previously
forested land. This scheme was a response to the
limitations of the transmigration program, during
‘big bang’ decentralisation in early 2000. Further,
weak governance and poor enforcement to
meet requirements for plasma-inti integration led
to relatively lower private plasma development.
Therefore, such smallholder development hasn’t
been planned or integrated into companies’
supply chains. Given the gap between smallholder
partnerships and independent smallholders, the
comparative aspects of this study focus on the
differences in the various partnership models rather
than comparing partnerships with independent
smallholders. We aim to identify key features,
best practices and highlight key strengths and
weaknesses of each partnership model.
Three main partnership models existing in Central
Kalimantan are examined, namely 1) Cooperative
Plasma Scheme, 2) Individual Partnership Scheme
and 3) Company-managed plasma scheme. The
analysis focuses on key productivity and profitability
drivers that drive benefits in terms of yields, but also
profits for smallholders. Considering the higher-risk
profile of smallholder farming compared to risks
faced by companies operating at a relatively larger
scale, discussion on production models also assesses
the effectiveness of each model to mitigate risks.
Bogor Agricultural University, 2012, Reducing agricultural
expansion into forests in Central Kalimantan- Indonesia: Analysis of
implementation and financing gaps.
Survey results for the Cooperative Plasma Scheme
Yahya, Sudirman and Basyaruddin, Darmansyah. 2015. Capacity
Building for the Farmer. Discussion paper for the Working Group
Meeting on Sustainable Palm Oil initiative of the Ministry of
Agriculture on March 10 to 11, 2015. Jakarta.
Bogor Agricultural University, 2012, Reducing agricultural
expansion into forests in Central Kalimantan- Indonesia:Analysis of
implementation and financing gaps.
Opportunities for Increasing Productivity & Profitability of Oil Palm Smallholder Farmers in Central Kalimantan
6
3.1.1
COOPERATIVE PLASMA SCHEME
In the cooperative plasma scheme, smallholder farmers manage the whole plasma plantation collectively,
pooling their land plots into a shared plantation. The farmers share profits and risks. Like the other two
models, they sell FFB to the inti-company. Farmers can work on the plantation for salary, as well as receiving
their profit share as members, and they can also manage their own independent plots alongside the
plantation, with benefit of accessing seedling, fertilizer and selling to mill through the cooperative.
NAL
ADDITIO
SMALLHOLDER 1
(CO-OP MEMBER)
LABOR
SALARY
FOR LABOR
LAND
ACCESS
SMALLHOLDER 2
(CO-OP MEMBER)
(CO-OP MEMBER)
LABOR
+ CO-OP
BENEFITS
INDEPENDENT
PLOT
LAND
ACCESS
LAND
ACCESS
$
+ CO-OP
BENEFITS
SMALLHOLDER 3
$
+ CO-OP
BENEFITS
$
+ CO-OP
BENEFITS
COOPERATIVE
PLANTATION
ADDITIONAL $
$
NAL
ADDITIO
COMPANY
MILL
*OPTIONAL COMPONENTS IN RED
Opportunities for Increasing Productivity & Profitability of Oil Palm Smallholder Farmers in Central Kalimantan
7
3.1.2
INDIVIDUAL PARTNERSHIP SCHEME
In the individual partnership scheme, smallholder farmers manage their own plot of land individually. They
sell FFB to the inti-company (usually large-medium conglomerate). They have the opportunity to buy
seedlings and fertilizer from the plantation company.
INDIVIDUAL PLASMA
INDIVIDUAL
SMALLHOLDER
PLOT 1
INDIVIDUAL
SMALLHOLDER
PLOT 2
INDIVIDUAL
SMALLHOLDER
PLOT 3
$
$
SEEDLINGS
+ FERTILIZER
PLANTATION COMPANY
COMPANY
MILL
*OPTIONAL COMPONENTS IN RED
Opportunities for Increasing Productivity & Profitability of Oil Palm Smallholder Farmers in Central Kalimantan
8
3.1.3
COMPANY-MANAGED SCHEME
In the company-managed scheme, the inti-company directly manages the plasma plantation on behalf
of the farmers. Farmers provide the company with access to the land and receive a share of the profits,
which are distributed by the cooperative (note the only function of cooperative in this instance is profit
distribution).
$
$
SMALLHOLDER 1
$
SMALLHOLDER 2 SMALLHOLDER 3
LAND
TITLE
LAND
TITLE
LAND
TITLE
COOPERATIVE
$
COMPANY-MANAGED
PLANTATION
COMPANY
MILL
Opportunities for Increasing Productivity & Profitability of Oil Palm Smallholder Farmers in Central Kalimantan
9
Table 2: Overview and comparison of 3 Partnership Models
COOPERATIVE
INDIVIDUAL
COMPANY-MANAGED
DISTRICT LOCATION
Kotawaringin Barat
Kotawaringin Barat
Katingan
YEAR STARTED
1996
2007
1997
PLANTED AREA
1,018 Ha
89 Ha
325 Ha
NUMBER OF
FARMERS
515 farmers
20 farmers
108 farmers
INSTITUTIONAL
SETTINGS
FINANCE
After securing a customary
land certificate (Surat Adat)
from the local community
leader, landholders relinquish
title and control to the
inti- company. They do not
function as farmers and
have no responsibility for
management or production.
The cooperative is managed
Individual holders of land
as a single production entity,
certificates
come together to
each member/landowner
join
smallholder
partnership.
contributing to and benefiting
Inti- company sets minimum
from the whole rather than
group size of 10 farmers per
only their plot of land.
group.
Members work as professional
farmers, responsible for upkeep Each farmer is responsible for
There is no limitation over land
and harvest for the whole
the management of their own
area applied. A cooperative
cooperative area, not limited
plot of land and production.
exists for financial purpose
to their own plot of land.
only in distribution of income
to smallholders
Plantation development is
financed through a Kredit
Koperasi Primer untuk
Anggota (KKPA), a credit
facility guaranteed by and
channelled through the inticompany to the cooperative.
Loan grace period: 4 years.
Land certificates used as bank
collateral.
Banks play a key role in
ensuring best management
and transparent practices
through quarterly audits and
disbursing credit based on
work plans agreed by the
company and the planning
unit of the cooperative.
FARMER INCOME
DISTRIBUTION
A profit sharing agreement
of 70/30 split for cooperative
and company. After loan
repayment, the Cooperative
retains a profit share of 4%
to cover its costs (eg for
replanting, guarantee of
minimum etc); the rest is
distributed amongst members,
and the cooperative
guarantees a minimum of IDR
1.25 million per month/Ha to
each member.
Development funds are
disbursed from the inticompany. Source of funds
include banks and company
balance sheet. Lower than
market cost loans are repaid
through revenue sharing on
FFB sales.
Farmers are paid 70% of their
FFB sales while in payback
period. Once repaid, they
get 100% payment of FFB
proceeds.
Bank financing is arranged
and managed by IntiCompany. The smallholder is
not involved in financing.
All development and
operational costs incurred by
company are deducted from
FFB proceeds.
During the loan repayment
period, plasma farmers retain
only 20% of the generated
value.
After loan repayment, 55% of
the generated value is paid
to landholders.
Opportunities for Increasing Productivity & Profitability of Oil Palm Smallholder Farmers in Central Kalimantan
10
COOPERATIVE
ADDITIONAL
INCOME
OPPORTUNITIES
Smallholders can work as
Smallholder is required to
professional farmers for
manage his own plot to
cooperative and earn extra
receive the benefits and
income, or manage additional
participate.
independent plots. Other
external income opportunities In addition, he can plant other
types of crops, or work other
are also open as the
farmer’s plantation during
smallholder is not required to
harvesting
be farmer.
Cooperative is responsible
for procurement of input
(seeds, fertilizer, production
equipment, etc) to the
transport and sale of FFB to
the CPO mill. All activities/
operational costs are
managed and recorded by
the cooperative.
VALUE CHAIN
Upkeep, harvesting, and
transportation are planned
and organized at the
Cooperative (Koperasi Unit
Desa or KUD) level, for the
whole cooperative plantation.
Transport: Fleet of 5 trucks
deliver FFB to the CPO mill. This
eliminates any dependence
on intermediaries.
REPLANTING
INDIVIDUAL
In addition to funding,
Company provides training.
Farmers are fully responsible
to manage their own land.
Partnership members can
order inputs/maintenance
material/fertilizer as a farmers
group. The company provides
fertilizer on credit against
future delivery of FFB.
Transport: surveyed plots were
located near the inti-mill (less
than 5% rely on intermediaries
for transportation to mill)
COMPANY-MANAGED
There is no time required by
landowners therefore there
are many external income
opportunities available.
Inti-company is responsible
for land clearing, plantation
development, inputs and
supply chain management,
upkeep and harvest of FFB.
Contractual obligation to sell
FFB to inti-company.
The cooperative is responsible
for replanting and has
a replanting fund (The
reserve fund acts as a price
stabilisation mechanism to
Individual farmers are
guarantee a minimum IDR
responsible for replanting. It
2.5 million monthly revenue
is likely that they will need to
to farmers. Around 16% of
obtain a further loan from the
operating profits are being
company to finance the costs.
saved for replanting, which is
planned to start within 5 years)
that enables them to finance
replanting without need for a
further loan.
Company is responsible for
replanting and will need
to finance. The cost will be
passed on to farmers and
deducted from profits.
Opportunities for Increasing Productivity & Profitability of Oil Palm Smallholder Farmers in Central Kalimantan
11
4. Analysis of Partnership Models
4.1 Productivity and profitability of
smallholder models
On the outset, comparison between the models
finds that the individual partnership had the highest
operating costs per Ha of all the three models
with fertilizer accounting for more than 50% of the
operating costs. The individual partnership site was
experiencing some difficulties in reaching its optimal
yield, and as a consequence, farmer profits were
the lowest per ha of the models we analyzed.
Whereas, the cooperative model, which was the
largest in terms of scale analysed, achieved the
highest yield, closest to the potential recommended
and farmers received the highest profit per Ha.
The medium-scale company-managed model
studied also performed well in terms of yield,
although there was room to improve to close the
gap between yields and the optimal yield for the
seedling type. The operating profit was considerably
higher than the individual partnership model,
coming in just behind the cooperative.
The following section assesses these three models
individually and examines how yields, scale and
operating costs impact smallholder profits in further
detail. It also gives insights on how different models
arrangements share risk, and allocate income or
take home pay for the smallholders.
Opportunities for Increasing Productivity & Profitability of Oil Palm Smallholder Farmers in Central Kalimantan
12
Table 3: Overview Smallholder Models’ Revenues, Costs and Profitability23
COOPERATIVE
(IDR/HA/YR)
INDIVIDUAL
(IDR/HA/YR)
COMPANY-MANAGED
(IDR/HA/YR)
24,326,683
14,561,407
25,090,088
267,225
1,214,805
*
HARVESTING COSTS
2,585,296
1,902,857
808,719
FERTILIZER COSTS
3,840,665
5,880,858
2,535,475
UPKEEP COSTS
1,262,341
1,800,766
261,351
OPERATING PROFIT
16,371,156
3,762,121
21,484,544
REVENUES COLLECTED
TRANSPORTATION COSTS
* The financial statements do not include transportation costs separately. Transportation costs are included in other cost components
23
Referring to the results in 2013 over the range of one year.
4.1.1
INDIVIDUAL PARTNERSHIP
Yields and Scale: Yield averages 11.8 Tonnes per
Ha for the scale of 4.04 Ha/farmer. Actual reported
yields reached only 52.4%39 of the potential yield
profile for the type of seedlings used, which is
low considering there is no shortage of fertilizer
or good seedlings. In fact, the survey data
showed that fertilizer application is higher than
the good practice benchmark for both mature
and immature plantations. The data collected
does not allow for a conclusion about the reason
behind lower performance,40 but lower yields
may reflect inappropriate fertilizer use or lower
fertilizer use during an immature stage. It should be
acknowledged here that there is a high level of
uncertainty regarding yield data.41
Costs: Labour inputs for upkeep and cultivation are
significantly below benchmark standards, and could
contribute to high harvesting costs. 42 Operational
costs are driven upwards due to the high fertilizer
costs. The achieved income is only a fraction of the
optimal yields possible despite the quality seedlings
planted.
39
40
41
42
Productivity compared against benchmark set by Subject Matter
Expert and producer of seeds of the same age. In this analysis it is
assumed that the type of seed used is Bibis produced in the year
prior to the year of planting.
The difference in productivity needs to be investigated more
deeply, by analyzing historical data fertilization, and also the
suitability of fertilization through soil testing and fertilizer types.
This data collected which was collected through field surveys
contained a large amount of outliers, compared to credible
datasets for the cooperative and the company-managed
plasma, which were obtained directly directly. Instead, to
maintain credibility and consistency in the data analysis, the
average yield recorded in the FGDs has been used, even though
this is relatively lower than input data collected.
Harvesting costs and yields are two different things. Low upkeep
costs do not impact yields significantly, but make the actual
harvesting logistically more challenging, hence more expensive.
Profits: The profit is less than one third compared
to profits achieved in other models and stands at
3.762.121 IDR/ Ha/ year. With an average plantation
size of 4.45 Ha per farmer, each farmer‘s income
is IDR 1.4 million/month, still significantly below
minimum wage.
There are clear economic disadvantages to
individual partnership and lack of economies
of scale, which notably impact investment in
supportive infrastructure including buying fertilizer
at scale, and risk management (risk is mutualized
among smallholders) considering they are individual
entities.
4.1.2
COOPERATIVE PLASMA
Yields and Scale: With an average plantation size
of 1.98 Ha per farmer, the cooperative plasma
model yields the highest FFB tonnage of the samples
studied, with 20 Tonnes/Ha/Yr, demonstrating highly
efficient plantation management. Our analysis of
production data indicates that appropriate fertilizer
use supports strong yields.
Costs: Labour input for upkeep and cultivation
was significantly below benchmark standards
contributing to increased cost of harvesting. Relative
to the benchmark costs, harvesting costs were high.
Available data suggests that low labour input in
upkeep is compensated by higher upkeep through
material costs, i.e. utilisation of more pesticides and
insecticides. Moreover, the cooperative benefits
from lower transportation costs as it benefits from
economies of scale.
Opportunities for Increasing Productivity & Profitability of Oil Palm Smallholder Farmers in Central Kalimantan
13
Profits: The cooperative plasma model has strong
operating profits, which reached over IDR 16.3
million per Ha/year with the smallholders being able
to retain over 96% of the operating profit and with
cooperatives selling price of FFB as the highest of
all the models. The cooperative set aside IDR 2.65
billion of reserves in 2013, equivalent to 15.92% of
the years’ distributed profits. This reserve is intended
to compensate for any potential drop in future
profitability by guaranteeing cooperative members
a minimum income of IDR 2.5 million43/month.
After loan repayment profits are distributed evenly
amongst members. The cooperative retains around
4% of the profits to cover its operational expenses.
In 2013, each member received the equivalent of
around IDR 2.6 million per month in profit sharing,
up to IDR 3.1 million including non-cash benefits
(reserves and replanting fund). The reserve fund acts
as a price stabilisation mechanism to guarantee a
minimum IDR 2.5 million monthly revenue to farmers.
Around 16% of operating profits are being saved for
replanting, which is planned to start within 5 years.
The cooperative management is currently studying
the best option for replanting: extracting Vs injection
to remove old trees, best seedling option, plantation
design, etc.
Although cooperatives had the best yield and
coverage for risk exposure, with stronger integration
into the supply chain, there is room to benefit from
further cost efficiencies and profit margins. However,
strong and transparent accountability systems have
been identified as a key success factors for the
cooperative model.
4.1.3
COMPANY-MANAGED
Yields and Scale: With an average plantation size
of 3.10 Ha per farmer, the survey data shows that
adequate fertilizer use is supporting good yields, at
18 tonnes/Ha. This is almost 85% of potential yield
compared to the benchmark.
43
This is more than the minimum wage in Central Kalimantan which
is 1,896,367 IDR per month and slightly higher than the minimum
decent living wage of 2,254,000 IDR per month. Price fluctuation is
a key issue for smallholder farmers, hence this acts like stabilization
mechanism
Costs: The company managed model benefits
from economies of scale and integrated supply
chains with harvesting and upkeep costs 50%-70%
less than the other models. It is only using 37% of
recommended fertilizer usage, and 20% of labour
usage as per the benchmarks, but company
data suggest that there is no significant impact on
harvesting or material upkeep cost.
Profits: High yields combined with low upkeep
costs support strong operating profits. Profits were
the highest of the sample, hence the companymanaged model appears to be the most effective
for profitability with almost 86% profit margins.
However, fertilizer application for immature plants,
at 0.2kg per tree is insufficient and raises concerns
about the future yield performance of immature
plants representing more than half of the smallholder
area.
With an average of 3 hectares per smallholder,
each member will receive around IDR 15 million
per year44 during the payback period, equivalent
to less than IDR 1.26 million per month, significantly
below the province’s minimum wage. However this
payment is simply a rental fee and landholders can
take up other employment.
Although the profit margin is high, there is still
room for cost efficiencies on scale and integrated
supply chain efficiencies that could increase
profitability even further. However, this model
struggles to protect and benefit smallholder
livelihoods compared to the cooperative model.
After bank loan repayment, landowners retain 55%
of value declared by the company, around IDR
1.15 million per Ha per month, just slightly less than
the cooperative farmers. However, the pay-back
period of 16 years is relatively long, and hence, over
a 25-year productive period, the average monthly
income per Ha – around IDR 680 thousand - would
remain more than 40% below that of cooperative
farmers.
44
This refers to the 3 per ha during the payoff period, source: Data
key points for benchmark and costing (farmer profit before payoff,
per year and per ha) * 3 in the Annex.
Opportunities for Increasing Productivity & Profitability of Oil Palm Smallholder Farmers in Central Kalimantan
14
4.1.4
OPPORTUNITIES TO INCREASE PRODUCTIVITY
There were opportunities in all models to increase
productivity and profitability. In particular individual
partnerships have the potential tp double their
yield, while the company-managed model also has
significant room for improvements.
Further time series analyses would be needed to
suggest how to improve the yields, for example on
past year’s practices, or in fertilizer use, or on the
chemical characteristics of the soil, etc. These further
analyses may also need further investigation, soil
testing, and fertilizer testing.
In terms of labour inputs, all three models were well
below the recommended inputs for their types
of seedlings. For the cooperative and company
managed models, the input was only 30% and
20% of recommended labour input respectively.
The low labour input was largely compensated
by other inputs as these models still performed
relatively highly against their potential yield. But for
Table 4: Model Profiles for Yield, Labour & Fertilizer
the individual partnership, the low labour input was
not sufficiently compensated for. For this model,
reaching the optimal labour input may help to
address the yield performance. This highlights
opportunities in factor efficiencies with the company
managed and cooperative models, which could
further benefit from production efficiencies.
In terms of fertilizer use, the individual partnership
was using 25% more than the recommended fertilizer
inputs. This was contributing to higher operating
costs, but did not seem to be supporting good yield
performance. The other two models were inputting
below the recommended fertilizer, but achieving
relatively good yield performance, and as such
the reduced fertilizer was a cost savings in terms
of operating costs. Further investigation is required
to understand why individual partnership farmers
use more fertilizer but achieve very low yield while
company-managed plasma achieve high yields
with very little input and to explore opportunities for
yield improvement.
YIELD
(% OF POTENTIAL)
LABOUR
(% OF RECOMMENDED)
FERTILIZER USAGE
(% OF RECOMMENDED)
COOPERATIVE
95%
30%
69%
COMPANY- MANAGED
85%
20%
37%
SCHEME
INDIVIDUAL
52%
47%
Opportunities for Increasing Productivity & Profitability of Oil Palm Smallholder Farmers in Central Kalimantan
125%
15
4.2
Risk management
The following table compares the risks between the three smallholder partnership models studied. The
cooperative model provides the greatest ability to manage risks for smallholder farmers, with the individual
partnership model being the most risk exposed.
Table 5: Risk Management of Smallholder partnership models
RISKS
COOPERATIVE
INDIVIDUAL
COMPANY-MANAGED
•Each plot is a separate
production unit
PRODUCTION
•Risk mutualized
•Risk borne by individual
farmers (as such highly
vulnerable to external risks
such as flooding, fire, pest or
disease)
•No insurance product
available
•No insurance products
available
•Single production unit
(comprised of farmer plots
contributed by members)
•Company holds risk
•However, if land becomes
unproductive unlikely
company will provide income
to farmers – so risk is passed
on
•Planning and financing of
replanting
•Risk mutualized
LEGAL
•(12ha currently under
dispute – but all members still
receive benefits from active
plantation)
•Distribution of subsidized
fertilizer to smallholders in
region has proved highly
unreliable
SUPPLY
•Group able to manage
this risk by directly accessing
fertilizer from suppliers owing
to scale of their plantation
•Also able to invest in local
infrastructure directly
MARKET
•Protected by company
partner through guaranteed
off-take
•Price fluctuations can
impact, but established
reserve fund to mitigate
•Risk borne by individual
farmers
•Farmers highly vulnerable
without valid land certificate
•Fertilizer supply guaranteed
by company
•Limited ability to improve
infrastructure, as operating
as individual plots and
hence limited resources to
invest in road maintenance
and repair and water table
management etc.
•Off-take agreement with
partner company, but highly
sensitive to price fluctuations
owing to scale
•Company responsable to
access fertilizer and invest in
infrastructure
•Off-take guaranteed as
company managed, but
farmers remain sensitive to
price fluctuations
Opportunities for Increasing Productivity & Profitability of Oil Palm Smallholder Farmers in Central Kalimantan
16
As a further illustration of risk exposure, we
conducted two sensitivity analyses of farmer profits
per hectare, the first with fluctuations in price and
the second with fluctuations in yield. The prices of
FFB (fresh fruit bunches) used for the analysis are
set by the local government. The sensitivity analysis
highlights the correlation between productivity and
costs on one hand (Figure 1 below), and sensitivity to
price and yield variation on the other hand (Figure 2
below). The higher the margin on operating profits,
the lower the sensitivity to price and yields.
Figure 1
Sensitivity to Price Changes
Operating Profit
(IDR per hectare)
INDIVIDUAL PARTNERSHIP
+150%
3.8m
0
+50%
COOPERATIVE 15.7m
base
Decreasing
Operating
Profit
20m
10m
+100%
Increasing
Operating
Profit
30m
30m
20m
10m
-50%
0
-100%
COMPANY MANAGED
13.8m
-150%
30m
20m
10m
0
-50% -40% -30% -20% -10% base +10% +20% +30% +40% +50%
Price Decrease
Price Increase
-50% -40% -30% -20% -10% base +10% +20% +30% +40% +50%
Price Decrease
Price Increase
Figure 2
Sensitivity to Yield Changes
Operating Profit
(IDR per hectare)
INDIVIDUAL PARTNERSHIP
+150%
0
+50%
30m
COOPERATIVE
20m
base
Decreasing
Operating
Profit
20m
10m
+100%
Increasing
Operating
Profit
30m
10m
-50%
0
-100%
COMPANY MANAGED
-150%
30m
20m
10m
0
-50% -40% -30% -20% -10% base +10% +20% +30% +40% +50%
Yield Decrease
Yield Increase
-50% -40% -30% -20% -10% base +10% +20% +30% +40% +50%
Yield Decrease
Yield Increase
Opportunities for Increasing Productivity & Profitability of Oil Palm Smallholder Farmers in Central Kalimantan
17
For the price sensitivity analysis, we aim to examine
price impacts operating profits to see how different
models are exposed to the risk of price volatility.
The study finds that the individual partnership model
is most sensitive to both increases and decreases
in price. For example, a 30% price increase leads
to 100% increase in profits (whereas the other two
models increase by less than 50%). But likewise, a
30% decrease in price is more than 100% decrease
in profits, taking the individual partnership model into
the negative.
Mapped against actual profits, the analysis finds
that the smallholder profits were highest in the
cooperative model. Even with a 50% decrease in
price, farmer profits under the cooperative model
would be higher than the individual partnership’s
base profit. Hence the cooperative and company
managed models out perform the individual
partnership both in terms of actual profits and risk
exposure.
For the second sensitivity analysis, on yield, we
examine how a percentage increase in yield
impacts operating profits to see how different
models are exposed to the risk of yield volatility.
The study finds a similar pattern and risk level for all
the three models, however, because starting yields
were again lower for the individual partnership
model, its risk exposure and sensitivity to change
is greatest. With a 30% increase in yields for the
individual partnership model, profits increase by
just below 100%, and with a 30% decrease in yields,
profits decrease by nearly 30%. For both price and
yield, the company-managed model is the least
sensitive (hence least risk exposed, but also not
as able to benefit from increases in price or yield).
The cooperative performs well in both models,
and as mentioned earlier has some unique risk
management features through it’s reserve fund that
guard against the decreases in price or yield to
protect farmers and provide more stable minimum
profits throughout the plantation cycle.
In summary, the individual partnership scheme,
which features very low yields and high input costs,
therefore a slim margin, is particularly sensitive to
price and yield variations. The company managed
scheme, which has the lowest operating costs and
highest margin in the sample is particularly resilient
to price and yield fluctuations. The cooperative
scheme features the highest yields per Ha, but
has significantly higher costs than the company
managed plantation. This highlights the importance
of cost management in building model resilience to
yield and price fluctuations.
Opportunities for Increasing Productivity & Profitability of Oil Palm Smallholder Farmers in Central Kalimantan
18
5. Summary of Findings: Smallholder
Farmer Partnership Models
This report finds a range of options for smallholder
partnership models of which the cooperative
model is the most beneficial for smallholder
farmers in terms of more sustainable livelihoods,
higher yields, higher revenue, improved access to
marketing channels, and reduced risk exposure.
Although the company-managed plasma model
also provides higher revenues, access to markets,
and reduced risk exposure, this model does not
contribute to improved smallholder capacity by
empowering farmers to the same extent as the
cooperative model. However, while the cooperative
model that was examined in this study was highly
successful, there are numerous examples of failed
cooperatives. Therefore, there is merit in exploring
institutional settings and the prerequisites that
make cooperatives successful. In the interim, there
is also merit in considering how to improve value
chain integration of smallholders within company
models, and where and how each of the different
models may work best or be most suitable (including
individual partnership and independent models).
5.1
Case: KUD Cooperative23
One of the smallholder communities surveyed
had tried to form a KUD24 cooperative, which
failed to provide the expected benefits to its
members; lack of transparency allowed the
KUD management to embezzle its members’
funds, resulting in its disbandment. Based
on our discussions, very few examples of
smallholder cooperatives have been recorded
in the region. As such, further analysis is
required as to the requirements of establishing
a successful cooperative, and also a toolkit
to enable other organisational models to
be pursued in circumstances where the
foundations for a successful cooperative are
not present.
23
24
Source: FGD 11 September - Karang Sari, Parenggean,
Kotawaringin Timur
Koperasi Unit Desa (Indonesian Village Cooperative
System; rural savings and loan cooperatives)
Cooperative Model
Under the Cooperative scheme, the inticompany participates in building the cooperative
management capacity and assists in developing
operating procedures, reporting, transparency
and accountability mechanisms to ensure
effective plantation management practices and
sound administrative management. In addition,
involvement in oversight from the bank lending
for smallholder plantation development during
the development and payback period, through
regular audits, also contributed to high levels of
transparency and accountability. Shared risks
among cooperative members are also an important
advantage for individual members. Cooperative
management has also allowed for learning and
professionalization of farmers within the cooperative.
However, establishing a successful cooperative
model can be very challenging, and requires local
community cohesion around common goals, values,
and principles. Previous unsuccessful experiences
(corruption of cooperative management) have
impacted trust and confidence in cooperative
models.
Further, an off-take agreement with the inticompany does and will protect farmers against
market risks. The reserve fund does and will also
provide a buffer to mitigate FFB price fluctuation
and act as an income stabilization instrument.
Finally, cooperative management also allows
investment in infrastructure maintenance and
development, contributing to keeping transportation
costs in line and preventing supply chain disruptions
of individual plots following road or irrigation canal
damage.
5.2
Individual Partnership Model
In comparison, the Individual Partnership model
also presents several advantages, notably supply
chain security and credit opportunities for input
procurement; the company will guarantee supply of
seedlings and fertilizer to partnership farmers, even
allowing deferred payments. An off-take agreement
with the inti-company also protects the partnership
farmers against basic market risks, however they are
still sensitive to changes in yield.
Opportunities for Increasing Productivity & Profitability of Oil Palm Smallholder Farmers in Central Kalimantan
19
While farmers under an individual partnership
scheme are mitigated against supply and market
risks, individual production models do not allow
risks to be mutually shared. Partnership farmers
remain vulnerable to production risks and FFB price
fluctuation. Similarly, individual partnership farmers
will have limited resources to invest in infrastructure
maintenance and repair, and will face difficulties
responding individually to infrastructure damage.
5.3
Company-managed Model
The Company-Managed scheme has clear
advantages of integration into company’s
management, effective infrastructure maintenance
and repair for effective supply chain and market
risk management. Similar to the cooperative
scheme, production risks are shared across the
whole hectarage. Last, since the plantation is being
managed by the company, smallholders will not
have to spend time on upkeep or harvesting, and
will be able to engage into alternative revenue
generating activities.
Despite the obvious advantages, concerns about
land rights legality, accountability, and data
transparency to smallholders have to be highlighted.
Management data and records are not made
available to plasma smallholders or the financial
cooperative. Moreover, over 25 years, financial
benefits for smallholders remain significantly lower
than under the cooperative plasma scheme.
Table 6: Comparison of partnership production models25
INDIVIDUAL
COOPERATIVE
COMPANY-MANAGED
AVERAGE YIELD
(TONNES/HA/YR)
11.8
20
18
THE SELLING PRICE OF
FRESH FRUIT BUNCHES (FFB)/KG (RP)
1.216,33
1.393,89
1.234,02
SALE REVENUE /HA/YEAR (RP)
14,561,407
24,326,683
25,090,088
OPERATING PROFITS
(PER HA)
3,762,121
16,371, 156
21,484,544
FARMER’S PROFIT
(PER HA POST- SETTLEMENT) 26
3,762,121
15,682,711
13,799,548 27
PERCENTAGE OF OPERATING PROFIT
RETAINED BY FARMER
100%
96%
64% 28
FARMER’S AVERAGE YEARLY INCOME
(INCLUDING BENEFITS 29)
16,741,438 30
28,141,180 31
PROFIT MARGIN (OPERATING PROFIT/
REVENUE)
26%
67%
86%
FARMER’S AVERAGE MONTHLY
INCOME (INCLUDING BENEFITS)
1,395,120
2,345,098
2,050,983
FARMER’S AVERAGE MONTHLY
INCOME PER HA (INCLUDING
BENEFITS)
313,510
1,172,549
681,614
25
26
27
28
29
30
31
32
33
24,611,794
32,33
Shaded areas in this table indicate profits which are retained by the company, however they are important as they reflect management
efficiencies.
This refers to the Farmer Income after paying off the loan (IDR / ha / year). Source: in the annex.
Farmer income (profit) is associated with the operating profit (after deduction of operation cost), except for the company managed scheme,
where it is governed by contract that states 55% from the total sales regardless of the value of operations cost.
For the company manage scheme, as per contract with smallholders, they receive 55% from the total sales.
This includes the cost of reserve and replanting. Please see annex for source.
Farmer profit after loan pay off (IDR/Ha/year)* Average Plantation Size per Farmer (4.45)
The calculation includes both profit before and after loan pay-off. The formula of average yearly income used is: { [Farmer Profit before loan
pay off (IDR/Ha/year)*Loan Period*average plantation size per farmer] + [Profit after pay off (IDR/Ha/year) * period until replanting *average
plantation size] } /(Total time period which is 25 in this case.
Profits are still shared among all members, based on the land they contributed, which is 2Ha per members, despite12Ha which are not
producing as the risks and loss are mutualized amongst all members.
{ [Farmer profit before loan pay off (IDR/Ha/year)*16*Average plantation size per farmer (3.01 ha)] + [ Farmer Profit after loan pay off (IDR/Ha/
year)* (25-16) * Average plantation size per farmer (3.01 ha ) ] }/25
Opportunities for Increasing Productivity & Profitability of Oil Palm Smallholder Farmers in Central Kalimantan
20
6. Independent Smallholder farmers
Independent smallholders consistently display lower
yields than plasma farmers, up to 50% lower. The
field study conducted in Kotawaringin Timur and
Seruyan explored systemic challenges throughout
the value chain for independent smallholders:
access to quality seeds and fertilizer; access to
finance; and access to markets.
The quantitative data on yields and production
costs for independent smallholders was collected
through field surveys, and contained many outliers
compared to credible datasets for the cooperative
and the company-managed plasma. Consequently,
the discussion relating to independent smallholders
in this report is focused on the qualitative data that
was obtained through focus group discussions.
Focus Group Discussions highlighted that one of the
major obstacles to improved productivity and risk
management for independent smallholders is their
ability to address systemic challenges, for instance
access to finance and markets, which are difficult
to address as an individual farmer at a small scale.
The field study underlined insufficient financial
transparency and management accountability as
key obstacles for effective collective organizing.
Cooperation between farmers remains limited,
mostly focused on sharing costs for infrastructure
repairs, on an ad-hoc basis.
6.1
Supply chain
Because independent smallholders are generally
unable to secure reliable supply of fertilizer and
quality seedlings, they are exposed to considerable
supply chain risks. They are dependent on
intermediaries or traders who access fertilizer
and seedlings from companies or large suppliers
on behalf of many individual farmers. They also
generally pay much higher costs for these inputs,
which increases their operating costs and reduces
profits.
Limited access to quality inputs (mainly seeds and
fertilizer) contribute to lower yields compared to
partnership farmers who are able to obtain inputs
from the inti-company’s supply chain. Independent
farmers stated that up to 50 trees per hectare,
or more than one third of planted trees, failed to
produce fruit. Respondents suggested suppliers are
not providing genuine or high quality seedlings and
fertilizer, which has significant impacts on farmer
yields and productivity.
6.2
Access to finance
Independent smallholders are unlikely to access
bank loans individually. In the absence of
development capital (estimated IDR 35 million per
Ha), they cannot afford to buy quality certified
seedlings and rely instead on cheaper local nurseries
with variable quality. Independent smallholders
who participated in the survey also indicated that
they commonly reduce the amount of fertilizer to
immature oil palm trees, therefore impacting their
future yield potential. Therefore, limited financial
access to independent smallholders will contribute
to lower yields. Further, many small independent
farmers have developed their palm oil in noncontiguous plots because it depends on where
they happen to own land as they do not have the
finance to buy near inti plant.
6.3 Access to markets and supporting
infrastructure
Field discussions have revealed that independent
smallholder development was not only driven by
local communities, but also by small scale local and
national investors, working through local farmers to
take advantage of the relatively low land prices in
Central Kalimantan. As a consequence, smallholder
development tends to be supply driven, developed
without sufficient consideration of available market
capacity.
The oil palm industry in Central Kalimantan is
relatively integrated, with larger companies
matching mill capacity to plantations. As a
result, CPO mills have limited excess capacity
to accommodate independent smallholder
production.
Failure to integrate smallholder production into
existing mills weakens independent farmers’
leverage and allows companies to push FFB price
lower through higher ratios of grading. In most cases,
independent smallholders will rely on intermediaries
to buy their FFB and spread processing among
different local mills, taking a fee for transport and
marketing.
Opportunities for Increasing Productivity & Profitability of Oil Palm Smallholder Farmers in Central Kalimantan
21
In the group surveyed, the intermediary fee reached
13% of the production’s value. Obviously, the higher
the uncertainty of market absorption of FFB then the
higher the intermediary’s fee.
6.4 Access to knowledge/extension
services
• Limited access to finance and supply chain
inefficiencies contribute to low quality of
input, notably seedlings and fertilizer, and
therefore smallholders generate yields much
lower than partnership smallholders who
are integrated into inti-companies’ supply
chains.
Discussion with independent smallholders also
highlighted strong demand for extension services,
training and knowledge sharing on good farming
practices. In particular, independent smallholders
highlighted the need to better identify and deal with
pest and disease.
• Poor integration with CPO mills and
the supply chains mean independent
smallholders face high market risks, which
considerably weaken their bargaining
position vis-à-vis FFB buyers and
intermediaries.
6.5
• Lack of knowledge and capacity on
plantation upkeep, notably pest and disease
control tends to accentuate production risks.
Risk exposure
Independent smallholders are not able to spread
and share risks or insure themselves against external
risks, and therefore remain highly vulnerable to
production loss and sustainable access to credit.
6.6
Conclusions
Independent smallholders face systemic challenges
to productivity improvements, as well as greater
exposure to a wide range of risks:
Interviews highlighted institutional weaknesses,
notably lack of value chain transparency and
financial accountability as key blockages to the
development of effective collective production
mechanisms.
Opportunities for Increasing Productivity & Profitability of Oil Palm Smallholder Farmers in Central Kalimantan
22
7. Conclusions and Recommendations
With company plantation development being
increasingly regulated, as the industry looks to
comply to legal Indonesia Sustainable Palm Oil
(ISPO) and Roundtable of Sustainable Palm Oil
(RSPO) requirements, managing smallholder
development is important to ensure this
development does not become a key driver of
deforestation and offset sustainability gains made
by companies. Smallholder farmers have, to date,
largely operated outside certification standards,
with few legal requirements applying to the
development of agricultural production at this
smaller scale. The Ministry of Agriculture, with support
from UNDP, are taking steps to enable smallholders
to be bought within the ISPO framework. We hope
this study and planned follow up work can make
a timely contribution to these efforts by helping to
inform development of smallholder organisation
models.
Improved coordination and larger-scale smallholder
business models would help smallholders to meet
certification standards, improve efficiency, and
achieve better integration into oil palm value chains.
There are opportunities to improve productivity and
farmer benefits within all models.
Both the cooperative and company-managed
plasma models feature strong performance in terms
of yields and profitability per hectare and can be
easily integrated into landscape-level planning,
provide more efficient management structures,
and mutualize risks among a larger pool of farmers.
Of the two plasma models, the institutional and
legal settings of the cooperative model tend to be
more advantageous to smallholders and facilitate
the delivery of a broader set of local development
benefits beyond simple farmer profits.
In contrast, our analysis suggests that independent
smallholder oil palm farming is economically
inefficient, unable to reach the required scale
to access input supply or markets, and is highly
exposed to a wide range of risks. As such,
organization of smallholders is important to achieve
economies of scale, minimise risk exposure and
deliver greater benefits to local farmers. Ideally,
smallholder production should be matched with
local milling capacity to ensure market outlets for
farmers and economic efficiency.
Development of higher productivity smallholder
organizational models must take place on
environmentally suitable lands to deliver both
economic and environmental goals. Linking this
analysis to CPI-PILAR’s related analysis on high
value ecosystems will be critical to ensure that both
company and smallholder plantations on suitable
lands.
RECOMMENDATIONS FOR COOPERATIVE
PRODUCTION MODELS
Transparency and accountability are key
prerequisites for cooperative production to be
effective. Our analysis suggests that support from the
company partners’ operations personnel in building
the cooperative’s management capacity, including
developing operating procedures, reporting
mechanisms, transparency, and accountability
can help to establish more effective plantation
management and administration practices, which is
perceived as a key success factor by participating
farmers. In addition, oversight from the lending bank
during the development and payback period,
through regular audits, also contributed to high
levels of transparency and accountability.
KEY FINDINGS FOR COMPANY-MANAGED MODELS
Company-managed production models are
generally cost effective and efficient. With the right
institutional settings, they can also provide a viable
model for reconciling local communities’ welfare
and efficient land use. This model of partnership
can benefit the company, which retains control
over management and value chain, as well as
smallholders, who receive benefits for leasing their
land.
Efforts to strengthen transparency and
accountability mechanisms, and address any land
ownership issues would help ensure that this model
delivers inclusive benefits and does not contribute to
social conflicts in the region. Plasma schemes were
initially developed as a model to raise the capacity
and productivity of local smallholder farmers. Under
the company-managed model, it is questionable
whether it contributes to this original goal of
improving farming practices.
FOLLOW-UP ANALYSIS AND TOOLKIT DEVELOPMENT
The study highlights the advantages of a partnership
system compared to independent farmers. These
Opportunities for Increasing Productivity & Profitability of Oil Palm Smallholder Farmers in Central Kalimantan
23
advantages include more sustainable livelihoods
in terms of higher yield and revenue, improved
access to marketing channels, and reduced risk
exposure. With the existence of many independent
smallholder farmers in Central Kalimantan, building
a pathway to organize them into appropriate
partnership schemes could deliver economic
benefits to the community and local region. Both
public and private actors would need to support this
organization, including involvement of the private
sector to develop technical capacity, value chain
integration, and reduction of company-community
conflicts. The government also has an important role,
including linking smallholders with the ISPO, ensuring
market regulation is aligned (including price setting
for CPO), regulating how benefits are shared
between government, business and community
actors, managing spatial planning and resolving
land rights and ownership issues.
For communities that choose to engage in oil
palm and have suitable lands available from an
environmental perspective, the choice of the
appropriate smallholder organisation model will
depend on a range of local factors. All of the
models assessed have variations in form and come
with their own merits and shortcomings.
Further analysis is needed on the circumstances
when different models might be most suitable and
the key features for success of each model so that
it delivers the maximum benefits to the community,
while meeting economic, environmental, other
social goals. We propose further case studies on
the key features of a successful cooperative, given
the numerous examples of failed cooperatives in
Indonesia. We also propose a toolkit to support
model selection by companies and communities.
Opportunities for Increasing Productivity & Profitability of Oil Palm Smallholder Farmers in Central Kalimantan
24
Annex I – Breakdown of costs and benchmarks
for smallholder farmer partnership models
OVERVIEW OF PROFITABILITY FOR SMALLHOLDER
PARTNERSHIP MODELS:
Figure 1: Cooperative Plasma’s Scheme Profitability
Figure 2: Individual Partnership’s Scheme Profitability
Opportunities for Increasing Productivity & Profitability of Oil Palm Smallholder Farmers in Central Kalimantan
25
Figure 3: Company-Managed Plasma Scheme Profitability
Table 7 Benchmarks for recommended inputs, & cost analysis23
COST
(IDR/HA)
RECOMMENDED
LABOUR
(INPUT DAYS/HA)
MATURE PLANTATION
2,400,000
36
IMMATURE PLANTATION
4,000,000
54
FERTILIZER
COST
(IDR/HA)
RECOMMENDED
FERTLIZER
(KG/TREE)
UPKEEP
23
RECOMMENDED
LABOUR
(INPUT DAYS/HA)
MATURE PLANTATION
7,000,000
8
4
IMMATURE PLANTATION
5,800,000
5
2.5
HARVESTING
COST
(IDR/KG)
HARVESTING
80
TRANSPORTATION
50
The benchmark for input and cost analysis has been developed by Arghajata based on recommendations from Subject Matter Experts Agronomists and former plantation managers.The benchmark for yields is based on data provided by seedling producers, broken down by
type of soil and geographic location; in this case, we used data for mineral soil in Central Kalimantan
Opportunities for Increasing Productivity & Profitability of Oil Palm Smallholder Farmers in Central Kalimantan
26
Table 8 Palm Oil Yield in Mineral-Soil in Kalimantan
AGE OF
PLANTATION
(YEARS)
SEEDLING TYPE
AVERAGE
RECOMMENDED
SELLING PRICE 2013
LONSUM
(TONS/HA)
DAMI
(TONS/HA)
SOCFINDO
(TONS/HA)
MARIHAT
(TONS/HA)
0
-
-
-
-
1
-
-
-
-
2
-
-
-
-
3
11.0
11.4
7.0
8.8
1,002
4
19.0
19.4
18.5
15.0
1,105
5
23.0
26.4
21.1
21.1
1,207
6
24.0
25.5
21.1
22.0
1,227
7
23.0
23.8
20.2
21.1
1,261
8
23.0
21.1
19.4
20.2
1,331
9
23.0
18.5
21.1
18.5
1,349
10
23.0
20.2
21.1
20.2
1,396
11
23.0
22.0
21.1
21.1
1,396
12
24.0
22.9
22.0
21.1
1,396
13
24.0
22.9
22.0
22.0
1,396
14
24.0
23.8
22.9
22.0
1,396
15
23.0
23.8
22.9
21.1
1,396
16
23.0
22.9
22.0
21.1
1,396
17
23.0
22.0
22.0
21.1
1,396
18
23.0
22.0
21.1
20.2
1,396
19
23.0
21.1
21.1
19.4
1,396
20
23.0
21.1
20.2
18.5
1,396
21
23.0
20.2
19.4
17.6
1,411
22
22.0
20.2
19.4
17.6
1,387
23
22.0
19.4
18.5
17.6
1,387
24
21.0
18.5
17.6
16.7
1,387
25
21.0
17.6
16.7
15.8
1,387
Opportunities for Increasing Productivity & Profitability of Oil Palm Smallholder Farmers in Central Kalimantan
27
P: (0536) 4200208
F: (0536) 4200208
Fakultas Pertanian
Universitas Palangka Raya
Kalimantan Tengah
[email protected]


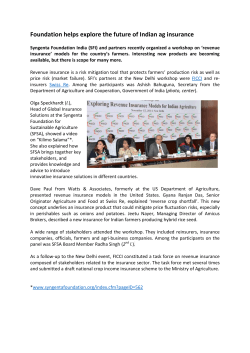


© Copyright 2026