
Reaching India`s Renewable Energy Targets Cost
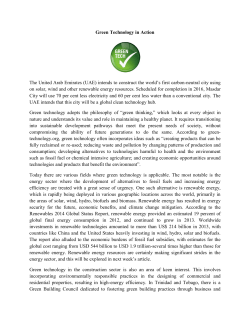
Reaching India’s Renewable Energy Targets
Cost-Effectively
Gireesh Shrimali
Sandhya Srinivasan
Shobhit Goel
Saurabh Trivedi
David Nelson
April 2015
A CPI-ISB Series
Reaching India’s Renewable Energy Targets Cost Effectively
April 2015
Acknowledgements
The authors acknowledge inputs, comments, and internal review from CPI staff: Ruby Barcklay, Maggie
Young and Amira Hankin. We thank participants in our primary research for their contribution. We also
thank ISB for its continued support toward our research efforts. The views expressed in this paper are
the authors’ own.
Descriptors
Sector
Renewable energy finance
Region
India
Keywords
Renewable energy finance, emerging economies, India, cost of debt
Related CPI Reports
Solving India’s Renewable Energy Financing Challenge: Which Federal
Policies can be Most Effective? (2014)
Contact
Gireesh Shrimali
[email protected]
About CPI
Climate Policy Initiative is a team of analysts and advisors that works to improve the most important
energy and land use policies around the world, with a particular focus on finance. An independent
organization supported in part by a grant from the Open Society Foundations, CPI works in places that
provide the most potential for policy impact including Brazil, China, Europe, India, Indonesia, and the
United States.
Our work helps nations grow while addressing increasingly scarce resources and climate risk. This is a
complex challenge in which policy plays a crucial role.
About ISB
The Indian School of Business (ISB) is a global business school offering world-class management
education across its two campuses – Hyderabad and Mohali. The School has grown at a rapid pace
over the twelve years since its inception and already has several notable accomplishments to its credit
– it is the youngest school ever to consistently rank among the top Global MBA programmes, the first
institution in South Asia to receive the prestigious AACSB accreditation, one of the largest providers
of Executive Education in Asia, and the most research productive Indian management institution. A
vibrant pool of research-oriented resident faculty and strong academic associations with leading global
B-schools, have helped the ISB fast emerge as a premier global Business school in the emerging markets.
For more details visit www.isb.edu
Copyright © 2015 Climate Policy Initiative www.climatepolicyinitiative.org
All rights reserved. CPI welcomes the use of its material for noncommercial purposes, such as policy
discussions or educational activities, under a Creative Commons Attribution-NonCommercialShareAlike 3.0 Unported License. For commercial use, please contact [email protected].
A CPI-ISB Series
I
April 2015
Reaching India’s Renewable Energy Targets Cost Effectively
Executive Summary
India has ambitious targets for renewable energy
growth. As part of its Union Budget 2015-2016, India
aims to install 60 GW of wind power capacity and
100 GW of solar power capacity by 2022, which is
more than six times the current installed capacities of
approximately 22GW and 3GW, respectively.
This important task is made difficult by the
government’s limited budget, which is constrained
by a large fiscal deficit and multiple development
priorities. Since government support is required when
renewable energy is more expensive than the fossil fuel
energy it would replace, there is a need for an objective
comparison between the levelized costs of electricity
from renewable energy and fossil fuels.
This project investigates not only this comparison but
also how much it would cost the Government of India
to reach its renewable energy targets. We answer this
by comparing the levelized cost of electricity from
renewable energy to a baseline fossil fuel in absence of
any subsidies – whether explicit or implicit;1 estimating
the total cost of support for renewable energy under
accelerated depreciation, which is the most costeffective of existing policies;2 and investigating
federal policy options to make this support even more
cost-effective.
Compared to imported coal, the cost of wind power
is already competitive, thus requiring no additional
support, and the cost of solar power will be
competitive by 2019.
We find that wind power is already competitive (see ES
Figure 1), meaning the levelized cost of electricity from
wind power is the same or lower than that from coal,
and would not require any government support. For
solar power, the levelized cost of electricity was 11.79%
higher than imported coal in 2015.
However, this gap will narrow over time due to learning
effects that drive solar capital costs down while fossil
fuels become progressively more expensive, primarily
due to inflation and increased transportation costs.3
By 2019, solar power is expected to be cheaper than
imported coal-based power.
LEVELIZED COST OF
Figure ES 1: Forecast
of Levelized Cost ofFORECAST
Electricity
ELECTRICITY
8
INR/
KWH
7
We use the levelized cost of electricity from imported
coal as the baseline for this comparison because this is
the fuel, rather than domestic coal or natural gas, that
renewable energy is likely to replace. While natural
gas is the most expensive fossil fuel, it has very limited
availability. Imported coal is the next most expensive
fossil fuel, and is also projected to account for 18% of
India’s total generation, higher than India’s target of 15%
of generation from renewable energy by 2020 (NAPCC,
2008).
1
2
This is key to ensure that implicit subsidies, such as ones provided to
domestic coal, do not distort the comparison.
The total cost support includes only system level generation cost and does
not account for integration costs as renewable penetration in India is still
low (less than 10%).
A CPI-ISB Series
6
5
3
Solar becomes
competitive with
coal in 2019
SOL
A
R
IMPORTED
COAL
WIND
2015
'16
'17
'18
'19
'20
'21
'22
Learning effects are productivity/efficiency gains due to increased experience with a technology, evidenced by an inverse relationship between
cumulative capacity and capital cost.
II
April 2015
Under current federal policies, the cost of support
for meeting India’s renewable energy targets is INR
2.71/W.
Since the cost of electricity from wind power is already
competitive with fossil fuels, the corresponding cost
of government support is zero.4 Solar power will
continue to require policy support until 2019. Under
existing federal policy which allows developers to use
accelerated depreciation for renewable energy assets,
in today’s values, the cost of supporting 20GW of utility
scale solar by 2022 is INR 46.97 billion (INR 2.71/W).
The cost of support needed to achieve India’s
renewable energy targets can be lowered by 96% by
using reduced cost, extended tenor debt.
We find that, in place of existing federal policy, a
combination of reduced cost and extended tenor debt,
where the government provides debt at lower cost and
higher tenor than markets, can lower the cost of support
Reaching India’s Renewable Energy Targets Cost Effectively
by over 96% to INR 0.1/W. Reduced cost, extended tenor
debt also has the advantage of enabling the government
to recover the cost of support over time through loan
repayments, making it possible to reuse this capital to
support other projects.
The cost of support can be further reduced by
accelerating wind deployment in the near term and
gradually ramping up solar deployment.
Since wind power is already competitive with fossil
fuels, the government should focus on supporting rapid
deployment of capacity in the near term to minimize its
cost of support. Solar power will become competitive
with fossil fuels in 2019. Therefore, in order to minimize
the cost of government support, solar capacity
deployment should be scheduled such that a larger part
of the deployment target is met after 2019.
4 Cost of support is the net present (or today’s) value of the sum of federal
and state subsidy cash flows and tax losses.
A CPI-ISB Series
III
April 2015
Reaching India’s Renewable Energy Targets Cost Effectively
Contents
1.INTRODUCTION
1
2. REPLACING IMPORTED COAL
2
3. FORECASTING THE LEVELIZED COST OF RENEWABLE ENERGY 3.1 Drivers of levelized cost of electricity
3.2 Wind power: forecasting the drivers of the levelized cost of electricity
3.3 Solar power: forecasting the drivers of the levelized cost of electricity 3.4 Imported coal: forecasting the drivers of the levelized cost of electricity
3.5 Comparing the levelized cost of renewable energy with imported coal 3
3
3
4
5
6
4. COST OF GOVERNMENT SUPPORT
4.1 Total Cost of Support
4.2 Nominal Cost of Support 7
7
9
5.CONCLUSIONS
12
6.REFERENCES
13
7.APPENDIX
15
A CPI-ISB Series
IV
April 2015
1.
Reaching India’s Renewable Energy Targets Cost Effectively
Introduction
India faces serious challenges of climate change and
energy security.
India’s energy mix is dominated by fossil fuels, with 68%
of total power generated from coal (IBEF, 2014). High
dependence on imported oil and increasingly, imported
coal, large peak power and energy deficits, and high
energy intensity all pose serious challenges to climate
change and India’s energy security.
To overcome these challenges, India has set ambitious
renewable energy targets.
Under India’s most recent budget, Union Budget
2015-2016, India aims to install 100 GW of solar
energy capacity and 60 GW of wind energy capacity
by 2022, which is more than six times the current
installed capacities of approximately 22GW and 3GW,
respectively (MNRE, 2014a).
However, this is a difficult task due to the government’s
limited budget, which is constrained by a large fiscal
deficit and multiple development priorities. Renewable
energy would require government financial support if it
were more expensive than the energy from fossil fuels
it would replace. Since renewable energy is perceived to
be more expensive than fossil fuels because fossil fuels
receive implicit and explicit subsidies, there is a need for
an objective comparison between the levelized costs of
electricity from renewable energy and fossil fuels.
Our objective comparison between the cost of
renewable energy and fossil fuels can provide a fair
basis for government planning and budget allocation
for renewable energy deployment.
In order to estimate the cost of government support
needed to achieve India’s renewable energy targets, the
unsubsidized levelized cost of electricity from renewable
energy must be compared with a baseline of the
levelized cost of electricity from the marginal fossil fuel
source that it would replace. As we explain in Section 2,
renewable energy will likely replace imported coal, so
we use imported coal as the baseline comparison.
By forecasting the levelized cost of electricity from
renewable energy and from fossil fuels in the absence
of any subsidies, we determine the cost of government
support required to bridge the difference for renewable
energy.5 We then identify the most cost-effective
policies to achieve India’s renewable energy targets.
Over the years, India has put in place several
progressive policies, both federal and state, to boost
the renewable energy sector. Federal policy support has
been in the form of accelerated depreciation, generation
based incentive, and viability gap funding, while state
policy support has typically been feed-in tariffs.6
In our previous work we showed that existing federal
policy is not the most cost-effective policy choice for
supporting renewable energy (CPI, 2014). Rather, a
combination of reduced cost and extended tenor debt,
where the government provides debt to renewable
energy projects at a lower cost and higher tenor than
markets, would be more cost-effective.
In this paper, we build on this work to compare the
cost of government support to achieve its renewable
energy targets under different policy pathways.The
paper is organized in five sections. Section 2 discusses
the selection of imported coal as the baseline cost
of electricity for comparison with renewable energy.
Section 3 forecasts and compares the levelized cost
of electricity from renewable energy and the baseline
of imported coal. Section 4 examines the cost of
government support for renewable energy under
different policy pathways. Section 5 presents policy
implications.
5
The levelized cost of electricity or LCOE is the minimum per unit revenue
required to meet the investors return expectations, given the project’s
parameters.
6 Each policy is described in Appendix A.
A CPI-ISB Series
1
Reaching India’s Renewable Energy Targets Cost Effectively
April 2015
2.
Replacing Imported Coal
Renewable energy will likely replace marginal fossil
fuel plants, which we use as our baseline for comparing
costs.
As India sets out to meet its renewable energy targets,
the additional renewable energy capacity will likely
replace marginal fossil fuel plants, or in other words
the most expensive fossil fuel plants that would have
been commissioned in absence of renewable energy
deployment. By comparing the levelized cost of
electricity from renewable energy with a baseline of
the levelized cost of electricity from marginal fossil fuel
plants, we can then estimate the cost of government
support needed for renewable energy.
Renewable energy will likely replace imported coalbased power.
At present, natural gas is the most expensive source
of fossil fuel-based power in India. However, natural
gas currently constitutes only 8.6% of the total energy
mix due to supply constraints (Ministry of Statistics
and Programme Implementation, 2014).7 The share
of natural gas in India’s energy mix has not changed
significantly over time. Therefore, natural gas-based
power plants are unlikely to be deployed at a significant
scale over the next few years, and thus unlikely to be
replaced by renewable energy deployment.
7
India’s natural gas market is facing a supply deficit due to low domestic
production and an inadequate transmission and distribution infrastructure
(Ernst & Young, 2014).
A CPI-ISB Series
On the other hand, the share of imported coal, the next
most expensive fossil fuel, as a percentage of total coal
consumption has risen steadily from 8.7% in 2006 to
16% in 2012 (MOSPI 2014). Imported coal accounts for
18% of total electricity (CRISIL, 2012), which is higher
than India’s target of 15% of generation from renewable
energy by 2020 (MNRE, 2009). Therefore, imported
coal is the most expensive fossil fuel that is likely to be
replaced by renewable energy.
We therefore use the cost of electricity from imported
coal as our baseline to compare with renewable energy.
Domestic coal remains the predominant source of
electricity (CRISIL, 2012), accounting for around 55%
of total power generation. However, domestic coalbased power plants will not be the marginal fossil
fuel-based plants replaced by renewable energy, since
domestic coal is cheaper than imported coal, and the
latter already accounts for a larger proportion of total
power generation than the proposed share of renewable
energy.8 However, for reference, we have provided a
comparison of domestic coal-based power prices with
imported coal based power and renewable sources of
coal-based power in Figure 9, Appendix D.
8 Domestic coal supply is of inferior quality compared to imported coal.
However, even after adjusting for heat content, imported coal is more expensive than domestic coal, since government price regulations artificially
lower prices.
2
April 2015
3.
Forecasting the Levelized Cost of Renewable Energy
In order to estimate the cost of government support
required to achieve India’s renewable energy targets,
we begin by forecasting the levelized cost of electricity
for three technologies from 2015 to 2022: utility-scale
wind and solar power (the dominant renewable energy
technologies), and the marginal fossil fuel-based power
source, which we determined is imported coal.
The levelized cost of imported coal serves as the
baseline cost of electricity. Based on the difference
between the forecasted levelized cost of renewable
energy and the baseline cost of electricity, we calculate
the cost of government support required to meet its
renewable energy deployment targets for each year
from 2015 to 2022.
Our forecasts for the levelized costs of electricity from
renewable energy and imported coal estimate the
unsubsidized levelized costs, or the costs without policy
support. We estimate the forecasts of the levelized
costs for plants commissioned each year from 2015
to 2022 by examining project-level cash flows, which
are driven by the variables explained in the following
section.9
3.1
Reaching India’s Renewable Energy Targets Cost Effectively
Drivers of levelized cost of electricity
Several factors, such as return on equity, interest rate,
capital expenditure, and the capacity utilization factor,
may drive changes in the levelized cost of electricity
from renewable energy. By assessing the responsiveness
of the levelized costs to these factors,10 we observe that
the levelized costs of both wind and solar energy are
highly sensitive to capital expenditure and the capacity
utilization factor.
Capital expenditure is the expense associated with
acquiring or upgrading property and equipment. In
the case of renewable energy projects, this primarily
includes turbine (wind) and module (solar) costs,
balance of system costs, land costs, construction costs,
and evacuation costs. Higher capital costs naturally
result in higher levelized costs.
9 We provide four possible scenarios for these forecasts, the details of
which are in Appendix D. In the main body of the manuscript, we provide
analysis based on only the most likely forecasts.
10 Using sensitivity analysis
A CPI-ISB Series
The capacity utilization factor is the fraction of a period
of time that a plant is producing energy, and is used
as an indicator of plant efficiency. This is the same as
another commonly used term – the plant load factor.
For example, capacity utilization factors for solar plants
without storage are low (around 25%) given that there
is typically good sunlight for only six hours out of a
24 hour day; on the other hand, capacity utilization
factors for fossil fuel plants can be much higher, around
80-90%. A higher capacity utilization factor typically
means higher generation for any given installed capacity
and, therefore, lower levelized costs.
Because the levelized cost of electricity from renewable
energy sources are most affected by capital expenditure
and the capacity utilization factor, these two are the key
variables that we forecast to calculate the levelized cost
of electricity for solar and wind energy. Other variables
have a much lower impact on levelized costs.11
For coal-based power plants (both domestic and
imported), the levelized cost of electricity is primarily
driven by capital expenditure and fuel cost.
Assumptions in the cash flow model that we use to
estimate the levelized costs are available in Appendix
B12 More details on the methodology used for
forecasting are in Appendix C.
3.2 Wind power: forecasting the drivers
of the levelized cost of electricity
While capital costs are expected to decrease as
developers gain experience, capital expenditure for
wind energy is expected to increase slightly from 2015
to 2022, due to inflation.
The first key variable that drives the levelized cost of
electricity for wind power is capital expenditure, which
are the costs associated with acquiring or upgrading
property and equipment.
11 We have assumed all the other variables such as return on equity, interest
rates etc. to remain constant throughout the project life in the cash flow
models used to calculate the levelized cost of electricity.
12 The assumptions (Table 1 in Appendix B) for these models are drawn from
a sample of projects from the Bloomberg New Energy Finance (BNEF)
database, and validated through the Central Electricity Regulatory Commission’s (CERC 2014) benchmark tariffs, as well as our primary research.
3
Reaching India’s Renewable Energy Targets Cost Effectively
April 2015
Figure 1: Capital Expenditure Forecast for Wind Energy
90
WIND CAPITAL EXPENDITURES
INR M/
MW
89.4
80
Because of this, we expect that capacity utilization will
rise gradually over the coming years. By 2022, we expect
that most of the new wind plants will have a hub height
of 120 meters, with an average capacity utilization
of 29%. This assumes a linear increase in capacity
utilization from 25% to 29% based on continued similar
wind speeds (Phadke et al., 2011).
70
67.9
60
50
India’s wind deployment is at a hub height of 80 meters,
with an average capacity utilization of 25%. However,
hub heights are steadily rising, with turbines of 100
meters becoming increasingly common (Phadke et al.,
2011).
Overall, we forecast an increase in the levelized cost of
wind energy over time.
2015
'16
'17
'18
'19
'20
'21
'22
Our forecasts for capital expenditure for wind power
from 2015 to 2022 indicate that it will increase by around
4% each year,13 as depicted in Figure 1.14 The capital cost
is expected to rise from INR 67.89 million/MW (USD
1.13 million/MW) in 2015 to INR 89.4 million/MW (USD
1.49 million/MW) in 2022.15
The primary reason for this is the effect of inflation
on component costs. We observe that there will also
be a significant reduction in capital expenditure due
to a strong learning effect, which is an increase in
efficiencies over time as experience with a technology
grows. However, the effect of inflation on component
costs is much stronger, and outweighs the cost
reduction from learning.
The capacity utilization factor for wind power will
increase from 25% in 2015 to 29% in 2022.
The capacity utilization factor is the fraction of a
period of time that a plant is generating power, and
indicates plant efficiency. A higher capacity utilization
factor means lower levelized costs.
The capacity utilization factor for a wind plant depends
on the height of the turbine from the ground, or hub
height, as well as wind speeds. The capacity utilization
factor typically increases with hub height due to higher
wind speeds at higher elevations. At present, most of
An increase in capital expenditure will raise the
levelized cost from wind energy, while an increase in
capacity utilization factor will lead to a reduction in the
levelized cost, but the increase in capital expenditure
will outweigh any cost reduction from increased
capacity utilization.
3.3 Solar power: forecasting the drivers
of the levelized cost of electricity
Figure 2: Capital Expenditure Forecast for Solar Energy
90
SOLAR CAPITAL EXPENDITURES
INR M/
MW
80
71.3
70
62.6
60
50
2015
'16
'17
'18
'19
'20
'21
'22
13 4% is the compound annual growth rate (CAGR).
14 We developed forecasts of capital expenditure for wind power from 2015
to 2022 using four approaches: a) regression analysis; b) trend analysis;
c) primary research; and d) literature review.
15 We assume an exchange rate of INR/USD = 60.
A CPI-ISB Series
4
April 2015
Reaching India’s Renewable Energy Targets Cost Effectively
Capital expenditure for solar energy is expected to
decline from 2015 to 2022.
3.4 Imported coal: forecasting the
drivers of the levelized cost of electricity
We find that capital expenditure for solar power, or
the cost of setting up a solar plant, will decrease by
approximately 1.83% each year (Figure 2).16 The capital
cost is expected to decrease from INR 71.25 million/MW
(USD 1.19 million/MW) in 2015 to INR 62.6 million/MW
(USD 1.04 million/MW) in 2022.
Capital expenditure and coal price are the main
variables that drive the levelized cost of electricity for
imported coal, so we use those to calculate the levelized
cost of electricity from an imported coal-based plant.
This decrease is due to strong global learning effects
(increased efficiencies due to experience gained over
time), which push down the price of solar panels. We
also observe local-level learning effects, which are not
as strong, that marginally reduce non-panel costs over
time.
The capacity utilization factor for solar energy will
remain constant at 20.5%.
The capacity utilization factor indicates the fraction
of a period of time that a plant is producing energy.
In the case of solar energy, this would depend on the
amount of solar resources (solar radiation) as well as
the local temperature. Data shows that existing capacity
utilization levels are sustainable for the government’s
proposed solar targets due to abundant solar resource
availability.17 Therefore, it is possible to achieve the
government’s 2022 solar targets while maintaining the
current level of capacity utilization of 20.5% (CERC,
2011).18
Overall, we forecast that the levelized cost of solar
energy will decrease over time.
Since we forecast that the capacity utilization factor will
remain constant, the levelized cost of solar energy will
be driven downwards by decreasing capital expenditure.
Our forecast of capital expenditure for a coal plant
shows a steady increase over time (Figure 3).19 Capital
expenditure rises by about 2.86% per year from INR 56.6
million (USD 0. 9 million) in 2015 to INR 68.9 million
(USD 1.15 million) in 2022.
Forecasts for the second driver, fuel price, indicate an
increase of 2.12% each year, from USD 98 per ton in 2015
to USD 114 per ton in 2022 (Figure 3).20 These imported
coal prices are driven by global demand and supply.
Figure 3: Capital Expenditure and Fuel Cost Forecasts for Coal Energy
$/tonne
A CPI-ISB Series
114
110
105
100 98
95
70
COAL CAPITAL EXPENDITURES
INR M/
MW
60
50
16 We developed forecasts of capital expenditure for solar power from 2015
to 2022 using four approaches: a) regression analysis; b) trend analysis; c)
primary research; and d) literature review.
17 We use estimates for resource availability based on local irradiation and
ambient temperature from National Renewable Energy Laboratory (NREL)
and National Institute of Solar Energy (NISE). To estimate capacity utilization factors, we use data provided by CERC (2011).
18 An increase in solar capacity utilization factors would be driven by an
improvement in system-level technology, such as use of sunlight tracking
devices, which we do not model in this paper.
IMPORTED COAL PRICE
115
69
56.6
2015
'16
'17
'18
'19
'20
'21
'22
19 Coal capital expenditure forecasts are based on a regression model with
inflation (Upadhayay et. al. 2014) as the independent variable.
20 For fuel cost estimates, we use an average of two coal price forecast series: CPI’s New Climate Economy forecasts and forecasts from the Institute
for Energy, Economics and Financial Analysis (IEEFA 2014)
5
Reaching India’s Renewable Energy Targets Cost Effectively
April 2015
Therefore, overall, we forecast that the levelized cost
of electricity from imported coal increases over time,
due to increasing capital expenditure and fuel prices.
However, the rate of increase in fuel prices is
significantly lower than the increase in capital
expenditure, causing levelized costs to rise gradually
over time.
3.5 Comparing the levelized cost of
renewable energy with imported coal
By comparing the levelized costs of electricity from wind
power and solar power to the levelized cost of electricity
from imported coal, which we use as our baseline, we
can then estimate the cost of government support
required to meet its renewable energy targets.
Wind energy is already cheaper than imported coal
based power; but solar plants will require government
support up to 2019.
Our analysis shows that compared to the baseline of
imported coal-based power, which has a levelized cost
of INR 6.92/kWh (USD 0.12/kWh) in 2015, wind energy
is already competitive at a levelized cost of INR 5.94/
kWh (USD 0.1/kWh).
LEVELIZED COST OF
Figure 4: Forecast ofELECTRICITY
Levelized Cost of Electricity
FORECAST
8
INR/
KWH
7
6
5
R
The levelized cost of imported coal-based power, which
serves as our baseline for comparison, is also expected
to increase due to an increase in capital expenditure
forecasts, as well as rising fuel costs, measured by
imported coal prices.
Overall, the gap between the levelized cost of wind
power and imported coal-based power is expected
to decrease from 14% in 2015 to 7% in 2022. This is
primarily because inflation is expected to have a
stronger impact on capital expenditure than fuel prices.
In the case of wind power, all levelized cost increases
are driven by capital expenditure. In the case of coalbased power, since capital expenditure only accounts
for a part of the change in the levelized cost, and the
increase in fuel price is much more gradual, the overall
increase in the levelized cost is not as rapid. However,
even though the gap between the costs will grow
smaller, wind power will continue to be competitive with
imported coal.
Unlike wind energy, solar energy continues to be
more expensive than imported coal-based power.
The levelized cost of solar energy is INR 7.74/kWh
(USD 0.13/kWh) in 2015, about 11.79% more expensive
compared to imported coal.
Solar becomes
competitive with
coal in 2019
SOL
A
In spite of the increase in the wind capacity utilization
factor, which would decrease the levelized cost of
electricity from wind power, we observe an increasing
trend in wind levelized costs. The primary reason for
this is the increase in capital cost, discussed in Section
3.2, which outweighs the cost reduction from increased
capacity utilization.
The levelized cost of electricity for solar power declines
gradually, driven by the expected reduction in capital
expenditure, and becomes competitive with imported
coal-based power in 2019 (Figure 4). By 2022, solar
energy is expected to become around 5% cheaper than
imported coal-based power. The gap between solar
energy and wind energy narrows, but solar energy still
remains more expensive than wind energy up to 2022
(Figure 4).
COAL
IMPORTED
WIND
Analysis for other possible outcomes is presented in
Appendix D.
2015
A CPI-ISB Series
'16
'17
'18
'19
'20
'21
'22
6
April 2015
4.
Reaching India’s Renewable Energy Targets Cost Effectively
Cost of Government Support
Our forecasts of levelized costs have shown that while
wind energy is already competitive, solar energy is still
more expensive than imported coal-based power, and
thus would require government support. In this section,
we present the cost of government support needed to
meet India’s renewable energy targets. We also identify
the most cost-effective policy for providing support.
Given that wind energy is already competitive, the cost
of support is mainly calculated for solar energy.
We use the Planning Commission’s 12th Five Year plan
cumulative capacity targets of 20 GW of solar capacity
and 50 GW of wind capacity by 2022. While the
Planning Commission has outlined interim cumulative
capacity targets at the end of the 12th Five Year Plan
(2017) and the 13th Five Year Plan (2022), it does not
specify annual capacity addition targets. Therefore, we
assume that the annual targets are a linear division of
the cumulative targets (Figure 10 in Appendix D).
The cost of support refers to the required government
spending under a policy mechanism to bridge the gap
between the unsubsidized levelized cost of renewable
power and the baseline cost of electricity. Estimating
the cost of support under each policy enables us to
identify the most cost-effective policy to support
renewable energy.21
We use the 12th Five Year Plan targets since the
government has created a realistic deployment
roadmap for it with interim targets. The Union Budget
2015-2016 targets, on the other hand, were made official
very recently in February, 2015 and interim targets
are yet to be created. Despite this, based on coarse
assumptions, we briefly discuss the implications of the
revision in targets in Box 4.1. We note that the results
remain similar.
In India, policy support is provided through a
combination of state and federal support. Our previous
work (CPI, 2014) found that, in general, any federal
support is more cost-effective than state support which
is usually in the form of feed-in tariffs.22
To measure and compare the cost of support, we
use the total cost of support as our key metric,
which indicates the net present value23 of all the
government cash flows over the project life for projects
commissioned during 2015 to 2022.24
The cost of support is calculated on the basis of
capacity addition of renewable energy for each year and
the forecasted difference between the unsubsidized
levelized cost of renewable power and the baseline cost
of electricity from imported coal.
21 The cost of support is calculated as the sum of federal support, state
support and tax reductions.
22 In our previous work (CPI, 2014), we found that 100% support by
state-level feed-in tariffs is the least cost-effective policy. We also found
that the total cost of support decreases as federal policies cover more of
the (viability) gap between the unsubsidized levelized cost of renewable
energy and the fossil fuel baseline. Thus, the most cost-effective approach
is to meet the entire support requirement through federal policies. Feed-in
tariffs may be used in addition to federal support in cases where the difference in levelized cost of renewables and the baseline cost is very high.
23 Net present value is a key financial parameter used to allow comparison of
cash flows in different years, by discounting future cash flows to convert
them to today’s values.
24 We show the total cost of support in absolute terms i.e. INR billion as well
as in INR/W terms. INR/W is the ratio of absolute value of the total cost of
support to total renewable capacity deployed from 2015 to 2022.
A CPI-ISB Series
4.1
Total Cost of Support
We examine current federal policies as well as a set of
proposed debt-related policies and calculate the cost
of government support under each, to determine which
is most cost-effective.25 The full list of policies can be
found in Appendix A. Among existing federal policies,
we give special attention to accelerated depreciation,
which is the most cost-effective of current policies.
With accelerated depreciation, the most cost-effective
among existing policies, the total cost of support for
solar is INR 2.71/W.
Accelerated depreciation is a policy which allows the
developer to write off the asset value of a renewable
energy project in its initial years, thereby reducing
tax liability. However, after the value of the asset has
completely depreciated, taxes are higher in later years,
which would lead to partial government recovery of
the cost of support. The government currently provides
accelerated depreciation of up to 80% for both wind and
solar projects.
As discussed in Section 3.5, wind energy is already
competitive, whereas solar energy will require policy
support from 2015 to 2019 in order to be competitive
with imported coal-based power.
25 Cost-effectiveness is measured by the percentage reduction in total cost
of support compared to the baseline, where there is no federal policy
support.
7
Reaching India’s Renewable Energy Targets Cost Effectively
April 2015
Accelerated depreciation is the
most cost-effective policy among
the existing federal policies. If
the government were to provide
policy support through another
policy of viability gap funding
instead, the total cost of support
would be 19% higher.28 In the case
of another federal policy called
generation based incentive, the
total cost of support would be 61%
higher compared to accelerated
depreciation.29
ANNUAL
COST
OF SUPPORT FOR SOLAR
Figure 5: Annual
Cost of Support
(INR/W)
10
INR/W
8
ACCELERATED DEPRECIATION
8.6
6.2
6
3.9
4
2.71
2
2
0.2
0
-2
-4
2014
'15
'16
'17
'18
'19*
'20*
'21*
REDUCED COST, EXTENDED TENOR DEBT
10
Discounted
Weighted
Average
INR/W
8
6
4
3.7
2
0.9
0.1
0
-2
-1.1
-4
2014
'15
'16
-2
'17
-2.7
'18
'19*
'20*
'21*
*solar competitive with coal by 2019
Under the existing policy of accelerated depreciation,
the annual cost of support, defined as the net present
value of the cost of support for capacity deployed only
in a particular year, declines from INR 8.6/W in 2014 to
INR 0.23/W in 2018.26
The corresponding total cost of support, which is the
average cost of support over the full project life for
plants installed during 2015 to 2018, for solar energy
is INR 2.71/W, about 3.8% of the capital cost of solar
energy in 2015 (Figure 5).27 Based on the 12th Five Year
Plan deployment targets of 20 GW of solar and 50 GW
of wind by 2022, the total cost of support is INR 46.97
billion.
26 Net present value for each year is calculated as of one period prior to the
first cash flow. Therefore, for projects starting in 2015, the net present
value is calculated for 2014.
27 Since solar energy becomes competitive in 2019, the cost of support is
calculated for plants installed prior to 2019.
A CPI-ISB Series
Discounted
Weighted
Average
This is primarily because
accelerated depreciation is frontloaded, or in other words, the
downward impact on the levelized
cost of electricity is higher since
the entire benefit of the policy is
available to the project developer
from the first year, unlike other
policies which may spread out
the benefits over a longer period
of time. Accelerated depreciation
also enables the government to
recover subsidies, since some of
the tax loss is recovered through
higher taxes in later years, after
the value of the asset is written off
completely.30
However, our previous work
shows that it is possible to further lower the total cost
of support by using policies that address a key barrier
for renewable energy projects – the cost of debt. Inferior
terms of debt such as high cost, short tenor, and a
variable interest rate add approximately 30% to the
total cost of renewable energy in India compared to
developed countries (CPI, 2012). Therefore, debt-related
policies that address these challenges can significantly
reduce the total cost of support (CPI, 2014).
28 Viability gap funding (VGF) is a capital grant from the government to enable a project developer to supply renewable power at a pre-determined
tariff.
29 Generation based incentive (GBI) is a direct subsidy that is paid over and
above the tariff for each kWh of power that the developer supplies to the
grid.
30 A detailed discussion of the relative cost-effectiveness of different policies
is available in CPI, 2014
8
Reaching India’s Renewable Energy Targets Cost Effectively
April 2015
The total cost of support can be lowered by 96%
through policy support in the form of reduced cost,
extended tenor debt.
Under a policy of reduced cost, extended tenor debt,
the government would make direct loans to project
developers below the commercial rate of interest for
longer than the usual commercial tenor.
If the government provides policy support through
reduced cost, extended tenor debt instead of the
existing federal policies, the total cost of support for
solar energy can be reduced to an average of INR
0.10/W.
opportunity for interest arbitrage: in cases where the
government lends at a higher rate of interest to the
developer than its own cost of borrowing (7.8% on a
10-year government bond), the net cash flows for the
government are positive. Lastly, when debt is cheaper,
the developer can substitute equity with more debt in
the project while meeting debt servicing conditions.
By replacing expensive equity with cheaper debt, the
overall cost of capital is reduced.
4.2 Nominal Cost of Support
We also look at the nominal cost of support as a
measurement of the cost of policy support.
Under reduced cost, extended tenor debt, the annual
cost of support varies from INR 3.75/W in 2014 to
a recovery (i.e., a profit) of INR 2.73/W by 2018 on
account of loan repayments. Based on the 12th Five Year
Plan deployment targets of 20 GW of solar and 50 GW
of wind by 2022, the total cost of support would be INR
1.81 billion under reduced cost, extended tenor debt,
around 96% lower than under accelerated depreciation
(Figure 5).
This is because as a policy mechanism, reduced cost,
extended tenor debt offers a number of advantages.
The net cash outflow for the government is recovered
over time since policy support is provided in the
form of a loan rather than a grant. It also provides an
The nominal cost of support indicates the net annual
cash outflow for the government in nominal terms,
i.e. without discounting for time value of money. It is
calculated as the sum of net cash outflows for projects
deployed in a particular year as well as continuing policy
support obligations for projects deployed in previous
years starting from 2015.
Whereas the total cost of support includes the effect
of future cash flows over a project’s life from the
provision of a subsidy, the nominal cost of support only
measures the net cash outflow for the government at
a particular point of time, ignoring any future costs or
recoveries for the government. For example, in the case
of reduced cost, extended tenor debt, the nominal cost
Figure 6: Nominal Cost of Support for Solar Energy
124
99
100
50
SUBSIDY RECOVERY PHASE (revenues)
SUPPORT OUTFLOW PHASE
INR 150 bn
75
31
32
20
12
0
ACCELERATED
DEPRECIATION
-50
5
0.4
REVENUES
CONTINUE
UNTIL 2043
13
-2
REDUCED COST,
EXTENDED
TENOR DEBT
-4
-77
-81
-100
2015
A CPI-ISB Series
'16
'17
'18
'19
-4
'20
'21
-73
'22
9
April 2015
of support in 2015 will simply be the loan disbursed by
the government for the capacity installed in that year,
while the total cost of support will account for loan
repayments over the entire project life cycle. Therefore,
the total cost of support provides a complete measure
of the cost of support for the government.
The nominal cost of support, however, is instructive
from a budgetary perspective in showing government
cash flow profiles for each year. However, it does not
facilitate fair comparison of the cost-effectiveness of
policies since it does not take into account all the costs
over a project’s life cycle costs, which is the focus of the
total cost of support.
While reduced cost, extended tenor debt is much more
cost-effective than accelerated depreciation over a
project’s life cycle, it would require a higher allocation
of the budget in the initial years.
Figure 6 presents the nominal amount required from the
government’s budget under accelerated depreciation,
the most cost-effective among existing policies, and
reduced cost, extended tenor debt, which is the most
cost-effective among all policy options.
Reaching India’s Renewable Energy Targets Cost Effectively
While the net present value, or the total cost of support,
for reduced cost, extended tenor debt is significantly
lower due to recovery of the subsidy amount invested
by the government through loan repayments, the
annual budget allocation, or nominal cost of support,
for reduced cost, extended tenor debt is much higher in
the initial years, since the government needs to provide
approximately 70% of the total project cost in the form
of debt.
For example, in 2015, based on the 12th Five Year Plan
deployment targets of 20 GW of solar and 50 GW of
wind by 2022, the total budget allocation for reduced
cost, extended tenor debt would be INR 123.79 billion
(USD 2.06 billion). In contrast, the nominal cost of
support in 2015 under accelerated depreciation is INR
31.2 billion.
However, after 2019, once solar power becomes
competitive, there would be a net cash inflow for
the government thereafter, since solar power would
no longer require additional support, and the policy
support provided in the form of debt would be repaid
by the project developers. As shown in Figure 6, the
Box 1: 12th Five Year Plan targets vs. Budget 2015 targets
The results presented in this section correspond to the Planning Commission’s 12th Five Year Plan
targets (from 2011) of 20 GW of solar and 50 GW of wind capacity by 2022. However, our analysis can
also be replicated for the government’s Budget 2015 targets, which, in February 2015, revised the targets
upwards to 100 GW of solar and 60 GW of wind capacity. Under the Budget 2015 targets, the impact on wind levelized costs (and therefore, total cost of support)
is negligible, since the targets are only revised upward by 10 GW. In the case of solar energy, the
government’s Budget 2015 targets represent a quintupling of the previous targets. Of the 100 GW
target, 40 GW is expected to be achieved through utility scale solar and 20 GW through ultra-mega
solar, which form the focus of this paper. The remaining 40 GW is to be achieved through rooftop solar.
Based on our model, assuming a linear capacity addition schedule of approximately 7.2 GW per year,
we expect that the revision of targets will have a marginal impact on capital expenditure, with the
corresponding impact on the levelized cost being less than 4.8%. This indicates that solar energy will
become competitive by 2018 and the total cost of support under accelerated depreciation will be INR
1.99/W or INR 113.88 billion. Under the Budget 2015 targets, the total cost of support for solar (Section
4.2) will be roughly 2.5 times the total cost under the 12th Five Year Plan targets.
The revision of targets would also have other implications for deployment paths and grid balancing,
which require further examination. Due to these reasons as well as to the lack of concrete roadmaps
for these recently announced targets, this paper focuses on the 12th Five Year Plan targets, as indicated
earlier.
A CPI-ISB Series
10
April 2015
subsidy recovery is approximately 25 times higher under
reduced cost, extended tenor debt as compared to
accelerated depreciation.
Therefore, although the government will need to make
a budgetary commitment that is four times that of
accelerated depreciation in the short term, the net cash
outflow in the long term will be 96% lower with reduced
cost, extended tenor debt. In other words, in net present
value terms, the total cost of support under accelerated
depreciation is about 25 times higher than that of
reduced cost, extended tenor debt.
The total cost of support can be further reduced if the
government accelerates deployment of wind energy in
the near term, and gradually ramps up deployment of
solar energy.
Our analysis shows that wind energy is already
competitive, and so the government’s targets for
deploying wind energy can be met quickly. The
government can encourage rapid deployment of wind
energy by creating a friendly policy environment that
focuses on other barriers to wind deployment, for
example, challenges in land acquisition and delays in
environmental clearances (TERI, 2014).
A CPI-ISB Series
Reaching India’s Renewable Energy Targets Cost Effectively
By 2022, we anticipate that solar energy will be cheaper
than other sources of electricity. However, at present,
solar energy is competitive only in the presence of
policy support. Thus, in the absence of direct policy
support, it is likely that a larger proportion of solar
capacity will be commissioned after 2019, when solar
energy becomes competitive.
A schedule of solar capacity addition in which a
larger part of the capacity addition takes place after
2019 is tenable for the 12th Five Year Plan targets, and
would also minimize the total cost of support for the
government.
However, the Budget 2015 targets of 100 GW (see Box
1) may be difficult to achieve if much of the capacity
deployment is delayed to 2019. In order to accelerate
solar deployment in the near term, the government
will need to provide more financial support to solar
project developers and should therefore consider the
cost implications of changes to the capacity addition
schedule.
11
Reaching India’s Renewable Energy Targets Cost Effectively
April 2015
5.
Conclusions
We examine how much it would cost the Government
of India to meet its renewable energy targets. By
comparing the unsubsidized levelized cost of electricity
from wind and solar energy to a baseline of the levelized
cost from imported coal-based power, we provide a fair
basis upon which the government can plan and allocate
its budget to meet its renewable energy targets. We
also examine the cost of government support under
different policy mechanisms to determine which is
most cost-effective, and we examine the implications of
different deployment pathways.
Renewable energy will likely replace imported coal
based power plants.
Imported coal-based power is playing an increasingly
prominent role in India’s energy portfolio, accounting for
about 18% of total electricity production, a proportion
that is steadily rising. India targets 15% of power
generation from renewable energy sources by 2020
(NAPCC, 2008), which will replace the most expensive
fossil fuel. Since imported coal-based power is more
expensive than domestic coal, and the share of natural
gas is unlikely to grow due to supply constraints, it is
likely that renewable energy will replace additional
imported coal build.
Compared to imported coal, wind energy is already
competitive, while solar energy will become
competitive in 2019.
Compared to imported coal-based power, wind energy
is already cheaper, and is expected to remain so up to
2022. Therefore, it would be cheaper to meet additional
energy requirements through wind energy rather than
imported coal. The levelized cost for solar energy is
expected to decline steadily and become cheaper than
imported coal by 2019. Due to its continuing decrease in
cost, we expect that solar energy will be the most viable
source of renewable energy within the next ten years.
The total cost of support for solar energy can be
lowered 96% by using reduced cost, extended tenor
debt instead of accelerated depreciation; however, this
will require a larger amount of support in the initial
years.
A combination of reduced cost, extended tenor debt is a
more cost-effective policy option than the current policy
of accelerated depreciation. Compared to accelerated
depreciation, the total cost of support can be lowered
by 96% by using reduced cost, extended tenor debt.
However, this will require a larger allocation of the
government budget for debt in initial years, which will
be recovered in later years.
The total cost of support can be further reduced if the
government focuses on accelerating deployment of
wind energy now, and gradually ramps up deployment
of solar energy.
Since wind energy is already competitive with imported
coal-based power, it can be deployed very quickly
without any policy support. In the case of solar energy,
policy support would be more cost-effective if a larger
proportion of the deployment targets were met after
2019, when solar energy will be competitive. In order to
accelerate solar deployment sooner, the government
would need to provide some policy support.
Future Research
Future work will focus on developing analytical
frameworks to compare renewable energy and fossil
fuels in other ways, including total cost to society
(including carbon, resource, integration, etc.), cost
of capital (due to different risk profiles), and energy
security.
Under current policy, the total cost of support for solar
energy is INR 2.71/W.
Wind energy does not require government support,
since it is already competitive. Under the current
federal policy of accelerated depreciation, the most
cost-effective among existing policies, the total cost
of support for solar energy is about 3.8% of its current
capital costs, which is INR 2.71/W under accelerated
depreciation. The annual cost of support varies with the
levelized cost of solar and imported coal-based power,
declining from INR 8.6/W in 2014 to INR 0.23/W in 2018.
A CPI-ISB Series
12
April 2015
6.
Reaching India’s Renewable Energy Targets Cost Effectively
References
Bridge To India (2014). India’s 100 GW solar roadmap
feasible. http://www.bridgetoindia.com/blog/weeklyupdate-is-indias-100-gw-solar-road-map-feasible/
Business Standard (2014). Accelerated depreciation
scheme for wind energy restored. http://www.
business-standard.com/article/news-ians/
accelerated-depreciation-scheme-for-wind-energyrestored-114071800777_1.html
IEEFA (2014). IEEFA Briefing Note-Indian Power Prices.
http://www.ieefa.org/wp-content/uploads/2014/05/
IEEFA-Briefing-Note_IndianElectricityCoalPricing_4May-2014.pdf
MOSPI (2014). Energy Statistics. Ministry of Statistics
and Programme Implementation, Government of
India. http://mospi.nic.in/mospi_new/upload/Energy_
stats_2014.pdf
CERC (2011). Performance of Solar Power Plants
in India. http://cercind.gov.in/2011/Whats-New/
PERFORMANCE%20OF%20SOLAR%20POWER%20
PLANTS.pdf
MNRE (2009). Renewable Energy Certificate
Mechanism for India. Ministry of New and Renewable
Energy, Government of India. http://mnre.gov.in/filemanager/UserFiles/MNRE_REC_Report.pdf
CERC (2014). CERC Tariff Revision Order, May 2014.
http://cercind.gov.in/2014/orders/SO354.pdf
MNRE (2014a). Physical Progress (Achievements).
Ministry of New and Renewable Energy, Government
of India. Ministry of New and Renewable Energy,
Government of India. http://mnre.gov.in/
mission-and-vision-2/achievements/
CPI (2012). Nelson, D., G. Shrimali, C. Konda, S. Goel, R.
Kumar. 2012. Meeting India’s Renewable Energy Targets:
The Financing Challenge. http://climatepolicyinitiative.
org/wp-content/uploads/2012/12/Meeting-IndiasRenewable-Targets-The-Financing-Challenge.pdf
CPI (2014) Shrimali, G., S. Goel, S. Srinivasan (2014).
Meeting India’s Renewable Energy Financing Challenge:
Which Federal Policies can be Most Effective?. CPI
India. http://climatepolicyinitiative.org/wp-content/
uploads/2014/03/Which-Federal-Policies-can-be-MostEffective-Full-Study.pdf
CRISIL (2012). Rising Fuel Imports for Power Generation.
http://www.crisil.com/pdf/infra-advisory/4-rising-fuelimports-power-generation.pdf
Berry, D (2009). Innovation and the price of wind energy
in the US. Energy Policy, 37 (11): 4493-4499
Ernst and Young (2014). Natural gas pricing in India
– Current policy and potential impact. http://www.
ey.com/Publication/vwLUAssets/EY-natural-gaspricing-in-India/$FILE/EY-natural-gas-pricing-in-India.
pdf
IBEF (2014). Power Sector in India. http://www.ibef.org/
industry/power-sector-india.aspx
IEA (2012). Renewable Energy: Medium-Term Market
Report. International Energy Agency. http://www.
iea.org/publications/freepublications/publication/
MTrenew2012_web.pdf
A CPI-ISB Series
MNRE (2014b). “National Wind Mission: Objectives
and Scope”. National Level Consultation on National
Wind Energy Mission. Ministry of New and Renewable
Energy, Government of India.http://mnre.gov.in/filemanager/UserFiles/Presentations-NWM-09012014/
Alok-Srivastava-JS-MNRE.pdf
Nemet, G.F. (2006). Beyond the learning curve: factors
influencing cost reductions in photovoltaics. Energy
Policy, 34: 3218-3232
Phadke, A., R. Bharvirkar & J. Khangura (2011).
Reassessing Wind Potential Estimates for India:
Economic and Policy Implications. Lawrence Berkeley
National Laboratory (LBNL). https://isswprod.lbl.gov/
library/view-docs/public/output/rpt81160.PDF
PIB (2011). Generation Based Incentive Scheme. Press
Information Bureau, Government of India. http://www.
pib.nic.in/newsite/erelease.aspx?relid=78829
PIB (2013). Coal Block Auction Methodology Approved.
Press Information Bureau, Government of India. http://
pib.nic.in/newsite/erelease.aspx?relid=99642
PIB (2014). Jawaharlala Nehru National Solar Mission.
Press Information Bureau, Government of India. http://
pib.nic.in/newsite/PrintRelease.aspx?relid=108233
Pillai, U. & K. Cruz (2013). Drivers of Cost Reduction
in Solar Photovoltaic Panels. Energy Economics
(submitted)
13
April 2015
Shakti Foundation (2013). Contribution of Renewable
Power Towards Eliminating Shortages and Meeting
Economic Growth Aspirations. http://shaktifoundation.
in/wp-content/uploads/2014/02/power%20security%20
report-%20final%20-%20feb%202013.pdf
TERI (2014). Governance of Renewable Energy in India:
Issues and Challenges. The Energy and Resources
Institute. http://www.teriin.org/projects/nfa/pdf/
working-paper-14-Governance-of-renewable-energy-inIndia-Issues-challenges.pdf
A CPI-ISB Series
Reaching India’s Renewable Energy Targets Cost Effectively
Upadhayay, A., G. Agnihotri & G. Agnihotri (2014).
Prudency of Capital Cost of Power Station and its
Impact on Tariff. International Journal of Electrical and
Electronics Engineering Research. http://www.tjprc.
org/download.php?fname=2-15-1404213801-EEE-IJEEERPrudency%20of%20Capital%20Cost.pdf
14
April 2015
7.
Reaching India’s Renewable Energy Targets Cost Effectively
Appendix
A. Financial Support Policies
In this section, we briefly discuss the state policies,
existing federal policies, and a new class of debt-related
federal policies which are used to support renewable
energy.
State Policy
State policy support is typically provided through feedin-tariffs. A feed-in-tariff is a long-term power purchase
agreement of 20-25 years. Under this agreement, the
tariff is based on the cost of power production and is
higher than the average pooled purchase cost (APPC).31
Existing federal policies
In addition to the state-level policies, renewable energy
also receives federal level policy support. 32 A renewable
energy project can avail any one of these federal policies
at a time. However, for the purpose of comparison, we
calculate the cost of support under all these policies for
both wind and solar energy.
•• Accelerated depreciation allows the developer
to write off the asset value in the initial years of
the project, thereby reducing the tax liability.33
However, after the value of the asset has
completely depreciated, taxes are higher in later
years, which would lead to partial recovery of
the cost of support. The government currently
provides accelerated depreciation of up to 80%
for both wind and solar projects.
•• Generation based incentive (GBI) is a direct
subsidy that is paid over and above the tariff
for each kWh of power that the developer
supplies to the grid. The support can be availed
at INR 0.50/kWh for a minimum of four years
and a maximum of ten years with a cap of INR
6.2 million/MW. The objective is to incentivize
higher power production. The scheme is
available for both wind and solar in parallel to
31 Average pooled purchase cost (APPC) is the weighted average pooled
price at which the power distribution companies purchased electricity
in the previous year from all energy suppliers, except renewable energy
sources.
32 In addition to these federal policies, projects engaged in the generation
(or distribution) of renewable power are eligible for a 10-year tax holiday.
Although plants have to pay a minimum alternate tax (MAT) of ~21%, it
can be offset in future years.
33 Accelerated depreciation was withdrawn for wind in April, 2012 which led
to fall in the investment and the deployment of wind projects but has been
reinstated in 2014 again (Business Standard, 2014).
A CPI-ISB Series
accelerated depreciation, but on a mutually
exclusive basis. While there is no minimum
capacity fixed under the scheme for wind
projects, solar projects in the range of 100 kW to
2 MW can avail this scheme (PIB, 2011).
•• Viability gap funding is a capital grant from the
government to enable a project developer to
supply renewable power at a pre-determined
tariff. It was introduced for solar projects under
Phase 2, Batch 1 of the National Solar Mission.
The government provided a capital subsidy in
installments with an upper limit of 30% of the
project cost or INR 25 million per MW (PIB,
2014).
Proposed debt-related policies
In our previous work (CPI, 2012), we found that the
greatest barrier to renewable energy in India is the
inferior terms of debt – i.e., high interest cost, short
tenor, and variable rate. We found that the terms
of debt raise the cost of renewable energy in India
by around 30% compared to similar projects in the
US. Hence, in addition to existing policies, we also
consider four promising debt-related policies: interest
subsidy, reduced cost debt, extended tenor debt, and a
combination of reduced cost, extended tenor debt (CPI,
2014).
•• Interest rate subsidy. Under this policy, the
federal government would service a part of
the interest obligation of a project, by directly
making a partial interest payment to the bank
for a commercial loan. This would help reduce
the effective rate of interest. Although no such
policy currently exists for renewable power
generation, the Ministry of Power provided an
interest rate subsidy of 3% for 14 years under
the National Electricity Fund to public and
private power distribution utilities in order to
improve their financial health. The government
now plans to provide an interest subsidy for
renewable energy projects using KfW’s grant of
EUR 1 billion to IREDA (BridgetoIndia, 2014).
•• Reduced cost debt. The federal government
would directly lend below the commercial rate
of interest to renewable projects, either using
funds earmarked for the purpose, or by raising
money from bond markets and on-lending
15
Reaching India’s Renewable Energy Targets Cost Effectively
April 2015
the proceeds. For example, the Brazilian
Development Bank’s (BNDES) provides low-cost
loans for renewable energy projects (IEA, 2012).
•• Extended tenor debt. The federal government
would directly lend to project developers at the
commercial rate of interest, but for a longer
than commercial tenor. It has been identified as
one of the policies desired under the proposed
National Wind Mission (MNRE, 2014b).
•• Reduced cost, extended tenor debt. The
government would make direct loans to project
developers below the commercial rate of
interest for longer than commercial tenor. For
example, under the IREDA-NCEF refinance
scheme, the debt of renewable projects can
be taken out using concessional finance from
IREDA, thereby reducing the effective rate of
interest and increasing the tenor of debt.
In the following section, we describe the methodology
for computing the cost of support under each of these
policies.
B. Assumptions for Cash Flow Models
(See Table 1 below)
Table 1: Assumptions for Cash Flow Models
ASSUMPTIONS
POWER GENERATION
CAPACITY UTILIZATION
FACTOR (P50 PLF)
USEFUL LIFE
CAPITAL COST
1
WIND
24.5% FOR THE PROJECTS TO
BE COMMISSIONED IN 2015#.
25 YEARS
BASED ON FORECAST OF
CAPITAL COST (INR MILLION/
SOLAR PLANT CAPITAL COST
MW)
(SECTION 3.2)
FINANCIAL ASSUMPTIONS
MINIMUM DEBT SERVICE
1.3
COVERAGE RATIO
22.5% FOR THE PROJECTS TO
P90 PLF (DEBT CONDITION)
BE COMMISSIONED IN 2015#.
DEBT
REPAYMENT PERIOD
12 YEARS
INTEREST RATE (FIXED)
12.30%
EQUITY
EXPECTED RETURN ON
17.90%*
EQUITY
TAX INCENTIVE
TAX HOLIDAY
10 YEARS
MINIMUM ALTERNATIVE TAX
20%
2
3
4
SOLAR
COAL
20.5%*
75%*
25 YEARS
40 YEARS
BASED ON FORECAST OF
WIND PLANT CAPITAL
COST (SECTION 3.3)
BASED ON FORECAST OF
COAL PLANT CAPITAL COST
(SECTION 3.4)
1.3
NA (FIXED DEBT TO EQUITY
RATIO)
19%*
NOT APPLICABLE
12 YEARS
12.30%
10 YEARS
12%
17.30%*
15.50%*
10 YEARS
20%
NOT APPLICABLE
NOT APPLICABLE
1 Capacity utilization factor can be defined as fraction of time that a plant is producing energy.
2 Ratio of cash flows available for debt servicing to interest and principal.
3 P50 PLF or plant load factor represents the most likely output of the plant, while P90 PLF is a conservative estimate of the plant load factor.
4 Return on equity (ROE) is the amount of net income returned as a percentage of shareholders equity.
* We assume that these variables remain constant throughout the project life-cycle of all the projects to be commissioned till 2022.
# Increases by 0.5% every year for the projects to be commissioned in subsequent years.
A CPI-ISB Series
16
April 2015
Reaching India’s Renewable Energy Targets Cost Effectively
C. Methodology used for forecasting
capital expenditure
D. Results for other scenarios-Sensitivity
Analysis
Solar capital expenditure (capex) consists of module
costs and non-module or balance of system costs. The
market for PV modules is global. However, non-module
costs such as land, labor and transmission costs depend
on local or country-level factors. Therefore, it is possible
to extrapolate module costs based on global data, but
non-module costs have to be estimated using Indian
data.
To account for the inherent uncertainty in forecasts,
we provide four possible scenarios for cost of support.
For wind energy, turbine costs constitute 70-85% of the
total system cost. The major components of the turbine
costs are rotor blades, tower, generator, transformer,
power gearbox and power converter. The remaining
system costs consists of land cost, grid connection,
construction cost, and consulting cost. Due to the lack
of granular data, we forecast wind capital expenditure at
the system level.
We used four approaches for estimating capital
expenditure for wind and solar energy:
1. Literature Review: We examine existing solar
and wind capex forecasts from secondary sources
(Shakti Foundation 2013) and the assumptions
underlying these forecasts.
2. Trend Analysis: Simple extrapolation of historical
capital costs. We extract project level capital
cost yearly data from BNEF and other secondary
sources and make simple forecasts using trend
lines – in this case, we implicitly assume that
historical trends will continue for the next seven
years.
3. Regression Analysis: We identify the key drivers
of capital costs for wind plants and solar plants
through literature review (Berry, D (2009) for
Wind; Nemet, G.F. (2006) & Pillai, U & K. Cruz
(2013) for Solar). Using the appropriate regression
model, we forecast the capex for wind and solar
plants from 2015 to 2022.
4.Primary Research: The three methods detailed
above provide an estimate of the ranges within
which capex estimates lie, and the changes
observed with each level of refinement. Based
on several interviews of consultants, experts,
developers, manufacturer, we drew inferences
on expected trends in system costs for wind and
solar. Primary research was used to validate the
findings of our secondary research, and to obtain
insights on expected trends and drivers for solar
and wind capex.
A CPI-ISB Series
We develop three sets of forecasts: best case (i.e.
renewable based unsubsidized levelized costs drop
rapidly and imported coal based levelized cost rises
significantly); worst case (i.e., renewable based
unsubsidized levelized costs do not decrease much
while the levelized cost of imported coal shows a
declining trend); and the average case, which combines
all forecasts to arrive at the most likely or the most
probabilistic scenario. The best case will represent the
minimum cost of support for renewable energy, and in
the worst case, the cost of support will be the highest.
We also consider a fourth scenario as an additional
case, where the average case unsubsidized levelized
costs of renewable power are compared with the
levelized cost of domestic coal-based power.
Forecast of unsubsidized levelized cost of
electricity
In the best case, levelized costs for wind energy
show an increasing trend, while solar energy shows
a decreasing trend. Both are cheaper than imported
coal-based power.
Figure 7: Forecast of Levelized Cost of Electricity - Best Case
LCOE BEST CASE (INR/KWH)
9
8
L
IMPORTED COA
SOLA
7
6
5
R
Solar and wind are
already competitive
WIND
2015
'16
'17
'18
'19
'20
'21
'22
17
Reaching India’s Renewable Energy Targets Cost Effectively
April 2015
Figure 8: Forecast of Levelized Cost of Electricity - Worst case
LCOE WORST CASE (INR/KWH)
9
In the worst case (Figure 8), the levelized cost of
imported coal rises at a very gradual rate from INR 6.63/
kWh in 2015 to INR 6.95/kWh in 2022. On the other
hand, wind levelized costs rise rapidly from INR 6.14/
kWh in 2015 to INR 7.56/kWh in 2022. The levelized cost
of wind is expected to be 7.5% lower than imported coal
in 2015 but will become 9% more expensive by 2022.
In this case, wind projects will begin to require policy
support from 2019 since the effect of inflation on wind is
more pronounced.
SOL
A
R
8
7
IMPORTED COAL
D
WIN
6
5
Wind requires policy
support after 2019
2015
'16
'17
In the worst case, wind energy would require policy
support after 2019, while solar energy would require
policy support up to 2022.
'18
'19
'20
'21
'22
For solar, the decline in prices is much more gradual
relative to the average case, starting at INR 8.48/kWh in
2015 and falling to INR 7.22/kWh in 2022. The levelized
cost of solar is 27.9% higher than imported coal, but this
gap would reduce to 3.8% by 2022. Hence, solar energy
will continue to require policy support until 2022 in
order to compete with imported coal-based power.
In the best case scenario (Figure 7), we find that wind
and solar energy are expected to be cheaper than
imported coal-based power.
In the case of domestic coal-based power as the
baseline, both wind and solar energy would require
policy support throughout 2015 to 2022.
In 2015, the levelized cost of wind is INR 5.64/kWh and
is expected to slowly decline to INR 5.55/kWh by 2022,
primarily due to the increase in capacity utilization
factor, which outweighs the effect of increasing capital
expenditure. The wind levelized cost is currently 22%
cheaper than the levelized cost of imported coal, and is
expected to become 26% cheaper by 2022.
In our additional scenario with domestic coal as the
baseline cost of imported coal based power, we find that
domestic coal prices are considerably lower than wind,
solar and imported coal.
In the case of solar, the forecasted levelized cost for
2015 is INR 7.13/kWh, and is expected to steadily decline
to INR 6.62/kWh by 2022, driven by declining capital
expenditure. The levelized cost of imported coal is
expected to increase from INR 7.22/kWh in 2015 to INR
7.54/kWh in 2022 on account of inflation and rising fuel
prices. The levelized cost of solar energy is expected to
be 1.3% cheaper than that of the imported coal based
power in 2015.
Therefore, both renewable technologies are already
cheaper than imported coal based power in 2015, and do
not require any policy support from the government.
Figure 9: Forecast of Levelized Cost of Electricity - Domestic Coal
Case
LCOE AVERAGE CASE COMPARED
TO DOMESTIC COAL (INR/KWH)
9
8
SOLA
R
7
6
WIND
AL
DOMESTIC CO
Domestic coal
remains cheaper
than solar and wind
5
2015
A CPI-ISB Series
'16
'17
'18
'19
'20
'21
'22
18
Reaching India’s Renewable Energy Targets Cost Effectively
April 2015
solar and wind based power,
respectively. As shown
in Figure 9, this gap will
decrease to 19% in the case of
solar energy and increase to
16% in case of wind energy by
2022.
Figure 10: Yearly and Cumulative Capacity Deployment Targets of Renewable Energy
Total Cost of Support –
Sensitivity Analysis
The capital expenditure for imported and domestic coal
based power plants is the same. Hence, the system level
project cost of a coal based plant differs mainly due to
the difference in fuel price between domestic coal and
imported coal.
Since domestic coal prices are regulated, we use the
price of imported coal adjusted downward by 15% for
transport, or the import parity price, which indicates the
unsubsidized market price of domestic coal (PIB, 2013).
The levelized cost of domestic coal-based power is
expected to be at INR 5.47/kWh in 2015. The price
increases over time to INR 5.79/kWh in 2022, but
remains cheaper than all the other technologies. The
levelized cost of domestic coal based electricity is
41.6% and 8.6% cheaper than the levelized cost of
Based on the levelized cost
estimates discussed above,
we estimate the total cost of
support in each of the four
scenarios. For all scenarios,
we assume the capacity
addition schedule will follow
the path illustrated in Figure
10, constructed on the
basis of the interim targets declared by the Planning
Commission. The total cost of support is zero in the best
case since both wind and solar are already competitive
with imported coal based power. However, in the worst
case, the total cost of support is over four times higher
for solar, while wind begins to require policy support.
In the domestic coal case, the total cost of support for
solar energy is over seven times higher compared to the
support required in the average case with imported coal.
Figure 11 summarizes these results with respect to two
policies – accelerated depreciation, the most costeffective among the existing policies, and reduced cost,
extended tenor debt, the most cost-effective of all
policies examined in this paper.
Figure 11: Total Cost of Support for Renewable Energy under AD and RCETD
A CPI-ISB Series
19


© Copyright 2026