
DEEP DRILLING, DEEP POCKETS IN CONGRESS & PENNSYLVANIA November 10, 2011
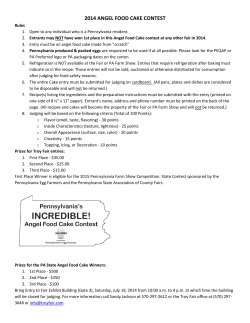
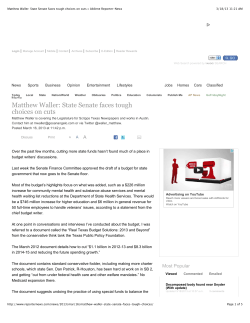
James Browning & Alex Kaplan November 10, 2011 DEEP DRILLING, DEEP POCKETS IN CONGRESS & PENNSYLVANIA i About Common Cause Common Cause is a nonpartisan, nonprofit advocacy organization founded in 1970 by John Gardner as a vehicle for citizens to make their voices heard in the political process and to hold their elected leaders accountable to the public interest. Today, Common Cause is one of the most active, effective, and respected nonprofit organizations working for political change in America. Common Cause strives to strengthen our democracy by empowering our members, supporters and the general public to take action on critical policy issues. In this spirit, Common Cause serves as an independent voice for change and a watchdog against corruption and abuse of power. Together with our sister organization, the Common Cause Education Fund, we employ a powerful combination of grassroots organizing, coalition building, research, policy development, public education, lobbying and litigation to win reform at all levels of government. 1133 19th Street NW | Washington, D.C. 20036 | 202-833-1200 | [email protected] www.CommonCause.org | www.CommonBlog.com | Facebook.com/CommonCause | @CommonCause ii Table of Contents Executive Summary Key Findings Fracking Money in Politics Campaign Contributions Lobbying Expenditures Independent Political Expenditures Regulation Failure to Regulate Can the Natural Gas Industry Regulate Itself? Regulation in the States Conclusion Recommendations About This Report Pennsylvania Campaign Contributions and the Rise of Gas Drilling in PA Recommendations for Pennsylvania References Page 1 Page 3 Page 5 Page 5 Page 7 Page 8 Page 9 Page 9 Page 10 Page 10 Page 13 Page 13 Page 14 Page 17 Page 21 Page 22 Page 24 List of Charts and Figures 1. Fracking Industry PAC and Employee Campaign Contributions (graph) 2. Fracking Industry Lobbying Expenditures (graph) 3. Fracking money by vote on the “Halliburton Loophole” (chart) 4. Av. fracking money received by vote on the 2005 Energy Policy Act (graph) 5. Top 10 fracking entities by PAC and employee campaign contributions (chart) 6. Fracking money to energy committee members vs. non-members (chart) 7. Fracking money to Republicans vs. Democrats (graphic) 8. Top 10 entities by lobbying expenditures, 2001-2011 (chart) 9. Top 5 entities by lobbying expenditures, 2001-2010 (graph) 10. Top 100 in Congress by money received from the fracking industry (chart) 11. Top Pennsylvania members of Congress as recipients of fracking money 12. Fracking money to Pennsylvania state candidates (graph) 13. Pennsylvania’s top 20 state-level recipients of fracking money (chart) Page 4 Page 4 Page 5 Page 5 Page 6 Page 6 Page 6 Page 7 Page 7 Page 15 Page 18 Page 20 Page 21 1 Executive Summary A faction of the natural gas industry has invested more than $747 million as part of a 10-year lobbying and political spending campaign to persuade federal authorities to ignore the dangers of hydraulic fracturing, or “fracking,” a rapidly expanding but poorly regulated method of tapping gas reserves. Fracking involves injecting a mix of sand, chemicals, and water into a well at high pressure in order to break up underground rock formations and free up natural gas. Pollution may occur underground, with fracking chemicals or methane directly contaminating aquifers and drinking wells, or above ground, as streams or tributaries are polluted by spills or improper wastewater disposal. Nationwide, more than 1,000 complaints of water contamination due to fracking have already been reported.1 Natural gas obtained from fracking and horizontal drilling in shale deposits – a combination which produces massive amounts of toxic wastewater – will rise from 16 percent of all U.S. natural gas production in 2009 to 45 percent by 2035, according to the U.S. Department of Energy.2 Despite the pollution risks, the industry has argued that regulatory exemptions for fracking are needed to give America the opportunity to tap vast reserves of natural gas that have been previously unobtainable, generate millions of new jobs, reduce energy costs for the American consumer, and dramatically reduce America’s dependence on foreign oil. This is an impressive list—suggesting a “cure-all” for some of America’s biggest domestic and foreign challenges. From 2001 through June 2011, the fracking industry gave $20.5 million to current members of Congress and spent $726 million on lobbying. 2 Such promises have helped the natural gas industry “systematically exempt themselves from most major environmental laws,” according to Dusty Horwitt, Senior Counsel for the Environmental Working Group, and author of the 2010 study “Drilling Around the Law.” With little federal regulation in place, the public has been left to rely on industry promises to limit the use of harmful substances in the fracking process—promises which have been repeatedly broken. The EPA is scheduled to publish new, preliminary findings about the potential dangers of fracking in 2012. That gives the natural gas industry a powerful incentive to increase its political spending now in an attempt to shape public opinion and the debate over fracking in Congress, as well as affect the outcome of the 2012 Congressional elections. Doing so will be much easier after last year’s U.S. Supreme Court ruling in Citizens United. This ruling threw out a century-old ban on corporate spending around elections and empowered corporations to exert even more influence over the political process. Now money spent on campaign contributions, lobbying, and through other avenues of influence such as the American Legislative Exchange Council (ALEC) can be backed by millions spent on electioneering. 3 Key Findings From 2001 through June 2011, companies now engaged in fracking contributed $20.5 million to current members of Congress. Industry giving more than tripled from the 2001-02 election cycle, when $2 million was contributed, to the 2009-10 election cycle, when $6.8 million was contributed. These same companies spent $726 million on lobbying at the federal level from 2001 through September, 2011. Contributions heavily favored current members of Congress who voted for the 2005 Energy Policy Act, which exempted fracking from regulation under the Safe Drinking Water Act. Current members who voted for the bill received an average of $73,433, while those who voted against the bill received an average of $10,894. Current members of the Senate Committee on the Environment and Public Works have received a total of $1.4 million from the industry. Current members of the House Energy and Commerce Committee have received a total of $3.7 million from the industry. Chair Rep. Fred Upton (R-MI) has received $153,917 from the industry and Committee member Rep. Joe Barton (R-TX) is the single-biggest recipient of fracking money in Congress with $514,945. The natural gas industry’s fight against regulation has gotten important help at the state level from the American Legislative Exchange Council (ALEC). As documented in an August 2011 Common Cause report, ALEC generates and lobbies for hundreds of model bills every year despite its status as a tax-exempt 501 (c)(3) organization. Prominent financial backers of ALEC’s activities include the American Petroleum Institute, ExxonMobil, and Koch Industries, owner of the largest network of natural gastransmitting pipelines in the country. The natural gas industry’s political expenditures have been used to target supporters of the FRAC Act, which would regulate fracking under the Safe Drinking Water Act and require disclosure of chemicals used in the fracking process. For example, in 2010, the industry gave $3 million to American Crossroads which in turn spent $533,000 in an attempt to defeat FRAC Act sponsor U.S. Rep. Maurice Hinchey (D-NY). 4 Figure 1 Fracking Industry PAC and Employee Campaign Contributions, 2001-2010 5,000,000 4,573,727 4,500,000 4,000,000 Total in Dollars 3,500,000 3,306,972 3,000,000 2,500,000 2,274,194 2,000,000 1,500,000 1,646,124 1,486,132 1,295,178 1,000,000 500,000 896,339 703,070 700,438 1,697,182 0 2001 2002 2003 2004 2005 2006 2007 2008 2009 2010 Figure 2 Fracking Industry Lobbying Expenditures, 2001-2010 160 144.3 Total in Millions of Dollars 140 120 102.2 100 110.2 80 62.3 60 52.1 40 20 29.1 37 35.7 34 44 0 2001 2002 2003 2004 2005 2006 2007 2008 2009 2010 5 Fracking Money in Politics Campaign Contributions Data was retrieved from the Federal Election Commission and represent contributions made from January 1, 2001 through June 30, 2011. Custom databases were built and searched for contributions relating to the PACs and employees of the relevant companies and organizations described in the list available at the below link. Download the entire data sheet at www.commoncause.org/fracking2012 Figure 3 Fracking money by vote on the 2005 Energy Policy Act / “Halliburton Loophole” House In Favor House Against House not in office in 2005 Senate In Favor Senate Against Senate not in office in 2005 Total Count Average $8,655,233 137 $63,117 $1,243,528 123 $10,110 $2,980,647 173 $17,229 $4,931,832 48 $102,747 $172,700 7 $24,671 $2,115,006 43 $49,186 Figure 4 Average fracking money received by vote on the 2005 Energy Policy Act $102,747 $120,000 $100,000 $80,000 $63,117 $49,186 $60,000 $40,000 $10,110 $20,000 $24,671 $17,229 $0 House In Favor House Against House not in office Senate In Favor Senate Against Senate not in office 6.2x 4.1x 6 Fracking PAC total 2001 – June 2011 $16,236,806 Fracking employee total 2001 – June 2011 $4,250,851 Fracking industry total 2001 – June 2011 $20,487,657 Figure 5 Top 10 fracking entities by PAC and employee campaign contributions Entity Exxon Mobil Chevron ConocoPhillips Occidental Petroleum DTE Energy Williams Marathon Oil American Gas Association Ind. Petro. Assoc. of Amer. Anadarko Total $2,843,443 $1,572,175 $1,399,600 $1,197,218 $1,083,392 $1,000,300 $961,350 $926,022 $898,500 $836,000 PAC Employee $2,563,543 $279,900 $1,401,825 $170,350 $1,149,750 $249,850 $1,075,600 $121,618 $903,194 $180,198 $892,200 $108,100 $841,900 $119,450 $856,622 $69,400 $895,000 $3,500 $699,500 $136,500 Figure 6 Fracking money to energy committee members vs. non-members Total Count Senate Envir. & Public Works members $1,440,188 18 Senate non-energy committee members $5,897,100 82 House Energy & Commerce members $3,728,132 53 House non-energy committee members $9,343,476 382 Average $80,010 $71,915 $70,342 $24,459 2.8x Figure 7 Fracking money to Republicans vs. Democrats Republican Party/Caucus Democratic Party/Caucus House Senate Combined Total: $10,551,757 241 members Average: $43,783 Total: $5,595,169 47 members Average: $119,046 Total: $16,146,926 288 members Average: $56,066 Total: $2,519,851 194 members Average: $12,989 Total: $1,742,119 53 members Average: $32,870 Total: $4,261,970 247 members Average: $17,255 7 Fracking Money in Politics Lobbying Expenditures Data was compiled using both the Senate's online Lobbying Disclosure Act Database and data from the Center for Responsive Politics. Lobbying figures included in this report represent expenditures from the start of 2001 through the end of Quarter 3, 2011. Download the entire data sheet at www.commoncause.org/fracking2012 Figure 8 Top 10 entities by lobbying expenditures, 2001-2011, in millions of dollars Exxon Mobil Chevron ConocoPhillips BP America Marathon Oil Am. Pet. Inst. Shell Occidental Williams DTE Energy 2001 5.83 3.71 0.23 2.18 5.72 1.14 0.26 2.13 1.83 2.00 2002 8.25 5.04 1.16 3.03 3.86 3.04 0.10 2.25 1.62 1.72 2003 7.56 4.62 1.38 2.57 3.66 3.14 0.06 2.03 1.14 2.36 2004 7.94 5.22 2.67 1.90 1.91 2.87 0.06 2.03 1.17 1.08 2005 2006 2007 2008 7.30 14.54 16.94 29.00 9.49 7.48 9.03 12.99 5.22 2.04 4.09 8.46 2.92 3.65 4.64 10.45 4.31 2.32 5.69 6.89 3.64 3.38 4.00 4.85 0.16 0.09 3.10 4.46 2.04 9.09 2.65 2.77 1.18 0.83 0.68 3.86 1.22 1.06 1.17 1.35 2009 27.43 20.82 18.07 15.99 9.95 7.32 10.19 2.77 4.16 1.52 2010 2011* TOTAL 12.45 10.03 147.27 Exxon Mobil 13.13 6.99 98.51 Chevron 19.63 16.13 79.07 ConocoPhillips 7.41 5.71 60.45 BP America 5.13 2.69 52.13 Marathon Oil 7.30 5.98 46.66 Am. Pet. Inst. 10.37 11.25 40.10 Shell 2.58 2.66 33.00 Occidental 3.94 3.01 23.40 Williams 1.50 1.46 16.44 DTE Energy *2011 data incomplete: ends through Quarter 3 or September 2011 Figure 9 Top 5 entities by lobbying expenditures, 2001-2010, in millions of dollars 35.00 30.00 25.00 Exxon Mobil 20.00 Chevron 15.00 ConocoPhillips BP America 10.00 Marathon Oil 5.00 0.00 2001 2002 2003 2004 2005 2006 2007 2008 2009 2010 8 Fracking Money in Politics Independent Political Expenditures “Climate is gone,” veteran political strategist Karl Rove announced at a 2010 conference of the oil and gas industry.3 Rove was referring to the results of the 2010 elections in which Republicans took control of the U.S. House—an election in which political committees controlled by Rove and aided by donations from oil and gas interests were a leading source of independent political expenditures. Rove’s American Crossroads, a political action committee organized under laws that allow it to receive unlimited donations, has collected $2 million from Trevor ReesJones, Chairman of Chief Oil and Gas, and $1 million from Robert Rowling, Chairman of TNT Holdings, whose businesses include an oil and gas exploration firm. American Crossroads and Rove’s Crossroads Grassroots Political Strategies, or Crossroads GPS, a spin-off of American Crossroads organized as a non-profit 501(c)(4) organization and exempt from requirements that it reveal its donors, together accounted for $37.5 million of the $390 million in independent expenditures disclosed to the FEC in the 2009-10 election cycle. For the 2011-12 election cycle, these two groups have accounted for 28 percent—$1.2 million of $4.3 million— disclosed to the FEC as of October 2011. Crossroads GPS is one of four groups whose tax-exempt status was challenged in a September 2011 letter to the IRS from the Campaign Legal Center and Democracy 21. “The idea that these organizations are social welfare groups is nonsense,” wrote Fred Wertheimer, President of Democracy 21. “The groups have sought tax-exempt status under section 501(c)(4) in order to keep secret from the American people the donors financing their campaign expenditures.” “The idea that these organizations are social welfare groups is nonsense. The groups have sought tax-exempt status under section 501(c)(4) in order to keep secret from the American people the Regulation donors financing their campaign expenditures.” A Failure to Regula - Fred Wertheimer, President of Democracy 21 9 Regulation Failure to Regulate When the EPA announced in 2000 that it was designing a study to investigate the potential for groundwater contamination from hydraulic fracturing, the United States Department of Energy warned that regulations could hinder economic growth in the industry.4 When released in 2004, the EPA study concluded that the process is environmentally harmless, and then-Vice President Dick Cheney and his former employer Halliburton used this finding to insert language into the 2005 Energy Policy Act to exempt fracking from regulation under the Safe Drinking Water Act. Current members of Congress who voted for this bill have received an average of $73,433 from industry, while current members who voted against the bill have received an average of $10,894. When the EPA study was released in June 2004, many environmentalists criticized it for not adequately testing the potential for fracking to contaminate groundwater. Then, in October 2004, EPA environmental engineer Weston Wilson sought protection under the Federal Whistleblower Protection Act and charged that five of the seven members of the study’s external peer review panel of experts had conflicts of interest (three of those five were at the time employed by the gas industry) and criticized its authors for making no attempt to investigate the migration of methane as a result of fracking. Highlighting the fact that the agency could come to such concrete conclusions despite the fact that, as written in the report, the “EPA was unable to find complete chemical analyses of any fracturing fluids,” Wilson called the study’s findings “scientifically unsound and contrary to the purposes of the [Safe Drinking Water Act].”5 The industry’s exemption from the Safe Drinking Water Act has been called “the Halliburton loophole,” but the industry’s political influence runs much deeper. The New York Times has reported that the findings of a 1987 EPA study were also heavily influenced by the industry. ''It was like the science didn't matter. The industry was going to get what it wanted, and we were not supposed to stand in the way,” said Carla Greathouse, author of the 1987 EPA study.6 The Times has also noted that the industry is exempt from seven of the 15 major laws designed to protect air and water from contamination by harmful substances, including the Clean Air Act, Clean Water Act, and the Superfund Act. ''It was like the science didn't matter. The industry was going to get what it wanted, and we were not supposed to stand in the way.” -Carla Greathouse, author of 1987 EPA study 10 Regulation Can the Natural Gas Industry Regulate Itself? The fight to keep fracking largely free from federal regulation has been led by some of the biggest recipients of fracking money in Congress. The FRAC Act, a bill that would eliminate the “Halliburton loophole,” remains bottled up in the House Energy & Commerce Committee, whose chair, Rep. Fred Upton (R-MI), has received $153,917 from the industry. After Secretary of the Interior Ken Salazar announced plans to regulate fracking through his department Rep. Dan Boren (D-OK) and Rep. Tim Murphy (R-PA), who co-chair the House Natural Gas Caucus, sent Salazar a letter in January 2011 urging him not to act until completion of a new study by the EPA.7 Boren ranks eighth among all members of Congress with $328,300 in contributions from companies engaged in fracking. Murphy ranks tenth with $275,499.8 Most recently, the Securities and Exchange Commission has stepped in and begun asking drillers to confidentially disclose which chemicals they are using in hydraulic fracturing as a way of determining these companies’ potential liabilities for frackingrelated damage to the environment. Confidential disclosure addresses the industry’s long-standing objection to public release of proprietary information about fracking fluid. Yet even this modest step was opposed by Rep. Steve Pearce (R-NM) at a September 2011 hearing of the Committee on Financial Services. Pearce, whose campaigns have collected $351,650 from fracking interests, more than all but five other current lawmakers, suggested that SEC Chair Mary Schapiro’s concerns about having insufficient resources for her agency were ill-founded at a time when her agency was “drifting off into this environmental question.”9 Such extraordinarily lax government oversight leaves the industry, in many cases, free to regulate itself. But in May of this year, the shareholders of Chevron and ExxonMobil rejected proposals calling for more disclosure of the environmental impacts and risks of drilling for natural gas.10 Current members of Congress who voted for the “Halliburton loophole” have received an average of $73,433 from the industry, while current members who voted against the bill have received an average of $10,894. 11 The industry’s failure to abide by its promise not to use diesel fuel in fracking highlights the dangers of relying on selfregulation. In 2003, the EPA and the three major fracturing companies at the time (Halliburton, BJ Services, and Schlumberger) signed a voluntary memorandum of agreement (MOA) to discontinue the use of diesel fuel in fracking fluids. In an inquiry initiated by the Energy and Commerce Committee’s then-chairman, Rep. Henry Waxman (D-CA), Halliburton and BJ Services were found to have knowingly violated the MOA between 2005 and 2007; the committee concluded that the companies used fracking fluid with hundreds of thousands of gallons of diesel fuel containing chemicals that have confirmed negative health effects.11,12 Even after the EPA gained authority to regulate the use of diesel fuel in fracking fluids, Reps. Waxman, Edward J. Markey (DMA), and Dianna DeGette (D-CO) discovered that the practice had continued in apparent violation of federal law. A letter released by the three in January 2011 stated: “The congressional investigation finds that oil and gas service companies have injected over 32 million gallons of diesel fuel or hydraulic fracturing fluids containing diesel fuel in wells in 19 states between 2005 and 2009. In addition, the investigation finds that no oil and gas service companies have sought – and no state and federal regulators have issued – permits for diesel fuel use in hydraulic fracturing, which appears to be a violation of the Safe Drinking Water Act.” Even after the EPA gained authority to regulate the use of diesel fuel in fracking fluids, Reps. Waxman, Edward J. Markey (DMA), and Dianna DeGette (D-CO) discovered that the practice had continued in apparent violation of federal law. 12 Regulation Regulation in the States The natural gas industry’s success in Congress contrasts starkly with the “go slow” or “don’t go” approach that a growing number of state and local elected officials are taking toward fracking. New Jersey has imposed a one-year moratorium on fracking until its risks to the environment and human health can be further studied. New York imposed a six-month moratorium that expired in July 2011, while Maryland has effectively halted fracking by ordering a three-year environmental impact study. Several municipalities have banned fracking entirely, including Pittsburgh, PA; Albany, Ithaca, and Buffalo, NY; and Morgantown and Westover, West Virginia. Two states that have long depended on oil and gas revenues, Texas and Wyoming, have taken the lead on requiring disclosure of fracking chemicals. Fracking using vertical wells has been conducted in both states since the 1950s, and unlike some states where the fracking boom is just beginning, both states have ample evidence of the threats to human health from drillingrelated pollution.13,14 In 2010, Wyoming became the first state to issue regulations requiring disclosure of fracking chemicals. Meanwhile Texas, which has ranked as one of the worst states for per capita spending on maintaining water quality15, became the first state to pass a law requiring disclosure of fracking chemicals in June 2011. Additional in-depth studies of the natural gas industry’s political spending in Pennsylvania, New York, Ohio, and Michigan are available at commoncause.org/fracking2012 13 Conclusion The absence of strong federal regulation means that states with little or no fracking may still find their water supplies at risk of pollution produced outside their boundaries. In 2009, the group American Riverkeeper declared the Delaware River, which provides water to 15 million people in four states, to be the most endangered river in the country. In 2010, the group declared the Susquehanna River, which provides drinking water to six million people in Pennsylvania and Maryland, to be the most endangered. The ability of the natural gas industry to tap vast new reserves through fracking is a good metaphor for its enhanced political clout in the post-Citizens United era, in which the industry and its backers can now spend unlimited amounts of money on electioneering, often in secret. A full and fair debate about the degree to which the natural gas industry should be more transparent about the chemicals used in fracking, and more forthcoming about their potential to damage the environment and human health, depends on forcing the industry to more fully disclose its political expenditures. Recommendations I. II. III. Independent political expenditures should be disclosed in a timely manner so the public can better understand their impact on Congressional elections. As with all corporations, the shareholders of natural gas companies should have the right to approve or disapprove any political expenditures by their companies, and the extent of corporations’ political expenditures should be disclosed to their shareholders. The U.S. Senate should join the U.S. House in requiring that reports of campaign contributions be filed electronically. 14 About This Report “Deep Drilling, Deep Pockets In Congress” was written and researched by James Browning and Alex Kaplan, with additional research by Jaron Raab and John Ammon. This is the third in a series of Common Cause studies of political spending by the natural gas industry. The previous two studies of political spending by the industry in New York and Pennsylvania are available at www.commoncause.org/ny and www.commoncause.org/pa. Cover design by Anagramist (www.anagramist.com) Figure 10 Top 100 current members of Congress by campaign money received from the fracking industry, 2001-June 11 Rank 1 2 3 4 5 6 7 8 9 10 11 12 13 14 15 16 17 18 19 20 21 22 23 24 25 26 27 28 29 30 31 32 33 34 35 36 37 38 39 40 41 42 43 44 45 46 47 48 49 50 Total $ 514,945 417,556 372,450 367,925 357,788 351,650 329,000 328,300 326,149 275,499 257,950 244,050 237,775 230,860 223,797 216,233 215,349 211,720 203,453 197,150 194,550 191,700 187,795 186,900 186,300 182,149 173,100 160,750 154,900 154,627 153,917 152,032 144,603 144,150 142,350 137,250 136,150 127,050 127,009 124,500 123,800 123,546 123,271 121,350 118,300 117,700 115,900 115,050 111,800 109,150 PACs 410,895 202,400 232,000 271,000 204,800 329,000 225,900 270,050 253,499 178,397 191,750 166,500 182,000 175,500 180,250 198,483 179,499 140,370 138,903 191,500 121,300 150,000 152,995 173,500 180,000 151,849 159,500 106,300 139,000 138,927 143,000 91,000 112,205 129,200 125,500 128,600 93,000 118,750 111,500 124,500 98,500 108,000 106,271 96,500 104,000 110,500 108,500 38,250 96,500 97,000 Individuals 104,050 215,156 140,450 96,925 152,988 22,650 103,100 58,250 72,650 97,102 66,200 77,550 55,775 55,360 43,547 17,750 35,850 71,350 64,550 5,650 73,250 41,700 34,800 13,400 6,300 30,300 13,600 54,450 15,900 15,700 10,917 61,032 32,398 14,950 16,850 8,650 43,150 8,300 15,509 0 25,300 15,546 17,000 24,850 14,300 7,200 7,400 76,800 15,300 12,150 Loophole Vote In Favor In Favor In Favor In Favor In Favor In Favor In Favor In Favor In Favor In Favor In Favor Not in office In Favor In Favor In Favor In Favor Not in office Not in office Against In Favor Not in office Not voting In Favor In Favor In Favor In Favor In Favor Not in office In Favor In Favor In Favor Not in office In Favor In Favor In Favor Not in office In Favor In Favor In Favor In Favor In Favor In Favor In Favor In Favor In Favor Not in office In Favor Not in office In Favor In Favor Chamber House Senate Senate Senate Senate House House House Senate House Senate Senate House Senate House Senate House House House House Senate House House House House House House Senate Senate House House Senate House Senate House Senate House House Senate House House Senate House Senate Senate House House House Senate Senate Party R R R D R R R D R R R R R R D R R R D R R R R R D R R R R R R R R R D R R R R R R R R D R R R R R R Name Barton, Joe Cornyn, John Murkowski, Lisa Landrieu, Mary Inhofe, Jim Pearce, Steve Sullivan, John Boren, Dan Blunt, Roy Murphy, Tim McConnell, Mitch Barrasso, John Young, Don Vitter, David Matheson, Jim Burr, Richard Lummis, Cynthia M. Cole, Tom Dingell, John Brady, Kevin Wicker, Roger Sessions, Pete Culberson, John Boehner, John A. Green, Gene Hall, Ralph M. Cantor, Eric Toomey, Pat Enzi, Mike Camp, Dave Upton, Fred Hoeven, John Capito, Shelley M. Chambliss, Saxby Ross, Mike Thune, John Lucas, Frank Rehberg, Dennis DeMint, Jim Shimkus, John Conaway, K. Michael Grassley, Chuck Hastings, Doc Baucus, Max Coburn, Tom McCarthy, Kevin Boustany Jr., Charles Lankford, James Hatch, Orrin Crapo, Mike State TX TX AK LA OK NM OK OK MO PA KY WY AK LA UT NC WY OK MI TX MS TX TX OH TX TX VA PA WY MI MI ND WV GA AR SD OK MT SC IL TX IA WA MT OK CA LA OK UT ID 15 Committee Energy & Comm. Env. & Pub. Works Energy & Comm. Energy & Comm. Env. & Pub. Works Env. & Pub. Works Energy & Comm. Energy & Comm. Energy & Comm. Energy & Comm. Energy & Comm. Energy & Comm. Env. & Pub. Works Env. & Pub. Works Top 100 current members of Congress by campaign money received from the fracking industry, 2001-June 11 Rank 51 52 53 54 55 56 57 58 59 60 61 62 63 64 65 66 67 68 69 70 71 72 73 74 75 76 77 78 79 80 81 82 83 84 85 86 87 88 89 90 91 92 93 94 95 96 97 98 99 100 Total $ 109,146 108,900 106,350 103,550 103,450 102,500 102,500 102,400 101,329 99,800 97,395 97,350 96,600 93,150 93,125 92,700 91,000 87,829 87,595 87,100 86,000 85,250 82,600 82,600 81,489 80,700 80,100 80,000 77,500 76,750 75,300 73,750 73,000 71,650 70,550 70,500 69,600 68,076 67,600 66,725 66,550 66,270 66,200 66,100 65,800 65,635 65,350 64,350 64,200 63,750 PACs 107,200 99,500 61,000 61,000 92,500 99,500 80,250 95,000 56,000 92,000 26,498 84,000 75,500 51,500 87,575 85,500 90,000 73,429 33,745 81,500 73,500 82,500 75,000 78,000 0 73,000 39,500 79,000 72,750 73,500 56,400 73,750 73,000 51,600 61,500 68,000 65,000 53,000 57,500 59,000 49,000 66,270 38,900 62,500 51,500 32,010 59,000 42,250 51,000 54,000 Individuals 1,946 9,400 45,350 42,550 10,950 3,000 22,250 7,400 45,329 7,800 70,897 13,350 21,100 41,650 5,550 7,200 1,000 14,400 53,850 5,600 12,500 2,750 7,600 4,600 81,489 7,700 40,600 1,000 4,750 3,250 18,900 0 0 20,050 9,050 2,500 4,600 15,076 10,100 7,725 17,550 0 27,300 3,600 14,300 33,625 6,350 22,100 13,200 9,750 Loophole Vote In Favor Against In Favor In Favor In Favor In Favor In Favor In Favor Not in office In Favor Not in office In Favor Not in office In Favor In Favor Not voting Not in office In Favor In Favor Not in office Against Not in office In Favor In Favor In Favor In Favor In Favor Against Not in office In Favor Not in office Not in office In Favor In Favor In Favor In Favor In Favor In Favor In Favor In Favor Not in office In Favor Not in office In Favor Not in office Not in office Not in office Not in office In Favor Not in office Chamber House House House House House House Senate House Senate Senate Senate Senate House Senate House Senate Senate House Senate Senate House Senate House Senate Senate House Senate House House House House House House House House House Senate Senate House House House Senate House House Senate House Senate House House Senate Party R D R R R R D R D R D R R D R R R R D R D R R D D R D D R R R R R R R R R R R R R R R D R D R R R R Name Rogers (MI), Mike J Hoyer, Steny H. Hensarling, Jeb Johnson, Sam Burgess, Michael Walden, Greg Nelson, Ben Davis, Geoff Begich, Mark Isakson, Johnny Manchin, Joe Alexander, Lamar Lamborn, Doug Rockefeller, Jay Whitfield, Ed Sessions, Jeff Portman, Rob Granger, Kay Bennet, Michael Moran, Jerry Costa, Jim Corker, Bob Poe, Ted Bingaman, Jeff Stabenow, Debbie Issa, Darrell Pryor, Mark Barrow, John Gardner, Cory Carter, John Olson, Pete Scalise, Steve Nunes, Devin Bishop, Rob Simpson, Mike Terry, Lee Roberts, Pat Collins, Susan Mica, John McCaul, Michael T. McKinley, David Hutchison, Kay Bailey Flores, Bill Cuellar, Henry Ayotte, Kelly Altmire, Jason Coats, Dan Griffin, Tim Marchant, Kenny Kirk, Mark State MI MD TX TX TX OR NE KY AK GA WV TN CO WV KY AL OH TX CO KS CA TN TX NM MI CA AR GA CO TX TX LA CA UT ID NE KS ME FL TX WV TX TX TX NH PA IN AR TX IL 16 Committee Energy & Comm. Energy & Comm. Energy & Comm. Env. & Pub. Works Energy & Comm. Env. & Pub. Works Energy & Comm. Energy & Comm. Energy & Comm. Energy & Comm. Energy & Comm. Energy & Comm. - 17 101 S. 2nd St., Suite 3 | Harrisburg, PA 17101 | p: 717-232-9951 | [email protected] www.commoncause.org/pa | www.facebook.com/commoncausepa 18 Figure 11 Top Pennsylvania members of Congress as recipients of fracking money, 2001-2010 Rank Total PACs 10 275,499 178,397 28 160,750 106,300 96 104 108 114 122 65,635 60,800 59,000 56,500 52,000 Individuals 32,010 59,600 57,000 56,000 44,500 Loophole Vote Chamber Party Name State 97,102 In Favor House R Murphy, Tim PA 54,450 Not in office Senate R Toomey, Pat PA 33,625 1,200 2,000 500 7,500 Not in office Against In Favor In Favor Not in office House House House House House D R R R R Altmire, Jason Gerlach, Jim Shuster, Bill Dent, Charles W. Thompson, Glenn W. District 18 Committee En. & Comm. - PA 04 - PA 06 - PA 09 - PA 15 - PA 05 En. & Comm. 144 45,700 37,250 8,450 In Favor House D Doyle, Mike PA 14 165 33,750 33,750 0 Against House R Fitzpatrick, Michael G. PA 08 - 167 32,000 32,000 0 In Favor House R Pitts, Joseph R. PA 16 En. & Comm. PA 07 - PA 12 - PA 11 - Kelly, Mike PA 03 - 180 181 213 27,650 27,541 19,750 25,000 26,291 19,250 269 11,750 0 287 9,700 330 5,500 344 364 t438 t438 t438 2,650 1,250 500 Not in office Not in office Not in office House House House R D R Meehan, Pat Critz, Mark Barletta, Lou 11,750 Not in office House R 9,000 700 Not in office Senate D Casey, Bob PA 0 5,500 Against House D Schwartz, Allyson PA 13 - 4,500 4,500 0 In Favor House D Holden, Tim PA 17 - 3,000 3,000 0 Not in office House R Marino, Tom PA 10 - PA 02 - PA 19 - PA 01 - 0 0 0 0 0 0 0 0 0 Against In Favor In Favor House House House D R D Fattah, Chaka Platts, Todd Brady, Robert - 19 Pennsylvania Even before the election of Gov. Tom Corbett in 2010, Pennsylvania was considered “the sweet spot” for fracking by the natural gas industry’s Marcellus Shale Coalition. The state’s regulatory scheme is weak; it levies no severance tax, insufficiently funds its corps of safety inspectors and is the only state to allow drillers to dump fracking wastewater in its waterways. Natural gas interests have shown their appreciation by investing generously in the campaigns of state leaders. Through the end of 2010, Gov. Corbett was the state’s all-time leading recipient of campaign contributions from the industry, with $1.6 million; other Pennsylvania candidates, parties, and elected officials received $6.1 million from industry donors from 20012010. After promising during his campaign that he would not impose a severance tax, Corbett in 2011 endorsed a 1% “impact fee,” with most of the revenue going to communities where fracking is occurring. Corbett’s proposed fee is so low that, according the Pennsylvania Budget and Policy Center, “Drillers in Texas will pay five times as much in drilling taxes over the life of a comparable deep well as they will in the Marcellus Shale under the House plan.”16 Among states where a fracking boom is underway, only Pennsylvania and Texas fail to limit campaign contributions, allowing the industry to pour unlimited amounts of money into the campaign coffers of its supporters. And tracking those donations is problematic. The Pennsylvania Department of State’s database of campaign contributions, widely criticized as clunky and user-unfriendly, got even worse in 2011. As exposed by Common Cause Pennsylvania in February 201117, budget cuts forced the Department of State to stop entering contribution reports filed by paper into its database. This means that during a period of rapid expansion for fracking in Pennsylvania, and through the first months of the term of a new, pro-fracking governor, accurate information about the extent of the industry’s campaign contributions was not available. From 2001 through 2010, the fracking industry gave $6.1 million to all Pennsylvania candidates, parties and elected officials. 20 Figure 12 Fracking money to Pennsylvania state candidates, 2001-2010 Contributions to candidates for PA state office $1,600,000 $1,343,000 $1,400,000 Total Amount Contributed $1,200,000 $1,000,000 $797,000 $740,000 $800,000 $688,000 $600,000 $400,000 $389,000 $248,000 $343,000 $200,000 $250,000 $159,000 $160,000 $0 2001 2002 2003 2004 The natural gas industry has also taken advantage of Pennsylvania’s lax law covering gifts to elected officials, generously rewarding its supporters in the state legislature. In February 2011, it was revealed that Consol Energy had paid for a Super Bowl junket, including flights and accommodations, for Sen. President Joe Scarnati (R) and State Sen. Tim Solobay (D). Scarnati is the second biggest recipient of campaign contributions from the industry, with $282,034. After opposing a severance 2005 2006 2007 2008 2009 2010 tax supported by Gov. Ed Rendell (D) in 2010, Scarnati supported Gov. Corbett’s proposal for a 1% impact fee. Yet an impact fee bill passed by the House Finance Committee in November 2011, HB 1950, appears to be a Trojan Horse for items on the industry’s wish list; the bill would forbid counties from regulating fracking on their own, and would create a system of “deluxe permitting” whereby drillers seeking permits could pay extra and receive a private review of their application. Campaign Contributions & the Rise of Gas Drilling in Pennsylvania 21 A look at contributions to candidates for Pennsylvania state government offices since 2001 tells the story of the industry’s interest in drilling the Keystone State. A May 2011 analysis by Common Cause Pennsylvania of data obtained from the Pennsylvania Department of State found $6.1 million in contributions by natural gas corporate PACs and executives to Pennsylvania candidates and parties from 2001 through 2010; contributions mushroomed beginning in 2008 as the industry came to recognize the potential profitability of Pennsylvania’s unique geographical and regulatory positioning. In-Office Officials Of the $5.1 million donated to Pennsylvania candidates since 2001, $3.38 million went to elected officials still in office in May 2011. Almost half of this amount, at $1.6 million, was donated to the campaigns of Republican Governor Tom Corbett, whose “no severance tax” campaign pledge made him the favorite of industry executives. Figure 13 Pennsylvania’s top 20 state-level recipients of fracking industry money 1 2 3 4 5 6 7 8 9 10 11 12 13 14 15 16 17 18 19 20 Name Corbett, Tom Scarnati, Joseph B., III Reed, Dave Turzai, Mike White, Donald C. Corman, Jake Smith, Samuel H. DeWeese, H. William Solobay, Timothy J. Pileggi, Dominic Piccola, Jeffrey E. Orie, Jane Clare Pyle, Jeffrey P. Metcalfe, Daryl D. Pippy, John Tomlinson, Robert M. Robbins, Robert D. Kasunic, Richard A Ellis, Brian L. Preston, Joseph , Jr. Office Governor Senate House House Senate Senate House House Senate Senate Senate Senate House House Senate Senate Senate Senate House House District 0 25 62 28 41 34 66 50 46 9 15 40 60 12 37 6 50 32 11 24 Party R R R R R R R D D R R R R R R R R D R D Enviro. Comm. yes yes subchair - Total $1,634,097 $282,034 $105,732 $79,100 $69,125 $65,640 $58,000 $53,300 $48,475 $48,250 $46,850 $39,650 $35,902 $33,100 $31,775 $31,300 $30,400 $25,250 $23,300 $22,125 Party Preference - $931,674 donated by industry to party PACs from 2001-2010 The industry heavily favored Republicans over Democrats, with $3 million going to Republican officeholders, compared to $401,000 to in-office Democrats. Republican Party PACs collected $805,450, compared to $126,125 for Democratic Party PACs. 22 No Campaign Contribution Limits Corbett benefitted especially from Pennsylvania’s lack of contributions limits, receiving single direct contributions as much as $150,000. Of the total 4,795 donations from industry PACs or executives to all Pennsylvania candidates from 2001 through 2010, 228 exceeded the $2,500 limit imposed by the Federal Elections Commission on donations to federal candidates. These 228 donations, just 5% of the total number of donations, accounted for $2,669,344, or 52% of the overall $5.1 million donated by the industry to Pennsylvania candidates. Recommendations for Pennsylvania I. II. III. IV. Contribution Limits. The current system allows big political donors to wield extraordinary influence over the political process in Pennsylvania, even as they face relatively little scrutiny, compared to many other states. Pennsylvania should limit contributions from both individuals and PAC’s to candidates for state and local offices. A recommended limit for General Assembly candidates would be $1,000 per election cycle. For statewide offices, limits should not exceed the maximums set by the Federal Election Campaign Act for federal candidates. Donors should also have an aggregate limit on contributions made to all candidates during an election cycle. A Better System of Disclosure. Pennsylvania should require all candidates to file campaign contribution reports electronically. Electronic files obtainable from the Pennsylvania Department of State are not well standardized and often are rife with typographical errors, forcing multiple searches based on name, address, and employer to ensure the complete collection of relevant data. For example, a simple search for Consol Energy should not require additional searches to discover contributions under the names Colsol, Consal, and Consoe. Due to reporting errors by campaign treasurers, the database is also rife with duplicates.18 More frequent disclosure of campaign contributions. Pennsylvania should require the quarterly disclosure of campaign contributions during non-election years. Citizens should not have to wait for as long as 12 months to learn about the influence of campaign contributions from key supporters of legislative and regulatory efforts. In election years, legislative candidates should be subjected to the same disclosure schedule as statewide candidates – adding a report due on the 6th Friday prior to an election. Ban Gifts to Elected Officials. Pennsylvania should make it illegal to give a public official more than $100 in gifts in a year and should require disclosure of all gifts given. About this report This report is made possible by the contributions of our members and by the generous support of The Park Foundation and The Woodtiger Fund. 23 24 References 1 Lustgarten, Abrahm. “Buried Secrets: Is Natural Gas Drilling Endangering U.S. Water Supplies?” ProPublica. Nov 13 2008. Web. http://www.propublica.org/feature/buried-secrets-is-natural-gas-drillingendangering-us-water-supplies-1113 2 Annual energy outlook 2011 early release overview. DOE/EIA-0383ER(2011). Energy Information Agency, U.S. Department of Energy. http://www.eia.gov/forecasts/aeo/pdf/0383er(2011).pdf 3 Maykuth, Andrew. “In PA, Rove Tells Drillers To Expect ‘Sensible Regulation.’” Philadelphia Inquirer Nov 4 2010. 4 “EPA urged to go slow on drilling regulations.” Bloomberg News. 13 Aug. 2000. Web. 5 Wilson, Weston. “Letter from EPA fracking study whistleblower Weston Wilson.” Earthworks. 8 Oct 2004. http://www.earthworksaction.org/pubs/Weston.pdf 6 Urbina, Ian. “Pressure Limits Efforts To Police Drilling for Gas.” The New York Times 3 Mar, 2011. 7 Natural Gas Caucus. Web. http://naturalgascaucus.murphy.house.gov 8 Klimasinskia, Katarzyna. “Lawmakers Oppose Gas Extraction Rules.” Tulsa World 7 Jan, 2011. 9 Committee On Financial Services, Hearing entitled “Fixing the Watchdog: Legislative Proposals to Improve and Enhance the Securities and Exchange Commission.” Thursday, September 15, 2011. 10 “ExxonMobil Tries Assuring Shareholders Fracking Is Safe.” Associated Press 26 May, 2011. 11 Memorandum. “Examining the Potential Impact of Hydraulic Fracturing.” Committee on Energy and Commerce, Chairman Henry A. Waxman. 18 Feb 2010. http://energycommerce.house.gov/Press_111/20100218/hydraulic_fracturing_memo.pdf 12 Soraghan, Mike. “Two Oil-Field Companies Acknowledge Fracking With Diesel.” The New York Times 19 Feb 2010. 13 “Emissions From Natural Gas Production in the Barnett Shale Area and Opportunities for Cost-Effective Improvements,” by Al Armendariz, Ph.D., Department of Environmental and Civil Engineering, Southern Methodist University, published July 26, 2009 14 Farr, Derek. “Sublette Nonattainment Recommended.” Sublette Examiner 18 May, 2009. 15 Vegter, Brandon. “The Lone Star Ranking.” Texas Center for Policy Studies, Fall 1999. 16 Ward, Sharon. “An Impact Fee Gift Wrapped for Drillers.” Third and State. Pennsylvania Budget and Policy Center. 4 Nov 2011. http://thirdandstate.org/2011/november/impact-fee-gift-wrapped-drillers 17 Brennan, Chris. “PA Will Have Less Campaign Finance Info On-Line.” Philadelphia Daily News. 18 February 2011 18 Duplicate contributions that appeared in the DOS database were deleted by Common Cause/PA and not included in this study. 1133 19th Street NW | Washington, D.C. 20036 | 202-833-1200 | [email protected] www.CommonCause.org | www.CommonBlog.com | Facebook.com/CommonCause | @CommonCause


© Copyright 2026