
O-tert-Butyltyrosine, an NMR Tag for High-Molecular
Article
pubs.acs.org/JACS
O-tert-Butyltyrosine, an NMR Tag for High-Molecular-Weight
Systems and Measurements of Submicromolar Ligand Binding
Affinities
Wan-Na Chen,† Kekini Vahini Kuppan,† Michael David Lee,‡ Kristaps Jaudzems,§ Thomas Huber,*,†
and Gottfried Otting*,†
†
Research School of Chemistry, Australian National University, Canberra, ACT 2601, Australia
Monash Institute of Pharmaceutical Sciences, Parkville, VIC 3052, Australia
§
Latvian Institute of Organic Synthesis, Riga 1006, Latvia
‡
S Supporting Information
*
ABSTRACT: O-tert-Butyltyrosine (Tby) is an unnatural amino acid
that can be site-specifically incorporated into proteins using
established orthogonal aminoacyl-tRNA synthetase/tRNA systems.
Here we show that the tert-butyl group presents an outstanding NMR
tag that can readily be observed in one-dimensional 1H NMR spectra
without any isotope labeling. Owing to rapid bond rotations and the
chemical equivalence of the protons of a solvent-exposed tert-butyl
group from Tby, the singlet resonance from the tert-butyl group generates an easily detectable narrow signal in a spectral region
with limited overlap with other methyl resonances. The potential of the tert-butyl 1H NMR signal in protein research is illustrated
by the observation and assignment of two resonances in the Bacillus stearothermophilus DnaB hexamer (320 kDa), demonstrating
that this protein preferentially assumes a 3-fold rather than 6-fold symmetry in solution, and by the quantitative measurement of
the submicromolar dissociation constant Kd (0.2 μM) of the complex between glutamate and the Escherichia coli aspartate/
glutamate binding protein (DEBP, 32 kDa). The outstanding signal height of the 1H NMR signal of the Tby tert-butyl group
allows Kd measurements using less concentrated protein solutions than usual, providing access to Kd values 1 order of magnitude
lower than established NMR methods that employ direct protein detection for Kd measurements.
■
INTRODUCTION
NMR spectroscopy offers structural information on biological
macromolecules at a level of detail that is unsurpassed by any
other solution method. The resolution of the solution NMR
spectrum of a large protein, however, is compromised both by
the number of NMR resonances as well as by line widths that
increase with molecular mass.1 These problems are routinely
addressed by labeling with 15N and 13C to facilitate the
recording of multidimensional NMR spectra. In addition,
perdeuteration of the protein leads to narrower NMR signals of
the remaining 1H spins, permitting in exceptional cases twodimensional (2D) NMR spectra to be recorded of protein
multimers approaching total molecular masses of 500 kDa and
beyond.2−4 In particular, methyl groups are relatively easy to
observe in such systems because methyl groups rotate rapidly,
which results in chemical shift degeneracy of the three methyl
protons and favorable 1H relaxation properties.5 It is a quite
general phenomenon that enhanced mobility produces
narrower, more easily observable NMR signals. For example,
highly flexible polypeptide segments are typically found at the
N- and C-termini of a protein and their NMR resonances can
often be observed without perdeuteration even when the
molecular weight of the system is large.6
These observations prompted us to investigate the potential
of an unnatural amino acid containing a mobile tert-butyl group.
© 2015 American Chemical Society
Methods have recently been established for the genetic
encoding of O-tert-butyltyrosine (Tby),7,8 but NMR spectra
of proteins with Tby incorporated in this way have not been
reported, although the value of monitoring the NMR signal of a
site-specifically incorporated chemical “spy” is well established.
For example, Geierstanger and co-workers have shown that the
NMR resonances of the methyl- and CF3-groups of pmethoxyphenylalanine (OMePhe) and p-trifluoromethoxyphenylalanine (OCF3Phe) can readily be observed after sitespecific incorporation at different locations of a 33 kDa
protein.9 The signals of the newly introduced 13CH3- and CF3groups were readily observed in two-dimensional (2D) 13C
HSQC and 1D 19F NMR spectra, respectively. Similarly, Mehl
and co-workers demonstrated that site-specific incorporation of
trifluoromethylphenylalanine (CF3Phe) produced 1D 19F NMR
spectra that allowed distinction of different ligand- and metalbound states in 48 and 98 kDa homodimers.10 While the 1H
NMR resonances of methyl groups are difficult to resolve
without additional labeling with 13C, the main drawback of 19F
NMR is the large chemical shift anisotropy (CSA) associated
with 19F spins which leads to broad NMR resonances. As CSA
relaxation rates increase with the square of the magnetic field
Received: February 21, 2015
Published: March 19, 2015
4581
DOI: 10.1021/jacs.5b01918
J. Am. Chem. Soc. 2015, 137, 4581−4586
Article
Journal of the American Chemical Society
strength, 19F NMR spectra are best recorded at relatively low
NMR frequencies, compromising sensitivity. In contrast, the
tert-butyl group of Tby can be observed by 1H NMR with
increasing sensitivity at increasing magnetic fields. We
hypothesized that, owing to the intensity of the methyl
resonance (corresponding to nine degenerate 1H spins) and the
decreased relaxation rate associated with a mobile, solvent
exposed tert-butyl group, its observation by high-field NMR
should be straightforward without any stable isotope labeling.
In the following we show that Tby indeed produces a 1H
NMR signal that is readily observable in proteins without
isotope labeling, including a 320 kDa system. Furthermore, we
show that the outstanding sensitivity of the tert-butyl resonance
allows its detection in dilute protein solutions, effectively
reducing the protein demand by 1 order of magnitude. Finally,
we show that Tby is an excellent probe for direct NMR
measurements of submicromolar ligand binding affinities.
■
RESULTS
Incorporation of Tby. For site-specific incorporation of
Tby into proteins, we chose the p-cyanophenylalanyl-tRNA
synthetase (pCNF-RS) evolved from the Methanocaldococcus
jannaschii tyrosyl-RS encoded in the pUltra system together
with the requisite tRNACUA for recognition of TAG stop
codons.11 Bacillus stearothermophilus (Bst) DnaB was produced
in fusion with the solubility enhancer GB1 by in vivo expression
in Escherichia coli (Supporting Information Figures S1 and
S2A), whereas Staphylococcus aureus sortase A (SrtA) and the E.
coli aspartate/glutamate binding protein (DEBP) were
produced from linear PCR amplified DNA in a cell-free system
based on an E. coli cell extract, from which the release factor 1
had been selectively removed by tagging with chitin-binding
domains and filtration over chitin (Figure S2B).12 The fusion
with GB1 did not significantly change the 1D 1H NMR
spectrum of the Bst DnaB hexamer (Figure S3A).
NMR Spectroscopy of DnaB-Tby. Figure 1A compares
the 1D 1H NMR spectrum of the mutant Tyr104Tby with the
corresponding spectrum of wild-type DnaB. As expected for a
high-molecular-weight system, the proteins display very broad
signals, whereas very narrow signals arise from buffer or lowmolecular-weight impurities. Two new signals at about 1.2
ppm, however, are observed for DnaB-Tby but not wild-type
DnaB. Their chemical shifts agree with the chemical shift of the
tert-butyl group in free Tby (1.26 ppm in 25 mM Tris-HCl, pH
7.5). The observation of two resonances is in agreement with
the two different chemical environments of the Tby site in
crystal structures of the Bst DnaB hexamer in complex with
DnaG (Figure 1B and C).13 Previous electron microscopy
studies of E. coli DnaB had reported hexamers with 3-fold and
6-fold symmetries.14−16 The observation of two, rather than
one, tert-butyl resonances identifies the 3-fold symmetry as the
symmetry prevailing for the Bst helicase in solution.
To assign the local environments which the two resonances
belong to, we introduced the additional mutations Cys253Val,
Ala303Cys, and Cys305Val to enable site-specific ligation with a
lanthanide tag at position 303. At the same time, the natural
amino acids of the protein were perdeuterated to confirm the
assignment of the tert-butyl signals. The mutations did not alter
the appearance of the tert-butyl signals (Figure 1A). Following
ligation of the cysteine residue with a C1-tag17 loaded with
Ce3+ (Figure S4A), one of the two Tby resonances broadened
significantly, assigning it to the site, which is within 15 Å of Ala
303 in the crystal structure. This result presents further
Figure 1. Conformational study of Bst DnaB helicase. (A) 1D 1H
NMR spectra of wild-type and mutant Bst DnaB. The spectra were
recorded in a buffer of 25 mM Tris-HCl, pH 7.5, 150 mM NaCl at 25
°C, using a Bruker 600 MHz NMR spectrometer. Protein
concentrations were about 20−40 μM and the total recording time
per spectrum was 0.5−2 h. (i) Wild-type DnaB. (ii) DnaB with Tby at
site 104. The tert-butyl group displays two peaks (highlighted by a
frame). Unassigned narrow signals are from impurities in the buffer.
(iii) Perdeuterated DnaB (70% deuteration) with Tby at site 104 and
containing the additional mutations Cys253Val, Ala303Cys, and
Cys305Val. The reduced intensity of the background confirms the
identification of the Tby tert-butyl resonances. (iv) Same as (iii),
except with a C1-Ce tag ligated to Cys 303. The downfield, but not the
upfield, tert-butyl peak is affected, assigning the downfield peak to the
Tby residue near residue 303 of the neighboring DnaB molecule, and
confirming that residue 104 exists in two different chemical
environments as expected for a hexamer with C3 symmetry. (B)
View of the crystal structure of the DnaB hexamer along the C3
symmetry axis (PDB: 2R6A).13 Each monomer is colored differently,
showing the N-terminal domains in a cartoon representation, while the
linker segments and the C-terminal domains are in a surface
representation. The sites of Tyr 104, which was replaced by Tby in
this work, are highlighted by red spheres. The sites of residue 303,
mutated to a cysteine for subsequent ligation with the C1-Ce tag, are
identified by yellow spheres. (C) The C1-Ce tag modeled at Cys 303
(yellow) is close to Tyr 104 in the blue monomer, but far from Tyr
104 in the green monomer in the crystal structure 2R6A. The N- and
C-terminal domains are shown in cartoon and surface representations,
respectively, as in (B). Tyr 104 is shown in red.
4582
DOI: 10.1021/jacs.5b01918
J. Am. Chem. Soc. 2015, 137, 4581−4586
Article
Journal of the American Chemical Society
confirmation that the crystal structure of the Bst hexamer
reflects its predominant three-dimensional (3D) structure in
solution.
Most importantly, the result clearly demonstrates the
possibility to detect the Tby tert-butyl resonance in systems
of high molecular mass at low concentration without any
isotope labeling. For comparison, we also incorporated a
trifluoromethyl-phenylalanine residue in position 104 and
recorded a 19F NMR spectrum at a 1H NMR frequency of
500 MHz. The line width of the 19F NMR resonance was about
160 Hz at half height and thus too broad to resolve two
different signals (Figure S5).
NMR Spectroscopy of Sortase A with Tby. Figure 2A
and B compares the 1D 1H NMR spectra obtained with the
significance of even small chemical shift changes. The inhibitor
used here (Figure S4B) is known to bind irreversibly by
formation of a covalent bond to the active-site cysteine.18 As
expected for a system with slow or no chemical exchange, the
tert-butyl resonances of the inhibitor bound and unbound states
of the protein appeared simultaneously at half-saturation
(Figure 2B). A control experiment confirmed that the dimethyl
sulfoxide (DMSO) of the inhibitor stock solution caused much
smaller chemical shift changes than the ligand (Figure S3B).
Measuring Submicromolar Dissociation Constants. E.
coli DEBP is a periplasmic transport protein that reversibly
binds aspartate or glutamate. It binds glutamate with a binding
affinity of 260 nM, as measured by isothermal calorimetry
(ITC; B. Clifton and C. J. Jackson, personal communication).
Despite the high molecular mass of the protein (32 kDa), the
tert-butyl resonance is clearly visible in the 1D 1H NMR
spectrum of the mutant Val140Tby and over 1 order of
magnitude taller than any other signal of the protein (Figure
3A). Therefore, NMR spectra of good sensitivity can be
Figure 2. Ligand binding study of S. aureus sortase A. The spectra were
recorded at 25 °C using a Bruker 800 MHz NMR spectrometer. (A)
1D 1H NMR spectra of sortase A with Tby incorporated at position
150. Top trace: 20 μM protein in 20 mM MES buffer, pH 6.5, 50 mM
NaCl, 5 mM CaCl2. Bottom trace: same as above, but without CaCl2
and with 1 mM EDTA. (B) 1D 1H NMR spectra of a sortase A/
inhibitor complex with (top) and without (bottom) calcium. The
protein concentration was 20 μM. Black: inhibitor-free state. Red: halfsaturation with inhibitor. Blue and magenta: inhibitor-bound state with
50% excess inhibitor. The inhibitor18 was added from a 5 mM stock
solution in DMSO-d6. The final concentration of DMSO in the
protein solution was always less than 1%. Arrows indicate the direction
of chemical shift change upon addition of inhibitor. (C) Cartoon
representation of sortase A (PDB: 1IJA19). Inhibitor, calcium, and the
mutation site for Tby are shown as red sticks, a white sphere, and an
orange sphere, respectively. The ligand and calcium coordinates were
taken from the PDB files 2MLM18 and 2KID,20 respectively.
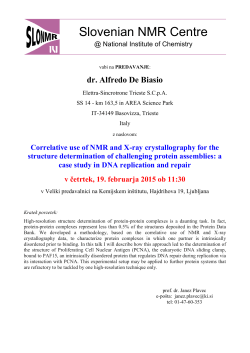
Figure 3. Binding affinity measurement of E. coli DEBP for glutamate.
The 1D 1H NMR spectra were recorded in 20 mM phosphate buffer,
pH 7.5, 100 mM NaCl at 25 °C, using a Bruker 800 MHz NMR
spectrometer. (A) NMR spectra of 50 μM solutions of DEBP. The top
and bottom traces show the spectra of the mutant with Tby at position
140 and of wild-type DEBP, respectively. The signal of the tert-butyl
group appears at about 1.24 ppm. Other narrow signals are from lowmolecular weight impurities. (B) Titration of glutamate (1 mM stock
solution in H2O) into a 2 μM solution of DEBP. The tert-butyl
resonance shifts upfield with increasing concentration of glutamate
(indicated by the arrow). Each spectrum was acquired with a total
recording time of 30 min on a 800 MHz NMR spectrometer equipped
with a cryoprobe. (C) Fit of the binding affinity curve by eq 1. For best
accuracy, the chemical shifts were determined by fitting Lorentzian line
shapes to the tert-butyl resonances in (B). Kd was calculated as 0.20
μM with a standard error of 0.08 μM.
Thr150Tby mutant of S. aureus sortase A and the effects of
calcium and inhibitor binding on the chemical shift of the tertbutyl resonance of Tby. The chemical shift of the tert-butyl
group is unusually high-field, which can be attributed to ring
current effects arising from its proximity to the side chain of
Phe 144. Despite the distance of the Tby residue from the
active site marked by Cys 184 (about 25 Å) and the calcium
binding site (about 20 Å, Figure 2C), the chemical shift of the
tert-butyl resonance was sensitive to the presence of Ca2+ or
inhibitor, or both. Therefore, the Tby residue can be used for
remote sensing of changes in the substrate binding site of the
enzyme. Although the presence of calcium causes many spectral
changes in the 1H NMR spectrum of the protein, the tert-butyl
resonance is easily picked out as the tallest resonance in the
range between 0 and 1.7 ppm (Figure 2A). The size of the
resonance greatly facilitates monitoring its chemical shift in
titration experiments, and its narrow line width magnifies the
recorded at low protein concentrations, which is a prerequisite
for determining small dissociation constants from chemical shift
changes of protein resonances. Titration of glutamate into the
protein solution indeed led to small changes in chemical shifts,
indicating fast exchange between the bound and free state of
the protein (Figure 3B).
4583
DOI: 10.1021/jacs.5b01918
J. Am. Chem. Soc. 2015, 137, 4581−4586
Journal of the American Chemical Society
■
DISCUSSION
The present work shows that tert-butyl-tyrosine is an
outstanding probe for the study of small and large proteins at
natural isotopic abundance by NMR spectroscopy. The intense
1
H NMR signal of the tert-butyl group is easily detected in onedimensional NMR spectra due to its narrow line width and
chemical shift that is well separated from the NMR resonances
of most organic buffers, the water resonance, and the usually
dominant methyl signals of valine, leucine, and isoleucine. The
system for genetic encoding of Tby is well established,7
allowing its incorporation at any site of a protein. Importantly,
the 1H chemical shift of the tert-butyl resonance is still sensitive
to changes in the chemical environment of the protein, even if
the tert-butyl group is solvent exposed. Therefore, it can be
used to monitor the state of a protein, which is of particular
interest for studies of ligand binding.
Measurements of Dissociation Constants. The results
obtained with DEBP demonstrate the outstanding advantage of
Tby for ligand binding studies, in particular for the measurement of tight binding affinities. Measurements of small
dissociation constants by direct observation of protein signals
require a protein concentration in the order of the Kd value.
The intensity of the tert-butyl resonance provides the sensitivity
required to measure dilute solutions even of large proteins.
A graphical representation of titration curves for different Kd
values illustrates the difficulty to measure dissociation constants
that are much smaller than the protein concentration (Figure
5). To obtain Kd values with reasonable accuracy, a practical
The observed chemical shift changes can be described by eq
1:
Δobs = Δmax {(Kd + L t + Pt)
1/2
− [(Kd + L t + Pt)2 − 4PL
}/(2Pt)
t t]
Article
(1)
where Δobs is the observed change in chemical shift, Δmax is the
maximal chemical shift change observed when the protein is
fully saturated with ligand, Lt and Pt are the total concentrations
of ligand and protein, respectively, and Kd is the dissociation
constant. The Kd value obtained by fitting the observed changes
in chemical shifts by eq 1 was 0.20 μM (Figure 3C), in close
agreement with the value determined by ITC measurement.
Near-Isotropic Bond Reorientation in Tby. The tertbutyl group of Tby produces an exceptionally narrow line
because of its motional freedom. When it is fully solvent
exposed, three different bond rotations contribute to the
reorientation of the C−H bonds of the methyl groups. First,
each methyl group rotates about its axis of symmetry. Second,
the tert-butyl group reorientates by rotation about the C−O
bond, that projects from the aromatic ring. Finally, the
following O−C bond to the tert-butyl group is free to rotate.
Crystal structures of compounds with tert-butyl-phenyl groups
show dihedral angles of about 90° for the C−O bond,
positioning the tert-butyl group outside the plane of the
aromatic ring (Figure 4A). Assuming dihedral angles of 90° or
Figure 4. Methyl groups of O-tert-butyl-tyrosine can change their
orientation in multiple directions. (A) Stick representation of the Otert-butyl-tyrosine residue as determined by X-ray crystallography.21
(B) Different orientations of a single methyl C−H bond produced by
rotations around bonds of the O-tert-butyl group, including dihedral
angles of 90° or 270° for the C−O bond, and 60°, −60°, or 180° for
the O−C bond and the methyl groups. The variability in the resulting
C−H bond orientations is highlighted by superimposing the carbon
atom of each of the 18 rotameric states. The carbon and hydrogen
atoms of the C−H group are represented by black and white spheres,
respectively. Some of the rotamers produce degenerate orientations.
Figure 5. Titration curves calculated for different dissociation
constants Kd. The curves were calculated using eq 1. The vertical
axis plots the saturation of the protein with ligand (ratio of bound
protein, PL, relative to total protein, Pt). The horizontal axis plots the
ratio of total ligand concentration, Lt, to total protein concentration.
The curves are labeled with the respective dissociation constants
normalized by the total protein concentration, Kd/Pt.
270° for the C−O bond, and 60°, −60°, or 180° for the O−C
bond and the methyl group rotamers, an individual C−H group
of a methyl can access 2 × 3 × 3 = 18 different rotameric states.
Assuming equal probability of each dihedral angle combination
owing to unrestricted motions of a solvent-exposed tert-butyl
group, the C−H bond populates a remarkably isotropic
distribution of orientations (Figure 4B). As a measure of the
degree of isotropy, concatenation of all C−H bond vectors
produced by the 18 rotameric states yields a sum vector of a
length of only about 1 Å. Although each rotamer may be
associated with different opportunities for dipole−dipole
relaxation depending on the location of other protein protons
in the vicinity, the remarkably slow relaxation of the tert-butyl
resonance is fundamentally due to its exceptionally high degree
of mobility.
recommendation is to aim for protein concentrations that
produce saturation ratios of ligand-bound protein to total
protein between 0.2 and 0.8, when ligand and protein are
present in 1:1 ratio.22 Figure 5 shows that this condition is
fulfilled for Kd values that are 10 times smaller than the protein
concentration, but not if they are 100 or 1000 times smaller
(see also Figure S6). Therefore, the measurement of
submicromolar Kd values requires the ability to measure at
protein concentrations in the low micromolar range. Such low
concentrations pose a serious challenge in sensitivity for
contemporary NMR spectrometers, especially if the NMR
resonances of the protein are broad due to high molecular
weight or chemical exchange broadening. As a result, NMR
4584
DOI: 10.1021/jacs.5b01918
J. Am. Chem. Soc. 2015, 137, 4581−4586
Article
Journal of the American Chemical Society
hexamer by the selective line broadening observed for one of
the signals, when an intermonomer contact with a paramagnetic
tag was produced in a cysteine mutant of the protein. The C1tag is a cyclen-based lanthanide-binding tag designed to induce
pseudocontact shifts (PCS). In the case of the Bst DnaB mutant
with Tby residue and C1-Ce tag, the observation of line
broadening rather than PCS can be attributed to paramagnetic
relaxation enhancement, which becomes more severe with
increasing molecular weight,27 or to reduced motional freedom
of the tert-butyl group due to interactions with the tag. For
protein systems of lower molecular mass, where the tert-butyl
signal is more readily observable, it will be possible to use a
lanthanide tag to gain further structural information by
inducing pseudocontact shifts in the tert-butyl resonances of
Tby residues positioned at different sites of the protein.
spectroscopy is traditionally regarded as a unique tool for
detecting complexes with weakly binding ligands, whereas Kd
values much smaller than about 10 μM are practically
inaccessible by direct observation of protein resonances even
in the case of small proteins,23 let alone proteins of the
molecular mass of DEBP. The exceptional peak height of the
1
H NMR resonance of the tert-butyl group of Tby changes this
situation and lowers the detection limit by more than an order
of magnitude. In principle, ligand detected competition
experiments are a viable alternative for determining nanomolar
binding affinities by NMR spectroscopy, but these experiments
are less straightforward than the direct monitoring of an NMR
resonance of the target protein in a protein observed
experiment because they require the availability of an
additional, different ligand, for which the dissociation constant
must be determined independently.24
Tight binding affinities are invariably associated with slow
dissociation rates, as the dissociation constant can be calculated
from the ratio of dissociation versus association rates and
diffusion poses an upper limit on the rate of complex formation.
In the limit of slow chemical exchange between bound and free
protein, separate NMR signals are observed and eq 1 no longer
applies. Importantly, however, the limit between the fast and
slow chemical exchange regimes depends on the frequency
difference of the NMR resonances in the respective states, with
small frequency differences extending the fast exchange regime
to slower exchange rates. For the measurement of small
dissociation constants, it is thus an advantage if the NMR signal
which is monitored displays only small chemical shift changes
upon titration with ligand, as in the case of a solvent-exposed
tert-butyl group. As the examples of sortase A and DEBP show,
the narrow line shape of the 1H NMR resonance of the tertbutyl group of Tby permits accurate measurements also of
small changes in chemical shift, allowing the positioning of the
Tby probe sufficiently far from the ligand binding site to avoid
any interference with ligand binding. In practice, we found that
narrow NMR signals from buffer or low-molecular weight
impurities provide excellent internal controls to confirm the
accurate alignment of the NMR spectra recorded in a titration
experiment.
Tby as a Probe in High-Molecular-Weight Systems.
Established strategies for solution NMR spectroscopy of highmolecular weight systems employ isotope labeling strategies, in
particular per-deuteration to reduce dipolar relaxation rates of
the remaining 1H spins.25,26 Selective labeling or unlabeling of
all amino acid residues of a certain type, however, usually labels
more than a single site, making it challenging to obtain sitespecific information. In contrast, the incorporation of a single
unnatural amino acid naturally produces a label at a
predetermined site, which is defined by the amber stop
codon placed in the gene of interest.
In the case of Bst DnaB, the Tby probe positioned at a
solvent exposed site of the N-terminal domain of the protein
not only revealed clear 1H NMR resonances of the tert-butyl
group, but also provided clear evidence for the C3 symmetry of
the hexamer as two different chemical environments of the tertbutyl group were apparent. Considering the molecular mass of
the hexamer (320 kDa), it is remarkable that this could be
achieved without isotope labeling, highlighting the substantial
line narrowing associated with a mobile tert-butyl group of Tby.
Once a site-specific signal can be observed, it offers a
convenient probe for further structural analysis. In the case of
Bst DnaB we were able to verify the crystal structure of the
■
CONCLUSION
In conclusion, the Tby probe offers superior sensitivity in 1H
NMR spectra, which makes larger and less soluble proteins
amenable to NMR analysis than hitherto possible. The NMR
signal of the tert-butyl group can be observed with minimal
interference from the protein background. The robustness with
which the tert-butyl group can be detected also in the presence
of large concentrations of buffer and ligands could be enhanced
further by 13C labeling. While, in principle, isotope labels can be
deployed to study wild-type proteins, the introduction of a Tby
residue requires a point mutation. Notably, however, the
capacity to study proteins without perdeuteration is important
too, as perdeuterated proteins can be significantly less stable
than their unlabeled forms, which can result in slightly different
structures.28,29 Unlabeled Tby is commercially available and
inexpensive. We anticipate that the Tby probe will become an
extremely valuable tool in structural biology and drug discovery.
■
ASSOCIATED CONTENT
S Supporting Information
*
Figures illustrating the DnaB construct used, the production of
full-length versus truncated protein, the effect of cleaving GB1
from DnaB, the effect of DMSO on tert-butyl group chemical
shifts, the chemical structures of the C1-Ce tag and the sortase
A inhibitor, 1D 19F NMR spectra of trifluoromethyl-phenylalanine labeled DnaB, a glutamate binding affinity measurement
performed with 10 μM DEBP, and the nucleotide sequence of
the construct of E. coli DEBP. This material is available free of
charge via the Internet at http://pubs.acs.org.
■
AUTHOR INFORMATION
Corresponding Authors
*[email protected]
*[email protected]
Notes
The authors declare no competing financial interest.
■
ACKNOWLEDGMENTS
We thank Prof. Nicholas E. Dixon for helpful discussions on
DnaB, Prof. Peter G. Schultz for the pEVOL and pUltra vector
with the p-cyano-Phe-tRNA synthetase, Dr. Bim Graham for
the C1-Ce tag, and Dr. Colin J. Jackson for an expression
system of wild-type DEBP. W.-N.C. thanks the government of
the People’s Republic of China for a CSC scholarship. Financial
support by the Australian Research Council is gratefully
acknowledged.
4585
DOI: 10.1021/jacs.5b01918
J. Am. Chem. Soc. 2015, 137, 4581−4586
Article
Journal of the American Chemical Society
■
REFERENCES
(1) Ryabov, Y. E.; Geraghty, C.; Varshney, A.; Fushman, D. J. Am.
Chem. Soc. 2006, 128, 15432−15444.
(2) Fiaux, J.; Bertelsen, E. B.; Horwich, A. L.; Wüthrich, K. Nature
2002, 418, 207−211.
(3) Sprangers, R.; Kay, L. E. Nature 2007, 445, 618−622.
(4) Mas, G.; Crublet, E.; Hamelin, O.; Gans, P.; Boisbouvier, J. J.
Biomol. NMR 2013, 57, 251−262.
(5) Rosenzweig, R.; Kay, L. E. Annu. Rev. Biochem. 2014, 83, 291−
315.
(6) Ozawa, K.; Horan, N. P.; Robinson, A.; Yagi, H.; Hill, F. R.;
Jergic, S.; Xu, Z.-Q.; Loscha, K. V.; Li, N.; Tehei, M.; Oakley, A. J.;
Otting, G.; Huber, T.; Dixon, N. E. Nucleic Acids Res. 2013, 41, 5354−
5367.
(7) Young, D. D.; Young, T. S.; Jahnz, M.; Ahmad, I.; Spraggon, G.;
Schultz, P. G. Biochemistry 2011, 50, 1894−1900.
(8) Wang, Y.-S.; Fang, X.; Wallace, A. L.; Wu, B.; Liu, W. R. J. Am.
Chem. Soc. 2012, 134, 2950−2953.
(9) Cellitti, S. E.; Jones, D. H.; Lagpacan, L.; Hao, X.; Zhang, Q.; Hu,
H.; Brittain, S. M.; Brinker, A.; Caldwell, J.; Bursulaya, B.; Spraggon,
G.; Brock, A.; Ryu, Y.; Uno, T.; Schultz, P. G.; Geierstanger, B. H. J.
Am. Chem. Soc. 2008, 130, 9268−9281.
(10) Jackson, J. C.; Hammill, J. T.; Mehl, R. A. J. Am. Chem. Soc.
2007, 129, 1160−1166.
(11) Chatterjee, A.; Sun, S. B.; Furman, J. L.; Xiao, H.; Schultz, P. G.
Biochemistry 2013, 52, 1828−1837.
(12) Loscha, K. V.; Herlt, A. J.; Qi, R.; Huber, T.; Ozawa, K.; Otting,
G. Angew. Chem., Int. Ed. 2012, 51, 2243−2246.
(13) Bailey, S.; Eliason, W. K.; Steitz, T. A. Science 2007, 318, 459−
463.
(14) San Martin, M. C.; Stamford, N. P. J.; Dammerova, N.; Dixon,
N. E.; Carazo, J.-M. J. Struct. Biol. 1995, 114, 167−176.
(15) Yu, X.; Jezewska, M. J.; Bujalowski, W.; Egelman, E. H. J. Mol.
Biol. 1996, 259, 7−14.
(16) San Martin, C.; Radermacher, M.; Wolpensinger, B.; Engel, A.;
Miles, C. S.; Dixon, N. E.; Carazo, J.-M. Structure 1998, 6, 501−509.
(17) Graham, B.; Loh, C. T.; Swarbrick, J. D.; Ung, P.; Shin, J.; Yagi,
H.; Jia, X.; Chhabra, S.; Pintacuda, G.; Huber, T.; Otting, G.
Bioconjugate Chem. 2011, 22, 2118−2125.
(18) Zhulenkovs, D.; Rudevica, Z.; Jaudzems, K.; Turks, M.;
Leonchiks, A. Bioorg. Med. Chem. 2014, 22, 5988−6003.
(19) Ilangovan, U.; Ton-That, H.; Iwahara, J.; Schneewind, O.;
Clubb, R. T. Proc. Natl. Acad. Sci. U. S. A. 2001, 98, 6056−6061.
(20) Suree, N.; Liew, C. K.; Villareal, V. A.; Thieu, W.; Fadeev, E. A.;
Clemens, J. J.; Jung, M. E.; Clubb, R. T. J. Biol. Chem. 2009, 284,
24465−24477.
(21) Goldup, S. M.; Pilkington, C. J.; White, A. J. P.; Burton, A.;
Barrett, A. G. M. J. Org. Chem. 2006, 71, 6185−6191.
(22) Fielding, L. Prog. NMR Spectrosc. 2007, 51, 219−242.
(23) Marti, D. N.; Hu, C.-K.; An, S. S. A.; von Haller, P.; Schaller, J.;
Llinás, M. Biochemistry 1997, 36, 11591−11604.
(24) Dalvit, C.; Fasolini, M.; Flocco, M.; Knapp, S.; Pevarello, P.;
Veronesi, M. J. Med. Chem. 2002, 45, 2610−2614.
(25) Gardner, K. H.; Kay, L. E. Annu. Rev. Biophys. Biomol. Struct.
1998, 27, 357−406.
(26) Lu, K.; Miyazaki, Y.; Summers, M. F. J. Biomol. NMR 2010, 46,
113−125.
(27) Otting, G. J. Biomol. NMR 2008, 42, 1−9.
(28) Hattori, H.; Crespi, H. L.; Katz, J. J. Biochemistry 1965, 4, 1213−
1225.
(29) Piszczek, G.; Lee, J. C.; Tjandra, N.; Lee, C.-R.; Seok, Y.-J.;
Levine, R. L.; Peterkofsky, A. Arch. Biochem. Biophys. 2011, 507, 332−
342.
4586
DOI: 10.1021/jacs.5b01918
J. Am. Chem. Soc. 2015, 137, 4581−4586


© Copyright 2026