
Comm missione ed Pape er: Heal
nuf Masssachusettts G General Hospitall Harvard Medicaal Schoo ol Comm missione ed Pape er: Heallthcare Disparities Measureme ent 11 July 19, 201 Joel S. Weissman W n, PhD Jose eph R. Be etancourt, MD, MPH H Ale exander R. R Green, M MD, MPH H Gregg G S. Meyer, M MD D, MSc As swita Tan n-McGroryy, MSPH Jaco ob D. Nudel Jessica A. A Zeidma an, MD J. Emilio Carrillo, C MD D, MPH This T work wa as sponsore ed by the Na ational Qualitty Forum 1 DRAFT – DO NOT CIITE, QUOTE, O OR REPRODU UCE MEMBER comments d due Sept. 7, 2 2011, 6:00 PM M ET; PUBLIC COMMENTS due Aug. 31,, 2011, 6:00 P PM ET TABLE OF CONTENTS Executive Summary ................................................................................................................................... 4 1. Background: Disparities and Quality Measurement ................................................................................................................................................................... 10 0 2. Data Collection: Building the Foundation ................................................................................................................................................................... 12 2 2.a. Categories, Methods, and Modes of Data Collection ..................................................................... 122 2.a.i. Race/Ethnicity Categories ........................................................................................................ 122 2.a.ii. Language Categories ............................................................................................................... 133 2.a.iii. Ethnic Granularity and Multi-racial Categories and Other Key Issues ................................. 133 2.a.iv. Data Collection Methods and Training .................................................................................. 144 2.b. Interim Methods for Race/Ethnicity Data when Direct Self-Reports are not Feasible .................. 155 2.b.i. Challenges Faced by Health Plans ........................................................................................... 155 2.b.ii. Indirect Estimation Methods ................................................................................................. 166 2.c. Looking Towards the Future .......................................................................................................... 188 3. Disparities Measures and Indicators: What to Measure? ................................................................................................................................................................... 22 2 3.a. Criteria for Disparities-Sensitive Measure Selection Among the NQF Portfolio of Endorsed Standards and Measures ............................................................................................................... 222 3.a.i. Step 1: Assess the portfolio of NQF performance Measures Using Disparities-Sensitive Principles, with Special Emphasis on Quality Gap and Prevalence ....................................... 232 3.a.ii. Step 2: Apply New Criteria for Disparities Sensitivity .......................................................... 243 3.b. Categories and Characteristics of Disparities-Sensitive Measures .................................................. 25 3.b.i. Practitioner Performance Measures ........................................................................................... 25 3.b.ii. Consumer Surveys that Measure the Patient Experience ......................................................... 26 3.b.iii. Hospital, Ambulatory Care Center, Home Health Nursing Home Performance Measures ..... 26 3.b.iv. Measures of Ambulatory Care-Sensitive Conditions and Management .................................. 27 3.b.v. Measures Associated with Cultural Competency ..................................................................... 28 3.b.vi. Patient-Centered Measures ...................................................................................................... 29 3.c. Step 3: Developing New Disparities-Specific Measures ................................................................ 29 3.c.i. Disparities-Specific Measures ................................................................................................... 30 3.c.ii. Disparities that may Occur Along the Clinical Pathway .......................................................... 30 3.c.iii. Summary and Recommendations ............................................................................................ 31 4. Methodological Approaches to Disparities Measurement: How to Measure and Monitor .................... 32 4.a. Overview .......................................................................................................................................... 32 4.b. Reference Points ............................................................................................................................ 343 4.c. Absolute Versus Relative Disparities, and Favorable Versus Adverse Measures .......................... 34 4.d. Paired Comparisons Versus Summary Statistics ............................................................................ 37 4.e. Normative Judgments About Disparity Measures............................................................................ 38 4.f Research Resources for Disparity Measurement .............................................................................. 39 4.g. Interaction Effects ........................................................................................................................... 40 4.h. Sample Size Considerations ............................................................................................................ 41 4.i. Risk Adjustment and Stratification ................................................................................................... 44 4.i.i. Risk Adjusting Overall Quality Metrics for Race/Ethnicity ....................................................... 45 2 DRAFT – DO NOT CITE, QUOTE, OR REPRODUCE MEMBER comments due Sept. 7, 2011, 6:00 PM ET; PUBLIC COMMENTS due Aug. 31, 2011, 6:00 PM ET 4.i.ii. Risk Adjusting Racial/Ethnic Disparities for Socioeconomic and Other Contributory Factors ................................................................................................ 48 4.j. Disparities Between and Within Providers (Geographic Variation): ................................................ 52 4.k. Summary Table ................................................................................................................................ 53 5. Priorities and Options for Quality Improvement and Public Reporting of Healthcare Disparities ........ 55 5.a. What Should be Achieved from Disparities Measurement? ........................................................... 55 5.b. What Should be Avoided? Challenges in Program Design and the Potential for Unintended Consequences................................................................................................................................. 55 5.c. What Measures Should be Selected?............................................................................................... 59 5.d. Current Practices and Real-World Lessons..................................................................................... 60 5.d.i. Federal and State Government ................................................................................................... 60 5.d.ii. Health Plans .............................................................................................................................. 62 5.d.iii. Hospitals .................................................................................................................................. 63 5.e. Policy and Dissemination Considerations ....................................................................................... 65 Appendix I—NQF Measures Cross-Walked with AHRQ’s National Healthcare Disparities and Quality Report ................................................................................................................... 69 Appendix II—Sample Analysis of NQF Endorsed Measures for Sensitivity to Disparities...................... 72 References .................................................................................................................................................. 73 Tables and Figures Table 1. Comparing Population Estimates Using Self-Report vs RAND Indirect Estimation in Health Plan of 2 Million ...................................................................................... 177 Table 2. Comparing Disparities from Self-Report vs RAND Indirect Method in a Health Plan of 2 Million ...................................................................................................... 177 Table 3. Practitioner Performance Measure .............................................................................................. 265 Table 4. Consumer Surveys that Measure the Patient Experience.............................................................. 26 Table 5. Hospital, Ambulatory Care Center, Home Health Nurse Home Performance Measures ............. 27 Table 6. Measures of Ambulatory Care-Sensitive Conditions Management .............................................. 27 Table 7. Measures Associated with Cultural Competency ......................................................................... 28 Table 8. Patient Centered Measures ............................................................................................................ 29 Table 9. Measures of Absolute and Relative Health Disparity ................................................................... 40 Table 10. Predictors of Referral for Cardiac Catheterization* ................................................................... 41 Table 11. Racial Frequencies in the 2006 National Health Interview Survey ............................................ 42 Table 12. Pros and Cons of Options for Dealing with Insufficient Sample Sizes ...................................... 43 Table 13. Summary Table of Recommendations for Measuring and Monitoring Disparities .................... 53 Figure 1. IOM Recommended Categories .................................................................................................. 20 Figure 2. Persons Reporting Multiple Races .............................................................................................. 21 Figure 3. Distribution of Multiple Races .................................................................................................... 21 Figure 4. Access to Renal Transplantation ................................................................................................. 31 Figure 5. Measure Selection/Development Algorithm ............................................................................... 32 Figure 6. Percentage of Blacks and Whites Failing to Receive Test .......................................................... 35 Figure 7. Trends in Prostrate Cancer among Black and White Males, and Percentage Change in Black-White Ratio and Rate Difference .................................................................... 36 Figure 8. Income and Disparities ................................................................................................................ 50 Figure 9. Income and Disparities ................................................................................................................ 51 Figure 10. Possible Unintended Effects of QI Programs ............................................................................ 58 3 DRAFT – DO NOT CITE, QUOTE, OR REPRODUCE MEMBER comments due Sept. 7, 2011, 6:00 PM ET; PUBLIC COMMENTS due Aug. 31, 2011, 6:00 PM ET 1 EXECUTIVE SUMMARY 2 3 4 5 The purpose of this report is to: (1) provide guidance to a National Quality Forum (NQF) Steering Committee charged with the selection and evaluation of disparity-sensitive quality measures, (2) describe methodological issues with disparities measurement, and (3) identify cross-cutting measurement gaps in disparities. 6 7 8 9 10 11 12 13 14 15 16 17 18 19 20 21 22 1. Background: Disparities and Quality Measurement The Institute of Medicine (IOM) reports Crossing the Quality Chasm and Unequal Treatment highlight the critical nexus between improving quality and eliminating racial and ethnic disparities in healthcare. Racial and ethnic minorities and people with limited English proficiency (LEP) often receive lower quality of care. The ability of hospitals, health plans, and other healthcare organizations to identify and address disparities hinges on effective collection of patient demographic data that captures race, ethnicity, language, and income. This information, however, is often not collected by providers and, when collected, is rarely analyzed to examine disparities in quality of care. We note here that some analysts differentiate between “health disparities” and “healthcare disparities.” The former usually refers to differences in health status or health outcomes, which may be difficult to attribute to individual providers. In this report we focus on disparities in healthcare, defined by the IOM as “racial and ethnic differences in the quality of healthcare that are not due to access related factors or clinical needs, preferences, and appropriateness of intervention.”1 23 24 25 26 27 28 29 30 2. Data Collection: Building the Foundation The Office of Management and Budget’s (OMB) basic racial/ethnic categories (i.e., White, Black, Asian, American Indian/Alaskan Native, Native Hawaiian/Other Pacific Islander),should be supplemented by additional questions that identify subgroups within each group to capture better the unique experiences of smaller populations within each major category (e.g., the category “Asian” encompasses people of Japanese, Indian, Laotian, etc., origin). Additionally, people should be able to identify as multiracial, a group that should not be considered homogenous but rather should be divided into subgroups based on the component identities. 31 32 33 34 35 36 37 38 39 To assess language proficiency and preference, we endorse the approach proposed by the IOM’s Subcommittee on Standardized Collection of Race/Ethnicity Data for Healthcare Quality Improvement (the “IOM Subcommittee”) in conjunction with the Committee on Future Directions for the National Healthcare Quality and Disparities Report, which recommends using two types of questions to assess both proficiency and preferred language for medical encounters—“Spoken English language proficiency” and “Spoken language preferred for healthcare.” Because of the great degree of variability in the languages spoken in different parts of the country, local and regional providers are best positioned to develop a response list relevant to their area. 4 DRAFT – DO NOT CITE, QUOTE, OR REPRODUCE MEMBER comments due Sept. 7, 2011, 6:00 PM ET; PUBLIC COMMENTS due Aug. 31, 2011, 6:00 PM ET 40 41 42 43 44 45 46 47 48 49 50 51 52 53 54 55 56 57 58 59 60 61 62 Information on race, ethnicity, and language should be obtained by self-report. However, these data are not widely available. In particular, although they are uniquely positioned to track disparities in ambulatory care, insurance plans have limited ability to obtain self-identified race and ethnicity due to minimal contact with enrollees, limits by some states that prohibit insurers from requesting such information from applicants, enrollee reluctance to disclose, and member turnover. When self-report data are not available, estimations using a combination of geo-coding and surname analysis should be used. Recommendation: Directly reported race/ethnicity and language (self-identified) is the preferred method for data collection. Efforts should be taken to solidify and support the infrastructure for race, ethnicity, and language proficiency data collection from patients/members within all healthcare settings. There is clear guidance from IOM/NQF/HRET that should be followed for self-reports (the gold standard). Where not feasible in the short term, indirect estimation can be put into place immediately. In considering the future collection of information on race, ethnicity, and language, several considerations should be taken into account. First, as legislation increasingly requires the reporting of this information, it will be more widely available; and as the use of electronic health records continues to spread, obtaining and sharing this information among different levels of the health system may make measuring disparities more efficient. However, during this time of transition, there also is the possibility that because of their generally more limited access to resources, providers who care for large numbers of minority and LEP patients will lag behind providers of less diverse populations in their ability to collect this information and analyze health outcomes and quality measures by it. 63 64 65 66 67 68 69 70 71 72 73 74 75 3. Disparities Measures and Indicators: What to Measure? NQF has previously developed a set of criteria to determine whether a quality measure would qualify as “disparities sensitive.” Disparities-sensitive measures are those that serve to detect not only differences in quality across institutions or in relation to certain benchmarks, but also differences in quality among populations or social groupings (race/ethnicity, language, etc.). The NQF portfolio of endorsed standards and measures includes more than 700 performance measures of quality of care for both ambulatory and institution-based settings, including diseasespecific measures and cross-cutting measures that apply across disease areas. None of these measures was designed specifically with the idea of detecting disparities in care by race/ethnicity or language. However, as a broad assessment of quality of care, it is reasonable to assume that some of these measures would be more sensitive to disparities in care than others. We envision identifying current and potential disparities-sensitive measures as a three--step process (below). 5 DRAFT – DO NOT CITE, QUOTE, OR REPRODUCE MEMBER comments due Sept. 7, 2011, 6:00 PM ET; PUBLIC COMMENTS due Aug. 31, 2011, 6:00 PM ET 76 77 78 79 80 81 82 83 84 4. Metho odologicall Approach hes to Disp parities Me easuremen nt: How to Measure/Monitor? ? n addition to o the choice of o race/ethniicity measurres to use, hoow data are aanalyzed andd In reported can impact the t identificaation and peerception of ddisparities. W We discuss sseveral issuees around th he mathemattical analysiss of disparitiies in healthccare. These issues includde a selectioon of referencee point, samp ple size conssiderations, reporting r rellative versuss absolute diffferences in care, and adjussting results by demograaphic case mix m versus strratifying resuults by demoographic characterristics, amon ng others. 85 86 87 88 89 90 91 92 93 94 95 96 97 98 99 100 Whether W to reeport relativee or absolutee differencess in care or ffavorable or unfavorable events sh hould be deteermined in th he context of the measurre, but neitheer approach is universallly superior for each outtcome of inteerest. Summ mary statisticss may be useed when grouups are arbitrarily y defined orr when sample size of on ne group is vvery small, but should otherwise generally y be avoided d in favor of paired p comp parisons becaause of the m many non-traansparent characterristics of the statistic. To o circumventt this, we reccommend a ffew strategiees, includingg combinin ng smaller grroups into brroader categ gories, (i.e., uusing the OM MB categoriees instead off measuress of greater granularity) g and using co omposite quaality measurres. In additiion, when ussed for qualitty improvem ment and not necessarily for high-stakkes reporting, it may be valuable to providerss to analyze even small samples s for disparities d inn case it sugggests practicce patterns thhat, while nott statistically y significant, are opportu unities for im mprovement.. We also weeigh the pross and cons of risk adjustmeent versus strratification by b race/ethniicity, and LE EP, and recoommend thatt the ultimate use of the measurement m be used to guide g selecti on of one appproach overr the other. W We recommeend that strattified models of race/eth hnicity shoulld not be adjuusted for soccioeconomicc status (SE ES) Howeveer, payment systems s also o should connsider risk addjusting paym ments to providerss, while hold ding them acccountable fo or equitable performancee. 6 DRAFT – DO NOT CIITE, QUOTE, O OR REPRODU UCE MEMBER comments d due Sept. 7, 2 2011, 6:00 PM M ET; PUBLIC COMMENTS due Aug. 31,, 2011, 6:00 P PM ET 101 102 103 104 105 106 107 108 109 110 111 112 113 114 115 116 117 118 119 120 121 122 123 124 125 126 127 128 129 130 131 132 133 Recommendations: Whereas some organizations consider any differences in quality to be evidence of a disparity, in this report we believe that for purposes of achieving equity in healthcare that is fair and just, the choice of the reference group should always be the historically advantaged group. The choice of a disparity measure can lead to different interpretations when making comparisons over time or among providers. Therefore, both absolute and relative statistics should be calculated, and if they lead to conflicting conclusions, both should be presented, allowing the readers to make their own interpretation. Public reporting of disparities should calculate statistics using both favorable and adverse events. If the results are notably different, both statistics should be reported, allowing the reader to judge the importance by taking the context of the report into consideration. Because most summary measures of disparities lack “directionality,” great care must be taken before using them to track disparities. Paired comparisons using the historically advantaged group as the reference point should be checked to see if a positive finding from the summary statistic reflects superior care received by the disadvantaged group. If so, the context of the report and relevant policy goals need to be explicitly considered. When clear differences in quality exist by racial/ethnic substrata, further stratification of results will serve to highlight areas of the greatest potential for intervention. Stratification by race/ethnicity and primary language should be performed when there are sufficient data to do so. Risk adjustment may be appropriate when performance is highly dependent on community factors beyond a provider’s control. 134 135 136 137 138 139 Performance reports stratified by race/ethnicity should not be risk adjusted by SES or other contributory factors, and instead could optionally be stratified by SES if the data permit. 5. Priorities and Options for Quality Improvement and Public Reporting of Healthcare Disparities 7 DRAFT – DO NOT CITE, QUOTE, OR REPRODUCE MEMBER comments due Sept. 7, 2011, 6:00 PM ET; PUBLIC COMMENTS due Aug. 31, 2011, 6:00 PM ET 140 141 142 143 144 145 146 147 148 149 150 151 Disparities measurement should achieve generally the same aims as overall quality measurement, that is, to monitor progress, inform consumers and purchasers, stimulate competition, and stimulate innovation. Short case studies of government initiatives, organizations, and institutions that have begun to collect, analyze, and report disparities on quality measures illustrate the incipient progress that is attainable and provide valuable lessons. Massachusetts in particular has been at the forefront of disparities measurement and reduction, experiencing both progress and setbacks. As discussed above, health plans face several barriers to collecting demographic information. Very large plans may not have the resources to invest in collecting these data given the limited contact they have with their large number of enrollees, although smaller plans may have the ability to do so. A few hospitals have begun to construct “dashboards” or disparities reports that display disparities in outcomes for a few standardized measures, and to use these to develop targeted interventions to reduce disparities. 152 153 154 155 156 157 158 159 At the same time, challenges exist in program design due to the potential for unintended consequences, such as the following: 1) minority patients tend to have poorer outcomes than majority patients; 2) hospitals with high numbers of minority patients could be disadvantaged in high-stakes incentive programs; 3) “teaching to the test” may result in the inappropriate provision of services to patients; 4) “color–blind” quality improvement programs could fail to reduce disparities if minority patients do not benefit from them to the same degree as majority patients; and 5) reducing the disparity in situations in which differences can be traced by inappropriate overuse by the majority population would not improve the overall quality of care. 160 161 162 163 164 165 166 Disparities measurement is undoubtedly an area that will grow in the coming years. To date, regulating bodies and federal and state legislative efforts are fostering the collection of race, ethnicity, and language proficiency data as a precursor to measurement efforts that will allow us to monitor quality and equity of care across the nation and perhaps design programs to encourage their reduction. To avoid unintended consequences, a number of design features should be considered as either alternatives to, or more likely, supplements to be used in combination with, standard components. Among these are: 167 168 169 170 Using payment for improvement (versus payment to achieve quality benchmarks or thresholds). The Centers for Medicare & Medicaid Services (CMS) ValueBased Payment program, for example, uses a mix of achievement (median), benchmark (90th percentile) and improvement thresholds. 171 172 Paying for performance based on lower racial/ethnic disparities (versus paying for higher-quality performance applied generally to all patients). 173 174 175 Conducting special studies that monitor for potential unintended consequences, such as increased difficulty accessing care or adverse financial impacts on safety net providers. 8 DRAFT – DO NOT CITE, QUOTE, OR REPRODUCE MEMBER comments due Sept. 7, 2011, 6:00 PM ET; PUBLIC COMMENTS due Aug. 31, 2011, 6:00 PM ET 176 177 Paying for performance focused on improving quality of care for minority populations. 178 Exception reporting (as used in the United Kingdom). 179 180 181 Quality improvement efforts targeting safety net providers and high-minority providers (and directing supplemental resources to those providers including the sharing of best practices). 182 183 Assessing structural characteristics of providers until more evidence-based process and outcome measures are developed. 184 185 186 187 188 189 One option that has not appeared in the literature to our knowledge is the idea of risk adjusting payments to providers rather than risk adjusting performance measures. Such an approach recognizes the greater resource needs of providers to reach populations with multiple social disadvantages. Once these resources are available, it may then be more reasonable to hold all providers to the same quality performance standards applied to everyone without risk adjustment. 190 191 192 193 194 195 196 The development of a standardized and comprehensive set of disparities-sensitive measures that are used across the healthcare continuum is essential in enabling meaningful comparison of equality among providers, institutions, health plans, and regions. While these are being developed, existing measures should be stratified using modifications of the Office of Management and Budget (OMB) categories and examined for disparities in care. As we move forward, what level disparities are measured on and how this information will be used and reported remains to be determined. 197 198 9 DRAFT – DO NOT CITE, QUOTE, OR REPRODUCE MEMBER comments due Sept. 7, 2011, 6:00 PM ET; PUBLIC COMMENTS due Aug. 31, 2011, 6:00 PM ET 199 1. Background: Disparities and Quality Measurement 200 201 202 203 204 205 206 207 208 209 The Institute of Medicine (IOM) reports Crossing the Quality Chasm and Unequal Treatment highlight the critical nexus between improving quality and eliminating racial and ethnic disparities in healthcare.1, 3 Unequal Treatment found that even with the same insurance and socioeconomic status—and when comorbidities, stage of presentation, and other confounders are controlled for—racial and ethnic minorities often receive a lower quality of healthcare than do their white counterparts. In sum, racial and ethnic disparities in healthcare may be characterized as poorer-quality care for minorities that are not due to access-related factors, patient preferences, or clinical needs or appropriateness of the intervention.1 Disparities populations include Blacks/African-Americans, Hispanics/Latinos, Asian/Pacific Islanders, Native Americans/Alaska Natives, and persons with Limited English Proficiency (LEP).2 210 211 212 213 214 215 216 217 Crossing the Quality Chasm suggests that to truly achieve quality care, healthcare systems must, among other things, be equitable. Equity is achieved by providing care that is free from disparities and does not vary by personal characteristics such as race, ethnicity, gender, geographic location, and socioeconomic status. Over the past few years, there has been an increased focus on improving quality, eliminating disparities, and achieving equity. These efforts have intensified as research has shown that racial and ethnic disparities in healthcare, and their root causes, have an impact on quality, safety, cost, patient experience, and risk management. For example: 218 219 220 Patients with LEP and racial/ethnic minorities are more likely than their Englishspeaking white counterparts to suffer from adverse events, and these adverse events tend to have greater clinical consequences.4-6 221 222 223 224 Communication problems are the most frequent cause of serious adverse events (as recorded in the Joint Commission database) and arise due to language barriers, cultural differences, and low health literacy, all of which are particularly important issues for racial/ethnic minority patients.5 1 Some analysts differentiate between “health disparities” and “healthcare disparities.” The former usually refers to differences in health status or health outcomes, which may be difficult to attribute to individual providers. Disparities in healthcare are defined by the IOM as “racial and ethnic differences in the quality of healthcare that are not due to access related factors or clinical needs, preferences, and appropriateness of intervention.”1 2 For the purpose of this work, we are focusing on disparities measures that compare racial, ethnic, and linguistic minorities with the majority population. Although we acknowledge that there are other vulnerable groups that should be considered “disparities populations”—such as women, the disabled, and lesbian/gay/bisexual/transgender (LGBT) individuals, among others—we are concentrating our efforts on the aforementioned groups because (1) the evidence on racial/ethnic disparities is substantial and has garnered national attention and (2) efforts to develop measures for these other vulnerable populations are still in the developmental phase. By no means does our focus diminish the importance of disparities in these other groups, and we hope this work can serve as the foundation for future advancements for all vulnerable populations 10 DRAFT – DO NOT CITE, QUOTE, OR REPRODUCE MEMBER comments due Sept. 7, 2011, 6:00 PM ET; PUBLIC COMMENTS due Aug. 31, 2011, 6:00 PM ET 225 226 227 228 In the presence of communication difficulties with patients (i.e., due to language barriers or cultural barriers) healthcare providers may tend to order expensive tests (such as CT Scans) for conditions that could have been diagnosed through basic history taking.7 229 230 231 232 Patients with LEP have longer hospital stays for some common medical and surgical conditions (unstable coronary syndromes and chest pain, coronary artery bypass grafting, stroke, craniotomy procedures, diabetes mellitus, major intestinal and rectal procedures, and elective hip replacement) than their white counterparts. 233 234 235 236 237 Minorities are more likely to be readmitted for certain chronic conditions,8-10 such as congestive heart failure.11 Moving forward, this issue might take on greater financial importance given that CMS will likely limit or refuse reimbursement for Medicare patients with congestive heart failure who are readmitted within 30 days of discharge.12, 13 238 239 240 Minorities, even when controlling for insurance status, may be at greater risk for ambulatory care sensitive/avoidable hospitalizations for chronic conditions (hypertension and asthma) than their white counterparts. 241 242 243 244 245 246 There are multiple liability exposures that arise when there is a demonstrated failure to address the root causes for disparities. These include patients’ misunderstanding of their medical condition, treatment plan, or discharge instructions (including how to identify complications and when to follow up); ineffective or improper use of medications or serious medication errors; improper preparation for tests and procedures; and poor or inadequate informed consent. 247 248 249 250 251 252 253 254 255 256 257 258 The ability of hospitals, health plans, and other healthcare organizations to identify and address racial and ethnic disparities hinges on their capacity to collect information about their patients’ race, ethnicity, and language proficiency. This essential step was recommended in Unequal Treatment, as well as in the 2004 National Research Council report Eliminating Health Disparities: Measurement and Data Needs.14, 15 Collecting race and ethnicity data alone is not enough to address disparities, however. Once such data are collected, healthcare organizations should routinely and regularly analyze and review them internally to monitor for disparities. This would allow them to identify variations in quality of care by race, ethnicity, and language proficiency and develop interventions to address them. For example, health plans and hospitals could determine whether patients of different racial and ethnic backgrounds were receiving the recommended testing and treatment for particular clinical conditions and develop quality improvement interventions to address any disparities or variations in care, if found. 259 260 To date, there have been several studies that have attempted to measure variations in quality by race and ethnicity,8-11, 16, 17 and some that have even tried to address disparities 11 DRAFT – DO NOT CITE, QUOTE, OR REPRODUCE MEMBER comments due Sept. 7, 2011, 6:00 PM ET; PUBLIC COMMENTS due Aug. 31, 2011, 6:00 PM ET 261 262 263 264 265 266 through quality improvement strategies such as provider education and detailing.18 However, a 2006 survey of 500 hospitals nationwide found that while 78.4 percent collected patient race information, 50 percent collected data on patient ethnicity, and 50 percent collected data on primary language,19 fewer than one in five of the hospitals that collected race/ethnicity and language information routinely used it to assess disparities in quality of care, healthcare outcomes, or patient satisfaction. 267 268 269 270 271 272 273 The National Quality Forum (NQF) has taken the lead on the important issue of disparities measurement, building on its previous work, including the development of the National Voluntary Standards for Ambulatory Care–Measuring Healthcare Disparities,20 and the consensus report on A Comprehensive Framework and Preferred Practices for Measuring and Reporting Cultural Competency.15, 21 Ultimately, the development of a set of standardized disparities measures will be a major contribution to monitoring for—and achieving—equity in healthcare. 274 275 2. Data Collection: Building the Foundation 276 2.a. Categories, Methods, and Modes of Data Collection 277 278 279 A significant amount of research has been conducted on, and efforts devoted to, how to collect race, ethnicity, and language data from patients.22 This work is critical, as it serves as the foundation for any disparities measurement efforts. 280 281 282 283 284 285 286 Usually, the first challenge organizations face when seeking to collect race/ethnicity data is determining what questions to ask and which racial, ethnic, and linguistic categories to use. In 2008, IOM convened the Subcommittee on Standardized Collection of Race/Ethnicity Data for Healthcare Quality Improvement in conjunction with the Committee on Future Directions for the National Healthcare Quality and Disparities Reports and produced a report that is the most complete and often-cited source on this topic. 23 This report made several key observations and recommendations that are worth noting: 287 2.a.i. Race/Ethnicity Categories 288 289 The concepts of race and ethnicity are defined socially and culturally and, in the case of federal data collection, by legislative and political necessity.24 290 291 292 293 294 295 296 OMB has developed a minimum set of standardized categories for reporting on race and Hispanic ethnicity by federal agencies and recipients of federal funds.2527 The five OMB race categories are: Black or African American, White, Asian, American Indian or Alaska Native, and Native Hawaiian or Other Pacific Islander. The only ethnicity choice is one of “yes” or “no” to Hispanic/Latino ethnicity. NQF 20 has endorsed these categories, at minimum. Additionally, NQF has endorsed the use of the Hospital Research & Education Trust (HRET) Toolkit 12 DRAFT – DO NOT CITE, QUOTE, OR REPRODUCE MEMBER comments due Sept. 7, 2011, 6:00 PM ET; PUBLIC COMMENTS due Aug. 31, 2011, 6:00 PM ET 297 298 299 300 301 as the preferred method for asking patients about race/ethnicity. Of note, at the time of endorsement, the HRET Toolkit recommended the use of OMB categories with a modification to include multiracial. Since the NQF endorsement, the Toolkit has been updated to endorse the approach of collecting granular ethnicity as recommended by IOM (see Figure 1). 2.a.ii. Language Categories 302 303 304 305 OMB has not established a list of language categories. The preferred option is local choice informed by data on the languages spoken most frequently in the service area by persons with LEP. 306 307 308 309 310 IOM concluded that spoken language can best be assessed by asking two types of questions: one aimed at determining whether an individual speaks English less than very well, and a second aimed at identifying the individual’s preferred spoken language during a healthcare encounter (see Figure 1). However, IOM does not recommend suggest specific language for these two types of questions. 311 312 313 When the individual is a child, the language need of the parent/guardian must be determined. Similarly, if an adult has a guardian/conservator, that individual’s language need must be assessed. 314 315 316 317 318 319 A single list of languages does not suit all areas given that the top non-English languages vary greatly from area to area. The aim is to have data on each individual’s specific language need; but when an entity designs its collection instruments, whether paper or electronic, it may, because of space considerations, have to use a limited number of response categories. Therefore, such a response list should always include an “Other, please specify: __” option. 2.a.iii. Ethnic Granularity and Multiracial Categories and Other Key 320 321 Issues 322 323 324 325 One limitation with the OMB minimum race and ethnicity set is that using too few categories can frustrate respondents who do not self-identify with those groups. It also can mask disparities by aggregating heterogeneous subpopulations with different cultures, behaviors, and risk factors. 326 327 328 329 330 “For example, the group of individuals who identify as Asian varies tremendously, including individuals from Japan, India, Laos, and other countries with vastly differing cultures and experiences in the United States. Similarly, the Latino category includes many different ethnic groups that have been found to have very different experiences with health care utilization, such as Puerto Ricans, Mexicans, and Central Americans.”28, 29 13 DRAFT – DO NOT CITE, QUOTE, OR REPRODUCE MEMBER comments due Sept. 7, 2011, 6:00 PM ET; PUBLIC COMMENTS due Aug. 31, 2011, 6:00 PM ET 331 332 333 334 335 OMB encourages the collection of more detailed data provided they can be aggregated back to the minimum categories.30 IOM recommended a separate question to collect data on granular ethnicity—defined as “a person’s ethnic origin or descent, ‘roots,’ or heritage, or the place of birth of the person or the person’s parents or ancestors…”23—in addition to OMB race and Hispanic ethnicity categories. 336 337 338 339 340 341 342 In addition, according to the US Census Bureau, the number of Americans identifying as multiracial increased by approximately one-third between the 2000 and 2010, making them one of the fastest-growing racial or ethnic groups during this interval. In the 2010 census, just more than 9 million people, or 2.9 percent of all respondents, identified with two or more races (see Figure 2). Among those who reported two or more races in the most recent census, more than 90 percent identified with two races. Predominant among those reporting two or more races were those identifying as white and another racial group (see 343 344 345 346 Figure 3). In particular, those identifying as white and black, some other race, Asian, or American Indian and Alaska Native collectively comprised more than two-thirds of those who reported multiple races. Among Hispanics, a relatively high proportion of those reporting multiple races identified as some other race in combination with another category.31 347 348 349 350 351 352 The Subcommittee suggested adding “Some other race” to the OMB list.23 Finally, the Subcommittee recommended reporting specific multiple-race combinations to enable reporting detailed breakdowns rather than just “multiracial,” as used by the Toolkit. Essentially, the emerging philosophy is that patients should be allowed to choose as many categories as they want, and in additional should be allowed to write in a response if they do not see a category that fits them. 353 354 355 356 357 This approach is not without its own limitations. Including too many racial and ethnic categories in a data collection tool can strain the data collection system and can make it difficult for workers at the registration site to locate a particular racial or ethnic group. More categories also mean that some groups will have few members, making it unlikely that the data reported will be statistically reliable. 358 359 360 Another minor issue is frequency of collection. While a change in race or ethnicity is highly unusual, race/ethnicity categories do in fact change. Thus, the Subcommittee recommended reconfirming race and ethnicity data every five years.28, 29, 32 361 362 363 364 365 366 367 368 2.a.iv. Data Collection Methods and Training The primary modes of collecting information on race, ethnicity, and language are selfreport, observation, and indirect estimation. Surveys typically use questionnaire items for selfreport. In the past, patient intake procedures used observation but are moving in the direction of allowing the patient to self-identify. Medical records often rely on observation. Self-reported race/ethnicity is considered the gold standard because it reflects the individual’s self-judgment and the population with which he or she identifies, and thus is endorsed by national experts from IOM and OMB. 14 DRAFT – DO NOT CITE, QUOTE, OR REPRODUCE MEMBER comments due Sept. 7, 2011, 6:00 PM ET; PUBLIC COMMENTS due Aug. 31, 2011, 6:00 PM ET 369 370 371 372 373 374 375 Eliciting accurate and reliable race, Hispanic ethnicity, and granular ethnicity data depends on the ways in which the questions are asked, the instructions provided to respondents (e.g., “Select one or more”), and the format of the questions (i.e., OMB one-question versus two-question format). This latter issue is especially relevant to how Hispanic populations self-identify. Pilot projects and further study are necessary to confirm the best ways to collect accurate data that are useful for healthcare quality improvement. 376 377 378 379 Each of the entities involved in the nation’s healthcare system has some capability for the collection of race, ethnicity, and language data. However, some are better positioned than others to collect these data through self-report, generally the agreed-upon best way to define a person’s racial and ethnic identity. 380 381 382 383 384 Training of staff, upgrades to health information technology (health IT) systems, and communication with patients and enrollees are potential avenues for improved data collection and building of trust. This is essential because in practice, the uniform implementation of the population definitions is as challenging as the initial population definition specification. 385 386 387 388 In IOM’s proposed framework, optional categories are offered (e.g., declined, unavailable, unknown, self-reported, observer-reported); these are not for patient response but for tracking the portion of the patient population for which an entity has been able to collect data or the nature of the data collection. 389 390 2.b. Interim Methods for Race/Ethnicity Data when Direct Self-Reports are not Feasible 2.b.i. Challenges Faced by Health Plans 391 392 393 394 395 396 397 398 399 400 Because individuals receive most of their healthcare in the ambulatory setting, the greatest potential at this time for tracking healthcare disparities lies with health plans.3 The ability to take a population-centered approach, in which enrollment in health plans clearly defines a group, will become increasingly important in our reformed health system. In fact, a survey conducted by America’s Health Insurance Plans (AHIP) found that health plan executives reported at least five reasons for collecting race/ethnicity data: 1) to identify enrollees at risk for certain medical conditions; 2) to support linguistically and culturally appropriate communications; 3) to structure quality improvement efforts in order to reduce disparities; 4) to assess variation in quality measures; and 5) to develop targeted disease management or similar 3 Most U.S. hospitals collect data on patients’ race or ethnic group, but few record this information systematically. Furthermore, the value of this data is limited since in the course of any given year only a small fraction of people are hospitalized. Many more people visit doctors, but very few physician practices collect race and ethnic data routinely. The reality is that most healthcare is provided in the ambulatory setting, and health insurers and payers, including Medicare, Medicaid, and commercial health plans, are the largest source of information. 15 DRAFT – DO NOT CITE, QUOTE, OR REPRODUCE MEMBER comments due Sept. 7, 2011, 6:00 PM ET; PUBLIC COMMENTS due Aug. 31, 2011, 6:00 PM ET 401 402 programs.33 However, health plans face sizeable barriers to obtaining self-reported race/ethnicity data: 403 404 405 406 407 1. Health plans have only sporadic direct contact with enrollees, principally at the time of enrollment. Since most individuals enroll in plans through their place of employment, employers provide one avenue for collecting race, ethnicity, and language need data. It is possible in principle for individuals to self-identify during open enrollment, but employers rarely use opportunity and are not required to do so. 408 2. Health plan enrollees may be reluctant to provide their race or ethnic background.34 409 410 411 3. Some states prohibit insurers from requesting such information from applicants at the time of enrollment to prevent the possibility of being denied access to insurance or certain services, a practice sometimes referred to as “redlining.”23 412 413 4. Even if they decide to collect the race/ethnicity data themselves, data-collection costs are high due to the costs of contacting patients. 414 5. Member turnover means that health plans need to update their files constantly. 415 416 417 418 419 Despite these obstacles, some health plans have actively begun to collect race/ethnicity from their members. This is attempted in a variety of ways, including by member selfidentification through enrollment forms, incoming and outgoing customer service calls, disease/care/case management, health risk appraisals and health needs assessments, member surveys via providers or hospitals, Web portals, and interactive voice response surveying.35 420 421 422 423 424 425 426 However, even plans that have tried to collect race data after enrollment have had limited success. For example, after a decade of making direct reporting of race/ethnicity a priority, Aetna has collected these data for more than 60 million encounters and yet have self-reported data for only one-third of active members.36 Among states, Massachusetts is one of only a few in the country to require self-reported race/ethnicity by health plans; but due to pressure from stakeholders, the state set a floor that requires reporting on only 5 percent of membership by 2012.37 Thus, the majority of race/ethnicity fields in the submitted claims are empty. 427 2.b.ii. Indirect Estimation Methods 428 429 430 431 432 As an interim strategy, until a healthcare data infrastructure exists for routinely collecting and reporting race/ethnicity data, IOM recommends imputing information on race or ethnic background through indirect estimation.23 The most common method uses geo-coded data from the U.S. Census to characterize people on the basis of their address or ZIP code as living in a high-, medium-, or low-minority area. 433 434 435 436 437 A second approach uses each person’s surname, along with Census information on the self-identification of people with that name. The U.S. Census Bureau created a new surname list based on data from the 2000 census that was far more detailed compared with prior lists.38 The new list compared surnames shared by 100 or more individuals with self-reported race and ethnicity data. The enhanced list covers 151,671 people, or 89.8 percent of persons listed in the 16 DRAFT – DO NOT CITE, QUOTE, OR REPRODUCE MEMBER comments due Sept. 7, 2011, 6:00 PM ET; PUBLIC COMMENTS due Aug. 31, 2011, 6:00 PM ET 438 439 440 441 442 census. For each name, the lists provide the frequency of occurrence in each of six categories: (1) Hispanic, (2) White, (3) Black, (4) Asian and Pacific Islander, (5) American Indian/Alaska Native, and (6) Multiracial. Thus for each such name, one can calculate the probability of being in that self-reported category. Surnames are especially useful for identifying Hispanics and Asians, whereas “geocoding” is most useful for identifying blacks. 443 444 445 446 447 448 449 450 451 452 453 454 Combining geocoding and surnames can substantially increase imputation’s accuracy. For example, someone named Smith living in an area with a high proportion of blacks is more likely to be black than someone named Smith living in a largely white community. The newer indirect methods do not assign a single race or ethnic background to any individual, instead estimating probabilities for each race or ethnic category.39 The probabilities can then be “rolled up” to estimate racial distributions in populations or combined with utilization data to examine disparities in care. Used in this way, imputed data can reveal aggregate disparities with remarkable accuracy, achieving an average accuracy of 93 percent by the common “area under the ROC curve” (AUC) measure in a validation using nearly 2 million commercially insured beneficiaries.39 RAND researchers compared indirect estimation with self-reports and were able to match within a percentage point or two the demographic characteristics of a population and measurements of healthcare disparities (see Table 1 and Table 2).40 455 456 457 458 Table 1. Comparing Population Estimates Using Self-Report vs RAND Indirect Estimation in Health Plan of 2 Million Self-Report RAND Hispanic 8.9 10.0 Asian 5.0 4.5 Black 8.0 9.1 White/Other 78.1 76.4 459 460 Source: Elliott, et al., 2008.41 461 462 463 Table 2. Comparing Disparities from Self-Report vs RAND Indirect Method in a Health Plan of 2 Million (~30k Diabetics) B-Blocker HgbA1c Lipids Eye Exam Racial Disparity (White vs Black) Direct Indirect Method Method 22.7 23.1 14.5 14.5 21.6 21.3 7.6 7.4 464 465 Source: Fremont, et al., 2005.40 466 467 468 The indirect method of race/ethnicity estimation is not without its critics. For example, its reliance on housing segregation to maximize its predictive power makes some potential users uncomfortable and, of course, makes it less useful in highly integrated communities. Further, it 17 DRAFT – DO NOT CITE, QUOTE, OR REPRODUCE MEMBER comments due Sept. 7, 2011, 6:00 PM ET; PUBLIC COMMENTS due Aug. 31, 2011, 6:00 PM ET 469 470 471 472 473 lacks precision for American Indians and Alaska natives and multiracial groups, and, as currently implemented, it is unable to distinguish sub-ethnic groups such as Haitians among the black population or Vietnamese among Asians. Thus, it might not be useful for organizations serving increasingly diverse populations. Finally, the method is best applied in the aggregate and never should be used to make clinical decisions for individuals. 474 475 476 477 Despite these reservations, experts now suggest that until self-reported data on race/ethnicity become feasible on a broad scale, implementing indirect estimation methods by insurance plans would provide an unprecedented opportunity to populate vast quantities of health-claims records with racial and ethnic information.42 478 479 480 481 482 483 484 Recommendation: Directly reported race/ethnicity and language (self-identified) is the preferred method for data collection. Efforts should be taken to solidify and support the infrastructure for race, ethnicity, and language proficiency data collection from patients/members within all healthcare settings. There is clear guidance from IOM/NQF/HRET that should be followed for self-reports (the gold standard). Where not feasible in the short term, indirect estimation can be put into place immediately. 485 2.c. Looking Toward the Future 486 487 488 489 The capacity for disparities measurement hinges on the effective collection of patient race, ethnicity, and language data. Aside from public health bodies that collect vital statistics, the data providing the ability to link health data to patients’ race, ethnicity, or linguistic proficiency for measurement purposes are collected haphazardly and are not routinely available. There are, however, several key considerations for the future that are relevant to these efforts: Looking ahead, information infrastructure may enable integrated data exchange so that all entities will not need to collect all data. For now, however, all health and healthcare entities have roles to play in collecting these data directly from individuals. 490 491 492 493 494 495 496 497 498 Some electronic data collection systems may evolve and be more sophisticated, allowing the use of keystroke recognition to accommodate hundreds races/ethnicities and languages. 499 500 501 502 The American Recovery and Reinvestment Act of 2009’s (ARRA) goal of having a national electronic health record (EHR) for each individual by 2014 that incorporates collection of data on the person’s race, ethnicity, and primary language, will foster efforts of data collection and disparities measurement. 503 504 To be eligible for meaningful use incentives related to EHRs, the Health Information Technology for Economic and Clinical Health Act (HITECH) 18 DRAFT – DO NOT CITE, QUOTE, OR REPRODUCE MEMBER comments due Sept. 7, 2011, 6:00 PM ET; PUBLIC COMMENTS due Aug. 31, 2011, 6:00 PM ET 505 506 requires physicians to record race or ethnic background for at least half their patients. 507 508 509 510 The Patient Protection and Affordable Care Act (PPACA) includes provisions requiring race and ethnicity to be collected for selected federal programs including population surveys, Medicaid, and the Children’s Health Insurance Program. 511 512 513 514 515 516 517 518 519 520 Differential adoption and slow diffusion of health IT may lead to a “digital divide” that could impact disparities data collection, measurement, and reduction. For example, providers who cared for uninsured and Medicaid black and Hispanic patients had 12 percent to 36 percent lower odds of using electronic health records than privately insured non-Hispanic white patients.43 In addition, federally qualified health centers with high rates of uninsured patients had 47 percent lower odds of EHR adoption.44 Hospitals that disproportionately care for the poor (defined by a hospital's Medicare disproportionate-share hospital [DSH] index) have slightly lower rates of adoption of either basic or comprehensive EHR compared to low-DSH-index hospitals.45 521 522 523 524 525 In summary, race, ethnicity, and language proficiency, data collection serves as the foundation for disparities measurement, and the field is rapidly evolving. Key lessons from the field as well as legislative efforts should facilitate advances in this area. 19 DRAFT – DO NOT CITE, QUOTE, OR REPRODUCE MEMBER comments due Sept. 7, 2011, 6:00 PM ET; PUBLIC COMMENTS due Aug. 31, 2011, 6:00 PM ET 526 Figure 1. 1 IOM Rec commende ed Categorries 527 528 529 530 © IOM, 20 009. 20 DRAFT – DO NOT CIITE, QUOTE, O OR REPRODU UCE due Sept. 7, 2 2011, 6:00 PM M ET; PUBLIC COMMENTS due Aug. 31,, 2011, 6:00 P PM ET MEMBER comments d 531 532 533 534 Figure 2. 2 Persons s Reporting g Multiple Races R 21 DRAFT – DO NOT CIITE, QUOTE, O OR REPRODU UCE due Sept. 7, 2 2011, 6:00 PM M ET; PUBLIC COMMENTS due Aug. 31,, 2011, 6:00 P PM ET MEMBER comments d 535 536 Figure 3. 3 Distributtion of Multiple Race es 537 538 3. Dispa arities Mea asures and d Indicators s: What to Measure? ? 539 540 541 542 543 544 545 546 547 548 NQF N has prev viously deveeloped a set of o criteria too determine w whether a quuality measuure would qu ualify as “dissparities sensitive.” Disp parities-sensiitive measurres are thosee that serve too detect no ot only differrences in quaality across institutions i oor in relationn to certain bbenchmarks, but also diffeerences in qu uality among g population ns or social ggroupings (raace/ethnicityy, language, eetc.). In this ch hapter we wiill review ex xisting NQF criteria for ddisparities seensitivity andd provide soome additionaal perspectiv ve on them. We W also will recommendd a new set oof criteria annd ways of categorizzing measurees with respeect to dispariities sensitivvity. We preesent a system m for categorizzing and charracterizing the t mechanissms behind sselected dispparities-sensitive measurres and end by b discussing possible ap pproaches to o the creationn of developpmental (new w) measures for disparitiees when the need n exists. The algorith hm for this pprocess can bbe found in F Figure 5. 549 550 551 3.a. Critteria for Diisparities-S Sensitive Measure M Se election Am mong the N NQF Portfo folio of Endo orsed Standards and d Measures s 552 553 The T NQF porrtfolio of end dorsed stand dards and meeasures incluudes more thhan 700 performaance measurees of quality y of care for both b ambulaatory and insstitution-baseed settings, 22 DRAFT – DO NOT CIITE, QUOTE, O OR REPRODU UCE MEMBER comments d due Sept. 7, 2 2011, 6:00 PM M ET; PUBLIC COMMENTS due Aug. 31,, 2011, 6:00 P PM ET 554 555 556 557 558 559 including disease specific measures and cross-cutting measures that apply across disease areas.4 None of these measures was designed specifically with the idea of detecting disparities in care by race/ethnicity or language. However, as a broad assessment of quality of care, it is reasonable to assume that some of these measures would be more sensitive to disparities in care than others. We envision identifying current and potential disparities sensitive measures as a three-step process, which we now describe. 560 561 562 3.a.i. Step 1: Assess the Portfolio of NQF Performance Measures Using Disparities-Sensitive Principles, with Special Emphasis on Quality Gap and Prevalence 563 564 565 Step 1a: All existing performance measures should be evaluated against the guiding principles established by the NQF Steering Committee and TAP that produced the report on consensus standards in 2008.20 The guiding principles are: 566 1. Prevalence—How prevalent is the condition among minority populations? 567 568 2. Impact of the Condition—What is the impact of the condition on the health of the disparity population? 569 570 3. Impact of the Quality Process—How strong is the evidence linking improvement in the measure to improved outcomes in the disparity population? 571 572 4. Quality Gap—How large is the gap in quality between the disparity population and the group with the highest quality for that measure? 573 574 5. Ease and Feasibility of Improving the Quality Process (Actionable)—Is the measure actionable among the disparity population? 575 576 577 578 579 580 581 582 583 584 585 586 587 588 In reviewing these principles, however, two of the five listed above are particularly useful for distinguishing measures as disparities sensitive: Quality Gap and Prevalence. The other principles are less precisely evaluated, and it is not well known whether evidence is available to apply these principles specifically to minority populations. The most important of these two is Quality Gap. This criterion essentially means that if there is evidence showing a difference in the quality of care by race/ethnicity or language, it should be considered disparities sensitive. The other criterion that we consider particularly relevant is Prevalence. To achieve NQF endorsement, it is assumed that a measure should demonstrate sufficient prevalence to merit consideration. There are no instances of rare diseases or conditions that relate to the approximately 700 NQF-endorsed measures. However, prevalence also is an important criterion for disparities sensitivity because measures for diseases that are more prevalent in minority communities—such as end-stage renal disease, diabetes, and congestive heart failure—may allow for the detection of disparities even when no data demonstrating disparities currently exist. 4 NQF measures are all evaluated with a set of standard criteria before being listed (http://www.qualityforum.org/Measuring_Performance/Submitting_Standards/Measure_Evaluation_Criteria.aspx ). The criteria described in this report refer to those that might be applied to select disparities-sensitive measures. 23 DRAFT – DO NOT CITE, QUOTE, OR REPRODUCE MEMBER comments due Sept. 7, 2011, 6:00 PM ET; PUBLIC COMMENTS due Aug. 31, 2011, 6:00 PM ET 589 590 591 592 593 594 595 596 597 598 599 600 601 602 603 604 605 606 607 608 609 610 611 612 613 614 615 616 617 618 619 620 621 622 623 624 625 626 Step 1-b: We recommend that all of the NQF measures should be compared with the literature on known areas of disparities, beginning with AHRQ’s National Healthcare Disparities and Quality Report, the Institute of Medicine’s Unequal Treatment Report,1 and then a new review of the disparities literature since the publication of Unequal Treatment. All NQF measures that can be matched (at least partially if not identically) to disparities that have been documented in at least one of the sources mentioned should be considered as candidates for disparities sensitive measures. Appendix I contains an example of a table of some measures that are compared with AHRQ’s National Healthcare Disparities and Quality Report. In addition, these measures can be categorized further according to the described scheme at the end of this chapter. 3.a.ii. Step 2: Apply New Criteria for Disparities Sensitivity It seems fairly clear that the best criterion to use to determine whether a quality measure is disparities sensitive is the existence of known disparities using the same or a similar measure. When the NQF does not have access to performance data stratified by race/ethnicity, or when known disparities do not exist, a set of additional criteria can be applied to determine potential disparities sensitive measures. 1 These include the following: Care with a High Degree of Discretion: Many of the disparities described depend on a certain degree of discretion on the part of the clinician.47 The less there is a standard protocol that must be followed, the easier it is for a clinician to offer a procedure differently based on the patient’s socio-demographic characteristics (whether or not this is consciously factored into the decision). This tends to impact the utilization of high-cost procedures, referral for specialty care, newly emerging technologies, and other “high-end” aspects of care. However, there are other areas where discretion is important. For example, pain is very subjective, and the decision to prescribe medications to control a patient’s pain is full of nuance and subtle cues that could be related to stereotype—race/ethnicity, socioeconomic status, language, etc. Communication-Sensitive Services: When receiving care depends to a great extent on providers and patients communicating well, disparities are likely to occur given the challenges to communication across cultures. For example, studies have shown that many of the core hospitals quality measures (such as aspirin at arrival and discharge or oxygenation assessment) reveal very similar performance between minority and majority populations, partly due to the fact that performance on these measures is generally high. On the other hand, measures that required communication with patients (such as receipt of smoking cessation counseling or discharge instructions) where language or cultural barriers may come into play exhibited larger and statistically significant disparities.48, 49 24 DRAFT – DO NOT CITE, QUOTE, OR REPRODUCE MEMBER comments due Sept. 7, 2011, 6:00 PM ET; PUBLIC COMMENTS due Aug. 31, 2011, 6:00 PM ET 627 628 629 630 631 632 633 Social Determinant-Dependent Measures: Disparities often are seen in areas that depend to a large extent on patient self-management (e.g., diet, exercise, and medication adherence for diabetes or congestive heart failure management). Social determinants, such as low socioeconomic status, education level, and environment, can present barriers to health-related changes in lifestyle, which are challenging for all patients, but especially for those who are disproportionately affected by these challenges—which we know minorities are. 634 635 636 637 638 639 640 641 642 643 644 Outcomes Rather than Process Measures: Many process measures are relatively straightforward and less likely to be influenced by subjective factors or patient factors that can lead to disparities. For example, prescribing beta-blocker after a myocardial infarction has now achieved very high rates of success in most organizations and rarely shows disparities. This is largely because processes are standardized and patients do not hold particular beliefs or concerns about standard medications such as these. However, in a situation such as the provision of flu shots, although standard processes may be put in place, patient preferences based on beliefs or concerns about this particular intervention may make this a disparities-sensitive measure (insomuch as minority patients have specific concerns about some interventions or medications over others). 645 646 647 648 649 650 These four areas overlap significantly. For example, readmission rates depend to a large extent on both communication and lifestyle changes, as do diabetes outcomes measures. We recommend that all the current measures as well as newly proposed measures be reviewed in the context of these four disparities-sensitive criteria. While no one of these automatically qualifies a measure for disparities sensitivity, they all can provide some rough guidance when solid data on disparities do not yet exist. 651 3.b. Categories and Characteristics of Disparities-Sensitive Measures 652 653 654 655 656 In reviewing the NQF-endorsed standards for sensitivity to disparities, we identified six different types of disparities-sensitive measures. These are described below, and examples are provided. Our recommendation is that a full set of NQF-endorsed measures should be analyzed according to this system of categorization, not as a way of determining disparities sensitivity, but rather, as a way of understanding the range of measures used to identify disparities. 657 658 659 660 661 662 After assigning a measure to a category, each measure should be further assessed according the following characteristics: 1) whether it is condition specific (CS) or cross-cutting (CC); 2) whether the mechanisms of the disparities are provider-based, patient-based, systembased, or related to health insurance; and 3) whether it is a measure of structure, process, or outcome (based on Donabedian’s classification system).2 Appendix II contains an additional sample table of NQF Endorsed Measures for Sensitivity to Disparities catalogued using the 25 DRAFT – DO NOT CITE, QUOTE, OR REPRODUCE MEMBER comments due Sept. 7, 2011, 6:00 PM ET; PUBLIC COMMENTS due Aug. 31, 2011, 6:00 PM ET 663 664 above three characteristics. Each measure is numbered according to the official NQF-Endorsed Standard listing (www.qualityforum.org/Measures_list.aspx). 3.b.i. Practitioner Performance Measures 665 666 667 668 669 670 671 672 These are the measures that assess practitioners’ performance and their adherence to prescribed screenings and healthcare that is consistent with national evidence-based clinical standards. Areas of performance that are assessed include screening, treatment, and follow-up. Generally, practitioner performance measures are condition specific. The following are examples of such disparities-sensitive measures and their characteristics (see Table 3): Table 3. Practitioner Performance Measure NQF Number Name 1 Asthma Assessment 2 Appropriate testing for Children with Pharyngitis 3 Bipolar Dis: DM Assessment 4 Alcohol, Drug Treatment (Initiation, Engagement) 12 HIV Prenatal Screening 61 Type of Measure— Condition Specific (CS) or CrossCutting (CC) CS Root of Potential Disparity— Provider (PB), Patient (PtB), Systemic, or Health Insurance PB Donabedian Category— Structural (S), Process (P), Outcome (O) P CS PB P CS PB or PtB P CS PB or PtB P PB or PtB or CS Systemic O PB or PtB or Systemic or BP Measurement CS Insurance O Other examples of this type of measure are: #14 – 112, #568, 569, #579-587, #593 – 637, #650 – 659. 673 3.b.ii. Consumer Surveys that Measure the Patient Experience 674 675 676 677 678 Consumer surveys are disparity-sensitive tools. Generally, consumer surveys are crosscutting and provide a type of outcome measure, according to Donabedian’s classification. Within the consumer surveys, those question that deal with communication are the most likely to be disparities sensitive. The following are examples within the universe of NQF-endorsed measures (see Table 4): 679 680 Table 4. Consumer Surveys that Measure the Patient Experience NQF Number Name Type of Measure Root of Potential Donabedian Category— 26 DRAFT – DO NOT CITE, QUOTE, OR REPRODUCE MEMBER comments due Sept. 7, 2011, 6:00 PM ET; PUBLIC COMMENTS due Aug. 31, 2011, 6:00 PM ET Condition— Specific (CS) or CrossCutting (CC) CAHPS (B): Clinician/Group Surveys (Adult Primary Care, Pediatric Care, and Specialist Care Surveys) CS 6 CAHPS (C): CAHPS Health Plan Survey v 4.0— Adult Questionnaire CS 8 Experience of Care and Health Outcomes (ECHO) Survey (Behavioral Health, Managed Care Versions) CS 9 CAHPS (D): Health Plan Survey v 3.0 Children with Chronic Conditions Supplement CS 10 YAHCS: Young Adult Health Care Survey CS 11 PHDS: Promoting Healthy Development Survey CS Other examples include: #166, #258, #517, #691 – 693, #726. Disparity— Provider (PB), Patient (PtB), Systemic, or Health Insurance Structural (S), Process (P), Outcome (O) PB or PtB or Systemic O PB or PtB or Systemic O PB or PtB or Systemic O 5 PB or PtB or Systemic PB or PtB or Systemic PB or PtB or Systemic O O O 681 682 3.b.iii. Hospital, Ambulatory Care Center, Home Health Nursing Home Performance Measures 683 684 685 686 687 688 689 These types of measures assess the performance of a particular health facility. Generally, quality standards are fairly even within systems of care, and disparities are not detected. Some institutions could be poorly performing, or they could be High-Performing Hospitals, as measured by CMS, or Patient-Centered Medical Homes, as designated by National Committee for Quality Assurance (NCQA). The level and quality of care within such facilities may compare favorably or unfavorably with their peers; however, disparities within the institution disparities may be less evident. 690 691 692 693 Some examples are below (Table 5): Table 5. Hospital, Ambulatory Care Center, Home Health Nurse Home Performance Measures NQF Number Name Type of Measure— Condition Specific (CS) or Root of Potential Disparity— Provider (PB), Patient (PtB), Donabedian Category— Structural (S), Process (P), Outcome (O) 27 DRAFT – DO NOT CITE, QUOTE, OR REPRODUCE MEMBER comments due Sept. 7, 2011, 6:00 PM ET; PUBLIC COMMENTS due Aug. 31, 2011, 6:00 PM ET Risk-Adjusted Mortality for 119 CABG Annual Procedure Volume for CABG, Valve or 124 Combined Surgeries CrossCutting (CC) CS CS Systemic, or Health Insurance PB or PtB or Systemic PB or PtB or Systemic O O CS PB or PtB or O 130 Deep Sternal Wounds Systemic Other examples of this type of measure include: #286 – 304, #318 – 324, #334 – 376, #450 – 487, #495 – 497 (ED Performance), #530 – 532 (AHRQ Composite Measures), #640 – 649, #694 – 709. 694 695 696 3.b.iv. Measures of Ambulatory Care Sensitive Conditions and Management 697 698 699 700 701 702 703 Community level data that can point to population-based disparities are available. Fourteen AHRQ Prevention Quality Indicators (PQIs) were included as part of the NQF Ambulatory Care Disparities report. The AHRQ PQIs measure potentially avoidable hospitalizations for ambulatory care-sensitive conditions. The indicators rely on hospital discharge data and are intended to reflect issues of access to high-quality ambulatory care (see Table 6).20 704 705 Table 6. Measures of Ambulatory Care-Sensitive Conditions Management NQF Number Name Diabetes, short-term 272 complications (PQI 1) Uncontrolled Diabetes 638 Admission Rate (PQI 14) 706 Type of Measure— Condition Specific (CS) or CrossCutting (CC) CS CS Root of Potential Disparity— Provider (PB), Patient (PtB), Systemic, or Health Insurance PB or PtB or Systemic PB or PtB or Systemic Donabedian Category— Structural (S), Process (P), Outcome (O) O O 3.b.v. Measures Associated with Cultural Competency 707 708 709 A number of the NQF-endorsed measures may be associated with issues of culture, language, and health literacy. Examples of these include the Home Health measures #175 – 181; assessment of post-stroke communication capabilities #445 – 449. 710 711 All measures that deal with patient readmissions are disparities sensitive because of the crucial importance of patient communication in transitions of care. This is noted in measure #506 28 DRAFT – DO NOT CITE, QUOTE, OR REPRODUCE MEMBER comments due Sept. 7, 2011, 6:00 PM ET; PUBLIC COMMENTS due Aug. 31, 2011, 6:00 PM ET 712 713 (30-day pneumonia readmission) and #505 (30-day MI readmission), as well as #541-547 (Medication management). 714 715 716 Measures of Depression assessment (#518, 710-712) and patient education (#519, 520, 136—Detailed heart failure discharge instructions) are also disparities sensitive and related to cultural competency (see Table 7). 717 718 719 Table 7. Measures Associated with Cultural Competency NQF Number 176 445 506 Name Improvement in Management of Oral Medications Functional Communication Measure: Spoken Language Comprehension Thirty-Day All-Cause Risk Standardized Readmission Rate Following Pneumonia Hospitalization Type of Measure— Condition Specific (CS) or CrossCutting (CC) Root of Potential Disparity— Provider (PB), Patient (PtB), Systemic, or Health Insurance Donabedian Category— Structural (S), Process (P), Outcome (O) CS PB or PtB or Systemic O CS PB or PtB or Systemic O CS PB or PtB or Systemic PB or PtB, Systemic or Insurance PB or PtB or Systemic O Adherence to Chronic Medication CS O Depression Assessment 518 Conducted CS PM Drug Education on All Medications Provided to Patient/Caregiver During PB or PtB or 520 Episode CS Systemic O Home health measures #175 – 181; assessment of post stroke communication capabilities #445 – 449, #506 (30 day pneumonia readmission) and #505 (30 day MI readmission) as well as #541-547 (Medication Management); measure of depression assessment (#518, #710 - 712) and patient education (#519, 520, 136). 542 720 721 722 723 724 725 726 3.b.vi. Patient-Centered Measures Generally, patient-centered measures are cross-cutting. They may be structural, process, or outcome measures according to the Donabedian classification. The field of patient-reported outcomes measures is growing rapidly and is likely to be a major opportunity for disparities measurement in the future. Examples of patient-centered measures are below (see Table 8): 29 DRAFT – DO NOT CITE, QUOTE, OR REPRODUCE MEMBER comments due Sept. 7, 2011, 6:00 PM ET; PUBLIC COMMENTS due Aug. 31, 2011, 6:00 PM ET 727 728 Table 8. Patient-Centered Measures NQF Number 717 Name Children School Days Missed Type of Measure — Condition Specific (CS) or CrossCutting (CC) Donabedian Category— Structural (S), Process (P), Outcome (O) CC Root of Potential Disparity—Provider (PB), Patient (PtB), Systemic, or Health Insurance PtB, Sytemic, Insurance PtB, Systemic, Insurance PB, PtB, Systemic, Insurance CC CC Structural Structural O O CS 718 719 720 721 Children Obtaining Referrals Children Get Effective Care Coordination Children Live in Safe Communities Safe School CC O O O 729 3.c. Step 3: Developing New Disparities Specific Measures 730 731 732 733 734 735 736 737 738 739 740 741 742 743 744 745 746 While NQF measures, HEDIS measures, and hospital core measures provide a solid foundation for measuring disparities in quality broadly speaking, they may miss out on important phenomena. In general, quality measures are not developed specifically with the idea of identifying disparities. The disparities literature includes hundreds of studies documenting disparities in screening measures, surgical procedure utilization, diabetes outcomes, transplantation, pain management, and many other areas by race, ethnicity, and other sociodemographic characteristics.1 Most do not appear as NQF measures (or other standard quality measures) and were not intended to be quality measures. The disparities literature is wide-ranging, but some of the most important disparities are in specific disease areas or procedures where sample sizes within organizations are relatively small, such as renal transplantation rates. These would not typically be used as a measure of quality, yet we know that African Americans are less likely to receive renal transplants while waiting longer on dialysis than their white counterparts. In this section we describe two approaches to identifying potential new disparities-sensitive quality measures: 1) disparities-specific measures that draw upon known or suspected disparities from the academic literature but for which no current performance measures exist, and 2) consideration of additional measures along the clinical pathway. 30 DRAFT – DO NOT CITE, QUOTE, OR REPRODUCE MEMBER comments due Sept. 7, 2011, 6:00 PM ET; PUBLIC COMMENTS due Aug. 31, 2011, 6:00 PM ET 747 3.c.i. Disparities-Specific Measures 748 749 750 751 752 753 754 755 756 757 758 759 760 761 762 763 764 765 766 The term disparities-specific measures distinguish these as new measures that are created specifically as indicators of the existence of disparities in particular areas of care where research has shown disparities to exist. These are distinguished from disparities-sensitive measures, a term that includes any current quality measure in which disparities have already been identified. Disparities-specific measures would thus play the role of making healthcare organizations aware of disparities that may exist even though they may not be apparent when using standard quality indicators. These measures can be developed based on a review of the disparities literature, cross-walking this with the existing NQF measures to ensure that no current measure exists, and developing a new disparities-specific measure. For example, there is a abundant literature that demonstrates disparities in pain management for long bong fractures in the emergency department (minorities receiving significantly less pain medication for the same exact fracture as their white counterparts).53 Currently, there is no off-the-shelf measure that allows organizations to determine if there are differences in pain management by race/ethnicity in patients who present to the emergency department with long bong fracture. As such, Massachusetts General Hospital went about developing a new disparities-specific measure to measure and monitor pain management routinely by race/ethnicity. This would be considered a disparities-specific measure. Other areas where disparities specific measures might be developed include cardiac catheterization rates,51,52 amputation rates for peripheral vascular disease, referral for renal transplantation, and stage at initial diagnosis of prostate cancer.54, 55 767 3.c.ii. Disparities that may Occur Along the Clinical Pathway 768 769 770 771 772 773 774 775 776 777 778 779 780 Another option for identifying new disparities-sensitive measures is to search for processes or services that occur at various points along the clinical pathway. Optimal outcomes often depend on a series of interventions, each of which may pose barriers to disadvantaged patients. Measuring performance at only one point may miss important sources of disparities. A case in point is renal transplantation, which is particularly exasperating because disparities have been known for more than 20 years. The endpoint—a new kidney—is essentially a zero-sum game because kidneys are a limited and scarce resource. Obtaining a kidney transplant requires attaining a number of services, including initial referral to a specialist, clinical work-up, referral to the wait list, registration, matching the criteria, understanding and adhering to procedures around the offer and acceptance, and the transplantation itself. Although the problem of latent racism may exist (minorities in the past were seen as inferior candidates compared with whites56) in fact, differences in rates can be identified at many key steps along the clinical pathway (see Figure 4).57 781 782 783 784 A related concern is the possibility that focusing on disparities in utilization may inadequately describe the appropriateness of that utilization. “Differences” in procedure rates, for example, may reflect one or more of the following phenomena: 1) differences in clinical appropriateness (presenting condition); 2) underuse (defined as lower use, even when clinically 31 DRAFT – DO NOT CITE, QUOTE, OR REPRODUCE MEMBER comments due Sept. 7, 2011, 6:00 PM ET; PUBLIC COMMENTS due Aug. 31, 2011, 6:00 PM ET 785 786 787 788 789 appropriate or necessary); or, 3) overuse (defined as more frequent use, even when the risks outweigh the benefits). Research on access to cardiac surgery demonstrates that all three phenomena may be involved in explaining differences in use rates—higher rates of clinical appropriateness among whites, greater underuse among blacks, and greater likelihood of revascularization among whites when it is not clinically appropriate.52, 58 790 791 792 793 794 795 The implication of these studies for quality measurement is that improving access at only one or two points along the way is unlikely to eliminate the disparities in “things that matter.” For example, for renal transplantation, disparities in receipt of a transplant can occur because of failure to refer to a transplant nephrologist, failure to place the patient on the renal transplant list, or failure to receive the transplant. We recommend that disparities measures represent a complete and comprehensive view of care, not just one point along the clinical pathway. 796 797 Figure 4. Access to Renal Transplantation Percent Referred 100 90 80 70 60 50 40 30 20 10 0 Placed on wait list 96 92 85 78 63 52 803 804 805 806 807 808 40 36 17 20 20 3 White Appropriate Candidates 798 799 800 801 802 Received transplant Black Appropriate Candidates Black White Inappropriate Inappropriate Candidates Candidates Epstein AM, et al. Racial disparities in access to renal transplantation: Clinically appropriate or due to underuse or overuse, NEJM 2000;343:1537‐44. Source: Epstein, et al., 2000.57 Rates adjusted for age, region, primary cause of renal failure, education, income, overall health status, patients’ preferences, distance to nearest transplantation facility 3.c.iii. Summary and Recommendations In summary, the peer-reviewed literature may contain the seeds of new disparitiesspecific measure development. In 2006 a study published in the New England Journal of Medicine examined 439 quality indicators for 30 chronic and acute conditions and for disease prevention among randomly selected patients from 12 communities around the United States.50 The goal was to determine where disparities by race/ethnicity existed and the magnitude of these 32 DRAFT – DO NOT CITE, QUOTE, OR REPRODUCE MEMBER comments due Sept. 7, 2011, 6:00 PM ET; PUBLIC COMMENTS due Aug. 31, 2011, 6:00 PM ET 809 810 811 812 813 814 815 816 817 disparitiees compared d to overall leevels of quallity when beenchmarked against natioonal standardds. The findiings were su urprising beccause the varriation in quaality-of-caree scores accoording to thiss set of indicators was verry small acro oss racial/eth hnic groups ccompared too the gaps beetween obserrved and desirred quality across all gro oups. Initially y, it was diffficult to recooncile this w with the abunndant literaturee on disparitiies. Howeverr, when the authors a conffined their quuality measuures to thosee that had know wn disparitiees in the literrature, they confirmed c thhat disparitiees existed in their data ass well. Dissparities-speccific measurres might em merge from s ervices that reflect proviider biases against certain group ps (consciouss or unconsccious), poor ccommunicattion across ccultures, misttrust, languagee barriers, an nd ineffectivee systems off care, amongg other factoors. 818 819 820 821 822 823 824 825 826 827 828 Finally, our reecommendaation also inccludes trackiing the progrress of the N National Prioorities Partnersh hip (NPP) an nd NQF’s Measure M Appllications Parrtnership (MA AP) becausee any effort iin disparitiees measurem ment should be b synchroniized with theeir work wheenever possiible. Prioritiees that NPP P has targeted d for improv vement are proven p ways to eliminatee harm, wastte, and dispaarities, including g action in th he areas of payment, pub blic reportingg, quality im mprovement, and consum mer engagem ment. MAP will w provide direction d and d direct inpuut to HHS onn preliminariily identifiedd performaance measurees available for benchmaarking and im mprovementt purposes, aand will adviise on measu ures needed for specific care settingss, care providders, and paatient populaations. Thesee prioritiess and goals provide p oppo ortunities forr immediate action and m measurementt and includee measuress such as preeventable re--admission and a equitablee access to care, which ccan be includded in dispariities-sensitiv ve measures.. 829 830 831 832 833 834 835 836 837 838 839 840 841 842 843 844 845 846 847 Figure 5. 5 Measure Selection/De S evelopment Algorithm m 33 DRAFT – DO NOT CIITE, QUOTE, O OR REPRODU UCE MEMBER comments d due Sept. 7, 2 2011, 6:00 PM M ET; PUBLIC COMMENTS due Aug. 31,, 2011, 6:00 P PM ET 848 849 4. Methodological Approaches to Disparities Measurement: How to Measure and Monitor 850 4.a. Overview 851 852 853 854 855 The goal of eliminating health disparities can be achieved only if indicators of interest are monitored and disparities recorded. Progress toward reducing disparities means that indicators are measured over time. This section will provide an in-depth discussion of methodological approaches to disparities measurement, including statistical and technical considerations of disparities measurement, highlighting strengths and weaknesses of the different approaches. 856 857 858 859 860 861 862 863 864 865 866 Measuring disparities is essentially an exercise in arithmetic, usually comparing indicators of health status or quality of care (performance) among two or more groups of interest. Indicators are usually measured in terms of rates, percents, proportions, or means for each group in a “domain.” A domain is defined as “a set of groups defined in terms of a specific characteristic of persons in a population.”60 For example, the race domain according to OMB consists of Black or African American, White, Asian, American Indian or Alaska Native, and Native Hawaiian or Other Pacific Islander. Disparities become evident when quantitative measures of health or measures of health quality (rates, percents, etc.) differ among groups in a domain. However, what may seem straightforward in fact has a number of pitfalls. In the calculation of disparities there are several considerations that must be addressed. These issues are discussed below. 867 4.b. Reference Points 868 869 870 871 872 873 874 875 876 A reference point is “the specific value of a rate, percent, proportion, mean, or other quantitative measure relative to which a disparity is measured.”60 Disparities frequently are measured among groups in a domain.5 From a purely statistical point of view, any one of the groups in a domain could be chosen as a reference point. For example, the largest group might be selected because its rate is usually the most stable. Thus if in some localities a “minoritymajority” exists, the minority population would be the reference group. Alternatively, one might select the group with the best rate or highest-quality performance because this represents a realistic attainment. In addition, choosing the group with the best performance ensures that all of the differences with the other groups will be positive and have ratios greater than 1. 877 878 879 880 A disadvantage of using the largest group or the best-performing group is that the reference point may change over time. Furthermore, using a method that ignores a priori evidence of social disadvantage could lead to policies that redirect resources toward more privileged populations.61 In this white paper we follow the argument proffered by Braveman, 5 Disparities also can be measured from a reference point that is not a group characteristic. For example, one could compare each group against the unweighted mean of all the groups in the domain, or to a benchmark or goals. The goal (e.g., from Healthy People reports) has intuitive appeal because it implies that all groups could improve. However, in this paper we have chosen to concentrate on differences between groups. 34 DRAFT – DO NOT CITE, QUOTE, OR REPRODUCE MEMBER comments due Sept. 7, 2011, 6:00 PM ET; PUBLIC COMMENTS due Aug. 31, 2011, 6:00 PM ET 881 882 883 884 885 886 who defines disparities as “…potentially avoidable differences in health (or in health risks that policy can influence) between groups of people who are more and less advantaged socially.”61 Therefore, Recommendation: In this report, we believe that for purposes of achieving equity in healthcare that is fair and just, the chosen reference group should always be the historically advantaged group. 887 888 4.c. Absolute versus Relative Disparities, and Favorable versus Adverse Measures 889 890 891 892 While calculations of disparities can be straightforward, comparisons of disparities among entities or over time can be sensitive to the calculations chosen. The simplest measure of disparity is the absolute or simple difference, that is, the arithmetic difference between two rates, expressed in the same units as the rates themselves: 893 894 895 896 Simple difference = rate of reference group – rate of group of interest Another straightforward approach is to calculate the relative measure of disparity, usually expressed as the simple difference from the reference point (or group) as a percentage of the reference point: 897 898 899 900 901 902 903 904 905 906 907 908 909 Relative disparity = (rate of interest–reference point rate) x 100 reference point rate For any given domain, the “direction” of the disparity will always be the same whether one chooses absolute or relative measures. In other words, if the absolute difference is greater than zero, then the relative difference will always be greater than one (1). Many analysts focus on the relative rate because it has an intuitive connection with the idea of equality.62 However, making comparisons across time or geography or institutions can result in different interpretations, partly because a change in disparities is a “difference in differences” problem. A simple example illustrates this. In Figure 6 the percentage of blacks and whites failing to receive the indicated test decreases over time from 40 to 20, and 25 to 10, respectively. The absolute disparity improved (decreasing from 15 to 10), while the relative worsened (increasing from 1.6 to 2.0). 910 35 DRAFT – DO NOT CITE, QUOTE, OR REPRODUCE MEMBER comments due Sept. 7, 2011, 6:00 PM ET; PUBLIC COMMENTS due Aug. 31, 2011, 6:00 PM ET 911 912 Figure 6. 6 Percenta age of Blac cks and Whites Failin ng to Rece eive Test 913 914 915 916 917 918 919 920 921 922 923 924 925 926 Harper, H et al.,, provide ano other examp ple (see Figuure 7).62 In thhis case, the relative dispparity in prostatte cancer mo ortality betw ween whites and a blacks inncreased, whhile the absoolute disparitty, or rate diffeerence, declin ned. This occcurred becau use blacks hhad worse heealth at the bbeginning, annd the rate of o improvem ment for black ks was smalller than for w whites. How wever, the auuthors note thhat the rate for f blacks deeclined by 24 4 deaths per 100,000 whhile the rate ffor whites deecreased by 13 deaths peer 100,000; so s on an abso olute basis, blacks b madee more progrress. In a widdely cited paaper 63 by Werneer, et al., using u the hig ghly inflamm matory title, ““Racial proffiling: the unnintended consequeences of coro onary artery bypass graft ft report cardds,” the authoors claimed that “The release of CABG G report card ds in New Yo ork was asso ociated with a widening of the dispaarity in CABG use between white veersus black and a Hispanicc patients.” H However, a cclose inspecction of the ddata shows that the rate more m than trip pled for blaccks (rising frrom 0.9 to 3..0) while onlly doubling ffor whites. 927 928 929 930 931 Recommend R dation: The choice c of a disparity d m measure can lead to diffferent in nterpretatio ons when ma aking comp parisons oveer time or am mong proviiders. Therefore, T both absolute and relatiive statisticss should be calculated; and if they lead to o conflicting g conclusion ns, both should be pres ented, allow wing readerrs to make th heir ow wn interpreetation. 932 36 DRAFT – DO NOT CIITE, QUOTE, O OR REPRODU UCE MEMBER comments d due Sept. 7, 2 2011, 6:00 PM M ET; PUBLIC COMMENTS due Aug. 31,, 2011, 6:00 P PM ET 933 934 935 Figure 7. 7 Trends in Prostrate Cancer among a Bla ack and Wh hite Males and Percenttage Chang ge in Black k-White Ra atio and Ra ate Differen nce 936 937 938 939 940 941 942 943 944 945 946 947 In n addition to o deciding on n absolute veersus relativee measures, one must also consider tthe choice off reporting faavorable or unfavorable u (i.e., adversse) events. M Many health iindicators arre based on extremely rare r events, such s as morttality rates. S Say the morttality rate forr the dominaant group is 1 percent (fo or a given co ondition in a given periood of time), aand 1.25 perccent for the minority group. It is a relatively small differeence, but it ccould be reprresented as a 25 percent 5-1)/1. Insteaad, assume nnow that survvival is the iindicator. Thhe differencce in mortalitty, i.e., (1.25 differencce then is (99 9-98.75)/99 = 0.252525 percent, p neaarly a 100-fold differencee. An articlee by 64 Trivedi, et e al. conclluded that diisparities bettween black and white M Medicare enrrollees who received preventive services s decllined for sev ven of nine H HEDIS qualiity measuress from 1997-- Source: S Harp per, et al.62 37 DRAFT – DO NOT CIITE, QUOTE, O OR REPRODU UCE due Sept. 7, 2 2011, 6:00 PM M ET; PUBLIC COMMENTS due Aug. 31,, 2011, 6:00 P PM ET MEMBER comments d 948 949 950 951 952 2003. When the results were recalculated using relative instead of absolute disparities and adverse events of failing to receive indicated services instead of receiving the service, four of the reductions in absolute disparities became relative increases.65 These discrepancies in interpretation—using the same underlying statistics—can become important when communicating disparities to the media.6 953 954 955 956 957 Recommendation: As above, with respect to absolute and relative comparisons, public reporting of disparities should calculate statistics using both favorable and adverse events. If the results are notably different, both statistics should be reported, allowing the reader to judge the importance by taking the context of the report into consideration. 958 4.d. Paired Comparisons versus Summary Statistics 959 960 961 962 963 964 965 966 Comparisons between two (paired) groups in a single domain are easy. But when multiple groups make up a domain, problems arise. First, making comparisons among all possible pairs of groups can be cumbersome. Second, if the groups in an ordered domain are arbitrarily defined (e.g., persons below poverty, 100 percent to 200 percent of poverty, and so on), then changing the group definition could arbitrarily change the results. Third, the sample size of one or more of the individual groups of interest may be too small to make stable estimates (see below for more detail). In these cases, it may be desirable to use a summary disparity statistic. 967 968 969 970 971 972 973 974 975 976 Healthy People 2010, for example, uses a summary measure, the index of disparity (ID), which is calculated as the average of the percentage differences from the best group rate.66, 67 The Massachusetts Office of Medicaid found that many of the hospitals participating in its statewide pay-for-performance program had very few minority patients in their fee-for-service Medicaid program and so decided to use a summary statistic similar to the index of disparity, called the Between Group Variance (BGV), to assess disparities in the quality of hospital care.68 The BGV provides a single measure of the consistency of care provided across all racial/ethnic groups treated in a hospital. It is derived by summing the variation from the average quality of care provided by the hospital that is received by members of different racial/ethnic groups, calculated as: 977 978 Where: BGV = ((ni/di – N/D)2 (di/D)) ni = the number of successfully achieved opportunities for a given racial/ethnic group 6 A problem communicating with the media about disparities led to a controversy surrounding Kevin Schulman’s high-profile 1999 NEJM article showing large odds ratios comparing whites with blacks for the likelihood of being referred for cardiac catheterization (Schulman, et al., 1999). The authors reported an odds ratio (OR) of 0.6, and the press picked up on this as blacks being 40 percent less likely to be referred. However, a letter to the editor by Frank Davidoff noted that the actual referral rates were 91 percent and 85 percent, and so in fact the black rate ratio (RR) was 93 percent that of whites, which would have appeared much less dramatic. This discrepancy occurred because of the statistical properties of ORs and RRs. In this case, had the authors reported the likelihood of not being referred, the OR and RR (blacks/whites) would have been nearly identical: 1.7 and 1.6, respectively. 38 DRAFT – DO NOT CITE, QUOTE, OR REPRODUCE MEMBER comments due Sept. 7, 2011, 6:00 PM ET; PUBLIC COMMENTS due Aug. 31, 2011, 6:00 PM ET 979 980 981 di = the total number of eligible opportunities for a given racial/ethnic group N = the total number of successfully achieved opportunities (for all groups) D = the total number of eligible opportunities (for all groups) 982 983 984 985 986 987 988 989 990 991 992 993 994 995 996 997 998 999 Summary measures have several disadvantages. First, they do not indicate which groups are doing poorly and which are doing better. This may be important for public reporting and can be essential for identifying opportunities for improvement. Second, summary statistics lack “directionality,” meaning that they may indicate that disparities exist even in cases where the direction of the comparison is one in which the historically disadvantaged group performs better than the other groups. Third, some summary measures are sensitive to the numbers of patients within each racial/ethnic group. For example, using the BGV, a provider with few minority patients would have a lower disparity than other providers even if it offered the same level of care to each group. In other words, hospitals with more diverse populations (more minorities) will appear to provide less equitable care (higher disparities) when assessed using the BGV.68 Recommendation: Because most summary measures of disparities lack “directionality,” great care must be taken before using them to track disparities. Comparisons using the historically advantaged group as the reference point should be checked to see if a positive finding from the summary statistic reflects superior care received by the disadvantaged group. If so, the context of the report and relevant policy goals need to be explicitly considered. 1000 4.e. Normative Judgments about Disparity Measures 1001 1002 1003 1004 1005 1006 1007 1008 1009 1010 1011 1012 1013 1014 1015 1016 Sometimes the choice of reporting statistics is deliberate and meant to support a particular agenda. Harper, et al. make the case that the choice of disparity measures, even if they are mathematically correct, carry with them normative judgments about which aspects of disparity reductions matter most.62 Although they cite many examples using six different case studies, one stands out for the stark contrast in values. They illustrate this point by examining a hypothetical change in smoking prevalence disparities as measured by the Index of Disparity 67 and the Mean Log Deviation. The former measure tends to weight improvements whether or not the least health group or the healthiest group makes progress. The latter measure values reductions in inequality among the least healthy groups. Their example shows a threefold difference in the change in inequality using the two measures. Another example of normative values influencing statistics is illustrated by the choice of a summary index of disparities selected for use by the CDC in its Healthy People 2010 report (http://www.healthypeople.gov/2010/data/midcourse/html/tables/dt/dt-01a.htm).69 The report includes tables that list each indicator stratified by the OMB categories and indicates the size of the relative disparity from the best group rate (the percentage difference between the best group rate and each of the other group rates). The summary index is the average of these percentage 39 DRAFT – DO NOT CITE, QUOTE, OR REPRODUCE MEMBER comments due Sept. 7, 2011, 6:00 PM ET; PUBLIC COMMENTS due Aug. 31, 2011, 6:00 PM ET 1017 1018 1019 1020 differences for a characteristic. The summary index is not weighted by the size of the population, even though some groups, such as the American Indian or Alaska Native, are quite small. This was a conscious decision at CDC to avoid a situation in which a summary index might completely miss major disparities of a small group.70 1021 1022 1023 Clearly, whether one believes it is important for society to reduce overall inequality or whether it is more important to reduce inequality among the least healthy groups, or among small minorities, will influence the choice of measure. 1024 4.f Research Resources for Disparity Measurement 1025 1026 1027 1028 1029 1030 1031 1032 1033 1034 In addition to those highlighted above, there exist a number of absolute and relative disparity methods from which to choose, as well as summary indexes (see Table 9). The most complete review of these methods can be found in a series of monographs published by CDC and the National Cancer Institute (NCI),60, 62, 67, 71, 71, 72 and a critique of those methods.73 In addition, NCI publishes a statistical software program, HD*Calc, which imports data from populationbased health registries (e.g., NCI’s Surveillance, Epidemiology, and End Results Data [SEER], the National Health Interview Survey, National Health and Nutrition Examination Survey) and can be used to monitor and trend health disparities in cancer in the United States. It can be downloaded from the NCI website at http://seer.cancer.gov/hdcalc/. The software calculates several absolute and relative disparities measures: 1035 1036 Absolute Disparity: which includes Range Difference (RD), Between Group Variance (BGV), Absolute Concentration Index (ACI), and Slope Index of Inequality (SII). 1037 1038 1039 Relative Disparity: which includes Range Ratio (RR), Index of Disparity (IDisp), Mean Log Deviation (MLD), Relative Concentration Index (RCI), Theil Index (T), Kunst Mackenbach Relative Index (KMI), Relative Index of Inequality (RII). 1040 1041 1042 The tables and graphs that the program generates can be exported. Software development was guided by NCI’s report Methods for Measuring Cancer Disparities: A Review Using Data Relevant to Health People 2010’s Cancer-Related Objectives (Harper & Lynch, 2005).72 1043 40 DRAFT – DO NOT CITE, QUOTE, OR REPRODUCE MEMBER comments due Sept. 7, 2011, 6:00 PM ET; PUBLIC COMMENTS due Aug. 31, 2011, 6:00 PM ET 1044 Table 9. Measures of Absolute and Relative Health Disparity Measures of Absolute Disparity Rate Difference = Simple arithmetic difference between two groups (usually between the less-advantaged group and the more-advantaged group). Between-Group Variance = The sum of squared deviations from a population average. The variance that would exist in the population if each individual had the average health of their social group. Absolute Concentration Index = Measures the extent to which health or illness is concentrated among a particular group. Slope Index of Inequality = Absolute difference in health status between the bottom and top of the social group distribution. Measures of Relative Disparity Rate Ratio = Measures the relative difference in the rates of the best and worst group. Index of Disparity = Summarizes the difference between several group rates and a reference rate and expresses the summed differences as a proportion of the reference rate. Relative Concentration Index = Measures the extent to which health or illness is concentrated among a particular group. Relative Index of Inequality = Measures the proportionate rather than the absolute increase or decrease in health between the highest and lowest group. Theil Index and Mean Log = Measures of disproportionality. Summaries of the difference between the natural logarithm of shares of deviation health and shares of population. NOTE: Although this table is on measures of health disparities rather than healthcare disparities, the same concepts can be applied to measuring disparities in healthcare performance. SOURCE: Harper and Lynch, 2007, as cited in Institute of Medicine, Future directions for the national healthcare quality and disparities reports.74 1045 1046 4.g. Interaction Effects 1047 1048 1049 1050 1051 1052 The most common disparity comparison is made within a single domain, such as differences among racial groups or ethnicities. However, disparities may in some cases exist only for subsets of a particular racial/ethnic group. This is known in statistical terms as an interaction effect, defined as the situation in which the effect of one group differs depending on the characteristics (or level) of the other group. This occurred in reporting the effects of the Schulman article mentioned earlier, reporting racial and gender disparities in referral for cardiac 41 DRAFT – DO NOT CITE, QUOTE, OR REPRODUCE MEMBER comments due Sept. 7, 2011, 6:00 PM ET; PUBLIC COMMENTS due Aug. 31, 2011, 6:00 PM ET 1053 1054 1055 1056 1057 1058 1059 1060 catheterizzation (see Table T 10).75 The T findingss as reportedd by the meddia were thatt blacks and women were w 40 perccent less likely to be refeerred. Howevver, as descrribed in a subbsequent NE EJM Sounding g Board, the effect of racce was modiified dependi ding on whethher the patieent was malee or 76 female, and a vice verssa. In fact, the care wass the same fo for white menn, white wom men, and blaack men. Onlly black wom men were referred at low wer rates (seee Table 10). Recommend R dation: When clear diffeerences in q quality existt by racial/eethnic substtrata, furtheer stratifica ation of resu ults will servve to highligght areas off the greatesst potential for interventio on. 1061 Table 10 0. Predicto ors of Refe erral for Ca ardiac Cath heterization n* 1062 1063 Source: Schulman, S et al., a 1999.75 1064 1065 ations 4.h. Sample Size Considera 1066 1067 1068 1069 The T identificaation of disp parities is oftten hamperedd by sample sizes becauuse many racial/eth hnic groups are a in the miinority. Thuss, disparitiess measuremeent programss (and incenttive programss) face a majjor challengee when prov viders or insttitutions havee small num mbers of minoority patients. Pay-for-perfformance prrograms need d to reliably identify prooviders that pperform welll or 42 DRAFT – DO NOT CIITE, QUOTE, O OR REPRODU UCE due Sept. 7, 2 2011, 6:00 PM M ET; PUBLIC COMMENTS due Aug. 31,, 2011, 6:00 P PM ET MEMBER comments d 1070 1071 1072 1073 1074 poorly in the area of interest.77 For a program that is designed to identify providers with low levels of disparity, this means the disparities statistic should consistently identify the same providers as either high or low performers, if their performance were to be measured repeatedly. The smaller the numbers, the more likely it is apparent disparities will reflect chance rather than true differences. 1075 1076 1077 1078 1079 1080 1081 1082 1083 Even national data sources may lack sufficient numbers of minorities for some purposes. For example, research using the CMS Hospital Quality Alliance data demonstrated that only 1/3 to 1/2 of U.S. hospitals had sufficient numbers of minority patients, depending on the condition of interest, to make stable enough estimates for ranking them to be eligible for incentive payments when disparities in care are being considered.78, 79 Likewise, even national surveys with large sample sizes may be able to provide reliable estimates for smaller racial/ethnic groups. The National Health Interview Survey (NHIS) surveys more than 75,000, and yet has small numbers of Native Hawaiian or Other Pacific Islander and American Indian or Alaska Native and persons self-identifying as having more than one race (see Table 11). 1084 1085 1086 1087 1088 1089 1090 1091 Table 11. Racial Frequencies in the 2006 National Health Interview Survey Race Frequency Percent 56,348 12,349 74.4 16.3 White only Black only Asian only 4,802 6.3 AIAN only NHOPI only White/black 621 111 420 0.8 0.1 0.6 White/Asian White/AIAN Other combinations 308 423 334 0.4 0.6 0.4 SOURCE: Division of Health Interview Statistics, National Center for Health Statistics. NOTES: AIAN is American Indian or Alaska Native. NHOPI is Native Hawaiian or other Pacific Islander. As appearing in Bilheimer 2008 Source: Bilheimer, et al., 2008.80 There are a number of options to consider. Pros and cons are described in the accompanying table (see Table 12). 1092 1093 1094 1. The racial/ethnic categories can be “rolled up” into broader categories containing more than one group. Commonly, researchers will use the OMB categories, or some combination, or even minority to non-minority. 1095 1096 1097 1098 2. Use a summary statistic such as the BGV, which considers all of the racial/ethnic groups simultaneously. This is what the Massachusetts Office of Medicaid decided to do when confronted with small sample sizes for their Pay 4 Performance program.68 1099 1100 3. Use composite quality measures. Composite measures provide a global comparison of the quality of care by combining across indicators to produce a 43 DRAFT – DO NOT CITE, QUOTE, OR REPRODUCE MEMBER comments due Sept. 7, 2011, 6:00 PM ET; PUBLIC COMMENTS due Aug. 31, 2011, 6:00 PM ET 1101 1102 “composite” or “aggregate” score. Composite scores can be generated using much smaller sample sizes than those required for single indicators. 1103 4. Over-sample minority patients, 1104 5. Combine data from two or more years. 1105 1106 1107 Table 12, Pros and Cons of Options for Dealing with Insufficient Sample Sizes Option Pros Cons Rolling up Allows analyst to choose groupings Loses data on important with sufficient numbers for analysis subgroups, potentially masking disparities that best represent the population and the policy question Summary statistics Provides a single measure of disparity, allowing easy comparisons across place and time Composites Intuitively appealing since composites are often created around a condition of interest rather than specific processes of care that are not well understood by lay public Lacks “directionality”, potentially penalizing providers that provide superior quality to disadvantaged minorities Hard to understand and thus are not very transparent Choice of summary statistic may reflect value judgments, such as the importance of equity across all groups in a domain regardless of size May have less wellunderstood statistical properties, such as rewarding providers serving less diverse populations even if quality is no better than others Loss of transparency, since the user may not understand what factors influence their creation Certain composites have undesirable properties, e.g., may be influenced by the number of measures used or by the proportion of the population eligible for each measure 44 DRAFT – DO NOT CITE, QUOTE, OR REPRODUCE MEMBER comments due Sept. 7, 2011, 6:00 PM ET; PUBLIC COMMENTS due Aug. 31, 2011, 6:00 PM ET Over-sample minorities Boosts sample size of smaller subgroups Combine data from two or more years More stable estimate of performance Composites created across clinical condition lack meaningfulness Composites created without proper statistical analysis may not “hold together” as a single construct May add to cost of data collection; Requires knowledge of important subgroups ahead of time. Loses sense of immediacy for quality improvement purposes 1108 1109 The selection of disparity measures will of necessity be context specific. 1110 1111 1112 1113 1114 Some applications (for example, statewide report cards) may need to rely on broad disparity indexes and composite measures to avoid overly cluttered tables. However, more detailed data tables should probably be included as appendices, and areas noted where the detailed data present might lead to different conclusions. 1115 1116 1117 Disparities reporting for internal quality purposes might focus on granular groups, even if differences are not statistically significant, and might examine differences in measures that are not yet nationally vetted. 1118 1119 1120 Programs for public reporting and incentive payments need to be highly transparent and more rigorous than for internal QI purposes, and therefore need to pay attention to stable group sizes and the use of strong evidence-based measures. 1121 1122 1123 Despite limits on statistical testing with small sample sizes, it may still be useful and important to examine quality data stratified by race, ethnicity, and language. Weinick, et al.28 suggest four rationales: 1124 1125 1126 Stratified data can provide a first look at trends that might be indicative of true disparities. These instances could be further explored via anecdotes and case studies. 1127 1128 Even anecdotal evidence of failure to receive high-quality care may be of interest to providers seeking to improve quality. 45 DRAFT – DO NOT CITE, QUOTE, OR REPRODUCE MEMBER comments due Sept. 7, 2011, 6:00 PM ET; PUBLIC COMMENTS due Aug. 31, 2011, 6:00 PM ET 1129 1130 1131 In some cases there will likely never be statistical significance for certain units, such as the practice level, yet these differences could still be clinically meaningful to practitioners. 1132 Small groups may represent “low-hanging fruit” for quality improvement. 1133 4.i. Risk Adjustment and Stratification 1134 1135 1136 1137 1138 1139 1140 1141 Because high-stakes performance reporting, whether as a pay-for-performance program or as public reporting, can significantly affect provider revenues, the manner in which disparities in care are examined and documented likewise has the potential to impact the resources and actions of different providers. This section considers two purposes of risk adjustment: 1) making fair comparisons among different entities (e.g., health plans, providers, health insurance exchanges) on overall quality of care metrics; and 2) reporting racial/ethnic disparities among different entities. The issues and rationales for risk adjustment are different for each purpose and so must be considered separately. 1142 1143 1144 1145 1146 1147 1148 1149 1150 1151 Risk adjustment and stratification defined. The two major approaches to framing performance by demographic characteristics are case mix adjustment and stratification. Risk adjustment and stratification are both ways of addressing the confounding influence of variables such as race/ethnicity, SES, primary language, and insurance status on health outcomes. In stratification, a given population is divided into subpopulations. For categorical variables, such as ethnicity, this yields groups such as Hispanic and Asian. Continuous variables, such as income, must be grouped into strata, e.g., less than 300 percent of the Federal Poverty Level (FPL) versus greater than 300 percent FPL. The relative risk of the outcome or variable of interest is then calculated for each substratus and can be compared among groups. Risk adjustment uses multivariable regression analyses to account for the effect of confounders. 1152 1153 1154 1155 1156 1157 1158 1159 Exception reporting. While it does not directly use demographic characteristics, exception reporting, as practiced in the United Kingdom, may also affect the way that a provider’s demographic case mix influences performance.7 In 2004 the United Kingdom implemented a pay-for-performance contract for family practitioners in which providers received additional reimbursement for meeting specific quality indicators. To decrease the pressure this generates for providers to avoid high-risk patients, providers were allowed to exclude certain patients from the calculation of their performance data, known as “exception reporting.” The basic idea is that by excluding certain patients from their denominator populations, this design 7 Doran, et al. show that practices caring for higher proportions of disadvantaged patients had only marginally higher exclusion rates. Additionally, although the performance of practices caring for large proportion of “deprived” populations had somewhat lower performance than those caring for predominantly “non-deprived” populations (4.6 percent lower than that serving the least-deprived population), this gap narrowed over just 2 years to 1.21 percent, suggesting that, even without reimbursement tied directly to reduction of disparities, the United Kingdom pay-forperformance initiative had the effect of reducing disparities in care. However, the authors note the poorest performing practices still remained in the most deprived areas (Doran, et al., 2008), with these providers still exposed to financial liability due in part to the high-risk communities they serve. 46 DRAFT – DO NOT CITE, QUOTE, OR REPRODUCE MEMBER comments due Sept. 7, 2011, 6:00 PM ET; PUBLIC COMMENTS due Aug. 31, 2011, 6:00 PM ET 1160 1161 1162 1163 1164 1165 1166 feature protects physicians from being penalized for avoiding the provision of inappropriate care to patients simply to boost performance (e.g., patients with terminal illness or intolerance of standard therapy).81 Other reasons for exclusion (e.g., new patients, patients who miss appointments, and patients refusing treatment) insulate physicians from patient or practice considerations that undermine the ability to meet quality metrics. To avoid gaming or attempts to avoid addressing underlying performance issues, the rates of exclusion reporting must be monitored carefully. 1167 4.i.i. Risk Adjusting Overall Quality Metrics for Race/Ethnicity 1168 1169 1170 1171 1172 1173 1174 1175 1176 1177 1178 1179 1180 1181 1182 1183 High-stakes incentive programs, such as pay-for-performance and public reporting, have been criticized for fostering concentration of resources among providers of care to low-risk patients or populations, thereby encouraging provider selection of these low-risk populations.82 This both undermines access to care for vulnerable populations, such as the poor and racial and ethnic minorities, and leaves their existing providers with fewer resources to provide care and invest in quality improvement.83 In addition, the revenue sources of these providers may be further diminished if employers, health plans, and consumers opt not to use the services of these institutions on the basis of their performance.84 This point of view is illustrated by a recent letter from the American Hospital Association (AHA) to Donald Berwick, M.D., M.P.P, Administrator for CMS, to add variables for race and limited English proficiency to its risk-adjustment methodology as part of the Hospital Readmissions Reduction Program (HRRP).85 AHA expressed concerns that “the HRRP may disproportionately affect hospitals serving a large number of minorities. And, by penalizing these hospitals, the HRRP will in turn disproportionately harm minority patients.” Demographic case-mix adjustment, demographic stratification, and exclusion of outliers collectively mitigate these pressures. However, each approach has limitations. 1184 1185 1186 1187 1188 1189 1190 1191 1192 1193 1194 1195 1196 1197 1198 Demographic case mix adjustment accounts for the generally poorer performance of racial/ethnic minorities and the poor on quality measures. In so doing, it provides some financial protection for providers of these vulnerable populations and reduces incentives for providers and health plans to avoid serving these groups. However, risk adjustment has been criticized for its low transparency and potential to institutionalize poor performance by “setting a lower bar” for providers with large numbers of minority patients. Because the performance of different groups is obscured, it does not provide any mechanism for tracking and rewarding the improvement of care for vulnerable populations who may be receiving substandard care. For example, when quality scores are adjusted by race/ethnicity case mix, it may be easier for a provider to improve its overall quality score by focusing on low-risk groups, rather than addressing the group receiving poorer quality care.84 In addition, adjustment by race/ethnicity may only affect performance on quality measures for a few institutions caring for large portions of racial/ethnic minorities.86 In other words, for all but the providers of large numbers of the vulnerable, risk adjustment may fail to take advantage of the tremendous potential of quality measures to help eliminate disparities among providers of smaller portions of vulnerable communities. NQF notes 47 DRAFT – DO NOT CITE, QUOTE, OR REPRODUCE MEMBER comments due Sept. 7, 2011, 6:00 PM ET; PUBLIC COMMENTS due Aug. 31, 2011, 6:00 PM ET 1199 1200 1201 1202 that, “In order to drive improvement…National and local healthcare quality efforts and activities should adopt a specific goal of eliminating disparities in healthcare quality.”20 By rendering opaque the performance of the poor and racial/ethnic minorities, adjustment removes incentives to eliminate disparities and may therefore act to institutionalize low-quality care.83, 84 1203 1204 1205 1206 1207 1208 1209 1210 1211 1212 1213 In lieu of demographic case-mix adjustment, a number of consensus-building organizations and researchers, including the IOM,1, 3 AHRQ,23 and previous NQF reports, have advocated for racial/ethnic stratification of quality measures.20, 84 Stratification makes the quality of care of the most vulnerable groups plain, highlighting disparities in care between groups where adjustment obscures them.87 This helps raise awareness of disparities in care, supporting its presence on the national healthcare agenda and the development of accountability for these differences within and between institutions. In addition, the improved transparency afforded by stratification produces opportunities for providers to develop targeted interventions and allows the construction of pay-for-performance practices that provide targeted rewards to providers who give high-quality care to vulnerable groups and also to reward improvement over time in minimizing disparities in quality of care.83, 84 1214 1215 1216 1217 1218 1219 1220 1221 1222 Illustrating the advantage of stratifying results by demographic variables, the IOM Subcommittee notes in its 2009 report, “Common to virtually all successful [quality improvement] projects are some fundamental steps, including the acquisition of data on race and ethnicity, the stratification of quality-of-care data by race and ethnicity, the use of race and ethnicity to identify members of a target population to whom elements of an intervention would apply, and reanalysis of stratified quality data to evaluate the impact of the activities.”23 Furthermore, during this nascent phase of measuring disparities in healthcare, stratifying results will help identify the measures that have the greatest potential to highlight disparities and therefore provide opportunities for intervention and improvement.20 1223 1224 1225 1226 1227 1228 1229 1230 1231 1232 1233 1234 Despite these advantages, stratification is not without pitfalls. As with adjustment, it may have limited utility for providers of smaller numbers of the poor or racial/ethnic minorities, because meaningful stratified results require that a provider/organization have a certain number of racial/ethnic minority patients.83 In addition, data, reported by provider, can create a scenario in which the provider both appears to be responsible and is financially liable for providing lowquality care, when many of the forces leading to health disparities are beyond the scope of interventions available to individual providers, groups, and even institutions. Stratification also does not account for the impact of providing care to a very large portion of high-risk, vulnerable people on an institution’s resources and operations. Such providers may still perform worse on performance measures, even for their low-risk populations. In these matters, stratification still leaves providers who serve predominantly disadvantaged communities vulnerable to financial liability that may ultimately undermine their ability to invest in quality improvement. 1235 1236 1237 In summary, by increasing the transparency of healthcare disparities, stratifying performance on quality measures by racial/ethnic and demographic variables offers the advantages of an integrated approach to measurement, incentive, and intervention, although it 48 DRAFT – DO NOT CITE, QUOTE, OR REPRODUCE MEMBER comments due Sept. 7, 2011, 6:00 PM ET; PUBLIC COMMENTS due Aug. 31, 2011, 6:00 PM ET 1238 1239 1240 1241 1242 1243 1244 1245 1246 1247 still leaves providers financially vulnerable to forces beyond their control. The optimal approach will depend on the purpose of quality measurement and may ultimately require a combination of approaches to provide a balance of incentives and financial protection. Work by the VA suggests that inclusion or exclusion depends on the level of control attributed to the provider. Hebert, et al. (2010) argue that models of hospital quality should not control for race/ethnicity for process measures that occur within the institution, but should control for race/ethnicity when looking at outcomes such as survival, which depends more on community level resources (over which hospitals have less influence).88 Even this reasoning may change in the future as more incentive programs such as CMS’s readmission program and many of the medical home pilots based on Wagner’s chronic care model encourage providers to connect with community partners. 1248 1249 1250 1251 Recommendation: Stratification by race/ethnicity and primary language should be performed when there is sufficient data to do so. Risk adjustment may be appropriate when performance is highly dependent on community factors beyond a provider’s control. 1252 1253 1254 1255 1256 1257 Finally, it may be that we are considering risk adjustment at the incorrect leverage point. If indeed disadvantaged populations are more difficult to treat and require more resources in to bring performance levels up to those of providers with more advantaged patients, then perhaps a better strategy would be to risk adjust payments to providers, while holding them accountable for equitable performance and outcomes. Clearly such an approach would need testing before implementation. 1258 1259 4.i.ii. Risk Adjusting Racial/Ethnic Disparities for Socioeconomic and Other Contributory Factors 1260 1261 1262 1263 1264 1265 The issue addressed here is whether equity reports that stratify results by race/ethnicity and language should be adjusted (or controlled) for socioeconomic status. Socioeconomic status is one of the most important determinants of health and healthcare utilization. Low-income persons are exposed to more life stresses, live in less healthful environments, are subjected to advertisements for unhealthy products, and live in “food deserts” where healthy foods are less available. 1266 1267 1268 1269 1270 1271 Given that a racial/ethnic disparity exists, risk adjustment is an important research tool that can be used to identify the underlying mechanisms or contributory factors that explain the observed differences. For example, members of a Latino population may have relatively low incomes and lower rates of insurance. If health insurance and low income are also related to the performance measure, then controlling or adjusting for these variables will tend to make the significant disparities findings “go away,” or at least become non-statistically significant. 1272 1273 1274 The question is, “…If the discrepancies in service use between whites and minorities are ‘explained’ by SES or insurance, does that mean there are no racial/ethnic disparities?”90 We believe the answer is “no.” First, once one begins to control for selected socioeconomic 49 DRAFT – DO NOT CITE, QUOTE, OR REPRODUCE MEMBER comments due Sept. 7, 2011, 6:00 PM ET; PUBLIC COMMENTS due Aug. 31, 2011, 6:00 PM ET 1275 1276 1277 1278 1279 1280 1281 1282 variables, there is no logical limit to how many variables might be added to the equation, including such important mechanisms as patient preferences, availability of good public transportation, literacy levels, and so on. The more variables that are considered, the less likely the main effect of racial/ethnic grouping will remain significant. Second, one should consider the end user, in this case perhaps a minority patient trying to choose among different health plans, providers, or health insurance exchanges, based upon the equity of care provided to its members. Would providing information that says there are no disparities because they are explained by SES serve the needs of that consumer? We think not. 1283 1284 1285 1286 1287 1288 For these reasons, we recommend that stratified models should not be adjusted for SES. The basis of this belief is that differences in income and other aspects of SES are part of the social disadvantage that a racial/ethnic group might experience; controlling for SES variables therefore corresponds to an unrealistic hypothetical world in which such disadvantages have been eliminated, rather than describing the current situation of the racial/ethnic group. Disparities are still unfair, even if they can be explained by differences in socioeconomic position. 1289 1290 1291 1292 1293 1294 1295 1296 1297 1298 1299 1300 An optional strategy would be to stratify the race/ethnicity rates by a limited number of explanatory variables such as SES, insurance status, gender, age, or primary language, when there is sufficient data to do so.74,89 By stratifying by more than one demographic characteristic simultaneously, stratification can also help focus attention on particularly vulnerable communities at the intersection of multiple risk factors, such as care of racial and ethnic minorities with low SES or racial/ethnic minorities who speak English as a second language,91 while illustrating the independent and combined contributions of each demographic risk factors. Indeed, in the IOM report Future Directions for the National Healthcare Quality and Disparities Reports, the committee recommended that data be presented by race, ethnicity, SES, insurance status, and language, and that data stratified by race and ethnicity be reported simultaneously in two ways: both stratified by SES and adjusted for SES to examine further the potential mediating role of SES in quality performance.74 1301 1302 1303 1304 1305 It may be possible to display the data in a manner that recognizes the contribution of both racial/ethnic and SES variables. See, for example, the bar charts in Figure 8 and Figure 9, where each bar represents an income group within a specific race/ethnicity. Such a display allows the viewer to separate racial/ethnic and SES aspects of disparity and avoids masking the “main effects” differences. 1306 1307 1308 1309 Recommendation: Performance reports stratified by race/ethnicity should not be risk adjusted by SES or other contributory factors, and instead could optionally be stratified by SES if the data permit. 50 DRAFT – DO NOT CITE, QUOTE, OR REPRODUCE MEMBER comments due Sept. 7, 2011, 6:00 PM ET; PUBLIC COMMENTS due Aug. 31, 2011, 6:00 PM ET 1310 Figure 8. 8 Income and a Disparities 1311 1312 1313 1314 Source: Robert R Wood Johnson J Foundation, Overcoming Obsttacles to Hea alth. Available at www.rwjf.o org/files/resea arch/obstaclestohealth.pdff. Last accesssed July 2011. 51 DRAFT – DO NOT CIITE, QUOTE, O OR REPRODU UCE due Sept. 7, 2 2011, 6:00 PM M ET; PUBLIC COMMENTS due Aug. 31,, 2011, 6:00 P PM ET MEMBER comments d 1315 1316 1317 1318 1319 Figure 9. Income an nd Disparities Source: Roberrt Wood Johnson Foundation, Overcom ming Obstacless to Health. Available A at ww ww.rwjf.org/filles/research/o obstaclestohe ealth.pdf. Lasst accessed July 2011. 52 DRAFT – DO NOT CIITE, QUOTE, O OR REPRODU UCE due Sept. 7, 2 2011, 6:00 PM M ET; PUBLIC COMMENTS due Aug. 31,, 2011, 6:00 P PM ET MEMBER comments d 1320 4.j. Disparities Between and Within Providers (Geographic Variation) 1321 1322 1323 1324 1325 1326 Whereas much of the literature on disparities implies differential treatment by practitioners or institutions, perhaps due to bias, racism, or lack of cultural competency, another possible explanation is that minorities tend to receive care from lower-quality providers. This may be due to where they live, where they seek care, or where they are steered to seek care. An emerging literature now suggests that aggregate (e.g., national or regional) differences in care are probably due to a mix of the two phenomena.92, 93 1327 1328 1329 1330 1331 1332 1333 1334 1335 1336 1337 1338 1339 1340 1341 1342 1343 1344 1345 1346 1347 1348 1349 1350 1351 1352 1353 1354 1355 1356 1357 A study by Gaskin, et al., for example, found that when whites, blacks, Hispanics, and Asians were admitted for similar conditions to the same hospital, performance on AHRQ’s riskadjusted quality and safety indicators was not different.94 However, what is becoming increasingly clear is that care of racial minorities is concentrated among certain providers,92 and that they tend to perform poorly on quality measures. Jha, et al.95 showed that hospitals with higher volumes of black patients were associated with having lower quality care for acute myocardial infarction (AMI). Werner, et al. 63 found that hospitals with high percentages of Medicaid patients (disproportionately minority) had lower performance using CMS’ Hospital Compare data. In a study of hospital quality of care using the National Hospital Inpatient Quality Measures from the Hospital Quality Alliance, national disparities persisted after controlling for age, gender, source of payment, and comorbidities. Once site of care was taken into consideration, the adjusted disparities were smaller and in some cases not significantly different from zero.49 A similar pattern can be seen at the level of the health plan, with racial and ethnic minorities enrolled disproportionately in inferior plans. For example, Schneider, et al. found that health plans in the lowest tertile of black enrollment had breast cancer screening rates of 76 percent for whites and 74 percent for blacks, while health plans in the highest tertile of black enrollment had breast cancer screening rates of 60 percent for whites and 58 percent for blacks, with no significant difference in quality of care between blacks and whites once health plan was taken into consideration.96 There was greater difference in quality of care between health plans than within health plans. Differences in health plan quality also accounted for more than half of the racial disparities in rates of eye exams in diabetics and use of beta blocker post-MI. Because people tend to obtain medical care close to where they live, examinations of geographic patterns in disparities also suggest that inter-provider practice differences play an important role in generating disparities. In other words, racial and ethnic minorities may live in areas where they have less access to care or access to a generally lower quality of care. Skinner, et al., 97 found that black women and Hispanic men and women tended to live in regions where lower rates of knee arthroplasty (a surgical procedure to relieve pain and improve function of patients with disease of the knee) were observed even for whites. In some regions there was no significant difference between rates of arthroplasty between white and black women; regions where there was a significant difference were characterized by higher degrees of residential segregation. Because geographic barriers are particularly significant for people with limited resources, racial 53 DRAFT – DO NOT CITE, QUOTE, OR REPRODUCE MEMBER comments due Sept. 7, 2011, 6:00 PM ET; PUBLIC COMMENTS due Aug. 31, 2011, 6:00 PM ET 1358 1359 and ethnic minorities and people with low incomes have less opportunity to seek alternative providers. 1360 1361 1362 1363 1364 1365 1366 1367 1368 1369 1370 1371 What is not clear from these studies is the degree to which the quality of care is diminished by the inferior qualifications of the providers or the inferior resources available to them. Demonstrating the importance of both of these factors, Bach, et al., 92 showed that physicians who treated predominantly black patients were less likely to be board certified than physicians who treated mostly white patients, but also were more likely to report greater difficulty accessing specialty care and radiology. This latter point was demonstrated clearly in a study of revascularization (heart surgery) looking at rates of underuse, that is, failure to receive the procedure even when the benefits clearly outweighed the risks.98 No differences were found by race or ethnic group within hospitals, but hospitals that provided on-site revascularization had significantly higher procedure rates. In that study, which took in New York City, eight out of nine private hospitals provided on-site revascularization, whereas only one out of four municipal hospitals provided that service. 1372 1373 1374 1375 1376 1377 This debate over “who you are versus where you are treated” has policy significance because the answer may determine whether resources are committed to efforts to reduce prejudicial treatment by practitioners, to improve the quality of care in organizations that serve high volumes of minorities, or to implement policies that equalize access to high-quality providers. Some approaches that policymakers might consider are described in the following section 5. 1378 4.k. Summary Table 1379 1380 Table 13. Summary Table of Recommendations for Measuring and Monitoring Disparities Methodological Issue Choice Recommendation A reference point is “the In this report, we believe that for purposes Reference specific value of a rate, of achieving equity in healthcare that is fair Points percent, proportion, mean or and just, the choice of the reference group other quantitative measure should always be the historically relative to which a disparity advantaged group. is measured.”60 Disparities are frequently measured among groups in a domain.8 The choice of a disparity measure can lead Absolute versus Absolute and relative changes in disparities can to different interpretations when making Relative yield different conclusions comparisons over time or among providers. Disparities about whether or not gaps Therefore, both absolute and relative are closing. statistics should be calculated, and if they 8 Disparities can also be measured from a reference point that is not a group characteristic. For example, one could compare each group against the unweighted mean of all the groups in the domain or to a benchmark or goals. The goal (e.g., from Healthy People reports) has intuitive appeal because it implies that all groups could improve. However, in this paper we have chosen to concentrate on differences between groups. 54 DRAFT – DO NOT CITE, QUOTE, OR REPRODUCE MEMBER comments due Sept. 7, 2011, 6:00 PM ET; PUBLIC COMMENTS due Aug. 31, 2011, 6:00 PM ET Favorable versus Adverse Measures Measuring rates of adverse and positive events can yield different conclusions about whether or not gaps are closing. Paired Comparisons versus Summary Statistics Comparisons among multiple groups can be difficult because they can be cumbersome, changing the group definition could arbitrarily change the results, or the sample size of one or more of the individual groups of interest may be too small. Summary statistics can address these issues but obscure important information. Interaction effect is defined as the situation inw hich the effect of one group differs depending on the characteristics (or level) of the other group. Case mix adjustment and stratification are ways to avoid punitive effects of pay-for-performance affecting providers with disproportionately large poor and vulnerable populations. Should displays stratified by race/ethnicity be adjusted for income or other SES variables? Interaction Effects Risk Adjustment and Stratification 1381 Consideration of Socioeconomic and Other Demographic Variables lead to conflicting conclusions, both should be presented, allowing the reader to make their own interpretation. As above with respect to absolute and relative comparisons, public reporting of disparities should calculate statistics using both favorable and adverse events. If the results are notably different, both statistics should be reported, allowing the reader to judge the importance by taking the context of the report into consideration. Because most summary measures of disparities lack “directionality,” great care must be taken before using them to track disparities. Comparisons using the historically advantaged group as the reference point should be checked to see if a positive finding from the summary statistic reflects superior care received by the disadvantaged group. If so, the context of the report and relevant policy goals need to be explicitly considered. When clear differences in quality exist by racial/ethnic substrata, further stratification of results will serve to highlight areas of the greatest potential for intervention. Stratification by race/ethnicity and primary language should be performed when there are sufficient data to do so. Risk adjustment may be appropriate when performance is highly dependent on community factors beyond a provider’s control. Performance reports stratified by race/ethnicity should not be risk adjusted by SES or other contributory factors, and instead should be further stratified if the data permit. 55 DRAFT – DO NOT CITE, QUOTE, OR REPRODUCE MEMBER comments due Sept. 7, 2011, 6:00 PM ET; PUBLIC COMMENTS due Aug. 31, 2011, 6:00 PM ET 1382 1383 5. Priorities and Options for Quality Improvement and Public Reporting of Healthcare Disparities 1384 5.a. What Should be Achieved from Disparities Measurement? 1385 1386 1387 1388 1389 1390 1391 1392 1393 1394 1395 The purpose of this report is to provide guidance to an NQF Steering Committee charged with selecting and evaluating disparity-sensitive quality measures, to describe methodological issues with disparities measurement, and to identify cross-cutting measurement gaps in disparities and cultural competency. Performance measurement has become one of the fundamental strategies for monitoring the quality of care that health plans and medical groups deliver. To date, quality measurement has not been used on a large scale to assess whether that quality is provided equitably. Therefore, the ability to measure and compare performance for subpopulations of patients both within and across providers is key to improving clinical care and should serve to counter social biases and perhaps financial incentives to under-provide care to select populations. Disparities measurement should achieve the following policy goals (adapted from RAND 201199): 1396 1397 monitor progress toward disparities reduction; 1398 1399 inform consumers and purchasers to enable selection of providers based on the provision of equitable care; 1400 1401 stimulate competition among providers to provide the highest quality of care to disadvantaged populations; 1402 1403 stimulate innovation in methods for providing culturally sensitive care to all populations, regardless of race/ethnicity or English proficiency; and 1404 promote the “values” of the health system. 1405 1406 1407 5.b. What Should be Avoided? Challenges in Program Design and the Potential for Unintended Consequences 1408 1409 1410 1411 1412 1413 1414 Disparities and quality measurement can lead to unanticipated and adverse consequences in a variety of ways, especially given how these measures may be used for payment reform.20 Pay-for-performance (P4P) programs, for example, have been increasingly used to incent quality improvement and decrease costs of healthcare. P4P programs work by ranking providers (or setting performance targets) and then awarding incentives based on achievement. The idea is that payers need to counteract the occasionally perverse incentives of the fee-for-service system, which many feel over-produces certain services while under-producing value. While evidence is 56 DRAFT – DO NOT CITE, QUOTE, OR REPRODUCE MEMBER comments due Sept. 7, 2011, 6:00 PM ET; PUBLIC COMMENTS due Aug. 31, 2011, 6:00 PM ET 1415 1416 still accumulating about whether P4P improves care, 100 questions have been raised as to whether this payment strategy might reduce—or exacerbate—disparities (see Figure 10). 1417 1418 1419 1420 1421 Minority patients tend to have poorer outcomes than majority patients.17 Providers may be motivated to “cherry-pick” patients they perceive as most likely to improve their quality scores (or may take the converse action of “lemondropping”). This could lead to reduced access for minorities.83, 101-103 1422 1423 1424 1425 1426 1427 1428 1429 1430 1431 1432 1433 1434 1435 Hospitals that serve large numbers of minority patients could be disadvantaged in high-stakes incentive programs. Research suggests that P4P mostly rewards wellresourced providers—“the rich get richer” phenomenon.104 If hospitals serving many minorities have lower quality than other hospitals, 95 then excluding these under-resourced hospitals from receiving incentive payments could worsen care for their populations.105, 106 For example, the Affordable Care Act directs the Center for Medicare and Medicaid Services (CMS) to reduce payments to hospitals with excessively high readmission rates starting in 2014. Although the details of who will be penalized are not yet finalized, a substantial number of hospitals are likely to experience reductions in payments due to their high readmission rates. Minority patients are doubly disadvantaged in this regard. Black patients have higher readmission rates than whites, and patients from highminority hospitals have higher readmission rates than those from other institutions.17 1436 1437 1438 1439 “Teaching to the test” refers to focusing on what is measured rather than what is most important for improving patient outcomes. This may result in the inappropriate provision of services to patients (e.g., antibiotics for patients before the diagnosis of pneumonia is confirmed).107 1440 1441 1442 1443 1444 1445 1446 1447 “Shifting unsustainable resources”—Another possible consequence of teaching to the test is that real improvements may be achieved in the short term but only through a level of resource commitment which in certain facilities cannot be sustained. As a result there is a tendency for resource commitment and performance to drop back to the pre-incentive baseline after the incentive is gone. It is also essential to choose the metrics wisely because there will always be a shift of resources to improve incented performance that will come at the expense of other potentially worthy initiatives. 1448 1449 1450 1451 “Gaming the system”—If not carefully designed, healthcare providers faced with third-party quality measures may change what they do in a way that yields better measured quality but no real improvement in quality of care. For example, at Kaiser Permanente, the performance improvement department found that certain 57 DRAFT – DO NOT CITE, QUOTE, OR REPRODUCE MEMBER comments due Sept. 7, 2011, 6:00 PM ET; PUBLIC COMMENTS due Aug. 31, 2011, 6:00 PM ET 1452 1453 1454 minority physicians were leaving high-minority services areas to avoid a disproportionate number of minority patients, who tended to rate physicians lower compared with non-minority patients.108 1455 1456 1457 1458 1459 1460 1461 “Color–blind” quality improvement programs could fail to reduce disparities if minority patients do not benefit from them to the same degree as majority patients. One study simulated the effects of P4P using the national Hospital Quality Alliance data for all U.S. non-federal acute hospitals and found that traditional “color-blind” programs would have only small effects on disparities, and recommended that hospitals be judged directly on quality gaps between minority and majority patients.78 1462 1463 1464 Patients differ in their ability to take advantage of public reporting. Patients with LEP or poor literacy skills may be unable to benefit from publicly reported information.83 1465 1466 1467 1468 National or regional disparities may be due to differences in where minority patients receive their care rather than differences among race/ethnicities within provider settings. P4P programs be definition focus on within-provider disparities, and thus may miss important opportunities. 1469 1470 1471 Disparities in care may reflect overuse among privileged populations rather than underuse among minority populations. Reducing the disparity in such a situation would not improve the overall quality of care. 1472 1473 1474 1475 1476 1477 1478 1479 1480 1481 1482 Despite the concerns raised above, there is a remarkable lack of evidence to guide the design of incentive programs to reduce disparities. A systematic review of the P4P literature conducted in 2007 found only one empirical article out 536 that examined both performance incentives and racial disparities.101 However, to date no large-scale P4P program has fully implemented this approach, although Massachusetts began such an initiative for its Medicaid fee-for-service program as mandated by the state’s 2006 health reform law. A recent study of that program 68 found that its implementation was hampered because of relatively small disparities among the measures used, lack of buy-in from the provider community around structural measures, and the concentration of minorities in only a few hospitals. In the final section in this paper, we explore alternative policy options that address these design challenges. 58 DRAFT – DO NOT CITE, QUOTE, OR REPRODUCE MEMBER comments due Sept. 7, 2011, 6:00 PM ET; PUBLIC COMMENTS due Aug. 31, 2011, 6:00 PM ET 1483 1484 1485 1486 1487 Figure 10. 1 Possible Unintended Effectts of QI Pro ograms Source: Green, G et al., 2010. 2 59 DRAFT – DO NOT CIITE, QUOTE, O OR REPRODU UCE due Sept. 7, 2 2011, 6:00 PM M ET; PUBLIC COMMENTS due Aug. 31,, 2011, 6:00 P PM ET MEMBER comments d 1488 60 DRAFT – DO NOT CITE, QUOTE, OR REPRODUCE MEMBER comments due Sept. 7, 2011, 6:00 PM ET; PUBLIC COMMENTS due Aug. 31, 2011, 6:00 PM ET 1489 5.c. What Measures Should be Selected? 1490 1491 We recommend the following to create a set of measures that organizations can use to identify and track disparities in healthcare. 1492 1493 Step 1: Assess the portfolio of NQF performance measures using disparities-sensitive principles, with special emphasis on quality gap and prevalence. 1494 1495 1496 1497 1498 Recommendation: We recommend that all existing performance measures should be evaluated against the guiding principles established by the NQF Steering Committee and TAP that produced the report on consensus standards in 2008.20 The guiding principles are: 1) prevalence, 2) impact of the condition, 3) impact of the quality process, 4) quality gap, and 5) ease and feasibility of improving the quality process. 1499 1500 1501 1502 1503 1504 1505 Recommendation: We recommend that all of the NQF measures should be cross-walked with the literature on known areas of disparities, beginning with AHRQ’s National Healthcare Disparities and Quality Report, the Institute of Medicine’s Unequal Treatment Report,1 and then a new review of the disparities literature since the publication of Unequal Treatment. All NQF measures that can be matched (at least partially if not identically) to disparities that have been documented in at least one of the sources mentioned should be considered as candidates for disparities-sensitive measures. 1506 1507 Recommendation: We recommend the use of the 35NQF-endorsed ambulatory practitioner- and group-level performance measures that are sensitive to disparities. 1508 Step 2: Apply new criteria for disparities sensitivity. 1509 1510 1511 1512 1513 Recommendation: When NQF does not have access to performance data stratified by race/ethnicity, or when known disparities do not exist, a set of additional criteria can be applied to determine potential disparities sensitive measures. 1 These include: care with a high degree of discretion, communication-sensitive services, social determinantdependent measures, and outcomes rather than process measures. 1514 1515 1516 1517 1518 1519 1520 1521 1522 Recommendation: In reviewing the NQF endorsed standards for sensitivity to disparities, we identified six different types of disparities sensitive measures: 1) practitioner performance measures; 2) consumer surveys that measure the patient experience; 3) hospital, ambulatory care center, home health nursing home performance measures; 4) measures of ambulatory care-sensitive conditions and management; 5) measures associated with cultural competency; and 6) patient-centered measures. After assigning a measure to a category, each measure should be assessed further according to a set of characteristics that include whether: 1) a measure is condition specific (CC) or crosscutting (CS); 2) whether it is considered structure, process or outcome; and 3) whether 61 DRAFT – DO NOT CITE, QUOTE, OR REPRODUCE MEMBER comments due Sept. 7, 2011, 6:00 PM ET; PUBLIC COMMENTS due Aug. 31, 2011, 6:00 PM ET 1523 1524 1525 1526 1527 1528 the roots of the disparities are provider based, patient based, system based, or related to health insurance. Our recommendation is that a full set of NQF-endorsed measures should be analyzed according to this system of categorization, not as a way of determining disparities sensitivity, but rather as a way of understanding the range of measures used to identify disparities. Step 3: Developing new disparities-specific measures. 1529 1530 1531 1532 1533 1534 1535 Recommendation: We recommend developing disparities-specific measures for areas of care in which research has shown disparities exits but for which no current quality measure exits. These are distinguished from disparities-sensitive measures, a term that includes any current quality measure in which disparities have already been identified. These measures can be developed based on a review of the disparities literature, crosswalking this with the existing NQF measures to ensure that no current measure exists, and developing a new disparities-specific measure. 1536 1537 1538 1539 Recommendation: Another option for identifying new disparities-sensitive measures is to search for processes or services that occur at various points along the clinical pathway. We recommend that disparities measures represent a complete and comprehensive view of care, not just one point along the clinical pathway. 1540 1541 1542 1543 1544 1545 1546 1547 1548 1549 1550 Recommendation: Finally, our recommendation includes tracking the progress of NPP and MAP because any effort in disparities measurement should be synchronized with their work whenever possible. Priorities NPP has targeted for improvement are proven ways to eliminate harm, waste, and disparities, including action in the areas of payment, public reporting, quality improvement, and consumer engagement. MAP will provide direction direct input to HHS on preliminarily identifying performance measures available for benchmarking and improvement purposes, including advice on measures needed for specific care settings, care providers, and patient populations. These priorities and goals provide opportunities for immediate action and measurement and include measures such as preventable re-admission and equitable access to care, which can be included in disparities-sensitive measures. 1551 5.d. Current Practices and Real-World Lessons 1552 1553 1554 There are a limited number of healthcare organizations nationally that are routinely monitoring quality by race and ethnicity, and thus few lessons from the field. Here is a brief overview of research and examples from the field, as well as current practices and key lessons: 1555 1556 1557 5.d.i. Federal and State Government Although CMS obtains self-reported data on race or ethnic background from Social Security Administration records, beneficiaries who enrolled before 1980 were recorded only as 62 DRAFT – DO NOT CITE, QUOTE, OR REPRODUCE MEMBER comments due Sept. 7, 2011, 6:00 PM ET; PUBLIC COMMENTS due Aug. 31, 2011, 6:00 PM ET 1558 1559 1560 “black,” “white,” or “other.”109 Thus, CMS recently imputed data on race or ethnic background for all Medicare beneficiaries, allowing researchers to begin to examine disparities in more detail.110 1561 1562 1563 At the state level, Massachusetts mandated the collection of race/ethnicity data in hospitals and health plans as part of the disparities reduction legislation in the nationally recognized healthcare reform initiative that the state passed in 2007.111 1564 1565 1566 1567 Massachusetts is also one of only a few in the country to require self-reported race/ethnicity by health plans; but due to pressure from stakeholders, the state set a floor that requires reporting on only 5 percent of membership by 2012.37 Thus, the majority of race/ethnicity fields in the submitted claims are empty. 1568 1569 1570 1571 1572 1573 The Massachusetts Health Disparities Council has devoted considerable effort to preparing a Health Disparities Report Card that will help policymakers, payers, providers, and consumer advocates focus on key disparities. The Report Card Working Group (RCWG), convened in February 2009, was tasked with developing a Massachusetts Report Card. The report card is intended to provide the Health Disparities Council with current health outcome data by race and ethnicity, highlight emerging trends, and inform policy recommendations. 1574 1575 1576 1577 1578 1579 1580 Through a deliberative process, consensus was reached to have the Report Card emphasize how rates of asthma, diabetes, obesity, heart disease and stroke, and infant mortality vary by race and ethnicity. Social determinants such as education and income, and environmental factors will also be included to provide insight on possible remedies outside of strictly medical interventions. Communities with poor health indicators will also be compared to communities with good health indicators. The RCWG met approximately monthly. The meetings resulted in the RCWG presenting an outline of tasks for developing the report card, which included: 1581 1582 1583 1584 1585 1586 1587 1588 1589 1590 1591 identifying a subset of all useful indicators from which high-priority indicators will be selected for publication in the report card; selecting initial indicators to work on for initial inclusion on the report card; selecting criteria for justifying inclusion; looking at policies that address specific issues identified by the group for initial inclusion on the report card; creating a scoring system for describing how Massachusetts is performing in areas identified as part of the report card; and producing a summary report card . In addition, the following criteria were established and considerations presented by the RCWG in consultation with the HDC for including indicators on the MA report card. They were: 1592 availability of information; 1593 size of the disparity; 1594 amenability to intervention; 63 DRAFT – DO NOT CITE, QUOTE, OR REPRODUCE MEMBER comments due Sept. 7, 2011, 6:00 PM ET; PUBLIC COMMENTS due Aug. 31, 2011, 6:00 PM ET 1595 presence of policies that would impact the disparity; 1596 provision of justification for inclusion; and 1597 1598 consideration of grouping disparities that may be amenable to a common set of interventions. 1599 1600 1601 1602 Finally, the RCWG imbedded the Report Card within the Massachusetts Framework for the Elimination of Racial and Ethnic Health Disparities by recommending that the framework be used to evaluate how each indicator selected by the RCWG is impacted by each sector identified in the framework. 1603 1604 1605 1606 Key Lessons: Mandating the collection of data on patient race, ethnicity, language, and highest level of education is a successful way of building the foundation for monitoring quality by race and ethnicity. 1607 1608 1609 Hospitals can effectively collect these patient demographics, and some hospitals in the state have distinguished themselves by producing disparities dashboards and reports. 1610 1611 State efforts to mandate race, ethnicity, and language proficiency by health plans have been limited by a “floor” of membership collection. 1612 1613 1614 1615 1616 The creation of statewide Health Disparities Report Cards hold promise as a very general health disparities measurement tool but will not allow real comparisons of quality of care, as its primary focus is simply stratifying health outcomes by race/ethnicity and looking at social determinants that might contribute to health disparities. 1617 1618 1619 1620 1621 1622 1623 1624 1625 1626 1627 1628 5.d.ii. Health Plans AHIP conducted two surveys of member and nonmember health plans—one in 2003 and the other in the 2006—to determine whether information about its members’ race/ethnicity was being collected. In 2003, from the 137 health plans (of 300) surveyed, 53.5 percent of enrollees were in plans that collected race/ethnicity data; and in 2006, from the 156 health plans (of 260) surveyed, 67 percent of enrollees were in plans that collected such data.33 This information was obtained from the enrollees, usually during their enrollment in the plan or in special programs. Some plans collected this information indirectly through geocoding and surname analysis of their members.112 The earliest examination of health plan collection of race/ethnicity data was the “Minority Health Report Card Project,” a collaborative effort of researchers and initially 8, but later 13, health plans (commercial, Medicaid, and Medicare).113 The demonstration created report cards, and the researchers recommended that race/ethnicity data be collected and used to 64 DRAFT – DO NOT CITE, QUOTE, OR REPRODUCE MEMBER comments due Sept. 7, 2011, 6:00 PM ET; PUBLIC COMMENTS due Aug. 31, 2011, 6:00 PM ET 1629 1630 1631 1632 1633 1634 1635 measure the quality (i.e., Healthcare Effectiveness Data and Information Set [HEDIS], Consumer Assessment of Health Plans Survey [CAHPS]) of health plans and also for external reporting and internal quality purposes. The National Health Plan Collaborative, established in December 2004, was supported by the Robert Wood Johnson Foundation, the Agency for Healthcare Research and Quality, and coordinated by AHIP is a project that brings together 11 major health insurance companies, in partnership with organizations from the public and private sectors, to identify ways to improve the quality of healthcare for racially and ethnically diverse populations. 1636 1637 1638 The National Health Plan Collaborative has used both direct and indirect methods to identify at-risk populations and then design and implement disparity-reduction programs, such as initiatives for increasing the rates of retinal examinations for Hispanics with diabetes. 1639 1640 Ultimately, health plans do not routinely report quality measures by race/ethnicity. There are a few notable exceptions: 1641 1642 1643 1644 1645 1646 Aetna began collecting race/ethnicity from its members in 2003 in a voluntary, optional fashion. Most recently, they have completed their first Disparities Dashboard, which stratifies HEDIS measures by race, ethnicity, language, and region. They plan to do this routinely and are in the process of developing interventions to identify disparities in diabetes management in Texas. 1647 1648 1649 1650 1651 1652 1653 Neighborhood Health Plan (NHP) in Boston, MA, has been stratifying its HEDIS® quality measures by race/ethnicity, and in 2007 partnered with Federally Qualified Health Centers to collect race and ethnicity data on membership for the purpose of conducting disparities analyses. NHP identified disparities in comprehensive diabetes management in Latinos and breast cancer screening in African Americans and developed interventions to target disparities in both those areas. 1654 1655 Kaiser Permanente has begun stratifying some quality measures by race/ethnicity and are in the early stages of work in this area. 1656 1657 WellPoint uses imputed racial and ethnic data to identify disparity “hot spots” and inform outreach to members of disadvantaged populations. 1658 Key Lessons: 1659 1660 1661 Routine collection of race/ethnicity data among health plans remains a challenge for future efforts to monitor quality by race/ethnicity primarily because it is difficult for them to collect these data. 1662 1663 1664 Currently health plans are using different techniques for race/ethnicity data collection to address this challenge, ranging from self-report to indirect estimation (geocoding and surname analysis). 65 DRAFT – DO NOT CITE, QUOTE, OR REPRODUCE MEMBER comments due Sept. 7, 2011, 6:00 PM ET; PUBLIC COMMENTS due Aug. 31, 2011, 6:00 PM ET 1665 1666 1667 1668 Local, smaller plans are in a better position to monitor quality routinely by race/ethnicity because they may have better access to these data (particularly Medicaid plans). 5.d.iii. Hospitals 1669 1670 1671 1672 1673 1674 1675 1676 1677 1678 1679 1680 1681 In the past few years, two major studies examined whether hospitals routinely collect race/ethnicity data about their patients. In 2004, of 272 hospitals surveyed (from a sample of one thousand members of the American Hospital Association), 82 percent collected data on their patients’ race and ethnicity, and 67 percent collected information on their patients’ primary language, but the data were not collected in a systematic or standard manner. For example, the categories of race/ethnicity and the collection methods were different (such as patients’ selfreports versus clerks assigning race/ethnicity to patients based only on appearance). In addition, the data were often not shared, even among different departments within the same hospital.114 In 2006, of 501 hospitals (of 1,100) that were similarly surveyed, 78.4 percent collected race information, 50 percent collected data on patient ethnicity, and 50 percent collected data on primary language.19 Most importantly, fewer than one in five of the hospitals that collected race/ethnicity information routinely used it to assess disparities in quality of care, health care outcomes, or patient satisfaction. 1682 1683 1684 1685 1686 1687 1688 1689 1690 1691 1692 Similarly, researchers recently investigated public hospitals to find out whether current public reporting efforts could include data by race or ethnicity.115 In particular, they looked at the feasibility of using the Hospital Quality Alliance framework to collect quality measures by race/ethnicity and to gauge these measures’ usefulness for supporting hospitals’ quality improvement activities designed to reduce disparities.115 The Hospital Quality Alliance is a public-private collaboration (AHA, CMS, the Federation of American Hospitals, and the Association of American Medical Colleges) to improve the quality of care provided by the nation’s hospitals by measuring and publicly reporting the management of patients with congestive heart failure, acute myocardial infarction, and community-acquired pneumonia.116 A useful lesson from this work was that race/ethnicity data could be used to measure quality to identify those disparities that could be addressed by quality improvement initiatives. 1693 1694 Similar to health plans, hospitals do not routinely use race and ethnicity date to monitor quality and equity, with a few notable exceptions: 1695 1696 1697 1698 1699 1700 1701 1702 Massachusetts General Hospital (MGH) created an annual Disparities Dashboard in 2007. This is distributed to leaders throughout the organization and identifies the hospital’s patient population by race/ethnicity and stratifies the National Hospital Quality Measures (congestive heart failure, acute myocardial infarction, and pneumonia), HEDIS outpatient measures, H-CAHPS patient satisfaction measures, all-cause admissions, ambulatory care-sensitive admissions, congestive heart failure readmissions, and several disparities-sensitive measures (pain management for long bone fractures in the emergency room), by race/ethnicity 66 DRAFT – DO NOT CITE, QUOTE, OR REPRODUCE MEMBER comments due Sept. 7, 2011, 6:00 PM ET; PUBLIC COMMENTS due Aug. 31, 2011, 6:00 PM ET 1703 1704 1705 and language. MGH also began public reporting its disparities and equity measures in 2009. This can be found at http://qualityandsafety.massgeneral.org/measures/equitable.aspx?id=4. 1706 1707 1708 1709 1710 1711 1712 1713 1714 1715 1716 Baylor Health Care System, in Dallas-Ft. Worth, began health equity reporting in 2007. This included stratification of the National Hospital Quality Measures, ambulatory care measures (i.e., mammography screening), and other care process measures by various sociodemographic characteristics. The first among these targets was surgical infection prophylaxis. Initial analyses showed variations in surgical infection prevention measures, particularly by payer status where statistically significant differences were identified between commercially insured and self-pay (i.e., uninsured) patients. The Office of Health Equity worked with high- and low-performing hospital facilities within BHCS to identify root causes of the observed differences and best practices that could be implemented to improve equity in SIP performance across the system. 1717 1718 1719 1720 1721 1722 1723 1724 1725 1726 Barnes Jewish Hospital, in St. Louis, MO, is currently collecting race, ethnicity, and language demographics at admission points throughout the organization. In February 2010, along with partners from Washington University School of Medicine, they implemented a pilot readmission project to reduce the readmission rate for patients with certain chronic diagnoses. Barnes-Jewish Hospital is working to develop a strategic plan to utilize patient demographics to evaluate patient health outcomes and to address health disparities by creating a database that will allow them to track patient admissions, diagnosis, DRGs, inpatient, outpatient, ED services, etc. The database will also include patient demographics including race, ethnicity, language, religion, and geography. 1727 1728 1729 1730 KeyLessons: It is possible to create routine disparities measurement and monitoring tools (such as disparities dashboards or disparities reports). These are facilitated by standardized patient race/ethnicity data collection. 1731 1732 Initially, healthcare organizations might begin by stratifying measures that are already collected, then graduate on to particular measures of interest. 1733 1734 1735 1736 Depending on the diversity of a healthcare organization’s population, small minority sample size for particular conditions/procedures might limit statistically significant comparisons between racial/ethnic groups, requiring more gross, white/non-white comparisons. 1737 1738 To address concerns among health care leaders about publicly reporting disparities, an appropriate communication strategy is essential, as well as a 67 DRAFT – DO NOT CITE, QUOTE, OR REPRODUCE MEMBER comments due Sept. 7, 2011, 6:00 PM ET; PUBLIC COMMENTS due Aug. 31, 2011, 6:00 PM ET 1739 1740 commitment to action, transparency, and accountability when disparities are found. 1741 5.e. Policy and Dissemination Considerations 1742 1743 1744 1745 1746 1747 1748 Disparities measurement is undoubtedly an area that will grow in the years to come. To date, regulating bodies and federal and state legislative efforts are fostering the collection of race, ethnicity, and language proficiency data as a precursor to measurement efforts that will allow us to monitor quality and equity of care across the nation. As more robust efforts focusing on disparities measurement evolve, there are a series of policy and dissemination considerations that must be taken into account, both for external reporting to regulatory bodies, as well as public reporting: 1749 1750 1751 Standardization of disparities measures will be essential so as to allow meaningful conclusions and comparisons to be made about quality of care and care gaps. These measures should also be easily understandable and actionable. 1752 1753 Initial efforts in disparities measurement should capitalize on the stratification of measures that are already available and used for quality reporting. 1754 1755 1756 While race, ethnicity, and language proficiency data evolve, basic and current OMB categories should be used for measurement and comparison and adapted over time to meet caregiver and local needs. 1757 1758 1759 Section 4 of this paper highlights the key issues and provides guidance and recommendations that can help address the key decisions that need to be made about: 1760 1761 o When is a difference in quality a disparity and what should be the burden of evidence (percentage difference versus statistical significance)? 1762 1763 1764 1765 1766 1767 o What is the correct level of aggregation for comparison purposes? Individual provider? Hospital? Health plan? Geographic area? How will disparities measurement be used? Will it be utilized simply to monitor quality and equity internally for healthcare organizations as a basis for quality improvement, or will it be used as for benchmarking against yet undefined standards? 1768 1769 Regarding public reporting of disparities measurement: o How should public reporting be used? 68 DRAFT – DO NOT CITE, QUOTE, OR REPRODUCE MEMBER comments due Sept. 7, 2011, 6:00 PM ET; PUBLIC COMMENTS due Aug. 31, 2011, 6:00 PM ET 1770 1771 1772 o For payment and reimbursement purposes? For consumer choice? There is a concern that certain organizations might be penalized for caring for more vulnerable and needy minority populations. 1773 1774 1775 1776 1777 1778 1779 1780 o To motivate providers to improve performance? Public reporting alone can provide a powerful incentive for improvement, but attention to the analytic and reporting recommendations above is essential to avoid dismissal or mistrust of the results. 117 1781 1782 1783 1784 1785 1786 1787 1788 1789 1790 1791 o How should this information be packaged, given the inherent sensitivity about disparities, and the potential public perception that they may emerge from intentional actions? Current efforts in the field demonstrate the importance of carefully explaining what disparities are, their root causes, and the need to immediately link any disparities that are identified with quality improvement efforts (even if as simple as further exploring the problem). Above, we discussed some of the challenges and potential for unintended consequences that could ensue from programs seeking to incent disparities reduction. While this paper was intended to focus on methodological issues in disparities measure selection and measurement and not on the design of incentive programs, this topic deserves some consideration. Therefore, we list below a number of approaches that can be used to address those challenges. Each of these should be considered as either alternatives to, or more likely supplements to be used in combination with, standard incentive program design features. Among these are: 1792 1793 1794 1795 Using payment for improvement (versus payment to achieve quality benchmarks or thresholds). The CMS Value-Based Payment program for example uses a mix of achievement (median), benchmark (90th percentile) and improvement thresholds.107 1796 1797 Paying for performance based on lower racial/ethnic disparities (versus paying for higher quality performance applied generally to all patients). 1798 1799 1800 Conducting special studies that monitor for potential unintended consequences, such as increased difficulty accessing care, or adverse financial impacts on safety net providers.118 1801 1802 Paying for performance focused on improving quality of care for minority populations. 1803 Exception reporting (as used in the United Kingdom ). 69 DRAFT – DO NOT CITE, QUOTE, OR REPRODUCE MEMBER comments due Sept. 7, 2011, 6:00 PM ET; PUBLIC COMMENTS due Aug. 31, 2011, 6:00 PM ET 1804 1805 1806 Quality improvement efforts targeting safety net providers and high-minority providers (and directing supplemental resources to those providers including the sharing of best practices). 1807 1808 Assessing structural characteristics of providers until more evidence-based process and outcome measures are developed. 1809 1810 1811 1812 1813 1814 One option that has not appeared in the literature to our knowledge is the idea of risk-adjusting payments to providers rather than risk adjusting performance measures. Such an approach recognizes the greater resource needs of providers to reach populations with multiple social disadvantages. Once these resources are available, it may then be more reasonable to hold all providers to the same quality performance standards applied to everyone without risk adjustment. 1815 1816 1817 1818 1819 1820 The information provided in this commissioned paper is intended to provide the appropriate background, evidence, and context for these key issues and considerations. As with any policy decision, there is no one right answer, or one-size-fits-all solution. An incremental approach to disparities measurement that involves key stakeholders in the process, and that builds on the foundation of work to date and key lessons from the field, will ultimately provide the foundation for identifying disparities and achieving equity. 1821 70 DRAFT – DO NOT CITE, QUOTE, OR REPRODUCE MEMBER comments due Sept. 7, 2011, 6:00 PM ET; PUBLIC COMMENTS due Aug. 31, 2011, 6:00 PM ET 1822 1823 1824 Appendix I. NQF Measures Cross-Walked with AHRQ’s National Healthcare Disparities and Quality Report I. TREATMENT OF DEPRESSION NQF# NQF Description of NQF Endorsed Endorsed Measure Measure 105 New Episode of Depression: (a) Optimal Practitioner Contacts for Medication Management, (b) Effective Acute Phase Treatment, (c) Effective Continuation Phase Treatment a. Percentage of patients who were diagnosed with a new episode of depression and treated with antidepressant medication, and who had at least three follow-up contacts with a practitioner during the 84-day (12-week) Acute Treatment Phase. b Percentage of patients who were diagnosed with a new episode of depression, were treated with antidepressant medication and remained on an antidepressant drug during the entire 84day Acute Treatment Phase. c. Percentage of patients who were diagnosed with a new episode of depression and treated with antidepressant medication and who remained on an antidepressant drug for at least 180 days. AHRQ Disparities Measure Description of AHRQ Disparities Measure Is there a Known Disparity for this Measure? Adults with a major depressive episode (MDE) in the last 12 months who received treatment for depression in the last 12 months. National Denominator: Persons age 18 or older with a major depressive episode in the past year. National Numerator: Subset of the denominator who received treatment or counseling in the past year. Disparity found for 119 Asians, 119, 120 blacks, and 119, Hispanics. Quality of Match between NQF and AHRQ Measure Medium 120 1825 71 DRAFT – DO NOT CITE, QUOTE, OR REPRODUCE MEMBER comments due Sept. 7, 2011, 6:00 PM ET; PUBLIC COMMENTS due Aug. 31, 2011, 6:00 PM ET 1826 1827 1828 Appendix I. NQF Measures Cross-Walked with AHRQ’s National Healthcare Disparities and Quality Report II. CARDIOVASCULAR DISEASE NQF# NQF Description of NQF Endorsed Endorsed Measure Measure AHRQ Disparities Measure Description of AHRQ Disparities Measure Is there a Known Disparity for this Measure? National Denominator: Discharged hospital patients with a principal diagnosis of acute myocardial infarction (AMI), and documented left ventricular ejection fraction, and without contraindication for ACE inhibitors or angiotensin receptor blockers. National Numerator: Subset of the denominator prescribed an ACE inhibitor or ARB at hospital discharge. National Denominator: All hospital inpatient discharges among persons age 18 and over. Excluded from the denominator are patients transferring to another shortterm hospital. National Numerator: Subset of the denominator Disparity found for Hispanics120, 121 but not 10 blacks 137 ACEI or ARB for left ventricular systolic dysfunctionAcute Myocardial Infarction (AMI) Patients Percentage of acute myocardial infarction (AMI) patients with left ventricular systolic dysfunction (LVSD) who are prescribed an ACEI or ARB at hospital discharge. For purposes of this measure, LVSD is defined as chart documentation of a left ventricular ejection fraction (LVEF) less than 40% or a narrative description of left ventricular systolic (LVS) function consistent with moderate or severe systolic dysfunction. Hospital patients with heart attack and left ventricular systolic dysfunction who were prescribed angiotensinconverting enzyme (ACE) inhibitors or angiotensin receptor blockers (ARB) at discharge. 730 Acute Myocardial Infarction (AMI) Mortality Rate Number of deaths per 100 discharges with a principal diagnosis code of acute myocardial infarction. Deaths per 1,000 adult hospital admissions with acute myocardial infarction (AMI). Disparity found for Asians120. Blacks have lower mortality rate after AMI; this effect is augmented by adjustment for withinhospital effects.122 Quality of Match between NQF and AHRQ Measure High Medium 72 DRAFT – DO NOT CITE, QUOTE, OR REPRODUCE MEMBER comments due Sept. 7, 2011, 6:00 PM ET; PUBLIC COMMENTS due Aug. 31, 2011, 6:00 PM ET who died. 73 DRAFT – DO NOT CITE, QUOTE, OR REPRODUCE MEMBER comments due Sept. 7, 2011, 6:00 PM ET; PUBLIC COMMENTS due Aug. 31, 2011, 6:00 PM ET Appendix I. NQF Measures Cross‐Wwalked with AHRQ’s National Healthcare Disparities and Quality Report III. MANAGEMENT OF ASTHMA Description of NQF NQF# NQF Endorsed Endorsed Measure Measure 47 Asthma: pharmacologic therapy 728 Asthma Admission Rate (pediatric) AHRQ Title Description of AHRQ Disparities Measure Is there a Known Disparity for this Measure? Percentage of all patients with mild, moderate, or severe persistent asthma who were prescribed either the preferred longterm control medication (inhaled corticosteroid) or an acceptable alternative treatment People with asthma who were taking prescription medication to control asthma during the past 12 months. Disparity found for Asians,120 Mexicans,120 and Hispanics120. Corticosteroid metered dose inhalers were taken up more slowly by minorities than by whites 123. Admission rate for asthma in children ages 2-17, per 100,000 population (area level rate) Hospital admissions for asthma per 100,000 population by age group. National Denominator: U.S. civilian noninstitutionalized population who currently have active asthma. National Numerator: Subset of denominator who are taking daily or almost daily preventive medicine. National Denominator: As appropriate to each measure, the U.S. population of children ages 2-17 and adults age 18 and over or age 65 and over, excluding patients with cystic fibrosis or anomalies of the respiratory system and transfers from other institutions. National Numerator: Subset of denominator with a principal hospital admission diagnosis of asthma. In the late 1990s, black children were more than three times more likely than whites to have been hospitalized for asthma.124 A 2009 study found that white patients admitted for acute asthma are less likely than minority patients to have been admitted for asthma in the past.125 Quality of Match between NQF and AHRQ Measure Medium Medium 74 DRAFT – DO NOT CITE, QUOTE, OR REPRODUCE MEMBER comments due Sept. 7, 2011, 6:00 PM ET; PUBLIC COMMENTS due Aug. 31, 2011, 6:00 PM ET Appendix II. Sample Analysis of NQF-Endorsed Measures for Sensitivity to Disparities NQF # Title NQFDisparities Designated Sensitive: Ambulatory (Yes/No) Care Sensitive (Yes/No) Measure Specification : Condition Specific or CrossCutting Donabedian Category: Structure/Proc ess/Outcome Root(s) of Potential Disparitie s: Provider/ Patient/ System/ Insurance 1 Asthma assessment 2 Appropriate testing for children with pharyngitis 3 Bipolar Disorder: Assessmen t for diabetes 4 Initiation and Engagemen t of Alcohol and Other Drug Dependenc e Treatment: a. Initiation, b. Engagemen t 5 CAHPS Clinician/Gr oup Surveys (Adult Primary Care, Pediatric Care, and Specialist Care Surveys) 75 DRAFT – DO NOT CITE, QUOTE, OR REPRODUCE MEMBER comments due Sept. 7, 2011, 6:00 PM ET; PUBLIC COMMENTS due Aug. 31, 2011, 6:00 PM ET REFERENCES 1. Institute of Medicine (IOM), Unequal Treatment: Confronting Racial and Ethnic Disparities in Health Care, Washington, DC: National Academies Press; 2002. 2. Donabedian A, The quality of care, JAMA, 1988;260(12):1743-1748. Availableat http://jama.amaassn.org/content/260/12/1743.abstract. Last accessed July 2011. 3. IOM, Crossing the Quality Chasm: A New Health System for the 21st Century, Washington, DC: National Academies Press; 2001. 4. Divi C, Koss RG, Schmaltz SP, et al., Language proficiency and adverse events in US hospitals: a pilot study, Int J Qual Health Care, 2007;19(2):60-7. Available at file://Sfa1/dscenter$/Article%20Downloads%20by%20Journal/Intnl%20Journal%20for%20Qual ity%20in%20Health%20Care/Divi_Language%20prof%20and%20adverse%20events%20in%20 US%20hosp_2007.pdf. Last accessed July 2011. 5. Schyve PM, Language differences as a barrier to quality and safety in health care: the Joint Commission perspective, J Gen Intern Med, 2007;22 Suppl 2:360-1. 6. Flores G, Ngui E, Racial/ethnic disparities and patient safety, Pediatr Clin North Am, 2006;53(6):1197-215. Available at file://Sfa1/dscenter$/Article%20Downloads%20by%20Journal/Pediatric%20Clinics%20of%20N orth%20America/Flores_RacialEthnic%20Disp%20and%20Pt%20Safety_2006.pdf. Last accessed July 2011. 7. Elixhauser A, Weinick RM, Betancourt JR, et al., Differences between Hispanics and nonHispanic whites in use of hospital procedures for cerebrovascular disease, Ethn Dis, 2002;12(1):29-37. 8. Jiang HJ, Andrews R, Stryer D, et al., Racial/ethnic disparities in potentially preventable readmissions: the case of diabetes, Am J Public Health, 2005;95(9):1561-7. 9. Ash M, Brandt S, Disparities in asthma hospitalization in Massachusetts, Am J Public Health, 2006;96(2):358-62. 10. Rathore SS, Foody JM, Wang Y, et al. Race, quality of care, and outcomes of elderly patients hospitalized with heart failure, JAMA, 2003;289(19):2517-24. 11. Alexander M, Grumbach K, Remy L, et al., Congestive heart failure hospitalizations and survival in California: patterns according to race/ethnicity, Am Heart J, 1999;137(5):919-27. 12. Commission MPA. Report to Congress: Reforming the delivery system. 2008. Available at http://www.medpac.gov/documents/Jun08_EntireReport.pdf. Last accessed July 2011. 13. Sack K. Medicare won’t pay for medical errors, The New York Times. September 30, 2008. . 76 DRAFT – DO NOT CITE, QUOTE, OR REPRODUCE MEMBER comments due Sept. 7, 2011, 6:00 PM ET; PUBLIC COMMENTS due Aug. 31, 2011, 6:00 PM ET 14. National Research Council (NRC), Eliminating health disparities: measurement and data needs, Washington, DC: NRC; 2004. 15. National Forum for Health Care Quality Measurement and Reporting, Improving healthcare quality for minority patients. 2002. 16. Joynt KE, Jha AK, Who has higher readmission rates for heart failure, and why? Implications for efforts to improve care using financial incentives, Circ Cardiovasc Qual Outcomes, 2011;4(1):53-59. 17. Joynt KE, Orav EJ, Jha AK, Thirty-day readmission rates for medicare beneficiaries by race and site of care, JAMA, 2011;305(7):675-681. 18. Sequist TD, Fitzmaurice GM, Marshall R, et al., Cultural competency training and performance reports to improve diabetes care for black patients: a cluster randomized, controlled trial. Ann Intern Med, 2010;152(1):40-6. 19. Regenstein M, Sickler D, Race, ethnicity and language of patients: hospital practices regarding collection of information to address disparities in health care, National Public Health and Hospital Institute; 2006. Available at http://www.hablamosjuntos.org/resources/pdf/RWJNPHHIreport-2-06.pdf. Last accessed July 2011. 20. The National Quality Forum (NQF), National Voluntary Consensus Standards for Ambulatory Care—Measuring Healthcare Disparities, Washing, DC: NQF; 2008. Availableat http://www.qualityforum.org/Publications/2008/03/National_Voluntary_Consensus_Standards_f or_Ambulatory_Care%E2%80%94Measuring_Healthcare_Disparities.aspx. Last accessed July 2011. 21. NQF, A Comprehensive Framework and Preferred Practices for Measuring and Reporting Cultural Competency: A Consensus Report, Washington, DC: NQF; 2009. Available from: file://HOME27/dmo17$/Office/WordDocs/Executuve%20Summary%20for%20Cultural%20Co mpetency.pdf. Last accessed July 2011. 22. Hasnain-Wynia R, Pierce D, A toolkit for collecting race, ethnicity, and primary language information from patients. 2005. 23. IIOM, Ulmer C, McFadden B, Nerenz D, eds. Race, Ethnicity, and Language Data: Standardization for Health Care Quality Improvement. Subcommittee on Standardized Collection of Race/Ethnicity Data for Healthcare Quality Improvement Washington, DC: National Academies Press; 2009. 24. Hayes-Bautista DE, Chapa J, Latino terminology: conceptual bases for standardized terminology, Am J Public Health, 1987;77(1):61-68. 25. Office of Management and Budget (OMB), Statistical Policy Directive No. 15, Race and Ethnic Standards for Federal Statistics and Administrative Reporting. 1977. 26. OMB, Revisions to the Standards for the Classification of Federal Data on Race and Ethnicity. 1997. Available at http://www.whitehouse.gov/omb/fedreg/1997standards.html. Last accessed July 2011. 77 DRAFT – DO NOT CITE, QUOTE, OR REPRODUCE MEMBER comments due Sept. 7, 2011, 6:00 PM ET; PUBLIC COMMENTS due Aug. 31, 2011, 6:00 PM ET 27. OMB, Revisions to the standards for the classification of federal data on race and ethnicity, Federal Register, 1997;62:58781-58790. 28. Weinick RM, Flaherty K, Bristol SJ, Creating equity reports: a guide for hospitals. 2008. 29. Weinick RM, Jacobs EA, Stone LC, et al., Hispanic healthcare disparities: challenging the myth of a monolithic Hispanic population, Med Care, 2004;42(4):313-320. 30. OMB, Recommendations from the interagency committee for the review of the racial and ethnic standards to the office of management and budget concerning changes to the standards for the classification of federal data on race and ethnicity, Federal Register, 1997;(3110-01):3687336946. 31. Humes KR, Jones NA, Ramirez RR, Overview of race and Hispanic origin: 2010. U.S. Census Bureau, 2010 Census Briefs. Available from: http://www.census.gov/prod/cen2010/briefs/c2010br-02.pdf. Last accessed July 2011. 32. Wynia M, Hasnain-Wynia R, Hotze T, et al., Collecting and using race, ethnicity and language data in ambulatory settings: a white paper with recommendations from the commission to end health care disparities. 2011. 33. America's Health Insurance Plans, Collection and use of Race and Ethnicity Data for Quality Improvement: 2006 AHIP-RWJF Survey of Health Insurance Plans ; 2006. 34. Hasnain-Wynia R, Taylor-Clark K, Anise A, Collecting race, ethnicity, and language data to identify and reduce health disparities: perceptions of health plan enrollees, Med Care Res Rev, 2010. 35. The Quality Alliance Steering Committee and the Engleberg Center for Health Care Reform at The Brookings Institution.,Lessons in the acquisition of race, ethnicity, and language data by health plans. 2010. Last accessed May 2011. 36. Toscano M, Rawlins W, 2010. 37. The Commonwealth of Massachusetts Health Care Quality and Cost Council, Health care cost and quality council minutes. Last accessed January 2011. 38. Word DL, Coleman CD, Nunziata R, et al., Demographic aspects of surnames from Census 2000 . 2008. Last accessed May2011. 39. Elliott MN, Morrison PA, Fremont A, et al., Using the Census Bureau’s surname list to improve estimates of race/ethnicity and associated disparities, Health Serv Outcomes Res Methodol, 2009;9(2):69-83. 40. Fremont AM, Bierman A, Wickstrom SL, et al., Use of geocoding in managed care settings to identify quality disparities, Health Aff (Millwood). 2005;24(2):516-526. 41. Elliott MN, Fremont A, Morrison PA, et al., A new method for estimating race/ethnicity and associated disparities where administrative records lack self-reported race/ethnicity, Health Serv Res, 2008 May 12 [Epub ahead of print]. 42. Weissman JS, Romana Hasnain-Wynia, Advancing health care equity through improved data collection, N Engl J Med, (364):2276-2277. 78 DRAFT – DO NOT CITE, QUOTE, OR REPRODUCE MEMBER comments due Sept. 7, 2011, 6:00 PM ET; PUBLIC COMMENTS due Aug. 31, 2011, 6:00 PM ET 43. Hing E, Burt CW, Are there patient disparities when electronic health records are adopted? J Health Care Poor Underserved, 2009;20(2):473-488. 44. Shields AE, Shin P, Leu MG, et al., Adoption of health information technology in community health centers: results of a national survey, Health Aff (Millwood), 2007;26(5):1373-83. Available at file://Sfa1/dscenter$/Article%20Downloads%20by%20Journal/Health%20Affairs/Shields_Adopt ion%20of%20health%20information%20technology%20in%20community%20health%20centers -results%20of%20a%20national%20survey_2009.pdf. Last accessed July 2011. 45. Jha AK, DesRoches CM, Shields AE, et al., Evidence of an emerging digital divide among hospitals that care for the poor, Health Aff (Millwood), 2009;28(6):w1160-70. 46. NQF, Measure evaluation criteria; 2011. Available at http://www.qualityforum.org/Measuring_Performance/Submitting_Standards/Measure_Evaluatio n_Criteria.aspx. Last accessed June 2011. 47. Balsa AI, McGuire TG, Prejudice, clinical uncertainty and stereotyping as sources of health disparities, J Health Econ, 2003;22(1):89-116. 48. Hasnain-Wynia R, Kang R, Landrum MB, et al., Racial and ethnic disparities within and between hospitals for inpatient quality of care: an examination of patient-level hospital quality alliance measures, Journal of Health Care for the Poor & Underserved, 2010;21(2):629-48. Available fat internal-pdf://Hasnain-wynia_Racial and Ethnic Disparities within and be-2960788480/Hasnainwynia_Racial and Ethnic Disparities within and between Hospitals for Inpatient Quality of Care.pdf. 49. Hasnain-Wynia R, Baker DW, Nerenz D, et al., Disparities in health care are driven by where minority patients seek care: examination of the hospital quality alliance measures.,Arch Intern Med, 2007;167(12):1233-9. Available at file://Sfa1/dscenter$/Article%20Downloads%20by%20Journal/Archives%20of%20Internal%20 Medicine/HasnianWynia_Disp%20driven%20by%20where%20minority%20pts%20seek%20care_2007.pdf. Last accessed July 2011. 50. Asch SM, Kerr EA, Keesey J, et al., Who is at greatest risk for receiving poor-quality health care? N Engl J Med, 2006;354(11):1147-1156. 51. Peterson ED, Shah BR, Parsons L, et al., Trends in quality of care for patients with acute myocardial infarction in the national registry of myocardial infarction from 1990 to 2006, Am Heart J, 2008;156(6):1045-55. 52. Epstein AM, Weissman JS, Schneider EC, et al., Race and gender disparities in rates of cardiac revascularization: do they reflect appropriate use of procedures or problems in quality of care? Med Care, 2003;41(11):1240-55. 53. Todd KH, Samaroo N, Hoffman JR, Ethnicity as a risk factor for inadequate emergency department analgesia, JAMA, 1993;269(12):1537-9. 79 DRAFT – DO NOT CITE, QUOTE, OR REPRODUCE MEMBER comments due Sept. 7, 2011, 6:00 PM ET; PUBLIC COMMENTS due Aug. 31, 2011, 6:00 PM ET 54. Mullins CD, Onukwugha E, Bikov K, et al., Health disparities in staging of SEER-medicare prostate cancer patients in the united states, Urology, 2010;76(3):566-572. 55. Fedewa SA, Etzioni R, Flanders WD, et al., Association of insurance and race/ethnicity with disease severity among men diagnosed with prostate cancer, National Cancer Database 20042006, Cancer Epidemiol Biomarkers Prev, 2010;19(10):2437-2444. 56. Ayanian JZ, Cleary PD, Keogh JH, et al., Physicians' beliefs about racial differences in referral for renal transplantation, Am J Kidney Dis., 2004;43(2):350-7. Available at file://Sfa1/dscenter$/Article%20Downloads%20by%20Journal/American%20Journal%20of%20 Kidney%20Diseases/Ayanian_Physicians%20Beliefs%20about%20racial%20differences%20in %20referral%20for%20renal%20transplantation_2004.pdf. Last accessed July 2011. 57. Epstein AM, Ayanian JZ, Keogh JH, et al., Racial disparities in access to renal transplantation— clinically appropriate or due to underuse or overuse? N Engl J Med, 2000;343(21):1537-44. 58. Schneider EC, Leape LL, Weissman JS, et al., Racial differences in cardiac revascularization rates: does "overuse" explain higher rates among white patients? Ann Intern Med, 2001;135(5):328-37. Available at file://Sfa1/dscenter$/Article%20Downloads%20by%20Journal/Annals%20of%20Internal%20M edicine/Schneider_Racial%20Differences%20in%20Cardiac%20Revascularization%20Rates_D oes%20overuse%20explain%20higher%20rates%20among%20white%20patients_2001.pdf. Last accessed July 2011. 59. Meyer GS, Massagli MP, The forgotten component of the quality triad: can we still learn something from "structure"? Jt Comm J Qual Improv, 2001;27(9):484-493. 60. Keppel K, Pamuk E, Lynch J, et al., Methodological issues in measuring health disparities, Vital Health Stat 2, 2005;(141)(141):1-16. 61. Braveman P. Health disparities and health equity: concepts and measurement, Annu Rev Public Health, 2006;27:167-94. Available at file://Sfa1/dscenter$/Article%20Downloads%20by%20Journal/Annals%20of%20Thoracic%20S urgery/Higgins_Understanidng%20Disp%20in%20Outcomes%20in%20CV%20Med%20and%2 0Thoracic%20Oncology%20in%20Afr-Amer_2003.pdf. Last accessed July 2011. 62. Harper S, King NB, Meersman SC, et al., Implicit value judgments in the measurement of health inequalities, Milbank Q, 2010;88(1):4-29. 63. Werner RM, Asch DA, Polsky D, Racial profiling: the unintended consequences of coronary artery bypass graft report cards, Circulation, 2005;111(10):1257-63. Available at file://Sfa1/dscenter$/Article%20Downloads%20by%20Journal/Circulation/Werner_racial%20pr ofiling%20the%20unintended%20conseq%20of%20CAB%20Graft%20Report%20Cards_2005.pdf. Last accessed July 2011. 64. Trivedi AN, Zaslavsky AM, Schneider EC, et al., Trends in the quality of care and racial disparities in medicare managed care, N Engl J Med, 2005;353(7):692-700. Available at file://Sfa1/dscenter$/Article%20Downloads%20by%20Journal/NEJM/Trivedi_Trends%20in%20 qual%20of%20care%20and%20racial%20disp%20in%20medicare%20managed%20care_2005. pdf. Last accessed July 2011. 80 DRAFT – DO NOT CITE, QUOTE, OR REPRODUCE MEMBER comments due Sept. 7, 2011, 6:00 PM ET; PUBLIC COMMENTS due Aug. 31, 2011, 6:00 PM ET 65. Keppel KG, Pearcy JN, Weissman JS, Trends in racial disparities in care, N Engl J Med, 2005;353(19):2081-5; author reply 2081-5. 66. Keppel K, Bilheimer L, Gurley L, Improving population health and reducing health care disparities, Health Aff (Millwood), 2007;26(5):1281-92. 67. Pearcy JN, Keppel KG, A summary measure of health disparity, Public Health Rep, 2002;117(3):273-280. 68. Blustein J, Weissman JS, Ryan AM, et al., Analysis raises questions on whether pay-forperformance in Medicaid can efficiently reduce racial and ethnic disparities, Health Affairs (In Press); 2011. 69. US Department of Health and Human Services (HHS), Healthy People 2010 Midcourse Review, Washington, DC: U.S. Government Printing Office; 2006. Available at http://www.healthypeople.gov/2010/data/midcourse/html/default.htm. Last accessed July 2011. 70. Makram Talih PD, Senior Service Fellow Office of Analysis & Epidemiology National Center for Health Statistics Centers for Disease Control and Prevention; 2011. 71. Keppel K, Garcia T, Hallquist S, et al., Comparing Racial and Ethnic Populations Based on Healthy People 2010 Objectives, 26th ed., Hyattsville, MD: National Center for Health Statistics; 2008. 72. Harper S, Lynch J, Methods for Measuring Cancer Disparities: Using Data Relevant to Healthy People 2010 Cancer-Related Objectives, 6th ed., Bethesda, MD: National Cancer Institute; 2005. NIH Publication No. 05-5777. 73. Asada Y, On the choice of absolute or relative inequality measures, Milbank Q, 2010;88(4):61622; discussion 623-7. 74. IIOM, Future directions for the national healthcare quality and disparities reports, Ulmer C, Bruno M, Burke S, ed., Washington, DC: National Academies Press; 2010. 75. Schulman KA, Berlin JA, Harless W, et al., The effect of race and sex on physicians' recommendations for cardiac catheterization, N Engl J Med, 1999;340(8):618-26. 76. Schwartz LM, Woloshin S, Welch HG, Misunderstandings about the effects of race and sex on physicians' referrals for cardiac catheterization, N Engl J Med, 1999;341(4):279-83; discussion 286-7. 77. Normand SL, Wolf RE, Ayanian JZ, et al., Assessing the accuracy of hospital clinical performance measures, Med Decis Making, 2007;27(1):9-20. 78. Weissman JS, Vogeli C, Kang R, et al., The design of pay-for-performance programs for reducing disparities: what do the data tell us? 2008. Available at http://www.ahsrhp.org/2008/sunday/virginiaab/6_8_2008_11_00/WeissmanJ1.ppt. Last accessed July 2011. 79. Weissman JS, Vogeli C, Kang R, et al., Examining the quality of hospital care & simulating the impact of several pay‐for‐performance scoring methods on hospital rankings. 2009. 80. Bilheimer LT, Sisk JE, Collecting adequate data on racial and ethnic disparities in health: the challenges continue, Health Aff (Millwood), 2008;27(2):383-91. 81 DRAFT – DO NOT CITE, QUOTE, OR REPRODUCE MEMBER comments due Sept. 7, 2011, 6:00 PM ET; PUBLIC COMMENTS due Aug. 31, 2011, 6:00 PM ET 81. Doran T, Fullwood C, Reeves D, et al., Exclusion of patients from pay-for-performance targets by English physicians, N Engl J Med, 2008;359(3):274-284. 82. Fiscella K, Franks P, Gold MR, et al., Inequality in quality: addressing socioeconomic, racial, and ethnic disparities in health care, JAMA, 2000;283(19):2579-84. 83. Casalino LP, Elster A, Eisenberg A, et al., Will pay-for-performance and quality reporting affect health care disparities? Health Aff (Millwood), 2007;26(3):w405-14. Available at file://Sfa1/dscenter$/Article%20Downloads%20by%20Journal/Health%20Affairs/Casalino_Will %20Pay-For-Performance%20And%20Qual%20Report%20Affect%20HC%20Disp_2007.pdf. Last accessed July 2011. 84. Romano PS, Should health plan quality measures be adjusted for case mix? Med Care, 2000;38(10):977-980. 85. Cheung K, AHA pushes for risk-adjusted readmissions for race. 86. Zaslavsky AM, Hochheimer JN, Schneider EC, et al., Impact of sociodemographic case mix on the HEDIS measures of health plan quality, Med Care, 2000;38(10):981-992. 87. Smith LA, Hatcher-Ross JL, Wertheimer R, et al. Rethinking race/ethnicity, income, and childhood asthma: racial/ethnic disparities concentrated among the very poor, Public Health Rep, 2005;120(2):109-16. Available at file://Sfa1/dscenter$/Article%20Downloads%20by%20Journal/Public%20Health%20Reports/S mith_Rethinking%20Race%20Ethnicity,%20Income,%20and%20Childhood%20Asthma_2005.p df. Last accessed July 2011. 88. Hebert P, Ross J, Goldstein N, et al. Should statistical models of hospital quality include patient’s race as a covariate? 2010. 89. IOM, Envisioning the National Health Care Quality Report, Washington, DC: The National Academies Press; 2001. 90. McGuire TG, Alegria M, Cook BL, et al., Implementing the institute of medicine definition of disparities: an application to mental health care, Health Serv Res, 2006;41(5):1979-2005. 91. Shi L, Stevens GD, Vulnerable Populations in the United States, 2nd ed., San Francisco, CA: Jossey-Bass; 2010. 92. Bach PB, Pham HH, Schrag D, et al., Primary care physicians who treat blacks and whites, N Engl J Med, 2004;351(6):575-84. Available at file://Sfa1/dscenter$/Article%20Downloads%20by%20Journal/The%20New%20England%20Jo urnal%20of%20Medicine/Bach_PCP%20who%20treat%20blacks%20and%20whites_2004.pdf. Last accessed July 2011. 93. Baicker K, Chandra A, Skinner JS, et al., Who you are and where you live: how race and geography affect the treatment of medicare beneficiaries, Health Aff (Millwood), 2004;Suppl Web Exclusives:VAR33-44. 94. Gaskin DJ, Spencer CS, Richard P, et al., Do hospitals provide lower-quality care to minorities than to whites? Health Aff (Millwood), 2008;27(2):518-27. 82 DRAFT – DO NOT CITE, QUOTE, OR REPRODUCE MEMBER comments due Sept. 7, 2011, 6:00 PM ET; PUBLIC COMMENTS due Aug. 31, 2011, 6:00 PM ET 95. Jha AK, Orav EJ, Li Z, et al., Concentration and quality of hospitals that care for elderly black patients, Arch Intern Med, 2007;167(11):1177-82. Available at file://Sfa1/dscenter$/Article%20Downloads%20by%20Journal/Archives%20of%20Internal%20 Medicine/Jha_Conc%20and%20Qual%20of%20Hosp%20Caring%20for%20Elderly%20Black% 20Pts_2007.pdf. Last accessed July 2011. 96. Schneider EC, Zaslavsky AM, Epstein AM, Racial disparities in the quality of care for enrollees in Medicare managed care [see comments], JAMA, 2002;287(10Comment in: JAMA. 2002 Jun 12;287(22):2937 ; 12052113 Comment in: JAMA. 2002 Jun 12;287(22):2942; discussion 2943 ; 12052117 Comment in: JAMA. 2002 Jun 12;287(22):2942; discussion 2943 ; 12052116 Comment in: JAMA. 2002 Jun 12;287(22):2943; dis(TRUNCATED)):1288-1294. 97. Skinner J, Weinstein JN, Sporer SM, et al., Racial, ethnic, and geographic disparities in rates of knee arthroplasty among medicare patients, N Engl J Med, 2003;349(14):1350-1359. 98. Leape LL, Hilborne LH, Bell R, et al., Underuse of cardiac procedures: do women, ethnic minorities, and the uninsured fail to receive needed revascularization? Ann Intern Med, 1999;130(3):183-192. 99. Schneider EC, Hussey PS, Schnyer C, Payment reform: analysis of models and performance measurement implications, RAND Corp. (Sponsored by NQF); 2011. Available at http://www.rand.org/content/dam/rand/pubs/technical_reports/2011/RAND_TR841.pdf. Last accessed July 2011. 100. Lindenauer PK, Remus D, Roman S, et al., Public reporting and pay for performance in hospital quality improvement, N Engl J Med, 2007;356(5):486-496. 101. Chien AT, Chin MH, Davis AM, et al., Pay for performance, public reporting, and racial disparities in health care: how are programs being designed? Med Care Res Rev, 2007;64(5 Suppl):283S-304S. Availableat file://Sfa1/dscenter$/Article%20Downloads%20by%20Journal/Medical%20Care%20Research% 20and%20Review/Chien_%20P4P%20Public%20Reporting%20and%20Racial%20Disp%20in% 20HC%20How%20Are%20Programs%20Being%20Designed_2007.pdf. Last accessed July 2011. 102. Chien AT, The potential impact of performance incentive programs on racial disparities in healthcare, In: Eliminating Healthcare Disparities in America, Totowa, NJ: Humana Press; 2007:237-256. 103. Weinick R, Alegría M, Coltin K, et al., Pay-for-Performance to Reduce Racial and Ethnic Disparities in health Care in the Massachusetts Medicaid Program, Boston, MA: Massachusetts Medicaid Policy Institute; 2007. 104. Rosenthal MB, Frank RG, Li Z, Epstein AM, Early experience with pay-for-performance: from concept to practice, JAMA, 2005;294(14):1788-1793. 105. Karve AM, Ou F, Lytle BL, et al., Potential unintended financial consequences of pay-forperformance on the quality of care for minority patients, Am Heart J, 2008;155(3):571-576. 106. Ash A, Measuring quality, Med Care, 2008;46(2):105-108. 83 DRAFT – DO NOT CITE, QUOTE, OR REPRODUCE MEMBER comments due Sept. 7, 2011, 6:00 PM ET; PUBLIC COMMENTS due Aug. 31, 2011, 6:00 PM ET 107. Centers for Medicare & Medicaid Services (CMS), HHS, Medicare program; hospital inpatient value-based purchasing program. 26 CFR 76. 2011. 108. Newhouse D, Diversity, demographics & analytics program. Seattle; 2011. 109. Arday SL, Arday DR, Monroe S, et al., HCFA's racial and ethnic data: current accuracy and recent improvements, Health Care Financ Rev, 2000;21(4):107-116. 110. Medical Care Section Study Group, Weissman JS, chair, Using indirect measures of raceethnicity to identify disparities in healthcare. 111. Massachusetts General Laws (MGL). 2007 c. 111, §§ 31 and 2–7(a. 15). An act to eliminate health and health care disparities in the commonwealth. 2007. 112. Fiscella K, Fremont AM, Use of geocoding and surname analysis to estimate race and ethnicity, Health Serv Res, 2006;41(4 Pt 1):1482-500. 113. Nerenz DR, Gunter M, Garcia M, et al., Developing a health plan report card on quality of care for minority populations, The Commonwealth Fund; 2002. Available at file://Sfa1/dscenter$/Article%20Downloads%20by%20Journal/Commonwealth%20Fund/nerenz _devel%20a%20health%20plan%20reportcard%20on%20qual%20of%20care%20for%20min%2 0pop_2002.pdf. Last accessed July 2011. 114. Hasnain-Wynia R, Pierce D, Pittman MA, Who, when, and how: the current state of race, ethnicity, and primary language data collection in hospitals, The Commonwealth Fund; 2004. Available at http://www.commonwealthfund.org/usr_doc/hasnain-wynia_whowhenhow_726.pdf. Last accessed July 2011. 115. Seigel B, Regenstein M, Jones K, Enhancing public hospitals' reporting of data on racial and ethnic disparities in care, New York: The Commonwealth Fund; 2007. 116. Hospital Quality Alliance, Mission and vision. 117. Berwick DM, James B, Coye MJ, Connections between quality measurement and improvement. Med Care, 2003;41(1 Suppl):I30-8. 118. CMS Hospital Value-Based Purchasing Workgroup, the RAND Corporation, Brandeis University, Booz Allen & Hamilton, Boston University. U.S. Department of Health and Human Services: Report to Congress: Plan to implement a Medicare hospital value-based purchasing program. 2007. 119. Alegria M, Chatterji P, Wells K, et al., Disparity in depression treatment among racial and ethnic minority populations in the United States, Psychiatr Serv, 2008;59(11):1264-1272. Available at http://ps.psychiatryonline.org/cgi/content/abstract/59/11/1264. Last accessed July 2011. 120. Agency for Healthcare Researchand Quality (AHRQ), National Healthcare Disparities Report, Rockville, MD: U.S. Department of Health and Human Services; 2011;AHRQ Publication No. 11-0005. Available at http://www.ahrq.gov/qual/nhdr10/nhdr10.pdf. Last accessed July 2011. 121. AHRQ, TeamSTEPPS Instructor Guide, AHRQ Publication No. 06-0020 ed. Rockville, MD: Developed by the Department of Defense and published by the Agency for Healthcare Research and Quality; September 2006. 84 DRAFT – DO NOT CITE, QUOTE, OR REPRODUCE MEMBER comments due Sept. 7, 2011, 6:00 PM ET; PUBLIC COMMENTS due Aug. 31, 2011, 6:00 PM ET 122. Barnato AE, Lucas FL, Staiger D, et al., Hospital-level racial disparities in acute myocardial infarction treatment and outcomes, Med Care, 2005;43(4):308-19. 123. Ferris TG, Kuhlthau K, Ausiello J, et al., Are minority children the last to benefit from a new technology? Technology diffusion and inhaled corticosteriods for asthma, Med Care, 2006;44(1):81-86. 124. Akinbami LJ, Schoendorf KC, Trends in childhood asthma: prevalence, health care utilization, and mortality, Pediatrics, 2002;110(2 Pt 1):315-322. 125. Mattke S, Martorell F, Sharma P, et al., Quality of care for childhood asthma: estimating impact and implications, Pediatrics, 2009;123 Suppl 3:S199-204. 85 DRAFT – DO NOT CITE, QUOTE, OR REPRODUCE MEMBER comments due Sept. 7, 2011, 6:00 PM ET; PUBLIC COMMENTS due Aug. 31, 2011, 6:00 PM ET


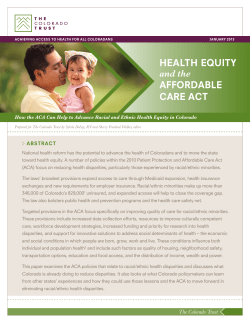


© Copyright 2026