
Shareholder Report
Canadian Tire Corporation, Limited 2015 First Quarter Report to Shareholders 13 Weeks Ended April 4, 2015 Management’s Discussion and Analysis (MD&A) 1.0 Preface ........................................................................................................................ 1 1.1 Definitions .............................................................................................................. 1 1.2 Forward-looking statements................................................................................... 1 1.3 Review and approval by the Board of Directors ..................................................... 1 1.4 Quarterly and annual comparisons in this MD&A .................................................. 2 1.5 Accounting framework ........................................................................................... 2 1.6 Accounting estimates and assumptions ................................................................. 2 1.7 Key operating performance measures and additional GAAP and non-GAAP financial measures ................................................................................................ 2 1.8 Rounding and percentages .................................................................................... 3 2.0 Company and industry overview .............................................................................. 3 3.0 Financial aspirations and strategic objectives ........................................................ 3 3.1 Financial aspirations .............................................................................................. 3 3.2 Strategic imperative and objectives ....................................................................... 5 3.2.1 Strategic imperatives ...................................................................................... 5 3.2.2 Objectives for 2015 ......................................................................................... 5 4.0 Financial performance ............................................................................................... 6 4.1 Consolidated financial performance ....................................................................... 6 4.1.1 Consolidated key operating performance measures ...................................... 6 4.1.2 Consolidated financial results ......................................................................... 7 4.1.3 Seasonal trend analysis.................................................................................. 9 4.2 Retail segment performance ................................................................................ 10 4.2.1 Retail segment key operating performance measures.................................. 10 4.2.2 Retail banner network at a glance ................................................................ 11 4.2.3 Retail segment financial results .................................................................... 12 4.2.4 Retail segment business risks ...................................................................... 13 4.3 CT REIT segment performance ........................................................................... 14 4.3.1 CT REIT segment key operating performance measures ............................. 14 4.3.2 CT REIT segment financial results ............................................................... 14 4.3.3 CT REIT segment business risks ................................................................. 15 4.4 Financial Services segment performance ............................................................ 16 4.4.1 Financial Services segment key operating performance measures ........... 16 4.4.2 Financial Services segment financial results .............................................. 16 4.4.3 Financial Services segment business risks ................................................ 17 5.0 Liquidity, capital resources and contractual obligations ..................................... 17 5.1 Summary balance sheet highlights ...................................................................... 17 5.2 Summary cash flows ............................................................................................ 19 5.3 Capital management ............................................................................................ 19 5.3.1 Capital management objectives .................................................................... 19 5.3.2 Capital under management .......................................................................... 19 5.4 Liquidity and financing ......................................................................................... 20 5.5 Capital expenditures ............................................................................................ 21 5.6 Contractual obligations, guarantees and commitments ........................................ 22 6.0 Equity ........................................................................................................................ 22 6.1 Shares outstanding .............................................................................................. 22 6.2 Dividends ............................................................................................................. 23 6.3 Equity derivative contracts ................................................................................... 23 7.0 Tax matters ............................................................................................................... 23 8.0 Accounting policies, estimates and non-GAAP measures................................... 23 8.1 Critical accounting estimates. .............................................................................. 23 8.2 Changes in accounting policies. .......................................................................... 24 8.3 Key operating performance measures and non-GAAP financial measures. ........ 25 8.3.1 Key operating performance measures ........................................................ 25 8.3.2 Non-GAAP financial measures ................................................................... 26 9.0 Enterprise risk management ................................................................................... 29 10.0 Controls and procedures....................................................................................... 29 11.0 Social and environmental responsibility.............................................................. 29 11.1 Overview ............................................................................................................. 29 11.2 Social responsibility............................................................................................. 30 11.2.1 Charitable activities ................................................................................. 30 11.2.2 Community activities ............................................................................... 30 11.3 Environmental responsibility: Business sustainability.......................................... 30 11.4 Responsible sourcing practices........................................................................... 31 12.0 Forward-looking statements and other investor communication ...................... 31 1.0 Preface 1.1 Definitions In this document, the terms “we”, “us”, “our”, “Company”, “Canadian Tire Corporation”, “CTC” and “Corporation” refer to Canadian Tire Corporation, Limited, on a consolidated basis. This document also refers to the Corporation’s three reportable operating segments: the “Retail segment”, the “CT REIT segment” and the “Financial Services segment”. The financial results for the Retail segment are delivered by the businesses operated by the Company under the Company’s retail banners, which include Canadian Tire, PartSource, Petroleum, Mark’s, Sport Chek, Sports Experts, Atmosphere and Pro Hockey Life (“PHL”). In this document: “Canadian Tire” refers to the general merchandise retail and services businesses carried on under the “Canadian Tire” and “PartSource” names and trademarks. “Canadian Tire stores” and “Canadian Tire gas bars” refer to stores and gas bars (which may include convenience stores, car washes and propane stations), respectively, operated under the “Canadian Tire” and “Gas +” names and trademarks, and “PartSource stores” refers to stores operated under the “PartSource” name and trademarks. “Petroleum” refers to the retail petroleum business carried out under the “Canadian Tire” and “Gas +” names and trademarks. “CT REIT” refers to the business carried on by CT Real Estate Investment Trust and its subsidiaries, including CT REIT Limited Partnership (“CT REIT LP”). “Financial Services” refers to the business carried on by the Company’s Financial Services subsidiaries, including Canadian Tire Bank (“CTB” or “the Bank”) and the activities of Glacier Credit Card Trust (“GCCT” or “Glacier”). “FGL Sports” refers to the retail business carried on by FGL Sports Ltd., and “FGL Sports stores” includes stores operated under the “Sport Chek”, “Sports Experts”, “Atmosphere”, and “Pro Hockey Life” names and trademarks. “Mark’s” refers to the retail business carried on by Mark’s Work Wearhouse Ltd., and “Mark’s stores” includes stores operated under the “Mark’s”, “Mark’s Work Wearhouse”, and “L’Équipeur” names and trademarks. Other terms that are capitalized in this document are defined the first time they are used. 1.2 Forward-looking statements This Management’s Discussion and Analysis (“MD&A”) contains statements that are forwardlooking. Actual results or events may differ materially from those forecast and from statements of the Company’s plans or aspirations that are made in this MD&A because of the risks and uncertainties associated with the Corporation’s business and the general economic environment. The Company cannot provide any assurance that any forecast financial or operational performance, plans or financial aspirations will actually be achieved or, if achieved, will result in an increase in the price of the Company’s shares. Refer to section 12.0 in this MD&A for a more detailed discussion of the Company’s use of forward-looking statements. 1.3 Review and approval by the Board of Directors The Board of Directors, on the recommendation of its Audit Committee, approved the contents of this MD&A on May 14, 2015. 2015 First Quarter Report 1 1.4 Quarterly and annual comparisons in this MD&A Unless otherwise indicated, all comparisons of results for Q1 2015 (13 weeks ended April 4, 2015) are against results for Q1 2014 (13 weeks ended March 29, 2014). 1.5 Accounting framework The condensed consolidated financial statements have been prepared in accordance with International Financial Reporting Standards (“IFRS”), also referred to as Generally Accepted Accounting Principles (“GAAP”), using the accounting policies described in Note 2 of the condensed consolidated financial statements. 1.6 Accounting estimates and assumptions The preparation of consolidated financial statements that conform to IFRS requires Management to make estimates and assumptions that affect the reported amounts of assets and liabilities and disclosures of contingent liabilities at the date of the consolidated financial statements and the reported amounts of revenue and expenses during the reporting period. Refer to section 8.1 in this MD&A for further information. 1.7 Key operating performance measures and additional GAAP and non-GAAP financial measures The Company has identified several key operating performance measures and non-GAAP financial measures which Management believes are useful in assessing the performance of the Company; however, readers are cautioned that some of these measures may not have standardized meanings under IFRS and, therefore, may not be comparable to similar terms used by other companies. Retail sales is one of these key operating performance measures and refers to the point of sale (i.e. cash register) value of all goods and services sold to retail customers at stores operated by Canadian Tire Associate Dealers (“Dealers”), Mark’s and FGL Sports franchisees and Petroleum retailers, at corporatelyowned stores across all retail banners and through the Company’s online sales channels, and in aggregate does not form part of the Company’s consolidated financial statements. Revenue, as reported in the Company’s consolidated financial statements, comprises primarily the sale of goods to Dealers and to franchisees of Mark’s and FGL Sports, the sale of gasoline through Petroleum retailers, the sale of goods to retail customers by stores that are corporately-owned under the Mark’s, PartSource and FGL Sports banners, the sale of services through the home services business, the sale of goods to customers through INA International Ltd. (“INA”), a business-to-business operation of FGL Sports and through the Company’s online sales channels, as well as revenue generated from interest, service charges, interchange and other fees and from insurance products sold to credit card holders in the Financial Services segment and rent paid by third-party tenants in the CT REIT segment. Management believes that retail sales and relating year-over-year comparisons provide meaningful information to investors and are expected and valued by them to help them assess the size and financial health of the retail network of stores; these measures also serve as an indicator of the strength of the Company’s brand, which ultimately impacts its consolidated financial performance. Refer to section 8.3.1 for additional information on retail sales. In addition, an aspiration with respect to retail sales has been included in our financial aspirations for the three-years ending in 2017. Refer to section 5.0 of the MD&A contained in the Company’s 2014 Annual Report, available on the Company’s website (corp.canadiantire.ca/en/investors) and SEDAR (www.SEDAR.com), for further information on the Company’s financial aspirations and for an analysis of CTC’s performance against its aspirational performance goals for 2014. The Company also evaluates performance based on the effective utilization of its assets. The primary metric used to evaluate the performance of core retail assets is average sales per square foot. Comparison of sales per square foot over several periods will identify whether existing assets are being made more productive by the retail businesses’ introduction of new store layouts and merchandising strategies. In addition, Management believes return on invested capital (“ROIC”), analyzed on a rolling 12-month basis, reflects how well the Company is allocating capital toward profitable retail investments. ROIC can be compared to CTC’s cost of capital to determine whether invested capital was used effectively. Refer to section 8.3.1 for a description of changes made to the definition of this metric in Q4 2014. In addition, an aspiration with respect to ROIC has been included in our financial aspirations for the three-years ending in 2017. Refer to section 5.0 of the MD&A contained in the Company’s 2014 Annual Report for further information on the Company’s financial aspirations and for an analysis of CTC’s performance against its aspirational performance goals for 2014. 2015 First Quarter Report 2 Additionally, the Company considers earnings before interest, tax, depreciation and amortization, and the change in fair value of the redeemable financial instrument (“EBITDA”) to be an effective measure of CTC’s profitability on an operational basis. EBITDA is a non-GAAP financial metric and is commonly regarded as an indirect measure of operating cash flow, a significant indicator of success for many businesses. Refer to section 8.3.2 for a schedule showing the relationship of the Company’s consolidated EBITDA to the most comparable GAAP measure. In the CT REIT segment, certain income and expense measurements that are recognized under GAAP are supplemented by Management’s use of certain non-GAAP financial key operating performance measures when analyzing operating performance. Management believes the non-GAAP financial key operating performance measures provide useful information to both Management and investors in measuring the financial performance and financial condition of CT REIT. These measures include funds from operations (“FFO”), adjusted funds from operations (“AFFO”) and net operating income (“NOI”). Refer to section 8.3.2 for further information and for a reconciliation of these measures to the nearest GAAP measure. Management calculates and analyzes certain measures to assess the size, profitability and quality of Financial Services’ total managed portfolio of receivables. Growth in the total managed portfolio of receivables is measured by growth in the average number of accounts and growth in the average account balance. A key profitability measure the Company tracks is the return on the average total managed portfolio (also referred to as “return on receivables” or “ROR”). Refer to section 8.3.1 for a definition of ROR. In addition, an aspiration with respect to ROR has been included in our financial aspirations for the three-years ending in 2017. Refer to section 5.0 of the MD&A contained in the Company’s 2014 Annual Report for further information on the Company’s financial aspirations and for an analysis of CTC’s performance against its aspirational performance goals for 2014. 1.8 Rounding and percentages Rounded numbers are used throughout the MD&A. All year-over-year percentage changes are calculated on whole dollar amounts except in the presentation of basic and diluted earnings per share (“EPS”), in which the year-over-year percentage changes are based on fractional amounts. 2.0 Company and industry overview For an overview of the business and a full description of the Company’s Retail, CT REIT and Financial Services operating segments, refer to section 2.1 of the MD&A contained in the Company’s 2014 Annual Report. For a discussion of the competitive landscape affecting the Company, refer to section 2.2 of the MD&A contained in the Company’s 2014 Annual Report. 3.0 Financial aspirations and strategic objectives 3.1 Financial aspirations The following represents forward-looking information and users are cautioned that actual results may vary. The Company’s three-year growth strategy, announced in 2014, includes investment in digital technology and store upgrades, with a renewed focus on target customers within each of its core businesses. For further information regarding the Company’s three-year growth strategy, visit the Company’s investor relations website at corp.canadiantire.ca/en/investors, or refer to section 5.0 in the MD&A contained in the Company’s 2014 Annual Report. The Company’s financial aspirations for its businesses for fiscal years 2015 to 2017, including a discussion of the key assumptions and risk underlying each are outlined in the table below. These financial aspirations reflect the Company’s aspirations over the life of the plan period and it is expected that performance in individual fiscal years within that period will vary. 2015 First Quarter Report 3 1. Annualized retail sales growth of 3+ percent at Canadian Tire, 5+ percent at Mark’s, and 9+ percent at FGL Sports Key assumptions: • Strong and consistent same-store sales growth across core retail businesses • Retail square footage growth at Canadian Tire and Mark’s in line with recent years • Continued Sport Chek network expansion of 2 million square feet of retail space • Growth in eCommerce sales across all retail banners • Positive customer response to brand-focused marketing, in-store merchandising, category specific tactical growth initiatives, digital strategy execution • Effective use of loyalty program customer shopping data to create targeted customer offerings and enhance in-store experience Significant risks: • Limitations on availability of preferred retail locations due to continued competition and demand for retail space in Canada • Increased competition due to expanding and new U.S. retailers, new and existing online competitors or a significant change in the Canadian retail landscape • Decline in economic growth, consumer confidence and household spending 2. Average diluted EPS growth of 8 to 10 percent over the three-year period Key assumptions: • Increasing bottom line earnings across all businesses through strong margin management and operating expense growth in line with revenue growth • Realization of cost savings and benefits aimed at improving gross margin and operating expenses, including Dealer contract initiatives and enterprise-wide productivity initiative • Successful integration of sourcing processes across INA and Mark’s businesses • Reflects financial impact of Financial Services transaction and announced share buybacks (until the end of 2015) Significant risks: • Revenue growth not achieved, same significant risks associated with retail sales aspirations described above • Increased costs relating to foreign exchange and global sourcing processes impacting the Company’s ability to hold or reduce operating and/or supply chain costs • Ability to achieve enhanced purchasing efficiencies and reduce overhead expenses 3. Financial Services return on receivables of 6+ percent annually Key assumptions: • Continued gross average accounts receivable growth • Customers respond positively to new marketing initiatives including enhanced loyalty program and strategic partnerships • Higher incremental allowance for future write-offs of the credit card portfolio • Continued prudent expense management Significant risks: • Decline in economic growth, consumer confidence and household spending • Higher credit or default risk impacts expected incremental allowance for future write-offs 4. Return on invested capital of 9 percent by the end of 2017 Key assumptions: • Improvement in retail earnings including operating expense growth in line with revenue growth • Continued investments in businesses to achieve organic growth and in projects and initiatives to improve returns • Average annual operating capital expenditures of $575 million over the three-year period Significant risks: • Revenue growth not achieved, same significant risks associated with retail sales aspirations described above • Increased costs relating to foreign exchange and global sourcing of key products impacting the Company’s ability to maintain or reduce operating and/or supply chain costs • Ability to achieve enhanced purchasing efficiencies and reduce overhead expenses 2015 First Quarter Report 4 3.2 Strategic imperatives and objectives 3.2.1 Strategic imperatives The success of any great organization is directly attributable to the quality of its leadership. Underlying the strategic imperatives identified below is the Company’s commitment to attracting and retaining worldclass talent that will drive growth in the business. The Company believes that meeting its financial aspirations is dependent on having the right team and the right corporate culture in place. Over the threeyear strategic plan period, the Company will continue to develop or acquire talent in key areas such as digital retailing, marketing and data analytics in order to drive growth in its core businesses. The following represents forward-looking information and users are cautioned that actual results may vary. The five strategic imperatives framing the Company’s growth strategy and the 2015 strategic objectives are outlined below: 1) Achieve financial aspirations The Company is committed to achieving its three-year financial aspirations as outlined in section 3.1. In addition to the objectives outlined within the following strategic imperatives, the Company must also execute on enterprise-wide productivity initiatives and operating efficiencies. 2) Make measured capital allocation decisions The Company is in a strong liquidity position with multiple sources of funding and financial flexibility. In order to support its growth agenda, the Company must actively manage its capital and make wise capital allocation decisions that support the achievement of its financial aspirations, while balancing its objective of returning value to shareholders. 3) Drive growth in core businesses The Company will focus on driving growth from within its four core businesses: Canadian Tire, FGL Sports, Mark’s and Financial Services. Growth from within the core businesses, both inorganic and organic, will primarily come from the key heritage categories. 4) Transition from old-world retailing to the new (digitization of retail) In order to compete on a global basis and continue to be relevant and engaged with its customers, the Company must invest in the future of retailing. The future of retailing, also referred to as the “digitization of retail”, requires significant investment in foundational technological platforms in order to successfully transition the Company from the old-world to the new. 5) Strengthen the brands The Company is committed to being a “brand-led” organization. It believes that the strength and value of its brands are directly correlated to the strength of its business results. Successful achievement of objectives within this strategic imperative will ensure that the Company’s brands are supported and enhanced in the eyes of its customers and other key stakeholders. 3.2.2 Objectives for 2015 In section 5.2.2 of the MD&A contained in the Company’s 2014 Annual Report, the Company identified its objectives for 2015. Successful achievement of the objectives will ensure that the Company’s brands are supported and enhanced in the eyes of its customers and other key stakeholders. Management has identified key assumptions and material risk factors that may affect the achievability of its 2015 objectives. For a discussion of these key assumptions and material risk factors, refer to sections 5.2.2 and 10.2 of the MD&A contained in the Company’s 2014 Annual Report. Q1 2015 objectives update The following represents forward-looking information and users are cautioned that actual results may vary. The Company reports on achievement of its objectives annually. In addition, on a quarterly basis, Management reviews the material risks and underlying assumptions that will impact the achievement of 2015 First Quarter Report 5 those objectives. Based on its assessment as at the date of this MD&A, there have been no material changes to such risks and underlying assumptions. The Company remains on track to achieve its 2015 objectives as stated in the MD&A contained in the Company’s 2014 Annual Report. 4.0 Financial performance 4.1 Consolidated financial performance The Company posted strong results in the quarter in both retail sales and gross margin, reflecting the success of enhanced assortments, new products and continued focus on marketing campaigns that resonate with customers. In addition, Canadian Tire executed integrated social media campaigns that engaged its customers. Weather patterns across the country during the quarter were varied, with the West seeing the early arrival of spring and the East experiencing record snow fall. As a result, the Company saw sales lifts in winterrelated products in the East and spring-related products in the West. The Company’s Financial Services segment continued its GAAR growth momentum, prudent credit risk management and expense control to contribute strong earnings growth. Non-operational items The results of operations in the current and previous quarters ended April 4, 2015 and March 29, 2014 did not include material non-operational items, and therefore the Company has not included a measure of “normalized” earnings or “normalized” diluted EPS attributable to the owners of Canadian Tire Corporation in this MD&A. 4.1.1 Consolidated key operating performance measures Key operating performance measures do not have standard meanings under IFRS and, therefore, may not be comparable to similar terms used by other companies. Refer to section 8.3 in this MD&A and to section 9.3 in the MD&A contained in the Company’s 2014 Annual Report for definitions and further information on changes made to performance measures. (C$ in millions) 1 EBITDA Selling, general and administrative expenses (excluding depreciation and amortization) as a % of revenue2 EBITDA1 as a % of revenue 1 Q1 2015 245.3 Q1 2014 212.4 Change 15.5% 25.7% 24.2% 153 bps 9.8% 8.3% 150 bps Non-GAAP measure. Refer to section 8.3.2 in this MD&A for additional information. 2 Selling, general and administrative expenses exclude depreciation and amortization of $95.2 million in the Q1 2015 ($84.7 million for Q1 2014). Selling, general and administrative expenses (excluding depreciation and amortization) as a percent of revenue typically rises in the first quarter given the additions to the retail store base over the prior year and the seasonality of the retail businesses. In Q1 2015, this metric was negatively impacted by the significant decline in Petroleum revenue due to lower gas prices. Excluding the effect of the decline in Petroleum revenue, selling, general and administrative expenses as a percent of revenue increased slightly, but less than our historical seasonal pattern, reflecting the increased focus on cost control and productivity despite higher activity levels across the businesses. 2015 First Quarter Report 6 4.1.2 Consolidated financial results Q1 2015 (C$ in millions, except where noted) Retail sales 1 Revenue Gross margin dollars Gross margin as a % of revenue Other (income) expense Selling, general and administrative expenses Net finance costs Income before income taxes Income taxes Effective tax rate Net income Net income attributable to: Owners of Canadian Tire Corporation 1 Change $ 2,462.7 $ 2,460.5 0.1% $ $ 2,514.9 882.1 35.1% (6.8) 741.0 23.6 124.3 36.0 29.0% 88.3 $ $ 2,573.1 835.3 32.5% 1.5 706.1 24.1 103.6 28.0 27.0% 75.6 (2.3)% 5.6% 261 bps 70.6 5.0 (3.0)% $ $ $ $ NM2 5.0% (2.3)% 20.0% 28.9% 16.7% 68.5 19.8 $ $ 88.3 $ 75.6 $ 0.88 $ 0.88 - $ 0.88 $ 0.88 - $ Non-controlling interests Basic earnings per share attributable to owners of Canadian Tire Corporation Diluted earnings per share attributable to owners of Canadian Tire Corporation Q1 2014 NM2 16.7% Key operating performance measure. Refer to section 8.3.1 in this MD&A for additional information. 2 Year-over-year change percent is not meaningful. Non-controlling interests The following table provides further information regarding the Company’s non-controlling interests. For additional details, refer to Note 17 to the annual consolidated financial statements contained in the Company’s 2014 Annual Report. Net income attributable to: Non-controlling interests - Financial Services Non-controlling interests - CT REIT Non-controlling interests - Retail segment subsidiary Net income attributable to non-controlling interests 2015 First Quarter Report Q1 2014 Q1 2015 (C$ in millions) $ $ 14.5 4.9 0.4 19.8 $ $ 4.9 0.1 5.0 7 Consolidated first quarter 2015 versus first quarter 2014 Earnings summary Diluted EPS attributable to owners of Canadian Tire Corporation was $0.88 in the quarter versus $0.88 in the prior year. Strong earnings performance from Financial Services and solid growth in the Retail segment was negatively impacted by a reduction in earnings attributable to the owners of CTC of $14.5 million, or $0.19 per share, resulting from the sale of 20 percent of the Financial Services business in Q4 2014, and an increase in the effective tax rate. This was partially offset by a reduction in the weighted average number of shares outstanding due to share repurchases. Retail segment earnings growth was primarily driven by strong gross margin contribution from Canadian Tire and FGL Sports, higher cents-per-litre fuel margin at Petroleum and an increase in other income due to increased real estate gains in 2015 as compared to an asset write-down in the prior year. Financial Services earnings growth was primarily driven by increased credit charges on higher average account balances, lower revenue deferral on balance transfers and deferred sales transactions, and decreased marketing expenses. Consolidated earnings growth was partially offset by increased personnel, occupancy and amortization expenses. Retail sales Consolidated retail sales increased $2.2 million, or 0.1 percent, over the prior year, which includes an 18 percent decline in Petroleum retail sales due to the decline in gas prices (down 23 percent year-overyear). Excluding Petroleum, consolidated retail sales increased 5.3 percent due to increased sales across FGL Sports, Canadian Tire and Mark’s. Refer to section 4.2.3 for further information regarding Retail segment sales growth in the quarter. Revenue Consolidated revenue declined $58.2 million, or 2.3 percent, versus the prior year, which includes a $104.3 million decline in Petroleum revenue resulting from lower gas prices. Excluding Petroleum, consolidated revenue increased $46.1 million, or 2.2 percent, primarily due to increased revenue at Financial Services, FGL Sports and Mark’s. This was partially offset by the timing of shipments to Dealers as compared to the prior year at Canadian Tire. Refer to sections 4.2.3 and 4.4.2 for further information regarding Retail and Financial Services segment revenue. Gross margin Consolidated gross margin increased $46.8 million or 5.6 percent due to increased revenue at FGL Sports, Mark’s and Financial Services, and a 261 basis point improvement in the gross margin rate. The margin rate increase was primarily driven by the Petroleum margin rate, which was up over 300 basis points. Excluding Petroleum the consolidated gross margin rate increased 113 basis points due to increased gross margin rate at Financial Services, Canadian Tire and FGL Sports. This was partially offset by increased clearance sales at Mark’s and the impact of the deterioration of the Canadian dollar against the U.S. dollar. Refer to sections 4.2.3 and 4.4.2 for further information regarding Retail and Financial Services segment gross margin. Other income/expense Consolidated other income increased $8.3 million primarily due to increased real estate gains in 2015 as compared to an asset write-down in the prior year. Selling, general and administrative expenses Consolidated selling, general and administrative expenses increased $34.9 million in the quarter, or 5 percent, due primarily to: • higher planned personnel expenses to support information technology initiatives, including the Company’s digital strategy; • higher personnel and occupancy costs relating to a greater number of corporate stores at FGL Sports; • higher property taxes and maintenance costs due to properties acquired by CT REIT from third parties in the prior year; and 2015 First Quarter Report 8 • increased depreciation and amortization relating to increased capital spending on information technology initiatives; partially offset by: • a decrease in Financial Services selling, general and administrative expenses, primarily due to lower account acquisition costs and consulting fees. Net finance costs Consolidated net finance costs decreased $0.5 million primarily due to lower interest expense on debt as a result of the early redemption of medium-term notes in Q2 2014, and an increase in interest capitalized on qualifying information technology and real estate projects. This was partially offset by lower investment income as a result of lower return on lower investment balances. Income taxes The effective tax rate increased 200 basis points to 29.0 percent due primarily to higher non-deductible stock option expense and higher adjustments to tax estimates recorded in the quarter. 4.1.3 Seasonal trend analysis Over the past two years, the Company’s quarterly revenue and earnings have steadily increased, with the exception of the current quarter, which was impacted by the decline in gasoline prices and the sale of 20 percent of the Financial Services business. The fourth quarter typically generates the greatest contribution to revenues and earnings, and the first quarter the least. This is largely due to the seasonal nature of some merchandise and the timing of marketing programs in the retail businesses. The following table shows the financial performance of the Company by quarter for the last two years and has been prepared in accordance with IFRS. (C$ in millions, except per share amounts) Revenue Net income Basic earnings per share attributable to owners of Canadian Tire Corporation Diluted earnings per share attributable to owners of Canadian Tire Corporation 2015 First Quarter Report $ Q1 2015 2,514.9 $ 88.3 Q4 2014 3,653.8 $ 206.6 Q3 2014 3,069.9 $ 178.2 Q2 2014 3,166.1 $ 178.9 Q1 2014 2,573.1 $ 75.6 Q4 2013 3,328.7 $ 191.0 Q3 2013 2,956.0 $ 145.5 Q2 2013 3,021.1 154.9 0.88 2.46 2.19 2.14 0.88 2.34 1.81 1.92 0.88 2.44 2.17 2.12 0.88 2.32 1.79 1.91 9 4.2 Retail segment performance 4.2.1 Retail segment key operating performance measures Key operating performance measures do not have standard meanings under IFRS and, therefore, may not be comparable to similar terms used by other companies. Refer to section 8.3 in this MD&A and to section 9.3 in the MD&A contained in the Company’s 2014 Annual Report for definitions and further information on changes made to performance measures. Q1 2014 Q1 2015 (year-over-year percentage change, C$ in millions, except where noted) Change Retail segment – total Retail sales growth Retail ROIC 1.2% 0.1% Revenue1 $ 2 EBITDA11 Retail segment – by banner $ 2,207.3 7.94% $ 89.0 $ 2,293.1 (3.7)% 7.79% 80.4 10.7% Canadian Tire Retail sales growth3 Same-store sales growth Sales per square foot4 (whole $) Revenue1, 5 FGL Sports 400 $ 388 $ 1,217.9 $ 1,218.9 8.6% Same-store sales growth6, 12 8.6% Sales per square foot7 (whole $) Revenue1 Mark’s (0.5)% 4.7% $ Retail sales growth6 1.7% 6.4% 292 $ 282 3.4% $ 405.0 $ 379.4 6.7% 4.4% 9, 12 Sales per square foot9 (whole $) 1, 10 Revenue Petroleum 2.7% 2.9% 5.5% $ 337 $ 324 4.0% $ 209.6 $ 204.3 2.6% Gasoline volume growth in litres Same-store gasoline volume growth in litres12 Retail sales growth Revenue1 Gross margin dollars 3.0% (0.1)% $ Retail sales growth8 Same-store sales growth 0.0% 4.5% 3, 12 2.4% 0.0% 1.9% (18.0)% (1.6)% 3.3% $ 394.8 $ 499.1 (20.9)% $ 41.6 $ 36.5 13.9% 1 Inter-segment revenue within the retail banners of $20.0 million in the first quarter of 2015 ($9.3 million for Q1 2014) has been eliminated at the Retail segment level. Revenue reported for Canadian Tire, FGL Sports, Mark’s and Petroleum includes inter-segment revenue. 2 Figures are calculated on a rolling 12 month basis. Retail ROIC has been restated. Refer to section 8.3.1 in this MD&A for additional information. 3 Includes sales from Canadian Tire stores, PartSource stores and the labour portion of Canadian Tire’s auto service sales. 4 Figures are calculated on a rolling 12 month basis. Excludes PartSource stores. Retail space does not include seasonal outdoor garden centre, auto service bays, warehouse and administrative space. 5 Includes revenue from Canadian Tire, PartSource and Franchise Trust. 6 Retail sales include sales from both corporate and franchise stores. Figures are calculated on a rolling 12 month basis and include both corporate and franchise stores. Sales per square foot include warehouse and administrative space. 7 8 Includes retail sales from Mark’s corporate and franchise stores and ancillary revenue related to embroidery and alteration services. 9 Figures are calculated on a rolling 12 month basis and include sales from both corporate and franchise stores and excludes ancillary revenue. Sales per square foot does not include warehouse and administrative space. 10 Includes sale of goods to Mark’s franchise stores and retail sales from Mark's corporate stores and includes ancillary revenue related to embroidery and alteration services. 11 Non-GAAP measure. Refer to section 8.3.2 in this MD&A for additional information. 12 Same-store sales have been calculated by aligning the 2014 fiscal calendar to match the 2015 fiscal calendar (i.e. sales from week 1 in 2015 are compared against week 2 in 2014) 2015 First Quarter Report 10 4.2.2 Retail banner network at a glance Number of stores and retail square footage April 4, 2015 January 3, 2015 March 29, 2014 Canadian Tire stores1 Smart stores Updated and expanded stores Traditional stores Small Market stores Other Total Canadian Tire stores PartSource stores 340 94 35 22 2 493 91 337 96 36 22 2 493 91 309 125 36 21 1 492 91 FGL Sports stores Sport Chek Sports Experts Atmosphere 188 73 66 189 73 66 170 71 65 107 434 108 436 111 417 303 34 44 304 34 45 216 120 381 295 1,694 383 297 1,700 20.5 0.3 7.2 20.5 0.3 7.2 3.5 3.5 6.7 3.4 31.5 31.5 30.7 Consolidated store count Other Total FGL Sports stores Mark’s stores1 Mark’s Mark’s Work Wearhouse L'Équipeur Work World Total Mark’s stores Canadian Tire gas bar locations Total stores Consolidated retail square footage2 (in millions) Canadian Tire PartSource FGL Sports Mark’s Total retail square footage2 (in millions) 1 Store count numbers reflect individual selling locations. Both Canadian Tire and Mark’s totals include stores that are co-located. 2 The average retail square footage for Petroleum’s convenience stores was 535 square feet per store in Q1 2015 (528 square feet per store in Q1 2014). It is not included in the above. 2015 First Quarter Report 45 1 382 301 1,683 20.3 0.3 11 4.2.3 Retail segment financial results (C$ in millions) Retail sales 1 Revenue Gross margin dollars Gross margin as a % of revenue Other income Selling, general and administrative expenses Net finance income Income before income taxes 1 Q1 2015 Q1 2014 Change $ 2,462.7 $ 2,460.5 0.1% $ $ 2,207.3 677.0 30.7% (33.5) 699.8 $ $ 2,293.1 (3.7)% 3.2% 206 bps 46.3% 4.8% 67.0% 18.6% $ (9.0) 19.7 $ 656.3 28.6% (23.0) 668.0 (5.3) 16.6 Key operating performance measure. Refer to section 8.3.1 in this MD&A for additional information. Retail segment first quarter 2015 versus first quarter 2014 Earnings summary Income before income taxes in the Retail segment was $19.7 million, an increase of 18.6 percent over the prior year due to strong gross margin contributions from Canadian Tire, FGL Sports and Petroleum. In addition, an increase in other income due to increased real estate gains in 2015 as compared to an asset write-down in the prior year, and increased inter-segment income earned on CT REIT Class B LP Units, also contributed to earnings growth. This was partially offset by increased expenses, primarily relating to personnel and occupancy costs, and higher amortization charges. Retail sales Canadian Tire retail sales increased 4.5 percent (same-store sales increased 4.7 percent) primarily due to improved sales mix resulting from sales of higher priced items and new assortments. Sales growth was led by the Automotive and Living categories, with the Living category benefitting from continued growth in in-store special promotions. During the quarter, significant snowfall in the East contributed to increased sales of winter-related products and warmer temperatures in the West drove early demand for spring/summer categories. FGL Sports retail sales increased 8.6 percent (same-store sales increased 8.6 percent) driven by the success of new marketing campaigns. Key category sales drivers included footwear and athletic clothing due to the launch of the “All Sweat is Equal” campaign, and spring-related categories including cycling, team sports and camping. There were 18 additional Sport Chek stores compared to the prior year, which also contributed to retail sales growth. Retail sales at Mark’s increased 4.4 percent (same-store sales increased 5.5 percent) led by strong sales in men’s casual footwear and denim, partly resulting from the success of promotional events and campaigns including the re-launch of the “Everything in Jeans” campaign, flyer features, and a promotion with the SCENE program. Industrial wear sales were soft in the quarter, reflecting warmer winter weather in Western Canada compared to the prior year and lower sales at stores located in Northern Alberta. Petroleum retail sales declined 18 percent resulting from the decline in gas prices (down 23 percent yearover-year), partially offset by higher gas volume sales. Revenue Retail segment revenue decreased 3.7 percent in the quarter, primarily driven by Petroleum due to the decline in gas prices. Excluding Petroleum, Retail segment revenue increased 1.0 percent as a result of: • higher sales at FGL Sports and Mark’s; and • increased shipments to Dealers at Canadian Tire in the Playing and Living categories; partially offset by: • abnormally high shipments of winter-related products in the prior year due to the 2013 ice storm. 2015 First Quarter Report 12 Gross margin Retail segment gross margin increased $20.7 million or 3.2 percent due to increased revenue at FGL Sports, higher shipments and a 206 basis point improvement in the gross margin rate. The gross margin rate increase was primarily driven by Petroleum, which was up over 300 basis points. Excluding Petroleum, the Retail segment gross margin rate increased 52 basis points due to: • a shift in mix to higher margin products and improved mix of promotional and regular shipments at Canadian Tire; and • favourable sales mix at FGL Sports; partially offset by: • increased clearance sales at Mark’s; and • the impact of the deterioration of the Canadian dollar against the U.S. dollar. Other income Retail segment other income increased $10.5 million primarily due to increased real estate gains in 2015 as compared to an asset write-down in the prior year, and higher distributions earned on CT REIT Class B LP Units held by CTC. Selling, general and administrative expenses Retail segment selling, general and administrative expenses increased $31.8 million in the quarter, or 4.8 percent due primarily to: • higher planned personnel expenses to support information technology initiatives, including the Company’s digital strategy; • higher personnel and occupancy costs due to a greater number of corporate stores at FGL Sports; • higher inter-segment occupancy costs related to market rent paid on retail properties sold to CT REIT; and • increased depreciation and amortization primarily due to increased capital spending on information technology initiatives; partially offset by: • lower other expenses due to savings in back-office administrative expenses. Net finance income Net finance income increased $3.7 million primarily due to lower interest expense on debt as a result of the early redemption of medium-term notes in Q2 2014, an increase in interest capitalized on qualifying information technology and real estate projects, and higher interest income earned on inter-segment loans. 4.2.4 Retail segment business risks The Retail segment is exposed to a number of risks in the normal course of business that have the potential to affect its operating performance. These include, but are not limited to, supply chain disruption, seasonality, environmental and global sourcing risks. Refer to section 6.4.1.3 of the MD&A contained in the 2014 Annual Report for a discussion of these business-specific risks. Also refer to section 10.2 of the MD&A contained in the Company’s 2014 Annual Report for a discussion of other industry-wide and company-wide risks affecting the business. 2015 First Quarter Report 13 4.3 CT REIT segment performance 4.3.1 CT REIT segment key operating performance measures Key operating performance measures do not have standard meanings under IFRS and, therefore, may not be comparable to similar terms used by other companies. Refer to section 8.3 in this MD&A and to section 9.3 in the MD&A contained in the Company’s 2014 Annual Report for definitions and further information on changes made to performance measures. Q1 2014 Q1 2015 (C$ in millions) Net operating income1 (NOI) $ $ 64.5 Change 58.1 11.1% Funds from operations1 (FFO) 47.4 42.7 11.1% Adjusted funds from operations1 (AFFO) 36.9 32.3 14.1% 1 Non-GAAP measures. Refer to section 8.3.2 in this MD&A for additional information. 4.3.2 CT REIT segment financial results (C$ in millions) Property revenue Property expense General and administrative expense Net finance costs Fair value gain on investment properties Income before income taxes $ $ Q1 2015 92.4 21.6 2.4 21.5 (8.6) 55.5 $ $ Q1 2014 82.7 17.9 1.9 20.2 (127.0) 169.7 Change 11.8% 20.4% 33.7% 6.0% (93.2)% (67.2)% CT REIT segment first quarter 2015 versus first quarter 2014 Earnings summary Income before income taxes in the CT REIT segment decreased $114.2 million in the quarter, due to the gain recorded on the revaluation of investment properties. Excluding the fair value gain on investment properties, income before income taxes increased $4.2 million primarily due to additional properties acquired during 2014. Property revenue Revenue for the quarter was $92.4 million, of which $88.4 million was received from CTC. Revenue consists of base rent, operating cost and property tax recoveries. Property revenue increased by $9.7 million, or 11.8 percent, compared to the prior year mainly due to additional properties acquired during 2014. Property expense Property expense for the quarter was $21.6 million, of which the majority of the costs are recoverable from tenants, with CT REIT absorbing these expenses to the extent of vacancies. Property expense consists primarily of taxes and costs incurred pursuant to the property management agreement between CT REIT and CTC. Property expense increased by $3.7 million, or 20.4 percent, compared to the prior year largely due to property expenses related to additional properties acquired during 2014. General and administrative expense General and administrative expenses are primarily related to ongoing operational costs associated with the public entity and outsourced costs which are largely related to the services provided by CTC pursuant to the services agreement between CT REIT and CTC. 2015 First Quarter Report 14 General and administrative expenses were higher by $0.5 million, or 33.7 percent, compared to the prior year due primarily to additional personnel expenses as a result of increased headcount and higher Unitbased compensation as a result of the increase in the trading price of Units. Net finance costs Net finance costs for the quarter primarily relate to distributions on the Class C LP Units held by CTC. Net finance costs were $1.3 million, or 6 percent, higher compared to the prior year largely due to mortgages assumed, draws on CT REIT’s bank credit facility and an increase in Class C LP Units issued during 2014 in connection with CT REIT’s investment activities. Net operating income During the quarter, NOI was $64.5 million which consists of rental revenue less property operating costs. NOI was higher by $6.4 million, or 11.1 percent, compared to the prior year mainly due to additional properties acquired during 2014 and rent escalations for properties initially acquired when CT REIT was formed in 2013. NOI is a non-GAAP measure; refer to section 8.3.2 for additional information. Funds from operations and adjusted funds from operations FFO and AFFO for the quarter were $47.4 million and $36.9 million, respectively. FFO and AFFO were higher compared to the prior year by $4.7 million and $4.6 million, respectively, largely due to the impact of the NOI variances discussed above. FFO and AFFO are non-GAAP measures, refer to section 8.3.2 for additional information. 4.3.3 CT REIT segment business risks CT REIT is exposed to a number of risks in the normal course of business that have the potential to affect its operating performance. These include, but are not limited to, financial risks, real property ownership and tenant risks and tax-related risks. Refer to section 6.4.2.3 of the MD&A contained in the Company’s 2014 Annual Report for a discussion of these business-specific risks. Also refer to section 4 in CT REIT’s Annual Information Form (“AIF”) and Part X – Enterprise Risk Management in CT REIT’s MD&A for the period ended December 31, 2014 for a comprehensive discussion of risks that affect its operations and also to section 10.2 in the Company’s MD&A contained in the Company’s 2014 Annual Report for a discussion of industry-wide and company-wide risks affecting the business. 2015 First Quarter Report 15 4.4 Financial Services segment performance 4.4.1 Financial Services segment key operating performance measures Key operating performance measures do not have standard meanings under IFRS and, therefore, may not be comparable to similar terms used by other companies. Refer to section 8.3 in this MD&A and to section 9.3 in the MD&A contained in the Company’s 2014 Annual Report for definitions and further information on changes made to performance measures. Q1 2015 (year-over-year percentage change, C$ in millions, except where noted) 1 Credit card sales growth Gross average accounts receivable (GAAR) $ 2 Revenue (as a % of GAAR) Average number of accounts with a balance3 (thousands) 3 Average account balance (whole $) $ 0.2% 4,852.2 $ Q1 2014 5.5% Change 4,542.1 6.8% 23.00% 23.40% 1,827 1,797 1.7% 2,524 5.1% 2,654 $ Net credit card write-off rate2,3 6.03% 5.85% Past due credit card receivables3,4 (PD2+) 3.28% 3.27% Allowance rate5 2.42% 2.83% 2 Operating expenses (as a % of GAAR) 6.27% 6.42% Return on receivables2 7.63% 7.31% 1 Credit card sales exclude balance transfers. 2 Figures are calculated on a rolling 12 month basis. 3 Credit card portfolio only. 4 Credit card receivables more than 30 days past due as a percentage of total ending credit card receivables. 5 The allowance rate was calculated based on the total managed portfolio of loans receivable. 4.4.2 Financial Services segment financial results (C$ in millions) Revenue Gross margin dollars Gross margin (% of revenue) Other expense Selling, general and administrative expenses Net finance income Income before income taxes 1 $ $ Q1 2015 284.5 169.0 59.4% 1.2 67.5 (0.6) 100.9 $ $ Q1 2014 264.6 150.4 56.8% 0.2 70.0 (2.0) 82.2 Change 7.5% 12.3% 254 bps NM1 (3.5)% (70.6)% 22.6% Year-over-year change percent is not meaningful. Financial Services segment first quarter 2015 versus first quarter 2014 Earnings summary Financial Services income before income taxes of $100.9 million increased $18.7 million, or 22.6 percent, primarily the result of increased credit charges, due to increased average account balances, lower revenue deferral on balance transfers and deferred sales transactions, and decreased marketing expenses. Revenue Financial Services segment revenue increased 7.5 percent in the quarter compared to the prior year due primarily to higher credit charges on increased GAAR and lower revenue deferral on both balance 2015 First Quarter Report 16 1 transfers and deferred sales transactions . GAAR increased 6.8% over the prior year due to increased average account balances and growth in active accounts. Gross margin Financial Services segment gross margin dollars increased 12.3 percent over the prior year. The gross margin rate increased 254 basis points primarily due to higher revenue resulting from successful balance building programs, along with increased yield due to a reduction in the level of promotional financing executed relative to Q4 2014. Selling, general and administrative expenses Financial Services segment selling, general and administrative expenses decreased 3.5 percent in the quarter from the prior year primarily due to lower investment in new account acquisition during the quarter, and savings in consulting fees. Net finance income Financial Services segment net finance income decreased $1.4 million in the quarter due primarily to lower interest earned on inter-company loans. 4.4.3 Financial Services segment business risks Financial Services segment is exposed to a number of risks in the normal course of business that have the potential to affect its operating performance. These include, but are not limited to, consumer credit risk, securitization funding risk, interest rate and regulatory risk. Refer to sections 6.4.3.3 of the MD&A contained in the Company’s 2014 Annual Report for a discussion of these business-specific risks. Also refer to section 10.2 in the MD&A contained in the Company’s 2014 Annual Report for a discussion of additional industry-wide and company-wide risks. 5.0 Liquidity, capital resources and contractual obligations 5.1 Summary balance sheet highlights Selected line items from the Company’s assets, liabilities and shareholders’ equity as at April 4, 2015, January 3, 2015 and March 29, 2014 are noted below. Assets Cash and cash equivalents Trade and other receivables Loans receivable Merchandise inventories Property and equipment Total assets Liabilities Deposits Trade and other payables Short-term borrowings Current portion of long-term debt Long-term debt Long-term deposits Other long-term liabilities Total liabilities March 29, 2014 April 4, 2015 (C$ in millions) $ $ $ 291.3 1,105.4 4,700.5 1,891.1 3,780.7 14,534.0 $ $ 576.4 853.0 4,411.7 1,678.8 3,500.6 13,586.7 January 3, 2015 $ $ 662.1 880.2 4,905.5 1,623.8 3,743.1 14,553.2 869.6 1,896.6 197.0 587.4 2,130.4 1,118.8 1,779.8 120.7 271.7 2,337.0 950.7 1,961.2 199.8 587.5 2,131.6 1,361.3 788.8 8,869.2 1,221.0 225.3 8,117.7 1,286.2 787.8 8,922.4 $ $ 1 In accordance with IFRS, balance transfers, deferred sales and installment sales are recorded at fair value using an effective interest rate. Financial Services records a reduction to revenue when funding these loans, which is amortized back into revenue over the term of the loan. 2015 First Quarter Report 17 The year-over-year increase in total assets of $947.3 million was due primarily to: • an increase in loans receivables of $288.8 million largely relating to higher credit card sales and higher average account balances at Financial Services; • an increase in property and equipment of $280.1 million primarily due to acquisitions by CT REIT including Canada Square and Dufferin Place, higher capital spending on information technology initiatives, and increased spending on the Bolton Distribution Centre (“DC”) construction; • an increase in trade and other receivables of $252.4 million driven by an increase in derivative assets of $151 million arising from a more favourable valuation of the foreign exchange and equity hedge portfolios combined with an increase in Dealer accounts receivable at Canadian Tire of $93 million due to higher Dealer shipments; and • an increase in merchandise inventories of $212.3 million across retail banners. Higher inventory levels at Canadian Tire were mainly driven by new camping brands including Woods and Outbound, timing of vendor shipments and higher inventory levels resulting from additional purchases in Q4 2014 to mitigate the risk of port disruptions at that time. Higher inventory at FGL Sports was to support new stores in the network and sales growth, and inventory levels at Mark’s were higher to support sales growth and an expanded assortment, particularly in footwear; partially offset by: • a decrease in cash and cash equivalents of $285.1 million due to surplus cash held by Financial Services in the prior year to fund Glacier notes of $252.5 that matured in May 2014. The year-over-year increase in total liabilities of $751.5 million was due primarily to: • an increase in other long-term liabilities of $563.5 million, largely attributable to the $517 million redeemable financial instrument issued in connection with the sale of 20 percent of the Financial Services business; • an increase in trade and other payables of $116.8 million mainly driven by higher merchandise payables as a result of higher inventory levels across all retail banners, increased compensation incentive accruals and higher valuation of U.S. dollar denominated payables; • a net increase in term debt of $109.1 million due to $247.5 million net issuance of Glacier notes and assumed mortgages of $58 million at CT REIT in the prior year, partially offset by lower outstanding long-term debt; partially offset by: • a net decrease in deposits of $108.9 million at Financial Services Total assets decreased by $19.2 million compared to January 3, 2015, primarily due to: • decrease in cash and cash equivalents of $370.8 million (for details refer to section 5.2); and • decrease in loans receivables of $205 million mainly due to a reduction in credit card loans; customer payments were greater than sales in the quarter, leading to an overall decline in credit card receivables; partially offset by: • an increase in merchandise inventories of $267.3 million mainly driven by higher inventory levels across retail banners to support same-store sales growth and new or expanded assortments; and • an increase in trade and other receivables of $225.2 million as a result of an increase in derivative assets from a more favourable valuation of the foreign exchange and equity hedge portfolios, and Dealer accounts receivable at Canadian Tire. The Company’s liabilities as at April 4, 2015 are not materially different than the liabilities as at January 3, 2015. For the complete balance sheet, refer to the condensed consolidated balance sheets included in the condensed interim consolidated financial statements for the first quarter of 2015. 2015 First Quarter Report 18 5.2 Summary cash flows The Company’s cash and cash equivalents position, net of bank indebtedness was 281.5 million as at April 4, 2015. The increase in cash used in the quarter of $289.2 million compared to prior year was primarily due to: • higher investment in working capital requirements mainly due to the increase in inventory levels across retail banners to support same-store sales growth, new or expanded assortments and more stores in the network; and • an increase in cash used in investing activities due to the timing of maturity of short-term investments. The Company’s consolidated statements of cash flows for the quarters ended April 4, 2015 and March 29, 2014 are noted below: (C$ in millions) Cash generated from operating activities before the undernoted items Change in operating working capital and other Change in loans receivable net of impairment loss Cash used for operating activities $ Q1 2015 136.5 (502.2) 180.7 (185.0) $ Q1 20141 124.2 (314.3) 147.6 (42.5) $ Change 12.3 (187.9) 33.1 (142.5) Cash generated from investing activities before the undernoted items Additions to property and equipment and investment property Additions to intangible assets Cash (used for) generated from investing activities 48.4 (96.8) (26.4) (74.8) 140.7 (75.4) (26.5) 38.8 (92.3) (21.4) 0.1 (113.6) Cash used for financing activities before the undernoted items Change in deposits (99.6) (6.9) (81.9) 8.5 (17.7) (15.4) (106.5) (73.4) (33.1) Cash used for financing activities Cash used in the period 1 $ (366.3) $ (77.1) $ (289.2) Prior year figures have been restated. Refer to Note 17 of the condensed consolidated interim financial statements. 5.3 Capital management In order to support its growth agenda and meet the goals highlighted in its strategic objectives, the Company actively manages its capital. 5.3.1 Capital management objectives The Company’s objectives when managing capital are: • ensuring sufficient liquidity to support its financial obligations and execute its operating and strategic plans; • maintaining healthy liquidity reserves and access to capital; and • minimizing the after-tax cost of capital while taking into consideration current and future industry, market and economic risks and conditions. The current economic environment has not caused Management to change the Company’s objectives in managing capital. 5.3.2 Capital under management The definition of capital varies from company to company, from industry to industry and for different purposes. The Company’s definition of capital is the same as that detailed in Note 4 of the annual financial statements contained in the Company’s 2014 Annual Report, which includes Glacier indebtedness but excludes Franchise Trust indebtedness. The Company monitors its capital structure through measuring various debt-to-capitalization and debt-toearnings ratios and ensures its ability to service debt and meet other fixed obligations by tracking its interest and other fixed-charge coverage ratios. As part of this process, Management calculates and monitors its consolidated adjusted net debt metric which includes Glacier indebtedness but excludes Franchise Trust indebtedness. A reconciliation of the Company’s adjusted net debt as at April 4, 2015 to reported GAAP measures is provided in section 8.3.2 of this MD&A. 2015 First Quarter Report 19 The Company manages its capital structure with a view to maintaining an investment-grade rating from two credit rating agencies. Management calculates its ratios to approximate the methodology of debt rating agencies and other market participants on a current and prospective basis. To assess its effectiveness in managing capital, Management monitors these ratios against targeted ranges. The Company was in compliance with all covenants as at April 4, 2015 and March 29, 2014. Under these covenants, the Company currently has sufficient flexibility to fund business growth and maintain or amend dividend rates within its existing dividend policy. The Company was in compliance with all regulatory capital guidelines established by the Office of the Superintendent of Financial Institutions of Canada and its Internal Capital Adequacy Assessment Process which it utilizes to achieve its goals and objectives associated with the operations of CTB, a federally chartered bank. 5.4 Liquidity and financing The Company is in a strong liquidity position with the ability to access multiple sources of funding to ensure that liquidity is available to meet the Company’s strategic objectives. Bank lines of credit totaling $1.5 billion are available to the Corporation through a five-year $1.2 billion syndicated credit facility expiring in July 2019 and $300 million in bilateral credit agreements expiring in March 2016. Bank lines of credit totaling $200 million are available to CT REIT under a four-year syndicated revolving credit facility maturing in October 2017. In addition, CTB has a bank line of credit totaling $250M and a $2 billion note purchase facility available for the purchase of Senior and Subordinated Notes issued by Glacier, both expiring in October 2017. At quarter end, the Company had no commercial paper or borrowings outstanding under its bank lines of credit. Glacier had $122 million of commercial paper outstanding and CT REIT had $74.9 million of borrowings under its bank line of credit. During the quarter, • Glacier filed a short-form base shelf prospectus on March 31, 2015 enabling it to issue up to $1.5 billion of term notes for the subsequent 25-month period; • CT REIT filed a base shelf prospectus under which it may raise up to $1.5 billion of debt and equity capital, and qualifies the sale of CT REIT Units by CTC; and • On March 30, 2015, the holders of the Company’s 6.25% medium term notes, series 2, due April 13, 2028 (the “2028 notes”) and 6.32% medium term notes, series 2, due February 24, 2034 (the “2034 notes”) approved certain amendments to the 2028 notes, the 2034 notes and the terms of the trust indenture dated as of June 4, 1993 as amended or supplemented from time to time, between the Corporation and BNY Trust Company of Canada. As a result of the amendments, the interest rate on the 2028 notes will increase to 6.375% (from 6.25%) and the interest rate on the 2034 notes will increase to 6.445% (from 6.32%) effective March 30, 2015. Additional details on the Company’s sources of funding, credit ratings and a description of credit market conditions were provided in section 7.3 of the MD&A contained in the Company’s 2014 Annual Report. 2015 First Quarter Report 20 5.5 Capital expenditures The Company’s capital expenditures for the periods ended April 4, 2015 and March 29, 2014 were as follows: (C$ in millions) Real estate Information technology Other operating Operating capital expenditures CT REIT acquisitions and developments excluding vend-ins from CTC1 Distribution capacity Total capital expenditures2 $ Q1 2015 31.0 36.4 8.9 76.3 $ Q1 2014 43.8 18.3 6.1 68.2 14.7 26.4 $ 117.4 5.8 $ 74.0 1 Q1 2015 capital expenditures relate primarily to developments and intensifications performed by CT REIT on properties for lease by the Retail segment. Prior year capital expenditures relate primarily to the acquisition of one property from a third party. 2 Capital expenditures are presented on an accrual basis and include software additions, but exclude acquisitions related to business combinations and intellectual properties. Capital expenditures in Q1 2015 were $117.4 million compared to $74 million in the prior year. Operating capital expenditures, which excludes spending on additional distribution capacity and CT REIT third-party acquisitions and developments, were $76.3 million compared to $68.2 million in the prior year. The increase in operating capital expenditures is due to higher capital spending on information technology initiatives, including the Company’s digital strategy, partially offset by lower spending on real estate projects. The spending on distribution capacity primarily relates to the Bolton DC, for which construction began in the spring of 2014. In Q1 2015, CT REIT completed three intensifications, one development land acquisition and incurred property maintenance capital expenditures for a total cost of $14.7 million. In addition, CT REIT acquired five properties from the Retail segment (vend-ins) totaling $62 million. Capital commitments The Company has commitments of approximately $127.1 million at April 4, 2015 for the acquisition of tangible and intangible assets. The following represents forward-looking information and users are cautioned that actual results may vary. In connection with the announcement of the Company’s three-year growth strategy on October 9, 2014, the Company announced that it expects average annual operating capital expenditures of approximately $575 million between fiscal years 2015 and 2017, including significant new investments in digital technology and continued investment in the Company’s store network. The average annual operating capital expenditures do not include spending relating to new DC capacity, properties CT REIT acquires from third parties or costs incurred relating to the recently announced agreement to acquire 12 strategic real estate leases, formerly held by Target Canada which is subject to court approval. Operating capital expenditures in 2015 are expected to be higher than the three-year average, within a range of $600 million to $625 million, primarily due to increased spending on the retail network expansion, including the FGL Sports growth strategy, and significant investments in digital and technology initiatives. The Company expects capital expenditures for additional distribution capacity to be in the range of $175 million to $200 million in 2015. This does not include acquisitions of third-party properties by CT REIT as part of its growth strategy or costs incurred relating to the agreement, subject to court approval, to acquire 12 former Target locations referenced above. 2015 First Quarter Report 21 If required, the Company will update its capital expenditure guidance as part of its second quarter disclosure documents. 5.6 Contractual obligations, guarantees and commitments The Company funds capital expenditures, working capital needs, dividend payments and other financing needs, such as debt repayments and Class A Non-Voting Share purchases under a normal course issuer bid (“NCIB”) program, from a combination of sources. In addition, the Company has a number of obligations related to finance leases, operating leases and purchase obligations. For a description of contractual obligations as at January 3, 2015, refer to section 7.3.1.1 of the MD&A contained in the Company’s 2014 Annual Report. There were no significant changes to the outstanding contractual obligations identified at year end, other than those discussed in this document. The Company believes it has sufficient liquidity available to meet its contractual obligations as at April 4, 2015. In the normal course of business, the Company enters into numerous agreements that may contain features that meet the definition of a guarantee and provides other additional indemnification commitments to counterparties in various transactions that require the Company to compensate the counterparties for certain amounts and costs incurred. For a discussion of the Company’s significant guarantees and commitments, refer to Note 37 to the annual consolidated financial statements contained in the Company’s 2014 Annual Report. The Company’s maximum exposure to credit risk with respect to such guarantees and commitments is provided in Note 5 to the annual consolidated financial statements contained in the Company’s 2014 Annual Report. There were no significant changes in guarantees and commitments identified at year-end, other than those discussed in this document. 6.0 Equity 6.1 Shares outstanding (C$ in millions) March 29, 20141 April 4, 2015 January 3, 2015 Authorized 3,423,366 Common Shares 100,000,000 Class A Non-Voting Shares Issued 3,423,366 Common Shares (March 29, 2014 3,423,366; January 3, 2015 - 3,423,366) $ 73,602,606 Class A Non-Voting Shares (March 29, 2014 - 76,265,951; January 3, 2015 - 74,023,208) $ 1 0.2 $ 0.2 $ 0.2 693.1 $ 711.4 $ 695.3 693.3 $ 711.6 $ 695.5 Refer to Note 17 in the condensed interim consolidated financial statements for details of accounting policy change. On February 26, 2015, the Toronto Stock Exchange (“TSX”) accepted the Company’s notice of intention to make a NCIB to purchase up to 4.0 million Class A Non-Voting Shares between March 2, 2015 and March 1, 2016 (the “2015 NCIB”). As at April 4, 2015, the Company had purchased 435,700 Class A Non-Voting Shares at a cost of $56.5 million under the 2015 NCIB. On October 9, 2014, CTC announced that it intended to repurchase $400 million of its Class A Non-Voting Shares in excess of the amount required for anti-dilutive purposes through to the end of 2015. As at April 4, 2015 CTC had repurchased $138.3 million towards this commitment, leaving $261.7 million remaining to be repurchased in fiscal 2015. 2015 First Quarter Report 22 6.2 Dividends The Company has declared dividends payable to holders of Class A Non-Voting Shares and Common Shares at a rate of $0.525 per share payable on September 1, 2015 to shareholders of record as of July 31, 2015. The dividend is considered an “eligible dividend” for tax purposes. 6.3 Equity derivative contracts The Company enters into equity derivative contracts to provide a partial offset to its exposure to fluctuations in stock option and performance share unit (“PSU”) plan expense. Equity derivatives commonly used by the Company include total return swaps, floating-rate equity forwards and fixed-rate equity forwards. During the quarter, equity forwards, which had hedged 275,000 units of PSUs and stock options, settled. This resulted in a payment to the Company of $15.8 million. 7.0 Tax matters In the ordinary course of business, the Company is subject to ongoing audits by tax authorities. While the Company has determined that its tax filing positions are appropriate and supportable, from time to time, certain matters are reviewed and challenged by the tax authorities. There have been no material changes in the status of ongoing audits by tax authorities as disclosed in section 8.0 in the MD&A contained in the Company’s 2014 Annual Report. The Company anticipates the resolution of certain tax matters under audit by the end of 2015. The Company regularly reviews the potential for adverse outcomes in respect of tax matters. The Company believes that the ultimate disposition of these matters will not have a material adverse effect on its liquidity, consolidated financial position or net income because the Company has determined that it has adequate provision for these tax matters. Should the ultimate tax liability materially differ from the provision, the Company’s effective tax rate and its earnings could be affected positively or negatively in the period in which the matters are resolved. Income taxes for the 13 weeks ended April 4, 2015 increased to $36 million (2014 - $28 million). The effective tax rate for the 13 weeks ended April 4, 2015 increased to 29.0 percent (2014 – 27.0 percent) primarily related to higher non-deductible stock option expense and adjustments to tax estimates recorded in the quarter. 8.0 Accounting policies, estimates and non-GAAP measures 8.1 Critical accounting estimates The Company estimates certain amounts reflected in its consolidated financial statements using detailed financial models that are based on historical experience, current trends and other assumptions that are believed to be reasonable under the circumstances. Actual results could differ from those estimates. In Management’s judgment, the accounting policies and estimates detailed in Note 2 and Note 3 of the notes to the annual consolidated financial statements do not require Management to make assumptions about matters that are highly uncertain and, accordingly, none of the estimates are considered a “critical accounting estimate” as defined in Form 51-102F1 published by the Ontario Securities Commission except as noted below. In the Company’s view, the allowance for loan impairment in Financial Services is considered to be a “critical accounting estimate”. Losses for impaired loans are recognized when there is objective evidence that the impairment of the loan portfolio has occurred. Impairment allowances are calculated on individual loans and on groups of loans assessed collectively. All individually significant loans receivable are assessed for specific impairment. Loans receivable that are not individually significant are collectively assessed for impairment by grouping together loans receivable with similar risk characteristics. The Company uses a roll-rate methodology, which employs statistical analysis of historical data, economic indicators and experience of delinquency and default to estimate the amount of loans that will eventually 2015 First Quarter Report 23 be written off. Future customer behaviour may be affected by a number of factors, including changes in interest and unemployment rates and program design changes. The estimated loss is the difference between the present value of the expected future cash flows, discounted at the original effective interest rate of the portfolio and the carrying amount of the portfolio. Default rates, loss rates and the expected timing of future recoveries are regularly benchmarked against actual outcomes to ensure that they remain appropriate. 8.2 Changes in accounting policies Standards, amendments and interpretations issued and not yet adopted The following new standards, amendments and interpretations have been issued and are expected to have an impact on the Company, but are not effective for the fiscal year ending January 2, 2016, and accordingly have not been applied in preparing the condensed consolidated interim financial statements. Financial instruments In July 2014, the IASB issued the final version of IFRS 9 – Financial Instruments (“IFRS 9”), which brings together the classification and measurement, impairment and hedge accounting phases of the IASB’s project to replace IAS 39. Classification and measurement – Financial assets are classified and measured based on the business model under which they are managed and the contractual cash flow characteristics of the financial assets. Financial liabilities are classified in a similar manner as under IAS 39, except that financial liabilities measured at fair value will have fair value changes resulting from changes in the entity’s own credit risk recognized in Other Comprehensive Income instead of net income, unless this would create an accounting mismatch. Impairment – The measurement of impairment of financial assets is based on an expected credit loss model. It is no longer necessary for a triggering event to have occurred before credit losses are recognized. IFRS 9 also includes new disclosure requirements about expected credit losses and credit risk. Hedge accounting - The new general hedge accounting model more closely aligns hedge accounting with risk management activities undertaken by entities when hedging their financial and non-financial risk exposures. It will provide more opportunities to apply hedge accounting to reflect actual risk management activities. IFRS 9 will be applied retrospectively for annual periods beginning on or after January 1, 2018. Early adoption is permitted. The Company is assessing the potential impact of this standard. Revenue from Contracts with Customers In May 2014, the IASB issued IFRS 15 – Revenue from Contracts with Customers (“IFRS 15”), which replaces IAS 11 – Construction Contracts, IAS 18 – Revenue and IFRIC 13 – Customer Loyalty Programmes (“IFRIC 13”), as well as various other interpretations regarding revenue. IFRS 15 outlines a single comprehensive model for entities to use in accounting for revenue arising from contracts with customers, except for contracts that are within the scope of the standards on leases, insurance contracts and financial instruments. IFRS 15 also contains enhanced disclosure requirements. IFRS 15 will be applied retrospectively for annual periods beginning on or after January 1, 2017. Early adoption is permitted. The Company is assessing the potential impact of this standard. Disclosure initiative In December 2014, the IASB issued Disclosure Initiative Amendments to IAS 1 as part of the IASB’s Disclosure Initiative. These amendments encourage entities to apply professional judgment regarding disclosure and presentation in their financial statements. These amendments are effective for annual periods beginning on or after January 1, 2016. Earlier application is permitted. The Company is assessing the potential impact of these amendments. 2015 First Quarter Report 24 8.3 Key operating performance measures and non-GAAP financial measures The Company uses certain key operating performance measures and non-GAAP financial measures and believes that they provide useful information to both Management and investors in measuring the financial performance and financial condition of the Company for the reasons outlined below. Some of these measures do not have a standardized meaning prescribed by GAAP and therefore may not be comparable to similarly titled measures presented by other publicly traded companies and should not be construed as an alternative to other financial measures determined in accordance with GAAP. 8.3.1 Key operating performance measures Retail sales Retail sales refer to the point of sale (i.e., cash register) value of all goods and services sold to retail customers at Canadian Tire Dealer-operated, Mark’s and FGL Sports franchisee-operated, Petroleum retailer-operated and corporately-owned stores across the retail banners and for services provided as part of the Home Services offering as well as through the Company’s online sales channels and in aggregate do not form part of the Company’s consolidated financial statements. Revenue, as reported in the Company’s consolidated financial statements, is comprised primarily of the sale of goods to Canadian Tire Dealers and to Mark’s and FGL Sports franchisees, the sale of gasoline through Petroleum agents and the sale of goods to retail customers by Mark’s, PartSource and FGL Sports corporately owned stores and their online sales channels. Sales definitions for the Retail banners can be found in the footnotes to the table contained within section 4.2.1 of this MD&A and in the glossary contained in the Company’s 2014 Annual Report. Management believes that retail sales and relating year-over-year comparisons provide meaningful information to investors and are expected and valued by them to help assess the size and financial health of the retail network of stores. These measures also serve as an indicator of the strength of the Company’s brand, which ultimately impacts its consolidated financial performance. Same-store sales Same-store sales is a metric used by Management and is also commonly used in the retail industry to identify sales growth generated by a Company’s existing store network and removes the effect of opening and closing stores. For Canadian Tire stores, the calculation also excludes stores that have been retrofitted, replaced or expanded where the percentage change in square footage exceeds 25 percent of the original store size, and includes sales from all stores that have been open for a minimum of one year and one week. For Mark’s and FGL Sports, same-store sales include sales from all stores that have been open since at least the beginning of the comparative quarter period in the prior year. Additional information on same-store sales definitions for Canadian Tire, Mark’s and FGL Sports can be found in section 4.2.1 of this MD&A and in the glossary contained in the Company’s 2014 Annual Report. Sales per square foot Management and investors use comparisons of sales per square foot metrics over several periods to help identify whether existing assets are being made more productive by the Company’s introduction of new store layouts and merchandising strategies. Sales per square foot definitions for Canadian Tire, Mark’s and FGL Sports can be found in section 4.2.1 of this MD&A and in the glossary contained in the Company’s 2014 Annual Report. Retail ROIC The Company believes ROIC is useful in assessing the return on capital invested in its retail assets. In Q4 2014, Management refined the definition of ROIC to isolate the investments in and effects of CT REIT and Financial Services on the Retail segment, thus ensuring that the Retail ROIC metric reflects a pure retail business number. Retail ROIC is calculated as the rolling 12 months retail earnings divided by average invested retail capital. Retail earnings are defined as Retail segment after-tax earnings excluding interest expense, inter-segment earnings, minimum lease payments and non-controlling interests. Invested capital is defined as Retail segment total assets, including operating leases capitalized at a factor of eight, less Retail segment current liabilities and inter-segment balances. An aspiration with respect to ROIC has been included as one of the Company’s financial aspirations. Refer to section 5.1 in the MD&A 2015 First Quarter Report 25 contained in the Company’s 2014 Annual Report for additional information regarding the Company’s ROIC performance in 2014. Return on receivables ROR is used by Management to assess the profitability of the Financial Services total portfolio of receivables. ROR is calculated by dividing income before income tax and gains/losses on disposal of property and equipment by the average total managed portfolio over a 12-month period. An aspiration with respect to ROR has been included as one of the Company’s financial aspirations. Refer to section 5.1 in the MD&A contained in the Company’s 2014 Annual Report for additional information on the Company’s ROR performance in 2014. 8.3.2 Non-GAAP financial measures EBITDA The following table reconciles consolidated income before income taxes, net finance costs, depreciation and amortization, and change in fair value of redeemable financial instrument to net income which is a GAAP measure reported in the Annual Consolidated Financial Statements for the periods ended April 4, 2015 and March 29, 2014. Management uses EBITDA as a supplementary measure when assessing the performance of its ongoing operations and its ability to generate cash flows to fund its cash requirements, including the Company’s capital expenditures. (C$ in millions) EBITDA Depreciation and amortization1 Net finance costs Income before income taxes Income taxes Effective tax rate Net income 1 $ $ $ Q1 2015 245.3 (97.4) (23.6) 124.3 (36.0) 29.0% 88.3 $ $ $ Q1 2014 212.4 (84.7) (24.1) 103.6 (28.0) 27.0% 75.6 Includes $2.2 million reported in cost of producing revenue in the quarter ($nil 2014). The following table reconciles Retail segment EBITDA, to income before income taxes which is a supplementary GAAP measure reported in the notes to the annual consolidated financial statements for the periods ended April 4, 2015 and March 29, 2014. $ Q1 2015 89.0 $ (78.3) 9.0 19.7 (C$ in millions) EBITDA Depreciation and amortization1 Net finance income Income before income taxes 1 $ Q1 2014 80.4 $ (69.1) 5.3 16.6 Includes $2.2 million reported in cost of producing revenue in the quarter ($nil 2014). 2015 First Quarter Report 26 Adjusted net debt The following table reconciles adjusted net debt to GAAP measures reported as at the periods ended as indicated. The Company believes that adjusted net debt is relevant in assessing the amount of financial leverage employed. The Company calculates debt as the sum of short-term debt, long-term debt, short-term deposits, longterm deposits and certain other short-term borrowings. The Company calculates adjusted debt as debt less intercompany debt and liquid assets. Consolidated Q1 2015 (C$ in millions) Consolidated net debt Bank indebtedness Short-term deposits Long-term deposits Short-term borrowings Current portion of long-term debt Long-term debt Debt $ 1 Liquid assets Net debt (cash) Inter-company debt Adjusted net debt (cash) 1 $ 9.8 $ 869.6 1,361.3 197.0 587.4 2,130.4 5,155.5 (717.2) 4,438.3 4,438.3 $ Retail 9.8 $ 321.6 679.0 1,010.4 (358.6) 651.8 (2,045.5) (1,393.7) $ CT REIT - $ 74.9 1.2 56.9 133.0 (4.1) 128.9 1,851.1 1,980.0 $ Financial Services 869.6 1,361.3 122.1 264.6 1,394.5 4,012.1 (354.5) 3,657.6 194.4 3,852.0 Liquid assets include cash, short-term investments and long-term investments Consolidated Q1 2014 (C$ in millions) Consolidated net debt Bank indebtedness Short-term deposits Long-term deposits Short-term borrowings Current portion of long-term debt Long-term debt Debt $ 1,2 Liquid assets Net debt (cash) Inter-company debt Adjusted net debt (cash) $ 79.3 $ 1,118.8 1,221.0 120.7 271.7 2,337.0 5,148.5 (989.6) 4,158.9 4,158.9 $ Retail 79.3 $ 19.1 1,177.2 1,275.6 (282.4) 993.2 (2,204.8) (1,211.6) $ CT REIT - $ (46.6) (46.6) 1,807.1 1,760.5 $ Financial Services 1,118.8 1,221.0 120.7 252.6 1,159.8 3,872.9 (660.6) 3,212.3 397.7 3,610.0 1 Liquid assets include cash, short-term investments and long-term investments 2 Financial Services' liquid assets has been restated to reflect the OSFI liquidity coverage ratio (LCR) requirements that came into effect on January 1, 2015 2015 First Quarter Report 27 CT REIT Non-GAAP Financial Measures Net operating income NOI is defined as cash rental revenue from investment properties less property operating costs. NOI is used as a key indicator of performance as it represents a measure over which Management has control. CT REIT evaluates its performance by comparing the performance of the portfolio adjusted for the effects of non-operational items and current-year acquisitions. The following table shows the relationship of NOI to GAAP property revenue and property expense in the Consolidated Statement of Income and Comprehensive Income for the quarter. (C$ in millions) Property revenue Less: Property expense Straight-line rent adjustment Add: Straight-line land lease expense adjustment Net operating income $ Q1 2015 92.4 $ 21.6 6.4 $ 0.1 64.5 Q1 2014 82.7 17.9 6.8 $ 0.1 58.1 Change 11.8% 20.4% (4.9)% (13.5)% 11.1% Funds from operations CT REIT calculates its FFO in accordance with the Real Property Association of Canada White Paper on FFO for IFRS issued in April 2014. The purpose of the White Paper was to provide reporting issuers and investors with greater guidance on the definition of FFO and to promote more consistent disclosure from reporting issuers. Management believes that FFO provides an operating performance measure that, when compared periodover-period, reflects the impact on operations of trends in occupancy levels, rental rates, operating costs and realty taxes, acquisition activities and interest costs and provides a perspective of the financial performance that is not immediately apparent from net income determined in accordance with IFRS. FFO adds back to net income items that do not arise from operating activities, such as fair value adjustments. FFO, however, still includes non-cash revenues relating to accounting for straight-line rent and makes no deduction for the recurring capital expenditures necessary to sustain the existing earnings stream. Adjusted funds from operations AFFO is a supplemental measure of operating performance widely used in the real estate industry to assess an entity’s ability to pay distributions. Management believes that AFFO is an effective measure of the cash generated from operations, after providing for operating capital requirements which are referred to as “productive capacity maintenance expenditures”. CT REIT calculates AFFO by adjusting FFO for non-cash income and expense items such as amortization of straight-line rents. FFO is also adjusted for a reserve for maintaining productive capacity required for sustaining property infrastructure and revenue from real estate properties and direct leasing costs. Property capital expenditures do not occur evenly over the fiscal year. The property capital reserve in the AFFO calculation is intended to reflect an average annual spending level. 2015 First Quarter Report 28 The following table reconciles FFO and AFFO to GAAP income before income taxes as reported in the Consolidated Statement of Income and Comprehensive Income for the quarter and year. (C$ in millions) Income before income taxes Fair value adjustment of investment property Deferred taxes Fair value of equity awards Funds from operations Properties straight-line rent adjustment Straight-line land lease expense adjustment Capital expenditure reserve Adjusted funds from operations 1 Q1 2015 $ $ 55.5 (8.6) 0.4 0.1 47.4 (6.4) 0.1 (4.2) 36.9 $ $ Q1 2014 Change 169.7 (127.0) 42.7 (6.8) 0.1 (3.7) 32.3 (67.2)% (93.2)% NM1 NM1 11.1% (4.9)% (13.5)% 13.8% 14.1% Year-over-year change percent is not meaningful. 9.0 Enterprise risk management To preserve and enhance shareholder value and CTC’s brand, the Company approaches the management of risk strategically through its enterprise risk management (“ERM Program”). The Company’s comprehensive ERM Program addresses risk identification, quantification, monitoring and integration. In addition, protecting and enhancing CTC’s brand and reputation is a key consideration in the effective management of each of the Principal Risks. The ERM Program provides an integrated approach to the management of risks, supporting the Company’s strategies and objectives, and is described in detail in sections 10.0 and 10.2, respectively, in the MD&A contained in the Company’s 2014 Annual Report. The Company’s ERM Program continues to further develop and refine underlying processes and tools aimed at supporting the identification, evaluation, monitoring and reporting of key risks across the Company. Management reviews risks on an ongoing basis and did not identify any new Principal Risks during Q1 2015. 10.0 Controls and procedures Details related to disclosure controls and procedures and internal controls over financial reporting are disclosed in section 11.0 of the MD&A contained in the Company’s 2014 Annual Report. Changes in internal control over financial reporting During the quarter ended April 4, 2015, there have been no changes in the Company’s internal control over financial reporting that have materially affected, or are reasonably likely to materially affect, the Company’s internal control over financial reporting. 11.0 Social and environmental responsibility 11.1 Overview The Company integrates responsible, sustainable business practices into its values, operations and strategy. The following three sections include information regarding selected social and environmental programs, initiatives and policies relating to the Company’s business operations. 2015 First Quarter Report 29 11.2 Social responsibility 11.2.1 Charitable activities The Company’s charitable efforts are reflected in the work of Canadian Tire Jumpstart Charities (“Canadian Tire Jumpstart” or “the Charity”). Canadian Tire Jumpstart helps children from financially disadvantaged families gain the life benefits associated with participating in organized sports and recreational activities. The Charity assists eligible applicants with the cost of registration, equipment and transportation. Through its 332 active chapters, Canadian Tire Jumpstart has funded the programming costs for over 918,000 children since the launch of the program in 2005. In Q1 2015, Canadian Tire Jumpstart, through the support of the Corporation, its vendors, employees and customers, had raised over $4.8 million across Canada, helping over 26,000 children participate in sports and recreation programs. Helping Canadians enjoy life in Canada has always been at the centre of the Company’s activities. The Canadian Tire family of companies is proud to support local initiatives across all its banners through community and organizational support, including support of amateur sport, injury prevention programs and disaster relief. 11.2.2 Community activities Canadian Tire continues to play a leading role in ACTIVE AT SCHOOL, the largest movement in Canadian history to get kids engaged in physical activity. With the support of a broad-based group of more than 80 partners, ACTIVE AT SCHOOL has made great progress helping to ensure that one hour a day of quality physical activity and education is brought back to schools across Canada. Working closely with its partners as well as provincial and territorial governments, ACTIVE AT SCHOOL is helping over 300 schools and more than 86,300 students across Canada get physically active each day. With the provinces of New Brunswick, Prince Edward Island and Ontario signed-on to the movement and pilot programs running in Nunavut, Alberta and Newfoundland, the momentum continues to grow. Over 65,000 pieces of sporting equipment have been donated to support schools and students that have committed to getting active for one hour each day and the ACTIVE AT SCHOOL team is engaged in positive discussions with provincial governments interested in joining the movement. With a goal of helping to reverse the trend of inactivity in Canadian kids and youth, ACTIVE AT SCHOOL remains focused on keeping the issue top of mind with federal, provincial and municipal government as well as school boards across Canada. By working together, all kids across Canada will have the opportunity to play, learn and grow. 11.3 Environmental responsibility: Business sustainability Strategy and aspirations The Company’s sustainability strategy supports its corporate strategic objectives as outlined in section 5.2 of the MD&A contained in the Company’s 2014 Annual Report. It is an innovation strategy that aims to achieve productivity gains and economic benefits from enhanced environmental and social outcomes by integrating sustainability into business operations. Through its sustainability strategy, the Company aims to serve its customers, communities, employees and shareholders, both now and in the future. The Company’s sustainability strategy has four imperatives: • optimize productivity: drive product and operations value chain improvements; • develop innovation: create and reinvent better processes, products and services; • enhance the brand: protect and enhance banner brands and corporate reputation; and • drive company engagement: engage employees through integration of sustainability practices into everyday business operations. 2015 First Quarter Report 30 The Company will be reporting on benefits from sustainability initiatives and its annual environmental footprint in the fourth quarter of fiscal 2015. For further details, please refer to section 12.3 in the MD&A contained in the Company’s 2014 Annual Report or our Business Sustainability Performance Reports on Making a Difference at: http://corp.canadiantire.ca/EN/CorporateCitizenship/BusinessSustainability/Pages/OurProgressReports.as px 11.4 Responsible sourcing practices The Company’s Supplier Code of Business Conduct (“the Code”) sets out the principles and practices of ethical business conduct that the Company expects of its suppliers of goods and services. The Code addresses bribery, child labour, forced labour, discrimination, freedom of association, wages and benefits, working hours, health and safety and disciplinary actions. The Company mitigates social compliance risk through a combination of ensuring suppliers have signed the Code as evidence of agreement; internal assessments of suppliers; and third-party audits of suppliers’ facilities. Where corrective action plans are required, the Company works with suppliers to continually improve factory performance. The Company reserves the right to terminate its business relationship with any supplier who fails to implement corrective actions or refuses to comply with the Code. For further information and the Company’s Supplier Code of Business Conduct visit: corp.canadiantire.ca/EN/CorporateCitizenship/ResponsibleSourcing/Pages/default.aspx 12.0 Forward-looking statements and other investor communication Caution regarding forward-looking statements This document contains forward-looking statements that reflect Management’s current expectations relating to matters such as future financial performance and operating results of the Company. Specific forward-looking statements included or incorporated by reference in this document include, but are not limited to, statements with respect to: • the Company’s three-year growth strategy and financial aspirations for fiscal years 2015 to 2017 in section 3.1; • 2015 strategic imperatives and objectives in section 3.2; • capital management objectives in subsection 5.3.1; • liquidity and availability of financing in section 5.4; • capital expenditures in section 5.5; • contractual obligations, guarantees and commitments in section 5.6; and • tax matters in section 7.0. Forward-looking statements are provided for the purposes of providing information about Management’s current expectations and plans, and allowing investors and others to get a better understanding of the Company’s anticipated financial position, results of operations and operating environment. Readers are cautioned that such information may not be appropriate for other purposes. All statements other than statements of historical facts included in this document may constitute forwardlooking statements, including but not limited to, statements concerning Management's expectations relating to possible or assumed future prospects and results, the Company’s strategic goals and priorities, its actions and the results of those actions and the economic and business outlook for the Company. Often, but not always, forward-looking statements can be identified by the use of forward-looking terminology such as "may", "will", "expect", “intend”, "believe", "estimate", "plan", “can”, "could", "should", "would", "outlook", "forecast", "anticipate", “aspire”, "foresee", "continue", “ongoing” or the negative of these terms or variations of them or similar terminology. Forward-looking statements are based on the reasonable assumptions, estimates, analyses, beliefs and opinions of Management, made in light of its experience and perception of trends, current conditions and expected developments, as well as other factors that Management believes to be relevant and reasonable at the date that such statements are made. 2015 First Quarter Report 31 By their very nature, forward-looking statements require Management to make assumptions and are subject to inherent risks and uncertainties, which give rise to the possibility that the Company's assumptions, estimates, analyses, beliefs and opinions may not be correct and that the Company's expectations and plans will not be achieved. Examples of Management’s beliefs, which may prove to be incorrect include, but are not limited to, beliefs about the effectiveness of certain performance measures, beliefs about current and future competitive conditions and the Company’s position in the competitive environment, beliefs about the Company’s core capabilities and beliefs regarding the availability of sufficient liquidity to meet the Company’s contractual obligations. Although the Company believes that the forward-looking statements in this document are based on information, assumptions and beliefs that are current, reasonable and complete, these statements are necessarily subject to a number of factors that could cause actual results to differ materially from Management’s expectations and plans as set forth in such forward-looking statements. Some of the factors – many of which are beyond the Company’s control and the effects of which can be difficult to predict – include: (a) credit, market, currency, operational, liquidity and funding risks, including changes in economic conditions, interest rates or tax rates; (b) the ability of the Company to attract and retain high quality employees for all of its businesses, Dealers, Canadian Tire Petroleum retailers and Mark's and FGL Sports franchisees, as well as the Company’s financial arrangements with such parties; (c) the growth of certain business categories and market segments and the willingness of customers to shop at its stores or acquire its financial products and services; (d) the Company’s margins and sales and those of its competitors; (e) the changing consumer preferences toward eCommerce, online retailing and the introduction of new technologies; (f) risks and uncertainties relating to information management, technology, cyber threats, property management and development, environmental liabilities, supply chain management, product safety, changes in law, regulation, competition, seasonality, weather patterns, commodity prices and business disruption, the Company’s relationships with suppliers, manufacturers, partners and other third parties, changes to existing accounting pronouncements, the risk of damage to the reputation of brands promoted by the Company and the cost of store network expansion and retrofits; and (g) the Company’s capital structure, funding strategy, cost management programs and share price. Management cautions that the foregoing list of important factors and assumptions is not exhaustive and other factors could also adversely affect the Company’s results. Investors and other readers are urged to consider the foregoing risks, uncertainties, factors and assumptions carefully in evaluating the forward-looking statements and are cautioned not to place undue reliance on such forward-looking statements. For more information on the risks, uncertainties and assumptions that could cause the Company's actual results to differ from current expectations, please refer to sections 6.4.1.3 (Retail segment business risks), 6.4.2.3 (CT REIT segment business risks), 6.4.3.3 (Financial Services segment business risks) and 10.0 (Enterprise risk management) and all subsections thereunder of the MD&A contained in the Company’s 2014 Annual Report. Please also refer to section 2.10 (Risk Factors) of the Company’s Annual Information Form for fiscal 2014, as well as the Company’s other public filings, available on the SEDAR (System for Electronic Document Analysis and Retrieval) website at www.sedar.com and at www.corp.canadiantire.ca. Forward-looking statements do not take into account the effect that transactions or non-recurring or other special items announced or occurring after the statements are made, have on the Company’s business. For example, they do not include the effect of any dispositions, acquisitions, asset write downs or other charges announced or occurring after such statements are made. The forward-looking statements and information contained herein are based on certain factors and assumptions as of the date hereof. The Company does not undertake to update any forward-looking statements, whether written or oral, that may be made from time to time by it or on its behalf, to reflect new information, future events or otherwise, except as is required by applicable securities laws. Information contained in or otherwise accessible through the websites referenced in this MD&A does not form part of this MD&A and all references in this MD&A to websites are inactive textual references and are for information only. 2015 First Quarter Report 32 Commitment to disclosure and investor communication The Company strives to maintain a high standard of disclosure and investor communication and has been recognized as a leader in financial reporting practices. Reflecting the Company’s commitment to full and transparent disclosure, the Investor Relations section of the Company’s website, at: corp.canadiantire.ca/en/investors, includes the following documents and information of interest to investors: • the Annual Report; • the Annual Information Form; • the Management Information Circular; • quarterly reports; • quarterly fact sheets; • reference materials on the Company’s reporting changes; and • conference call webcasts (archived for one year). The Company’s Annual Report, Annual Information Form, Management Information Circular and quarterly reports are also available at www.sedar.com. If you would like to contact the Investor Relations department directly, call Lisa Greatrix at (416) 480-8725 or email [email protected]. May 14, 2015 2015 First Quarter Report 33 Financial Statements and Notes Condensed Consolidated Balance Sheets (Unaudited) .............................................. 34 Condensed Consolidated Statements of Income (Unaudited) ................................... 35 Condensed Consolidated Statements of Comprehensive Income (Unaudited) ....... 36 Condensed Consolidated Statements of Cash Flows (Unaudited)............................ 37 Condensed Consolidated Statements of Changes in Equity (Unaudited) ................ 38 Notes to the Condensed Interim Consolidated Financial Statements (Unaudited) . 39 Note 1 The Company and its operations ........................................................... 39 Note 2 Basis of preparation ............................................................................... 39 Note 3 Capital management .............................................................................. 40 Note 4 Liquidity and financing ........................................................................... 41 Note 5 Operating segments............................................................................... 41 Note 6 Loans receivable .................................................................................... 44 Note 7 Share capital .......................................................................................... 44 Note 8 Share-based payments .......................................................................... 45 Note 9 Revenue ................................................................................................ 45 Note 10 Cost of producing revenue ..................................................................... 46 Note 11 Selling, general and administrative expenses ........................................ 46 Note 12 Net finance costs ................................................................................... 46 Note 13 Notes to the condensed consolidated interim statements of cash flows.46 Note 14 Financial instruments ............................................................................. 47 Note 14.1 Fair value of financial instruments ....................................... 47 Note 14.2 Fair value measurement of debt and deposits..................... 48 Note 14.3 Fair value of financial assets and financial liabilities classified using the fair value hierarchy ................................................................. 48 Note 15 Legal matters ......................................................................................... 48 Note 16 Tax matters ............................................................................................ 48 Note 17 Comparative figures ............................................................................... 49 2015 First Quarter Report Condensed Consolidated Balance Sheets (Unaudited) As at (C$ in millions) April 4, 2015 March 29, 2014 (Note 17) January 3, 2015 ASSETS Cash and cash equivalents (Note 13) $ Short-term investments 291.3 $ 249.9 576.4 $ 342.8 662.1 289.1 Trade and other receivables 1,105.4 853.0 880.2 Loans receivable (Note 6) 4,700.5 4,411.7 4,905.5 Merchandise inventories 1,891.1 1,678.8 1,623.8 55.6 51.4 31.9 150.6 84.3 104.5 Income taxes recoverable Prepaid expenses and deposits Assets classified as held for sale 8.2 3.8 13.1 8,452.6 8,002.2 8,510.2 Long-term receivables and other assets 701.7 693.8 684.2 Long-term investments 176.0 70.4 176.0 1,242.4 1,179.5 1,251.7 136.1 100.8 148.6 3,780.7 3,500.6 3,743.1 Total current assets Goodwill and intangible assets Investment property Property and equipment Deferred income taxes Total assets $ 44.5 14,534.0 $ 9.8 $ 39.4 13,586.7 $ 79.3 $ 39.4 14,553.2 LIABILITIES Bank indebtedness (Note 13) $ Deposits Trade and other payables 14.3 869.6 1,118.8 950.7 1,961.2 1,896.6 1,779.9 Provisions 211.1 194.9 206.0 Short-term borrowings 197.0 120.7 199.8 Loans payable 623.6 602.1 604.4 39.1 24.5 54.9 587.4 271.7 587.5 4,434.2 4,191.9 4,578.8 46.9 38.6 44.1 Long-term debt 2,130.4 2,337.0 2,131.6 Long-term deposits 1,286.2 Income taxes payable Current portion of long-term debt Total current liabilities Long-term provisions 1,361.3 1,221.0 Deferred income taxes 107.6 103.9 93.9 Other long-term liabilities Total liabilities 788.8 225.3 787.8 8,869.2 8,117.7 8,922.4 693.3 711.6 695.5 2.9 2.6 2.9 144.8 59.3 82.0 4,050.8 4,891.8 4,412.4 5,185.9 4,075.1 4,855.5 EQUITY Share capital (Note 7) Contributed surplus Accumulated other comprehensive income Retained earnings Equity attributable to owners of Canadian Tire Corporation Non-controlling interests Total equity Total liabilities and equity $ 773.0 283.1 775.3 5,664.8 14,534.0 5,469.0 13,586.7 5,630.8 14,553.2 $ $ The related notes form an integral part of these condensed consolidated financial statements. 2015 First Quarter Report 34 Condensed Consolidated Statements of Income (Unaudited) 13 weeks ended (C$ in millions, except per share amounts) Revenue (Note 9) April 4, 2015 $ Cost of producing revenue (Note 10) Gross margin Other (income) expense $ Net finance costs (Note 12) Income before income taxes Income taxes 2,573.1 1,632.8 1,737.8 882.1 835.3 (6.8) Selling, general and administrative expenses (Note 11) Net income 2,514.9 March 29, 2014 1.5 741.0 706.1 23.6 24.1 124.3 103.6 36.0 28.0 $ 88.3 $ 75.6 $ 68.5 $ 70.6 Net income attributable to: Owners of Canadian Tire Corporation Non-controlling interests 19.8 5.0 $ 88.3 $ 75.6 Basic earnings per share attributable to owners of Canadian Tire Corporation $ 0.88 $ 0.88 Diluted earnings per share attributable to owners of Canadian Tire Corporation $ 0.88 $ 0.88 Weighted average number of Common and Class A Non-Voting Shares outstanding: Basic 77,369,566 79,886,504 Diluted 77,904,538 80,524,425 The related notes form an integral part of these condensed consolidated financial statements. 2015 First Quarter Report 35 Condensed Consolidated Statements of Comprehensive Income (Unaudited) 13 weeks ended April 4, 2015 March 29, 2014 (C$ in millions) Net income $ 88.3 $ 75.6 Other comprehensive income Items that may be reclassified subsequently to net income: Cash flow hedges: Gains, net of tax of $39.4 (2014 - $13.5) Reclassification of gains to non-financial assets, net of tax of $16.4 (2014 - $9.3) Reclassification of gains to income, net of tax of $0.3 (2014 - $0.2) Other comprehensive income 109.4 39.9 (45.5) (0.8) (27.5) (0.5) 63.1 11.9 Other comprehensive income attributable to: Owners of Canadian Tire Corporation $ 62.8 $ 11.9 $ 63.1 $ 11.9 $ 151.4 $ 87.5 $ 131.3 $ 82.5 $ 151.4 $ 87.5 Non-controlling interests Comprehensive income 0.3 - Comprehensive income attributable to: Owners of Canadian Tire Corporation Non-controlling interests 20.1 5.0 The related notes form an integral part of these condensed consolidated financial statements. 2015 First Quarter Report 36 Condensed Consolidated Statements of Cash Flows (Unaudited) 13 weeks ended April 4, 2015 March 29, 2014 (Note 17) (C$ in millions) Cash generated from (used for): Operating activities Net income $ 88.3 $ 75.6 Adjustments for: Depreciation of property and equipment and investment property (Notes 10 and 11) 71.7 63.1 Income tax expense 36.0 28.0 Net finance costs 23.6 24.1 Amortization of intangible assets (Note 11) 25.7 21.6 1.5 1.7 (2.6) (21.7) (15.3) Changes in fair value of derivative instruments Gain on disposal of property and equipment, investment property and assets held for sale Interest paid Interest received Income taxes paid Other (0.3) 1.9 3.5 (89.5) (82.8) 1.6 5.0 136.5 124.2 Change in operating working capital and other (Note 13) (502.2) (314.3) Change in loans receivable 180.7 (185.0) 147.6 (42.5) Cash used for operating activities Investing activities Additions to property and equipment and investment property (96.8) (75.4) Additions to intangible assets (26.4) (26.5) (123.2) (101.9) Acquisition of short-term investments (60.5) (127.5) Proceeds from the maturity and disposition of short-term investments 110.1 258.0 Acquisition of long-term investments (10.1) - Proceeds from the disposition of long-term investments Proceeds on disposition of property and equipment, investment property and assets held for sale Long-term receivables and other assets Other - 7.6 9.3 (0.4) 0.3 2.2 - 0.1 48.4 (74.8) 140.7 38.8 Dividends paid (38.7) (33.4) Distributions paid to non-controlling interests (22.4) (4.5) (61.1) (37.9) Cash (used for) generated from investing activities Financing activities Net (repayment) issuance of short-term borrowings (2.8) 0.3 Issuance of loans payable 45.4 27.4 (26.1) (36.4) Repayment of loans payable Issuance of long-term debt Repayment of long-term debt and finance lease liabilities Payment of transaction costs related to long-term debt Repurchase of share capital 1.1 0.6 (5.6) (4.7) (1.9) (0.4) 10.1 (13.2) (48.6) (30.8) Change in deposits Cash used for financing activities (6.9) (106.5) 8.5 (73.4) Cash used in the period Cash and cash equivalents, net of bank indebtedness, beginning of period (366.3) 647.8 (77.1) 574.2 Cash and cash equivalents, net of bank indebtedness, end of period (Note 13) $ 281.5 $ 497.1 The related notes form an integral part of these condensed consolidated financial statements. 2015 First Quarter Report 37 Condensed Consolidated Statements of Changes in Equity (Unaudited) Total accumulated other comprehensive income Share capital (Note 17) (C$ in millions) Balance at January 3, 2015 $ 695.5 Contributed surplus (Note 17) $ 2.9 Fair value changes in available-forsale financial assets Cashflow hedges $ 81.8 $ 0.2 Total accumulated other comprehensive income $ 82.0 Equity attributable to owners of Canadian Tire Corporation Retained earnings (Note 17) $ 4,075.1 $ 4,855.5 Equity attributable to noncontrolling interests $ 775.3 Total equity $ 5,630.8 Total comprehensive income Net income 68.5 Other comprehensive income 62.8 Total comprehensive income - - 62.8 62.8 - 62.8 68.5 68.5 19.8 88.3 62.8 0.3 63.1 131.3 20.1 151.4 Contributions by and distributions to owners of Canadian Tire Corporation Issuance of Class A Non-Voting Shares (Note 7) Repurchase of Class A Non-Voting Shares (Note 7) Excess of repurchase price over average cost (Note 7) 1.9 1.9 1.9 (56.5) (56.5) (56.5) 52.4 (52.4) Dividends - (40.4) - (40.4) (40.4) Contributions by and distributions to non-controlling interests Issuance of trust units to non-controlling interests, net of transaction costs Distributions and dividends to non-controlling interests Total contributions and distributions (2.2) - - - - (92.8) (95.0) 0.5 0.5 (22.9) (22.9) (22.4) (117.4) Balance at April 4, 2015 $ 693.3 $ 2.9 $ 144.6 $ 0.2 $ 144.8 $ 4,050.8 $ 4,891.8 $ 773.0 $ 5,664.8 Balance at December 28, 2013 $ 712.9 $ 2.4 $ 47.0 $ 0.4 $ 47.4 $ 4,404.6 $ 5,167.3 $ 282.6 $ 5,449.9 Total comprehensive income Net income 70.6 Other comprehensive income 11.9 Total comprehensive income - - 11.9 11.9 - 11.9 70.6 70.6 5.0 11.9 - 75.6 11.9 82.5 5.0 87.5 Contributions by and distributions to owners of Canadian Tire Corporation Issuance of Class A Non-Voting Shares (Note 7) Repurchase of Class A Non-Voting Shares (Note 7) Excess of repurchase price over average cost (Note 7) 1.6 1.6 1.6 (30.8) (30.8) (30.8) 27.9 (27.9) Dividends Contributed surplus arising on sale of property to CT REIT - (34.9) 0.2 - (34.9) (34.9) 0.2 0.2 Contributions by and distributions to non-controlling interests Issuance of trust units to non-controlling interests, net of transaction costs Distributions to non-controlling interests 0.4 (4.9) Total contributions and distributions Balance at March 29, 2014 (1.3) $ 711.6 0.2 $ 2.6 $ 58.9 $ 0.4 $ 59.3 (62.8) $ 4,412.4 (63.9) $ 5,185.9 0.4 (4.9) (4.5) $ 283.1 (68.4) $ 5,469.0 The related notes form an integral part of these condensed consolidated financial statements. 2015 First Quarter Report 38 Notes to the Condensed Interim Consolidated Financial Statements (Unaudited) 1. The Company and its operations Canadian Tire Corporation, Limited is a Canadian public company primarily domiciled in Canada. Its registered office is located at 2180 Yonge Street, Toronto, Ontario, M4P 2V8, Canada. It is listed on the Toronto Stock Exchange (TSX – CTC, CTC.A). Canadian Tire Corporation, Limited and entities it controls are together referred to in these condensed interim consolidated financial statements as the “Company” or “Canadian Tire Corporation”. The Company comprises three main business operations, which offer a range of retail goods and services, including general merchandise, apparel, sporting goods, petroleum, financial services including a bank and real estate operations. Details of its three reportable operating segments are provided in Note 5. Due to the seasonal nature of some merchandise and the timing of marketing programs in the retail businesses, the fourth quarter typically generates the greatest contribution to revenues and earnings, and the first quarter the least. 2. Basis of preparation Statement of compliance These condensed interim consolidated financial statements (“interim financial statements”) have been prepared in accordance with International Financial Reporting Standards (“IFRS”). The Company prepared these interim financial statements for the 13 weeks ended April 4, 2015 (and comparative results for the 13 weeks ended March 29, 2014) in accordance with International Accounting Standard (“IAS”) 34 – Interim Financial Reporting. These interim financial statements should be read in conjunction with the annual consolidated financial statements contained in the Company’s 2014 Annual Report. They have been prepared using the same accounting policies that were described in Note 3 to the annual consolidated financial statements contained in the Company’s 2014 Annual Report. These interim financial statements were authorized for issuance by the Company’s Board of Directors on May 14, 2015. Basis of presentation These interim financial statements have been prepared on the historical cost basis, except for the following items, which are measured at fair value: • • • • • financial instruments at fair value through profit or loss; derivative financial instruments; available-for-sale financial assets; liabilities for share-based payment plans; and initial recognition of assets acquired and liabilities assumed in a business combination. In addition, the post-employment defined benefit obligation is recorded at its discounted present value. Functional and presentation currency These interim financial statements are presented in Canadian dollars (“C$”), the Company’s functional currency (“the functional currency”). All financial information is presented in millions, except per share amounts, which are presented in whole dollars, and the number of shares or the weighted average number of shares, which are presented in whole numbers. Judgments and estimates The preparation of these interim financial statements in accordance with IAS 34 requires Management to make judgments and estimates that affect the application of accounting policies and the reported amounts of assets and liabilities and disclosures of contingent assets and liabilities at the date of these interim financial statements and the reported amounts of revenue and expenses during the reporting periods. Actual results may differ from estimates made in these interim financial statements. Judgments are made in the selection and assessment of the Company’s accounting policies. Estimates are used mainly in determining the measurement of recognized transactions and balances. Estimates are based on historical experience and other factors, including expectations of future events that are believed to be reasonable under the circumstances. Judgments and estimates are often interrelated. The Company’s judgments and estimates are continually re-evaluated to ensure they remain appropriate. Revisions to accounting estimates are recognized in the period in which the estimates are revised and in future periods affected. Details of the accounting policies that are subject to judgments and estimates that the Company believes could have the most significant impact on the amounts recognized in these interim financial statements are described in Note 2 to the annual consolidated financial statements contained in the Company’s 2014 Annual Report. 2015 First Quarter Report 39 Notes to the Condensed Interim Consolidated Financial Statements (Unaudited) Standards, amendments and interpretations issued and not yet adopted The following new standards, amendments and interpretations have been issued and are expected to have an impact on the Company, but are not effective for the fiscal year ending January 2, 2016, and accordingly have not been applied in preparing these interim financial statements. Financial instruments In July 2014, the IASB issued the final version of IFRS 9 – Financial Instruments (“IFRS 9”), which brings together the classification and measurement, impairment and hedge accounting phases of the IASB’s project to replace IAS 39. Classification and measurement – Financial assets are classified and measured based on the business model under which they are managed and the contractual cash flow characteristics of the financial assets. Financial liabilities are classified in a similar manner as under IAS 39, except that financial liabilities measured at fair value will have fair value changes resulting from changes in the entity’s own credit risk recognized in Other Comprehensive Income instead of Net Income, unless this would create an accounting mismatch. Impairment – The measurement of impairment of financial assets is based on an expected credit loss model. It is no longer necessary for a triggering event to have occurred before credit losses are recognized. IFRS 9 also includes new disclosure requirements about expected credit losses and credit risk. Hedge accounting - The new general hedge accounting model more closely aligns hedge accounting with risk management activities undertaken by entities when hedging their financial and non-financial risk exposures. It will provide more opportunities to apply hedge accounting to reflect actual risk management activities. IFRS 9 will be applied retrospectively for annual periods beginning on or after January 1, 2018. Early adoption is permitted. The Company is assessing the potential impact of this standard. Revenue from Contracts with Customers In May 2014, the IASB issued IFRS 15 – Revenue from Contracts with Customers (“IFRS 15”), which replaces IAS 11 – Construction Contracts, IAS 18 – Revenue and IFRIC 13 – Customer Loyalty Programmes (“IFRIC 13”), as well as various other interpretations regarding revenue. IFRS 15 outlines a single comprehensive model for entities to use in accounting for revenue arising from contracts with customers, except for contracts that are within the scope of the standards on leases, insurance contracts and financial instruments. IFRS 15 also contains enhanced disclosure requirements. IFRS 15 will be applied retrospectively for annual periods beginning on or after January 1, 2017. Early adoption is permitted. The Company is assessing the potential impact of this standard. Disclosure initiative In December 2014, the IASB issued Disclosure Initiative Amendments to IAS 1 as part of the IASB’s Disclosure Initiative. These amendments encourage entities to apply professional judgment regarding disclosure and presentation in their financial statements. These amendments are effective for annual periods beginning on or after January 1, 2016. Earlier application is permitted. The Company is assessing the potential impact of these amendments. 3. Capital management The Company’s objectives when managing capital are: • • • ensuring sufficient liquidity to support its financial obligations and execute its operating and strategic plans; maintaining healthy liquidity reserves and access to capital; and minimizing the after-tax cost of capital while taking into consideration current and future industry, market and economic risks and conditions. The definition of capital varies from company to company, industry to industry and for different purposes. The Company’s definition of capital is the same as that detailed in Note 4 to the annual consolidated financial statements contained in the Company’s 2014 Annual Report, which includes Glacier Credit Card Trust (“GCCT” or “Glacier”) indebtedness but excludes Franchise Trust indebtedness. The Company manages its capital structure to maintain an investment-grade rating from two credit rating agencies. Management calculates its ratios to approximate the methodology of debt-rating agencies and other market participants on a current and prospective basis. To assess its effectiveness in managing capital, Management monitors these ratios against targeted ranges. 2015 First Quarter Report 40 Notes to the Condensed Interim Consolidated Financial Statements (Unaudited) The Company was in compliance with all covenants under its existing debt agreements as at the quarter ended April 4, 2015. Under these covenants, the Company currently has sufficient flexibility to fund business growth and maintain or amend dividend rates within its existing dividend policy. The Company was in compliance with all regulatory capital guidelines established by the Office of the Superintendent of Financial Institutions of Canada and its Internal Capital Adequacy Assessment Process which it utilizes to achieve its goals and objectives associated with the operations of Canadian Tire Bank (“CT Bank”), a federally chartered bank. 4. Liquidity and financing GCCT filed a short form base shelf prospectus on March 31, 2015 enabling the issuance of up to $1.5 billion of term notes for the subsequent 25-month period. In addition, during the quarter CT Real Estate Investment Trust (“CT REIT”) filed a base shelf prospectus under which it may raise up to $1.5 billion of debt and equity capital. 5. Operating segments The Company has three reportable operating segments: Retail, CT REIT, and Financial Services. The reportable operating segments are strategic business units offering different products and services. They are separately managed due to their distinct nature. The following summary describes the operations in each of the Company’s reportable segments: • Retail comprises the Living, Playing, Fixing, Automotive, Seasonal, Apparel and Sporting Goods categories. The retail business is conducted through a number of banners, including Canadian Tire, Canadian Tire Gas (“Petroleum”), Mark’s, PartSource, and various FGL Sports banners. Retail also includes the Dealer Loan Program (the portion [silo] of Franchise Trust that issues loans to Dealers), a financing program established to provide an efficient and cost-effective way for Dealers to access the majority of the financing required for their store operations. Non-CT REIT real estate is included in Retail. • CT REIT is an unincorporated, closed-end real estate investment trust. CT REIT holds a geographically diversified portfolio of properties comprised largely of Canadian Tire banner stores, Canadian Tire anchored retail developments, a mixed use commercial development and two distribution centres. • Financial Services markets a range of Canadian Tire-branded credit cards, including the Canadian Tire Options MasterCard, the Cash Advantage MasterCard, the Gas Advantage MasterCard and the Sport Chek MasterCard. Financial Services also markets insurance and warranty products and processes credit card transactions with respect to purchases made in Canadian Tire Dealer associate stores and petroleum outlets. Financial Services includes Canadian Tire Bank, a federally regulated financial institution that manages and finances the Company’s consumer MasterCard, Visa and retail credit card portfolios, as well as an existing block of Canadian Tire-branded personal loan and line of credit portfolios. The Bank also offers and markets high-interest savings (“HIS“) account deposits, tax free savings account (“TFSA”) deposits and broker guaranteed investment certificate (“GIC”) deposits, both directly and through thirdparty brokers. Financial Services also includes GCCT, a financing program established to purchase co-ownership interests in the Company’s credit card loans. GCCT issues debt to third-party investors to fund its purchases. Performance is measured based on segment income before income taxes, as included in the internal management reports reviewed by the Company’s chief operating decision maker. Management has determined that this measure is the most relevant in evaluating segment results. 2015 First Quarter Report 41 Notes to the Condensed Interim Consolidated Financial Statements (Unaudited) Information regarding the results of each reportable operating segment is as follows: 13 weeks ended April 4, 2015 (C$ in millions) External revenue Intercompany revenue Total revenue Cost of producing revenue Gross margin Other (income) expense Selling, general and administrative expenses Net finance (income) costs Fair value (gain) on investment properties Income before income taxes Items included in the above: Depreciation and amortization Interest income Interest expense $ $ Retail 2,205.9 $ 1.4 2,207.3 1,530.3 677.0 (33.5) 699.8 (9.0) 19.7 $ CT REIT 4.0 $ 88.4 92.4 92.4 24.0 21.5 (8.6) 55.5 $ 78.3 27.2 14.8 21.5 $ $ $ Financial Eliminations Services and adjustments 281.6 $ 23.4 $ 2.9 (92.7) 284.5 (69.3) 115.5 (13.0) 169.0 (56.3) 1.2 25.5 67.5 (50.3) (0.6) 11.7 8.6 100.9 $ (51.8) $ 1.9 215.6 26.7 $ 17.2 $ (21.8) (22.0) Total 2,514.9 2,514.9 1,632.8 882.1 (6.8) 741.0 23.6 124.3 97.4 221.0 41.0 13 weeks ended March 29, 2014 (C$ in millions) External revenue Intercompany revenue Total revenue Cost of producing revenue Gross margin Other (income) expense Selling, general and administrative expenses Net finance (income) costs Fair value (gain) on investment properties Income before income taxes Items included in the above: Depreciation and amortization Interest income Interest expense $ $ Retail 2,291.0 $ 2.1 2,293.1 1,636.8 656.3 (23.0) 668.0 (5.3) 16.6 $ CT REIT 2.4 $ 80.3 82.7 82.7 19.8 20.2 (127.0) 169.7 $ 69.1 29.0 20.1 0.2 20.4 $ $ $ Eliminations and adjustments Financial Services 261.0 $ 3.6 264.6 114.2 150.4 0.2 70.0 (2.0) 82.2 $ 2.0 195.6 28.1 $ 18.7 $ (86.0) (67.3) (13.2) (54.1) 24.3 (51.7) 11.2 127.0 (164.9) $ Total 2,573.1 2,573.1 1,737.8 835.3 1.5 706.1 24.1 103.6 13.6 $ (23.8) (24.0) 84.7 201.0 44.6 The eliminations and adjustments include the following items: • • • • reclassifications of certain revenues and costs in the Financial Services segment to finance income and finance costs; reclassifications of revenues and operating expenses to reflect loyalty program accounting in accordance with IFRS Interpretations Committee (“IFRIC”) 13 for the Company’s Canadian Tire Money programs; conversion from CT REIT’s fair value investment property valuation policy to the Company’s cost model, including the recording of depreciation; and inter-segment eliminations and adjustments including intercompany rent, property management fees, and credit card processing fees. Capital expenditures by reportable operating segment are as follows: 13 weeks ended April 4, 2015 Retail (C$ in millions) Capital expenditures 1 1 $ 101.5 Financial Services CT REIT $ 14.7 $ 1.2 Total $ 117.4 Capital expenditures are presented on an accrual basis and include software additions. 2015 First Quarter Report 42 Notes to the Condensed Interim Consolidated Financial Statements (Unaudited) 13 weeks ended March 29, 2014 Retail (C$ in millions) Capital expenditures1 1 $ 65.6 Financial Services CT REIT $ 5.8 $ 2.6 Total $ 74.0 Capital expenditures are presented on an accrual basis and include software additions. Total assets by reporting operating segment are as follows: (C$ in millions) Retail CT REIT Financial Services Eliminations and adjustments Total assets1 1 2 $ $ 2 April 4, 2015 March 29, 2014 11,274.9 $ 10,236.0 $ 4,113.3 3,757.7 5,517.8 5,528.0 (6,372.0) (5,935.0) 14,534.0 $ 13,586.7 $ January 3, 2015 11,066.5 4,017.4 5,553.6 (6,084.3) 14,553.2 The Company employs a shared services model for several of its back-office functions, including finance, information technology, human resources and legal. As a result, expenses relating to these functions are allocated on a systematic and rational basis to the reportable operating segments. The associated assets and liabilities are not allocated among segments in the presented measures of segmented assets and liabilities. The prior period figures have been restated to correspond to the current period presentation. Total liabilities by reporting operating segment are as follows: (C$ in millions) Retail CT REIT Financial Services Eliminations and adjustments Total liabilities1 1 2 $ $ 2 April 4, 2015 March 29, 2014 4,200.2 $ 4,054.1 $ 2,023.8 1,836.5 4,595.9 4,493.0 (1,950.7) (2,265.9) 8,869.2 $ 8,117.7 $ January 3, 2015 4,137.1 2,015.3 4,576.3 (1,806.3) 8,922.4 The Company employs a shared services model for several of its back-office functions, including finance, information technology, human resources and legal. As a result, expenses relating to these functions are allocated on a systematic and rational basis to the reportable operating segments. The associated assets and liabilities are not allocated among segments in the presented measures of segmented assets and liabilities. The prior period figures have been restated to correspond to the current period presentation. The eliminations and adjustments include the following items: • • CT REIT uses the fair value for its investment properties. The adjustment to convert to the Company’s cost model is included in eliminations and adjustments; and inter-segment eliminations. 2015 First Quarter Report 43 Notes to the Condensed Interim Consolidated Financial Statements (Unaudited) 6. Loans receivable Quantitative information about the Company’s loans receivable portfolio is as follows: Total principal amount of receivables1 (C$ in millions) Credit card loans Line of credit loans Personal loans2 Total Financial Services' loans receivable Dealer loans3 Other loans Total loans receivable Less: long-term portion4 Current portion of loans receivable 1 2 3 4 April 4, 2015 4,663.4 5.3 0.3 4,669.0 623.6 5.3 5,297.9 597.4 $ 4,700.5 $ March 29, 2014 January 3, 2015 $ 4,384.9 $ 4,862.9 6.1 5.5 0.2 0.3 4,391.2 4,868.7 602.2 604.4 6.0 5.5 4,999.4 5,478.6 587.7 573.1 $ 4,411.7 $ 4,905.5 Average balance1 April 4, 2015 4,730.0 5.4 0.3 $ 4,735.7 $ March 29, 2014 $ 4,413.2 6.3 0.2 $ 4,419.7 Amounts shown are net of allowance for loan impairment. Personal loans are unsecured loans that are provided to qualified existing credit card holders for terms of one to five years. Personal loans have fixed monthly payments of principal and interest; however, the personal loans can be repaid at any time without penalty. Dealer loans issued by Franchise Trust. The long-term portion of loans receivable is included in long-term receivables and other assets and includes Dealer Loans of $592.3 million (March 29, 2014 – $582.0 million and January 3, 2015 – $568.2 million). The gross impairment loss on loans receivable for the 13 weeks ended April 4, 2015 was $93.2 million (2014 – $90.9 million). Recoveries of bad debts for the 13 weeks ended April 4, 2015 was $16.1 million (2014 – $13.5 million). During the 13 weeks ended April 4, 2015, the amount of cash received from interest earned on credit cards and loans was $196.7 million (2014 – $183.1 million). 7. Share capital (C$ in millions) March 29, 20141 April 4, 2015 January 3, 2015 Authorized 3,423,366 Common Shares 100,000,000 Class A Non-Voting Shares Issued 3,423,366 Common Shares (March 29, 2014 3,423,366; January 3, 2015 - 3,423,366) $ 73,602,606 Class A Non-Voting Shares (March 29, 2014 - 76,265,951; January 3, 2015 - 74,023,208) $ 1 0.2 $ 0.2 $ 0.2 693.1 $ 711.4 $ 695.3 693.3 $ 711.6 $ 695.5 Refer to Note 17 for details of accounting policy change. All issued shares are fully paid. The Company does not hold any of its Common or Class A Non-Voting Shares. Neither the Common nor Class A Non-Voting Shares have a par value. During 2015 and 2014, the Company issued and repurchased Class A Non-Voting Shares. Share repurchases are charged to share capital at the average cost per share outstanding and the excess between the repurchase price and the average cost is first allocated to contributed surplus, with any remainder allocated to retained earnings. 2015 First Quarter Report 44 Notes to the Condensed Interim Consolidated Financial Statements (Unaudited) The following transactions occurred with respect to Class A Non-Voting Shares during 2015 and 2014: 13 weeks ended (C$ in millions) Shares outstanding at beginning of the year Issued under the dividend reinvestment plan Repurchased2 Excess of repurchase price over average cost Shares outstanding at end of the period 1 2 April 4, 2015 Number 74,023,208 $ 15,098 (435,700) 73,602,606 $ $ 695.3 1.9 (56.5) 52.4 693.1 March 29, 20141 Number 76,560,851 $ 16,419 (311,319) 76,265,951 $ $ 712.7 1.6 (30.8) 27.9 711.4 Refer to Note 17 for details of accounting policy change. Repurchased shares have been restored to the status of authorized but unissued shares. The Company records shares repurchased on a transaction date basis. As of April 4, 2015, the Company had dividends declared and payable to holders of Class A Non-Voting Shares and Common Shares of $40.4 million (2014 – $34.9 million) at a rate of $0.525 per share (2014 – $0.4375 per share). On May 14, 2015 the Company’s Board of Directors declared a dividend of $0.525 per share payable on September 1, 2015 to shareholders of record as of July 31, 2015. 8. Share-based payments During the 13 weeks ended April 4, 2015, the Company issued the following share-based payment awards: Stock options The Company granted 387,234 stock options to certain employees. These stock options vest on a graduated basis over a three-year period, are exercisable over a term of seven years and have an exercise price of $129.14. Performance share unit and performance unit plans The Company grants performance share units (“PSUs”) to certain of its employees. Each PSU entitles the participant to receive a cash payment equal to the weighted average price of Class A Non-Voting Shares of the Company traded on the Toronto Stock Exchange during the 10 calendar-day period commencing on the first business day following the end of the performance period, multiplied by a factor determined by specific performance-based criteria, as set out in the performance share unit plan. The performance period of each PSU award is approximately three years from the date of issuance. CT REIT grants Performance Units (“PUs”) to its executives. Each PU entitles the executive to receive a cash payment equal to the weighted average price of Units of CT REIT traded on the Toronto Stock Exchange during the 10 calendar-day period commencing on the first business day following the end of the performance period, multiplied by a factor determined by specific performance-based criteria, as set out in the performance unit plan. The performance period of each PU award is approximately three years from the date of issuance. 9. Revenue (C$ in millions) Sale of goods Interest income on loans receivable Royalties and licence fees Services rendered Rental income 13 weeks ended April 4, 2015 March 29, 2014 $ 2,105.5 217.3 91.2 85.6 15.3 $ 2,191.4 195.4 88.0 85.9 12.4 $ 2,514.9 $ 2,573.1 Major customers The Company does not rely on any one customer. 2015 First Quarter Report 45 Notes to the Condensed Interim Consolidated Financial Statements (Unaudited) 10. Cost of producing revenue 13 weeks ended (C$ in millions) March 29, 2014 April 4, 2015 Inventory cost of sales1 $ $ 1,530.7 1,636.6 Net impairment loss on loans receivable 75.8 75.8 Finance costs on deposits 13.7 14.9 Other 12.6 10.5 $ 1 $ 1,632.8 1,737.8 Inventory cost of sales includes depreciation for the 13 weeks ended April 4, 2015 of $2.2 million (2014 – $nil). Inventory writedowns as a result of net realizable value being lower than cost, recognized in the 13 weeks ended April 4, 2015 were $10.8 million (2014 – $15.8 million). Inventory writedowns recognized in prior periods and reversed in the 13 weeks ended April 4, 2015 were $0.4 million (2014 – $1.6 million). The reversal of writedowns was the result of actual losses being lower than previously estimated. The writedowns and reversals are included in inventory cost of sales. 11. Selling, general and administrative expenses 13 weeks ended (C$ in millions) Personnel expenses Occupancy Marketing and advertising Depreciation of property and equipment and investment property1 $ Amortization of intangible assets Other $ 1 April 4, 2015 280.8 166.3 76.1 69.5 25.7 122.6 741.0 $ $ March 29, 2014 266.3 156.3 75.8 63.1 21.6 123.0 706.1 Refer to Note 10 for depreciation included in cost of producing revenue. 12. Net finance costs 13 weeks ended March 29, 2014 April 4, 2015 (C$ in millions) Finance income Finance costs $ (3.7) $ 27.3 (5.6) 29.7 $ 23.6 24.1 $ 13. Notes to the condensed consolidated interim statements of cash flows Cash and cash equivalents, net of bank indebtedness, comprise the following: $ Cash equivalents Restricted cash and cash equivalents1 Total cash and cash equivalents Bank indebtedness 2 Cash and cash equivalents, net of bank indebtedness 1 2 March 29, 2014 April 4, 2015 (C$ in millions) Cash 127.3 $ January 3, 2015 $ 134.5 155.0 485.6 9.0 13.7 6.6 291.3 576.4 662.1 (9.8) $ 77.1 281.5 521.0 (79.3) $ 497.1 (14.3) $ 647.8 Relates to GCCT and is restricted for the purpose of paying out note holders and additional funding costs. Included in cash and cash equivalents are amounts held in reserve in support of Financial Services’ liquidity and regulatory requirements. 2015 First Quarter Report 46 Notes to the Condensed Interim Consolidated Financial Statements (Unaudited) Changes in operating working capital and other comprise the following: 13 weeks ended April 4, 2015 March 29, 2014 (C$ in millions) Changes in operating working capital Trade and other receivables Merchandise inventories Income taxes Prepaid expenses and deposits Trade and other payables $ Total (113.7) $ (285.4) (0.3) (46.2) (65.5) (63.1) (205.6) (1.4) (16.1) (29.1) (511.1) (315.3) Changes in other Provisions Long-term provisions Other long term liabilities 8.3 0.4 0.2 0.6 (0.8) 1.2 Total 8.9 1.0 Changes in operating working capital and other $ (502.2) $ (314.3) Capital commitments During the 13 weeks ended April 4, 2015, the Company had capital commitments for the acquisition of property and equipment, investment property and intangible assets for an aggregate cost of approximately $127.1 million (2014 – $50.8 million). 14. Financial instruments 14.1 Fair value of financial instruments Fair values have been determined for measurement and/or disclosure purposes based on the following: The carrying amount of the Company’s cash and cash equivalents, trade and other receivables, loans receivable, bank indebtedness, trade and other payables, short-term borrowings and loans payable approximate their fair value either due to their short-term nature or because they are derivatives, which are carried at fair value. The carrying amount of the Company’s long-term receivables and other assets approximates their fair value either because the interest rates applied to measure their carrying amount approximate current market interest or because they are derivatives, which are carried at fair value. Fair values of financial instruments reflect the credit risk of the Company and counterparties when appropriate. Investments in equity and debt securities The fair values of financial assets at fair value through profit or loss (“FVTPL”), held-to-maturity investments and availablefor-sale financial assets that are traded in active markets are determined by reference to their quoted closing bid price or dealer price quotations at the reporting date. For investments that are not traded in active markets, the Company determines fair values using a combination of discounted cash flow models, comparison to similar instruments for which marketobservable prices exist and other valuation models. The fair values of loans and receivables and held-to-maturity investments are determined for disclosure purposes only. Derivatives The fair value of a forward exchange contract is estimated by discounting the difference between the contractual forward price and the current forward price for the residual maturity of the contract using a risk-free interest rate (based on government bonds). The fair value of interest rate swaps is based on counterparty confirmations tested for reasonableness by discounting estimated future cash flows derived from the terms and maturity of each contract using market interest rates for a similar instrument at the measurement date. The fair value of equity derivatives is determined by reference to share price movement adjusted for interest using market interest rates specific to the terms of the underlying derivative contracts. 2015 First Quarter Report 47 Notes to the Condensed Interim Consolidated Financial Statements (Unaudited) The fair value measurement of debt and deposits is categorized within Level 2 of the fair value hierarchy as described in Note 35.4 to the annual consolidated financial statements contained in the Company’s 2014 Annual Report. Redeemable financial instrument The fair value of the redeemable financial instrument is calculated based on a discounted cash flow model using normalized earnings attributable to the Financial Services business, adjusted for any undistributed earnings and Scotiabank’s proportionate interest in the Financial Services business. This recurring fair value measurement is categorized within Level 3 of the fair value hierarchy. Refer to Note 3 and Note 35 to the annual consolidated financial statements contained in the Company’s 2014 Annual Report for further information regarding this financial instrument. There was no change in the fair value of the redeemable financial instrument during the 13 weeks ended April 4, 2015, 14.2 Fair value measurement of debt and deposits The fair values of the Company’s debt and deposits compared to the carrying amounts are as follows: April 4, 2015 (C$ in millions) Liabilities carried at amortized cost Debt Deposits Carrying Amount $ $ 2,717.8 2,230.9 March 29, 2014 Carrying Amount Fair Value $ $ 2,959.9 $ 2,259.0 $ 2,608.7 2,339.8 January 3, 2015 Carrying Amount Fair Value $ $ 2,758.7 2,356.3 $ $ 2,719.1 2,236.9 Fair Value $ $ 2,900.8 2,255.4 The difference between the fair values and the carrying amounts (excluding transaction costs, which are included in the carrying amount of debt) is due to decreases in market interest rates for similar instruments. The fair values are determined by discounting the associated future cash flows using current market interest rates for items of similar risk. 14.3 Fair value of financial assets and financial liabilities classified using the fair value hierarchy The Company uses a fair value hierarchy to categorize the inputs used to measure the fair value of financial assets and financial liabilities. The following table presents the financial instruments measured at fair value classified by the fair value hierarchy: (C$ in million) Balance sheet line Category FVTPL Short-term investments Available for sale Short-term investments Available for sale Long-term investments Trade and other receivables FVTPL1 Effective hedging instruments Trade and other receivables Long-term receivables and other assets FVTPL1 Trade and other payables FVTPL1 Redeemable financial instrument FVTPL Other long-term liabilities FVTPL1 1 Includes derivatives that are classified as held for trading. April 4, 2015 Level 2 2 2 2 2 2 2 3 2 $ 30.0 219.9 176.0 33.2 220.0 51.1 0.1 517.0 - March 29, 2014 Level 2 2 2 2 2 2 2 N/A 2 $ 102.4 240.4 70.4 16.0 86.0 34.0 0.5 0.3 January 3, 2015 Level 2 2 2 2 2 2 2 3 2 $ 115.1 174.0 176.0 15.1 128.3 58.3 517.0 - There were no transfers between categories in 2015 and 2014. 15. Legal matters The Company is party to a number of legal and regulatory proceedings. The Company has determined that each such proceeding constitutes a routine matter incidental to the business conducted by the Company and that the ultimate disposition of the proceedings will not have a material effect on its consolidated net income, cash flows or financial position. 16. Tax matters In the ordinary course of business, the Company is subject to ongoing audits by tax authorities. While the Company has determined that its tax filing positions are appropriate and supportable, from time to time certain matters are reviewed and challenged by the tax authorities. There have been no material changes in ongoing audits by tax authorities as disclosed in Note 18 to the annual consolidated financial statements contained in the Company’s 2014 Annual Report. 2015 First Quarter Report 48 Notes to the Condensed Interim Consolidated Financial Statements (Unaudited) The Company regularly reviews the potential for adverse outcomes with respect to tax matters. The Company believes that the ultimate disposition of these will not have a material adverse effect on its liquidity, consolidated financial position or net income because the Company has determined that it has adequate provision for these tax matters. Should the ultimate tax liability materially differ from the provision, the Company’s effective tax rate and its earnings could be affected positively or negatively in the period in which the matters are resolved. 17. Comparative figures Cash flow Certain of the prior period figures within the Condensed Consolidated Statement of Cash Flows have been reclassified to align with Management’s view of the Company’s operations. Share capital During the quarter ended September 27, 2014, the Company changed its accounting policy relating to share repurchases, which resulted in the financial statements providing more reliable and relevant information. Under the new policy, share repurchases are charged to share capital at the average cost per share outstanding and the excess between the repurchase price and the average cost is first allocated to contributed surplus, with any remainder allocated to retained earnings. Previously, share repurchases were recorded as a reduction to share capital. As a result of this accounting policy change, equity as at March 29, 2014 and December 28, 2013 were restated as follows: Increase (decrease) March 29, 2014 December 28, 2013 (C$ in millions) Share capital Contributed surplus Retained earnings 2015 First Quarter Report $ 154.2 $ (4.2) (150.0) 125.9 (3.8) (122.1) 49 Shareholder and Corporate Information Home Office Registrar and Transfer Agent Exchange Listings Canadian Tire Corporation, Limited Computershare Trust Company of The Toronto Stock Exchange: 2180 Yonge Street P.O. Box 770, Station K Canada Head Office Common Shares (CTC) Class A Non-Voting Shares (CTC.A) Toronto, Ontario M4P 2V8 100 University Avenue Toronto, Ontario Tel (416) 480-3000 Fax (416) 544-7715 M5J 2Y1 Toll free 1-877-982-8768 Website http://corp.canadiantire.ca Fax 1-866-249-7775 Email: [email protected] Information Shareholder services provided by the transfer agent: Lisa Greatrix Change of address SVP, Company Performance Effectiveness & Investor Relations Eliminate multiple mailings Transfer Canadian Tire shares [email protected] Investor Relations email: Inquire about Dividend Reinvestment Program Obtain a copy of the most recent annual report Other shareholder account inquiries Corporate and Shareholder [email protected] Website: http://corp.canadiantire.ca/EN/Investors Please contact the principal offices of Computershare Investor Services in Halifax, Montreal, Toronto, Calgary or Vancouver.

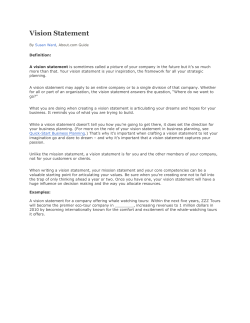


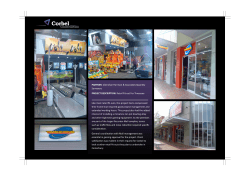


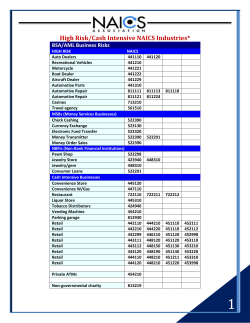
© Copyright 2026