
1113
If you are in any doubt about any of the contents of this listing document, you should obtain
independent professional advice.
CHEUNG KONG PROPERTY HOLDINGS LIMITED
長 江 實 業 地 產 有 限 公 司
(Incorporated in the Cayman Islands with limited liability)
LISTING BY WAY OF INTRODUCTION
OF THE ENTIRE ISSUED SHARE CAPITAL OF THE COMPANY
ON THE MAIN BOARD OF
THE STOCK EXCHANGE OF HONG KONG LIMITED
Stock Code
:
1113
Joint Sponsors
(in alphabetical order)
Hong Kong Exchanges and Clearing Limited, The Stock Exchange of Hong Kong Limited and Hong Kong
Securities Clearing Company Limited take no responsibility for the contents of this listing document, make no
representation as to its accuracy or completeness and expressly disclaim any liability whatsoever for any loss
howsoever arising from or in reliance upon the whole or any part of the contents of this listing document.
This listing document is published in connection with the Listing and contains particulars given in
compliance with the Securities and Futures (Stock Market Listing) Rules (Chapter 571V of the Laws of
Hong Kong) and the Listing Rules solely for the purpose of giving information with regard to the Group.
This listing document does not constitute an offer of, nor is it calculated to invite offers for, shares or
other securities of the Company, nor have any such shares or other securities been allotted with a view
to any of them being offered for sale to, or subscription by, the public. No Shares will be allotted or
issued in connection with, or pursuant to, this listing document.
The Shares have not been registered under the U.S. Securities Act or the laws of any state in the United
States, and may not be offered or sold within the United States, absent registration or an exemption from the
registration requirements of the U.S. Securities Act and applicable state laws. There will be no public
offering of securities in the United States. Neither the SEC nor any other U.S. federal or state securities
commission or regulatory authority has approved or disapproved of the Shares or passed an opinion on
the adequacy of this listing document. Any representation to the contrary is a criminal offence in the
United States.
Neither this listing document nor any copy hereof may be released, forwarded or distributed, directly
or indirectly, in or into the United States or any other jurisdiction where such release or distribution
might be unlawful.
CKH Holdings Shareholders and Beneficial CKH Holdings Shareholders located or resident in
jurisdictions other than Hong Kong, including but not limited to those in the United States, should
refer to the important information set out in “The Distribution In Specie and the Spin-off – Distribution
In Specie – Non-Qualifying CKH Holdings Shareholders” and “Appendix VII – General Information –
Information for Overseas Shareholders”.
Your attention is drawn to “Risk Factors”. Information regarding dealings and settlement of dealings in the
Shares following completion of the Listing is set out in “The Distribution In Specie and the Spin-off”.
8 May 2015
EXPECTED TIMETABLE(1)
Last day of dealings in CKH Holdings Shares
on a cum entitlement basis . . . . . . . . . . . . . . . . . . . . . . . . . . . . . . . . . . . . Tuesday, 26 May 2015
First day of dealings in CKH Holdings Shares
on an ex entitlement basis . . . . . . . . . . . . . . . . . . . . . . . . . . . . . . . . . . . Wednesday, 27 May 2015
Latest time for lodging transfers of the CKH Holdings Shares
to qualify for the entitlement to the Distribution In Specie . . . . . . . . . . . . . 4:30 p.m. on Thursday,
28 May 2015
Closure of the register of members of CKH Holdings for
determining the entitlement to the Distribution In Specie . . . . . . . . . . from Friday, 29 May 2015 to
Tuesday, 2 June 2015
(both days inclusive)
Despatch of Share certificates on(2)
Record Time
. . . . . . . . . . . . . . . . . . . . . . . . . . . . . . . . Tuesday, 2 June 2015
. . . . . . . . . . . . . . . . . . . . . . . . . . . . . . . . . . . . . 8:50 a.m. on Wednesday, 3 June 2015
Dealings in the Shares on the Stock Exchange expected
to commence at(2) . . . . . . . . . . . . . . . . . . . . . . . . . . . . . . . 9:00 a.m. on Wednesday, 3 June 2015
Payment to Non-Qualifying CKH Holdings Shareholders
of the net proceeds of the sale of the Shares
which they would otherwise receive pursuant
to the Distribution In Specie on or around(3) . . . . . . . . . . . . . . . . . . . . . Wednesday, 24 June 2015
Notes:
(1)
All dates and times refer to Hong Kong dates and times unless otherwise indicated.
(2)
The Share certificates are expected to be despatched to the Qualifying CKH Holdings Shareholders on Tuesday, 2 June
2015. If the Distribution In Specie does not become unconditional, the Share certificates will not become valid and
dealings in the Shares on the Stock Exchange will not commence on Wednesday, 3 June 2015.
(3)
Non-Qualifying CKH Holdings Shareholders will be entitled to the Distribution In Specie but will not receive the Shares.
Instead, the Shares which the Non-Qualifying CKH Holdings Shareholders would otherwise receive pursuant to the
Distribution In Specie will be issued to a nominee selected by the CKH Holdings Board, who will sell such Shares on the
market as soon as reasonably practicable following the commencement of dealings in the Shares on the Stock Exchange.
The aggregate proceeds of such sale (net of expenses and taxes) will be paid to the relevant Non-Qualifying CKH
Holdings Shareholders (pro rata to their shareholdings in CKH Holdings as at the Record Time) in Hong Kong dollars in
full satisfaction of the relevant Shares which they would otherwise receive pursuant to the Distribution In Specie, provided
that if the amount that a Non-Qualifying CKH Holdings Shareholder would be entitled to receive is less than HK$50, such
sum will be retained for the benefit of CKH Holdings.
The CKH Holdings Board and the Board do not propose that the Shares be allotted and issued to CKH Holdings
Shareholders in the United States as part of the Distribution In Specie unless it is determined that it can be done in
transactions that are exempt from or do not require registration under the U.S. Securities Act. By reference to the register
of members of CKH Holdings and the register of members of Hutchison as at the Latest Practicable Date, the Excluded
Jurisdictions would include Australia, the Cayman Islands, the United Arab Emirates and the United States. If the Excluded
Jurisdictions turn out to be different, CKH Holdings will announce, after the Record Time, the Excluded Jurisdictions.
Such announcement is expected to be made on Wednesday, 3 June 2015. Further information is set out in “The
Distribution In Specie and the Spin-off”.
–i–
EXPECTED TIMETABLE(1)
If the Listing does not proceed, the Company will make an announcement as soon as practicable
thereafter. Any persons who deal in the Shares prior to the receipt of the Share certificates or prior to
the Share certificates becoming valid do so entirely at their own risk.
– ii –
CONTENTS
IMPORTANT NOTICE
We have not authorised anyone to provide you with information that is different from what is
contained in this listing document. Any information or representation not made in this listing
document must not be relied on by you as having been authorised by the Company or any of the
Relevant Persons.
Page
Expected Timetable. . . . . . . . . . . . . . . . . . . . . . . . . . . . . . . . . . . . . . . . . . . . . . . . . . . . . . . . .
i
Contents. . . . . . . . . . . . . . . . . . . . . . . . . . . . . . . . . . . . . . . . . . . . . . . . . . . . . . . . . . . . . . . . .
iii
Questions and Answers . . . . . . . . . . . . . . . . . . . . . . . . . . . . . . . . . . . . . . . . . . . . . . . . . . . . . .
v
Summary . . . . . . . . . . . . . . . . . . . . . . . . . . . . . . . . . . . . . . . . . . . . . . . . . . . . . . . . . . . . . . . .
1
The Distribution In Specie and the Spin-off . . . . . . . . . . . . . . . . . . . . . . . . . . . . . . . . . . . . . . .
20
Responsibility Statement . . . . . . . . . . . . . . . . . . . . . . . . . . . . . . . . . . . . . . . . . . . . . . . . . . . . .
29
Forward-Looking Statements . . . . . . . . . . . . . . . . . . . . . . . . . . . . . . . . . . . . . . . . . . . . . . . . . .
30
Risk Factors . . . . . . . . . . . . . . . . . . . . . . . . . . . . . . . . . . . . . . . . . . . . . . . . . . . . . . . . . . . . . .
31
Directors and Parties Involved in the Spin-off . . . . . . . . . . . . . . . . . . . . . . . . . . . . . . . . . . . . . .
70
Corporate Information . . . . . . . . . . . . . . . . . . . . . . . . . . . . . . . . . . . . . . . . . . . . . . . . . . . . . . .
73
History and Reorganisation . . . . . . . . . . . . . . . . . . . . . . . . . . . . . . . . . . . . . . . . . . . . . . . . . . .
76
Industry Overview . . . . . . . . . . . . . . . . . . . . . . . . . . . . . . . . . . . . . . . . . . . . . . . . . . . . . . . . .
89
Business. . . . . . . . . . . . . . . . . . . . . . . . . . . . . . . . . . . . . . . . . . . . . . . . . . . . . . . . . . . . . . . . .
110
Financial Information . . . . . . . . . . . . . . . . . . . . . . . . . . . . . . . . . . . . . . . . . . . . . . . . . . . . . . .
182
Share Capital . . . . . . . . . . . . . . . . . . . . . . . . . . . . . . . . . . . . . . . . . . . . . . . . . . . . . . . . . . . . .
274
Substantial Shareholders . . . . . . . . . . . . . . . . . . . . . . . . . . . . . . . . . . . . . . . . . . . . . . . . . . . . .
275
Relationship with the Controlling Shareholders . . . . . . . . . . . . . . . . . . . . . . . . . . . . . . . . . . . . .
278
Connected Transactions . . . . . . . . . . . . . . . . . . . . . . . . . . . . . . . . . . . . . . . . . . . . . . . . . . . . . .
283
Directors and Senior Management . . . . . . . . . . . . . . . . . . . . . . . . . . . . . . . . . . . . . . . . . . . . . .
293
Waivers from Strict Compliance with the Listing Rules . . . . . . . . . . . . . . . . . . . . . . . . . . . . . . .
304
– iii –
CONTENTS
Page
Appendix IA
–
Accountants’ Report on the Cheung Kong Property Group . . . . . . . . . . .
IA-1
Appendix IB
–
Accountants’ Report on the Hutchison Property Group . . . . . . . . . . . . . .
IB-1
Appendix II
–
Unaudited Pro Forma Financial Information . . . . . . . . . . . . . . . . . . . . . .
II-1
Appendix III
–
Property Valuation . . . . . . . . . . . . . . . . . . . . . . . . . . . . . . . . . . . . . . . .
III-1
Appendix IV
–
Regulatory Overview . . . . . . . . . . . . . . . . . . . . . . . . . . . . . . . . . . . . . .
IV-1
Appendix V
–
Summary of the Constitution of the Company and
Cayman Companies Law . . . . . . . . . . . . . . . . . . . . . . . . . . . . . . . . . .
V-1
VI-1
Appendix VI
–
Taxation . . . . . . . . . . . . . . . . . . . . . . . . . . . . . . . . . . . . . . . . . . . . . . . .
Appendix VII
–
General Information . . . . . . . . . . . . . . . . . . . . . . . . . . . . . . . . . . . . . . . VII-1
Appendix VIII
–
Documents Available for Inspection . . . . . . . . . . . . . . . . . . . . . . . . . . . . VIII-1
Appendix IX
–
Definitions and Glossary . . . . . . . . . . . . . . . . . . . . . . . . . . . . . . . . . . . .
– iv –
IX-1
QUESTIONS AND ANSWERS
The following are some of the questions you may have and the answers to those questions.
However, you are urged to read this entire listing document, including the Appendices,
carefully.
1.
What is the purpose of this listing document?
쐌
2.
3.
What is the Spin-off?
쐌
The Spin-off involves the proposed spin-off of the Combined Property Businesses (being the
existing property businesses of the CKH Holdings Group and the Hutchison Group, which
will be reorganised under the Group) to the Qualifying CKH Holdings Shareholders by way
of the Distribution In Specie and the separate listing of the Shares on the Main Board by
way of introduction. The Company is not offering any Shares for sale or subscription.
쐌
The Spin-off is subject to the fulfilment (or, where relevant, waiver) of certain conditions,
including, among other things, completion of the Merger Proposal and the Listing Committee
of the Stock Exchange granting approval for the listing of the Shares on the Main Board.
What is the Distribution In Specie?
쐌
4.
Pursuant to the Distribution In Specie, subject to the fulfilment (or, where relevant, waiver)
of certain conditions, the Qualifying CKH Holdings Shareholders will receive new Shares in
the ratio of one Share for each CKH Holdings Share held at the Record Time (being
8:50 a.m. on Wednesday, 3 June 2015).
Do I need to pay anything for the Shares or complete any application form to receive the
Shares pursuant to the Distribution In Specie?
쐌
5.
This listing document is published in connection with the Company’s listing by way of
introduction on the Main Board of the Stock Exchange and is solely for the purpose of
providing you with information with regard to the Group.
No, you do not need to pay anything for the Shares or complete any application form to
receive the Shares pursuant to the Distribution In Specie. Please also see question 7 below.
What are “odd lots” and what arrangements are being made relating to the sale of odd lots
of Shares?
쐌
Since the Shares will be traded in board lots of 500 shares, any holding of Shares that is not
a whole multiple of 500 is known as an “odd lot”.
쐌
The Company has appointed Fulbright Securities Limited and One China Securities Limited
to provide, on a best efforts basis, a service to match the sale and purchase of odd lots of
Shares issued pursuant to the Distribution In Specie during the period of 60 days
commencing from (and including) the Listing Date (which is expected to be Wednesday, 3
June 2015). Please refer to “The Distribution In Specie and the Spin-off – Arrangements
Relating to the Sale of Odd Lots of the Shares” for further details.
–v–
QUESTIONS AND ANSWERS
6.
Who will receive Shares pursuant to the Distribution In Specie?
쐌
Qualifying CKH Holdings Shareholders as at the Record Time will receive Shares pursuant
to the Distribution In Specie. In addition to the existing CKH Holdings Shareholders, these
CKH Holdings Shareholders will include holders of the CKH Holdings Shares to be issued
pursuant to:
(a)
the Husky Share Exchange (i.e. the Husky Sale Shares Vendor (or as it may direct));
and
(b)
the Hutchison Scheme (i.e. the Hutchison Scheme
Non-Qualifying Hutchison Overseas Shareholders),
Shareholders
other
than
unless they are Non-Qualifying CKH Holdings Shareholders. Please also see question 7
below.
7.
Who are Non-Qualifying CKH Holdings Shareholders? Will they receive Shares pursuant to
the Distribution In Specie?
쐌
Non-Qualifying CKH Holdings Shareholders are those CKH Holdings Shareholders with
registered addresses in, or CKH Holdings Shareholders or Beneficial CKH Holdings
Shareholders who are otherwise known by CKH Holdings to be residents of or located in,
jurisdictions outside Hong Kong at the Record Time and whom the CKH Holdings Board
and the Board, based on enquiries made on their behalves, consider it necessary or expedient
to exclude from receiving Shares pursuant to the Distribution In Specie after taking into
account the legal restrictions under the applicable laws of the relevant jurisdictions where
the CKH Holdings Shareholders or Beneficial CKH Holdings Shareholders are resident or
located in or the requirements of the relevant regulatory bodies or stock exchanges in those
jurisdictions. The relevant Non-Qualifying CKH Holdings Shareholders will not receive any
Shares.
쐌
Based on the registered addresses of the CKH Holdings Overseas Shareholders and the
Hutchison Overseas Shareholders as at the Latest Practicable Date and the legal advice
received, Non-Qualifying CKH Holdings Shareholders are expected to be those CKH
Holdings Shareholders in Australia, the Cayman Islands, the United Arab Emirates and the
United States, subject to certain exceptions as further described in “The Distribution In
Specie and the Spin-off”.
쐌
The Shares which the Non-Qualifying CKH Holdings Shareholders would otherwise receive
pursuant to the Distribution In Specie will be sold in the market as soon as reasonably
practicable following the Listing. The aggregate proceeds of such sale (net of expenses and
taxes) will be paid to the relevant Non-Qualifying CKH Holdings Shareholders (pro rata to
their shareholdings in CKH Holdings as at the Record Time) in Hong Kong dollars in full
satisfaction of the relevant Shares which they would otherwise receive pursuant to the
Distribution In Specie, provided that if the amount that a Non-Qualifying CKH Holdings
Shareholder would be entitled to receive is less than HK$50, such sum will be retained for
the benefit of CKH Holdings.
– vi –
QUESTIONS AND ANSWERS
8.
9.
When do you expect the Spin-off and the Distribution In Specie to be completed?
쐌
The Spin-off and the Distribution In Specie are expected to be completed on Wednesday, 3
June 2015.
쐌
The Share certificates are expected to be despatched to the Qualifying CKH Holdings
Shareholders on Tuesday, 2 June 2015. If the Distribution In Specie does not become
unconditional, the Share certificates will not become valid and dealings in the Shares will
not commence on Wednesday, 3 June 2015.
Who should I call if I have additional questions?
쐌
If you have questions concerning administrative matters, such as dates, documentation and
procedures relating to the Spin-off, please call the Company’s share registrar, Computershare
Hong Kong Investor Services Limited, at +852 2862 8555 between 9:00 a.m. and 5:00 p.m.
from Mondays to Fridays, excluding public holidays.
쐌
This helpline does not provide advice on the merits of the Spin-off or the Distribution In
Specie or give financial or legal advice.
– vii –
SUMMARY
This summary is intended to give you an overview of the information contained in this listing
document. Since it is a summary, it does not contain all the information that may be important to
you. You should read this listing document in its entirety.
Statements contained in this summary that are not historical facts may be forward-looking
statements. Such statements are based on certain assumptions. While the Directors consider such
assumptions to be reasonable, whether actual results will meet our expectations will depend on a
number of risks and uncertainties over which we have no control. Under no circumstances should
the inclusion of such information in this listing document be regarded as a representation, warranty
or prediction with respect to the accuracy of the underlying assumptions by the Company or any of
the Relevant Persons or that these results will be achieved or are likely to be achieved.
OVERVIEW
The Group is one of Hong Kong’s largest property developers with a leading market share in
Hong Kong, strong penetration in the PRC and an international presence through its operations in
Singapore and the United Kingdom. The Company’s predecessor, Cheung Kong, became listed in Hong
Kong in 1972 and the Group benefits from a long and successful track record of over 40 years.
The Group’s Principal Activities
The Group has diverse capabilities with principal activities encompassing property development
and investment, hotel and serviced suite operation and property and project management.
The Group’s Property Interests
The Group
Development
properties
Hotels and
serviced
suites
Investment
properties
Interests in
listed REITs
The Group’s property interests comprise the following:
쐌
Development properties, which include properties for and under development (including
completed properties held for sale) and properties in which the Group has a development
interest;
쐌
Investment properties, which include office, retail and industrial properties and car park
spaces;
쐌
Hotels and serviced suites; and
–1–
SUMMARY
쐌
Interests in listed REITs, which include unitholding interests in Fortune REIT, Prosperity
REIT and Hui Xian REIT. The Group also has interests in ARA Asset Management (which is
the holding company of the managers of Fortune REIT and Prosperity REIT) and Hui Xian
Asset Management Limited (which is the manager of Hui Xian REIT).
Overview of the Group’s Property Portfolio
The Group has a diversified portfolio of properties globally, which includes properties located in
Hong Kong, the PRC, Singapore, the United Kingdom and The Bahamas.
As at 31 December 2014, the Combined Property Businesses (which will be held by the Group
pursuant to the Property Businesses Combination) had a total attributable interest in approximately 1.6
million sq.m. of rental properties, a development land bank of approximately 15.8 million sq.m. (of
which approximately 14.5 million sq.m. is located in the PRC) and more than 14,600 hotel rooms and
also managed approximately 21 million sq.m. of properties in Hong Kong and the PRC. Based on the
value of the Group’s contracted sales of residential properties and the total sales and purchases of
residential properties in the primary market in Hong Kong in 2014, the Group had an estimated market
share of approximately 9.4%. Compared with property developers listed in Hong Kong, the Group
ranked among the top three based on property development revenue in Hong Kong in each of 2012,
2013 and 2014 according to the Group’s calculations based on publicly available data.
As at 28 February 2015, the Group’s diverse portfolio of development properties, investment
properties and hotels and serviced suites that was valued by the Property Valuers (as set out in
“Appendix III – Property Valuation”) had a total valuation of approximately HK$420.1 billion. The
property interests of the Group that were not valued by the Property Valuers include agricultural land
lots held by the Cheung Kong Property Group with an aggregate net book value of approximately
HK$1.1 billion as at 31 December 2014.
COMPETITIVE STRENGTHS
The Directors consider that the Group’s key competitive strengths include:
쐌
One of Hong Kong’s largest property developers, with a proven track record in Hong Kong
and the PRC
쐌
Diversified business mix
쐌
Strong recurring income from extensive asset portfolio
쐌
Focus on optimising land bank to balance stability and growth
쐌
Disciplined investment approach and prudent financial management
쐌
Highly experienced and professional management with a global vision and strong
commitment to robust corporate governance
See “Business – Competitive Strengths” for more details.
–2–
SUMMARY
BUSINESS STRATEGIES
The Group will continue to adhere to its core strategic objective of maximising shareholder value
by driving the long-term sustainable growth of its business. The Group is focused on pursuing other
attractive investment opportunities within its core markets, whilst at the same time seeking to expand
its geographic coverage, with a goal of creating steady returns for Shareholders.
쐌
Continue to focus on the Group’s core markets
쐌
Maintain an active but prudent land bank strategy
쐌
Continue to grow the Group’s recurring income from investment properties
쐌
Enhance the scale and brand positioning of the Group’s hotel and serviced suite portfolio
쐌
Maintain a disciplined financial management approach
See “Business – Business Strategies” for more details.
THE DISTRIBUTION IN SPECIE AND THE SPIN-OFF
On 4 May 2015, the Board resolved, with the consent of CKH Holdings, to implement the
Distribution In Specie immediately following completion of the Property Businesses Combination.
Immediately following completion of the Hutchison Proposal and upon completion of the Property
Businesses Combination, the Combined Property Businesses will be held by the Group, which will at
that time be wholly-owned by CKH Holdings. Immediately following completion of the Property
Businesses Combination, the Company will allot and issue to the Qualifying CKH Holdings
Shareholders new Shares pursuant to the Distribution In Specie in the ratio of one Share for each CKH
Holdings Share held as at the Record Time and immediately thereafter, the two Shares then held by
CKH Holdings will be surrendered for cancellation. Accordingly, the Qualifying CKH Holdings
Shareholders will hold the same proportionate interests in the Company as they hold in CKH Holdings
as at the Record Time. Details of the Distribution In Specie, including information for the
Non-Qualifying CKH Holdings Shareholders, are set out in “The Distribution In Specie and the Spin-off
– Distribution In Specie”.
The Spin-off
If the Spin-off proceeds, it will be implemented in compliance with the Listing Rules. The
Spin-off will be effected through a listing of the Shares by way of introduction and the Distribution In
Specie whereby the Qualifying CKH Holdings Shareholders will receive the relevant Shares. The
Company is not offering any Shares for sale or subscription. For further details of the Spin-off,
including its objectives and benefits, see “The Distribution In Specie and the Spin-off – The Spin-off”.
–3–
SUMMARY
KEY RISKS AND UNCERTAINTIES
There are risks and uncertainties involved in the Group’s business. These risks and uncertainties
can be categorised as set out below. See “Risk Factors” for more details. The following highlights some
of the key risks that affect the Group’s business:
(a)
(b)
(c)
Risks relating to the Group’s Business
쐌
The Group is principally dependent on the performance of the real estate markets in
Hong Kong and the PRC.
쐌
The Group may not always be able to obtain suitable land reserves at commercially
reasonable cost and successfully identify and acquire suitable land for development at a
cost comparable to its historical cost levels.
쐌
The Group’s results of operations may be materially and adversely impacted by labour
shortages and/or rising costs of construction materials and labour.
쐌
The Group may be unable to obtain, or may suffer material delays in obtaining, the
relevant government approvals or be unable to take possession of the land parcels for
its property development projects.
Risks relating to the Property and Hotel Industries
쐌
The Group faces increasing competition in Hong Kong, the PRC and other places
where it operates.
쐌
The Group’s business is subject to government policies and regulations, and in
particular, the Group is susceptible to changes in policies related to the property
industry and the hotel industry in Hong Kong and the PRC. For example, the Cheung
Kong Property Group recorded a decrease in contracted sales in Hong Kong in 2013
primarily as a result of new government regulations and measures in Hong Kong, and
the joint ventures of both the Cheung Kong Property Group and the Hutchison Property
Group recorded lower property sales volume with lower selling prices in certain cities
in the PRC in 2014, which was in part due to government regulations and measures in
the PRC. See “Financial Information – Significant Factors Affecting Our Results of
Operations – Project Development Schedules” for more details.
Risks relating to the PRC and Hong Kong
쐌
(d)
Changes in the PRC and Hong Kong political and economic policies and conditions
could adversely affect the Group’s business and prospects.
Risks relating to the Listing and the Spin-off
쐌
The Spin-off is conditional upon, and will only be completed immediately following,
completion of the Hutchison Proposal.
–4–
SUMMARY
PROPERTY BUSINESSES COMBINATION
In preparation for the Listing and before the commencement of dealings in the Shares on the
Stock Exchange, a number of pre-completion and reorganisation steps have been or will be taken,
pursuant to which interests in the Combined Property Businesses currently under the CKH Holdings
Group and/or the Hutchison Group will be reorganised under the Group. The reorganisation steps
include the following:
(a)
shares in a number of the CPB Companies will be reorganised to form part of the Group;
and
(b)
loans owing by certain CPB Companies to the Cheung Kong Group or the Hutchison Group
at completion of the Property Businesses Combination will be assigned to the Group.
Prior to completion of the Property Businesses Combination, the Cheung Kong Reorganisation and
the Merger Proposal will be implemented. The Cheung Kong Reorganisation was completed on 18
March 2015. Details of the Cheung Kong Reorganisation, the Merger Proposal and the Property
Businesses Combination are set out in “History and Reorganisation – The Reorganisation”.
RELATIONSHIP WITH THE CONTROLLING SHAREHOLDERS
The Trust together with Mr. Li Ka-shing and Mr. Li Tzar Kuoi, Victor will directly and/or
indirectly hold approximately 30.15% of the issued share capital of the Company immediately
following the Listing. Notwithstanding that none of them will individually hold 30% or more of the
issued share capital of the Company immediately following the Listing, they have been deemed by the
Stock Exchange to be a group of controlling shareholders of the Company for the purpose of the
Listing Rules. In addition, the Trust together with Mr. Li Ka-shing and Mr. Li Tzar Kuoi, Victor will
directly and/or indirectly hold approximately 30.15% of the issued share capital of CKH Holdings
immediately following the completion of the Hutchison Proposal and the Husky Share Exchange.
As at the Latest Practicable Date, the Company was a wholly-owned subsidiary of CKH Holdings.
The Company will cease to be a subsidiary of CKH Holdings upon completion of the Distribution In
Specie. There is a clear and distinct delineation between the businesses of the Group and the businesses
of the CKH Holdings Group. On this basis, the Directors are satisfied that the Group will be capable of
carrying on its businesses independently from the CKH Holdings Group following the Listing. See
“Relationship with the Controlling Shareholders” for more details.
–5–
SUMMARY
CORPORATE STRUCTURE IMMEDIATELY AFTER COMPLETION OF THE PROPOSALS
AND THE LISTING
The simplified shareholding and corporate structure of the Group immediately after completion of
the Proposals and the Listing is set out below:
The Trust
Mr. Li Ka-shing
and
Mr. Li Tzar Kuoi, Victor
3.49%
26.66%
Other
shareholders(1)
69.85%
The Company
(listed on the Stock
Exchange)
Combined
Property
Businesses
Notes:
(1)
The other shareholders of the Company include certain core connected persons of the Company (including, among others,
certain directors of the Company (other than Mr. Li Ka-shing and Mr. Li Tzar Kuoi, Victor)), who are not regarded as
public shareholders of the Company under the Listing Rules.
(2)
Details of certain information on the Group’s non-wholly owned subsidiaries as at the Latest Practicable Date (assuming
completion of the Proposals) are set out in “Appendix VII – General Information – Further Information about the
Company – Subsidiaries – Non-wholly Owned Subsidiaries”.
OVERVIEW OF FINANCIAL INFORMATION
During the Track Record Period, the Cheung Kong Property Group derived turnover from property
sales. In addition, the Cheung Kong Property Group and the Hutchison Property Group derived turnover
from (i) property rental, (ii) hotel and serviced suite operation and (iii) property and project
management. The Cheung Kong Property Group and the Hutchison Property Group also conducted
property sales and other property businesses through joint ventures.
For the years ended 31 December 2012, 2013 and 2014, the Cheung Kong Property Group’s
turnover amounted to HK$19,192 million, HK$17,011 million and HK$24,038 million, respectively,
while its profit for the year amounted to HK$17,063 million, HK$14,424 million and HK$17,316
million, respectively. For the same period, the Hutchison Property Group’s turnover amounted to
HK$6,237 million, HK$6,676 million and HK$6,901 million, respectively, while its profit for the year
amounted to HK$8,478 million, HK$9,392 million and HK$35,959 million, respectively.
–6–
SUMMARY
For the years ended 31 December 2012, 2013 and 2014, the Cheung Kong Property Group’s share
of property sales attributable to its interests in joint ventures amounted to HK$11,846 million,
HK$15,301 million and HK$6,959 million, respectively. For the same period, the Hutchison Property
Group’s share of property sales attributable to its interests in joint ventures amounted to HK$11,805
million, HK$15,233 million and HK$6,845 million, respectively.
Assuming completion of the Hutchison Proposal, the Property Businesses Combination (including
the consolidation of joint ventures as referred to below) and the Spin-off as if the Listing had taken
place on 1 January 2014, pro forma turnover of the Group would have amounted to HK$46,606 million
and pro forma profit of the Group would have amounted to HK$54,052 million for the year ended 31
December 2014.
Historically, the Cheung Kong Property Group and the Hutchison Property Group have been
managed and operated largely independently of each other. Many of their development projects in the
PRC were conducted through joint ventures that were not consolidated in either company’s financial
statements. In particular, the Cheung Kong Property Group and the Hutchison Property Group
historically did not consolidate their joint ventures’ turnover under the relevant International Financial
Reporting Standards (“IFRS”) accounting rules, and profits contributed by their joint ventures were
historically recorded as share of net profit of joint ventures under the equity method of accounting.
Immediately following completion of the Property Businesses Combination, a substantial portion
of the joint ventures between the Cheung Kong Property Group and the Hutchison Property Group will
become subsidiaries of the Company and will be consolidated into the financial statements of the
Group. The financial information of the remaining non-consolidated joint ventures will continue to be
recorded as share of net profit of joint ventures under the equity method of accounting.
As a result, the historical financial statements of the Cheung Kong Property Group and the
Hutchison Property Group are not directly comparable to the future financial statements of the Group
immediately following completion of the Property Businesses Combination, which will contain the
results of operations, financial position and cash flows of the Combined Property Businesses and the
joint ventures that will become subsidiaries of the Company as prepared and presented on a
consolidated basis. The historical results of the Cheung Kong Property Group and the Hutchison
Property Group presented below and in the Accountants’ Reports in Appendices IA and IB therefore
will not be comparable to, or be reflective of, the Group’s results following completion of the Property
Businesses Combination.
–7–
SUMMARY
Summary Combined Income Statements
The table below sets out selected financial information from the combined income statements of
the Cheung Kong Property Group and the Hutchison Property Group for the Track Record Period and
the unaudited pro forma combined income statement of the Group for the year ended 31 December
2014:
Cheung Kong Property Group
Group pro
forma(1)
Hutchison Property Group
Year ended 31 December
2012
2013
2014
2012
2013
2014
2014
(HK$ million)
Turnover . . . . . . . . . . .
Operating costs . . . . . . . .
Share of net profit of joint
ventures . . . . . . . . . .
Increase in fair value of
investment properties. . . .
Operating profit . . . . . . .
Profit for the year . . . . . .
Net profit for the year
(excluding increase in fair
value of investment
properties(2), net of tax) .
Net profit margin (excluding
increase in fair value of
investment properties(2),
net of tax) . . . . . . . .
19,192
(12,451)
17,011
(10,612)
24,038
(15,609)
6,237
(3,646)
6,676
(3,727)
6,901
(3,841)
46,606
(30,105)
5,480
4,031
2,835
4,959
3,763
2,342
93
4,470
18,312
17,063
1,782
15,865
14,424
4,542
18,939
17,316
859
8,704
8,478
17
9,935
9,392
28,088
36,445
35,959
33,683
56,839
54,052
12,174
12,624
12,291
7,282
9,355
7,384
20,412
63.4%
74.2%
51.1%
116.8%(3)
140.1%(3)
107.0%(3)
43.8%
Notes:
(1)
Before completion of the Property Businesses Combination, the Cheung Kong Property Group and the Hutchison
Property Group co-invested in entities which are accounted for as joint ventures using the equity method of
accounting in their respective combined financial statements. Immediately following completion of the Property
Businesses Combination, a substantial portion of the joint ventures between the Cheung Kong Property Group and
the Hutchison Property Group will become subsidiaries of the Company and will be consolidated into the financial
statements of the Group. Accordingly, the share of net results of these joint ventures is eliminated, the income and
expenses of these joint ventures are incorporated in the pro forma combined income statement of the Group and
intra-group income and expenses are eliminated. In addition, the Cheung Kong Property Group’s and the Hutchison
Property Group’s respective carrying values of interests in these joint ventures are eliminated, the assets and
liabilities of these joint ventures are incorporated in the pro forma combined statement of assets and liabilities of
the Group and intra group assets and liabilities are eliminated. The financial information of the remaining
non-consolidated joint ventures will continue to be accounted for using the equity method of accounting.
Before completion of the Property Businesses Combination, certain equity interests in Hui Xian REIT are held
through an entity co-invested in by the Cheung Kong Property Group, the Hutchison Property Group and other
parties, which is accounted for as a joint venture using the equity method of accounting in the respective combined
financial statements of the Cheung Kong Property Group and the Hutchison Property Group; while the equity
interests in Hui Xian REIT directly held by the Cheung Kong Property Group and the Hutchison Property Group are
accounted for as investments available for sale and stated at fair value in their respective combined financial
statements. Immediately following completion of the Property Businesses Combination, Hui Xian REIT will become
an associate of the Group and be accounted for using the equity method of accounting. See “Appendix II –
Unaudited Pro Forma Financial Information” and the accompanying notes set out therein for more details.
(2)
Such increase in fair value of investment properties comprised the amount directly attributable to each of the
Cheung Kong Property Group and the Hutchison Property Group and those amounts attributable to the respective
share of joint ventures and associates of the Cheung Kong Property Group and the Hutchison Property Group.
(3)
The Hutchison Property Group’s net profit margin exceeded 100% during the Track Record Period because its profit
for the year included certain line items such as share of net profit of joint ventures and associates and profits on
disposal of investments and others, which did not make any corresponding contribution to its turnover.
–8–
–9–
11,846
19,119
11,919
–
31,038
(ii) Turnover Breakdown by Geography
Hong Kong . . . . . . . . . . . . . . . . . .
PRC . . . . . . . . . . . . . . . . . . . . . .
Overseas. . . . . . . . . . . . . . . . . . . .
Total . . . . . . . . . . . . . . . . . . . . . .
(1)
Note:
100.0
61.6
38.4
–
100.0
38.2
61.8
47.1
6.0
7.6
1.1
(%)
32,312
14,878
16,454
980
32,312
15,301
17,011
12,288
1,961
2,368
394
(HK$
million)
2013
100.0
46.0
50.9
3.1
100.0
47.4
52.6
38.0
6.1
7.3
1.2
(%)
2014
30,997
23,842
5,945
1,210
30,997
6,959
24,038
19,389
1,908
2,213
528
(HK$
million)
100.0
76.9
19.2
3.9
100.0
22.4
77.6
62.6
6.2
7.1
1.7
(%)
2012
18,042
6,012
11,806
224
18,042
11,805
6,237
–
3,318
2,221
698
(HK$
million)
100.0
33.3
65.4
1.3
100.0
65.4
34.6
–
18.4
12.3
3.9
(%)
21,909
6,321
14,373
1,215
21,909
15,233
6,676
–
3,682
2,196
798
(HK$
million)
2013
100.0
28.9
65.6
5.5
100.0
69.5
30.5
–
16.8
10.0
3.7
(%)
2014
13,746
6,457
5,784
1,505
13,746
6,845
6,901
–
3,995
2,230
676
(HK$
million)
Year ended 31 December
Year ended 31 December
100.0
47.0
42.1
10.9
100.0
49.8
50.2
–
29.1
16.2
4.9
(%)
(%)
46,606
30,837
13,107
2,662
46,606
33,679
6,821
5,564
542
100.0
66.2
28.1
5.7
100.0
72.3
14.6
11.9
1.2
(unaudited)
(HK$
million)
December 2014
Year ended 31
Group
pro forma
Total represents the sum of the turnover of (i) the Cheung Kong Property Group or the Hutchison Property Group (as the case may be) and (ii) their respective share of property
sales of joint ventures. This non-IFRS measure is used by the management of the Cheung Kong Property Group and the Hutchison Property Group, respectively, to evaluate their
respective financial performance, and it is considered by them to be an important performance measure which is used in the Cheung Kong Property Group’s and the Hutchison
Property Group’s internal financial and management reporting to manage their respective business performance. This measure is not identified as an accounting measure under
IFRS and should not be considered as an alternative to the Cheung Kong Property Group’s and the Hutchison Property Group’s respective turnover, which is determined in
accordance with IFRS.
Total
31,038
(1)
Share of property sales of joint ventures .
.
.
.
.
19,192
.
.
.
.
Cheung Kong Property Group
Turnover/Hutchison Property Group
Turnover/Group pro forma . . . . . . .
.
.
.
.
14,614
1,867
2,350
361
.
.
.
.
.
.
.
.
Turnover Breakdown by
Operating Activity
Subsidiaries
Property sales . . . . . . . . . . . .
Property rental . . . . . . . . . . .
Hotels and serviced suites . . . . .
Property and project management
. . . . . . . . . . . . . . . . . . . .
(i)
2012
(HK$
million)
Hutchison Property Group
Cheung Kong Property Group
The tables below set out a breakdown of the turnover by operating activity and geography, and a breakdown of the profit contribution by
operating activity, for the Cheung Kong Property Group, the Hutchison Property Group and their respective shares of turnover and profit contribution
from joint ventures and associates, and unaudited pro forma information for the Group on a combined basis, for the periods indicated:
SUMMARY
– 10 –
(1)
Note:
13,297
.
.
.
.
.
.
.
.
.
.
.
.
100.0
74.6
14.9
9.3
1.2
100.0
88.2
5.2
5.7
0.9
100.0
65.6
21.2
11.6
1.6
(%)
13,740
10,172
2,117
1,272
179
6,135
5,486
322
281
46
7,605
4,686
1,795
991
133
(HK$
million)
2013
100.0
74.0
15.4
9.3
1.3
100.0
89.4
5.2
4.6
0.8
100.0
61.6
23.6
13.0
1.8
(%)
2014
12,012
8,501
2,069
1,227
215
2,560
1,924
300
275
61
9,452
6,577
1,769
952
154
(HK$
million)
100.0
70.8
17.2
10.2
1.8
100.0
75.2
11.7
10.7
2.4
100.0
69.6
18.7
10.1
1.6
(%)
2012
10,542
6,219
3,340
940
43
6,859
6,219
381
259
–
3,683
–
2,959
681
43
(HK$
million)
100.0
59.0
31.7
8.9
0.4
100.0
90.7
5.5
3.8
–
100.0
–
80.3
18.5
1.2
(%)
10,710
6,039
3,721
937
13
6,662
6,039
378
245
–
4,048
–
3,343
692
13
(HK$
million)
2013
100.0
56.4
34.7
8.8
0.1
100.0
90.6
5.7
3.7
–
100.0
–
82.6
17.1
0.3
(%)
2014
6,788
1,903
3,978
949
(42)
2,508
1,903
361
244
–
4,280
–
3,617
705
(42)
(HK$
million)
Year ended 31 December
Year ended 31 December
100.0
28.0
58.6
14.0
(0.6)
100.0
75.9
14.4
9.7
–
100.0
–
84.5
16.5
(1.0)
(%)
(%)
18,964
10,602
6,002
2,185
175
18,964
10,602
6,002
2,185
175
100.0
55.9
31.7
11.5
0.9
100.0
55.9
31.7
11.5
0.9
(unaudited)
(HK$
million)
December 2014
Year ended 31
Group
pro forma
Profit contribution represents earnings before interest, taxes, changes in fair value of investment properties, investment and finance income and profit on disposal of investments
and others. This non-IFRS measure is used by the management of the Cheung Kong Property Group and the Hutchison Property Group, respectively, to evaluate their respective
financial performance, and it is considered by them to be an important performance measure which is used in the Cheung Kong Property Group’s and the Hutchison Property
Group’s internal financial and management reporting to manage their respective business performance. This measure is not identified as an accounting measure under IFRS and
should not be considered as an alternative to the Cheung Kong Property Group’s and the Hutchison Property Group’s results of operations, which are determined in accordance
with IFRS. Further, it may not be comparable to other similarly titled measures of other companies.
.
.
.
.
.
.
.
.
Total . . . . . . . . . . . . . . . . . . . . . . . .
.
.
.
.
.
.
.
.
9,916
1,979
1,233
169
.
.
.
.
.
.
.
.
.
.
.
.
.
.
.
.
.
.
.
.
Total
Property sales . . . . . . . . . . .
Property rental . . . . . . . . . . .
Hotels and serviced suites . . . .
Property and project management
.
.
.
.
5,277
.
.
.
.
Total . . . . . . . . . . . . . . . . . . . . . . . .
.
.
.
.
4,655
275
302
45
.
.
.
.
.
.
.
.
.
.
.
.
Joint Ventures and Associates
Property sales . . . . . . . . . . .
Property rental . . . . . . . . . . .
Hotels and serviced suites . . . .
Property and project management
.
.
.
.
8,020
.
.
.
.
Total . . . . . . . . . . . . . . . . . . . . . . . .
.
.
.
.
5,261
1,704
931
124
.
.
.
.
.
.
.
.
Profit Contribution Breakdown(1)
Subsidiaries
Property sales . . . . . . . . . . . .
Property rental . . . . . . . . . . . .
Hotels and serviced suites . . . . .
Property and project management .
2012
(HK$
million)
Hutchison Property Group
Cheung Kong Property Group
SUMMARY
SUMMARY
Historically, the Group has derived a majority of its profit contribution from property sales. Pro
forma profit contribution from property sales would have amounted to HK$10,602 million for the year
ended 31 December 2014, representing 55.9% of the total pro forma profit contribution of the Group.
In addition, the Group has relied on recurring income from its investment properties and income
derived from hotels and serviced suites. Pro forma profit contribution from property rental and hotel
and serviced suite operation would have amounted to HK$8,187 million for the year ended 31
December 2014, representing 43.2% of the total pro forma profit contribution of the Group for that
period. The Group expects that it will continue to rely on these income sources going forward.
Summary Combined Statements of Financial Position
The table below sets out a summary of the combined statements of financial position of the
Cheung Kong Property Group, the Hutchison Property Group and the unaudited pro forma combined
statement of assets and liabilities of the Group for the dates indicated:
Cheung Kong Property Group
Hutchison Property Group
Group
pro
forma(1)
As at 31 December
2012
2013
2014
2012
2013
2014
2014
(HK$ million)
Total current assets . . .
Total current liabilities .
Net current (liabilities)/
assets . . . . . . . . .
Total non-current
liabilities . . . . . . .
Total non-current assets
Net assets . . . . . . . .
. .
. .
96,475
(105,095)
92,690
(91,594)
86,633
(82,796)
45,381
(29,410)
51,007
(26,683)
55,789
(33,019)
253,501
(139,235)
. .
(8,620)
1,096
3,837
15,971
24,324
22,770
114,266
. .
. .
. .
(1,120)
91,417
81,677
(1,576)
89,634
89,154
(1,349)
96,583
99,071
(31,815)
92,389
76,545
(32,017)
94,159
86,466
(30,700)
125,122
117,192
(50,219)
162,539
226,586
Note:
(1)
Please refer to the footnote to the table under “– Summary Combined Income Statements” above for a description of
the key accounting adjustments used to prepare the Group’s pro forma financial information.
– 11 –
SUMMARY
Summary Combined Statements of Cash Flows
The table below sets out a summary of the combined statements of cash flows of the Cheung
Kong Property Group and the Hutchison Property Group for the Track Record Period and the unaudited
pro forma combined statements of cash flows of the Group for the year ended 31 December 2014:
Cheung Kong Property Group
Group
pro
forma(1)
Hutchison Property Group
Year ended 31 December
2012
2013
2014
2012
2013
2014
2014
(HK$ million)
Net cash flows (used
in)/generated from
operating activities . . .
Net cash flows generated
from investing
activities . . . . . . . . .
Net cash flows generated
from/(used in) financing
activities . . . . . . . . .
Net increase/(decrease) in
cash and cash
equivalents . . . . . . . .
Cash and cash equivalents
at 1 January . . . . . . .
Cash and cash
equivalents at 31
December . . . . . . . .
(3,402)
3,769
7,972
3,021
6,903
2,917
3,921
(13,499)
(10,604)
3,540
(2,827)
9,356
12,896
(158)
2,574
221
1,551
1,046
269
(186)
6,762
138
(6,031)
(2,690)
(7,153)
285
2,554
(4,764)
(870)
(577)
12,896
10,069
6,441
8,995
4,231
32,935
10,069
10,354
8,995
4,231
3,361
32,358
Note:
(1)
Please refer to the footnote to the table under “– Summary Combined Income Statements” above for a description of
the key accounting adjustments used to prepare the Group’s pro forma financial information.
Changes in Fair Value of Investment Properties
Changes in fair value of investment properties are recognised in the combined income statements
in the year or period such changes arise. The fair values of the Cheung Kong Property Group’s and the
Hutchison Property Group’s investment properties as at 31 December 2012, 2013 and 2014 were
determined by professional valuation conducted by independent property valuers on the basis of
capitalisation of rental income derived from the existing tenancies with due allowance for reversionary
potential of each of the properties or by reference to comparable market transactions. The reversionary
potential of the properties was estimated by the independent property valuers based on the risk profile
of the properties being valued. The higher the risk profile, the lower the fair value is.
Please refer to Note 9 in “Appendix IA – Accountants’ Report on the Cheung Kong Property
Group” and Note 10 in “Appendix IB – Accountants’ Report on the Hutchison Property Group” for the
ranges of capitalisation rates used for the valuation of the Cheung Kong Property Group’s and the
Hutchison Property Group’s investment properties.
– 12 –
SUMMARY
For the years ended 31 December 2012, 2013 and 2014, the Cheung Kong Property Group had an
increase in fair value of investment properties of HK$4,470 million, HK$1,782 million and HK$4,542
million, respectively. For the same years, the Hutchison Property Group had an increase in fair value of
investment properties of HK$859 million, HK$17 million and HK$28,088 million. The significant
increase in the Hutchison Property Group’s investment properties from 2013 to 2014 was due to the
improvement in market conditions in 2014 as a result of the high global liquidity and easing of investor
concerns over a potential increase in interest rates, which boosted overall investor confidence and
sentiment. As a result of the changes in the market conditions, the independent property valuers
changed certain assumptions used to value the investment properties, including reducing the weighted
average capitalisation rate used from 8.7% as at 31 December 2013 to 6.1% as at 31 December 2014
for the valuation of Hutchison Property Group’s investment properties. The amounts of revaluation
adjustments have been, and may continue to be, significantly affected by the prevailing property
markets. Gains and losses arising from changes in the fair value of our investment properties may have
a substantial effect on our profits. We cannot assure you that levels of increases in the fair value of
investment properties to be recognised in 2015 and onwards will be similar to those recognised during
the Track Record Period or that the values will not fall from those recognised during the Track Record
Period. See “Financial Information – Significant Factors Affecting Our Results of Operations – Fair
Value of Our Investment Properties” and “Financial Information – Critical Accounting Policies and
Estimates – Investment Properties Valuation”.
Key Financial Ratios
The following table sets out the key financial ratios for the Cheung Kong Property Group and the
Hutchison Property Group as at and for the periods indicated:
Cheung Kong Property Group
Hutchison Property Group
Group
pro
forma(7)
As at and for the year ended 31 December
2012
Liquidity ratios
Current ratio(1) . . . . . .
Quick ratio(2) . . . . . .
Capital adequacy ratios
Gearing ratio(3) . . . . .
Debt-to-asset ratio(4) . .
Profitability ratios
Return on total assets(5) .
Return on equity(6) . . . .
2013
2014
2012
2013
2014
2014
. . . . . .
. . . . . .
0.9x
0.2x
1.0x
0.1x
1.0x
0.2x
1.5x
1.5x
1.9x
1.9x
1.7x
1.6x
3.9x
0.8x
. . . . . .
. . . . . .
50.1%
28.7%
41.9%
26.0%
34.2%
24.1%
25.1%
20.5%
27.7%
19.4%
20.5%
15.2%
15.6%
19.6%
. . . . . .
. . . . . .
9.1%
20.9%
7.9%
16.2%
9.5%
17.5%
6.2%
11.1%
6.5%
10.9%
19.9%
30.7%
14.7%
21.3%
Notes:
(1)
Current ratio is calculated by dividing total current assets by total current liabilities.
(2)
Quick ratio is calculated by dividing total current assets less stock of properties by total current liabilities.
(3)
For the Cheung Kong Property Group, gearing ratio is calculated by dividing interest-bearing borrowings and
interest-bearing amounts due to the Cheung Kong Group less cash and cash equivalents by total equity and
multiplying the resulting value by 100%. For the Hutchison Property Group, gearing ratio is calculated by dividing
interest-bearing borrowings and interest-bearing amounts due to the Hutchison Group less cash and cash equivalents
by total equity and multiplying the resulting value by 100%. For Group pro forma, gearing ratio is calculated by
dividing total borrowings of the Group less cash and cash equivalents by total equity and multiplying the resulting
value by 100%.
– 13 –
SUMMARY
(4)
For Cheung Kong Property Group, debt-to-asset ratio is calculated by dividing interest-bearing borrowings and
interest-bearing amounts due to the Cheung Kong Group by total assets and multiplying the resulting value by
100%. For Hutchison Property Group, debt-to-asset ratio is calculated by dividing interest-bearing borrowings and
interest-bearing amounts due to the Hutchison Group by total assets and multiplying the resulting value by 100%.
For Group pro forma, debt-to-asset ratio is calculated by dividing total borrowings of the Group by total assets and
multiplying the resulting value by 100%.
(5)
Return on total assets is calculated by dividing profit for the year by total assets at the end of the year and
multiplying the resulting value by 100%.
(6)
Return on equity is calculated by dividing profit for the year by total equity at the end of the year and multiplying
the resulting value by 100%.
(7)
The Group’s pro forma financial ratios are calculated based on the pro forma balances (including the net amount
due to the Combined Non-Property Businesses) as at 31 December 2014. Based on the pro forma balances as at 31
December 2014, the net amount due to the Combined Non-Property Businesses of HK$81,725 million, which results
from (i) amounts due from the Combined Non-Property Businesses of HK$49,077 million, (ii) amounts due to the
Combined Non-Property Businesses of HK$101,492 million and (iii) loans from the Combined Non-Property
Businesses of HK$29,310 million, will be partially settled by a promissory note that will be issued by the Company
to CKH Holdings in the principal amount of HK$55 billion (the “Specified Loans Promissory Note”) upon
completion of the Property Businesses Combination. The Specified Loans Promissory Note will, in turn, be settled
by cash upon drawdown of two loan facilities in the aggregate amount of no less than HK$55 billion or its
equivalent of which HK$15 billion is classified as current liabilities and the remaining HK$40 billion is classified
as non-current liabilities. The remaining balance of HK$26,725 million, together with the consideration for the CPB
Companies Share Reorganisation, will be settled by another promissory note, which, in turn, will be settled by the
Company issuing one Share to CKH Holdings, credited as fully paid at a premium. For further details of the
settlement arrangement, please refer to “History and Reorganisation – The Reorganisation – Property Businesses
Combination”. The key financial ratios for the Group pro forma column have taken into account these adjustments
and also have assumed that the issuance of the Specified Loans Promissory Note and completion of the related
transactions had taken place on 31 December 2014.
UNAUDITED PRO FORMA FINANCIAL INFORMATION
The unaudited pro forma financial information has been prepared for illustrative purposes only
and, because of its hypothetical nature, it may not give a true picture of the financial position of the
Group had the Listing been completed as at 31 December 2014 or any future date.
We have prepared and included the unaudited pro forma financial information as at and for the
year ended 31 December 2014 as set out in Appendix II for the purpose of illustrating the effect of
completion of the Hutchison Proposal and the Property Businesses Combination (including
consolidation of the joint ventures that will become subsidiaries of the Company) as if the Listing had
taken place on 1 January 2014 for the pro forma combined income statement and statement of cash
flows and 31 December 2014 for the pro forma combined statement of assets and liabilities.
The unaudited pro forma financial information has been prepared in accordance with Rule 4.29 of
the Listing Rules, incorporating the combined results and cash flows of the Cheung Kong Property
Group, the Hutchison Property Group and the joint ventures that will become subsidiaries of the
Company for the year ended 31 December 2014; and the combined assets and liabilities of the Cheung
Kong Property Group, the Hutchison Property Group and the joint ventures that will become
subsidiaries of the Company as at 31 December 2014. The unaudited pro forma information does not
form part of the Accountants’ Reports set out in Appendices IA and IB to this listing document.
See “Appendix II – Unaudited Pro Forma Financial Information” for details.
– 14 –
SUMMARY
DIVIDEND POLICY
Prior to completion of the Merger Proposal, each of the Hutchison Group and the Cheung Kong
Group declared a second interim dividend in lieu of a final dividend in respect of the financial year of
2014 based on their respective full results for the financial year of 2014, which was paid on 15 April
2015.
For the financial year of 2015, if the Merger Proposal and the Spin-off become effective, an
interim dividend will be declared by each of CKH Holdings and the Company at the time of the
announcement of their respective interim results which will take into account the results of the
respective businesses of the CKH Holdings Group and the Group from 1 January 2015. Subject to the
business results for the financial year of 2015, assuming an existing CKH Holdings Shareholder or
Hutchison Shareholder continues to hold both the CKH Holdings Shares and the Shares received after
completion of the Proposals, it is expected that the combined per share dividend CKH Holdings and the
Company will pay in respect of the financial year of 2015 on those shares will be more than the total
dividend per Cheung Kong share or Hutchison Share, as the case may be, paid in respect of the
financial year of 2014, excluding any special dividends paid in that year.
Going forward, from and including the financial year of 2016, the Company will adopt a dividend
policy that is consistent with its business profile. Subject to business conditions and the maintenance of
a strong credit profile, the Company expects the dividend policy will result in a higher dividend payout
ratio than that in the financial year of 2015.
OUR PROPERTY PORTFOLIO
The table below sets out the aggregate GFA and valuation attributable to the Group’s diverse
portfolio of development properties, investment properties and hotels and serviced suites that was
valued by the Property Valuers as at 28 February 2015, respectively. All valuation figures cited are
derived from the property valuation reports contained in “Appendix III – Property Valuation”.
GFA
Development
Properties
Investment
Properties
Valuation
Hotels
Development
Properties
Total
(million sq.m.)
Hong Kong . .
PRC(1) . . . . .
Overseas
Singapore . .
UK . . . . .
The Bahamas
Investment
Properties
Hotels
Total
(HK$ million)
. . . . .
. . . . .
0.9
19.7
1.3
0.2
0.6
0.1
2.8
20.0
87,299
131,412
117,767
5,260
63,908
1,770
268,974
138,442
. . . . .
. . . . .
. . . . .
0.1
0.6
–
–
0.0
–
–
–
0.1
0.1
0.6
0.1
4,648
7,321
16
–
304
–
–
–
445
4,648
7,625
461
Total. . . . . . . . . . .
21.3
1.5
0.8
23.6
230,696
123,331
66,122
420,149
Note:
(1)
Excludes Chongqing Metropolitan Plaza, the sale of which to Hui Xian REIT was completed on 2 March 2015.
– 15 –
SUMMARY
Property Valuation
The following information is extracted from the property valuation reports of the Property Valuers
in “Appendix III – Property Valuation”. You should note that the market values of the properties
prepared by the Property Valuers were based on certain assumptions which may be subject to changes
and may not be realised. See “Risk Factors – Risks Relating to Our Business – The appraised value of
our properties may be different from the actual realisable value and is subject to change” for further
details.
(a)
DTZ Debenham Tie Leung Limited
No.
1.
Property group
Group I – Completed properties held
by the Cheung Kong Property Group
and the Hutchison Property Group
for sale in the PRC
Valuation approach
Direct Comparison Approach assuming the sale of each of these
properties in its existing state by making reference to comparable
sales transactions as available in the relevant market; or
Page no. of
property valuation
report in
Appendix III
III-1 to III-42
Investment Approach on the basis of capitalisation of the rental
income derived from the existing tenancies with due allowance for
reversionary potential of each of the properties.
2.
Group II – Completed properties
held by the Cheung Kong Property
Group and the Hutchison Property
Group for investment in the PRC
Investment Approach on the basis of capitalisation of rental income
derived from the existing tenancies with due allowance for
reversionary potential of each of the properties or by reference to
comparable market transactions.
III-1 to III-42
3.
Group III – Completed properties
held by the Cheung Kong Property
Group and the Hutchison Property
Group for operation in the PRC
Discounted Cash Flow Approach involving discounting future net
cash flow of each property for a 10-year investment horizon and the
anticipated net operating income receivable thereafter being
capitalised at appropriate terminal capitalisation rates until the end of
the respective land use terms to its present value by using an
appropriate discount rate that reflects the rate of return required by a
third party investor for an investment of this type.
III-1 to III-42
4.
Group IV – Properties held by the
Cheung Kong Property Group and
the Hutchison Property Group under
development in the PRC
Direct Comparison Approach by making reference to comparable
sales evidence as available in the relevant market and also taking into
account the incurred construction costs and the costs that will be
incurred to complete the development to reflect the quality of the
completed development.
The Property Valuer has adopted the Direct Comparison Approach to
assess the development value as if completed as at 28 February 2015.
III-1 to III-42
5.
Group V – Properties held by the
Cheung Kong Property Group and
the Hutchison Property Group for
future development in the PRC
Direct Comparison Approach assuming the sale of each of these
properties in its existing state by making reference to comparable
sales transactions as available in the relevant market.
III-1 to III-42
6.
Group VI – Completed properties
held by the Cheung Kong Property
Group and the Hutchison Property
Group for sale in Hong Kong
Direct Comparison Approach assuming the sale of each of these
properties in its existing state by making reference to comparable
sales transactions as available in the relevant market; or
III-1 to III-42
Investment Approach on the basis of capitalisation of rental income
derived from the existing tenancies with due allowance for
reversionary potential of each of the properties.
– 16 –
SUMMARY
No.
Property group
Valuation approach
Page no. of
property valuation
report in
Appendix III
7.
Group VII – Completed properties
held by the Cheung Kong Property
Group and the Hutchison Property
Group for investment in Hong Kong
Investment Approach on the basis of capitalisation of rental income
derived from the existing tenancies with due allowance for
reversionary potential of each of the properties or by reference to
comparable market transactions.
III-1 to III-42
8.
Group VIII – Completed hotel
properties held by the Cheung Kong
Property Group and the Hutchison
Property Group for operation in
Hong Kong
Discounted Cash Flow Approach involving discounting future net
cash flow of each property for a 10-year investment horizon by using
an appropriate discount rate that reflects the rate of return required by
a third party investor for an investment of this type. The anticipated
net operating income receivable from the 11th year onwards is
capitalised in perpetuity at an appropriate terminal capitalisation rate
and discounted to its present value. In valuing Property No. VIII-12
which involves a joint venture interest, the anticipated net operating
income is discounted for the remaining joint venture period.
III-1 to III-42
9.
Group IX – Properties held by the
Cheung Kong Property Group under
development in Hong Kong
Direct Comparison Approach by making reference to comparable
sales evidence as available in the relevant market and also taking into
account the incurred construction costs and the costs that will be
incurred to complete the development to reflect the quality of the
completed development.
III-1 to III-42
The Property Valuer has adopted the Direct Comparison Approach to
assess the development value as if completed as at 28 February 2015.
10.
Group X – Properties held by the
Cheung Kong Property Group for
future development in the Hong
Kong
Direct Comparison Approach assuming sale of each of these
properties in its existing state by making reference to comparable
sales transactions as available in the relevant market.
III-1 to III-42
11.
Group XI – Property held by the
Cheung Kong Property Group under
development in Singapore
Direct Comparison Approach by making reference to comparable
sales evidence as available in the relevant market and also taking into
account the incurred construction costs and the costs that will be
incurred to complete the development to reflect the quality of the
completed development.
III-1 to III-42
The Property Valuer has adopted the presold consideration as the
development value as if completed as at 28 February 2015.
12.
Group XII – Property held by the
Cheung Kong Property Group and
the Hutchison Property Group for
future development in Singapore
Direct Comparison Approach assuming the sale of the property in its
existing state by making reference to comparable sales transactions as
available in the relevant market.
III-1 to III-42
13.
Group XIII – Property held by the
Cheung Kong Property Group and
the Hutchison Property Group under
development in the United Kingdom
Direct Comparison Approach or Investment Approach by making
reference to comparable sales evidence as available in the relevant
market or on the basis of capitalisation of the potential rental income
of the property respectively, and also taking into account the incurred
construction costs and the costs that will be incurred to complete the
development to reflect the quality of the completed development.
III-1 to III-42
The Property Valuer has adopted the Direct Comparison Approach or
the Investment Approach to assess the development value as if
completed as at 28 February 2015.
– 17 –
SUMMARY
No.
14.
Property group
Group XIV – Property held by the
Cheung Kong Property Group and
the Hutchison Property Group for
future development in the United
Kingdom
Valuation approach
Direct Comparison Approach or Investment Approach by making
reference to comparable sales evidence as available in the relevant
market or on the basis of capitalisation of the potential rental income
of each of the properties and also taking into account the incurred
construction costs and the costs that will be incurred to complete the
development to reflect the quality of the completed development.
Page no. of
property valuation
report in
Appendix III
III-1 to III-42
The Property Valuer has adopted the Direct Comparison Approach or
the Investment Approach to assess the development value as if
completed as at 28 February 2015.
(b)
Gerald Eve LLP
No.
1.
(c)
Property
Albion Riverside, London, United
Kingdom
III-43 to III-52
Smiths Gore
No.
1.
(d)
Valuation approach
Investment Approach on the basis of capitalisation of rental income
derived from the existing tenancies with due allowance for
reversionary potential of the property or by comparable market.
Page no. of
property valuation
report in
Appendix III
Property
Valuation approach
Land at Teversham Road, Fulbourn,
Cambridgeshire, United Kingdom
Direct Comparison Approach assuming sale of the property in its
existing state with the benefit of vacant possession by making
reference to comparable sales transactions as available in the relevant
market.
Page no. of
property valuation
report in
Appendix III
III-53 to III-61
CBRE, Inc.
No.
Property
Valuation approach
Page no. of
property valuation
report in
Appendix III
1.
Silver Point Beach Land Freeport,
The Bahamas
Direct Comparison Approach assuming the sale of the property in its
existing state by making reference to comparable sales transactions as
available in the relevant market.
III-61 to III-72
2.
Grand Lucayan Beach and Golf
Resort, The Bahamas
Direct Comparison Approach assuming the sale of the property in its
existing state by making reference to comparable sales transactions as
available in the relevant market.
III-73 to III-93
Investment Approach on the basis of capitalisation of rental income
derived from the existing tenancies with due allowance for
reversionary potential of the property or by comparable market.
– 18 –
SUMMARY
RECENT DEVELOPMENTS
On 9 January 2015, Cheung Kong and Hutchison announced the Cheung Kong Reorganisation, the
Merger Proposal and the Spin-off. CKH Holdings became the holding company of the Cheung Kong
Group upon completion of the Cheung Kong Reorganisation on 18 March 2015.
The Group’s business has been, and will continue to be, affected by the regulatory environment in
the places where it operates. For example, the Cheung Kong Property Group recorded a decrease in
contracted sales in Hong Kong in 2013 primarily as a result of new government regulations and
measures in Hong Kong, and the joint ventures of both the Cheung Kong Property Group and the
Hutchison Property Group recorded lower property sales volume with lower selling prices in certain
cities in the PRC in 2014, which was in part due to government regulations and measures in the PRC.
The Group believes that these policies and measures adversely affected the Group’s business during the
Track Record Period, and may continue to adversely impact its financial performance in the future.
However, despite the new regulatory environment in Hong Kong which resulted in a decrease in
contracted sales in Hong Kong in 2013, the Cheung Kong Property Group’s turnover from property
sales in Hong Kong increased in 2014 from 2013. As a result, the Group believes it is difficult to
provide a meaningful quantitative analysis of the impact of existing and future government policies and
measures on the Group’s business in the future. See “Financial Information – Significant Factors
Affecting Our Results of Operations – Regulatory Environment and Measures Affecting the Property and
Hotel Industries” and “Appendix IV – Regulatory Overview” for more details.
Save as disclosed above, as far as the Directors are aware, there have been no material changes in
the financial or trading position of the Group or the general economic and market conditions, or legal
and regulatory regimes, in the jurisdictions or the industries in which the Cheung Kong Property Group
and the Hutchison Property Group operate that have materially and adversely affected the Group’s
business, operations or financial position since 31 December 2014, being the date to which the latest
published audited consolidated financial statements of the Group were made up, and up to the Latest
Practicable Date.
LISTING EXPENSES
In relation to the Listing, the Company expects to incur listing expenses of approximately
HK$140.1 million prior to completion of the Hutchison Proposal and the Property Businesses
Combination, the entirety of which will be borne by the CKH Holdings Group. The Company did not
incur listing expenses during the Track Record Period.
– 19 –
THE DISTRIBUTION IN SPECIE AND THE SPIN-OFF
DISTRIBUTION IN SPECIE
On 4 May 2015, the Board resolved, with the consent of CKH Holdings, to implement the
Distribution In Specie immediately following completion of the Property Businesses Combination.
Immediately following completion of the Hutchison Proposal and upon completion of the Property
Businesses Combination, the Combined Property Businesses will be held by the Group, which will at
that time be wholly-owned by CKH Holdings. Immediately following completion of the Property
Businesses Combination, the Company will allot and issue to the Qualifying CKH Holdings
Shareholders new Shares pursuant to the Distribution In Specie in the ratio of one Share for each CKH
Holdings Share held as at the Record Time and immediately thereafter, the two Shares then held by
CKH Holdings will be surrendered for cancellation. Accordingly, the Qualifying CKH Holdings
Shareholders will hold the same proportionate interests in the Company as they hold in CKH Holdings
as at the Record Time.
These CKH Holdings Shareholders will include, among others, holders of the CKH Holdings
Shares to be issued pursuant to (a) the Husky Share Exchange (i.e. the Husky Sale Shares Vendor (or as
it may direct)) and (b) the Hutchison Scheme (i.e. the Hutchison Scheme Shareholders other than the
Non-Qualifying Hutchison Overseas Shareholders), unless they are Non-Qualifying CKH Holdings
Shareholders.
(a)
Conditions Precedent to the Spin-off
The Spin-off will be subject to the fulfilment (or, where relevant, waiver) of the following
conditions precedent:
(i)
completion of the Cheung Kong Reorganisation (which occurred on 18 March 2015);
(ii)
the Listing Committee granting approval for the listing by way of introduction of, and
permission to deal in, the Shares and such approval not having been revoked prior to
completion of the Spin-off;
(iii) completion of the Husky Share Exchange having occurred;
(iv) the Hutchison Scheme having become effective;
(v)
fulfilment (or, where applicable, waiver) of the respective conditions precedent to the
Specified Loans Purchase Agreement and the Reorganisation Agreement (other than the
condition precedent relating to the Hutchison Scheme having become effective); and
(vi) all authorisations, registrations, filings, rulings, consents, permissions and approvals
(including approval in-principle) which may be required in connection with the Spin-off
under any existing contractual arrangements, including loan and other finance
documentation, or regulatory requirements having been obtained and all regulatory filing
obligations having been complied with.
CKH Holdings has reserved the right to waive the condition precedent in (vi) above in whole or
in part and either generally or in respect of any particular matter. The other conditions precedent cannot
be waived. As at the Latest Practicable Date, none of the above conditions (other than the condition
precedent in (i) above) had been satisfied.
– 20 –
THE DISTRIBUTION IN SPECIE AND THE SPIN-OFF
(b)
Non-Qualifying CKH Holdings Shareholders
The allotment and issue by the Company of the Shares under the Distribution In Specie to certain
CKH Holdings Shareholders may be subject to laws of jurisdictions outside Hong Kong. CKH Holdings
Shareholders and Beneficial CKH Holdings Shareholders residing in jurisdictions other than Hong Kong
should inform themselves about and observe all legal and regulatory requirements applicable to them. It
is the responsibility of CKH Holdings Shareholders and Beneficial CKH Holdings Shareholders to
satisfy themselves as to the full observance of the laws of the relevant jurisdictions applicable to them
in connection with the Distribution In Specie, including obtaining of any governmental, exchange
control or other consents which may be required, or compliance with any other necessary formalities
and payment of any issue, transfer or other taxes due in such jurisdiction.
CKH Holdings Overseas Shareholders and Beneficial CKH Holdings Shareholders should consult
their professional advisers if they are in any doubt as to the potential applicability of, or consequences
under, any provision of law or regulation or judicial or regulatory decisions or interpretations in any
jurisdictions, territory or locality therein or thereof and, in particular, whether there will be any
restriction or prohibition on the acquisition, retention, disposal or otherwise with respect to the Shares,
as the case may be. It is emphasised that none of CKH Holdings, the Company or any of the Relevant
Persons accepts any responsibility in relation to the above.
Non-Qualifying CKH Holdings Shareholders are those CKH Holdings Shareholders with registered
addresses in, or CKH Holdings Shareholders or Beneficial CKH Holdings Shareholders who are
otherwise known by CKH Holdings to be residents of or located in, jurisdictions outside Hong Kong at
the Record Time and whom the CKH Holdings Board and the Board, based on enquiries made on their
behalves, consider it necessary or expedient to exclude them from receiving Shares pursuant to the
Distribution In Specie on account of the legal restrictions under the applicable laws of the relevant
jurisdictions where the CKH Holdings Shareholders or Beneficial CKH Holdings Shareholders are
resident or located in or the requirements of the relevant regulatory bodies or stock exchanges in those
jurisdictions. The relevant Non-Qualifying CKH Holdings Shareholders will not receive any Shares.
The Shares which the Non-Qualifying CKH Holdings Shareholders would otherwise receive
pursuant to the Distribution In Specie will be issued to a nominee selected by the CKH Holdings
Board, who will sell such Shares in the market as soon as reasonably practicable following the
commencement of dealings in the Shares on the Stock Exchange. The aggregate proceeds of such sale
(net of expenses and taxes) will be paid to the relevant Non-Qualifying CKH Holdings Shareholders
(pro rata to their shareholdings in CKH Holdings as at the Record Time) in Hong Kong dollars in full
satisfaction of the relevant Shares which they would otherwise receive pursuant to the Distribution In
Specie, provided that if the amount that a Non-Qualifying CKH Holdings Shareholder would be entitled
to receive is less than HK$50, such sum will be retained for the benefit of CKH Holdings. The CKH
Holdings Board and the Board do not propose that the Shares be allotted and issued to CKH Holdings
Shareholders in the United States as part of the Distribution In Specie unless it is determined that it can
be done in transactions that are exempt from or do not require registration under the U.S. Securities
Act.
– 21 –
THE DISTRIBUTION IN SPECIE AND THE SPIN-OFF
As at the Latest Practicable Date:
(a)
based on the information provided by CKH Holdings, there were 116 CKH Holdings
Shareholders whose addresses as registered in the register of members of CKH Holdings
were outside Hong Kong, namely in Australia, Canada, the Cayman Islands, France, Guyana,
Macau, Malaysia, New Zealand, the Philippines, the PRC, Singapore, Switzerland, Taiwan,
the United Kingdom and the United States; and
(b)
based on the information provided by Hutchison, there were 499 Hutchison Shareholders
whose addresses as registered in the register of members of Hutchison were outside Hong
Kong, namely in Australia, Austria, Bermuda, Canada, France, Indonesia, India, Ireland,
Japan, Kenya, Macau, Malaysia, New Zealand, Nigeria, the Republic of Panama, the
Philippines, Portugal, the PRC, Republic of Korea, Singapore, Sri Lanka, Sweden,
Switzerland, Tahiti, Taiwan, Thailand, the United Arab Emirates, the United Kingdom and
the United States.
Based on the legal advice received and, where relevant, taking into account the number of CKH
Holdings Overseas Shareholders and Hutchison Overseas Shareholders in the relevant jurisdictions as at
the Latest Practicable Date and/or the number of CKH Holdings Shares and Hutchison Shares they then
held and assuming that the relevant legal requirements remain unchanged, the Excluded Jurisdictions
are expected to be:
(i)
Australia, on the basis that there are expected to be more than 20 CKH Holdings Overseas
Shareholders whose addresses as registered in the register of members of CKH Holdings are
located in Australia as at the Record Time (the “Australian Shareholders”);
(ii)
the Cayman Islands, other than any CKH Holdings Overseas Shareholders which are
registered as Cayman Islands exempted companies or Cayman Islands exempted limited
partnerships;
(iii) the United Arab Emirates; and
(iv) the United States, subject to “– Limited categories of persons in the Excluded Jurisdictions
who may be able to receive the Shares issued pursuant to the Distribution In Specie” below,
and therefore on the basis and subject to the exceptions described above, the CKH Holdings Overseas
Shareholders in these Excluded Jurisdictions are expected to be Non-Qualifying CKH Holdings
Shareholders. If, at the Record Time, there are 20 or fewer Australian Shareholders, Australia will not
be classified as an “Excluded Jurisdiction” and the Australian Shareholders will not be Non-Qualifying
CKH Holdings Shareholders.
With respect to the Excluded Jurisdictions, CKH Holdings will send a letter to CCASS
Participants (other than CCASS Investor Participants) notifying them that, in light of applicable laws
and regulations of the Excluded Jurisdictions, to the extent they hold any CKH Holdings Shares on
behalf of any Beneficial CKH Holdings Shareholder with an address located in any of the Excluded
Jurisdictions, they should sell the Shares which they receive pursuant to the Distribution In Specie on
behalf of the CKH Holdings Overseas Shareholder and pay the net proceeds of such sale to such
Beneficial CKH Holdings Shareholder. None of CKH Holdings, the Company or any of the Relevant
Persons takes any responsibility for the sale of such Shares or the payment of the net proceeds of the
sale of such Shares to any such underlying Beneficial CKH Holdings Shareholder.
– 22 –
THE DISTRIBUTION IN SPECIE AND THE SPIN-OFF
If there is any other jurisdiction outside Hong Kong which is not referred to above in which the
address of any CKH Holdings Shareholder as shown in the register of members of CKH Holdings at
the Record Time is located or any CKH Holdings Shareholder or Beneficial CKH Holdings Shareholder
at the Record Time is otherwise known by CKH Holdings to be located or resident, and such CKH
Holdings Shareholders should, in the view of the CKH Holdings Board and the Board having made the
relevant enquiries and having considered the circumstances, be excluded from receiving the Shares
pursuant to the Distribution In Specie on the basis of the legal restrictions under the applicable laws of
such jurisdiction or the requirements of the relevant regulatory bodies or stock exchanges in such
jurisdiction, the Company will make an announcement.
Limited categories of persons in the Excluded Jurisdictions who may be able to receive the Shares
issued pursuant to the Distribution In Specie
Notwithstanding what is said in the section above, the following limited categories of persons in
the Excluded Jurisdictions may be able to receive the Shares pursuant to the Distribution In Specie.
CKH Holdings Shareholders or Beneficial CKH Holdings Shareholders in the United States will
generally be considered to be Non-Qualifying CKH Shareholders. However, a limited number of CKH
Holdings Shareholders and Beneficial CKH Holdings Shareholders in the United States who CKH
Holdings and the Company reasonably believe are “qualified institutional buyers” as defined in Rule
144A under the U.S. Securities Act may be able to receive the Shares issued pursuant to the
Distribution In Specie in transactions exempt from the registration requirements of the U.S. Securities
Act, provided that they fulfil relevant requirements to the satisfaction of CKH Holdings and the
Company.
CKH Holdings and the Company reserve the right, in their absolute discretion, to determine
whether to allow such participation, as well as the identity of the persons who may be allowed to do
so.
Information for Overseas Shareholders
A summary of the requirements applicable to CKH Holdings Overseas Shareholders or persons in
certain jurisdictions is set out in “Appendix VII – General Information – Information for Overseas
Shareholders”.
THE SPIN-OFF
If the Spin-off proceeds, it will be implemented in compliance with the Listing Rules. The
Spin-off will be effected through a listing of the Shares by way of introduction and the Distribution In
Specie whereby the Qualifying CKH Holdings Shareholders will receive the relevant Shares. The
Company is not offering any Shares for sale or subscription.
– 23 –
THE DISTRIBUTION IN SPECIE AND THE SPIN-OFF
Objectives and Benefits of the Merger Proposal and the Spin-off
The Directors believe that the Merger Proposal and the Spin-off will achieve the following
objectives and benefits for the Group and the CKH Holdings Group and their respective shareholders
(as the case may be) as a whole:
(a)
Shareholder value creation through the elimination of the holding company discount of
Cheung Kong’s stake in Hutchison
The Merger Proposal and the Spin-off should immediately realise value for shareholders through
the elimination of the CKH Holdings holding company discount associated with the existing tiered
shareholding structure as no Hutchison Shares will be held indirectly. Based on the closing price of the
Cheung Kong shares on the Stock Exchange on 7 January 2015 (which was prior to the publication of
the Announcement on 9 January 2015), Cheung Kong shares were trading at a 23.0% and 26.0%
discount to, or HK$87 billion or HK$102 billion less than, Cheung Kong’s book equity value
attributable to shareholders (being the shareholders’ funds in the consolidated financial statements of
Cheung Kong) as at 30 June 2014 and 31 December 2014 respectively (based on the unaudited
consolidated financial statements of Cheung Kong for the six months ended 30 June 2014 and the
audited consolidated financial statements of Cheung Kong for the year ended 31 December 2014),
which included its approximately 49.97% stake in Hutchison. A part of this was attributable to the
holding company discount on the CKH Holdings Group’s stake in Hutchison, which would be
eliminated through the Merger Proposal and the Spin-off as shareholders will hold shares in CKH
Holdings and the Company directly.
Since the exchange ratios for each of the Hutchison Proposal and the Husky Share Exchange have
been determined by reference to the average closing prices of the shares of Cheung Kong and
Hutchison for the five trading days up to (and including) 7 January 2015 and the average closing price
of the Husky Shares for the five trading days up to (and including) 6 January 2015 with no premium or
discount involved, all CKH Holdings Shareholders and Hutchison Shareholders will be able to benefit
from the continuing growth of the distinct businesses of CKH Holdings and the Company.
(b)
Greater transparency and business coherence
Following completion of the Merger Proposal and the Spin-off, the business profiles of CKH
Holdings and the Company will be very clearly delineated. As a result, shareholders and potential
investors will be better able to differentiate and value the businesses of the CKH Holdings Group and
the Group based on their respective earnings, cash flow and net asset value profiles. The increased
transparency and greater coherence in the grouping of the existing businesses of the CKH Holdings
Group and the Hutchison Group under the new structure is expected to enhance value, in particular
given the differences between the valuation methodologies investors would normally apply to the
property business of the Company and the diversified portfolio of infrastructure and consumer
businesses of CKH Holdings.
The Merger Proposal and the Spin-off will align the businesses of each of CKH Holdings and the
Company with their respective investor bases and eliminate the investment arbitrage that originates
from valuation mismatch between CKH Holdings and Hutchison.
The Merger Proposal and the Spin-off will permit each of CKH Holdings and the Company to
focus its strategic plans and growth opportunities independently and will allow the management of each
of CKH Holdings and the Company to focus independently on the specific and distinct business
– 24 –
THE DISTRIBUTION IN SPECIE AND THE SPIN-OFF
characteristics of the Combined Property Businesses and the Combined Non-Property Businesses,
respectively. The Merger Proposal and the Spin-off will also provide each of CKH Holdings and the
Company greater flexibility in investing capital in a manner appropriate for its business strategy and
facilitate a more company-specific allocation of capital, including increased strategic flexibility to make
future acquisitions. Finally, the separation of the businesses of each of CKH Holdings and the Company
through the Merger Proposal and the Spin-off will permit each of CKH Holdings and the Company to
reduce its exposure to unrelated risk and provide cost savings for each of CKH Holdings and the
Company.
(c)
Removal of the layered holding structure between CKH Holdings and Hutchison allowing
shareholders to directly invest in two separate listed vehicles alongside the Trust
As at the Latest Practicable Date, the Trust was the controlling shareholder of CKH Holdings,
which in turn owned approximately 49.97% of Hutchison. Following completion of the Merger Proposal
and the Spin-off, the Trust, together with Mr. Li Ka-shing and Mr. Li Tzar Kuoi, Victor, will directly
and/or indirectly hold approximately 30.15% of the shares of each of CKH Holdings and the Company,
and the Li family will continue to chair and lead the management of both companies.
(d)
All eligible shareholders to hold CKH Holdings Shares and the Shares directly, enhancing
investment flexibility and efficiencies
Upon completion of the Merger Proposal and the Spin-off, all Qualifying CKH Holdings
Shareholders and Hutchison Scheme Shareholders will hold CKH Holdings Shares and Shares directly.
This will provide all shareholders with the choice to adjust their shareholdings in CKH Holdings and/or
the Company according to their individual investment objectives and preferences.
(e)
Enhanced size and scale
Following completion of the Merger Proposal and the Spin-off, the CKH Holdings Group will be
a multinational conglomerate of significant size and scale, operating in over 50 countries. Infrastructure
assets currently owned by the CKH Holdings Group, which contributed HK$1.8 billion to the profit
before tax in the financial year of 2014 for the Cheung Kong Group, will be combined with the
infrastructure assets currently owned by the Hutchison Group in the consolidated accounts of the CKH
Holdings Group, and there will be an increased interest in the energy sector through CKH Holdings
becoming the largest shareholder in Husky. In addition, the portfolio of the CKH Holdings Group will
include the Hutchison Group’s existing operations in the ports and related services, retail and
telecommunications. The CKH Holdings Group’s newly acquired business of ownership and leasing of
movable assets will further diversify the CKH Holdings Group’s business mix.
Upon Listing, the Group will be one of the largest property developers listed in Hong Kong with
a leading market share in Hong Kong, strong penetration in the PRC and an international presence
through its operations in Singapore and the United Kingdom. As at 31 December 2014, the Combined
Property Businesses (which will be held by the Group pursuant to the Property Businesses
Combination) had a total attributable interest in approximately 1.6 million sq.m. of rental properties, a
development land bank of approximately 15.8 million sq.m. (of which approximately 14.5 million sq.m.
are located in the PRC) and more than 14,600 hotel rooms and also managed approximately 21 million
sq.m. of properties in Hong Kong and the PRC. As at 28 February 2015, the Group’s diverse portfolio
of development properties, investment properties and hotels and serviced suites that was valued by the
Property Valuers (as set out in “Appendix III – Property Valuation”) had a total value of approximately
HK$420.1 billion.
– 25 –
THE DISTRIBUTION IN SPECIE AND THE SPIN-OFF
APPLICATION FOR LISTING ON THE STOCK EXCHANGE
The Company has made an application to the Stock Exchange for the listing of, and permission to
deal in, the Shares in issue immediately following completion of the Spin-off. No part of the share or
loan capital of the Company is listed on or dealt in on any other stock exchange. At present, the
Company is not seeking or proposing to seek such listing of, or permission to deal in, the share or loan
capital of the Company on any other stock exchange.
NO CHANGE IN BUSINESS
No change in the business of the Company immediately following completion of the Spin-off is
contemplated.
HONG KONG REGISTER AND STAMP DUTY
The Company’s Hong Kong branch register of members is maintained by the Hong Kong Share
Registrar in Hong Kong. Dealings in the Shares on the Stock Exchange will be registered on the
Company’s Hong Kong branch register of members maintained in Hong Kong.
Unless the Company determines otherwise, dividends payable in Hong Kong dollars in respect of
the Shares will be paid to the Shareholders listed on the Company’s register of members, by way of
cheque sent by ordinary post, at the Shareholder’s risk, to the registered address of each Shareholder.
Dealings in the Shares on the Company’s Hong Kong branch register of members maintained in
Hong Kong will be subject to Hong Kong stamp duty.
SHARES WILL BE ELIGIBLE FOR ADMISSION INTO CCASS
Subject to the granting of listing of, and permission to deal in, the Shares on the Stock Exchange
and the Company’s compliance with the stock admission requirements of HKSCC, the Shares will be
accepted as eligible securities by HKSCC for deposit, clearance and settlement in CCASS with effect
from the date of commencement of dealings in the Shares on the Stock Exchange or any other date as
determined by HKSCC.
Settlement of transactions between participants of the Stock Exchange is required to take place in
CCASS on the second business day after any trading day. All activities under CCASS are subject to the
General Rules of CCASS and CCASS Operational Procedures in effect from time to time. All necessary
arrangements have been made for the Shares to be admitted into CCASS.
PROFESSIONAL TAX ADVICE RECOMMENDED
You should consult your professional advisers if you are in any doubt as to the tax implications of
receiving, purchasing, holding, disposing of and dealing in the Shares. None of the Company or any of
the Relevant Persons accepts responsibility for any tax effects or liabilities resulting from the receipt
of, purchase, holding or disposing of, or dealing in, the Shares or your exercise of any rights attaching
to the Shares.
– 26 –
THE DISTRIBUTION IN SPECIE AND THE SPIN-OFF
COMMENCEMENT OF DEALINGS IN THE SHARES
Dealings in the Shares on the Stock Exchange are expected to commence on Wednesday, 3 June
2015. The Shares will be traded in board lots of 500 Shares each. The stock code of the Shares is 1113.
The Share certificates are expected to be despatched to Qualifying CKH Holdings Shareholders on
Tuesday, 2 June 2015 and will only become valid if the Distribution In Specie becomes unconditional.
If the Distribution In Specie does not become unconditional, dealings in the Shares on the Stock
Exchange will not commence on Wednesday, 3 June 2015.
In respect of the Shares which the Qualifying CKH Holdings Shareholders are entitled to receive,
each Qualifying CKH Holdings Shareholder will be sent (a) one Share certificate representing Shares
that are a whole multiple of a board lot of 500 Shares and (b) (if applicable) one Share certificate for
the remaining Shares which represent less than a whole multiple of 500 Shares (i.e. an odd lot of
Shares), except for HKSCC Nominees Limited which may request for Share certificates to be issued in
such denominations as it may specify.
ARRANGEMENTS RELATING TO THE SALE OF ODD LOTS OF THE SHARES
In order to assist Shareholders to sell their odd lots of Shares received under the Distribution In
Specie if they so wish, the Company has appointed Fulbright Securities Limited and One China
Securities Limited (the “Odd Lot Traders”) to provide, on a best efforts basis, a service to match the
sale and purchase of odd lots of Shares (the “Matching Service”) during the period of 60 days
commencing from (and including) the Listing Date (which is expected to be Wednesday, 3 June 2015)
(the “Matching Period”).
In the event of successful matching, no brokerage will be charged by the Odd Lot Traders for the
odd lots of Shares sold as the Company has agreed to absorb this cost as part of the appointment of the
Odd Lot Traders. The opening of trading accounts with the Odd Lot Traders for the purpose of the
Matching Service is subject to satisfactory completion of requisite account opening procedures.
Any Shareholder wishing to make use of the Matching Service may contact the following persons
during the Matching Period:
One China Securities Limited
2/F, Cheong K. Building
86 Des Voeux Road Central
Hong Kong
Attention: Marco KO
Frankie MAK
Telephone: +852 3188 9878
+852 3188 4321
Fulbright Securities Limited
33rd Floor, Cosco Tower
Grand Millennium Plaza
No. 183 Queen’s Road Central
Hong Kong
Attention: CHAN Yui Kie
SAN Uel Sammy
Telephone: +852 2805 0727
Shareholders who have brokerage accounts and who wish to sell their odd lots of Shares received
under the Distribution In Specie may also approach and inform their brokers that the Odd Lot Traders
will, on a best efforts basis during the Matching Period, provide liquidity for odd lots of Shares.
Shareholders selling odd lots of Shares through their brokers to the Odd Lot Traders will be responsible
for all fees (if any) payable to their brokers, but no additional brokerage will be payable by them to the
Odd Lot Traders.
– 27 –
THE DISTRIBUTION IN SPECIE AND THE SPIN-OFF
Holders of Shares received under the Distribution In Specie should note that the successful
matching of odd lots of Shares and the provision of liquidity referred to above is not guaranteed.
Shareholders are advised to consult their own professional advisers if they are in doubt about any of
these arrangements.
– 28 –
RESPONSIBILITY STATEMENT
DIRECTORS’ RESPONSIBILITY FOR THE CONTENTS OF THIS LISTING DOCUMENT
This listing document, for which the Directors collectively and individually accept full
responsibility, includes particulars given in compliance with the Securities and Futures (Stock Market
Listing) Rules (Chapter 571V of the Laws of Hong Kong) and the Listing Rules for the purpose of
giving information to the public with regard to the Group.
The Directors, having made all reasonable enquiries, confirm that to the best of their knowledge
and belief the information contained in this listing document is accurate and complete in all material
respects and not misleading or deceptive, and there are no other matters the omission of which would
make any statement in this listing document misleading.
RESTRICTIONS ON THE USE OF THIS LISTING DOCUMENT
This listing document is published solely in connection with the Spin-off. It may not be used for
any other purpose and, in particular, no person is authorised to use or reproduce this listing document
or any part thereof in connection with any offering of Shares or other securities of the Company.
Accordingly, this listing document does not constitute an offer or invitation in any jurisdiction to
acquire, subscribe for or purchase any of the Shares or other securities of the Company nor is it
calculated to invite any offer or invitation for any of the Shares or other securities of the Company.
Neither the delivery of this listing document nor the allotment and issue of Shares pursuant to the
Distribution In Specie should, under any circumstances, constitute a representation that there has been
no change or development reasonably likely to involve a change in our affairs since the date of this
listing document or imply that the information contained in this listing document is correct as at any
date subsequent to the date of this listing document.
– 29 –
FORWARD-LOOKING STATEMENTS
This listing document contains forward-looking statements and opinions. All statements other than
statements of historical facts contained in this listing document, including, without limitation, (a) the
discussions of our business strategies, objectives and expectations regarding our future operations,
margins, profitability, liquidity and capital resources, (b) the future development of, and trends and
conditions in, the property industry and the general economy of the countries in which we operate or
plan to operate, (c) our ability to control costs, (d) the nature of, and potential for, the future
development of our business, (e) the estimated date of completion of our projects set out in “Business –
Development Properties – Key Information of the Principal Development Properties” and (f) any
statements preceded by, followed by or that include words and expressions such as “expect”, “believe”,
“plan”, “intend”, “aim”, “estimate”, “forecast”, “project”, “anticipate”, “seek”, “may”, “will”, “ought
to”, “would”, “should” and “could” or similar words or statements, as they relate to the Group or our
management, are intended to identify forward-looking statements.
These statements are based on assumptions regarding our present and future business, our business
strategies and the environment in which we will operate. These forward-looking statements reflect our
current views as to future events and are not a guarantee of our future performance. Forward-looking
statements are subject to certain known and unknown risks, uncertainties and assumptions, including the
risk factors described in “Risk Factors”, which may cause our actual results, performance or
achievements to be materially different from any future results, performance or achievements expressed
or implied by these forward-looking statements.
Subject to the requirements of applicable laws, rules and regulations, we do not have any
obligation, and undertake no obligation, to update or otherwise revise the forward-looking statements in
this listing document, whether as a result of new information, future events or developments or
otherwise. As a result of these and other risks, uncertainties and assumptions, the forward-looking
events and circumstances discussed in this listing document might not occur in the way we expect or at
all. Accordingly, you should not place undue reliance on any forward-looking information. All
forward-looking statements contained in this listing document are qualified by reference to the
cautionary statements set out in this section.
In this listing document, statements of or references to our intentions or that of any of the
Directors are made as at the date of this listing document. Any of these intentions may change in light
of future developments.
– 30 –
RISK FACTORS
You should carefully consider all the information set out in this listing document and, in
particular, the risks and uncertainties described below before making an investment in the Shares.
The occurrence of any of the following events could materially and adversely affect us. If these
events occur, the trading price of the Shares could decline and you may lose all or part of your
investment.
RISKS RELATING TO OUR BUSINESS
We are principally dependent on the performance of the real estate markets in Hong Kong and
the PRC.
Most of our properties are located in Hong Kong and the PRC. Our business and prospects
therefore principally depend on the performance of the real estate markets in Hong Kong and the PRC,
in particular, Shanghai, Wuhan and Chengdu. Any adverse change in the demand for properties and any
measures that the relevant governments may take to restrict the growth of the property market, or
control the prices of properties or rental values in the places that we operate, particularly where we
have or plan to develop properties, may materially and adversely impact our business, financial
condition, results of operations and growth prospects.
The property markets in Hong Kong and the PRC are affected by many factors, including changes
in the social, political, economic and legal environment and changes in the government’s fiscal and
economic policies. We are also sensitive to changes in economic conditions, consumer confidence,
consumer spending and consumer preferences. Other factors beyond our control, such as levels of
personal disposable income, may also affect consumer confidence in our geographic markets and
demand for properties.
The Hong Kong and PRC property markets have experienced fluctuations in recent years in
response to government policies and trends in the Hong Kong, PRC and global economies. There have
been increasing concerns over the sustainability of the real estate market growth in Hong Kong and the
PRC due to the slowdown of the PRC economy and the normalisation of U.S. monetary policy, as well
as the general uncertainty of the global economy since the global financial crisis in 2008. In particular,
certain cities in the PRC have experienced a cooling-down period in recent months as a result of the
slowdown in the PRC economy and housing prices in certain cities may continue to decline. Any
slowdown in the Hong Kong, PRC and global economies or financial turmoil in the future may
materially and adversely affect the potential purchasers and tenants of our properties, which may lead
to a decrease in the general demand for our properties and a decrease in the selling prices or rents of
our properties.
The occurrence of any of the above may materially and adversely impact our business, financial
condition, results of operations and growth prospects.
– 31 –
RISK FACTORS
We may not always be able to obtain suitable land reserves at commercially reasonable cost and
successfully identify and acquire suitable land for development at a cost comparable to our
historical cost levels.
Our business is dependent upon our ability to identify and acquire suitable land at commercially
reasonable costs and our ability to generate profit from the sale and lease of properties developed on
such land. Therefore, we strive to maintain or replenish our land reserves at an appropriate pace, and
target those land parcels of suitable size and appropriate scope of usage for our requirements, and in
strategic locations, in order to position ourselves for sustainable growth in our business.
It may be difficult to obtain suitable land in Hong Kong, the PRC and other places where we
operate at commercially reasonable cost due to strong competition from other developers and the
limited amount of undeveloped land and land for redevelopment. Such development sites have generally
become increasingly scarce and the costs of acquiring such sites have increased in recent years. As a
result, our future growth prospects and results of operations may be materially and adversely affected if
we are not able to acquire a sufficient amount of suitable new land for development at reasonable cost
levels.
The land supply policies implemented by the governments in the places where we operate have a
direct impact on our ability to acquire land and our land acquisition costs. In particular, the Hong Kong
and the PRC governments control the land supply and regulate the means by which property developers
may obtain land for property development. These measures may further intensify the competition for
securing land and limit our ability to develop properties. Changes in government policies that reduce
the land supply or limit our ability to tender for land may materially and adversely affect us.
The occurrence of any of the above may materially and adversely impact our business, financial
condition, results of operations and growth prospects.
Our results of operations may be materially and adversely impacted by labour shortages and/or
the rising cost of construction materials and labour.
As a result of economic growth and infrastructure development in Hong Kong and the PRC,
prices for construction materials and wages for construction workers have increased in recent years.
Furthermore, with the overall improvement of living standards in Hong Kong and the PRC as well as
the PRC government’s recent policies which aim at increasing the wages of migrant workers, we expect
labour costs to continue to increase in the foreseeable future. In addition to the higher labour costs,
competition for construction workers has intensified during the last few years as the demand for labour
continued to increase in the places where we operate. For example, Hong Kong has been experiencing
an increasing shortage of construction workers and service workers, which may cause disruptions to our
property development business as we have been experiencing increasing difficulties in securing an
adequate supply of skilled labour for our property development projects and investment properties. In
addition, labour shortages in nearby regions such as Macau also further intensified the competition for
labour supply in the region, which may negatively impact our operations.
Increases in the costs of construction materials and labour will likely prompt our contractors to
increase their fee quotes for our new property development projects. Furthermore, as we typically
pre-sell our properties prior to their completion, we may not be able to pass the increased costs onto
the purchasers of our properties if costs of construction materials and labour increase subsequent to the
pre-sale.
– 32 –
RISK FACTORS
If the labour shortage continues to increase and/or if the costs of labour or construction materials
continue to increase significantly and we are unable to offset such increases by reducing other costs or
pass on such increases to the purchasers or tenants of our properties, our business, financial condition,
results of operations and growth prospects may be materially and adversely impacted.
We rely on third party contractors for the construction of our property developments and other
services and we cannot assure you that third party contractors will always meet our quality
standards and provide services in a timely manner.
We rely on third party construction companies for construction of buildings for our property
development projects. We also engage third party contractors to carry out various works, including, but
not limited to, design, structural engineering, internal decoration, landscaping, and electrical and
mechanical engineering. We generally select third party contractors through competitive bids and
evaluate them based on factors including their competence, market reputation and our prior relationship
with them, if any. Completion of our projects is subject to the satisfactory performance by these third
party contractors of their contractual obligations, including their adherence to our quality and safety
standards and the pre-agreed schedule for completion. We also strictly monitor the progress and quality
of the contractors. However, we cannot assure you that the services provided by any of these third
party contractors will be satisfactory or meet our requirements for quality and safety, or that their
services will be completed on time. If the performance of any third party contractor proves
unsatisfactory, or if any of them is in breach of its contractual obligations due to its financial
difficulties or other reasons, we may need to replace such contractor or take other actions to remedy the
situation, which could materially and adversely impact our costs and the progress of construction of our
projects.
As we may expand our business into other geographic locations, there may be a shortage of third
party contractors that meet our standards and, as a result, we may not be able to engage a sufficient
number of high quality contractors in a timely manner. If the performance of any of these independent
contractors or third parties is not satisfactory to our customers, our reputation may be adversely
affected. In addition, we may be unable to offset an increase in the costs of labour or pass such costs
on to the purchasers or tenants of our properties. Furthermore, any serious dispute with these third
party contractors which we are unable to resolve could result in costly legal proceedings.
The occurrence of any of the above may materially and adversely impact our business, financial
condition, results of operations and growth prospects.
We generate a significant portion of our turnover from the sale of properties, which depends on a
number of factors, including the schedule of our property development and the timing of property
sales.
For the years ended 31 December 2012, 2013 and 2014, approximately 61.6%, 46.0% and 76.9%,
respectively, of the Cheung Kong Property Group’s turnover and its share of property sales of joint
ventures was derived from Hong Kong, and 38.4%, 50.9% and 19.2%, respectively, of the Cheung
Kong Property Group’s turnover and its share of property sales of joint ventures was derived from the
PRC. For the same period, approximately 33.3%, 28.9% and 47.0% of the Hutchison Property Group’s
turnover and its share of property sales of joint ventures was derived from Hong Kong, and 65.4%,
65.6% and 42.1%, respectively, of the Hutchison Property Group’s revenue and its share of property
sales of joint ventures was derived from the PRC.
– 33 –
RISK FACTORS
Our results of operations may fluctuate due to factors such as the schedule of our property
development and the timing of our property sales. Turnover from property sales is recognised either on
the date of sale or on the date of issue of the relevant occupation or completion permit, whichever is
later, and the economic benefit accrues to the Cheung Kong Property Group or the Hutchison Property
Group and the significant risks and rewards of the properties accrue to the purchasers. Our revenue and
results of operation may vary significantly from period to period depending on the number of properties
completed during a specific period, which in turn depends on the capital requirements and the lead time
required for completion of the construction projects. Furthermore, the timing of property sales is
dependent on when we are able to obtain the requisite governmental approvals, and the time required
for the approval process is beyond our control.
Fluctuations in our operating results may also be caused by other factors, such as changes in
market demand for our properties. In addition, the cyclical property market affects the optimal timing
for the acquisition of land, the planning of development and the sales of properties. As our results of
operations relating to property development activities may be susceptible to significant fluctuations, our
period-to-period comparisons of results of operations and cash flow positions should not be taken as
meaningful measures of our financial performance for any specific period.
We may be unable to obtain, or may suffer material delays in obtaining, the relevant government
approvals or be unable to take possession of the land parcels for our property development
projects.
The real estate industries in Hong Kong and the PRC are regulated by the respective governments.
In general, property developers must comply with various requirements mandated by applicable laws
and regulations, including the policies and procedures established by the local authorities to implement
such laws and regulations. Specifically, in order to conduct property development activities, property
developers in Hong Kong and the PRC must obtain the relevant permits, licences, certificates and other
approvals at various stages of the property development process. The grant of such permits, licences,
certificates and other approvals is dependent on meeting certain conditions set by the authorities, which
are often subject to the discretion of the relevant government authorities and to changes in new laws,
regulations and policies, especially those with respect to the real estate industry.
Hong Kong
In Hong Kong, land is obtained from the government and is usually subject to various covenants
in the conditions of grant and in the government leases, including land use and development
restrictions. In addition, the Hong Kong government imposes restrictions on when development
properties can be pre-sold prior to their completion. In recent years, our experience has been that it has
taken a longer period of time to obtain approval to commence pre-sales of our development properties.
As we typically pre-sell a significant portion of our development properties prior to their completion,
such restrictions and the timing of obtaining approvals for pre-sales may affect our liquidity, restrict our
cash flow position and limit our ability to generate sufficient funding for our operations.
PRC
In the PRC, in addition to obtaining the required permits, licences, certificates and other
approvals, property developers must also develop the land according to the terms of the land grant
contract, including those relating to the payment of fees, the designated uses of land and the time for
– 34 –
RISK FACTORS
commencement and completion of development of the land. Any violation of the terms of the land grant
contract may result in the relevant authorities issuing a warning to the developer, imposing a fine on
the developer and/or forfeiting the land use rights.
In relation to the Group’s PRC land interests as at the Latest Practicable Date, there were five
instances where we could not take possession of the land parcels. The reasons for our inability to take
possession of the land parcels included that the land parcels for development had not been cleared in
time for handing over to the Group and also that certain conditions that had to be satisfied by others
before the land could be developed had not been fulfilled. The relevant land parcels occupied a total
site area of approximately 4.4 million sq.m.. This inability may in turn delay our development
schedules with respect to these development sites.
We cannot assure you that we will not encounter problems in obtaining the necessary government
approvals, in fulfilling the conditions required for obtaining the relevant approvals or in taking
possession of the land parcels for our property development projects, or that we will be able to fulfil
the obligations under the land grant contracts in the future including the time for commencement and
completion of development or that we will be able to comply with new laws, regulations or policies
that may come into effect from time to time with respect to the real estate industry in general or the
particular processes with respect to the granting of the relevant approvals. If we are unable to obtain
the relevant approvals or to fulfil the conditions of those approvals or take possession of the land
parcels for our property development projects, these projects may not proceed on schedule or at all.
The occurrence of any of the above may materially and adversely impact our business, financial
condition, results of operations and growth prospects.
Our turnover and profit levels are affected by our turnover mix and other factors and we may not
be able to sustain our existing level of turnover or profit.
The Cheung Kong Property Group recorded turnover of approximately HK$19,192 million,
HK$17,011 million and HK$24,038 million, respectively, for the years ended 31 December 2012, 2013
and 2014 and recorded profit for the year of approximately HK$17,063 million, HK$14,424 million and
HK$17,316 million during the same periods. The Hutchison Property Group recorded turnover of
approximately HK$6,237 million, HK$6,676 million and HK$6,901 million, respectively, for the years
ended 31 December 2012, 2013 and 2014 and recorded profit for the year of HK$8,478 million,
HK$9,392 million and HK$35,959 million during the same periods. Factors which may reduce our
turnover and profit include:
쐌
changes in the mix of our turnover sources, such as income from the sale of our property
development, rental income from our investment properties and income from our hotels;
쐌
increased market competition;
쐌
measures implemented by the government that may dampen consumer sentiment;
쐌
inability to achieve target sales volumes and selling prices;
쐌
inability to achieve target rental rates, daily room rates and occupancy rates;
쐌
a decrease in the fair value of our investment properties;
– 35 –
RISK FACTORS
쐌
our costs may not decrease in tandem with a reduction in turnover at our properties, as many
of the expenses associated with owning and maintaining our properties are fairly fixed and
inflexible and which include land costs, development costs, administrative expenses and
selling and marketing expenses; and
쐌
inability to negotiate volume discounts with suppliers on favourable terms.
We cannot assure you that we can maintain or increase our turnover or profit. We may not be able
to sustain similar patterns or levels of turnover or profit in the future. The occurrence of any of the
above may materially and adversely impact our business, financial condition, results of operations and
growth prospects.
We may not be able to complete or deliver our property development projects on time, on budget,
or at all.
The progress and costs of a development project can be adversely affected by many factors,
including:
쐌
changes in market conditions, economic downturns and decreases in business and consumer
sentiment in general;
쐌
delays in obtaining the necessary licences, permits or approvals from governments;
쐌
delays in obtaining the necessary financing;
쐌
changes in the timing of or results of property pre-sales;
쐌
changes in government policies or relevant laws or regulations on a national and/or local
level, including but not limited to, policies relating to the reclamation of land for urban
development;
쐌
relocation of existing residents and/or demolition of existing buildings;
쐌
shortages of materials, equipment, contractors and labour;
쐌
labour disputes;
쐌
an ageing workforce and a mismatch in skills of the workforce;
쐌
construction accidents;
쐌
natural catastrophes and adverse weather conditions;
쐌
geological conditions at our property development sites;
쐌
structural issues, whether natural or man-made, in the foundation of our properties or in the
areas surrounding our properties;
쐌
the involvement of non-government organisations or other parties against a property
development project for environmental or other reasons; and
– 36 –
RISK FACTORS
쐌
other unforeseen problems and circumstances.
Construction delays or the inability to complete the construction of a project according to our
planned specifications, schedule or budget as a result of the above factors may affect our results of
operations and financial position and may also adversely affect our customers’ satisfaction. We cannot
assure you that we will not experience any significant delays in the completion or delivery of our
projects, or that we will not be subject to any liabilities to our customers, tenants or relevant
governmental authorities for any such delays. With respect to pre-sold properties, delays in the
completion and delivery of these properties beyond the contractual time limits may result in adverse
contractual and other legal consequences, including interest or other payments being payable by us and
the right of purchasers to rescind the relevant purchase contracts. Liabilities arising from any delays in
the completion or delivery of our projects may materially and adversely impact our business, financial
condition, results of operations and growth prospects. See “Business − Development Properties” for
further information relating to our property development projects.
The historical financial statements of the Cheung Kong Property Group and the Hutchison
Property Group may not be a reliable indicator of the future performance or indebtedness
position of the Group following completion of the Property Businesses Combination.
Immediately following completion of the Property Businesses Combination, the Group will hold
the property businesses of the Cheung Kong Property Group and the Hutchison Property Group.
Historically, the Cheung Kong Property Group and the Hutchison Property Group have been managed
and operated largely independently of each other. Many of their development projects in the PRC were
conducted through joint ventures that were not consolidated in either company’s financial statements. In
particular, the Cheung Kong Property Group and the Hutchison Property Group historically did not
consolidate their joint ventures’ turnovers as their respective turnovers under the relevant IFRS
accounting rules and profits contributed by their joint ventures were historically recorded as share of
their respective profits from joint ventures. Immediately following completion of the Property
Businesses Combination, a substantial portion of the joint ventures between the Cheung Kong Property
Group and the Hutchison Property Group will become subsidiaries of the Company and be consolidated
into the financial statements of the Group. As a result, the historical financial statements of the Cheung
Kong Property Group and the Hutchison Property Group are not directly comparable to the future
financial statements of the Group immediately following completion of the Property Businesses
Combination, which will contain the results of operations, financial position and cash flows of the
Combined Property Businesses and the joint ventures that will become subsidiaries of the Company as
prepared and presented on a consolidated basis. See “Financial Information – Significant Factors
Affecting Comparability of Our Results of Operations”.
Our indebtedness could have an adverse effect on our financial condition, diminish our ability to
raise additional capital to fund our operations and limit our ability to explore business
opportunities.
We maintain a certain level of indebtedness to finance our operations. As at 31 March 2015, the
Group had indebtedness amounting to approximately HK$139,782 million. Our indebtedness could have
an adverse effect on us, for example by:
쐌
requiring us to maintain certain financial ratios;
– 37 –
RISK FACTORS
쐌
requiring us to dedicate a large portion of our cash flow from operations to fund interest
payments and repayments of our debt, thereby reducing the availability of our cash flow to
expand our business;
쐌
increasing our vulnerability to adverse general economic or industry conditions;
쐌
limiting our flexibility in planning for or reacting to changes in our business or the industry
in which we operate;
쐌
limiting our ability to raise additional debt or equity capital in the future or increasing the
cost of such funding;
쐌
restricting us from making strategic acquisitions or taking advantage of business
opportunities; and
쐌
making it more difficult for us to satisfy our obligations with respect to our debt.
See “Financial Information − Indebtedness – Loan Facilities” for more details. In the future, we
may from time to time incur substantial additional indebtedness, which could intensify the risks that we
face as a result of our indebtedness.
Our ability to generate sufficient cash to satisfy our outstanding and future debt obligations will
depend upon our future operating performance, which will be affected by, among other things,
prevailing economic conditions, governmental regulations, the demand for properties in the places we
operate and other factors, many of which are beyond our control. We may not generate sufficient cash
flow to pay our anticipated operating expenses and to service our debts, in which case we will be
forced to adopt an alternative strategy that may include actions such as reducing or delaying capital
expenditures, disposing of our assets, restructuring or refinancing our indebtedness or seeking equity
capital. These strategies may not be implemented on satisfactory terms, or at all, and, even when
implemented, may result in an adverse effect on our business, financial condition and results of
operations.
Furthermore, our inability to meet payment obligations or to comply with affirmative covenants or
required financial ratios or the violation of any restrictive covenants may constitute an event of default
under the terms of our borrowings. If an event of default occurs, our lenders would be entitled to
accelerate payment of all or any part of our outstanding indebtedness.
The occurrence of any of these events of default would materially and adversely impact our
business, financial condition, results of operations and growth prospects.
Our profit and results of operations are subject to changes in interest rates.
Changes in interest rates have affected and will continue to affect our financing costs and,
ultimately, our results of operations. Interest expense (including capitalised interest expense) on the
Cheung Kong Property Group’s borrowings incurred in the financial years ended 31 December 2012,
2013 and 2014 were HK$1,138 million, HK$1,309 million and HK$1,245 million, respectively. Interest
expense (including capitalised interest expense) on the Hutchison Property Group’s borrowings incurred
during the same periods were HK$1,111 million, HK$1,116 million and HK$1,235 million, respectively.
Immediately following completion of the Property Businesses Combination, the Group will also
– 38 –
RISK FACTORS
consolidate into its balance sheet the loans of the joint ventures that will become its subsidiaries
following the Property Businesses Combination. The Group’s finance costs and interest expense will
fluctuate with changes in interest rates.
Hong Kong
Our borrowings include amounts denominated in Hong Kong dollars. The interest rates on some
of our outstanding Hong Kong dollar denominated borrowings are benchmarked to the Hong Kong
interbank offered rates (“HIBOR”) for Hong Kong dollars. We cannot assure you that the benchmark
interest rate will not increase in the future, which would increase our financing costs and interest
expense.
PRC
Our borrowings also include amounts denominated in RMB. The PBOC has from time to time
adjusted its benchmark lending rates to respond to changes in the PRC and global economy. On 22
November 2014, the PBOC published and set the benchmark one-year bank lending rate at 5.6%. On 28
February 2015, the PBOC announced that effective on 1 March 2015, the benchmark one-year bank
lending rate would be reduced to 5.35%. However, we cannot assure you that PBOC will not raise
lending rates in the future.
As we also borrow from overseas banks and other financial institutions, changes in the prevailing
interest rates in the global credit markets for the currencies we borrow may also affect us.
Any increase in the interest rates we pay on the currencies we borrow will increase our financing
costs and the mortgage rates of our customers and may materially and adversely impact our business,
financial condition, results of operations and growth prospects.
We may face significant risks before realising any benefits from property development.
One of our primary businesses is the development of properties for sale and investment. Property
development typically requires substantial capital outlay during the land acquisition and construction
phases and it may take a number of years before positive cash flows can be generated from a
development. Depending on the size of the development, developing a property usually takes a number
of years. Consequently, changes in the business environment during the course of the development may
affect the revenue and cost of the development, as well as disrupt the scheduled timing of property
sales, which in turn may affect the profitability of the project. Revenue generated by, and the value of,
a property development may be adversely affected by a number of factors, including, but not limited to,
international, regional and local economic environments, local property conditions, perceptions of
purchasers and tenants as to the convenience and attractiveness of the projects, competition from other
properties with respect to their selling prices for comparable properties and market rates for comparable
leases. Factors that may affect the profitability of a project include the risk that the receipt of
government approvals may take longer than expected, the inability to complete construction according
to original specifications, schedule or budget, poor leasing markets for the properties and increased
construction costs.
If any of the property development risks described above materialises, our returns on investments
may be lower than originally expected, which may in turn result in a material and adverse impact on
our business, financial condition, results of operations and growth prospects.
– 39 –
RISK FACTORS
We may be subject to fines or sanctions if we do not pay land premiums or do not develop
properties according to the terms of the land grant documents.
We are limited by the Hong Kong and PRC governments with respect to certain aspects of the
development of our properties, and we must comply with the relevant regulations or be subject to the
risk of penalties.
Hong Kong
In Hong Kong, land grants obtained from the government usually include a provision which
stipulates by when the land needs to be developed (the “Building Covenant Period”). If we do not
complete the development before the expiry of the Building Covenant Period, there are provisions for
re-entry by the government, unless the government grants an extension of the Building Covenant
Period, in which case a payment is usually required to be made to the government for the extension.
PRC
Under PRC laws and regulations relating to idle land, if a developer fails to develop land
according to the terms of the land grant contract (including but not limited to, the payment of fees, the
designated uses of land and the time for commencement and completion of development of the land),
the relevant authorities may issue a warning to or impose a fine on the developer or require the
developer to forfeit the land use rights. Any violation of the terms of the land grant contract may also
restrict a developer’s ability to participate, or prevent it from participating, in future land bidding.
Specifically, under current PRC laws and regulations:
쐌
If we do not pay the required land grant premium by the stipulated deadline, we may be
subject to confiscation of the deposit, late payment penalties or the repossession of the land
by the government.
쐌
If we do not commence development within one year from the commencement date
stipulated in the land grant contract, the relevant PRC land bureau may serve a warning
notice on us and impose an idle land fee on the land of up to 20% of the land grant
premium, unless the delay in development is caused by government reasons or a force
majeure event.
쐌
If we do not commence development within two years from the commencement date
stipulated in the land grant contract, the land use rights are subject to forfeiture to the PRC
government unless the delay in development is caused by government reasons or force
majeure.
In addition to the above, the land grant contracts also contain provisions that stipulate, among
other things, the time frame for developing the land, the area to be developed and the total capital
expenditure on the land development. If we do not complete the development according to the
completion date stipulated in the land grant contract, we may be subject to a fine or land use rights
forfeiture to the PRC government unless otherwise stipulated in the land grant contract. Even if we
commence development of the land in accordance with the land grant contract, if the developed land
area is less than one-third of the total land area, or if the total capital expenditure on land development
is less than one-fourth of the total amount expected to be invested in the project, and the development
of the land is suspended for over one year without government approval, the land will still be treated as
idle land.
– 40 –
RISK FACTORS
Furthermore, there are specific requirements regarding idle land and other aspects of land use
rights grant contracts in many cities in the PRC, and the local authorities are expected to enforce such
rules in accordance with instructions from the central government of the PRC. Where a holder of the
right to use a plot of State-owned land for construction contracts engages in malicious hoarding or
speculation of the land, current measures in place require the competent land authorities, among other
things, not to accept any application for new land use rights or process any title transfer transaction,
mortgage transaction, lease transaction or land registration application in respect of any idle land before
such holder completes the required rectification procedures.
In relation to our PRC land interests as at the Latest Practicable Date, five development sites
(with total site area of approximately 1.6 million sq.m.) had experienced delays in commencement of
construction under the land grant contracts largely due to government reasons (including but not limited
to changes to site planning and land delivery schedules). In relation to our PRC land interests as at the
Latest Practicable Date, three development sites with total site area of approximately 1.2 million sq.m.
had experienced delays in completion of development under the land grant contracts largely due to
government reasons and the impact of third party activities. See “Business – Legal and Regulatory
Proceedings and Compliance Matters – PRC Property-Related Matters” for further information on our
PRC land-related issues, including the advice of our PRC counsels.
We cannot assure you that circumstances leading to the repossession of land or delays in the
completion of a property development will not arise. If our land is repossessed, we will not be able to
continue our property development on the forfeited land, recover the costs incurred for the initial
acquisition of the repossessed land or recover development costs and other costs incurred up to the date
of the repossession. Furthermore, we cannot assure you that regulations relating to idle land or other
aspects of land use rights will not become more restrictive or punitive in the future. If we do not
comply with the terms of any land use rights grant contract as a result of delays in project
development, or as a result of other factors, we may lose the opportunity to develop the project, as well
as our past investments in the land, which may materially and adversely impact our business, financial
condition, results of operations and growth prospects.
The appraised value of our properties may be different from the actual realisable value and is
subject to change.
The appraised values of our properties as contained in “Appendix III – Property Valuation” are
based on assumptions that include elements of subjectivity and uncertainty and may be subject to
substantial fluctuations. Some of the key assumptions include:
쐌
we will complete development projects on time;
쐌
we have obtained or will obtain on a timely basis all approvals from regulators necessary for
the development of the projects; and
쐌
we have paid all the land grant premiums and obtained all land use rights certificates and
transferable land use rights without any payment obligation of additional land grant
premium.
– 41 –
RISK FACTORS
In addition, the appraised value of our investment properties is based on key assumptions
including their market position, levels of yield, rent and/or price. See “Financial Information – Critical
Accounting Policies and Estimates – Investment Properties Valuation”. Even though our property
valuers adopted valuation methodologies used in valuing similar types of properties when preparing the
property valuation reports, the assumptions adopted may prove to be incorrect.
As a result, the appraised values of our properties may differ materially from the price we could
receive in an actual sale of the properties in the market and should not be taken as their actual
realisable value or an estimation of their realisable value. For example, the Hong Kong property market
is at or near historic peaks and has in the past been highly volatile and suffered significant falls in
prices. Unforeseeable changes in the development of property development projects, as well as national
and local economic conditions, may affect the value of our properties. In particular, the valuation of our
investment properties could stagnate or even decrease if the market for comparable properties in the
places where we operate experiences a downturn as a result of government austerity measures with
respect to the property sector, any deterioration in the macroeconomic environment or for other reasons.
The occurrence of any of the above may materially and adversely impact our business, financial
condition, results of operations or growth prospects.
Gains or losses arising from changes in the fair value of our investment properties are likely to
fluctuate from time to time, and gains may decrease significantly and losses may rise significantly
in the future.
We are required to reassess the fair value of our investment properties at every balance sheet date
for which we issue financial statements. Under IFRS, gains or losses arising from changes in the fair
value of our investment properties are included in our income statement for the period in which they
arise. Our investment properties were revalued by independent property valuers as at 31 December
2012, 2013 and 2014 on an open-market-and-existing-use basis, which reflected market conditions on
the respective dates. The Property Valuers also valued our investment properties as at 28 February
2015, which was conducted for the purpose of the valuation reports as set out in “Appendix III –
Property Valuation”. Based on the valuations provided by our independent property valuer, we
recognised the aggregate fair market value of our investment properties and relevant deferred tax on our
consolidated balance sheet and increases in fair value of investment properties and movements of the
relevant deferred tax on our consolidated income statement. For the years ended 31 December 2012,
2013 and 2014, fair value gains of the Cheung Kong Property Group’s investment properties amounted
to HK$4,470 million, HK$1,782 million and HK$4,542 million, respectively, and accounted for
approximately 24.4%, 11.2% and 24.0%, respectively, of its profit before taxation. For the same
periods, fair value gains of the Hutchison Property Group’s investment properties amounted to HK$859
million, HK$17 million and HK$28,088 million, respectively, and accounted for approximately 9.6%,
0.2% and 76.2%, respectively, of its profit before taxation. In particular, the significant increase in the
fair value gain of the Hutchison Property Group’s investment properties from 2013 to 2014 was due to
high global liquidity and easing of investor concerns over a potential increase in interest rates that led
to a boost in overall investor confidence and sentiment and accordingly a change in the assumptions
(including a lower weighted average capitalisation ratio) used to value the investment properties as a
result of a change in the market conditions.
Fair value gains or losses are not cash items and, as a result, do not correspondingly increase or
decrease our cash and cash equivalents despite the increase or decrease in profit. The amount of
revaluation adjustments has been, and will continue to be, subject to market fluctuations. As a result,
we cannot assure you that changes in market conditions will, in the future, create gains arising from
– 42 –
RISK FACTORS
changes in fair value of our investment properties at similar levels or at all, or that the fair value of our
investment properties will not decrease in the future. In particular, the fair value of our investment
properties could decline if the property markets in the regions where we operate experience a
slowdown. Any such decrease in the fair value of our investment properties could materially and
adversely affect our profitability.
We may be subject to negative consequences for the inability to register lease contracts or for
leasing premises that lack the relevant title certificates
According to the relevant PRC laws and regulations, lease contracts are required to be registered
with the local branch of the Ministry of Housing and Urban-Rural Development of the PRC. During the
Track Record Period, we did not strictly follow the requirements of the relevant laws and regulations in
relation to the registration of lease contracts. Non-registration of the lease contracts does not affect the
validity of the lease contracts under the relevant PRC laws and regulations. Non-registration of a lease
contract can, however, result in the imposition of a maximum fine of RMB10,000 for each
non-registered lease contract. Should such fines be imposed, the maximum penalty we could be
required to pay would be less than RMB1 million as of the Latest Practicable Date. In addition, from
time to time, premises that we lease may not possess the relevant title certificate resulting from the
landlords’ inability to obtain such documents. This may result in third parties challenging our interests
in the respective leased properties and may require us to seek alternative premises for some of the
properties that we leased. There can be no assurance that legal disputes or conflicts concerning such
leases and tenancies will not arise in the future. See “Business – Legal and Regulatory Proceedings and
Compliance Matters – PRC Property-Related Matters” for further information on other PRC
land-related matters.
The occurrence of any of the above conflicts or disputes or the imposition of fines could require
us to make additional efforts and/or incur additional expenses, any of which may materially and
adversely impact our business, financial condition, results of operations and growth prospects.
Certain portions of our properties are designated as civil air defence properties.
Pursuant to the PRC Law on National Defence 《中華人民共和國國防法》 promulgated by the
National People’s Congress (the “NPC”) in March 1997 and amended in August 2009, national defence
assets are owned by the state. Pursuant to the PRC Law on Civil Air Defence 《中華人民共和國人民防空
法》 (the “Civil Air Defence Law”) promulgated by the NPC on 29 October 1996 and amended on 27
August 2009, civil air defence is an integral part of national defence. As at the Latest Practicable Date,
certain areas of our properties were considered to be civil air defence properties. As at 28 February
2015, such civil air defence properties had an aggregate GFA of approximately 784,129 sq.m. and had a
carrying amount of RMB437.0 million.
In addition, under the Civil Air Defence Law, while an investor in civil air defence properties can
use and manage civil air defence properties in times of peace and profit therefrom, such use must not
impair their functions as civil air defence properties. The design, construction and quality of the civil
air defence properties must also conform to the protection and quality standards established by the PRC
government. If we do not maintain the civil air defence properties in accordance with the applicable
laws and regulations, we may be subject to adverse legal consequences. Furthermore, in the event that
the PRC government declares a state of war, the PRC government may take over the civil air defence
properties as civil air defence shelters. If we do not provide the civil air defence properties when
required by the PRC government in such times of war, we may be subject to sanctions or other
penalties imposed by the PRC government.
– 43 –
RISK FACTORS
The occurrence of any of the above may materially and adversely impact our business, financial
condition, results of operations and growth prospects.
Our provisions for land appreciation tax in the PRC could prove to be insufficient.
Our PRC properties developed for sale are subject to LAT. Under PRC tax laws and regulations,
all income derived from the sale or transfer of land use rights, buildings and their ancillary facilities in
the PRC is subject to LAT on the appreciation of land value at progressive rates ranging from 30% to
60%. LAT is calculated based on proceeds received from the sale of properties less deductible
expenditures as provided in the relevant tax laws. We make provisions for the full amount of applicable
LAT in accordance with the relevant PRC tax laws and regulations from time to time pending
settlement with the relevant tax authorities. Provisions for LAT are made based on our own estimates
including, among other things, our own apportionment of deductible expenses which is subject to final
confirmation by the relevant tax authorities upon settlement of the LAT. We only prepay a portion of
such provisions each year as required by the local tax authorities.
We cannot assure you that the relevant tax authorities will agree with our calculation of LAT
liabilities, nor can we assure you that the LAT provisions will be sufficient to cover our LAT
obligations in respect of the past LAT liabilities of the Combined Property Businesses. If the relevant
tax authorities determine that our LAT liabilities exceed our LAT prepayments and provisions and seek
to collect that excess amount, our cash flow, results of operations and financial condition may be
materially and adversely affected. As there are uncertainties as to when the tax authorities will enforce
the LAT collection and whether they will apply LAT collection retrospectively to properties sold before
the enforcement, any payment as a result of the enforcement of LAT collection may restrict our cash
flow position and our ability to finance our land acquisitions and execute our business plans.
The occurrence of any of the above may materially and adversely impact our business, financial
condition, results of operations and growth prospects.
We may be liable to purchasers of our properties for damages if we do not deliver strata-title
building ownership certificates in a timely manner.
Property developers in the PRC are typically required to deliver to the purchasers the relevant
strata-title building ownership certificates within a time frame set out in the property sale and purchase
agreement. Property developers generally elect to specify the deadline for the delivery in the property
sale and purchase agreements to allow sufficient time for the application and approval processes. Under
current regulations for applying for strata-title building ownership certificates, property developers must
first file an application with and submit the required materials to the relevant local authority. Upon
receiving the complete application materials in statutory form, the relevant local authority will accept or
reject the application within 30 working days. If the application is accepted, property developers must
then submit, within the required periods after delivery of the properties, the relevant property sale and
purchase agreements, the purchasers’ identification documents, proof of deed tax payment, together
with the general property ownership certificates, for review by the relevant local authority and the
subsequent issuance of the strata-title building ownership certificates. Delays by the various
administrative authorities in reviewing the application and granting approval as well as other factors
may delay delivery of the general and strata-title building ownership certificates. In the event of a late
delivery of any strata-title building ownership certificate due to delays which are deemed to be caused
by us, the purchaser would be able to terminate the property sale and purchase agreement, reclaim the
– 44 –
RISK FACTORS
payment and claim damages. We cannot assure you that we will not incur material liabilities to
purchasers in the future for the late delivery of strata-title building ownership certificates due to our
fault or for any reason beyond our control.
The occurrence of any of the above may materially and adversely impact our business, financial
condition, results of operations and growth prospects.
We are subject to fines and may be required to cease operating property development projects if
we do not obtain and/or renew valid qualification certificates.
In accordance with the Regulations on Administration of Urban Real Estate Development 《城市房
地產開發經營管理條例》 promulgated by the State Council of the PRC in July 1998 (the “Development
Regulations”), the Provisions on Administration of Qualifications of Real Estate Developers 《房地產開
發企業資質管理規定》 (the “Provisions on Administration of Qualifications”) promulgated by the
Ministry of Construction in March 2000 and other relevant laws and regulations, property developers in
the PRC are required to obtain the relevant class of qualification certificates for the development of
certain types of properties and certain sizes of property developments. The Development Regulations
provide that when an enterprise engages in the development and sale of real estate without any
qualification certificates or a property developer engages in the development and sale of real estate
beyond the class of its qualification certificate, it must rectify the non-compliance within the time limit
set by the real estate development authorities under the local government on or above the county level,
and is also subject to a fine ranging from RMB50,000 to RMB100,000. If the property developer does
not rectify the non-compliance within the time limit, its business licence may be revoked by the
Administration for Industry and Commerce. Typically, qualification certificates of property developers
are inspected on an annual basis. The property developer’s registered capital, property development
investments, history of property development, quality of property construction, quality control system,
management expertise or any illegalities on the part of the developer will be taken into account by the
relevant authorities in deciding whether to approve or renew qualification certificates of the property
developers and whether to approve the annual inspection of the qualification certificates. If we are
unable to obtain, renew or pass the annual verification of the requisite qualification certificates or
rectify any non-compliance, we may not be able to carry on all or part of our business. If any of our
project companies is unable to obtain, renew or pass the annual inspection of the qualification
certificates, that project company may not be permitted to continue to engage in real estate
development or to conduct any pre-sales for that development.
The occurrence of any of the above may materially and adversely impact our business, financial
condition, results of operations or growth prospects.
The Group will rely on the Contractual Arrangement with the CKH Holdings Group to pass on
the economic interests and other rights and obligations in respect of the CPB Specified Companies
to the Group and the Contractual Arrangement may not be as effective as legal ownership of the
CPB Specified Companies.
The reorganisation of the interests held directly or indirectly through certain CPB Companies to
form part of the Group, including in particular the interests in certain development agreements, joint
venture agreements, shareholders agreements or other similar agreements entered into with third parties
(the “Third Party Agreements”), requires third party consents (the “Third Party Consents”). In
relation to the CPB Specified Companies (being the CPB Companies for which Third Party Consents
are required but may not be obtained by 10 business days before the scheduled completion of the
Property Businesses Combination), the CKH Holdings Group will pursuant to the Reorganisation
– 45 –
RISK FACTORS
Agreement pass on the economic interests and other rights and obligations in respect of the CPB
Specified Companies to the Group through the Contractual Arrangement. For a description of the
Contractual Arrangement, see “History and Reorganisation – The Reorganisation – Property Businesses
Combination – The Reorganisation Agreement – Passing of Economic Interests”.
There is no certainty as to whether and when the Third Party Consents will be obtained. Until the
Third Party Consents have been obtained and completion of the remaining steps of the Reorganisation
Agreement Transactions in respect of the CPB Specified Companies, the Group will have to rely on the
contractual obligations of the CKH Holdings Group pursuant to the Contractual Arrangement to pass on
the economic interests and other rights and obligations in respect of the CPB Specified Companies to
the Group. As these are contractual obligations, they may not provide the Group with the right of
control over or the right to receive the benefits from the CPB Specified Companies as effective as legal
ownership of the CPB Specified Companies. Furthermore, the Group may need to incur costs and
expenses if a formal legal process is required to enforce the Group’s rights under the Contractual
Arrangement, and the Company only has unsecured claims for the economic interests in respect of, and
funding provided to, the CPB Specified Companies under the Contractual Arrangement.
During the Effective Period, since the Group will not own the CPB Specified Companies and is
not a party to the Third Party Agreements concerned, in the event of any breach of the terms or default
under such Third Party Agreements by the contracting third parties, the Group will not have direct
recourse against those contractual third parties and will have to rely on the CKH Holdings Group to
take action against such third parties, and any damages or compensation for loss recovered by the CPB
Specified Companies will then be passed on to the Group by the CKH Holdings Group through the
Contractual Arrangement.
The carrying amount of the property interests or development interests owned by the CPB
Specified Companies as at 31 December 2014, the relevant Third Party Consents for the transfer of
which had not been obtained as at the Latest Practicable Date, represented approximately 7% of the
Group’s pro forma total assets as set out in Appendix II.
We may be adversely affected by material issues that affect our relationships or business ventures
with our joint venture partners.
We carry out, and expect to carry out in the future, some of our business through joint ventures or
ventures with third parties. Such joint venture arrangements involve a number of risks, including:
쐌
with respect to joint ventures involving a joint venture company, we may not be able to pass
certain important board resolutions requiring unanimous consent of all the directors of our
joint venture companies if there is a disagreement between us and our joint venture partners;
쐌
any disagreement with any of our joint venture partners in connection with the scope or
performance of our respective obligations under the joint venture arrangements might affect
our ability to develop or operate a property;
쐌
our joint venture partners may be unable or unwilling to perform their obligations under the
joint venture arrangements with us, including their obligations to make required capital
contributions and shareholder loans, whether as a result of financial difficulties or otherwise;
쐌
our partners may have economic or business interests or goals that are inconsistent with
those of the Group;
– 46 –
RISK FACTORS
쐌
our partners may take action contrary to our requests or instructions, or contrary to our
policies or objectives with respect to our property development; or
쐌
our partners may face financial or other difficulties affecting their ability to perform their
obligations under the relevant joint venture with us.
The occurrence of any of the above may materially and adversely impact our business, financial
condition, results of operations and growth prospects.
We may not have adequate capital resources to fund our land acquisitions and future property
developments.
Property development is capital intensive. Our property development projects are generally funded
through amounts due to the Combined Non-Property Businesses, cash generated from operations and
bank borrowings. Prior to the Listing, the Cheung Kong Property Group and the Hutchison Property
Group centralised their cash management at their respective former parent groups (namely, the Cheung
Kong Group and the Hutchison Group). This centralised cash management included advances from their
respective former parent groups and transfers of income from operations from the Cheung Kong
Property Group and the Hutchison Property Group to their respective former parent groups. In the
future, we intend to fund our operations primarily from cash generated from operations, bank
borrowings and funding raised from the capital markets. A number of factors, such as general economic
conditions, our financial performance, availability of credit from financial institutions and monetary
policies, may affect our ability to obtain adequate financing for our projects on favourable terms. Many
of these factors are beyond our control. In recent years, global credit markets have tightened
significantly with the failure and/or the nationalisation of a number of large financial institutions in
Europe, the United States and other countries. Financial institutions are generally more cautious in
lending funds to companies, and as a result, companies may face increased financing costs as they may
only be able to procure funds from financial institutions with increased interest rates applied to their
funds. There can be no assurance that our existing major lenders will not change their lending policies,
increase our funding costs and, or, adopt a more cautious credit stance as a result of the overall
economic climate, or any other factors that may limit our ability to obtain credit on favourable terms
and affect our options for obtaining liquidity.
The PRC government has also in recent years taken a number of measures to further tighten
lending requirements for property developers, which, among other things:
쐌
prohibit PRC commercial banks from financing the payment of land grant premiums;
쐌
prohibit PRC commercial banks from extending any existing loans or granting any revolving
credit facilities in any form to property developers that hold idle land for speculation, hoard
properties and drive up property prices;
쐌
prohibit PRC commercial banks from taking properties of property developers that have been
vacant for more than three years as security for loans;
쐌
prohibit PRC commercial banks from granting loans to development projects that fail to
meet project capital ratio requirements or lack the required government permits and
certificates;
– 47 –
RISK FACTORS
쐌
prohibit property developers from using borrowings obtained from any local banks to fund
property developments outside that local region; and
쐌
prohibit a foreign-funded enterprise that fails to make full payment of its registered capital,
fails to obtain the land use rights certificate or fails to use at least 50% of its total project
investment funding for project development purposes, from applying for any domestic or
overseas loans.
In addition, the PBOC sets the benchmark lending rates and regulates the reserve requirement
ratio for commercial banks in the PRC, which affects the availability and cost of financing from them.
The PBOC has adjusted the bank reserve requirement ratio several times in recent years. Moreover, the
PRC government has also introduced new monetary policies in recent years that have resulted in the
tightening and loosening of liquidity in the market depending on whether the government raises or
lowers bank interest rates and bank reserve requirement ratios, which has resulted in fluctuations in our
business and results of operations. We cannot assure you that the PRC government will not introduce
other measures which may limit our access to capital resources.
The above and other governmental actions and policy initiatives may limit our flexibility and
ability to use bank loans or financings from other financial institutions, to finance our property
developments and therefore may require us to maintain a relatively high level of internally sourced
cash. If we are unable to fund our projects on reasonable terms, our business, financial condition,
results of operations and growth prospects may be materially and adversely impacted.
We are partially dependent on rental income from our rental portfolio and any downturn in the
rental market for commercial and residential properties could negatively affect the demand for
our rental properties and the amount of rental income we earn.
Leasing of our rental portfolio constitutes an important part of our business. For the years ended
31 December 2012, 2013 and 2014, property rental income of the Cheung Kong Property Group
amounted to HK$1,867 million, HK$1,961 million and HK$1,908 million, respectively, and constituted
approximately 9.7%, 11.5% and 7.9%, respectively, of its total turnover. For the same period, property
rental income of the Hutchison Property Group amounted to HK$3,318 million, HK$3,682 million and
HK$3,995 million, respectively, and constituted approximately 53.2%, 55.2% and 57.9%, respectively,
of its total turnover. We are subject to risks associated with the ownership and operation of commercial
and residential properties including, amongst other things, changes in market rental levels, competition
for tenants, costs resulting from on-going maintenance and repair and inability to collect rent from
tenants or renew leases with tenants due to bankruptcy, insolvency or other financial difficulties. In
addition, we may not be able to renew leases with our tenants on terms acceptable to us, or at all, upon
the expiration of the existing terms. Furthermore, any downturn in the rental market for commercial and
residential properties could negatively affect the demand for our rental properties and the amount of
rental income we earn, which may materially and adversely impact our business, financial condition,
results of operations and growth prospects.
We may not be able to continue to attract and retain quality tenants.
Our investment properties compete for tenants with other properties on the basis of, amongst other
things, location, quality, maintenance, property management, rent levels and other lease terms. We
cannot assure you that existing or prospective tenants will not choose other properties. Any future
increase in the supply of properties which compete with ours would increase the competition for tenants
and as a result we may have to reduce rent or incur additional costs to make our properties more
– 48 –
RISK FACTORS
attractive. If we are not able to retain our existing tenants or attract new tenants to replace those that
leave or to lease our new properties, our occupancy rates may decline. If we are unable to attract
well-known brands as our tenants or keep our existing tenants who bring in well-known brands to our
properties, our investment properties may become less attractive and competitive.
The occurrence of any of these events may materially and adversely impact our business, financial
condition, results of operations and growth prospects.
The results of operations of our property rental and property management businesses may be
materially and adversely impacted by the lack of effective management of our investment
properties and development properties.
Our results of operations depend, to a certain extent, on rental income from our investment
properties, which in turn is dependent upon the effective management of these properties. We rely
primarily on services from the property management division of the Cheung Kong Property Group to
provide property management services to our investment properties. However, we cannot assure you
that our investment properties will continue to be effectively managed and maintained. If our
investment properties are not maintained in a manner consistent with the required quality standards, we
may not be able to retain our existing tenants and may also be unable to attract prospective quality
tenants. The inability of the Cheung Kong Property Group to manage our investment properties in an
efficient, effective and professional manner could therefore have a material and adverse effect on us. In
addition, we consider property management to be an important element of after-sales services provided
to our customers with respect to properties that we have sold. Ineffective property management in this
regard may also result in damage to our overall brand and reputation.
The occurrence of any of the above may materially and adversely impact our business, financial
condition, results of operations and growth prospects.
We incur high maintenance and operating costs in operating our investment properties and hotels,
and these costs may increase.
Our investment properties and hotel businesses consume a large quantity of utilities such as gas,
water and electricity. We are generally not able to influence the prices which utility providers charge
us, nor can we easily switch to different utility providers. Any price increase or change in pricing
structure from these utility providers could have an adverse effect on our operating costs. In addition,
increases in the prices of other products and services which we procure to maintain our services to our
tenants and guests could increase our operating costs. If we are not able to pass these higher operating
costs on to our customers, our business, financial condition, results of operations and growth prospects
may be materially and adversely impacted.
In addition, operating investment properties and hotels involves a significant amount of fixed
costs, including maintenance costs as well as employee and staff salaries and expenses. These fixed
costs limit our ability to respond to adverse market conditions by minimising costs. Such costs may
have an adverse impact on our profitability when the property rental and hotel industries experience a
downturn and may exacerbate a decline in occupancy rates, rental rates or room rates.
Any significant increase in maintenance costs may materially and adversely impact our business,
financial condition, results of operations and growth prospects.
– 49 –
RISK FACTORS
Our investment properties and hotels may encounter temporary closures, reduced turnover or
lower occupancy rates as a result of repairs, refurbishments and/or the redevelopment or
renovation of the properties or neighbouring properties.
Our investment properties and hotels may require repairs and refurbishments which may require
significant capital expenditures. Our investment properties and hotels may also need to undergo
redevelopment or renovation works from time to time to retain their attractiveness and may also require
maintenance or repairs. Such repairs, refurbishments, redevelopments or renovations of our investment
properties and hotels may impact our ability to attract tenants at our investment properties and
customers for our hotels and their facilities. In some circumstances, such repairs, refurbishments,
redevelopments or renovation may require the temporary closure of an investment property or hotel or
the related facilities within the investment property or hotel. As a result, during periods of any such
repairs, refurbishments, redevelopments or renovations, we may experience a reduction in occupancy
rates, rental income and/or average room rates of the investment property or hotels and the number of
customers using the catering facilities at these properties.
Furthermore, buildings in the proximity to any of our investment properties and hotels may be
demolished or redeveloped for alternative uses, which may cause disruption to operations at our
investment properties and hotels. This may in turn negatively impact the revenue, attractiveness and
valuation of our investment properties and hotels. Moreover, any development or redevelopment of
neighbouring properties could add properties that compete with our investment properties and hotels.
The occurrence of any of the above may materially and adversely impact our business, financial
condition, results of operations and growth prospects.
We rely on third party hotel management companies to manage the day-to-day operations of some
of our hotels pursuant to the hotel management agreements.
Pursuant to the hotel management agreements between the third party hotel management
companies and us, the hotel management companies supervise the day-to-day operations and marketing
of the hotels they manage. As such, we are dependent on these third party hotel management companies
to manage such functions for the relevant hotels and are exposed to risks which are beyond our control,
including the third party hotel management companies or their parent companies suffering from
financial difficulties. If the third party hotel management companies are unable to maintain the quality
and adequate supply of various levels of hotel management personnel as stipulated under the hotel
management agreements, the business, financial condition, results of operations and growth prospects of
our hotel business may be materially and adversely impacted.
The hotel management agreements generally require us and the third party hotel management
companies to comply with operational and performance conditions that are subject to interpretation and
could result in disagreements or termination of the hotel management agreements. In addition, any
contractual or other disagreements with the third party hotel management companies may adversely
impact our relationships with these hotel management companies. If any of the hotel management
agreements is terminated prior to its expiration, we may experience disruptions to our hotel operations
while we seek to replace the relevant hotel management company. In addition, the relevant hotel would
need to be rebranded, which would likely involve a substantial initial outlay for the marketing,
refurbishment, branding and hospitality items and fixtures and furniture of the hotel, and it may take
several years for a successful operation to be re-established under the new brand. The disruption and
– 50 –
RISK FACTORS
costs associated with the termination of a hotel management agreement may be significant and may
materially and adversely impact the business, financial condition, results of operations and growth
prospects of our hotel business.
If our suppliers do not deliver high quality food, beverage and other supplies to our restaurants at
our hotels at competitive prices or in a timely manner, we may experience supply shortages and
reduced profitability.
The ability to source quality food ingredients and beverages at competitive prices in a timely
manner is important to our hotel business. Our ability to maintain consistent quality and maintain our
menu offerings throughout our restaurants depends in part upon our ability to acquire fresh food
products and beverages and related supplies from reliable sources that meet our quality specifications
and in sufficient quantities. We are exposed to the risks that we will not be able to obtain supplies in
sufficient quantities or of a sufficient quality and that the price of our supplies will rise significantly. A
disruption of our food or beverage supplies could occur for a variety of reasons, many of which are
beyond our control and this could increase our food and beverage costs and/or cause shortages of food,
beverages and other supplies at our restaurants. These factors may materially and adversely impact the
business, financial condition, results of operations and growth prospects of our hotel business.
We face risks related to instances of food-borne illnesses, food contamination and the associated
liability claims.
As we provide food and beverage and banquet services at our hotels, we face an inherent risk of
our food and beverages being found to be unfit for consumption or causing illness due to contamination
or degeneration, tampering by third parties or other problems arising during the various stages of
procurement, transportation, preparation and storage, as well as the associated liability claims. Our food
quality depends partly on the quality of the food ingredients and raw materials provided by our
suppliers. We may not be able to detect all defects in our supplies and food contamination that could be
caused by third party food suppliers or other factors which are outside of our control. Due to the scale
of our operations, we also face the risk that certain of our employees may not adhere to our mandated
procedures and requirements. If we are unable to detect defective food supplies or observe proper
hygiene and other quality control requirements or standards in our operations, this could adversely
affect the quality of the food we offer, which could lead to liability claims, complaints and related
adverse publicity, reduced customer traffic at our hotels and restaurants, damage to our reputation and
brand and the imposition against us of penalties by relevant authorities and compensation awards by
courts.
Additionally, we are subject to extensive and stringent health and sanitation laws and regulations
that impose fines and/or suspension or revocation of licenses for violation of such laws and regulations.
Furthermore, these laws and regulations are constantly evolving, and we cannot assure you that the
relevant government or authority will not impose additional or stricter laws or regulations, the
compliance with which may cause us to incur significant costs which we may not be able to pass on to
our customers. If we are unable to comply with existing or future health and sanitation laws and
regulations or do not meet public expectations in relation to health and sanitation, our business,
financial condition, results of operations and growth prospects may be materially and adversely
impacted.
– 51 –
RISK FACTORS
The illiquidity of investment properties and the lack of alternative uses of investment properties
and hotels may significantly limit our ability to respond to adverse changes in the performance of
our investment properties.
Property investments in general are relatively illiquid; accordingly our ability to sell promptly one
or more of our investment properties in response to changing economic, financial and investment
conditions is limited. The property market is affected by various factors, such as general economic
conditions, availability of financing, interest rates and supply and demand, many of which are beyond
our control. We cannot predict whether we will be able to sell any of our investment properties for the
price or on the terms set by us, or whether any price or other terms offered by a prospective purchaser
would be acceptable to us. We also cannot predict the length of time needed to find a purchaser and to
complete the sale of a property. Moreover, we may also need to incur capital expenditure to manage
and maintain our properties or to correct defects or make improvements to these properties before
selling them. We cannot assure you that financing for such expenditures will be available when needed,
or at all. In addition, if we sell an investment property during the term of that property’s management
agreement or tenancy agreement, we may have to pay termination fees to our retail tenants.
Furthermore, the ageing of investment properties, changes in economic and financial conditions or
changes in the competitive landscape in the property market may adversely affect the amount of rentals
and revenue we generate from, as well as the fair value of, our investment properties. However, hotels
and investment properties may not be readily converted to alternative uses, as such conversion requires
extensive governmental approvals and involves substantial capital expenditures for the purpose of
renovation, reconfiguration and refurbishment. We cannot assure you that we will obtain the necessary
approvals and sufficient funds to carry out the required conversion. These factors and any others that
would impede our ability to respond to adverse changes in the performance of our hotels and
investment properties could affect our ability to compete against our competitors and our results of
operations.
The occurrence of any of the above events may materially and adversely impact our business,
financial condition, results of operations and growth prospects.
Our success depends on the continued services of our executive Directors, our senior management
team and employees.
Our success depends on the continued services provided by our executive Directors, senior
management team and other employees. Competition for talented employees is intense in the property
sector. If members of our core management team leave the Group and we are unable to find suitable
replacements, our business could be adversely affected. In addition, as we continue to expand our
business, we will need to employ, train and retain more employees. If we cannot attract, train and retain
qualified employees, our business, financial condition, results of operations and growth prospects may
be materially and adversely impacted.
We may not be able to integrate the Combined Property Businesses successfully and the
integration process may disrupt our business operations.
Immediately following completion of the Property Businesses Combination, the Combined
Property Businesses will be held by the Group. Historically, the property businesses of the Cheung
Kong Property Group and the Hutchison Property Group have been managed and operated largely
independently of each other. The Property Businesses Combination may give rise to certain challenges
when integrating the policies, procedures, staffing and other aspects of the daily operations of the two
– 52 –
RISK FACTORS
property businesses and those of the joint ventures that will be consolidated and become subsidiaries of
the Company. In addition, there are risks involved in integrating industry and intellectual know-how, as
well as information and technological systems and other logistical functions. The inability to integrate
the Combined Property Businesses may result in disruptions to the business operations of the Group
and may materially and adversely impact our business, financial condition, results of operations and
growth prospects.
We may be involved in disputes and legal and other proceedings arising out of our operations
from time to time and may face significant liabilities as a result.
We may be involved in disputes arising out of the development, sale or leasing of our properties
with contractors, suppliers, construction workers, residents, tenants, residents of surrounding areas, joint
venture partners, purchasers, vendors or other parties. These disputes may lead to protests, legal or
other proceedings and may damage our reputation and divert our resources. Significant costs may have
to be incurred in defending ourselves in such proceedings. If we are not successful in defending
ourselves in such proceedings, we may be liable for damages, the amount of which may be significant.
In addition, we may have disagreements with regulatory bodies in the course of our operations, which
may subject us to administrative proceedings or unfavourable decrees that may result in liabilities and
cause delays to our property developments. We may also be involved in disputes or legal proceedings in
relation to delays in the completion and delivery of our projects.
The occurrence of any of the above may materially and adversely impact our business, financial
condition, results of operations and growth prospects.
We may suffer losses from fluctuations in exchange rates.
We record our results in Hong Kong dollars but certain of our subsidiaries, joint ventures and
associates record turnover and incur expenses in other currencies. Any currency fluctuations may impact
translation of the accounts of these subsidiaries, joint ventures and associates, and the repatriation of
earnings, equity investments and loans, and ultimately, our business.
The exchange rates between the Hong Kong dollar and RMB, the U.S. Dollar and other foreign
currencies are affected by, among other things, changes in the political and economic conditions of the
issuing jurisdictions of the currencies. In July 2005, the PRC government changed its policy of pegging
the value of RMB to the U.S. Dollar. This change in policy resulted in RMB appreciating against the
Hong Kong dollar, the U.S. Dollar and certain other foreign currencies. The PRC government has been
facing pressure from foreign countries to adopt a more flexible currency system, which may lead to
further appreciation of RMB. RMB may be revalued further against the Hong Kong dollar, U.S. Dollar
or other currencies or may be permitted to enter into a full or limited free float, which may result in
appreciation or depreciation in RMB against the Hong Kong dollar, the U.S. Dollar or other currencies.
If the exchange rates of the Hong Kong dollar against RMB and other currencies continues to
fluctuate, this may materially and adversely impact our business, financial condition, results of
operations and growth prospects. See “Financial Information – Qualitative and Quantitative Disclosure
About Market Risk – Foreign Exchange Risk” for more information on the potential impact on currency
fluctuation on our results of operations.
– 53 –
RISK FACTORS
We may suffer losses arising from uninsured risks.
We have insurance in place in relation to our development properties, investment properties and
hotels and serviced suites. Certain of our insurance policies require renewal every year and we are
therefore exposed to the volatility of insurance costs. For further information, please see “Business –
Insurance”. Our insurance may not fully indemnify us for all potential losses, damages or liabilities
related to our properties. This is because in the jurisdictions in which we operate, there are certain
exposures which are excluded under some of our insurance programmes or for which insurance is not
available on what we consider to be reasonable commercial terms. Such exposures include potential
losses which might arise as a result of war, terrorism, pollution, fraud, professional negligence and acts
of God. Our insurers may become impaired and find themselves financially unable to meet claims. As a
result of large losses sustained by the international insurance market, insurers may exclude certain risks
when we renew our insurance programmes. If we suffer from any losses, damage or liabilities in the
course of our operations arising from events for which we do not have any or adequate insurance cover,
we may not have sufficient funds to cover any such losses, damages or liabilities or to replace any
property that has been destroyed.
The occurrence of any of the above events and the resulting payment we make to cover any
losses, damages or liabilities may materially and adversely impact our business, financial condition,
results of operations and growth prospects.
We are exposed to various types of taxes in the jurisdictions in which we operate or have a
presence.
As our operations are primarily based in Hong Kong and the PRC, the income and gains derived
by us are primarily exposed to tax laws in Hong Kong and the PRC. In addition, the current PRC tax
system is being reformed such that the Business Tax, which is a tax on turnover without accounting for
input tax credits, will be replaced by the Value-Added Tax (the “B2V Pilot Programme”). The B2V
Pilot Programme will be expanded to include all industries currently not under the programme,
including the real estate, hospitality, construction and financial industries. The coverage expansion is
projected to be completed in 2015. As the relevant PRC authorities have not yet announced the details
of how the B2V Programme will apply to these industries, including the tax rates to be imposed, it is
difficult to assess its impact on our business. Furthermore, the income and gains derived by us are
exposed to various types of taxes in other jurisdictions where members of the Group operate including
Singapore, the United Kingdom and The Bahamas. These may include stamp duties, turnover taxes,
income taxes as well as withholding taxes and other taxes payable on dividends and other distributions.
While we intend to manage our tax situation in each of these jurisdictions efficiently and to ensure
compliance with the applicable tax rules and regulations, there can be no assurance that the estimated
tax outcome will be achieved. In addition, the level of taxation in each of these jurisdictions is subject
to changes in laws and regulations as well as changes in the application of existing laws and
regulations by tax authorities, and such changes may lead to an increase in our effective tax rates. We
will also be subject to taxes in any new jurisdictions in which we acquire properties, and similar risks
will apply in respect of such taxes.
All of these factors may materially and adversely impact our business, financial condition, results
of operations and growth prospects.
– 54 –
RISK FACTORS
Certain Shareholders will in aggregate have a substantial shareholding in the Company and their
interests may not be aligned with the interests of the other Shareholders.
Immediately following completion of the Spin-off, the Trust will directly and/or indirectly hold
approximately 26.66% of our total issued share capital, of which approximately 24.26% will be,
directly or indirectly, held by Li Ka-Shing Unity Trustee Company Limited (being TUT1) as trustee of
The Li Ka-Shing Unity Trust (being UT1). Further, immediately following completion of the Spin-off,
Mr. Li Ka-shing and Mr. Li Tzar Kuoi, Victor will directly and/or indirectly hold respectively
approximately 3.42% and 0.07% of our total issued share capital. The above shareholdings may, for the
foreseeable future, confer on some or all of those Shareholders through their respective voting rights
the ability to exercise influence over our operations and business strategy, such as matters related to the
composition of our Board, the amount and timing of dividends and other distributions, the issuance of
securities and adjustments to our capital structure, amendments to the Memorandum and Articles of
Association, and other corporate actions requiring approval of the Shareholders, including merger,
consolidation or sale of our assets, or any other change of control event that may benefit our other
Shareholders generally. Such voting power may discourage certain types of transactions, including those
involving an actual or potential change of control of the Company.
In the event that there is a divergence of our strategic and other interests from all or some of the
Shareholders mentioned above in the future, such Shareholders (or certain of them) may exercise
influence over the Company in ways that conflict with the interests of our other Shareholders.
Our future dividend payments and policy will be subject to the discretion of the Board.
The amount of any dividends that the Company may declare and pay in the future will be subject
to the discretion of the Board and will be based upon our earnings, cash flow, financial condition,
capital requirements, distributable reserves and any other conditions that the Directors deem relevant.
The payment of dividends may also be limited by legal restrictions and by financing agreements that
we may enter into from time to time. The amounts of distributions that any company within the Group
or Hutchison or Cheung Kong has declared and made in the past are not indicative of the dividends that
the Company may pay in the future.
Our brand image may be impacted and our intellectual property rights may be infringed upon.
We use a number of brand names, including “Cheung Kong”, “Hutchison”, ”Harbour Plaza”,
“Harbour Grand”, “Rambler” and “Horizon”, in marketing our properties to potential purchasers,
tenants, and hotel and serviced suite customers. Brand value is based largely on subjective consumer
perception and can be damaged by isolated incidents that diminish consumer trust. Any negative
incident or negative publicity concerning us, our business, our tenants or our hotel customers could
adversely affect our reputation and business. Our brand value and consumer demand for our properties
could decline significantly if we are unable to maintain the quality of our properties or are unable to
deliver a consistently positive experience to the purchasers, tenants and hotel customers of our
properties, or if we are perceived to have acted in an unethical or socially irresponsible manner. In
addition, our efforts to protect our brand names may not be adequate and we may be unable to identify
any unauthorised use of our brand names or to take appropriate steps to enforce our rights to protect
our brand names on a timely basis. Moreover, our trade marks and other intellectual property are
important to our success and we take certain precautions to protect these intellectual property rights.
However, it may be possible for third parties to obtain and use our intellectual property (including
– 55 –
RISK FACTORS
some of our key brands that are used by us under certain licence arrangements) without authorisation,
which may impair our brand value, damage our reputation and may materially and adversely impact our
business, financial condition, results of operations and growth prospects.
Adverse media reports about us or our projects, whether substantiated or not, may cause harm to
our reputation.
The development of, and future trends in, Hong Kong, the PRC, Singapore and the United
Kingdom property industries, including business strategies of major property developers, have been the
focus of numerous media reports. As a leading property developer in Hong Kong and the PRC,
information about us or our projects appears frequently in various media outlets. Some of these media
reports contain inaccurate information about the Company and our projects. There can be no assurance
that there will not be false, inaccurate or adverse media reports about us or our projects in the future.
In particular, we may be required to respond or take defensive and remedial actions with regard to such
inaccurate or adverse media reports, which may adversely divert our resources and our management’s
attention and may materially and adversely impact our business operations.
Moreover, there can be no assurance as to the appropriateness, accuracy, completeness or
reliability of any media reports regarding the Company and the Spin-off. To the extent that any media
reports contain information that is inconsistent or conflicts with the information contained in this listing
document, we disclaim them, and investors should not rely on such information in making a decision as
to invest in our Shares, and should rely only on the information included in this listing document.
Failure in our information and technology systems could interrupt our business operations.
We use modern information and technology systems to control and manage our operations. These
information and technology systems are intended to enable us to improve efficiency and monitor and
control our operations and are fundamental to ensuring that we maintain our competitiveness in our
industry. Our information systems are vulnerable to damage or interruption from circumstances beyond
our control, including but not limited to, fire, power loss, hardware failure, software program error,
telecommunications failure, computer viruses, human error, hacking and break-in and other similar
events. Any failure or breakdown in these systems could interrupt our normal business operations and
result in a significant decrease in operational and management efficiency during such failure or
breakdown. Recovery from such disasters may result in lost data as a result of such malfunction and
disruption. In addition, precautionary measures may only be partly, if at all, successful. Any prolonged
failure or breakdown could dramatically impact our ability to manage our properties and offer services
to our customers, which may materially and adversely impact our business, financial condition, results
of operations and growth prospects.
– 56 –
RISK FACTORS
RISKS RELATING TO THE PROPERTY AND HOTEL INDUSTRIES
We face increasing competition in Hong Kong, the PRC and other places where we operate.
There are a large number of property developers in Hong Kong and the PRC. In recent years, a
few PRC property developers have begun to undertake property development and investment projects in
Hong Kong. In addition, a number of regional and international developers have expanded their
operations into the PRC. Many of these developers, both private and State-owned, have significant
financial, managerial and marketing resources, as well as experience in property and land development.
Local PRC property developers are improving in quality and expanding in terms of scale and product
offerings. Competition among property developers in the places where we operate is intense and may
result in, among other things, an increase in the costs of land acquisition, an oversupply of properties, a
decrease in property prices, a slowdown in the rate at which new property developments receive
approval by the relevant government authorities, an increase in construction costs and difficulty in
obtaining high quality contractors and qualified employees. In addition, the property market in the PRC
is rapidly changing. In particular, certain cities in the PRC have experienced a cooling-down period in
recent months as a result of the slowdown in the PRC economy and housing prices in certain cities may
continue to decline. If we cannot respond to these changes more swiftly or effectively than our
competitors do, our financial condition and results of operations will be adversely affected.
Our property rental, property management and hotel businesses also face significant competition,
primarily from properties of a similar grade in their immediate vicinity and properties in their target
market. The level of competition is affected by various factors, including changes in local, regional and
global economic conditions, changes in populations, the supply of and demand for properties, changes
in travel patterns/preferences and the level of business activity.
We compete with other property developers and businesses across a range of factors, including
location, capital resources, transportation, infrastructure, government financial and other incentives,
design, quality of premises, accommodations and amenities, breadth and quality of services provided,
brand recognition, maintenance and supporting services. We also compete on sales prices, rental rates
and other terms. As a result, we may (i) lose current and potential tenants or purchasers to our
competitors and have difficulty selling, renewing leases on or re-letting properties, (ii) be forced to
reduce our sales prices or rental rates or (iii) incur additional costs in order to make our properties
more attractive than those of our competitors. If we are unable to compete effectively and consistently,
we may not be able to sell or lease our properties on favourable terms, or at all, our occupancy rates
may decline and we may not be able to recover our property development costs.
Any of the above may adversely affect our business, financial condition and results of operations.
Our business is subject to government policies and regulations, and in particular, we are
susceptible to changes in policies related to the Hong Kong property industry and the hotel
industry.
Our business is subject to government policies and regulations, and in particular, we are
susceptible to changes in policies related to the Hong Kong property industry and hotel industry. Since
2011, the Hong Kong government has implemented a series of policies and regulations to slow down
the residential property market and inflation of property prices, as well as to dampen property
speculation. These policies and regulations include increased mortgage down payments, additional
stamp duties on property sales, supply of land controls, residential property financing, building
regulations, suspension of the Capital Investment Entrant Scheme (an immigration scheme which allows
– 57 –
RISK FACTORS
an individual to gain residency status in Hong Kong through capital investments) and other fiscal
policies. For more information, please see “Appendix IV – Regulatory Overview”. In addition, the Hong
Kong government has indicated in the 2015 Hong Kong Government Policy Address that it intends to
speed up the development of public housing and public rental housing (“PRH”) and make available a
number of Home Ownership Scheme flats, subsidised sales flats and PRH for sales. The Hong Kong
government also intends to continue to maintain the development of the private property market
through steady and sustained land supply and implementation of certain management measures.
Moreover, the Hong Kong and the PRC governments may change laws and regulations which limit the
number of daily mainland Chinese travellers allowed to travel to Hong Kong. These policies,
regulations and plans create a lot of uncertainty and could materially and adversely impact the Hong
Kong property market, the supply of available land or the occupancy rates or daily room rates of our
hotels and serviced suites. We cannot assure you that the Hong Kong government will not adopt
additional and more stringent industry policies or regulations in the future, which may materially and
adversely impact our business, financial condition, results of operations and growth prospects.
Our business in the PRC is subject to extensive government regulations, and the PRC government
may introduce further measures to curtail growth in the property sector.
Our business in the PRC is subject to government regulations. As with other property developers,
we must comply with various requirements mandated by PRC laws and regulations, including the
policies and procedures established by local authorities designed to implement such laws and
regulations. The PRC government exerts considerable direct and indirect influence on the development
of the PRC property sector by imposing industry policies and other economic and environmental
measures, such as control over the supply of land for property development and control of foreign
exchange, property financing, zoning laws, taxation, foreign investment and environmental planning.
Specifically, the PRC government may restrict or reduce land available for property development, raise
benchmark interest rates for commercial banks, place additional limitations on the ability of commercial
banks to make loans to property developers and property purchasers, implement changes to current
zoning laws, impose additional taxes and levies on property sales, restrict foreign investment in certain
PRC property segments and restrict the usage of land as a result of environmental measures. For
example, as a result of a change in local practices, a local government in the PRC has recently
requested us to make certain adjustments to the drainage system at our golf course in the PRC (with a
market value of RMB 280 million as at 28 February 2015) to enhance its environmental standards.
Such adjustments may require temporary closure of a portion of the golf course for several months. We
are liaising with the local government on the proposed adjustment plan (including the completion date).
We may experience a reduction in revenue derived from the golf course operations as a result of the
temporary closure and may be subject to negative consequences (including but not limited to
operational suspension of the relevant portion of the golf course) if we fail to complete the adjustments
by the requested timeline. Such property industry and other policies may materially and adversely affect
our operations and/or our future business development. There is no assurance that the PRC government
will not adopt additional and more stringent industry policies, regulations and measures in the future. If
we are unable to adapt our operations to such new policies, regulations and measures that may come
into effect from time to time, or if such policy changes negatively impact our business or cause us to
incur additional costs, our business, financial condition, results of operations or prospects may be
materially and adversely impacted.
Investments in the PRC property sector have increased significantly in the past decade. In
response to concerns over the rapid increase in property investments and property prices, from 2004 to
the first half of 2008, the PRC government introduced various policies and measures to curtail property
development. In the second half of 2008 and in 2009, in order to combat the impact of the global
– 58 –
RISK FACTORS
economic slowdown, the PRC government adopted measures to encourage consumption in the property
market and to support real estate development. However, since December 2009, the PRC government
has adjusted some of its policies in order to slow down the increase in property prices in certain cities,
including:
쐌
abolishing certain preferential treatment relating to business taxes payable upon transfers of
residential properties by property owners and imposing more stringent requirements on the
payment of land grant premium by property developers;
쐌
requiring higher minimum down payments;
쐌
requiring commercial banks to stop lending to speculative developers;
쐌
imposing a pilot scheme for property tax in Shanghai and Chongqing;
쐌
imposing property purchase restrictions on non-local residents, decreasing the maximum loan
to value ratio of mortgage loans offered to borrowers, and increasing mortgage interest rates
and construction loan interest rates;
쐌
setting minimum down payment amounts for residential property purchases: (i) where a
family that has not fully repaid the mortgage on its first residential property applies for a
commercial loan for a second ordinary residential property for personal use for the purpose
of improving living conditions, the minimum percentage of down payment required for the
second ordinary residential property is adjusted to 40%, (ii) where a public housing
provident fund loan is used by the family of the individual who has contributed to the fund
in order to purchase the first ordinary residential property for personal use for the purpose of
improving living conditions, the down payment shall not be less than 20%, and (iii) where a
family who has fully repaid the public housing provident fund loan on its first residential
property and applies for another public housing provident fund loan to purchase a second
ordinary residential property for personal use for the purpose of improving living conditions,
the minimum percentage down payment required is 30%;
쐌
setting the minimum lending interest rate at no less than 110% of the benchmark rate for
second residential property purchases; and
쐌
restricting purchasers in certain targeted cities from acquiring second (or further) residential
properties and restricting non-residents in certain targeted cities that cannot provide any
proof of local tax or social security payments for more than a specified time period from
purchasing any residential properties, launching new property tax schemes in certain cities
on a trial basis and levying business taxes on the full amount of the transfer price if an
individual owner transfers a residential property within two years of the date of making the
purchase as defined in the relevant regulations, or on the difference between the sale price
and the original purchase price if an individual owner transfers a non-ordinary residential
property after two years or more from the date of making the original purchase.
These and other future measures may limit our access to capital, reduce market demand for our
products, reduce the prices at which we can sell our products and increase our finance costs. Since June
2014, the PRC government has loosened certain of the previously implemented policies designed to
slow down the increase in property prices in the PRC. We cannot assure you that the PRC government
will not adopt more policies, regulations and measures that may result in volatile market conditions and
– 59 –
RISK FACTORS
subject our business to fluctuations. For example, recent austerity measures that aim at minimising
extravagant spending by PRC government officials and reducing bureaucratic visits and meetings have
negatively impacted the hotel, travel and tourism industries in the PRC, including our hotel business in
the PRC. If we are unable to adapt our operations to new policies, regulations and measures that may
come into effect from time to time with respect to the real property industry, or such policy changes
may materially and adversely impact our business, financial condition, results of operations and growth
prospects.
The property industry in the PRC is still developing, bringing a significant degree of uncertainty.
Demand for commercial and residential properties in the PRC has been increasing rapidly in
recent years, which has often been coupled with volatile market conditions and fluctuations in prices.
Numerous factors may affect the development of the market and it is therefore difficult to predict when
and how much demand there will be. Limited availability of accurate financial and market information
and the general low level of transparency in the PRC property industry contribute to the overall market
uncertainty. Investors may be discouraged from acquiring new properties due to the lack of a liquid
secondary market for commercial and residential properties. In addition, the limited amounts and types
of mortgage financing available to purchasers, together with the lack of long-term security of legal title
and enforceability of property rights, may also inhibit demand for commercial and residential
properties. The risk of over-supply is also increasing in certain regions of the PRC where property
investment, trading and speculation have been more active. If as a result of any one or more of these or
similar factors, demand for commercial and residential properties or market prices decline, our business,
financial condition, results of operations and growth prospects may be materially and adversely
impacted.
The PRC government has implemented restrictions on the ability of PRC property developers to
obtain offshore financing which could affect our ability to deploy funds raised for our business in
the PRC.
In April 2013, SAFE issued the Operation Guidelines for the Administration of Foreign Debt 《外
債登記管理操作指引》 (the “Guidelines”), which became effective on 13 May 2013. The Guidelines
stipulate that, amongst other things, (i) with respect to real estate enterprises with foreign investment
who obtained approval certificates from commercial authorities and registered with the MOC on or after
1 June 2007, the branches of SAFE will no longer process the foreign debt registrations for such
enterprises, (ii) with respect to real estate enterprises with foreign investment established prior to 1
June 2007, such enterprises may borrow foreign debt in accordance with the relevant provisions in the
Guidelines, but the amount of foreign debt shall not exceed the surplus between the enterprise’s total
investment amount and its registered capital (the “Surplus”); in the event that the enterprise increases
its registered capital, and the Surplus after the increase of registered capital is less than the Surplus
before the increase of registered capital, then the amount of foreign debt of such enterprise shall not
exceed the Surplus after the increase of registered capital, and (iii) in the event that the registered
capital of a real estate enterprise with foreign investment is not paid in full, or such real estate
enterprise with foreign investment does not obtain State-owned land use rights certificate(s), or the
capital for real estate projects to be developed is less than 35% of the total investment amount of such
projects, such real estate enterprise with foreign investment is prohibited from borrowing foreign debt,
and the branches of SAFE will not process the foreign debt registrations for such enterprises. The
Guidelines therefore restrict the ability of our PRC subsidiaries that are real estate enterprises with
foreign investment to raise funds offshore for the purpose of injecting such funds into the enterprises
by way of shareholder loans. We cannot assure you that the PRC government will not introduce new
policies that further restrict our ability to deploy our funds in the PRC, which may materially and
adversely impact our business, financial condition, results of operations and growth prospects.
– 60 –
RISK FACTORS
Our investment properties in the PRC are located on land that is under long-term land use rights
granted by the PRC government. There is uncertainty about the amount of the land grant
premium that the Group will have to pay and additional conditions that may be imposed if we
decide to seek an extension of the land use rights for our investment properties.
Our investment properties in the PRC are held by us under land use rights granted by the PRC
government. Under PRC laws, the maximum term of the land use rights is 40 years for commercial use
purposes and 50 years for mixed-use purposes. Upon expiration, the land use rights will revert to the
PRC government unless the holder of the land use rights applies for and is granted an extension of the
term of the land use rights.
These land use rights do not have automatic rights of renewal and holders of land use rights are
required to apply for extensions of the land use rights one year prior to the expiration of their terms. If
an application for extension is granted (and such grant would usually be given by the PRC government
unless the land in issue is to be taken back for the purpose of public interests), the holder of the land
use rights will be required to, among other things, pay a land grant premium. If no application is made,
or if such application is not granted, the properties under the land use rights will be disposed of in
accordance with the land use right grant contracts.
In certain circumstances, the PRC government may, on the ground of public interest, terminate
land use rights before the expiration of the term. In addition, the PRC government has the right to
terminate long-term land use rights and expropriate the land in the event the grantee fails to observe or
perform certain terms and conditions pursuant to the land use rights grant contracts. If the PRC
government charges a high land grant premium, imposes additional conditions, or does not grant an
extension of the term of the land use rights of any of our investment properties, our operations could be
disrupted, which may materially and adversely affect our business, financial condition, results of
operations or growth prospects.
The property development business is subject to claims under statutory quality warranties and
other claims from purchasers of our properties.
In general, property development companies must provide certain quality warranties for the
properties they construct or sell. During the Track Record Period, we received claims from purchasers
of our properties in relation to the quality of our completed property projects and we expect to continue
to receive claims from purchasers of our properties of this nature in the future. Although we receive
quality warranties from our third party contractors with respect to our property development projects, if
a significant number of claims are brought against us under our warranties and if we are unable to
obtain reimbursement for such claims from third party contractors in a timely manner, or at all, or if
the money retained by us to cover our payment obligations under the quality warranties is not
sufficient, we could incur significant expenses to resolve such claims or face delays in correcting the
related defects, which may materially and adversely impact our business, financial condition, results of
operations, reputation and growth prospects.
In addition, we may be subject to other types of claims from purchasers of our properties from
time to time during our ordinary course of business, such as claims in relation to the delay in delivery
of property title documents due to various reasons, including a delay in completing the relevant
procedures or in commencing the relevant procedures, including, but not limited to, the examining
procedure by the relevant land use right authorities and the registration, approval and certificate
production procedures by the relevant property right authorities. We cannot assure you that we will not
– 61 –
RISK FACTORS
face any significant claims from purchasers of our properties in the future, which may result in
significant expenses to resolve such claims, or if we face delays in remedying the related defects, harm
our reputation and impact our business, financial condition, results of operations and growth prospects.
The hotel industry is cyclical and macroeconomic and other factors beyond our control can have a
material and adverse impact on demand for our hospitality products and services.
We own and operate hotels in Hong Kong, the PRC and The Bahamas. As a result, the operations
of our hotel business depend, to a large extent, on the performance of these economies and their real
estate market conditions. Historically, the hotel industry has been cyclical and affected by, amongst
other factors, supply of and demand for comparable properties, the rate of economic growth, interest
rates, inflation and political and economic developments. During periods of economic decline or
uncertainty, our hotel operations could be vulnerable to reduced business travel, decreased consumer
spending and reduced disposable income, all of which may result in reduced demand for hotel rooms
and downward pressure on our daily room rates. There can be no assurance that the economies of the
jurisdictions in which we operate will improve or that hotel property values and rates will not decline
or that interest rates will not rise in the future. Our customers’ desire, willingness and ability to travel
may also be affected by travel disruptions caused by extreme weather conditions, other natural disasters
or epidemics. An economic decline generally, or a decline in the hotel industry, could have an adverse
effect on our hotel business and therefore may materially and adversely impact our business, financial
condition, results of operations and growth prospects.
We are exposed to seasonal volatility in the overall hotel industry.
We derive a portion of our revenue from hotel operations. Hotel guests are short-term occupants
of the hotel rooms and do not generally commit to medium- or long-term contractual rental payments.
As a result, hotel occupancy rates and room rates are subject to a high degree of variability due to
seasonal factors and the nature of the hotel business. In addition, a significant portion of our hotel
revenue is generated by our food and beverage services, including banqueting services. Demand for our
banqueting services typically increases on holidays, festivals and dates that are believed to be
auspicious under the Chinese lunar calendar. While measures have been taken to address the seasonal
fluctuations for our hotel business, including our food and beverage business, such measures may be
ineffective and therefore comparisons of results of operations between different periods within a single
financial year may not be meaningful and should not be relied upon as indicators of our performance.
Accidents, injuries or prohibited activities in our investment properties, development properties
and hotels may materially and adversely impact our reputation and subject us to liability.
There are inherent risks of accidents, injuries or prohibited activities taking place in public places,
such as hotels. The occurrence of one or more accidents, injuries or prohibited activities at any of our
investment properties, construction sites or hotels could adversely affect our reputation among
purchasers of our properties and our hotel guests, harm our brand, decrease our overall rents and hotel
occupancy rates and increase our costs by requiring us to implement additional safeguard measures. In
addition, if accidents, injuries or prohibited activities occur at any of our investment properties,
construction sites or hotels, we may be held liable for costs, damages and fines and there is a risk that
our operations may be suspended as a result. Our current property and liability insurance policies may
not provide adequate or any coverage for such losses and we may be unable to renew our insurance
policies or obtain new insurance policies without increases in premiums and deductibles or decreases in
coverage levels, or at all.
– 62 –
RISK FACTORS
Any inability to comply with our environmental responsibilities may subject us to liabilities.
We are subject to extensive and increasingly stringent environmental protection laws, regulations
and decrees that impose fines for violation of such laws, regulations or decrees and there is a risk of
shutdown by governmental authorities of any construction sites not in compliance with governmental
orders requiring the cessation or cure of certain activities causing environmental damage. In addition,
there is a growing awareness of environmental issues and we may sometimes be expected to meet a
standard which is higher than the requirement under the prevailing environmental laws and regulations.
The environmental protection measures we have adopted, including conducting environmental
assessments on our property construction projects and hiring construction contractors who have good
environmental protection and safety track records and requiring them to comply with the relevant laws
and regulations on environmental protection and safety, may be ineffective. In addition, there is no
assurance that more stringent environmental protection requirements will not be imposed in the future.
If we are unable to comply with existing or future environmental laws and regulations or are unable to
meet public expectations in relation to environmental matters, our reputation may be damaged or we
may be required to pay penalties or fines or take remedial actions and our operations may be
suspended, any of which may materially and adversely impact our business, financial condition, results
of operations and growth prospects.
RISKS RELATING TO THE PRC AND HONG KONG
Changes in PRC and Hong Kong political and economic policies and conditions could adversely
affect our business and prospects.
Hong Kong and the PRC have been, and will continue to be, our primary operating base and
markets. While the PRC government has been pursuing economic reforms to transform its economy
from a planned economy to a market economy since 1978, a substantial part of the PRC economy is
still being operated under various controls by the government. By imposing industrial policies and other
economic measures, such as control of foreign exchange, taxation and foreign investment, the PRC
government exerts considerable direct and indirect influence on the development of the PRC economy.
Many of the economic reforms carried out by the PRC government are unprecedented or experimental
and are expected to be refined and improved over time. Other political, economic and social factors
may also lead to further adjustments of the reform measures. This refining and adjustment process may
materially and adversely impact our business, financial condition, results of operations and growth
prospects.
We may in the future rely principally on dividends paid by our subsidiaries, associates and jointly
controlled companies to fund our cash and financing requirements.
The Company is a holding company and will rely on dividends paid by its subsidiaries, associates
and jointly controlled companies for cash requirements, including the funds necessary to service any
debt we may incur. Certain of the debt instruments of our subsidiaries, associates and jointly controlled
companies may contain provisions restricting their ability to make dividends or other distributions on
its equity interest to us. Furthermore, applicable laws, rules and regulations permit payment of
dividends by some of our consolidated entities only out of their retained earnings, if any, determined in
accordance with applicable laws and accounting standards. Our PRC subsidiaries are required to set
aside a certain percentage of their after-tax profit based on the PRC accounting standards each year for
their reserve fund in accordance with the requirements of relevant laws and provisions in their
respective articles of association. As a result, all of our PRC entities are restricted in their ability to
transfer a portion of their net income to us. Such restricted reserves are not distributable as cash
– 63 –
RISK FACTORS
dividends. Any limitation on the ability of our subsidiaries, associates or jointly controlled companies
to pay dividends to us could materially and adversely limit our ability to grow, pay dividends or
otherwise fund and conduct our business.
There is uncertainty regarding taxation with respect to the indirect transfer of equity interests in
PRC resident enterprises.
The State Administration of Taxation (the “SAT”) issued the Circular on Strengthening
Administration of Enterprise Income Tax on Non-Resident Enterprises’ Equity Transfer Income 《國家稅
務總局關於加強非居民企業股權轉讓所得企業所得稅管理的通知》 (“Circular 698”) on 10 December 2009,
with retrospective effect from 1 January 2008. Pursuant to Circular 698, when a non-PRC investor
indirectly transfers the equity interests of a PRC resident enterprise by disposing of its equity interests
in a non-PRC holding company (the “Indirect Transfer”) under the conditions set out in Circular 698,
the non-PRC investor shall report the Indirect Transfer to the relevant PRC tax authority. Based on the
“substance over form” principle, if the PRC tax authority considers that the Indirect Transfer lacks bona
fide commercial purpose, it may disregard the existence of the non-PRC holding company and impose
PRC Enterprise Income Tax (“EIT”) on the attributable capital gain. Circular 698 also provides that
where a non-PRC resident enterprise transfers its equity interests in a PRC resident enterprise to its
related parties at a price lower than the fair market value, the relevant tax authority has the power to
make a reasonable adjustment to the taxable income of the transaction.
On 3 February 2015, the SAT issued the Circular on Several Issues Relating to Corporate Income
Tax on Gains from Indirect Transfer of Assets by Non-resident Enterprises 《關於非居民企業間接轉讓財產
企業所得稅若干問題的公告》 (“Bulletin 7”), which replaces the relevant provisions on Indirect Transfer
in Circular 698. Bulletin 7 sets out a wider scope of Indirect Transfer of PRC assets that might be
subject to EIT, and more detailed guidelines on the circumstances when such Indirect Transfer is
considered to lack a bona fide commercial purpose and thus regarded as avoiding PRC tax. The
conditional reporting obligation of the non-PRC investor under Circular 698 is replaced by a voluntary
reporting by the transferor, the transferee or the underlying PRC resident enterprise being transferred.
Furthermore, if the Indirect Transfer is subject to EIT, the transferee has an obligation to withhold tax
from the sale proceeds, unless the transferor reports the transaction to the PRC tax authority under
Bulletin 7. The EIT payable is 10% of the attributable capital gain if the transferor is a non-PRC
resident (and may be 25% if the transferor is deemed as PRC tax resident).
Whether Circular 698 and Bulletin 7 would apply to the indirect transfer of equity interests in
PRC resident enterprises that may be undertaken by the Group depends on the ultimate determination of
the PRC tax authority. If Circular 698 and Bulletin 7 are applicable to such transactions, our business,
financial condition, results of operations and growth prospects may be materially and adversely
affected. With reference specifically to the Property Businesses Combination outlined in the “History
and Reorganisation” section and listing of the Company, the CKH Holdings Group has commenced
discussions with the PRC tax authorities with regard to the application of Bulletin 7. However, as noted
under the deed of tax indemnity summarised in the “History and Reorganisation” section and the limits
referred to there, the Company is indemnified by the CKH Holdings Group with respect to the relevant
tax arising from, including the implementation of, the Property Businesses Combination, the
Distribution In Specie and the Spin-off. Please see “History and Reorganisation” for further details on
the deed of tax indemnity and the limitations on the tax indemnity (including the minimum claim size
and the maximum amount of indemnity).
– 64 –
RISK FACTORS
There is uncertainty regarding the PRC withholding tax rate that will be applied to distributions
from the PRC.
The EIT Law provides that a withholding tax at the rate of 10% is applicable to dividends and
other distributions payable by a PRC resident enterprise to investors who are “non-resident enterprises”
(that do not have an establishment or place of business in the PRC, or that have such establishment or
place of business but the relevant dividend or other distribution is not effectively connected with the
establishment or place of business). However, pursuant to the Arrangement between the Mainland of
China and the Hong Kong Special Administrative Region for the Avoidance of Double Taxation and the
Prevention of Fiscal Evasion with respect to Taxes on Income (the “Arrangement”), withholding tax at
a reduced rate of 5% may be applicable to dividends payable to non-resident beneficial owners of the
dividends paid by PRC resident enterprises if certain requirements are met.
There is uncertainty regarding whether the PRC authorities will consider us to be eligible to
receive the reduced tax rate. If the Arrangement is deemed not to apply to dividends payable by our
PRC entities to their respective Hong Kong holding companies that are ultimately owned by the
Company, the withholding tax rate applicable to us will be the statutory rate of 10% instead of 5%
which may materially and adversely affect our business, financial condition, results of operations and
growth prospects.
Our operations are subject to the uncertainties of the PRC legal system and its laws and
regulations.
Our core business and operations are conducted in Hong Kong and the PRC. Our business in the
PRC is growing and its contribution to our turnover and profit is expected to grow. Our business in the
PRC is subject to PRC laws and regulations applicable to foreign investment in the PRC. The PRC
legal system is a civil law system based on written statutes. Unlike the common law system, prior cases
have limited precedential value in deciding subsequent cases in the civil law legal system. Additionally,
PRC written statutes are often principle-oriented and require detailed interpretations by the enforcement
bodies for their application and enforcement. The PRC has made significant progress in the
promulgation of laws and regulations dealing with business and commercial affairs of various
participants of the economy, involving foreign investment, corporate organisation and governance,
commercial transactions, taxation and trade. The promulgation of new laws, changes in existing laws
and abrogation of local regulations by national laws may have a negative impact on our business and
prospects. In addition, given the involvement of different enforcement bodies in regard to the relevant
rules and regulations and the non-binding nature of prior court decisions and administrative rulings, the
interpretation and enforcement of PRC laws and regulations involve significant uncertainties under the
current legal environment, which may materially and adversely impact our business, financial condition,
results of operations and growth prospects.
Restrictions on currency exchange may limit our ability to utilise the RMB-denominated portion
of our revenue effectively.
The PRC government imposes controls on the convertibility between RMB and foreign currencies
and the remittance of foreign exchange out of the PRC. All of our operations in the PRC are conducted
in RMB. Our PRC subsidiaries, associates and joint ventures must convert their RMB into foreign
currency before they may pay cash dividends to us or service their foreign currency denominated
obligations. Under existing PRC foreign exchange regulations, payments of current account items may
be made in foreign currencies without prior approval from SAFE by complying with certain procedural
requirements.
– 65 –
RISK FACTORS
However, approval from appropriate PRC governmental authorities is required when RMB is
converted into foreign currencies and remitted out of the PRC for capital account transactions, such as
the repatriation of equity investment in the PRC and the repayment of the principal of loans
denominated in foreign currencies. Such restrictions on foreign exchange transactions under capital
accounts also affect our ability to finance our PRC business. In addition, our transfer of funds to our
PRC subsidiaries, associates and joint ventures is subject to approval by PRC governmental authorities
in the case of an increase in registered capital, and subject to approval by and registration with PRC
government authorities in case of shareholder loans to the extent that the existing foreign investment
approvals received by our PRC subsidiaries, associates and joint ventures permit any such shareholder
loans at all. These limitations on the flow of funds between us and our PRC subsidiaries, associates and
joint ventures could restrict our ability to act in response to changing market conditions, which may
materially and adversely impact our business, financial condition, results of operations and growth
prospects.
Our prospects may be adversely affected by a recurrence of SARS or an outbreak of other
epidemics, such as influenza A (H1N1 and H3N2) and avian flu (H5N1), and natural disasters.
Any recurrence of Severe Acute Respiratory Syndrome (SARS) or an outbreak of any other
epidemic in the places where we operate, such as influenza A (H1N1 and H3N2) and avian flu (H5N1),
may result in material disruptions to our and our tenants’ businesses. According to the Hong Kong
Department of Health, as at January 2015, the overall influenza activity had continued to increase and
rapidly reached a high level as compared to the peak levels in previous seasons, including with high
activities in Hong Kong. In April 2015, the Hong Kong Department of Health continued to urge the
public to heighten vigilance against seasonal influenza.
Natural disasters or other catastrophic events, such as earthquakes, floods or severe weather
conditions affecting the regions where we operate could, depending upon their magnitude, significantly
disrupt our business operations or cause a material economic downturn in the affected area. For
example, the PRC and a number of other countries have experienced severe earthquakes in recent years
that caused significant property damage and loss of life. There can be no assurance that future
earthquakes or other natural disasters will not occur in the areas where we operate and cause major
damage to our property development projects, assets, infrastructure and facilities.
The occurrence of any of the above may materially and adversely impact our business, financial
condition, results of operations and growth prospects.
RISKS RELATING TO THE LISTING AND THE SPIN-OFF
The Spin-off is conditional upon, and will only be completed immediately following, completion of
the Hutchison Proposal.
The Spin-off is conditional upon, and will only be completed immediately following, completion
of the Hutchison Proposal. The Hutchison Proposal is conditional upon, and will be completed
immediately following, completion of the Husky Share Exchange. We cannot assure you that the Husky
Share Exchange and the Hutchison Proposal will be completed since they are subject to the fulfilment
(or, where relevant, waiver) of a number of conditions precedent. If completion of the Husky Share
Exchange and the Hutchison Proposal do not occur, the Spin-off will not proceed.
– 66 –
RISK FACTORS
There is no existing public market for the Shares and their liquidity and market price may
fluctuate.
Prior to the Listing, there was no public market for, and no established price for, the Shares. The
Company has made an application for the listing of, and permission to deal in, the Shares on the Stock
Exchange. The Listing, however, does not guarantee that an active trading market for the Shares will
develop or, if it does develop, that it will be sustained following the Listing or that the market price of
the Shares will not fluctuate following completion of the Listing. In addition, we cannot assure you that
the Listing will result in the development of an active and liquid public trading market for the Shares.
Furthermore, the price and trading volume of the Shares may be volatile. Factors such as the following
may affect the volume and price at which the Shares will trade:
쐌
actual or anticipated fluctuations in our results of operations;
쐌
news regarding recruitment or loss of key personnel by us or our competitors;
쐌
announcements of competitive developments, acquisitions or strategic alliances in our
industry;
쐌
changes in earnings estimates or recommendations by financial analysts;
쐌
potential litigation or regulatory investigations;
쐌
general economic, market or regulatory conditions or other developments affecting us or our
industry;
쐌
the operating and stock price performance of other companies, other industries and other
events or factors beyond our control; and
쐌
release of lock-up or other transfer restrictions on the outstanding Shares or sales or
perceived sales of additional Shares by the Company, the Controlling Shareholders or other
Shareholders.
You should note that the stock prices of companies in the property industry have experienced
wide fluctuations. Such wide market fluctuations may adversely affect the market price of the Shares.
In addition, the securities markets have from time to time experienced significant price and volume
fluctuations that are not related to the operating performance of particular companies. These market
fluctuations may also materially and adversely affect the market price of the Shares.
Shareholders’ interests in the Company’s share capital may be diluted in the future.
In order to expand our business, we may consider offering and issuing additional Shares or
equity-linked securities in the future, which may result in a dilution in our net tangible book value or
earnings per Share. The Board has been granted an unconditional general mandate to issue Shares with
an aggregate nominal value of not more than 20% of the aggregate nominal value of the ordinary share
capital immediately following completion of the Spin-off, as described in “Appendix VII – General
Information – Further Information About the Company”.
– 67 –
RISK FACTORS
U.S. Holders may be subject to U.S. federal income tax on the receipt of Shares pursuant to the
Distribution In Specie.
For U.S. federal income tax purposes, U.S. Holders receiving Shares in the Distribution In Specie
pursuant to the Spin-Off will be required to treat the issue of Shares pursuant to the Distribution In
Specie as a dividend in a U.S. dollar amount equal to the market value of the Shares on the date of
receipt unless the Distribution In Specie qualifies for tax-deferred treatment under Section 355 of the
U.S. Internal Revenue Code of 1986, as amended (the “Code”). The Company believes that the issue of
Shares pursuant to the Distribution In Specie may qualify as a tax-free distribution under Section 355
of the Code provided that the conditional share offer pursuant to the Hutchison Proposal qualifies as a
reorganisation under Section 368(a) of the Code. Therefore, subject to the discussion of passive foreign
investment company (“PFIC”) rules below, a U.S. Holder receiving Shares in the Distribution In Specie
(i) should not recognise any income, gain or loss upon the receipt of Shares, (ii) should apportion its
tax basis in the CKH Holdings Shares between such CKH Holdings Shares and the Shares received in
the Distribution In Specie in proportion to the relative fair market value of the CKH Holdings Shares
and the Shares on the date on which the Shares are issued, and (iii) should have a holding period for
the Shares that includes the period during which the U.S. Holder held the CKH Holdings Shares.
However, neither the Group nor CKH Holdings has either requested or received an opinion of
U.S. federal income tax counsel that the Distribution In Specie qualifies under Section 355 of the Code
and no ruling has been sought or obtained from the U.S. Internal Revenue Service (“IRS”). There can
be no assurance the IRS will not take a position that the Distribution In Specie does not qualify under
Section 355 of the Code, or that such position would not be sustained if asserted. If such a position
were taken and were sustained, then U.S. Holders would be required to treat the issue of Shares
pursuant to the Distribution In Specie as a dividend in a U.S. dollar amount equal to the fair market
value of the Shares on the date of receipt, would take tax basis in the Shares equal to U.S. dollar
amount included in income as a dividend and would have a holding period in the Shares that begins
with the effective date of the Distribution In Specie.
In addition, if CKH Holdings is considered a PFIC with respect to any U.S. Holder in any taxable
year in which a U.S. Holder has held CKH Holdings Shares, such U.S. Shareholder may be required to
recognise gain with respect to a U.S. Holder’s CKH Holdings Shares, which would be taxable as
ordinary income and could be subject to additional tax.
We cannot guarantee the accuracy of certain facts and statistics contained in this listing
document.
Certain facts and statistics in this listing document, including those relating to Hong Kong, the
PRC, Europe and Asia, their respective economies and their respective real estate industries have been
derived from various official government and other publications generally believed to be reliable. We
believe that the sources of such information are appropriate sources for such information and have
taken reasonable care in extracting and reproducing such information. We have no reason to believe
that such information is false or misleading in any material respect or that any fact has been omitted
that would render such information false or misleading in any material respect. The information has not
been independently verified by us or any of the Relevant Persons and no representation is given as to
its accuracy. Due to possibly flawed or ineffective collection methods or discrepancies between
published information and market practice, the facts and statistics in this listing document may be
inaccurate or may not be comparable to facts and statistics produced with respect to other economies.
– 68 –
RISK FACTORS
Further, we cannot assure you that they are stated or compiled on the same basis or with the same
degree of accuracy (as the case may be) in other jurisdictions. Therefore, you should not rely unduly
upon the facts and statistics contained in this listing document.
You should read this entire listing document carefully and we strongly caution you not to place
any reliance on any information contained in press articles or other media regarding us and the
Spin-off.
Prior to the publication of this listing document, there has been press and media coverage
regarding us and the Spin-off. Such press and media coverage included certain operational information,
financial information, financial projections, valuations and other information about us that are not
contained in this listing document. There may continue to be additional press and media coverage on us
and the Spin-off. We do not accept any responsibility for any such press or media coverage or the
accuracy or completeness of any such information. We make no representation as to the
appropriateness, accuracy, completeness or reliability of any such information or publication. To the
extent that any such information appearing in publications other than this listing document is
inconsistent or conflicts with the information contained in this listing document, we disclaim it, and
accordingly you should not rely on any such information.
– 69 –
DIRECTORS AND PARTIES INVOLVED IN THE SPIN-OFF
The members of the Board are as follows:
Name
Address
Nationality
Executive Directors
Mr. Li Ka-shing (李嘉誠)
(Chairman)
79 Deep Water Bay Road, Hong Kong
Chinese
Mr. Li Tzar Kuoi, Victor (李澤鉅)
(Managing Director and Deputy
Chairman)
79 Deep Water Bay Road, Hong Kong
Chinese
Mr. Kam Hing Lam (甘慶林)
(Deputy Managing Director)
Flat C, 38/F, Block 2, Estoril Court,
55 Garden Road, Hong Kong
Chinese
Mr. Ip Tak Chuen, Edmond (葉德銓)
(Deputy Managing Director)
Flat B2, 10/F, Park Place, No. 7 Tai
Tam Reservoir Road, Hong Kong
Chinese
Mr. Chung Sun Keung, Davy
16 Cape Drive, Chung Hom Kok,
Hong Kong
Chinese
29B, Tower III, Garden Terrace, 8A
Old Peak Road, Hong Kong
Canadian
4th Floor, Yicks Villa, 83 Blue Pool
Road, Happy Valley, Hong Kong
Chinese
16D Butler Towers, No. 1-5 Boyce
Road, Hong Kong
Chinese
9C Olympian Mansion, 9 Conduit
Road, Hong Kong
Chinese
Flat C2, 5/F, Park Place, 7 Tai Tam
Reservoir Road, Hong Kong
British
66A Mount Davis Road, Hong Kong
British
Flat B, 2/F, Braemar Hill Mansions,
No. 23 Braemar Hill Road, Hong
Kong
Chinese
Mr. Simon Murray (馬世民)
Ground Floor, Block B, 39 Tung Tau
Wan Road, Hong Kong
British
Mr. Yeh Yuan Chang, Anthony
22 Oxford Road, Kowloon Tong,
Kowloon, Hong Kong
British
(鍾慎強)
Mr. Chiu Kwok Hung, Justin
(趙國雄)
Mr. Chow Wai Kam
(周偉淦)
Ms. Pau Yee Wan, Ezra
(鮑綺雲)
Ms. Woo Chia Ching, Grace
(吳佳慶)
Independent Non-executive Directors
Mr. Cheong Ying Chew, Henry
(張英潮)
Mr. Chow Nin Mow, Albert
(周年茂)
Ms. Hung Siu-lin, Katherine
(洪小蓮)
(葉元章)
For further details of the Directors, see “Directors and Senior Management”.
– 70 –
DIRECTORS AND PARTIES INVOLVED IN THE SPIN-OFF
Joint Sponsors
Merrill Lynch Far East Limited
55/F, Cheung Kong Center
2 Queen’s Road Central
Central
Hong Kong
HSBC Corporate Finance (Hong Kong) Limited
1 Queen’s Road Central
Hong Kong
Legal Counsel to the Company
Hong Kong counsel:
Woo Kwan Lee & Lo
26th Floor, Jardine House
1 Connaught Place
Central
Hong Kong
International and U.S. counsel:
Freshfields Bruckhaus Deringer
11th Floor, Two Exchange Square
Hong Kong
PRC counsel:
Commerce & Finance Law Offices
6F NCI Tower
A12 Jianguomenwai Avenue
Chaoyang District
Beijing 100022
PRC
Guantao Law Firm
17/F, Tower 2, Yingtai Center
28 Finance Street
Xicheng District
Beijing 100033
PRC
Cayman Islands counsel:
Maples and Calder
53rd Floor, The Center
99 Queen’s Road Central
Hong Kong
– 71 –
DIRECTORS AND PARTIES INVOLVED IN THE SPIN-OFF
Legal Counsel to the Joint
Sponsors
Hong Kong and U.S. counsel:
Linklaters
10th Floor, Alexandra House
18 Chater Road
Central
Hong Kong
PRC counsel:
King & Wood Mallesons
20th Floor, East Tower
World Financial Center
1 Dongsanhuan Zhonglu
Chaoyang District
Beijing 100020
PRC
Reporting Accountants and
Auditor
Deloitte Touche Tohmatsu
Certified Public Accountants
35/F, One Pacific Place
88 Queensway
Hong Kong
Property Valuers
As to all properties valued (other than certain properties in the
United Kingdom and properties in The Bahamas):
DTZ Debenham Tie Leung Limited
16th Floor, Jardine House
1 Connaught Place
Central
Hong Kong
As to certain properties in the United Kingdom:
Gerald Eve LLP
72 Welbeck Street
London
W1G 0AY
United Kingdom
Smiths Gore
17-18 Old Bond Street
London
W1S 4PT
United Kingdom
As to certain properties in The Bahamas:
CBRE, Inc.
777 Brickell Ave.
Suite 900
Miami, FL 33131
United States of America
– 72 –
CORPORATE INFORMATION
Registered Office
PO Box 309
Ugland House
Grand Cayman
KY1-1104
Cayman Islands
Head Office and Principal Place
of Business in Hong Kong
7th Floor
Cheung Kong Center
2 Queen’s Road Central
Hong Kong
Company Secretary
Ms. Eirene Yeung LLB, FCS, FCIS
7th Floor
Cheung Kong Center
2 Queen’s Road Central
Hong Kong
Authorised Representatives
Mr. Ip Tak Chuen, Edmond
7th Floor
Cheung Kong Center
2 Queen’s Road Central
Hong Kong
Ms. Eirene Yeung
7th Floor
Cheung Kong Center
2 Queen’s Road Central
Hong Kong
Audit Committee
Mr. Cheong Ying Chew, Henry (Chairman)
Mr. Chow Nin Mow, Albert
Ms. Hung Siu-lin, Katherine
Remuneration Committee
Ms. Hung Siu-lin, Katherine (Chairman)
Mr. Li Ka-shing
Mr. Cheong Ying Chew, Henry
Compliance Adviser
Haitong International Capital Limited
22/F, Li Po Chun Chambers
189 Des Voeux Road Central
Hong Kong
Principal Bankers
Mizuho Bank, Ltd.
17/F, Two Pacific Place
88 Queensway
Hong Kong
– 73 –
CORPORATE INFORMATION
The Bank of Tokyo-Mitsubishi UFJ, Ltd.
8/F, AIA Central
1 Connaught Road Central
Hong Kong
Bank of China (Hong Kong) Limited
Bank of China Tower
1 Garden Road
Central
Hong Kong
The Hongkong and Shanghai Banking Corporation Limited
1 Queen’s Road Central
Hong Kong
Sumitomo Mitsui Banking Corporation
7/F-8/F, One International Finance Centre
1 Harbour View Street
Central
Hong Kong
Citibank, N.A.
39/F-40/F & 43/F-50/F
Citibank Tower
Citibank Plaza
3 Garden Road
Hong Kong
Overseas-Chinese Banking Corporation Limited
9/F, Nine Queen’s Road Central
Hong Kong
Bank of America, N.A.
52/F, Cheung Kong Center
2 Queen’s Road Central
Central
Hong Kong
China Construction Bank (Asia) Corporation Limited
28/F, CCB Tower
3 Connaught Road Central
Central
Hong Kong
Standard Chartered Bank (Hong Kong) Limited
4-4A Des Voeux Road
Central
Hong Kong
– 74 –
CORPORATE INFORMATION
Cayman Principal Share
Registrar and Transfer Office
Maples Fund Services (Cayman) Limited
P.O. Box 1093
Boundary Hall
Cricket Square
Grand Cayman KY1-1102
Cayman Islands
Hong Kong Share Registrar and
Transfer Office
Computershare Hong Kong Investor Services Limited
Shops 1712-1716, 17th Floor
Hopewell Centre
183 Queen’s Road East
Wanchai
Hong Kong
Company’s Website
www.ckph.com.hk
(A copy of this listing document is available on the Company’s
website. Except for the information contained in this listing
document, none of the other information contained on the
Company’s website forms part of this listing document)
– 75 –
HISTORY AND REORGANISATION
HISTORY
The Company’s predecessor, Cheung Kong, became listed in Hong Kong in 1972, and the Group
benefits from a long and successful track record of over 40 years. Through investment in the Cheung
Kong Group and the Hutchison Group, Mr. Li Ka-shing, our founder and Chairman, expanded the
Group’s property development business in Hong Kong. With over 40 years of refinement, we have
become one of the largest developers of residential, office, retail, industrial and hotel properties in
Hong Kong. Whilst maintaining a strategic focus on property development projects in Hong Kong, the
Group expanded its presence to the PRC in the 1980s and to overseas markets in the 1990s. We have
also developed a property and project management business to support our development and investment
properties. With our expertise and strength in property development and investment, we also developed
our business scope to include hotel and serviced suite operation and interests in listed REITs.
Key Milestones
Some of the key milestones of our development over the past 40 years are set out below:
Year
Key Milestone
1972. . . . . . . . . . .
Listing of the Company’s predecessor, Cheung Kong, in Hong Kong
1977. . . . . . . . . . .
Acquisition of Hong Kong Hilton Hotel and shopping arcade, then a 5-star hotel
of the Group, which was subsequently re-developed as Cheung Kong Center
1978. . . . . . . . . . .
Completion of Braemar Hill Mansions, a major residential property development
project in Hong Kong in which the Group had a 50% interest
1978. . . . . . . . . . .
Completion of the redevelopment of China Building in Central, Hong Kong,
where the headquarters of Cheung Kong was situated until the relocation of the
headquarters to Cheung Kong Center after its completion in 1999
1980 . . . . . . . . . .
Completion of Admiralty Centre in Admiralty, Hong Kong, one of the first major
commercial joint development property projects, which is close to the Admiralty
MTR station
1982. . . . . . . . . . .
Completion of Aberdeen Centre in Hong Kong, a large scale housing estate of the
Group
1985-1991 . . . . . .
Completion of Whampoa Garden in Hung Hom, Kowloon, a large scale
residential estate comprising both residential towers and shopping complex of the
Group, through the redevelopment of the former Hung Hom dockyards
1989. . . . . . . . . . .
Participation in the development of two former industrial sites at Ap Lei Chau
and Kwun Tong in Hong Kong into two residential and commercial developments
of the Group known as South Horizons and Laguna City
– 76 –
HISTORY AND REORGANISATION
Year
Key Milestone
1990-1993 . . . . . .
Completion of Hutchison Logistics Centre, a multi-storey drive-in freight
distribution centre located in Kwai Chung Container Terminals in Hong Kong,
one of the busiest container ports in the world
1995. . . . . . . . . . .
Completion of The Harbourfront, Grade A twin office towers adjacent to
Whampoa Garden residential estate of the Group in Hong Kong
1995. . . . . . . . . . .
Opening of Harbour Grand Kowloon, formerly known as the Harbour Plaza
Hotel, the first hotel built and managed by the Group in Hong Kong
1998. . . . . . . . . . .
Completion of The Center, a Grade A commercial building with a central core
design located at a prime location in the business district of Hong Kong, a joint
development of the Group
1999. . . . . . . . . . .
Completion of Cheung Kong Center, the Group’s flagship commercial complex
and the Group’s first intelligent building utilising innovative design and
sophisticated technology, located in the heart of Central, Hong Kong
1999. . . . . . . . . . .
Opening of Bahamas Grand Lucayan, the Group’s large scale resort in The
Bahamas, earmarking the expansion of the Group’s development and operation of
hotel businesses outside Hong Kong
2000-2004 . . . . . .
Completion of Beijing Oriental Plaza, one of the largest commercial complexes in
the political and commercial heart of Beijing, the PRC, with a total GFA of
763,482 sq.m., comprising a shopping centre, office buildings, serviced apartment
towers, a hotel and car parking spaces
2002-2007 . . . . . .
Awarded the tender for the residential and retail development project at Tiu Keng
Leng Station along the Tseung Kwan O Line of the MTR, and awarded the tender
for the development at Packages One, Two and Three of LOHAS Park Station,
Tseung Kwan O Line of the MTR
2003. . . . . . . . . . .
Listing of Fortune REIT on Singapore Stock Exchange
2005. . . . . . . . . . .
Listing of Prosperity REIT on the Main Board of the Stock Exchange
2009. . . . . . . . . . .
Completion of 1881 Heritage, a new heritage revitalisation landmark for cultural
tourism, shopping and leisure in Hong Kong, which was revitalised and
redeveloped from the former Marine Police Headquarters
2010. . . . . . . . . . .
Listing of Fortune REIT on the Main Board of the Stock Exchange
2010-2013 . . . . . .
Completion of Phases 1 and 2 of La Grande Ville, a residential complex in
Beijing, the PRC
2011 . . . . . . . . . . .
The Group injected its interest in Beijing Oriental Plaza in Beijing into Hui Xian
REIT upon the establishment of the REIT, the first RMB-denominated REIT
listed on the Stock Exchange, and the first RMB-denominated equity security
listed outside the PRC
– 77 –
HISTORY AND REORGANISATION
PRINCIPAL SUBSIDIARIES
The Group is one of Hong Kong’s largest property developers, with a leading market share in
Hong Kong, strong penetration in the PRC and an international presence. We develop, own and/or
manage residential, office, retail, industrial and hotel property in Hong Kong, the PRC, Singapore, the
United Kingdom and The Bahamas. Due to the project-specific nature of our business, the Group
established individual project companies for the holding, development and operation of different
projects. Upon Listing, the Group will comprise over 1,000 companies.
Details of certain information on the Principal Subsidiaries upon Listing are set out in “Appendix
VII – General Information – Further Information about the Company – Subsidiaries – Principal
Subsidiaries”.
THE REORGANISATION
In preparation for the Listing, the following steps are being implemented to establish the Group:
1.
Incorporation of various companies
Prior to the Latest Practicable Date, the Company and certain wholly-owned subsidiaries (being
Mighty State Limited, Agate Glory Limited, Novel Trend Holdings Limited, CK Property Finance
Limited and New Challenge Global Limited) were incorporated.
2.
Cheung Kong Reorganisation
On 9 January 2015, Cheung Kong proposed a group reorganisation by way of a scheme of
arrangement pursuant to Division 2 of Part 13 of the Companies Ordinance. The Cheung Kong
Reorganisation was completed on 18 March 2015 whereupon (i) the holding company of the Cheung
Kong Group was changed from Cheung Kong to CKH Holdings, (ii) the shareholders of Cheung Kong
(other than certain non-qualifying overseas shareholders of Cheung Kong) became shareholders of CKH
Holdings, with the same shareholding proportion as they held shares in Cheung Kong as at the record
time of 4:00 p.m. on 17 March 2015 and (iii) the listing of the shares of Cheung Kong on the Stock
Exchange was withdrawn and the CKH Holdings Shares became listed on the Stock Exchange by way
of introduction.
3.
Merger Proposal
A.
Husky Share Exchange
On 9 January 2015, the Husky Sale Shares Purchaser entered into a conditional agreement
with the Husky Sale Shares Vendor for the acquisition of 61,357,010 Husky Shares, representing
approximately 6.24% of the common shares of Husky in issue as at the date thereof. Pursuant to
the Husky Share Exchange Agreement, the consideration for the acquisition will be satisfied by
the issue of 84,427,246 new CKH Holdings Shares by CKH Holdings to the Husky Sale Shares
Vendor (or as it may direct), credited as fully paid (representing a share exchange ratio of 1.376
new CKH Holdings Shares for each Husky Share to be acquired). In the event that the acquisition
of the 61,357,010 Husky Shares (whether on its own or together with the completion of the
Hutchison Proposal) by the Husky Sale Shares Purchaser and the issue of the 84,427,246 new
CKH Holdings Shares to the Husky Sale Shares Vendor (or as it may direct) as consideration
would, after taking into account any other acquisitions of shares by concert parties of the Trust (if
– 78 –
HISTORY AND REORGANISATION
any), result in the Trust incurring a mandatory general offer obligation under the Takeovers Code
in respect of CKH Holdings, the 61,357,010 Husky Shares which are the subject of the Husky
Share Exchange Agreement (and correspondingly the number of CKH Holdings Shares to be
issued as consideration under the Husky Share Exchange) may be reduced to such number as may
be agreed between the parties to the Husky Share Exchange Agreement at any time before
completion of the Husky Share Exchange to the extent as would result in such mandatory general
offer obligation not being incurred.
Completion of the Husky Share Exchange, which will take place immediately before the
Hutchison Scheme becomes effective, is conditional upon the fulfilment (or, where relevant,
waiver) of a number of conditions precedent. Certain conditions precedent have been fulfilled as
at the Latest Practicable Date and the following are the conditions precedent which remain to be
fulfilled (or, where relevant, waived):
(a)
the conditions precedent to the Hutchison Proposal (other than the condition precedent
relating to completion of the Husky Share Exchange) having been fulfilled or waived
(as the case may be) and the Hutchison Proposal not having been terminated;
(b)
all authorisations, registrations, filings, rulings, consents, permissions and approvals
(including approval in-principle) which may be required under any existing contractual
arrangements or regulatory requirements having been obtained and all regulatory filing
obligations having been complied with;
(c)
the Listing Committee granting approval for the listing of, and permission to deal in,
the CKH Holdings Shares to be issued as consideration for the Husky Share Exchange
on the Main Board of the Stock Exchange and such approval not having been revoked
prior to completion of the Husky Share Exchange;
(d)
the warranties, representations, undertakings and indemnities given by the Husky Sale
Shares Vendor in the Husky Share Exchange Agreement remaining true and accurate in
all material respects and not misleading in any material respect;
(e)
the conditions precedent to the Spin-off (as further described in “The Distribution In
Specie and the Spin-off – Distribution In Specie – Conditions Precedent to the
Spin-off”) (other than the conditions precedent relating to completion of the Husky
Share Exchange and the Hutchison Proposal) having been fulfilled or waived (as the
case may be); and
(f)
no mandatory general offer obligation under the Takeovers Code being incurred by the
Trust in respect of CKH Holdings as a result of the completion of the Husky Share
Exchange (whether on its own or together with the completion of the Hutchison
Proposal), or if any such mandatory general offer obligation is incurred, a waiver of
such obligation having been granted by the SFC Executive and the fulfilment of any
conditions or requirements for the waiver.
Assuming that (i) there is no other change in the shareholding of Husky from the Latest
Practicable Date to the date of completion of the Husky Share Exchange and (ii) there is no
reduction of the 61,357,010 Husky Shares to be acquired and the corresponding 84,427,246 new
– 79 –
HISTORY AND REORGANISATION
CKH Holdings Shares to be issued under the Husky Share Exchange, the aggregate holding of
common shares in Husky in issue by the Hutchison Group will increase from approximately
33.96% to approximately 40.20% immediately upon completion of the Husky Share Exchange.
B.
Hutchison Proposal
On 31 March 2015, the Hutchison Proposal Offeror made a conditional share exchange offer
to the Hutchison Scheme Shareholders for cancellation of all the Hutchison Shares held by them
by way of a scheme of arrangement pursuant to Division 2 of Part 13 of the Companies
Ordinance, and in consideration, each Hutchison Scheme Shareholder (other than the
Non-Qualifying Hutchison Overseas Shareholders) will receive 0.684 of a CKH Holdings Share
for each Hutchison Scheme Share held at the Hutchison Scheme Record Time. Pursuant to the
Hutchison Proposal, it is proposed that on the date on which the Hutchison Scheme, if approved
and sanctioned by the Court, becomes effective in accordance with its terms (which is expected to
be on 3 June 2015):
(a)
the share capital of Hutchison will be reduced by cancelling and extinguishing the
Hutchison Scheme Shares (being all the Hutchison Shares in issue as at the Hutchison
Scheme Record Time, other than those held by the Relevant CKH Holdings
Subsidiaries);
(b)
subject to and immediately upon such reduction of capital taking effect, the share
capital of Hutchison will be increased to its former amount by the creation of such
number of new Hutchison Shares as is equal to the number of Hutchison Scheme
Shares cancelled;
(c)
Hutchison will apply all credit arising in its books of account as a result of such
capital reduction in paying up the newly created Hutchison Shares, which will be
allotted and issued, credited as fully paid, to the Hutchison Proposal Offeror (which is
a wholly-owned subsidiary of CKH Holdings); and
(d)
in consideration for the cancellation and extinguishment of the Hutchison Scheme
Shares, the Hutchison Scheme Shareholders (other than the Non-Qualifying Hutchison
Overseas Shareholders) will receive CKH Holdings Shares (which will rank pari passu
with each other and with all other CKH Holdings Shares then in issue), credited as
fully paid, in the share exchange ratio of 0.684 of a CKH Holdings Share for each
Hutchison Scheme Share held as at the Hutchison Scheme Record Time.
Completion of the Hutchison Proposal, which will take place immediately after completion
of the Husky Share Exchange and immediately prior to completion of the Property Businesses
Combination, is subject to the fulfilment (or, where relevant, waiver) of a number of conditions
precedent. Certain conditions precedent have been fulfilled as at the Latest Practicable Date and
the following are the conditions precedent which remain to be fulfilled (or, where relevant,
waived):
(a)
the Hutchison Scheme, with or without modification, being sanctioned and the
proposed reduction of capital provided for in the Hutchison Scheme being confirmed
by the Court, and an office copy of the Court order together with the minute and a
return that comply with subsections (2) and (3) of section 230 of the Companies
Ordinance respectively being registered by the Companies Registrar;
– 80 –
HISTORY AND REORGANISATION
(b)
the Listing Committee granting approval for the listing of, and permission to deal in,
the CKH Holdings Shares to be issued as consideration under the Hutchison Scheme
on the Main Board of the Stock Exchange and such approval not having been revoked
prior to the Hutchison Scheme becoming effective;
(c)
completion of the Husky Share Exchange having occurred;
(d)
the fulfilment (or, where relevant, waiver) of all the conditions precedent to the
Spin-off (as further described in “The Distribution In Specie and the Spin-off –
Distribution In Specie – Conditions Precedent to the Spin-off”) (other than the
condition precedent relating to the Hutchison Proposal having been completed);
(e)
all applicable filings, notices and waivers required in connection with the Hutchison
Proposal and its implementation from or with any competent governmental or
regulatory body being made, and if applicable, any waiting periods under any
applicable antitrust or similar laws and regulations having expired or terminated; and
(f)
all other authorisations, registrations, filings, rulings, consents, permissions and
approvals (including approval in-principle) which may be required in connection with
the Hutchison Proposal under any existing contractual arrangements, including loan and
other finance documentation, or regulatory requirements having been obtained and all
regulatory filing obligations having been complied with.
Upon completion of the Hutchison Proposal, (i) Hutchison will become a wholly-owned
subsidiary of CKH Holdings and (ii) the listing of Hutchison Shares on the Stock Exchange will
be withdrawn and the CKH Holdings Shares to be issued as consideration under the Hutchison
Scheme will be listed on the Stock Exchange.
4.
Property Businesses Combination
In preparation for the Listing and before the commencement of dealings in the Shares on the
Stock Exchange, a number of pre-completion and reorganisation steps have been or will be taken,
pursuant to which interests in the Combined Property Businesses currently under the CKH Holdings
Group and/or the Hutchison Group will be reorganised under the Group. The reorganisation steps
include the following:
(a)
shares in a number of the CPB Companies will be reorganised to form part of the Group
pursuant to the Reorganisation Agreement; and
(b)
loans owing by certain CPB Companies to the Cheung Kong Group or the Hutchison Group
at Completion (as defined below) will be assigned to the Group pursuant to the
Reorganisation Agreement and the Specified Loans Purchase Agreement.
Further details of the reorganisation steps are set out below.
– 81 –
HISTORY AND REORGANISATION
A.
The Specified Loans Purchase Agreement
On 5 May 2015, the Company entered into the Specified Loans Purchase Agreement with CKH
Holdings, a wholly-owned subsidiary of Cheung Kong and a wholly-owned subsidiary of Hutchison,
pursuant to which the Company conditionally agreed to accept the assignment from those subsidiaries
of certain interest-bearing loans owing by certain CPB Companies to them as at Completion (the
“Specified Loans”).
(1)
Conditions to Completion of the Assignment of the Specified Loans under the Specified
Loans Purchase Agreement
Completion of the assignment of the Specified Loans under the Specified Loans Purchase
Agreement is conditional upon the fulfilment (or, where applicable, waiver) of the conditions which are
summarised below:
(a)
the fulfilment (or, where applicable, waiver) of the conditions to completion of the Reorganisation
Agreement Transactions (as referred to in “– The Reorganisation Agreement” below), other than
the condition relating to the fulfilment (or, where applicable, waiver) of the conditions to
completion of the Specified Loans Purchase Agreement; and
(b)
the warranties given by relevant members of the Cheung Kong Group and the Hutchison Group
and CKH Holdings under the Specified Loans Purchase Agreement remaining true and accurate in
all material respects and not misleading in any material respects.
The condition in (a) above cannot be waived. The Company has the right to waive the condition
in (b) above in whole or in part. Subject to the fulfilment (or, where applicable, waiver) of the
conditions above, completion of the assignment of the Specified Loans will take place simultaneously
with completion of the Reorganisation Agreement Transactions (as defined below) (together referred to
in this “History and Reorganisation” section as “Completion”) immediately after the Hutchison Scheme
becomes effective and before completion of the Distribution In Specie on the Listing Date (referred to
in this “History and Reorganisation” section as the “Completion Date”).
(2)
Consideration
The consideration for the assignment of the Specified Loans will be an amount equal to the
outstanding principal amounts of the Specified Loans as at the Completion Date plus any unpaid
interest accrued thereon up to and excluding the Completion Date, such consideration will in aggregate
be HK$55 billion.
(3)
Settlement of Consideration
At Completion, the aggregate consideration for the assignment of the Specified Loans will be
settled by way of the issue of a promissory note in the principal amount of HK$55 billion by the
Company to CKH Holdings (the “Specified Loans Promissory Note”). Such promissory note is to be
settled by payment of cash on or before the fifth business day following the Completion Date (the
“Payment Date”) and is non-interest bearing (except for any amount which remains unpaid after the
Payment Date, after which interest will be payable at the rate of one-month HIBOR plus 1% per annum
until the date of payment of all outstanding amount). The Group has entered into two loan facilities in
the aggregate amount of no less than HK$55 billion or its equivalent with a group of lenders (the
“Loan Facilities”), the proceeds of which will be used to settle the Specified Loans Promissory Note.
– 82 –
HISTORY AND REORGANISATION
(4)
Guarantee
CKH Holdings will guarantee the performance by the relevant members of the Cheung Kong
Group and the Hutchison Group of their respective obligations under or pursuant to the Specified Loans
Purchase Agreement.
(5)
Representations and Warranties and Related Liability
The Specified Loans Purchase Agreement contains representations and warranties given severally
by the relevant members of the Cheung Kong Group and the Hutchison Group and representations and
warranties given by CKH Holdings subject to limitations. The aggregate liability of the relevant
members of the Cheung Kong Group and the Hutchison Group and CKH Holdings under the Specified
Loans Purchase Agreement, the Reorganisation Agreement and the Deed of Tax Indemnity (each as
further described in “− The Reorganisation Agreement” and “− Deed of Tax Indemnity” below) is
subject to a maximum amount of US$7 billion.
B.
The Reorganisation Agreement
On 5 May 2015, the Company and certain subsidiaries of the Company entered into the
Reorganisation Agreement with certain members of the Cheung Kong Group and the Hutchison Group
and CKH Holdings, pursuant to which:
(a)
shares and/or other interests in a number of the CPB Companies will be reorganised to form part
of the Group (the “CPB Companies Share Reorganisation”); and
(b)
loans owing by certain CPB Companies to the Cheung Kong Group or the Hutchison Group (other
than the Specified Loans) at Completion will be assigned to the Group (the “Reorganisation
Agreement Loans Assignment”).
The transactions in (a) and (b) above are together referred to as the “Reorganisation Agreement
Transactions”.
The principal terms and conditions of the Reorganisation Agreement are summarised below.
(1)
Conditions to Completion of the Reorganisation Agreement Transactions
Completion of the Reorganisation Agreement Transactions is conditional upon the fulfilment (or,
where applicable, waiver) of a number of conditions which are summarised below:
(a)
the Hutchison Scheme having become effective;
(b)
all authorisations which may be required in connection with the transactions contemplated under
the Reorganisation Agreement under any existing contractual arrangements having been obtained
and all regulatory filing obligations having been complied with;
(c)
the warranties given by the relevant members of the Cheung Kong Group and the Hutchison
Group and CKH Holdings under the Reorganisation Agreement (together, the “CKH Holdings
Warranties”) remaining true and accurate in all material respects and not misleading in any
– 83 –
HISTORY AND REORGANISATION
material respect and there being no material adverse change or effect on the CPB Companies as a
whole resulting from any of the CKH Holdings Warranties not being true and accurate or being
misleading;
(d)
there being no material breach of any terms of the Reorganisation Agreement on the part of the
relevant members of the Cheung Kong Group and the Hutchison Group resulting in any material
adverse change or effect on the CPB Companies as a whole; and
(e)
the fulfilment (or, where applicable, waiver) of the conditions to completion of the assignment of
the Specified Loans, other than the condition relating to the fulfilment (or, where applicable,
waiver) of the conditions to completion of the Reorganisation Agreement Transactions.
The conditions in (a) and (e) cannot be waived. The Company has the right to waive any of the
conditions in (b) to (d) above in whole or in part and either generally or in respect of any particular
matter.
Subject to the fulfilment (or, where relevant, waiver) of the conditions referred to above,
completion of the Reorganisation Agreement Transactions will take place simultaneously with
completion of the assignment of the Specified Loans immediately after the Hutchison Scheme becomes
effective and before completion of the Distribution In Specie on the Listing Date.
(2)
Consideration
(i)
Consideration for the CPB Companies Share Reorganisation
The consideration for the CPB Companies Share Reorganisation will be an amount equal to the
aggregate of the net asset values attributable to ordinary / common shareholders of the CPB Companies
as at the Completion Date based on (i) the unaudited consolidated net asset value attributable to
ordinary / common shareholders as at 31 March 2015 of the relevant CPB Companies and (ii) the
estimated changes in the unaudited consolidated net asset value attributable to ordinary / common
shareholders of the relevant CPB Companies during the period from 1 April 2015 to the day
immediately preceding the Completion Date, as agreed between CKH Holdings and the Company.
(ii)
Consideration for the Reorganisation Agreement Loans Assignment
The consideration for the Reorganisation Agreement Loans Assignment will be an amount equal to
the aggregate of the outstanding principal amounts of the relevant loans as at the Completion Date (if
applicable, plus any unpaid interest accrued thereon up to and excluding the Completion Date).
(3)
Settlement of Consideration
The aggregate consideration for the Reorganisation Agreement Transactions will be settled by way
of the issue of a promissory note (the “Reorganisation Promissory Note”) by the Company to CKH
Holdings, and the debt due from the Company to CKH Holdings pursuant to such promissory note will
be settled at Completion through the issue of one new Share by the Company to CKH Holdings
credited as fully paid at a premium, with the premium equal to the principal amount of that promissory
note less HK$1 (being the par value of one Share).
– 84 –
HISTORY AND REORGANISATION
(4)
Passing of Economic Interests
The reorganisation of the interests held directly or indirectly through certain CPB Companies to
form part of the Group, including in particular the interests in certain development agreements, joint
venture agreements, shareholders agreements and other similar agreements and ancillary documents
(together the “Property Agreements”) entered into with third parties (the “Third Party Agreements”),
requires third party consents (the “Third Party Consents”). In the event that, in respect of any CPB
Companies, the relevant Third Party Consent cannot be obtained to the satisfaction of the Company on
or before 10 business days prior to the Completion Date (the “CPB Specified Companies”), the
relevant members of the CKH Holdings Group and the Hutchison Group will, pursuant to the
Reorganisation Agreement, pass on the economic interests in and other rights and obligations in respect
of such CPB Specified Companies to the Group (the “Contractual Arrangement”) from the
Completion Date until the date on which the remaining steps of the Reorganisation Agreement
Transactions in respect of the relevant CPB Specified Companies, which are to take place within five
business days (a) after the Completion Date (in relation to the CPB Specified Companies the Third
Party Consents of which are obtained within 10 business days prior to the Completion Date) or (b) after
the date when the relevant Third Party Consents are obtained (in relation to the CPB Specified
Companies the Third Party Consents of which are obtained on or after the Completion Date), are
completed and become effective (the “Effective Period”).
The Contractual Arrangement will include, among others, the relevant members of the CKH
Holdings Group and Hutchison Group procuring payment to the Group of amounts representing the
economic interests (including revenue and other income arising from the Third Party Agreements and
the relevant property interest or development interest) attached, accrued or accruing to the CPB
Specified Companies and belonging to the relevant members of the CKH Holdings Group and
Hutchison Group during the Effective Period. During the Effective Period, (a) the Group will take all
such steps and actions necessary to cause the discharge and performance of all the obligations and
undertakings of the relevant members of the CKH Holdings Group and the Hutchison Group and the
CPB Specified Companies under the relevant Third Party Agreements and (b) the relevant members of
the CKH Holdings Group and Hutchison Group will exercise all voting rights and powers (including
the right to nominate director(s) of the CPB Specified Companies) attaching to their ownership interest
in the CPB Specified Companies in accordance with the direction of the Group.
(5)
Representations and Warranties and Related Liability
The Reorganisation Agreement contains representations and warranties given severally by the
relevant members of the Cheung Kong Group and the Hutchison Group, and representations and
warranties given by CKH Holdings, subject to limitations.
No claim shall be brought by the Group under the Reorganisation Agreement unless each claim
exceeds US$120 million. The aggregate liability of the relevant members of the Cheung Kong Group
and the Hutchison Group and CKH Holdings under the Specified Loans Purchase Agreement, the
Reorganisation Agreement and the Deed of Tax Indemnity (as further described in “– Deed of Tax
Indemnity” below) is subject to a maximum amount of US$7 billion.
– 85 –
HISTORY AND REORGANISATION
(6)
Guarantees
Under the Reorganisation Agreement:
(a)
CKH Holdings has agreed to guarantee the performance by the Cheung Kong Group and the
Hutchison Group of their respective obligations under or pursuant to the Reorganisation
Agreement; and
(b)
the Company has agreed to guarantee the performance by the relevant members of the Group of
their obligations under or pursuant to the Reorganisation Agreement.
(7)
Undertakings
Under the Reorganisation Agreement, the Company will use all reasonable endeavours to procure
that, as from Completion (and, in the case of the CPB Specified Companies, the completion of the
reorganisation of the relevant CPB Specified Companies to form part of the Group), all members of the
CKH Holdings Group are released from all their obligations under the Property Agreements, all
guarantees and indemnities given by any of them in respect of any obligations of any CPB Companies
and, pending such release, the Company will indemnify such members of the CKH Holdings Group
against all liabilities arising under the above obligations under the Property Agreements, guarantees and
indemnities in respect of, or attributable to, the period after Completion.
C.
Deed of Tax Indemnity
On 5 May 2015, the Company entered into a deed of tax indemnity (the “Deed of Tax
Indemnity”) with CKH Holdings, Cheung Kong and HIL, under which Cheung Kong and HIL severally
covenanted, conditional upon Completion having taken place and subject to limitations, to indemnify
and pay for certain tax liabilities of the CPB Companies owned by the Cheung Kong Group and the
Hutchison Group respectively before the Property Businesses Combination including, among other
things, those tax liabilities arising from events occurring on or before Completion or in respect of any
gains accrued on or before Completion or any tax liabilities arising as a result of the pre-completion
reorganisation, the assignment of the Specified Loans, the Reorganisation Agreement Transactions, the
Distribution In Specie or the Spin-off. CKH Holdings has agreed to guarantee the performance by
Cheung Kong and HIL of their respective obligations under the Deed of Tax Indemnity.
No claim shall be brought in respect of the covenant and indemnity given by each of Cheung
Kong and HIL (the “indemnifying parties”) under the Deed of Tax Indemnity unless the claim against
such indemnifying party exceeds US$120 million. The aggregate liability of the relevant members of
the Cheung Kong Group and the Hutchison Group and CKH Holdings under the Specified Loans
Purchase Agreement, the Reorganisation Agreement and the Deed of Tax Indemnity is subject to a
maximum amount of US$7 billion.
– 86 –
HISTORY AND REORGANISATION
CORPORATE STRUCTURE PRIOR TO THE MERGER PROPOSAL AND THE SPIN-OFF
Below is a simplified corporate structure of CKH Holdings, Cheung Kong, Hutchison, Husky, and
the Company as at the Latest Practicable Date:
Other
shareholders of
CKH Holdings(1)
Mr. Li Ka-shing
and
Mr. Li Tzar Kuoi, Victor
The Trust
40.43%
56.58%
2.99%
Other
shareholders of
Hutchison(2)
CKH Holdings
(listed on the Stock Exchange)
100.00%
Cheung Kong
0.27%
49.97%
2.25%
100.00%
47.51%
Hutchison
(listed on the
Stock Exchange)
The Company
33.96%
35.56%
Husky
(listed on the
Toronto Stock
Exchange)
Combined
Property
Businesses (3)
Combined
NonProperty
Businesses (3)
Notes:
(1)
The other shareholders of CKH Holdings include certain core connected persons of CKH Holdings (including, among
others, certain directors of CKH Holdings (other than Mr. Li Ka-shing and Mr. Li Tzar Kuoi, Victor)), who are not
regarded as public shareholders of CKH Holdings under the Listing Rules.
(2)
The other shareholders of Hutchison include certain core connected persons of Hutchison (including, among others, certain
directors of Hutchison (other than Mr. Li Ka-shing and Mr. Li Tzar Kuoi, Victor)), who are not regarded as public
shareholders of Hutchison under the Listing Rules.
(3)
Prior to the Property Businesses Combination, the Combined Property Businesses and the Combined Non-Property
Businesses are businesses jointly and/or separately owned by the CKH Holdings Group and the Hutchison Group.
(4)
Some percentage figures may not add up due to rounding differences.
– 87 –
HISTORY AND REORGANISATION
CORPORATE STRUCTURE IMMEDIATELY AFTER COMPLETION OF THE PROPOSALS
AND THE LISTING
The simplified shareholding and corporate structure of the Group immediately after completion of
the Proposals and the Listing is set out below:
The Trust
26.66%
Mr. Li Ka-shing
and
Mr. Li Tzar Kuoi, Victor
3.49%
Other
shareholders(1)
69.85%
The Company
(listed on the Stock
Exchange)
Combined
Property
Businesses
Notes:
(1)
The other shareholders of the Company include certain core connected persons of the Company (including, among others,
certain directors of the Company (other than Mr. Li Ka-shing and Mr. Li Tzar Kuoi, Victor)), who are not regarded as
public shareholders of the Company under the Listing Rules.
(2)
Details of certain information on the Group’s non-wholly owned subsidiaries as at the Latest Practicable Date (assuming
completion of the Proposals) are set out in “Appendix VII – General Information – Further Information about the
Company – Subsidiaries – Non-wholly Owned Subsidiaries”.
– 88 –
INDUSTRY OVERVIEW
This section and other sections of this listing document contain information relating to the
Hong Kong economy, the PRC economy and the industries in which we operate. The information
that appears in this section has been prepared based on publicly available sources and trade
opinion surveys, and is prepared primarily as a market research tool. The Directors believe that the
sources of information contained in this section are appropriate sources for such information and
have taken reasonable care in reproducing such information. The Directors have no reason to
believe that such information is false or misleading or that any material fact has been omitted that
would render such information false or misleading. The information set out in this section has not
been independently verified by the Company or any of the Relevant Persons and none of them gives
any representations as to its accuracy and the information should not be relied upon in making, or
refraining from making, any investment decision.
Source of Information
This listing document cites materials prepared by the Hong Kong Tourism Board, the Meetings
and Exhibitions Hong Kong, the Rating and Valuation Department of Hong Kong, the Land Registry of
Hong Kong, National Bureau of Statistics of the PRC, CEIC Data Company Ltd. (“CEIC”), China
Index Academy, the China National Tourism Administration (“CNTA”), HM Revenue & Customs,
Nationwide Building Society, United Nations Conference on Trade and Development (“UNCTAD”),
Bloomberg, Jones Lang LaSalle and other research sources. None of the Company, the Directors or the
Joint Sponsors has commissioned any of the materials prepared by these research sources for use as
citations in this listing document. The materials we have used are widely available periodic publications
and/or data compilations by the respective research sources. The parameters and assumptions used by
researchers in compiling the reports are based on their own in-house standards.
The Directors confirm that, after due enquiry, there is no material adverse change in the market
information since the issue date of the abovementioned sources which may qualify, contradict or
adversely impact on the information contained in this section.
Hong Kong Real Estate Market Overview
Due to its geographic location, well-established legal system and importance as a gateway city to
the PRC, Hong Kong is one of the world’s leading financial and trading centres. It is one of the
world’s freest economies and is highly integrated with the global business cycle. It is the second largest
recipient of foreign direct investment in Asia with total global foreign direct investment inflows of
US$77 billion in 2013 according to the UNCTAD World Investment Report 2014. According to CEIC,
during the period 2009 to 2014, Hong Kong’s GDP and GDP per capita recorded CAGRs of 6.2% and
5.4%, to reach HK$2,246 billion and HK$310,113, respectively. During the period 2009 to the end of
2014, Hong Kong recorded an average real GDP growth of 2.7%.
During the past few years, the Hong Kong real estate market (including the residential property
and commercial property markets) has been influenced by a number of factors. These include, but are
not limited to, a relatively limited supply of land, increasing construction costs, relatively low interest
rates, rising housing demand from local and mainland Chinese residents, growing consumption power
and a stable business environment. The Hong Kong government and the Hong Kong Monetary
Authority have also implemented a series of policies and regulations to slow down the residential
property market and inflation of property prices and to dampen property speculation. These policies and
regulations include increased mortgage down payments and additional stamp duties on property sales
made within a certain period of time or on properties purchased by foreign purchasers or existing
property owners.
– 89 –
INDUSTRY OVERVIEW
The Hong Kong government has indicated in the 2015 Hong Kong Government Policy Address
that it intends to speed up the development of public housing and public rental housing (“PRH”) and
make available flats under the Home Ownership Scheme, subsidised sales flats and PRH for sales in the
near future. The Hong Kong government also intends to continue to maintain the development of the
private property market through steady and sustained land supply and implementation of certain
management measures. The Hong Kong government raised the short-term supply target of private
residential units over the next three to four years to 74,000 flats, up from 68,000 units over the next
five years as mentioned in the 2014 Hong Kong Government Policy Address, while indicating a
housing target of 480,000 public and private flats over the next decade, 40% of which will be
accounted for with private housing.
Historical Land Transactions and Price Trend of Construction Materials and Labour Costs in
Hong Kong
From 2009 to 2014, the total value of sales and purchase agreements for land transactions in
Hong Kong fluctuated from approximately HK$27.6 billion in 2009 to approximately HK$37.2 billion
in 2010, and to approximately HK$19.8 billion in 2014. In terms of number of transactions, the number
of sales and purchase agreements for land transactions also fluctuated during the period from 2009 to
2014, and increased from 2,256 transactions in 2009 to 2,480 transactions in 2014. The table below sets
out the details for the sales and purchase agreements for land transactions in Hong Kong over the
periods indicated in terms of total value and number of transactions:
2009
Sales and purchase agreements
of land transactions
(HK$ billion) . . . . . . . . . . . .
Sales and purchase agreements
of land transactions
(no. of transactions) . . . . . . . .
Source:
2010
2011
2012
2013
2014
27.6
37.2
27.9
28.0
29.9
19.8
2,256
2,788
2,756
2,478
2,147
2,480
CEIC 2009 – 2014
Concrete blocks, galvanised mild steel and Portland cement are common materials used in the
construction of residential and commercial properties in Hong Kong. According to CEIC, the material
cost of concrete blocks, galvanised mild steel and Portland cement showed increasing trends during the
period from 2009 to the end of 2014. In terms of labour cost, the median monthly earnings for all
industries in Hong Kong also showed an increasing trend during the period from 2009 to the end of
2014.
– 90 –
INDUSTRY OVERVIEW
The table below sets out the Materials Cost Index for concrete blocks, galvanised mild steel and
Portland cement as well as the median monthly earnings for all industries in Hong Kong over the
periods indicated:
2009
Materials Cost Index – Concrete
Blocks(1) . . . . . . . . . . . . . . . .
Materials Cost Index –
Galvanised Mild Steel(1) . . . . .
Materials Cost Index – Portland
Cement(1) . . . . . . . . . . . . . . .
Median monthly earnings for all
industries in Hong Kong
(HK$). . . . . . . . . . . . . . . . . .
2010
2011
2012
2013
2014
141
151
170
175
180
189
240
256
269
259
263
266
114
120
135
138
138
146
10,500
10,825
11,575
12,000
12,625
13,125
Source: CEIC 2009 – 2014
Note:
(1)
As at the end of each year
Hong Kong Residential Market Overview
New supply in the Hong Kong residential market recorded a decrease in 2013 with the completion
of approximately 8,250 units, representing approximately 81% of the level in 2012 and approximately
85% of the average of 9,684 units per annum during the period from 2009 to the end of 2013. Vacancy
at the end of 2013 declined moderately to approximately 4.1% of the total stock, equivalent to
approximately 46,570 units.
Completion, take-up and vacancy of
small/medium residential units (1)
(No. of Units)
Completion .
Take-up . .
Vacancy . .
Vacancy rate
Source:
. . .
. . .
. . .
(%) .
.
.
.
.
Completion, take-up and vacancy of
large residential units (2)
2009
2010
2011
2012
2013
(No. of Units)
4,740
10,420
38,770
3.8
11,970
5,790
43,960
4.3
8,320
10,770
40,000
3.9
7,730
6,680
38,860
3.8
7,310
6,390
38,210
3.7
Completion .
Take-up . .
Vacancy . .
Vacancy rate
The Rating and Valuation Department of Hong
Kong
Source:
. . .
. . .
. . .
(%) .
2009
.
.
.
.
2,420
670
8,580
10.5
2010
1,440
2,240
7,570
9.2
2011
1,130
630
7,920
9.5
2012
2,420
870
9,140
10.7
2013
940
1,670
8,360
9.7
The Rating and Valuation Department of Hong
Kong
Notes:
(1)
Units with a saleable area of less than 100 sq.m.
(2)
Units with a saleable area of 100 sq.m. or above
According to CEIC, residential prices experienced a strong growth trend during the period
between January 2009 and December 2014, with the residential price index and residential rental index
increasing by approximately 159.8% and 74.0%, respectively, driven by a strong recovery and growth
in residential purchases for end-user purposes and investment after the global financial crisis in 2008.
However, starting from 2011, the Hong Kong government and the Hong Kong Monetary Authority
introduced a number of policies and regulations to the Hong Kong property market. In 2011, the
mortgage payment requirements were increased for properties with different prices. In 2012, a 15%
BSD targeting buyers of residential flats who are not Hong Kong permanent residents and a SSD which
applies a tax rate of 10% to 20% for resale with a holding period of less than 36 months were
introduced, with a goal to curb speculative and investment demand. In 2013, the Hong Kong
– 91 –
INDUSTRY OVERVIEW
government introduced further policies and regulations including DSD targeting buyers of all properties,
except for those bought by permanent residents who are either first-time buyers or who are selling their
only home to buy another one. In addition, in 2013, the Residential Properties (First-hand Sales)
Ordinance came into effect, which sets out detailed requirements for vendors of first-hand residential
properties to comply with in relation to sales brochures, price lists, show flats, disclosure of transaction
information, advertisements, sales arrangements, and the mandatory provisions for the preliminary
agreement for sale and purchase and agreement for sale and purchase for the sales of first-hand
residential properties. In February 2015, further tightening measures relating to increased mortgage
down payment requirements were announced in Hong Kong.
The charts below set out the rental and price indices for the Hong Kong residential market and
the average residential sales prices in Hong Kong for the periods indicated:
Rental and price indices for residential sector
Average residential sales prices in Hong Kong
as at 31 December 2014
(HK$ per sq.m.)
Hong Kong
(Index) 300
Island . . . .
+159.8% 250
Kowloon . . . .
200
+74.0% New Territories
150
100
50
0
Jan-09 Jan-10 Jan-11 Jan-12 Jan-13 Jan-14 Dec-14
Price Index
Source:
Class A
Class B
Class C
Class D
Class E
138,260
113,274
101,129
138,404
119,870
88,670
159,238
144,474
95,142
184,926
190,669
88,881
253,795
192,621
76,417
Rental Index
CEIC 2009-2014
Source: CEIC 2014
Note: Class A – Less than 40 sq.m. saleable area
Class B – 40 – 69.9 sq.m. saleable area
Class C – 70 – 99.9 sq.m. saleable area
Class D – 100 – 159.9 sq.m. saleable area
Class E – 160 sq.m. and above saleable area
The volume and value of sales and purchases in the Hong Kong residential market experienced a
decrease in 2013 due to the government’s policies and regulations as described above. The market then
recovered in 2014 with a total of approximately 64,000 sale and purchase agreements recorded with a
value of HK$433 billion, according to the Land Registry of Hong Kong, representing an increase of
approximately 25.5% and 44.8%, respectively, from 2013. The charts below set out the sales and
purchases of residential building units in Hong Kong in terms of number of agreements and value:
Sales and purchases of residential building units in Hong Kong
(Number of
Agreements ’000)
150
115
85
100
99
50
16
14
2010
Source:
81
122
2009
0
(HK$ bn)
600
426
400
136
51
74
68
11
2011
13
2012
64
200
47
40
11
2013
2014
Primary
Secondary
17
0
The Land Registry of Hong Kong
– 92 –
307
561
443
431
452
433
299
312
321
257
203
176
119
130
131
131
96
2009
2010
2011
2012
2013
2014
Primary
Secondary
INDUSTRY OVERVIEW
Developers in the Hong Kong residential market primarily comprise of a number of local
developers, including both large-scale listed developers and small to medium private companies, who
compete in terms of land acquisition, brand recognition, financial resources, price, product quality,
service quality and other factors. Some PRC developers have also entered the market in recent years, to
take advantage of the increasing demand from Hong Kong’s economic growth and to cater to the
residential needs of migrants from the PRC. In terms of entry barriers, property development generally
requires financial strength and operational expertise. The Group is one of the largest property
developers in Hong Kong based on residential units sold during the last five years. Based on the value
of the Group’s contracted sales of residential properties and the total sales and purchases amount of
residential properties in the primary market in Hong Kong in 2014, the Group had an estimated market
share of approximately 9.4%. Compared with property developers listed in Hong Kong, the Group
ranked among the top three based on property development revenue in Hong Kong in each of 2012,
2013 and 2014 according to the Group’s calculations based on publicly available data.
Hong Kong Office Market Overview
As a global financial and trading hub, Hong Kong’s office market is highly developed, with
strong demand from domestic, the PRC and international enterprises. Hong Kong is also a popular
venue for hosting regional headquarters or representative offices for multinational companies to manage
their businesses in the Asia Pacific. Based on a Hong Kong government survey, there were 3,784
regional headquarters and regional offices in Hong Kong representing their parent companies located
outside Hong Kong as at June 2014. The total stock of private offices at the end of 2013 was
approximately 11 million sq.m., approximately 63% of which was attributable to Grade A offices.
Given the limited supply of land in Hong Kong, the supply of Grade A offices has historically
been limited. Improving global and local economies have driven increased demand for Hong Kong
Grade A office space, with the vacancy rate decreasing from 11.5% in 2009 to 7.2% in 2013. Primarily
as a result of strong demand and relatively limited supply, Hong Kong’s Grade A office rental rates
have grown significantly over the past few years. During the period between January 2009 and
December 2014, the Grade A rental index compiled by CEIC increased by approximately 40.4%. During
the same period, the price index for office sales also increased by approximately 144.1%, which was
primarily driven by a shortage in Grade A offices for sale and low interest rates. According to the
Rating and Valuation Department of Hong Kong, the average property market yield for Grade A offices
in Hong Kong was 2.9% for 2014, which was largely in line with the average property market yield of
3.2% during the period 2009 to the end of 2014.
– 93 –
INDUSTRY OVERVIEW
The charts below set out the completion, take-up and vacancy of Grade A offices as well as rental
and price indices for Grade A offices for the periods indicated:
Completion, take-up and vacancy of
Grade A offices
(sq.m.)
2009
Completion .
Take-up. . .
Vacancy . .
Vacancy rate
. .
. .
. .
(%)
.
.
.
.
129
(71)
753
11.5
2010
115
292
576
8.5
2011
125
233
448
6.6
2012
104
134
418
6.1
Rental and price indices for Grade A offices
2013
97
12
502
7.2
(Index)
300 250 200 150 100 50 0
Jan -09
+144.1%
+40.4%
Jan -10
Jan -11
Jan -12
Price Index Source:
The Rating and Valuation Department of Hong
Kong
Source:
Jan -13
Jan -14
Dec-14
Rental Index
CEIC 2009-2014
Hong Kong Retail Market Overview
The Hong Kong retail market is one of the most developed markets, with some of the highest
rental rates, in the world. High consumer spending by Hong Kong residents and a large number of
tourists, in particular visitors from the PRC, and low barriers to entry attract a large number of
international retailers to the market. Total stock in this sector at the end of 2013 was approximately 11
million sq.m.. According to the Rating and Valuation Department of Hong Kong, vacancy rates
decreased from approximately 8.7% in 2009 to approximately 7.2% in 2013 and are expected to remain
stable in next few years.
During the period January 2009 to December 2014, the annual retail rental index and the price
index increased by approximately 62.9% and 235.5%, respectively. According to the Rating and
Valuation Department of Hong Kong, the average property market yield for retail space in Hong Kong
was approximately 2.4% for 2014, which is largely in line with the average property market yield for
such space of 2.9% during the period from 2009 to the end of 2014.
– 94 –
INDUSTRY OVERVIEW
The charts below set out the completion, take-up and vacancy of private commercial retail space
as well as rental and price indices for the rental sector for the periods indicated:
Completion, take-up and vacancy of private
commercial retail space
(sq.m.)
2009
Completion .
Take-up. . .
Vacancy . .
Vacancy rate
. .
. .
. .
(%)
.
.
.
.
84
42
932
8.7
2010
65
135
844
7.9
2011
42
(7)
859
8.0
2012
90
165
752
6.9
Rental and price indices for retail sector
2013
38
(14)
782
7.2
(Index) 400 +235.5% 300 200 +62.9% 100 0
Jan -09
Jan -10
Jan -11
Jan -12
Price Index Source:
The Rating and Valuation Department of Hong
Kong
Source:
Jan -13
Jan -14
Dec -14
Rental Index CEIC 2009-2014
PRC Real Estate Market Overview
The PRC economy has grown significantly since the PRC government introduced economic
reforms in the late 1970’s. The PRC’s accession to the World Trade Organization in 2001 further
accelerated the development of the Chinese economy. During the period 2009 to the end of 2013, the
PRC recorded a relatively strong growth in GDP from RMB34,878 billion to RMB58,667 billion,
representing a CAGR of approximately 13.9%, driven primarily by expansion of various fundamental
industries and the impetus of various macro-economic policy adjustments. According to the National
Bureau of Statistics of the PRC, the PRC overtook Japan to become the world’s second largest
economy in terms of GDP in the second quarter of 2010. In terms of annual disposable income per
capita, it increased from RMB17,175 to RMB28,844, representing a CAGR of 10.9% during the period
2009 to the end of 2014.
As a result of the rapid economic growth and increasing urbanisation in the PRC, the real estate
market has achieved strong growth. According to the National Bureau of Statistics of the PRC, total
real estate investments have increased at a CAGR of approximately 24.1% during the period 2009 to
the end of 2013, increasing from RMB3,624 billion to RMB8,601 billion over this period. During the
same period, sales of commodity properties increased both in volume and value as a result of stronger
demand for self-occupation and investments. According to National Bureau of Statistics of the PRC, the
average selling price of commodity properties increased from RMB4,681 per sq.m. in 2009 to
RMB6,237 per sq.m. in 2013, while total sales of commodity properties increased from RMB4,436
billion in 2009 to RMB8,143 billion in 2013, representing CAGRs of approximately 7.4% and 16.4%,
respectively.
– 95 –
INDUSTRY OVERVIEW
The table below sets out selected information about the PRC property market over the periods
indicated:
2009
Total real estate investment
(RMB billion) . . . . . . . . . . .
Total GFA completed (million
sq.m.) . . . . . . . . . . . . . . . . .
Total GFA under construction
(million sq.m.) . . . . . . . . . .
Total GFA sold (million sq.m.).
Source:
2010
2011
2012
2013
09-13
CAGR
.
3,624
4,826
6,180
7,180
8,601
24.1%
.
727
787
926
994
1,014
8.7%
.
.
3,204
948
4,054
1,048
5,068
1,094
5,734
1,113
6,656
1,306
20.1%
8.3%
National Bureau of Statistics of the PRC 2009 – 2013
The PRC government exerts considerable direct and indirect influence on the development of the
PRC property sector by imposing industry policies and other economic measures, such as control over
the supply of land for property development and control of foreign exchange, property financing,
taxation and foreign investment. Starting from December 2009, the PRC government has adjusted some
of its policies in order to prevent the prices of properties from rapidly increasing, especially in certain
developed cities, including the introduction of home purchase restriction policies which apply various
restrictions to qualified purchasers, higher minimum down payment requirements, mortgage and
construction loan interest rate increases and the introduction of a new property tax scheme in certain
cities. Starting from June 2014, local rules have been promulgated by some of the Chinese local
governments to implement loosening or cancellation of the home purchase restrictions and credit policy
related to residential property market has been relaxed. Please refer to “Appendix IV – Regulatory
Overview” for details.
Historical Price Trend of Construction Materials, Labour Costs and Land Costs in the PRC
The Purchasing Price Index of Raw Materials, Fuel and Power (“PPIRM”) is commonly used to
predict construction costs for real estate developers. In general, the prices of raw materials fluctuate
year-on-year owing to economic, political and social changes. According to the National Bureau of
Statistics of the PRC, PPIRM – Construction Materials fluctuated slightly during the period from 2009
to 2013, dropping from 101 in 2009 to 99 in 2013. The steel product price index dropped from 3,910 in
2009 to 3,600 in 2013. The China Producer Price Index – Manufacture of Cement also fluctuated
during this period, increasing from 95 in 2009 to 103 in 2013. The average annual wage level for
working in urban areas in the property industry increased from RMB32,242 in 2009 to RMB51,048 in
2013. The table below sets out PPIRM – Construction Materials, Steel Product Price Index, the China
Producer Price Index – Manufacture of Cement and the average annual wage level for workers in urban
areas in the PRC of the real estate industry over the periods indicated:
– 96 –
INDUSTRY OVERVIEW
2009
(1)
PPIRM – Construction Materials . . . . . . .
Steel Product Price Index(1) . . . . . . . . . . . .
The China Producer Price Index –
Manufacture of Cement(1) . . . . . . . . . . . .
The average annual wage level for workers
in urban areas in the PRC of the
property industry (RMB) . . . . . . . . . . . .
2010
2011
2012
2013
101
3,910
104
4,760
108
4,480
100
3,800
99
3,600
95
112
112
92
103
32,242
35,870
42,837
46,764
51,048
Source: Bloomberg, CEIC 2009 – 2013 and National Bureau of Statistics of the PRC 2009 – 2013
Note:
(1)
As at the end of each year
During the period from 2009 to the end of 2013, the total transaction site area and average site
values for both residential and commercial real estate in different tiers of cities in China have
experienced growth. The table below sets out the total transaction site area and the average sites values
for residential and commercial real estate in different tiers of cities in China over the periods indicated:
2009
Transaction site area (million sq.m.) . . . . . .
Average site values
– For residential property development in
Tier 1 cities (RMB per sq.m.) . . . . . . .
– For residential property development in
Tier 2 cities (RMB per sq.m.) . . . . . . .
– For residential property development in
Tier 3 and 4 cities (RMB per sq.m.) . .
– For commercial property development in
Tier 1 cities (RMB per sq.m.) . . . . . . .
– For commercial property development in
Tier 2 cities (RMB per sq.m.) . . . . . . .
– For commercial property development in
Tier 3 and 4 cities (RMB per sq.m.) . .
Source:
2010
2011
2012
2013
822
1,220
2,640
2,861
2,919
10,018
11,359
8,021
9,457
14,501
3,439
4,186
3,446
3,796
4,625
1,770
1,972
1,573
1,552
1,916
8,423
11,623
17,981
16,989
29,214
2,929
3,274
3,279
2,761
3,231
1,141
1,394
1,109
1,076
1,337
China Index Academy
– 97 –
INDUSTRY OVERVIEW
PRC Residential Market Overview
During the period from 2009 to the end of 2013, the total GFA of commodity residential
properties sold increased at a CAGR of approximately 7.6%, from 862 million sq.m. to 1,157 million
sq.m.. The PRC government has implemented various policies and regulations on property development,
real estate financing, sale of commodity properties and leasing of buildings, which has influenced the
sentiment of the PRC residential market. Please refer to “Appendix IV – Regulatory Overview” for
details. The table below sets the key indicators of the PRC residential market for the period indicated:
2009
Total area of commodity residential
properties completed (million
sq.m.) . . . . . . . . . . . . . . . . . . . . .
Total GFA of commodity residential
properties sold (million sq.m.) . . .
Total sales of commodity residential
properties (RMB billion) . . . . . . .
Total ASP of commodity residential
properties (RMB/sq.m.) . . . . . . . .
Source:
2010
2011
2012
2013
09-13
CAGR
596
634
743
790
787
7.2%
862
934
965
985
1,157
7.6%
3,843
4,412
4,820
5,347
6,769
15.2%
4,459
4,725
4,993
5,430
5,850
7.0%
National Bureau of Statistics of the PRC 2009 – 2013
The PRC residential market is relatively fragmented, with the top 10 developers accounting for
approximately 17.2% of the market based on contracted sales in 2014 (which totalled approximately
RMB7,508 billion) and approximately 10.5% based on contracted GFA sold in 2014 (which totalled
approximately 1,198 million sq.m.). In terms of entry barriers, property development generally requires
financial strength and operational expertise. Therefore, early entrants and large-scale participants in the
industry which have gained experience and market reputation across the regions in which they operate
generally have a competitive advantage over new entrants. Please refer to “Business – Market and
Competition” for details.
PRC Office Market Overview
During the past few years, demand in the office sector has remained strong, particularly in the
high-end property segment driven by services-related industries such as finance and information
technology, with interest coming both from domestic and international firms. During the period 2009 to
the end of 2014, the annual office floor space completed in the PRC increased at a CAGR of
approximately 13.7% from 16.5 million sq.m. to 31.4 million sq.m..
The table below sets out the annual office floor space completed in the PRC over the periods
indicated:
2009
Annual office floor
space completed in
the PRC (million
sq.m.) . . . . . . . . . .
Source:
16.5
2010
2011
18.2
CEIC 2009 – 2014
– 98 –
22.7
2012
23.2
2013
27.9
2014
31.4
09-14
CAGR
13.7%
INDUSTRY OVERVIEW
Overview of Top 10 Cities in the PRC in which the Group has Operations
The following sets out an overview of the property market in the top 10 cities in the PRC (based
on property valuation of the Group’s projects as at 28 February 2015) in which the Group has
operations.
Shanghai
Shanghai is one of the most developed cities in the PRC and is aiming to become a leading
international economic, financial, trading and shipping centre by 2020. GDP and disposable income per
capita increased at CAGRs of approximately 9.5%, from RMB1,505 billion in 2009 to RMB2,160
billion in 2013, and 11.0%, from RMB28,838 in 2009 to RMB43,851 in 2013, respectively. Shanghai’s
GDP has experienced strong growth in recent years, with retail sales also exhibiting robust growth in
the city, leading to increased retail development. The Shanghai Housing Security and Housing
Administration Bureau announced an adjustment in the city’s definition for mass-market housing (which
is subject to looser mortgage restrictions for first home purchasers) in November 2014. After the
adjustment, the ratio of mass-market housing as percentage of total new housing increased to 21% from
5% (before the adjustment), while the ratio of mass-market housing as percentage of total second-hand
housing increased to 89% from 75% (before the adjustment). As a result of the adjustment, more home
purchasers are generally able to enjoy loosened mortgage terms. The table below sets out selected data
relating to the Shanghai property market:
2009
Total population (million) . . . .
Total investment in property
development projects (RMB
billion) . . . . . . . . . . . . . . . .
Average selling price of
commodity properties
(RMB/sq.m.) . . . . . . . . . . . .
Total GFA completed (million
sq.m.) . . . . . . . . . . . . . . . . .
Total GFA sold (million sq.m.).
Source:
2010
2011
2012
2013
09-13
CAGR
.
14.0
14.1
14.2
14.3
14.3
0.5%
.
146
198
225
238
282
17.9%
.
12,840
14,464
14,603
14,061
16,420
6.3%
.
.
21
34
19
21
24
18
23
19
23
24
2.3%
(8.3%)
CEIC 2009 – 2013, National Bureau of Statistics of the PRC 2009 – 2013
Wuhan
Wuhan is one of the key cities in the Central China region and is experiencing an urbanisation
drive as a result of active city planning with new roads, road widening and subway improvements. GDP
and disposable income per capita increased at CAGRs of approximately 18.3%, from RMB462 billion
in 2009 to RMB905 billion in 2013, and 12.9%, from RMB18,385 in 2009 to RMB29,821 in 2013,
respectively. With solid demand and strong economic fundamentals, the residential property market has
remained resilient. Home purchase restrictions in Wuhan have been fully removed since 24 September
2014 on newly built commodity residential apartments and second-hand apartments. In addition, in
– 99 –
INDUSTRY OVERVIEW
November 2014, the government of Hubei Province announced the loosening of restrictions on the use
of housing funds by residential purchasers. The table below sets out selected data relating to the Wuhan
property market:
2009
Total population (million) . . . .
Total investment in property
development projects (RMB
billion) . . . . . . . . . . . . . . . .
Average selling price of
commodity properties
(RMB/sq.m.) . . . . . . . . . . . .
Total GFA completed (million
sq.m.) . . . . . . . . . . . . . . . . .
Total GFA sold (million sq.m.).
Source:
2010
2011
2012
2013
09-13
CAGR
.
8.4
8.4
8.3
8.2
8.2
(0.6%)
.
78
102
128
158
191
25.1%
.
5,329
5,746
7,193
7,344
7,717
9.7%
.
.
9
11
9
12
12
13
11
16
7
20
(6.1%)
16.1%
CEIC 2009 – 2013, National Bureau of Statistics of the PRC 2009 – 2013
Chengdu
Chengdu is the centre of technology and education, trade and finance in Southwestern China.
GDP and disposable income per capita increased at CAGRs of approximately 19.3%, from RMB450
billion in 2009 to RMB911 billion in 2013, and 14.2%, from RMB17,589 in 2009 to RMB29,968 in
2013, respectively. Despite a recent downturn in transaction volume, the city’s position as the centre of
Southwestern China continues to attract migrants to participate in its growing tertiary industries such as
technology and communications, which supports residential property demand and lays a solid
foundation for the real estate market. On 20 January 2015, home purchase restrictions as well as price
restrictions were officially announced to be removed by end of the year 2015 by the government of
Sichuan, on all types of residential apartments across the city. The table below sets out selected data
relating to the Chengdu property market:
2009
Total population (million) . . . .
Total investment in property
development projects (RMB
billion) . . . . . . . . . . . . . . . .
Average selling price of
commodity properties
(RMB/sq.m.) . . . . . . . . . . . .
Total GFA completed (million
sq.m.) . . . . . . . . . . . . . . . . .
Total GFA sold (million sq.m.).
Source:
2010
2011
2012
2013
09-13
CAGR
.
11.4
11.5
11.6
11.7
11.9
1.1%
.
95
128
159
189
211
22.1%
.
4,925
5,937
6,717
7,288
7,197
9.9%
.
.
17
27
16
26
16
27
21
28
19
30
2.8%
2.7%
CEIC 2009 – 2013, National Bureau of Statistics of the PRC 2009 – 2013
– 100 –
INDUSTRY OVERVIEW
Chongqing
Chongqing is one of the gateway cities in Southwest China. GDP and disposable income per
capita increased at CAGRs of approximately 18.0%, from RMB653 billion in 2009 to RMB1,266
billion in 2013, and 12.5%, from RMB15,749 in 2009 to RMB25,216 in 2013, respectively. In 2014, in
response to the government’s objective of ensuring its steady growth, and underpinned by strong
growth in monetary supply, the real estate market has experienced an increase in transaction volume.
The table below sets out selected data relating to the Chongqing property market:
2009
Total population (million) . . . .
Total investment in property
development projects (RMB
billion) . . . . . . . . . . . . . . . .
Average selling price of
commodity properties
(RMB/sq.m.) . . . . . . . . . . . .
Total GFA completed (million
sq.m.) . . . . . . . . . . . . . . . . .
Total GFA sold (million sq.m.).
Source:
2010
2011
2012
2013
09-13
CAGR
.
32.8
33.0
33.3
33.4
33.6
0.6%
.
124
162
202
251
301
24.8%
.
3,442
4,281
4,734
5,080
5,569
12.8%
.
.
29
40
26
43
34
45
40
45
38
48
7.0%
4.7%
CEIC 2009 – 2013, National Bureau of Statistics of the PRC 2009 – 2013
Dongguan
Dongguan is a key industrial and manufacturing hub located in the Pearl River Delta. GDP and
disposable income per capita increased at CAGRs of approximately 9.9%, from RMB376 billion in
2009 to RMB549 billion in 2013, and 9.0%, from RMB33,045 in 2009 to RMB46,594 in 2013,
respectively. In August 2014, the government of Dongguan announced the removal of the price
reporting mechanism to allow for more flexible pricing of residential houses, as well as relaxing public
housing reserve fund. The table below sets out selected data relating to the Dongguan property market:
2009
Total population (million) . . . .
Total investment in property
development projects (RMB
billion) . . . . . . . . . . . . . . . .
Average selling price of
commodity properties
(RMB/sq.m.) . . . . . . . . . . . .
Total GFA completed (million
sq.m.) . . . . . . . . . . . . . . . . .
Total GFA sold (million sq.m.).
Source:
2010
2011
2012
2013
09-13
CAGR
.
7.9
8.2
8.3
8.3
8.3
1.2%
.
28
30
37
38
50
15.6%
.
5,881
7,310
7,717
8,486
9,066
11.4%
.
.
N/A
N/A
N/A
N/A
N/A
N/A
N/A
N/A
N/A
N/A
N/A
N/A
CEIC 2009 – 2013, National Bureau of Statistics of the PRC 2009 – 2013
– 101 –
INDUSTRY OVERVIEW
Beijing
As the capital of the PRC, Beijing is also a political, cultural, economic and financial
decision-making and administrative centre as well as a world-famous ancient capital city and a modern
international metropolis. GDP and disposable income per capita increased at CAGRs of approximately
12.6%, from RMB1,215 billion in 2009 to RMB1,950 billion in 2013, and 10.8%, from RMB26,738 in
2009 to RMB40,321 in 2013, respectively. The overall real estate market remains active with
developers offering incentives, concessions and discounts. In September 2014, the Beijing Municipal
Commission of Housing and Urban-rural Development, the Finance Bureau and the Tax Bureau jointly
announced an adjustment to expand the scope of mass residential housing where the purchasers enjoy
certain property tax benefits. In December 2014, the Beijing Housing Provident Fund Management
Center released an adjusted policy for advancing loans with the maximum loan amount increased to
RMB1.2 million for purchasing first self-occupied units with a size of 90 sq.m. or below, effective from
1 January 2015. The table below sets out selected data relating to the Beijing property market:
2009
Total population (million) . . . .
Total investment in property
development projects (RMB
billion) . . . . . . . . . . . . . . . .
Average selling price of
commodity properties
(RMB/sq.m.) . . . . . . . . . . . .
Total GFA completed (million
sq.m.) . . . . . . . . . . . . . . . . .
Total GFA sold (million sq.m.).
Source:
2010
2011
2012
2013
09-13
CAGR
.
12.5
12.6
12.8
13.0
13.2
1.4%
.
234
290
304
315
348
10.4%
.
13,799
17,782
16,852
17,022
18,553
7.7%
.
.
27
24
24
16
22
14
24
19
27
19
0.0%
(5.7%)
CEIC 2009 – 2013, National Bureau of Statistics of the PRC 2009 – 2013
Guangzhou
Guangzhou is the political, economic, scientific, educational and cultural centre of Guangdong
Province and is located at the northern edge of the Pearl River Delta. GDP and disposable income per
capita increased at CAGRs of approximately 14.0%, from RMB914 billion in 2009 to RMB1,542
billion in 2013, and 11.1%, from RMB27,610 in 2009 to RMB42,049 in 2013, respectively. As there
has been no relaxation of home purchase restrictions and mortgage policies have remained tight in
– 102 –
INDUSTRY OVERVIEW
Guangzhou, transaction volume remained low in 2014 and price reduction was common particularly in
outlying districts. The table below sets out selected data relating to the Guangzhou property market:
2009
Total population (million) . . . .
Total investment in property
development projects (RMB
billion) . . . . . . . . . . . . . . . .
Average selling price of
commodity properties
(RMB/sq.m.) . . . . . . . . . . . .
Total GFA completed (million
sq.m.) . . . . . . . . . . . . . . . . .
Total GFA sold (million sq.m.).
Source:
2010
2011
2012
2013
09-13
CAGR
.
7.9
8.1
8.1
8.2
8.3
1.2%
.
82
98
131
137
157
17.6%
.
9,351
11,921
12,104
13,163
15,330
13.2%
.
.
11
14
11
14
13
12
13
13
11
17
0.0%
5.0%
CEIC 2009 – 2013, National Bureau of Statistics of the PRC 2009 – 2013
Qingdao
Qingdao is located in the southern part of the Shandong Peninsula and is one of the major port
cities in North China. GDP and disposable income per capita increased at CAGRs of approximately
13.4%, from RMB485 billion in 2009 to RMB801 billion in 2013, and 12.0%, from RMB22,368 in
2009 to RMB35,227 in 2013, respectively. The residential market remained active in 2014. Home
purchase restrictions have been fully removed in Qingdao since 1 September 2014, in order to support
the steady growth and development of the residential property market. Mortgage restrictions were also
loosened in September 2014 for residents who are selling their only home to buy another one. The table
below sets out selected data relating to the Qingdao property market:
2009
Total population (million) . . . .
Total investment in property
development projects (RMB
billion) . . . . . . . . . . . . . . . .
Average selling price of
commodity properties
(RMB/sq.m.) . . . . . . . . . . . .
Total GFA completed (million
sq.m.) . . . . . . . . . . . . . . . . .
Total GFA sold (million sq.m.).
Source:
2010
2011
2012
2013
09-13
CAGR
.
7.6
7.6
7.7
7.7
7.7
0.3%
.
46
60
79
93
105
22.9%
.
5,576
6,576
7,495
8,056
8,435
10.9%
.
.
8
13
10
14
9
10
12
10
10
12
5.7%
(2.0%)
CEIC 2009 – 2013, National Bureau of Statistics of the PRC 2009 – 2013
Nanjing
Nanjing is one of the major cities on the Yangtze River and a sub-central city in Eastern China.
GDP and disposable income per capita increased at CAGRs of approximately 17.3%, from RMB423
billion in 2009 to RMB801 billion in 2013, and 11.8%, from RMB24,678 in 2009 to RMB38,531 in
2013, respectively. In September 2014, the Municipal Government of Nanjing announced a plan to
– 103 –
INDUSTRY OVERVIEW
encourage steady development of the property market, including stabilising market supply by focusing
on an annual target of providing over 500 hectares of land for residential properties on average over the
next five years and strengthening credit support to broaden financing channels for the property sector
via financial product innovation and coordinating various commercial financial institutions to speed up
disbursement of credit facilities for residential properties. Home purchase restrictions were removed by
the government of Nanjing in September 2014 on all types of residential apartments across the city. The
table below sets out selected data relating to the Nanjing property market:
2009
Total population (million) . . . .
Total investment in property
development projects (RMB
billion) . . . . . . . . . . . . . . . .
Average selling price of
commodity properties
(RMB/sq.m.) . . . . . . . . . . . .
Total GFA completed (million
sq.m.) . . . . . . . . . . . . . . . . .
Total GFA sold (million sq.m.).
Source:
2010
2011
2012
2013
09-13
CAGR
.
6.3
6.3
6.4
6.4
6.4
0.4%
.
60
75
87
97
104
14.7%
.
7,185
9,565
9,311
10,106
11,495
12.5%
.
.
15
12
10
8
12
8
17
10
10
12
(9.6%)
0.0%
CEIC 2009 – 2013, National Bureau of Statistics of the PRC 2009 – 2013
Dalian
Dalian is one of the most developed cities in Northeast China. GDP and disposable income per
capita increased at CAGRs of approximately 15.2%, from RMB435 billion in 2009 to RMB765 billion
in 2013, and 12.3%, from RMB19,014 in 2009 to RMB30,238 in 2013, respectively. Home purchase
restrictions in Dalian have been removed since 3 September 2014, with no home purchase qualification
certificate required for the purchase of either new residential properties or second-hand residential
properties, representing a complete removal of such restrictions in Dalian. The table below sets out
selected data relating to the Dalian property market:
2009
Total population (million) . . . .
Total investment in property
development projects (RMB
billion) . . . . . . . . . . . . . . . .
Average selling price of
commodity properties
(RMB/sq.m.) . . . . . . . . . . . .
Total GFA completed (million
sq.m.) . . . . . . . . . . . . . . . . .
Total GFA sold (million sq.m.).
Source:
2010
2011
2012
2013
09-13
CAGR
.
5.8
5.9
5.9
5.9
5.9
0.4%
.
58
77
111
140
171
31.0%
.
6,249
7,044
8,052
8,004
8,263
7.2%
.
.
5
12
6
12
9
9
8
11
10
12
18.9%
0.0%
CEIC 2009 – 2013, National Bureau of Statistics of the PRC 2009 – 2013
– 104 –
INDUSTRY OVERVIEW
Singapore Real Estate Market Overview
Singapore’s real estate market is driven by solid economic fundamentals, political stability and a
transparent business environment. Singapore’s position as a regional financial and business hub has also
promoted growing demand for residential real estate from migrants and investors, especially in the
high-end segment. According to CEIC, the total GDP increased at a CAGR of 6.9%, from SGD280
billion in 2009 to SGD390 billion in 2014, while GDP per capita also increased at a CAGR of 4.9%,
from SGD56,111 in 2009 to SGD71,318 in 2014. The table below sets out the total number of
residential property transactions and median residential housing price in the Singapore property market:
2009
Total number of
residential property
transactions . . . . .
Residential housing
price (SGD per
sq.m.)(1) . . . . . . . .
2010
2011
2012
2013
2014
09-14
CAGR
33,292
39,683
37,055
39,927
26,918
13,369
(16.7%)
9,606
11,049
11,493
12,102
12,190
11,691
4.0%
Source: CEIC 2009 – 2014
Note:
(1)
Median prices for the fourth quarter of each year for private residential non-landed apartments
A series of policies and regulations introduced starting from 2009 have helped manage potential
speculation in the residential market. When the total debt servicing ratio framework (which assesses the
credit quality of potential borrowers) was introduced in June 2013, residential sales volume halved.
However, demand and supply are expected to re-gain a balance going forward, as the current project
pipeline for and accumulated stock of residential housing may decrease to a relatively lower level as
developers respond to the adjustment in the market.
– 105 –
INDUSTRY OVERVIEW
The U.K. Real Estate Market Overview
The U.K. economy is currently one of the most stable in the developed world, attracting interest
from both U.K. and foreign investors. According to CEIC, total GDP increased at a CAGR of 3.9%,
from GBP1,482 billion in 2009 to GBP1,791 billion in 2014, while GDP per capita also increased at a
CAGR of 3.1%, from GBP23,806 in 2009 to GBP27,770 in 2014. The table below sets out the total
number of residential property transactions and average residential housing price in the U.K. and
London property markets:
2009
Total number of
residential property
transactions in the
U.K. (’000) (1) . . . .
Total number of
residential property
transactions in
London (’000) (1) . .
Residential housing
price in the U.K.
(GBP ’000)(2) . . . .
Residential housing
price in London
(GBP ’000)(2) . . . .
2010
2011
2012
2013
2014
09-14
CAGR
848
879
884
932
1,067
1,226
7.7%
95
116
115
124
145
N/A
11.2%(3)
162
163
165
163
174
189
3.1%
276
283
298
300
345
407
8.1%
Source: HM Revenue & Customs, Nationwide Building Society
Notes:
(1)
With value GBP40,000 or above
(2)
Average prices for the fourth quarter of each year for private residential housing
(3)
2009-2013 CAGR
In the United Kingdom, the housing market is a large part of the economy and 1,226,460
residential and 112,650 non-residential transactions with a value of GBP40,000 or above were recorded
in 2014. London’s total number of residential property transactions in 2013 accounted for
approximately 13.6% of the total number of residential property transactions in the overall U.K. market,
while the average price for private residential housing in London of GBP406,730 is more than double
that of the overall U.K. market of GBP189,002 in 2014. The U.K. government has implemented stable
monetary and credit policies as a large portion of the country’s wealth is tied to real estate. The
outlook for the U.K. real estate market remains robust supported by economic growth, expansion in
employment and low inflation expectations. At the same time the new stamp duty regime, which
resulted in more people paying a reduced tax rate, is expected to boost transactions in the real estate
market.
– 106 –
INDUSTRY OVERVIEW
Hospitality Market Overview
Hong Kong
According to the Hong Kong Tourism Board, there were a total of 72,721 hotel rooms in Hong
Kong as at 31 December 2014, which had increased at a CAGR of approximately 4.1% from a total of
59,627 hotel rooms as at 31 December 2009. The Group is one of the largest hotel owner-operators in
Hong Kong in terms of number of rooms as at 31 December 2014.
In recent years, there has also been an increasing demand for serviced suites that provide a
combination of daily, weekly and monthly rental options. These are attractive accommodation options
due to their flexibility, with no substantial initial deposits and more flexible lease renewals. According
to Jones Lang LaSalle, the number of serviced suites in Hong Kong has increased at a CAGR of
approximately 3.9% during the period 2009 to the end of 2013, with demand largely being driven by
expatriate hires and a growing trend of companies favouring using mobile and temporary workers in the
region. By the end of 2013, the total number of serviced suites in Hong Kong was approximately
16,800. The table below sets out the key indicators of the Hong Kong hospitality market for the period
indicated:
2009
Total number of hotels . . . . . .
– High Tariff A Hotels . . . . . .
– High Tariff B Hotels . . . . . .
– Medium Tariff Hotels . . . . . .
– Unclassified. . . . . . . . . . . . .
Total number of hotel rooms . .
Total number of visitors in
Hong Kong (million) . . . . . .
Percentage of PRC visitors (%)
Average room rate (HK$)(1) . . .
Occupancy rate (%)(1) . . . . . . .
2010
2011
2012
2013
2014
.
.
.
.
.
.
167
27
55
71
14
59,627
175
29
58
72
16
60,428
190
32
69
78
11
62,830
211
34
73
84
20
67,394
225
34
83
88
20
70,017
244
34
86
95
29
72,721
.
.
.
.
30
60.7
1,023
78
36
63.0
1,165
87
42
67.0
1,356
89
49
71.8
1,489
89
54
75.0
1,447
89
61
77.7
1,473
90
Source: Hong Kong Tourism Board, CEIC 2009 – 2014
Note:
(1)
Representing average of all types of hotels
Hong Kong’s hospitality industry remained relatively stable in 2014, backed by strong visitor
arrivals. In 2014, there were a total of approximately 61 million visitors in Hong Kong, which were
dominated by visitors from the PRC constituting approximately 77.7% of the total number of visitors.
Visitor arrivals to Hong Kong increased by approximately 13.0% on a year-on-year basis in 2014, after
rising by approximately 10.2% in 2013, while those from the PRC saw a stronger growth of
approximately 17.0% on a year-on-year basis, after rising by approximately 15.1% in 2013.
– 107 –
INDUSTRY OVERVIEW
Hong Kong has developed into a centre for conventions and exhibitions in Asia, and the market
for meetings, incentives, conferencing and exhibitions (“MICE”) travellers has remained strong, which
in turn attracts business travellers to Hong Kong driving hotel demand. According to the Meetings and
Exhibitions of Hong Kong, in 2014, MICE overnight visitor arrivals by major markets(1) amounted to
approximately 1.8 million, representing an approximately 11.1% year-on-year growth.
Note:
(1)
Major markets include the Americas, Europe, Africa and the Middle East, Australia, New Zealand and South
Pacific, North Asia, South and Southeast Asia, Taiwan, Macau and Mainland China
PRC
The PRC hospitality industry has been driven by rapid economic development in the PRC,
increasing numbers of domestic leisure and business travellers, growing numbers of visitors with the
strong growth of the PRC’s export-oriented economy and its integration into the global economy and
policy support as outlined in the Development of Tourism in the PRC during the 12th Five-Year Plan.
The following table sets out the number of each category of travellers for the periods indicated:
2009
Number of domestic travellers (million) . . .
Number of inbound travellers (million). . . .
Source:
1,902
126
2010
2,103
134
2011
2,641
135
2012
2,957
132
2013
3,262
129
National Bureau of Statistics of the PRC 2009 – 2013
According to the CNTA, the PRC had 11,687 star-rated hotels at the end of 2013. Of those rated
in 2013, approximately 6.3% were rated five-star and approximately 20.2% were rated four-star. The
PRC hotel industry recorded a relatively stable trend in occupancy rates and steady growth in average
room rates during the period 2009 to the end of 2013. The overall outlook for the sector is expected to
be positive. The following table sets out selected data relating to the PRC hospitality market for the
period indicated:
2009
(1)
Total number of hotels . . . .
Total number of rooms (’000)
Occupancy rates (%) . . . . . . .
Average room rates (RMB) . .
.
.
.
.
.
.
.
.
.
.
.
.
.
.
.
.
.
.
.
.
.
.
.
.
.
.
.
.
.
.
.
.
.
.
.
.
.
.
.
.
14,237
1,674
57.9
N/A
2010
13,991
1,710
60.3
295
2011
11,676
1,475
61.0
313
2012
2013
11,367
1,497
59.5
329
11,687
1,539
56.0
334
Source: China National Tourism Administration 2009 – 2013
Note:
(1)
The decrease in 2010 and 2011 was partially due to post Olympic conversions after boom in PRC hospitality
industry in 2008
– 108 –
INDUSTRY OVERVIEW
In terms of sector demand, domestic tourism and business travellers are the key drivers of future
demand while growing demand from middle-income earners may present new opportunities for higher
end hotels. The business traveller segment has grown strongly in recent years as companies grow their
geographical footprints and the PRC becomes more connected. Demand from these two segments help
mitigate the downside risk from government’s policies to curb the consumption of luxury goods and
services. On the supply side, the PRC hotel market is faced with competition among local and
international hotel brands but international hotels brands have continued to indicate their long-term
confidence in the PRC’s hospitality market as demonstrated by their expansion plans.
– 109 –
BUSINESS
You should note that following completion of the Property Businesses Combination and the
formation of the Group, the structure of the businesses comprising the Group will differ from the
structure in place prior to completion of the Property Businesses Combination and during the Track
Record Period. In particular, certain of the joint venture companies in which the Cheung Kong
Property Group and the Hutchison Property Group are currently, and have previously been,
interested but which are not and were not previously consolidated into the respective financial
statements of either the Cheung Kong Property Group or the Hutchison Property Group, will be
consolidated into the financial statements of the Group upon completion of the Property Businesses
Combination. Accordingly, prior to and up to completion of the Property Businesses Combination,
references in this listing document to the Group are to the Cheung Kong Property Group, the
Hutchison Property Group and their respective joint ventures, whereas after completion of the
Property Businesses Combination, references in this listing document to the Group are to the
Company and its subsidiaries, comprising the Cheung Kong Property Group, the Hutchison Property
Group and their joint ventures which will become subsidiaries of the Company, and interests in their
other joint ventures that will remain as joint ventures and will not be consolidated.
OVERVIEW
The Group is one of Hong Kong’s largest property developers with a leading market share in
Hong Kong, strong penetration in the PRC and an international presence through its operations in
Singapore and the United Kingdom. The Company’s predecessor, Cheung Kong, became listed in Hong
Kong in 1972 and the Group benefits from a long and successful track record of over 40 years.
The Group’s Principal Activities
The Group has diverse capabilities with principal activities encompassing property development
and investment, hotel and serviced suite operation and property and project management.
The Group’s Property Interests
The Group
Development
properties
Investment
properties
Hotels and
serviced
suites
Interests in
listed REITs
The Group’s property interests comprise the following:
쐌
Development properties, which include properties for and under development (including
completed properties held for sale) and properties in which the Group has a development
interest;
쐌
Investment properties, which include office, retail and industrial properties and car park
spaces;
– 110 –
BUSINESS
쐌
Hotels and serviced suites; and
쐌
Interests in listed REITs, which include unitholding interests in Fortune REIT, Prosperity
REIT and Hui Xian REIT. The Group also has interests in ARA Asset Management (which is
the holding company of the managers of Fortune REIT and Prosperity REIT) and Hui Xian
Asset Management Limited (which is the manager of Hui Xian REIT).
COMPETITIVE STRENGTHS
The Directors consider that the Group’s key competitive strengths include:
One of Hong Kong’s largest property developers, with a proven track record in Hong Kong and
the PRC
The Group is one of Hong Kong’s largest property developers with a leading market share in
Hong Kong, strong penetration in the PRC and an international presence in Singapore and the United
Kingdom. Headquartered in Hong Kong, it is also, as at 31 December 2014:
쐌
One of Hong Kong’s largest owners of investment properties, with a total attributable
interest in approximately 1.6 million sq.m. of rental properties in Hong Kong, the PRC,
Singapore and the United Kingdom;
쐌
One of the largest owner-operators of hotels within Hong Kong, and with an attributable
interest in more than 14,600 hotel rooms in Hong Kong, the PRC and The Bahamas;
쐌
One of Hong Kong’s largest property managers, managing approximately 21 million sq.m. of
properties in Hong Kong and the PRC; and
쐌
Hong Kong’s most active REIT sponsor, having sponsored three listed REITs in Hong Kong
(one of which is also listed in Singapore).
The Group has a proven track record of more than 40 years in Hong Kong. In the PRC, the Group
has been in the property business since the 1980s where, as at the Latest Practicable Date, it had
operations in 21 cities.
As a result of its scale and track record established over its long history, the Group believes it has
a competitive advantage in executing large-scale projects in Hong Kong (including projects developed
with joint venture partners such as MTR Corporation Limited and Urban Renewal Authority) as well as
in cities across the PRC. Key landmark projects developed include Kingswood Villas, Tierra Verde,
Cheung Kong Center, The Center and 1881 Heritage in Hong Kong, and Beijing Oriental Plaza in the
PRC.
Diversified business mix
The Group has extensive expertise in developing, investing in and managing properties across
different asset classes, including residential, office, retail, industrial, car parks and hotel properties,
either as standalone developments or large scale mixed-use projects, solely or through joint ventures
and other arrangements.
– 111 –
BUSINESS
The Group is committed to nurturing new growth through geographic diversification. Historically,
the Group has successfully diversified into other geographical regions outside of Hong Kong and the
PRC, in particular through its premium commercial and residential developments in Singapore and the
United Kingdom. Key landmark projects developed or under development by the Group on a sole basis
or as a key joint venture partner include The Marina Bay Financial Centre and One Raffles Quay in
Singapore, and Albion Riverside and Chelsea Waterfront in London.
By building on a diversified operating base both in terms of asset type and geographical locations,
the Group believes it will be able to further enhance its operational efficiency and effectiveness, and
strengthen its risk management capacity to deal with unforeseen market changes.
Strong recurring income from an extensive asset portfolio
The Group benefits from strong recurring income from its extensive asset portfolio including:
쐌
Rental income from investment properties;
쐌
Income from hotels and serviced suites; and
쐌
Distributions from its interests in listed REITs.
Most of the Group’s investment properties, hotels and services suites are self-developed.
On a pro forma basis, profit contribution from property rental and hotel and serviced suite
operation amounted to approximately HK$8,187 million, representing 43.2% of the Group’s pro forma
unaudited total profit contribution in 2014.
The Group has demonstrated a strong performance in its investment properties, hotels and
serviced suites portfolio where it has provided active asset management through its experienced
property and hotel management teams. The Group is able to maintain high occupancy rates and rental
income growth for its investment property portfolio, and believes its focus on its self-managed hotel
business model has enabled it to adapt dynamically to industry trends and maintain high occupancy
rates and room rate growth. The Group has also undertaken renovations and refurbishments periodically
to optimise the performance of its investment properties, hotels and serviced suites.
The Group has historically utilised REIT platforms to support its overall business strategy. The
three REITs it has sponsored are managed by dedicated and professional asset managers to maximise
returns and value for their respective unitholders. On the other hand, the Group continued to manage
the properties within the REITs as property and leasing manager. The Group is the largest unitholder in
each of these REITs, and benefits from both the recurring distribution income and any long term capital
appreciation.
The Group believes that its strong and diversified recurring income base provides it with a solid
financial foundation to navigate different business cycles, and enhances its credit profile.
Focus on optimising land bank to balance stability and growth
The Group’s long track record and financial strength has allowed it to focus on acquiring land at
times and prices that it considered to be favourable. The Group has always striven to manage its land
bank actively in step with market conditions and attuned to its needs for medium- and long-term
– 112 –
BUSINESS
development. As at 31 December 2014, the Combined Property Businesses maintained a sizeable
development land bank of approximately 0.8 million sq.m., 14.5 million sq.m., 0.1 million sq.m. and
0.4 million sq.m. in Hong Kong, the PRC, Singapore and the United Kingdom, respectively.
Disciplined investment approach and prudent financial management
The Group is steadfast in maintaining financial prudence in its pursuit of acquisitions and
investments. Following completion of the Property Businesses Combination, subject to the confirmation
of credit rating agencies, the Group expects to obtain and maintain strong investment grade ratings.
The Group has had access to diversified financing channels including offshore and onshore bank
borrowings, and maintains strong relationships with a large number of leading financial institutions.
This philosophy and approach has allowed it to achieve attractive financing costs while maintaining
sufficient cash resources.
Through adhering to its fundamental financial policy of maintaining a healthy debt ratio, the
Group has maintained strong liquidity and sufficient financial resources to capitalise on acquisitions and
investment opportunities as they arise.
Highly experienced and professional management with a global vision and strong commitment to
robust corporate governance
The global vision and leadership of the Li family has been a core strength of the Group. Such
vision is supported by a dedicated professional management team with deep industry experience that
has been instrumental to the success of the Group. Following the Spin-off, the Group will continue to
benefit from the intelligence, creativity, dedication and loyalty of its core management team. The Group
believes that the skills and experience of the management team provide the Group with a competitive
advantage by allowing it to identify and capture global business opportunities at the right time in
business cycles while prudently managing risk exposure.
The professional management of the Group has been committed to robust corporate governance
and risk management, and will continue to apply the same rigorous approach to internal controls and
corporate governance within the Group after the Spin-off.
BUSINESS STRATEGIES
The Group will continue to adhere to its core strategic objective of maximising shareholder value
by driving the long-term sustainable growth of its business. The Group is focused on pursuing other
attractive investment opportunities within its core markets, whilst at the same time seeking to expand
its geographic coverage, with a goal of creating steady returns for Shareholders.
Continue to focus on the Group’s core markets
As at the Latest Practicable Date, the Group’s operations were principally in Hong Kong, the
PRC, Singapore and the United Kingdom. The Group will continue to focus on its core markets and
seek to further solidify its market positions in Hong Kong by leveraging its extensive operating
experience and expertise, taking into account the operating conditions and tailoring the schedules of
business development accordingly. The Group will continue its commitment to providing innovative
property concepts, enhancing property qualities and service level, and developing diversified, high
quality projects to meet market trends and needs. In the PRC, the Group is confident in the growth
– 113 –
BUSINESS
prospects of the PRC property market over the longer term and will focus on property developments
and investments in major, high growth cities which have solid economic fundamentals. In Singapore
and the United Kingdom, the Group will continue to identify suitable development projects.
Maintain an active but prudent land bank strategy
The active acquisition of prime sites with good development potential and at a reasonable cost has
been a key pillar of the Combined Property Businesses’ development strategy. The Group will continue
to seek to respond to land acquisition opportunities by utilising its market strengths and financial
resources effectively, across all market segments in Hong Kong, the PRC, Singapore and the United
Kingdom as well as in other select geographies where it believes it can achieve an attractive return for
its shareholders. The Group will be focused on securing suitable investment opportunities to extend
further its footprint in and outside of Hong Kong, leveraging its accumulated expertise and experience
in providing diversified property developments to accommodate different market needs and aspirations.
The Group will continue to have a disciplined approach to future land acquisition and make
acquisitions in a prudent manner.
Continue to grow the Group’s recurring income from investment properties
The Group intends to grow its investment property portfolio by evaluating and strategically
adjusting its mix of properties for sale and investment from time to time in light of, among other
things, the expansion plans of the Group, the related cash flow requirement, the financial position of
the Group and prevailing market conditions. The Group will continue to target large scale, mixed use
projects with a commercial element which can generate stable, recurring income after completion. The
Group will continue to enhance its existing portfolio and optimise its tenant base in order to maximise
its rental rates and occupancy. It will also evaluate and execute asset enhancement opportunities,
seeking to improve overall asset performance and to maximise value. This should enable the Group to
complement its cash flow from sales of properties with stable recurring income and capture long-term
capital appreciation potential of its properties.
Enhance the scale and brand positioning of the Group’s hotel and serviced suite portfolio
The Group will selectively expand its hotel and serviced suite portfolio mainly through primary
land acquisition, including the hotel project on Oil Street in North Point which is currently under
construction. It will also continue to actively manage its existing portfolio and enhance its “Harbour
Grand”, “Rambler”, “Harbour Plaza” and “Horizon” brand positioning. The Group will work with its
internal hotel managers and the respective third party hotel managers to maximise room rates,
occupancy and non-room revenues, while seeking to improve operational efficiency to enhance the
value of its hotels and serviced suites.
Maintain a disciplined financial management approach
The Group will continue to seek to maintain financial prudence in its capital commitments and
deploy its capital resources efficiently to position itself for future growth. The Group believes that by
maintaining a disciplined investment policy and prudent financial management approach, it will be well
positioned to quickly capitalise on potential market opportunities. The Group will also seek access to
diversified funding sources such as offshore and onshore bank borrowings and international capital
markets, and continue to maintain strong relationships with a large number of leading financial
institutions. The Group will seek to adhere to the principle of “advancing with stability”, and to make
various investment and financial decisions based on the long-term interests of shareholders.
– 114 –
BUSINESS
OUR PROPERTY PORTFOLIO
The Group has a diversified portfolio of properties globally, which includes properties located in
Hong Kong, the PRC, Singapore, the United Kingdom and The Bahamas.
As at 31 December 2014, the Combined Property Businesses (which will be held by the Group
pursuant to the Property Businesses Combination) had a total attributable interest in approximately 1.6
million sq.m. of rental properties, a development land bank of approximately 15.8 million sq.m. (of
which approximately 14.5 million sq.m. are located in the PRC) and more than 14,600 hotel rooms and
also managed approximately 21 million sq.m. of properties in Hong Kong and the PRC.
As at 28 February 2015, the Group’s diverse portfolio of development properties, investment
properties and hotels and serviced suites that was valued by the Property Valuers (as set out in
“Appendix III – Property Valuation”) had a total valuation of approximately HK$420.1 billion. The
property interests of the Group that were not valued by the Property Valuers included agricultural land
lots held by the Cheung Kong Property Group with an aggregate net book value of approximately
HK$1.1 billion as at 31 December 2014.
The table below sets out the aggregate GFA and valuation attributable to the Group’s diverse
portfolio of development properties, investment properties and hotels and serviced suites that was
valued by the Property Valuers as at 28 February 2015, respectively. All valuation figures cited are
derived from the property valuation reports contained in “Appendix III – Property Valuation”.
GFA
Development
Properties
Investment
Properties
Valuation
Hotels
Development
Properties
Total
(million sq.m.)
Hong Kong . .
PRC(1) . . . . .
Overseas
Singapore . .
UK . . . . .
The Bahamas
Investment
Properties
Hotels
Total
(HK$ million)
. . . . .
. . . . .
0.9
19.7
1.3
0.2
0.6
0.1
2.8
20.0
87,299
131,412
117,767
5,260
63,908
1,770
268,974
138,442
. . . . .
. . . . .
. . . . .
0.1
0.6
–
–
0.0
–
–
–
0.1
0.1
0.6
0.1
4,648
7,321
16
–
304
–
–
–
445
4,648
7,625
461
Total. . . . . . . . . . .
21.3
1.5
0.8
23.6
230,696
123,331
66,122
420,149
Note:
(1)
Excludes Chongqing Metropolitan Plaza, the sale of which to Hui Xian REIT was completed on 2 March 2015.
– 115 –
– 116 –
.
.
.
.
.
.
.
.
14,614
1,867
2,350
361
19,119
11,919
–
31,038
(ii) Turnover Breakdown by Geography
Hong Kong . . . . . . . . . . . . . . . . . .
PRC . . . . . . . . . . . . . . . . . . . . . .
Overseas. . . . . . . . . . . . . . . . . . . .
Total . . . . . . . . . . . . . . . . . . . . . .
(1)
Notes:
100.0
61.6
38.4
–
100.0
38.2
61.8
47.1
6.0
7.6
1.1
(%)
32,312
14,878
16,454
980
32,312
15,301
17,011
12,288
1,961
2,368
394
(HK$
million)
2013
100.0
46.0
50.9
3.1
100.0
47.4
52.6
38.0
6.1
7.3
1.2
(%)
2014
30,997
23,842
5,945
1,210
30,997
6,959
24,038
19,389
1,908
2,213
528
(HK$
million)
100.0
76.9
19.2
3.9
100.0
22.4
77.6
62.6
6.2
7.1
1.7
(%)
2012
18,042
6,012
11,806
224
18,042
11,805
6,237
–
3,318
2,221
698
(HK$
million)
100.0
33.3
65.4
1.3
100.0
65.4
34.6
–
18.4
12.3
3.9
(%)
21,909
6,321
14,373
1,215
21,909
15,233
6,676
–
3,682
2,196
798
(HK$
million)
2013
100.0
28.9
65.6
5.5
100.0
69.5
30.5
–
16.8
10.0
3.7
(%)
2014
13,746
6,457
5,784
1,505
13,746
6,845
6,901
–
3,995
2,230
676
(HK$
million)
Year ended 31 December
Year ended 31 December
100.0
47.0
42.1
10.9
100.0
49.8
50.2
–
29.1
16.2
4.9
(%)
(%)
46,606
30,837
13,107
2,662
46,606
33,679
6,821
5,564
542
100.0
66.2
28.1
5.7
100.0
72.3
14.6
11.9
1.2
(unaudited)
(HK$
million)
December 2014
Year ended 31
Group
pro forma
Total represents the sum of the turnover of (i) the Cheung Kong Property Group or the Hutchison Property Group (as the case may be) and (ii) their respective share of property
sales of joint ventures. This non-IFRS measure is used by the management of the Cheung Kong Property Group and the Hutchison Property Group, respectively, to evaluate their
respective financial performance, and it is considered by them to be an important performance measure which is used in the Cheung Kong Property Group’s and the Hutchison
Property Group’s internal financial and management reporting to manage their respective business performance. This measure is not identified as an accounting measure under
IFRS and should not be considered as an alternative to the Cheung Kong Property Group’s and the Hutchison Property Group’s respective turnover, which is determined in
accordance with IFRS.
Total
31,038
(1)
11,846
.
.
.
.
Share of property sales of joint ventures .
.
.
.
.
19,192
.
.
.
.
Cheung Kong Property Group
Turnover/Hutchison Property Group
Turnover/Group Pro forma . . . . . . .
Turnover Breakdown by
Operating Activity
Subsidiaries
Property sales . . . . . . . . . . . .
Property rental . . . . . . . . . . .
Hotels and serviced suites . . . . .
Property and project management
. . . . . . . . . . . . . . . . . . . .
(i)
2012
(HK$
million)
Hutchison Property Group
Cheung Kong Property Group
The tables below set out a breakdown of the turnover by operating activity and geography, and a breakdown of the profit contribution by
operating activity, for the Cheung Kong Property Group, the Hutchison Property Group and their respective shares of turnover and profit contribution
from joint ventures and associates, and unaudited pro forma information for the Group on a combined basis for the periods indicated:
BUSINESS
– 117 –
(1)
Notes:
13,297
.
.
.
.
.
.
.
.
.
.
.
.
100.0
74.6
14.9
9.3
1.2
100.0
88.2
5.2
5.7
0.9
100.0
65.6
21.2
11.6
1.6
(%)
13,740
10,172
2,117
1,272
179
6,135
5,486
322
281
46
7,605
4,686
1,795
991
133
(HK$
million)
2013
100.0
74.0
15.4
9.3
1.3
100.0
89.4
5.2
4.6
0.8
100.0
61.6
23.6
13.0
1.8
(%)
2014
12,012
8,501
2,069
1,227
215
2,560
1,924
300
275
61
9,452
6,577
1,769
952
154
(HK$
million)
100.0
70.8
17.2
10.2
1.8
100.0
75.2
11.7
10.7
2.4
100.0
69.6
18.7
10.1
1.6
(%)
2012
10,542
6,219
3,340
940
43
6,859
6,219
381
259
–
3,683
–
2,959
681
43
(HK$
million)
100.0
59.0
31.7
8.9
0.4
100.0
90.7
5.5
3.8
–
100.0
–
80.3
18.5
1.2
(%)
10,710
6,039
3,721
937
13
6,662
6,039
378
245
–
4,048
–
3,343
692
13
(HK$
million)
2013
100.0
56.4
34.7
8.8
0.1
100.0
90.6
5.7
3.7
–
100.0
–
82.6
17.1
0.3
(%)
2014
6,788
1,903
3,978
949
(42)
2,508
1,903
361
244
–
4,280
–
3,617
705
(42)
(HK$
million)
Year ended 31 December
Year ended 31 December
100.0
28.0
58.6
14.0
(0.6)
100.0
75.9
14.4
9.7
–
100.0
–
84.5
16.5
(1.0)
(%)
(%)
18,964
10,602
6,002
2,185
175
18,964
10,602
6,002
2,185
175
100.0
55.9
31.7
11.5
0.9
100.0
55.9
31.7
11.5
0.9
(unaudited)
(HK$
million)
December 2014
Year ended 31
Group
pro forma
Profit contribution represents earnings before interest, taxes, changes in fair value of investment properties, investment and finance income and profit on disposal of investments
and others. This non-IFRS measure is used by the management of the Cheung Kong Property Group and the Hutchison Property Group, respectively, to evaluate their respective
financial performance, and it is considered by them to be an important performance measure which is used in the Cheung Kong Property Group’s and the Hutchison Property
Group’s internal financial and management reporting to manage their respective business performance. This measure is not identified as an accounting measure under IFRS and
should not be considered as an alternative to the Cheung Kong Property Group’s and the Hutchison Property Group’s results of operations, which are determined in accordance
with IFRS. Further, it may not be comparable to other similarly titled measures of other companies.
.
.
.
.
.
.
.
.
Total . . . . . . . . . . . . . . . . . . . . . . . .
.
.
.
.
.
.
.
.
9,916
1,979
1,233
169
.
.
.
.
.
.
.
.
.
.
.
.
.
.
.
.
.
.
.
.
Total
Property sales . . . . . . . . . . .
Property rental . . . . . . . . . . .
Hotels and serviced suites . . . .
Property and project management
.
.
.
.
5,277
.
.
.
.
Total . . . . . . . . . . . . . . . . . . . . . . . .
.
.
.
.
4,655
275
302
45
.
.
.
.
.
.
.
.
.
.
.
.
Joint Ventures and Associates
Property sales . . . . . . . . . . .
Property rental . . . . . . . . . . .
Hotels and serviced suites . . . .
Property and project management
.
.
.
.
8,020
.
.
.
.
Total . . . . . . . . . . . . . . . . . . . . . . . .
.
.
.
.
5,261
1,704
931
124
.
.
.
.
.
.
.
.
Profit Contribution Breakdown(1)
Subsidiaries
Property sales . . . . . . . . . . . .
Property rental . . . . . . . . . . . .
Hotels and serviced suites . . . . .
Property and project management .
2012
(HK$
million)
Hutchison Property Group
Cheung Kong Property Group
BUSINESS
BUSINESS
DEVELOPMENT PROPERTIES
The Group’s development properties comprise properties for/under development, including
properties in which the Group has a development interest.
Properties for/under development refers to completed properties which the Group holds for sale
and properties being developed and/or to be developed.
Properties in which the Group has a development interest refers to properties developed, being
developed and/or to be developed pursuant to certain joint development agreements entered into by the
Group with third parties on land owned by those third parties.
The Group’s development property portfolio that was valued by the Property Valuers as at 28
February 2015 comprised an aggregate attributable GFA of approximately 21.3 million sq.m..
Properties For/Under Development
The Group has a proven track record in property sales and is primarily involved in the
development of residential property for sale. The Group’s portfolio of properties for/under development
is located in Hong Kong, the PRC, Singapore, the United Kingdom and The Bahamas and comprises:
쐌
completed properties which are held for sale; and
쐌
properties which are being developed and/or are to be developed.
The table below sets out the GFA (or expected GFA) attributable to the Group of the Group’s
portfolio of properties for/under development that were valued by the Property Valuers as at 28
February 2015:
Completed
and Held for
Sale
Being and/or
to be
Developed
Total
GFA (million sq.m.)
Hong Kong. . . .
PRC. . . . . . . . .
Overseas
Singapore . . .
UK . . . . . . . .
The Bahamas
..............................
..............................
0.2
1.7
0.7
18.0
0.9
19.7
..............................
..............................
..............................
–
–
–
0.1
0.6
–
0.1
0.6
–
Total . . . . . . . . . . . . . . . . . . . . . . . . . . . . . . . . . . . . . .
1.9
19.4
21.3
– 118 –
BUSINESS
Properties with a Development Interest
According to the joint development arrangements entered into between the Group and third party
land owners, typically the Group is under a contractual obligation to carry out the development and to
finance the construction costs and occasionally also the land costs, and is entitled to share the surplus
proceeds or development profits of these properties after their completion.
Joint development property projects of the above category in which the Group will be interested,
directly or economically, following the completion of the relevant transactions under the Reorganisation
Agreement, include projects with the MTR Corporation Limited, Urban Renewal Authority and other
land owners, including property projects such as City Point and Hemera at LOHAS Park.
Reorganisation to the Group
In preparation for the Listing, the Group’s interest in development properties will be reorganised
to form part of the Group.
The reorganisation of the Group’s interests held under joint ventures (including but not limited to
the shares of certain CKH Holdings Group developer companies that have entered into joint
development agreements with third party land owners, or the respective holding companies of such
developer companies) to form part of the Group will, in some cases, require consents from third parties
(such as the joint venture partners). In the event that the relevant third party consents cannot be
obtained to the satisfaction of the Company on or before 10 business days prior to the completion date
for the reorganisation (which is expected to be the date of Listing), economic interests and other rights
and obligations in respect of those joint ventures (including the relevant developer company, or its
respective holding company), will, upon completion of the Property Businesses Combination, be passed
to the Group pursuant to arrangements entered into between the CKH Holdings Group, the Hutchison
Group and the Group.
For further details, see “History and Reorganisation – The Reorganisation – Property Businesses
Combination”.
As advised by the Company’s reporting accountants, from the financial reporting perspective, for
financial periods during which those economic interests are passed to the Group through contractual
arrangements, the economic interests are expected to be treated in the consolidated financial statements
of the Company in a similar manner as they would if those joint ventures were owned by the Group
and as if the properties in which those joint ventures had development interests were properties in
which the Group had development interests. Therefore, the Group does not expect that there would be
material financial or operational impact on the Group in the event that the third party consents referred
to above could not be obtained in time. Following completion of the Property Businesses Combination,
the Group will continue to provide operational and financial support (including making available human
and financial resources) to those CPB Specified Companies in which the CKH Holdings Group will
continue to hold Shares pending obtaining the Third Party Consents in relation to the performance of
their obligations regarding the development properties although the Company would only have
unsecured claims for the economic interests in respect of, and funding provided to, the CPB Specified
Companies under the contractual arrangements.
– 119 –
– 120 –
13
8,513
11,725
6,073
–
–
Ho Man Tin
Hung Hom
Cheung Sha Wan
Tseung Kwan O
Yuen Long
777
138
512
122
191
74
247
58
468
330
–
13
N/A
Number of
Car Parking
Spaces
2007
2013
2009
2000
2005
2014
2014
Actual
Completion
Date
(Year)
2014
2014
2014
1956 & 1965
2013
N/A
356
565
571
126
483
851
556
158
2,708
Total Value
Attributable to
the Group
(HK$ million)
460
2,230
7,302
801
106
340
361
126
100.0%(1)
98.47%
537
851
556
158
2,708
Total Value
(HK$ million)
460
2,623
8,590
801
106
340
90.0%
100.0%
100.0%(1)
100.0%
100.0%
(1)
100.0%(1)
85.0%
85.0%(1)
100.0%
100.0%
100.0%
Interest
Attributable to
the Group
As at 28 February 2015
VI-8 to VI-14,
VI-16, VI-18,
VI-19, VI-22,
VI-23, VI-25,
VI-28 to VI-30,
VI-33 to VI-38
VI-32
VI-31
VI-24
VI-26
VI-27
VI-21
VI-20
VI-1
VI-2
VI-3
VI-4 to VI-7
VI-15
VI-17
Reference Number
in Property
Valuation Report
Notes:
(1)
For properties in which the Group’s interest is in relation to development rights, the percentage interest shown represents the Group’s attributable interest in the developer company
which entered into the relevant joint development contract with the land owner.
(2)
Comprising the saleable area of the residential units and GFA of the commercial units held for sale.
(3)
Denotes saleable area.
–
–
27
118
63
427
766(3)
Tai Po
Kwai Chung
12
651
1,648
48
20
N/A
26,824(3)
Cheung Sha Wan
Tsuen Wan
Tseung Kwan O
Kowloon Tong
Cheung Sha Wan
Yau Tong
Location
Number of
Units Held for
Sale
GFA Held for
Sale (including
Sold) and Not
Recognised
(sq.m.)
4,766(2)
41,951(3)
(3)
127,270(3)
5,937
2,666
N/A
As at 31 December 2014
Principal Completed Properties Held for Sale in Hong Kong
Trinity Towers (Development rights) .
City Point (Development rights) . . . . .
Hemera (Development rights) . . . . . . .
Luso Apartments (Various units). . . . .
West Kowloon Place . . . . . . . . . . . . .
5 Tung Yuen Street, Remaining
Portion of Yau Tong Inland Lot
No. 4 . . . . . . . . . . . . . . . . . . . . . .
Mont Vert, Phase 1 (Various units and
car parks) . . . . . . . . . . . . . . . . . . .
The Rise (Various units and car
parks) . . . . . . . . . . . . . . . . . . . . . .
Celestial Heights Mall . . . . . . . . . . . .
The Laguna Mall (Portions) . . . . . . . .
Banyan Garden (Various commercial
units and car parks) (Development
rights) . . . . . . . . . . . . . . . . . . . . . .
The Beaumount (Various car parks)
(Development rights). . . . . . . . . . .
Central Park Towers (Various car
parks) . . . . . . . . . . . . . . . . . . . . . .
Other completed properties held for
sale in Hong Kong . . . . . . . . . . . .
Project
(i)
Tables containing certain key information with respect to the Group’s principal development properties that were valued by the Property Valuers
as at 28 February 2015, which comprise completed properties held for sale and properties for/under development (including properties in which the
Group has a development interest), are set out below. The details below on the GFA for sale, number of units held for sale and number of car
parking spaces are presented as at 31 December 2014, which correspond to the date of the unaudited pro forma combined statement of assets and
liabilities of the Group and the date the last audited financial statements of the Cheung Kong Property Group and of the Hutchison Property Group
were made up to. To facilitate reference, the tables also show the valuations of the properties valued by the Property Valuers as at 28 February 2015
(see “Appendix III – Property Valuation”) together with the Group’s attributable interests as at that date.
Key Information of the Principal Development Properties
BUSINESS
– 121 –
N/A
50
340
135
3,756
28
10,720
7,114
11,966
1,632
3,043
159
3,064
996
707
2,162
1,090
576
409
1,104
723
4,295
2,200
5,420
N/A
973
N/A
7,286
2,412
1,708
873
1,672
160
1,554
297
580
1,018
332
679
205
46
77
613
1,280
100.0%
946
(1)
400
60.0%
100.0%
6,294
29
11,120
100.0%(1)
80.0%
100.0%
8,633
14,930
1,861
3,140
349
3,960
1,039
750
2,736
3,200
2,405
460
1,540
1,323
5,500
100.0%
100.0%
100.0%(1)
100.0%
100.0%
100.0%
100.0%
100.0%
100.0%
100.0%
100.0%
100.0%
100.0%
100.0%
100.0%
(HK$
million)
Total Value
1,280
568
400
5,035
29
11,120
8,633
14,930
1,861
3,140
349
3,960
1,039
750
2,736
3,200
2,405
460
1,540
1,323
5,500
(HK$
million)
Total Value
Attributable
to the Group
X-4
X-3
X-2
IX-17
X-1
IX-16
IX-13
IX-14
IX-15
IX-12
IX-10
IX-11
IX-8
IX-9
IX-4
IX-5
IX-6
IX-7
IX-1
IX-2
IX-3
Pre-sale consent was obtained for Stars by the Harbour in February 2015.
N/A
N/A
N/A
2015
N/A
2018
2017
2017
2017
2016
2016
2016
2015
2016
2016
2016
2015
2015
2015
2015
2015
(HK$
million)
Interest
Attributable
to the Group
DIVA is a non-consent scheme project and no pre-sale consent is required.
N/A
N/A
N/A
–
N/A
–
–
–
–
–
–
–
2014
–
–
–
–
–
2014
-(2)
–(3)
(HK$
million)
Incurred
Development
Costs
(3)
50
N/A
N/A
2010
N/A
2012
2011
2011
2012
2012
2009
2011
2011
2011
2010
2012
2011
2011
2007
2009
2010
(Year)
Estimated
Completion
Date
(2)
877
N/A
N/A
294
N/A
469
199
334
–
270
–
145
43
59
247
22
195
41
66
–
227
(Year)
Pre-sale
Consent
Date
Reference
Number in
Property
Valuation
Report
For properties in which the Group’s interest is in relation to development rights, the percentage interest shown represents the Group’s attributable interest in the developer company
which entered into the relevant joint development contract with the land owner.
55,342
N/A
N/A
228
N/A
2,426
378
181
185
452
75
1,129
216
67 houses
279
122
312 units and
9 houses
872
11 houses
661
41 houses
(Year)
Number of
Development
Car Parking Commencement
Spaces
Date
Estimated
Future
Development
Costs
As at 28 February 2015
(1)
Notes:
Shum Shui Po
N/A
Yuen Long
36,630
N/A
Ho Man Tin
Tuen Mun
N/A
207,650
Tsuen Wan
Kowloon
70,200
40,440
17,790
North Point
Mid-Levels
Central
3,577
61,700
To Kwa Wan
Yuen Long
52,227
9,740
9,391
Hung Hom
Yuen Long
Ma On Shan
51,000
6,613
30,099
6,076
Tseung Kwan O
Repulse Bay
Aberdeen
Yuen Long
The Beaumount II . . . . . . . . . .
90 Repulse Bay Road . . . . . . .
41 Heung Yip Road. . . . . . . . .
Lot No.2129 in DD No. 121,
Ping Shan . . . . . . . . . . . . . .
La Lumière . . . . . . . . . . . . . . . .
Lot No.2086 in DD No. 105,
Ngau Tam Mei . . . . . . . . .
77-87 Ma Tau Wai Road . . . .
Yuen Long Town Lot No.
518 . . . . . . . . . . . . . . . . . . .
STTL No. 574, Choi Sha
Street, Lok Wo Sha . . . . .
IL 8920, Oil Street . . . . . . . . .
IL 8949, Borrett Road. . . . . . .
Peel Street/Graham Street,
Site B (Development
right) . . . . . . . . . . . . . . . . . .
West Rail Tsuen Wan Station
TW5 Bayside
(Development right) . . . . .
KIL 11125, Argyle Street . . . .
Interest in certain agricultural
land in Siu Sau Tsuen . . .
Various lots in Survey
District No. 1 Nga Tsin
Wai Village . . . . . . . . . . . .
Lot 1457 RP in DD No. 123,
Fung Lok Wai . . . . . . . . . .
Hai Tan Street/Kweilin
Street/Pei Ho Street
(Development right) . . . . .
(sq.m.)
Total GFA
16,892
6,606
33,979
Location
Number of
Units Held
for Sale
As at 31 December 2014
Principal Properties Being Developed and/or To Be Developed in Hong Kong
Mont Vert, Phase 2 . . . . . . . . . Tai Po
DIVA . . . . . . . . . . . . . . . . . . . . . North Point
Stars by the Harbour . . . . . . . . Hung Hom
Project
(ii)
BUSINESS
– 122 –
Wuhan
Wuhan
Wuhan
110,618
35,271
787,945
1,327,287
80,052
1,333,333
119,502
309,330
14,528
144,483
74,091
260,561
50,729
263,417
269,826
16,974
85,185
375,852
19,618
Maofengshan(2) . . . . . .
Aotou. . . . . . . . . . . . . .
Silver Cove . . . . . . . . .
Emerald City . . . . . . . .
The Harbourfront . . . . .
City Link . . . . . . . . . . .
Riviera Palace . . . . . . .
Royal Waterfront. . . . . .
Regency Cove . . . . . . .
Maison des Artistes. . . .
Regency Garden . . . . . .
Seasons Villas. . . . . . . .
Century Place . . . . . . . .
Noble Hills. . . . . . . . . .
Regency Park . . . . . . . .
The Metropolitan
Tianjin(3) . . . . . . . . . .
Millennium Waterfront .
The Metropolitan . . . . .
Regency Cove . . . . . . .
Guangzhou
Huizhou
Jiangmen
Nanjing
Qingdao
Shanghai
Shanghai
Shanghai
Shanghai
Shanghai
Shanghai
Shanghai
Shenzhen
Shenzhen
Shenzhen
Tianjin
74,857
491,779
2,112,672
The Greenwich . . . . . . .
Beixin Village. . . . . . . .
Regency Cove . . . . . . .
Regency Park . . . . . . . .
Regency Residence . . . .
Noble Hills. . . . . . . . . .
Regency Park . . . . . . .
Le Parc . . . . . . . . . . . .
Regency Oasis . . . . . . .
Cape Coral . . . . . . . . . .
Noble Hills. . . . . . . . . .
Regency Hills . . . . . . . .
Regency Lakeview . . . .
Wolong Bay . . . . . . . . .
Laguna Verona . . . . . . .
Emerald Cove. . . . . . . . Foshan
Cape Coral . . . . . . . . . . Guangzhou
Noble Hills(1) . . . . . . . . Guangzhou
Site Area
(sq.m.)
263,256
254,742
158,892
920,689
143,441
556,708
80,600
811,615
373,333
128,214
447,028
1,041,360
132,471
319,359
3,236,869
Location
Beijing
Beijing
Changchun
Changchun
Changchun
Changsha
Changzhou
Chengdu
Chengdu
Chongqing
Chongqing
Chongqing
Chongqing
Dalian
Dongguan
Project
714,697
265,752
1,672,655
–
240,156
429,430
527,344
1,094,634
90,661
215,981
133,142
73,589
213,258
451,381
71,707
179,420
146,588
117,774
204,718
261,996
518,185
348,507
(sq.m.)
475,878
96,400
283,044
394,949
274,091
409,699
228,650
3,040,422
566,065
433,130
413,108
4,121,781
357,660
535,338
1,744,929
23,453
–
89,357
–
–
–
–
421,860
–
–
–
73,589
213,258
272,175
71,707
179,420
146,588
117,774
204,718
–
261,821
109,807
(sq.m.)
261,619
–
–
170,883
274,091
116,717
228,650
1,567,795
566,065
433,130
413,108
–
–
–
359,052
6,045
–
–
–
–
–
–
305,399
–
–
–
37,745
184,001
252,795
66,687
122,172
137,062
110,894
54,959
–
245,428
66,858
(sq.m.)
220,029
–
–
156,332
261,011
28,093
107,090
1,299,143
337,233
343,633
370,357
–
–
–
266,206
17,408
–
89,357
–
–
–
–
116,461
–
–
–
35,844
29,257
19,380
5,020
4,485
9,526
6,880
149,759
–
16,393
42,949
(sq.m.)
38,976
–
–
14,551
(6)
11,615
88,624
121,560
268,652
228,832
89,497
42,751
–
–
–
92,016
2014
–
2014
–
–
–
–
2014
–
–
–
2011
2008
2014
2012
2012
2013
2010
2013
–
2013
2014
(Year)
2011
–
–
2013
2013
2013
2014
2014
2013
2013
2014
–
–
–
2014
691,244
265,752
1,583,298
–
240,156
429,430
527,344
672,774
90,661
215,981
133,142
–
–
179,206
–
–
–
–
–
261,996
256,364
238,700
(sq.m.)
214,259
96,400
283,044
224,066
–
292,982
–
1,472,627
–
–
–
4,121,781
357,660
535,338
1,385,877
58,942
–
–
–
–
–
48,164
20,600
–
–
–
–
–
–
–
–
–
–
–
–
15,401
–
–
–
7,984
4,929
–
–
–
8,802
–
–
–
85,111
–
–
–
(sq.m.)
(Year)
2011
2012
2014
2014
2010
2012
2013
2009
2013
2011
–
–
2006
–
–
–
–
–
2012
2012
2006
2013
–
–
–
–
2014
2014
–
–
–
–
–
–
–
–
–
–
–
–
2014
–
–
2014
–
–
–
2014
–
–
–
2011
–
–
2014
2014
(Year)
2010
–
–
–
2007
2011
2011
2005
2004
2005
2011
2011
As at 31 December 2014
Total GFA
for the
Project
Completed Properties Held for Sale
Properties for/under Development
(Excluding
GFA Held
Completed
Actual
GFA Sold for Sale and
Pre-Sale
Phases Fully
Development
Total GFA
Completion
Not
and
Total GFA
Sold and
Commencement Consent
Under
GFA
(4)
Date
Date
Recognised) Completed Recognised Recognised
Date
Development Pre-sold
(iii) Principal Development Properties in the PRC
2016
2017
2024
2019
2022
2015
2017
2017
2015
2015
–
–
2016
–
–
–
–
–
2016
2016
2017
4,080
1,131
1,426
156
82
451
4,374
5,962
651
1,880
2,104
1,268
1,732
1,830
1,994
2,723
2,012
1,197
2,116
1,325
693
591
Estimated
Incurred
Completion Development
(5)
Date
Costs
(RMB
(Year)
million)
2018
2,035
2020
203
2015
1,460
2016
1,955
1,526
2018
868
2,443
2018
9,327
–
2,563
–
2,506
–
2,322
2023
2,959
2016
2,008
2018
1,444
2027
1,733
1,699
1,061
7,471
100.0%
100.0%
100.0%
8,297
1,760
2,732
8,297
1,760
2,732
I-30, IV-21
IV-22
I-29, V-15
Reference
Number in
Estimated
Total Value Property
Interest
Future
Attributable Valuation
Development Attributable
to the Group Total Value to the Group Report
Costs
(RMB
(RMB
(RMB
million)
million)
million)
1,791
100.0%
2,161
2,161
I-1, V-1
3,128
100.0%
221
221
V-2
394
100.0%
1,748
1,748
IV-3
801
100.0%
1,157
1,157
I-3, IV-2
100.0%
177
177
I-4
1,264
100.0%
1,265
1,265
I-9, V-5
–
100.0%
1,493
1,493
I-23
6,043
100.0%
7,276
7,276 I-5, IV-4, V-4
–
100.0%
1,653
1,653
I-6
–
95.0%
917
871
I-8
–
100.0%
602
602
I-7
22,091
95.0%
3,841
3,649
IV-5
971
100.0%
2,152
2,152
IV-6
2,326
100.0%
1,521
1,521
IV-8, V-7
7,163
99.823%
7,400
7,387 I-10, IV-7,
V-6
672
100.0%
1,640
1,640
IV-9
555
100.0%
2,128
2,128 I-11, IV-10
1,068
100.0%
703
703 I-13, V-10,
V-11
489
100.0%
371
371
V-9
1,088
100.0%
129
129
V-14
3,454
90.0%
470
423
V-17
1,739
100.0%
5,882
5,882
IV-13
2,829
90.0%
6,648
5,983 I-16, IV-14
673
60.0%
1,710
1,026
IV-15
760
100.0%
2,736
2,736
IV-16
318
100.0%
2,178
2,178
IV-17
–
85.0%
891
757
I-20
–
100.0%
187
187
I-17
778
85.0%
2,760
2,346 I-21, IV-18
–
100.0%
342
342
I-19
–
80.0%
226
181
I-24
–
100.0%
279
279
I-26
–
100.0%
269
269
I-25
–
100.0%
3,314
3,314
I-28
As at 28 February 2015
BUSINESS
321,261
225,547
176,853
Guangzhou
Guangzhou
Shanghai
100.0%
80.0%
60.0%
60.0%
5,596
82
2,694
14,224
3,066
5,596
82
2,155
8,534
1,840
I-14, IV-11,
V-12
I-15, IV-12
I-22, IV-19,
V-13
IV-20
I-12, I-18,
I-27, I-32
– 123 –
Location
Thomson Grand . . . . . . . . . Singapore
Land Parcel at Upper
Singapore
Serangoon Road . . . . . .
Project
(sq.m.)
48,159
30,292
Total GFA
for the
Project
361
N/A
Number of
Units Held
for Sale
–
N/A
(Year)
2011
N/A
Number of
Car Parking
Development
Spaces Held Commencement
for Sale
Date
(Year)
2011
N/A
Pre-sale
Consent
Date
As at 31 December 2014
(Year)
2015
2019
Estimated
Completion
Date
Incurred
Development
Costs
(SGD
million)
425
82
Estimated
Future
Development
Costs
(SGD
million)
101
378
100.0%
100.0%
Interest
Attributable
to the Group
Total Value
(SGD
million)
549
265
Total Value
Attributable
to the Group
(SGD
million)
549
265
As at 28 February 2015
XI-1
XII-1
Reference
Number in
Property
Valuation
Report
Principal Development Properties in Singapore
1,663
720
8,386
1,777
(v)
2,589
2,210
4,781
1,764
Excluding 1,465 sq.m. completed and held for own use.
2017
2016
2018
2019
(6)
2013
2014
2013
–
(Year)
2014
–
–
2012
–
The estimated completion date of the last phase (except the portion without a development plan).
2008
2011
2007
2011
2010
2013
2006
2008
2012
(5)
(Year)
The actual completion date of the last phase.
68,776
2,336
102,462
–
(sq.m.)
40,212
–
–
133,317
–
(4)
588,115
201,063
1,120,794
359,561
(sq.m.)
419,485
65,558
277,995
479,978
725,800
The GFA, development cost and valuation data excludes the interest attributable to the joint venture partner of the project. For more details, please refer to “Business –
Development Properties – Description of Selected Development Properties – PRC – The Metropolitan Tianjin Project in Tianjin”.
2013
2014
2013
2013
(Year)
2012
(3)
–
8,049
28,106
120,145
(sq.m.)
91,578
–
–
14,313
–
Maofengshan in Guangzhou is held for future development and currently there is no development plan.
–
37,811
–
49,631
(sq.m.)
644,959
–
–
229,513
–
For Noble Hills in Guangzhou, a portion with a site area of 1,519,840 sq.m. is held for future development and there is no development plan currently for this portion.
–
46,734
28,106
172,255
(sq.m.)
736,537
–
–
263,431
–
(2)
588,115
247,797
1,148,900
531,816
(sq.m.)
1,156,022
65,558
277,995
743,409
725,800
Reference
Number in
Estimated
Total Value Property
Interest
Estimated
Future
Incurred
Attributable Valuation
Completion Development Development Attributable
to the Group Total Value to the Group Report
Date(5)
Costs
Costs
(RMB
(RMB
(RMB
(RMB
(Year)
million)
million)
million)
million)
2016
5,349
1,382
100.0%
2,542
2,542 I-31, IV-23
2016
493
449
100.0%
524
524
V-18
2018
175
1,150
100.0%
711
711
V-16
2018
4,114
2,014
100.0%
4,847
4,847 I-2, IV-1, V-3
2020
2,052
4,683
100.0%
2,150
2,150
V-8
As at 28 February 2015
(1)
Notes:
211,621
(sq.m.)
482,173
109,264
200,000
741,822
143,034
Site Area
Xi’an
Zhongshan
Zhuhai
Beijing
Dalian
Location
Hupan Mingdi . . . . . . . Shanghai
Other development
properties in the PRC .
The Greenwich . . . . . . .
Cuilihu. . . . . . . . . . . . .
Horizon Costa. . . . . . . .
La Grande Ville . . . . . .
Heizuizi, Xigang
District. . . . . . . . . . . .
Guangzhou Guoji
Wanjucheng . . . . . . . .
Yuhu Mingdi . . . . . . . .
Upper West Shanghai . .
Project
As at 31 December 2014
Total GFA
for the
Project
Completed Properties Held for Sale
Properties for/under Development
(Excluding
GFA Held
Completed
Actual
GFA Sold for Sale and
Pre-Sale
Development
Phases Fully
Total GFA
Completion
Not
and
Total GFA
Commencement Consent
Sold and
Under
GFA
(4)
Date
Date
Date
Recognised) Completed Recognised Recognised
Development Pre-sold
BUSINESS
Location
709
4,556
N/A
618
1,840
N/A
– 124 –
Location
(1)
Note:
–
–
N/A
(Year)
2018
2024
N/A
(Year)
Estimated
Completion
Date
482
1,145
N/A
(GBP
million)
167
108
1
(GBP
million)
Incurred
Development
Costs
95.0%
100.0%
100.0%
Interest
Attributable
to the Group
N/A
(sq.m.)
Total GFA
for the
Project
N/A
Number of
Units Held
for Sale
N/A
(Year)
N/A
Number of
Car Parking
Development
Spaces Held Commencement
for Sale
Date
N/A
(Year)
Pre-sale
Consent
Date
As at 31 December 2014
515
125
0.4
(GBP
million)
Total Value
489
125
0.4
(GBP
million)
Total Value
Attributable
to the Group
N/A
(Year)
Estimated
Completion
Date
(USD
million)
N/A
(USD
million)
Incurred
Development
Costs
7
Estimated
Future
Development
Costs
100.0%
Interest
Attributable
to the Group
(USD
million)
2
Total Value
(USD
million)
2
Total Value
Attributable
to the Group
As at 28 February 2015
Silver Point Beach Land (excluding road easement) has a site area of 68,797 sq.m. and currently there is no development plan for the project.
The Bahamas
Silver Point Beach Land
(Excluding road
easement)(1) . . . . . . . . .
Project
2012
2015
N/A
(Year)
Pre-sale
Consent
Date
Estimated
Future
Development
Costs
As at 28 February 2015
Land at Teversham Road, Fulbourn has a site area of 68,500 sq.m. and a leaseable/saleable area of 68,500 sq.m.. Currently there is no development plan for the project.
119,069
419,000
68,500
(sq.m.)
Number of
Units Held
for Sale
(vii) Principal Development Properties in The Bahamas
(1)
Note:
Chelsea Waterfront . . . . . . . London
Convoys Wharf . . . . . . . . . London
Fulbourn,
Land at Teversham Road,
Fulbourn(1) . . . . . . . . . . Cambridgeshire
Project
Total GFA
for the
Project
Number of
Car Parking
Development
Spaces Held Commencement
for Sale
Date
As at 31 December 2014
(vi) Principal Development Properties in the United Kingdom
CBRE
Reference
Number in
Property
Valuation
Report
XIII-1
XIV-1
Smiths Gore
Reference
Number in
Property
Valuation
Report
BUSINESS
BUSINESS
Description of Selected Development Properties
As at 31 December 2014, the following were (i) the development properties in Hong Kong and
the PRC (which comprise properties for/under development including properties in which the Group has
a development interest) each of which had a carrying amount as at 31 December 2014 of over 1% of
the Group’s pro forma total assets as set out in Appendix II, and (ii) selected development properties in
Singapore and the U.K.:
(i)
Hong Kong
Borrett Road Project
The Borrett Road Project is a development located in the Mid-Levels on Hong Kong Island.
This project is a residential development with a site area of approximately 10,488 sq.m..
We commenced the development of this project in June 2011 and expect to complete this
project in June 2017.
Residential
As at 31 December 2014, the five residential buildings comprising 181 units at the Borrett
Road Project, with a GFA of approximately 40,440 sq.m., were under development.
Oil Street Project
The Oil Street Project is a development located in North Point on Hong Kong Island, which
is near to the Fortress Hill MTR Station on the Island Line and is adjacent to Victoria Harbour.
The Oil Street Project is a mixed-use development that is expected to comprise residential units
and a 4-star hotel. This project has a site area of approximately 7,887 sq.m. and a GFA of
approximately 70,200 sq.m..
We commenced the development of this project in September 2011 and expect to complete
this project in December 2017.
Residential
As at 31 December 2014, the six residential buildings comprising 378 units at the Oil Street
Project, with a GFA of approximately 40,200 sq.m., were under development.
Hotel
As at 31 December 2014, the hotel at the Oil Street Project, with a GFA of approximately
30,000 sq.m., was under development. The hotel is expected to comprise approximately 840
rooms. We commenced construction of the hotel in September 2011 and the hotel is expected to
commence operations in 2018. The hotel is expected to be positioned as a business hotel, offering
affordable accommodation at a convenient location for corporate and leisure travellers.
– 125 –
BUSINESS
Argyle Street Project
The Argyle Street Project is a development on Argyle Street in Kowloon. This project is a
residential development with a site area of approximately 7,326 sq.m..
We commenced the development of this project in August 2010 and expect to complete this
project in October 2015.
Residential
As at 31 December 2014, the six residential buildings comprising 228 units at the Argyle
Street Project, with a GFA of approximately 36,630 sq.m., were under development.
Stars by the Harbour Project
The Stars by the Harbour Project is a development located at the junction of Oi King Street
and Hung Luen Road in Kowloon. This project is a residential development with a site area of
approximately 7,551 sq.m..
We commenced the development of this project in August 2010 and expect to complete this
project in December 2015.
Residential
As at 31 December 2014, the four residential buildings comprising 312 units and nine
houses at the Stars by the Harbour Project, with a GFA of approximately 33,979 sq.m., were
under development.
West Rail Tsuen Wan West Station TW5 Bayside Project
The West Rail Tsuen Wan West Station TW5 Bayside Project is a development located in
Tsuen Wan, which is near the Tsuen Wan West Station on the West Rail Line. This project is a
residential and commercial development with a GFA of approximately 207,650 sq.m.. It comprises
residential units and retail space.
We commenced the development of this project in November 2012 and expect to complete
this project in 2018.
Residential
As at 31 December 2014, the nine residential buildings comprising 2,426 units at the West
Rail Tsuen Wan West Station TW5 Bayside Project, with a GFA of approximately 167,100 sq.m.,
were under development.
Retail
As at 31 December 2014, the retail space at the West Rail Tsuen Wan West Station TW5
Bayside Project is expected to have a GFA of approximately 40,550 sq.m. upon completion of this
project. We expect the retail space will provide us with a recurring rental income.
– 126 –
BUSINESS
Hemera
Hemera is a development located in Tseung Kwan O, which is in proximity to the LOHAS
Park MTR Station on the Tseung Kwan O Line. This project is a residential development with a
site area of approximately 13,587 sq.m. and a saleable area of approximately 127,270 sq.m..
We commenced the development of this project in March 2008 and this project was
completed in December 2014.
Residential
As at 31 December 2014, sales of the four residential buildings comprising 1,648 units at
Hemera have not yet been launched.
(ii)
PRC
Upper West Shanghai Project in Shanghai
The Upper West Shanghai Project is a development located in Putuo District, Shanghai,
which is near to the Shanghai West Station and the Hong Qiao transportation hub.
We commenced the development of this project in July 2007 and expect to complete this
project in 2018. This project is being developed by the Group and a joint venture partner which is
an independent third party of the Group. The land premium for this project is expected to be fully
paid in April 2015.
The Upper West Shanghai Project is a mixed-use development that is expected to comprise
retail space, residential units, Grade A office buildings, hotels, serviced apartments and 44,000
sq.m. of recreational space. According to the approval document issued by the relevant
government authority, the Upper West Shanghai Project is expected to comprise a total GFA of
approximately 1,148,900 sq.m. upon completion.
Residential
As at 31 December 2014, the nine residential buildings comprising 1,456 units at the Upper
West Shanghai Project were under development.
Office
As at 31 December 2014, the four Grade A office buildings at the Upper West Shanghai
Project were under development. The office buildings are expected to be available both for sale
and leasing upon completion.
Retail
As at 31 December 2014, the retail space at the Upper West Shanghai Project was under
development. We expect the retail space will provide us with a recurring rental income upon
completion.
– 127 –
BUSINESS
Serviced Apartments
As at 31 December 2014, the serviced apartments at the Upper West Shanghai Project were
under development.
Hotels
As at 31 December 2014, the two hotels at the Upper West Shanghai Project were under
development. The hotels are expected to comprise approximately 1,444 guest rooms. Construction
of the hotels was commenced in January 2009 and the hotels are expected to commence
operations in 2018.
Millennium Waterfront Project in Wuhan
The Millennium Waterfront Project is a development located in Jianghan District, Wuhan,
which is near to the Yangtze River, the Wuhan Customs House, which is a historical building, and
the Jianghanglu Metro Station.
We commenced the development of this project in January 2011 and expect to complete this
project in 2016. The land premium for this project has been fully paid.
The Millennium Waterfront Project is a mixed-use development that is expected to comprise
(i) retail space at 1861 The Bund; (ii) Waterfront Landmark, which is expected to consist of
high-rise buildings of riverside residential units and semi-detached houses, and (iii) Millennium
Tower, a commercial office building. According to the latest master layout plan, the Millennium
Waterfront Project is expected to comprise a total GFA of approximately 714,697 sq.m. upon
completion.
Residential
As at 31 December 2014, Waterfront Landmark, the residential development at the
Millennium Waterfront Project was under development. The development is expected to comprise
10 residential buildings ranging from 24 storeys to 57 storeys and 14 semi-detached houses with
five storeys each, providing approximately 2,793 units.
Office
As at 31 December 2014, Millennium Tower, the commercial office building at the
Millennium Waterfront Project was under development. The office building is expected to be for
sale upon completion.
Retail
As at 31 December 2014, the retail space at 1861 The Bund at Millennium Waterfront was
under development. The retail space is expected to be for sale upon completion.
Emerald City Project in Nanjing
The Emerald City Project is a development located in Ying Tian Avenue of Jianye District,
Nanjing, which faces the Nan River on the east and the Olympic Stadium on the west.
– 128 –
BUSINESS
We commenced the development of this project in March 2012 and expect to complete this
project in November 2015. The land premium for this project has been fully paid.
The Emerald City Project is a mixed-use development that is expected to comprise retail
space, residential buildings, townhouses and one office building. According to the latest master
layout plan, the Emerald City Project is expected to comprise a total GFA of approximately
527,344 sq.m. upon completion.
Residential
As at 31 December 2014, the 19 residential buildings comprising 1,168 units and 346
townhouses at the Emerald City Project were under development.
Office
As at 31 December 2014, the office building at the Emerald City Project was under
development. The office building is expected to be for sale upon completion.
Retail
As at 31 December 2014, the retail space at the Emerald City Project was under
development. The retail space is expected to be for sale upon completion.
The Harbourfront Project in Qingdao
The Harbourfront Project is a development project located in Shi Bei District, Qingdao,
along the Jiaozhou Bay coastline.
We commenced the development of this project in December 2006 and expect to complete
this project in 2017. This project is being developed by the Group and a joint venture partner
which is an independent third party of the Group. The land premium for this project has been
fully paid.
The Harbourfront Project is a mixed-use development that is expected to comprise a total
GFA of approximately 1,094,634 sq.m. of residential and commercial area, together with various
recreational spaces including a 940-metre waterfront and a 463-metre man-made waterway.
Residential
As at 31 December 2014, the 12 residential buildings comprising 2,706 units and 53
townhouses at The Harbourfront Project were under development.
Serviced Apartments
As at 31 December 2014, the serviced apartments at The Harbourfront Project were under
development. The serviced apartments are expected to be for sale upon completion.
– 129 –
BUSINESS
Retail
As at 31 December 2014, the retail space at The Harbourfront Project was under
development. The retail space is expected to be for sale upon completion.
Le Parc Project in Chengdu
The Le Parc Project is a development located in Chengdu High-Tech Zone, south of
Chengdu, which is near the Hi-Tech Station of the Chengdu metro line.
We commenced the development of this project in December 2005 and expect to complete
this project in 2018. The land premium for this project has been fully paid.
The Le Parc Project is a mixed-use development that is expected to comprise residential
units and a shopping street, Xin Jie Li. According to the latest master layout plan, the Le Parc
Project is expected to comprise a total GFA of approximately 3,040,422 sq.m. upon completion.
Residential
As at 31 December 2014, the 170 residential buildings comprising 8,077 units at the Le Parc
Project were under development.
Retail
As at 31 December 2014, the retail space at Xin Jie Li, the shopping street at the Le Parc
Project was under development. Xin Jin Li is expected to provide all-in-one facilities for
shopping, entertainment, dining and leisure and is also expected to be for sale upon completion.
Regency Hills Project in Chongqing
The Regency Hills Project is a development located in Nanan District, which is near to the
Yangtze River.
We commenced the development of this project in December 2007 in phases and expect to
complete this project in 2023. The land premium for this project has been fully paid.
The Regency Hills Project is a large scale residential complex, with a range of commercial
and community facilities, and is expected to comprise a total GFA of approximately 4,121,781
sq.m..
Residential
As at 31 December 2014, the 98 residential buildings comprising 25,722 units, 117
semi-detached houses, 716 townhouses and 3,137 duplex-on-duplex row houses at the Regency
Hills Project were under development.
Retail
As at 31 December 2014, the retail space at the Regency Hills Project was under
development. The retail space is expected to be for sale upon completion.
– 130 –
BUSINESS
Hupan Mingdi Project in Shanghai
The Hupan Mingdi Project is a development located at the east of Ruilin Road and the south
of Jiaxiu Dong Road in Jiading District, which is a suburban district approximately 18 kilometres
from downtown Shanghai.
We commenced the development of this project in December 2010 in phases and expect to
complete this project in 2017. The land premium for this project has been fully paid.
The Jiading District Project is a mixed-use development that is expected to comprise mainly
residential units, office buildings and retail space. According to the approval document issued by
the relevant government authority, the Hupan Mingdi Project is expected to comprise a total GFA
of approximately 588,115 sq.m. upon completion.
Residential
As at 31 December 2014, the 93 residential buildings comprising 2,218 units at the Hupan
Mingdi Project were under development.
Office
As at 31 December 2014, the two office buildings at the Hupan Mingdi Project were under
development. The office buildings are expected to be for sale upon completion.
Retail
As at 31 December 2014, retail space at the Jiading District Project was under development.
We expect the retail space will provide us with a recurring rental income upon completion.
The Metropolitan Tianjin Project in Tianjin
The Metropolitan Tianjin Project is a development atop the Yingkou Road Station, which is
located in the centre of the commercial business area of Tianjin, at the junction of Nanjing Road
and Yingkou Road in Heping District.
We commenced the development of this project in January 2007 and completed this project
in December 2013. This project was developed by the Group and a joint venture partner which is
an independent third party of the Group. The land was contributed by the joint venture partner.
The Metropolitan Tianjin Project is a mixed-use integrated complex that comprises (i)
Metropolitan Heights, which consists of high-rise residential units and townhouses, (ii)
Metropolitan Tower, a 53-storey Grade A office building and (iii) Metropolitan Plaza, a
seven-floor retail mall. The Metropolitan Tianjin comprises a total GFA of approximately 272,920
sq.m., of which 204,718 sq.m. belongs to the Group and the remaining 68,202 sq.m. belongs to
the joint venture partner.
– 131 –
BUSINESS
Residential
Metropolitan Heights, the residential development at The Metropolitan Tianjin Project, has a
GFA of approximately 94,933 sq.m., of which 55,266 sq.m. belongs to the Group and the
remaining 39,667 sq.m. belongs to the joint venture partner. It comprises three buildings of 933
residential units. As at 31 December 2014, approximately 94,410 sq.m. of GFA had been sold
(with the remaining 523 sq.m. unsold).
Office
Metropolitan Tower, the office building at The Metropolitan Tianjin Project, has a GFA of
approximately 101,503 sq.m., of which 72,968 sq.m. belongs to the Group and the remaining
28,535 sq.m. belongs to the joint venture partner.
Retail
Metropolitan Plaza, a retail mall at The Metropolitan Tianjin Project, has a GFA of
approximately 76,484 sq.m., all of which belongs to the Group. It comprises seven floors, with
the basement level directly connected to the Yingkou Road Metro Station, and provides
approximately 200 shop premises for retail, dining and entertainment uses, which are intended for
sale.
(iii) Singapore
Thomson Grand Project
The Thomson Grand Project is a development located at Upper Thomson Road, Singapore.
We commenced the development of this project in November 2009, which is expected to be
completed in November 2015.
Thomson Grand is a residential development that is expected to comprise residential units
and two-storey strata houses. Thomson Grand overlooks Singapore Island Country Club, Lower
Pierce Reservoir, Bishan Park and the Central Catchment Nature Reserve. Thomson Grand is
expected to comprise a total GFA of approximately 48,159 sq.m..
Residential
As at 31 December 2014, the nine residential buildings, comprising 339 units, and 22
two-storey strata houses at the Thomson Grand Project were under development.
(iv) United Kingdom
Chelsea Waterfront Project
The Chelsea Waterfront Project is a development located at Lots Road, Chelsea, London,
United Kingdom.
We commenced the development of this project in November 2012 and expect to complete
this project in 2018.
– 132 –
BUSINESS
The Chelsea Waterfront Project is a mixed-use development that is expected to comprise two
residential towers of 37 and 25 storeys on either side of the entrance to Chelsea Creek, four
riverside buildings as well as the refurbishment of the historic Lots Road Power Station. The
development will also include shops, restaurants and a club house. Chelsea Waterfront is expected
to comprise a total net saleable area of approximately 96,628 sq.m..
Residential
As at 31 December 2014, the 709 residential units (including 275 affordable housing units)
at the Chelsea Waterfront Project, with a total net saleable area of approximately 89,365 sq.m.,
were under development, of which approximately 70,410 sq.m. was for luxury apartments and
approximately 18,955 sq.m. was for affordable housing required under the planning obligations for
this project.
Retail
As at 31 December 2014, the retail space of the Chelsea Waterfront Project was expected to
have a net area of approximately 7,263 sq.m. upon completion. The retail space is expected to
provide us with a recurring rental income.
INVESTMENT PROPERTIES
The Group’s investment properties include office, retail, and industrial properties and car park
spaces for leasing and which are held for long-term investment. As at 28 February 2015, the Group’s
investment property portfolio that was valued by the Property Valuers comprises an aggregate GFA
attributable to the Group of approximately 1.5 million sq.m..
The table below breaks down the Group’s investment property portfolio that was valued by the
Property Valuers by geography and based on GFA and by valuation as at 28 February 2015. All
valuations cited are derived from the property valuation reports contained in “Appendix III – Property
Valuation”.
Investment Properties
GFA
Office
Retail
Valuation
Industrial
Others
Total
Office
(million sq.m.)
Hong Kong . .
PRC(1) . . . . .
Overseas
Singapore . .
UK . . . . .
The Bahamas
Retail
Industrial
Others
Total
(HK$ million)
. . . . . . . .
. . . . . . . .
0.4
0.0
0.2
0.2
0.6
–
0.0
–
1.3
0.2
65,439
118
35,131
5,142
13,631
–
3,566
–
117,767
5,260
. . . . . . . .
. . . . . . . .
. . . . . . . .
–
0.0
–
–
–
–
–
–
–
–
–
–
–
0.0
–
–
304
–
–
–
–
–
–
–
–
–
–
–
304
–
Total . . . . . . . . . . . . .
0.4
0.4
0.6
0.0
1.5
65,861
40,273
13,631
3,566
123,331
Note:
(1)
Excludes Chongqing Metropolitan Plaza, the sale of which to Hui Xian REIT was completed on 2 March 2015.
– 133 –
BUSINESS
The Group seeks to maintain long-term relationships with tenants and an appropriate balance in its
tenant mix. The Group believes that its tenant selection criteria and tenant relationship management
have been some of the factors for retaining its core tenants and sustaining satisfactory occupancy rates
and rental income base. In assessing new tenancies, the Group takes into consideration factors including
the type of trade or business conducted by the tenant, brand attractiveness, rental affordability and the
effect on the tenant mix of the particular investment property as a whole.
The Group recognises the importance of asset enhancement programmes to retain tenants and to
improve rental income. During the Track Record Period, various asset enhancements or renovation
works have been carried out, including the reconfiguration and repartitioning of the retail space at
various retail malls, such as Wonderful Worlds of Whampoa in Hong Kong, and the refurbishments at
the Group’s office buildings including Cheung Kong Center and Hutchison House in Hong Kong in
2014.
Office Properties
As at 28 February 2015, an aggregate GFA of approximately 0.4 million sq.m. of office space that
was valued by the Property Valuers was attributable to the Group’s investment properties portfolio.
Certain of the Group’s office buildings for leasing include Cheung Kong Center, Harbourfront Office
Towers 1 and 2, Hutchison House, The Center and China Building in Hong Kong, office buildings at
the Westgate Tower in Shanghai, the PRC, and office space at Albion Riverside in London, the United
Kingdom.
For the three years ended 31 December 2014, turnover from rental of office space for the Cheung
Kong Property Group amounted to HK$652 million, HK$712 million and HK$776 million, respectively.
For the three years ended 31 December 2014, turnover from rental of office space for the
Hutchison Property Group amounted to HK$1,851 million, HK$2,101 million and HK$2,264 million,
respectively.
Retail Properties
As at 28 February 2015, an aggregate GFA of approximately 0.4 million sq.m. of retail space that
was valued by the Property Valuers was attributable to the Group’s investment property portfolio.
Certain of the Group’s shopping malls for leasing include 1881 Heritage, Wonderful Worlds of
Whampoa, The Laguna Mall, The Pacifica Mall, Banyan Mall, Victoria Mall, Celestial Place and
Aberdeen Centre in Hong Kong, Century Place and Westgate Mall in Shanghai, the PRC, and retail
space at Albion Riverside in London, the United Kingdom.
For the three years ended 31 December 2014, turnover from rental of retail space for the Cheung
Kong Property Group amounted to HK$1,037 million, HK$1,090 million and HK$984 million,
respectively.
For the three years ended 31 December 2014, turnover from rental of retail space for the
Hutchison Property Group amounted to HK$796 million, HK$859 million and HK$915 million,
respectively.
– 134 –
BUSINESS
Industrial Properties
As at 28 February 2015, an aggregate GFA of approximately 0.6 million sq.m. of industrial
properties that was valued by the Property Valuers was attributable to the Group’s investment property
portfolio. Major industrial properties for leasing include Hutchison Logistics Centre, Watson Centre and
Harbour Centre in Hong Kong.
For the three years ended 31 December 2014, turnover from rental of industrial space for the
Cheung Kong Property Group amounted to HK$48 million, HK$50 million and HK$53 million,
respectively.
For the three years ended 31 December 2014, turnover from rental of industrial space for the
Hutchison Property Group amounted to HK$495 million, HK$538 million and HK$623 million,
respectively.
– 135 –
Location
– 136 –
Whampoa Garden (Various
shops and car parks) . .
Aberdeen Centre (Various
shops and car parks) . .
Hunghom Bay Centre
(Portions) . . . . . . . . .
Chun Fai Centre . . . . . . .
41A & 43 Smithfield Rd . .
Baguio Villa (Portions) . . .
Fine Mansion (Portions) . .
Mount Sterling Mall, Mei
Foo Sun Chuen
(Various shops) . . . . .
23 Coombe Road . . . . . .
United Centre (Various
shops) . . . . . . . . . . .
1881 Heritage. . . . . . . . .
Conic Investment
Building . . . . . . . . . .
8 Tung Yuen Street . . . . .
Victoria Mall . . . . . . . . .
South Horizons
(Kindergartens, various
units and car parks) . .
South Horizons (Portions
of retail, residential
and car parks) . . . . . .
Rambler Crest (Portions) .
Retail, Carpark
Retail, Office,
Carpark
Retail, Carpark
Retail
Retail, Carpark
Retail, Carpark
Retail
Residential
Aberdeen
Hung Hom
Tai Hang
Kennedy Town
Pokfulam
Happy Valley
Lai Chi Kok
The Peak
Retail, Carpark
Retail, Hotel
Industrial,
Carpark
Industrial
Retail, Carpark
Kindergarten,
Residential,
Carpark
Retail,
Residential,
Carpark
Retail, Carpark
Hung Hom
Tsing Yi
Aberdeen
Yau Tong
Tsim Sha Tsui
Aberdeen
Tsim Sha Tsui
Hung Hom
Central
Office, Retail,
Carpark
Retail
Type of Property
(sq.m.)
3,512
3,512
569
2,998
655
1,201
1,273
474
7,470
32,054
159,235
569
2,671
655
1,201
1,308
462
6,892
29,603
128,451
3,923
987
987(3)
4,104
7,170
15,634
4,039
14,986
30,409
7,170
15,634
4,039(2)
13,023
30,409
113,431
(sq.m.)
Total GFA
113,170
LFA as at 31
Dec 2014
Principal Investment Properties in Hong Kong
The Center (Portions). . . . Central
Project
(i)
–
103
–
40
2
–
16
133
1,026
–
298
720
610
646
921
457
667
398
284
327
373(4)
492
286
370
236
4,584
103
1,258
619
(HK$/sq.m.)
Average
Monthly
Effective
Rent for
2014
–
79
274
–
95
–
402
Number of
Car Parking
Spaces as at
31 Dec
2014(1)
0%
100%
100%
100%
100%
100%
81%
97%
95%
88%
100%
24%
66%
100%
100%
98%
100%
97%
Average
Occupancy
Rate for
2014
Pre-war
1993
1985
1975
1973
1982
1979
1980-1982
1985-1991
2003
1993 & 1995
1977
2002
1991-1994
2009
1982
1981
1998
(Year)
Actual
Completion
Date
2036
2047
2882
2859
2079
2047
2886
2856
2134
2047
2040
2047
2048
2040
2053
2047
2128
2047
(Year)
Leasehold
Expiry
100.0%
100.0%
100.0%
100.0%
100.0%
100.0%
100.0%
100.0%
100.0%
100.0%
100.0%
100.0%
85.0%
80.0%
100.0%
100.0%
100.0%
100.0%
Interest
Attributable
to the Group
as 28 Feb
2015
(HK$
million)
922
132
224
132
130
193
109
823
4,351
12,847
420
409
112
1,063
519
13,634
1,019
132
224
132
130
193
109
823
4,351
12,847
420
409
112
904
415
13,634
1,019
922
17,735
(HK$
million)
Total Value
as at 28 Feb
2015
17,735
Total Value
Attributable
to the Group
as at 28 Feb
2015
VII-35
VII-20
VII-22
VII-23
VII-25
VII-27
VII-19
VII-18
VII-14,
VII-56
VII-17
VII-13
VII-5
VII-11
VII-12
VII-3
VII-4
VII-2
VII-1
Reference
Number in
Property
Valuation
Report
Tables containing certain key information with respect to the Group’s principal completed investment properties that were valued by the
Property Valuers as at 28 February 2015 are set out below. The details below on the GFA, LFA and number of car parking spaces are presented as at
31 December 2014 and the average monthly effective rent and average occupancy rates are for the year ended 31 December 2014, which correspond
to the date of the unaudited pro forma combined statement of assets and liabilities of the Group and the date the last audited financial statements of
the Cheung Kong Property Group and of the Hutchison Property Group were made up to. To facilitate reference, the tables also show the valuations
of the properties valued by the Property Valuers as at 28 February 2015 (see “Appendix III – Property Valuation”) together with the Group’s
attributable interests as at that date.
Key Information of the Principal Investment Properties
BUSINESS
Location
Central
Hung Hom
Central
Hung Hom
– 137 –
Comprising saleable area of the kindergarten portion and GFA of the residential portions.
N/A
N/A
99
101
71
73
110
109
1,164
243
1,050
239
675
504
412
(HK$/sq.m.)
(2)
6
155
N/A
1,656
N/A
1,656(7)
28
20
21,368
95
50
118
68
1,038
107
–
107
5
6
12
11,829
13,229
26,096
56,694
31,854
63,843
375,575
31,854
28,143
103,947
37,666
19,195
37,816
437,122
27,896
117,370
40,055
24,039
40,119
46,878
927
927
46,797
1,797
(sq.m.)
1,797
(sq.m.)
Total GFA
Including motorcycle parking space where applicable.
Residential,
Carpark
Industrial, Office,
Carpark
Industrial,
Carpark
Industrial,
Carpark
Industrial,
Carpark
Industrial,
Carpark
Carpark
Residential,
Carpark
Residential,
Carpark
Office, Retail,
Carpark
Office, Retail
Office, Retail,
Carpark
Office, Retail,
Carpark
Office, Retail,
Carpark
Office, Carpark
Type of Property
Average
Monthly
Effective
Rent for
2014
(1)
Notes:
Fanling Sheung Shui Town Sheung Shui
Lot No. 97 . . . . . . . .
The Metropolis (Various
Hung Hom
car parks) . . . . . . . . .
28 Barker Road (Various
The Peak
houses and car parks) .
Other investment
properties in Hong
Kong . . . . . . . . . . . .
Watson House . . . . . . . . Fo Tan
Watson Centre . . . . . . . . Kwai Chung
99 Cheung Fai Road
Tsing Yi
(Portions) . . . . . . . . .
Hutchison Logistics Centre Kwai Chung
(Portions) . . . . . . . . .
Cavendish Centre . . . . . . Aberdeen
China Building . . . . . . . .
Harbourfront Office Tower
1(5) . . . . . . . . . . . . .
Harbourfront Office Tower
2(6) . . . . . . . . . . . . .
Cheung Kong Center . . . .
Hutchison House . . . . . . . Central
Provident Villas (Various
Pokfulam
houses) . . . . . . . . . .
Peak Villas . . . . . . . . . . The Peak
Project
LFA as at 31
Dec 2014
Number of
Car Parking
Spaces as at
31 Dec
2014(1)
N/A
N/A
100%
100%
100%
93%
99%
100%
98%
98%
98%
99%
87%
54%
81%
Average
Occupancy
Rate for
2014
2013
2002
1991
1982
1978
1984
1993
2004
1999
1995
1978
1995
1974
1983
1981
(Year)
Actual
Completion
Date
2056
2047
2047
2047
2047
2129
2047
2047
2047
2090
2071
2090
2122
2029
2100
(Year)
Leasehold
Expiry
100.0%
100.0%
100.0%
100.0%
100.0%
100.0%
100.0%
100.0%
100.0%
100.0%
100.0%
100.0%
100.0%
100.0%
100.0%
Interest
Attributable
to the Group
as 28 Feb
2015
(HK$
million)
1,622
927
965
101
264
477
921
950
9,738
799
27,000
3,357
5,531
3,105
7,772
269
1,622
101
264
477
921
950
9,738
799
27,000
3,357
5,531
3,105
7,772
269
423
(HK$
million)
Total Value
as at 28 Feb
2015
423
Total Value
Attributable
to the Group
as at 28 Feb
2015
VII-6 to
VII-10,
VII-15,
VII-16,
VII-21,
VII-24,
VII-26,
VII-28 to
VII-34,
VII-36,
VII-44,
VII-48,
VII-52,
VII-53,
VII-55
VII-57
VII-54
VII-51
VII-50
VII-49
VII-47
VII-46
VII-45
VII-43
VII-42
VII-40
VII-41
VII-39
VII-38
VII-37
Reference
Number in
Property
Valuation
Report
BUSINESS
Location
– 138 –
Commercial,
Clubhouse
Commercial,
Office, Carpark
Commercial
Type of Property
10,626
52,762
6,024
52,762
80,966
(sq.m.)
102,133
(sq.m.)
Total GFA
Location
Albion Riverside . . . . . . . London
Project
Office,
Commercial
Type of Property
(sq.m.)
6,379
(sq.m.)
Total GFA
7,331
LFA as at
31 Dec 2014
–
–
317
24
Number of
Car Parking
Spaces as at
31 Dec 2014
(iii) Principal Investment Properties in the United Kingdom
Other investment
properties in the PRC .
Shenzhen Century Place
Shenzhen
(Portions of
commercial space) . . .
Shenzhen Le Parc
Shenzhen
(Portions) . . . . . . . . .
Shanghai Westgate Mall . . Shanghai
Project
LFA as at
31 Dec 2014
17
(GBP/sq.m.)
Average
Monthly
Effective
Rent for
2014
131
177
413
(RMB/sq.m.)
100%
Average
Occupancy
Rate for
2014
100%
71%
95%
2004
(Year)
Actual
Completion
Date
2003
2012
1998
(Year)
Actual
Completion
Date
3002
(Year)
Leasehold
Expiry
2068
2043
2024
(Year)
Leasehold
Expiry
90.0%
Interest
Attributable
to the Group
as at 28 Feb
2015
100.0%
80.0%
100.0%
26
(GBP
million)
28
(GBP
million)
Total Value
as at 28 Feb
2015
116
130
1,216
Total Value
Attributable
to the Group
as at 28 Feb
2015
116
130
1,520
2,780
(RMB
million)
2,780
(RMB
million)
Total Value
as at 28 Feb
2015
Gerald Eve
Reference
Number in
Property
Valuation
Report
II-1 to II-5,
II-7, II-8,
II-11, II-12
II-10
II-9
II-6
Reference
Number in
Property
Valuation
Report
Principal Investment Properties in the PRC
(ii)
Total Value
Attributable
to the Group
as at 28 Feb
2015
Denotes the saleable area.
(7)
Interest
Attributable
to the Group
as at 28 Feb
2015
Harbourfront Office Tower 2 is currently undergoing an extension of 16,309 sq.m. Total GFA of the project will increase upon completion of the extension, and the valuation has
taken into consideration the extension.
(6)
Average
Occupancy
Rate for
2014
Harbourfront Office Tower 1 is currently undergoing an extension of 9,301 sq.m. Total GFA of the project will increase upon completion of the extension, and the valuation has
taken into consideration the extension.
(5)
Average
Monthly
Effective
Rent for
2014
One car park was sold in January 2015.
(4)
Number of
Car Parking
Spaces as at
31 Dec 2014
Comprising saleable area of the retail portion and GFA of the residential portion.
(3)
BUSINESS
BUSINESS
Description of Selected Investment Properties
The following are the investment properties, each of which had a carrying amount as at 31
December 2014 of over 1% of the Group’s pro forma total assets as set out in Appendix II.
(i)
Commercial Properties in Hong Kong
Cheung Kong Center
Cheung Kong Center is our flagship commercial complex in Hong Kong. Cheung Kong
Center is a 62-storey Grade A commercial building located in Central, the central business district
of Hong Kong, with floor-to-ceiling glass windows and column-free floors. Cheung Kong Center
comprises a total GFA of 117,370 sq.m. of office and retail space and 1,038 car park spaces. The
building was completed in 1999. Cheung Kong Center is located near the Central MTR station,
which is the interchange station for a number of MTR lines.
As at 31 December 2014, there were a total of 34 tenants, which included financial
institutions and multinational corporations. The five largest tenants (excluding members of the
Cheung Kong Group and the Hutchison Group) contributed an aggregate of HK$76.8 million in
rental income for the month ended 31 December 2014 and accounted for 64% of the total rental
income of Cheung Kong Center for the month ended 31 December 2014 and 64% of the total LFA
of Cheung Kong Center as at 31 December 2014.
– 139 –
BUSINESS
The weighted average lease term to expiry by LFA for Cheung Kong Center was
approximately 3.5 years as at 31 December 2014.
The Center
The Center is a landmark building located on Queen’s Road Central, a prime location in the
business district of Hong Kong. The Center is an 80-storey Grade A commercial building with a
central core design that maximises the options available for office layout and subdivision. As at
31 December 2014, the Group owned various units in The Center, representing a total LFA of
112,160 sq.m. of office space, a total LFA of 1,271 sq.m. of retail space and 402 car park spaces
at The Center. The building was completed in 1998. The Center is within a short distance from
the Airport Express MTR station, which is one of the stations for the direct MTR line to the Hong
Kong International Airport.
As at 31 December 2014, there were a total of 186 tenants occupying the various units in
The Center held by the Group, which included major financial institutions and reputable
companies. The five largest tenants (excluding members of the Cheung Kong Group and the
Hutchison Group) contributed an aggregate of HK$14.4 million in rental income for the month
ended 31 December 2014 and accounted for 20.9% of the total rental income derived from The
Center by the Group for the month ended 31 December 2014 and 21.8% of the total GFA of the
The Center held by the Group as at 31 December 2014.
The weighted average lease term to expiry by LFA for the various units in The Center held
by the Company was approximately 2.1 years as at 31 December 2014.
– 140 –
BUSINESS
Hutchison House
Hutchison House is a 24-storey Grade A commercial building located in the central business
district of Hong Kong with column-free floors and panoramic views of the Victoria Harbour.
Hutchison House comprises a total GFA of 46,797 sq.m. of office and retail space. The building
was completed in 1974. Hutchison House is located near to the Admiralty MTR station, which is
the interchange station for a number of MTR lines.
As at 31 December 2014, there were a total of 111 tenants, which included financial
institutions and multinational organisations. The five largest tenants (excluding members of the
Cheung Kong Group and the Hutchison Group) contributed an aggregate of HK$10.2 million in
rental income for the month ended 31 December 2014 and accounted for 35% of the total rental
income of Hutchison House for the month ended 31 December 2014 and 39% of the total LFA of
Hutchison House as at 31 December 2014.
The weighted average lease term to expiry by LFA for Hutchison House was approximately
2.6 years as at 31 December 2014.
– 141 –
BUSINESS
Hutchison Logistics Centre
Hutchison Logistics Centre is a multi-storey drive-in freight distribution centre strategically
located at Terminal 4 in Kwai Tsing Container Terminals, one of the busiest container ports in the
world. Hutchison Logistics Centre offers direct road access for container vehicles to each of its
warehouse levels. It is a 7-storey building with an adjoining 10-storey office building, and
comprises a total GFA of 437,122 sq.m. of warehouse and office space, and 118 parking spaces.
Hutchison Logistics Centre was completed in 1993.
As at 31 December 2014, there were a total of 52 tenants, which included freight operators,
logistics companies and brand name retailers. The five largest tenants (excluding members of the
Cheung Kong Group and the Hutchison Group) contributed an aggregate of HK$14.9 million in
total rental income for the month ended 31 December 2014 and accounted for 35% of the total
rental income of Hutchison Logistics Centre for the month ended 31 December 2014 and 35% of
the total LFA of Hutchison Logistics Centre as at 31 December 2014.
The weighted average lease term to expiry by LFA for Hutchison Logistics Centre was
approximately 1.5 years as at 31 December 2014.
– 142 –
BUSINESS
The Harbourfront
The Harbourfront is located along the Hung Hom coastline adjacent to the Whampoa Garden
residential estate. The Harbourfront comprises two 20-storey Grade A office towers with a total
GFA of 80,174 sq.m. of office space and 214 car park spaces, with many of the office units
enjoying harbour views. The buildings were completed in 1995.
As at 31 December 2014, there were a total of 57 tenants, which included financial
institutions and media/entertainment companies. The five largest tenants (excluding members of
the Cheung Kong Group and the Hutchison Group) contributed an aggregate of HK$7.2 million in
rental income for the month ended 31 December 2014 and accounted for 40% of the total rental
income of The Harbourfront for the month ended 31 December 2014 and 40% of the total LFA of
The Harbourfront as at 31 December 2014. The Harbourfront is located in close proximity to the
Hung Hom ferry pier and a bus/mini bus terminus. It is expected that the transportation network
will be further enhanced upon the scheduled completion of the MTR Kwun Tong line extension in
2016.
The weighted average lease term to expiry by LFA for The Harbourfront was approximately
1.5 years as at 31 December 2014.
– 143 –
BUSINESS
(ii)
Retail Properties in Hong Kong
1881 Heritage
1881 Heritage is a cultural and shopping complex which was revitalised and transformed
from the original site of the Former Marine Police Headquarters. It is located on Canton Road in
Tsim Sha Tsui, a prime shopping district of Hong Kong. Following extensive renovation and
conservation works, 1881 Heritage now features luxury retail shops, fine dining establishments, a
heritage hotel and an exhibition hall which allows visitors to discover the history of the site. 1881
Heritage comprises a total LFA of 14,986 sq.m. of retail space. The building was completed in
2009. 1881 Heritage can be conveniently reached by various modes of transportation, including
the MTR, ferry and bus.
As at 31 December 2014, there were a total of 12 tenants, some of which brought in several
leading international brands in the complex. The lease term for 1881 Heritage is generally three
years.
– 144 –
BUSINESS
Wonderful Worlds of Whampoa
Wonderful Worlds of Whampoa is one of the largest shopping, dining and entertainment
centres located within the Whampoa Garden residential estate in Kowloon, Hong Kong. With a
large ship as its landmark building, Wonderful Worlds of Whampoa comprises a combination of
themed areas, namely Whampoa Gourmet Place, Fashion World, Treasure World, Home World,
Amazing World and Pebbles World, offering an array of retail shops, restaurants and entertainment
facilities. Wonderful Worlds of Whampoa comprises a total GFA of 159,235 sq.m. of retail space
and 1,026 car park spaces. Wonderful Worlds of Whampoa was completed in phases between 1985
and 1991. The new Whampoa MTR station, being the terminal station of the Kwun Tong line
extension, is under construction.
As at 31 December 2014, there were a total of 298 tenants. The lease term for Wonderful
Worlds of Whampoa is generally two years.
– 145 –
BUSINESS
HOTELS AND SERVICED SUITES
The Group owns and/or manages hotels and serviced suites in Hong Kong, the PRC and The
Bahamas. As at 31 December 2014, the Group owned interests in and managed 15 hotels and serviced
suites with 13,530 rooms in aggregate. As at 31 December 2014, the Group owned (but did not
manage) four hotels with 2,586 rooms in aggregate.
Hotels and Serviced Suites Owned and Managed by the Group
The table below shows the Group’s ownership interests in, and certain other data of, the hotels
and serviced suites owned and managed by the Group as at 31 December 2014:
Hong Kong
Harbour Grand Hong
Kong . . . . . . . . . . . . . .
Harbour Grand Kowloon .
Harbour Plaza 8 Degrees . .
Harbour Plaza Metropolis .
Harbour Plaza North Point.
Harbour Plaza Resort City .
Harbourfront Horizon
All-Suite Hotel . . . . . . .
Harbourview Horizon
All-Suite Hotel . . . . . . .
Horizon Suite Hotel at
Tolo Harbour . . . . . . . .
Rambler Garden Hotel. . . .
Rambler Oasis Hotel . . . .
The Apex Horizon . . . . . .
The Kowloon Hotel. . . . . .
PRC
Harbour Plaza Chongqing .
The Bahamas
Bahamas Grand Lucayan . .
Number of
Rooms
Ownership Interest
Managed By
Rating
100%(1)
Harbour Plaza
High Tariff B(2)
828
100%
100%
100%
100%
98.47%
100%
Harbour Plaza
Harbour Plaza
Harbour Plaza
Harbour Plaza
Harbour Plaza
Horizon
High Tariff A(2)
High Tariff B(2)
High Tariff B(2)
High Tariff B(2)
Medium Tariff(2)
N/A
555
704
821
669
1,102
1,662
100%
Horizon
N/A
1,980
100%
Horizon
N/A
831
100%
100%
100%
100%
Harbour Plaza
Harbour Plaza
Horizon
Harbour Plaza
Medium Tariff(2)
Medium Tariff(2)
N/A
High Tariff B(2)
800
822
360
736
100%
Harbour Plaza
5-stars(3)
389
100%
Harbour Plaza
AAA 3
Diamond(4)
Total . . . . . . . . . . . . . . . .
1,271
13,530
Notes:
(1)
For properties in which the Group has a development right, the percentage interest shown represents the Group’s
attributable interest in the developer company which entered into the relevant joint development contract with the
land owner.
(2)
Based on the Hong Kong Tourism Board classification system.
(3)
Based on the China Tourist Hotel Star Rating Committee.
(4)
Based on the AAA Diamond Ratings System.
– 146 –
BUSINESS
Harbour Plaza and Horizon are indirect wholly-owned subsidiaries of the Group, which primarily
provide management services to the Group’s hotels and serviced suites. The “Harbour Grand” brand
targets premium visitors. The “Harbour Plaza” brand targets business and leisure travellers while the
“Rambler” hotels offer affordable accommodation.
Hotels Owned (but not Managed) by the Group
As at 31 December 2014, the Group also had interests in (but did not manage) the following
hotels:
Effective
Ownership
Interest
Hong Kong
Sheraton Hong Kong
Hotel & Towers . . . . .
PRC
Sofitel Shenyang Lido
Hotel . . . . . . . . . . . .
Sheraton Chengdu Lido
Hotel . . . . . . . . . . . .
The Great Wall
Sheraton Hotel
Beijing . . . . . . . . . . .
Number of
Rooms
Managed By
Rating
39%(1)
Starwood Hotels & Resorts
Worldwide, Inc.
High
Tariff A(4)
782
29%(2)
Accor Group
5-stars(5)
590
69%(3)
Starwood Hotels & Resorts
Worldwide, Inc.
Starwood Hotels & Resorts
Worldwide, Inc.
5-stars(5)
387
5-stars(5)
827
50%(3)
Total . . . . . . . . . . . . . .
2,586
Notes:
(1)
The hotel is held through a joint venture which was established between the Group and independent third parties.
(2)
The 29% effective ownership interest represents the percentage of entitlement to distribution of the owner company
of Sofitel Shenyang Lido Hotel. The remaining 70% and 1% entitlements to the distributions of the owner company
of Sofitel Shenyang Lido Hotel are held by Hui Xian REIT and Beijing Wondergrow Investment and Consulting
Co., Ltd. 北京穩得高投資顧問有限公司 (“Beijing Wondergrow”), respectively. There is also an agreement between the
Group and the Hui Xian REIT group under which the Group will give certain priority to the Hui Xian REIT
Group’s entitlement of 70% of yearly distributions of the hotel owner company during the period up to 2021.
Beijing Wondergrow is directly owned as to 50% by a wholly-owned subsidiary of the Company, as to 40% by
Wang Yi (王琦) (a director of Beijing Wondergrow) and as to 10% by Chen Yan (陳燕) (a director of Beijing
Wondergrow). As at 31 December 2014, the Group held a 46.23% interest in Hui Xian REIT and the Group had a
30% interest in Hui Xian Asset Management Limited, the asset manager of Hui Xian REIT. In addition, the Group
had a 7.84% interest in ARA Asset Management Limited, which in turn held 30% interest in Hui Xian Asset
Management Limited as at 31 December 2014.
(3)
The hotel is held through a joint venture which was established between the Group and an independent third party.
(4)
Based on the Hong Kong Tourism Board classification system.
(5)
Based on the China Tourist Hotel Star Rating Committee.
The hotel managers are internationally renowned and were selected by mutual agreement of the
Group and other major shareholders in the hotels. The hotel management agreements for these hotel
managers are typically for a period ranging from five to 10 years and renewable with the written
consent of the relevant parties. Under the hotel management agreements, the third party hotel managers
generally have the right to operate the hotels in accordance with their respective operating policies and
– 147 –
BUSINESS
standards. The fees paid by the Group to the third party hotel managers generally comprise a basic
management fee and an incentive fee, which is based on the financial performance of the hotel. For the
year ended 31 December 2014, the total basic management fee and incentive fee paid to third party
hotel managers by the Cheung Kong Property Group and the Hutchison Property Group amounted to
HK$5 million and HK$31 million, respectively.
Hotels Under Development
We have the following hotels which are under development:
쐌
A hotel as part of the Silver Cove Jiangmen Project in the PRC, which is expected to
complete in 2016, with an expected GFA of approximately 21,271 sq.m. and 200 rooms.
쐌
A hotel at Oil Street in Hong Kong. See “– Development Properties – Description of
Selected Development Properties – Hong Kong – Oil Street Project” for further details.
쐌
A hotel as part of the Regency Cove Wuhan Project in the PRC, which is expected to
complete in 2018, with an expected GFA of approximately 30,846 sq.m. and 240 rooms.
쐌
Hotels as part of the Upper West Shanghai Project in the PRC. See “– Development
Properties – Description of Selected Development Properties – PRC – Upper West Shanghai
Project in Shanghai” for further details.
Asset Enhancement Programmes
Maintenance and asset enhancement programmes are carried out for the Group’s hotels and
serviced suites to maintain their competitiveness in the hospitality market.
During the Track Record Period, certain hotels of the Group have also undergone and completed
renovation works, which included the following:
쐌
2012 – Harbour Grand Kowloon renovated its fitness centre and Sheraton Hong Kong Hotel
& Towers renovated its Chinese restaurant, Celestial Court.
쐌
2013 – The Kowloon Hotel’s shopping arcade underwent renovation to accommodate a new
tenant mix.
쐌
2013 – Sheraton Hong Kong Hotel & Towers commenced renovation works of all its hotel
rooms in phases. During the first phase, in addition to the renovation of 396 hotel rooms,
the lobby and Sky Lounge were also upgraded. During the second phase in 2014, renovation
works to the remaining 382 hotel rooms (excluding four presidential suites) and the
executive lounge were completed in 2014.
쐌
2013 – Bahamas Grand Lucayan carried out renovation works to its Reef Wing, which
contained approximately 450 rooms.
– 148 –
BUSINESS
As at the Latest Practicable Date, the following hotels had undergone or are expected to undergo
renovation works:
쐌
2014 – Harbourview Horizon All-Suite Hotel commenced the replacement of the
air-conditioning units in all of its suites, which is expected to complete in 2015. The
expected amount for such renovation works in 2015 is estimated to be approximately HK$56
million.
쐌
2014 – Horizon Suite Hotel commenced renovation works of 831 suites to replace furniture,
fixtures and electronic appliances, which are expected to complete in 2016. The expected
amount for such renovation works in 2015 is estimated to be approximately HK$99 million.
쐌
2014 – Harbour Grand Kowloon commenced extension works to add an additional 360 hotel
rooms in an adjacent office building which are expected to complete in 2018. The existing
hotel rooms are also expected to undergo a renovation programme which will commence in
2016 and are expected to complete in 2017. The total estimated amount for the extension
works in 2015 is approximately HK$350 million.
쐌
2015 − Harbour Plaza North Point is expected to carry out renovation works to increase its
room inventory by converting 30 of its one-bedroom suites into 60 hotel rooms and the costs
of such renovation works are expected to be approximately HK$9 million in 2015.
– 149 –
– 150 –
(1)
Notes:
21,420
61,513
42,857
30,610
19,613
19,810
31,873
56,000
41,341
47,467
61,950
To Kwa Wan
Tin Shui Wai
Hung Hom
Tsim Sha Tsui
Tsing Yi
Tsing Yi
North Point
Ma On Shan
North Point
Hung Hom
Tsim Sha Tsui
555
782
831
828
704
1,102
821
736
800
822
669
1,980
1,662
360
14
19
42
38
10
8
6
–
–
–
6
400
20
3
Number of
Car Parking
Spaces as at
31 Dec 2014
511
649
458
1,673
2,262
473
1,434
799
612
1,134
1,271
501
513
909
(HK$)
Average
Room Rate
for 2014
83%
87%
94%
83%
91%
96%
96%
97%
98%
97%
95%
88%
93%
95%
Average
Occupancy
Rate for
2014
450
606
436
1,397
1,964
444
1,194
726
588
1,083
1,229
490
500
859
(HK$)
Average
Effective
RevPAR for
2014
1995
1974
2002
2008
2009
1998 & 1999
2002
1985
2003
2003
1999
2005
2006
2007
(Year)
Actual
Completion
Date
2090
2119
2048
2104
2088
2047
2047
2039
2047
2047
2047
2051
2051
2052
(Year)
Leasehold
Expiry
100.0%
39.0%
100.0%
100.0%(1)
100.0%
98.47%
100.0%
100.0%
100.0%
100.0%
100.0%
100.0%
100.0%
100.0%
Interest
Attributable
to the Group
as at 28 Feb
2015
(HK$
million)
4,647
10,230
2,652
4,440
2,394
2,860
5,074
7,778
1,817
1,900
2,757
4,647
3,990
2,652
4,440
2,394
2,816
5,074
7,778
1,817
1,900
2,757
11,450
11,140
1,053
(HK$
million)
Total Value
as at 28 Feb
2015
11,450
11,140
1,053
Total Value
Attributable
to the Group
as at 28 Feb
2015
VIII-13
VIII-14
VIII-11
VIII-12
VIII-4
VIII-5
VIII-6
VIII-7
VIII-8
VIII-9
VIII-10
VIII-1
VIII-2
VIII-3
Reference
Number in
Property
Valuation
Report
For properties in which the Group’s interest is in relation to development rights, the percentage interest shown represents the Group’s attributable interest in the developer company
which entered into the relevant joint development contract with the land owner.
119,280
107,444
21,190
(sq.m.)
Total GFA
Hung Hom
Hung Hom
Kwai Chung
Location
Number of
Hotel Rooms
or Serviced
Suites as at
31 Dec 2014
Hotels and Serviced Suites in Hong Kong
Harbourview Horizon . . . .
Harbourfront Horizon . . . .
The Apex Horizon
(Excluding retail shops
and commercial
parking spaces) . . . . .
Harbour Plaza 8 Degrees .
Harbour Plaza Resort City.
Harbour Plaza Metropolis .
The Kowloon Hotel . . . . .
Rambler Garden Hotel . . .
Rambler Oasis Hotel . . . .
Harbour Plaza North
Point . . . . . . . . . . . .
Horizon Suite Hotel . . . . .
Harbour Grand Hong
Kong (Development
rights) . . . . . . . . . . .
Harbour Grand Kowloon .
Sheraton Hong Kong . . . .
Project
(i)
Tables containing certain key operating information with respect to the completed hotels and serviced suites (including a property held for
operation) owned by the Group that were valued by the Property Valuers as at 28 February 2015 are set out below. The details below on the total
GFA, number of hotel rooms and serviced suites and number of car parking spaces are presented as at 31 December 2014 and the average room rate,
average occupancy rates and average effective RevPAR are for the year ended 31 December 2014, which correspond to the date of the unaudited pro
forma combined statement of assets and liabilities of the Group and the date the last audited financial statements of the Cheung Kong Property
Group and of the Hutchison Property Group were made up to. To facilitate reference, the tables also show the valuations of the properties valued by
the Property Valuers as at 28 February 2015 (see “Appendix III – Property Valuation”) together with the Group’s attributable interests as at that date.
Key Information of the Hotels and Serviced Suites
BUSINESS
– 151 –
Location
95,457
(sq.m.)
Harbour Plaza Golf Club . . .
Project
Dongguan
Location
Golf Course
Type of Property
1,271
Number of
Hotel Rooms
or Serviced
Suites as at
31 Dec 2014
389
387
827
Number of
Hotel Rooms
or Serviced
Suites as at
31 Dec 2014
(iv) Property held for operation in the PRC
Bahamas Grand Lucayan. . The Bahamas
Project
Total GFA
52,238
Harbour Plaza Chongqing . Chongqing
(iii) Hotel in The Bahamas
56,350
Sheraton Chengdu Lido
Chengdu
Hotel . . . . . . . . . . . .
(sq.m.)
Total GFA
81,563
Location
Hotels in the PRC
The Great Wall Sheraton
Beijing
Hotel . . . . . . . . . . . .
Project
(ii)
(US$)
1998
112
Average
Room Rate
for 2014
512
730
563
(RMB)
Average
Room Rate
for 2014
Actual Completion
Date
500
Number of
Car Parking
Spaces as at
31 Dec 2014
20
25
133
Number of
Car Parking
Spaces as at
31 Dec 2014
64
2000
(Year)
Actual
Completion
Date
1998
2000
1984
(Year)
Actual
Completion
Date
99.9965%
Interest Attributable
to the Group as at 28
Feb 2015
(US$)
Average
Effective
RevPAR for
2014
250
351
331
(RMB)
Average
Effective
RevPAR for
2014
2044
Leasehold Expiry
57%
Average
Occupancy
Rate for
2014
49%
52%
59%
Average
Occupancy
Rate for
2014
280
280
(RMB million)
(RMB million)
CBRE
Reference
Number in
Property
Valuation
Report
III-3
III-2
III-1
Reference
Number in
Property
Valuation
Report
III-4
Reference Number in
Property Valuation
Report
57
(US$
million)
57
(US$
million)
Total Value
as at 28 Feb
2015
504
477
Total Value
Attributable
to the Group
as at 28 Feb
2015
504
691
166
(RMB
million)
334
(RMB
million)
Total Value
as at 28 Feb
2015
Total Value as at 28
Feb 2015
100.0%
(%)
Interest
Attributable
to the Group
as at 28 Feb
2015
100.0%
69.0%
49.82%
(%)
Total Value
Attributable
to the Group
as at 28 Feb
2015
Total Value
Attributable to the
Group as at 28 Feb
2015
Freehold
(Year)
Nature of
Interest
2044
2049
2023
(Year)
Leasehold
Expiry
Interest
Attributable
to the Group
as at 28 Feb
2015
BUSINESS
BUSINESS
PROPERTY AND PROJECT MANAGEMENT
The Group has developed a property and project management business to support its development
and investment properties.
As at 31 December 2014, the total floor area of properties managed by the Cheung Kong Property
Group and the Hutchison Property Group was approximately 9 million sq.m. and approximately 12
million sq.m., respectively. During the Track Record Period, the turnover from the Cheung Kong
Property Group’s property and project management businesses amounted to HK$361 million, HK$394
million and HK$528 million, respectively. During the Track Record Period, the turnover from the
Hutchison Property Group’s property and project management businesses amounted to HK$698 million,
HK$798 million and HK$676 million, respectively.
Property Management
The Group provides property management services for a diverse portfolio of properties, including
large-scale residential properties, commercial buildings, office buildings, luxury villas, industrial
premises, shopping malls, car park spaces, clubhouses and education facilities. Such property
management services include deploying on-site security guards and caretakers, managing the
maintenance and renovation of properties and liaising with government departments and incorporated
owners associations. In addition to their own respective portfolio of properties, each of the Cheung
Kong Property Group and the Hutchison Property Group provides property management services to
properties located in Hong Kong and developed by third parties.
The Group generally charges a monthly manager’s remuneration for the provision of property
management services based on a certain percentage of property management expenditures or income in
accordance with the contract terms for the relevant property. During the Track Record Period, neither
the Cheung Kong Property Group nor the Hutchison Property Group had any material delays in the
collection of the manager’s remuneration.
Project Management
The Cheung Kong Property Group’s project management business in Hong Kong is conducted
through Cheung Kong Property Development Limited, a wholly-owned subsidiary of the Cheung Kong
Group. It primarily provides project management related services, including assisting in the making of
any necessary planning applications under the Buildings Ordinance and monitoring and supervising
construction progress, especially in respect of quality assurance and adherence to budget and schedule.
During the Track Record Period, major development projects managed by Cheung Kong Property
Development in Hong Kong included the City Point Project, the Hemera Project and The Beaumount
Project.
The Hutchison Property Group also provides project management and agency services, through its
wholly-owned subsidiaries, primarily to its property development joint ventures in the PRC and the
United Kingdom as well as to certain redevelopment and renovation projects in Hong Kong. During the
Track Record Period, major development projects managed by the Hutchison Property Group in the
PRC included the Le Parc Project in Chengdu, The Harbourfront Project in Qingdao and The
Greenwich Project in Xian.
– 152 –
BUSINESS
OTHER PROPERTY INTERESTS
The Group holds unitholding interests in a number of REITs, namely Fortune REIT, Prosperity
REIT and Hui Xian REIT, as well as interests in ARA Asset Management (which is the holding
company of the managers of Fortune REIT and Prosperity REIT) and Hui Xian Asset Management
Limited (which is the manager of Hui Xian REIT).
During the Track Record Period, the Cheung Kong Property Group and the Hutchison Property
Group held direct equity interests in Hui Xian REIT, which were accounted for as investments available
for sale. In addition to their direct interest in Hui Xian REIT, the Cheung Kong Property Group, the
Hutchison Property Group and others also held certain equity interests in Hui Xian REIT through a
joint venture, which was accounted for as a joint venture in the respective combined financial
statements of the Cheung Kong Property Group and the Hutchison Property Group using the equity
method of accounting. After completion of the Property Businesses Combination and consolidation of
the joint venture, Hui Xian REIT will become an associate of the Company and be accounted for under
the equity method of accounting.
The table below sets out certain information on the Group’s interests in the abovementioned
REITs and asset management companies as at 31 December 2014:
Group’s Ownership
Interest (%) . . . .
Class of Assets Held/
Business
Description . . . .
Fortune REIT
Prosperity REIT
Hui Xian REIT
28.0
19.3
46.23
7.84
30.0
(i) Manager of
Fortune REIT
and Prosperity
REIT and (ii)
holding a 30%
interest in Hui
Xian Asset
Management
Limited as at 31
December 2014
S$341.2 million
(approximately
HK$1,948.3
million)
Manager of Hui
Xian REIT
–
–
Manages assets
located in Hong
Kong, the PRC,
Singapore,
Malaysia, Korea
and Australia
–
–
Retail properties
Office, retail and
industrial
properties
Office and retail
properties and
hotels and
serviced suites
Net Asset Value as at
31 December 2014.
HK$22,376 million
HK$6,672 million
Number of Properties
in Portfolio . . . .
Geographical
Location of Assets.
18
8
RMB28,564
million
(approximately
HK$ 35,419.4
million)
2
Hong Kong
Hong Kong
PRC
Manager . . . . . . .
ARA Asset
Management
(Fortune)
Limited (2)
Listed on the
Singapore Stock
Exchange in
August 2003 and
the Main Board
in April 2010
ARA Asset
Management
(Prosperity)
Limited (2)
Listed on the Main
Board in
December 2005
Hui Xian Asset
Management
Limited
Listing Status. . . . .
Hui Xian Asset
Management
Limited
ARA Asset
Management
– 153 –
Listed on the Main
Board in April
2011
Listed on the
Singapore Stock
Exchange in
November 2007
(1)
HK$97 million(3)
–
Unlisted
BUSINESS
Notes:
(1)
This does not take into account any interest in Hui Xian Asset Management Limited held by ARA Asset
Management, a company in which the Group had a 7.84% interest as at 31 December 2014.
(2)
These manager companies are subsidiaries of ARA Asset Management.
(3)
This represents the consolidated net asset value of Hui Xian Asset Management Limited and its immediate holding
company, World Deluxe Enterprises Limited.
SITE ACQUISITION AND DEVELOPMENT
The Group places great emphasis on and devotes significant management resources to site
acquisition and development. The decisions relating to site acquisition and development are made at the
Group’s headquarters.
Site Acquisition
In Hong Kong, the Cheung Kong Property Group’s sites were obtained through a variety of
sources, including government auctions or tenders, purchasing from existing land owners or joint
ventures with existing land owners. The Cheung Kong Property Group has also acquired development
rights in property projects with the MTR Corporation Limited and the Urban Renewal Authority. In the
PRC, most of the Cheung Kong Property Group’s sites were obtained through public auctions
conducted by the PRC local government or through joint ventures formed with local developers.
During the Track Record Period, most of the Hutchison Property Group’s sites were obtained
through public auctions or through joint ventures formed with local developers in the PRC.
The Group believes that its competitive advantages for land acquisition are built on the experience
and expertise of the Cheung Kong Property Group and the Hutchison Property Group, including their
capital resources, high financing flexibility, global and local market experiences, brand recognition and
good reputation.
As at 31 December 2014, the property investment and valuation departments of the Cheung Kong
Property Group and the Hutchison Property Group comprised professionally qualified surveyors, and
are responsible for pre-acquisition evaluation such as conducting site inspections, drawing up financial
models and carrying out quantitative and qualitative analyses to determine the development feasibility
and potential profitability. Based on the findings in macroeconomic and site-specific analyses in respect
of each site, a preliminary building design and construction plan will be prepared by the project team to
derive the estimated costs for the proposed new development. A budget for each proposed new
development will be prepared and a maximum bid price for a particular site will then be determined
based on the estimated construction costs and the target profit margin. Where appropriate, assistance
will be sought from the development department on issues relating to technical, engineering, design and
material costs. External consultants (for example, architects, engineers, land consultants and surveyors)
to handle land and valuation issues may also be appointed as and where necessary.
The key factors considered when carrying out site acquisition are the site’s location, site specific
supply and demand conditions, planning policies, the neighbourhood in which the site is located in,
accessibility of the site by key modes of transportation, the availability of infrastructure facilities and
certain other features which may enhance or detract from the value of the site. Occasionally, sites may
be chosen for strategic reasons, such as to enhance the value between two adjacent sites. When entering
into a new city, the Group considers numerous factors, including general local economic conditions,
income levels and purchasing power of the local residents, potential market growth, completion of the
city’s development plans and the relevant government policies that may affect the city.
– 154 –
BUSINESS
Development
The development process for each proposed new development is managed by a project
management team. Each project management team is made up of representatives from the development
and valuations, project management, finance, residential and portfolio management departments. Issues
such as the feasibility, potential profitability, design, material costs, project management, market
demand and property management for each proposed new development are evaluated by the team for
the development of the project.
Our professionally qualified surveyors carry out project valuations and are also responsible for all
valuations with respect to feasibility studies, acquisitions and land premiums. Other responsibilities
include semi-annual valuations of our investment property portfolio in parallel with the independent
valuations carried out by a third party professional valuer.
The development process begins when a potential site has been identified. The project
management team then formulates an initial investment plan taking into account the expected return on
investment and coordinates with the various departments (such as the marketing department, the
projects department and the cost control department) to carry out a more in-depth study before a final
development plan and feasibility report are sent to the management team for their review and approval.
When drawing up development plans and feasibility reports, the project management team will
consider factors including (i) the local construction methods used, (ii) certain site specific
characteristics, such as views from the site, accessibility to the site, noise level around the site and the
neighbourhood of the site, (iii) the findings from macro market research (involving studies on the local
economy, policies, planning and development and property demand and supply in the region), (iv) the
master layout plan design for the development and (v) the financial modelling based on specific
development parameters.
The Group has regional offices in different cities in the PRC and overseas, which follow the same
approach to development. The regional offices report regularly to the head office in Hong Kong.
EXPANSION OF PROPERTY PORTFOLIO, PIPELINE AND LAND BANK REPLENISHMENT
As at the Latest Practicable Date, the land bank of the Cheung Kong Property Group and the
Hutchison Property Group was mostly located in tier one and tier two cities in the PRC. Depending on
the market conditions, the Group plans to develop the land bank in the PRC in phases over several
years. The Group will continue to replenish its land bank, with a focus on development projects at
prime locations in tier one and tier two cities in the PRC.
In addition, as at the Latest Practicable Date, the Cheung Kong Property Group and the Hutchison
Property Group also had land bank in the United Kingdom, by value predominantly in London. The
Group has been monitoring the overseas property markets and has been pursuing opportunities to
further expand its land bank in London.
PROPERTY VALUATION
A full list of the properties and a summary of the values of such properties issued by the Property
Valuers are included in “Appendix III – Property Valuation”. The full property valuation reports issued
by the Property Valuers are available for inspection as described in “Appendix VIII – Documents
Available for Inspection”.
– 155 –
BUSINESS
The properties that were valued by the Property Valuers as at 28 February 2015 (a) included
properties for which the Group has a development interest only (see “– Development Properties” for
details) and (b) excluded properties (i) each with a carrying amount below 1% of the unaudited pro
forma total assets of the Group as at 31 December 2014 but which in aggregate do not exceed 10% of
the unaudited pro forma total assets of the Group as at 31 December 2014 as permitted under the
Listing Rules and (ii) in respect of which the Group has recognised all or substantially all of the
economic benefits through sale transactions but where it may remain as the legal owner of some part
pending formal transfer of the legal title at or after completion of the sale.
A reconciliation of the net book value of the properties as at 31 December 2014 as set out in
“Appendix IA – Accountants’ Report on the Cheung Kong Property Group” and “Appendix IB –
Accountants’ Report on the Hutchison Property Group” to their fair value as at 28 February 2015 as
stated in “Appendix III – Property Valuation” is set out below:
HK$ million
Cheung Kong Property Group
Net book value as at 31 December 2014
Hotels and serviced suites
– in Hong Kong . . . . . . . . . . . . . . .
– outside Hong Kong . . . . . . . . . . .
Investment properties . . . . . . . . . . . . .
Stock of properties . . . . . . . . . . . . . .
.
.
.
.
.
.
.
.
.
.
.
.
.
.
.
.
.
.
.
.
.
.
.
.
.
.
.
.
.
.
.
.
.
.
.
.
.
.
.
.
.
.
.
.
.
.
.
.
.
.
.
.
.
.
.
.
.
.
.
.
.
.
.
.
.
.
.
.
.
.
.
.
.
.
.
.
.
.
.
.
.
.
.
.
.
.
.
.
.
.
.
.
.
.
.
.
.
.
.
.
.
.
.
.
.
.
.
.
.
.
.
.
.
.
.
.
.
.
.
.
9,256
529
33,285
73,259
116,329
Hutchison Property Group
Net book value as at 31 December 2014
Leasehold land classified as finance leases
Hotels and other properties. . . . . . . . . . . .
Investment properties . . . . . . . . . . . . . . . .
Stock of properties . . . . . . . . . . . . . . . . .
.
.
.
.
.
.
.
.
.
.
.
.
.
.
.
.
.
.
.
.
.
.
.
.
.
.
.
.
.
.
.
.
.
.
.
.
.
.
.
.
.
.
.
.
.
.
.
.
.
.
.
.
.
.
.
.
.
.
.
.
.
.
.
.
.
.
.
.
.
.
.
.
.
.
.
.
.
.
.
.
.
.
.
.
.
.
.
.
.
.
.
.
.
.
.
.
.
.
.
.
.
.
.
.
.
.
.
.
763
3,384
72,905
1,388
78,440
Joint Ventures
Net book value of property interests as at 31 December 2014 . . . . . . . . . . . . . . .
103,974
Total combined net book value as at 31 December 2014 . . . . . . . . . . . . . . . . . . .
298,743
Property interests excluded from valuation (1) . . . . . . . . . . . . . . . . . . . . . . . . . . .
Net changes during the period from 1 January 2015 to 28 February 2015 (2) . . . . .
(4,404)
4,255
Total . . . . . . . . . . . . . . . . . . . . . . . . . . . . . . . . . . . . . . . . . . . . . . . . . . . . . . . .
298,594
Add: Valuation surplus . . . . . . . . . . . . . . . . . . . . . . . . . . . . . . . . . . . . . . . . . . .
144,737
Gross valuation as at 28 February 2015 as set out in “Appendix III – Property
Valuation” . . . . . . . . . . . . . . . . . . . . . . . . . . . . . . . . . . . . . . . . . . . . . . . . . . .
443,331
Gross valuation attributable to the Group . . . . . . . . . . . . . . . . . . . . . . . . . . . . . .
420,149
Notes:
(1)
Excludes Chongqing Metropolitan Plaza, the sale of which to Hui Xian REIT was completed on 2 March 2015.
(2)
Includes additions, disposals, depreciation and amortisation during the period from 1 January 2015 to 28 February
2015.
– 156 –
(a)
Property group
Group I – Completed properties held by the
Cheung Kong Property Group and the
Hutchison Property Group for sale in the PRC
No.
1.
DTZ Debenham Tie Leung Limited
RMB23,055
Market value in existing
state attributable to the
Cheung Kong Property
Group and/or the
Hutchison Property
Group as at 28 February
2015 (million)
Valuation approach and key assumptions
– 157 –
Market unit price for:
(1) Residential: RMB5,500 to RMB91,704 per sq.m. on GFA basis
(2) Office: RMB7,298 to RMB50,721 per sq.m. on GFA basis
(3) Commercial: RMB8,233 to RMB52,186 per sq.m. on GFA basis
(4) Car park: RMB61,000 to RMB400,000 per lot
Market monthly unit rent for:
(1) Commercial: RMB137 to RMB249 per sq.m. on GFA basis
Capitalisation rate for:
(1) Commercial: 6.5%
쐌
쐌
쐌
Investment Approach on the basis of capitalisation of the rental income derived from the existing
tenancies with due allowance for reversionary potential of each of the properties.
Direct Comparison Approach assuming the sale of each of these properties in its existing state
by making reference to comparable sales transactions as available in the relevant market; or
III-1 to III-42
Page no. of
property
valuation report
in Appendix III
The following information is extracted from the property valuation reports of the Property Valuers in “Appendix III – Property Valuation”. You
should note that the market values of the properties prepared by the Property Valuers were based on certain assumptions which may be subject to
changes and may not be realised. See “Risk Factors – Risks Relating to Our Business – The appraised value of our properties may be different from
the actual realisable value and is subject to change” for further details.
Valuation Approach and Key Assumptions
BUSINESS
Property group
Group II – Completed properties held by the
Cheung Kong Property Group and the
Hutchison Property Group for investment in
the PRC
Group III – Completed properties held by the
Cheung Kong Property Group and the
Hutchison Property Group for operation in the
PRC
Group IV – Properties held by the Cheung
Kong Property Group and the Hutchison
Property Group under development in the
PRC
No.
2.
3.
4.
RMB64,336
RMB1,427
RMB4,242
Market value in existing
state attributable to the
Cheung Kong Property
Group and/or the
Hutchison Property
Group as at 28 February
2015 (million)
Capitalisation rate for:
(1) Office: 6% to 7.5%
(2) Commercial: 6.5% to 7.5%
쐌
– 158 –
Terminal capitalisation rate: 5.5%
쐌
쐌
Market unit price adopted for estimating the development value as if completed as at 28
February 2015:
(1) Residential: RMB7,157 to RMB38,700 per sq.m. on GFA basis
(2) Office: RMB14,000 to RMB42,240 per sq.m. on GFA basis
(3) Commercial: RMB12,045 to RMB80,000 per sq.m. on GFA basis
(4) Car park: RMB90,000 to RMB260,000 per lot
The Property Valuer has adopted the Direct Comparison Approach to assess the development
value as if completed as at 28 February 2015.
Direct Comparison Approach by making reference to comparable sales evidence as available in
the relevant market and also taking into account the incurred construction costs and the costs that
will be incurred to complete the development to reflect the quality of the completed development.
Discount rate: 9.5% to 10%
쐌
Discounted Cash Flow Approach involving discounting future net cash flow of each property for
a 10-year investment horizon and the anticipated net operating income receivable thereafter being
capitalised at appropriate terminal capitalisation rates until the end of the respective land use
terms to its present value by using an appropriate discount rate that reflects the rate of return
required by a third party investor for an investment of this type.
Market monthly unit rent for:
(1) Office: RMB50 to RMB339 per sq.m. on GFA basis
(2) Commercial: RMB28 to RMB1,510 per sq.m. on GFA basis
쐌
Investment Approach on the basis of capitalisation of rental income derived from the existing
tenancies with due allowance for reversionary potential of each of the properties or by reference
to comparable market transactions.
Valuation approach and key assumptions
III-1 to III-42
III-1 to III-42
III-1 to III-42
Page no. of
property
valuation report
in Appendix III
BUSINESS
Property group
Group V – Properties held by the Cheung
Kong Property Group and the Hutchison
Property Group for future development in the
PRC
Group VI – Completed properties held by the
Cheung Kong Property Group and the
Hutchison Property Group for sale in Hong
Kong
No.
5.
6.
HK$17,041
RMB18,586
Market value in existing
state attributable to the
Cheung Kong Property
Group and/or the
Hutchison Property
Group as at 28 February
2015 (million)
Unit site value for agricultural land: RMB270 per sq.m.
쐌
Market unit price for:
(1) Residential: HK$80,700 to HK$215,300 per sq.m. on saleable area basis
(2) Office: HK$53,800 per sq.m. on GFA basis
(3) Industrial: HK$34,400 to HK$45,000 per sq.m. on GFA basis
Market monthly unit rent for:
(1) Commercial: HK$75 to HK$1,170 per sq.m. on GFA basis
Capitalisation rate for:
(1) Commercial: 4% to 5.5%
쐌
쐌
쐌
Investment Approach on the basis of capitalisation of rental income derived from the existing
tenancies with due allowance for reversionary potential of each of the properties.
Direct Comparison Approach assuming the sale of each of these properties in its existing state
by making reference to comparable sales transactions as available in the relevant market; or
Accommodation value for land: RMB536 to RMB24,519 per sq. m.
쐌
Direct Comparison Approach assuming the sale of each of these properties in its existing state
by making reference to comparable sales transactions as available in the relevant market.
Valuation approach and key assumptions
III-1 to III-42
III-1 to III-42
Page no. of
property
valuation report
in Appendix III
BUSINESS
– 159 –
Group VIII – Completed hotel properties held
by the Cheung Kong Property Group and the
Hutchison Property Group for operation in
Hong Kong
Group VII – Completed properties held by the
Cheung Kong Property Group and the
Hutchison Property Group for investment in
Hong Kong
7.
8.
Property group
No.
HK$63,908
HK$117,767
Market value in existing
state attributable to the
Cheung Kong Property
Group and/or the
Hutchison Property
Group as at 28 February
2015 (million)
Capitalisation rate for:
(1) Residential: 2% to 3%
(2) Office: 4.5% to 5.75%
(3) Commercial: 4.25% to 6.75%
(4) Industrial: 4.25% to 5.5%
쐌
– 160 –
Discount rate: 8.5%
Terminal capitalisation rate: 3.5% to 5%
쐌
쐌
Discounted Cash Flow Approach involving discounting future net cash flow of each property for
a 10-year investment horizon by using an appropriate discount rate that reflects the rate of return
required by a third party investor for an investment of this type. The anticipated net operating
income receivable from the 11th year onwards is capitalised in perpetuity at an appropriate
terminal capitalisation rate and discounted to its present value. In valuing Property No. VIII-12
which involves a joint venture interest, the anticipated net operating income is discounted for the
remaining joint venture period.
Market monthly unit rent for:
(1) Residential: HK$129 to HK$484 per sq.m. on GFA basis
(2) Office: HK$96 to HK$1,080 per sq.m. on GFA basis
(3) Commercial: HK$86 to HK$15,600 per sq.m. on GFA basis
(4) Industrial: HK$68 to HK$430 per sq.m. on GFA basis
쐌
Investment Approach on the basis of capitalisation of rental income derived from the existing
tenancies with due allowance for reversionary potential of each of the properties or by reference
to comparable market transactions.
Valuation approach and key assumptions
III-1 to III-42
III-1 to III-42
Page no. of
property
valuation report
in Appendix III
BUSINESS
Property group
Group IX – Properties held by the Cheung
Kong Property Group under development in
Hong Kong
Group X – Properties held by the Cheung
Kong Property Group for future development
in the Hong Kong
Group XI – Property held by the Cheung
Kong Property Group under development in
Singapore
Group XII – Property held by the Cheung
Kong Property Group and the Hutchison
Property Group for future development in
Singapore
No.
9.
10.
11.
12.
– 161 –
SGD265
SGD549
HK$2,276
HK$67,981
Market value in existing
state attributable to the
Cheung Kong Property
Group and/or the
Hutchison Property
Group as at 28 February
2015 (million)
Market unit price adopted for estimating the development value as if completed as at 28
February 2015:
(1) Residential: HK$81,800 to HK$646,000 per sq.m. on GFA basis
(2) Commercial: HK$81,800 to HK$592,000 per sq.m. on GFA basis
Unit site value for agricultural land: HK$1,180 to HK$9,800 per sq.m.
쐌
Residential: SGD13,308 per sq.m. on GFA basis
쐌
Accommodation value for land: SGD8,800 per sq. m.
Direct Comparison Approach assuming the sale of each of these properties in its existing state
by making reference to comparable sales transactions as available in the relevant market.
(1)
The Property Valuer has adopted the presold consideration as the development value as if
completed as at 28 February 2015.
Direct Comparison Approach by making reference to comparable sales evidence as available in
the relevant market and also taking into account the incurred construction costs and the costs that
will be incurred to complete the development to reflect the quality of the completed development.
Accommodation value for land: HK$46,000 to HK$58,000 per sq. m. on GFA basis
쐌
Direct Comparison Approach assuming sale of each of these properties in its existing state by
making reference to comparable sales transactions as available in the relevant market.
쐌
The Property Valuer has adopted the Direct Comparison Approach to assess the development
value as if completed as at 28 February 2015.
Direct Comparison Approach by making reference to comparable sales evidence as available in
the relevant market and also taking into account the incurred construction costs and the costs that
will be incurred to complete the development to reflect the quality of the completed development.
Valuation approach and key assumptions
III-1 to III-42
III-1 to III-42
III-1 to III-42
III-1 to III-42
Page no. of
property
valuation report
in Appendix III
BUSINESS
14.
13.
No.
Group XIV – Property held by the Cheung
Kong Property Group and the Hutchison
Property Group for future development in the
United Kingdom
Group XIII – Property held by the Cheung
Kong Property Group and the Hutchison
Property Group under development in the
United Kingdom
Property group
GBP125
GBP489
Market value in existing
state attributable to the
Cheung Kong Property
Group and/or the
Hutchison Property
Group as at 28 February
2015 (million)
– 162 –
Market monthly rent adopted for estimating the development value as if completed as at 28
February 2015:
(1) Commercial: GBP22 to GBP31 per sq.m.
(2) Capitalisation rate: 7% to 9%
Market unit price adopted for estimating the development value as if completed as at 28
February 2015:
(1) Private residential: GBP19,700 to GBP20,465 per sq.m.
(2) Affordable housing provision: GBP2,690 per sq.m.
Market unit price adopted for estimating the development value as if completed as at 28
February 2015:
(1) Private residential: GBP7,265 to GBP7,805 per sq.m.
(2) Affordable housing provision: GBP1,885 per sq.m.
Market monthly rent adopted for estimating the development value as if completed as at 28
February 2015:
(1) Commercial: GBP9 to GBP22 per sq.m.
(2) Capitalisation rate: 7% to 9%
쐌
쐌
The Property Valuer has adopted the Direct Comparison Approach or the Investment Approach to
assess the development value as if completed as at 28 February 2015.
Direct Comparison Approach or Investment Approach by making reference to comparable sales
evidence as available in the relevant market or on the basis of capitalisation of the potential
rental income of the property respectively, and also taking into account the incurred construction
costs and the costs that will be incurred to complete the development to reflect the quality of the
completed development.
쐌
쐌
The Property Valuer has adopted the Direct Comparison Approach or the Investment Approach to
assess the development value as if completed as at 28 February 2015.
Direct Comparison Approach or Investment Approach by making reference to comparable sales
evidence as available in the relevant market or on the basis of capitalisation of the potential
rental income of the property respectively, and also taking into account the incurred construction
costs and the costs that will be incurred to complete the development to reflect the quality of the
completed development.
Valuation approach and key assumptions
III-1 to III-42
III-1 to III-42
Page no. of
property
valuation report
in Appendix III
BUSINESS
(c)
(b)
– 163 –
No.
1.
Property
Land at Teversham Road, Fulbourn,
Cambridgeshire, United Kingdom
Property
Albion Riverside, London, United Kingdom
Smiths Gore
1.
No.
Gerald Eve LLP
GBP0.4
Market value in existing
state attributable to the
Cheung Kong Property
Group and/or the
Hutchison Property
Group as at 28 February
2015 (million)
GBP25.5
Market value in existing
state attributable to the
Cheung Kong Property
Group and/or the
Hutchison Property
Group as at 28 February
2015 (million)
Reversionary capitalisation rate: 6.35%
쐌
쐌
Market unit price: GBP6.2 per sq. m.
Direct Comparison Approach assuming sale of the property in its existing state with the benefit
of vacant possession by making reference to comparable sales transactions as available in the
relevant market.
Valuation approach and key assumptions
Market monthly unit rent: GBP247.5 to GBP295.9 per sq. m.
쐌
Investment Approach on the basis of capitalisation of rental income derived from the existing
tenancies with due allowance for reversionary potential of the property or by comparable market.
Valuation approach and key assumptions
III-53 to III-61
Page no. of
property
valuation report
in Appendix III
III-43 to III-52
Page no. of
property
valuation report
in Appendix III
BUSINESS
(d)
Silver Point Beach Land Freeport, The
Bahamas
Grand Lucayan Beach and Golf Resort, The
Bahamas
2.
Property
1.
No.
CBRE, Inc.
USD57.0
USD2.1
Market value in existing
state attributable to the
Cheung Kong Property
Group and/or the
Hutchison Property
Group as at 28 February
2015 (million)
Market unit price: USD18.4 to USD40.8 per sq. m.
Market unit price: USD111,467 to USD152,928 per unit
Discount rate: 11%
Terminal capitalisation rate: 9%
쐌
쐌
Income Capitalisation Approach that reflects the rate of return required by a third party investor
for an investment of this type with due allowance for reversionary potential of each property.
쐌
Direct Comparison Approach utilises sales of comparable properties, adjusted for differences, to
arrive at a value for the subject property.
쐌
Direct Comparison Approach utilises sales of comparable properties, adjusted for differences, to
arrive at a value for the subject property:
Valuation approach and key assumptions
III-73 to III-93
III-61 to III-72
Page no. of
property
valuation report
in Appendix III
BUSINESS
– 164 –
BUSINESS
SUPPLIERS
The Group contracts out construction and construction-related work to independent construction
companies through a competitive tender process. The Group’s project team maintains a list of qualified
contractors for different types of work. The Group selects construction contractors by taking into
account various factors including their qualifications, financial strength, experience with similar
projects, reputation for reliability, quality and safety, price quotations and the technical and contractual
proposals put forward.
The quality and timeliness of the construction is warranted by contract. Generally, the contractors
are responsible for any quality issues and complaints in relation to construction and construction-related
work and liable for defects during the defects liability period. A defects liability period is typically a
fixed period of time after a construction project has been completed during which a contractor has the
responsibility to rectify any defects identified within a reasonable time. The procurement of raw
materials is also included as part of the scope of the construction contracts. Cost control and
construction progress are monitored during the construction period with close on-site supervision and
quality control procedures. Details on the quality control measures adopted are further set out in “–
Quality Control” below.
During the Track Record Period, the Cheung Kong Property Group’s and the Hutchison Property
Group’s purchases were settled mainly by bank transfers and cheques. The credit and payment terms
granted by the Cheung Kong Property Group’s suppliers and the Hutchison Property Group’s suppliers
were generally up to 28 days and up to 60 days, respectively.
We retain multiple suppliers for our purchases in an effort to avoid reliance on any single supplier
and to avoid unexpected disruptions to the development of our properties. To the extent possible and
subject to prevailing market conditions, any increase in the prices of goods and services supplied will
have to be reflected in the property prices. For example, an increase in construction supplies may result
in an increase in property prices. In the event that any of our existing suppliers is no longer able to
supply goods and services to us or suddenly increases the prices of goods and services supplied, we
believe we will be able to identify suitable replacement suppliers with comparable quality and prices in
a timely manner. During the Track Record Period, the Cheung Kong Property Group and the Hutchison
Property Group did not experience any material interruptions to, or material decline in, the amount or
quality of our purchases.
The Cheung Kong Property Group
The Cheung Kong Property Group’s major suppliers are based in Hong Kong. The major suppliers
of the Cheung Kong Property Group consisted mainly of contractors handling construction, foundation
and fitting-out works. For the three years ended 31 December 2014, purchases from the five largest
suppliers accounted for approximately 82.7%, 50.1% and 48.5% of the total purchases of the Cheung
Kong Property Group, respectively.
For the year ended 31 December 2012, the total purchases attributable to the Cheung Kong
Property Group’s largest supplier, which supplied the Cheung Kong Property Group with land,
accounted for approximately 51.5% of the total purchases of the Cheung Kong Property Group. As at
31 December 2012, an executive Director held an interest of approximately 0.00007% in the largest
supplier for the year ended 31 December 2012. For the year ended 31 December 2013, the total
purchases attributable to the Cheung Kong Property Group’s largest supplier, who is an independent
third party which provided construction services including superstructure, carcass, foundation and fitting
– 165 –
BUSINESS
out, accounted for approximately 15.6% of the total purchases of the Cheung Kong Property Group. For
the year ended 31 December 2014, the total purchases attributable to the Cheung Kong Property
Group’s largest supplier, who is an independent third party which provided construction services,
accounted for approximately 15.5% of the total purchases of the Cheung Kong Property Group.
Save as disclosed above, the five largest suppliers are independent third parties and, to the best
knowledge and belief of the Directors, none of the Directors or their close associates or any
Shareholders (which to the knowledge of the Directors beneficially own more than 5% of the Shares)
had any interest in any of the five largest suppliers of the Cheung Kong Property Group during the
Track Record Period.
The major suppliers have generally been suppliers of the Cheung Kong Property Group for more
than 5 years.
The Hutchison Property Group
The Hutchison Property Group’s major suppliers are based in Hong Kong. The major suppliers of
the Hutchison Property Group consisted mainly of a government department, utility providers and
property management service providers. For the three years ended 31 December 2014, purchases from
the five largest suppliers accounted for approximately 19%, 20% and 21% of the total purchases of the
Hutchison Property Group, respectively.
For the year ended 31 December 2012, the total purchases attributable to the largest supplier of
the Hutchison Property Group, which is a government department, accounted for approximately 9% of
the total purchases of the Hutchison Property Group. For the year ended 31 December 2013, the total
purchases attributable to the largest supplier of the Hutchison Property Group, which is a government
department, accounted for approximately 10% of the total purchases of the Hutchison Property Group.
For the year ended 31 December 2014, the total purchases attributable to the largest supplier of the
Hutchison Property Group, which is a government department, accounted for approximately 10% of the
total purchases of the Hutchison Property Group.
The five largest suppliers are independent third parties and, to the best knowledge and belief of
the Directors, none of the Directors or their close associates or any Shareholders (which to the
knowledge of the Directors beneficially own more than 5% of the Shares) had any interest in any of the
five largest suppliers of the Hutchison Property Group during the Track Record Period.
The major suppliers have generally been suppliers of the Hutchison Property Group for more than
10 years.
Joint Ventures
The major suppliers of the Cheung Kong Property Group’s and the Hutchison Property Group’s
joint ventures during the Track Record Period are based in the PRC and consisted mainly of
construction companies. For the three years ended 31 December 2014, purchases from the five largest
suppliers accounted for approximately 7%, 10% and 11% of the total purchases of the joint ventures,
respectively.
For the year ended 31 December 2012, the total purchases attributable to the largest supplier of
the joint ventures, which is a construction company, accounted for approximately 2% of the total
purchases of the joint ventures. For the year ended 31 December 2013, the total purchases attributable
– 166 –
BUSINESS
to the largest supplier of the joint ventures, which is a construction company, accounted for
approximately 2% of the total purchases of the joint ventures. For the year ended 31 December 2014,
the total purchases attributable to the largest supplier of the joint ventures, which is a construction
company, accounted for approximately 3% of the total purchases of the joint ventures.
The five largest suppliers are independent third parties and, to the best knowledge and belief of
the Directors, none of the Directors or their close associates or any Shareholders (which to the
knowledge of the Directors beneficially own more than 5% of the Shares) had any interest in any of the
five largest suppliers of the joint ventures during the Track Record Period.
The major suppliers have generally been suppliers of the joint ventures for, on average, at least 3
years.
QUALITY CONTROL
As at 31 December 2014, the Cheung Kong Property Group and the Hutchison Property Group
had approximately 500 and 110 members, respectively, in their respective quality assurance teams. The
quality assurance personnel are experienced in quality control, and are trained to carry out construction
audit and monitor quality assurance. The quality assurance personnel are generally project-related
professional staff whose areas of expertise include mechanical and electrical engineering, building
technology and construction management. The quality assurance personnel include degree holders and
some hold master’s degrees in construction and real estate, construction management, civil/electrical
and mechanical/building services engineering. Some of the quality assurance personnel also hold
professional memberships in The Hong Kong Institute of Engineers, The Hong Kong Institute of
Construction Managers, The Chartered Institute of Building and The Institute of Quality Assurance,
U.K. In addition, the Cheung Kong Property Group and the Hutchison Property Group encourage their
quality assurance teams to have regular training regarding quality control standards and procedures.
We place great emphasis on the quality control and inspection of the construction of our
properties to ensure compliance with our quality standard. We believe in maintaining the quality of the
properties and the quality of our service. Our quality control is carried out starting from the
pre-development phase of our properties through to the post-development phase.
Pre-Development Phase
As described in “– Suppliers” above, the Group selects its third party contractors through a
competitive tendering process. The quality assurance teams conduct pre-qualification checks on all
contractors who are invited to submit their tenders. Contractors are selected based on various factors
including their qualifications, financial strength, experience with similar projects, reputation for
reliability, quality and safety, price quotations and the technical and contractual proposals put forward.
Results from the background checks of the contractors are kept by the quality assurance teams.
Development Phase
The development departments of the Cheung Kong Property Group and/or the Hutchison Property
Group monitor the property development and design of the construction projects. The development
departments and the construction management departments of the Cheung Kong Property Group and/or
the Hutchison Property Group are responsible for monitoring the progress of construction projects and
implementing quality control measures for construction works on site.
– 167 –
BUSINESS
The quality assurance teams implement in-house construction audits during the construction
period, inspect during the handover period, and monitor rectification works for any liable defects during
the maintenance/defects liability period of the construction projects.
The quality assurance teams perform regular construction audits on our properties under
construction. Areas of material non-compliance relating to construction details, procedures, activities
and practices are identified and alerted to the relevant contractors, electrical and mechanical engineer or
construction consultants with responsibility for addressing these areas. Monitoring for such
non-compliant practices is carried out so as to minimise possible compliance cost and ensure optimum
quality. We implement a pro-active approach and preventative measures. Regular review of the
construction progress and details in project meetings on a cross-project basis would also be made.
When there are incidents of non-compliance requiring remedial work, the professional project teams are
required to address the corrective and preventive actions on a case-by-case basis.
Post-Development Phase
For residential estates developed by the Group in Hong Kong, the PRC and overseas, the quality
assurance teams and customer service teams of the Cheung Kong Property Group and/or the Hutchison
Property Group are responsible for the execution of the cross-departmental guidelines in carrying out
re-examination and re-inspection of properties during the handover of properties to purchasers.
The dedicated customer service teams work with quality assurance teams to handle queries from
customers or tenants in a timely and efficient manner in order to ensure good customer and after-sales
service.
Properties Managed by the Group
The Cheung Kong Property Group and/or the Hutchison Property Group have qualified and
registered property managers, engineers and surveyors to provide building management services in
managing the building conditions and assisting its owners to obtain professional advice and methods to
upkeep and/or improve the properties. The estate management operations run by the Cheung Kong
Property Group and the Hutchison Property Group are also accredited with ISO 9001:2008 and are
governed by a well-structured management system to seek to sustain the high quality of service.
In addition, trained personnel and security staff are appointed to conduct daily patrols to monitor
the conditions of the managed areas. If there are any defects or problems identified, in-house fitters or
outsourced contractors will be assigned to follow up (for example repair or replace the necessary items
or components). Routine maintenance for all facilities is carried out by in-house fitters or outsourced
contractors.
Hotels and Serviced Suites
Each hotel and serviced suite has a maintenance program that is monitored by the hotel or
serviced suite general manager. In addition, managers from the hospitality group corporate office pay
periodic visits each year to each of the hotels or serviced suites to audit the various operating
procedures as well as to review the condition of the properties.
– 168 –
BUSINESS
Employee Training
We also focus on the training and development of our employees and believe that possessing the
necessary skills and providing good quality service are important. Please see “– Employees – Training
and Development” below for further details.
SALES AND MARKETING
Development Properties
The sale of our residential properties are organised by the in-house sales departments of the
Cheung Kong Property Group and/or the Hutchison Property Group. The sales departments are
primarily responsible for organising promotional campaigns and events to publicise and raise awareness
of the properties and liaising with customers in the sale and purchase process. During the Track Record
Period and up to the Latest Practicable Date, neither the Cheung Kong Property Group nor the
Hutchison Property Group had experienced any material delays in delivering its properties in
accordance with the sale and purchase contracts.
In Hong Kong, the sale of development properties typically takes place before their completion.
After the necessary government approval for pre-sales has been obtained, the sales department is
involved in the setting up of show flats and a pre-sales office for the public to obtain more information
about the property project. In the PRC, government approval for pre-sales is also required and the sale
process is similar to that in Hong Kong.
We also engage external sales agents from reputable agencies for the marketing of our properties.
In each geographical region, the Group closely follows the prevailing local market conditions in
formulating its pricing and marketing strategies. Our pricing strategies are based on various factors,
including the orientation of the property, view from the property, noise level and popularity of the
layout of the units within the property. We adjust the weight of these factors based on customer
preferences in the regions in which we operate.
Our marketing strategies include the following elements:
쐌
Product: We will design and build the products that are in line with the preferences of our
customers in different geographical regions.
쐌
Pricing: We set our pricing in accordance with the prevailing market conditions as well as
the potential customers’ affordability.
쐌
Promotion: We design and implement a wide range of promotional activities to reach out to
potential customers’ in different cities and geographical locations including advertising (such
as television, print and online advertising), promotional events, roadshows and direct
marketing.
쐌
Sales Channels: We aim to expand and optimise the coverage of the potential customer
segments by using our internal sales team and external sales agents.
– 169 –
BUSINESS
The Group recognises good customer and after-sales service are keys to the success and
sustainability of a corporation. Following this belief, we deploy a dedicated customer service team to
handle queries from customers in a timely and efficient manner for residential estates developed by the
Group in Hong Kong, in the PRC and overseas.
With the assistance of the customer service teams, the handover teams of the quality assurance
teams are responsible to execute the cross-departmental guidelines in carrying out re-examination and
re-inspection of properties prior to the handover of properties to purchasers. Further details of the
customer service teams and quality assurance teams are described in “– Quality Control” above.
Investment Properties
The leasing of our investment properties is organised by the in-house leasing departments of the
Cheung Kong Property Group and/or the Hutchison Property Group. The leasing departments are
involved in tenancy negotiations and oversee the investment property portfolio of the Group. Third
party real estate agents also from time to time introduce new tenants to the Group’s investment
properties. The agents’ fees vary across different properties and at different times, depending primarily
on the occupancy level of our property in question and the prevailing agency fee offered by our major
competitors at the time. Assessments of market rent are conducted from time to time, having regard to
market demand, existing competition and economic factors.
Customer service hotlines and counters are set up to seek comments or handle queries from the
tenants. In addition, regular meetings with tenants’ representatives and annual customer satisfaction
surveys are conducted to review the level of satisfaction of tenants.
Hotels
Turnover from hotel and serviced suite operation is generated from reservations made through
various sales distribution channels, including travel agents and online booking agents. Room rates are
reviewed and adjusted by the management periodically, taking into account factors including seasonality
of the hospitality industry, planned renovation works and prevailing market conditions.
CUSTOMERS
The Cheung Kong Property Group
For the three years ended 31 December 2014, turnover from the five largest customers accounted
for approximately 2.1%, 8.6% and 3.8% of the total turnover of the Cheung Kong Property Group,
respectively.
For the year ended 31 December 2012, the total turnover attributable to the largest customer, who
is an independent third party and a tenant of 1881 Heritage, accounted for approximately 1.4% of the
total turnover of the Cheung Kong Property Group. For the year ended 31 December 2013, the total
turnover attributable to the largest customer, who is an independent third party and a purchaser of
property, accounted for approximately 4.6% of total turnover of the Cheung Kong Property Group. For
the year ended 31 December 2014, the total turnover attributable to the largest customer, who is also
the largest customer for the year ended 31 December 2012, accounted for approximately 1.5% of the
total turnover of the Cheung Kong Property Group.
– 170 –
BUSINESS
The five largest customers are independent third parties and, to the best knowledge and belief of
the Directors, none of the Directors or their close associates or any Shareholders (which to the
knowledge of the Directors beneficially own more than 5% of the Shares) had any interest in any of the
five largest customers of Cheung Kong Property Group during the Track Record Period.
During the Track Record Period, Cheung Kong Property Group’s major customers consisted
mainly of tenants of investment properties and purchasers of residential properties.
The Hutchison Property Group
For the three years ended 31 December 2014, turnover from the five largest customers accounted
for approximately 13%, 15% and 14% of the total turnover of the Hutchison Property Group,
respectively.
For the year ended 31 December 2012, the total turnover attributable to the largest customer, who
is an independent third party and a tenant of Cheung Kong Center, accounted for approximately 5% of
the total turnover of the Hutchison Property Group. For the year ended 31 December 2013, the total
turnover attributable to the largest customer, who is an independent third party and a tenant of Cheung
Kong Center, accounted for approximately 5% of the total turnover of the Hutchison Property Group.
For the year ended 31 December 2014, the total turnover attributable to the largest customer, who is an
independent third party and a tenant of Cheung Kong Center, accounted for approximately 5% of the
total turnover of the Hutchison Property Group.
The five largest customers are independent third parties and, to the best knowledge and belief of
the Directors, none of the Directors or their close associates or any Shareholders (which to the
knowledge of the Directors beneficially own more than 5% of the Shares) had any interest in any of the
five largest customers of the Hutchison Property Group during the Track Record Period.
During the Track Record Period, the Hutchison Property Group’s major customers consisted
mainly of tenants of investment properties.
Joint Ventures
For the three years ended 31 December 2014, turnover from the five largest customers of all of
the Cheung Kong Property Group’s and the Hutchison Property Group’s joint ventures accounted for
approximately 2%, 15% and 5% of the total turnover of the joint ventures, respectively.
For the year ended 31 December 2012, the total turnover attributable to the largest customer, who
is an independent third party, accounted for approximately 0.4% of the total turnover of the joint
ventures. For the year ended 31 December 2013, the total turnover attributable to the largest customer,
who is an independent third party, accounted for approximately 11.5% of the total turnover of the joint
ventures. For the year ended 31 December 2014, the total turnover attributable to the largest customer,
who is an independent third party, accounted for approximately 1.5% of the total turnover of the joint
ventures.
The five largest customers are independent third parties and, to the best knowledge and belief of
the Directors, none of the Directors or their close associates or any Shareholders (which to the
knowledge of the Directors beneficially own more than 5% of the Shares) had any interest in any of the
five largest customers of the joint ventures during the Track Record Period.
– 171 –
BUSINESS
During the Track Record Period, the joint ventures’ major customers consisted mainly of
purchasers of the development projects and tenants of investment properties.
MARKET AND COMPETITION
The property development and property rental business in the areas where we operate is highly
competitive.
For more information on the competitive landscape of the various business segments of the Group,
see “Industry Overview”.
Hong Kong
The Group competes with other property developers in bidding for development sites at
government auctions and in public and private tenders as well as in private sales of prospective
development properties. Once it has developed a property, the Group competes with other major
property developers for buyers or to attract and retain tenants.
The Group competes for office tenants primarily based on the quality and location of the
development, our reputation as a building owner and quality of the support service. With respect to
retail tenants, the Group competes primarily based on the location of the commercial centres, the ability
to attract customers using a balanced mix of tenants and the quality of management services. In
addition, the hotels and serviced suites industry in Hong Kong is highly competitive and the Group
competes primarily based on the location, reputation, brand recognition, room rates and range of
services and facilities offered by the Group’s hotels and serviced suites.
Despite the competitive environment, the Group has been able to achieve satisfactory sales and
maintain high average occupancy rates for its investment properties. The Directors believe this is partly
due to our brand, the strategic locations of our properties and the quality of our investment properties.
PRC
Our existing and potential competitors in the PRC include major developers in the PRC and, to a
lesser extent, foreign developers from elsewhere in Asia. Some of our competitors target different
segments of the PRC property market. Some of them engage in other activities in addition to property
development and some are focused regionally or nationally.
The Group focuses on mid to high-end residential properties in the PRC. The Directors believe
that it is in a very competitive position against the other major developers in the mid to high-end
residential property market.
In addition, the Group’s hotels in the PRC face competition from other hotel operators located
nearby, particularly those that offer rooms and banqueting and meeting facilities of a similar quality at
similar prices. The Group’s hotels in the PRC compete primarily based on location, brand, room rates,
banqueting and meeting facility rates and range and quality of services and facilities.
– 172 –
BUSINESS
Singapore
The principal competitive factors faced by the Group in Singapore include the quality and location
of the property developments. Despite the competitive environment of the property development market
in Singapore, the Group has been able to achieve satisfactory sales and the Directors believe that this is
partly due to the Group’s brand, reputation and quality and location of the Group’s properties in
Singapore.
United Kingdom
The Group focuses on high-end residential properties in the United Kingdom. The Directors
believe that the Group is in a competitive position against the other major developers in the high-end
residential property market due to our reputation and the local market experience acquired since the
expansion of the Group into the property industry in the United Kingdom. The Group is a relatively
small player in the commercial rental market in the United Kingdom.
OTHER BUSINESS
Subject to the relevant regulatory approval being obtained, following completion of the Spin-off,
the Group will own a 50% interest in Metro Broadcast, a radio broadcast company which went on air in
July 1991 and currently operates six radio channels in Hong Kong, namely Metro Finance, Metro Info,
Metro Plus, Metro Finance Digital, Metro Music Digital and Metro Life Digital.
For the three years ended 31 December 2014, the Group’s share of the aggregate turnover derived
from the radio broadcasting business was HK$98 million, HK$101 million and HK$106 million,
respectively.
AWARDS
The Group benefits from the property industry expertise and experience of the Cheung Kong
Property Group and the Hutchison Property Group. The following key awards were received in respect
of 2014:
쐌
“Asia Top 10 Developers – Hong Kong” was awarded to Cheung Kong at the “BCI Asia
Awards 2014”; and
쐌
“Outstanding Listed Company Award 2014” was awarded to Cheung Kong by The Hong
Kong Institute of Financial Analysts and Professional Commentators Limited.
CORPORATE SOCIAL RESPONSIBILITY
The Group is committed to a high standard of corporate social responsibility and aspires to create
a harmonious society through cultivating responsible corporate citizenship. Over the years, the Cheung
Kong Group and the Hutchison Group have proactively implemented various community involvement
initiatives to foster the well-being of the community, its employees and the environment. The following
are highlights of such initiatives in 2014:
쐌
The Cheung Kong Group was named one of The Community Chest’s Top Three Donors in
2014 for the 15th consecutive year. Hutchison also received the President’s Award in 2014
as a recognition of its contribution to The Community Chest.
– 173 –
BUSINESS
쐌
In May 2014, Cheung Kong participated in the launch of a donation hotline to raise money
for The Community Chest Rainbow Fund, which was first launched in 2004 to provide rapid
responses to people who find themselves in an emergency financial crisis. All contributions
made through the hotline by the public were matched dollar-for-dollar and over HK$2.5
million was raised from the public for this programme.
쐌
The Cheung Kong Group has participated in The Hong Kong Council of Social Service’s
Caring Company Scheme since its inception in 2003. In 2014, 119 member companies of the
Cheung Kong Group and the Hutchison Group were awarded the “Caring Company Logo”,
representing the highest number of awards received by a commercial group entity.
쐌
In 2014, the Cheung Kong Property Group continued to organise summer internship
programmes for university students to work in the sales and leasing department and the
hotels and hospitality division of the Cheung Kong Property Group. The programmes offered
practical training to university graduates. The Cheung Kong Property Group was granted
“Nurture Young Talents” award by the Hong Kong Labour Department for its participation in
the Youth Employment and Training Programme. Under the programme, the Cheung Kong
Property Group offers 12 months’ training to trainees who will be issued a certificate
specifying their acquired skills upon completion of their training. The trainees with
satisfactory performance may be offered full-time employment with the Cheung Kong
Property Group.
쐌
The Hutchison Group’s volunteer team regularly arranges activities for the community in
conjunction with various social organisations such as the Education Bureau and the Hong
Kong Family Welfare Society in 2012, the Tung Wah Group of Hospitals in 2013 and Yan
Oi Tong in 2014.
쐌
The Shanghai Volunteer Team of the Hutchison Property Group participated in the Shanghai
Library volunteer campaign in 2014.
쐌
The Qingdao Volunteer Team of the Hutchison Property Group helped raise public awareness
and support for children with autism through working with local schools and foundations.
– 174 –
BUSINESS
EMPLOYEES
Following completion of the Property Businesses Combination, the Group will have approximately
19,400 employees.
The following table sets out a breakdown of the employees by function and region as at 31
December 2014:
Hong Kong
Function
Executive Director(s) . . .
Property Investment and
Development . . . . . . . .
Sales, Leasing, Building
Management and Hotel
Operation . . . . . . . . . .
Business Development
and Investment . . . . . .
Professional Support . . . .
Total . . . . . . . . . . . . . . .
Cheung
Kong
Property
Group(1)
Other Regions(3)
PRC
Hutchison
Property
Group(2)
Cheung
Kong
Property
Group(1)
Hutchison
Property
Group(2)
Cheung
Kong
Property
Group(1)
Hutchison
Property
Group(2)
7
1
–
–
–
–
400
349
478
1,609
12
18
6,145
3,672
719
3,491
5
473
47
554
24
246
–
251
65
849
–
7
–
10
7,153
4,292
1,448
6,014
24
501
Notes:
(1)
(2)
(3)
Includes employees of joint venture entities managed by the Cheung Kong Property Group.
Includes employees of joint venture entities managed by the Hutchison Property Group.
Other regions include Singapore, the United Kingdom and The Bahamas.
Training and Development
The Group places great emphasis on the training and development of its employees. Employees
are encouraged to take part in internal and external training courses. Vocational training such as
job-related seminars and workshops are held by the Group from time to time for its employees for
skills enhancement. Tailor-made training programmes are also implemented for employees in specific
work units.
The Group supports employees who attend vocational training courses or professional seminars
through sponsoring and/or granting them special leave.
Employee Benefits
Competitive remuneration is offered to employees and reviewed individually on an annual basis
reflecting each employee’s work performance, contributions and market developments. Other employee
benefits include comprehensive medical, life and disability insurance coverage, free annual health
check-ups, retirement schemes and long service gifts.
– 175 –
BUSINESS
ENVIRONMENTAL MATTERS
We are committed to sustainable development and continuously reinforce our commitment to the
environment by reducing carbon emissions and adopting high environmental standards in our
development projects and hotel operation.
During the Track Record Period, the Cheung Kong Property Group participated in the Carbon
Audit programme in support of the Hong Kong Government’s Carbon Reduction Charter. In order to
promote a green living environment, the Cheung Kong Property Group has introduced eco-friendly
measures, including energy conservation measures, to the residential and commercial developments of
the Cheung Kong Property Group during the design, construction and maintenance of the properties. In
planning and design, curtain walls are installed (where applicable) to capture daylight and enhance
natural ventilation. In material sourcing and construction, timber used in construction is sourced from
sustainable forests in support of environmental conservation. Various green initiatives have been
implemented in the residential estates and commercial properties managed by the Cheung Kong
Property Group, including using energy-saving lighting, reducing water consumption and organising
waste rebate and recycling programmes. In 2013, Citybase and Goodwell received Certificates of Merit
in the Hong Kong Award for Environmental Excellence, an award in recognition of their efforts in
promoting green practices. During the Track Record Period, the Hutchison Property Group has also
organised recycling and promoted green projects in the residential estates managed by the Hutchison
Property Group to support a green living lifestyle for its residents.
Many of the eco-friendly measures mentioned above were also implemented during the design and
construction of the Group’s hotels. In addition, the Group’s hotels regularly participate in recycling
programmes, such as the Wood Recycling and Tree Conservation Scheme organised by the
Environmental Bureau and Environmental Protection Department since 2013, recycling of paper and
recycling of cooking oil into biodiesel.
The operations of our properties are subject to various environmental laws and regulations,
including those relating to waste disposal, water pollution control, air pollution control and noise
control.
For the years ended 31 December 2012, 2013 and 2014, the total costs of compliance with
applicable environmental laws and regulations incurred by the Cheung Kong Property Group (including
its interests in its joint ventures) were approximately HK$245 million, HK$510 million and HK$1,384
million, respectively. Such increase in compliance costs in 2014 was primarily due to the completion of
six projects, three of which were large-scale developments. In 2013, two projects were completed, one
of which was a large-scale development while in 2012, three relatively smaller projects were
completed. In addition, the government has also implemented new and tightened existing environmental
measures and standards over the years.
For the years ended 31 December 2012, 2013 and 2014, the total costs of compliance with
applicable environmental laws and regulations incurred by the Hutchison Property Group (including its
interests in its joint ventures) were approximately HK$561 million, HK$387 million and HK$409
million, respectively.
The annual costs of compliance going forward are expected to be similar. During the Track
Record Period, none of our properties received any material fines or penalties associated with the
breach of any environmental laws or regulations.
– 176 –
BUSINESS
INTELLECTUAL PROPERTY
We use a number of brand names including “Cheung Kong”, “Hutchison”, “Harbour Plaza”,
“Harbour Grand”, “Rambler” and “Horizon”, in marketing our properties to potential purchasers,
tenants and hotel customers.
As at the Latest Practicable Date, we had registered 36 trade marks and six domain names, had
applied for the registration of five trade marks and had been licensed to use 18 trade marks, which are
material to our business. Further details of such intellectual property rights are set out in “Appendix VII
– General Information – Further Information about the Business – Intellectual Property”.
We have also entered into new licensing arrangements with members of the CKH Holdings Group,
which grant us the right to use certain intellectual property rights and domain names containing or
consisting of the brand names “Cheung Kong”, “Hutchison”, “和記”, “和黃”, or “和記黃埔” and certain
associated logos that are owned by members of the Cheung Kong Group or the Hutchison Group from
the Listing Date and on a royalty free and perpetual basis. Other intellectual property rights owned by
members of the Cheung Kong Group or the Hutchison Group that had been licensed to use by the
Group will be assigned to members of the Group with effect from the Listing Date.
As at the Latest Practicable Date, we had not been engaged in any material dispute, litigation or
legal proceedings relating to the violation of intellectual property rights.
INSURANCE
Our properties, completed and under development, are in general insured to standards in line with
industry practice in Hong Kong. In addition to statutory required insurances, the Group purchases other
insurances, where considered necessary, to cover the major risks identified by the Group. The principal
insurances in place for completed properties are property all risks insurance, business interruption
insurance and third party liability insurance. The principal insurances in place for our properties under
development are contractors all risks insurance.
There are no national mandatory provisions under the relevant PRC laws and regulations requiring
property developers to maintain insurance coverage with respect to their property development
operations. We maintain insurance policies including property all risk insurance, work-related accidents
and third party liability insurance.
The Group’s insurance policies are reviewed from time to time by an insurance task force
consisting of senior management of the Group. During the Track Record Period, there were no
significant or unusual excess or deductible amounts under these policies and the Directors are of the
view that the insurance coverage under these policies is adequate and customary for our industry.
However, there may be certain risks for which the Group is not insured and may not have
sufficient insurance coverage for damages and liabilities that may arise in the course of the Group’s
business operations. See “Risk Factors – Risks Relating to Our Business – We may suffer losses arising
from uninsured risks” for further details.
Upon Listing, the Company intends to purchase and maintain insurance for the Directors and
certain officers against liabilities to third parties that may be incurred in the performance of their
respective duties.
– 177 –
BUSINESS
HEALTH AND SAFETY
We are subject to the health and safety requirements in the jurisdictions we operate in. We have
internal policies and systems in place designed with a view to implementing and ensuring compliance
with such requirements. We believe that we were in material compliance with such requirements during
the Track Record Period up to the Latest Practicable Date. Our liability to our employees is covered by
insurance, which we are required by law to have. We do not have an insurable interest in relation to the
employees of our contractors. Our contractors are required by applicable laws to have insurance which
covers their liabilities to their employees.
To provide a safe working environment for employees, risk assessments, upgrades and
maintenance of workstations, equipment and tools for all users are performed. To ensure hygienic
working conditions, regular cleaning of air-conditioning systems and disinfection treatment of carpets
are carried out at regular intervals.
For employees who are assigned to work on construction sites, they are required to observe
additional safety guidelines. This is to ensure a high standard of occupational safety, protecting
employees from occupational hazards. Special safety equipment such as safety helmets, goggles, shoes,
ear-plugs and dust masks are provided and well-maintained.
LEGAL AND REGULATORY PROCEEDINGS AND COMPLIANCE MATTERS
Litigation, Claims and Arbitration
As at the Latest Practicable Date, no member of the Group was engaged in any litigation, claim or
arbitration of material importance nor, to the best of our knowledge, is any litigation, claim or
arbitration of material importance pending or threatened against any member of the Group.
Compliance with Laws and Regulations
In February 2013, contracts were entered into for the sale of hotel units in The Apex Horizon
owned by Pearl Wisdom Limited (“PWL”), a wholly-owned subsidiary of Cheung Kong. Subsequently,
PWL was notified by the SFC that the arrangements relating to the sale and purchase of hotel units in
The Apex Horizon appeared to constitute a Collective Investment Scheme as defined under the SFO.
Although this view was not agreed by PWL, arrangements for cancellation of the transactions were
made.
A summary of the key laws and regulations which are applicable to the Group’s operations is set
out in “Appendix IV – Regulatory Overview”.
During the Track Record Period and up to the Latest Practicable Date, save as disclosed in “–
PRC Property-Related Matters – Registration of Property Lease Contracts” below, we complied with
the relevant laws and regulations in relation to our business in all material respects and there were no
material breaches or violations of the laws or regulations applicable to the Group that would have a
material adverse effect on our business or financial condition taken as a whole.
– 178 –
BUSINESS
Licences and Permits
During the Track Record Period and up to the Latest Practicable Date, we had obtained all
material licences and permits necessary for the operation of our business in the jurisdictions in which
we operate and such licences and permits are still valid and in force. We have not experienced any
refusal of the renewal application of any material licences or permits necessary for the operation of our
business. Further information on the material licences and permits necessary for the operation of our
business is set out in “Appendix IV – Regulatory Overview”.
PRC Property-Related Matters
Registration of Property Lease Contracts
Pursuant to the applicable PRC laws and regulations, lease contracts are required to be registered
with the local branch of the Ministry of Housing and Urban-Rural Development of the PRC. The
registration of lease contracts requires the cooperation between tenants and landlords in signing the
registration forms and providing the supporting documents. During the Track Record Period, we did not
strictly follow the requirements of the relevant laws and regulations in relation to the registration of
lease contracts. As at the Latest Practicable Date, we were unable to register certain lease contracts,
primarily due to the lack of cooperation of our tenants or lessors. We have taken all practicable and
reasonable steps, including seeking the cooperation of the relevant tenants and lessors to ensure that
such lease contracts are registered. As advised by our PRC counsels, non-registration of these lease
contracts does not affect their validity under the relevant PRC laws and regulations. Our PRC counsels
have advised us that a maximum penalty of RMB10,000 may be imposed on the non-registration of
each lease contract and the estimated total maximum penalty which may be imposed on us for such
non-registration is less than RMB1 million.
In addition to our current internal controls system, we have strengthened our internal controls
measures to prevent the recurrence of such non-compliance with the relevant PRC laws and regulations
relating to registration of lease contracts. Our standard lease contracts incorporate specific provisions in
connection with the respective responsibilities of the landlord and the tenants with regard to lease
registration and our right to make a claim against our tenants for any penalties arising from the
inability to register the lease contracts caused by our tenants. Our leasing department has set up
mechanisms to monitor the status of lease registration and send reminders to, and make claims against,
any tenant who fails to fulfil its obligations. Our legal and finance departments will conduct regular
checks to confirm that our lease contracts have been or are in the process of being registered. Periodic
reminders will also be sent to the leasing department to remind them of the need to comply with the
relevant policies and procedures as well as on-going regulatory requirements. We have engaged an
independent consulting firm (the “Internal Controls Consultant”), under a non-assurance engagement,
as the Company’s internal controls consultant to review the remedial measures taken by the Company
to address these non-compliance incidents and the additional measures put in place to prevent
recurrence of non-compliance incidents mentioned above. The Internal Controls Consultant raised no
further recommendation.
Having considered the facts and causes of the issue described above and the stronger internal
controls measures taken by us to prevent the recurrence of the identified issue, our Directors are
satisfied that our internal controls system is adequate and effective for its current operations and
consider, and the Joint Sponsors concur, that the non-compliance incidents do not have any material
impact on the suitability of our Directors under Rules 3.08 and 3.09 of the Listing Rules and our
suitability for listing under Rule 8.04 of the Listing Rules.
– 179 –
BUSINESS
Delays in Commencement of Construction under the Land Grant Contract
As at the Latest Practicable Date, five of our development sites had yet to commence development
on or before the respective development commencement dates as stated in the relevant land grant
contracts or other relevant permits due to government reasons (including but not limited to changes to
site planning and land delivery schedules). These development sites had a total site area of
approximately 1.6 million sq.m. as at 28 February 2015.
Our PRC counsels are of the view that under PRC law, a fine of 20% of the land premium and
forfeiture of land use rights with respect to the relevant land under the PRC Measures on Disposing
Idle Land, are not applicable since the delays were caused by government reasons.
Separately, as a matter of contract, while the land grant contracts for two of these development
sites contain provisions on fines and/or forfeiture of land use rights, our PRC counsels are of the view
that the risks of such fine or forfeiture are remote based on (a) the delays were caused by government
reasons; (b) each of the relevant project companies confirmed that it had not received any investigation
notice, warning, penalty or order to forfeit the relevant development site as at the Latest Practicable
Date; and (c) with respect to certain development sites, the relevant government authorities have issued
written documents confirming that the delays were caused by government reasons. Pursuant to the land
grant contracts, the aggregate maximum penalties which may be imposed in connection with these
delays are up to approximately RMB295.4 million in addition to the forfeiture of the land use rights in
respect of one parcel of land.
Based on the foregoing, we do not believe these delays would have a material and adverse effect
on our business, financial condition and results of operations. We will continue to discuss with the
relevant government authorities in relation to the signing of supplementary agreements pursuant to
which new development commencement dates will be determined.
Delays in Completion of Development under the Land Grant Contract
As at the Latest Practicable Date, three of our development sites had yet to complete the
development by the time stipulated under the terms of the relevant land grant contracts or other
relevant permits without further approval or confirmation from the relevant government authorities. For
the first development site, the delay was due to government reasons (including site planning). For the
second development site, the delay was due to change in flood control design, relocation works
involving military fibre cables and change in the design of underground car park spaces imposed by the
relevant government authorities. For the third development site, the delay was partially due to
government reasons and partially due to uncontrollable traffic congestion arising from the construction
of a nearby development site. These development sites had a total site area of approximately 1.2
million sq.m. as at 28 February 2015.
While the land grant contracts for these three development sites contain provisions on fines and/or
forfeiture of land use rights, our PRC counsels are of the view that the risks of a fine (as applicable)
being imposed and/or the relevant development site being forfeited under such land grant contracts are
remote based on the following: (a) the delays were caused by government reasons and uncontrollable
impact from third parties; (b) each of the relevant project companies confirmed that it had not received
any investigation notice, warning, penalty or order to forfeit the relevant development site as at the
Latest Practicable Date; (c) with respect to one of the development sites, the property project has been
substantially completed and the uncompleted portion has entered into the development stage; (d) with
respect to another of the development sites, the relevant government authorities have issued a
– 180 –
BUSINESS
construction planning permit and a construction permit. For the completed portion of one of the
projects, the relevant government authorities have also issued pre-sales permits. Pursuant to the land
grant contracts, the aggregate maximum penalties which may be imposed in connection with these
delays are up to approximately RMB1.2 billion in addition to the forfeiture of the land use rights in
respect of two parcels of land.
Based on the foregoing, we do not believe these delays would have a material and adverse effect
on our business, financial condition and results of operations. We intend to complete these development
projects and we will continue to discuss with the relevant government authorities in relation to the
signing of supplementary agreements pursuant to which new development completion dates will be
determined.
Civil Air Defence Properties
As of the Latest Practicable Date, certain portions of the premises at 38 of our properties in the
PRC were considered to be civil air defence properties. Such civil air defence properties had an
aggregate GFA of approximately 784,129 sq.m. with a carrying amount of RMB437.0 million as at 28
February 2015:
쐌
Premises with (i) an aggregate GFA of 464,337 sq.m. were car park spaces and were
accounted for as investment properties, (ii) an aggregate GFA of 75,731 sq.m. were car park
spaces held for sales and were accounted for as stock of properties and (iii) GFA of 3,400
sq.m. was a commercial property and was accounted for as stock of properties.
쐌
Premises with an aggregate GFA of 238,868 sq.m. were largely car park spaces to be
developed or under development and were accounted for as property under development.
쐌
Premises with an aggregate GFA of 1,793 sq.m. were a fitness centre and a staff changing
room and were accounted for as property, plant and equipment.
In light of the fact that these civil air defence properties were largely car park spaces, we do not
believe they are significant to the Group’s overall property portfolio as they did not generate a
significant amount of turnover for the Group during the Track Record Period. Our PRC counsels are of
the opinion that, as at the Latest Practicable Date, our civil air defence properties complied with Civil
Air Defence Law in all material aspects.
To ensure compliance with the Civil Air Defence Law, we schedule regular inspections of all our
civil air defence properties to ensure that the design, construction and quality of the construction and
quality of the properties conform to the protection and quality standards established by the PRC
government. In addition, we also seek legal and/or technical advice from external professional
consultants when necessary. We also consult legal advisers to advise us on an ongoing basis regarding
the continuing legal developments in respect of the interpretation and enforcement by PRC
governmental authorities in respect of civil air defence properties.
We believe that our business operations have complied with the Civil Air Defence Law in all
material respects. During the Track Record Period and up to the Latest Practicable Date, we had not
received any warning notice, rectification order or been subject to any fines or penalties in connection
with the Civil Air Defence Law.
– 181 –
FINANCIAL INFORMATION
The following discussion and analysis should be read in conjunction with the Accountants’
Reports (together with the accompanying notes) set out in “Appendix IA – Accountants’ Report on
the Cheung Kong Property Group” and “Appendix IB – Accountants’ Report on the Hutchison
Property Group” and the unaudited pro forma financial information set out in “Appendix II –
Unaudited Pro Forma Financial Information”.
The historical financial information as at and for the years ended 31 December 2012, 2013
and 2014 for each of the Cheung Kong Property Group and the Hutchison Property Group set out
below was derived from their respective audited combined financial statements for such periods.
Such historical financial information does not necessarily reflect the results of operations, financial
position and cash flows of the Company, which will hold the Combined Property Businesses and the
joint ventures that will become subsidiaries of the Company immediately following completion of the
Property Businesses Combination. As such, the historical financial information is not directly
comparable to the future financial statements of the Company immediately following completion of
the Property Businesses Combination, which will contain the results of operations, financial position
and cash flows of the Combined Property Businesses and the joint ventures that will become
subsidiaries of the Company as prepared and presented on a consolidated basis and thus should not
be relied upon as an indication or guarantee of the Company’s future operating performance.
The underlying combined financial statements of the Cheung Kong Property Group and the
Hutchison Property Group have been prepared in accordance with HKFRS. Pursuant to HKFRS, the
underlying financial statements of the Cheung Kong Property Group and the Hutchison Property
Group have been prepared under the historical cost convention, except for investments in securities,
investment properties and derivative financial instruments, which have been measured at fair value.
The Cheung Kong Property Group’s financial information and the Hutchison Property Group’s
financial information as set out in the Accountants’ Reports in Appendices IA and IB are reported in
HKD and have been prepared in accordance with accounting policies that conform with IFRS.
You should note that following completion of the Property Businesses Combination and the
formation of the Group, the structure of the businesses comprising the Group will differ from the
structure in place prior to completion of the Property Businesses Combination and during the Track
Record Period. In particular, a substantial portion of the joint venture companies in which the
Cheung Kong Property Group and the Hutchison Property Group are interested but which are not
and were not previously consolidated into the respective financial statements of either the Cheung
Kong Property Group or the Hutchison Property Group will become subsidiaries of the Company
and accordingly will be consolidated into the financial statements of the Group upon completion of
the Property Businesses Combination. Therefore, prior to and up to completion of the Property
Businesses Combination, references in this listing document to the Group are referring to the
Cheung Kong Property Group, the Hutchison Property Group and their interests in their respective
joint ventures, whereas after completion of the Property Businesses Combination, references in this
listing document to the Group are to the Company and its subsidiaries, comprising the Cheung Kong
Property Group, the Hutchison Property Group and their former joint ventures which will become
subsidiaries of the Company, and interests in their other joint ventures that will remain as joint
ventures and will not be consolidated.
– 182 –
FINANCIAL INFORMATION
We have prepared and included the unaudited pro forma financial information as at and for
the year ended 31 December 2014 as set out in Appendix II for the purpose of illustrating the effect
of completion of the Hutchison Proposal, the Property Businesses Combination (including
consolidation of joint ventures that will become subsidiaries of the Company) and the Spin-off as if
the Listing had taken place on 1 January 2014 for the pro forma combined income statement and
statement of cash flows and 31 December 2014 for the pro forma combined statement of assets and
liabilities. The unaudited pro forma statement has been prepared for illustrative purposes only.
The following discussion and analysis contains forward-looking statements that involve risks
and uncertainties. These statements are based on assumptions and analyses made by us in light of
our experience and perception of historical trends, current conditions and expected future
developments, as well as other factors we believe are appropriate under the circumstances. You
should not place undue reliance on any such statements. Our actual future results could differ
materially from those discussed in the forward-looking statements as a result of various factors,
including those set out in “Risk Factors” and “Forward-Looking Statements”.
CERTAIN KEY TERMS
As the following key terms are used frequently throughout this section, definitions for such key
terms are set out below to assist the reader in understanding the Cheung Kong Property Group’s and
the Hutchison Property Group’s financial information during the Track Record Period. The terms and
their meanings may not correspond to the standard usage of the terms.
“Cheung Kong Property Group Turnover” or “Hutchison Property Group Turnover”, as the
case may be, does not include property sales of its joint ventures, including those that will become
subsidiaries of the Company upon completion of the Property Businesses Combination.
“Attributable interests in joint ventures” means the equity interests in those joint ventures held
by the companies within the Cheung Kong Property Group or the Hutchison Property Group, as the
case may be.
“Profit contribution” primarily represents earnings before interest, taxes, changes in fair value of
investment properties, investment and finance income and profit on disposal of investments and others.
See Note 3 in “Appendix IA – Accountants’ Report on the Cheung Kong Property Group” and Note 5
in “Appendix IB – Accountants’ Report on the Hutchison Property Group” for a reconciliation of profit
contribution results with the combined income statements for the Cheung Kong Property Group and the
Hutchison Property Group, respectively. This non-IFRS measure is used by the management of the
Cheung Kong Property Group and the Hutchison Property Group, respectively, to evaluate their
respective financial performance, and it is considered by them to be an important performance measure
which is used in the Cheung Kong Property Group’s and the Hutchison Property Group’s internal
financial and management reporting to manage their respective business performance. This measure is
not identified as an accounting measure under IFRS and should not be considered as an alternative to
the Cheung Kong Property Group’s and the Hutchison Property Group’s results of operations, which are
determined in accordance with IFRS. Further, it may not be comparable to other similarly titled
measures of other companies.
– 183 –
FINANCIAL INFORMATION
OVERVIEW
The Group is one of Hong Kong’s largest property developers with a leading market share in
Hong Kong, strong penetration in the PRC and an international presence through its operations in
Singapore and the United Kingdom. The Company’s predecessor Cheung Kong became listed in Hong
Kong in 1972 and the Group benefits from a long and successful track record of over 40 years.
As at 31 December 2014, the Group held a total attributable interest in approximately 1.6 million
sq.m. of rental properties, approximately 15.8 million sq.m. (of which approximately 14.5 million sq.m.
are located in the PRC) of development land bank and more than 14,600 hotel rooms and also managed
approximately 21 million sq.m. of properties in Hong Kong and the PRC. As at 28 February 2015, the
Group’s properties that were valued by the Property Valuers (as set out in “Appendix III – Property
Valuation”) had a total value of approximately HK$420.1 billion. The property interests of the Group
that were not valued by the Property Valuers included agricultural land lots held by the Cheung Kong
Property Group with an aggregate net book value of approximately HK$1.1 billion as at 31 December
2014.
For the years ended 31 December 2012, 2013 and 2014, the Cheung Kong Property Group’s
turnover amounted to HK$19,192 million, HK$17,011 million and HK$24,038 million, respectively,
while its profit for the year amounted to HK$17,063 million, HK$14,424 million and HK$17,316
million, respectively. For the same period, the Hutchison Property Group’s turnover amounted to
HK$6,237 million, HK$6,676 million and HK$6,901 million, respectively, while its profit for the year
amounted to HK$8,478 million, HK$9,392 million and HK$35,959 million, respectively. During the
Track Record Period, both the Cheung Kong Property Group and the Hutchison Property Group also
conducted property sales and other property businesses through joint ventures. Assuming completion of
the Hutchison Proposal, the Property Businesses Combination (including the consolidation of joint
ventures) and the Spin-off as if the Listing had taken place on 1 January 2014, pro forma turnover of
the Group would have amounted to HK$46,606 million and pro forma profit for the year of the Group
would have amounted to HK$54,052 million for the period ended 31 December 2014.
SIGNIFICANT
OPERATIONS
FACTORS
AFFECTING
COMPARABILITY
OF
OUR
RESULTS
OF
Proposed Combination and Consolidation of Joint Ventures
Immediately following completion of the Property Businesses Combination, the Group will hold
the property businesses of the Cheung Kong Property Group and the Hutchison Property Group.
Historically, the Cheung Kong Property Group and the Hutchison Property Group have been managed
and operated largely independently of each other. Many of their development projects in the PRC were
conducted through joint ventures that were not consolidated in either company’s financial statements. In
particular, the Cheung Kong Property Group and the Hutchison Property Group historically did not
consolidate their joint ventures’ turnover under the relevant IFRS accounting rules, and profits
contributed by their joint ventures were historically recorded as share of their respective profits from
joint ventures. Immediately following completion of the Property Businesses Combination, a substantial
portion of the joint ventures between the Cheung Kong Property Group and the Hutchison Property
Group will become subsidiaries of the Company and be consolidated into the financial statements of the
Group. The financial information of the remaining non-consolidated joint ventures will continue to be
recorded as share of net profits from joint ventures under the equity method of accounting. As a result,
the historical financial statements of the Cheung Kong Property Group and the Hutchison Property
Group are not directly comparable to the future financial statements of the Group immediately
– 184 –
FINANCIAL INFORMATION
following completion of the Property Businesses Combination, which will contain the results of
operations, financial position and cash flows of the Combined Property Businesses and the joint
ventures that will become subsidiaries of the Company as prepared and presented on a consolidated
basis. The historical results of the Cheung Kong Property Group and the Hutchison Property Group
presented below and in the Accountants’ Reports in Appendices IA and IB therefore will not be
comparable to, or be reflective of, the Group’s results after the combination of the property businesses.
We have prepared and included unaudited pro forma financial information in Appendix II in order to
illustrate the financial results of the Group had the Listing been completed as at 1 January 2014.
However, this information is hypothetical in nature.
Loan Facilities, Loan Consolidation and Finance Costs
The Group has entered into two loan facilities in the aggregate amount of no less than HK$55
billion or its equivalent with a group of lenders (being the Loan Facilities). The proceeds of the Loan
Facilities will be used to settle the Specified Loans Promissory Note that will be issued by the
Company to CKH Holdings in the principal amount of HK$55 billion. The Specified Loans Promissory
Note is to be settled on or before the fifth business day following the date of completion of the
assignment of the Specified Loans (which comprise interest-bearing loans due to the Cheung Kong
Group or the Hutchison Group), which will be the Listing Date.
In addition to paying CKH Holdings the proceeds of the Loan Facilities to settle the Specified
Loans Promissory Note, the Company will also issue to CKH Holdings an additional promissory note
with a principal amount equal to the aggregate consideration for the Reorganisation Agreement
Transactions in connection with the Property Businesses Combination (referred to in “History and
Reorganisation – The Reorganisation”). The debt due from CK Property to CKH Holdings pursuant to
such promissory note will be settled by the Company issuing one Share to CKH Holdings, credited as
fully paid at a premium. As a result, the amounts due to the Combined Non-Property Businesses that
are of a non-trade nature will be settled immediately following completion of the Property Businesses
Combination. Other than the amounts due from the CPB Specified Companies (being the entities in
which the Cheung Kong Property Group and the Hutchison Property Group will continue to hold shares
pending the Third Party Consents being obtained) to the Group, there will be no amount which is of a
non-trade nature due to the Group from the Combined Non-Property Businesses immediately before and
upon completion of the Property Businesses Combination.
Immediately following completion of the Property Businesses Combination, the Group will also
consolidate a substantial portion of the joint ventures’ loans into its balance sheet. Based on the pro
forma balances as at 31 December 2014, the net amount due to the Combined Non-Property Businesses
of HK$81,725 million, which results from (i) amounts due from the Combined Non-Property Businesses
of HK$49,077 million, (ii) amounts due to the Combined Non-Property Businesses of HK$101,492
million and (iii) loans from the Combined Non-Property Businesses of HK$29,310 million, will be
partially settled by the Specified Loans Promissory Note upon completion of the Property Businesses
Combination. The Specified Loans Promissory Note will, in turn, be settled by cash upon drawdown of
the Loan Facilities. The remaining balance of HK$26,725 million, together with the consideration for
the CPB Companies Share Reorganisation, will be settled by another promissory note, which, in turn,
will be settled by the Company issuing one Share to CKH Holdings, credited as fully paid at a
premium. For further details of the settlement arrangement, please refer to “History and Reorganisation
– The Reorganisation – Property Businesses Combination”.
– 185 –
FINANCIAL INFORMATION
The net effect is the Group’s overall indebtedness level and its finance costs and interest payments
are expected to be lower immediately following the Listing than they were prior to completion of the
Property Businesses Combination primarily because of the settlements of the amounts due to the
Non-Property Businesses.
Cost Structure
The Company’s cost structure following the Listing will be different from the historical cost
structure for the Cheung Kong Property Group and the Hutchison Property Group. For example, during
the Track Record Period, salaries and related expenses reported on the Cheung Kong Property Group’s
combined income statement covered mainly remuneration paid to employees of hotels and serviced
suites and the property and project management business. The remuneration for most employees of the
property sales and property rental businesses, and the remuneration for directors of Cheung Kong as
regards their performance of services for the Cheung Kong Property Group, were paid by other
members of the Cheung Kong Group. Service fees were paid by the Cheung Kong Property Group to
other members of the Cheung Kong Group to cover these amounts paid and for other support provided
by other members of the Cheung Kong Group to the Cheung Kong Property Group. Conversely, salaries
and related expenses reported on the Hutchison Property Group’s combined income statement included
salaries and other benefits paid to all employees of the Hutchison Property Group (including directors
of the Hutchison Property Group). As a result, the pro forma amounts referred to as salaries and related
expenses will not necessarily provide an accurate illustration of the amount of salaries and related
expenses to be incurred following the Listing.
In addition, the amounts paid by the Cheung Kong Group to the directors of the Cheung Kong
Property Group as regards their performance of services for the Cheung Kong Group (including the
Cheung Kong Property Group) were not specifically allocated between the Cheung Kong Property
Group and the other members of the Cheung Kong Group, and there was no arrangement to recharge
the Cheung Kong Property Group for such expenses. As a result, the remuneration arrangements of the
directors of Cheung Kong Property Group during the Track Record Period will not be representative of
the remuneration that will be paid to the Directors by the Group following the Listing, which will be
costs borne directly by the Group. See “– Description of Selected Components of Combined Income
Statements – Operating Costs” for more details.
SIGNIFICANT FACTORS AFFECTING OUR RESULTS OF OPERATIONS
Our results of operations and financial condition have been, and will continue to be, directly and
indirectly affected by a number of factors, including those set forth below.
General Economic Conditions and Market Cyclicality
Our business is heavily dependent on global financial and economic conditions, and the continued
economic growth and resulting demand for properties in places where we operate, particularly in Hong
Kong and the PRC. For the years ended 31 December 2012, 2013 and 2014, approximately 61.6%,
46.0% and 76.9%, respectively, of the Cheung Kong Property Group’s turnover and its share of
property sales of joint ventures was derived from Hong Kong, and 38.4%, 50.9% and 19.2%,
respectively, of the Cheung Kong Property Group’s turnover and its share of property sales of joint
ventures was derived from the PRC. For the same period, approximately 33.3%, 28.9% and 47.0% of
the Hutchison Property Group’s turnover and its share of property sales of joint ventures was derived
from Hong Kong, and 65.4%, 65.6% and 42.1%, respectively, of the Hutchison Property Group’s
turnover and its share of property sales of joint ventures was derived from the PRC.
– 186 –
FINANCIAL INFORMATION
The key macroeconomic factors that we consider to be important to our operations include general
economic development, continued growth of the private sector and government policies, including
monetary policies. Economic growth boosts the general level of disposable income and the number of
middle to upper-middle income households in Hong Kong and the PRC. Economic growth and the
urbanisation of the PRC in particular have had a significant impact on the PRC property markets,
including the cities and regions where we operate, and have affected the supply of and demand for
properties as well as property pricing trends. Consumer spending power and confidence and the level of
business activities have also affected rental income from our investment properties and income from
our hotels and serviced suites. We expect the demand for our properties and our operating results to
continue to be affected by macroeconomic conditions, the growth of the economies in the regions where
we operate and global economic uncertainties.
Moreover, the Hong Kong, PRC and international property markets have historically been cyclical.
Typically, periods of high economic growth are accompanied by higher selling prices or higher rental
rates when compared to the prior selling prices or rental rates for a particular property. The opposite
typically occurs during periods of slower economic growth or significant market disruptions. With
respect to our development properties, although we aim to limit our market risk exposure by pre-selling
a portion of our properties before they are completed, we are still subject to a certain level of risk
based on fluctuations in the economy that affect the selling prices and timing of sales of our properties.
With respect to our rental properties, as lease terms and the periods between rental reviews typically
are several years or more, rental rates on individual premises are locked in for several years at a level
which may diverge from the prevailing market rate for similar premises during the period until the
lease expires or until the next rental review.
Regulatory Environment and Measures Affecting the Property and Hotel Industries
Our business has been, and will continue to be, affected by the regulatory environment in places
where we operate, including, specifically, policies and measures taken by the Hong Kong and PRC
governments with respect to the property and hotel industries.
Hong Kong
The Hong Kong government has recently implemented a series of policies and regulations to slow
down the residential property market and inflation of property prices, as well as to dampen property
speculation. These policies and regulations include, but are not limited to, increased mortgage down
payments, additional stamp duties on property sales, supply of land controls, restrictions on property
financing, building regulations, suspension of the Capital Investment Entrant Scheme (an immigration
scheme which allows an individual to gain residency status in Hong Kong through capital investments)
and other fiscal policies. In addition, it has recently stated that it intends to speed up the development
of public housing and public rental housing (“PRH”) and make available a number of Home Ownership
scheme flats, subsidised sales flats and PRH for sale. Measures have also been implemented by other
regulatory bodies in Hong Kong including the Hong Kong Monetary Authority. Moreover, the Hong
Kong and PRC governments may change laws and regulations which limit the number of daily PRC
travellers allowed to travel to Hong Kong. Doing so may also materially and adversely affect the
occupancy rates or daily room rates of our hotels and serviced suites. Any of the foregoing events
could in turn affect our results of operations and financial condition. For example, the Cheung Kong
Property Group recorded a decrease in contracted sales in Hong Kong in 2013 primarily as a result of
new government regulations and measures. See “Industry Overview”, “Appendix IV – Regulatory
– 187 –
FINANCIAL INFORMATION
Overview” and “Risk Factors – Risks Relating to the Property and Hotel Industries – Our business is
subject to government policies and regulations, and in particular, we are susceptible to changes in
policies related to the Hong Kong property industry and the hotel industry” for more details.
PRC
In recent years, the PRC government has also implemented a series of measures to constrain the
perceived over-heating in the real estate market by taking various restrictive measures to discourage
speculation, including regulating, among other things, land grants, pre-sales of properties, bank
financing, mortgages and taxation. For example, policies implemented by the PRC government
increasing the minimum down payment for residential properties and tightening liquidity in the market
have impacted our sales activities in the PRC. Starting from December 2009, the PRC government has
adjusted some of its policies in order to prevent the prices of properties from rapidly increasing,
especially in certain developed cities, including the introduction of home purchase restriction policies
which apply various restrictions to purchasers, higher minimum down payments requirements, mortgage
and construction loan interest rates adjustments and the introduction of new property tax schemes in
certain cities. Measures taken by the PRC government to control the money supply, credit availability,
interest rate and fixed asset investment also have an impact on our business. For example, the joint
ventures of both the Cheung Kong Property Group and the Hutchison Property Group recorded lower
property sales volume with lower selling prices in certain cities in the PRC in 2014, which was in part
due to government regulations and measures in the PRC. Furthermore, recent austerity measures that
aim at minimising extravagant spending by PRC government officials and reducing bureaucratic visits
and meetings have negatively impacted the hotel, travel and tourism industries in the PRC, including
our hotel business in the PRC. See “Industry Overview”, “Appendix IV – Regulatory Overview” and
“Risk Factors – Risks Relating to the Property and Hotel Industries – Our business in the PRC is
subject to extensive government regulations, and the PRC government may introduce further measures
to curtail growth in the property sector” for more details.
The policies of the governments in the regions where we operate have led, and may continue to
lead to, changes in market conditions, including changes in property prices, costs of ownership, costs of
development and the balance of supply and demand with respect to our properties, hotels and serviced
suites. Furthermore, the adoption of more restrictive policies in the future may also lead to downturns
in the real estate and hotel industries in the regions where we operate and have a significant impact on
our business and results of operations.
Business Mix
We derive a significant portion of our turnover from sales of properties. We also retain a number
of properties as investment properties to generate rental income and to enjoy the benefit of any
appreciation in property value. In addition, we generate turnover from our hotels and serviced suites
and property and project management businesses. See “− Description of Selected Components of
Combined Income Statements − Turnover”.
– 188 –
– 189 –
(1)
Notes:
(HK$
million)
394
100.0 32,312
38.2 15,301
61.8 17,011
1.1
47.1 12,288
6.0 1,961
7.6 2,368
(%)
2013
(HK$
million)
528
6,959
100.0 30,997
47.4
52.6 24,038
1.2
38.0 19,389
6.1 1,908
7.3 2,213
(%)
2014
6,237
698
−
3,318
2,221
(HK$
million)
100.0 18,042
22.4 11,805
77.6
1.7
62.6
6.2
7.1
(%)
2012
6,676
798
−
3,682
2,196
(HK$
million)
100.0 21,909
65.4 15,233
34.6
3.9
−
18.4
12.3
(%)
2013
6,845
6,901
676
−
3,995
2,230
(HK$
million)
2014
100.0 13,746
69.5
30.5
3.7
−
16.8
10.0
(%)
Year ended 31 December
Year ended 31 December
542
–
100.0 46,606
49.8
50.2 46,606
4.9
(%)
100.0
–
100.0
1.2
72.3
14.6
11.9
(unaudited)
(HK$
million)
− 33,679
29.1 6,821
16.2 5,564
(%)
2014
Year ended
31 December
Group pro forma
Total represents the sum of the turnover of (i) the Cheung Kong Property Group or the Hutchison Property Group (as the case may be) and (ii) their respective share of property
sales of joint ventures. This non-IFRS measure is used by the management of the Cheung Kong Property Group and the Hutchison Property Group, respectively, to evaluate their
respective financial performance, and it is considered by them to be an important performance measure which is used in the Cheung Kong Property Group’s and the Hutchison
Property Group’s internal financial and management reporting to manage their respective business performance. This measure is not identified as an accounting measure under
IFRS and should not be considered as an alternative to the Cheung Kong Property Group’s and the Hutchison Property Group’s respective turnover, which is determined in
accordance with IFRS.
31,038
11,846
Share of property sales of
joint ventures . . . . . . . .
..............
19,192
Cheung Kong Property
Group Turnover/
Hutchison Property
Group Turnover/
Group pro forma . . . . .
Total
361
.
(1)
14,614
1,867
2,350
.
.
.
Property sales . . . . . . . . .
Property rental . . . . . . . .
Hotels and serviced suites
Property and project
management . . . . . . . .
(HK$
million)
2012
Hutchison Property Group
Cheung Kong Property Group
The following table sets out a breakdown by operating activity of (i) the Cheung Kong Property Group’s turnover and its share of property
sales attributable to its interests in joint ventures, (ii) the Hutchison Property Group’s turnover and its share of property sales attributable to its
interests in joint ventures and (iii) unaudited pro forma turnover information of the Group on a combined basis, in each case for the periods
indicated.
FINANCIAL INFORMATION
169
.
– 190 –
(1)
Note:
(HK$
million)
179
100.0 13,740
1.2
74.6 10,172
14.9 2,117
9.3 1,272
(%)
2013
215
8,501
2,069
1,227
(HK$
million)
100.0 12,012
1.3
74.0
15.4
9.3
(%)
2014
43
6,219
3,340
940
(HK$
million)
100.0 10,542
1.8
70.8
17.2
10.2
(%)
2012
13
6,039
3,721
937
(HK$
million)
100.0 10,710
0.4
59.0
31.7
8.9
(%)
2013
100.0
0.1
56.4
34.7
8.8
(%)
2014
6,788
(42)
1,903
3,978
949
(HK$
million)
Year ended 31 December
Year ended 31 December
175
100.0 18,964
(0.6)
(%)
100.0
0.9
55.9
31.7
11.5
(unaudited)
(HK$
million)
28.0 10,602
58.6 6,002
14.0 2,185
(%)
2014
Year ended
31 December
Group pro forma
Profit contribution represents earnings before interest, taxes, changes in fair value of investment properties, investment and finance income and profit on disposal of investments
and others. This non-IFRS measure is used by the management of the Cheung Kong Property Group and the Hutchison Property Group, respectively, to evaluate their respective
financial performance, and it is considered by them to be an important performance measure which is used in the Cheung Kong Property Group’s and the Hutchison Property
Group’s internal financial and management reporting to manage their respective business performance. This measure is not identified as an accounting measure under IFRS and
should not be considered as an alternative to the Cheung Kong Property Group’s and the Hutchison Property Group’s results of operations, which are determined in accordance
with IFRS. Further, it may not be comparable to other similarly titled measures of other companies.
13,297
9,916
1,979
1,233
.
.
.
Total . . . . . . . . . . . . . . . .
Property sales . . . . . . . . .
Property rental . . . . . . . .
Hotels and serviced suites
Property and project
management . . . . . . . .
(HK$
million)
2012
Hutchison Property Group
Cheung Kong Property Group
The following table sets out a breakdown by operating activity of (i) the Cheung Kong Property Group’s profit contribution, (ii) the Hutchison
Property Group’s profit contribution and (iii) unaudited pro forma profit contribution information of the Group on a combined basis, in each case for
the periods indicated.
FINANCIAL INFORMATION
FINANCIAL INFORMATION
As a result, our results of operations, including our operating profit margin in particular, and the
sources of and amount of cash generated from operations, have varied and may continue to vary
significantly from period to period depending on the mix of our turnover from property sales, property
rental, hotels and serviced suites and property and project management. In general, sales of properties
produce relatively larger amounts of, or fluctuations in, turnover, while property rentals generate
relatively steady recurring income. Our property sales are affected by many factors, including the
general performance of the real estate markets in the areas where we operate, measures by the relevant
governments to restrict or encourage the growth of the property market, supply of and demand for
properties and general consumer sentiment. We seek to proactively plan and manage the relative growth
of our property sales, property rentals, hotels and serviced suites and property and project management
in order to achieve and maintain a desirable turnover mix from our business segments. Accordingly, our
turnover and results of operations may vary from period to period depending on the type of properties
we sell or lease out and the source of our income.
Project Development Schedules
The number of property development projects that a developer can undertake during any particular
period is limited due to substantial capital requirements for land acquisition and construction costs, as
well as limited land supply. The development of a property project will take a certain period of time
before the commencement of pre-sales. Although the pre-sales of a property generate positive cash
flows for us in the period in which they are made, no turnover is recognised in respect of the pre-sale
of a property until its development has been completed, the relevant occupation permit or completion
permit has been issued by the relevant authorities, the economic benefit has accrued to us and the
significant risks and rewards of the properties have passed to the purchasers. As a result, our cash flows
and results of operations may vary from period to period depending on the properties pre-sold/sold and
delivered, as well as the average selling price, in the relevant period. In addition, delays in
construction, regulatory approvals and other processes may adversely affect the timetables of our
projects, which may in turn delay our pre-selling and delivery schedule and ultimately impact the
timing of our turnover recognition. As a result of our property development schedules, our turnover,
cash flow and results of operations have fluctuated in the past and are likely to continue to fluctuate in
the future.
– 191 –
FINANCIAL INFORMATION
During the Track Record Period, the Cheung Kong Property Group and its joint ventures primarily
generated turnover from property sales, and the Hutchison Property Group primarily conducted sales of
properties through its joint ventures. The following table sets out a breakdown of the Cheung Kong
Property Group’s turnover from recognised sales of properties during the Track Record Period:
Cheung Kong Property Group
Year ended 31 December
2012
2013
2014
...............
...............
...............
13,044
158,401
82,348
9,271
133,153
69,627
19,112
166,098
115,065
...............
...............
...............
−
−
−
420
11,827
35,512
−
−
−
...............
1,570
632
277
...............
...............
...............
−
–
–
1,965
73,288
26,812
−
–
–
Total turnover (HK$ million). . . . . . . . . . . . . . . . . . . .
14,614
12,288
19,389
Subsidiaries
Hong Kong
Residential
Turnover (HK$ million) . . . . . . .
Recognised saleable area (sq.m.). .
Average selling price (HK$/sq.m.)
Commercial
Turnover (HK$ million) . . . . . . .
Recognised saleable area (sq.m.). .
Average selling price (HK$/sq.m.)
Others
Turnover (HK$ million) . . . . . . .
PRC and others
Turnover (HK$ million) . . . . . . .
Recognised saleable area (sq.m.). .
Average selling price (HK$/sq.m.)
– 192 –
FINANCIAL INFORMATION
The following table sets out a breakdown of the Cheung Kong Property Group’s share of property
sales of joint ventures and a breakdown of the Hutchison Property Group’s share of property sales of
joint ventures based on recognised sales of properties for the Track Record Period:
Cheung Kong Property Group
Hutchison Property Group
Year ended 31 December
2012
Attributable interests in joint
ventures
Hong Kong
Turnover (HK$ million) . . .
PRC . . . . . . . . . . . . . . . .
Residential
Turnover (HK$ million) . . .
Recognised saleable area
(sq.m.) . . . . . . . . . . . .
Average selling price
(HK$/sq.m.) . . . . . . . . .
Commercial
Turnover (HK$ million) . . .
Recognised saleable area
(sq.m.) . . . . . . . . . . . .
Average selling price
(HK$/sq.m.) . . . . . . . . .
Others
Turnover (HK$ million) . . .
Others
Turnover (HK$ million) . . .
Total share of property sales
of joint ventures
(HK$ million) . . . . . . . . .
2013
Year ended 31 December
2014
2012
2013
2014
229
75
18
221
75
−
10,066
10,866
5,093
10,038
10,830
4,991
576,401
654,132
286,807
576,091
654,115
286,637
17,464
16,611
17,758
17,423
16,556
17,413
1,439
3,140
507
1,414
3,102
480
51,645
66,953
13,993
50,937
65,715
13,246
27,863
46,899
36,232
27,760
47,211
36,223
112
240
131
116
246
135
–
980
1,210
16
980
1,239
11,846
15,301
6,959
11,805
15,233
6,845
For the years ended 31 December 2012, 2013 and 2014, profit before taxation of the Cheung
Kong Property Group amounted to HK$18,313 million, HK$15,866 million and HK$18,940 million,
respectively, and profit before taxation of the Hutchison Property Group amounted to HK$8,903
million, HK$10,055 million and HK$36,844 million, respectively. For illustrative purposes only, the
following table sets out a sensitivity analysis of changes in the average selling price of properties on
profit before taxation of the Cheung Kong Property Group and the Hutchison Property Group during
the Track Record Period, assuming all other variables were held constant.
Changes in Profit Before Taxation
Cheung Kong Property Group
Changes in
Average Selling
Price
+10% . . . . . . .
-10% . . . . . . .
Hutchison Property Group
Year ended 31 December
Year ended 31 December
2012
2013
2014
2012
2013
2014
(HK$
million)
(HK$
million)
(HK$
million)
(HK$
million)
(HK$
million)
(HK$
million)
2,646.0
(2,646.0)
2,758.9
(2,758.9)
2,634.8
(2,634.8)
– 193 –
1,180.5
(1,180.5)
1,523.3
(1,523.3)
684.5
(684.5)
FINANCIAL INFORMATION
The following table sets out a breakdown of the Cheung Kong Property Group’s contracted sales
of properties during the Track Record Period:
Cheung Kong Property Group
Year ended 31 December
2012
2013
2014
(HK$
million)
(HK$
million)
(HK$
million)
Subsidiaries
Hong Kong
Residential . . . . . . . . . . . . . . . . . . . . . . . . . . . . . . . .
Commercial. . . . . . . . . . . . . . . . . . . . . . . . . . . . . . . .
Others . . . . . . . . . . . . . . . . . . . . . . . . . . . . . . . . . . .
PRC and others
18,653
–
1,393
3,946
420
630
16,631
149
184
Residential . . . . . . . . . . . . . . . . . . . . . . . . . . . . . . . .
3,269
1,384
973
Total . . . . . . . . . . . . . . . . . . . . . . . . . . . . . . . . . . . . . .
23,315
6,380
17,937
The following table sets out a breakdown of the Cheung Kong Property Group’s share of
contracted property sales of joint ventures and a breakdown of the Hutchison Property Group’s share of
contracted property sales of joint ventures for the Track Record Period:
Cheung Kong Property Group
Hutchison Property Group
Year ended 31 December
Year ended 31 December
2012
2013
2014
2012
2013
2014
(HK$
million)
(HK$
million)
(HK$
million)
(HK$
million)
(HK$
million)
(HK$
million)
Attributable Interests in Joint
Ventures
Hong Kong
Residential . . . . . . . . . . .
Others . . . . . . . . . . . . . .
PRC
80
47
76
–
–
18
184
36
75
–
–
–
Residential . . . . . . . . . . .
Commercial . . . . . . . . . . .
Others . . . . . . . . . . . . . .
Others
11,123
1,547
112
11,122
2,827
240
5,980
902
135
11,120
1,530
111
11,122
2,788
239
5,980
878
131
Residential . . . . . . . . . . .
206
88
22
–
57
22
Total. . . . . . . . . . . . . . .
13,115
14,353
7,057
12,981
14,281
7,011
Access to and Cost of Financing
Advances from their former parent groups and cash generated from operations have historically
been the main sources of funding for the property businesses of the Cheung Kong Property Group and
the Hutchison Property Group. The Hutchison Property Group has also used bank borrowings as a
source of funding. Prior to the Listing, the Cheung Kong Property Group and the Hutchison Property
Group centralised their cash management at their respective former parent groups (namely, the Cheung
Kong Group and the Hutchison Group). This centralised cash management included advances from their
respective former parent groups and transfers of income from operations from the Cheung Kong
Property Group and the Hutchison Property Group to their respective former parent groups.
– 194 –
FINANCIAL INFORMATION
As at 31 December 2012, 2013 and 2014, amounts due to the Cheung Kong Group amounted to
HK$91,903 million, HK$79,891 million and HK$70,707 million, respectively (after taking into account
amounts due from the Cheung Kong Group, net amounts due to the Cheung Kong Group amounted to
HK$89,997 million, HK$78,916 million and HK$69,497 million, respectively). As at the same dates,
amounts due to the Cheung Kong Group of HK$53,238 million, HK$46,803 million and HK$43,620
million, respectively, bore interest at an average rate of 2.2%, 2.5% and 2.5%, respectively. The
remaining portions of amounts due to the Cheung Kong Group were unsecured, interest-free and had no
fixed terms of repayment. For the years ended 31 December 2012, 2013 and 2014, the Cheung Kong
Property Group’s total interest expense on borrowings and net amounts due to the Cheung Kong Group
were HK$650 million, HK$776 million and HK$815 million, respectively.
As at 31 December 2012, 2013 and 2014, amounts due to the Hutchison Group amounted to
HK$55,850 million, HK$51,332 million and HK$57,100 million, respectively (after taking into account
amounts due from the Hutchison Group, net amounts due to the Hutchison Group amounted to
HK$23,249 million, HK$10,741 million and HK$9,233 million, respectively). As at the same dates,
amounts due to the Hutchison Group of HK$27,407 million, HK$27,404 million and HK$26,609
million, respectively, bore interest at an average rate of 4.0%, 4.1% and 4.6%, respectively. The
remaining portions of amounts due to the Hutchison Group were unsecured, interest-free and had no
fixed terms of repayment. For the years ended 31 December 2012, 2013 and 2014, the Hutchison
Property Group’s total interest expense on bank and other borrowings and net amounts due to the
Hutchison Group were HK$1,094 million, HK$1,099 million and HK$1,222 million, respectively.
Going forward, we will fund our operations primarily from cash generated from operations, bank
borrowings and funding raised from the capital markets. Taking into account the Loan Facilities and the
consolidation of the joint ventures’ loans into the Company’s balance sheet upon completion of the
Property Businesses Combination, the net effect is that the Group’s overall indebtedness level and its
finance costs and interest payments are expected to be lower immediately following the Listing than
they were prior to completion of the Property Businesses Combination.
In addition, our access to capital and cost of financing may be affected by restrictions imposed on
bank lending for property developments by the relevant governments in the jurisdictions where our
property projects are located. For example, the PRC government from time to time has imposed
restrictions on bank lending for property development. To the extent the PRC government or other
governments in the jurisdictions where we operate slow down the development of the private property
sector, either by restricting loans to the sector or by increasing lending rates to the sector, our access to
capital and cost of financing may be adversely affected. As such, any increase in interest rates offered
to us, together with the general availability of credit, may significantly impact our property
development business.
Land Acquisition Costs, Construction Costs and Related Costs
Land acquisition costs, construction costs and related costs such as labour costs constitute a
substantial portion of our costs and have had, and will continue to have, a significant impact on our
business and results of operations. Land acquisition costs have generally been increasing over the years
and are expected to continue to rise, particularly in Hong Kong and the PRC, as competition in the
property market continues to intensify for the limited amount of undeveloped land. In certain areas
where we operate, particularly in fast-developing cities, the relevant government policies relating to
urban and rural planning and development, land supply policies and implementation measures may
further intensify competition for undeveloped land and increase our land acquisition costs. Moreover,
– 195 –
FINANCIAL INFORMATION
other policies relating to land, housing, conveyance and property taxes implemented by the relevant
local governments in the areas where we operate, as well as the general market sentiment, may also
affect land acquisition prices.
The construction and related costs of our properties vary according to the GFA and the height of
the buildings, the geology of the construction sites, as well as the use and price of certain key
construction materials, such as steel and cement. In recent years, construction material costs and labour
costs have generally been on the rise in Hong Kong and the PRC due to inflation, government policies
and increased competition for labour from Macau. Costs for construction materials and construction
labour for a property development project are generally specified and included in the contractor fees
agreed between us and our general contractors. While we aim to manage our costs efficiently through
our cost control measures and procurement and bidding procedures, we are subject to fee quotes from
contractors and increases in construction and labour costs, which will likely prompt our contractors to
increase their fee quotes for new property development projects in the future. We expect our property
development costs to continue to be influenced by fluctuations in the cost of land and construction
materials and the rise in labour costs for our property developments.
Fair Value of Our Investment Properties
Property values are affected by, among other factors, supply of and demand for comparable
properties, the rate of economic growth, interest rates, inflation, political and economic developments,
construction costs and the timing of the development of properties. We report our investment properties
at fair value on our statements of financial position as non-current assets as at each financial statement
date based on the valuations prepared by independent property valuers, and record changes in fair value
in our combined income statement. See “– Description of Selected Components of Combined Income
Statements – Increase in Fair Value of Investment Properties”. Property valuation involves the exercise
of professional judgment and requires the use of certain bases and assumptions. The fair value of our
investment properties may be higher or lower if the valuers use a different set of bases and assumptions
or if the valuation is conducted by another qualified independent professional valuer using the same or
a different set of bases and assumptions. Furthermore, property values are also affected by market
fluctuations. For example, the increase in fair value of the Hutchison Property Group’s investment
properties, which increased significantly by HK$28,071 million to HK$28,088 million in 2014 from
HK$17 million in 2013, was due to an improvement in market conditions in 2014 as the result of high
global liquidity and easing of investor concerns over a potential increase in interest rates, which
boosted the overall investor confidence and sentiment. As a result of the change in market conditions,
the independent property valuers changed certain assumptions used to value the investment properties,
including reducing the weighted average capitalisation rate used from 8.7% as at 31 December 2013 to
6.1% as at 31 December 2014.
As at 31 December 2012, 2013 and 2014, the fair value of the Cheung Kong Property Group’s
investment properties amounted to HK$29,656 million, HK$28,777 million and HK$33,285 million,
respectively, and the fair value of the Hutchison Property Group’s investment properties amounted to
HK$45,983 million, HK$44,717 million and HK$72,905 million, respectively. For the years ended 31
December 2012, 2013 and 2014, the Cheung Kong Property Group recorded increases in fair value of
investment properties of HK$4,470 million, HK$1,782 million and HK$4,542 million, respectively, and
the Hutchison Property Group recorded increases in fair value of investment properties of HK$859
million, HK$17 million and HK$28,088 million, respectively. The fair value of each of the investment
properties has fluctuated, and is likely to continue to fluctuate, in accordance with the prevailing
property market conditions.
– 196 –
FINANCIAL INFORMATION
Gains or losses arising from changes in the fair value of our investment properties may have a
substantial effect on our profits. Any decrease in the fair value of our investment properties will
adversely affect our profitability. In addition, increases in the fair value of investment properties are
unrealised and do not generate any cash inflow to us until such investment properties are disposed of.
We may therefore experience higher profitability through increases in the fair value of investment
properties without a corresponding improvement to our cash position. We cannot assure you that levels
of increases in the fair value of investment properties similar to those recognised during the Track
Record Period can be sustained in the future or that the values will not fall, or that any disposals of
investment properties will occur at prices similar to the valuations.
Rental Rates, Room Rates and Occupancy Trends
Our rental income depends principally on our rental rates and occupancy rates. Factors affecting
our rental rates include the supply of comparable properties, the overall demand in the market, the floor
area occupied by individual tenants, the trade sectors in which our tenants operate, general
macroeconomic conditions (including inflation rates) and occupancy rates. In addition, occupancy rates
largely depend on rental rates at competing properties, the supply and demand for comparable
properties and the ability to minimise the intervals between lease expiries (or terminations) and the
entry into new leases. In addition, occupancy rates of a new property tend to be lower during the initial
ramp-up stage and subsequent renovation period.
Lease terms for our investment properties vary based on the type of properties and the
geographical location. In Hong Kong and the PRC, lease terms for our office and commercial properties
are generally for two to three years. The lease terms for material tenancies generally vary from six to
twelve years for office properties and between three to ten years for commercial properties. The rental
rates are generally reviewed and adjusted every three years based on relevant market rates.
As at 31 December 2014, the Cheung Kong Property Group’s investment property portfolio
primarily comprised office, retail and industrial properties and car park spaces in Hong Kong, and also
included interests in a number of joint venture commercial developments in Hong Kong, the PRC and
the United Kingdom. As at the same date, the Hutchison Property Group’s investment property portfolio
primarily comprised office, commercial, industrial and residential properties and car park spaces in
Hong Kong, and also included interests in a number of joint venture developments in Hong Kong, the
PRC and the United Kingdom.
The following table sets out the GFA, LFA, average rental rate and average occupancy rate of the
Cheung Kong Property Group’s and the Hutchison Property Group’s investment properties for the Track
Record Period:
(1)
GFA (sq.m.)
...........
LFA (sq.m.)(1) . . . . . . . . . . . .
Average rental rate
(HK$/sq.m.)(2) . . . . . . . . . .
Average occupancy rate (%)(3)
Cheung Kong Property Group(4)(5)
Hutchison Property Group(4)
Year ended 31 December
Year ended 31 December
2012
2013
.
.
170,252
172,423
170,252
172,475
.
.
767.9
94
852.0
93
– 197 –
2014
2012
2013
2014
170,252 1,108,238 1,094,933 1,094,500
172,476 981,316 967,337 964,021
897.4
95
282.0
97
312.5
97
342.4
97
FINANCIAL INFORMATION
Notes:
(1)
The data indicates the GFA and LFA as at the end of each period.
(2)
Calculated by dividing the average monthly rental income by the average monthly area leased.
(3)
Calculated by dividing the average monthly area leased by the average monthly LFA.
(4)
The above data excludes data relating to car park spaces.
(5)
The LFA is higher than the GFA primarily due to the common area and the curtain wall area which are included in
the LFA but not in the GFA.
For the years ended 31 December 2012, 2013 and 2014, profit before taxation of the Cheung
Kong Property Group amounted to HK$18,313 million, HK$15,866 million and HK$18,940 million,
respectively, and profit before taxation of the Hutchison Property Group amounted to HK$8,903
million, HK$10,055 million and HK$36,844 million, respectively. For illustrative purposes only, the
following table sets out a sensitivity analysis of changes in rental income on profit before taxation of
the Cheung Kong Property Group and the Hutchison Property Group during the Track Record Period,
assuming all other variables were held constant.
Changes in Profit Before Taxation
Cheung Kong Property Group
Changes in Rental
Income
+10% . . . . . . .
-10% . . . . . . .
Hutchison Property Group
Year ended 31 December
Year ended 31 December
2012
2013
2014
2012
2013
2014
(HK$
million)
(HK$
million)
(HK$
million)
(HK$
million)
(HK$
million)
(HK$
million)
186.7
(186.7)
196.1
(196.1)
190.8
(190.8)
331.8
(331.8)
368.2
(368.2)
399.5
(399.5)
The daily room rates of our hotels and rental rates of our serviced suites are influenced by a
variety of factors, including the rates charged by our competitors and the supply of hotels and serviced
suites in the market, the attractiveness of our hotels and serviced suites’ locations, the breadth and
quality of services provided, hotel and serviced apartment industry trends, the development of tourism
and business activities in the places that we operate, seasonality and general economic conditions. A
shortage of rooms in the market will often have the effect of increasing daily room rates and rental
rates as hotels and serviced suites increase their rates in response to demand, whereas an oversupply of
rooms will often have the opposite effect. The occupancy rates of our hotels and serviced suites will be
in part determined by the level of our daily room rates and rental rates and our ability to minimise the
period of time between customers during which rooms are unoccupied.
– 198 –
FINANCIAL INFORMATION
The following table sets out the number of rooms, average room rate, average occupancy rate and
RevPAR of the Cheung Kong Property Group’s hotels and serviced suites and the Hutchison Property
Group’s hotels and serviced suites for the Track Record Period:
Cheung Kong Property Group
Year ended 31 December
2012
(1)
Number of rooms . . . . . . . .
Average room rate (HK$)(2) . .
Average occupancy rate (%)(3)
RevPAR (HK$)(4) . . . . . . . . .
.
.
.
.
2013
8,432
670
90.0
603
8,397
687
89.2
613
2014
8,406
703
89.8
631
Hutchison Property Group
Year ended 31 December
2012
5,057
1,038
83.8
870
2013
5,057
1,073
80.4
863
2014
5,057
1,059
81.3
861
Note:
(1)
Represents the number of available rooms as individual units at the end of each period.
(2)
Calculated by dividing total room revenue by the total number of room nights occupied during each period.
(3)
Calculated by dividing the total number of room nights occupied by the total number of available room nights
during each period.
(4)
Calculated by dividing total hotel room revenue by the total number of available room nights during each period.
Competition in the Property and Hotel Industries
The property and hotel industries in the regions where we operate are highly competitive. We
compete primarily with other property developers, landlords and hotel operators in Hong Kong and the
PRC, as well as a number of regional and international developers and hotel operators who have
expanded their operations into Hong Kong and the PRC. Our property rental business also faces
competition primarily from properties of a similar grade in their immediate vicinity and also with other
properties in their geographical market. We compete with our competitors across a range of factors,
including location, capital resources, transportation, infrastructure, financial and other incentives,
design, quality of premises, quality of accommodations and amenities, breadth and quality of services
provided, brand recognition, and maintenance and supporting services. We also compete on sales prices,
rental rates, room rates and other terms.
Going forward, competition in the property and hotel industries may intensify as a result of
changing governmental policies, the increasingly limited amount of undeveloped land, the increased
number of hotels in the regions where we operate, changes in local, regional and global market
conditions and changes in the supply and demand for properties and rental rates. Increased competition
may result in increased costs of acquiring land for development, an oversupply of properties in certain
areas in the places where we operate, a decrease in property prices, a slowdown in the rate at which
new property developments will be approved and/or reviewed by the relevant governmental authorities,
an increase in construction costs and difficulties in obtaining high quality contractors and qualified
employees, all of which may adversely affect our business and results of operations. See “Business –
Market and Competition” for further details.
BASIS OF PRESENTATION
As the Cheung Kong Property Group and the Hutchison Property Group have historically been
managed and operated largely independently of each other, the financial statements for the Cheung
Kong Property Group and the Hutchison Property Group have been prepared separately for the Track
– 199 –
FINANCIAL INFORMATION
Record Period and are set out in Appendix IA and Appendix IB, respectively. The historical financial
information for the Cheung Kong Property Group and the Hutchison Property Group represents the
results of operations of the property businesses of the Cheung Kong Property Group and the Hutchison
Property Group and does not reflect the consolidation adjustments the Company will make when it
consolidates the results of the Cheung Kong Property Group and the Hutchison Property Group. We
have prepared and included the unaudited pro forma financial information as at and for the year ended
31 December 2014 as set out in Appendix II for the purpose of illustrating the effect of the completion
of the Hutchison Proposal and the Property Businesses Combination (including consolidation of the
joint ventures that will become subsidiaries of the Company) as if the Listing had taken place on 1
January 2014 for the pro forma combined income statement and statement of cash flows; and 31
December 2014 for the pro forma combined statement of assets and liabilities. The unaudited pro forma
financial information has been prepared in accordance with paragraph 4.29 of the Listing Rules,
incorporating the combined results and cash flows of the Cheung Kong Property Group, the Hutchison
Property Group and the joint ventures that will become subsidiaries of the Company for the year ended
31 December 2014; and the combined assets and liabilities of the Cheung Kong Property Group, the
Hutchison Property Group and the joint ventures that will become subsidiaries of the Company as at 31
December 2014.
For the purposes of the Accountants’ Reports in Appendices IA and IB, the underlying combined
financial statements of the Cheung Kong Property Group and the Hutchison Property Group have been
prepared in accordance with HKFRS. Pursuant to HKFRS, the underlying financial statements of the
Cheung Kong Property Group and the Hutchison Property Group have been prepared under the
historical cost convention, except for investments in securities, investment properties and derivative
financial instruments, which have been measured at fair value. The Cheung Kong Property Group’s
financial information and the Hutchison Property Group’s financial information as set out in the
Accountants’ Reports in Appendices IA and IB, which comprise their respective combined income
statements, combined statements of comprehensive income, combined statements of changes in equity
and combined statements of cash flows during the Track Record Period, and their combined statements
of financial position on the respective reporting dates, have been prepared in accordance with
accounting policies that conform with IFRS.
The Cheung Kong Property Group: The Cheung Kong Property Group’s financial information has
been prepared as if the companies comprising the Cheung Kong Property Group have been a single
reporting entity throughout the Track Record Period or since the respective dates of incorporation or
establishment of the relevant entities, or up to the respective dates of disposal or dissolution, where this
is a shorter period.
The Hutchison Property Group: The Hutchison Property Group’s financial information has been
prepared as if the intended group structure had been in existence on the respective reporting dates and
throughout the Track Record Period, or since the respective dates of incorporation or establishment of
the relevant entities, or up to the respective dates of disposal or dissolution, where this is a shorter
period.
CRITICAL ACCOUNTING POLICIES AND ESTIMATES
We have identified below certain accounting policies that are significant to the preparation of the
financial statements of the Cheung Kong Property Group and the Hutchison Property Group, and which
are important for an understanding of the financial condition and results of operations of the Cheung
Kong Property Group and the Hutchison Property Group.
– 200 –
FINANCIAL INFORMATION
Some of the accounting policies involve making judgments and estimates that affect items
reported in these financial statements. The making of these judgments and estimates is fundamental to
our results of operations and financial condition and requires management to make subjective and
complex judgments about matters that are inherently uncertain based on information and data that may
change in future periods. As a result, determinations regarding these items necessarily involve the use
of assumptions and subjective judgments as to future events and are subject to change, and the use of
different assumptions or data could produce materially different results. In addition, actual results could
differ from estimates and may have a material adverse effect on our business, financial condition,
results of operations or cash flows. We also have other policies that we consider to be key accounting
policies, which are set forth in “Appendix IA – Accountants’ Report on the Cheung Kong Property
Group” and “Appendix IB – Accountants’ Report on the Hutchison Property Group”.
The accounting policies, judgments and estimates made in preparing the financial statements have
not changed during the Track Record Period. Furthermore, the estimates of our financial performance
based on the accounting policies and certain subjective judgments and assumptions made by
management have not produced materially different results when compared to our actual results of
operations. Going forward, we will continue to use similar accounting policies, assumptions and
subjective judgements to report our future results of operations and financial condition.
Turnover Recognition
Turnover comprises income from property sales, property rental, hotels and serviced suites and
property and project management.
Turnover from property sales is recognised either on the date of sale or on the date of issue of the
relevant occupation or completion permit, whichever is later, and the economic benefit accrues to the
Cheung Kong Property Group or the Hutchison Property Group and the significant risks and rewards of
the properties accrue to the purchasers.
Rental income is recognised on a straight-line basis over the term of the lease. Income from
property and project management and sales agency service is recognised when services are rendered.
Turnover from hotels and serviced suites is recognised upon provision of services.
Interest income is recognised on a time proportion basis using the effective interest method.
Dividend income is recognised when the right to receive payment is certain.
Investment Properties Valuation
Investment properties are properties held for rental. Investment properties are stated at fair value
as determined by professional valuations conducted by independent property valuers. In determining the
fair value of the investment properties, the property valuers use various assumptions and estimates that
reflect, among other things, comparable market transactions, rental income from current leases and
assumptions about rental income from future leases in light of current market conditions.
Investment properties under development are stated at fair value when their fair values become
reliably determinable or upon completion of their construction, whichever is earlier. Otherwise, they are
stated at cost less provision for impairment.
Changes in fair value are included in the combined income statement for the Cheung Kong
Property Group and the Hutchison Property Group.
– 201 –
FINANCIAL INFORMATION
Impairment of Fixed Assets
Fixed assets, including hotel and serviced suite properties held for operation, are stated at cost
less depreciation and provision for impairment.
Buildings are generally depreciated on the basis of an expected life of 50 years, or the remainder
thereof, or over the remaining period of the lease of the underlying leasehold land, whichever is
shorter. The period of the lease includes the period for which a right of renewal is attached, to the
extent applicable.
Leasehold land with respect to hotel and serviced suite properties is amortised over the remaining
term of the lease on a straight-line basis. Other fixed assets are depreciated on a straight-line basis at
annual rates of 5% to 331⁄3% based on their respective estimated useful lives.
Taxation
Taxation comprises current tax and deferred tax. The Cheung Kong Property Group and the
Hutchison Property Group are subject to income taxes in the jurisdictions where they operate. Taxation
also includes provisions for income tax, LAT through interests in joint ventures and other tax
provisions.
Hong Kong profits tax is provided for, using the enacted rate at the year-end date, on the
estimated assessable profits less available tax relief for losses brought forward. Tax outside Hong Kong
is provided for, using the local enacted rates at the year-end date, on the estimated assessable profits of
the individual company concerned.
Deferred tax liabilities are provided in full, based on the applicable enacted rates, on all
temporary differences between the carrying amounts of assets and liabilities and their tax bases, and
deferred tax assets are recognised, based on the applicable enacted rates, to the extent that it is
probable that future taxable profits will be available against which the deductible temporary differences
and unused tax losses can be utilised.
Borrowing Costs
Borrowing costs are charged to the combined income statements when they are incurred unless
they are capitalised as being directly attributable to the acquisition and development of properties which
necessarily take a substantial period of time to complete.
DESCRIPTION OF SELECTED COMPONENTS OF COMBINED INCOME STATEMENTS
Turnover
The Cheung Kong Property Group derives turnover from property sales. In addition, the Cheung
Kong Property Group and the Hutchison Property Group derive turnover from (i) property rental, (ii)
hotels and serviced suites and (iii) property and project management. The Cheung Kong Property Group
and the Hutchison Property Group also conducted property sales and other property businesses through
joint ventures.
– 202 –
FINANCIAL INFORMATION
The operating segment results set out below are reported in a manner consistent with the internal
reporting provided to the board of directors of the Cheung Kong Property Group and the board of
directors of the Hutchison Property Group, who are responsible for allocating resources and assessing
performance of the operating segments.
Property Sales
During the Track Record Period, the Cheung Kong Property Group derived most of its turnover
from sales of properties. During the same period, the Cheung Kong Property Group and the Hutchison
Property Group also conducted sales of properties through joint ventures and generated their respective
shares of property sales attributable to their interests in joint ventures. The shares of property sales of
joint ventures were not consolidated in the Cheung Kong Property Group’s combined income statement
or the Hutchison Property Group’s combined income statement according to the relevant IFRS rules.
Property Rental
Turnover from property rental primarily comprises rental income generated from retail shopping
malls, commercial office properties, residential properties, industrial properties and car park spaces.
Hotels and Serviced Suites
Turnover from hotels and serviced suites is primarily generated from hotel rooms and serviced
suites, food and beverage business, rental from the hotels’ leased spaces and ancillary services.
Turnover from ancillary services primarily includes turnover from business centers, laundry, telephone
and internet charges, spa services, foreign exchange services, recreational services and transportation
services. During the Track Record Period, the Cheung Kong Property Group and the Hutchison Property
Group have entered into hotel management agreements with internationally renowned hotel managers
for some of their hotels and a portion of their turnover was derived from the hotels operated by
third-party hotel managers.
Property and Project Management
Turnover from property and project management comprises income generated from property
management and project management related services provided to a diverse portfolio of properties,
including large-scale residential properties, commercial properties, office buildings, luxury villas,
industrial properties, shopping malls, car park spaces and clubhouses in Hong Kong, the PRC and the
United Kingdom.
Investment and Other Income
Investment and other income comprises dividends from investment in securities of listed
companies and unlisted companies including Fortune REIT, Prosperity REIT and Hui Xian REIT, which
are all listed on the Main Board and the Singapore Stock Exchange, and interests in ARA Asset
Management and Hui Xian Asset Management Limited.
During the Track Record Period, the Cheung Kong Property Group and the Hutchison Property
Group held direct equity interests in Hui Xian REIT, which were accounted for as investments available
for sale and stated at fair value in their respective combined financial statements.
– 203 –
FINANCIAL INFORMATION
Operating Costs
Our operating costs comprise (i) property and related costs, (ii) service fees, (iii) salaries and
related expenses, (iv) interest and other finance costs, (v) depreciation and amortisation and (vi) other
expenses. Property and related costs generally represent costs of properties sold, selling and marketing
costs and outgoings associated with investment properties. During the Track Record Period, salaries and
related expenses reported on the Cheung Kong Property Group’s combined income statement covered
mainly remuneration paid to employees of hotels and serviced suites and the property and project
management businesses. The remuneration for most employees of the property sales and property rental
businesses, and the remuneration for directors of Cheung Kong as regards their performance of services
for the Cheung Kong Property Group, were paid by other members of the Cheung Kong Group. Service
fees were paid by the Cheung Kong Property Group to other members of the Cheung Kong Group to
cover these amounts paid and for other support provided by other members of the Cheung Kong Group
to the Cheung Kong Property Group. Conversely, salaries and related expenses reported on the
Hutchison Property Group’s combined income statement included salaries and other benefits paid to all
employees of the Hutchison Property Group (including directors of the Hutchison Property Group). As
a result, the pro forma salaries and related expenses will not necessarily provide an accurate illustration
of the amount of salaries and related expenses to be incurred following the Listing.
All the directors of Cheung Kong Property Group received remuneration from the Cheung Kong
Group during the Track Record Period in respect of their services to the Cheung Kong Group
(including the Cheung Kong Property Group). The amounts paid by the Cheung Kong Group were not
specifically allocated between the Cheung Kong Property Group and other members of the Cheung
Kong Group, and there was no arrangement to recharge the Cheung Kong Property Group for such
expenses. As a result, the remuneration arrangements of the directors of the Cheung Kong Property
Group during the Track Record Period will not be representative of the remuneration that will be paid
to the Directors by the Group following the Listing, which will be costs borne directly by the Group.
Other expenses generally include rent, property insurance, repair and maintenance costs and other
administrative costs.
– 204 –
8,424
731
52
641
9,848
971
542
650
313
127
12,451
.
.
.
.
.
.
.
.
.
.
Total . . . . . . . . . . . . . . . . . . . . . . .
Property and related costs
Costs of property sold . . . . . . . .
Property selling and other costs .
Rental expenses . . . . . . . . . . . .
Hotel operating costs. . . . . . . . .
Subtotal . . . . . . . . . . . . . . . . . . .
Service fees . . . . . . . . . . . . . . . . .
Salaries and related expenses . . . .
Interest and other finance costs . . .
Depreciation and amortisation . . . .
Other expenses. . . . . . . . . . . . . . .
(HK$
million)
2012
– 205 –
100.0
67.7
5.9
0.4
5.1
79.1
7.8
4.4
5.2
2.5
1.0
%
10,612
6,919
368
67
657
8,011
836
556
776
301
132
(HK$
million)
100.0
65.2
3.5
0.6
6.2
75.5
7.9
5.2
7.3
2.8
1.3
%
15,609
11,708
638
34
605
12,985
892
525
815
286
106
(HK$
million)
2014
100.0
75.0
4.1
0.2
3.9
83.2
5.7
3.4
5.2
1.8
0.7
%
3,646
−
−
464
440
904
−
1,202
1,094
200
246
(HK$
million)
2012
100.0
−
−
12.7
12.1
24.8
−
33.0
30.0
5.5
6.7
%
3,727
−
−
516
444
960
−
1,289
1,099
177
202
(HK$
million)
2013
100.0
−
−
13.9
11.9
25.8
−
34.6
29.5
4.7
5.4
%
2014
3,841
−
−
510
464
974
−
1,318
1,222
178
149
(HK$
million)
Year ended 31 December
Year ended 31 December
2013
Hutchison Property Group
Cheung Kong Property Group
100.0
−
−
13.3
12.1
25.4
−
34.3
31.8
4.6
3.9
%
The following table sets out a breakdown of the Cheung Kong Property Group’s operating costs and the Hutchison Property Group’s operating
costs for the Track Record Period:
The Cheung Kong Property Group and the Hutchison Property Group
FINANCIAL INFORMATION
FINANCIAL INFORMATION
Share of Net Profit of Joint Ventures
Joint ventures are entities in which either or both of the Cheung Kong Property Group and the
Hutchison Property Group have a long term equity interest and over which it or they are in a position
to exercise joint control with other parties when decisions of the entity require unanimous consent of
the parties sharing control. Investments in joint ventures and the share of post-acquisition profits or
losses are recognised in the combined income statements and are accounted for under the equity method
of accounting.
The Cheung Kong Property Group’s share of net profit of joint ventures for the years ended 31
December 2012, 2013 and 2014 amounted to HK$5,480 million, HK$4,031 million and HK$2,835
million, respectively. The Hutchison Property Group’s share of net profit of joint ventures for the years
ended 31 December 2012, 2013 and 2014 amounted to HK$4,959 million, HK$3,763 million and
HK$2,342 million, respectively. Immediately following completion of the Property Businesses
Combination, a substantial portion of the joint ventures will become subsidiaries of the Company and
be consolidated in the financial statements of the Group. As a result, the Group will be able to
recognise turnover generated from these joint ventures as part of the Group’s turnover. Profits
contributed by the remaining joint ventures, which will not be consolidated, will continue to be
recorded as share of net profit from joint ventures under the equity method of accounting.
In addition to their direct interests in Hui Xian REIT, the Cheung Kong Property Group, the
Hutchison Property Group and others also held certain equity interests in Hui Xian REIT through a
joint venture, which was accounted for as a joint venture in the respective combined financial
statements of the Cheung Kong Property Group and the Hutchison Property Group using the equity
method of accounting. After completion of the Property Businesses Combination, Hui Xian REIT will
become an associate of the Company and be accounted for under the equity method of accounting.
For a list of the Cheung Kong Property Group’s principal joint ventures, please refer to Note 10
in “Appendix IA – Accountants’ Report on the Cheung Kong Property Group”. For a list of the
Hutchison Property Group’s principal joint ventures, please refer to Note 12 in “Appendix IB –
Accountants’ Report on the Hutchison Property Group”.
Share of Net Profit of Associates
Associates are entities other than subsidiaries or joint ventures in which either or both of the
Cheung Kong Property Group and the Hutchison Property Group have a long term equity interest and
exercise significant influence over the management of such entities.
The Cheung Kong Property Group’s share of net profit of associates for the years ended 31
December 2012, 2013 and 2014 amounted to HK$1 million, HK$1 million and HK$1 million,
respectively. The Hutchison Property Group’s share of net profit of associates for the years ended 31
December 2012, 2013 and 2014 amounted to HK$199 million, HK$120 million and HK$399 million,
respectively.
For a full list of the Hutchison Property Group’s associates, please refer to Note 11 in “Appendix
IB – Accountants’ Report on the Hutchison Property Group”.
– 206 –
FINANCIAL INFORMATION
Increase in Fair Value of Investment Properties
The Cheung Kong Property Group and the Hutchison Property Group’s investment properties
primarily comprise retail shopping malls, office properties, residential properties and car park spaces in
Hong Kong, the PRC and the United Kingdom, which are held for rental. Investment properties are
stated at fair value on the statements of financial position as non-current assets as at each financial
statement date based on the valuations prepared by the independent property valuers. Investment
properties under development are stated at fair value when their fair values become reliably
determinable or upon completion of their construction, whichever is earlier. Otherwise, they are stated
at cost less provision for impairment. Changes in fair value are included in the combined income
statement for the Cheung Kong Property Group or the Hutchison Property Group, as applicable.
Profit on Disposal of Investment Properties
The Cheung Kong Property Group recognised a profit of HK$2,760 million in the year ended 31
December 2013 resulting from the disposal of Kingswood Ginza, a retail shopping mall in Hong Kong,
which had been one of the Cheung Kong Property Group’s investment properties. The Cheung Kong
Property Group did not recognise any profit or loss on disposal of investment properties in 2012 or
2014.
Surplus on Loss of Control of Interest in Subsidiaries
Surplus on loss of control of interest in subsidiaries represents the Cheung Kong Property Group’s
surplus from the disposal of its controlling interest in Sheraton Shenyang Lido Hotel in the PRC in
2012.
Profit on Disposal of Joint Ventures
Profit on disposal of joint ventures represents profits recognised as a result of the Cheung Kong
Property Group’s disposal of interests in a joint venture which held Oriental Financial Center, a
commercial property in Shanghai in 2014, the disposal of interests in a joint venture which held The
Metropolitan Plaza, a commercial property in Guangzhou in 2013, and the disposal of interests in a
joint venture which held the Metropark Lido Hotel in Beijing in 2012.
Profits on Disposal of Investments and Others
Profit on disposal of investments and others primarily represents the gain recognised upon the
Hutchison Property Group’s disposal of interests in certain investment properties. Major disposals
during the Track Record Period include the Hutchison Property Group’s interests in a joint venture
which held The Metropolitan Plaza and its interests in Trust Tower (an office building in Hong Kong),
both in 2013, and its interests in a joint venture which held Oriental Financial Center, in 2014.
Taxation
Taxation primarily comprises current and deferred tax. Current tax comprises Hong Kong profits
tax, which was provided at the rate of 16.5% on the estimated assessable profits for each of the years
during the Track Record Period. Tax paid outside of Hong Kong has been provided for at the applicable
rates on estimated assessable profits less available tax losses. For the years ended 31 December 2012,
2013 and 2014, the Cheung Kong Property Group’s effective income tax rate (calculated by dividing
taxation by the resulting value of profit before taxation less shares of the net profit of joint ventures
– 207 –
FINANCIAL INFORMATION
and associates) was 9.7%, 12.2% and 10.1%, respectively, and the Hutchison Property Group’s effective
income tax rate was 11.3%, 10.7% and 2.6%, respectively. Hutchison Property Group’s significantly
lower effective income tax in 2014 was the result of a substantial portion of fair value gains recognised
from investment properties in Hong Kong, and there is no tax on such gains in Hong Kong.
The Directors confirm that the Cheung Kong Property Group and the Hutchison Property Group
duly paid all taxes during the Track Record Period and up to the Latest Practicable Date and there are
no matters in dispute or unresolved with the relevant tax authorities.
DISCUSSION OF RESULTS OF OPERATIONS
You should read the selected historical financial information set forth below in conjunction with
the financial statements, together with the accompanying notes, included in the Accountants’ Reports
set forth in “Appendix IA – Accountants’ Report on the Cheung Kong Property Group” and “Appendix
IB – Accountants’ Report on the Hutchison Property Group”.
The Cheung Kong Property Group
The following table sets forth the Cheung Kong Property Group’s results of operations for the
periods indicated:
Year ended 31 December
Turnover
Investment and other income . . . .
Operating costs
Property and related costs . . . .
Service fees . . . . . . . . . . . . . .
Salaries and related expenses . .
Interest and other finance costs.
Depreciation . . . . . . . . . . . . . .
Other expenses . . . . . . . . . . . .
.................
.
.
.
.
.
.
.
.
.
.
.
.
.
.
.
.
.
.
.
.
.
.
.
.
.
.
.
.
.
.
.
.
.
.
.
.
.
.
.
.
.
.
.
.
.
.
.
.
.
.
.
.
.
.
.
.
.
.
.
.
.
.
.
.
.
.
.
.
.
.
.
.
.
.
.
.
.
.
.
.
.
.
.
.
.
.
.
.
.
.
.
.
.
.
.
.
.
.
.
.
.
.
Share of net profit of joint ventures . . . . . . . . . . . .
Increase in fair value of investment properties . . . .
Profit on disposal of investment properties . . . . . . .
Surplus on loss of control of interest in subsidiaries
Profit on disposal of joint ventures.. . . . . . . . . . . . .
Operating profit . . . . . . . . . . . . . . . . . . . . . . . . . .
Share of net profit of associates . . . . . . . . . . . . . . .
Profit before taxation . . . . . . . . . . . . . . . . . . . . .
Taxation . . . . . . . . . . . . . . . . . . . . . . . . . . . . . . . .
Profit for the year . . . . . . . . . . . . . . . . . . . . . . . .
.
.
.
.
.
.
.
.
.
.
.
.
.
.
.
.
.
.
.
.
.
.
.
.
.
.
.
.
.
.
.
.
.
.
.
.
.
.
.
.
Attributable to:
Shareholders of the Cheung Kong Property Group . . . .
Non-controlling interests . . . . . . . . . . . . . . . . . . . . . .
Profit for the year . . . . . . . . . . . . . . . . . . . . . . . . . . . .
– 208 –
2012
2013
2014
(HK$
million)
(HK$
million)
(HK$
million)
19,192
94
17,011
95
24,038
784
(9,848)
(971)
(542)
(650)
(313)
(127)
(12,451)
5,480
4,470
−
1,077
450
18,312
1
18,313
(1,250)
17,063
(8,011)
(836)
(556)
(776)
(301)
(132)
(10,612)
4,031
1,782
2,760
−
798
15,865
1
15,866
(1,442)
14,424
(12,985)
(892)
(525)
(815)
(286)
(106)
(15,609)
2,835
4,542
−
−
2,349
18,939
1
18,940
(1,624)
17,316
16,930
133
17,063
14,152
272
14,424
17,068
248
17,316
FINANCIAL INFORMATION
The following table sets forth the Cheung Kong Property Group’s turnover and its share of
property sales attributable to its interests in joint ventures for the Track Record Period:
Year ended 31 December
Property sales . . . . . . . . . . . . . . .
Property rental . . . . . . . . . . . . . .
Hotels and serviced suites . . . . . .
Property and project management.
Turnover . . . . . . . . . . . . . . . . . .
.
.
.
.
.
.
.
.
.
.
.
.
.
.
.
.
.
.
.
.
.
.
.
.
.
.
.
.
.
.
.
.
.
.
.
.
.
.
.
.
.
.
.
.
.
.
.
.
.
.
.
.
.
.
.
.
.
.
.
.
.
.
.
.
.
.
.
.
.
.
.
.
.
.
.
2013
2014
(HK$
million)
(HK$
million)
(HK$
million)
.
.
.
.
.
14,614
1,867
2,350
361
19,192
12,288
1,961
2,368
394
17,011
19,389
1,908
2,213
528
24,038
Share of property sales of joint ventures . . . . . . . . . . . . .
Total . . . . . . . . . . . . . . . . . . . . . . . . . . . . . . . . . . . . .
11,846
31,038
15,301
32,312
6,959
30,997
– 209 –
.
.
.
.
.
2012
11.6
1.6
931
124
8,020
Total . . . . . . . . .
100.0
65.6
21.2
5,261
1,704
(%)
Property sales . . . .
Property rental . . . .
Hotels and serviced
suites . . . . . . .
Property and project
management. . . .
(HK$
million)
2012
7,605
133
991
4,686
1,795
(HK$
million)
100.0
1.8
13.0
61.6
23.6
(%)
9,452
154
952
6,577
1,769
(HK$
million)
100.0
1.6
10.1
69.6
18.7
(%)
5,277
45
302
4,655
275
(HK$
million)
2012
100.0
0.9
5.7
88.2
5.2
(%)
6,135
46
281
5,486
322
(HK$
million)
2013
100.0
0.8
4.6
89.4
5.2
(%)
Year ended 31 December
2014
Year ended 31 December
2013
Joint Ventures
Subsidiaries
2,560
61
275
1,924
300
(HK$
million)
2014
169
1,233
9,916
1,979
(HK$
million)
100.0 13,297
2.4
10.7
75.2
11.7
(%)
2012
(HK$
million)
179
1,272
100.0 13,740
1.2
9.3
74.6 10,172
14.9 2,117
(%)
2013
215
1,227
8,501
2,069
(HK$
million)
2014
100.0 12,012
1.3
9.3
74.0
15.4
(%)
Year ended 31 December
Total
100.0
1.8
10.2
70.8
17.2
(%)
The following table sets out a breakdown of profit contribution from the Cheung Kong Property Group’s subsidiaries and a breakdown of profit
contribution from the Cheung Kong Property Group’s attributable interests in joint ventures by operating activity for the Track Record Period:
FINANCIAL INFORMATION
– 210 –
FINANCIAL INFORMATION
2014 Compared to 2013
Turnover and Profit Contribution
Turnover from the Cheung Kong Property Group increased by HK$7,027 million, or 41.3%, to
HK$24,038 million in 2014 from HK$17,011 million in 2013, primarily due to the increase in turnover
from property sales in Hong Kong.
Profit contribution from the Cheung Kong Property Group’s subsidiaries increased by HK$1,847
million, or 24.3%, to HK$9,452 million in 2014 from HK$7,605 million in 2013, primarily due to an
increase in profit contribution from property sales in Hong Kong. Profit contribution from joint
ventures decreased by HK$3,575 million, or 58.3%, to HK$2,560 million in 2014 from HK$6,135
million in 2013, primarily due to a decrease in the share of profit contribution from property sales in
the PRC.
Turnover and profit contribution from property sales
Turnover from the Cheung Kong Property Group’s property sales increased by HK$7,101 million,
or 57.8%, to HK$19,389 million in 2014 from HK$12,288 million in 2013, primarily due to increased
property sales in Hong Kong as more property sales were recognised in 2014. Property sales recognised
included eight completed property projects in Hong Kong. The total saleable area of properties
recognised was 218,268 sq.m. and 166,098 sq.m. in 2013 and 2014, respectively, and the average
selling price was HK$53,402 per sq.m. and HK$115,065 per sq.m., respectively, for the same periods.
Profit contribution from property sales of the Cheung Kong Property Group’s subsidiaries
increased by HK$1,891 million, or 40.4%, to HK$6,577 million in 2014 from HK$4,686 million in
2013, primarily due to the reasons discussed above.
Profit contribution from property sales of joint ventures decreased by HK$3,562 million, or
64.9%, to HK$1,924 million in 2014 from HK$5,486 million in 2013, primarily due to lower sales
volume with lower selling prices in certain cities in the PRC, which was in part due to government
regulations and measures in the PRC. Property sales recognised included two completed property
projects in Singapore and 25 completed property projects in the PRC. The total saleable area of
properties recognised was 728,173 sq.m. and 320,019 sq.m. in 2013 and 2014, respectively, and the
average selling price was HK$20,683 per sq.m. and HK$21,280 per sq.m., respectively, for the same
periods. In addition, the Cheung Kong Property Group disposed of its interests in a joint venture which
held Oriental Financial Center in 2014, the profit for which is recorded in “− Profit on Disposal of
Joint Ventures”.
Turnover and profit contribution from property rental
Turnover from property rental decreased by HK$53 million, or 2.7% to HK$1,908 million in 2014
from HK$1,961 million in 2013, primarily due to the disposal of Kingswood Ginza, a retail shopping
mall in Hong Kong, in October 2013. The turnover in 2013 included the rental income derived from
Kingswood Ginza prior to its disposal in October 2013. The decrease in turnover from property rental
was partially offset by the increase in the average rental rate, which was set with reference to the
prevailing market conditions upon the renewal of tenancies. The total LFA was 172,475 sq.m. and
172,476 sq.m. as at 31 December 2013 and 2014, respectively, and the average rental rate (calculated
by dividing the average monthly rental income by the average monthly area leased) was HK$852 per
sq.m. and HK$897 per sq.m. for 2013 and 2014, respectively.
– 211 –
FINANCIAL INFORMATION
Profit contribution from property rental of the Cheung Kong Property Group’s subsidiaries
decreased by HK$26 million, or 1.4%, to HK$1,769 million in 2014 from HK$1,795 million in 2013,
primarily due to the reasons discussed above.
Profit contribution from property rental attributable to joint ventures decreased by HK$22 million,
or 6.8%, to HK$300 million in 2014 from HK$322 million in 2013, primarily due to the disposal of
interests in a joint venture which held The Metropolitan Plaza in 2013.
Turnover and profit contribution from hotels and serviced suites
Turnover from hotels and serviced suites decreased by HK$155 million, or 6.5% to HK$2,213
million in 2014 from HK$2,368 million in 2013, primarily due to (i) more competitive operating
conditions for hotels and serviced suites in Hong Kong and the PRC, (ii) renovations being carried out
at Horizon Suite Hotel, Harbourfront Horizon All-Suite Hotel and Harbourview Horizon All-Suite Hotel
in 2014 and (iii) leasing out the food and beverage outlets in certain hotels for rental income instead of
self operating. The total number of available rooms was 8,397 and 8,406 as at 31 December 2013 and
2014, respectively. For the years ended 31 December 2013 and 2014, the average occupancy rate was
89.2% and 89.8%, respectively, and the average room rate was HK$687 and HK$703, respectively.
Profit contribution from hotels and serviced suites of the Cheung Kong Property Group’s
subsidiaries decreased by HK$39 million, or 3.9%, to HK$952 million in 2014 from HK$991 million in
2013, primarily due to the reasons discussed above.
Profit contribution from hotels and serviced suites attributable to joint ventures and associates
decreased by HK$6 million, or 2.1%, to HK$275 million in 2014 from HK$281 million in 2013,
primarily due to more competitive operating conditions for hotels and serviced suites in Hong Kong in
2014.
In February 2013, contracts were entered into for the sale of hotel units in The Apex Horizon,
which is owned by one of Cheung Kong’s wholly-owned subsidiaries. The wholly-owned subsidiary
was subsequently notified by the SFC that the arrangements relating to the sale and purchase of hotel
units in The Apex Horizon appeared to constitute a Collective Investment Scheme (as defined by the
SFO). Arrangements for cancellation of the transactions were made, and the cancellation had no
material impact on the Cheung Kong Property Group’s results of operations.
Turnover and profit contribution from property and project management
Turnover from property and project management increased by HK$134 million, or 34.0%, to
HK$528 million in 2014 from HK$394 million in 2013, primarily due to the growth in the property
management business in the PRC and an increase in the total floor area of properties under the Cheung
Kong Property Group’s management following the completion of certain property development projects.
The total floor area of properties under the Cheung Kong Property Group’s management was
approximately 8.3 million sq.m. and 8.5 million sq.m. as at 31 December 2013 and 2014, respectively.
Profit contribution from property and project management of the Cheung Kong Property Group’s
subsidiaries increased by HK$21 million, or 15.8%, to HK$154 million in 2014 from HK$133 million
in 2013, primarily due to the reasons discussed above.
– 212 –
FINANCIAL INFORMATION
Profit contribution from property and project management attributable to joint ventures increased
by HK$15 million, or 32.6%, to HK$61 million in 2014 from HK$46 million in 2013, primarily due to
an increase in the number of properties under the joint ventures’ management.
Investment and Other Income
Investment and other income increased by HK$689 million, or 725.3%, to HK$784 million in
2014 from HK$95 million in 2013, primarily due to (i) a decrease in exchange losses, (ii) a gain on the
disposal of certain unlisted equity investments available for sale and (iii) an increase in the amount of
dividend income received from REITs.
Operating Costs
Operating costs increased by HK$4,997 million, or 47.1%, to HK$15,609 million in 2014 from
HK$10,612 million in 2013, primarily due to an increase in property and related costs.
Property and related costs increased by HK$4,974 million, or 62.1%, to HK$12,985 million in
2014 from HK$8,011 million in 2013, primarily due to an increase in cost of properties sold resulting
from increased property sales in Hong Kong in 2014.
Service fees increased by HK$56 million, or 6.7%, to HK$892 million in 2014 from HK$836
million in 2013, primarily due to an increase in the amount of property sales-related service fee
resulting from increased property sales in Hong Kong in 2014.
Salaries and related costs decreased by HK$31 million, or 5.6%, to HK$525 million in 2014 from
HK$556 million in 2013, primarily due to a decrease in staff costs in connection with hotels and
serviced suites as a result of leasing out the food and beverage outlets at certain hotels for rental
income instead of self-operating.
Interest and other finance costs increased by HK$39 million, or 5.0%, to HK$815 million in 2014
from HK$776 million in 2013, primarily due to less interest capitalised in property projects being
developed and more interest being expensed in 2014.
Depreciation decreased by HK$15 million, or 5.0%, to HK$286 million in 2014 from HK$301
million in 2013, primarily due to lower depreciation as a result of certain fixed assets at hotels and
serviced suites being fully depreciated in 2014.
Other expenses decreased by HK$26 million, or 19.7%, to HK$106 million in 2014 from HK$132
million in 2013, primarily due to a decrease in certain administrative costs, including donations.
Share of Net Profit of Joint Ventures
Share of net profit of joint ventures decreased by HK$1,196 million, or 29.7%, to HK$2,835
million in 2014 from HK$4,031 million in 2013, primarily due to lower sales volume with lower selling
prices in certain cities in the PRC, which was in part due to government regulations and measures in
the PRC. On the other hand, as mentioned under “− Profit on Disposal of Joint Ventures” below, the
Cheung Kong Property Group made a profit on the disposal of its interests in a joint venture which
held Oriental Financial Center in 2014.
– 213 –
FINANCIAL INFORMATION
Increase in Fair Value of Investment Properties
Increase in fair value of investment properties increased by HK$2,760 million, or 154.9%, to
HK$4,542 million in 2014 from HK$1,782 million in 2013. The increase in 2014 was due to increases
in average rental rates and also reflected an improvement in property market conditions.
Profit on Disposal of Investment Properties
The Cheung Kong Property Group recorded profit on disposal of investment properties of
HK$2,760 million in 2013 due to the disposal of Kingswood Ginza in 2013. There was no such profit
on disposal of investment properties in 2014.
Surplus on Loss of Control of Interest in Subsidiaries
The Cheung Kong Property Group did not record a surplus on loss of control of interest in
subsidiaries in 2013 or 2014.
Profit on Disposal of Joint Ventures
Profit on disposal of joint ventures increased by HK$1,551 million, or 194.4%, to HK$2,349
million in 2014 from HK$798 million in 2013, primarily reflecting a higher amount of profit made on
the disposal of interests in a joint venture which held Oriental Financial Center in 2014 as compared to
the disposal of interests in a joint venture which held The Metropolitan Plaza in 2013.
Operating Profit
As a result of the foregoing, operating profit increased by HK$3,074 million, or 19.4%, to
HK$18,939 million in 2014 from HK$15,865 million in 2013.
Share of Net Profit of Associates
Share of net profit of associates remained at HK$1 million for 2013 and 2014.
Profit before Taxation
As a result of the foregoing, the Cheung Kong Property Group’s profit before taxation increased
by HK$3,074 million, or 19.4%, to HK18,940 million in 2014 from HK$15,866 million in 2013.
Taxation
Taxation expenses increased by HK$182 million, or 12.6%, to HK$1,624 million in 2014 from
HK$1,442 million in 2013, primarily due to an increase in the amount of taxable income in Hong Kong
as a result of an increase in sales of properties in Hong Kong.
Profit for the Year
As a result of the foregoing, profit for the year increased by HK$2,892 million, or 20.0%, to
HK$17,316 million in 2014 from HK$14,424 million in 2013.
– 214 –
FINANCIAL INFORMATION
Profit for the Year Attributable to Shareholders of the Cheung Kong Property Group
As a result of the foregoing, profit for the year attributable to shareholders increased by
HK$2,916 million, or 20.6%, to HK$17,068 million in 2014 from HK$14,152 million in 2013.
Profit for the Year Attributable to Non-Controlling Interests
Profit for the year attributable to non-controlling interests decreased by HK$24 million, or 8.8%,
to HK$248 million in 2014 from HK$272 million in 2013, primarily due to a decrease in profit
generated from a non-wholly owned subsidiary as the result of the disposal of Kingswood Ginza in
2013.
2013 Compared to 2012
Turnover and Profit Contribution
Turnover from the Cheung Kong Property Group decreased by HK$2,181 million, or 11.4%, to
HK$17,011 million in 2013 from HK$19,192 million in 2012, primarily due to a decrease in turnover
from property sales in Hong Kong, which was partially offset by an increase in turnover from property
sales outside of Hong Kong, including the PRC.
Profit contribution from the Cheung Kong Property Group’s subsidiaries decreased by HK$415
million, or 5.2%, to HK$7,605 million in 2013 from HK$8,020 million in 2012, primarily due to a
decrease in profit contribution from property sales in Hong Kong, which was partially offset by an
increase in profit contribution from property sales in the PRC. Profit contribution from joint ventures
increased by HK$858 million, or 16.3%, to HK$6,135 million in 2013 from HK$5,277 million in 2012,
primarily due to an increase in the share of profit contribution from joint ventures’ property sales in the
PRC.
Turnover and profit contribution from property sales
Turnover from the Cheung Kong Property Group’s property sales decreased by HK$2,326 million,
or 15.9%, to HK$12,288 million in 2013 from HK$14,614 million in 2012, primarily attributable to a
decrease in recognised property sales in Hong Kong resulting from the prolonged completion process of
certain developments, which was in part due to the new government regulations and/or their relevant
interpretation. This decrease was partially offset by increased recognised property sales outside of Hong
Kong, including the PRC. Property sales recognised included five completed property projects in Hong
Kong and one completed property project in the PRC. The total saleable area of properties recognised
was 158,401 sq.m. and 218,268 sq.m. in 2012 and 2013, respectively, and the average selling price was
HK$82,348 per sq.m. and HK$53,402 per sq.m., respectively, for the same periods.
Profit contribution from property sales of the Cheung Kong Property Group’s subsidiaries
decreased by HK$575 million, or 10.9%, to HK$4,686 million in 2013 from HK$5,261 million in 2012,
primarily due to the reasons discussed above.
Profit contribution from property sales of joint ventures increased by HK$831 million, or 17.9%,
to HK$5,486 million in 2013 from HK$4,655 million in 2012, primarily due to an increase in sales
volume and more property developments being completed in 2013. Property sales recognised included
28 completed property projects in the PRC. The total saleable area of properties recognised was
631,292 sq.m. and 728,173 sq.m. in 2012 and 2013, respectively, and the average selling price was
HK$18,516 per sq.m. and HK$20,683 per sq.m., respectively, for the same periods.
– 215 –
FINANCIAL INFORMATION
Turnover and profit contribution from property rental
Turnover from property rental increased by HK$94 million, or 5.0%, to HK$1,961 million in 2013
from HK$1,867 million in 2012, due to increased rental income for retail properties in Hong Kong,
which has benefited from the growing number of tourists from the PRC. The total LFA was 172,423
sq.m. and 172,475 sq.m. as at 31 December 2012 and 2013, respectively, and the average rental rate
was HK$768 per sq.m. and HK$852 per sq.m. for the years ended 31 December 2012 and 2013,
respectively.
Profit contribution from property rental of the Cheung Kong Property Group’s subsidiaries
increased by HK$91 million, or 5.3%, to HK$1,795 million in 2013 from HK$1,704 million in 2012,
primarily due to the reasons discussed above.
Profit contribution from property rental attributable to joint ventures increased by HK$47 million,
or 17.1%, to HK$322 million in 2013 from HK$275 million in 2012, due to increased rental for retail
properties in the PRC as the result of an improvement in property market conditions.
Turnover and profit contribution from hotels and serviced suites
Turnover from hotels and serviced suites increased slightly by HK$18 million, or 0.8% to
HK$2,368 million in 2013 from HK$2,350 million in 2012, primarily due to the steady demand for
hotels and serviced suites in Hong Kong resulting from active inbound tourism and business travelers.
The total number of available rooms was 8,432 and 8,397 as at 31 December 2012 and 2013,
respectively. During the same periods, the average occupancy rate was 90.0% and 89.2%, respectively,
and the average room rate was HK$603 and HK$613, respectively.
Profit contribution from hotels and serviced suites of the Cheung Kong Property Group’s
subsidiaries increased by HK$60 million, or 6.4%, to HK$991 million in 2013 from HK$931 million in
2012, primarily due to the reasons discussed above.
Profit contribution from hotels and serviced suites attributable to joint ventures decreased by
HK$21 million, or 7.0%, to HK$281 million in 2013 from HK$302 million in 2012, primarily due to
the disposal of interests in a joint venture which held Metropark Lido Hotel in 2012.
Turnover and profit contribution from property and project management
Turnover from property and project management increased by HK$33 million, or 9.1% to HK$394
million in 2013 from HK$361 million in 2012, due to the growth in the number of properties and/or
total floor area of properties under the Cheung Kong Property Group’s management. The total floor
area of properties under the Cheung Kong Property Group’s management was 8.1 million sq.m. and 8.3
million sq.m. as at 31 December 2012 and 2013, respectively.
Profit contribution from property and project management of the Cheung Kong Property Group’s
subsidiaries increased by HK$9 million, or 7.3%, to HK$133 million in 2013 from HK$124 million in
2012, primarily due to the reasons discussed above.
Profit contribution from property and project management attributable to joint ventures remained
relatively stable at HK$45 million and HK$46 million in 2012 and 2013, respectively.
– 216 –
FINANCIAL INFORMATION
Investment and Other Income
Investment and other income remained relatively stable at HK$94 million and HK$95 million in
2012 and 2013, respectively.
Operating Costs
Operating costs decreased by HK$1,839 million, or 14.8%, to HK$10,612 million in 2013 from
HK$12,451 million in 2012, primarily due to a decrease in property and related costs as a result of a
decrease in property sales during this period.
Property and related costs decreased by HK$1,837 million, or 18.7%, to HK$8,011 million in
2013 from HK$9,848 million in 2012, primarily due to a decrease in cost of properties sold resulting
from a decrease in property sales in Hong Kong in 2013.
Service fees decreased by HK$135 million, or 13.9%, to HK$836 million in 2013 from HK$971
million in 2012, primarily due to a decrease in the amount of property sales-related service fee
resulting from decreased property sales in Hong Kong in 2013.
Salaries and related costs increased by HK$14 million, or 2.6%, to HK$556 million in 2013 from
HK$542 million in 2012, primarily due to an increase in staff costs in connection with the property and
project management operations as a result of the increase in the number of properties under their
management.
Interest and other finance costs increased by HK$126 million, or 19.4%, to HK$776 million in
2013 from HK$650 million in 2012, primarily due to an increase in average interest rate in relation to
amounts due to the Cheung Kong Group.
Depreciation decreased by HK$12 million, or 3.8%, to HK$301 million in 2013 from HK$313
million in 2012, primarily due to lower depreciation as a result of certain fixed assets at the hotels and
serviced suites being fully depreciated in 2013.
Other expenses increased by HK$5 million, or 3.9%, to HK$132 million in 2013 from HK$127
million in 2012, primarily due to an increase in the amount of donations made.
Share of Net Profit of Joint Ventures
Share of net profit of joint ventures decreased by HK$1,449 million, or 26.4%, to HK$4,031
million in 2013 from HK$5,480 million in 2012, primarily due to the gain resulting from a joint
venture disposing of its interest in an entity which held Marina Bay Financial Centre, a commercial
property in Singapore, in 2012. There was no such gain in 2013.
Increase in Fair Value of Investment Properties
Increase in fair value of investment properties decreased by HK$2,688 million, or 60.1%, to
HK$1,782 million in 2013 from HK$4,470 million in 2012, primarily due to the reduced rate at which
property valuation grew in 2013.
– 217 –
FINANCIAL INFORMATION
Profit on Disposal of Investment Properties
The Cheung Kong Property Group recorded profit on disposal of investment properties of
HK$2,760 million in 2013 due to the disposal of Kingswood Ginza in 2013. There was no such profit
on disposal of investment properties in 2012.
Surplus on Loss of Control of Interest in Subsidiaries
The Cheung Kong Property Group recorded a surplus on loss of control of interest in subsidiaries
of HK$1,077 million in 2012 due to the disposal of its controlling interest in Sheraton Shenyang Lido
Hotel in 2012. There was no such surplus in 2013.
Profit on Disposal of Joint Ventures
Profit on disposal of joint ventures increased by HK$348 million, or 77.3%, to HK$798 million in
2013 from HK$450 million in 2012, as a result of higher amount of profit made on the disposal of
interests in a joint venture which held The Metropolitan Plaza in 2013 as compared to the disposal of
interests in a joint venture which held the Metropark Lido Hotel in 2012.
Operating Profit
As a result of the foregoing, operating profit decreased by HK$2,447 million, or 13.4%, to
HK$15,865 million in 2013 from HK$18,312 million in 2012.
Share of Net Profit of Associates
Share of net profit of associates remained at HK$1 million for 2012 and 2013.
Profit before Taxation
As a result of the foregoing, the Cheung Kong Property Group’s profit before taxation decreased
by HK$2,447 million, or 13.4%, to HK$15,866 million in 2013 from HK$18,313 million in 2012.
Taxation
Taxation expenses increased by HK$192 million, or 15.4%, to HK$1,442 million in 2013 from
HK$1,250 million in 2012, primarily due to an increase in taxable income resulting from higher
property sales volume in the PRC in 2013.
Profit for the Year
As a result of the foregoing, profit for the year decreased by HK$2,639 million, or 15.5%, to
HK$14,424 million in 2013 from HK$17,063 million in 2012.
Profit for the Year Attributable to Shareholders of the Cheung Kong Property Group
As a result of the foregoing, profit for the year attributable to shareholders decreased by
HK$2,778 million, or 16.4%, to HK$14,152 million in 2013 from HK$16,930 million in 2012.
– 218 –
FINANCIAL INFORMATION
Profit for the Year Attributable to Non-Controlling Interests
Profit for the year attributable to non-controlling interests increased by HK$139 million, or
104.5%, to HK$272 million in 2013 from HK$133 million in 2012, primarily due to increased property
sales in Hong Kong in 2013 generated by non wholly-owned subsidiaries.
The Hutchison Property Group
The following table sets forth the Hutchison Property Group’s results of operations for the periods
indicated:
Year ended 31 December
Turnover . . . . . . . . . . . . . . . . . .
Investment and other income . . . .
Operating costs
Property and related costs . . . .
Salaries and related expenses . .
Interest and other finance costs.
Depreciation and amortisation. .
Other expenses . . . . . . . . . . . .
.................
.................
2012
2013
2014
(HK$
million)
(HK$
million)
(HK$
million)
6,237
128
6,676
139
6,901
148
Share of net profit of joint ventures . . . . . . . . . . . . . . . .
Increase in fair value of investment properties . . . . . . . .
Profit on disposal of investments and others . . . . . . . . . .
(904)
(1,202)
(1,094)
(200)
(246)
(3,646)
4,959
859
167
(960)
(1,289)
(1,099)
(177)
(202)
(3,727)
3,763
17
3,067
(974)
(1,318)
(1,222)
(178)
(149)
(3,841)
2,342
28,088
2,807
Operating profit . . . . . . . . . . . . . . . . . . . . . . . . . . . . . .
Share of net profit of associates . . . . . . . . . . . . . . . . . . .
8,704
199
9,935
120
36,445
399
Profits before taxation . . . . . . . . . . . . . . . . . . . . . . . . .
Taxation . . . . . . . . . . . . . . . . . . . . . . . . . . . . . . . . . . . .
8,903
(425)
10,055
(663)
36,844
(885)
Profit for the year . . . . . . . . . . . . . . . . . . . . . . . . . . . .
8,478
9,392
35,959
Attributable to:
Shareholders of the Hutchison Property Group. . . . . . .
Non-controlling interests . . . . . . . . . . . . . . . . . . . . . .
8,179
299
9,110
282
35,569
390
Profit for the year . . . . . . . . . . . . . . . . . . . . . . . . . . . .
8,478
9,392
35,959
.
.
.
.
.
.
.
.
.
.
.
.
.
.
.
.
.
.
.
.
.
.
.
.
.
.
.
.
.
.
.
.
.
.
.
.
.
.
.
.
.
.
.
.
.
.
.
.
.
.
.
.
.
.
.
.
.
.
.
.
– 219 –
.
.
.
.
.
.
.
.
.
.
.
.
.
.
.
.
.
.
.
.
.
.
.
.
.
FINANCIAL INFORMATION
The following table sets forth the Hutchison Property Group’s turnover and its share of property
sales attributable to its interests in joint ventures for the Track Record Period:
Year ended 31 December
2012
2013
2014
(HK$
million)
(HK$
million)
(HK$
million)
Property rental . . . . . . . . . . . . . . . . . . . . . . . . . . . . . . .
Hotels and serviced suites . . . . . . . . . . . . . . . . . . . . . . .
Property and project management. . . . . . . . . . . . . . . . . .
3,318
2,221
698
3,682
2,196
798
3,995
2,230
676
Hutchison Property Group turnover . . . . . . . . . . . . . .
6,237
6,676
6,901
Share of property sales of joint ventures . . . . . . . . . . . . .
11,805
15,233
6,845
Total . . . . . . . . . . . . . . . . . . . . . . . . . . . . . . . . . . . . . .
18,042
21,909
13,746
– 220 –
−
2,959
681
43
3,683
Property sales . . . . . . . . . .
Property rental . . . . . . . . . .
Hotels and serviced suites . . . . .
Property and project management . .
Total . . . . . . . . . . . . . .
(HK$
million)
2012
−
100.0
1.2
18.5
80.3
(%)
4,048
13
692
3,343
−
(HK$
million)
−
100.0
0.3
17.1
82.6
(%)
4,280
(42)
705
3,617
−
(HK$
million)
−
100.0
(1.0)
16.5
84.5
(%)
6,859
−
259
381
6,219
(HK$
million)
2012
100.0
−
3.8
5.5
90.7
(%)
6,662
−
245
378
6,039
(HK$
million)
2013
100.0
−
3.7
5.7
90.6
(%)
2014
2,508
−
244
361
1,903
(HK$
million)
Year ended 31 December
2014
Year ended 31 December
2013
Joint Ventures and Associates
Hutchison Property Group
100.0
−
9.7
14.4
75.9
(%)
10,542
43
940
3,340
6,219
(HK$
million)
2012
100.0
0.4
8.9
31.7
59.0
(%)
10,710
13
937
3,721
6,039
(HK$
million)
2013
100.0
0.1
8.8
34.7
56.4
(%)
Year ended 31 December
Total
6,788
(42)
949
3,978
1,903
(HK$
million)
2014
100.0
(0.6)
14.0
58.6
28.0
(%)
The following table sets out a breakdown of profit contribution from the Hutchison Property Group’s subsidiaries and profit contribution from
the Hutchison Property Group’s attributable interests in joint ventures and associates by operating activity for the Track Record Period:
FINANCIAL INFORMATION
– 221 –
FINANCIAL INFORMATION
2014 Compared to 2013
Turnover and Profit Contribution
Turnover increased by HK$225 million, or 3.4%, to HK$6,901 million in 2014 from HK$6,676
million in 2013, primarily due to an increase in turnover from property rental.
Profit contribution from the Hutchison Property Group’s subsidiaries increased by HK$232
million, or 5.7%, to HK$4,280 million in 2014 from HK$4,048 million in 2013, primarily due to an
increase in profit contribution from property rental.
Profit contribution from joint ventures and associates decreased by HK$4,154 million, or 62.4% to
HK$2,508 million in 2014 from HK$6,662 million in 2013, primarily due to a decrease in profit
contribution from property sales of joint ventures in the PRC.
Turnover and profit contribution from property sales
During the Track Record Period, the Hutchison Property Group conducted sales of properties
through joint ventures and generated its share of property sales attributable to its interests in joint
ventures. The share of property sales of joint ventures was not consolidated in the Hutchison Property
Group’s combined income statement due to the relevant IFRS rules. The Hutchison Property Group’s
share of property sales attributable to its interests in joint ventures decreased by HK$8,388 million, or
55.1%, to HK$6,845 million in 2014 from HK$15,233 million in 2013, primarily due to lower sales
volume in the PRC along with lower selling prices in certain cities in the PRC, which was in part due
to government regulations and measures in the PRC. Property sales recognised through joint ventures
included 25 completed property projects in the PRC, two completed property projects in Singapore and
one completed property project in The Bahamas. The total saleable area of properties recognised was
726,842 sq.m. and 316,856 sq.m. in 2013 and 2014, respectively, and the average selling price was
HK$20,958 per sq.m. and HK$21,603 per sq.m., respectively, for the same periods.
Profit contribution from share of property sales of joint ventures decreased by HK$4,136 million,
or 68.5%, to HK$1,903 million in 2014 from HK$6,039 million in 2013, primarily due to the reasons
discussed above.
Turnover and profit contribution from property rental
Turnover from property rental increased by HK$313 million, or 8.5%, to HK$3,995 million in
2014 from HK$3,682 million in 2013, primarily due to higher rental renewal rates in Hong Kong as the
result of strong demand for the relatively limited supply of Grade A office buildings and the increase in
rental rates for retail properties driven by higher levels of consumer spending. The total LFA was
967,337 sq.m. and 964,021 sq.m. as at 31 December 2013 and 2014, respectively, and the average
rental rate was HK$313 per sq.m. and HK$342 per sq.m. for the years ended 31 December 2013 and
2014, respectively.
Profit contribution from property rental of the Hutchison Property Group’s subsidiaries increased
by HK$274 million, or 8.2%, to HK$3,617 million in 2014 from HK$3,343 million in 2013, primarily
due to the reasons discussed above.
– 222 –
FINANCIAL INFORMATION
Profit contribution from property rental attributable to joint ventures and associates decreased by
HK$17 million, or 4.5%, to HK$361 million in 2014 from HK$378 million in 2013, primarily due to
the disposal of interests in a joint venture which held The Metropolitan Plaza in 2013.
Turnover and profit contribution from hotels and serviced suites
Turnover from hotels and serviced suites increased by HK$34 million, or 1.5%, to HK$2,230
million in 2014 from HK$2,196 million in 2013, primarily due to improved results from hotel
operations in The Bahamas during the year as the result of higher average occupancy rates and the
leasing of a hotel complex to a third party hotel operator, which was partially offset by lower average
occupancy and room rates in the hotel operations in the PRC and certain hotels in Hong Kong as the
result of more subdued market conditions in the PRC and certain hotels facing keen market
competition. The total number of available rooms was 5,057 as at 31 December 2013 and 2014. During
the same periods, the average occupancy rate was 80.4% and 81.3%, respectively, and the average room
rate was HK$1,073 and HK$1,059, respectively.
Profit contribution from hotels and serviced suites of the Hutchison Property Group’s subsidiaries
increased by HK$13 million, or 1.9%, to HK$705 million in 2014 from HK$692 million in 2013,
primarily due to the reasons discussed above.
Profit contribution from hotels and serviced suites attributable to joint ventures and associates
remained stable at HK$245 million and HK$244 million in 2013 and 2014, respectively.
Turnover and profit contribution from property and project management
Turnover from property and project management decreased by HK$122 million, or 15.3%, to
HK$676 million in 2014 from HK$798 million in 2013, primarily due to lower sales volume and the
deferred completion of certain development projects in the PRC. The total floor area of properties
under the Hutchison Property Group’s management was 10 million sq.m. and 12 million sq.m. as at 31
December 2013 and 2014, respectively.
Profit contribution from property and project management of the Hutchison Property Group’s
subsidiaries amounted to HK$13 million in 2013, and amounted to a loss of HK$42 million in 2014.
The loss incurred in 2014 was primarily due to lower sales volume and delayed completion of certain
development projects in the PRC, as well as an increase in project management costs.
The Hutchison Property Group did not generate profit contribution from property and project
management from joint ventures and associates during the Track Record Period.
Investment and Other Income
Investment and other income increased by HK$9 million, or 6.5%, to HK$148 million in 2014
from HK$139 million in 2013, primarily due to the increase in dividend income from Hui Xian REIT.
Operating Costs
Operating costs increased by HK$114 million, or 3.1%, to HK$3,841 million in 2014 from
HK$3,727 million in 2013, due to an overall increase in costs.
– 223 –
FINANCIAL INFORMATION
Property and related costs increased slightly by HK$14 million, or 1.5%, to HK$974 million in
2014 from HK$960 million in 2013, primarily due to an overall increase in various hotel operating
costs, including food and beverage costs, utilities costs and repair and maintenance costs in 2014.
Salaries and related expenses increased slightly by HK$29 million, or 2.2%, to HK$1,318 million
in 2014 from HK$1,289 million in 2013, primarily due to an increase in wages, salaries, allowances
and bonuses as the result of general inflation, despite a decrease in total head count.
Interest and other finance costs increased by HK$123 million, or 11.2%, to HK$1,222 million in
2014 from HK$1,099 million in 2013, primarily due to higher interest rates on our borrowings.
Depreciation and amortisation remained stable at HK$177 million and HK$178 million in 2013
and 2014, respectively.
Other expenses decreased by HK$53 million, or 26.2%, to HK$149 million in 2014 from HK$202
million in 2013, primarily due to compensation income recorded in 2014 relating to the repossession of
land in relation to a joint development project.
Share of Net Profit of Joint Ventures
Share of net profit of joint ventures decreased by HK$1,421 million, or 37.8%, to HK$2,342
million in 2014 from HK$3,763 million in 2013, primarily due to lower sales volume in the PRC along
with lower selling prices in certain cities in the PRC, which was in part due to government regulations
and measures in the PRC.
Increase in Fair Value of Investment Properties
The increase in fair value of investment properties increased significantly by HK$28,071 million
to HK$28,088 million in 2014 from HK$17 million in 2013, due to the improvement in market
conditions in 2014 as the result of high global liquidity and easing of investor concerns over a potential
increase in interest rates, which boosted the overall investor confidence and sentiment. As a result of
the changes in market conditions, the independent property valuers changed certain assumptions used to
value the investment properties, including reducing the weighted average capitalisation rate used from
8.7% as at 31 December 2013 to 6.1% as at 31 December 2014.
Profits on Disposal of Investments and Others
Profits on disposal of investments and others decreased by HK$260 million, or 8.5%, to
HK$2,807 million in 2014 from HK$3,067 million in 2013, primarily due to the disposal of fewer
properties in Hong Kong in 2014, which was partially offset by the gain from the disposal of the
Hutchison Property Group’s interests in a joint venture which held the Oriental Financial Center in
2014.
Share of Net Profit of Associates
Share of net profit of associates increased by HK$279 million, or 232.5%, to HK$399 million in
2014 from HK$120 million in 2013, primarily due to an increase in the fair value of investment
properties held by associates.
– 224 –
FINANCIAL INFORMATION
Profit before Taxation
As a result of the foregoing, the Hutchison Property Group’s profit before taxation increased by
HK$26,789 million, or 266.4%, to HK$36,844 million in 2014 from HK$10,055 million in 2013.
Taxation
Taxation expenses increased by HK$222 million, or 33.5%, to HK$885 million in 2014 from
HK$663 million in 2013, primarily due to the provision of withholding tax upon the disposal of the
Hutchison Property Group’s interests in a joint venture which held the Oriental Financial Center in
2014.
Profit for the Year
As a result of the foregoing, profit for the year increased by HK$26,567 million, or 282.9%, to
HK$35,959 million in 2014 from HK$9,392 million in 2013.
Profit for the Year Attributable to Shareholders of the Hutchison Property Group
As a result of the foregoing, profit for the year attributable to shareholders of the Hutchison
Property Group increased by HK$26,459 million, or 290.4%, to HK$35,569 million in 2014 from
HK$9,110 million in 2013.
Profit for the Year Attributable to Non-Controlling Interests
Profit for the year attributable to non-controlling interests increased by HK$108 million, or
38.3%, to HK$390 million in 2014 from HK$282 million in 2013, primarily due to the share of
compensation income recorded in 2014 attributable to non-controlling interests and an increase in the
fair value of investment properties attributable to non-controlling interests.
2013 Compared to 2012
Turnover and Profit Contribution
Turnover increased by HK$439 million, or 7.0%, to HK$6,676 million in 2013 from HK$6,237
million in 2012, primarily due to an increase in turnover from property rental.
Profit contribution from the Hutchison Property Group’s subsidiaries increased by HK$365
million, or 9.9%, to HK$4,048 million in 2013 from HK$3,683 million in 2012, primarily due to an
increase in profit contribution from property rental. Profit contribution from joint ventures and
associates decreased by HK$197 million, or 2.9%, to HK$6,662 million in 2013 from HK$6,859 million
in 2012, primarily due to the disposal of the Hutchison Property Group’s interests in Marina Bay
Financial Centre, a commercial property in Singapore, in 2012.
Turnover and profit contribution from property sales
During the Track Record Period, the Hutchison Property Group conducted sales of properties
through joint ventures and generated its share of property sales attributable to its interests in joint
ventures. The share of property sales of joint ventures was not consolidated in the Hutchison Property
Group’s combined income statement due to the relevant IFRS rules. The Hutchison Property Group’s
– 225 –
FINANCIAL INFORMATION
share of property sales attributable to its interests in joint ventures increased by HK$3,428 million, or
29.0%, to HK$15,233 million in 2013 from HK$11,805 million in 2012, primarily due to increased
sales volume and more development projects being completed in 2013. Property sales recognised
through joint ventures included one completed property project in Hong Kong, twenty-six completed
property projects in the PRC, one completed property project in Singapore and one completed property
project in The Bahamas. The total saleable area of properties recognised was 629,457 sq.m. and
726,842 sq.m. in 2012 and 2013, respectively, and the average selling price was HK$18,754 per sq.m.
and HK$20,958 per sq.m., respectively, for the same periods.
Profit contribution from property sales of joint ventures decreased by HK$180 million, or 2.9%, to
HK$6,039 million in 2013 from HK$6,219 million in 2012, primarily due to the disposal of the
Hutchison Property Group’s interests in Marina Bay Financial Centre in 2012.
Turnover and profit contribution from property rental
Turnover from property rental increased by HK$364 million, or 11.0%, to HK$3,682 million in
2013 from HK$3,318 million in 2012, primarily due to higher rental rates and occupancy levels in
Hong Kong as a result of strong demand for the relatively limited supply of Grade A office buildings
and the increase in rental rates for retail properties driven by higher levels of consumer spending. The
total LFA was 981,316 sq.m. and 967,337 sq.m. as at 31 December 2012 and 2013, respectively, and
the average rental rate was HK$282 per sq.m. and HK$313 per sq.m. for the years ended 31 December
2012 and 2013, respectively.
Profit contribution from property rental of the Hutchison Property Group’s subsidiaries increased
by HK$384 million, or 13.0%, to HK$3,343 million in 2013 from HK$2,959 million in 2012, primarily
due to the reasons discussed above.
Profit contribution from property rental attributable to joint ventures and associates remained
relatively stable at HK$381 million and HK$378 million in 2012 and 2013, respectively.
Turnover and profit contribution from hotels and serviced suites
Turnover from hotels and serviced suites decreased by HK$25 million, or 1.1%, to HK$2,196
million in 2013 from HK$2,221 million in 2012, primarily due to lower average occupancy and room
rates in the hotels operations in the PRC and certain hotels in Hong Kong facing keen market
competition, as well as certain austerity measures imposed by the PRC government which negatively
impacted hotel operations in the PRC. The total number of available rooms was 5,057 as at 31
December 2012 and 2013. During the same periods, the average occupancy rate was 83.8% and 80.4%,
respectively, and the average room rate was HK$1,038 and HK$1,073, respectively.
Profit contribution from hotels and serviced suites of the Hutchison Property Group’s subsidiaries
increased by HK$11 million, or 1.6%, to HK$692 million in 2013 from HK$681 million in 2012,
primarily due to the better performance of Bahamas Grand Lucayan during 2013.
Profit contribution from hotels and serviced suites attributable to joint ventures and associates
decreased by HK$14 million, or 5.4%, to HK$245 million in 2013 from HK$259 million in 2012,
primarily due to lower average occupancy rates and room rates in certain hotels in Hong Kong and the
PRC for the same reasons as discussed above.
– 226 –
FINANCIAL INFORMATION
Turnover and profit contribution from property and project management
Turnover from property and project management increased by HK$100 million, or 14.3%, to
HK$798 million in 2013 from HK$698 million in 2012, primarily due to higher sales volume and more
projects being completed in 2013. The total floor area of properties under our management was 9
million sq.m. and 10 million sq.m. as at 31 December 2012 and 2013, respectively.
Profit contribution from property and project management of the Hutchison Property Group’s
subsidiaries decreased by HK$30 million, or 69.8%, to HK$13 million in 2013 from HK$43 million in
2012, primarily due to the increase in project management costs.
The Hutchison Property Group did not generate profit contribution from property and project
management from joint ventures and associates during the Track Record Period.
Investment and Other Income
Investment and other income increased by HK$11 million, or 8.6%, to HK$139 million in 2013
from HK$128 million in 2012, primarily due to an increase in dividend income from Hui Xian REIT.
Operating Costs
Operating costs increased by HK$81 million, or 2.2%, to HK$3,727 million in 2013 from
HK$3,646 million in 2012, primarily due to an increase in staff costs and property and related costs as
a result of a general increase in wages and salaries.
Property and related costs increased by HK$56 million, or 6.2%, to HK$960 million in 2013 from
HK$904 million in 2012, primarily due to an increase in management and agency expenses, which are
accounted for as rental expenses.
Salaries and related expenses increased by HK$87 million, or 7.2%, to HK$1,289 million in 2013
from HK$1,202 million in 2012, primarily due to an increase in wages, salaries, allowances and
bonuses as the result of general inflation.
Interest and other finance costs remained relatively stable at HK$1,094 million and HK$1,099
million in 2012 and 2013, respectively.
Depreciation and amortisation decreased by HK$23 million, or 11.5%, to HK$177 million in 2013
from HK$200 million in 2012, primarily due to lower depreciation on certain hotel properties as the
result of certain assets at the hotels being fully depreciated.
Other expenses decreased by HK$44 million, or 17.9%, to HK$202 million in 2013 from HK$246
million in 2012, primarily due to an increase in the exchange gain recognised by a subsidiary.
Share of Net Profit of Joint Ventures
Share of net profit of joint ventures decreased by HK$1,196 million, or 24.1%, to HK$3,763
million in 2013 from HK$4,959 million in 2012, primarily due to the share of profit recognised from
the disposal of the Hutchison Property Group’s interests in Marina Bay Financial Centre in 2012.
– 227 –
FINANCIAL INFORMATION
Increase in Fair Value of Investment Properties
Increase in fair value of investment properties decreased by HK$842 million, or 98.0%, to HK$17
million in 2013 from HK$859 million in 2012, which was primarily due to a relatively stable property
market in 2013.
Profits on Disposal of Investments and Others
Profits on disposal of investments and others increased significantly by HK$2,900 million to
HK$3,067 million in 2013 from HK$167 million in 2012, primarily due to the disposal in 2013 of the
Hutchison Property Group’s interests in certain office and residential properties in Hong Kong,
including Trust Tower, and in a joint venture which held The Metropolitan Plaza.
Share of Net Profit of Associates
Share of net profit of associates decreased by HK$79 million, or 39.7%, to HK$120 million in
2013 from HK$199 million in 2012, primarily due to the reclassification of an associate as a joint
venture in 2013.
Profit before Taxation
As a result of the foregoing, the Hutchison Property Group’s profit before taxation increased by
HK$1,152 million, or 12.9%, to HK$10,055 million in 2013 from HK$8,903 million in 2012.
Taxation
Taxation expenses increased by HK$238 million, or 56.0%, to HK$663 million in 2013 from
HK$425 million in 2012, primarily due to an increase in taxable income in 2013, along with the
provision of withholding tax on the disposal of the Hutchison Property Group’s interests in a joint
venture which held The Metropolitan Plaza in 2013.
Profit for the Year
As a result of the foregoing, profit for the year increased by HK$914 million, or 10.8%, to
HK$9,392 million in 2013 from HK$8,478 million in 2012.
Profit for the Year attributable to Shareholders of the Hutchison Property Group
As a result of the foregoing, profit for the year attributable to shareholders of the Hutchison
Property Group increased by HK$931 million, or 11.4%, to HK$9,110 million in 2013 from HK$8,179
million in 2012.
Profit for the Year attributable to Non-Controlling Interests
Profit for the year attributable to non-controlling interests decreased by HK$17 million, or 5.7%,
to HK$282 million in 2013 from HK$299 million in 2012, primarily due to the share of certain tax
provisions written back in 2012 attributable to the non-controlling interests.
– 228 –
FINANCIAL INFORMATION
CERTAIN ITEMS OF STATEMENTS OF FINANCIAL POSITION
Investment Properties
The Cheung Kong Property Group and the Hutchison Property Group hold certain properties for
long-term investment purposes and for recurring rental income and/or capital appreciation.
The Cheung Kong Property Group
During the Track Record Period, the investment properties held by the Cheung Kong Property
Group primarily comprised retail shopping malls and commercial office properties in Hong Kong. As at
31 December 2012, 2013 and 2014, independent property valuers valued the Cheung Kong Property
Group’s investment properties at HK$29,656 million, HK$28,777 million and HK$33,285 million,
respectively. The increase from 31 December 2013 to 31 December 2014 was primarily due to the
increase in fair value recorded from retail shopping malls and commercial office properties in Hong
Kong as a result of an increase in the rental rates at these properties due to the prevailing market
conditions. The decrease from 31 December 2012 to 31 December 2013 was primarily attributable to
the disposal of Kingswood Ginza which resulted in a lesser amount of increase in fair value recorded.
During the same periods, the Cheung Kong Property Group recorded increases in fair value of
investment properties of HK$4,470 million, HK$1,782 million and HK$4,542 million, respectively. The
increases in the fair value of the Cheung Kong Property Group’s investment properties during the Track
Record Period were primarily due to increases in the market value of the properties, resulting from
higher rental rates, as well as an improvement in property market conditions during the Track Record
Period. However, the increase in fair value grew slower in 2013 due to the reduced rate at which
property valuation grew during this period as the result of the property market remaining relatively
stable in 2012 and 2013.
The following table sets out the changes in the total fair value of the Cheung Kong Property
Group’s investment properties as at the dates indicated:
Investment properties in Hong Kong
At 1 January . . . . . . . . . . . . . . . .
Additions/Cost adjustments . . . . .
Disposals . . . . . . . . . . . . . . . . . .
Increase in fair value . . . . . . . . . .
.
.
.
.
.
.
.
.
.
.
.
.
.
.
.
.
.
.
.
.
.
.
.
.
.
.
.
.
.
.
.
.
2012
2013
2014
(HK$ million)
(HK$ million)
(HK$ million)
.
.
.
.
25,180
6
−
4,470
29,656
2
(2,663)
1,782
28,777
(34)
−
4,542
At 31 December. . . . . . . . . . . . . . . . . . . . . . . .
29,656
28,777
33,285
The Hutchison Property Group
The Hutchison Property Group’s investment properties comprised commercial properties, office
properties, residential properties and industrial properties in Hong Kong and the PRC and leased space
in hotels in Hong Kong and The Bahamas. As at 31 December 2012, 2013 and 2014, independent
property valuers valued the Hutchison Property Group’s investment properties at HK$45,983 million,
HK$44,717 million and HK$72,905 million, respectively. The increase from 31 December 2013 to 31
– 229 –
FINANCIAL INFORMATION
December 2014 was primarily due to the increase in fair value of investment properties in 2014 as
discussed below. The decrease from 31 December 2012 to 31 December 2013 was primarily attributable
to (i) the disposal of subsidiaries of HK$573 million and (ii) the transfer of a residential investment
property which was previously leased out to property, plant and equipment after converting it for the
Hutchison Property Group’s own use in 2013. The residential investment property was subsequently
partially disposed of in 2014.
During the same period, the Hutchison Property Group recorded increases in fair value of
investment properties of HK$859 million, HK$17 million and HK$28,088 million, respectively. The
increase from 31 December 2013 to 31 December 2014 was due to an improvement in market
conditions in 2014 as a result of the high global liquidity and easing of investor concerns over a
potential increase in interest rates, which boosted the overall investor confidence and sentiment. As a
result of the changes in market conditions, the independent property valuers changed certain
assumptions used to value the investment properties, including reducing the weighted average
capitalisation rate used from 8.7% as at 31 December 2013 to 6.1% as at 31 December 2014. The
decrease in the fair value of the Hutchison Property Group’s investment properties from 31 December
2012 to 31 December 2013 was primarily due to the smaller valuation gain in 2013 as a result of the
property market remaining relatively stable in 2012 and 2013.
The following table sets out the changes in the fair value of the Hutchison Property Group’s
investment properties as at the dates indicated:
At 1 January. . . . . . . . . . . . . . . . . . . . . . . . . . .
Additions . . . . . . . . . . .
Disposals . . . . . . . . . . .
Disposal of subsidiaries .
Changes in fair value . .
Transfer to fixed assets .
Exchange differences. . .
.
.
.
.
.
.
.
.
.
.
.
.
.
.
.
.
.
.
.
.
.
.
.
.
.
.
.
.
.
.
.
.
.
.
.
.
.
.
.
.
.
.
.
.
.
.
.
.
.
.
.
.
.
.
.
.
.
.
.
.
.
.
.
.
.
.
.
.
.
.
.
.
.
.
.
.
.
.
.
.
.
.
.
.
.
.
.
.
.
.
.
.
.
.
.
.
.
.
.
.
.
.
.
.
.
.
.
.
At 31 December. . . . . . . . . . . . . . . . . . . . . . . .
2012
2013
2014
(HK$ million)
(HK$ million)
(HK$ million)
45,020
228
(34)
(90)
859
−
−
45,983
45,983
44,717
427
(98)
(573)
17
(1,040)
1
122
(21)
−
28,088
−
(1)
44,717
72,905
Fixed Assets
Fixed assets primarily comprise land and buildings, including hotels and serviced suites properties
held for operation, plant, machinery and equipment and motor vehicles. Fixed assets are generally
stated at cost less depreciation and provision for impairment.
– 230 –
FINANCIAL INFORMATION
The Cheung Kong Property Group
The Cheung Kong Property Group’s fixed assets amounted to HK$10,093 million, HK$9,942
million and HK$9,928 million as at 31 December 2012, 2013 and 2014, respectively. The decrease over
the Track Record Period was primarily due to the depreciation of the hotels and serviced suites
properties in Hong Kong, which exceeded the value of new additions to the properties during the
respective periods.
The Hutchison Property Group
The Hutchison Property Group’s fixed assets amounted to HK$4,620 million, HK$4,971 million
and HK$4,627 million as at 31 December 2012, 2013 and 2014, respectively. The decrease from 31
December 2013 to 31 December 2014 was primarily due to the disposal of certain fixed assets in 2014,
namely a residential investment property that was transferred to property, plant and equipment after
converting it for the Hutchison Property Group’s own use in 2013. The increase from 31 December
2012 to 31 December 2013 was primarily due to certain investment properties being transferred and
reclassified as fixed assets.
Associates
Investments in associates are accounted for by incorporating the results of associates in the
financial statements and making adjustments as necessary to ensure consistency with the accounting
policies of the Cheung Kong Property Group and the Hutchison Property Group.
The Cheung Kong Property Group
As at 31 December 2012, 2013 and 2014, the Cheung Kong Property Group’s investments in
associates amounted to HK$3 million, HK$3 million and HK$2 million, respectively, and primarily
reflected its interest in a property management company in Hong Kong.
The Hutchison Property Group
As at 31 December 2012, 2013 and 2014, the Hutchison Property Group’s interests in associates
amounted to HK$1,762 million, HK$2,122 million and HK$2,346 million, respectively. The increase
from 31 December 2013 to 31 December 2014 was primarily attributable to the increase in share of
undistributed post acquisition reserves as a result of an increase in the fair value of investment
properties held by associates. The increase from 31 December 2012 to 31 December 2013 was primarily
attributable to the increase in amounts due from associates.
– 231 –
FINANCIAL INFORMATION
The following table sets out a breakdown of the results of the Hutchison Property Group’s
interests in associates as at the dates indicated:
As at 31 December
Unlisted shares . . . . . . . . . . . . . . . . . . . . . . . . .
Share of undistributed post acquisition reserves. .
Amounts due from associates . . . . . . . . . . . . . . .
Amounts due to associates . . . . . . . . . . . . . . . . .
Total . . . . . . . . . . . . . . . . . . . . . . . . . . . . . . . .
2012
2013
2014
(HK$ million)
(HK$ million)
(HK$ million)
832
913
158
832
952
498
832
1,074
479
1,903
2,282
2,385
(141)
1,762
(160)
2,122
(39)
2,346
Joint Ventures
Joint ventures represent investments in joint ventures, the share of results less dividends and
amounts due from joint ventures. Immediately following completion of the Property Businesses
Combination, a substantial portion of the joint ventures between the Cheung Kong Property Group and
the Hutchison Property Group will become subsidiaries of the Company and be consolidated into the
financial statements of the Group. The financial information of the remaining non-consolidated joint
ventures will continue to be recorded as share of net profits from joint ventures under the equity
method of accounting.
The Cheung Kong Property Group
During the Track Record Period, the Cheung Kong Property Group held interests in a number of
joint ventures. See Note 10 to “Appendix IA – Accountants’ Report on the Cheung Kong Property
Group” for more details.
As at 31 December 2012, 2013 and 2014, the Cheung Kong Property Group’s interests in joint
ventures amounted to HK$46,069 million, HK$45,306 million and HK$45,895 million, respectively. The
increase from 31 December 2013 to 31 December 2014 was primarily attributable to the net increase in
amounts due from joint ventures, which was partially offset by the disposal of interests in a joint
venture which held Oriental Financial Center in 2014. The decrease from 31 December 2012 to 31
December 2013 was primarily due to a portion of share premiums of certain joint ventures in the PRC
being distributed to shareholders and the disposal of interests in a joint venture which held The
Metropolitan Plaza in 2013.
– 232 –
FINANCIAL INFORMATION
The following table sets out the investment results of the Cheung Kong Property Group’s joint
ventures as at the dates indicated:
As at 31 December
Investments in unlisted joint ventures . . . . . . . . .
Share of results less dividends . . . . . . . . . . . . . .
2012
2013
2014
(HK$ million)
(HK$ million)
(HK$ million)
17,803
22,071
13,275
25,263
13,006
23,613
39,874
38,538
36,619
Amounts due from joint ventures . . . . . . . . . . . .
6,195
6,768
9,276
Total . . . . . . . . . . . . . . . . . . . . . . . . . . . . . . . .
46,069
45,306
45,895
The Hutchison Property Group
During the Track Record Period, the Hutchison Property Group held interests in a number of joint
ventures. See Note 12 to “Appendix IB – Accountants’ Report on the Hutchison Property Group” for
more details.
As at 31 December 2012, 2013 and 2014, the Hutchison Property Group’s interests in joint
ventures amounted to HK$38,319 million, HK$40,683 million and HK$42,767 million, respectively. The
increase from 31 December 2013 to 31 December 2014 was primarily attributable to the increase in the
net amounts due from joint ventures. The increase from 31 December 2012 to 31 December 2013 was
primarily attributable to the increase in the net amounts due from joint ventures, partially offset by the
decrease in the interests in unlisted shares as a result of a portion of share premium being returned to
shareholders by joint ventures.
The following table sets out the investment results of the Hutchison Property Group’s joint
ventures as at the dates indicated:
As at 31 December
Unlisted shares . . . . . . . . . . . . . . . . . . . . . . . . .
Share of undistributed post acquisition reserves. .
Amounts due from joint ventures . . . . . . . . . . . .
2012
2013
2014
(HK$ million)
(HK$ million)
(HK$ million)
17,546
20,141
8,573
12,992
21,629
9,005
12,649
20,673
11,365
46,260
43,626
44,687
Amounts due to joint ventures . . . . . . . . . . . . . .
(7,941)
(2,943)
(1,920)
Total . . . . . . . . . . . . . . . . . . . . . . . . . . . . . . . .
38,319
40,683
42,767
– 233 –
FINANCIAL INFORMATION
Stock of Properties
Our property portfolio comprises properties for/under development, joint development projects and
properties for sale. Joint development projects refer to property projects that the Cheung Kong Property
Group jointly develops with third parties.
The Cheung Kong Property Group
The following table sets out a breakdown of the Cheung Kong Property Group’s stock of
properties as at the dates indicated:
As at 31 December
2012
2013
2014
(HK$ million)
(HK$ million)
(HK$ million)
Properties for/under development . . . . . . . . . . . .
Joint development projects. . . . . . . . . . . . . . . . .
Properties for sale . . . . . . . . . . . . . . . . . . . . . . .
48,923
29,746
1,447
50,638
27,420
1,757
47,292
21,903
4,064
Total . . . . . . . . . . . . . . . . . . . . . . . . . . . . . . . .
80,116
79,815
73,259
Properties for/under development
The Cheung Kong Property Group’s properties for/under development decreased from HK$50,638
million as at 31 December 2013 to HK$47,292 million as at 31 December 2014, primarily due to the
completion of several property projects in Hong Kong, including Kennedy Park at Central, The Rise
and Mont Vert Phase I during this period.
The Cheung Kong Property Group’s properties for/under development increased from HK$48,923
million as at 31 December 2012 to HK$50,638 million as at 31 December 2013, primarily due to the
increase in development costs paid for various property projects in Hong Kong in 2013.
Joint development projects
The Cheung Kong Property Group’s joint development projects decreased from HK$27,420
million as at 31 December 2013 to HK$21,903 million as at 31 December 2014, primarily due to the
completion of certain joint development projects, including Trinity Towers, City Point and Hemera in
Hong Kong in 2014.
The Cheung Kong Property Group’s joint development projects decreased from HK$29,746
million as at 31 December 2012 to HK$27,420 million as at 31 December 2013, primarily due to the
completion of The Beaumount in Hong Kong in 2013.
Properties for sale
The Cheung Kong Property Group’s properties for sale increased from HK$1,757 million as at 31
December 2013 to HK$4,064 million as at 31 December 2014, primarily due to the completion of
several property projects, including Mont Vert Phase I and The Rise, in Hong Kong during this period.
– 234 –
FINANCIAL INFORMATION
The Cheung Kong Property Group’s properties for sale increased from HK$1,447 million as at 31
December 2012 to HK$1,757 million as at 31 December 2013, primarily due to the completion of One
West Kowloon in Hong Kong in 2013.
The Hutchison Property Group
During the Track Record Period, the Hutchison Property Group’s stock of properties comprised
properties under development, which represent property development projects in the United Kingdom.
As at 31 December 2012, 2013 and 2014, properties under development amounted to HK$1,362 million,
HK$1,410 million and HK$1,388 million, respectively.
Debtors, Deposits and Prepayments
The Cheung Kong Property Group
Debtors, deposits and prepayments comprise trade debtors, loan receivables, and deposits and
prepayments from purchasers and tenants of the Cheung Kong Property Group’s properties. The
following table sets out a breakdown of the Cheung Kong Property Group’s debtors, deposits and
prepayments as at the dates indicated:
As at 31 December
2012
2013
2014
(HK$ million)
(HK$ million)
(HK$ million)
Trade debtors . . . . . . . . . . . . . . . . . . . . . . . . . .
Loan receivables . . . . . . . . . . . . . . . . . . . . . . . .
Deposits, prepayments and others. . . . . . . . . . . .
1,194
21
342
1,512
13
306
1,549
13
248
Total . . . . . . . . . . . . . . . . . . . . . . . . . . . . . . . .
1,557
1,831
1,810
23
32
24
Trade debtors’ turnover days
(1)
...........
Note:
(1)
Trade debtors’ turnover days is calculated by dividing trade debtors at the end of the period by turnover and
multiplying the resulting value by 365 days.
Trade debtors
Trade debtors primarily comprise receivables for sales of properties and property management.
The sales terms vary for each property project and are determined by reference to the prevailing market
conditions. The increase from 31 December 2013 to 31 December 2014 was primarily due to the
increase in turnover from the provision of property management services. The increase in trade debtors
from 31 December 2012 to 31 December 2013 was primarily due to the increase in sales of properties
in the PRC.
– 235 –
FINANCIAL INFORMATION
Trade debtors’ turnover days decreased from 2013 to 2014, primarily due to more receivables
from the increased sale of car park spaces sold in Hong Kong in the latter half of 2013 being settled in
2014. Trade debtors’ turnover days increased from 2012 to 2013, primarily due to the increase in
debtors from sales of properties in the PRC.
The following table sets forth an ageing analysis of the Cheung Kong Property Group’s trade
debtors as at the dates indicated:
As at 31 December
2012
2013
2014
(HK$ million)
(HK$ million)
(HK$ million)
Current to one month . . . . . . . . . . . . . . . . . . . .
Two to three months . . . . . . . . . . . . . . . . . . . . .
Over three months . . . . . . . . . . . . . . . . . . . . . .
1,154
33
7
1,455
40
17
1,487
43
19
Total . . . . . . . . . . . . . . . . . . . . . . . . . . . . . . . .
1,194
1,512
1,549
The following table sets forth an ageing analysis of the Cheung Kong Property Group’s trade
debtors past due but not impaired as at the dates indicated:
As at 31 December
2012
2013
2014
(HK$ million)
(HK$ million)
(HK$ million)
Overdue within one month. . . . . . . . . . . . . . . . .
Overdue for two to three months . . . . . . . . . . . .
Overdue over three months . . . . . . . . . . . . . . . .
47
26
7
111
34
17
47
39
18
Total . . . . . . . . . . . . . . . . . . . . . . . . . . . . . . . .
80
162
104
Loan receivables
Loan receivables primarily comprise mortgage loan receivables from property purchasers and
carry interest at rates with reference to market lending rates. The loans are secured by collateral and
other credit enhancements such as charge on assets and guarantees. Loan receivables remained stable at
HK$13 million as at 31 December 2013 and 31 December 2014. The decrease in loan receivables from
31 December 2012 to 31 December 2013 was primarily due to payments received from property
purchasers.
Deposits, prepayments and others
Deposits, prepayments and others primarily comprise interest receivables and deposits and
prepayments for the Cheung Kong Property Group’s property development business. The decrease in
deposits, prepayments and others from 31 December 2013 to 31 December 2014 was primarily due to
the settlement of receivables arising from the disposal of interests in a joint venture which held The
– 236 –
FINANCIAL INFORMATION
Metropolitan Plaza in 2013. The decrease in deposits, prepayments and others from 31 December 2012
to 31 December 2013 was primarily due to the settlement of receivables due to the disposal of interests
in a joint venture which held the Metropark Lido Hotel in 2012.
The Cheung Kong Property Group carries out regular reviews of overdue amounts and implements
follow-up actions to minimise credit risk exposures. As at 31 December 2014, overdue trade debtors
accounted for 0.6% of the Cheung Kong Property Group’s profit for the year and credit risk on trade
debtors was determined to be negligible after assessment by the Cheung Kong Property Group. As at 31
March 2015, HK$606 million of the Cheung Kong Property Group’s trade debtors as at 31 December
2014 had been settled.
The Hutchison Property Group
The following table sets out a breakdown of the Hutchison Property Group’s debtors, deposits and
prepayments as at the dates indicated:
As at 31 December
2012
2013
2014
(HK$ million)
(HK$ million)
(HK$ million)
Debtors . . . . . . . . . . . . . . . . . . . . . . . . . . . . . .
Other receivables, deposits and prepayments . . . .
1,310
1,113
1,257
3,518
1,408
1,765
Total . . . . . . . . . . . . . . . . . . . . . . . . . . . . . . . .
2,423
4,775
3,173
77
69
74
Debtors’ turnover days
(1)
................
Note:
(1)
Debtors’ turnover days is calculated by dividing trade debtors at the end of the period by turnover and multiplying
the resulting value by 365 days.
Debtors
Debtors comprise receivables for rentals and for property and project management services. The
increase in debtors from 31 December 2013 to 31 December 2014 was primarily due to the increase in
turnover. The decrease in debtors from 31 December 2012 to 31 December 2013 was primarily due to
higher rates of settlement of rent from tenants.
The increase in debtors’ turnover days from 2013 to 2014 was primarily due to the delayed
payment of certain receivables for project management services from joint ventures. The decrease in
debtors’ turnover days from 2012 to 2013 was primarily due to a higher rate of settlement as a result of
increased payment collection efforts.
– 237 –
FINANCIAL INFORMATION
The following table sets out an ageing analysis of the Hutchison Property Group’s debtors
(presented based on the invoice date) as at the dates indicated:
As at 31 December
Less than 31 days . . .
Within 31 to 60 days.
Within 61 to 90 days.
Over 90 days . . . . . .
.
.
.
.
.
.
.
.
.
.
.
.
.
.
.
.
.
.
.
.
.
.
.
.
.
.
.
.
.
.
.
.
.
.
.
.
.
.
.
.
.
.
.
.
.
.
.
.
.
.
.
.
.
.
.
.
.
.
.
.
.
.
.
.
.
.
.
.
.
.
.
.
.
.
.
.
2012
2013
2014
(HK$ million)
(HK$ million)
(HK$ million)
.
.
.
.
279
13
156
862
235
9
133
880
178
14
135
1,081
Total . . . . . . . . . . . . . . . . . . . . . . . . . . . . . . . .
1,310
1,257
1,408
The following table sets out an ageing analysis of the Hutchison Property Group’s debtors past
due but not impaired as at the dates indicated:
As at 31 December
Past
Past
Past
Past
due
due
due
due
less than 31 days . . .
within 31 to 60 days
within 61 to 90 days
over 90 days . . . . . .
.
.
.
.
.
.
.
.
.
.
.
.
.
.
.
.
.
.
.
.
.
.
.
.
.
.
.
.
.
.
.
.
.
.
.
.
.
.
.
.
.
.
.
.
.
.
.
.
.
.
.
.
2012
2013
2014
(HK$ million)
(HK$ million)
(HK$ million)
.
.
.
.
231
2
153
851
192
1
130
872
150
12
135
1,081
Total . . . . . . . . . . . . . . . . . . . . . . . . . . . . . . . .
1,237
1,195
1,378
Debtors past due over 90 days primarily comprise receivables for project management from joint
ventures in the PRC. The settlement of such debtors was delayed as the result of remittances from the
PRC to Hong Kong being subject to foreign exchange procedures and withholding tax clearance.
Other receivables, deposits and prepayments
Other receivables, deposits and prepayments comprise deposits and prepayments for rental of our
properties. The decrease in other receivables, deposits and prepayments from 31 December 2013 to 31
December 2014 was primarily due to the settlement of the receivables that accrued in 2013. The
significant increase in other receivables, deposits and prepayments from 31 December 2012 to 31
December 2013 was primarily due to receivables due from the disposal of a property in Hong Kong and
certain subsidiaries.
The Hutchison Property Group carries out regular reviews of overdue amounts and implements
follow-up actions to minimise credit risk exposures. It also regularly reviews the recoverable amount of
each individual receivable to ensure that adequate impairment losses are made for irrecoverable
amounts. As at 31 December 2014, overdue debtors and other receivables accounted for 3.8% of the
Hutchison Property Group’s profit for the year and credit risk on debtors and other receivables after
– 238 –
FINANCIAL INFORMATION
mitigation by utilising collateral and other credit enhancements was determined to be negligible after
assessment by the Hutchison Property Group. As at 31 March 2015, HK$188 million of the Hutchison
Property Group’s debtors as at 31 December 2014 had been settled.
Creditors and Accruals
The Cheung Kong Property Group
Creditors and accruals primarily comprise trade creditors, accruals and other creditors and
customers’ deposits received. The following table sets out a breakdown of the Cheung Kong Property
Group’s creditors and accruals as at the dates indicated:
As at 31 December
2012
2013
2014
(HK$ million)
(HK$ million)
(HK$ million)
Trade creditors . . . . . . . . . . . . . . . . . . . . . . . . .
Accruals and other creditors . . . . . . . . . . . . . . .
Customers’ deposits received . . . . . . . . . . . . . . .
2,575
2,526
6,998
1,082
2,684
7,207
1,618
2,884
5,991
Total . . . . . . . . . . . . . . . . . . . . . . . . . . . . . . . .
12,099
10,973
10,493
49
23
25
Trade creditors’ turnover days
(1)
..........
Note:
(1)
Trade creditors’ turnover days is calculated by dividing trade creditors at the end of the period by turnover and
multiplying the resulting value by 365 days.
Trade creditors
Trade creditors primarily comprise land and construction cost payables. The increase in trade
creditors from 31 December 2013 to 31 December 2014 was primarily due to the increase in
construction cost payables as the result of more property completions in 2014. The decrease in trade
creditors from 31 December 2012 to 31 December 2013 was primarily due to the settlement of certain
land and construction cost payables.
Trade creditors’ turnover days remained relatively stable in 2013 and 2014. Trade creditors’
turnover days decreased from 2012 to 2013, primarily due to the settlement of outstanding land
consideration for a joint development project in Hong Kong for which the Cheung Kong Property
Group successfully bid in 2012.
– 239 –
FINANCIAL INFORMATION
The following table sets out an ageing analysis of the Cheung Kong Property Group’s trade
creditors as at the dates indicated:
As at 31 December
2012
2013
2014
(HK$ million)
(HK$ million)
(HK$ million)
Current to one month . . . . . . . . . . . . . . . . . . . .
Two to three months . . . . . . . . . . . . . . . . . . . . .
Over three months . . . . . . . . . . . . . . . . . . . . . .
2,513
38
24
1,071
7
4
1,563
24
31
Total . . . . . . . . . . . . . . . . . . . . . . . . . . . . . . . .
2,575
1,082
1,618
Accruals and other creditors
Accruals and other creditors primarily comprise accrued construction costs and deposits received
from tenants. The increase in accruals and other creditors from 31 December 2012 to 31 December
2013 and further to 31 December 2014 was primarily due to an increase in accrued construction costs
and interest expense as a result of more property developments being constructed and completed over
time.
Customers’ deposits received
Customers’ deposits received primarily comprise deposits received for sales of properties. The
decrease in customers’ deposits received from 31 December 2013 to 31 December 2014 was primarily
due to an increase in the portion of deposits recognised as turnover as a result of more property
projects being completed in 2014. The increase in customers’ deposits received from 31 December 2012
to 31 December 2013 was primarily due to an increase in the number of pre-sold properties in 2013.
Creditors and accrual amounts do not bear interest and are usually settled with reference to the
terms offered by the creditors. As at 31 March 2015, HK$540 million of the Cheung Kong Property
Group’s trade creditors as at 31 December 2014 had been settled.
– 240 –
FINANCIAL INFORMATION
The Hutchison Property Group
Creditors and accruals comprise creditors, other payables and accruals and customers’ deposits
received. The following table sets out a breakdown of the Hutchison Property Group’s creditors and
accruals as at the dates indicated:
As at 31 December
2012
2013
2014
(HK$ million)
(HK$ million)
(HK$ million)
Creditors . . . . . . . . . . . . . . . . . . . . . . . . . . . . .
Other payables and accruals. . . . . . . . . . . . . . . .
Customers’ deposits received . . . . . . . . . . . . . . .
79
2,448
576
69
4,254
632
78
3,088
692
Total . . . . . . . . . . . . . . . . . . . . . . . . . . . . . . . .
3,103
4,955
3,858
5
4
4
Creditors’ turnover days
(1)
...............
Note:
(1)
Creditors’ turnover days is calculated by dividing trade creditors at the end of the period by turnover and
multiplying the resulting value by 365 days.
Creditors
Creditors comprise rental payments and operating expenditures associated with property and
project management. The amount of Hutchison Property Group’s creditors remained relatively stable
during the Track Record Period.
Creditors’ turnover days remained stable during the Track Record Period.
The following table sets out an ageing analysis of the Hutchison Property Group’s creditors as at
the dates indicated:
As at 31 December
Less than 31 days . . .
Within 31 to 60 days.
Within 61 to 90 days.
Over 90 days . . . . . .
.
.
.
.
.
.
.
.
.
.
.
.
.
.
.
.
.
.
.
.
.
.
.
.
.
.
.
.
.
.
.
.
.
.
.
.
.
.
.
.
.
.
.
.
.
.
.
.
.
.
.
.
.
.
.
.
.
.
.
.
.
.
.
.
.
.
.
.
.
.
.
.
.
.
.
.
2012
2013
2014
(HK$ million)
(HK$ million)
(HK$ million)
.
.
.
.
47
13
3
16
54
12
2
1
43
28
3
4
Total . . . . . . . . . . . . . . . . . . . . . . . . . . . . . . . .
79
69
78
– 241 –
FINANCIAL INFORMATION
Other payables and accruals
Other payables and accruals comprise amounts due to property management funds, deposits from
sales and accrued expenses. The decrease in other payables and accruals from 31 December 2013 to 31
December 2014 was primarily due to deposits from sales being written off to our profit and loss
account. The significant increase in other payables and accruals from 31 December 2012 to 31
December 2013 was primarily due to deposits received from the sale of a joint venture.
Customers’ deposits received
Customers’ deposits received comprise deposits received for rental. The increase in customers’
deposits received during the Track Record Period was primarily due to the increase in our property
rental during this period.
Creditors and accruals do not bear interest and are usually settled within 60 days. As at 31 March
2015, HK$47 million of the Hutchison Property Group’s creditors as at 31 December 2014 had been settled.
NET CURRENT ASSETS/LIABILITIES
The Cheung Kong Property Group
The following table sets forth the Cheung Kong Property Group’s current assets and current
liabilities as at the dates indicated:
As at 31 December
Current Assets
Stock of properties . . . . . . . . .
Debtors, deposits and
prepayments . . . . . . . . . . . .
Amounts due from the Cheung
Kong Group . . . . . . . . . . . .
Bank balances and deposits . . .
As at 31 March
2012
2013
2014
2015
(HK$ million)
(HK$ million)
(HK$ million)
(HK$ million)
.
80,116
79,815
73,259
71,954
.
1,557
1,831
1,810
4,873
.
.
1,906
12,896
975
10,069
1,210
10,354
562
13,359
Total current assets . . . . . . . . .
96,475
92,690
86,633
90,748
(12,099)
(10,973)
(10,493)
(10,557)
(91,903)
(300)
(518)
(275)
(79,891)
−
−
(730)
(70,707)
(250)
−
(1,346)
(71,991)
(340)
−
(1,725)
Total current liabilities . . . . . .
(105,095)
(91,594)
(82,796)
(84,613)
Net current (liabilities) assets .
(8,620)
1,096
3,837
6,135
Current Liabilities
Creditors and accruals . . . . . . . .
Amounts due to the Cheung
Kong Group . . . . . . . . . . . . .
Borrowings. . . . . . . . . . . . . . . .
Derivative financial instruments .
Provision for taxation . . . . . . . .
– 242 –
FINANCIAL INFORMATION
Stock of properties and bank balances and deposits constituted the largest components of the
Cheung Kong Property Group’s current assets during the Track Record Period. Creditors and accruals
and amounts due to the Cheung Kong Group constituted the largest components of the Cheung Kong
Property Group’s current liabilities during the Track Record Period.
The Cheung Kong Property Group recorded net current liabilities of HK$8,620 million as at 31
December 2012 and net current assets of HK$1,096 million, HK$3,837 million and HK$6,135 million
as at 31 December 2013 and 2014 and 31 March 2015, respectively.
The increase in net current assets from HK$1,096 million in 2013 to HK$3,837 million in 2014
primarily reflected a decrease in amounts due to the Cheung Kong Group from HK$79,891 million as
at 31 December 2013 to HK$70,707 million as at 31 December 2014 as the Cheung Kong Property
Group repaid a portion of the amounts due to the Cheung Kong Group, partially offset by a decrease in
stock of properties from HK$79,815 million as at 31 December 2013 to HK$73,259 million as at 31
December 2014 resulting from an increase in property sales.
The change from net current liabilities of HK$8,620 million in 2012 to net current assets of
HK$1,096 million in 2013 primarily reflected (i) a decrease in amounts due to the Cheung Kong Group
from HK$91,903 million as at 31 December 2012 to HK$79,891 million as at 31 December 2013 as the
Cheung Kong Property Group repaid a portion of the amounts due to the Cheung Kong Group and (ii)
a decrease in creditors and accruals from HK$12,099 million in 2012 to HK$10,973 million in 2013
due to the settlement of certain trade creditors, partially offset by a decrease in bank balances and
deposits from HK$12,896 million in 2012 to HK$10,069 million in 2013.
The Cheung Kong Property Group’s net current liabilities position as at 31 December 2012 was
primarily due to the Cheung Kong Property Group using advances from the Cheung Kong Group to
fund investments in joint ventures, which are accounted for as non-current assets on the balance sheet.
As at 31 March 2015, being the latest practicable date for the purposes of this statement, the
Cheung Kong Property Group’s net current assets were HK$6,135 million, consisting of HK$90,748
million in current assets and HK$84,613 million in current liabilities.
The amounts due to the Cheung Kong Group that are of a non-trade nature will be settled
immediately following completion of the Property Businesses Combination. Please refer to
“− Significant Factors Affecting Comparability of Our Results of Operations – Loan Facilities, Loan
Consolidation and Finance Costs” for more details. Other than the amounts due from the CPB
Specified Companies (being the entities in which the Cheung Kong Group will continue to hold shares
pending the Third Party Consents being obtained) to the Group, no amount which is of a non-trade
nature will be due from the Cheung Kong Group to the Group immediately before and upon completion
of the Property Businesses Combination.
– 243 –
FINANCIAL INFORMATION
The Hutchison Property Group
The following table sets forth the Hutchison Property Group’s current assets and current liabilities
as at the dates indicated:
As at 31 December
Current Assets
Stock of properties . . . . . .
Debtors, deposits and
prepayments . . . . . . . . .
Amounts due from the
Hutchison Group . . . . . .
Bank balances and deposits
As at 31 March
2012
2013
2014
2015
(HK$ million)
(HK$ million)
(HK$ million)
(HK$ million)
....
1,362
1,410
1,388
1,330
....
2,423
4,775
3,173
3,753
....
....
32,601
8,995
40,591
4,231
47,867
3,361
42,906
1,766
Total current assets . . . . . . . . .
45,381
51,007
55,789
49,755
.
3,103
4,955
3,858
4,221
.
.
.
25,442
739
126
21,217
150
361
27,790
756
615
26,899
752
810
Total current liabilities . . . . . .
29,410
26,683
33,019
32,682
Net current assets . . . . . . . . .
15,971
24,324
22,770
17,073
Current Liabilities
Creditors and accruals . . . . . . .
Amounts due to the Hutchison
Group . . . . . . . . . . . . . . . . .
Borrowings. . . . . . . . . . . . . . .
Provision for taxation . . . . . . .
Amounts due from the Hutchison Group constituted the largest component of the Hutchison
Property Group’s current assets during the Track Record Period. Amounts due to the Hutchison Group
and creditors and accruals constituted the largest components of the Hutchison Property Group’s current
liabilities during the Track Record Period.
The Hutchison Property Group recorded net current assets of HK$15,971 million, HK$24,324
million, HK$22,770 million and HK$17,073 million in 2012, 2013 and 2014 and as at 31 March 2015,
respectively.
The decrease in net current assets from HK$24,324 million as at 31 December 2013 to
HK$22,770 million as at 31 December 2014 was primarily due to (i) a decrease in debtors, deposits and
prepayments from HK$4,775 million as at 31 December 2013 to HK$3,173 million as at 31 December
2014 due to the settlement of certain receivables due from the disposal of a property in Hong Kong and
the disposal of certain subsidiaries and (ii) a decrease in bank balances and deposits due to less cash
repatriated from joint ventures in 2014.
– 244 –
FINANCIAL INFORMATION
The increase in net current assets from HK$15,971 million as at 31 December 2012 to HK$24,324
million as at 31 December 2013 was primarily due to (i) the increase in net amounts due from the
Hutchison Group from HK$7,159 million as at 31 December 2012 to HK$19,374 million as at 31
December 2013 due to an increase in the amount of surplus cash deposited with the Hutchison Group
as part of its centralised cash management and (ii) the increase in debtors, deposits and prepayments
from HK$2,423 million as at 31 December 2012 to HK$4,775 million as at 31 December 2013 due to
receivables from the disposal of a property in Hong Kong and the disposal of certain subsidiaries,
partially offset by (i) a decrease in bank balances and deposits from HK$8,995 million as at 31
December 2012 to HK$4,231 million as at 31 December 2013 and (ii) an increase in creditors and
accruals from HK$3,103 million as at 31 December 2012 to HK$4,955 million as at 31 December 2013
due to deposits received from the disposal of a joint venture.
As at 31 March 2015, being the latest practicable date for the purposes of this statement, the
Hutchison Property Group’s net current assets were HK$17,073 million, consisting of HK$49,755
million in current assets and HK$32,682 million in current liabilities.
The amounts due to the Hutchison Group that are of a non-trade nature will be settled
immediately following completion of the Property Businesses Combination. Please refer to “−
Significant Factors Affecting Comparability of Our Results of Operations – Loan Facilities, Loan
Consolidation and Finance Costs” for more details. Other than the amounts due from the CPB
Specified Companies (being the entities in which the Hutchison Group will continue to hold shares
pending the Third Party Consents being obtained) to the Group, no amount which is of a non-trade
nature will be due from the Hutchison Group to the Group immediately before and upon completion of
the Property Businesses Combination.
INDEBTEDNESS
During the Track Record Period, the Cheung Kong Property Group and the Hutchison Property
Group funded their capital requirements primarily through borrowings from their non-property business,
cash generated from operations and loans from joint ventures. The Hutchison Property Group also used
bank borrowings as a source of funding. In the future, the Group will use funding from cash generated
from operations, bank borrowings and funding raised from the capital markets to finance working
capital, debt service requirements and capital expenditure. The Group has also entered into the Loan
Facilities.
Amounts due to the Combined Non-Property Businesses
Prior to the Listing, the Cheung Kong Property Group and the Hutchison Property Group
centralised their cash management at their respective former parent groups (namely, the Cheung Kong
Group and the Hutchison Group). This centralised cash management included advances from their
respective former parent groups and transfers of income from operations from the Cheung Kong
Property Group and the Hutchison Property Group to their respective former parent groups.
Upon completion of the Property Businesses Combination, two promissory notes will be issued by
the Company to CKH Holdings and the amounts due to the Combined Non-Property Businesses that are
of a non-trade nature will be settled as described in “History and Reorganisation – The
Reorganisation”.
– 245 –
FINANCIAL INFORMATION
The Cheung Kong Property Group
As at 31 December 2012, 2013 and 2014, amounts due to the Cheung Kong Group amounted to
HK$91,903 million, HK$79,891 million and HK$70,707 million, respectively (after taking into account
the amounts due from the Cheung Kong Group, net amounts due to the Cheung Kong Group amounted
to HK$89,997 million, HK$78,916 million and HK$69,497 million, respectively). The decrease in net
amounts due to the Cheung Kong Group over the Track Record Period was primarily due to repayments
made each year. As at the same dates, amounts due to the Cheung Kong Group of HK$53,238 million,
HK$46,803 million and HK$43,620 million, respectively, bore interest at an average rate of 2.2%, 2.5%
and 2.5%, respectively. The remaining portions of amounts due to the Cheung Kong Group were
unsecured, interest-free and had no fixed terms of repayment. The amounts approximate their fair
values as at the same dates.
As at 31 March 2015, amounts due to the Cheung Kong Group were HK$29,354 million.
As at 31 March 2015, loans from the Cheung Kong Group were HK$42,637 million.
During the Track Record Period, the Cheung Kong Property Group did not breach any of the
material covenants of its borrowings from the non-property business of the Cheung Kong Group.
The Hutchison Property Group
As at 31 December 2012, 2013 and 2014, amounts due to the Hutchison Group amounted to
HK$55,850 million, HK$51,332 million and HK$57,100 million, respectively (after taking into account
the amounts due from the Hutchison Group, net amounts due to the Hutchison Group amounted to
HK$23,249 million, HK$10,741 million and HK$9,233 million, respectively). The decrease in net
amounts due to the Hutchison Group over the Track Record Period was primarily due to repayments
made each year. As at the same dates, amounts due to the Hutchison Group of HK$27,407 million,
HK$27,404 million and HK$26,609 million, respectively, bore interest at an average rate of 4.0%, 4.1%
and 4.6%, respectively. The remaining portions of amounts due to the Hutchison Group were unsecured,
interest-free and had no fixed terms of repayment. The amounts approximate their fair values as at the
same dates.
As at 31 March 2015, amounts due to the Hutchison Group were HK$26,899 million.
As at 31 March 2015, loans from the Hutchison Group were HK$22,575 million.
During the Track Record Period, the Hutchison Property Group did not breach any of the material
covenants of its borrowings from the non-property business of the Hutchison Group.
Loans from Joint Ventures and Interest-bearing Bank Loans
The Cheung Kong Property Group
The Cheung Kong Property Group’s interest-bearing loans from joint ventures amounted to
HK$615 million, HK$610 million and HK$600 million as at 31 December 2012, 2013 and 2014,
respectively. The loans represent amounts due to a joint venture in which the Cheung Kong Property
Group and the Hutchison Property Group are co-invested, and are used to fund the operations of certain
hotels in Hong Kong. These loans are unsecured, and bore interest at prime rate during the Track
Record Period. The decrease over the Track Record Period was primarily due to partial repayments of
– 246 –
FINANCIAL INFORMATION
the outstanding amounts during each respective period. As at 31 March 2015, the Cheung Kong
Property Group’s interest-bearing loans from the joint venture amounted to HK$640 million. As at the
same date, the effective interest rates on such loans did not materially change as compared to 31
December 2014.
As at 31 March 2015, the Cheung Kong Property Group had no outstanding bank loans.
All of the Cheung Kong Property Group’s loans from joint ventures during the Track Record
Period were denominated in Hong Kong dollars and originated in Hong Kong. The following table sets
out the maturity of the Cheung Kong Property Group’s loans from joint ventures as at the dates
indicated:
As at 31
March
As at 31 December
2012
2013
2014
2015
(HK$
million)
(HK$
million)
(HK$
million)
(HK$
million)
Loans repayable
Within one year . . . . . . . . . . . . . . . . . . . .
After one year but not exceeding two
years . . . . . . . . . . . . . . . . . . . . . . . . . .
After two years but not exceeding five
years . . . . . . . . . . . . . . . . . . . . . . . . . .
Total . . . . . . . . . . . . . . . . . . . . . . . . . . . .
300
−
250
340
−
250
50
–
315
360
300
300
615
610
600
640
The Hutchison Property Group
The Hutchison Property Group had interest-bearing bank and other loans of HK$839 million,
HK$794 million and HK$806 million as at 31 December 2012, 2013 and 2014, respectively. The
increase from 31 December 2013 to 31 December 2014 was primarily due to an increase in loan
drawdowns used for construction repayment for property development and to fund working capital for
hotels. The decrease from 31 December 2012 to 31 December 2013 was primarily due to the repayment
of certain current bank loans.
As at 31 March 2015, the Hutchison Property Group had total bank loan facilities of HK$1,072
million, of which HK$270 million was unutilised. These loan amounts are committed and restricted to
construction and hotel renovation purposes. As at the same date, HK$652 million of the Hutchison
Property Group’s bank loans were guaranteed by Cheung Kong Investment Company Limited and
Hutchison Whampoa Properties Limited. The Group will replace the existing guarantors for the loans
before the Listing.
As at 31 March 2015, the Hutchison Property Group had no overdraft facilities.
During 2012, 2013 and 2014, the effective interest rate on interest-bearing bank loans was 1.9%,
2.2% and 1.9%, respectively. As at 31 March 2015, the effective interest rates on interest-bearing bank
loans did not materially change as compared to 31 December 2014.
– 247 –
FINANCIAL INFORMATION
The following table sets out the maturity of the Hutchison Property Group’s interest-bearing bank
and other debts as at the dates indicated:
As at 31
March
As at 31 December
2012
2013
2014
2015
(HK$
million)
(HK$
million)
(HK$
million)
(HK$
million)
Bank loans repayable
Within one year . . . . . . . . . . . . . . . . . . . .
Between two and five years . . . . . . . . . . . .
739
100
150
644
756
50
752
50
Total . . . . . . . . . . . . . . . . . . . . . . . . . . . .
839
794
806
802
The following table sets out the Hutchison Property Group’s interest-bearing bank and other debts
by currency denominations as at the dates indicated:
As at 31
March
As at 31 December
2012
2013
2014
2015
Hong Kong dollars . . . . . . . . . . . . . . . . . .
British Pounds . . . . . . . . . . . . . . . . . . . . .
200
639
150
644
150
656
150
652
Total . . . . . . . . . . . . . . . . . . . . . . . . . . . .
839
794
806
802
Loan Facilities
The Cheung Kong Property Group
During the Track Record Period, the Cheung Kong Property Group did not enter into any bank
loan facilities.
The Hutchison Property Group
During the Track Record Period, the Hutchison Property Group entered into the following loan
facilities:
1.
GBP 80,000,000 credit facility dated 19 June 2009
On 19 June 2009, Convoys Investment S.à r.l., a then wholly-owned subsidiary of Hutchison,
as borrower, entered into a loan facility in the total amount of up to GBP 80,000,000 with
Sumitomo Mitsui Banking Corporation Europe Limited as lender (as amended and restated on 23
June 2010, 21 June 2011 and 21 June 2013, whereby Convoys Properties Limited, a wholly-owned
subsidiary of Hutchison, was substituted as the borrower under the facility).
쐌
Purpose: to finance the acquisition and development of the property known as Convoys
Wharf, Deptford in the United Kingdom
쐌
Interest rate: LIBOR plus 1% to 1.55% depending on the loan period
쐌
Maturity Date: 24 June 2015
– 248 –
FINANCIAL INFORMATION
쐌
2.
Guarantee: guaranteed by Hutchison Whampoa Properties Limited and Cheung Kong
Investment Company Limited
HK$50,000,000 term loan facility dated 19 June 2014
On 19 June 2014, Consolidated Hotels Limited, a subsidiary of Hutchison, as borrower,
entered into a loan facility in the total amount of up to HK$50,000,000 with Crédit Agricole
Corporate and Investment Bank acting through its Hong Kong Branch as lender.
3.
쐌
Purpose: to refinance the borrower’s outstanding indebtedness under the
HK$100,000,000 term loan facility made available to the borrower under a facility
letter dated 18 June 2012
쐌
Interest rate: 1.3% per annum above (i) the cost of funding the facility for the lender
or (ii) the applicable 3-month or 6-month HIBOR depending on the interest period
쐌
Maturity Date: 24 months from date of drawdown
쐌
Guarantee: none
HK$100,000,000 revolving loan facility dated 30 May 2014
On 30 May 2014, Consolidated Hotels Limited, a subsidiary of Hutchison, as borrower,
extended the term of a loan facility in the total amount of up to HK$100,000,000 with Crédit
Agricole Corporate and Investment Bank acting through its Hong Kong Branch as lender,
originally extended pursuant to a facility letter dated 5 July 2012.
쐌
Purpose: to finance the working capital requirements of the Borrower
쐌
Interest rate: 0.7% per annum above (i) the cost of funding the facility for the lender
or (ii) the applicable 3-month HIBOR depending on the interest period
쐌
Maturity Date: 26 June 2015 or 364 days from date of acceptance of the loan facility
쐌
Guarantee: none
Summary of material covenants and events of default
The above loan facilities contain certain customary covenants which restrict the ability of the
borrower and, where relevant, the guarantors to, among other things: (i) enter into any merger,
consolidation, dissolution, liquidation or winding-up (other than for the purposes of a solvent
reorganisation); (ii) reduce its registered capital or make a distribution; (iii) materially change the
nature of its current business operations; (iv) dispose of a material part of the relevant property or its
business or its assets or revenues; (v) grant any loan or guarantee, except in the ordinary course of its
business; or (vi) without prior consent from the lender, create any security, mortgage, charge, lien or
other encumbrance over its property, assets or revenues, except for any security granted over project
development-related indebtedness.
– 249 –
FINANCIAL INFORMATION
In addition to the customary covenants above, the loans of Consolidated Hotels Limited also
require the borrower to, among other things: (i) procure that the Sheraton Hong Kong Hotel & Towers
are and will continue to be managed by Starwood Asia Pacific Hotels & Resorts Pte. Ltd. or by
Starwood Hotels or by Hutchison International Hotels Limited; (ii) not at any time, borrow or incur any
other financial obligations (excluding intra-group debts) in excess of HK$580 million in aggregate; (iii)
ensure the interest coverage (defined as earnings before interest, taxes, depreciation and amortisation
divided by gross interest expense) will not, at any time, be less than 1.25; and (iv) ensure that the total
principal outstanding under this loan facility made available to the borrower by the lender will not at
any time exceed 50% of the market value of the Sheraton Hong Kong Hotel & Towers.
The above loan facilities also contain certain customary events of default including, but not
limited to: (i) breach of any obligations by the borrower under the loan agreement or breach of any
obligations by any of the guarantors under the relevant guarantees; (ii) failure of any representation or
warranty to be true in all material respects; (iii) cross default and cross acceleration in relation to any
indebtedness of the borrower, Hutchison or any principal subsidiary of Hutchison which is greater than
HK$250 million (or its equivalent in other currencies); (iv) insolvency, dissolution, liquidation,
cessation of business or expropriation; and (v) any material adverse change in the business or financial
condition of the borrower or any of the guarantors. Upon the occurrence of an event of default, subject
to the applicable grace periods, the lender may accelerate the loan outstanding under the facility and/or
declare the facility terminated. During the Track Record Period and up to the Latest Practicable Date,
the Hutchison Property Group did not breach any of the material covenants of its loan facilities.
Cheung Kong Property Holdings Limited
On 30 April 2015, CK Property Finance Limited, a wholly-owned subsidiary of the Company, as
borrower, entered into a loan facility in the total amount of HK$15 billion with a group of lenders
(“Loan Facility A”) and a loan facility in the total amount of approximately HK$40 billion or its
equivalent with a group of lenders (“Loan Facility B”, and together with Loan Facility A, the “Loan
Facilities”). Lenders for both Loan Facilities include Bank of America, N.A., and The Hongkong and
Shanghai Banking Corporation Limited, and, in the case of Loan Facility B, also include a group of
other lenders. Pursuant to the Loan Facilities, loans in an aggregate amount of no less than HK$55
billion or its equivalent have been or will be made available to CK Property Finance Limited. Loan
Facility A comprises solely of a Hong Kong dollar tranche of HK$15 billion (“Loan Facility A-HKD
Tranche”) and Loan Facility B comprises of a Hong Kong dollar tranche of approximately
HK$22,428.6 million (“Loan Facility B-HKD Tranche”) and a U.S. Dollar tranche of approximately
US$2,267.3 million (“Loan Facility B-USD Tranche”).
Proceeds of the Loan Facilities will be used to settle a promissory note that will be issued by the
Company to CKH Holdings in the principal amount of HK$55 billion (being the Specified Loans
Promissory Note), which will be settled on or before the fifth business day following the date of
completion of the assignment of the Specified Loans (which comprise interest-bearing loans due to the
Cheung Kong Group or the Hutchison Group), which is expected to be the Listing Date.
– 250 –
FINANCIAL INFORMATION
쐌
Interest rate:
Loan Facility A-HKD Tranche: HIBOR plus an interest margin of 0.65% per annum (with
adjustment for default interest)
Loan Facility B-HKD Tranche: HIBOR plus an interest margin of 0.95% per annum (with
adjustment for default interest)
Loan Facility B-USD Tranche: LIBOR plus an interest margin of 0.95% per annum (with
adjustment for default interest)
쐌
Maturity date:
Loan Facility A: 364 days from the date of the first drawdown
Loan Facility B: third anniversary of the date of the first drawdown
쐌
Guarantee: the Loan Facilities will be guaranteed by the Company (the “Guarantor”)
Summary of material covenants and events of default
The Loan Facilities contain the following financial covenants:
쐌
The aggregate Market Value (as defined below) of all Group Tangible Assets (as defined
below) shall at all times exceed the Secured Consolidated Liabilities (as defined below) by
the greater of (i) 20% of the aggregate Market Value of all Group Tangible Assets and (ii)
HK$8,000,000,000.
쐌
The Adjusted Consolidated Liabilities (as defined below) shall not exceed twice of the
Adjusted Consolidated Tangible Net Worth (as defined below).
For the purposes of the above financial covenants:
쐌
“Market Value” means (i) the best price at which the relevant asset (other than shares
falling within (ii)) is expected to be sold on the relevant date, assuming certain conditions as
specified in the Loan Facilities are met and (ii) in the case of quoted shares in associated
companies and subsidiaries of the Guarantor, the value of such shares (taking into account
certain factors as specified in the Loan Facilities), in each case after deducting the estimated
tax liabilities, if any, that would arise on the sale of such asset.
쐌
“Group Tangible Assets” means the assets of the Guarantor and its subsidiaries excluding
goodwill and other intangible assets.
쐌
“Secured Consolidated Liabilities” means the aggregate of the secured liabilities and
secured contingent liabilities of the Guarantor and its subsidiaries, but excluding for this
purpose (i) such as are owed to the Guarantor by its subsidiaries, (ii) such as are owed to
subsidiaries of the Guarantor by the Guarantor or any of its subsidiaries, except a proportion
thereof equal to the proportion of the equity share capital of the relevant subsidiary not
directly or indirectly beneficially owned by the Guarantor, (iii) contingent liabilities in
respect of indebtedness secured by a first charge over an interest in land to the extent that
– 251 –
FINANCIAL INFORMATION
such contingent liability would be reduced if such indebtedness were reduced by the Market
Value of such interest, (iv) secured contingent liabilities in respect of guarantees of profits
arising out of a property development given to any person who is participating in such
development as a joint or co-venture party, (v) secured contingent liabilities under any
guarantee given by a subsidiary of the Guarantor in respect of obligations for which the
Guarantor is the primary obligor and (vi) the proportion of any secured contingent liability
under any guarantee given by the Guarantor or any of its subsidiaries in respect of
obligations for which any subsidiary of the Guarantor is the primary obligor equal to the
proportion of the issued equity share capital of such subsidiary directly or indirectly owned
by the Guarantor.
쐌
“Adjusted Consolidated Liabilities” means the aggregate of the unsecured liabilities and
unsecured contingent liabilities of the Guarantor and its subsidiaries, but excluding for this
purpose (i) such as are owed to the Guarantor by its subsidiaries, (ii) such as are owed to
subsidiaries of the Guarantor by the Guarantor or any of its subsidiaries, except a proportion
thereof equal to the proportion of the equity share capital of the relevant subsidiary not
directly or indirectly beneficially owned by the Guarantor, (iii) contingent liabilities in
respect of indebtedness secured by a first charge over an interest in land to the extent that
such contingent liability would be reduced if such indebtedness were reduced by the Market
Value of such interest, (iv) contingent liabilities in respect of guarantees of profits arising
out of a property development given to any person who is participating in such development
as a joint or co-venture party, (v) contingent liabilities under any guarantee given by a
subsidiary of the Guarantor in respect of obligations for which the Guarantor is the primary
obligor and (vi) the proportion of any contingent liability under any guarantee given by the
Guarantor or any of its subsidiaries in respect of obligations for which any subsidiary of the
Guarantor is the primary obligor equal to the proportion of the issued equity share capital of
such obligor directly or indirectly beneficially owned by the Guarantor, all as shown by the
latest audited consolidated statement of financial position of the Guarantor and its
subsidiaries and provided that where the contingent liability under a guarantee is limited to a
maximum contingent liability, there shall only be taken into account such maximum
contingent liability and in any case that contingent liability shall be taken to be the
aggregate of (a) any outstanding principal at the relevant date, (b) any other accrued
indebtedness at the relevant date and (c) any amount by which the principal obligor is
entitled to increase the guaranteed indebtedness at the relevant date and further provided that
where the guarantee giving rise to the contingent liability is a joint and several guarantee
given by the Guarantor or any of its subsidiaries and other joint or co-venture party in
respect of obligations in connection with a joint or co-venture in which the Guarantor or any
of its subsidiaries and such other joint or co-venture party are interested there shall only be
taken into account a proportion of this contingent liability of the Guarantor or the relevant
subsidiary of the Guarantor equal to the proportion of the interest of the Guarantor and any
of its subsidiaries in the joint or co-venture.
쐌
“Adjusted Consolidated Tangible Net Worth” means the aggregate of (i) the amount paid
up or credited as paid up on the issued share capital of the Guarantor and (ii) the amounts
standing to the credit of the capital and reserves of the Guarantor and its subsidiaries,
including any share premium, retained earnings and reserves, all as shown by the latest
audited consolidated statement of financial position of the Guarantor and its subsidiaries, but
after making the following adjustments (to the extent the same have not been taken into
account in such latest audited consolidated statement of financial position): (i) deducting
therefrom (a) any amount attributable to any assets which are not Group Tangible Assets, (b)
– 252 –
FINANCIAL INFORMATION
the amount of any debit balance on the income statement, (c) any amount distributed or
proposed to be distributed (other than attributable directly or indirectly to the Guarantor)
where such distribution is not provided for therein, (d) any amount attributable to minority
interests in subsidiaries and (e) the amount attributable directly or indirectly to the
Guarantor by which the Market Value of any asset is less than its book value in such latest
audited consolidated statement of financial position; (ii) adding thereto the amount
attributable directly or indirectly to the Guarantor by which the Market Value of any asset is
greater than its book value in such latest audited consolidated statement of financial position
and (iii) making such adjustment as may be appropriate to (a) reflect any variation in the
amount of such paid-up share capital or the amounts standing to the credit of such reserves
since the date of such latest audited consolidated statement of financial position, (b) take
account of any variation in interest in subsidiaries since the date of such latest audited
consolidated statement of financial position and (c) take account of any companies which
since the date of such latest audited consolidated statement of financial position have ceased
to be or have become subsidiaries.
The Loan Facilities also contain certain customary events of default including, but not limited to:
(i) breach of any obligations by the borrower and Guarantor under the relevant loan agreements or
other related documents for the Loan Facilities (including the relevant guarantees); (ii) any
representation or warranty in the loan agreements or other related documents not being complied with
or correct in all material respects; (iii) cross acceleration in relation to any indebtedness of the
borrower, the Guarantor or any principal subsidiary of the Guarantor having an aggregate outstanding
principal amount of not less than HK$250 million (or its equivalent in other currencies); (iv) any
present or future encumbrance on or over all or any material part of the assets of the borrower, the
Guarantor or any principal subsidiary of the Guarantor becoming enforceable or any step is taken to
enforce such encumbrance; (v) insolvency, dissolution or enforcement proceedings affecting the
borrower, the Guarantor or any principal subsidiary of the Guarantor, corporate restructuring or
nationalisation affecting the borrower or the Guarantor or any event which has an analogous or
equivalent effect as some of the aforesaid events; and (vi) any guarantee for the Loan Facilities not
being in full force and effect. Upon the declaration by the lenders of the occurrence of an event of
default, the lenders may accelerate and/or cancel the Loan Facilities.
During the Track Record Period and up to the Latest Practicable Date, the Company did not
breach any of the material covenants of its loan facilities.
Joint Ventures
As at 31 March 2015, the joint ventures that will become subsidiaries of the Company had total
bank loan facilities of HK$22,812 million, of which HK$5,860 million was unutilised. These loans are
committed. Of these amounts, HK$22,535 million are restricted to construction purposes. As at the
same date, HK$13,838 million of the bank loans are secured by land and properties, HK$184 million of
the bank loans are secured by investment properties and HK$1,957 million of the bank loans are
guaranteed by the Cheung Kong Group and the Hutchison Group. The Group intends to replace the
Cheung Kong Group and the Hutchison Group as guarantor for the loans. There were no bank
overdrafts or other similar indebtedness as at the same date.
During the Track Record Period and up to the Latest Practicable Date, the joint ventures that will
become subsidiaries of the Company did not breach any of the material covenants of their loan
facilities.
– 253 –
FINANCIAL INFORMATION
INDEBTEDNESS STATEMENT
Borrowings
As at the close of business on 31 March 2015, being the latest practicable date for the purpose of
this indebtedness statement, the Group had total loan facilities of HK$145,912 million, comprising bank
loan facilities of HK$23,884 million and amounts due to the Combined Non-Property Businesses of
HK$122,028 million. As at the same date, the Group had indebtedness amounting to approximately
HK$139,782 million, comprising bank loans of HK$17,754 million of which HK$14,023 million were
secured and HK$2,609 million were guaranteed, and amounts due to the Combined Non-Property
Businesses of HK$122,028 million which were unsecured and unguaranteed.
Upon completion of the Property Businesses Combination, two promissory notes will be issued
and the amounts due to the Combined Non-Property Businesses will be settled as described in “History
and Reorganisation – The Reorganisation.”
Pledge of assets
At 31 March 2015, the Group pledged stock of properties and investment properties with
aggregate carrying values of approximately HK$24,987 million and HK$314 million, respectively, as
collateral for the bank loans.
Guarantees
As at 31 March 2015, the Group provided mortgage guarantees to PRC banks amounting to
approximately HK$598 million in respect of the mortgage loans provided by the PRC banks to
purchasers of the properties developed and sold.
As at 31 March 2015, except as disclosed in this listing document, and apart from intra-group
borrowings or guarantees, the Group did not have any other debt securities, term-loan borrowings,
indebtedness, acceptance credits, hire purchase commitments, mortgages, charges, contingent liabilities
or guarantees outstanding.
There had not been any material adverse change in the Group’s indebtedness and contingent
liabilities since 31 March 2015 and up to the date of this listing document.
RELATED PARTY TRANSACTIONS
During the Track Record Period, each of the Cheung Kong Property Group and the Hutchison
Property Group entered into various transactions with related parties.
The Directors confirm that all related party transactions have been conducted on normal
commercial terms and that their terms are fair and reasonable.
– 254 –
FINANCIAL INFORMATION
The Cheung Kong Property Group
The Cheung Kong Property Group regularly conducts transactions in the normal course of
business with the Cheung Kong Group and related companies. The following table sets out the details
of the material related party transactions during the Track Record Period:
Year ended 31 December
Interest expense paid to the Cheung Kong Group . . . . . .
Service fees paid to Cheung Kong (Holdings) Limited. . .
2012
2013
2014
(HK$
million)
(HK$
million)
(HK$
million)
1,035
971
1,206
836
1,142
892
The Hutchison Property Group
The following table sets out a breakdown of the Hutchison Property Group’s material transactions
with related parties for the periods indicated:
Year ended 31 December
Rental and other related income from holding company
and fellow subsidiary companies. . . . . . . . . . . . . . . .
Project management and sales consultancy fee received
from joint ventures . . . . . . . . . . . . . . . . . . . . . . . . .
Interest paid to holding company and fellow subsidiary
companies . . . . . . . . . . . . . . . . . . . . . . . . . . . . . . . .
Management fee and other costs paid to holding
company, fellow subsidiary companies and joint
ventures . . . . . . . . . . . . . . . . . . . . . . . . . . . . . . . . .
2012
2013
2014
(HK$
million)
(HK$
million)
(HK$
million)
.
437
481
524
.
480
535
381
.
(1,085)
(1,089)
(1,219)
.
(190)
(184)
(188)
Other than rental and other related income from holding company and fellow subsidiary
companies, all other material transactions with related parties as represented in the line items above
will be eliminated upon Listing.
LIQUIDITY, CAPITAL RESOURCES AND CAPITAL MANAGEMENT
During the Track Record Period, the Cheung Kong Property Group and the Hutchison Property
Group funded their capital requirements primarily through borrowings from the Combined Non-Property
Businesses, bank borrowings and cash generated from operations. A centralised cash fund was utilised
where cash was typically transferred to the then holding company for management. Upon Listing, the
Group will handle its cash management independently. In the future, the Group will use funding from
cash generated from operations, bank borrowings and funding raised from the capital markets to finance
working capital, debt service requirements and capital expenditure. The Cheung Kong Property Group
and the Hutchison Property Group did not experience any liquidity shortage during the Track Record
Period.
– 255 –
FINANCIAL INFORMATION
Capital Management
The Cheung Kong Property Group and the Hutchison Property Group manage their respective
capital to ensure that they will be able to continue their operations while maximising returns to
shareholders and to support the future development of their business. They aim to achieve this through
optimising their debt and equity balance. The Cheung Kong Property Group and the Hutchison Property
Group monitor their indebtedness levels by reviewing their respective gearing ratios and debt-to-asset
ratios. See “– Key Financial Ratios”. The Cheung Kong Property Group and the Hutchison Property
Group also monitor their indebtedness levels generally through periodic reviews of their management
accounts to assess their financial condition and maintain indebtedness at reasonable levels. In addition,
the Cheung Kong Property Group and the Hutchison Property Group also monitor their compliance with
the terms of bank loans and other borrowings to ensure timely repayment using available cash
resources.
The Cheung Kong Property Group
The capital structure of the Cheung Kong Property Group consists of borrowings, amounts due to
the Cheung Kong Group, bank balances and deposits, shareholders’ funds and non-controlling interests.
The Cheung Kong Property Group reviews and manages its capital structure on a regular basis and
maintains an appropriate net debt to net total capital ratio to manage the cost of capital. See Note 24 to
“Appendix IA – Accountants’ Report on the Cheung Kong Property Group” for more details.
The Hutchison Property Group
The capital structure of the Hutchison Property Group consists of borrowings, including amounts
due to the Hutchison Group, loans from non-controlling shareholders of subsidiary companies and long
term bank loans, as well as shareholders’ funds. The Hutchison Property Group reviews its capital
structure periodically and manages its capital structure through the payment of dividends, new share
issues and drawdowns of new borrowings or repayments of existing borrowings. See Note 27.2 to
“Appendix IB – Accountants’ Report on the Hutchison Property Group” for more details.
To further enhance its working capital management going forward, the Group will seek to
continue to monitor its cash inflow associated with property sales and pre-sales by strengthening
marketing efforts and payment collection from its customers with respect to property sales and
pre-sales. It will also seek to manage the level of its liquid assets to ensure the availability of sufficient
cash flows to meet any unexpected cash requirements arising from its business. In addition, the Group
will continue to assess available resources to finance its business needs on an ongoing basis and plan
and proactively adjust its property development schedule or implement cost control measures as needed.
Furthermore, the Group intends to continue to access existing capital as well as to seek new sources of
funding to maintain and grow its business on a sustainable and cost-effective basis.
Immediately following completion of the Property Businesses Combination, subject to the
confirmation of credit rating agencies, the Group expects to obtain strong investment grade ratings
consistent with the Hutchison Group’s historical investment grade ratings.
– 256 –
FINANCIAL INFORMATION
Working Capital Sufficiency
After taking into consideration the financial resources available to us, including our internally
generated cash and our available credit and financing facilities and in the absence of unforeseeable
circumstances, the Directors confirm that we have sufficient working capital for our present
requirements for at least the next 12 months from the date of this listing document.
Thereafter, we expect to finance our operations and our debt service requirements with net cash
flows generated from our operations and, if required, additional debt or equity financing including from
the debt and equity capital markets. Our ability to obtain additional funding required for increased
capital expenditure in the future beyond our anticipated cash needs for the next 12 months following
the date of this listing document, however, is subject to a variety of uncertainties, including the future
results of our operations, financial condition and cash flows and economic, political and other
conditions in Hong Kong, China and elsewhere. The issue of additional equity or equity-linked
securities may result in additional dilution to our Shareholders.
The Directors confirm that the Cheung Kong Property Group and the Hutchison Property Group
did not have any material default in payment of creditors and accruals, bank borrowings and other debt
financing obligations and/or breaches of finance covenants during the Track Record Period.
CASH FLOW
Overview
The Cheung Kong Property Group
The following table sets out a summary of the Cheung Kong Property Group’s net cash flow for
the periods indicated:
Year ended 31 December
Net cash flows
activities . . .
Net cash flows
Net cash flows
activities . . .
(used in)/generated from operating
...............................
generated from investing activities. . . . . .
generated from/(used in) financing
...............................
2012
2013
2014
(HK$
million)
(HK$
million)
(HK$
million)
(3,402)
3,021
3,769
6,903
7,972
2,917
3,921
(13,499)
(10,604)
Net increase/(decrease) in cash and cash equivalents . . . .
Cash and cash equivalents at the beginning of the year . .
3,540
9,356
(2,827)
12,896
285
10,069
Cash and cash equivalents at the end of the year . . . .
12,896
10,069
10,354
Net Cash Flows Used in/Generated From Operating Activities
Cash generated from operating activities primarily comprises net cash generated from property
sales, property rental and hotels and serviced suites. Cash used in operating activities primarily
comprises dividends paid to shareholders of the Cheung Kong Property Group and investment in/loan
advances to joint ventures.
– 257 –
FINANCIAL INFORMATION
For the year ended 31 December 2014, the Cheung Kong Property Group’s net cash generated
from operating activities was HK$7,972 million, which was primarily the result of (i) cash generated
from operations of HK$16,500 million, partially offset by (i) dividends paid to shareholders of the
Cheung Kong Property Group of HK$5,567 million and (ii) investment in and loan advances to joint
ventures of HK$3,124 million. Cash generated from operations primarily comprised profit before
taxation of HK$18,940 million, adjusted by (i) increase in fair value of investment properties of
HK$4,542 million, (ii) share of net profit of joint ventures of HK$2,835 million, (iii) profit on disposal
of joint ventures of HK$2,349 million and (iv) decrease in stock of properties of HK$6,976 million.
For the year ended 31 December 2013, the Cheung Kong Property Group’s net cash generated
from operating activities was HK$3,769 million, which was primarily the result of (i) cash generated
from operations of HK$7,041 million and (ii) dividends and repayments from joint ventures of
HK$5,428 million, partially offset by dividends paid to shareholders of the Cheung Kong Property
Group of HK$7,447 million. Cash generated from operations primarily comprised profit before taxation
of HK$15,866 million, adjusted by (i) share of net profit of joint ventures of HK$4,031 million, (ii)
profit from disposal of investment properties of HK$2,760 million and (iii) increase in fair value of
investment properties of HK$1,782 million.
For the year ended 31 December 2012, the Cheung Kong Property Group’s net cash used in
operating activities was HK$3,402 million, which was primarily the result of (i) profits tax paid of
HK$2,076 million and (ii) investment in and loan advances to joint ventures of HK$1,867 million,
partially offset by dividends and repayments from joint ventures of HK$878 million. Cash used in
operations primarily comprised profit before taxation of HK$18,313 million, adjusted by (i) the increase
in stock of properties of HK$10,715 million, (ii) share of net profit of joint ventures of HK$5,480
million and (iii) the increase in fair value of investment properties of HK$4,470 million.
Net Cash Flows Generated From Investing Activities
Cash generated from investing activities primarily reflects proceeds from disposal of investment
properties and disposal of interests in subsidiaries or joint ventures.
For the year ended 31 December 2014, the Cheung Kong Property Group’s net cash generated
from investing activities was HK$2,917 million, which was primarily the result of (i) disposal of
interests in joint ventures of HK$3,298 million, partially offset by cash outflow for the addition of
fixed assets of HK$278 million.
For the year ended 31 December 2013, the Cheung Kong Property Group’s net cash generated
from investing activities was HK$6,903 million, which was primarily the result of (i) disposal of
investment properties of HK$5,427 million and (ii) disposal of interests in joint ventures of HK$1,560
million, partially offset by cash outflow for the addition of fixed assets of HK$155 million.
For the year ended 31 December 2012, the Cheung Kong Property Group’s net cash generated
from investing activities was HK$3,021 million, which was primarily the result of (i) dividends and
repayment from joint ventures of HK$1,862 million, (ii) loss of control of interest in subsidiaries of
HK$1,065 million and (iii) disposals of joint ventures of HK$503 million, partially offset by
investments in and loan advances to joint ventures of HK$233 million.
– 258 –
FINANCIAL INFORMATION
Net Cash Flows Generated From/Used in Financing Activities
Cash generated from financing activities primarily reflects advances from the Cheung Kong
Group. Cash used in financing activities primarily reflects repayments to the Cheung Kong Group.
For the year ended 31 December 2014, the Cheung Kong Property Group’s net cash used in
financing activities was HK$10,604 million, which was primarily the result of (i) repayments to the
Cheung Kong Group of HK$9,184 million and (ii) interest and other finance costs paid of HK$1,215
million.
For the year ended 31 December 2013, the Cheung Kong Property Group’s net cash used in
financing activities was HK$13,499 million, which was primarily the result of repayment to the Cheung
Kong Group of HK$12,012 million.
For the year ended 31 December 2012, the Cheung Kong Property Group’s net cash generated
from financing activities was HK$3,921 million, which was primarily the result of advances from the
Cheung Kong Group of HK$5,475 million, partially offset by interest paid of HK$1,110 million.
The Hutchison Property Group
The following table sets out a summary of the Hutchison Property Group’s net cash flow for the
periods indicated:
Year ended 31 December
Net cash flows
activities . . .
Net cash flows
Net cash flows
activities . . .
(used in)/generated from operating
...............................
generated from investing activities. . . . . .
generated from/(used in) financing
...............................
2012
2013
2014
(HK$
million)
(HK$
million)
(HK$
million)
(158)
2,574
221
1,046
1,551
269
138
(6,031)
(2,690)
Net increase/(decrease) in cash and cash equivalents . . . .
Cash and cash equivalents at the beginning of the year . .
2,554
6,441
(4,764)
8,995
(870)
4,231
Cash and cash equivalents at the end of the year . . . .
8,995
4,231
3,361
Net Cash Flows Used in/Generated From Operating Activities
Cash generated from operating activities primarily comprises net cash generated from property
rental and hotels and serviced suites. Cash used in operating activities primarily comprises interest
expense and other finance costs paid.
For the year ended 31 December 2014, the Hutchison Property Group’s net cash generated from
operating activities was HK$1,551 million, which was primarily the result of dividends received from
associates and joint ventures of HK$1,101 million and cash generated from operating activities after
changes in working capital of HK$2,035 million, offset in part by interest expense and other finance
costs paid of HK$1,166 million. Cash generated from operating activities primarily comprised profit
– 259 –
FINANCIAL INFORMATION
before taxation of HK$36,844 million, adjusted by (i) an increase in fair value of investment properties
of HK$28,088 million, (ii) profit on disposal of interests in a joint venture of HK$2,286 million and
(iii) share of net profit of joint ventures and associates of HK$2,741 million.
For the year ended 31 December 2013, the Hutchison Property Group’s net cash generated from
operating activities was HK$221 million, which was primarily the result of dividends received from
associates and joint ventures of HK$2,454 million, offset in part by (i) cash used in operating activities
after changes in working capital of HK$839 million and (ii) interest expense and other finance costs
paid of HK$1,097 million. Cash generated from operating activities primarily comprised profit before
taxation of HK$10,055 million, adjusted by (i) share of net profit of joint ventures and associates of
HK$3,883 million and (ii) profit on disposal of subsidiary companies of HK$1,714 million.
For the year ended 31 December 2012, Hutchison Property Group’s net cash used in operating
activities was HK$158 million, which was primarily the result of interest expense and other finance
costs paid of HK$1,154 million, partially offset by cash generated from operating activities after
changes in working capital of HK$924 million. Cash generated from operating activities primarily
comprised profit before taxation of HK$8,903 million, adjusted by (i) share of net profit of joint
ventures and associates of HK$5,158 million and (ii) an increase in fair value of investment properties
of HK$859 million.
Net Cash Flows Generated From Investing Activities
Cash generated from investing activities primarily reflects proceeds from disposal of interests in
joint ventures and subsidiary companies, and repayments from associates and joint ventures.
For the year ended 31 December 2014, Hutchison Property Group’s net cash generated from
investing activities was HK$269 million, which was primarily the result of proceeds from (i) disposal
of interests in a joint venture which held the Oriental Financial Center of HK$3,904 million and (ii)
disposal of fixed assets and investment properties (primarily certain residential properties in Hong
Kong) of HK$718 million, partially offset by advances to associates and joint ventures of HK$3,715
million.
For the year ended 31 December 2013, Hutchison Property Group’s net cash generated from
investing activities was HK$1,046 million, which was primarily the result of proceeds from (i) disposal
of subsidiary companies (primarily the interest in certain residential properties in Hong Kong and
interests in a joint venture which held The Metropolitan Plaza) of HK$2,058 million and (ii) disposal of
fixed assets and investment properties (primarily certain residential and commercial properties in Hong
Kong) of HK$681 million, partially offset by (i) purchases of fixed assets and investment properties
(primarily the costs associated with the development of a residential property and leasehold
improvements of certain hotel properties) of HK$534 million and (ii) advances to associates and joint
ventures of HK$1,159 million.
For the year ended 31 December 2012, Hutchison Property Group’s net cash generated from
investing activities was HK$2,574 million, which was primarily the result of (i) repayments from
associates and joint ventures of HK$2,583 million and (ii) proceeds from disposal of subsidiary
companies (primarily the interest in a residential property in Macau) of HK$194 million, partially offset
by purchases of fixed assets and investment properties (primarily leasehold improvements of certain
investment properties and hotels) of HK$267 million.
– 260 –
FINANCIAL INFORMATION
Net Cash Flows Generated From/Used in Financing Activities
Cash generated from financing activities primarily reflects increases in intercompany loans and
new borrowings. Cash used in financing activities primarily reflects decreases in intercompany loans
and dividends paid to non-controlling interests and the Hutchison Group.
For the year ended 31 December 2014, Hutchison Property Group’s net cash used in financing
activities was HK$2,690 million, which was primarily the result of dividends paid to the Hutchison
Group of HK$3,944 million and dividends paid to non-controlling interests of HK$264 million,
partially offset by an increase in intercompany loans of HK$1,478 million.
For the year ended 31 December 2013, Hutchison Property Group’s net cash used in financing
activities was HK$6,031 million, which was primarily the result of a decrease in intercompany loans of
HK$5,565 million.
For the year ended 31 December 2012, Hutchison Property Group’s net cash generated from
financing activities was HK$138 million, which was primarily the result of an increase in intercompany
loans of HK$506 million, partially offset by (i) dividends paid to non-controlling interests of HK$241
million and (ii) dividends paid to the Hutchison Group of HK$139 million.
CAPITAL EXPENDITURE
The Cheung Kong Property Group
For the years ended 31 December 2012, 2013 and 2014, the Cheung Kong Property Group
incurred capital expenditures in the amount of HK$101 million, HK$161 million and HK$296 million,
respectively, primarily due to expenditures in connection with development costs and leasehold
improvements of investment properties and hotels. The increase in capital expenditure during the Track
Record Period was primarily due to additional leasehold improvements to certain hotels. The estimated
capital expenditures for the year ended 31 December 2015 are approximately HK$408 million, and they
are expected to be used towards development costs and leasehold improvements to hotels.
The Hutchison Property Group
For the years ended 31 December 2012, 2013 and 2014, the Hutchison Property Group incurred
capital expenditures in the amount of HK$267 million, HK$534 million and HK$260 million,
respectively, primarily due to expenditures in connection with development costs and leasehold
improvements of investment properties and hotels. The decrease from 2013 to 2014 was primarily due
to the lower development costs associated with a residential development and leasehold improvements
to certain hotels. The increase from 2012 to 2013 was primarily due to leasehold improvements to
certain hotels. The estimated capital expenditures for the year ended 31 December 2015 are
approximately HK$899 million, and they are expected to be used for development costs and leasehold
improvements of our investment properties and hotels.
– 261 –
FINANCIAL INFORMATION
COMMITMENTS
Capital Commitments
The Cheung Kong Property Group
The following table sets out the Cheung Kong Property Group’s capital commitments as at the
dates indicated:
As at 31 December
Contracted but not provided for:
Acquisition of fixed assets . . . .
Authorised but not contracted for:
Acquisition of fixed assets . . . .
Loan advances to joint ventures
Investment in joint ventures . . .
2012
2013
2014
(HK$
million)
(HK$
million)
(HK$
million)
.................
210
499
408
.................
.................
.................
5
−
−
5
398
−
−
3,925
380
Total . . . . . . . . . . . . . . . . . . . . . . . . . . . . . . . . . . . . . .
215
902
4,713
The increase in capital commitments from 2013 to 2014 was primarily due to the provision of
shareholders’ loans for a new project in Singapore, along with additional capital injection for certain
projects in the PRC. The increase in capital commitments from 31 December 2012 to 31 December
2013 was primarily due to an increase in amounts of loans provided to joint venture projects in the
PRC.
As at 31 December 2012, 2013 and 2014, the minimum share of turnover undertaken by the
Cheung Kong Property Group to be received by the partner of a joint development project over the
remaining duration of the project amounted to HK$612 million, HK$600 million and HK$588 million,
respectively. The decrease in commitments over the Track Record Period was primarily due to
payments made each year.
The Hutchison Property Group
The following table sets out the Hutchison Property Group’s capital commitments as at the dates
indicated:
As at 31 December
2012
2013
2014
(HK$
million)
(HK$
million)
(HK$
million)
Contracted but not provided for:
Investment properties and fixed assets. . . . . . . . . . . . .
Authorised but not contracted for:
Investment properties and fixed assets. . . . . . . . . . . . .
Interests in joint ventures . . . . . . . . . . . . . . . . . . . . . .
106
81
49
980
1,186
1,066
401
1,084
3,530
Total . . . . . . . . . . . . . . . . . . . . . . . . . . . . . . . . . . . . . .
2,272
1,548
4,663
– 262 –
FINANCIAL INFORMATION
The increase in capital commitments from 31 December 2013 to 31 December 2014 was primarily
due to the provision of shareholders’ loans for a new project in Singapore, along with additional capital
injection for certain projects in the PRC. The decrease in capital commitments from 31 December 2012
to 31 December 2013 was primarily due to a decrease in the amount of loans provided to joint venture
projects in the PRC as the result of additional self-financing projects in 2013.
Operating Lease Commitments
The Cheung Kong Property Group leased certain office premises under operating lease
arrangements during the Track Record Period. The Hutchison Property Group leased certain office
premises under operating lease arrangements during the Track Record Period.
The Cheung Kong Property Group
The following table sets out the Cheung Kong Property Group’s future minimum rental payments
under non-cancellable operating lease commitments as at the dates indicated:
As at 31 December
2012
2013
2014
(HK$
million)
(HK$
million)
(HK$
million)
Within one year . . . . . . . . . . . . . . . . . . . . . . . . . . . . . .
After one year, but within five years . . . . . . . . . . . . . . .
37
27
39
29
52
30
Total . . . . . . . . . . . . . . . . . . . . . . . . . . . . . . . . . . . . . .
64
68
82
The increase in operating lease commitments from 2012 to 2014 was primarily due to the increase
in office rental area.
The Hutchison Property Group
The following table sets out the Hutchison Property Group’s future minimum rental payments
under non-cancellable operating lease commitments as at the dates indicated:
As at 31 December
2012
2013
2014
(HK$
million)
(HK$
million)
(HK$
million)
Within one year . . . . . . . . . . . . . . . . . . . . . . . . . . . . . .
After one year, but within five years . . . . . . . . . . . . . . .
After five years . . . . . . . . . . . . . . . . . . . . . . . . . . . . . .
27
26
2
42
57
1
42
41
−
Total . . . . . . . . . . . . . . . . . . . . . . . . . . . . . . . . . . . . . .
55
100
83
The decrease in operating lease commitments from 2013 to 2014 was primarily due to the
decrease in office rental area. The increase in operating lease commitments from 2012 to 2013 was
primarily due to the increase in office rental area.
– 263 –
FINANCIAL INFORMATION
CONTINGENT LIABILITIES
Contingent liabilities primarily comprise share of turnover payable to the partner of a joint
development project and guarantees provided to banks for loans of joint ventures.
The Cheung Kong Property Group
During the Track Record Period, the Cheung Kong Property Group did not have any contingent
liabilities.
The Hutchison Property Group
The following table sets out the Hutchison Property Group’s total contingent liabilities as at the
dates indicated:
As at 31 December
2012
2013
2014
(HK$
million)
(HK$
million)
(HK$
million)
Guarantees provided for:
Bank loans of joint ventures . . . . . . . . . . . . . . . . . . . .
Utility deposits . . . . . . . . . . . . . . . . . . . . . . . . . . . . .
965
2
546
−
911
−
Total . . . . . . . . . . . . . . . . . . . . . . . . . . . . . . . . . . . .
967
546
911
The increase in contingent liabilities from 2013 to 2014 was primarily due to the drawdown of
certain guaranteed bank loans. The decrease in contingent liabilities from 2012 to 2013 was primarily
due to the decrease in investments in joint ventures which resulted in lower amounts being guaranteed
for bank loans of joint ventures.
As at 31 March 2015, being the latest practicable date for determining such information, and
except as disclosed above, the Cheung Kong Property Group and the Hutchison Property Group had no
material contingent liabilities or guarantees. We are not currently involved in any significant litigation
and we are not aware of any outstanding or threatened significant litigation. If we are involved in any
such significant litigation that we may incur loss in an amount that can be reasonably estimated
according to available information at that time, we will record the loss or contingent liabilities
accordingly.
– 264 –
FINANCIAL INFORMATION
KEY FINANCIAL RATIOS
The Cheung Kong Property Group
The following table sets out the key financial ratios for the Cheung Kong Property Group as at
and for the periods indicated:
As at and for the year ended 31 December
2012
Liquidity ratios
Current ratio(1) . . . . . . .
Quick ratio(2) . . . . . . . . .
Capital adequacy ratios
Gearing ratio(3) . . . . . . .
Debt-to-asset ratio(4) . . .
Profitability ratios
Return on total assets(5) . .
Return on equity(6) . . . . .
2013
2014
.......................
.......................
0.9x
0.2x
1.0x
0.1x
1.0x
0.2x
.......................
.......................
50.1%
28.7%
41.9%
26.0%
34.2%
24.1%
.......................
.......................
9.1%
20.9%
7.9%
16.2%
9.5%
17.5%
Notes:
(1)
Current ratio is calculated by dividing total current assets by total current liabilities.
(2)
Quick ratio is calculated by dividing total current assets less stock of properties by total current liabilities.
(3)
Gearing ratio is calculated by dividing interest-bearing borrowings and interest-bearing amounts due to the Cheung
Kong Group less cash and cash equivalents by total equity and multiplying the resulting value by 100%.
(4)
Debt-to-asset ratio is calculated by dividing interest-bearing borrowings and interest-bearing amounts due to the
Cheung Kong Group by total assets and multiplying the resulting value by 100%.
(5)
Return on total assets is calculated by dividing profit for the year by total assets at the end of the year and
multiplying the resulting value by 100%.
(6)
Return on equity is calculated by dividing profit for the year by total equity at the end of the year and multiplying
the resulting value by 100%.
Current Ratio
As at 31 December 2012, 2013 and 2014, the Cheung Kong Property Group’s current ratio was
0.9x, 1.0x and 1.0x, respectively. The current ratio remained at 1.0x as at 31 December 2013 and 2014.
The current ratio increased from 31 December 2012 to 31 December 2014 primarily due to a decrease
in amounts due to the Cheung Kong Group during this time, partially offset by a smaller decrease in
stock of properties and bank balances and deposits. The adjusted current ratio (excluding amounts due
from the Cheung Kong Group and amounts due to the Cheung Kong Group) was 7.2x, 7.8x and 7.1x,
respectively.
Quick Ratio
As at 31 December 2012, 2013 and 2014, the Cheung Kong Property Group’s quick ratio was
0.2x, 0.1x and 0.2x, respectively. The increase in quick ratio from 0.1x as at 31 December 2013 to 0.2x
as at 31 December 2014 was primarily due to the decrease in amounts due to the Cheung Kong Group
in 2014. The decrease in quick ratio from 0.2x as at 31 December 2012 to 0.1x as at 31 December
– 265 –
FINANCIAL INFORMATION
2013 was primarily due to the decrease in bank balances and deposits. The adjusted quick ratio
(excluding amounts due from the Cheung Kong Group and amounts due to the Cheung Kong Group)
was 1.1x, 1.0x and 1.0x, respectively.
Gearing Ratio
As at 31 December 2012, 2013 and 2014, the Cheung Kong Property Group’s gearing ratio was
50.1%, 41.9% and 34.2%, respectively. The decrease in gearing ratio during the Track Record Period
was primarily due to the decrease in interest-bearing amounts due to the Cheung Kong Group while our
total equity increased in the Track Record Period.
Debt-to-Asset Ratio
As at 31 December 2012, 2013 and 2014, the Cheung Kong Property Group’s debt-to-asset ratio
was 28.7%, 26.0% and 24.1%, respectively. The decrease in gearing ratio during the Track Record
Period was also primarily due to the decrease in amounts due to the Cheung Kong Group while total
assets remained relatively stable.
Return on Total Assets
For the years ended 31 December 2012, 2013 and 2014, return on total assets of the Cheung Kong
Property Group was 9.1%, 7.9% and 9.5%, respectively. The increase in return on total assets from
7.9% for the year ended 31 December 2013 to 9.5% for the year ended 31 December 2014 was
primarily due to an increase in profit for the year ended 31 December 2014. The decrease in return on
total assets from 9.1% for the year ended 31 December 2012 to 7.9% for the year ended 31 December
2013 was primarily due to a decrease in profit for the year. Total assets remained relatively stable
throughout the Track Record Period.
Return on Equity
For the years ended 31 December 2012, 2013 and 2014, return on equity of the Cheung Kong
Property Group was 20.9%, 16.2% and 17.5%, respectively. The increase in return on equity from
16.2% for the year ended 31 December 2013 to 17.5% for the year ended 31 December 2014 was
primarily due to an increase in profit for the year ended 31 December 2014. The decrease in return on
equity from 20.9% for the ended 31 December 2012 to 16.2% for the year ended 31 December 2013
was primarily due to the decrease in profit for the year ended 31 December 2013.
– 266 –
FINANCIAL INFORMATION
The Hutchison Property Group
The following table sets out the key financial ratios for the Hutchison Property Group as at and
for the periods indicated:
As at and for the year ended 31 December
2012
Liquidity ratios
Current ratio(1) . . . . . . .
Quick ratio(2) . . . . . . . . .
Capital adequacy ratios
Gearing ratio(3) . . . . . . .
Debt-to-asset ratio(4) . . .
Profitability ratios
Return on total assets(5) . .
Return on equity(6) . . . . .
2013
2014
.......................
.......................
1.5x
1.5x
1.9x
1.9x
1.7x
1.6x
.......................
.......................
25.1%
20.5%
27.7%
19.4%
20.5%
15.2%
.......................
.......................
6.2%
11.1%
6.5%
10.9%
19.9%
30.7%
Notes:
(1)
Current ratio is calculated by dividing total current assets by total current liabilities.
(2)
Quick ratio is calculated by dividing total current assets less stock of properties by total current liabilities.
(3)
Gearing ratio is calculated by dividing interest-bearing borrowings and interest-bearing amounts due to the
Hutchison Group less cash and cash equivalents by total equity and multiplying the resulting value by 100%.
(4)
Debt-to-asset ratio is calculated by dividing interest-bearing borrowings and interest-bearing amounts due to the
Hutchison Group by total assets and multiplying the resulting value by 100%.
(5)
Return on total assets is calculated by dividing profit for the year by total assets at the end of the year and
multiplying the resulting value by 100%.
(6)
Return on equity is calculated by dividing profit for the year by total equity at the end of the year and multiplying
the resulting value by 100%.
Current Ratio
As at 31 December 2012, 2013 and 2014, the Hutchison Property Group’s current ratio was 1.5x,
1.9x and 1.7x, respectively. The decrease in the current ratio from 1.9x as at 31 December 2013 to 1.7x
as at 31 December 2014 was mainly due to an increase in amounts due to the Hutchison Group, which
was partially offset by an increase in amounts due from the Hutchison Group. The increase in the
current ratio from 1.5x as at 31 December 2012 to 1.9x as at 31 December 2013 was mainly due to an
increase in debtors, deposits and prepayments and an increase in amounts due from the Hutchison
Group. The adjusted current ratio (excluding amounts due from the Hutchison Group and amounts due
to the Hutchison Group) was 3.2x, 1.9x and 1.5x, respectively, as bank balances and deposits decreased
over the Track Record Period.
– 267 –
FINANCIAL INFORMATION
Quick Ratio
As at 31 December 2012, 2013 and 2014, the Hutchison Property Group’s quick ratio was 1.5x,
1.9x and 1.6x, respectively. The ratios are close to the current ratios, since stock of properties only
accounted for a relatively small portion of current assets during the Track Record Period. The adjusted
quick ratio (excluding amounts due from the Hutchison Group and amounts due to the Hutchison
Group) was 2.9x, 1.6x and 1.2x, respectively.
Gearing Ratio
As at 31 December 2012, 2013 and 2014, the Hutchison Property Group’s gearing ratio was
25.1%, 27.7% and 20.5%, respectively. The decrease in gearing ratio from 27.7% as at 31 December
2013 to 20.5% as at 31 December 2014 was primarily due to an increase in total equity. The increase in
gearing ratio from 25.1% as at 31 December 2012 to 27.7% as at 31 December 2013 was primarily due
to a decrease in bank balances and deposits.
Debt-to-Asset Ratio
As at 31 December 2012, 2013 and 2014, the Hutchison Property Group’s debt-to-asset ratio was
20.5%, 19.4% and 15.2%, respectively. The decrease in debt-to-asset ratio over the Track Record Period
was primarily due to an increase in total assets and a slight decrease in interest-bearing borrowings.
Return on Total Assets
For the years ended 31 December 2012, 2013 and 2014, the return on total assets of the
Hutchison Property Group was 6.2%, 6.5% and 19.9%, respectively. The increase in return on total
assets over the Track Record Period was primarily due to the increase in profit for the year over the
Track Record Period.
Return on Equity
For the years ended 31 December 2012, 2013 and 2014, the return on equity of the Hutchison
Property Group was 11.1%, 10.9% and 30.7%, respectively. The increase in return on equity from
10.9% for the year ended 31 December 2013 to 30.7% for the year ended 31 December 2014 was
primarily due to the increase in profit for the year ended 31 December 2014. The slight decrease in
return on equity from 11.1% for the year ended 31 December 2012 to 10.9% for the year ended 31
December 2013 was primarily due to the increase in total equity, which was partially offset by the
increase in profit for the year.
PROPERTIES AND VALUATION
The particulars of the investment properties are set out in “Business” and in “Appendix III –
Property Valuation”. The Property Valuers have valued the properties as at 28 February 2015. A full list
of properties and a summary of the values issued by the Property Valuers is included in “Appendix III –
Property Valuation.”
– 268 –
FINANCIAL INFORMATION
A reconciliation of the net book value of the properties as at 31 December 2014 as set out
“Appendix IA – Accountants’ Report on the Cheung Kong Property Group” and “Appendix IB
Accountants’ Report on the Hutchison Property Group” to their fair value as at 28 February 2015
stated in the property valuation reports set out in “Appendix III – Property Valuation” is set out
“Business – Property Valuation”.
in
–
as
in
QUALITATIVE AND QUANTITATIVE DISCLOSURE ABOUT MARKET RISK
The main market risks arising from our operations during the Track Record Period were credit
risk, interest rate risk, liquidity risk, foreign currency risk and foreign exchange risk.
Credit Risk
The Cheung Kong Property Group
The Cheung Kong Property Group is exposed to credit risk in relation to loan receivables and
trade debtors. It has legal rights to claim repossession of the properties in the event of default by
purchasers or tenants. To minimise its credit risk exposures, the Cheung Kong Property Group also
conducts regular reviews of and takes follow-up action on overdue amounts. As at 31 December 2012,
2013 and 2014, overdue loan receivables and trade debtors were less than 2% of the Cheung Kong
Property Group’s profit for the respective years and credit risk on loan receivables and trade debtors
after mitigation by collateral and other credit enhancements was negligible.
The Cheung Kong Property Group manages its exposure to investments in securities and
derivative financial instruments to price changes by closely monitoring changes in market conditions
that may have an impact on market prices or factors affecting their fair value. If the fair value of the
investments in securities and derivative financial instruments had been 5% higher or lower as at 31
December 2012, 2013 and 2014, the Cheung Kong Property Group’s investment revaluation reserve
would increase or decrease by approximately HK$267 million, HK$273 million and HK$359 million,
and the Cheung Kong Property Group’s profit for the years ended 31 December 2012, 2013 and 2014
would increase or decrease by approximately HK$26 million, nil and nil, respectively.
The Hutchison Property Group
The Hutchison Property Group is exposed to credit risk in relation to debtors, deposits and
prepayments, cash held by stakeholders, cash deposits with banks and amounts due from the Hutchison
Group, joint ventures and associates. The Hutchison Property Group also has policies in place to ensure
that rental deposits are required from tenants prior to the commencement of leases. Monthly rentals in
respect of investment properties are payable in advance by tenants in accordance with the lease
agreements. Other monitoring procedures include follow-up action to recover overdue debts. In
addition, the Hutchison Property Group regularly reviews the recoverable amount of each individual
receivable to ensure that adequate impairment losses are made for any irrecoverable amounts.
With respect to advances made to related parties, joint ventures and associates, and guarantees
provided to banks for loans of joint ventures, the central treasury department assesses the recoverability
of the advances and the creditworthiness of the companies by reference to the budgeted profitability of
the relevant property projects before committing to making the advances and guarantees. The Hutchison
Property Group therefore has no significant concentration of credit risk, and its exposure is spread over
a number of counterparties.
– 269 –
FINANCIAL INFORMATION
Interest Rate Risk
The Cheung Kong Property Group’s and the Hutchison Property Group’s exposure to the risk of
changes in market interest rates relates primarily to certain amounts due from and to joint ventures, the
Cheung Kong Group, the Hutchison Group, loan receivables and bank balances and deposits. In
addition, certain amounts due to the Cheung Kong Group, the Hutchison Group, and bank loans at
market interest rates also expose the Cheung Kong Group and the Hutchison Group to cash flow
interest rate risk.
The Cheung Kong Property Group
The Cheung Kong Property Group’s borrowings and those amounts due to the Cheung Kong
Group carrying interest on a floating rate basis are exposed to interest rate fluctuation. It is estimated
that an increase/a decrease of 1 % in interest rates would increase/decrease the Cheung Kong Property
Group’s finance costs for the years ended 31 December 2012, 2013 and 2014 by approximately
HK$405 million, HK$401 million and HK$375 million, respectively, assuming the change in interest
rates had been applied to the Cheung Kong Property Group’s relevant amounts due to the Cheung Kong
Group and borrowings at the year end dates which were kept constant throughout the relevant year, and
the amount of finance costs capitalised would increase/decrease by approximately HK$174 million,
HK$163 million and HK$130 million based on the proportion of finance cost capitalised during the
year.
The Hutchison Property Group
The following table shows the sensitivity analysis of an increase of 100 basis points in interest
rates at the end of the reporting period to profit or loss:
Year ended 31 December
Increase (decrease) of profit before taxation
Bank balances and deposits . . . . . . . . . . . .
Net amounts due to joint ventures . . . . . . .
Net amounts due to the Hutchison Group . .
Borrowings. . . . . . . . . . . . . . . . . . . . . . . .
.
.
.
.
.
.
.
.
.
.
.
.
.
.
.
.
.
.
.
.
.
.
.
.
.
.
.
.
.
.
.
.
.
.
.
.
2012
2013
2014
(HK$
million)
(HK$
million)
(HK$
million)
.
.
.
.
80
(42)
(268)
(9)
31
(15)
(264)
(8)
22
(5)
(256)
(8)
Total . . . . . . . . . . . . . . . . . . . . . . . . . . . . . . . . . . . . . .
(239)
(256)
(247)
Liquidity Risk
The Cheung Kong Property Group and the Hutchison Property Group aim to maintain sufficient
cash and cash equivalents or otherwise have available funding through an adequate amount of
borrowings. See Note 22(c) to the “Appendix IA – Accountants’ Report on the Cheung Kong Property
Group” and Note 27.1(iv) to the “Appendix IB – Accountants’ Report on the Hutchison Property
Group” for more details.
– 270 –
FINANCIAL INFORMATION
Foreign Exchange Risk
The Cheung Kong Property Group and the Hutchison Property Group operate mainly in Hong
Kong and the PRC, but also have operations in other jurisdictions. The Cheung Kong Property Group
and the Hutchison Property Group maintain a conservative approach on foreign exchange exposure
management and ensure that their exposure to fluctuations in foreign exchange rates is minimised by
closely monitoring the movement of the foreign currency rates.
HEDGING POLICY
The Cheung Kong Property Group
The Cheung Kong Property Group’s principal foreign currency exposure arises from income in
foreign currencies, including RMB and SGD, generated from its investments in property projects
outside of Hong Kong, as well as cash in these foreign currencies kept for business requirements. The
Cheung Kong Property Group maintains a conservative approach on foreign exchange exposure
management and ensures that its exposure to fluctuations in foreign exchange rates is minimised.
During the Track Record Period, the Cheung Kong Property Group did not enter into any hedging
instruments.
The Hutchison Property Group
The Hutchison Property Group is exposed to foreign currency risk arising from future commercial
transactions and from recognising assets and liabilities that are not denominated in Hong Kong dollars.
It generates income and has expenditures denominated in the respective local currencies of the various
regions where it operates, including the PRC, the United Kingdom, Singapore and The Bahamas. The
Hutchison Property Group manages its foreign currency risk by closely monitoring the movement of
foreign currency rates and by ensuring that to the extent possible, its borrowings are denominated in the
respective local currencies of those regions. During the Track Record Period, the Hutchison Property
Group did not enter into any hedging instruments.
DIVIDEND POLICY
Prior to completion of the Merger Proposal, each of the Hutchison Group and the Cheung Kong
Group declared a second interim dividend in lieu of a final dividend in respect of the financial year of
2014 based on their respective full results for the financial year of 2014, which was paid on 15 April
2015.
For the financial year of 2015, if the Merger Proposal and the Spin-off have become effective, an
interim dividend will be declared by each of CKH Holdings and the Company at the time of the
announcement of their respective interim results which will take into account the results of the
respective businesses of the CKH Holdings Group and the Group from 1 January 2015. Subject to the
business results for the financial year of 2015, assuming an existing CKH Holdings Shareholder or
Hutchison Shareholder continues to hold both the CKH Holdings Shares and the Shares received after
completion of the Proposals, it is expected that the combined per share dividend CKH Holdings and the
Company will pay in respect of the financial year of 2015 on those shares will be more than the total
dividend per Cheung Kong share or Hutchison Share, as the case may be, paid in respect of the
financial year of 2014, excluding any special dividends paid in that year.
– 271 –
FINANCIAL INFORMATION
Going forward, from and including the financial year of 2016, the Company will adopt a dividend
policy that is consistent with its business profile. Subject to business conditions and the maintenance of
a strong credit profile, the Company expects the dividend policy will result in a higher dividend payout
ratio than that in the financial year of 2015.
The Company was incorporated on 2 January 2015 and is an investment holding company
carrying on no business activities. Accordingly, there was no reserve available for distribution to
shareholders as at 31 December 2012, 2013 and 2014.
OFF-BALANCE SHEET ARRANGEMENTS
During the Track Record Period and as at the Latest Practicable Date, aside from the capital
commitments and contingent liabilities discussed above, the Cheung Kong Property Group and the
Hutchison Property Group had no material off-balance sheet arrangements.
NO ADDITIONAL DISCLOSURE REQUIRED UNDER THE LISTING RULES
Except as disclosed in this listing document, the Company confirms that, as at the Latest
Practicable Date, the Company was not aware of any circumstances that would give rise to a disclosure
requirement under Rules 13.13 to 13.19 of the Listing Rules.
DIRECTORS’ CONFIRMATION OF NO MATERIAL ADVERSE CHANGE
The Directors are not aware of any material adverse change in the financial or trading position of
the Group since 31 December 2014, being the date to which the latest published audited consolidated
financial statements of the Group were made and up to the Latest Practicable Date.
LISTING EXPENSES
In relation to the Listing, the Company expects to incur listing expenses of approximately
HK$140.1 million prior to completion of the Hutchison Proposal and the Property Businesses
Combination, the entirety of which will be borne by the CKH Holdings Group. The Company did not
incur listing expenses during the Track Record Period.
UNAUDITED PRO FORMA FINANCIAL INFORMATION
The unaudited pro forma financial information has been prepared for illustrative purposes only
and because of its hypothetical nature, it may not give a true picture of the financial position of the
Group had the Listing been completed as at 31 December 2014 or any future date. We have prepared
and included the unaudited pro forma financial information as at and for the year ended 31 December
2014 as set out in Appendix II for the purpose of illustrating the effect of the completion of the
Hutchison Proposal and the Property Businesses Combination (including consolidation of the joint
ventures that will become subsidiaries of the Company) as if the Listing had taken place on 1 January
2014 for the pro forma combined income statement and statement of cash flows; and 31 December
2014 for the pro forma combined statement of assets and liabilities. The unaudited pro forma financial
information has been prepared in accordance with paragraph 4.29 of the Listing Rules, incorporating
the combined results and cash flows of the Cheung Kong Property Group, the Hutchison Property
Group and the joint ventures that will become subsidiaries of the Company for the year ended 31
December 2014; and the combined assets and liabilities of the Cheung Kong Property Group, the
– 272 –
FINANCIAL INFORMATION
Hutchison Property Group and the joint ventures that will become subsidiaries of the Company as at 31
December 2014. The unaudited pro forma information does not form part of the Accountants’ Reports
set out in Appendices IA and IB to this listing document.
See “Appendix II – Unaudited Pro Forma Financial Information” for details.
RECENT DEVELOPMENTS
On 9 January 2015, Cheung Kong and Hutchison announced the Cheung Kong Reorganisation, the
Merger Proposal and the Spin-off. CKH Holdings became the holding company of the Cheung Kong
Group upon completion of the Cheung Kong Reorganisation on 18 March 2015.
Save as disclosed in “Summary – Recent Developments”, as far as the Directors are aware, there
have been no material changes in the general economic and market conditions, or legal and regulatory
regimes, in the jurisdictions or the industries in which the Cheung Kong Property Group and the
Hutchison Property Group operate that have materially and adversely affected the Group’s business,
operations or financial position since 31 December 2014 and up to the Latest Practicable Date.
– 273 –
SHARE CAPITAL
SHARE CAPITAL OF THE COMPANY
The following is a description of the authorised and issued share capital of the Company as at the
date of this Listing Document and immediately following the Listing.
Nominal
Value
(HK$)
Authorised share capital
380,000
8,000,000,000
Shares as at the date of this listing document
Shares as at the Listing Date
Issued and to be issued, fully paid or credited as fully paid
1 Share in issue as at the date of this listing document
1 Share to be issued for settlement of the Reorganisation
Promissory Note
3,859,678,500 Shares to be issued pursuant to the Distribution In Specie
To be surrendered for cancellation
2 Shares to be surrendered for cancellation
380,000.00
8,000,000,000.00
1.00
1.00
3,859,678,500.00
2.00
ASSUMPTIONS
The above table assumes that the Listing becomes unconditional and does not take into account
any Shares which may be issued or purchased by the Company pursuant to the general mandates
granted to the Directors to issue or purchase Shares as described below.
RANKING
The Shares are ordinary shares in the share capital of the Company and will rank equally in all
respects with each other, and will qualify for all dividends and other distributions declared, made or
paid by the Company following completion of the Listing.
GENERAL MANDATES GRANTED TO THE DIRECTORS
Subject to the Listing becoming unconditional, general mandates have been granted to the
Directors to allot and issue Shares and to purchase Shares. For details of such general mandates, see
“Appendix VII – General Information – Further Information about the Company”.
– 274 –
SUBSTANTIAL SHAREHOLDERS
So far as is known to any Director or chief executive of the Company as at the Latest Practicable
Date, immediately following completion of the Spin-off, the following persons (other than a Director or
chief executive of the Company) will have an interest and/or short position (as applicable) in the Shares
or the underlying Shares which would fall to be disclosed to the Company and the Stock Exchange
under the provisions of Divisions 2 and 3 of Part XV of the SFO, or will, directly or indirectly, be
interested in 10% or more of the nominal value of any class of share capital carrying rights to vote in
all circumstances at general meetings of any other member of the Group, once the Shares are listed on
the Stock Exchange:
(i)
Long Positions of Substantial Shareholders in Shares
Name of Shareholder
Capacity
Number of
Shares held or
interested
Approximate %
of interest
Li Ka-Shing Unity Trustee Company
Limited (being TUT1) as trustee of
The Li Ka-Shing Unity Trust (being
UT1) . . . . . . . . . . . . . . . . . . . . . . .
Trustee
936,462,744(1)
24.26%
Li Ka-Shing Unity Trustee
Corporation Limited (being TDT1)
as trustee of The Li Ka-Shing Unity
Discretionary Trust (being DT1) . . .
Trustee, and in such
capacity a
beneficiary of a
trust
936,462,744(1)
24.26%
Li Ka-Shing Unity Trustcorp Limited
(being TDT2) as trustee of DT2 . . .
Trustee, and in such
capacity a
beneficiary of a
trust
936,462,744(1)
24.26%
Note:
(1)
The references to 936,462,744 Shares relate to the same block of Shares. Of these 936,462,744 Shares, 913,378,704
Shares are held by TUT1 as trustee of UT1 and 23,084,040 Shares are held by companies controlled by TUT1 as
trustee of UT1. Each of TDT1 as trustee of DT1 and TDT2 as trustee of DT2 holds units in UT1 but is not entitled
to any interest or share in any particular property comprising the trust assets of UT1. Each of TUT1 as trustee of
UT1, TDT1 as trustee of DT1 and TDT2 as trustee of DT2 is taken to have a duty of disclosure in relation to these
936,462,744 Shares under the SFO.
– 275 –
SUBSTANTIAL SHAREHOLDERS
(ii)
Substantial Shareholders of Other Members of the Group
Name of Subsidiary of the Company
(1)
(2)
(3)
Name of Shareholder
Braintech Limited
Blissjoy International Limited
Cavendish Hotels (Holdings) Limited
Billion Merit Limited
Best Shield Limited
Beijing Tourism Group (HK)
Holdings Company Limited
嘉雲酒店
(集團)有限公司
(4)
Chengdu Changtian Co. Ltd.
Approximate
% of
Interest
10%
20%
49%
首都旅游集團(香港)
控股有限公司
成都工投資產經營有限公司
30%
上海國盛集團地產有限公司
上海達安房產開發有限公司
15%
25%
成都長天有限公司
(5)
Cheung Wo DaSheng Properties
(Shanghai) Limited
(6)
Consolidated Hotels Limited
(7)
Dongguan Asia Commercial Hwang
Gang Lake Development Co., Ltd.*
長和達盛地產(上海)
有限公司
Starwood Hong Kong Holdings
Tai Cheung Properties Limited
24.5%
23%
大昌地產有限公司
東莞市厚街房地產公司
25%
東莞市厚街鎮對外經濟發展總公司
15%
Golden Link Establishments
Limited 金聯拓展有限公司
Hopewell Holdings Limited
20%
東莞冠亞環崗湖商住區建造有限公司
(8)
Dongguan Hujing Holiday Country
Co., Ltd. 東莞湖景渡假村有限公司
(9) Estoril Court Management Company
Limited 愛都大廈管理有限公司
(10) Granlai Company Limited
45.95%
添麗有限公司
(11) Great Wall Hotel Joint Venture of
Beijing* 北京市長城飯店公司
(12) Guangzhou Bruckner City Properties
Co. Ltd. 廣州和記城市房產有限公司(a)
(13) Guangzhou International Toys And
Gifts Center Co., Ltd.*
北京首都旅游集團有限責任公司
10%
廣州市城市建設開發集團有限公司
35%
廣州國際玩具中心有限公司
40%
Lucky Star International Holdings
Inc.
Po Lian Enterprises Limited
20%
廣州國際玩具禮品城有限公司
(14) Hui Xian Holdings Limited
滙賢控股有限公司
(15) Hutchison Whampoa Properties
(Tianjin) Limited
天津市地下鐵道集團有限公司
20%
20%
Chesterfield Realty Limited
20%
兆豐地產有限公司
江門市樂活企業策劃有限公司
10%
和記黃埔地產(天津)
有限公司
(16) Jabrin Limited
(17) Jiangmen Hutchison Whampoa
Properties Limited
江門市和記黃埔地產有限公司
(18) Kido Profits Limited
(19) Marino Capital Holdings Limited
(20) Mutual Luck Investment Limited
Kowill Investments Inc.
Marathon Joy Limited
Stalybridge Investment Limited
E-Cash Ventures Limited
– 276 –
15%
15%
33.33%
15.33%
SUBSTANTIAL SHAREHOLDERS
Name of Subsidiary of the Company
(21) Qingdao Sihe Property Development
Co., Ltd.
Name of Shareholder
Approximate
% of
Interest
上海中星
(集團)
有限公司
20%
廣州方興房地產建設有限公司
20%
Neko International Limited
Direct Access Investments Ltd.
Gusbury Enterprises Inc.
上海長潤房地產開發有限公司
上海江和房地產開發有限公司
15%
20%
20%
25%
15%
上海梅龍鎮集團盧灣置業有限公司
15%
上海梅龍鎮集團置業有限公司
15%
上海梅龍鎮
(集團)有限公司
40%
中國航空技術深圳有限公司
20%
(31) Shepherd Investments Limited
Tai Cheung Properties Limited
48%
(32)
(33)
(34)
(35)
(36)
Bylite (Nominees) Limited(b)
Nan Fung Development Limited
Master Rank Investments Limited
Super Peak Holdings Limited
Nan Fung Development Limited
青島四和房地產發展有限公司(a)
(22) Regal Lake Property Development
Limited Guangzhou
廣州御湖房地產發展有限公司
(23)
(24)
(25)
(26)
Rivet Profits Limited
Ruotolo Investments Limited
Secan Limited
Shanghai Changrun Jianghe Property
Development Co., Ltd.*
上海長潤江和房地產發展有限公司
(27) Shanghai Qilong Properties Limited
上海旗龍置業有限公司
(28) Shanghai Ron Qi Properties Co.,
Ltd.* 上海榮啟置業有限公司
(29) Shanghai Westgate Mall Co., Ltd.
上海梅龍鎮廣場有限公司
(30) Shenzhen Hutchison Whampoa
CATIC Properties Limited*
深圳和記黃埔中航地產有限公司
大昌地產有限公司
*
Splendid Well Limited 錦佳有限公司
Stocklink Limited
Trudeau Holdings Limited
Wideplex Limited
Wit Profits Limited
25%
20%
10%
40%
15%
for identification only
Notes:
(a)
This company is being liquidated.
(b)
Bylite (Nominees) Limited holds 25% of Splendid Well Limited 錦佳有限公司 on trust for and on behalf of an
independent third party.
Save as disclosed above, as at the Latest Practicable Date, none of the Directors or chief
executive of the Company was aware of any other person (other than a Director or chief executive of
the Company) who will, immediately following completion of the Spin-off, have an interest and/or
short position (as applicable) in the Shares or the underlying Shares which would fall to be disclosed to
the Company and the Stock Exchange under the provisions of Divisions 2 and 3 of Part XV of the
SFO, or who is, directly or indirectly, interested in 10% or more of the nominal value of any class of
share capital carrying rights to vote in all circumstances at general meetings of any other member of
the Group.
– 277 –
RELATIONSHIP WITH THE CONTROLLING SHAREHOLDERS
BACKGROUND OF THE CONTROLLING SHAREHOLDERS
The Trust will, together with Mr. Li Ka-shing and Mr. Li Tzar Kuoi, Victor, directly and/or
indirectly hold approximately 30.15% of the issued share capital of the Company immediately
following the Listing. Notwithstanding that none of them will individually hold 30% or more of the
issued share capital of the Company immediately following the Listing, they have been deemed by the
Stock Exchange to be a group of controlling shareholders of the Company for the purpose of the
Listing Rules. In addition, the Trust, together with Mr. Li Ka-shing and Mr. Li Tzar Kuoi, Victor, will
directly and/or indirectly hold approximately 30.15% of the issued share capital of CKH Holdings
immediately following the completion of the Hutchison Proposal and the Husky Share Exchange. As at
the Latest Practicable Date, the Company was a wholly-owned subsidiary of CKH Holdings. The
Company will cease to be a subsidiary of CKH Holdings upon completion of the Distribution In Specie.
The Trust is comprised of:
(i)
The Li Ka-Shing Unity Discretionary Trust (being DT1), of which Mr. Li Ka-shing is the
settlor and, among others, Mr. Li Tzar Kuoi, Victor, his wife and children, and Mr. Li Tzar
Kai, Richard are discretionary beneficiaries, and the trustee of which is Li Ka-Shing Unity
Trustee Corporation Limited (being TDT1);
(ii)
a discretionary trust (being DT2) of which Mr. Li Ka-shing is the settlor and, among others,
Mr. Li Tzar Kuoi, Victor, his wife and children, and Mr. Li Tzar Kai, Richard are
discretionary beneficiaries, and the trustee of which is Li Ka-Shing Unity Trustcorp Limited
(being TDT2);
(iii) a discretionary trust (being DT3) of which Mr. Li Ka-shing is the settlor and, among others,
Mr. Li Tzar Kuoi, Victor, his wife and children, and Mr. Li Tzar Kai, Richard are
discretionary beneficiaries, and the trustee of which is Li Ka-Shing Castle Trustee
Corporation Limited (being TDT3);
(iv) a discretionary trust (being DT4) of which Mr. Li Ka-shing is the settlor and, among others,
Mr. Li Tzar Kuoi, Victor, his wife and children, and Mr. Li Tzar Kai, Richard are
discretionary beneficiaries, and the trustee of which is Li Ka-Shing Castle Trustcorp Limited
(being TDT4);
(v)
The Li Ka-Shing Unity Trust (being UT1), the trustee of which is Li Ka-Shing Unity Trustee
Company Limited (being TUT1); and
(vi) The Li Ka-Shing Castle Trust (being UT3), the trustee of which is Li Ka-Shing Castle
Trustee Company Limited (being TUT3).
Each of TDT1 and TDT2 holds units in UT1 but is not entitled to any interest or share in any
particular property comprising the trust assets of UT1; whereas each of TDT3 and TDT4 holds units in
UT3 but is not entitled to any interest or share in any particular property comprising the trust assets of
UT3.
– 278 –
RELATIONSHIP WITH THE CONTROLLING SHAREHOLDERS
The issued share capital of TUT1 and of the trustees of DT1 and DT2 are owned by Li Ka-Shing
Unity Holdings Limited (“Unity Holdco”). Mr. Li Ka-shing and Mr. Li Tzar Kuoi, Victor are
respectively interested in one-third and two-thirds of the issued share capital of Unity Holdco. The
issued share capital of TUT3 and of the trustees of DT3 and DT4 are owned by Li Ka-Shing Castle
Holdings Limited (“Castle Holdco”). Mr. Li Ka-shing and Mr. Li Tzar Kuoi, Victor are respectively
interested in one-third and two-thirds of the issued share capital of Castle Holdco. Further, Mr. Li
Ka-shing is the settlor of DT1 and DT2 and, among others, Mr. Li Tzar Kuoi, Victor, his wife and
children, and Mr. Li Tzar Kai, Richard are discretionary beneficiaries of DT1 and DT2.
INDEPENDENCE FROM THE CONTROLLING SHAREHOLDERS AND CKH HOLDINGS
The Directors are satisfied that the Group is capable of carrying on its businesses independently
from the Controlling Shareholders and the CKH Holdings Group (in which the Controlling Shareholders
will in aggregate be interested in approximately 30.15% of the issued share capital of CKH Holdings
immediately following completion of the Hutchison Proposal and the Husky Share Exchange) following
the Listing on the basis of the following.
(a)
Clear Delineation of Business
There is a clear and distinct delineation between the businesses of the Group and the businesses
of the CKH Holdings Group. Upon the Listing, the Group will be engaged in the businesses of property
development and investment, hotel and serviced suite operation, property and project management and
unitholding in various real estate investment trusts. For details of the Group’s businesses, please refer
to “Business”. On the other hand, the CKH Holdings Group, through its operating subsidiaries, will
focus on the businesses of (a) ports and related services, (b) retail, (c) infrastructure, (d) energy, (e)
telecommunications, (f) ownership and leasing of movable assets, and (g) other investments in
securities.
Although the CKH Holdings Group will retain certain property interests which are used by it for
the purposes of carrying on, or which are ancillary to, its businesses and the CKH Holdings Group may
also hold the CPB Specified Companies upon completion of the Property Businesses Combination for
the reasons set out in “History and Reorganisation – The Reorganisation – Property Businesses
Combination”, the Directors consider that there is a clear delineation between the businesses of the
Group and the businesses of the CKH Holdings Group following the Listing.
(b)
Financial Independence
In connection with the Property Businesses Combination, the consideration will be settled by two
promissory notes to be issued by the Company to CKH Holdings. The Reorganisation Promissory Note
will be settled by the Company by issuing one Share to CKH Holdings at completion of the
Reorganisation Agreement Transactions (being the Listing Date) and the Specified Loans Promissory
Note will be settled by the payment of cash by the Company to CKH Holdings on or before the fifth
business day following the date of completion of the assignment of the Specified Loans. Save for the
above, there will not be any loans due from the Group to the Controlling Shareholders or due from the
Group to the CKH Holdings Group.
Certain companies which are or will become members of the CKH Holdings Group as at the
Listing Date had given guarantees and indemnities in respect of the obligations of certain CPB
Companies, some of which will continue to subsist following the Listing. It is intended that such
guarantees and indemnities will be replaced by guarantees and/or indemnities from the Company
– 279 –
RELATIONSHIP WITH THE CONTROLLING SHAREHOLDERS
following completion of the Property Businesses Combination. Pursuant to the Reorganisation
Agreement, the Company has agreed to use all reasonable endeavours to procure that, as from
completion of the Reorganisation Agreement Transactions (and, in the case of the CPB Specified
Companies, from completion of the reorganisation of the relevant CPB Specified Companies), all
members of the CKH Holdings Group are released from all guarantees and indemnities given by any of
them in respect of any obligations of any CPB Companies and, pending such release, indemnify such
members of the CKH Holdings Group against all liabilities arising under the above guarantees and
indemnities in respect of, or attributable to, the period after completion of the Reorganisation
Agreement Transactions. Please see “History and Reorganisation – The Reorganisation – Property
Businesses Combination – The Reorganisation Agreement” for further details.
Given the strong asset base of the Group following completion of the Spin-off, the Group will be
able to independently access the debt markets and is expected to have a strong investment grade credit
rating.
On the basis of the foregoing, the Group will be financially independent of the Controlling
Shareholders and the CKH Holdings Group following the Listing.
(c)
Administrative Independence
Following completion of the Spin-off, certain corporate and administrative support services will
be made available by the CKH Holdings Group to the Group on arm’s length and normal commercial
terms and charged on a cost basis.
Save for the corporate and administrative support services referred to above, the Group will have
its own separate management team and separate functional units that focus on, among other things,
finance and accounting, administration and operations, company secretarial and human resources, all of
which will operate without reliance on the Controlling Shareholders or the CKH Holdings Group.
Accordingly, the Group will be administratively independent of the Controlling Shareholders and the
CKH Holdings Group following the Listing.
(d)
Independence of Directors and Management
Upon the Listing, certain executive Directors will continue to hold directorships and other roles
with CKH Holdings as set out below.
Directors
Name
Mr. Li Ka-shing . . . . . . . . . . . .
Mr. Li Tzar Kuoi, Victor . . . . . .
Mr. Kam Hing Lam. . . . . . . . . .
Mr. Ip Tak Chuen, Edmond . . . .
Mr. Chung Sun Keung, Davy . . .
Mr. Chiu Kwok Hung, Justin . . .
Position in the Company
Chairman and Executive
Director
Managing Director, Deputy
Chairman and Executive
Director
Deputy Managing Director
and Executive Director
Deputy Managing Director
and Executive Director
Executive Director
Executive Director
– 280 –
Position in CKH Holdings
Chairman and Executive
Director
Deputy Chairman, Group CoManaging Director and
Executive Director
Deputy Managing Director
and Executive Director
Deputy Managing Director
and Executive Director
None
None
RELATIONSHIP WITH THE CONTROLLING SHAREHOLDERS
Name
Position in the Company
Mr. Chow Wai Kam . . . . . . . .
Ms. Pau Yee Wan, Ezra . . . . . .
Ms. Woo Chia Ching, Grace . .
Mr. Cheong Ying Chew, Henry
.
.
.
.
Mr. Chow Nin Mow, Albert . . . .
Ms. Hung Siu-lin, Katherine . . .
Mr. Simon Murray . . . . . . . . . .
Mr. Yeh Yuan Chang, Anthony . .
Executive Director
Executive Director
Executive Director
Independent Non-executive
Director
Independent Non-executive
Director
Independent Non-executive
Director
Independent Non-executive
Director
Independent Non-executive
Director
Position in CKH Holdings
None
None
None
None
None
None
None
None
The Directors believe that the Group will be able to operate independently of the CKH Holdings
Group following the Listing for the following reasons:
(i)
the Board comprises 14 Directors, 10 of whom will not have any ongoing role with, and are
therefore independent from, the CKH Holdings Group;
(ii)
save for Mr. Cheong Ying Chew, Henry acting as an Independent Non-executive Director of
Cheung Kong Infrastructure Holdings Limited (stock code: 01038) and Hutchison
Telecommunications Hong Kong Holdings Limited (stock code: 00215), and as an alternate
Director to Dr. Wong Yick-ming, Rosanna, an Independent Non-executive Director of
Hutchison Telecommunications Hong Kong Holdings Limited, all of which will become
listed subsidiaries of CKH Holdings upon the Listing, the Independent Non-executive
Directors, representing more than one-third of the Board, will not have any ongoing role
with the CKH Holdings Group. The Directors believe that the Independent Non-executive
Directors will be able to provide independent oversight over the Board’s decision making on
significant transactions, connected transactions and other transactions involving any conflict
of interest between the Group (on the one hand) and the CKH Holdings Group (on the other
hand) and to protect the interests of the independent Shareholders;
(iii) the Company will also have its own separate management team and separate functional units
with appropriate expertise and experience to manage the Group’s businesses, all of which
operate independently from the CKH Holdings Group; and
(iv) the Company has established the following corporate governance measures to seek to (A)
address any potential conflicts of interest in respect of the overlapping of directors of the
Group and the CKH Holdings Group and (B) safeguard the interests of the independent
Shareholders:
Under the Articles, a Director who to his knowledge is in any way, whether directly or
indirectly, interested in a contract or arrangement or proposed contract or arrangement with
the Company shall, if his interest in the contract or arrangement or proposed contract or
arrangement is material, declare the nature of his interest at the meeting of the Board at
which the question of entering into the contract or arrangement is first taken into
consideration if he knows his interest then exists, or in any other case, at the first meeting
of the Board after he knows that he is or has become so interested. Although the Articles do
– 281 –
RELATIONSHIP WITH THE CONTROLLING SHAREHOLDERS
not require a Director who is so interested not to attend any meeting of the Board, such
Director is prohibited from voting (and will not be counted in the quorum) in respect of any
board resolution approving any contract or arrangement or proposed contract or arrangement
in which he or any of his associates is materially interested, except in certain prescribed
circumstances, details of which are set out in “Appendix V – Summary of the Constitution of
the Company and Cayman Companies Law”. The provisions in the Articles ensure that
matters involving a conflict of interest which may arise from time to time will be managed
in line with accepted corporate governance practice with a view to ensuring that decisions
are taken having regard to the best interests of the Company and the Shareholders (including
the independent Shareholders) taken as a whole.
– 282 –
CONNECTED TRANSACTIONS
OVERVIEW
Immediately following completion of the Spin-off, the Trust, together with Mr. Li Ka-shing and
Mr. Li Tzar Kuoi, Victor, will directly and/or indirectly hold approximately 30.15% of the issued share
capital of the Company. In addition, the Trust, together with Mr. Li Ka-shing and Mr. Li Tzar Kuoi,
Victor will directly and/or indirectly hold approximately 30.15% of the issued share capital of CKH
Holdings immediately following completion of the Hutchison Proposal and the Husky Share Exchange.
Whilst CKH Holdings does not fall within the scope of connected persons of the Company under
the relevant provisions of the Listing Rules, each of CKH Holdings and the Company has been deemed
by the Stock Exchange to be a connected person of the other after completion of the Spin-off. The
Company has sought a review of the deeming decision but the Stock Exchange has maintained its
position. Accordingly, transactions entered into between members of the Group and members of the
CKH Holdings Group following the Listing will, as a result, constitute connected transactions of the
Company under the Listing Rules.
The Stock Exchange has exercised its power under Rule 14A.19 of the Listing Rules to deem
Mr. Li Ka-shing, Mr. Li Tzar Kuoi, Victor and the Trust as a group of connected persons, and to deem
the Trust as an associate of Mr. Li Tzar Kuoi, Victor. The Stock Exchange considers, and as conceded
by the Group, that Mr. Li Tzar Kuoi, Victor and the Trust are closely associated. The Trust and Mr. Li
Tzar Kuoi, Victor together hold only approximately 26.7% of the issued share capital of CKH Holdings
immediately following completion of the Hutchison Proposal and the Husky Share Exchange. Further,
the Stock Exchange considers that Mr. Li Ka-shing and Mr. Li Tzar Kuoi, Victor are closely associated
given their blood relationship and their history of operating Cheung Kong and Hutchison together. In
addition, the Stock Exchange considers that, after the Listing, CKH Holdings and the Company may
have different groups of minority shareholders and on a future date the percentage shareholding of each
of CKH Holdings and the Company held by Mr. Li Ka-shing, Mr. Li Tzar Kuoi, Victor and the Trust
may be different, and therefore may result in a transfer of benefits from one company to another.
Details of the transactions which will continue, or which may from time to time be entered into,
following the Listing between members of the Group and the connected persons of the Company
(including members of the CKH Holdings Group) as well as the waiver granted by the Stock Exchange
from strict compliance with the relevant requirements in Chapter 14A of the Listing Rules are set out
below.
A.
FULLY EXEMPT CONTINUING CONNECTED TRANSACTIONS
Following the Listing, the following transactions will be regarded as continuing connected
transactions of the Company which are exempt from the reporting, announcement, annual review and
independent shareholders’ approval requirements under Chapter 14A of the Listing Rules.
(a)
Sharing of corporate, administrative and other support services between the Group and the
CKH Holdings Group
With a view to providing corporate, administrative and other support services to the respective
administrative teams of the Group and the CKH Holdings Group, the Company and CKH Holdings
entered into an agreement dated 5 May 2015 pursuant to which:
– 283 –
CONNECTED TRANSACTIONS
(i)
CKH Holdings agreed to provide or procure to be provided to the Group from time to time
as from the Listing Date, on a cost basis, corporate, administrative and other support
services as and when reasonably requested by the Company and agreed by CKH Holdings,
including the use of accounting and office management software systems, tax advice and
related services, the use of office equipment and facilities, certain staff and personnel
support, participation of staff in the medical and insurance plans of the CKH Holdings
Group, staff pension administrative services, staff training services, and such other corporate,
administrative and support services as may be agreed between CKH Holdings and the
Company from time to time; and
(ii)
the Company agreed to provide or procure to be provided to the CKH Holdings Group from
time to time as from the Listing Date, on a cost basis, corporate, administrative and other
support services as and when reasonably requested by CKH Holdings and agreed by the
Company, including company secretarial and accounting services, the use of accounting and
office management software systems, tax advice and related services, the use of office
equipment and facilities, certain staff and personnel support, and such other corporate,
administrative and support services as may be agreed between CKH Holdings and the
Company from time to time.
Such agreement is for an initial term of three years from the Listing Date and thereafter shall be
automatically renewed for successive periods of three years subject to compliance with the relevant
requirements of the Listing Rules, unless terminated by the Company or CKH Holdings by not less than
three months’ written notice or otherwise in accordance with the other terms of the agreement. The
relevant member of the Group and the relevant member of the CKH Holdings Group may, where they
consider necessary or appropriate, enter into a separate agreement with respect to any of the services
set out in the agreement to be provided by any of them.
As such administrative support services will be provided on a cost basis and the costs are
identifiable and are allocated between the Group and the CKH Holdings Group on a fair and equitable
basis, they will constitute continuing connected transactions exempt from the reporting, announcement,
annual review and independent shareholders’ approval requirements under Rule 14A.98 of the Listing
Rules.
(b)
Purchase of consumer goods and services by the Group from the CKH Holdings Group
Members of the Group have been purchasing, and will continue to purchase from time to time
following the Listing, consumer goods and services from the CKH Holdings Group, including office
and computer supplies, electrical appliances, distilled water, gift coupons for staff functions, food and
beverages, groceries, travel and transportation booking services, commercial printing services and office
relocation services.
As the consumer goods and services will be provided by the CKH Holdings Group to the Group
on normal commercial terms which are no less favourable than those made available to the Group by
independent third party suppliers and such goods and services will be provided for the Group’s or its
staff’s own use or consumption in the same state as when they were purchased, and not for resale,
processing into products of the Group or use by the Group for any of its businesses, the purchase of
such consumer goods and services by the Group from the CKH Holdings Group will constitute
continuing connected transactions exempt from the reporting, announcement, annual review and
– 284 –
CONNECTED TRANSACTIONS
independent shareholders’ approval requirements under Rule 14A.97 of the Listing Rules. The Group
will comply with the relevant requirements under Chapter 14A of the Listing Rules when conducting
such transactions.
(c)
Provision of consumer goods and services by the Group to connected persons other than the
CKH Holdings Group
Members of the Group have been providing, and will continue to provide following the Listing,
consumer goods and services (including hotel accommodation, food and beverage and catering services
and car parking space rental services in hotels and other premises owned by members of the Group
from time to time) to connected persons of the Company (other than the CKH Holdings Group),
including the directors of members of the Group and their respective associates.
As the consumer goods and services will be provided by the Group to such connected persons on
normal commercial terms which are no more favourable than those made available to independent third
party consumers of the Group in the open market, the provision of such consumer goods and services
by the Group to such connected persons will constitute continuing connected transactions exempt from
the reporting, announcement, annual review and independent shareholders’ approval requirements under
Rule 14A.97 of the Listing Rules.
(d)
Intellectual property rights (“IPRs”) licensing arrangement by the CKH Holdings Group for
use by the Group
Certain trade marks, domain names and copyright which are used by members of the Group are
owned by companies which are or will following the Listing be members of the CKH Holdings Group
(the “relevant IPRs”). On 5 May 2015, Cheung Kong (Holdings) Limited, Hutchison Whampoa
Enterprises Limited, Hutchison Enterprises Limited, Hutchison Whampoa Enterprises (US) Inc. and
Hutchison Whampoa Properties Limited, each being the proprietor of the relevant IPR(s) (each a
“Proprietor”) and a member of the CKH Holdings Group upon Listing, entered into various licence
agreements with the Company pursuant to which the Company has been granted a licence to use certain
relevant IPRs containing or consisting of the brand names “Cheung Kong”, “Hutchison”,
“和記”, “和黃”, or “和記黃埔” and certain associated logos from the Listing Date on a royalty-free basis.
Such licences are for a term commencing on the Listing Date and will continue until terminated by the
relevant Proprietor(s) by not less than three months’ written notice or otherwise in accordance with the
other terms of the agreements. The Company will bear the third party costs and expenses relating to the
management of the relevant IPRs licensed to it on an exclusive basis.
Whilst assignment agreements with respect to the remaining relevant IPRs have been entered into
between the relevant member(s) of the CKH Holdings Group and the Company on 5 May 2015, an
interim licence to use such relevant IPRs on a royalty-free basis has been granted to the Company until,
in each case, the relevant assignment has been accepted and recorded with the relevant intellectual
property offices or domain name registrars.
As no royalty is payable for the licence and the interim licence of the relevant IPRs, each of the
applicable percentage ratios for the aggregate annual amount payable by the Group to the CKH
Holdings Group is less than 0.1% by reference to the Group’s pro forma financial information for the
year ended 31 December 2014 and accordingly, the above licensing arrangement will constitute a de
minimis continuing connected transaction exempt from the reporting, announcement, annual review and
independent shareholders’ approval requirements under Rule 14A.76(1) of the Listing Rules.
– 285 –
CONNECTED TRANSACTIONS
(e)
Provision of hotel and restaurant and catering related services by the Group to the CKH
Holdings Group
Members of the Group have been providing, and will continue to provide following the Listing,
hotel and restaurant and catering related services, including the leasing of hotel rooms and other hotel
premises and facilities, laundry services, food and beverage services, and restaurant and catering related
consultancy, management and ancillary services to the CKH Holdings Group. These services will be
provided by the Group on normal commercial terms or better to the Group than those made available
by the Group to its independent third party corporate customers.
As each of the applicable percentage ratios for the annual consideration receivable by the Group
from the CKH Holdings Group is less than 0.1% by reference to the Group’s pro forma financial
information for the year ended 31 December 2014, these transactions will constitute de minimis
continuing connected transactions exempt from the reporting, announcement, annual review and
independent shareholders’ approval requirements under Rule 14A.76(1) of the Listing Rules. The Group
will comply with the relevant requirements under Chapter 14A of the Listing Rules when conducting
such transactions.
B.
NON-EXEMPT CONTINUING CONNECTED TRANSACTIONS
1.
Particulars of the non-exempt continuing connected transactions
(a)
Leasing and licensing of premises by the Group to the CKH Holdings Group
In the ordinary course of business of the Group, members of the Group are either already a
party to, or may from time to time enter into, leases, tenancies or licences in respect of premises
owned by the Group (including office space, car parks and building areas but excluding hotel
premises) with members of the CKH Holdings Group (the “Leasing Transactions”).
As the Leasing Transactions will constitute continuing connected transactions of the
Company following the Listing, on 5 May 2015, the Company entered into an agreement with
CKH Holdings to set out the framework terms governing the Leasing Transactions (the “Master
Leasing Agreement”), the principal terms of which are set out below:
(1)
Subject Matter
The Company agrees to lease or license or to procure its subsidiaries to lease or
license various premises (including office space, car parks and building areas but excluding
hotel premises) owned by the Group to members of the CKH Holdings Group as and when
reasonably requested by members of the CKH Holdings Group from time to time during the
term of the Master Leasing Agreement.
(2)
Duration
The term of the Master Leasing Agreement is from the Listing Date up to 31
December 2017, unless terminated by the Company or CKH Holdings by not less than one
month’s written notice or otherwise in accordance with the other terms of the Master
Leasing Agreement.
– 286 –
CONNECTED TRANSACTIONS
(3)
Consideration and other terms
The relevant member of the Group and the relevant member of the CKH Holdings
Group will enter into a separate lease, tenancy or licence agreement with respect to each of
the Leasing Transactions entered into between them. The terms of, and the consideration
payable under, such agreements will be negotiated on a case-by-case and an arm’s length
basis, and shall be on normal commercial terms which, from the Group’s perspective, shall
be no more favourable to the relevant members of the CKH Holdings Group than those
made available by the Group to its independent third party corporate lessees, tenants or
licensees. In particular, the rental or licence fee chargeable shall be at market rates and
based on the then prevailing rental rates or licence fee rates for properties of similar size
and with similar attributes within the same building charged by the Group or, if not
available, the then prevailing rental rates or licence fee rates for properties of similar size
and with similar attributes in the vicinity of the subject premises to be leased, let or licensed
by the Group. The management/service fees chargeable by the Group to the relevant member
of the CKH Holdings Group will be the same as those chargeable by the Group to other
tenants or licensees of the same building or property.
Historical transaction amounts
The aggregate annual rental and licence fees of the Leasing Transactions for the three
financial years ended 31 December 2014 are as follows:
Financial year ended 31 December
Amounts (rounded to the
nearest million) . . . . . . . . .
(b)
2012
2013
2014
HK$475 million
HK$515 million
HK$563 million
Purchases of goods and services by the Group from the CKH Holdings Group for use in
connection with the Group’s property development projects
In the ordinary course of business, members of the Group have been purchasing, and will
continue to purchase following the Listing, from members of the CKH Holdings Group goods
(such as air-conditioners and other electrical appliances and gift/cash coupons) and services (such
as printing of sales brochures and advertising materials) (collectively the “Project Related
Supplies”) for use in connection with the Group’s property development projects (the “Project
Related Supplies Transactions”).
As the Project Related Supplies Transactions will constitute continuing connected
transactions of the Group following the Listing, on 5 May 2015, the Company entered into an
agreement with CKH Holdings to set out the framework terms governing the Project Related
Supplies Transactions (the “Master Purchase Agreement”), the principal terms of which are set
out below:
(1)
Subject Matter
CKH Holdings agrees to provide, or to procure its subsidiaries to provide, the Project
Related Supplies to members of the Group as and when reasonably requested by the
members of the Group from time to time during the term of the Master Purchase Agreement.
– 287 –
CONNECTED TRANSACTIONS
(2)
Duration
The term of the Master Purchase Agreement is from the Listing Date up to 31
December 2017, unless terminated by the Company or CKH Holdings by not less than one
month’s written notice or otherwise in accordance with the other terms of the Master
Purchase Agreement.
(3)
Consideration and other terms
The relevant member of the Group and the relevant member of the CKH Holdings
Group will enter into a separate contract with respect to each of the Project Related Supplies
Transactions entered into between them. The terms of, and the consideration payable under,
such contracts will be negotiated on a case-by-case and an arm’s length basis, and will be on
normal commercial terms which, from the Group’s perspective, shall be no less favourable
to the Group than those which the Group could obtain from independent third party suppliers
of the relevant Project Related Supplies. In particular, before considering issuing a purchase
order or awarding a purchase contract to the CKH Holdings Group, the Group will seek
competitive quotes via tendering or other processes (including conducting a comparison of
prices of a sufficient number of independent third party suppliers of comparable Project
Related Supplies in the market) for management review with a view to ensuring that the fees
payable by the Group to the CKH Holdings Group in connection with the Project Related
Supplies are fair and reasonable and comparable to those offered by independent third party
suppliers having regard to the quality, reliability, and service levels of the Project Related
Supplies required and the past performance of the CKH Holdings Group when providing the
Project Related Supplies.
Historical transaction amounts
The aggregate annual amounts of the Project Related Supplies Transactions for the
three financial years ended 31 December 2014 are as follows:
Financial year ended 31 December
Amounts (rounded to the
nearest million) . . . . . . . . .
2012
2013
2014
HK$27 million
HK$122 million
HK$54 million
The significant increase in the historical transaction amounts in respect of the Project
Related Supplies Transactions in 2013, as compared to 2012, was primarily due to: (a) the
replacement of split-type air conditioning units in all guest rooms in one of the Group’s
hotels and serviced suites, namely Harbourview Horizon, in 2013, the aggregate cost of
which amounted to approximately HK$66 million; and (b) an increase in the number of
development projects in respect of which the CKH Holdings Group provided Project Related
Supplies in 2013. The significant decrease in the historical transaction amounts in respect of
the Project Related Supplies Transactions in 2014, as compared to 2013, was primarily
because there was no large scale replacement of electrical appliances in 2014 similar to the
replacement of split type air conditioning units, the aggregate cost of which amounted to
HK$66 million, in 2013.
– 288 –
CONNECTED TRANSACTIONS
(c)
Provision of Internet and telecommunication products and services by the CKH Holdings
Group to the Group
In the ordinary course of business of the Group, members of the Group have been
purchasing, and will continue to purchase following the Listing, from the CKH Holdings Group
Internet and telecommunication products and services (the “Internet and Telecommunication
Supplies”), including mobile handsets hardware, fixed-line and mobile telecommunication
services, WIFI and Internet services, data centre services, and related installation, set-up and
maintenance services and such other Internet and telecommunications related products and
services as may be agreed between members of the CKH Holdings Group and members of the
Group from time to time (the “Internet and Telecommunication Supplies Transactions”).
As the Internet and Telecommunication Supplies Transactions will constitute continuing
connected transactions of the Group following the Listing, on 5 May 2015, the Company entered
into an agreement with CKH Holdings to set out the framework terms governing the Internet and
Telecommunication Supplies Transactions (the “Master Internet and Telecommunication
Supplies Agreement”), the principal terms of which are set out below:
(1)
Subject Matter
CKH Holdings agrees to provide, or to procure its subsidiaries to provide, the Internet
and Telecommunication Supplies to members of the Group as and when reasonably requested
by members of the Group from time to time during the term of the Master Internet and
Telecommunication Supplies Agreement.
(2)
Duration
The term of the Master Internet and Telecommunication Supplies Agreement is from
the Listing Date up to 31 December 2017, unless terminated by the Company or CKH
Holdings by not less than one month’s written notice or otherwise in accordance with the
other terms of the Master Internet and Telecommunication Supplies Agreement.
(3)
Consideration and other terms
The relevant member of the Group and the relevant member of the CKH Holdings
Group will enter into a separate contract with respect to each of the Internet and
Telecommunication Supplies Transactions entered into between them. The terms of, and the
consideration payable under, such contracts will be negotiated on a case-by-case and an
arm’s length basis and will be on normal commercial terms which, from the Group’s
perspective, shall be no less favourable to the Group than those which the Group could
obtain from independent third party suppliers of the relevant Internet and Telecommunication
Supplies. In particular, the Group will seek competitive quotes via tendering or other
processes (including conducting a comparison of prices of a sufficient number of
independent third party suppliers of comparable Internet and Telecommunication Supplies in
the market, where available) for management review with a view to ensuring that the fees
payable to the CKH Holdings Group in connection with the Internet and Telecommunication
Supplies are fair and reasonable and comparable to those offered by independent third party
suppliers having regard to the scope, scale, quality, reliability and service levels of the
Internet and Telecommunication Supplies required and the past performance of the CKH
Holdings Group when providing the Internet and Telecommunication Supplies.
– 289 –
CONNECTED TRANSACTIONS
Historical transaction amounts
The aggregate annual amounts of the Internet and Telecommunication Supplies
Transactions for the three financial years ended 31 December 2014 are as follows:
Financial year ended 31 December
Amounts (rounded to the
nearest million) . . . . . . . . .
2.
2012
2013
2014
HK$45 million
HK$50 million
HK$58 million
Annual cap amounts and basis for determining the annual cap amounts
It is expected that the maximum aggregate annual amount receivable or payable by the Group (as
the case may be) in respect of each of the following categories: (a) the Leasing Transactions, (b) the
Project Related Supplies Transactions and (c) the Internet and Telecommunications Supplies
Transactions (together, the “Non-exempt Continuing Connected Transactions”) will not exceed the
amounts set out below (the “Annual Cap Amounts”):
Financial year ending 31 December
2015
2016
2017
Leasing Transactions . . . . . . . . . . . . . . .
HK$683 million
HK$763 million
HK$856 million
Project Related Supplies Transactions . . .
HK$86 million
HK$160 million
HK$160 million
Internet and Telecommunication
Supplies Transactions. . . . . . . . . . . . .
HK$76 million
HK$91 million
HK$97 million
The Annual Cap Amounts in respect of:
(a)
the Leasing Transactions were arrived at by reference to (i) the historical transaction
amounts for the same type of transactions, (ii) the amount receivable by the Group in respect
of the Leasing Transactions currently in existence, (iii) the expected renewals of existing
leases, tenancies and licences, (iv) the expected new Leasing Transactions that the CKH
Holdings Group may enter into with the Group, and (v) the estimated adjustment in rental
and service/management fees;
(b)
the Project Related Supplies Transactions were arrived at by reference to (i) the historical
transaction amounts for the same type of transactions, (ii) the estimated number of contracts
that may be awarded to the CKH Holdings Group, taking into account the expected progress
of the various existing property development projects of the Group, and (iii) to cater for (1)
additional demand for the Project Related Supplies in respect of new development projects
which may commence construction, (2) variations in the original purchase order or contract
due to changes in development project specifications in the course of construction of
relevant development projects during the three years ending 31 December 2017, and (3)
variations in the development schedules of relevant projects. The Annual Cap Amount in
respect of the Project Related Supplies Transactions for 2016 has been determined with
reference to the Group’s latest property development schedule for 2016 and on the
assumption that after completion of the competitive tendering or other processes referred to
– 290 –
CONNECTED TRANSACTIONS
in the Listing Document, purchase orders will be issued to or purchase contracts will be
awarded to and accepted by the relevant members of the CKH Holdings Group to provide
the required Project Related Supplies for all those development projects. The significant
increase in the Annual Cap Amount in respect of the Project Related Supplies Transactions
for 2016, as compared to 2015, is due to the estimated increase in the number of purchase
orders or contracts which will be accepted by the CKH Holding Group, taking into account
the expected progress of the Group’s development projects requiring the purchase of Project
Related Supplies in 2016. The Annual Cap Amount in respect of the Project Related
Supplies Transactions for 2017 (being the same amount as that for 2016) has been
determined on the assumption that the Group will have new development projects resulting
in similar requirements for supplies as in 2016, and that the Group’s purchase orders/
contracts in respect of such supplies will be awarded to and accepted by the CKH Holdings
Group; and
(c)
C.
the Internet and Telecommunication Supplies Transactions were arrived at by reference to (i)
the historical transaction amounts for the same type of transactions, (ii) the estimated
increase in usage demand from the Group (having regard to the projection of the growth of
the Group’s business operations), and (iii) the estimated increase in the costs of the Internet
and Telecommunication Supplies.
LISTING RULES IMPLICATIONS OF THE NON-EXEMPT CONTINUING CONNECTED
TRANSACTIONS
As one or more of the applicable percentage ratios set out in Rule 14.07 of the Listing Rules in
respect of each of the Annual Cap Amounts for the transactions contemplated under each of the
Non-exempt Continuing Connected Transactions is/are more than 0.1% but all of them are less than 5%
by reference to the Group’s pro forma financial information for the year ended 31 December 2014 and
each of the Annual Cap Amounts exceeds HK$3,000,000, the Non-exempt Continuing Connected
Transactions will, upon Listing, be subject to the reporting, announcement and annual review but
exempt from the circular and independent shareholders’ approval requirements under Chapter 14A of
the Listing Rules.
D.
WAIVER APPLICATION
TRANSACTIONS
FOR
THE
NON-EXEMPT
CONTINUING
CONNECTED
As the Non-exempt Continuing Connected Transactions are of an ongoing nature and will be
conducted in the ordinary and usual course of business of the Group, the Directors consider that
compliance with the announcement requirement under Chapter 14A of the Listing Rules on each
occasion such transactions arise would be impractical and unduly burdensome and would impose
unnecessary administrative costs upon the Company. Accordingly, pursuant to Rule 14A.105 of the
Listing Rules, the Company has applied to the Stock Exchange for, and the Stock Exchange has granted
to the Company, a waiver from strict compliance with the announcement requirements under Chapter
14A of the Listing Rules with respect to the Non-exempt Continuing Connected Transactions, provided
that the annual aggregate transaction amounts in respect of each category of the Non-exempt
Continuing Connected Transactions do not exceed the relevant Annual Cap Amount set out above. Apart
from the announcement requirement with which strict compliance has been waived by the Stock
Exchange, the Company will comply with the relevant requirements under Chapter 14A of the Listing
Rules which are applicable to the Non-exempt Continuing Connected Transactions.
– 291 –
CONNECTED TRANSACTIONS
E.
CONFIRMATION FROM THE DIRECTORS AND THE JOINT SPONSORS
Having regard to the pricing policies and internal controls set out in “− Consideration and other
terms” above in respect of each of the Non-exempt Continuing Connected Transactions, including
charging rental and licence fees at prevailing market rates for the Leasing Transactions and seeking
competitive quotes via tendering or other processes such as obtaining quotes from independent third
party suppliers for comparison in the case of the Project Related Supplies Transactions and the Internet
and Telecommunication Supplies Transactions, the Directors (including the independent non-executive
Directors) are of the view that the Non-exempt Continuing Connected Transactions have been and shall
be entered into in the ordinary and usual course of business of the Group, on normal commercial terms,
or better, that are fair and reasonable and in the interests of the Shareholders as a whole. The Directors
(including the independent non-executive Directors) are also of the view that the relevant Annual Cap
Amounts for the Non-exempt Continuing Connected Transactions are fair and reasonable and in the
interests of the Company and the Shareholders as a whole.
The Joint Sponsors have reviewed the relevant information and historical figures prepared and
provided by the Company relating to the Non-exempt Continuing Connected Transactions, have also
conducted due diligence by discussing the Non-exempt Continuing Connected Transactions with the
Company, and have obtained various representations from the Company and other members of the
Group. Based on the Joint Sponsors’ due diligence, the Joint Sponsors are of the view that the
Non-exempt Continuing Connected Transactions have been and shall be entered into in the ordinary and
usual course of business of the Group, on normal commercial terms, or better, that are fair and
reasonable and in the interests of the Shareholders as a whole. The Joint Sponsors are also of the view
that the relevant Annual Cap Amounts for the Non-exempt Continuing Connected Transactions are fair
and reasonable and in the interests of the Company and the Shareholders as a whole.
F.
ARRANGEMENT IN CONNECTION WITH THE REORGANISATION
As disclosed in “History and Reorganisation – The Reorganisation – Property Businesses
Combination – The Specified Loans Purchase Agreement”, the consideration for the assignment of the
Specified Loans will be settled by way of the issue of the Specified Loans Promissory Note. The
Specified Loans Promissory Note is to be settled on or before the fifth business day following the date
of completion of the assignment of the Specified Loans (which will be the Listing Date).
The Specified Loans Promissory Note and the other arrangements under the Specified Loans
Purchase Agreement and the Reorganisation Agreement (including (i) the assignment to the Group of
loans owing by certain CPB Companies in respect of projects subject to the Contractual Arrangement
mentioned in “History and Reorganisation – The Reorganisation – Property Businesses Combination –
The Reorganisation Agreement – Passing of Economic Interests”, and (ii) the Contractual Arrangement
themselves, as well as the related arrangements for the provision of future financing to those projects
via financing from the Group to those CPB Companies in which the CKH Holdings Group will
continue to hold shares pending obtaining of the Third Party Consents) are regarded as one-off
transactions agreed upon prior to the Listing. They are not regarded as constituting connected
transactions of the Company under Chapter 14A of the Listing Rules after the Listing, and no reporting,
announcement, annual review, circular or independent shareholders’ approval requirements under
Chapter 14A of the Listing Rules will need to be complied with by the Company in relation to those
transactions following the Listing.
– 292 –
DIRECTORS AND SENIOR MANAGEMENT
BOARD OF DIRECTORS
The Board of Directors consists of 14 Directors, comprising 9 Executive Directors and 5
Independent Non-executive Directors. Brief information of the Directors is set out below:
Date of
Appointment as
a Director
Date of Joining
the Group
Principal Roles and
Responsibilities
Relationship with the
Other Directors
Responsible for (i) the
leadership and effective
running of the Board;
(ii) determining the
broad strategic direction
of the Group in
consultation with the
Board; and (iii) the
high-level oversight of
management of the
Group. Also serves as a
member of the
remuneration committee
of the Company
With the support of the
executive Directors, is
responsible for the
strategic planning of
different business
functions and day-to-day
management and
operation of the Group
Responsible for the
day-to-day management
and operation of the
Group
Responsible for the
day-to-day management
and operation of the
Group
Responsible for the
day-to-day management
and operation of the
Group
Responsible for the
day-to-day management
and operation of the
Group
Responsible for the
day-to-day management
and operation of the
Group
Father of Mr. Li Tzar
Kuoi, Victor and
brother-in-law of
Mr. Kam Hing Lam
Responsible for the
day-to-day management
and operation of the
Group
Responsible for the
day-to-day management
and operation of the
Group
N/A
Name
Age
Position
Mr. Li Ka-shing .
86
Chairman and
Executive
Director
26 February 2015
3 December 1971
Mr. Li Tzar
Kuoi, Victor .
50
Managing
Director,
Deputy
Chairman and
Executive
Director
5 January 2015
15 June 1985
Mr. Kam Hing
Lam . . . .
68
26 February 2015
15 February 1993
Mr. Ip Tak
Chuen,
Edmond . . .
62
5 January 2015
18 September
1993
Mr. Chung Sun
Keung, Davy .
64
Deputy Managing
Director and
Executive
Director
Deputy Managing
Director and
Executive
Director
Executive
Director
26 February 2015
15 February 1993
Mr. Chiu Kwok
Hung, Justin .
64
Executive
Director
26 February 2015
3 March 1997
Mr. Chow Wai
Kam . . . .
67
Executive
Director
26 February 2015
1 July 1995
Ms. Pau Yee
Wan, Ezra . .
59
Executive
Director
26 February 2015
18 May 1982
Ms. Woo Chia
Ching, Grace .
58
Executive
Director
26 February 2015
11 May 1987
– 293 –
Son of Mr. Li
Ka-shing and
nephew of Mr. Kam
Hing Lam
Brother-in-law of Mr.
Li Ka-shing and
uncle of Mr. Li Tzar
Kuoi, Victor
N/A
N/A
N/A
N/A
N/A
DIRECTORS AND SENIOR MANAGEMENT
Position
Date of
Appointment as
a Director
Date of Joining
the Group
Name
Age
Mr. Cheong Ying
Chew, Henry .
67
Independent
Non-executive
Director
26 February 2015
23 September
2004
Mr. Chow Nin
Mow, Albert .
65
Independent
Non-executive
Director
26 February 2015
12 September
1983
Ms. Hung Siulin,
Katherine . .
67
Independent
Non-executive
Director
26 February 2015
15 March 1972
Mr. Simon
Murray . . .
75
Independent
Non-executive
Director
26 February 2015
31 August 1993
Mr. Yeh Yuan
Chang,
Anthony . . .
92
Independent
Non-executive
Director
26 February 2015
24 August 1993
– 294 –
Principal Roles and
Responsibilities
Serves as the chairman of
the audit committee and
a member of the
remuneration committee
of the Company. Also
exercises independent
judgement and advises
on the future business
directions and strategic
plans of the Group and
reviews the financial
information and
operational performance
of the Group on a
regular basis
Serves as a member of the
audit committee of the
Company. Also exercises
independent judgement
and advises on the future
business directions and
strategic plans of the
Group and reviews the
financial information and
operational performance
of the Group on a
regular basis
Serves as the chairman of
the remuneration
committee and a member
of the audit committee
of the Company. Also
exercises independent
judgement and advises
on the future business
directions and strategic
plans of the Group and
reviews the financial
information and
operational performance
of the Group on a
regular basis
Exercises independent
judgement and advises
on the future business
directions and strategic
plans of the Group and
reviews the financial
information and
operational performance
of the Group on a
regular basis
Exercises independent
judgement and advises
on the future business
directions and strategic
plans of the Group and
reviews the financial
information and
operational performance
of the Group on a
regular basis
Relationship with the
Other Directors
N/A
N/A
N/A
N/A
N/A
DIRECTORS AND SENIOR MANAGEMENT
Executive Directors
Mr. Li Ka-shing, GBM, KBE, Commandeur de la Légion d’Honneur, Grand Officer of the Order
Vasco Nunez de Balboa, Commandeur de l’Ordre de Léopold, aged 86, was appointed to the Board and
designated as an Executive Director and the Chairman of the Company and a member of the
Remuneration Committee on 26 February 2015. He is the founder of the Cheung Kong Group. He has
been the Chairman of Cheung Kong since 1971 and acted as the Managing Director of Cheung Kong
from 1971 to 1998. He has been a member of the Remuneration Committee of Cheung Kong since
March 2005. He has also been the Chairman of CKH Holdings since 9 January 2015 and a member of
the Remuneration Committee of CKH Holdings since 26 February 2015. Mr. Li has been the Chairman
of Hutchison since 1981 and is the Chairman of Li Ka Shing Foundation Limited, Li Ka Shing
(Overseas) Foundation and Li Ka Shing (Canada) Foundation. He has been engaged in many major
commercial developments in Hong Kong for more than 60 years. Mr. Li served as a member of the
Hong Kong’s Basic Law Drafting Committee, Hong Kong Affairs Adviser and the Preparatory
Committee for the Hong Kong Special Administrative Region. He is also an Honorary Citizen of a
number of cities in the PRC and overseas. Mr. Li is a keen supporter of community service
organisations, and has served as honorary chairman of many such groups over the years.
Mr. Li has received Honorary Doctorates from Peking University in 1992, the University of Hong
Kong in 1986, The Hong Kong University of Science and Technology in 1995, The Chinese University
of Hong Kong in 1997, City University of Hong Kong in 1998, The Open University of Hong Kong in
1999, University of Calgary in Canada in 1989 and Cambridge University in the United Kingdom in
1999. Mr. Li has been awarded Entrepreneur of the Millennium, the Carnegie Medal of Philanthropy
and The Berkeley Medal. He is the recipient of many other major honors and awards from renowned
institutions in the PRC and abroad. Mr. Li is the father of Mr. Li Tzar Kuoi, Victor, the Managing
Director and Deputy Chairman of the Company, and the brother-in-law of Mr. Kam Hing Lam, Deputy
Managing Director of the Company. Mr. Li is the settlor of each of DT1 of which TDT1 is the trustee
and DT2 of which TDT2 is the trustee. Each of TDT1 and TDT2 holds units in UT1 of which TUT1 is
the trustee. All of TUT1, TDT1 and TDT2 are substantial shareholders of the Company within the
meaning of Part XV of the SFO. Mr. Li also holds directorships in certain companies controlled by
certain substantial shareholders of the Company within the meaning of Part XV of the SFO.
Mr. Li Tzar Kuoi, Victor, aged 50, was appointed as a Director on 5 January 2015 and
designated as an Executive Director, Managing Director and Deputy Chairman of the Company on 26
February 2015. He joined the Cheung Kong Group in 1985 and acted as Deputy Managing Director of
Cheung Kong from 1993 to 1998. He has been Deputy Chairman of Cheung Kong since 1994,
Managing Director of Cheung Kong since 1999 and the Chairman of the Executive Committee of
Cheung Kong since March 2013. He has been an Executive Director, Managing Director and Deputy
Chairman of CKH Holdings since 9 January 2015 and the Chairman of the Executive Committee of
CKH Holdings since 26 February 2015. He is also the Deputy Chairman of Hutchison, the Chairman of
Cheung Kong Infrastructure Holdings Limited (stock code: 01038) and CK Life Sciences Int’l.,
(Holdings) Inc. (stock code: 00775), a Non-executive Director of Power Assets Holdings Limited (stock
code: 00006), a Non-executive Director of HK Electric Investments Manager Limited (“HKEIM”),
which is the trustee-manager of HK Electric Investments, and a Non-executive Director and the Deputy
Chairman of HK Electric Investments Limited (stock code: 02638), and Co-Chairman of Husky, all
being listed companies or investment trust (except HKEIM). Mr. Victor Li is also the Deputy Chairman
of Li Ka Shing Foundation Limited, Li Ka Shing (Overseas) Foundation and Li Ka Shing (Canada)
Foundation, and a Director of The Hongkong and Shanghai Banking Corporation Limited. Mr. Victor Li
serves as a member of the Standing Committee of the 12th National Committee of the Chinese People’s
Political Consultative Conference of the PRC. He is also a member of the Commission on Strategic
– 295 –
DIRECTORS AND SENIOR MANAGEMENT
Development of Hong Kong and Vice Chairman of the Hong Kong General Chamber of Commerce. Mr.
Victor Li is the Honorary Consul of Barbados in Hong Kong. He was previously a member of the
Council for Sustainable Development of Hong Kong. He obtained a Bachelor of Science degree in Civil
Engineering from Stanford University in January 1987, a Master of Science degree in Civil Engineering
from Stanford University in January 1987 and an honorary degree, Doctor of Laws, honoris causa
(LL.D.) from The University of Western Ontario in May 2009.
Mr. Victor Li is a son of Mr. Li Ka-shing, the Chairman of the Company and a substantial
shareholder of the Company within the meaning of Part XV of the SFO, and a nephew of Mr. Kam
Hing Lam, Deputy Managing Director of the Company. Mr. Victor Li is also a director of certain
substantial shareholders of the Company within the meaning of Part XV of the SFO, and a director of
certain companies controlled by certain substantial shareholders of the Company. TDT1 as trustee of
DT1, TDT2 as trustee of DT2, and TUT1 as trustee of UT1 in which each of TDT1 and TDT2 holds
units, are substantial shareholders of the Company within the meaning of Part XV of the SFO. The
discretionary beneficiaries of each of DT1 and DT2 include Mr. Victor Li, his wife and children.
Mr. Kam Hing Lam, aged 68, was appointed as an Executive Director and designated as Deputy
Managing Director of the Company on 26 February 2015. He has been Deputy Managing Director of
Cheung Kong since 1993 and a member of the Executive Committee of Cheung Kong since March
2013. Mr. Kam has been an Executive Director and the Deputy Managing Director of CKH Holdings
since 9 January 2015 and a member of the Executive Committee of CKH Holdings since 26 February
2015. He is also the Group Managing Director of Cheung Kong Infrastructure Holdings Limited (stock
code: 01038), the President and Chief Executive Officer of CK Life Sciences Int’l., (Holdings) Inc.
(stock code: 00775) and an Executive Director of Hutchison, all being listed on the Main Board. He is
also the Chairman of Hui Xian Asset Management Limited, which is the manager of Hui Xian REIT
(listed in Hong Kong) and a Director of Australian Gas Networks Limited (formerly known as Envestra
Limited, whose shares were withdrawn from listing on 17 October 2014). He has been an Executive
Director of Power Assets Holdings Limited (stock code: 00006), which is a company listed on the Main
Board, from 1993 to 2014. Mr. Kam is an Advisor of the 12th Beijing Municipal Committee of the
Chinese People’s Political Consultative Conference of the PRC. He obtained a Bachelor of Science
degree in Engineering from the University of Hong Kong in November 1969 and a Master’s degree in
Business Administration from The Chinese University of Hong Kong in December 1980.
Mr. Kam is the brother-in-law of Mr. Li Ka-shing, Chairman of the Company and a substantial
shareholder of the Company within the meaning of Part XV of the SFO, and an uncle of Mr. Li Tzar
Kuoi, Victor, Managing Director and Deputy Chairman of the Company.
Mr. Ip Tak Chuen, Edmond, aged 62, was appointed as a Director on 5 January 2015 and
designated as Executive Director and Deputy Managing Director of the Company on 26 February 2015.
He has been an Executive Director of Cheung Kong since 1993, Deputy Managing Director of Cheung
Kong since 2005 and a member of the Executive Committee of Cheung Kong since March 2013. Mr. Ip
has been an Executive Director and Deputy Managing Director of CKH Holdings since 9 January 2015,
and a member of the Executive Committee of CKH Holdings since 26 February 2015. He is also an
Executive Director and the Deputy Chairman of Cheung Kong Infrastructure Holdings Limited (stock
code: 01038), the Senior Vice President and Chief Investment Officer of CK Life Sciences Int’l.,
(Holdings) Inc. (stock code: 00775), a Non-executive Director of ARA Asset Management (an Asian
real estate fund management company listed in Singapore), TOM Group Limited (stock code: 02383),
AVIC International Holding (HK) Limited (stock code: 00232), Real Nutriceutical Group Limited (stock
code: 02010), Shougang Concord International Enterprises Company Limited (stock code: 00697)
(which are companies listed on the Main Board), ARA Asset Management (Fortune) Limited, which is
– 296 –
DIRECTORS AND SENIOR MANAGEMENT
the manager of Fortune REIT (listed in Hong Kong and Singapore), and Hui Xian Asset Management
Limited, which is the manager of Hui Xian REIT (listed in Hong Kong). Mr. Ip was previously a
Non-executive Director of Hong Kong Jewellery Holding Limited (stock code: 08048), being a listed
company on the Growth Enterprise Market of the Stock Exchange, prior to his resignation from such
position in July 2012, and a Director of ARA Trust Management (Suntec) Limited, which is the
manager of Suntec REIT (listed in Singapore), prior to his resignation from such position in April 2014.
He obtained a Bachelor of Arts degree in Economics from Ripon College, U.S. in May 1975 and a
Master of Science degree in Business Administration from University of British Columbia, Canada in
May 1977.
Mr. Ip is a director of certain companies controlled by certain substantial shareholders of the
Company within the meaning of Part XV of the SFO.
Mr. Chung Sun Keung, Davy, aged 64, was appointed as an Executive Director of the Company
on 26 February 2015. He has been an Executive Director of Cheung Kong since 1993 and a member of
the Executive Committee of Cheung Kong since March 2013. Mr. Chung has been an Executive
Director of CKH Holdings since 9 January 2015 and a member of the Executive Committee of CKH
Holdings since 26 February 2015. Mr. Chung is a Registered Architect and was admitted as a member
of The Hong Kong Institute of Architects since November 1977. He obtained a Bachelor of Arts in
Architectural Studies and a Bachelor of Architecture from the University of Hong Kong in November
1973 and 1975, respectively. He was a member of the 11th Guangzhou Committee of the Chinese
People’s Political Consultative Conference of the PRC.
Mr. Chiu Kwok Hung, Justin, aged 64, was appointed as an Executive Director of the Company
on 26 February 2015. He joined the Cheung Kong Group in 1997, and has been an Executive Director
of Cheung Kong since 2000 and a member of the Executive Committee of Cheung Kong since March
2013. Mr. Chiu has been an Executive Director of CKH Holdings since 9 January 2015 and a member
of the Executive Committee of CKH Holdings since 26 February 2015. He is the Chairman of ARA
Asset Management (an Asian real estate fund management company listed in Singapore), ARA Asset
Management (Fortune) Limited, which is the manager of Fortune REIT (listed in Hong Kong and
Singapore), and ARA Asset Management (Prosperity) Limited, which is the manager of Prosperity REIT
(listed in Hong Kong). Mr. Chiu is also a Director of ARA Fund Management (Asia Dragon) Limited,
which is the manager of the ARA Asia Dragon Fund, and a Director of ARA Asia Dragon Limited. Mr.
Chiu was previously the Chairman of ARA Trust Management (Suntec) Limited, which is the manager
of Suntec REIT (listed in Singapore), until his resignation from such position in April 2014. Mr. Chiu
has more than 30 years of international experience in real estate in Hong Kong and various countries.
He serves as a member of the Standing Committee of the 12th Shanghai Committee of the Chinese
People’s Political Consultative Conference of the PRC. Mr. Chiu is a Council Member and a Fellow of
The Hong Kong Institute of Directors, a Fellow of Hong Kong Institute of Real Estate Administrators
and a member of the Board of Governors of Hong Kong Baptist University Foundation. He obtained
Bachelor of Arts degree in Sociology and Economics from Trent University in May 1978, and was
conferred with the degree of Doctor of Social Sciences, honoris causa by Hong Kong Baptist University
in November 2012 and the degree of Doctor of Laws, honoris causa by Trent University, Canada in
June 2013.
Mr. Chiu is a director of a company controlled by a substantial shareholder of the Company
within the meaning of Part XV of the SFO.
– 297 –
DIRECTORS AND SENIOR MANAGEMENT
Mr. Chow Wai Kam, JP, aged 67, was appointed as an Executive Director of the Company on 26
February 2015. He joined the Hutchison Group in July 1995 and has been the Group Managing Director
of the property and hotels divisions of the Hutchison Group since 2000. He has over 30 years of
experience in project management and architectural design for various developments, including hotel,
residential, commercial, industrial and school projects in Hong Kong, the PRC and overseas. He
obtained a Bachelor of Arts degree in Architectural Studies and a Bachelor of Architecture degree from
the University of Hong Kong in November 1970 and November 1972, respectively. He has been an
Authorised Person (List of Architects) and a Registered Architect since July 1976 and January 1991,
respectively. He was also admitted as a Fellow of The Hong Kong Institute of Architects since August
2001.
Ms. Pau Yee Wan, Ezra, aged 59, was appointed as an Executive Director of the Company on 26
February 2015. She joined the Cheung Kong Group in 1982, and has been an Executive Director of
Cheung Kong since 1993 and a member of the Executive Committee of Cheung Kong since March
2013. Ms. Pau has been an Executive Director of CKH Holdings since 9 January 2015 and a member of
the Executive Committee of CKH Holdings since 26 February 2015. Ms. Pau obtained a Diploma in
Management Studies from The Hong Kong Polytechnic University and The Hong Kong Management
Association in September 1990. Ms. Pau is a director of certain substantial shareholders of the
Company within the meaning of Part XV of the SFO, and a director of certain companies controlled by
certain substantial shareholders of the Company.
Ms. Woo Chia Ching, Grace, aged 58, was appointed as an Executive Director of the Company
on 26 February 2015. She joined the Cheung Kong Group in 1987, and has been an Executive Director
of Cheung Kong since 1996 and a member of the Executive Committee of Cheung Kong since March
2013. Ms. Woo has been an Executive Director of CKH Holdings since 9 January 2015 and a member
of the Executive Committee of CKH Holdings since 26 February 2015. She obtained a Bachelor of Arts
degree from the University of Pennsylvania, U.S. in May 1978 and a Master’s degree in City and
Regional Planning from Harvard University, U.S. in June 1981.
Ms. Woo is a director of certain companies controlled by a substantial shareholder of the
Company within the meaning of Part XV of the SFO.
Independent Non-executive Directors
Mr. Cheong Ying Chew, Henry, aged 67, was appointed as an Independent Non-executive
Director, the Chairman of the Audit Committee and a member of the Remuneration Committee of the
Company on 26 February 2015. He has been an Independent Non-executive Director of Cheung Kong,
a member of the Audit Committee of Cheung Kong since September 2004 and the Chairman of the
Audit Committee of Cheung Kong since 1 January 2007. He has been an Independent Non-executive
Director of CKH Holdings since 9 January 2015 and the Chairman of the Audit Committee of CKH
Holdings since 26 February 2015. Mr. Cheong is also an Independent Non-executive Director of
Cheung Kong Infrastructure Holdings Limited (stock code: 01038), CNNC International Limited (stock
code: 02302), Creative Energy Solutions Holdings Limited (stock code: 08109), Greenland Hong Kong
Holdings Limited (stock code: 00337), Hutchison Telecommunications Hong Kong Holdings Limited
(stock code: 00215), New World Department Store China Limited (stock code: 00825), Skyworth
Digital Holdings Limited (stock code: 00751) and TOM Group Limited (stock code: 02383), an
Independent Director of BTS Group Holdings Public Company Limited (stock code: BTS), a company
listed on the Stock Exchange of Thailand, and an Alternate Director to Dr. Wong Yick-ming, Rosanna,
an Independent Non-executive Director of Hutchison Telecommunications Hong Kong Holdings
Limited, all being listed companies. Mr. Cheong is an Executive Director and Deputy Chairman of
– 298 –
DIRECTORS AND SENIOR MANAGEMENT
Worldsec Limited (stock code: WSL), a company listed on the London Stock Exchange. Mr. Cheong is
a member of the Advisory Committee of the SFC and was previously a member of the Securities and
Futures Appeals Tribunal. Mr. Cheong obtained a Bachelor of Science degree in Mathematics from
University of London in August 1971 and a Master of Science degree in Operational Research and
Management from University of London in December 1972.
Mr. Cheong was previously an Independent Non-executive Director of Hong Kong Jewellery
Holding Limited (resigned on 3 July 2012), being a listed company in Hong Kong.
Mr. Chow Nin Mow, Albert, aged 65, was appointed as an Independent Non-executive Director
and a member of the Audit Committee of the Company on 26 February 2015. He has been a Director of
Cheung Kong since September 1983. Mr. Chow acted as a Non-executive Director of Cheung Kong
from April 1997 to October 2004 and has been an Independent Non-executive Director of Cheung Kong
since October 2004. Mr. Chow has been an Independent Non-executive Director of CKH Holdings since
9 January 2015. Mr. Chow obtained a Diploma in Management Studies from The Hong Kong
Polytechnic University and The Hong Kong Management Association in August 1981. He is the
Chairman and Managing Director of Wah Yip (Holdings) Limited.
Ms. Hung Siu-lin, Katherine, aged 67, was appointed as an Independent Non-executive Director,
the Chairman of the Remuneration Committee and a member of the Audit Committee of the Company
on 26 February 2015. She joined the Cheung Kong Group in March 1972, and acted as an Executive
Director of Cheung Kong from 1985 to August 2000 and a Non-executive Director of Cheung Kong
from September 2000 to October 2004. She has been an Independent Non-executive Director of Cheung
Kong since October 2004 and a member of the Audit Committee of Cheung Kong since 1 January
2007. Ms. Hung has been an Independent Non-executive Director of CKH Holdings since 9 January
2015 and has been a member of the Audit Committee of CKH Holdings since 26 February 2015. Ms.
Hung is a member of the Tianjin Committee of the 13th Chinese People’s Political Consultative
Conference of the PRC. She is also a member of the Supervisory Board of Hong Kong Housing
Society, a Court Member of The Hong Kong University of Science and Technology, an Honorary Court
Member of The Hong Kong Polytechnic University, an Honorary Court Member of Lingnan University
and an Executive Director of Chinese Academy of Governance (HK) Industrial and Commercial
Professionals Alumni Association. She was a member of HKSAR Estate Agents Authority during the
period from November 2006 to October 2012, a Steering Committee Member of the Institute for
Enterprise of The Hong Kong Polytechnic University from April 2000 to August 2011, and an executive
committee member of Hong Kong Housing Society from September 2008 to August 2014. Ms. Hung is
a University Fellow of The Hong Kong Polytechnic University.
Mr. Simon Murray, CBE, aged 75, was appointed as an Independent Non-executive Director of
the Company on 26 February 2015. Mr. Murray has been a Director of Cheung Kong since 1993 and is
currently an Independent Non-executive Director of Cheung Kong. He has been an Independent
Non-executive Director of CKH Holdings since 9 January 2015. Mr. Murray is currently the
Non-executive Chairman of General Enterprise Management Services (International) Limited (“GEMS
Ltd.”), a private equity fund management company. He is a Non-executive Director of Greenheart
Group Limited (stock code: 00094), IRC Limited (stock code: 01029) and China LNG Group Limited
(stock code: 00931), and an Independent Non-executive Director of Orient Overseas (International)
Limited (stock code: 00316), Wing Tai Properties Limited (stock code: 00369), all being companies
listed on the Main Board, and Spring Asset Management Limited, which is the manager of Spring REIT
(stock code: 01426), which is listed on the Main Board. He is also a Non-executive Director of
Compagnie Financière Richemont SA, a company listed on the Swiss Exchange (stock code: CFR). Mr.
Murray obtained an Honorary Degree in Law from Bath University in 2005.
– 299 –
DIRECTORS AND SENIOR MANAGEMENT
Mr. Murray was previously an Independent Director of Sino-Forest Corporation (resigned on 30
January 2013 (Toronto time)), a company listed on the Toronto Stock Exchange (stock code: TRE), the
Chairman of Glencore Xstrata plc (resigned on 2 May 2013), a company listed on the Main Board
(stock code: 00805), the London Stock Exchange (stock code: GLEN) and the Johannesburg Stock
Exchange (stock code: GLN), the Vice Chairman and Independent Non-executive Director of Essar
Energy plc (resigned in May 2014), a company listed on the London Stock Exchange (stock code:
ESSR) until 9 June 2014, and an Independent Non-executive Director and Chairman of Gulf Keystone
Petroleum Ltd. (resigned on 31 March 2015), a company listed on the London Stock Exchange (stock
code: GKP).
Mr. Yeh Yuan Chang, Anthony, aged 92, was appointed as an Independent Non-executive
Director of the Company on 26 February 2015. Mr. Yeh has been a Director of Cheung Kong since
1993 and is currently an Independent Non-executive Director of Cheung Kong. He has been an
Independent Non-executive Director of CKH Holdings since 9 January 2015. He obtained a Master’s
degree in Science (Mechanical Engineering) from Syracuse University, U.S. in June 1949. He is the
Honorary Life President of Tai Ping Carpets International Limited (stock code: 00146), a company
listed on the Main Board.
Upon Listing, all Independent Non-executive Directors of the Company will cease to be
independent non-executive directors of CKH Holdings.
Save as disclosed in this listing document, none of the Directors has any relationship with any
other Directors, senior management or substantial or controlling shareholders (as defined under the
Listing Rules) of the Company.
Save as disclosed in this listing document, none of the Directors has been a director of any other
listed entities in the three years immediately preceding the date of this listing document.
Save as disclosed in “Appendix VII − General Information − Further Information about the
Directors − Particulars of Letters of Appointment”, none of the Directors has any existing or proposed
service contract with the Company or any of its subsidiaries other than contracts expiring or
determinable by the relevant member of the Group within one year without payment of compensation
(other than statutory compensation).
Save as disclosed above in “– Board of Directors” above and “Appendix VII – General
Information – Further Information about the Directors – Further Information on Certain Directors”,
each Director had not held any other directorships in listed companies during the three years
immediately prior to the Latest Practicable Date and there is no other information in respect of the
Directors to be disclosed pursuant to Rule 13.51(2) of the Listing Rules and there is no other matter
that needs to be brought to the attention of the Shareholders.
SENIOR MANAGEMENT OF THE COMPANY
The senior management of the Company shall comprise the Executive Directors.
BOARD COMMITTEES
The Board has established the audit committee and the remuneration committee.
– 300 –
DIRECTORS AND SENIOR MANAGEMENT
Audit Committee
The Company has established the audit committee of the Board in compliance with Rule 3.21 of
the Listing Rules and the Corporate Governance Code as set out in Appendix 14 to the Listing Rules.
The principal duties of the audit committee include the review and supervision of the Group’s financial
reporting system and internal control procedures, review of the Group’s financial information, review of
the relationship with the external auditor of the Company and performance of the corporate governance
functions delegated by the Board.
The audit committee consists of three Directors. The members of the audit committee are:
Mr. Cheong Ying Chew, Henry (Chairman)
Mr. Chow Nin Mow, Albert
Ms. Hung Siu-lin, Katherine
Remuneration Committee
The Company has established a remuneration committee of the Board in compliance with Rule
3.25 of the Listing Rules and the Corporate Governance Code as set out in Appendix 14 to the Listing
Rules. The principal duties of the remuneration committee include making recommendations to the
Board on the Company’s policy and structure for the remuneration of Directors and the management,
and reviewing the remuneration packages of all executive Directors and the management with reference
to the corporate goals and objectives of the Board resolved from time to time.
The remuneration committee consists of three Directors. The members of the remuneration
committee are:
Ms. Hung Siu-lin, Katherine (Chairman)
Mr. Li Ka-shing
Mr. Cheong Ying Chew, Henry
Nomination Committee
The Company does not have a nomination committee. The Company does not consider it
necessary to have a nomination committee as the full Board is responsible for reviewing the structure,
size and composition of the Board and the appointment of new Directors from time to time to ensure
that it has a balanced composition of skills and experience appropriate for the requirements of the
businesses of the Company, and the Board as a whole is also responsible for reviewing the succession
plan for the Directors, in particular the chairman of the Board and the managing director of the
Company.
COMPANY SECRETARY
Ms. Eirene Yeung, aged 54, was appointed as the Company Secretary of the Company on 5
January 2015. Ms. Yeung joined the Cheung Kong Group in August 1994. She is also a Member of the
Executive Committee and the Company Secretary of Cheung Kong; a Member of the Executive
Committee, General Manager, Company Secretarial Department and the Company Secretary of CKH
Holdings; the Company Secretary and the Alternate Director to Mr. Kam Hing Lam, the Group
Managing Director of Cheung Kong Infrastructure Holdings Limited (stock code: 01038); the Company
Secretary of CK Life Sciences Int’l., (Holdings) Inc. (stock code: 00775); and a Non-executive Director
– 301 –
DIRECTORS AND SENIOR MANAGEMENT
of ARA Asset Management (Fortune) Limited. She is a member of the Financial Reporting Council, a
member of the SFC (HKEC Listing) Committee of the SFC, a member of the Listing Committee of the
Main Board and Growth Enterprise Market of the Stock Exchange, a General Committee member of
The Chamber of Hong Kong Listed Companies, a member of the Advisory Board of the MBA
Programmes of The Chinese University of Hong Kong (“CUHK”) and a member of the Advisory Group
on BBA-JD Programme of CUHK. Ms. Yeung is a solicitor of the High Court of Hong Kong and of the
Senior Courts of England and Wales. She is also a fellow member of The Hong Kong Institute of
Directors, The Hong Kong Institute of Chartered Secretaries and The Institute of Chartered Secretaries
and Administrators. She obtained a Master of Science degree in Finance and a Master’s degree in
Business Administration from CUHK in 2005 and 2001 respectively, and a Bachelor’s degree in Laws
and a Postgraduate Certificate in Laws from the University of Hong Kong in November 1983 and 1984,
respectively.
DIRECTORS’ REMUNERATION AND REMUNERATION OF THE FIVE HIGHEST PAID
INDIVIDUALS
As the Directors joined the Company in 2015, no remuneration was paid or is payable to any
Director in his/her capacity as such during the Track Record Period. All the Directors received
remuneration from the Cheung Kong Group and the Hutchison Group during the Track Record Period
in respect of their services to the Cheung Kong Group and the Hutchison Group. The amounts paid by
the Cheung Kong Group and the Hutchison Group were not specifically allocated between their services
to the Cheung Kong Property Group and their services to the Hutchison Property Group, respectively,
as there is no arrangement to recharge the Group such expenses and it is not meaningful to perform a
retrospective allocation of the services rendered by the Directors to the various group companies within
the Cheung Kong Group and the Hutchison Group. Further information in respect of the Directors’
remuneration is set out in Note 25 of the Accountants’ Report on the Cheung Kong Property Group set
out in “Appendix IA – Accountants’ Report on the Cheung Kong Property Group ” and Note 29 of the
Accountants’ Report on the Hutchison Property Group set out in “Appendix IB – Accountants’ Report
on the Hutchison Property Group”.
Under the current arrangements, the aggregate remuneration and benefits in kind payable to the
Directors for the year ending 31 December 2015 are estimated to be approximately HK$150.6 million,
excluding discretionary bonuses which are payable at the Group’s discretion.
For the years ended 31 December 2012, 2013 and 2014, the aggregate amount or value of fees,
salaries, housing allowances, other allowances, benefits in kind (including contribution to the Group’s
pension scheme on behalf of the five highest paid individuals) or any bonuses paid by (i) the Cheung
Kong Property Group to its five highest paid individuals were approximately HK$29 million, HK$32
million and HK$32 million, respectively, and (ii) the Hutchison Property Group to its five highest paid
individuals were approximately HK$49 million, HK$53 million and HK$54 million, respectively.
During the Track Record Period, no remuneration was paid to the Directors or the five highest
paid individuals as an inducement to join or upon joining the Group. No compensation was paid to, or
receivable by, the Directors or past directors of the Company or the five highest paid individuals for
the loss of office as director of any member of the Group or of any other office in connection with the
management of the affairs of any member of the Group. None of the Directors had waived any
remuneration and/or emoluments during the Track Record Period.
Information on the letters of appointment entered into between the Company and the Directors is
set out in “Appendix VII – General Information – Further Information about the Directors”.
– 302 –
DIRECTORS AND SENIOR MANAGEMENT
COMPLIANCE ADVISER
The Company has appointed Haitong International Capital Limited as its compliance adviser
pursuant to Rule 3A.19 of the Listing Rules to provide advisory services to the Company. In
compliance with Rule 3A.23 of the Listing Rules, the Company must consult with, and if necessary,
seek advice from, the compliance adviser on a timely basis in the following circumstances:
(a)
before the publication of any regulatory announcement, circular or financial report;
(b)
where a transaction, which might be a notifiable or connected transaction or constitute price
sensitive information of the Company, is contemplated including share issues and share
repurchases;
(c)
where the Group’s business activities, developments or results deviate from any forecast,
estimate or other information in this listing document; and
(d)
where the Stock Exchange makes an inquiry of the Company concerning unusual movements
in the price or trading volume of the Shares, the possible development of a false market in
the Shares, or any other matters.
The term of the appointment of the compliance adviser will commence on the Listing Date and
will end on the date on which the Company distributes its annual report in respect of its financial
results for the first full financial year commencing after the Listing Date.
– 303 –
WAIVERS FROM STRICT COMPLIANCE WITH THE LISTING RULES
In preparation for the Listing, the Company has sought the following waivers from strict
compliance with the relevant provisions of the Listing Rules:
1.
Waiver in Relation to the Disclosure of Capital Alterations of the Group
Paragraph 26 of Appendix 1, Part A to the Listing Rules (“Paragraph 26”) requires this listing
document to contain the particulars of any alterations in the capital of any member of the Group within
the two years immediately preceding the issue of this listing document.
The Company has applied to the Stock Exchange for, and the Stock Exchange has granted, a
waiver from strict compliance with the requirements under Paragraph 26 on the basis that:
(a)
upon completion of the Property Businesses Combination, the Group will comprise over
1,000 companies, a vast majority of which will be non-Principal Subsidiaries of the
Company;
(b)
it is expected that over 50 members of the Group (which in aggregate contributed to
approximately 6.1%, 1.1% and 8.4% of the Group’s unaudited pro forma turnover, profit
before taxation and total assets, respectively, for the year ended and as at 31 December
2014) will have had alterations in their share capital within the two years immediately
preceding the issue of this listing document and therefore, it would be impracticable and
unduly burdensome on the Company if it was required to comply strictly with the
requirements of Paragraph 26 as the Company would have to incur additional costs and
devote additional resources in compiling and verifying the relevant information for such
disclosure, which may not be meaningful to Shareholders and investors of the Company to
the extent it is in respect of non-Principal Subsidiaries; and
(c)
if the disclosure included in this listing document pursuant to Paragraph 26 is only in
respect of Principal Subsidiaries of the Company and excludes the non-Principal Subsidiaries
of the Company, such disclosure will allow the Shareholders and investors of the Company
to focus better on more meaningful information. For this purpose, a “Principal Subsidiary”
means a subsidiary of the Company:
(1)
which contributes to more than 5% in terms of one or more of (i) total assets, (ii)
profits before tax, and (iii) total revenue of the Group, as at or for the year ended 31
December 2014 (as the case may be) by reference to the Group’s pro forma financial
information for the year ended 31 December 2014; or
(2)
which the Company considers is otherwise significant to the Group, having regard to
the non-financial aspects and other contributions, such as its impact on the Group’s
corporate image and reputation and/or its contribution to the Group’s brand awareness
to the public.
The companies that will be Principal Subsidiaries of the Group upon completion of the Property
Businesses Combination contributed in aggregate approximately 53.5%, 43.9% and 12.6% of the
Group’s unaudited pro forma turnover, profit before taxation and total assets, respectively, for the year
ended and as at 31 December 2014.
– 304 –
WAIVERS FROM STRICT COMPLIANCE WITH THE LISTING RULES
As set out in “Appendix VII – General Information – Further Information about the Company”,
there were no changes in the share capital of these Principal Subsidiaries during the period of two years
immediately preceding the date of this listing document.
2.
Waiver in Relation to Non-exempt Continuing Connected Transactions
Certain members of the Group have entered into certain transactions which will constitute
continuing connected transactions of the Company under the Listing Rules following completion of the
Listing. The Company has applied to the Stock Exchange for, and the Stock Exchange has granted to
the Company, a waiver from strict compliance with the announcement requirements under Chapter 14A
of the Listing Rules with respect to the Non-exempt Continuing Connected Transactions. For further
details of such continuing connected transactions and the waiver, see “Connected Transactions”.
– 305 –
APPENDIX IA
ACCOUNTANTS’ REPORT ON THE
CHEUNG KONG PROPERTY GROUP
The following is the text of a report received from Deloitte Touche Tohmatsu, Certified Public
Accountants, Hong Kong, the reporting accountants of the Company, for the purpose of incorporation
in this listing document.
8 May 2015
The Directors
Cheung Kong Property Holdings Limited
7th Floor, Cheung Kong Center
2 Queen’s Road Central
Hong Kong
Merrill Lynch Far East Limited
55/F Cheung Kong Center
2 Queen’s Road Central, Central
Hong Kong
HSBC Corporate Finance (Hong Kong) Limited
1 Queen’s Road Central
Hong Kong
Dear Sirs,
We set out below our report on the financial information of the property business of Cheung Kong
(Holdings) Limited (“CKH”) and its subsidiaries (collectively referred to as the “Cheung Kong Property
Group” or the “Group”) (the “Cheung Kong Property Group Financial Information”), which will be
reorganised and held by Cheung Kong Property Holdings Limited (the “Company”) upon completion of
the proposed reorganisation mentioned below, for each of the three years ended 31 December 2012,
2013 and 2014 (the “Relevant Periods”) for inclusion in the listing document issued by the Company
and dated 8 May 2015 (the “Listing Document”) in connection with the listing by way of introduction
of the entire issued share capital of the Company on the Main Board of The Stock Exchange of Hong
Kong Limited (the “Proposed Listing”).
The Company was incorporated and registered as an exempted company in the Cayman Islands
under the Cayman Islands Companies Law on 2 January 2015 with limited liability. The Company,
which is currently a wholly-owned subsidiary of CK Hutchison Holdings Limited, is an investment
holding company and has not carried on any business except for equity transactions and preparation for
the Proposed Listing since its incorporation.
Pursuant to the corporate reorganisation as more fully explained in the section headed “History
and Reorganisation” in the Listing Document, the Company will become the holding company of the
companies comprising the Cheung Kong Property Group (the “Proposed Reorganisation”).
– IA-1 –
APPENDIX IA
ACCOUNTANTS’ REPORT ON THE
CHEUNG KONG PROPERTY GROUP
At the date of this report and during the Relevant Periods, the particulars of the companies
comprising the Cheung Kong Property Group, all of which are companies with limited liabilities, are as
follows:
Equity interest attributable to the Group
(effective holding)
Name
Place of
incorporation/
establishment
Date of
incorporation/
establishment
2012
2013
2014
At the
date of
this
report
Issued and fully
paid share/
registered
capital
Place of
operation
Principal activities
U.S. Assets, Inc.. . . . . . . . . .
Arizona, U.S.A.
8 August 2001
100%
100%
100%
100%
USD1,000
U.S.A.
Property development
Able Sharp Group Limited . . . .
British Virgin
Islands
21 September 2005
100%
100%
100%
100%
USD1
note (a)
Investment holding
Achieve Point Holdings Limited .
British Virgin
Islands
16 February 2006
100%
100%
100%
100%
USD1
note (a)
Investment holding
Aesthetic Investments Limited . .
British Virgin
Islands
20 November 1996
100%
100%
100%
100%
USD1
note (a)
Investment holding
Agate Enterprises Limited . . . .
British Virgin
Islands
1 April 2014
N/A
N/A
100%
100%
USD1
note (a)
Investment holding
Aim Clever Holdings Limited . .
British Virgin
Islands
2 July 2004
100%
100%
100%
100%
USD1
note (a)
Investment holding
Akerman Holdings Limited . . . .
British Virgin
Islands
5 July 1995
100%
100%
100%
100%
USD1
note (a)
Investment holding
Amberland Investment Holdings
Limited . . . . . . . . . . . .
British Virgin
Islands
1 April 2014
N/A
N/A
100%
100%
USD2
note (a)
Investment holding
Amityville Limited . . . . . . . .
British Virgin
Islands
1 June 1995
100%
100%
100%
100%
USD1
note (a)
Investment holding
Ascardo Limited. . . . . . . . . .
British Virgin
Islands
8 December 1997
100%
100%
100%
100%
USD1
note (a)
Investment holding
Asset Legend Limited. . . . . . .
British Virgin
Islands
29 March 2011
100%
100%
50%
50%
USD1
note (a)
Investment holding
Astino Limited . . . . . . . . . .
British Virgin
Islands
4 November 1998
100%
100%
100%
100%
USD1
note (a)
Investment holding
Autogrow Enterprises
Corporation . . . . . . . . . .
British Virgin
Islands
7 April 2011
100%
100%
100%
100%
USD1
note (a)
Investment holding
Aventee Resources Limited . . . .
British Virgin
Islands
31 July 2003
100%
100%
100%
100%
USD1
note (a)
Investment holding
Bamco Investment Limited . . . .
British Virgin
Islands
4 January 1999
100%
100%
100%
100%
USD1
note (a)
Investment holding
Barbina Enterprises Limited
(disposed of on 29
November 2013) . . . . . . .
British Virgin
Islands
4 July 2013
N/A
N/A
N/A
N/A
N/A
note (a)
Investment holding
Bavette Limited . . . . . . . . . .
British Virgin
Islands
25 July 2012
100%
100%
100%
100%
USD1
note (a)
Investment holding
Beaumount Holdings Limited. . .
British Virgin
Islands
24 August 2011
100%
100%
100%
100%
USD1
note (a)
Investment holding
Benform Limited . . . . . . . . .
British Virgin
Islands
17 November 2005
100%
100%
100%
100%
USD1
note (a)
Investment holding
Best Desire Investments Limited .
British Virgin
Islands
28 January 2011
100%
100%
100%
100%
USD1
note (a)
Investment holding
Best Yet Resources Limited. . . .
British Virgin
Islands
30 July 1999
100%
100%
100%
100%
USD1
note (a)
Investment holding
Better Ace Group Limited . . . .
British Virgin
Islands
21 May 2007
100%
100%
100%
100%
USD1
note (a)
Investment holding
Bignet Limited . . . . . . . . . .
British Virgin
Islands
20 January 2000
100%
100%
100%
100%
USD1
note (a)
Investment holding
Bingham Venture Limited. . . . .
British Virgin
Islands
11 February 2004
100%
100%
100%
100%
USD1
note (a)
Investment holding
Bios Investment Limited . . . . .
British Virgin
Islands
10 March 2005
100%
100%
100%
100%
USD1
note (a)
Investment holding
Blackmoor Investments Limited .
British Virgin
Islands
24 August 2011
100%
100%
100%
100%
USD1
note (a)
Investment holding
Blissjoy International Limited . .
British Virgin
Islands
8 July 2005
80%
80%
80%
80%
USD10
note (a)
Investment holding
Bolo Investment Limited . . . . .
British Virgin
Islands
3 October 2000
100%
100%
100%
100%
USD1
note (a)
Investment holding
– IA-2 –
APPENDIX IA
ACCOUNTANTS’ REPORT ON THE
CHEUNG KONG PROPERTY GROUP
Equity interest attributable to the Group
(effective holding)
Name
Place of
incorporation/
establishment
Date of
incorporation/
establishment
2012
2013
2014
At the
date of
this
report
Issued and fully
paid share/
registered
capital
Place of
operation
Principal activities
Bonson Resources Limited . . . .
British Virgin
Islands
4 July 2000
100%
100%
100%
100%
USD1
note (a)
Investment holding
Boombay Limited . . . . . . . . .
British Virgin
Islands
25 November 1998
100%
100%
100%
100%
USD1
note (a)
Investment holding
Bouga Investments Limited . . . .
British Virgin
Islands
7 April 2011
100%
100%
100%
100%
USD1
note (a)
Investment holding
Bovision Limited . . . . . . . . .
British Virgin
Islands
3 March 2004
100%
100%
100%
100%
USD1
note (a)
Investment holding
Bowstar Limited. . . . . . . . . .
British Virgin
Islands
2 January 2003
100%
100%
100%
100%
USD1
note (a)
Investment holding
Bravo Time Holdings Limited . .
British Virgin
Islands
26 January 2011
100%
100%
100%
100%
USD1
note (a)
Investment holding
Broadstairs International Limited .
British Virgin
Islands
8 June 1999
100%
100%
100%
100%
USD1
note (a)
Investment holding
Burgeon Force Limited . . . . . .
British Virgin
Islands
18 November 2010
100%
100%
100%
100%
USD1
note (a)
Investment holding
Cabramatta Limited . . . . . . . .
British Virgin
Islands
25 July 1995
100%
100%
100%
100%
USD1
note (a)
Investment holding
Campanelle Investments Limited .
British Virgin
Islands
17 January 2014
N/A
N/A
100%
100%
USD1
note (a)
Investment holding
Carton International Limited . . .
British Virgin
Islands
1 August 2000
100%
100%
100%
100%
USD2
Hong Kong
Investment holding and
consultancy services
Cashwin Limited . . . . . . . . .
British Virgin
Islands
4 January 2013
N/A
100%
100%
100%
USD1
note (a)
Investment holding
Cellentani Investments Limited . .
British Virgin
Islands
17 January 2014
N/A
N/A
100%
100%
USD2
note (a)
Investment holding
Century Sixty Limited . . . . . .
British Virgin
Islands
8 August 1997
100%
100%
100%
100%
USD1
Hong Kong
Financing
Champion Leaf Limited. . . . . .
British Virgin
Islands
25 January 2013
N/A
100%
100%
100%
USD2
note (a)
Investment holding
Charm Aim International
Limited . . . . . . . . . . . .
British Virgin
Islands
8 May 2007
100%
100%
100%
100%
USD1
note (a)
Investment holding
Chasterton Limited . . . . . . . .
British Virgin
Islands
29 August 1995
100%
100%
100%
100%
USD1
note (a)
Investment holding
Cheerjoy Limited . . . . . . . . .
British Virgin
Islands
2 December 2008
100%
100%
100%
100%
USD10,000
note (a)
Investment holding
Chengdu Lido Limited . . . . . .
British Virgin
Islands
21 July 2011
100%
100%
100%
100%
USD1
note (a)
Inactive
Cheung Kong (China Hotel) Ltd. .
British Virgin
Islands
9 November 1993
100%
100%
100%
100%
USD1
note (a)
Investment holding
Cheung Kong (China Housing
Development) Ltd. . . . . . .
British Virgin
Islands
22 July 1991
100%
100%
100%
100%
USD1
note (a)
Investment holding
Cheung Kong (China Investment
Holdings) Limited . . . . . .
British Virgin
Islands
1 December 2004
100%
100%
100%
100%
USD1
note (a)
Inactive
Cheung Kong (China Investment)
Enterprises Ltd . . . . . . . .
British Virgin
Islands
31 August 2007
100%
100%
100%
100%
USD1
note (a)
Inactive
Cheung Kong (China Property
Development) Ltd. . . . . . .
British Virgin
Islands
23 June 1992
100%
100%
100%
100%
USD1
note (a)
Investment holding
Cheung Kong (China Property)
Ltd. . . . . . . . . . . . . . .
British Virgin
Islands
14 September 1993
100%
100%
100%
100%
USD1
note (a)
Investment holding
Cheung Kong Development
(China) Limited . . . . . . .
British Virgin
Islands
12 December 2005
100%
100%
100%
100%
USD10,000
note (a)
Investment holding
Cheung Kong Jingyang Housing
Development Ltd. . . . . . .
British Virgin
Islands
7 December 1993
100%
100%
100%
100%
USD1
note (a)
Inactive
China Cheung Kong Property
Investment Limited. . . . . .
British Virgin
Islands
27 July 2010
100%
100%
100%
100%
USD1
note (a)
Inactive
Chinawide Profits Limited . . . .
British Virgin
Islands
18 September 2002
100%
100%
100%
100%
USD1
note (a)
Investment holding
Chinex Ltd. . . . . . . . . . . . .
British Virgin
Islands
13 August 2003
100%
100%
100%
100%
USD1
note (a)
Investment holding
– IA-3 –
APPENDIX IA
ACCOUNTANTS’ REPORT ON THE
CHEUNG KONG PROPERTY GROUP
Equity interest attributable to the Group
(effective holding)
Name
Place of
incorporation/
establishment
Date of
incorporation/
establishment
2012
2013
2014
At the
date of
this
report
Issued and fully
paid share/
registered
capital
Place of
operation
Principal activities
Choice Century Limited. . . . . .
British Virgin
Islands
19 August 2002
100%
100%
100%
100%
USD1
note (a)
Investment holding
City Access Limited. . . . . . . .
British Virgin
Islands
3 May 2005
100%
100%
100%
100%
USD1
note (a)
Investment holding
City Magic Holdings Limited. . .
British Virgin
Islands
3 September 2004
100%
100%
100%
100%
USD100
note (a)
Investment holding
City Orient Investments Limited .
British Virgin
Islands
23 September 2004
100%
100%
100%
100%
USD1
note (a)
Investment holding
City Sparkling Limited . . . . . .
British Virgin
Islands
2 November 2011
100%
100%
100%
100%
USD2
note (a)
Investment holding
City Vanguard Limited . . . . . .
British Virgin
Islands
10 November 2011
100%
100%
100%
100%
USD1
note (a)
Investment holding
Citytex Investment Limited . . . .
British Virgin
Islands
12 April 2005
100%
100%
100%
100%
USD1
note (a)
Investment holding
CKH Star Limited. . . . . . . . .
British Virgin
Islands
20 January 2000
100%
100%
100%
100%
USD1
note (a)
Investment holding
Classic One Investments Limited .
British Virgin
Islands
6 January 2011
100%
100%
100%
100%
USD1
note (a)
Investment holding
Clear Success International
Limited . . . . . . . . . . . .
British Virgin
Islands
8 August 2005
100%
100%
100%
100%
USD1
note (a)
Investment holding
Cleverking International Limited .
British Virgin
Islands
3 December 2004
100%
100%
100%
100%
USD1
note (a)
Investment holding
Coco Resources Limited . . . . .
British Virgin
Islands
12 October 1998
100%
100%
100%
100%
USD1
note (a)
Inactive
Complete Wiz Investments
Limited . . . . . . . . . . . .
British Virgin
Islands
16 February 2006
100%
100%
100%
100%
USD1
note (a)
Inactive
Corzetti Limited . . . . . . . . . .
British Virgin
Islands
19 October 2012
100%
100%
100%
100%
USD2
note (a)
Investment holding
Cropland Investment Limited . . .
British Virgin
Islands
21 November 2000
100%
100%
100%
100%
USD1
note (a)
Investment holding
Croyland Investments Limited . .
British Virgin
Islands
3 January 1997
100%
100%
100%
100%
USD1
note (a)
Inactive
Curvers Holdings Limited . . . .
British Virgin
Islands
13 June 1995
100%
100%
100%
100%
USD1
note (a)
Investment holding
Datalink Enterprises Limited . . .
British Virgin
Islands
29 March 2000
100%
100%
100%
100%
USD1
note (a)
Investment holding
Datalink Resources Limited. . . .
British Virgin
Islands
21 January 2000
100%
100%
100%
100%
USD1
note (a)
Investment holding
Dellian Developments Limited . .
British Virgin
Islands
6 January 2000
100%
100%
100%
100%
USD1
note (a)
Investment holding
Desmark Investment Limited . . .
British Virgin
Islands
12 December 2005
100%
100%
100%
100%
USD1
note (a)
Investment holding
Dinmax Limited . . . . . . . . . .
British Virgin
Islands
6 March 2003
100%
100%
100%
100%
USD1
note (a)
Investment holding
Doko Limited . . . . . . . . . . .
British Virgin
Islands
30 January 2003
100%
100%
100%
100%
USD1
note (a)
Investment holding
Dragon Focus Group Limited. . .
British Virgin
Islands
28 April 2005
100%
100%
100%
100%
USD1
note (a)
Investment holding
Dreamsell Group Limited . . . . .
British Virgin
Islands
6 January 2000
100%
100%
100%
100%
USD1
note (a)
Investment holding
Easypro Group Limited . . . . . .
British Virgin
Islands
9 January 2006
100%
100%
100%
100%
USD1
note (a)
Investment holding
Enterpark Limited . . . . . . . . .
British Virgin
Islands
6 September 2005
100%
100%
100%
100%
USD1
note (a)
Investment holding
Equisite Taste Investments
Limited . . . . . . . . . . . .
British Virgin
Islands
7 March 1995
100%
100%
100%
100%
USD1
note (a)
Investment holding
Esteem-Rite Limited . . . . . . .
British Virgin
Islands
15 April 2011
100%
100%
100%
100%
USD1
note (a)
Investment holding
Estimated Return Investments
Limited . . . . . . . . . . . .
British Virgin
Islands
12 April 2000
100%
100%
100%
100%
USD1
note (a)
Investment holding
– IA-4 –
APPENDIX IA
ACCOUNTANTS’ REPORT ON THE
CHEUNG KONG PROPERTY GROUP
Equity interest attributable to the Group
(effective holding)
Name
Place of
incorporation/
establishment
Date of
incorporation/
establishment
2012
2013
2014
At the
date of
this
report
Issued and fully
paid share/
registered
capital
Place of
operation
Principal activities
Even Market Investments
Limited . . . . . . . . . . . .
British Virgin
Islands
30 August 2000
100%
100%
100%
100%
USD1
note (a)
Investment holding
Even Spread Limited . . . . . . .
British Virgin
Islands
10 April 2006
100%
100%
100%
100%
USD1
note (a)
Investment holding
Ever Attain Limited . . . . . . . .
British Virgin
Islands
18 January 2011
100%
100%
100%
100%
USD1
note (a)
Investment holding
Expert Pro Holdings Limited . . .
British Virgin
Islands
1 February 2011
100%
100%
50%
50%
USD2
note (a)
Investment holding
Fairy International Limited . . . .
British Virgin
Islands
2 October 2003
100%
100%
100%
100%
USD1
note (a)
Investment holding
Famous Star Venture Limited . . .
British Virgin
Islands
27 April 1999
100%
100%
100%
100%
USD1
note (a)
Investment holding
Favor Aim Enterprises Limited . .
British Virgin
Islands
9 January 2006
100%
100%
100%
100%
USD1
note (a)
Investment holding
Filand Enterprises Limited . . . .
British Virgin
Islands
31 May 1999
100%
100%
100%
100%
USD1
note (a)
Investment holding
Fiori Global Limited . . . . . . .
British Virgin
Islands
29 November 2012
100%
100%
100%
100%
USD1
note (a)
Investment holding
Fireball Enterprises Limited . . .
British Virgin
Islands
29 April 1999
100%
100%
100%
100%
USD1
note (a)
Investment holding
Flextop Limited . . . . . . . . . .
British Virgin
Islands
6 July 1999
100%
100%
100%
100%
USD1
note (a)
Investment holding
Focus Eagle Investments Limited.
British Virgin
Islands
15 April 2003
100%
100%
100%
100%
USD1
note (a)
Investment holding
Foncom Limited . . . . . . . . . .
British Virgin
Islands
18 July 2000
100%
100%
100%
100%
USD10,000
note (a)
Investment holding
Fortech Resources Limited . . . .
British Virgin
Islands
2 January 2002
100%
100%
100%
100%
USD1
note (a)
Investment holding
Full Vantage Limited . . . . . . .
British Virgin
Islands
10 April 2006
100%
100%
100%
100%
USD1
note (a)
Investment holding
Gadera Investments Limited . . .
British Virgin
Islands
7 June 1994
100%
100%
100%
100%
USD1
note (a)
Investment holding
Galand Limited . . . . . . . . . .
British Virgin
Islands
4 July 2006
100%
100%
100%
100%
USD1
note (a)
Investment holding
Gartech Resources Limited . . . .
British Virgin
Islands
9 September 2005
100%
100%
100%
100%
USD1
note (a)
Investment holding
Giant Step Holdings Group Inc. .
British Virgin
Islands
6 July 2005
100%
100%
100%
100%
USD1
note (a)
Inactive
Giga Resources Limited. . . . . .
British Virgin
Islands
11 August 2001
100%
100%
100%
100%
USD1
note (a)
Inactive
Gingerbread Investments Limited.
British Virgin
Islands
2 January 1992
100%
100%
100%
100%
USD1
Hong Kong
Property development
Glass Bead Limited . . . . . . . .
British Virgin
Islands
26 November 1991
100%
100%
100%
100%
USD1
Hong Kong
Property investment
– IA-5 –
APPENDIX IA
ACCOUNTANTS’ REPORT ON THE
CHEUNG KONG PROPERTY GROUP
Equity interest attributable to the Group
(effective holding)
Name
Place of
incorporation/
establishment
Date of
incorporation/
establishment
2012
2013
2014
At the
date of
this
report
Issued and fully
paid share/
registered
capital
Place of
operation
Principal activities
Gleaming Profits Limited . . . . .
British Virgin
Islands
25 September 1997
100%
100%
100%
100%
USD1
note (a)
Investment holding
Globeat Strategy Limited . . . . .
British Virgin
Islands
8 March 2000
100%
100%
100%
100%
USD1
note (a)
Investment holding
Go Best Investments Limited
British Virgin
Islands
25 August 2005
100%
100%
100%
100%
USD1
note (a)
Investment holding
Goda International Limited . . . .
British Virgin
Islands
21 May 1997
100%
100%
100%
100%
USD1
note (a)
Inactive
Going Places Group Limited . . .
British Virgin
Islands
25 September 1997
100%
100%
100%
100%
USD1
note (a)
Investment holding
Gold Braid Limited . . . . . . . .
British Virgin
Islands
26 November 1991
100%
100%
100%
100%
USD1
note (a)
Investment holding
Gold Creek Enterprises Limited .
British Virgin
Islands
12 April 2012
100%
100%
100%
100%
USD1
note (a)
Investment holding
Goldcent Investments Limited . .
British Virgin
Islands
29 August 1995
100%
100%
100%
100%
USD1
note (a)
Investment holding
Goldleaf Venture Limited . . . . .
British Virgin
Islands
16 May 1997
100%
100%
100%
100%
USD1
note (a)
Investment holding
Goldwise Limited . . . . . . . . .
British Virgin
Islands
2 April 1998
100%
100%
100%
100%
USD1
note (a)
Investment holding
Good Sun Profits Limited. . . . .
British Virgin
Islands
13 October 2005
100%
100%
100%
100%
USD1
note (a)
Investment holding
Gosula Limited . . . . . . . . . .
British Virgin
Islands
26 April 1994
100%
100%
100%
100%
USD1
note (a)
Investment holding
Gowrie Profits Limited . . . . . .
British Virgin
Islands
28 February 2000
100%
100%
100%
100%
USD1
note (a)
Investment holding
Grand Plan Investments Inc. . . .
British Virgin
Islands
15 April 2011
100%
100%
100%
100%
USD1
note (a)
Investment holding
Grandeur Era Limited . . . . . . .
British Virgin
Islands
28 March 2012
100%
100%
100%
100%
USD1
note (a)
Investment holding
Greats Assets Limited
(wound up on 17 October
2012)
British Virgin
Islands
11 January 1993
N/A
N/A
N/A
N/A
N/A
note (a)
Inactive
Great Fame International
Limited . . . . . . . . . . . .
British Virgin
Islands
8 June 2007
100%
100%
100%
100%
USD1
note (a)
Inactive
Great Hope International Limited.
British Virgin
Islands
8 June 2007
100%
100%
100%
100%
USD1
note (a)
Inactive
Great Region Investments
Limited . . . . . . . . . . . .
British Virgin
Islands
10 March 2011
100%
100%
100%
100%
USD1
note (a)
Investment holding
Greenage Holdings Limited. . . .
British Virgin
Islands
16 February 2011
100%
100%
100%
100%
USD1
note (a)
Investment holding
Harbour Plaza Resort City
Limited . . . . . . . . . . . .
British Virgin
Islands
10 July 2013
N/A
98.47%
98.47%
98.47%
USD10,000
Hong Kong
Hotel and serviced suite
operation
Haseldene International Limited .
British Virgin
Islands
28 October 2010
100%
100%
100%
100%
USD1
note (a)
Investment holding
Haunder Investments Limited. . .
British Virgin
Islands
5 July 1994
100%
100%
100%
100%
USD1
note (a)
Investment holding
Herolink Limited . . . . . . . . .
British Virgin
Islands
4 July 2000
100%
100%
100%
100%
USD1
note (a)
Investment holding
High Acceptation Limited. . . . .
British Virgin
Islands
20 April 2000
100%
100%
100%
100%
USD1
note (a)
Investment holding
Highbury International Limited . .
British Virgin
Islands
3 January 1995
100%
100%
100%
100%
USD1
note (a)
Investment holding
Holistic Gain Limited . . . . . . .
British Virgin
Islands
14 December 2011
100%
100%
100%
100%
USD1
note (a)
Investment holding
Honey Bear Holdings Limited . .
British Virgin
Islands
26 November 1991
100%
100%
100%
100%
USD1
note (a)
Investment holding
Hosar Investment Limited . . . .
British Virgin
Islands
21 May 2003
100%
100%
100%
100%
USD1
note (a)
Investment holding
– IA-6 –
APPENDIX IA
ACCOUNTANTS’ REPORT ON THE
CHEUNG KONG PROPERTY GROUP
Equity interest attributable to the Group
(effective holding)
Name
Place of
incorporation/
establishment
Date of
incorporation/
establishment
2012
2013
2014
At the
date of
this
report
Issued and fully
paid share/
registered
capital
Place of
operation
Principal activities
Hoshing Resources Limited. . . .
British Virgin
Islands
4 July 2000
100%
100%
100%
100%
USD1
note (a)
Investment holding
Hyperforce Limited . . . . . . . .
British Virgin
Islands
12 September 2005
100%
100%
100%
100%
USD1
note (a)
Investment holding
Idola Holdings Limited . . . . . .
British Virgin
Islands
15 July 2010
100%
100%
100%
100%
USD1
note (a)
Investment holding
In Favour Assets Limited . . . . .
British Virgin
Islands
3 July 2001
100%
100%
100%
100%
USD1
note (a)
Investment holding
Interwest Resources Limited . . .
British Virgin
Islands
9 May 2006
100%
100%
100%
100%
USD1
note (a)
Investment holding
iVision International Limited . . .
British Virgin
Islands
22 February 2001
100%
100%
100%
100%
USD100
Hong Kong
Financing
Jadeland Resources Limited . . .
British Virgin
Islands
6 May 1997
100%
100%
100%
100%
USD1
note (a)
Investment holding
Jolly Concept Holdings Limited .
British Virgin
Islands
20 April 2006
100%
100%
100%
100%
USD1
note (a)
Investment holding
Juralco Limited . . . . . . . . . .
British Virgin
Islands
3 January 1997
100%
100%
100%
100%
USD1
note (a)
Investment holding
Kalop Limited . . . . . . . . . . .
British Virgin
Islands
3 January 2002
100%
100%
100%
100%
USD1
note (a)
Investment holding
Kamlun Profits Limited . . . . . .
British Virgin
Islands
28 April 2005
100%
100%
100%
100%
USD1
note (a)
Investment holding
Kenten Road Investments
Limited . . . . . . . . . . . .
British Virgin
Islands
3 April 2006
100%
100%
100%
100%
USD1
note (a)
Investment holding
Kentex Enterprises Limited . . . .
British Virgin
Islands
22 May 2006
100%
100%
100%
100%
USD1
note (a)
Investment holding
Keyswin International Limited . .
British Virgin
Islands
4 January 2005
100%
100%
100%
100%
USD1
note (a)
Investment holding
Kiadina Investments Limited . . .
British Virgin
Islands
7 June 1994
100%
100%
100%
100%
USD1
note (a)
Investment holding
Killam Group Limited . . . . . .
British Virgin
Islands
22 November 2005
100%
100%
100%
100%
USD1
note (a)
Investment holding
Kismet Developments Limited . .
British Virgin
Islands
3 November 1997
100%
100%
100%
100%
USD1
note (a)
Investment holding
Know Win Limited . . . . . . . .
British Virgin
Islands
3 April 2006
100%
100%
100%
100%
USD1
note (a)
Inactive
Kolane Limited . . . . . . . . . .
British Virgin
Islands
4 April 2005
100%
100%
100%
100%
USD1
note (a)
Investment holding
Landinvest Investment Limited . .
British Virgin
Islands
3 October 2005
100%
100%
100%
100%
USD1
note (a)
Investment holding
Lasco Resources Limited . . . . .
British Virgin
Islands
20 March 2006
100%
100%
100%
100%
USD1
note (a)
Investment holding
Lead Ahead Group Limited . . . .
British Virgin
Islands
10 August 2005
100%
100%
100%
100%
USD1
note (a)
Investment holding
Leckford Resources Limited . . .
British Virgin
Islands
18 June 1997
100%
100%
100%
100%
USD1
note (a)
Investment holding
Lema International Limited . . . .
British Virgin
Islands
12 March 1997
100%
100%
100%
100%
USD1
note (a)
Investment holding
Lico Investment Limited . . . . .
British Virgin
Islands
23 April 1997
100%
100%
100%
100%
USD1
note (a)
Investment holding
Light Crown International
Limited . . . . . . . . . . . .
British Virgin
Islands
12 September 1995
100%
100%
100%
100%
USD1
note (a)
Investment holding
Lipwin Resources Limited . . . .
British Virgin
Islands
29 August 2000
100%
100%
100%
100%
USD1
note (a)
Investment holding
Liverton Investment Limited . . .
British Virgin
Islands
4 July 1996
100%
100%
100%
100%
USD1
note (a)
Inactive
Lumistar Limited . . . . . . . . .
British Virgin
Islands
29 November 2002
100%
100%
100%
100%
USD1
note (a)
Investment holding
– IA-7 –
APPENDIX IA
ACCOUNTANTS’ REPORT ON THE
CHEUNG KONG PROPERTY GROUP
Equity interest attributable to the Group
(effective holding)
Name
Place of
incorporation/
establishment
Date of
incorporation/
establishment
2012
2013
2014
At the
date of
this
report
Issued and fully
paid share/
registered
capital
Place of
operation
Principal activities
Lyntall Limited . . . . . . . . . .
British Virgin
Islands
8 April 2013
N/A
100%
100%
100%
USD1
note (a)
Investment holding
Magic Champ Limited . . . . . .
British Virgin
Islands
28 July 2010
100%
100%
100%
100%
USD1
note (a)
Inactive
Magic Fortune Limited . . . . . .
British Virgin
Islands
10 March 1998
100%
100%
100%
100%
USD1
note (a)
Investment holding
Marino Capital Holdings Limited.
British Virgin
Islands
25 January 2005
85%
85%
85%
85%
USD20
Hong Kong
Investment holding and
financing
Mass Success Investments
Limited . . . . . . . . . . . .
British Virgin
Islands
10 March 1998
100%
100%
100%
100%
USD1
note (a)
Investment holding
Mastronic Enterprises Limited . .
British Virgin
Islands
24 July 1998
100%
100%
100%
100%
USD1
note (a)
Investment holding
Maysprings Holdings Limited . .
British Virgin
Islands
22 April 1997
100%
100%
100%
100%
USD1
note (a)
Investment holding
Mcbride International Limited . .
British Virgin
Islands
13 July 2006
100%
100%
100%
100%
USD1
note (a)
Inactive
Megawin International Ltd. . . . .
British Virgin
Islands
2 January 2003
100%
100%
100%
100%
USD2
Hong Kong
Investment holding and
provision of
consultancy services
Merry Finance Ltd . . . . . . . .
British Virgin
Islands
22 March 1994
100%
100%
100%
100%
USD1
note (a)
Investment holding
Merry Investments Limited . . . .
British Virgin
Islands
19 October 1993
100%
100%
100%
100%
USD1
note (a)
Investment holding
Mesa Investment Limited . . . . .
British Virgin
Islands
24 March 1999
100%
100%
100%
100%
USD1
note (a)
Investment holding
Mocore Investment Limited. . . .
British Virgin
Islands
22 March 2005
100%
100%
100%
100%
USD1
note (a)
Investment holding
Monopro Investment Limited . . .
British Virgin
Islands
3 January 2002
100%
100%
100%
100%
USD1
note (a)
Investment holding
Monway Investment Limited . . .
British Virgin
Islands
5 January 2005
100%
100%
100%
100%
USD1
note (a)
Investment holding
More Fortune Investments
Limited . . . . . . . . . . . .
British Virgin
Islands
12 August 2005
100%
100%
100%
100%
USD1
note (a)
Investment holding
Mosco Enterprises Limited . . . .
British Virgin
Islands
21 July 1999
100%
100%
100%
100%
USD1
note (a)
Investment holding
Most Sunny Limited . . . . . . .
British Virgin
Islands
3 May 2006
100%
100%
100%
100%
USD1
note (a)
Inactive
Munrose Limited . . . . . . . . .
British Virgin
Islands
22 April 1997
100%
100%
100%
100%
USD1
note (a)
Investment holding
Narada Investment Limited . . . .
British Virgin
Islands
25 May 1999
100%
100%
100%
100%
USD1
note (a)
Investment holding
Newsbury Enterprises Limited . .
British Virgin
Islands
13 March 1996
100%
100%
100%
100%
USD1
note (a)
Investment holding
Nimble Market Limited . . . . . .
British Virgin
Islands
20 April 2011
100%
100%
100%
100%
USD1
note (a)
Investment holding
Nito International Limited . . . .
British Virgin
Islands
6 March 2002
100%
100%
100%
100%
USD1
note (a)
Investment holding
Noblecrown Investment Limited .
British Virgin
Islands
28 September 2000
100%
100%
100%
100%
USD1
note (a)
Investment holding
Numarko Limited . . . . . . . . .
British Virgin
Islands
18 October 2005
100%
100%
100%
100%
USD1
note (a)
Investment holding
Onwin Enterprises Limited . . . .
British Virgin
Islands
21 November 2002
100%
100%
100%
100%
USD1
note (a)
Investment holding
Orator Investment Limited . . . .
British Virgin
Islands
6 March 2002
100%
100%
100%
100%
USD1
note (a)
Investment holding
Ostobo Limited . . . . . . . . . .
British Virgin
Islands
2 January 2002
100%
100%
100%
100%
USD1
note (a)
Investment holding
Paola Holdings Limited . . . . . .
British Virgin
Islands
29 September 2010
100%
100%
100%
100%
USD1
note (a)
Investment holding
– IA-8 –
APPENDIX IA
ACCOUNTANTS’ REPORT ON THE
CHEUNG KONG PROPERTY GROUP
Equity interest attributable to the Group
(effective holding)
Name
Place of
incorporation/
establishment
Date of
incorporation/
establishment
2012
2013
2014
At the
date of
this
report
Issued and fully
paid share/
registered
capital
Place of
operation
Principal activities
Pentech Investment Limited
(wound up on 28 November
2014) . . . . . . . . . . . . .
British Virgin
Islands
4 July 2006
100%
100%
N/A
N/A
N/A
note (a)
Investment holding
Perfect Figure Investments
Limited (wound up on 1 July
2014) . . . . . . . . . . . . .
British Virgin
Islands
5 January 2006
100%
100%
N/A
N/A
N/A
note (a)
Investment holding
Pervasive Developments Limited .
British Virgin
Islands
22 May 2001
100%
100%
100%
100%
USD1
note (a)
Investment holding
Phonic Limited . . . . . . . . . .
British Virgin
Islands
29 March 1996
100%
100%
100%
100%
USD1
note (a)
Investment holding
Pine Fragrance Limited . . . . . .
British Virgin
Islands
19 September 1995
100%
100%
100%
100%
USD1
Hong Kong
Property investment
Plan Achieve Limited . . . . . . .
British Virgin
Islands
8 September 2010
100%
100%
100%
100%
USD1
note (a)
Investment holding
Platinum Ring Limited . . . . . .
British Virgin
Islands
10 May 2005
100%
100%
100%
100%
USD1
note (a)
Investment holding
Pofield Investments Limited . . .
British Virgin
Islands
21 June 1993
100%
100%
100%
100%
USD1
Hong Kong
Property investment
Polytown Investments Limited . .
British Virgin
Islands
3 January 1997
100%
100%
100%
100%
USD1
note (a)
Investment holding
Potent Limited. . . . . . . . . . .
British Virgin
Islands
7 July 2005
100%
100%
100%
100%
USD1
note (a)
Investment holding
Pomer International Limited . . .
British Virgin
Islands
1 May 1997
100%
100%
100%
100%
USD1
note (a)
Investment holding
Powercell Investment Limited
(wound up on 25 November
2014) . . . . . . . . . . . . .
British Virgin
Islands
27 February 2001
100%
100%
N/A
N/A
N/A
note (a)
Investment holding
Presion Limited . . . . . . . . . .
British Virgin
Islands
6 June 1990
100%
100%
100%
100%
USD650
note (a)
Investment holding
Prima Enterprise Corp. (dissolved
on 18 September 2012) . . .
British Virgin
Islands
6 July 2000
N/A
N/A
N/A
N/A
N/A
note (a)
Inactive
Prime Prosperous Limited . . . .
British Virgin
Islands
28 March 2012
100%
100%
100%
100%
USD1
note (a)
Investment holding
Prime Riches Limited . . . . . . .
British Virgin
Islands
18 April 2012
100%
100%
100%
100%
USD2
note (a)
Investment holding
Primefair Investment Limited. . .
British Virgin
Islands
2 December 1996
100%
100%
100%
100%
USD1
note (a)
Investment holding
Primrose Profits Corp. (wound up
on 25 November 2014). . . .
British Virgin
Islands
19 September 1996
100%
100%
N/A
N/A
N/A
note (a)
Inactive
Profit Land Global Enterprises
Inc. . . . . . . . . . . . . . .
British Virgin
Islands
15 April 2011
100%
100%
100%
100%
USD1
note (a)
Investment holding
Profit Town Investments Limited
(wound up on 7 May 2014) .
British Virgin
Islands
28 January 2005
100%
100%
N/A
N/A
N/A
note (a)
Inactive
Progress Future Limited . . . . .
British Virgin
Islands
1 August 1997
100%
100%
100%
100%
USD1
note (a)
Investment holding
Prospect Acme Limited . . . . . .
British Virgin
Islands
28 March 2011
100%
100%
100%
100%
USD1
note (a)
Investment holding
Punto Investment Limited. . . . .
British Virgin
Islands
16 October 1998
100%
100%
100%
100%
USD1
note (a)
Investment holding
Radiant Talent Investments
Limited . . . . . . . . . . . .
British Virgin
Islands
6 April 2011
100%
100%
100%
100%
USD1
note (a)
Investment holding
Ramway Investment Limited . . .
British Virgin
Islands
4 January 2005
100%
100%
100%
100%
USD1
note (a)
Investment holding
– IA-9 –
APPENDIX IA
ACCOUNTANTS’ REPORT ON THE
CHEUNG KONG PROPERTY GROUP
Equity interest attributable to the Group
(effective holding)
Name
Place of
incorporation/
establishment
Date of
incorporation/
establishment
2012
2013
2014
At the
date of
this
report
Issued and fully
paid share/
registered
capital
Place of
operation
Principal activities
Raven Profits Limited. . . . . . .
British Virgin
Islands
20 April 1995
100%
100%
100%
100%
USD1
note (a)
Investment holding
Reagan Enterprises Limited
(wound up on 10 December
2014) . . . . . . . . . . . . .
British Virgin
Islands
11 January 2005
100%
100%
N/A
N/A
N/A
note (a)
Investment holding
Reedy Profits Limited. . . . . . .
British Virgin
Islands
20 April 1995
100%
100%
100%
100%
USD1
note (a)
Investment holding
Renton International Limited . . .
British Virgin
Islands
6 June 1990
100%
100%
100%
100%
USD650
note (a)
Investment holding
Richly Reward Limited . . . . . .
British Virgin
Islands
22 December 2011
100%
100%
100%
100%
USD1
note (a)
Investment holding
Rivet Profits Limited . . . . . . .
British Virgin
Islands
8 November 2005
85%
85%
85%
85%
USD20
note (a)
Investment holding
Roseberg Resources Limited . . .
British Virgin
Islands
3 October 2005
100%
100%
100%
100%
USD1
note (a)
Investment holding
Rothwell Resources Limited
(wound up on 11 October
2012) . . . . . . . . . . . . .
British Virgin
Islands
11 June 1997
N/A
N/A
N/A
N/A
N/A
note (a)
Inactive
Rubic International Limited. . . .
British Virgin
Islands
25 January 1994
100%
100%
100%
100%
USD1
note (a)
Investment holding
Ryleston Limited . . . . . . . . .
British Virgin
Islands
26 April 1994
100%
100%
100%
100%
USD1
note (a)
Investment holding
Ryona Holdings Limited . . . . .
British Virgin
Islands
5 July 1995
100%
100%
100%
100%
USD1
note (a)
Investment holding
Saba Resources Limited. . . . . .
British Virgin
Islands
6 April 2000
100%
100%
100%
100%
USD1
note (a)
Investment holding
Sanwick Associates Limited . . .
British Virgin
Islands
2 January 1996
100%
100%
100%
100%
USD1
note (a)
Investment holding
Satiate Group Limited. . . . . . .
British Virgin
Islands
8 August 1996
100%
100%
100%
100%
USD1
note (a)
Investment holding
Sharp Bright Enterprises Limited
(wound up on 8 November
2013) . . . . . . . . . . . . .
British Virgin
Islands
28 July 2004
100%
N/A
N/A
N/A
N/A
note (a)
Inactive
Sheer Profit Enterprises Limited .
British Virgin
Islands
27 March 1997
100%
100%
100%
100%
USD1
note (a)
Investment holding
Sherio Limited. . . . . . . . . . .
British Virgin
Islands
9 July 2010
100%
100%
100%
100%
USD1
note (a)
Investment holding
Sherlock Assets Limited . . . . .
British Virgin
Islands
2 January 1996
100%
100%
100%
100%
USD1
note (a)
Investment holding
Silver Charm Limited . . . . . . .
British Virgin
Islands
18 January 1994
100%
100%
100%
100%
USD10
note (a)
Investment holding
Silver Palace International
Limited . . . . . . . . . . . .
British Virgin
Islands
18 January 2000
100%
100%
100%
100%
USD1
note (a)
Investment holding
Silverhill Holdings Limited . . . .
British Virgin
Islands
24 August 2011
100%
100%
100%
100%
USD2
note (a)
Investment holding
Sinobond Investment Limited. . .
British Virgin
Islands
4 July 2000
100%
100%
100%
100%
USD1
note (a)
Investment holding
Smartary Limited . . . . . . . . .
British Virgin
Islands
19 April 2013
N/A
100%
100%
100%
USD2
note (a)
Investment holding
Soundmax Limited . . . . . . . .
British Virgin
Islands
22 July 2003
100%
100%
100%
100%
USD1
note (a)
Investment holding
Special Cheer Investments
Limited (wound up on 22
May 2014) . . . . . . . . . .
British Virgin
Islands
5 January 1995
100%
100%
N/A
N/A
N/A
note (a)
Investment holding
Speed Mark Profits Limited . . .
British Virgin
Islands
31 March 1998
100%
100%
100%
100%
USD1
note (a)
Investment holding
Spinebill Investments Limited . .
British Virgin
Islands
26 July 1994
100%
100%
100%
100%
USD1
note (a)
Investment holding
Spotlight Investment Limited . . .
British Virgin
Islands
12 August 1996
100%
100%
100%
100%
USD1
note (a)
Investment holding
Starboard Profits Limited . . . . .
British Virgin
Islands
4 April 1996
100%
100%
100%
100%
USD1
note (a)
Investment holding
– IA-10 –
APPENDIX IA
ACCOUNTANTS’ REPORT ON THE
CHEUNG KONG PROPERTY GROUP
Equity interest attributable to the Group
(effective holding)
Name
Place of
incorporation/
establishment
Date of
incorporation/
establishment
2012
2013
2014
At the
date of
this
report
Issued and fully
paid share/
registered
capital
Place of
operation
Principal activities
Starcom Venture Limited . . . . .
British Virgin
Islands
15 March 2000
100%
100%
100%
100%
USD1
Hong Kong
Financing
Steelmill Resources Limited . . .
British Virgin
Islands
8 February 2001
100%
100%
100%
100%
USD1
note (a)
Investment holding
Stephigh Holdings Limited
(wound up on 8 November
2013) . . . . . . . . . . . . .
British Virgin
Islands
22 July 2004
100%
N/A
N/A
N/A
N/A
note (a)
Inactive
Stocklink Limited . . . . . . . . .
British Virgin
Islands
28 March 2000
80%
80%
80%
80%
USD5
Hong Kong
Investment holding and
financing
Sulham Limited . . . . . . . . . .
British Virgin
Islands
24 August 2011
100%
100%
100%
100%
USD1
note (a)
Investment holding
Sunbest International Limited
(wound up on 26 May
2014) . . . . . . . . . . . . .
British Virgin
Islands
2 January 2001
100%
100%
N/A
N/A
N/A
note (a)
Inactive
Sunway Asia Limited . . . . . . .
British Virgin
Islands
7 July 2000
100%
100%
100%
100%
USD1
note (a)
Inactive
Sunwell Resources Limited
(wound up on 1 November
2012) . . . . . . . . . . . . .
British Virgin
Islands
2 July 2004
N/A
N/A
N/A
N/A
N/A
note (a)
Inactive
Super Heaven Holdings Limited .
British Virgin
Islands
25 March 1997
100%
100%
100%
100%
USD1
note (a)
Investment holding
Superfun Limited . . . . . . . . .
British Virgin
Islands
2 June 1997
100%
100%
100%
100%
USD1
note (a)
Investment holding
Superquest Holdings Limited . . .
British Virgin
Islands
25 May 1993
100%
100%
100%
100%
USD10,000
note (a)
Investment holding
Tajo Holdings Limited . . . . . .
British Virgin
Islands
12 October 2010
100%
100%
100%
100%
USD1
note (a)
Investment holding
Talent Sun Limited . . . . . . . .
British Virgin
Islands
25 January 1994
65%
65%
65%
65%
USD100
note (a)
Investment holding
Terrier International Limited . . .
British Virgin
Islands
2 January 1998
51%
51%
51%
51%
USD100
note (a)
Investment holding
The Center (19) Limited . . . . .
British Virgin
Islands
22 September 1997
100%
100%
100%
100%
USD1
Hong Kong
Property investment
The Center (20) Limited . . . . .
British Virgin
Islands
22 September 1997
100%
100%
100%
100%
USD1
Hong Kong
Property investment
The Center (21) Limited . . . . .
British Virgin
Islands
22 September 1997
100%
100%
100%
100%
USD1
Hong Kong
Property investment
The Center (22) Limited . . . . .
British Virgin
Islands
22 September 1997
100%
100%
100%
100%
USD1
Hong Kong
Property investment
The Center (23) Limited . . . . .
British Virgin
Islands
22 September 1997
100%
100%
100%
100%
USD1
Hong Kong
Property investment
The Center (25) Limited . . . . .
British Virgin
Islands
22 September 1997
100%
100%
100%
100%
USD1
Hong Kong
Property investment
The Center (26) Limited . . . . .
British Virgin
Islands
22 September 1997
100%
100%
100%
100%
USD1
Hong Kong
Property investment
The Center (27) Limited . . . . .
British Virgin
Islands
22 September 1997
100%
100%
100%
100%
USD1
Hong Kong
Property investment
The Center (28) Limited . . . . .
British Virgin
Islands
22 September 1997
100%
100%
100%
100%
USD1
Hong Kong
Property investment
The Center (29) Limited . . . . .
British Virgin
Islands
22 September 1997
100%
100%
100%
100%
USD1
Hong Kong
Property investment
The Center (30) Limited . . . . .
British Virgin
Islands
22 September 1997
100%
100%
100%
100%
USD1
Hong Kong
Property investment
The Center (31) Limited . . . . .
British Virgin
Islands
22 September 1997
100%
100%
100%
100%
USD1
Hong Kong
Property investment
The Center (32) Limited . . . . .
British Virgin
Islands
22 September 1997
100%
100%
100%
100%
USD1
Hong Kong
Property investment
– IA-11 –
APPENDIX IA
ACCOUNTANTS’ REPORT ON THE
CHEUNG KONG PROPERTY GROUP
Equity interest attributable to the Group
(effective holding)
Name
Place of
incorporation/
establishment
Date of
incorporation/
establishment
2012
2013
2014
At the
date of
this
report
Issued and fully
paid share/
registered
capital
Place of
operation
Principal activities
The Center (33) Limited . . . . .
British Virgin
Islands
22 September 1997
100%
100%
100%
100%
USD1
Hong Kong
Property investment
The Center (35) Limited . . . . .
British Virgin
Islands
22 September 1997
100%
100%
100%
100%
USD1
Hong Kong
Property investment
The Center (36) Limited . . . . .
British Virgin
Islands
22 September 1997
100%
100%
100%
100%
USD1
Hong Kong
Property investment
The Center (37) Limited . . . . .
British Virgin
Islands
22 September 1997
100%
100%
100%
100%
USD1
Hong Kong
Property investment
The Center (38) Limited . . . . .
British Virgin
Islands
22 September 1997
100%
100%
100%
100%
USD1
Hong Kong
Property investment
The Center (39) Limited . . . . .
British Virgin
Islands
22 September 1997
100%
100%
100%
100%
USD1
Hong Kong
Property investment
The Center (42) Limited . . . . .
British Virgin
Islands
8 August 1997
100%
100%
100%
100%
USD1
Hong Kong
Property investment
The Center (43) Limited . . . . .
British Virgin
Islands
8 August 1997
100%
100%
100%
100%
USD1
Hong Kong
Property investment
The Center (45) Limited . . . . .
British Virgin
Islands
8 August 1997
100%
100%
100%
100%
USD1
Hong Kong
Property investment
The Center (46) Limited . . . . .
British Virgin
Islands
8 August 1997
100%
100%
100%
100%
USD1
Hong Kong
Property investment
The Center (47) Limited . . . . .
British Virgin
Islands
8 August 1997
100%
100%
100%
100%
USD1
Hong Kong
Property investment
The Center (48) Limited . . . . .
British Virgin
Islands
8 August 1997
100%
100%
100%
100%
USD1
Hong Kong
Property investment
The Center (49) Limited . . . . .
British Virgin
Islands
8 August 1997
100%
100%
100%
100%
USD1
Hong Kong
Property investment
The Center (50) Limited . . . . .
British Virgin
Islands
8 August 1997
100%
100%
100%
100%
USD1
Hong Kong
Property investment
The Center (51) Limited . . . . .
British Virgin
Islands
8 August 1997
100%
100%
100%
100%
USD1
Hong Kong
Property investment
The Center (52) Limited . . . . .
British Virgin
Islands
8 August 1997
100%
100%
100%
100%
USD1
Hong Kong
Property investment
The Center (53) Limited . . . . .
British Virgin
Islands
8 August 1997
100%
100%
100%
100%
USD1
Hong Kong
Property investment
The Center (55) Limited . . . . .
British Virgin
Islands
8 August 1997
100%
100%
100%
100%
USD1
Hong Kong
Property investment
The Center (56) Limited . . . . .
British Virgin
Islands
8 August 1997
100%
100%
100%
100%
USD1
Hong Kong
Property investment
The Center (57) Limited . . . . .
British Virgin
Islands
8 August 1997
100%
100%
100%
100%
USD1
Hong Kong
Property investment
The Center (58) Limited . . . . .
British Virgin
Islands
8 August 1997
100%
100%
100%
100%
USD1
Hong Kong
Property investment
The Center (59) Limited . . . . .
British Virgin
Islands
8 August 1997
100%
100%
100%
100%
USD1
Hong Kong
Property investment
The Center (61) Limited . . . . .
British Virgin
Islands
8 August 1997
100%
100%
100%
100%
USD1
Hong Kong
Property investment
The Center (62) Limited . . . . .
British Virgin
Islands
8 August 1997
100%
100%
100%
100%
USD1
Hong Kong
Property investment
The Center (63) Limited . . . . .
British Virgin
Islands
8 August 1997
100%
100%
100%
100%
USD1
Hong Kong
Property investment
The Center (65) Limited . . . . .
British Virgin
Islands
8 August 1997
100%
100%
100%
100%
USD1
Hong Kong
Property investment
The Center (66) Limited . . . . .
British Virgin
Islands
8 August 1997
100%
100%
100%
100%
USD1
Hong Kong
Property investment
The Center (67) Limited . . . . .
British Virgin
Islands
8 August 1997
100%
100%
100%
100%
USD1
Hong Kong
Property investment
The Center (68) Limited . . . . .
British Virgin
Islands
8 August 1997
100%
100%
100%
100%
USD1
Hong Kong
Property investment
– IA-12 –
APPENDIX IA
ACCOUNTANTS’ REPORT ON THE
CHEUNG KONG PROPERTY GROUP
Equity interest attributable to the Group
(effective holding)
Name
Place of
incorporation/
establishment
Date of
incorporation/
establishment
2012
2013
2014
At the
date of
this
report
Issued and fully
paid share/
registered
capital
Place of
operation
Principal activities
The Center (69) Limited . . . . .
British Virgin
Islands
8 August 1997
100%
100%
100%
100%
USD1
Hong Kong
Property investment
The Center (72) Limited . . . . .
British Virgin
Islands
8 August 1997
100%
100%
100%
100%
USD1
Hong Kong
Property investment
The Center (75) Limited . . . . .
British Virgin
Islands
8 August 1997
100%
100%
100%
100%
USD1
Hong Kong
Property investment
The Center (76) Limited . . . . .
British Virgin
Islands
8 August 1997
100%
100%
100%
100%
USD1
Hong Kong
Property investment
The Center (77) Limited . . . . .
British Virgin
Islands
8 August 1997
100%
100%
100%
100%
USD1
Hong Kong
Property investment
The Center (Car Parks) Limited .
British Virgin
Islands
8 August 1997
100%
100%
100%
100%
USD1
Hong Kong
Property investment
The Center (Display Spaces)
Limited . . . . . . . . . . . .
British Virgin
Islands
8 August 1997
100%
100%
100%
100%
USD1
Hong Kong
Property investment
The Center (Finance) Limited
(wound up on 1 November
2012) . . . . . . . . . . . . .
British Virgin
Islands
4 September 1997
N/A
N/A
N/A
N/A
N/A
note (a)
Inactive
The Center (Holdings) Limited . .
British Virgin
Islands
8 August 1997
100%
100%
100%
100%
USD1
note (a)
Investment holding
The Center 42 (No. 2) Limited . .
British Virgin
Islands
8 August 1997
100%
100%
100%
100%
USD1
Hong Kong
Property investment
The Center 78 (No. 2) Limited . .
British Virgin
Islands
30 October 1998
100%
100%
100%
100%
USD1
Hong Kong
Property investment
The Center Commercial (B.V.I.)
Limited . . . . . . . . . . . .
British Virgin
Islands
8 August 1997
100%
100%
100%
100%
USD1
Hong Kong
Property investment
The Center International Limited .
British Virgin
Islands
14 August 1997
100%
100%
100%
100%
USD10
note (a)
Investment holding
Tibon Limited . . . . . . . . . . .
British Virgin
Islands
14 August 1997
100%
100%
100%
100%
USD1
note (a)
Investment holding
Time Grow Holdings Limited. . .
British Virgin
Islands
26 October 2005
100%
100%
100%
100%
USD1
note (a)
Investment holding
Toba Investment Limited . . . . .
British Virgin
Islands
18 September 2003
100%
100%
100%
100%
USD1
note (a)
Investment holding
Top Dollar Limited . . . . . . . .
British Virgin
Islands
29 November 1995
90%
90%
90%
90%
USD1
note (a)
Investment holding
Top Fame Group Limited . . . . .
British Virgin
Islands
26 October 2010
100%
100%
100%
100%
USD1
note (a)
Inactive
Top Merit Enterprises Limited . .
British Virgin
Islands
26 October 2010
100%
100%
100%
100%
USD1
note (a)
Inactive
Topa International Limited . . . .
British Virgin
Islands
4 January 2000
100%
100%
100%
100%
USD1
note (a)
Investment holding
Torrens Global Limited . . . . . .
British Virgin
Islands
19 April 2013
N/A
100%
100%
100%
USD1
note (a)
Investment holding
Total Win Group Limited . . . . .
British Virgin
Islands
8 September 2005
100%
100%
100%
100%
USD1
note (a)
Investment holding
Total Wonder Holdings Limited .
British Virgin
Islands
11 September 2009
100%
100%
100%
100%
USD1
note (a)
Investment holding
Trade Ally Holdings Limited . . .
British Virgin
Islands
9 July 2010
100%
100%
100%
100%
USD1
note (a)
Investment holding
Treasure Well Investments
Limited . . . . . . . . . . . .
British Virgin
Islands
11 September 2009
100%
100%
100%
100%
USD1
note (a)
Investment holding
Tremendous Wealth Limited . . .
British Virgin
Islands
12 June 1992
100%
100%
100%
100%
USD1
Hong Kong
Property investment
Triumph King Limited . . . . . .
British Virgin
Islands
29 October 2010
100%
100%
100%
100%
USD1
note (a)
Investment holding
Trivictory Investments Limited
(wound up on 14 August
2014) . . . . . . . . . . . . .
British Virgin
Islands
8 July 2005
100%
100%
N/A
N/A
N/A
note (a)
Inactive
Trudeau Holdings Limited . . . .
British Virgin
Islands
16 November 1995
90%
90%
90%
90%
USD10
note (a)
Investment holding
– IA-13 –
APPENDIX IA
ACCOUNTANTS’ REPORT ON THE
CHEUNG KONG PROPERTY GROUP
Equity interest attributable to the Group
(effective holding)
Name
Place of
incorporation/
establishment
Date of
incorporation/
establishment
2012
2013
2014
At the
date of
this
report
Issued and fully
paid share/
registered
capital
Place of
operation
Principal activities
Tullieres Limited . . . . . . . . .
British Virgin
Islands
2 January 1998
100%
100%
100%
100%
USD1
note (a)
Investment holding
Ultimate Happy Limited . . . . .
British Virgin
Islands
15 September 2000
100%
100%
100%
100%
USD1
note (a)
Investment holding
Union Way Profits Limited
(wound up on 23 December
2013) . . . . . . . . . . . . .
British Virgin
Islands
1 September 2005
100%
N/A
N/A
N/A
N/A
note (a)
Investment holding
Versa International Limited . . . .
British Virgin
Islands
19 March 2002
100%
100%
100%
100%
USD1
note (a)
Investment holding
Warble Limited . . . . . . . . . .
British Virgin
Islands
2 November 1998
100%
100%
100%
100%
USD1
note (a)
Investment holding
Wateredge Enterprises Limited . .
British Virgin
Islands
11 April 2012
100%
100%
100%
100%
USD1
note (a)
Investment holding
Waygone Investments Limited . .
British Virgin
Islands
1 June 1995
100%
100%
100%
100%
USD1
note (a)
Investment holding
Wealth Finder Limited . . . . . .
British Virgin
Islands
28 September 2010
100%
100%
100%
100%
USD1
note (a)
Investment holding
Wealthman Group Limited . . . .
British Virgin
Islands
7 July 2005
100%
100%
100%
100%
USD1
note (a)
Investment holding
Wei Po Profits Limited . . . . . .
British Virgin
Islands
8 February 2000
100%
100%
100%
100%
USD1
note (a)
Investment holding
Well Support Investments
Limited . . . . . . . . . . . .
British Virgin
Islands
8 August 2005
100%
100%
100%
100%
USD1
note (a)
Investment holding
Wholesome Global Limited . . . .
British Virgin
Islands
24 January 2013
N/A
100%
100%
100%
USD2
note (a)
Investment holding
Wideplex Limited . . . . . . . . .
British Virgin
Islands
2 July 1999
60%
60%
60%
60%
USD5
note (a)
Investment holding
Wincom Investment Limited
(wound up on 25 November
2014) . . . . . . . . . . . . .
British Virgin
Islands
18 September 2003
100%
100%
N/A
N/A
N/A
note (a)
Investment holding
Winfolk International Limited . .
British Virgin
Islands
4 July 1996
100%
100%
100%
100%
USD1
note (a)
Investment holding
Wingco Investment Limited
(wound up on 25 November
2014) . . . . . . . . . . . . .
British Virgin
Islands
19 March 2002
100%
100%
N/A
N/A
N/A
note (a)
Investment holding
Wintop Investment Limited . . . .
British Virgin
Islands
16 July 1996
100%
100%
100%
100%
USD1
note (a)
Investment holding
Wisdom Ally Limited . . . . . . .
British Virgin
Islands
10 March 2011
100%
100%
100%
100%
USD1
note (a)
Investment holding
Wit Profits Limited . . . . . . . .
British Virgin
Islands
2 January 2003
85%
85%
85%
85%
USD100
Hong Kong
Investment holding and
financing
Wogan Holdings Limited . . . . .
British Virgin
Islands
13 June 1995
100%
100%
100%
100%
USD1
note (a)
Investment holding
World Trump Ltd. . . . . . . . . .
British Virgin
Islands
8 January 1999
100%
100%
100%
100%
USD1
note (a)
Investment holding
Wychwood Development
Limited . . . . . . . . . . . .
British Virgin
Islands
16 April 2012
100%
100%
100%
100%
USD2
note (a)
Investment holding
Wyre Development Limited. . . .
British Virgin
Islands
23 January 2013
N/A
100%
100%
100%
USD1
note (a)
Investment holding
Maenhout Investment N.V. . . . .
Curacao
23 November 1995
100%
100%
100%
100%
USD6,000
U.S. Assets Limited . . . . . . . .
Delaware, U.S.A.
22 April 1983
100%
100%
100%
100%
Ordinary share
USD1,000
Preference share
USD2,504
note (a)
Investment holding
U.S.A.
Property development
U.S. Assets (Texas) Ltd, Inc. . . .
Delaware, U.S.A.
29 December 1999
100%
100%
100%
100%
USD20
U.S.A.
Property development
1881 Heritage Hotel Management
Limited . . . . . . . . . . . .
Hong Kong
12 March 2008
100%
100%
100%
100%
HK$1
Hong Kong
Hotel management
8 Degrees Resources Limited . . .
Hong Kong
8 September 2008
100%
100%
100%
100%
HK$1
Hong Kong
Provision of staff
recruitment services
Agrila Limited. . . . . . . . . . .
Hong Kong
14 August 1987
100%
100%
100%
100%
HK$2
Hong Kong
Property development
Albany Investment Limited . . . .
Hong Kong
23 October 2013
N/A
100%
100%
100%
HK$1
note (a)
Inactive
Alcon Investments Limited . . . .
Hong Kong
21 March 2011
100%
100%
100%
100%
HK$1
Hong Kong
Property development
– IA-14 –
APPENDIX IA
ACCOUNTANTS’ REPORT ON THE
CHEUNG KONG PROPERTY GROUP
Equity interest attributable to the Group
(effective holding)
Name
Place of
incorporation/
establishment
Date of
incorporation/
establishment
2012
2013
2014
At the
date of
this
report
Issued and fully
paid share/
registered
capital
Allex Development Limited . . .
Hong Kong
28 November 1996
100%
100%
100%
100%
HK$2
Alliance Talent Limited (wound
up on 3 January 2014) . . . .
Hong Kong
17 February 2011
100%
100%
N/A
N/A
N/A
Allied Way International
Development Limited . . . .
Hong Kong
1 December 2006
100%
100%
100%
100%
Place of
operation
Principal activities
Hong Kong
Agricultural land
note (a)
Inactive
HK$1
Hong Kong
Agricultural land
Ansett Limited. . . . . . . . . . .
Hong Kong
3 December 1997
100%
100%
100%
100%
HK$2
Hong Kong
Agricultural land
Arenal Limited . . . . . . . . . .
Hong Kong
20 September 1994
100%
100%
100%
100%
HK$2
Hong Kong
Financing
Art Champion Investment
Limited . . . . . . . . . . . .
Hong Kong
23 August 2012
100%
100%
100%
100%
HK$1
note (a)
Inactive
Art Rich Investment Limited . . .
Hong Kong
16 July 2005
100%
100%
100%
100%
HK$1
Hong Kong
Agricultural land
Art State Limited . . . . . . . . .
Hong Kong
30 March 2006
100%
100%
100%
100%
HK$1
Hong Kong
Property holding
Asia Pacific International
Enterprises Limited . . . . .
Hong Kong
11 November 2005
100%
100%
100%
100%
HK$1
Hong Kong
Provision of consultancy
services
Asia-Tele-Venture Company
Limited . . . . . . . . . . . .
Hong Kong
26 October 2005
100%
100%
100%
100%
HK$1
Hong Kong
Project management
Asian Treasure Investments
Limited (deregistered on 10
January 2014) . . . . . . . .
Hong Kong
18 February 2011
100%
100%
N/A
N/A
N/A
note (a)
Inactive
Azalea Enterprises Limited . . . .
Hong Kong
18 July 2012
100%
100%
100%
100%
HK$1
note (a)
Investment holding
Bayshore Property Management
Limited . . . . . . . . . . . .
Hong Kong
14 October 1993
100%
100%
100%
100%
HK$2
Hong Kong
Property management
Beauty Gold Enterprises Limited .
Hong Kong
27 January 2004
100%
100%
100%
100%
HK$2
note (a)
Inactive
Bermington Investment Limited .
Hong Kong
22 November 2000
100%
100%
100%
100%
HK$2
Hong Kong
Hotel and serviced suite
operation
Best Finder Investment Limited .
Hong Kong
20 July 2011
100%
100%
100%
100%
HK$1
note (a)
Inactive
Best World Construction Limited .
Hong Kong
24 April 2002
100%
100%
100%
100%
HK$2
Hong Kong
Building contractor
Bestford International Enterprises
Limited . . . . . . . . . . . .
Hong Kong
17 January 2008
100%
100%
100%
100%
HK$1
note (a)
Inactive
Big Sky Resources Limited . . . .
Hong Kong
29 November 2002
100%
100%
100%
100%
HK$2
Hong Kong
Provision of consultancy
services
Biro Investment Limited . . . . .
Hong Kong
3 May 1983
100%
100%
100%
100%
HK$100,000
Hong Kong
Property development
Bonder Way Investment Limited .
Hong Kong
6 November 1998
100%
100%
100%
100%
HK$2
Hong Kong
Property development
Bradford Investments Limited . .
Hong Kong
4 July 2007
80%
80%
80%
80%
HK$1
Hong Kong
Property development
Bright Sign Services Limited . . .
Hong Kong
11 April 1997
100%
100%
100%
100%
HK$2
Hong Kong
Property management
Bristow Investments Limited . . .
Hong Kong
17 November 2009
100%
100%
100%
100%
HK$1
Hong Kong
Property development
Capital Star Development
Limited . . . . . . . . . . . .
Hong Kong
8 January 2001
100%
100%
100%
100%
HK$2
Hong Kong
Agricultural land
Carlford Investments Limited. . .
Hong Kong
23 December 2010
100%
100%
100%
100%
HK$1
Hong Kong
Property development
Casanova Investments Limited . .
Hong Kong
28 January 2013
N/A
100%
100%
100%
HK$1
note (a)
Inactive
Casson Investments Limited
(deregistered on 10 January
2014) . . . . . . . . . . . . .
Hong Kong
3 June 2011
100%
100%
N/A
N/A
N/A
note (a)
Inactive
Champful Limited . . . . . . . . .
Hong Kong
7 April 1995
100%
100%
100%
100%
HK$100
Hong Kong
Financing
Charm City Investments Limited .
Hong Kong
4 May 2012
100%
100%
100%
100%
HK$1
note (a)
Inactive
Cheer Good Limited . . . . . . .
Hong Kong
1 June 2009
100%
100%
100%
100%
HK$1
Hong Kong
Property development
Cheung Kong Advertising
Company Limited . . . . . .
Hong Kong
7 March 1980
100%
100%
100%
100%
HK$200
Hong Kong
Advertising
Cheung Kong Center Property
Management Limited. . . . .
Hong Kong
13 May 1998
100%
100%
100%
100%
HK$2
Hong Kong
Property management
Cheung Kong China Property
Limited . . . . . . . . . . . .
Hong Kong
25 November 1993
100%
100%
100%
100%
HK$2
note (a)
Investment holding
Cheung Kong Development
Company Limited . . . . . .
Hong Kong
3 January 1973
100%
100%
100%
100%
HK$20
note (a)
Investment holding
Cheung Kong E&M Engineering
Limited . . . . . . . . . . .
Hong Kong
26 January 2000
100%
100%
100%
100%
HK$2
Hong Kong
Provision of consultancy
services
Cheung Kong Property
Development Limited . . . .
Hong Kong
11 November 1980
100%
100%
100%
100%
HK$2
Hong Kong
Project management
– IA-15 –
APPENDIX IA
ACCOUNTANTS’ REPORT ON THE
CHEUNG KONG PROPERTY GROUP
Equity interest attributable to the Group
(effective holding)
Name
Place of
incorporation/
establishment
Date of
incorporation/
establishment
2012
2013
2014
At the
date of
this
report
Issued and fully
paid share/
registered
capital
Place of
operation
Principal activities
Cheung Kong Property
Management Limited. . . . .
Hong Kong
3 May 1974
100%
100%
100%
100%
HK$10,000
note (a)
Investment holding
Cheung Kong Real Estate
Agency Limited . . . . . . .
Hong Kong
23 July 1997
100%
100%
100%
100%
HK$2
Hong Kong
Provision of real estate
agency and related
services
China Linkway Technology
Limited . . . . . . . . . . . .
Hong Kong
3 May 2005
100%
100%
100%
100%
HK$1
Hong Kong
Property investment
China Sheen (Hong Kong)
Limited . . . . . . . . . . . .
Hong Kong
1 August 2005
100%
100%
100%
100%
HK$1
Hong Kong
Property investment
City Champion Investments
Limited . . . . . . . . . . . .
Hong Kong
14 November 2011
100%
100%
100%
100%
HK$1
note (a)
Inactive
City Investments Limited . . . . .
Hong Kong
26 November 2004
100%
100%
100%
Citybase Property Management
Limited . . . . . . . . . . . .
Hong Kong
11 June 1985
100%
100%
100%
100%
HK$1
Hong Kong
Property development
100%
HK$100,000
Hong Kong
Property management
Citypoint Investment Limited. . .
Hong Kong
4 August 2011
100%
100%
100%
100%
HK$1
Hong Kong
Property development
Citytruth Property Management
Limited . . . . . . . . . . . .
Hong Kong
23 May 1995
100%
100%
100%
100%
HK$2
Hong Kong
Property management
CK Construction Management
Limited . . . . . . . . . . . .
Hong Kong
21 May 2002
100%
100%
100%
100%
HK$2
Hong Kong
Construction
management
Concordia Property Management
Limited . . . . . . . . . . . .
Hong Kong
23 September 1993
100%
100%
100%
100%
HK$2
Hong Kong
Property management
Conford Investments Limited . . .
Hong Kong
21 September 2012
100%
100%
100%
100%
HK$1
Hong Kong
Property development
Crown Gain Investments Limited.
Hong Kong
3 June 2011
100%
100%
100%
100%
HK$1
note (a)
Inactive
Crown Treasure Investments
Limited . . . . . . . . . . . .
Hong Kong
29 February 2012
100%
100%
100%
100%
HK$1
Hong Kong
Property development
Crystal Mark Enterprises
Limited . . . . . . . . . . . .
Hong Kong
11 April 2011
100%
100%
100%
100%
HK$1
Hong Kong
Property holding
Deerhill Bay Management
Limited . . . . . . . . . . . .
Hong Kong
24 October 1997
100%
100%
100%
100%
HK$2
Hong Kong
Property management
Delight World Limited . . . . . .
Hong Kong
16 November 1993
100%
100%
100%
100%
HK$2
Hong Kong
Agricultural land
Diamond Jubilee Investment
Limited . . . . . . . . . . . .
Hong Kong
30 April 2004
100%
100%
100%
100%
HK$1
Hong Kong
Property development
East City Investments Limited . .
Hong Kong
5 January 2006
100%
100%
100%
100%
HK$1
Hong Kong
Property development
East King Investments Limited . .
Hong Kong
8 May 2002
100%
100%
100%
100%
HK$2
Hong Kong
Agricultural land
East Leader Investments Limited .
Hong Kong
25 September 2002
100%
100%
100%
100%
HK$2
Elite Property Advisors Limited
(deregistered on 14 February
2014) . . . . . . . . . . . . .
Hong Kong
19 February 2001
100%
100%
N/A
N/A
N/A
E-Park Parking Management
Limited . . . . . . . . . . . .
Hong Kong
15 June 1998
100%
100%
100%
100%
Excellent Star Limited . . . . . .
Hong Kong
30 August 2006
100%
100%
100%
Express Time Limited. . . . . . .
Hong Kong
16 November 1993
100%
100%
100%
Express Way Resources Limited .
Hong Kong
6 February 2002
100%
100%
Fair Chance Enterprises Limited .
Hong Kong
24 March 2003
100%
Fantastic State Limited . . . . . .
Hong Kong
2 August 2000
100%
Flying Snow Limited . . . . . . .
Hong Kong
29 November 2002
100%
100%
100%
100%
HK$2
Hong Kong
Property investment
Foo Chung Realty Limited . . . .
Hong Kong
4 July 1972
100%
100%
100%
100%
HK$10,000
Hong Kong
Property holding
Foo Yik Estate Company
Limited . . . . . . . . . . . .
Hong Kong
6 April 1973
100%
100%
100%
100%
HK$70,000
Hong Kong
Project management
Galaxy Power Investment
Limited . . . . . . . . . . . .
Hong Kong
26 May 1999
100%
100%
100%
100%
HK$2
Hong Kong
Agricultural land
Garbo Field Limited . . . . . . .
Hong Kong
12 July 1994
100%
100%
100%
100%
HK$2
Hong Kong
Property development
Garrison Security Services
Limited (deregistered on 2
July 2014) . . . . . . . . . .
Hong Kong
18 October 2000
100%
100%
N/A
N/A
N/A
Hong Kong
Provision of security
services
Global Coin Limited . . . . . . .
Hong Kong
26 March 1997
100%
100%
100%
100%
HK$2
Hong Kong
Property investment
Glorient Investments Limited . . .
Hong Kong
19 March 2004
100%
100%
100%
100%
HK$1
Hong Kong
Property holding
Go Rise Investments Limited . . .
Hong Kong
31 August 2005
100%
100%
100%
100%
HK$1
Hong Kong
Property investment
Hong Kong
Agricultural land
note (a)
Inactive
HK$2
Hong Kong
Carpark management
100%
HK$1
Hong Kong
Property holding
100%
HK$2
Hong Kong
Agricultural Land
100%
100%
HK$2
Hong Kong
Property investment
100%
100%
100%
HK$2
note (a)
Inactive
100%
100%
100%
HK$2
Hong Kong
Property development
– IA-16 –
APPENDIX IA
ACCOUNTANTS’ REPORT ON THE
CHEUNG KONG PROPERTY GROUP
Equity interest attributable to the Group
(effective holding)
Name
Place of
incorporation/
establishment
Date of
incorporation/
establishment
2012
2013
2014
At the
date of
this
report
Issued and fully
paid share/
registered
capital
Goldwin Property Management
Limited . . . . . . . . . . . .
Hong Kong
8 September 1972
100%
100%
100%
100%
HK$10,000
Good Rich Investments Limited
(deregistered on 21 June
2013) . . . . . . . . . . . . .
Hong Kong
19 February 2008
100%
N/A
N/A
N/A
N/A
Goodwell-Fortune Property
Services Limited . . . . . . .
Hong Kong
28 March 2003
100%
100%
100%
100%
Goodwell Property Management
Limited . . . . . . . . . . . .
Hong Kong
9 June 1981
100%
100%
100%
Goodwell-Prosperity Property
Services Limited . . . . . . .
Hong Kong
19 August 2005
100%
100%
Grand Elegant Investment
Limited . . . . . . . . . . . .
Hong Kong
26 April 2004
100%
Grandon Investment Limited . . .
Hong Kong
15 April 2005
Grandwood Investments Limited .
Hong Kong
25 July 2008
Granlai Company Limited . . . .
Hong Kong
Grayhill Estates Limited
(deregistered on 30 January
2015) . . . . . . . . . . . . .
Hong Kong
Place of
operation
Principal activities
Hong Kong
Property management
note (a)
Inactive
HK$2
Hong Kong
Property management
100%
HK$100,000
Hong Kong
Property management
100%
100%
HK$1
Hong Kong
Property management
100%
100%
100%
HK$1
note (a)
Inactive
100%
100%
100%
100%
HK$1
Hong Kong
Property investment
100%
100%
100%
100%
HK$1
Hong Kong
Property development
10 May 1985
54.05%
54.05%
54.05%
54.05%
HK$37
Hong Kong
Property investment
12 September 1980
100%
100%
100%
N/A
N/A
Hong Kong
Property trading
Great Art Investment Limited. . .
Hong Kong
1 April 2011
100%
100%
100%
100%
HK$1
Hong Kong
Property development
Great Rainbow Investments
Limited . . . . . . . . . . . .
Hong Kong
28 February 2014
N/A
N/A
100%
100%
HK$1
note (a)
Inactive
Harbour Grand (H.K.) Resources
Limited . . . . . . . . . . . .
Hong Kong
14 August 2008
100%
100%
100%
100%
HK$1
Hong Kong
Provision of staff
recruitment services
Harbour Grand Hong Kong
Limited . . . . . . . . . . . .
Hong Kong
19 September 1996
100%
100%
100%
100%
HK$2
Hong Kong
Hotel and serviced suite
operation
Harbour Plaza 8 Degrees
Limited . . . . . . . . . . . .
Hong Kong
19 December 2003
100%
100%
100%
100%
HK$2
Hong Kong
Hotel and serviced suite
operation
Harbour Plaza North Point
Resources Limited . . . . . .
Hong Kong
26 April 1999
60.91%
60.91%
60.91%
60.91%
HK$2
Hong Kong
Provision of staff
recruitment services
Harbour Plaza Resort City (H.K.)
Resources Limited . . . . . .
Hong Kong
26 April 1999
100%
100%
100%
100%
HK$2
Hong Kong
Provision of staff
recruitment services
Harbourfront Landmark
Management Limited. . . . .
Hong Kong
12 April 2000
100%
100%
100%
100%
HK$2
Hong Kong
Property management
Harvey International Limited . . .
Hong Kong
17 January 2008
100%
100%
100%
100%
HK$1
Hong Kong
Agricultural land
Haynes Estates Limited . . . . . .
Hong Kong
12 September 1980
100%
100%
100%
100%
HK$2
Hong Kong
Property holding
Hilder Company Limited . . . . .
Hong Kong
16 May 1975
100%
100%
100%
100%
HK$10,000
Hong Kong
Agricultural land
Horizon Hotels & Suites Limited.
Hong Kong
20 February 2002
100%
100%
100%
100%
HK$2
Hong Kong
Hotel management
Horse Saddle Interior Design
Limited (deregistered on 21
June 2013) . . . . . . . . . .
Hong Kong
26 January 2010
100%
N/A
N/A
N/A
N/A
note (a)
Inactive
Huge Grace Enterprises Limited .
Hong Kong
2 September 2006
100%
100%
100%
100%
HK$400,000,000
Hong Kong
Financing and provision
of consultancy
services
Jabrin Limited . . . . . . . . . . .
Hong Kong
3 March 1978
80%
80%
80%
80%
HK$10,000
Hong Kong
Agricultural land
Jet Well Investments Limited . . .
Hong Kong
28 October 1993
100%
100%
100%
100%
HK$2
Hong Kong
Agricultural land
Jetkind Limited . . . . . . . . . .
Hong Kong
26 March 1997
100%
100%
100%
100%
HK$2
Hong Kong
Agricultural land
Jetmark Limited . . . . . . . . . .
Hong Kong
9 January 2004
100%
100%
100%
100%
HK$2
Hong Kong
Property holding
Jubilant Plant Nursery Limited . .
Hong Kong
28 July 2000
100%
100%
100%
100%
HK$2
Hong Kong
Provision of gardening
services
Jubilee Year Investments Limited.
Hong Kong
16 May 2012
100%
100%
100%
100%
HK$1
Hong Kong
Property development
Jurado Limited . . . . . . . . . .
Hong Kong
11 March 1980
100%
100%
100%
100%
HK$10,000
Hong Kong
Agricultural land
Kamos Limited . . . . . . . . . .
Hong Kong
10 November 1987
100%
100%
100%
100%
HK$2
Hong Kong
Property development
and trading
Kaway Limited . . . . . . . . . .
Hong Kong
5 June 1998
100%
100%
100%
100%
HK$2
Hong Kong
Agricultural land
Kenstar Investments Limited . . .
Hong Kong
22 April 2005
100%
100%
100%
100%
HK$1
Hong Kong
Agricultural land
Kimpton Investments Limited . .
Hong Kong
14 October 2005
100%
100%
100%
100%
HK$1
Hong Kong
Agricultural land
– IA-17 –
APPENDIX IA
ACCOUNTANTS’ REPORT ON THE
CHEUNG KONG PROPERTY GROUP
Equity interest attributable to the Group
(effective holding)
Name
Place of
incorporation/
establishment
King Century Investments
Limited . . . . . . . . . . . .
Hong Kong
Kingsford Investments Limited . .
Kingsmark Investments Limited .
Kong Wah Investment Limited . .
Date of
incorporation/
establishment
2012
2013
2014
At the
date of
this
report
Issued and fully
paid share/
registered
capital
Place of
operation
Principal activities
3 June 2011
100%
100%
100%
100%
HK$1
Hong Kong
Property development
Hong Kong
15 July 2002
100%
100%
100%
100%
HK$2
Hong Kong
Agricultural land
Hong Kong
23 October 2006
100%
100%
100%
100%
HK$1
Hong Kong
Property investment
Hong Kong
22 September 2004
100%
100%
100%
100%
HK$1
Hong Kong
Agricultural land
Korn Reach Investment Limited .
Hong Kong
2 February 2005
100%
100%
100%
100%
HK$1
Hong Kong
Property investment
Laguna City Property
Management Limited. . . . .
Hong Kong
29 December 1989
100%
100%
100%
100%
HK$2
Hong Kong
Property management
Laguna Verde Property
Management Limited. . . . .
Hong Kong
24 September 1996
100%
100%
100%
100%
HK$2
Hong Kong
Property management
Lead All Investments Limited . .
Hong Kong
28 July 2005
100%
100%
100%
100%
HK$1
Hong Kong
Property investment
Lifestyle Plus Limited. . . . . . .
Hong Kong
3 September 1992
100%
100%
100%
100%
HK$2
Hong Kong
Provision of lifestyle
plus services
Lion Focus Investments Limited .
Hong Kong
20 October 2005
100%
100%
100%
100%
HK$1
Hong Kong
Property investment
Mansford Enterprises Limited . .
Hong Kong
1 March 2006
100%
100%
100%
100%
HK$1
Hong Kong
Design and promotion
Mantex Services Limited . . . . .
Hong Kong
17 May 1994
100%
100%
100%
100%
HK$2
Hong Kong
Property management
Maranta Estates Limited . . . . .
Hong Kong
13 January 1981
100%
100%
100%
100%
HK$2
Hong Kong
Property trading
Master Logistics Limited
(deregistered on 2 May
2014) . . . . . . . . . . . . .
Hong Kong
9 August 2005
100%
100%
N/A
N/A
N/A
note (a)
Inactive
Match Power Investment
Limited . . . . . . . . . . . .
Hong Kong
11 February 1998
100%
100%
100%
100%
HK$2
Hong Kong
Property development
Maxchief Limited . . . . . . . . .
Hong Kong
21 August 1998
100%
100%
100%
100%
HK$2
Hong Kong
Agricultural land
Mdvista Limited. . . . . . . . . .
Hong Kong
20 March 2000
100%
100%
100%
100%
HK$2
note (a)
Inactive
Meko Limited . . . . . . . . . . .
Hong Kong
10 September 2004
100%
100%
100%
100%
HK$1
Hong Kong
Agricultural land
Melbourne Vision Limited . . . .
Hong Kong
14 November 2014
N/A
N/A
100%
100%
HK$1
note (a)
Inactive
Metrofond Limited . . . . . . . .
Hong Kong
18 April 1997
100%
100%
100%
100%
HK$2
Hong Kong
Property development
Mightycity Company Limited. . .
Hong Kong
26 October 1979
98.47%
98.47%
98.47%
98.47%
A Shares
HK$11,510,500
B Shares
HK$490,000
Hong Kong
Investment holding and
financing
Milo Top Development Limited .
Hong Kong
25 August 1999
100%
100%
100%
100%
HK$2
note (a)
Inactive
Montaco Limited . . . . . . . . .
Hong Kong
12 October 1993
100%
100%
100%
100%
HK$100
Hong Kong
Property holding
Monte Vista Management
Limited . . . . . . . . . . . .
Hong Kong
3 March 1999
100%
100%
100%
100%
HK$2
Hong Kong
Property management
Mutual Luck Investment Limited .
Hong Kong
29 July 1977
60.04%
60.04%
60.04%
60.04%
HK$30,000
Hong Kong
Property development
New Accord Limited . . . . . . .
Hong Kong
7 October 2005
100%
100%
100%
100%
HK$1
Hong Kong
Property development
New City Investments Limited . .
Hong Kong
21 March 2006
100%
100%
100%
100%
HK$1
Hong Kong
Property development
New Harbour Investments
Limited . . . . . . . . . . . .
Hong Kong
17 June 2008
100%
100%
100%
100%
HK$1
Hong Kong
Property development
New Harmony Limited . . . . . .
Hong Kong
19 April 2007
100%
100%
100%
100%
HK$1
Hong Kong
Property investment
New Profit Resources Limited . .
Hong Kong
24 April 2002
98.47%
98.47%
98.47%
98.47%
HK$2
Hong Kong
Property development
New Solomon Investments
Limited (deregistered on 17
January 2014) . . . . . . . .
Hong Kong
5 May 2011
100%
100%
N/A
N/A
N/A
note (a)
Inactive
New Vision Development
Limited . . . . . . . . . . . .
Hong Kong
30 September 2004
100%
100%
100%
100%
HK$1
Hong Kong
Property development
Newton City Limited . . . . . . .
Hong Kong
26 March 1996
100%
100%
100%
100%
HK$2
note (a)
Investment holding
Ocean Century Investments
Limited . . . . . . . . . . . .
Hong Kong
6 May 2011
100%
100%
100%
100%
HK$1
Hong Kong
Property development
Oxford Investments Limited . . .
Hong Kong
20 March 2002
100%
100%
100%
100%
HK$2
Hong Kong
Property development
Pacific Land International
Limited . . . . . . . . . . . .
Hong Kong
4 July 2007
100%
100%
100%
100%
HK$1
Hong Kong
Provision of consultancy
services
Pacific Top Development
Limited . . . . . . . . . . . .
Hong Kong
29 April 1998
100%
100%
100%
100%
HK$2
Hong Kong
Agricultural land
Pako Wise Limited . . . . . . . .
Hong Kong
16 October 1990
100%
100%
100%
100%
HK$2
Hong Kong
Property investment
Pearl Wisdom Limited . . . . . .
Hong Kong
10 October 1996
100%
100%
100%
100%
HK$2
Hong Kong
Hotel and serviced suite
operation
– IA-18 –
APPENDIX IA
ACCOUNTANTS’ REPORT ON THE
CHEUNG KONG PROPERTY GROUP
Equity interest attributable to the Group
(effective holding)
Name
Place of
incorporation/
establishment
Date of
incorporation/
establishment
2012
2013
Perfect Idea Limited . . . . . . .
Hong Kong
4 February 1993
100%
100%
Petman Limited . . . . . . . . . .
Hong Kong
5 August 1960
100%
100%
Polin Limited . . . . . . . . . . .
Hong Kong
13 June 2001
100%
100%
2014
100%
At the
date of
this
report
Issued and fully
paid share/
registered
capital
100%
HK$20
100%
100%
HK$6,450,570
100%
100%
HK$2
Place of
operation
Hong Kong
Principal activities
Property investment and
development
note (a)
Inactive
Hong Kong
Property holding
Portofino Management Limited . .
Hong Kong
22 March 2000
100%
100%
100%
100%
HK$2
Hong Kong
Property management
Prompton Property Management
Limited . . . . . . . . . . . .
Hong Kong
22 January 1991
100%
100%
100%
100%
HK$2
Hong Kong
Property management
Queensway Investments Limited .
Hong Kong
17 June 2008
85%
85%
85%
85%
HK$1
Hong Kong
Property development
Rainbow Elite Investments
Limited . . . . . . . . . . . .
Hong Kong
22 February 2005
100%
100%
100%
100%
HK$1
Hong Kong
Property development
Randash Investment Limited . . .
Hong Kong
22 September 1992
60.91%
60.91%
60.91%
60.91%
HK$110
Hong Kong
Hotel and serviced suite
operation
Regent Land Investments
Limited . . . . . . . . . . . .
Hong Kong
15 June 2009
100%
100%
100%
100%
HK$1
Hong Kong
Property development
Resort Clubs Limited . . . . . . .
Hong Kong
5 September 1995
100%
100%
100%
100%
HK$2
Hong Kong
Provision of club house
management services
Rich Asia Investments Limited . .
Hong Kong
2 June 2005
85%
85%
85%
85%
HK$1,000,000
Rich Group Investments Limited
(deregistered on 20
December 2013) . . . . . . .
Hong Kong
3 June 2011
100%
N/A
N/A
N/A
N/A
Rich Hill Investments Limited . .
Hong Kong
14 November 2011
100%
100%
100%
100%
HK$1
Hong Kong
Agricultural land
Rich View Investment Limited . .
Hong Kong
29 February 2012
100%
100%
100%
100%
HK$1
note (a)
Inactive
Rich Will Investment Limited
(deregistered on 20
December 2013) . . . . . . .
Hong Kong
19 May 2011
100%
N/A
N/A
N/A
N/A
note (a)
Inactive
Ruby Star Enterprises Limited . .
Hong Kong
19 December 2006
100%
100%
100%
100%
HK$1
Hong Kong
Property development
Sai Ling Realty Limited . . . . .
Hong Kong
16 March 1973
100%
100%
100%
100%
HK$10,000
Hong Kong
Property development
Sarin Limited . . . . . . . . . . .
Hong Kong
13 April 1995
100%
100%
100%
100%
HK$2
Hong Kong
Agricultural land
Sceneway Property Management
Limited . . . . . . . . . . . .
Hong Kong
12 December 1989
100%
100%
100%
100%
HK$2
Hong Kong
Property management
Serwell Property Management
Limited (deregistered on 6
February 2015) . . . . . . . .
Hong Kong
26 February 1996
100%
100%
100%
N/A
N/A
Hong Kong
Property management
Silver King Investments Limited .
Hong Kong
4 August 2011
100%
100%
100%
100%
HK$1
note (a)
Inactive
Silver Treasure Investment
Limited . . . . . . . . . . . .
Hong Kong
22 July 2010
100%
100%
100%
100%
HK$1
note (a)
Inactive
Sino China Enterprises Limited. .
Hong Kong
4 April 2001
100%
100%
100%
100%
HK$2
Hong Kong
Hotel and serviced suite
operation
Smart Fine Development
Limited . . . . . . . . . . . .
Hong Kong
22 July 2006
100%
100%
100%
100%
HK$1
note (a)
Investment holding
Hong Kong
Property development
note (a)
Inactive
Splendid Well Limited . . . . . .
Hong Kong
24 October 1986
75%
75%
75%
75%
HK$20
Hong Kong
Agricultural plans
Sprado Company Limited . . . . .
Hong Kong
18 March 1983
100%
100%
100%
100%
HK$28
Hong Kong
Property trading and
letting
Springrun Limited . . . . . . . . .
Hong Kong
7 December 1993
100%
100%
100%
100%
HK$37,297,504
Hong Kong
Property development
Stanley Investments Limited . . .
Hong Kong
23 October 2006
100%
100%
100%
100%
HK$1
Hong Kong
Property development
Sunfex Limited . . . . . . . . . .
Hong Kong
26 March 1997
100%
100%
100%
100%
HK$2
Hong Kong
Agricultural land
Superb Gain Investments Limited
(deregistered on 22 March
2013) . . . . . . . . . . . . .
Hong Kong
10 November 2006
100%
N/A
N/A
N/A
N/A
note (a)
Inactive
Swiss Investments Limited . . . .
Hong Kong
18 March 2013
N/A
100%
100%
100%
HK$1
Hong Kong
Property development
Tenox Development Limited . . .
Hong Kong
22 October 1997
100%
100%
100%
100%
HK$2
Hong Kong
Agricultural land
The Apex Horizon Property
Management Limited. . . . .
Hong Kong
18 June 2001
100%
100%
100%
100%
HK$2
Hong Kong
Property management
The Center (Leasing Agent)
Limited . . . . . . . . . . . .
Hong Kong
30 September 1998
100%
100%
100%
100%
HK$2
Hong Kong
Provision of property
leasing agency
services
The Lucky Dragon Development
(H.K.) Limited . . . . . . . .
Hong Kong
10 May 1985
100%
100%
100%
100%
HK$2
Hong Kong
Property development
– IA-19 –
APPENDIX IA
ACCOUNTANTS’ REPORT ON THE
CHEUNG KONG PROPERTY GROUP
Equity interest attributable to the Group
(effective holding)
Name
The Paramount Management
Limited . . . . . . . . . . . .
Place of
incorporation/
establishment
Date of
incorporation/
establishment
2012
2013
100%
100%
2014
100%
At the
date of
this
report
100%
Issued and fully
paid share/
registered
capital
HK$2
Place of
operation
Hong Kong
Principal activities
Hong Kong
26 January 1998
Property management
Thomson Investments Limited . .
Hong Kong
14 March 2003
100%
100%
100%
100%
HK$2
Hong Kong
Agricultural land
Thorogood Estates Limited . . . .
Hong Kong
27 July 1979
100%
100%
100%
100%
HK$2
Hong Kong
Property trading and
investment
Tin Shui Wai Development
Limited (disposed of on 9
October 2013) . . . . . . . .
Hong Kong
26 June 1979
98.47%
N/A
N/A
N/A
N/A
Hong Kong
Property development,
property investment
and hotel operations
Tony Investments Limited . . . .
Hong Kong
15 April 2004
100%
100%
100%
100%
HK$1
Hong Kong
Property development
Top Sign Enterprises Limited . . .
Hong Kong
27 November 2007
100%
100%
100%
100%
HK$1
Hong Kong
Agricultural land
Top Success Resources Limited .
Hong Kong
19 December 2006
100%
100%
100%
100%
HK$1
note (a)
Inactive
Top Talent International Limited .
Hong Kong
6 September 2004
100%
100%
100%
100%
HK$1
note (a)
Inactive
Topview Development Limited
(deregistered on 19
September2014) . . . . . . .
Hong Kong
17 June 2011
100%
100%
N/A
N/A
N/A
note (a)
Inactive
Towerich Limited . . . . . . . . .
Hong Kong
17 December 1997
51%
51%
51%
51%
HK$2
Hong Kong
Hotel and serviced suite
operation
Treasure King Investment
Limited . . . . . . . . . . . .
Hong Kong
3 May 2013
N/A
100%
100%
100%
HK$1
note (a)
Inactive
Union Art Investment Limited . .
Hong Kong
30 March 2005
100%
100%
100%
100%
HK$1
Hong Kong
Property development
Union Ford Investments Limited .
Hong Kong
25 September 2002
80%
80%
80%
80%
HK$2
Hong Kong
Property development
Union Land Investments Limited .
Hong Kong
4 April 2001
100%
100%
100%
100%
HK$2
Hong Kong
Agricultural land
United Land Investments
Limited . . . . . . . . . . . .
Hong Kong
21 August 2000
100%
100%
100%
100%
HK$2
Hong Kong
Agricultural land
University Heights Management
Company Limited . . . . . .
Hong Kong
18 October 1994
100%
100%
100%
100%
HK$1,000
Hong Kong
Property management
Vista Paradiso Property
Management Limited. . . . .
Hong Kong
19 February 1997
100%
100%
100%
100%
HK$2
Hong Kong
Property management
Volly Best Investment Limited . .
Hong Kong
22 September 2004
90%
90%
90%
90%
HK$1
Hong Kong
Property development
and investment
Wealth Pine Investment Limited .
Hong Kong
21 September 2007
85%
85%
85%
85%
HK$1
Hong Kong
Property development
Wide Global Investment Limited .
Hong Kong
24 March 2003
100%
100%
100%
100%
HK$2
Hong Kong
Property development
Wilson Investments Limited . . .
Hong Kong
18 January 2013
N/A
100%
100%
100%
HK$1
Winchesto Finance Company
Limited . . . . . . . . . . . .
Hong Kong
4 May 1979
100%
100%
100%
100%
HK$15,000,000
Winning Top Limited . . . . . . .
Hong Kong
9 December 2006
100%
100%
100%
100%
Wisdom Choice Investment
Limited . . . . . . . . . . . .
Hong Kong
12 July 1999
60%
60%
60%
60%
Worldchamp Investments
Limited . . . . . . . . . . . .
Hong Kong
9 June 2004
100%
100%
100%
Yick Ho Limited . . . . . . . . .
Hong Kong
25 April 1969
100%
100%
Japura Pte Ltd . . . . . . . . . . .
Singapore
8 July 1996
76%
Japura Development Pte Ltd . . .
Singapore
21 March 1997
76%
Luxury Green Development Pte.
Ltd. . . . . . . . . . . . . . .
Singapore
4 December 2009
Property Enterprises
Development (Singapore)
Pte. Ltd. . . . . . . . . . . .
Singapore
7 July 2001
note (a)
Inactive
Hong Kong
Financing
HK$1
note (a)
Inactive
HK$2
Hong Kong
Property development
100%
HK$1
Hong Kong
Agricultural land
100%
100%
HK$6,000,000
Hong Kong
Investment in hotel
projects
76%
76%
76%
SGD100
note (a)
Investment holding
76%
76%
76%
SGD1,000,000
Singapore
Property development
100%
100%
100%
100%
SGD1,000,000
Singapore
Property development
100%
100%
100%
100%
SGD100,000
Singapore
Provision of corporate
services
U.S. Assets Management, Inc. . .
Texas, U.S.A.
5 July 1990
100%
100%
100%
100%
USD1,000
U.S.A.
Property management
Arra Development S.A. . . . . . .
The Republic of
Panama
21 September 1987
100%
100%
100%
100%
USD2
note (a)
Investment holding
Dobie Development S.A. . . . . .
The Republic of
Panama
29 May 1985
100%
100%
100%
100%
USD2
note (a)
Investment holding
Wooco Investment S.A. . . . . . .
The Republic of
Panama
21 September 1987
100%
100%
100%
100%
USD2
note (a)
Investment holding
上海信衛物業管理有限公司 . . . . . . .
The People’s
Republic of China
(the “PRC”)
3 November 2011
100%
100%
100%
100%
USD100,000
The PRC
Property management
– IA-20 –
APPENDIX IA
ACCOUNTANTS’ REPORT ON THE
CHEUNG KONG PROPERTY GROUP
Equity interest attributable to the Group
(effective holding)
Place of
incorporation/
establishment
Name
Date of
incorporation/
establishment
2012
2013
2014
At the
date of
this
report
Issued and fully
paid share/
registered
capital
Place of
operation
Principal activities
北京信衛物業管理有限公司 . . . . . . .
The PRC
3 February 2008
100%
100%
100%
100%
USD500,000
The PRC
Property management
北京寶苑房地產開發有限公司 . . . . . .
The PRC
6 January 1993
100%
100%
100%
100%
USD29,000,000
The PRC
Property development
北京港基世紀物業管理有限公司 . . . . .
The PRC
28 April 2002
99.5%
99.5%
99.5%
99.5%
USD400,000
The PRC
Property management
北京長樂房地產開發有限公司 . . . . . .
The PRC
6 January 1993
100%
100%
100%
100%
USD29,000,000
The PRC
Property development
北京高衛世紀物業管理有限公司 . . . . .
The PRC
28 April 2002
99.5%
99.5%
99.5%
99.5%
USD400,000
The PRC
Property management
廣州長江實業企業管理有限公司 . . . . .
The PRC
19 May 2008
100%
100%
100%
100%
USD2,200,000
The PRC
Provision of consultancy
services
廣州高衛物業管理有限公司 . . . . . . .
The PRC
29 March 2005
100%
100%
100%
100%
RMB3,000,000
The PRC
Property management
成都長天有限公司 . . . . . . . . . . .
The PRC
18 June 1998
70%
69%
69%
69%
RMB98,000,000
The PRC
Hotel operation
長江實業(上海)企業管理有限公司. . . .
The PRC
20 May 2008
100%
100%
100%
100%
HK$40,000,000
The PRC
Provision of consultancy
services
瀋陽麗都物業有限公司 (wound up on
The PRC
20 December 2001
100%
N/A
N/A
N/A
N/A
note (a)
Inactive
11 March 2013) . . . . . . .
Notes:
(a)
The company is inactive or has not carried on any operation except for acting as an investment holding company.
(b)
N/A: not applicable
The financial year end of the Company and the companies comprising Cheung Kong Property
Group is 31 December.
No audited statutory financial statements have been prepared for companies incorporated in
Arizona, U.S.A., the British Virgin Islands, Curacao, Delaware, U.S.A., the Republic of Panama and
Texas, U.S.A., where part 16 of the Hong Kong Companies Ordinance (Cap 622) is not applicable,
since their respective dates of incorporation as there is no statutory audit requirement in the jurisdiction
where they were incorporated.
No audited statutory financial statements have been prepared for Albany Investment Limited,
Great Rainbow Investments Limited and Melbourne Vision Limited as they have not reached the
statutory time limit imposed on the issuance of the first set of audited financial statements since their
respective date of incorporation.
The statutory financial statements of companies incorporated in the Hong Kong Special
Administrative Region for the years ended 31 December 2012, 2013 and 2014, or since their respective
dates of incorporation, where this is a shorter period, were prepared in accordance with Hong Kong
Financial Reporting Standards (“HKFRSs”) issued by the Hong Kong Institute of Certified Public
Accountants (the “HKICPA”) and were audited by PricewaterhouseCoopers in accordance with Hong
Kong Standards of Auditing issued by the HKICPA.
– IA-21 –
APPENDIX IA
ACCOUNTANTS’ REPORT ON THE
CHEUNG KONG PROPERTY GROUP
The statutory financial statements of companies established in the PRC for the Relevant Periods
or since respective date of establishment, where there is a shorter period, were prepared in accordance
with the relevant accounting policies and financial regulations applicable to enterprises established in
the PRC. They were audited by the following firms of certified public accountants registered in the
PRC.
Name of company
長江實業
(上海)
企業管理有限公司 .
廣州長江實業企業管理有限公司 . . .
成都長天有限公司 . . . . . . . . . . . .
北京港基世紀物業管理有限公司 . . .
北京高衛世紀物業管理有限公司 . . .
北京長樂房地產開發有限公司 . . . .
北京寶苑房地產開發有限公司 . . . .
北京信衛物業管理有限公司 . . . . . .
上海信衛物業管理有限公司 . . . . . .
廣州高衛物業管理有限公司 . . . . . .
Period covered
For the years ended 31
December 2012 and
2013
For the years ended 31
December 2012 and
2013
For the year ended 31
December 2012
For the years ended 31
December 2013 and
2014
For the years ended 31
December 2012 and
2013
For the years ended 31
December 2012 and
2013
For the years ended 31
December 2012 and
2013
For the years ended 31
December 2012 and
2013
For the year ended 31
December 2012
For the year ended 31
December 2013
For the years ended 31
December 2012 and
2013
For the year ended 31
December 2012
For the year ended 31
December 2013
Name of auditors
上海琳方會計師事務所有限公司
廣州嶺南會計師事務所有限公司
信永中和會計師事務所(特殊普通合
伙)
四川安必信會計師事務所有限責任公
司
北京中永眾合會計師事務所有限責任
公司
北京中永眾合會計師事務所有限責任
公司
北京今創會計師事務所(普通合伙)
北京今創會計師事務所(普通合伙)
北京中恒會計師事務所有限責任公司
北京安瑞普會計師事務所有限公司
上海琳方會計師事務所有限公司
廣州正粵會計師事務所(普通合伙)
廣州市大公會計師事務所有限公司
The statutory financial statements of companies incorporated in Singapore for the years ended 31
December 2012, 2013 and 2014 were prepared in accordance with the provisions of the Singapore
Companies Act and the Singapore Financial Reporting Standards. They were audited by
PricewaterhouseCoopers LLP in accordance with Singapore Standards on Auditing.
– IA-22 –
APPENDIX IA
ACCOUNTANTS’ REPORT ON THE
CHEUNG KONG PROPERTY GROUP
The audited statutory financial statements of certain companies have not been issued for the year
ended 31 December 2014 as the statutory time limits imposed on the issuance of audited financial
statements have not been reached.
For the purpose of this report, CKH has prepared the combined financial statements of the Cheung
Kong Property Group for the Relevant Periods in accordance with the HKFRSs (the “Cheung Kong
Property Group Underlying Financial Statements”) which were audited by PricewaterhouseCoopers in
accordance with Hong Kong Standards on Auditing issued by the HKICPA. We examined the Cheung
Kong Property Group Underlying Financial Statements for the Relevant Periods in accordance with
Auditing Guideline 3.340 “Prospectuses and the Reporting Accountant” as recommended by the
HKICPA.
The Cheung Kong Property Group Financial Information set out in this report has been prepared
from the Cheung Kong Property Group Underlying Financial Statements, on the basis set out in note
1(b) to Section II below. No adjustments were deemed necessary to adjust the Cheung Kong Property
Group Underlying Financial Statements in preparing our report for inclusion in the Listing Document.
The Cheung Kong Property Group Underlying Financial Statements are the responsibility of the
directors of CKH who approve their issuance. The directors of the Company are responsible for the
contents of the Listing Document in which this report is included. It is our responsibility to compile the
Cheung Kong Property Group Financial Information set out in this report from the Cheung Kong
Property Group Underlying Financial Statements, to form an independent opinion on the Cheung Kong
Property Group Financial Information and to report our opinion to you.
In our opinion, on the basis of preparation set out in note 1(b) to Section II below, the Cheung
Kong Property Group Financial Information, gives, for the purpose of this report, a true and fair view
of the state of affairs of the Cheung Kong Property Group as at 31 December 2012, 2013 and 2014 and
of the combined profits and combined cash flows of the Cheung Kong Property Group for each of the
three years ended 31 December 2012, 2013 and 2014.
– IA-23 –
APPENDIX IA
I.
ACCOUNTANTS’ REPORT ON THE
CHEUNG KONG PROPERTY GROUP
FINANCIAL INFORMATION OF THE GROUP
COMBINED INCOME STATEMENTS
Year ended 31 December
Notes
2012
2013
2014
HK$ million
HK$ million
HK$ million
19,192
94
17,011
95
24,038
784
..
..
..
(9,848)
(971)
(542)
(650)
(313)
(127)
(12,451)
5,480
4,470
–
(8,011)
(836)
(556)
(776)
(301)
(132)
(10,612)
4,031
1,782
2,760
(12,985)
(892)
(525)
(815)
(286)
(106)
(15,609)
2,835
4,542
–
..
..
1,077
450
–
798
–
2,349
Operating profit . . . . . . . . . . . . . . . . . . . . . . . .
Share of net profit of associates . . . . . . . . . . . . .
18,312
1
15,865
1
18,939
1
18,313
(1,250)
15,866
(1,442)
18,940
(1,624)
Profit for the year . . . . . . . . . . . . . . . . . . . . . . .
17,063
14,424
17,316
Profit attributable to
Shareholders of the Cheung Kong Property
Group . . . . . . . . . . . . . . . . . . . . . . . . . . . . . .
Non-controlling interests . . . . . . . . . . . . . . . .
16,930
133
14,152
272
17,068
248
17,063
14,424
17,316
N/A
N/A
N/A
Group turnover . . . . . . . . . . . . . .
Investment and other income . . . .
Operating costs
Property and related costs . . . .
Service fees . . . . . . . . . . . . . .
Salaries and related expenses . .
Interest and other finance costs.
Depreciation . . . . . . . . . . . . . .
Other expenses . . . . . . . . . . . .
...........
...........
.
.
.
.
.
.
.
.
.
.
.
.
.
.
.
.
.
.
.
.
.
.
.
.
.
.
.
.
.
.
.
.
.
.
.
.
.
.
.
.
.
.
.
.
.
.
.
.
.
.
.
.
.
.
Share of net profit of joint ventures . . . . . . . .
Increase in fair value of investment properties
Profit on disposal of investment properties . . .
Surplus on loss of control of interest in
subsidiaries . . . . . . . . . . . . . . . . . . . . . . . .
Profit on disposal of joint ventures. . . . . . . . .
.
.
.
.
.
.
.
.
.
.
.
.
Profit before taxation . . . . . . . . . . . . . . . . . . . .
Taxation . . . . . . . . . . . . . . . . . . . . . . . . . . . . . .
Earnings per share . . . . . . . . . . . . . . . . . . . . . .
– IA-24 –
3
4
5
6
7
APPENDIX IA
ACCOUNTANTS’ REPORT ON THE
CHEUNG KONG PROPERTY GROUP
COMBINED STATEMENTS OF COMPREHENSIVE INCOME
Year ended 31 December
2012
2013
2014
HK$ million
HK$ million
HK$ million
17,063
14,424
17,316
..
41
15
..
(145)
–
Profit for the year . . . . . . . . . . . . . . . . . . . . . . . . . . . . .
Other comprehensive income/(expense) – reclassifiable
profit or loss
Translation of financial statements of operations
outside Hong Kong
Exchange gain/(loss). . . . . . . . . . . . . . . . . . . . . .
Exchange gain reclassified to profit or loss upon
disposal . . . . . . . . . . . . . . . . . . . . . . . . . . . . .
Investments available for sale
Gain/(loss) in fair value . . . . . . . . . . . . . . . . . . .
Share of other comprehensive income/(expense) of
joint ventures . . . . . . . . . . . . . . . . . . . . . . . . . . .
to
–
..
1,598
..
953
829
(1,631)
Other comprehensive income/(expense). . . . . . . . . . . . . .
2,447
783
(1,343)
Total comprehensive income for the year . . . . . . . . . . . .
19,510
15,207
15,973
Total comprehensive income attributable to
Shareholders of the Cheung Kong Property Group . . . .
Non-controlling interests . . . . . . . . . . . . . . . . . . . . . .
19,377
133
14,930
277
15,726
247
19,510
15,207
15,973
– IA-25 –
(61)
(147)
435
APPENDIX IA
ACCOUNTANTS’ REPORT ON THE
CHEUNG KONG PROPERTY GROUP
COMBINED STATEMENTS OF FINANCIAL POSITION
As at 31 December
Notes
Non-current assets
Fixed assets . . . . . . . . . . . . .
Investment properties . . . . . . .
Associates . . . . . . . . . . . . . . .
Joint ventures . . . . . . . . . . . .
Investments available for sale .
Long term loan receivables . .
.
.
.
.
.
.
.
.
.
.
.
.
.
.
.
.
.
.
.
.
.
.
.
.
.
.
.
.
.
.
.
.
.
.
.
.
.
.
.
.
.
.
.
.
.
.
.
.
.
.
.
.
.
.
.
.
.
.
.
.
Current assets
Stock of properties . . . . . . . . . . . . . . . . . .
Debtors, deposits and prepayments . . . . . . .
Amounts due from Other Group Companies.
Bank balances and deposits . . . . . . . . . . . .
Current liabilities
Creditors and accruals . . . . . . . . . . . . . .
Amounts due to Other Group Companies.
Borrowings . . . . . . . . . . . . . . . . . . . . . .
Derivative financial instruments . . . . . . .
Provision for taxation . . . . . . . . . . . . . .
.
.
.
.
.
.
.
.
.
.
.
.
.
.
.
.
.
.
.
.
.
.
.
.
.
.
.
.
.
.
.
.
.
.
.
.
.
.
.
.
8
9
10
11
12
13
14
15
14
16
2012
2013
2014
HK$ million
HK$ million
HK$ million
10,093
29,656
3
46,069
5,345
251
9,942
28,777
3
45,306
5,468
138
9,928
33,285
2
45,895
7,172
301
91,417
89,634
96,583
80,116
1,557
1,906
12,896
79,815
1,831
975
10,069
73,259
1,810
1,210
10,354
96,475
92,690
86,633
(12,099)
(91,903)
(300)
(518)
(275)
(10,973)
(79,891)
–
–
(730)
(10,493)
(70,707)
(250)
–
(1,346)
(105,095)
(91,594)
(82,796)
Net current (liabilities)/assets. . . . . . . . . . . . . . .
(8,620)
1,096
3,837
Total assets less current liabilities . . . . . . . . . . .
82,797
90,730
100,420
Non-current liabilities
Borrowings . . . . . . . . . . . . . . . . . . . . . . . . . .
Deferred tax liabilities . . . . . . . . . . . . . . . . . .
16
17
(315)
(805)
(610)
(966)
(350)
(999)
(1,120)
(1,576)
(1,349)
81,677
89,154
99,071
93
78,519
93
86,002
93
96,161
Shareholders’ funds . . . . . . . . . . . . . . . . . . . .
Non-controlling interests . . . . . . . . . . . . . . . .
78,612
3,065
86,095
3,059
96,254
2,817
Total equity . . . . . . . . . . . . . . . . . . . . . . . . . . .
81,677
89,154
99,071
Net assets. . . . . . . . . . . . . . . . . . . . . . . . . . . . .
Representing:
Combined capital. . . . . . . . . . . . . . . . . . . . . .
Reserves . . . . . . . . . . . . . . . . . . . . . . . . . . . .
– IA-26 –
26
APPENDIX IA
ACCOUNTANTS’ REPORT ON THE
CHEUNG KONG PROPERTY GROUP
COMBINED STATEMENTS OF CHANGES IN EQUITY
Shareholders’ funds
Combined
capital
Investment
valuation
reserve
Exchange
reserve
Retained
profits
Noncontrolling
interests
Total
Total equity
HK$ million HK$ million HK$ million HK$ million HK$ million HK$ million HK$ million
Balance at 1 January
2012 . . . . . . . . . . . . . .
Profit for the year . . . . . .
Other comprehensive
income/(expense)
Translation of financial
statements of
operations outside
Hong Kong
Exchange gain . . . . .
Exchange gain
reclassified to
profit or loss upon
disposal. . . . . . . . .
Investments available
for sale
Gain in fair value . . .
Share of other
comprehensive
income of joint
ventures . . . . . . . . . .
Total comprehensive
income for the year . . .
Change in non-controlling
interests . . . . . . . . . . . .
Dividend paid to
non-controlling
interests . . . . . . . . . . . .
Dividend paid to
shareholders of the
Cheung Kong Property
Group . . . . . . . . . . . . .
Balance at 31 December
2012 . . . . . . . . . . . . . .
93
(145)
4,544
54,984
59,476
3,112
62,588
–
–
–
16,930
16,930
133
17,063
–
–
41
–
41
–
41
–
–
(145)
–
(145)
–
(145)
–
1,598
–
–
1,598
–
1,598
–
663
290
–
953
–
953
–
2,261
186
16,930
19,377
133
19,510
–
–
–
–
–
(130)
(130)
–
–
–
–
–
(50)
(50)
–
–
–
–
(241)
93
2,116
4,730
– IA-27 –
(241)
71,673
(241)
78,612
3,065
81,677
APPENDIX IA
ACCOUNTANTS’ REPORT ON THE
CHEUNG KONG PROPERTY GROUP
Shareholders’ funds
Combined
capital
Investment
valuation
reserve
Exchange
reserve
Retained
profits
Noncontrolling
interests
Total
Total equity
HK$ million HK$ million HK$ million HK$ million HK$ million HK$ million HK$ million
Balance at 1 January
2013 . . . . . . . . . . . . . .
Profit for the year . . . . . .
Other comprehensive
income/(expense)
Translation of financial
statements of
operations outside
Hong Kong
Exchange gain . . . . .
Investments available
for sale
Loss in fair value . . .
Share of other
comprehensive
(expense)/income of
joint ventures . . . . . .
Total comprehensive
(expense)/income for
the year . . . . . . . . . . . .
Change in non-controlling
interests . . . . . . . . . . . .
Dividend paid to
non-controlling
interests . . . . . . . . . . . .
Dividend paid to
shareholders of the
Cheung Kong Property
Group . . . . . . . . . . . . .
Balance at 31 December
2013 . . . . . . . . . . . . . .
93
2,116
4,730
71,673
78,612
3,065
81,677
–
–
–
14,152
14,152
272
14,424
–
–
10
–
10
5
15
–
(61)
–
–
(61)
–
(61)
–
(156)
985
–
829
–
829
–
(217)
995
14,152
14,930
277
15,207
–
–
–
–
–
(202)
(202)
–
–
–
–
–
(81)
(81)
–
–
–
93
1,899
5,725
– IA-28 –
(7,447)
(7,447)
78,378
86,095
–
3,059
(7,447)
89,154
APPENDIX IA
ACCOUNTANTS’ REPORT ON THE
CHEUNG KONG PROPERTY GROUP
Shareholders’ funds
Combined
capital
Investment
valuation
reserve
Exchange
reserve
Retained
profits
Noncontrolling
interests
Total
Total equity
HK$ million HK$ million HK$ million HK$ million HK$ million HK$ million HK$ million
Balance at 1 January
2014 . . . . . . . . . . . . . .
Profit for the year . . . . . .
Other comprehensive
income/(expense)
Translation of financial
statements of
operations outside
Hong Kong
Exchange loss . . . . . .
Investments available
for sale
Gain in fair value . . .
Share of other
comprehensive
expense of joint
ventures . . . . . . . . . .
Total comprehensive
income/(expense) for
the year . . . . . . . . . . . .
Change in non-controlling
interests . . . . . . . . . . . .
Dividend paid to
non-controlling
interests . . . . . . . . . . . .
Dividend paid to
shareholders of the
Cheung Kong Property
Group . . . . . . . . . . . . .
Balance at 31 December
2014 . . . . . . . . . . . . . .
93
1,899
5,725
78,378
86,095
3,059
89,154
–
–
–
17,068
17,068
248
17,316
–
–
–
435
–
(297)
(1,334)
–
–
138
(1,480)
17,068
15,726
–
–
–
–
–
(195)
(195)
–
–
–
–
–
(294)
(294)
–
–
–
93
2,037
4,245
(146)
–
– IA-29 –
–
(146)
(1)
(147)
–
435
–
435
(1,631)
(5,567)
(5,567)
89,879
96,254
–
247
–
2,817
(1,631)
15,973
(5,567)
99,071
APPENDIX IA
ACCOUNTANTS’ REPORT ON THE
CHEUNG KONG PROPERTY GROUP
COMBINED STATEMENTS OF CASH FLOWS
Year ended 31 December
Notes
Operating activities
Cash (used in)/generated from operations . . .
Investment in/loan advance to joint ventures .
Dividend/repayment from joint ventures . . . .
Dividend from associates . . . . . . . . . . . . . . .
Dividend from investments in securities . . . .
Interest received . . . . . . . . . . . . . . . . . . . . .
Dividend paid to shareholders of the Cheung
Kong Property Group . . . . . . . . . . . . . . . .
Dividend paid to non-controlling interests . . .
Profits tax paid . . . . . . . . . . . . . . . . . . . . . .
2014
HK$ million
7,041
(605)
5,428
1
188
70
16,500
(3,124)
1,159
2
209
62
.
.
.
(241)
(50)
(2,076)
(7,447)
(81)
(826)
(5,567)
(294)
(975)
Net cash (used in)/from operating activities . . . .
(3,402)
3,769
7,972
1,065
(233)
1,862
503
(75)
(21)
–
(80)
–
(122)
199
1,560
–
(6)
5,427
(155)
–
(85)
–
3,298
–
(18)
–
(278)
3,021
6,903
2,917
.
.
.
.
.
.
.
.
(a)
2013
HK$ million
(259)
(1,867)
878
1
165
47
Investing activities
Loss of control of interest in subsidiaries . .
Investment in/loan advance to joint ventures
Dividend/repayment from joint ventures . . .
Disposal of joint ventures. . . . . . . . . . . . . .
Purchase of investments available for sale . .
Addition of investment properties . . . . . . . .
Disposal of investment properties . . . . . . . .
Addition of fixed assets . . . . . . . . . . . . . . .
.
.
.
.
.
.
2012
HK$ million
.
.
.
.
.
.
.
.
Net cash from investing activities . . . . . . . . . .
Financing activities
Drawdown of borrowings . . . . . . . . . . . . .
Repayment of borrowings. . . . . . . . . . . . .
Advance from/(repayment to) Other Group
Companies . . . . . . . . . . . . . . . . . . . . . .
Decrease in funding from non-controlling
interests. . . . . . . . . . . . . . . . . . . . . . . .
Interest and other finance costs paid . . . . .
...
...
100
(414)
–
(5)
–
(10)
...
5,475
(12,012)
(9,184)
...
...
(130)
(1,110)
(202)
(1,280)
(195)
(1,215)
Net cash from/(used in) financing activities . . . .
3,921
(13,499)
(10,604)
Net increase/(decrease) in cash and cash
equivalents . . . . . . . . . . . . . . . . . . . . . . . . . .
3,540
(2,827)
Cash and cash equivalents at 1 January . . . . . . .
9,356
12,896
10,069
12,896
10,069
10,354
Cash and cash equivalents at 31 December . . . . .
– IA-30 –
(b)
285
APPENDIX IA
ACCOUNTANTS’ REPORT ON THE
CHEUNG KONG PROPERTY GROUP
Notes:
(a)
Cash (used in)/generated from operations
Year ended 31 December
Profit before taxation. . . . . . . . . . . . . . . . . . . . . . .
Interest income . . . . . . . . . . . . . . . . . . . . . . . . . .
Interest and other finance costs . . . . . . . . . . . . . . . .
Dividend income from investments in securities . . . . . . .
Share of net profit of joint ventures . . . . . . . . . . . . . .
Share of net profit of associates . . . . . . . . . . . . . . . .
Increase in fair value of investment properties . . . . . . . .
Gain on disposal of investments available for sale . . . . . .
Profit on disposal of investment properties . . . . . . . . . .
Surplus on loss of control of interest in subsidiaries . . . . .
Profit on disposal of joint ventures . . . . . . . . . . . . . . .
(Increase)/decrease in long term loan receivables . . . . . . .
Depreciation . . . . . . . . . . . . . . . . . . . . . . . . . . . .
Exchange difference and other items . . . . . . . . . . . . . .
Changes in working capital
(Increase)/decrease in stock of properties . . . . . . . . . .
Increase/(decrease) in customers’ deposits received . . . .
(Increase)/decrease in debtors, deposits and prepayments .
(Increase)/decrease in amounts due from Other Group
Companies . . . . . . . . . . . . . . . . . . . . . . . . . .
Increase/(decrease) in derivative financial instruments . .
Increase/(decrease) in creditors and accruals . . . . . . . .
(b)
.
.
.
.
.
.
.
.
.
.
.
.
.
.
.
.
.
.
.
.
.
.
.
.
.
.
.
.
2012
2013
2014
HK$ million
HK$ million
HK$ million
.
.
.
.
.
.
.
.
.
.
.
.
.
.
18,313
(54)
650
(206)
(5,480)
(1)
(4,470)
–
–
(1,077)
(450)
(72)
313
(86)
15,866
(80)
776
(283)
(4,031)
(1)
(1,782)
–
(2,760)
–
(798)
113
301
(85)
18,940
(75)
815
(361)
(2,835)
(1)
(4,542)
(137)
–
–
(2,349)
(163)
286
(71)
. . .
. . .
. . .
(10,715)
3,318
(788)
846
184
(276)
6,976
(1,154)
773
. . .
. . .
. . .
(102)
355
293
931
(518)
(1,362)
(235)
–
633
(259)
7,041
16,500
Cash and cash equivalents
As at 31 December
Bank balances and deposits . . . . . . . . . . . . . . . . . . . . . .
– IA-31 –
2012
2013
2014
HK$ million
HK$ million
HK$ million
12,896
10,069
10,354
APPENDIX IA
ACCOUNTANTS’ REPORT ON THE
CHEUNG KONG PROPERTY GROUP
II.
NOTES TO THE FINANCIAL INFORMATION
1.
BACKGROUND AND BASIS OF PREPARATION
(a)
Background
The Company was incorporated in the Cayman Islands on 2 January 2015 as an exempted company with limited
liability under the Companies Law of the Cayman Islands. The principal place of business of the Company is 7th Floor,
Cheung Kong Center, 2 Queen’s Road Central, Hong Kong. The Company is currently a wholly owned subsidiary of CK
Hutchison Holdings Limited, an exempted company incorporated in the Cayman Islands with limited liability, and whose
shares are listed on the Main Board of The Stock Exchange of Hong Kong Limited.
(b)
Basis of preparation
Pursuant to the Proposed Reorganisation, the Company will become the holding company of the Cheung Kong
Property Group.
The Cheung Kong Property Group Financial Information including the combined income statements, combined
statements of comprehensive income, combined statements of changes in equity and combined statements of cash flows of
the Group for the Relevant Periods and the combined statements of financial position on the respective reporting dates has
been prepared as if the companies comprising the Cheung Kong Property Group had been a single reporting entity
throughout the Relevant Periods, or since the respective dates of incorporation or establishment of the relevant entities, or
up to the respective dates of disposal, deregistration, dissolution or winding-up where this is a shorter period.
The Cheung Kong Property Group Financial Information is presented in Hong Kong dollar which is the functional
currency of the major companies comprising the Cheung Kong Property Group.
2.
PRINCIPAL ACCOUNTING POLICIES
Application of International Financial Reporting Standards (“IFRSs”)
For the following IFRSs which are not yet effective, the management of the Cheung Kong Property Group is in the
process of assessing their impact on the Group’s combined results and financial position.
Effective for the Cheung Kong Property Group’s annual accounting periods beginning on 1 January 2015
Amendments to IFRSs
Amendments to IFRSs
IAS 19 (amendments)
Annual Improvements 2010 – 2012 Cycle
Annual Improvements 2011 – 2013 Cycle
Defined Benefit Plans – Employee Contributions
Effective for the Cheung Kong Property Group’s annual accounting periods beginning on 1 January 2016
Amendments to IFRSs
Amendments to IAS 1
IAS 16 and IAS 38 (amendments)
IAS 16 and IAS 41 (amendments)
IAS 27 (amendments)
IFRS 10 and IAS 28 (amendments)
IFRS 11 (amendments)
IFRS 14
IFRS 10 and IFRS 12 and IAS 28
(amendments)
Annual Improvements 2012 – 2014 Cycle
Disclosure Initiative
Clarification of Acceptable Methods of Depreciation and Amortisation
Agriculture: Bearer Plants
Equity Method in Separate Financial Statements
Sale or Contribution of Assets between an Investor and its Associate or
Joint Venture
Accounting for Acquisitions of Interests in Joint Operations
Regulatory Deferral Accounts
Investment Entities: Applying the Consolidation Exception
Effective for the Cheung Kong Property Group’s annual accounting periods beginning on 1 January 2017
IFRS 15
Revenue from Contracts with Customers
Effective for the Cheung Kong Property Group’s annual accounting periods beginning on 1 January 2018
IFRS 9
Financial Instruments
– IA-32 –
APPENDIX IA
ACCOUNTANTS’ REPORT ON THE
CHEUNG KONG PROPERTY GROUP
The Cheung Kong Property Group Financial Information has been prepared in accordance with accounting policies
conform with IFRSs. In addition, the Cheung Kong Property Group Financial Information includes applicable disclosures
required by the Rules Governing the Listing of Securities on The Stock Exchange of Hong Kong Limited and by the Hong
Kong Companies Ordinance. The Cheung Kong Property Group Financial Information is prepared under the historical cost
convention except that investments in securities, investment properties and derivative financial instruments, as set out in
notes 2(d), 2(f) and 2(j) respectively, are stated at fair values.
(a)
Combination of the group
The Cheung Kong Property Group Financial Information incorporates the financial statement items of the
subsidiaries of CKH which are engaged in the property business.
A subsidiary is an entity which after considering the relevant facts, the reporting entity has (i) power over the
entity; (ii) exposure, or rights, to variable returns from involvement with the entity; and (iii) ability to use power over the
entity to affect the amount of return.
The results and assets and liabilities of the combining entities or businesses are combined using the existing book
values from the perspective of CKH.
The profit or loss includes the results of each of the combining entities or businesses from the earliest date
presented or since the date when combining entities or businesses first came under control of CKH, where this is a shorter
period.
The comparative amounts in the Cheung Kong Property Group Financial Information are presented as if the entities
or businesses had been combined at the earliest date of statement of financial position presented or when they first came
under control of CKH, whichever is the later.
Inter-company transactions, balances and unrealised gains on transactions within the Cheung Kong Property Group
are eliminated. Unrealised losses are also eliminated unless the transaction provides evidence of an impairment of the asset
transferred. Accounting policies and financial information of subsidiaries have been changed where necessary to ensure
consistency with the policies adopted by the Cheung Kong Property Group.
(b)
Joint ventures
A joint venture is an entity in which the Cheung Kong Property Group have a long term equity interest and of
which the Cheung Kong Property Group share joint control with other parties under contractual arrangements on decisions
that significantly affect the return.
Investments in joint ventures are carried at cost plus the Cheung Kong Property Group’s share of their
post-acquisition results less dividends received and provision for impairment.
Results of joint ventures are incorporated in the Cheung Kong Property Group Financial Information to the extent
of the Cheung Kong Property Group’s share of their total comprehensive income based on their financial statements made
up to 31 December and after adjusting, where necessary, to ensure consistency with the Cheung Kong Property Group’s
accounting policies.
(c)
Associates
An associate is an entity, other than a subsidiary or a joint venture, in which the Cheung Kong Property Group have
a long term equity interest and significant influence over its management.
Investments in associates are carried at cost plus the Cheung Kong Property Group’s share of their post-acquisition
results less dividends received and provision for impairment.
Results of associates are incorporated in the Cheung Kong Property Group Financial Information to the extent of
the Cheung Kong Property Group’s share of their total comprehensive income based on their financial statements made up
to 31 December and after adjusting, where necessary, to ensure consistency with the Cheung Kong Property Group’s
accounting policies.
(d)
Investments in securities
Investments in securities, other than subsidiaries, joint ventures or associates, are classified as investments available
for sale, and are stated at fair value. Changes in fair value of investments available for sale are recognised in other
comprehensive income and reclassified to profit or loss upon disposal.
– IA-33 –
APPENDIX IA
ACCOUNTANTS’ REPORT ON THE
CHEUNG KONG PROPERTY GROUP
Investments available for sale are reviewed for impairment when there are significant or prolonged declines in fair
value of equity securities below costs and impairment, if any, is charged to combined income statement and is not
reversible.
Purchase and sale of investments in securities are accounted for on a trade date basis.
(e)
Fixed assets
Fixed assets are stated at cost less depreciation and provision for impairment.
For hotel and serviced suite properties, leasehold land is amortised over the remaining term of the lease on a
straight-line basis and buildings are depreciated over the shorter of 50 years or the remaining term of the lease of the
underlying leasehold land. Other fixed assets are depreciated on a straight-line basis at annual rates of 5% to 33 1/3%
based on their respective estimated useful lives.
(f)
Investment properties
Investment properties, which are held for rental, are stated at fair value. Investment properties under development
are stated at fair value when their fair values become reliably determinable or upon completion of their construction,
whichever is the earlier, otherwise at cost less provision for impairment. Changes in fair value are included in combined
income statement.
(g)
Loan receivables
Loan receivables are non-derivative financial assets with fixed or determinable payments. Loan receivables are
recognised initially at fair value and subsequently carried at amortised cost using the effective interest method less
provision for impairment.
(h)
Stock of properties
Stock of properties are stated at the lower of cost and net realisable value. Net realisable value is determined with
reference to sale proceeds received after year end date less selling expenses, or by management estimates based on
prevailing market conditions.
Costs of properties include acquisition costs, development expenditure, interest and other direct costs attributable to
the properties. The carrying values of properties held by the Cheung Kong Property Group are adjusted in the Cheung
Kong Property Group Financial Information to reflect the Cheung Kong Property Group’s actual costs incurred where
appropriate.
(i)
Debtors
Debtors are recognised initially at fair value and subsequently carried at amortised cost using the effective interest
method less provision for impairment.
(j)
Derivative financial instruments
Derivative financial instruments are used for investment and financial purposes and are stated at fair value.
(k)
Borrowings
Borrowings are recognised initially at fair value and subsequently carried at amortised cost using the effective
interest method.
(l)
Creditors
Creditors are recognised initially at fair value and subsequently carried at amortised cost using the effective interest
method.
(m)
Revenue recognition
When properties under development are sold, income is recognised when the property development is completed
with the relevant occupation permit issued by the relevant authorities and the significant risks and rewards of the
properties are passed to the purchasers. Payments received from purchasers prior to this stage are accounted for as
customers’ deposits received.
– IA-34 –
APPENDIX IA
ACCOUNTANTS’ REPORT ON THE
CHEUNG KONG PROPERTY GROUP
Rental income is recognised on a straight-line basis over the term of the lease. Income from property and project
management is recognised when services are rendered. Revenue from hotel and serviced suite operation is recognised upon
provision of services. Interest income is recognised on a time proportion basis using the effective interest method; and
dividend income is recognised when the right to receive payment is certain.
(n)
Foreign exchange
Monetary assets and liabilities denominated in foreign currencies are translated at the rates of exchange ruling at the
year end date. Transactions in foreign currencies are converted at the rates of exchange ruling at the transaction date.
Exchange differences are included in combined income statement.
For translation of the financial statements of subsidiaries, joint ventures and associates denominated in foreign
currencies into presentation currency of the Cheung Kong Property Group, assets and liabilities are translated at the
exchange rates prevailing at the year end date and results are translated at the average rates of exchange for the year.
Exchange differences are recognised in other comprehensive income.
(o)
Taxation
Hong Kong profits tax is provided for, using the enacted rate at the year end date, on the estimated assessable
profits less available tax relief for losses brought forward of each individual company comprising the Cheung Kong
Property Group. Tax outside Hong Kong is provided for, using the local enacted rates at the year end date, on the
estimated assessable profits of the individual company concerned.
Deferred tax liabilities are provided in full, based on the applicable enacted rates, on all temporary differences
between the carrying amounts of assets and liabilities and their tax bases, and deferred tax assets are recognised, based on
the applicable enacted rates, to the extent that it is probable that future taxable profits will be available against which the
deductible temporary differences and unused tax losses can be utilised.
(p)
Borrowing costs
Borrowing costs are charged to combined income statement when they are incurred unless they are capitalised as
being directly attributable to the acquisition and development of properties which necessarily take a substantial period of
time to complete.
(q)
Combined capital
Ordinary shares are classified as equity. Incremental costs directly attributable to the issue of new shares are shown
in equity as a deduction, net of tax, from the proceeds.
3.
TURNOVER AND CONTRIBUTION
The principal activities of the Cheung Kong Property Group are property development and investment, hotel and serviced
suite operation, property and project management and investments in securities.
Turnover of the Cheung Kong Property Group’s activities comprise proceeds from property sales, gross rental income,
revenue from hotel and serviced suite operation and income from property and project management.
– IA-35 –
APPENDIX IA
ACCOUNTANTS’ REPORT ON THE
CHEUNG KONG PROPERTY GROUP
Turnover of the Cheung Kong Property Group and its share of property sales of joint ventures by operating activities for
the years are as follows:
Year ended 31 December
2012
2013
2014
HK$ million
HK$ million
HK$ million
.
.
.
.
14,614
1,867
2,350
361
12,288
1,961
2,368
394
19,389
1,908
2,213
528
Group turnover . . . . . . . . . . . . . . . . . . . . . . . . . . . . . . . . .
Share of property sales of joint ventures. . . . . . . . . . . . . . . . . . .
19,192
11,846
17,011
15,301
24,038
6,959
Turnover . . . . . . . . . . . . . . . . . . . . . . . . . . . . . . . . . . . .
31,038
32,312
30,997
Property sales . . . . . . . . . . . .
Property rental . . . . . . . . . . .
Hotel and serviced suite operation
Property and project management.
.
.
.
.
.
.
.
.
.
.
.
.
.
.
.
.
.
.
.
.
.
.
.
.
.
.
.
.
.
.
.
.
.
.
.
.
.
.
.
.
.
.
.
.
.
.
.
.
.
.
.
.
.
.
.
.
.
.
.
.
.
.
.
.
.
.
.
.
.
.
.
.
.
.
.
.
.
.
.
.
.
.
.
.
For the years ended 31 December 2012, 2013 and 2014, turnover outside Hong Kong accounted for approximately 38%,
54% and 23% of the turnover respectively and was derived from the following locations:
Year ended 31 December
The PRC . . . . . . . . . . . . . . . . . . . . . . . . . . . . . . . . . . . . .
Singapore . . . . . . . . . . . . . . . . . . . . . . . . . . . . . . . . . . . .
2012
2013
2014
HK$ million
HK$ million
HK$ million
11,919
–
16,454
980
5,945
1,210
11,919
17,434
7,155
Profit contribution by operating activities for the years is as follows:
Subsidiaries
Joint ventures
Total
2012
2013
2014
2012
2013
2014
2012
2013
2014
HK$ million HK$ million HK$ million HK$ million HK$ million HK$ million HK$ million HK$ million HK$ million
Property sales . . . . . . . .
5,261
4,686
6,577
4,655
5,486
1,924
9,916
10,172
8,501
Property rental . . . . . . . .
1,704
1,795
1,769
275
322
300
1,979
2,117
2,069
Hotel and serviced suite
operation . . . . . . . .
931
991
952
302
281
275
1,233
1,272
1,227
Property and project
management . . . . . . .
124
133
154
45
46
61
169
179
215
8,020
7,605
9,452
5,277
6,135
2,560
13,297
13,740
12,012
Investment and finance . . . .
Interest and other finance costs .
Increase in fair value of
investment properties
Subsidiaries . . . . . . . .
Joint ventures . . . . . . .
Profit on disposal of investment
properties . . . . . . . . .
Surplus on loss of control of
interest in subsidiaries . . . .
Surplus on loss of control of
indirect interest in joint
ventures . . . . . . . . .
Profit on disposal of joint
ventures . . . . . . . . .
Others . . . . . . . . . . .
Taxation
Subsidiaries . . . . . . .
Joint ventures . . . . . .
Profit attributable to
non-controlling interests . . .
Share of net profit of associates .
Profit attributable to
shareholders of the Cheung
Kong Property Group . . . .
– IA-36 –
79
(650)
574
(776)
852
(815)
4,470
531
1,782
24
4,542
510
–
2,760
–
1,077
–
–
1,326
–
–
450
121
798
108
2,349
213
(1,250)
(2,389)
(1,442)
(3,145)
(1,624)
(724)
(133)
16,929
1
(272)
14,151
1
(248)
17,067
1
16,930
14,152
17,068
APPENDIX IA
4.
ACCOUNTANTS’ REPORT ON THE
CHEUNG KONG PROPERTY GROUP
SERVICE FEES
Service fees represented costs paid to CKH for property and project management, administration, human resources,
information technology, sales and marketing and other support provided by CKH to the Cheung Kong Property Group.
5.
PROFIT BEFORE TAXATION
Year ended 31 December
Profit before taxation is arrived at after (charging)/crediting:
Interest and other finance costs
Other loans repayable within 5 years . . . . . . . . . . . . . . . . . . .
Less: Amount capitalised (Note) . . . . . . . . . . . . . . . . . . . . . .
Auditors’ remuneration. . . . . . . . . . . . . . . . . . . . . . .
Costs of properties sold . . . . . . . . . . . . . . . . . . . . . .
Service fees . . . . . . . . . . . . . . . . . . . . . . . . . . . . .
Operating lease charges – properties . . . . . . . . . . . . . . .
Interest income from banks . . . . . . . . . . . . . . . . . . . .
Interest income from joint ventures. . . . . . . . . . . . . . . .
Interest income from loan receivables . . . . . . . . . . . . . .
Dividend income from listed investments in equity securities .
Gain on disposal of investments available for sale . . . . . . .
Exchange difference . . . . . . . . . . . . . . . . . . . . . . . .
Note:
6.
.
.
.
.
.
.
.
.
.
.
.
.
.
.
.
.
.
.
.
.
.
.
.
.
.
.
.
.
.
.
.
.
.
.
.
.
.
.
.
.
.
.
.
.
.
.
.
.
.
.
.
.
.
.
.
.
.
.
.
.
2012
2013
2014
HK$ million
HK$ million
HK$ million
(1,138)
488
(1,309)
533
(1,245)
430
(650)
(776)
(815)
(5)
(8,424)
(971)
(61)
26
11
17
206
–
19
(5)
(6,919)
(836)
(70)
34
37
9
283
–
(160)
(6)
(11,708)
(892)
(71)
47
20
8
361
137
(30)
Interest and other finance costs were capitalised at annual rate of approximately 1.7%, 1.8% and 1.5% on average
respectively for the years ended 31 December 2012, 2013 and 2014 to various property development projects.
TAXATION
Year ended 31 December
Current tax
Hong Kong profits tax . . . . . . . . . . . . . . . . . . . . . . . . . . .
Tax outside Hong Kong . . . . . . . . . . . . . . . . . . . . . . . . . . .
Deferred tax . . . . . . . . . . . . . . . . . . . . . . . . . . . . . . . . . . .
– IA-37 –
2012
2013
2014
HK$ million
HK$ million
HK$ million
1,072
138
40
939
342
161
1,364
231
29
1,250
1,442
1,624
APPENDIX IA
ACCOUNTANTS’ REPORT ON THE
CHEUNG KONG PROPERTY GROUP
Hong Kong profits tax has been provided for at the rate of 16.5% during the Relevant Periods on the estimated assessable
profits for the years. Taxation outside Hong Kong has been provided for at the applicable rate on the estimated assessable profits
less available tax losses.
The profit before taxation is reconciled with taxation as follows:
Year ended 31 December
Profit before taxation less share of net profit of joint ventures and
associates. . . . . . . . . . . . . . . . . . . . . . . . . . . . . . . . . . .
Calculated at Hong Kong profits tax rate of 16.5% (2012 and 2013 –
16.5%) . . . . . . . . . . . . . . . . . . . . . . . . . . . . . . . . . . .
Effect of tax rate differences at locations outside Hong Kong . . . . .
Dividend income . . . . . . . . . . . . . . . . . . . . . . . . . . . . . . .
Increase in fair value of investment properties . . . . . . . . . . . . . .
Profit on disposal of investment properties . . . . . . . . . . . . . . . .
Net effect of tax losses and deductible temporary differences utilised/
not recognised . . . . . . . . . . . . . . . . . . . . . . . . . . . . . . .
Net effect of non-assessable/deductible items . . . . . . . . . . . . . . .
Tax provision in prior year written back . . . . . . . . . . . . . . . . . .
Others . . . . . . . . . . . . . . . . . . . . . . . . . . . . . . . . . . . . .
2012
2013
2014
HK$ million
HK$ million
HK$ million
12,832
11,834
16,104
.
.
.
.
.
2,117
(95)
(34)
(738)
–
1,953
182
(47)
(294)
(455)
2,657
(49)
(60)
(749)
–
.
.
.
.
(16)
8
–
8
57
56
–
(10)
(8)
(13)
(149)
(5)
1,250
7.
1,442
1,624
EARNINGS PER SHARE
No earning per share information is presented as its inclusion, for the purpose of Cheung Kong Property Group Financial
Information, is not considered meaningful due to the Reorganisation and the preparation of the results for each of the years ended
31 December 2012, 2013 and 2014 on a combined basis as disclosed in note 1(b).
– IA-38 –
APPENDIX IA
8.
ACCOUNTANTS’ REPORT ON THE
CHEUNG KONG PROPERTY GROUP
FIXED ASSETS
Hotels and serviced suites
in Hong
Kong
outside
Hong Kong
Other assets
Total
HK$ million
HK$ million
HK$ million
HK$ million
COST
At 1 January 2012 . . .
Additions/transfers . . .
Disposals . . . . . . . .
Derecognised on loss of
. . . . . .
. . . . . .
. . . . . .
control in
. . . . . . . .
. . . . . . . .
. . . . . . . .
subsidiaries .
.
.
.
.
.
.
.
.
.
.
.
.
.
.
.
.
11,966
32
–
–
At 31 December 2012
Translation difference
Additions/transfers . .
Disposals . . . . . . .
.
.
.
.
.
.
.
.
.
.
.
.
.
.
.
.
.
.
.
.
.
.
.
.
.
.
.
.
.
.
.
.
.
.
.
.
.
.
.
.
.
.
.
.
.
.
.
.
.
.
.
.
.
.
.
.
.
.
.
.
.
.
.
.
.
.
.
.
.
.
.
.
.
.
.
.
11,998
–
97
–
At 31 December 2013
Translation difference
Additions/transfers . .
Disposals . . . . . . .
.
.
.
.
.
.
.
.
.
.
.
.
.
.
.
.
.
.
.
.
.
.
.
.
.
.
.
.
.
.
.
.
.
.
.
.
.
.
.
.
.
.
.
.
.
.
.
.
.
.
.
.
.
.
.
.
.
.
.
.
.
.
.
.
.
.
.
.
.
.
.
.
.
.
.
.
At 31 December 2014 . . . . . . . . . . . . . . . . . . .
1,711
18
–
(1,008)
1,054
15
(27)
(121)
14,731
65
(27)
(1,129)
721
23
10
–
921
4
31
(25)
13,640
27
138
(25)
12,095
–
143
–
754
(2)
37
–
931
(1)
98
(32)
13,780
(3)
278
(32)
12,238
789
996
14,023
ACCUMULATED DEPRECIATION/ PROVISIONS
At 1 January 2012 . . . . . . . . . . . . . . . . . . .
Depreciation . . . . . . . . . . . . . . . . . . . . . . .
Disposals . . . . . . . . . . . . . . . . . . . . . . . .
Derecognised on loss of control in subsidiaries . . .
.
.
.
.
.
.
.
.
2,310
221
–
–
412
16
–
(207)
830
76
(17)
(94)
3,552
313
(17)
(301)
At 31 December 2012
Translation difference
Depreciation . . . . . .
Disposals . . . . . . .
.
.
.
.
.
.
.
.
.
.
.
.
.
.
.
.
.
.
.
.
.
.
.
.
.
.
.
.
.
.
.
.
.
.
.
.
.
.
.
.
.
.
.
.
.
.
.
.
.
.
.
.
.
.
.
.
.
.
.
.
.
.
.
.
.
.
.
.
.
.
.
.
.
.
.
.
2,531
–
225
–
221
7
17
–
795
4
59
(21)
3,547
11
301
(21)
At 31 December 2013
Translation difference
Depreciation . . . . . .
Disposals . . . . . . .
.
.
.
.
.
.
.
.
.
.
.
.
.
.
.
.
.
.
.
.
.
.
.
.
.
.
.
.
.
.
.
.
.
.
.
.
.
.
.
.
.
.
.
.
.
.
.
.
.
.
.
.
.
.
.
.
.
.
.
.
.
.
.
.
.
.
.
.
.
.
.
.
.
.
.
.
2,756
–
226
–
245
(1)
16
–
837
–
44
(28)
3,838
(1)
286
(28)
At 31 December 2014 . . . . . . . . . . . . . . . . . . .
2,982
260
853
4,095
NET BOOK VALUE
At 31 December 2012 . . . . . . . . . . . . . . . . . . .
9,467
500
126
10,093
At 31 December 2013 . . . . . . . . . . . . . . . . . . .
9,339
509
94
9,942
At 31 December 2014 . . . . . . . . . . . . . . . . . . .
9,256
529
143
9,928
At 31 December 2012, 2013 and 2014, hotels and serviced suites with carrying value of HK$8,935 million, HK$8,817
million and HK$8,744 million were held in Hong Kong under medium-term leases respectively; while hotels and serviced suites
with carrying value of HK$532 million, HK$522 million and HK$512 million were held in Hong Kong under long leases
respectively. Hotels and serviced suites with carrying value of HK$500 million, HK$509 million and HK$529 million were held
outside Hong Kong under medium-term leases at 31 December 2012, 2013 and 2014 respectively.
9.
INVESTMENT PROPERTIES
As at 31 December
Investment properties in Hong Kong
At 1 January . . . . . . . . . . . . .
Additions/cost adjustments . . . . .
Disposals . . . . . . . . . . . . . . .
Increase in fair value . . . . . . . .
.
.
.
.
.
.
.
.
.
.
.
.
.
.
.
.
.
.
.
.
.
.
.
.
.
.
.
.
.
.
.
.
.
.
.
.
.
.
.
.
.
.
.
.
.
.
.
.
.
.
.
.
.
.
.
.
.
.
.
.
.
.
.
.
.
.
.
.
.
.
.
.
2013
2014
HK$ million
HK$ million
HK$ million
.
.
.
.
25,180
6
–
4,470
29,656
2
(2,663)
1,782
28,777
(34)
–
4,542
At 31 December . . . . . . . . . . . . . . . . . . . . . . . . . . . . . . .
29,656
28,777
33,285
– IA-39 –
.
.
.
.
2012
APPENDIX IA
ACCOUNTANTS’ REPORT ON THE
CHEUNG KONG PROPERTY GROUP
At 31 December 2012, 2013 and 2014:
10.
(a)
investment properties were fair valued by DTZ Debenham Tie Leung Limited, independent professional valuers and
its office is located on 16/F, 1063 King’s Road, Quarry Bay, Hong Kong;
(b)
fair values of investment properties are generally derived using the income capitalisation method which is based on
the capitalisation of net income and reversionary income potential by appropriate capitalisation rates; the
capitalisation rates adopted, ranging between 3% to 8% generally and inversely related to the values derived, are
based on analysis of relevant sale transactions and interpretation of prevailing market expectations;
(c)
investment properties with carrying value of HK$28,765 million, HK$27,768 million and HK$32,050 million were
held under medium-term leases respectively; HK$891 million, HK$1,009 million and HK$1,235 million were held
under long leases respectively;
(d)
gross rental income of investment properties for the years ended 31 December 2012, 2013 and 2014 amounted to
HK$1,686 million, HK$1,802 million and HK$1,761 million respectively; and
(e)
direct operating expenses of investment properties for the years ended 31 December 2012, 2013 and 2014 amounted
to HK$28 million, HK$46 million and HK$12 million respectively.
JOINT VENTURES
As at 31 December
2012
2013
2014
HK$ million
HK$ million
HK$ million
Investments in joint ventures – unlisted . . . . . . . . . . . . . . . . . . .
Share of results less dividends (note (a)) . . . . . . . . . . . . . . . . . .
17,803
22,071
13,275
25,263
13,006
23,613
Amounts due from joint ventures (note (b)) . . . . . . . . . . . . . . . . .
39,874
6,195
38,538
6,768
36,619
9,276
46,069
45,306
45,895
Notes:
(a)
The Cheung Kong Property Group’s share of results of joint ventures for the years is as follows:
Year ended 31 December
(b)
2012
2013
2014
HK$ million
HK$ million
HK$ million
Net profit . . . . . . . . . . . . . . . . . . . . . . . . . . . . . . . .
Other comprehensive income/(expense) . . . . . . . . . . . . . . .
5,480
953
4,031
829
2,835
(1,631)
Total comprehensive income . . . . . . . . . . . . . . . . . . . . .
6,433
4,860
1,204
At the year end dates, amounts due from joint ventures included the following:
As at 31 December
Interest bearing loans
– repayable within 5 years . . . . . . . . . . . . . . . . . . . . .
Non-interest bearing loans
– no fixed repayment terms . . . . . . . . . . . . . . . . . . . .
2012
2013
2014
HK$ million
HK$ million
HK$ million
830
800
955
5,365
5,968
8,321
6,195
6,768
9,276
The directors considered that no single joint venture is material to the Group and hence no summarised financial
information for any individual joint venture is disclosed.
– IA-40 –
APPENDIX IA
ACCOUNTANTS’ REPORT ON THE
CHEUNG KONG PROPERTY GROUP
Particulars of the principal joint ventures are set out below:
Equity interest attributable to
the Group (effective holding)
Name
Place of
incorporation/
establishment
2012
2013
2014
At the
date
of this
report
Place of
operation
Bayswater Developments
British Virgin
Limited . . . . . . . . . . . .
Islands
50%
50%
50%
50% The PRC
Beright Investments Limited . British Virgin
Islands
Billion Rise Limited . . . . . . British Virgin
Islands
Cheung Wo Enterprises
British Virgin
Limited . . . . . . . . . . . .
Islands
Choicewide Group Limited . . British Virgin
Islands
Extreme Selection Investments British Virgin
Limited (disposed of in
Islands
2014) . . . . . . . . . . . . .
Gislingham Limited . . . . . . British Virgin
Islands
Golden Castle Management
British Virgin
Limited . . . . . . . . . . . .
Islands
Harbour Plaza Hotel
British Virgin
Management (International)
Islands
Limited . . . . . . . . . . . .
Harbour Plaza Metropolis
British Virgin
Limited . . . . . . . . . . . .
Islands
Mapleleaf Developments
British Virgin
Limited . . . . . . . . . . . .
Islands
Shanklin Developments
British Virgin
Limited . . . . . . . . . . . .
Islands
Sky Island Limited . . . . . . . British Virgin
Islands
Smart Rainbow Limited . . . . British Virgin
Islands
Swayfield Limited . . . . . . . British Virgin
Islands
True Ample Developments
British Virgin
Limited . . . . . . . . . . . .
Islands
Willpower Developments
British Virgin
Limited . . . . . . . . . . . .
Islands
Zealand Limited . . . . . . . . British Virgin
Islands
Afford Limited (disposed of
Hong Kong
in 2013) . . . . . . . . . . .
50%
50%
50%
50% The PRC
50%
50%
50%
50% Singapore
50%
50%
50%
50% The PRC
50%
50%
50%
50% Singapore
50%
50%
N/A
N/A The PRC
50%
50%
50%
50% The PRC
50%
50%
50%
50% The PRC
50%
50%
50%
50% Hong Kong
50%
50%
50%
50% Hong Kong
25%
25%
25%
25% The PRC
50%
50%
50%
50% The PRC
50%
50%
50%
50% The PRC
50%
50%
50%
50% Hong Kong
30%
30%
30%
30% Hong Kong
50%
50%
50%
50% The PRC
50%
50%
50%
50% The PRC
50%
50%
50%
50% The PRC
50%
N/A
N/A
N/A The PRC
Hong Kong
50%
50%
50%
N/A The PRC
Hong Kong
50%
50%
50%
50% Hong Kong
Hong Kong
50%
50%
50%
50% Hong Kong
Hong Kong
49%
49%
49%
49% The PRC
Hong Kong
50%
50%
50%
50% The PRC
Glory Sense Limited . . . . . . Hong Kong
50%
50%
50%
50% The PRC
Chesgold Limited (disposed of
in 2015) . . . . . . . . . . .
Clayton Power Enterprises
Limited . . . . . . . . . . . .
Dragon Beauty International
Limited . . . . . . . . . . . .
Elegant Wealth Investment
Limited . . . . . . . . . . . .
Forton Investment Limited. . .
– IA-41 –
Principal activities
Property
development and
investment
Property
development
Property
development
Property investment
Investment in
property project
Property
development
Property
development
Property
development
Hotel management
Hotel and serviced
suite operation
Property
development
Property
development
Property
development
Hotel and serviced
suite operation
Property investment
Property
development
Property
development
Property
development
Property
development and
investment
Property investment
Property
development
Property
development
Property
development
Property
development
Property
development
APPENDIX IA
ACCOUNTANTS’ REPORT ON THE
CHEUNG KONG PROPERTY GROUP
Equity interest attributable to
the Group (effective holding)
Name
11.
Place of
incorporation/
establishment
2012
2013
2014
At the
date
of this
report
Place of
operation
Hildon Development Limited . Hong Kong
50%
50%
50%
Hui Xian Holdings Limited . . Hong Kong
33.4%
33.4%
33.4%
33.4% Hong Kong
Konorus Investment Limited . Hong Kong
Metro Broadcast Corporation Hong Kong
Limited . . . . . . . . . . . .
Mighty General Limited . . . . Hong Kong
42.5%
50%
42.5%
50%
42.5%
50%
42.5% Hong Kong
50% Hong Kong
50%
50%
50%
50% The PRC
Montoya (HK) Limited. . . . . Hong Kong
50%
50%
50%
50% The PRC
New China Sheen Limited . . . Hong Kong
50%
50%
50%
50% The PRC
New China Target Limited. . . Hong Kong
50%
50%
50%
50% The PRC
Hong Kong Shanghai
Samoa
Development Co. Ltd . . . .
25%
25%
25%
25% The PRC
Kovan Treasure Pte. Limited . Singapore
N/A
N/A
50%
50% Singapore
Hutchison Whampoa
The PRC
Properties (Chengdu)
Limited . . . . . . . . . . . .
50%
50%
50%
50% The PRC
Principal activities
50% The PRC
Property
development
Investment holding
and financing
Property investment
Radio broadcasting
Property
development
Property
development
Property
development
Property
development
Property
development and
investment
Property
development
Property
development
INVESTMENTS AVAILABLE FOR SALE
As at 31 December
Listed investments
Equity securities – listed in Hong Kong. . . . . . . . . . . . . . . . . .
Equity securities – listed outside Hong Kong. . . . . . . . . . . . . . .
2012
2013
2014
HK$ million
HK$ million
HK$ million
3,139
2,151
3,208
2,196
4,716
2,449
5,290
5,404
7,165
Unlisted investments
Equity securities . . . . . . . . . . . . . . . . . . . . . . . . . . . . . . .
12.
55
64
7
5,345
5,468
7,172
STOCK OF PROPERTIES
As at 31 December
Properties for/under development . . . . . . . . . . . . . . . . . . . . . . .
Joint development projects . . . . . . . . . . . . . . . . . . . . . . . . . .
Properties for sale . . . . . . . . . . . . . . . . . . . . . . . . . . . . . . .
2012
2013
2014
HK$ million
HK$ million
HK$ million
48,923
29,746
1,447
50,638
27,420
1,757
47,292
21,903
4,064
80,116
79,815
73,259
Properties for/under development and joint development projects amounting to HK$63,466 million, HK$54,476 million and
HK$43,217 million were not scheduled for completion within twelve months at 31 December 2012, 2013 and 2014 respectively.
– IA-42 –
APPENDIX IA
13.
ACCOUNTANTS’ REPORT ON THE
CHEUNG KONG PROPERTY GROUP
DEBTORS, DEPOSITS AND PREPAYMENTS
As at 31 December
2012
2013
2014
HK$ million
HK$ million
HK$ million
1,194
21
342
1,512
13
306
1,549
13
248
1,557
1,831
1,810
Trade debtors . . . . . . . . . . . . . . . . . . . . . . . . . . . . . . . . . .
Loan receivables . . . . . . . . . . . . . . . . . . . . . . . . . . . . . . . .
Deposits, prepayments and others. . . . . . . . . . . . . . . . . . . . . . .
The Cheung Kong Property Group’s trade debtors mainly comprise receivables for sales of properties and rental. Sales
terms vary for each property project and are determined with reference to the prevailing market conditions. Sales of properties are
normally completed when sales prices are fully paid and deferred payment terms are sometimes offered to purchasers at a
premium. Rentals and deposits are payable in advance by tenants.
At the year end dates, ageing analysis of the Cheung Kong Property Group’s trade debtors was as follows:
As at 31 December
2012
2013
2014
HK$ million
HK$ million
HK$ million
1,154
33
7
1,455
40
17
1,487
43
19
1,194
1,512
1,549
Current to one month . . . . . . . . . . . . . . . . . . . . . . . . . . . . .
Two to three months . . . . . . . . . . . . . . . . . . . . . . . . . . . . . .
Over three months . . . . . . . . . . . . . . . . . . . . . . . . . . . . . . .
and ageing analysis of trade debtors past due but not impaired was as follows:
As at 31 December
2012
2013
2014
HK$ million
HK$ million
HK$ million
47
26
7
111
34
17
47
39
18
80
162
104
Overdue within one month . . . . . . . . . . . . . . . . . . . . . . . . . .
Overdue for two to three months . . . . . . . . . . . . . . . . . . . . . . .
Overdue over three months . . . . . . . . . . . . . . . . . . . . . . . . . .
14.
AMOUNTS DUE FROM/TO OTHER GROUP COMPANIES
Amounts due from CKH or its subsidiaries not formed part of the Group (the “Other Group Companies”) were unsecured,
interest-free and had no fixed terms of repayment. Amounts due to the Other Group Companies were unsecured had no fixed
terms of repayment and interest-free, except for amounts of HK$53,238 million, HK$46,803 million and HK$43,620 million at 31
December 2012, 2013 and 2014 respectively which carried interests at average rates of 2.2%, 2.5% and 2.5% per annum
respectively.
15.
CREDITORS AND ACCRUALS
As at 31 December
Trade creditors . . . . . . . . . . . . . . . . . . . . . . . . . . . . . . . . .
Accruals and other creditors. . . . . . . . . . . . . . . . . . . . . . . . . .
Customers’ deposits received . . . . . . . . . . . . . . . . . . . . . . . . .
– IA-43 –
2012
2013
2014
HK$ million
HK$ million
HK$ million
2,575
2,526
6,998
1,082
2,684
7,207
1,618
2,884
5,991
12,099
10,973
10,493
APPENDIX IA
ACCOUNTANTS’ REPORT ON THE
CHEUNG KONG PROPERTY GROUP
At the year end dates, ageing analysis of the Cheung Kong Property Group’s trade creditors was as follows:
As at 31 December
Current to one month . . . . . . . . . . . . . . . . . . . . . . . . . . . . .
Two to three months . . . . . . . . . . . . . . . . . . . . . . . . . . . . . .
Over three months . . . . . . . . . . . . . . . . . . . . . . . . . . . . . . .
16.
2012
2013
2014
HK$ million
HK$ million
HK$ million
2,513
38
24
1,071
7
4
1,563
24
31
2,575
1,082
1,618
BORROWINGS
As at 31 December
2012
2013
2014
HK$ million
HK$ million
HK$ million
Repayable
within 1 year . . . . . . . . . . . . . . . . . . . . . . . . . . . . . . . . .
after 1 year but not exceeding 2 years. . . . . . . . . . . . . . . . . . .
after 2 years but not exceeding 5 years . . . . . . . . . . . . . . . . . .
300
–
315
–
250
360
250
50
300
Less: Amounts classified under current liabilities . . . . . . . . . . . . . .
615
(300)
610
–
600
(250)
Amounts classified under non-current liabilities . . . . . . . . . . . . . .
315
610
350
Borrowings represent loans from joint venture, which are unsecured and interest bearing at prime rate per annum for the
years ended 31 December 2012, 2013 and 2014 respectively. The amounts of total borrowings approximate their fair values as at
31 December 2012, 2013 and 2014.
17.
DEFERRED TAX LIABILITIES
At 31 December 2012, 2013 and 2014:
18.
(a)
deferred tax liabilities amounting to HK$820 million, HK$808 million and HK$869 million were provided for
accelerated tax depreciation respectively; HK$14 million, HK$36 million and HK$35 million were provided for
withholding tax on undistributed profits respectively; and HK$(29) million, HK$122 million and HK$95 million
were provided for other (deductible) taxable temporary differences respectively; and
(b)
unutilised tax losses and deductible temporary differences amounting to a total of HK$2,205 million, HK$2,555
million and HK$2,479 million were not recognised respectively, of which HK$2 million, nil and nil expires within 5
years respectively.
OPERATING LEASE
Analysis of future minimum lease income receivable by the Cheung Kong Property Group under non-cancellable operating
leases, mainly on 2 to 3 year terms, for property rental at the year end dates is as follows:
As at 31 December
Future minimum lease income receivable
not later than 1 year . . . . . . . . . . . . . . . . . . . . . . . . . . . . .
later than 1 year but not later than 5 years . . . . . . . . . . . . . . . .
– IA-44 –
2012
2013
2014
HK$ million
HK$ million
HK$ million
1,725
1,633
1,633
919
1,202
1,022
3,358
2,552
2,224
APPENDIX IA
ACCOUNTANTS’ REPORT ON THE
CHEUNG KONG PROPERTY GROUP
Analysis of future minimum lease charges payable by the Cheung Kong Property Group under non-cancellable operating
leases at the year end dates are as follows:
As at 31 December
2012
2013
2014
HK$ million
HK$ million
HK$ million
37
27
39
29
52
30
64
68
82
Future minimum lease charges payable
not later than 1 year . . . . . . . . . . . . . . . . . . . . . . . . . . . . .
later than 1 year but not later than 5 years . . . . . . . . . . . . . . . .
19.
SEGMENT INFORMATION
Depreciation for the years analysed by operating activities is as follows:
As at 31 December
2012
2013
2014
HK$ million
HK$ million
HK$ million
306
7
294
7
282
4
313
301
286
Hotel and serviced suite operation . . . . . . . . . . . . . . . . . . . . . .
Property and project management . . . . . . . . . . . . . . . . . . . . . .
Other segmental information is set out in note 3.
20.
COMMITMENTS
At 31 December 2012, 2013 and 2014, the Cheung Kong Property Group had capital commitments as follows:
(a)
Contracted but not provided for
As at 31 December
2012
2013
2014
HK$ million
HK$ million
HK$ million
210
499
408
Acquisition of fixed assets. . . . . . . . . . . . . . . . . . . . . . .
(b)
Authorised but not contracted for
As at 31 December
Acquisition of fixed assets. . . . . . . . . . . . . . . . . . . . . . .
Loan advances to joint ventures . . . . . . . . . . . . . . . . . . .
Investment in joint ventures . . . . . . . . . . . . . . . . . . . . . .
2012
2013
2014
HK$ million
HK$ million
HK$ million
5
–
–
5
398
–
–
3,925
380
At 31 December 2012, 2013 and 2014, the minimum share of revenue undertaken by the Cheung Kong Property Group to
be received by the partner of a joint development project amounted to HK$612 million, HK$600 million and HK$588 million
respectively.
– IA-45 –
APPENDIX IA
21.
ACCOUNTANTS’ REPORT ON THE
CHEUNG KONG PROPERTY GROUP
RELATED PARTY TRANSACTIONS
Except as disclosed elsewhere in the Cheung Kong Property Group Financial Information, the Cheung Kong Property
Group entered into transactions in the normal course of business with the Other Group Companies and related companies, details
of the material ones were as follows:
Year ended 31 December
Interest expenses paid to the
Other Group Companies (note 14) . . . . . . . . . . . . . . . . . . . .
Service fees paid to CKH (note 4) . . . . . . . . . . . . . . . . . . . . . .
22.
2012
2013
2014
HK$ million
HK$ million
HK$ million
1,035
971
1,206
836
1,142
892
FINANCIAL RISKS AND MANAGEMENT
Financial assets and financial liabilities of the Cheung Kong Property Group include investments in securities, cash
balances maintained for liquidity, trade receivables, loan receivables, trade creditors, borrowings, amounts due from/to the Other
Group Companies and derivative financial instruments for investment and financial purposes. The Cheung Kong Property Group’s
treasury policies and how the management manages to mitigate the risks associated with these financial assets and financial
liabilities are described below:
(a)
Treasury policies
The Cheung Kong Property Group maintains a conservative approach on foreign exchange exposure management
and ensure that their exposure to fluctuations in foreign exchange rates is minimised.
The Cheung Kong Property Group’s borrowings and amounts due to the Other Group Companies are principally on
a floating rate basis.
At 31 December 2012, 2013 and 2014, the Cheung Kong Property Group’s borrowings were in Hong Kong Dollar
(“HK$”) and their bank balances and deposits were mainly in HK$.
(b)
Risk management
Loan receivables normally carry interest at rates with reference to market lending rates and are secured by
collaterals and other credit enhancements including charge on assets and guarantees. Trade debtors include mainly
receivables arising from sales and leases of properties to the public. The Cheung Kong Property Group have legal rights to
claim repossession of the properties in the event of default by purchasers/tenants. Regular review and follow-up actions are
carried out on overdue amounts to minimise credit risk exposures. At the year end dates, overdue loan receivables and
trade debtors were less than 2% of the Cheung Kong Property Group’s profit for the years and credit risk on loan
receivables and trade debtors after mitigation by collaterals and other credit enhancements was negligible.
Cash balances maintained for liquidity are placed with a number of major banks. Investments in securities and
transactions involving derivative financial instruments are generally limited to issuers and counter-parties with sound
credit.
The exposure of investments in securities and derivative financial instruments to price changes is managed by
closely monitoring changes in market conditions that may have an impact on market prices or factors affecting the fair
value. If the fair value of the investments in securities and derivative financial instruments was 5% higher/lower at the
year end dates, the Cheung Kong Property Group’s investment revaluation reserve would increase/decrease by
approximately HK$267 million, HK$273 million, and HK$359 million and the Cheung Kong Property Group’s profit for
the years ended 31 December 2012, 2013 and 2014 would increase/decrease by approximately HK$26 million, nil and nil
respectively.
The Cheung Kong Property Group’s borrowings and those amounts due to the Other Group Companies carrying
interest on floating rate basis are exposed to interest rate fluctuation. It is estimated that an increase/a decrease of 1 % in
interest rates would increase/decrease the Cheung Kong Property Group’s finance costs for the years ended 31 December
2012, 2013 and 2014 by approximately HK$405 million, HK$401 million and HK$375 million respectively, assuming the
change in interest rates had been applied to the Cheung Kong Property Group’s relevant amounts due to the Other Group
Companies and borrowings at the year end dates which were kept constant throughout the relevant year, and the amount of
finance costs capitalised would increase/decrease by approximately HK$174 million, HK$163 million and HK$130 million
based on the proportion of finance cost capitalised during the year.
– IA-46 –
APPENDIX IA
(c)
ACCOUNTANTS’ REPORT ON THE
CHEUNG KONG PROPERTY GROUP
Liquidity management
The Cheung Kong Property Group monitors their liquidity requirements on a short to medium-term basis and
arranges refinancing of the Cheung Kong Property Group’s borrowings as appropriate. With cash and marketable securities
in hand, the Cheung Kong Property Group’s liquidity positions remain strong and the Cheung Kong Property Group have
sufficient financial resources to satisfy their commitments and working capital requirements.
Contractual obligations of creditors and derivative financial instruments mature within one year from the year ended
dates. Amounts due to the Other Group Companies had no fixed terms of repayment. The contractual undiscounted cash
flows (including interest payments computed at rates at the year end dates) of the Cheung Kong Property Group’s
borrowings by contractual maturities at the respective year end dates were as follows:
2012
Within 1 year . . . . . . . . . . . . . . . . . . . . . . . . . . . . . .
After 1 year but not exceeding 2 years . . . . . . . . . . . . . . .
After 2 years but not exceeding 5 years . . . . . . . . . . . . . . .
23.
2013
2014
HK$ million
HK$ million
HK$ million
329
16
330
30
280
404
279
66
328
675
714
673
FAIR VALUE MEASUREMENT OF FINANCIAL INSTRUMENTS
Investments in securities and derivative financial instruments are stated at fair value. Fair values are measured based on
quoted prices in active markets, value inputs that are observable either directly or indirectly and/or value inputs that are not based
on observable market data. Change of value inputs that are not based on observable market data to reasonably possible
alternatives would not have material effect on the Cheung Kong Property Group’s results for the years and financial position at
the year end dates.
An analysis of the Cheung Kong Property Group’s financial assets and financial liabilities stated at fair value based on the
degree to which their fair values are observable is as follows:
Level 1: quoted prices in active markets
Level 2: value inputs, other than quoted prices, that are observable either directly or indirectly
Level 3: value inputs that are not based on observable market data
Level 1
Level 2
Level 3
Total
HK$ million
HK$ million
HK$ million
HK$ million
At 31 December 2012
Financial assets
Investments available for sale
– Equity securities . . . . . . . . . . . . . . .
5,290
–
55
5,345
Financial liabilities
Derivative financial instruments . . . . . . . . .
–
At 31 December 2013
Financial assets
Investments available for sale
– Equity securities . . . . . . . . . . . . . . .
5,404
–
64
5,468
At 31 December 2014
Financial assets
Investments available for sale
– Equity securities . . . . . . . . . . . . . . .
7,165
–
7
7,172
– IA-47 –
(518)
–
(518)
APPENDIX IA
ACCOUNTANTS’ REPORT ON THE
CHEUNG KONG PROPERTY GROUP
The movement of equity securities available for sale in Level 3 measurement for the years is as follows:
2012
2014
HK$ million
HK$ million
HK$ million
. . . . . . . . . . . . . . . .
other comprehensive
. . . . . . . . . . . . . . . .
. . . . . . . . . . . . . . . .
45
55
64
10
–
9
–
(45)
(12)
Fair value at 31 December. . . . . . . . . . . . . . . . . . . . . . .
55
64
7
Fair value at 1 January. . . . . . . . .
Gain/(loss) in fair value recognised in
income . . . . . . . . . . . . . . . .
Disposal during the year . . . . . . . .
24.
2013
CAPITAL MANAGEMENT
The Cheung Kong Property Group manage their capital to ensure that they will be able to continue as a going concern
while maximising returns to the shareholders of the Cheung Kong Property Group through the optimisation of debt and equity
balances. The capital structure of the Cheung Kong Property Group consists of borrowings as detailed in note 16, amounts due to
the Other Group Companies, bank balances and deposits, shareholders’ funds (comprising combined capital and reserves) and
non-controlling interests as detailed in the combined statement of financial position. The management of Cheung Kong Property
Group reviews their capital structure on a regular basis to maintain an optimal capital structure.
25.
EMPLOYEES’ EMOLUMENTS
Of the five individuals with the highest emoluments in the Cheung Kong Property Group, none of them were directors and
chief executive. Emoluments of these individuals were as follows:
Year ended 31 December
Salaries and other benefits. . . . . . . . . . . . . . . . . . .
Contributions to pension schemes . . . . . . . . . . . . . .
Share-based payment expense . . . . . . . . . . . . . . . . .
Discretionary and performance related incentive payments
Incentive paid on joining . . . . . . . . . . . . . . . . . . .
Compensation for loss of office paid: Contractual . . . . .
Other . . . . . . . . . . . . . . . . . . . . . . . . . . . . . . .
.
.
.
.
.
.
.
.
.
.
.
.
.
.
.
.
.
.
.
.
.
.
.
.
.
.
.
.
.
.
.
.
.
.
.
.
.
.
.
.
.
.
.
.
.
.
.
.
.
2012
2013
2014
HK$ million
HK$ million
HK$ million
22
1
–
6
–
–
–
23
1
–
8
–
–
–
24
1
–
7
–
–
–
.
.
.
.
.
.
.
The emoluments of the above individuals were within the following bands:
Year ended 31 December
HK$2,500,001 – HK$3,000,000 . . .
HK$3,500,001 – HK$ 4,000,000 . .
HK$4,000,001 – HK$ 4,500,000 . .
HK$4,500,001 – HK$ 5,000,000 . .
HK$5,000,001 – HK$ 5,500,000 . .
HK$5,500,001 – HK$ 6,000,000 . .
HK$6,500,001 – HK$ 7,000,000 . .
HK$11,500,001 – HK$ 12,000,000 .
HK$12,000,001 – HK$ 12,500,000 .
HK$12,500,001 – HK$ 13,000,000 .
26.
.
.
.
.
.
.
.
.
.
.
.
.
.
.
.
.
.
.
.
.
.
.
.
.
.
.
.
.
.
.
.
.
.
.
.
.
.
.
.
.
.
.
.
.
.
.
.
.
.
.
.
.
.
.
.
.
.
.
.
.
.
.
.
.
.
.
.
.
.
.
.
.
.
.
.
.
.
.
.
.
.
.
.
.
.
.
.
.
.
.
.
.
.
.
.
.
.
.
.
.
.
.
.
.
.
.
.
.
.
.
.
.
.
.
.
.
.
.
.
.
.
.
.
.
.
.
.
.
.
.
.
.
.
.
.
.
.
.
.
.
.
.
.
.
.
.
.
.
.
.
.
.
.
.
.
.
.
.
.
.
.
.
.
.
.
.
.
.
.
.
.
.
.
.
.
.
.
.
.
.
.
.
.
.
.
.
.
.
.
.
.
.
.
.
.
.
.
.
.
.
.
.
.
.
.
.
.
.
.
.
2012
2013
2014
No. of
employee
No. of
employee
No. of
employee
–
1
2
–
–
1
–
1
–
–
–
1
–
2
–
–
1
–
1
–
1
–
–
–
2
–
1
–
–
1
5
5
5
COMBINED CAPITAL
The Cheung Kong Property Group’s combined capital as at each year end dates represents the aggregate of the share
capital of all the companies comprising the Cheung Kong Property Group after elimination of inter-company investments.
– IA-48 –
APPENDIX IA
27.
ACCOUNTANTS’ REPORT ON THE
CHEUNG KONG PROPERTY GROUP
IMMEDIATE/ULTIMATE HOLDING COMPANY
At the date of this report, the directors of the Company consider that CK Hutchison Holdings Limited to be the immediate
holding company of the Company and the ultimate holding company of the Cheung Kong Property Group.
III. EVENTS AFTER THE REPORTING PERIOD
Subsequent to 31 December 2014, the Cheung Kong Property Group paid dividends of HK$154
million to its shareholders. Such dividends were not accounted for in the Cheung Kong Property Group
Financial Information during the Relevant Periods.
IV.
SUBSEQUENT FINANCIAL STATEMENTS
No audited financial statements have been prepared by any of the companies now comprising the
Cheung Kong Property Group in respect of any period subsequent to 31 December 2014 up to the date
of this report. Save as disclosed above, no dividend or distribution has been declared or made by the
Company or any of the companies now comprising the Cheung Kong Property Group in respect of any
period subsequent to 31 December 2014.
Yours faithfully,
Deloitte Touche Tohmatsu
Certified Public Accountants
Hong Kong
– IA-49 –
APPENDIX IB
ACCOUNTANTS’ REPORT ON
THE HUTCHISON PROPERTY GROUP
The following is the text of a report received from Deloitte Touche Tohmatsu, Certified Public
Accountants, Hong Kong, the reporting accountants of the Company, for the purpose of incorporation
in this listing document.
8 May 2015
The Directors
Cheung Kong Property Holdings Limited
7th Floor, Cheung Kong Cen
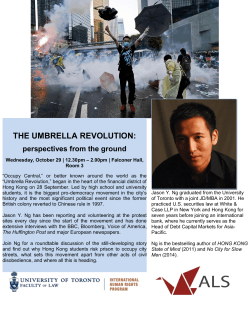
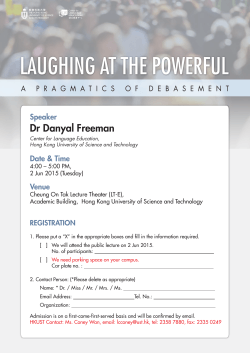
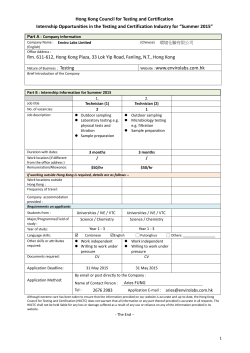
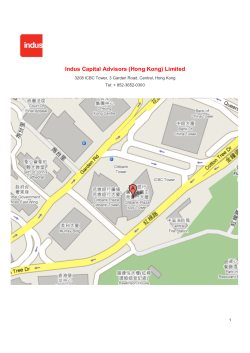
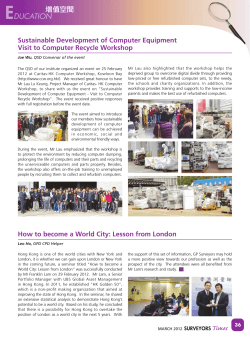
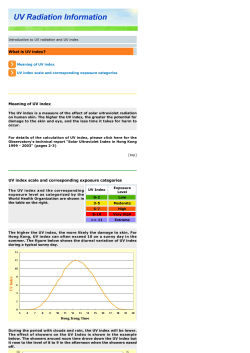
© Copyright 2026