
Restoration, Transformation and Growth
Restoration,
Transformation
and Growth
A New Economic Agenda for the
Great Lakes — St. Lawrence Region
The CGLR Vision
In 2011 over 250 leaders and experts met at the Great LakesSt. Lawrence Region Summit in Windsor, Ontario convened
by the Metropolitan Policy Program at the Brookings
Institute and the University of Toronto’s Mowat Centre for
Policy Innovation.
Council of the Great Lakes Region (CGLR) was born.
Launched in Cleveland in 2013 with the support of United
States Ambassador to Canada David Jacobson and Canadian
Ambassador
to the United States Gary Doer, CGLR was
Davis Strait
formally established to deepen cross-border and crossNuuk
sector collaboration
in the region. This was a monumental
step towards
recognizing the Great Lakes-St. Lawrence
(Godthab)
Region (GLSLR) as a distinct and vital
economic sub-region.
Nanortalik
The Summit sought better ways to work across borders and
sectors throughout the region, and stakeholders identified
N u many
n a v policy
u t areas where stronger collaboration and a
unified voice were needed to ensure the economic and
Iqaluit
environmental
future of the region.
Baker
Lake
Huds
on St
Since its creation, CGLR has
played a leadership role in
finding solutions to our common
challenges.
Rankin Inlet
ke
asca
rait
• Conducting rigorous research and analysis;
Ungava
•Sharing knowledge through conferences and events for
Bay
government, labor, academia, and the not-for-profit
Labrador Sea
community;
Inukjuak
Hudson Bay
Churchill
Since its creation, CGLR has played a leadership role in
finding solutions to our common challenges. Led by an
independent, bi-national board of directors, and guided by
multi-disciplinary and multi-organizational working groups,
CGLR is accomplishing this mandate by:
•Providing realistic solutions to governments on how to
reconcile the challenges of economic prosperity and
environmental conservation; and
M a n Summit
i t o b a leaders were equally clear about the need to
an
fill regional gaps in leadership, knowledge sharing, and
er
ivRecognizing
advocacy.
that no organization existed to bring
on R
Nels
interrelated,
bi-national interests together, the idea of the
•Coordinating public outreach campaigns to the GLSLR
Smallwood Res.
Labrador
community.
Thompson
Flin Flon
Labrador City
wan River
Lake
Winnipeg
Corner St. John's
Brook
Moosonee
Grand Forks
Marquette
Ironwood
Minnesota
Marinette
St. Paul
Minneapolis
Mi
Mankato
Rochester
Sioux Falls
Sudbury
ssis
Green Bay
pi Oshkosh
sip
Iowa
Lincoln
Illinois
Lafayette
St. Joseph
Topeka
Kansas
City
Kansas
nsas
R.
U. S. A.
Memphis
Pennsylvania
Columbus
Indianapolis
West
Ohio
Ohio R
.
Louisville
Frankfort
Nashville
.
City
Poplar Bluff
Arka
.
eR
Augusta
nc
Harrisburg
Indiana
Owensboro
Bowling Green
Kentucky
Missouri
pi R
klahoma
Tulsa
Parsons
Missouri R.
L. St. Claire
Wabash
Springfield
St. Louis
ssi
p
Winfield
Wichita
Toronto
Tennessee
Chattanooga
Huntsville
Sydney
Nova
Scotia
Halifax
La
Montpelier
St
New Concord
York
VT NH
rio
L. Onta
Boston
Albany
MA
Rochester
Buffalo
RI
CT Hartford
Bradford
rie
L. E
Detroit
Windsor
Toledo
Cleveland
Chicago
Des Moines
Omaha
Michigan
Lansing
Wisconsin
Bangor
ATLANTIC
OCEAN
Kingston
Milwaukee
Madison
Sioux City
Norfolk
Montreal
e
wr
Fredericton
Maine
Trois-rivieres
North
Bay Ottawa
L. Huron
Mi
ch
iga
n
Fargo
South
Dakota
ka
Duluth
Prince
Edward
Island
Moncton
Quebec
CA NADA
L. Superior
Gulf of
St. Lawrence
Charlottetown
Amos
Timmins
Thunder Bay
L.
Lake Oahe
Quebec
Ontario
Minot
Bismarck
New
Brunswick
Lake Nipigon
Winnipeg
randon
.
Newfoundland
MD
Virginia
Roanoke
North
Carolina
Charlotte
Greenville
New York
Trenton
Philadelphia
Baltimore
DE
Washington D. C.
Virginia
Charleston
NJ
Richmond
Raleigh
Norfolk
Restoration, Transformation and Growth
April 2015
Bermuda
1
The CGLR Vision
In 2011 over 250 leaders and experts met at the Great LakesSt. Lawrence Region Summit in Windsor, Ontario convened
by the Metropolitan Policy Program at the Brookings
Institute and the University of Toronto’s Mowat Centre for
Policy Innovation.
Council of the Great Lakes Region (CGLR) was born.
Launched in Cleveland in 2013 with the support of United
States Ambassador to Canada David Jacobson and Canadian
Ambassador
to the United States Gary Doer, CGLR was
Davis Strait
formally established to deepen cross-border and crossNuuk
sector collaboration
in the region. This was a monumental
step towards
recognizing the Great Lakes-St. Lawrence
(Godthab)
Region (GLSLR) as a distinct and vital
economic sub-region.
Nanortalik
The Summit sought better ways to work across borders and
sectors throughout the region, and stakeholders identified
N u many
n a v policy
u t areas where stronger collaboration and a
unified voice were needed to ensure the economic and
Iqaluit
environmental
future of the region.
Baker
Lake
Huds
on St
Since its creation, CGLR has
played a leadership role in
finding solutions to our common
challenges.
Rankin Inlet
ke
asca
rait
• Conducting rigorous research and analysis;
Ungava
• Sharing knowledge through conferences and events for
Bay
government, labor, academia, and the not-for-profit
Labrador Sea
community;
Inukjuak
Hudson Bay
Churchill
Since its creation, CGLR has played a leadership role in
finding solutions to our common challenges. Led by an
independent, bi-national board of directors, and guided by
multi-disciplinary and multi-organizational working groups,
CGLR is accomplishing this mandate by:
• Providing realistic solutions to governments on how to
reconcile the challenges of economic prosperity and
environmental conservation; and
M a n Summit
i t o b a leaders were equally clear about the need to
an
fill regional gaps in leadership, knowledge sharing, and
er
ivRecognizing
advocacy.
that no organization existed to bring
on R
Nels
interrelated,
bi-national interests together, the idea of the
• Coordinating public outreach campaigns to the GLSLR
Smallwood Res.
Labrador
community.
Thompson
Flin Flon
Labrador City
wan River
Lake
Winnipeg
Corner St. John's
Brook
Moosonee
Grand Forks
Marquette
Ironwood
Minnesota
Marinette
St. Paul
Minneapolis
Mi
Mankato
Rochester
Sioux Falls
Sudbury
ssis
Green Bay
pi Oshkosh
sip
Iowa
Lincoln
Illinois
Lafayette
St. Joseph
Topeka
Kansas
City
Kansas
nsas
R.
U. S. A.
Memphis
Pennsylvania
Columbus
Indianapolis
West
Ohio
Ohio R
.
Louisville
Frankfort
Nashville
.
City
Poplar Bluff
Arka
.
eR
Augusta
nc
Harrisburg
Indiana
Owensboro
Bowling Green
Kentucky
Missouri
pi R
klahoma
Tulsa
Parsons
Missouri R.
L. St. Claire
Wabash
Springfield
St. Louis
ssi
p
Winfield
Wichita
Toronto
Tennessee
Chattanooga
Huntsville
Sydney
Nova
Scotia
Halifax
La
Montpelier
St
New Concord
York
VT NH
rio
L. Onta
Boston
Albany
MA
Rochester
Buffalo
RI
CT Hartford
Bradford
rie
L. E
Detroit
Windsor
Toledo
Cleveland
Chicago
Des Moines
Omaha
Michigan
Lansing
Wisconsin
Bangor
ATLANTIC
OCEAN
Kingston
Milwaukee
Madison
Sioux City
Norfolk
Montreal
e
wr
Fredericton
Maine
Trois-rivieres
North
Bay Ottawa
L. Huron
Mi
ch
iga
n
Fargo
South
Dakota
ka
Duluth
Prince
Edward
Island
Moncton
Quebec
CA NADA
L. Superior
Gulf of
St. Lawrence
Charlottetown
Amos
Timmins
Thunder Bay
L.
Lake Oahe
Quebec
Ontario
Minot
Bismarck
New
Brunswick
Lake Nipigon
Winnipeg
randon
.
Newfoundland
MD
Virginia
Roanoke
North
Carolina
Charlotte
Greenville
New York
Trenton
Philadelphia
Baltimore
DE
Washington D. C.
Virginia
Charleston
NJ
Richmond
Raleigh
Norfolk
Restoration, Transformation and Growth
April 2015
Bermuda
1
Message from Mark Fisher, President and CEO of CGLR
On April 26-28, 2015, CGLR is hosting the firstever Great Lakes Economic Forum in Chicago,
Illinois. This landmark event in the GLSLR will
bring business, political, and government leaders
together alongside experts from academia and
the non-profit community to share insights on
the most pressing economic policy issues facing
the region.
On its own, the region is an economic powerhouse and key
to Canada, the United States, and North America as a whole,
crucial for increasing our mutual competitiveness and
economic output in today’s aggressively borderless climate
of global trade and commerce.
But in restoring, transforming, and growing the region’s binational economy, we must confront a number of challenges:
•Assembly-line manufacturing will no longer be the
centerpiece of our region’s future economic expansion;
•Border protection in the aftermath of 9/11 and
government rules that default to protectionism have made
the border less permeable;
•Regulatory practices are choking and fragmenting
supply chains;
•Our infrastructure is crumbling at a time when public
finances are increasingly constrained; and,
•Unemployment remains stubbornly high in many
communities throughout the region, especially for youth.
There is hope. The region’s indomitable spirit, foundation
of hard work, and ability to find new policy choices
across a broad spectrum of economic activities including
infrastructure modernization, workforce development, labor
mobility, energy, and multi-modal logistics and services, will
set the stage for a new and exciting economy.
We will need to collaborate more than ever to identify new
solutions, fortify the region’s strategic advantage, and be
able to capitalize on emerging opportunities within North
America and around the world.
The first Great Lakes Economic Forum, From Partnership Flows
Prosperity, is our moment to define an ambitious and practical
regional economic agenda that will drive us forward. Every
business, level of government, organization, and individual
has an important role to play in this process.
2
As Joseph Schumpeter, author of Capitalism, Socialism and
Democracy notes, we must accept change from the old ways
to make room for the new. This paper is intended to spur
dialogue by framing the core themes and issues that will be
discussed and debated at the economic forum:
•Building Together: Advanced Manufacturing — Great
Lakes Energy Future — Workforce Development and
Labor Mobility
•Moving Together: Multimodal Logistics — Border
Management — Infrastructure Modernization and
Financing
•Innovating Together: Regulatory Cooperation —
Economic Clusters — Blue Economy
The region’s indomitable spirit,
foundation of hard work, and ability
to find new policy choices across
a broad spectrum of economic
activities will set the stage for a
new and exciting economy.
Further, this paper builds upon the considerable research
that has already been conducted with respect to the state
of the GLSLR economy, its unique assets, and an agenda
for the future as outlined in seminal pieces like the
Brookings Institution’s The Vital Connection: Reclaiming Great
Lakes Economic Leadership in the Bi-National US-Canadian Region.
The authors argued then, as CGLR argues now, that
Canada and the United States should harness the full
potential of the GLSLR, recognizing this will only take place
with serious political leadership and purposeful action from
both countries.
_____________________________
Restoration, Transformation and Growth
April 2015
3
The Great Lakes – St. Lawrence Region
1
In January 2015, the International Monetary
Fund (IMF) revised its October 2014 global
growth projections downward, to 3.5 percent,
on account of a revised assessment of
prospects in China, Russia, the Euro zone,
and Japan. While economic activity is boosted
by the lower oil price, significant downside
risks remain, including shifts in sentiment
and volatility in global financial markets,
particularly emerging markets.2
Black Rock CEO Laurence Fink, at this year’s World
Economic Forum in Davos, Switzerland, noted there is more
pessimism about the state of the global economy than there
was at the same meeting last year. 3
However, in a volatile global economy, North America in
general and the United States in particular are bright lights.
The United States is the only major economy for which the
IMF raised growth prospects in its 2015 World Economic
Outlook update, suggesting that the United States is “again
the engine of global growth,”4 which, at its core, is fuelled by
trade with Canada and Mexico.
The United States and Canada enjoy the largest trade
relationship in the world, trading $782 billion in goods and
4
services in 2013. Two-way trade has tripled since the signing
of the Canada-U.S. Free Trade Agreement in 1989.
Trade and investment have also expanded in North America as
a result of the North American Free Trade Agreement (NAFTA),
which came into force in 1994. The region’s trade grew from
less than USD$300 billion in 1993 to more than USD$1.1 trillion
in 2013,5 evidence of the advantages of close proximity, shared
business cultures, and integrated supply chains.
Recent developments present new opportunities for the
North American economy, including: energy and fiscal
reforms underway in Mexico, a boom in unconventional
hydrocarbon production that has put North America in
a leading position in global energy production, and a
resurgence of manufacturing due in part to reshoring of
investment back from China.6
Within the broader context of a re-invigorated U.S. and
North American economy is the growing importance of
economic sub-regions. The largest and most dynamic of
these is the GLSLR, which comprises two provinces (Ontario
and Quebec), eight states (Illinois, Indiana, Minnesota,
Michigan, New York, Ohio, Pennsylvania, and Wisconsin),
over forty First Nations, and numerous city and municipal
governments, including several with global impact such as
New York, Chicago, and Toronto.
Sub-regions are critical because they are the most likely
units of economic organization, especially for small and
medium-sized enterprises. Organizing companies and
supply chains on a sub-regional basis makes sense because
the production cycle is sensitive to distance — fuel costs,
shipping time, etc. — especially when moving intermediate
goods through a geographically disaggregated production
cycle.7 Thus, from its vantage point as an economic subregion, the GLSLR is a driver of North America’s trade with
the rest of the world.
The region is home to leading research universities,
colleges, and educational institutes that are critical for talent
development and retention.9 19 of the top 100 universities
in the world are Great Lakes institutions.10 Combined,
the region produced 47% of university graduates in both
countries (2010).11
Academic institutions in the GLSLR collaborate with a largescale private sector research sector.12 In 2011, the U.S. portion
of the Great Lakes Region accounted for nearly 24.1% (US
$70,866 million) of the total research and development funding
in the country. The Canadian portion accounted for nearly
72.1% ($22,694 million) of the total research and development
funding in Canada,13 and generated 26.2% and 68% of patents
in the United States and Canada respectively (2012).14
“Cities and regions are competing with each other
in the global economy more so than national states.
Many regions are not within a single national state,
but are instead located at international borders and
transcend national territorial boundaries.”8
In terms of natural assets, the GLSLR is a bastion of
biodiversity, ranging from boreal forests and lakes to
wetlands and marshes. The region sustains one-fifth of
all fish species in North America, hundreds of millions of
migratory birds, and many other species.15 The great lakes
themselves contain 84% of North America’s water supply and
about 20% of global fresh water supply. The natural bounty of
the region is the basis for all its life and activity.
In spite of the image of the region as a declining rustbelt, the
GLSLR has emerged as a dynamic economic region with an
abundance of opportunity. The region accounts for roughly
40 percent of total Canada-U.S. cross-border trade and
approximately one third of total Canada-U.S. two-way trade
with the world.
World-class cities are important for the region as well. Two
of the top five best cities in the world to live in are in the
GLSLR, Toronto (#1) and Montreal (#2), according to a report
by the Economist Intelligence Unit (EIU) that ranks 50 major
cities across the world.16 This is at a time when more than
half of the world’s population now lives in cities. In North
America, the level of urbanization is 84% (EIU).
With a population of 107 million and a GDP of USD $5.2
trillion, if taken as a separate economic unit the GLSLR
would be the fourth largest economy in the world after
the United States, China, and Japan, supporting some 50
million jobs or roughly a third of the combined American and
Canadian workforce.
ONTARIO
MARATHON
HERON BAY
QUEBEC
THUNDER BAY
MICHIPICOTEN
TROIS RIVIERES
TACONITE HARBOR
MINNESOTA
SILVER BAY
TWO HARBORS
DULUTH
SUPERIOR
ONTONOGAN
ASHLAND
QUEBEC
HOUGHTON/HANCOCK
PRESQUE ISLE
MARQUETTE
MICHIGAN
(Upper Peninsula)
PORT INLAND
PARRY SOUND
CALCITE
PRESQUE ISLE
ALPENA
LUDINGTON
SAGINAW
MICHIGAN
PORT WASHINGTON
MUSKEGON
MILWAUKEE
OAK CREEK
WAUKEGAN
CHICAGO
CALUMET
GRAND HAVEN
HOLLAND
ST. JOSEPH
BURNS HARBOR
GARY
BUFFINGTON
INDIANA HARBOR
OGDENSBURG
MIDLAND
BATH
PICTON
BOWMANVILLE
OSHAWA
TORONTO
PORT CREDIT
CLARKSON
GODERICH
HARBOR
BEACH
MANITOWOC
CARDINAL
PRESCOTT
ONTARIO
OWEN SOUND
TRAVERSE CITY
FRANKFORT
PORT GYPSUM
MANISTEE
GREEN BAY
ILLINOIS
VALLEYFIELD
MELDRUM BAY
MACKINAW CITY
CHEBOYGAN
CHARLEVOIX
WISCONSIN
SERPENT HARBOUR
DRUMMOND ISLAND
BREVORT
STRAITS OF MACKINAC
GLADSTONE
ESCANABA
MENOMINEE
MARINETTE
MONTREAL
BRUCE MINES
CEDARVILLE
SOREL
CONTRECOUER
ST. MARYS RIVER
SOO LOCKS
SAULT STE. MARIE
THESSALON
MUNISING
BECANCOUR
HAMILTON
WELLAND CANAL
THOROLD
PORT COLBORNE
ESSEXVILLE
PORT HURON
MARYSVILLE
ST. CLAIR
MARINE CITY
DETROIT
RIVER ROUGE
ECORSE
WYANDOTTE
TRENTON
MONROE
NANTICOKE
PORT DOVER
PORT STANLEY
SARNIA
COURTRIGHT
ST. CLAIR RIVER
PORT LAMBTON
LAKE
ST. CLAIR
WINDSOR
KINGSVILLE
DETROIT RIVER
TOLEDO
MARBLEHEAD
KINGSVILLE
INDIANA
OSWEGO
ROCHESTER
ERIE
CONNEAUT
ASHTABULA
FAIRPORT HARBOR
CLEVELAND
TONAWANDA
BUFFALO
NEW YORK
DUNKIRK
PENNSYLVANIA
LORAIN
HURON
SANDUSKY
OHIO
Source: Chamber of Marine Commerce, modified from www.marinedelivers.com
Restoration, Transformation and Growth
April 2015
5
Building Together
Advanced Manufacturing
Advanced manufacturing entails a shift from production
driven by labour to technology-intensive production, which
requires fewer workers to produce the same output. But
clusters of productivity typically generate more enterprise
activity overall in sectors that are directly or indirectly
dependent on manufacturing.17
As a result, manufacturing employment, which represented
11.9 percent of total employment in the GLSLR in 2013, may
increase over time as advanced manufacturing brings with
it the dual forces of reduced labour requirements and new
manufacturing opportunities in key sectors (e.g. aerospace,
robotics, automotive, food processing, life sciences, plastics
and composites, and fabricated metals).
Even as manufacturing opportunities become available,
technological advancements or other changes in the
economy may mean that direct manufacturing employment
never returns to previous levels in the GLSLR unless reshoring also occurs at a much greater pace than predicted.22
However, longitudinal declines in manufacturing as a
percentage of total employment in the region (Figure 2) have
been, and may continue to be, offset by employment gains in
other sectors, notably education, health care, professional
services (Figure Y).23
Figure 2: Manufacturing Jobs in the GLSLR: 2004-2013
(% of total employment)
15.82 15.56
13.85 14.39 13.81
2004 2005 2006 2007 2008 2009 2010 2011 2012 2013
Source: Bureau of Labor Statistics, United States Department of Labor and
Great Lakes Region
Statistics Canada.
Note: U.S. data are manufacturing as a share of total non-farm employment,
while Canada data are manufacturing as a share of total employment.
Figure 1: What is Advanced Manufacturing?
Advanced manufacturing involves both new ways to manufacture existing
products, and the creation of new products arising from new advanced
technologies.18
The President’s Council of Advisors on Science and Technology defines
advanced manufacturing as “a family of activities that (a) depend on the use
of coordination of information, automation, computation, software, sensing
and networking and/or (b) make use of cutting edge materials and emerging
capabilities enabled by the physical and biological sciences, for example
nanotechnology, chemistry, and biology.”19
Advanced manufacturing is best viewed as a cluster of economic activities
encompassing much more than a single stand-alone enterprise. It has
implications for all facets of research, development, production, sales,
distribution, logistics, customer service, marketing, and support, extending
from the development of physical products to the delivery of services.20
Advanced manufacturing encompasses additive manufacturing (aka. 3D
Printing), robotics, digital manufacturing, and the industrial Internet.21
6
12.61 12.54 12.63 12.70
11.89
Figure 3: Employment trends in Great Lakes Region
Great Lakes Region (2002 = 100)
Employment
Laggards
130
130
120
120
110
All
Sectors
100
Employment
Leaders
Education
and Health
110
100
Construction
90
Manufacturing
80
70
new technologies such as 3D Printing (Box X) and the ability to
expand and adapt these skills for use in other applications.24
All
Sectors
90
Professional
Services
80
70
02
07
12
02
07
12
Source: BMO report (Robert Kavcic).
Claims that there will be fewer jobs in the GLSLR in the 21st
century than there were in 20th century are driven by the
mistaken impression that the 21st century GLSLR economy
will look like it has in the past. There are jobs; they just exist
in different sectors and have different characteristics.
It is no longer realistic to expect lifelong employment on an
assembly line following high-school graduation. The modern
labor force will require advanced skills that enable the use of
Success in the 21st century economy also depends on our
ability to be more productive.29 As the Conference Board of
Canada notes, productivity depends on dynamics at multiple
levels, including firm-specific activities related to investment
in physical capital.
One of the central challenges holding firms back from
increased productivity and innovation in manufacturing,
particularly in advanced manufacturing, has been the lack
of knowledge surrounding investments in new machinery,
equipment and technology, and limited application of
advanced information technologies. While the onus is on
workers to focus on skills development and lifelong learning,
it is also on employers to stay at the leading edge of valuecreating technologies.
Discussion Questions
1) What does your company need to accelerate
the shift to advanced manufacturing?
2) What are the benefits of integrating additive
manufacturing into your business?
3) How can government support bi-national
manufacturing R&D and commercialization?
Figure 4: The Transformative Prospects of 3D Printing (3DP)
3D printing has the potential to revolutionize the way we make almost everything.
The next industrial revolution in manufacturing will happen in America. — PRESIDENT BARACK OBAMA
3DP, or “additive manufacturing,” is transforming traditional manufacturing and accelerating the shift from mass
production to customization.25 American and Canadian manufacturers, big and small, are discovering the potential for
3DP technology to improve traditional manufacturing processes and to produce products that were virtually impossible
(or prohibitively expensive) using traditional methods.26 In a PWC survey of over 100 U.S. industrial manufacturers in
the United States, two thirds said they are currently implementing 3DP in some way and one in four said they plan to
adopt 3DP in the future.27
3D printing has emerged as one of the more visible aspects of the broader
wave of information and communications technologies that are empowering
business processes in manufacturing and beyond. Advanced 3D design software
increasingly enables modeling, prototyping, outsourcing, and testing to be done
virtually. Timelines from conception to delivery are being compressed, and product
adoption quickened.
America Makes was established in Youngstown, Ohio in 2012 as the pilot hub for
the National Network for Manufacturing Innovation (NNMI). America Makes’ focus
is to accelerate the adoption of additive manufacturing technologies in the U.S.
manufacturing sector and to increase domestic manufacturing competitiveness.
Its extensive network includes than 100 companies, non-profit organizations,
academic institutions, and government agencies.28
Restoration, Transformation and Growth
April 2015
7
Workforce Development and
Labor Mobility
There is immense human capital in the GLSLR ready
to take advantage of the opportunities in advanced
manufacturing, other knowledge-based sectors of our
economy, and in skilled trades. However, in order to build
the advanced workforce of the future, it will be critical to
support and invest in science, engineering, technology, and
math, together with creative thinking and hands-on skills
development, at all levels of learning.
High-quality post-secondary training and the concentration
of skills in urban areas give the GLSLR advantages over
other regions, but there are still skills shortages as
employers struggle to deploy the right talent to the right
areas at the right time. One of the major impediments to
business growth and infrastructure development is the
shortage of skilled trades workers available for deployment
when and where they are required. Employers report that
shortages in skilled trades are the number one barrier to
Canadian competitiveness.30
The changing nature of work to shorter-term, projectoriented employment, an aging workforce, and the shift from
traditional to advanced manufacturing are all factors that are
exacerbating the shortage in skilled trades in parts of the
economy and the GLSLR.
those in certified professions face a quagmire of different
certification requirements to do the same job in the eight
states and two provinces of the region.
In addition to certification and licensing, workers in the
region face border and immigration challenges. Even
though Canadian and American workers can utilize various
visa, intercompany transferee, or temporary worker
programs, dozens of issues impede labour mobility.
Crossing the border for work, whether for an hour or a
year, is not for the faint of heart or ill prepared. Employers
and employees avoid it whenever possible, creating
supply chain inefficiencies and diminishing regional
competitiveness. Some of the irritants include:
• Border delays related to paperwork;
•Burdensome or unclear procedures for low-risk business
travellers;
•Delays in identifying labor market needs and occupational
requirements;
• Health and safety equipment issues; and,
• Difficulty in obtaining waivers for minor criminal offences.
Discussion Questions
1) What skills do you see absent in today’s
workforce?
2)How do you see your labor needs changing?
3)Should business and government work more
closely to address skills gaps? If so, how?
4)Can labor market access rights — the right to
work in multiple jurisdictions — be separated
from citizenship rights?
5)Are there practices and models from
other jurisdictions that could be emulated
successfully here?
Energy
The U.S. and Canada enjoy the largest energy trade
relationship in the world and Canada is the single largest
foreign supplier of energy to the United States.
The problems faced by sectors characterized by shortterm deployments, such as construction, engineering,
after-sales service, and information technology, face
challenges that are particularly acute. The ideal situation
would be unimpeded labor mobility throughout the region,
but the reality is quite different. Skilled workers and
8
The North American energy landscape has been transformed
since 2008 with the development of vast shale oil and gas
reserves in the United States and the continued expansion
of oil sands production in Canada. In 2013, the United States
produced more oil and gas combined than any country in the
world, ahead of both Russia and Saudi Arabia.
Cheaper energy inputs driven by booming oil and gas
production in the United States and Canada are having
a profound effect on industries from petrochemicals
to steel manufacturing in both countries. In the United
States, maturing shale gas development is boosting U.S.
manufacturing through significant cost savings and job
creation.31 Lower natural gas prices benefit manufacturing
in two ways: both in direct use and indirectly when electricity
generators pass on savings to industrial customers.
both provinces sell surplus electricity to bordering states via
a high voltage grid. Access to cheap and abundant electricity
has been a vital feature of the region’s industrialization and
will be a crucial component of its revitalization.
The region is home to substantial shale gas reserves,
namely the Marcellus and Utica shale plays, but the
states and provinces of the GLSLR have adopted differing
positions regarding shale gas development. While New York
and Quebec have a moratorium on hydraulic fracturing,
neighboring Pennsylvania has moved forward aggressively
with shale gas development.
Natural gas is expected to play an increasingly important
role in the region, driven by mandates to close coal-fired
power plants and the sustained low price of natural gas due
to in part to high levels of production.
Across the globe, total renewable generation capacity is
forecast to grow as technology costs drop and governments
strengthen policies to combat climate change. In this regard,
provincial, state, and municipal governments are looking
at ways to get involved in the renewable sector, both as a
source for clean energy and to create jobs and economic
growth (e.g. In 2012 clean technology was Canada’s
fastest growing industrial sector).33 The opportunities for
deployment of renewable energy are vast, especially in
transportation, industry and building management, and
when combined with effective energy conservation and
efficiency standards.34
“On a North American side — the availability of shale
gas is changing the whole landscape for our industry.
What it is doing is giving us an energy competitiveness
as a North American manufacturer that we have not
seen in decades.”
— RICHARD PATON, PRESIDENT AND CEO OF
THE CANADIAN CHEMISTRY INDUSTRY ASSOCIATION.32
On top of this, Mexico recently opened its energy sector
to foreign investment, a move that is expected to lead to
increased production of hydrocarbons from that country.
North America’s dependence on energy imports is dwindling
and the region may one day be a net energy exporter. GLSLR
business and policy leaders will have to think seriously about
how the region fits into this new continental energy market.
The GLSLR is a strategic North American energy market and
transit corridor with assets in production, distribution, and
exploration of fossil fuels, nuclear power, and renewable
energy. The region is powered by a diverse mix of sources
including nuclear, coal, and hydroelectricity. Nuclear and
hydroelectricity are predominant in Ontario and Quebec and
However, as stated by the International Energy Agency, the
importance of "predictable, effective national policies to
encourage investment, greater coordination to encourage
the integration of renewables, and a common understanding
on the future of nuclear power"35 cannot be overstated. But,
like so many policy areas, action with respect to expanding
the GLSLR energy mark in a North American context will
require regional and national consensus.
Discussion Questions
1)Should the GLSLR have a regional energy
strategy? How can the region reconcile
divergent approaches to energy development?
2)Are there areas where jurisdictional
differences create extra costs and diminish
competitiveness?
3)What are the areas of opportunity for greater
collaboration on energy research and
technology?
4)What are the action items needed to
improve cross-border energy infrastructure,
inter-operability, and trade?
Restoration, Transformation and Growth
April 2015
9
Moving Together
Border Management
Today, 38.1 million jobs in the U.S. depend on trade36 while
one in five Canadian jobs is linked to exports.37 We are each
other’s largest trading partners, with over $600 billion
worth of two-way trade in goods and services in 2013.
Each year, the GLSLR generates approximately $184
billion in two-way trade, which accounts for approximately
one third of Canada-U.S. trade with the rest of the world
(2013 figures).38
What’s more, aside from the significance of the GLSLR
with respect to the volume and value of trade passing
through this continental gateway, four out of the five
busiest land crossings between the U.S. and Canada
are located in Ontario, with more trade flowing between
Windsor and Detroit than through any other border
crossing in the world.39
It is difficult to overstate the importance of free flowing
goods and efficient border management for the GLSLR. The
Government of Canada estimates conservatively that border
management policies that thicken the border cost the
Canadian economy $16 billion a year.40 A Fraser Institute
report (2012) also makes a clear link between additional
administration costs attributable to border security and
crossing wait times and negative affects on bilateral trade.41
Properly trained people are an important part of a smart
border. For example, U.S. estimates suggest that the
addition of one extra Customs and Border Protection
staff member to facilitate border crossings generates an
additional USD$2 million in U.S. GDP.42 Technology and data
are also crucial elements.
In 2011, President Obama and Prime Minister Harper
announced the Beyond the Border Action Plan (BTB) in
order to reduce barriers to the movement of goods and
people between the two countries.
BTB has provided a good first step to reducing delays
by attempting to move certain activities, such as cargo
inspection, away from the border, and reducing inspection
duplication through the principle of “inspected once,
cleared twice.” However, despite the gains that are
speeding up legitimate trade and travel, there is still a gap
between the objectives of high-level initiatives like BTB and
the realities of moving goods and people across the border.
A 2014 survey by the Canadian Employee Relocation
Council identifies ongoing problems for business travelers,
especially the failure to consistently apply rules at the
border and officials who are not aware of the needs of
business travellers.43 Shippers face many of the same
challenges and have added worries about the slow pace of
pilot projects involving pre-inspection, pre-clearance, and
single window programs that could lead to the adoption of
new practices and technology in freeing up the movement
of goods. 44
The region is home to an expansive network of highways
and rail lines, some of the world’s busiest international
airports, a growing number of world-class ports and the
bi-national St. Lawrence Seaway that connects North
American industry to Europe, South America, the Middle
East, and Africa.
10
In the early days of NAFTA, we proudly claimed that
automotive components crossed the borders many times
during the production of finished vehicle. This was evidence
that North America was becoming a seamless, integrated
market. Now, border and regulatory delays diminish this
advantage. A North American vehicle is subject to customs
inspections dozens of times, but a vehicle entering North
America from China is inspected only once.
The reduction of tariffs through the trade agreements of
the 1980s and 1990s made a significant contribution to
North American competitiveness by reducing transaction
costs. Today, while big data analytics have helped to
create risk assessment models to help customs officials
target likely offenders and make most crossings faster
and more routine, we need to find ways to eliminate, as far
as possible, border-related transaction costs so that we
can function as a truly integrated market in a borderless
global economy.
Discussion Questions
1)What is your vision of the border?
2)Has the BTB had a positive impact on your
business in the first three years of operation?
Successes? Ongoing challenges?
3)Are there dimensions to the border that are
unique to the GLSLR that could be addressed
by better partnerships between federal
authorities and key stakeholder groups? If
so, what are they and is there avenue to bring
these interests together?
4)Should we be doing a better job of engaging
federal as well as state/provincial legislators
on border issues?
5)Can we be more ambitious than NAFTA? Will
a Trans-Pacific Partnership force accelerated
NAFTA changes?
Figure 5: Overview of Multimodal logistics assets in GLSLR
Marine 15 large international marine ports
Transportation and 50 regional marine ports,
the Great Lakes — St. Lawrence
Seaway System (GLSLSS) and its
19 locks, and a network of inland
waterways, including, in particular,
the Mississippi River with its major
tributaries of the Ohio and Illinois
Rivers.
Rail Seven Class 1 railways, totalling
Transportation 30,778 miles of track and 68
intermodal terminals, several short
lines, and rail border crossings.
Road Extensive highway system and
Transportation several border crossings. In the
U.S., key north-south highways
include I-35, I-55, I-65, I-75, and
I-95 and on the east-west axis, I-70,
I-80, and I-90. In Canada, key freight
highways are east-west along the
St. Lawrence River and northern
edge of the Great Lakes.
Air The GLSLB serves as one of North
Transportation America’s major air cargo hubs and
includes 36 of North America’s 156
airports that handle over 10,000
tons of cargo per year. The GLSLB’s
20 largest airports make up 95.2%
of the regional air cargo traffic.
Major freight airports include
Chicago O’Hare and
Toronto Pearson.
Pipeline A network of pipelines in the
Transportation GLSLB moves a range of fuels and
Multimodal Logistics
The GLSLR is home to one of the world’s most interconnected and integrated multi-modal systems, from
the United States’ largest rail hub in Chicago to the vast
network of airports, roads, pipelines, ports, and waterways
(Figure X) that move major commodities including coal, iron
ore, agricultural and food products, automotive parts and
machinery, and petroleum products.
petroleum products including crude,
gasoline, and natural gas. these
pipelines are privately owned and
operated by energy companies.
Source: National Cooperative Freight Research Program, “Report 17:
Multimodal Freight Transportation Within the Great Lakes — St. Lawrence
Basin,” (2012).
Put simply, it is an economic platform that ties every aspect of
commerce in the region together and connects the region to
the North American marketplace and the rest of the world.
Restoration, Transformation and Growth
April 2015
11
The economic impact of this system on the GLSLR is
staggering. According to a report prepared for the U.S.
Transportation Research Board, the direct and indirect
impacts from freight transportation industries in the
region accounted for 3.8 million jobs, USD$627 billion in
gross output, USD$311 billion in gross domestic product,
USD$200 billion in personal income, and USD$87 billion in
taxes in 2007.
Further, this system plays a critical role in supporting
America’s and Canada’s global trade agenda. Almost 25
percent of marine traffic in the Great Lakes-St. Lawrence
Seaway system travels to and from overseas ports in Europe,
the Middle East, and Africa.45 In 2014, a new ClevelandEurope scheduled liner service was launched and the firstever international cargo shipments passed through the Port
of Munroe.46 This is a promising development in the U.S.
Administration’s desire to conclude a Transatlantic Trade and
Investment Partnership with Europe and the recent conclusion
of negotiations between Canada and the European Union on a
Comprehensive Economic and Trade Agreement.
Serious constraints and barriers in the
multi-modal system exist in the form of hard
infrastructure constraints (e.g. congestion and
age) and regulatory and operational issues
that hinder the free movement of goods and
commerce in the region.
Capacity bottlenecks are a particular challenge for road and
rail modes around major hubs. On the other hand, there is
untapped potential for greater utilization of the region’s air
and water modes, both of which have excess capacity.
Jurisdictions with access to competitive transportation
infrastructure and services, and who are able to fully optimize
all-modes, are at a distinct strategic advantage in attracting
investment, creating jobs and realizing economic growth.
Short Sea Shipping on the Great Lakes
St. Lawrence Seaway System
The Great Lakes-St. Lawrence Seaway (GLSL)
system is 3700 kilometres (2300 miles) in length
with 110 ports.
It is a crucial transportation link for trade
between North America and more than 59
overseas ports.
The seaway provides a cost-effective option for
cargos from Europe. (The port of Detroit is closer
to Rotterdam than to the Port of New Orleans.) 47
Every year, 164 million tonnes of cargo is shipped
on the GLSL system, generating some $34 billion
in economic activity. 48
Every 10,000 tons of cargo handled by a Great
Lakes port translates into half a million dollars of
economic benefit to the port community.49
Shipping provides 227,000 jobs in North America
(99,000 in Canada). 50
A Great Lakes freighter can carry one ton of cargo
607 miles (800 km) on one gallon of fuel. 51
12
“When it comes to rail traffic, Chicago is America’s
speed bump. Shippers complain that a load of freight
can make its way from Los Angeles to Chicago in 48
hours, and then take 24 hours to travel across the
city. A recent trainload of sulphur took some 27 hours
to pass through Chicago — an average speed of 1.13
miles per hour, or about a quarter the pace of many
electric wheelchairs.”52
Discussion Questions
1)Why are shippers and shipping lines
not making better use of the maritime
transportation system in the GLSLR?
2)What are the barriers to optimizing
transportation choices in the GLSLR?
3)What interests and incentives need to be
better addressed/aligned to make better use
of marine transportation in the GLSLR?
3)Would a regional multi-modal vision and
strategy for the GLSLR help to move freight and
remove bottlenecks? How would this work?
Infrastructure Modernization
and Financing
The GLSLR economy of today and the future requires
significant investment in public and private infrastructure.
The need for renewal applies to the wide range of physical
assets in the region, from our waterways, roads, bridges, rail
lines, airports and energy systems to our drinking water and
wastewater facilities.
The costs of renewal are astounding. McKinsey estimates
that $57 trillion will be needed by 2030 in order to keep pace
with projected global GDP growth.53 By 2020, it is estimated
that the infrastructure investment shortfall for the U.S.
will be USD$1.6 trillion.54 According to the Federation of
Canadian Municipalities, Canadian cities have an existing
infrastructure deficit of $172 billion.55
Important steps are being taken in the region to invest in
the critical corridors that support the movement of goods
throughout the region. For example, a January 2015 survey
by Martin Associates finds that a total of $7.1 billion is being
invested in asset renewal and modernization of vessels,
ports and terminals, and waterway infrastructure in the
Great Lakes-St. Lawrence seaway navigation system.56
Yet, like many parts of the United States and Canada,
the GLSLR continues to face challenges with respect to
building and renewing public infrastructure, particularly as
governments at all levels struggle to keep pace with growing
demands for improved infrastructure and better services at
a time of increasing government debt and tighter controls on
operating budgets.
Compounding these challenges is the reality that traditional
approaches to financing will not suffice. By giving the private
sector a role alongside government in designing, building,
financing, operating and maintaining public infrastructure,
we can harness private sector know-how, ingenuity and
capital in eliminating the region’s infrastructure deficit
and investment gap, providing we have the right rules and
administrative structures in place to manage contracts
between government and business. Such relationships would
likely need to involve alternative financing and procurement
(AFP) delivery models — or public-private partnerships (P3s)
— and other innovative financing mechanisms.
AFPs are a proven and effective means of addressing the
public infrastructure deficit. Based on a review of P3s in
operation or under construction in Canada from 20032012, which was commissioned by the Canadian Council
for Public Private Partnerships, the implementation of P3s
contributed to the creation of 517,430 full-time equivalent
jobs, the disbursement of $32.2 billion in total income/wages
and benefits, and the addition of $48.2 billion to total gross
domestic product. The use of P3s also supported the levying of
$7.5 billion in tax revenue, and $9.9 billion in total cost savings.
The use of AFPs in the GLSLR, however, has been slow
compared to many other jurisdictions. This is why the CGLR
announced a commitment to action at CGI America that will
identify ways of creating a more enabling environment for
AFPs in the region. This work will complement other efforts
aimed at encouraging private sector involvement in renewing
public infrastructure in the United States and Canada, such
as the Build America Investment Initiative, the National
Governors Association’s State Resource Center on Innovative
Infrastructure Strategies, and the Building Canada Plan.
In addition to AFPs, the quality of information sharing
pertaining to regional growth and infrastructure planning
is uneven in the GLSLR and the prioritization of investment
decisions for large-scale transportation projects that cross
jurisdictional boundaries is mostly uncoordinated. Planning
and investment decisions occurring in silos and weak
communication encumber our ability to boost the region’s
competitive edge and secure its long-term success in
globalized economy.
Discussion Questions
1)Are legislatures and federal, state/provincial
and city governments doing enough to explore
new ways of successfully delivering modern
infrastructure?
2)When is it effective for government to
partner with the private sector to deliver
infrastructure, and how can government and
business structure their partnerships to make
investments?
3)What are the some of the barriers that are
limiting the opportunity for governments
and businesses to work together on new
infrastructure investments?
4)How can investment in infrastructure become
a driver for economic development in the Great
Lakes region?
5)Do we have the right mechanisms in place to
facilitate closer cooperation on sharing best
practices with respect to innovative financing
and procurement models as well as regional
growth planning and the prioritization of
regional infrastructure investments?
Restoration, Transformation and Growth
April 2015
13
Innovating Together
Economic Corridors and Clusters
The GLSLR gateway, which is
defined by well-established
trade corridors, provides a
critical link to continental
and global markets. Over
the last decade, we have
witnessed the development of
clusters of innovation within
the region’s metropolitan
areas, from life sciences
and aerospace to ICT and
automotive.
An industry cluster is “a
group of firms and related
economic actors and institutions that are located near one
another and that draw productive advantage from their
mutual proximity and connections.”57 Clusters are a key
organizational unit for understanding and improving the
performance of regional economies.58
Clusters break the rules of vertical integration where a firm
performs all necessary functions in-house, and as Porter
argues, the existence of a cluster may go unrecognized.59
Clusters are important for regions because they generate
wealth, exports, jobs, and information. Firms gravitate
towards clusters because they provide economies of scale,
productivity advantages, marketing, and other competitive
advantages.60
The economies of scale that come from clusters reduce
costs, expand pools of shared labor and expertise, and
create positive synergies that spill over from one successful
enterprise to the next.61
The value of clusters lies in the potential for entire value
chains to be situated within a cluster, which are increasingly
extending across the border: manufacturing, research,
suppliers, distributors, academic institutions, support
services, and so forth.62 This creates efficiency and spillover
benefits and has the greatest potential for sustainability.
As the recovery from the Great Recession is firming up
in both the United States and Canada, the physical and
psychological barriers imposed by an international border
within the GLSLR have challenged clusters that would
14
normally emerge on the basis of geographic proximity. The
border has reduced the expansionary prospects of clusters in
some cases, but enterprises that have invested the time and
resources to overcome border barriers have been rewarded.
Discussion Questions
1)What can we do to promote cluster formation,
growth, and connectivity across the Great
Lakes states and provinces?
2)What lessons are there from the massive
cross-border automotive cluster?
3)How do we work together to strengthen the
region’s trade corridors?
Blue Economy
Water, water, everywhere! The Great Lakes, containing
roughly 21 percent of the world’s and 84 percent of North
America’s fresh water, form the largest group of freshwater
lakes on earth. They are often referred to as inland seas
because of their size and natural processes. However, as
large as they may be, only one percent of the waters of the
Great Lakes are renewed annually by precipitation, run-off
and groundwater. So while they are large, it doesn’t take
much to put them at risk.
The development of a blue economy epitomizes the triple
bottom line for the GLSLR: people, prosperity, and planet.
Effective stewardship of the lakes is therefore critical,
not only in terms of protecting the region’s natural places
and preserving our outdoor lifestyle, but also our future
prosperity. The lakes have been the foundation of the
region’s industrial economy and will be at the center of
global trade for decades to come.
The blue economy focuses on sustainable usage of shared
resources. This principle is key to the larger restoration
economy that we envision for the GLSLR — one in which
our physical, social and cultural assets are preserved and
where the legacies of past success become the seeds for
future prosperity through the development of new green
technologies and the export of services in areas like
remediation, environmental engineering, and sustainable
land use planning.
As illustrated at the Great Lakes-St. Lawrence Region
Summit in 2011, nascent blue economy initiatives exist
throughout the region, such as in Milwaukee, Cleveland,
southwestern Ontario and many parts of Michigan, but
they are not well networked with each other. As indicated
in 2011, this sector needs to reach its full potential in
attracting investors, exposing its products or tapping into
global networks.
Regulatory Cooperation
The United States and Canada have world-class regulatory
systems, but differences between regulations have
emerged over time as our integrated economies evolved
independently. These differences increase costs in an
integrated supply chain, raise the administrative burden on
business, and hinder cross-border trade.
The bi-national Regulatory Cooperation Council (RCC) was
introduced in tandem with the BTB. It brought together
federal regulators and businesses from both countries to
make inspection and certification practices more efficient
in 29 areas with a focus on four sectors: agriculture,
transportation, health and personal care products, and the
environment. The ultimate goal of this process is to reduce
and eliminate duplicative and unnecessary regulatory
requirements.
The experiment has yielded some successes in harmonizing
regulations in areas such as dangerous goods, motor
vehicle safety, and energy efficiency, but in other areas (e.g.
preclearance, marine safety and environmental standards),
progress has been slow. This has caused groups like the
Canadian Chamber of Commerce to call for a broader and
more institutionalized approach to regulatory harmonization
that would go beyond the RCC.63
Stakeholders outside of the 29 focus areas are virtually
unaware of its existence. The second phase of the RCC is
moving from a product focus to a regulator focus, mandating
that federal regulators meet regularly and agree to align
standards and practices wherever possible. This should
help to more deeply embed the practice of cooperation and
increase access and awareness by other stakeholders.
Discussion Questions
Discussion Questions
1)What is the best way to encourage networking
between the region’s blue economy clusters
and collaboration with the region’s academic
institutions?
1)Will the new approach yield broader results?
Can a slow, technical initiative maintain the
political momentum it needs to survive in the
long term?
2)What areas of the blue economy show
the most promise in terms of investment
attraction or product development in the short
to medium term?
2)If not, how can we build more durable
mechanisms for information sharing and
regulatory alignment?
3)Should we launch an annual international Blue
Economy Summit and Expo in the Great Lakes
to showcase the region as a world leader in
the blue economy?
3)Are there unnecessary or duplicative state,
provincial or municipal regulations that create
additional burdens on the GLSLR?
4)If so, should we elevate these issues to the
RCC or establish a separate regional process
to address them?
Restoration, Transformation and Growth
April 2015
15
Conclusion
The GLSLR has a wealth of assets including integrated
transportation infrastructure, diverse ecosystems,
innovative capacity and pools of talented workers. The
region has taken a monumental step into the future as a
distinct, unified sub-region, but much more work needs to
be done in order to build the region together, move goods
together, and innovate together.
The barriers to our future prosperity are real, and growing
policy fragmentation in key areas such as transportation,
energy, and infrastructure hinder the region’s ability to
capitalize on new and emerging opportunities. The Council
of the Great Lakes Region seeks to facilitate communication
and consensus building so that stakeholders throughout the
eight states and two provinces can restore, transform and
grow the bi-national Great Lakes St. Lawrence economy.
If you are interested in becoming a member of the Council of the
Great Lakes Region and/or a financial sponsor of its events and
research projects, please contact:
Mark P. Fisher, President and CEO
Council of the Great Lakes Region
Phone: (613) 668-2044
E-mail: [email protected]
720 Spadina Avenue, Suite 218 Toronto, Ontario, Canada M5S 2T9
11075 East Boulevard, #245A Cleveland, Ohio 44106
16
Acknowledgments
The Council of the Great Lakes Region would like to
thank the staff at Dawson Strategic for their assistance in
preparing this report.
Endnotes
1 All figures in Canadian dollars unless otherwise noted.
2 International Monetary Fund, “Cross Currents,” World Economic Outlook Update (January 19, 2015).
3 Remarks by Laurence Fink. World Economic Forum.
4 Rich Miller, “U.S. Retakes the Helm of the Global Economy,” Bloomberg Business (January 1, 2015).
5 Council on Foreign Relations, “Building a North American Community,” Task Force Report No. 53.
6 A good example of reshoring is Whirlpool’s decision to move its commercial washing machine production from Monterrey,
Mexico to Clyde, Ohio. For other case studies of American manufacturing companies reshoring operations back to the United
States, see the Reshoring Initiative website at: http://www.reshorenow.org/case-studies/.
7 Richard Baldwin, “WTO 2.0: Global Governance of Supply Chain Trade,” Centre for Economic Policy Research, Policy Insight No. 64
(December 2012).
8 J.D. Synder, et al. “Global Models of Binational Regional Collaboration: The Potential for Great Lakes Regional Innovation.”
Center for Community and Economic Development (Michigan State University, May 2014), 1.
9 For a detailed analysis of the R&D and human capital assets of the region, please see ‘The Vital Connection’ by Austin et al.
10 Times Higher Education, World University Rankings 2014-2015 (2014).
11 Author’s calculations with data from U.S. Department of Education, New State-by-State College Attainment Numbers Show Progress
Toward 2020 Goal, July 2012; Higher Education Quality of Council of Ontario, Quick Stats — Section 5 — Graduate Outcomes; and
Institut de la statistique du Québec, Gender gap in university completion exceeds 10 percentage points in favour of women among those
aged 25 to 34, December 2014.
12 John Austin, Elaine Dezenski, and Britany Affolter-Caine, “The Vital Connection: Reclaiming Great Lakes Economic
Leadership in the Bi-National US-Canadian Region.” Metropolitan Policy Program, The Brookings Institution. (March 2008).
13 National Science Foundation, Business Research and Development and Innovation Survey: 2011(December 2014); and Statistics
Canada, Domestic spending on research and development (GERD), funding sector, by province (Canada), 2011(December 2014).
14 Author’s calculations with data from U.S. Patent And Trademark Office, Patents By Country, State, and Year — All Patent Types
(December 2013) and Canadian Intellectual Property Office, A Foundation for the Future: Canadian Intellectual Property office
Annual Report 2011-12 (2012).
15 Joshua Hjartarson, Matthew Mendelsohn, Allison Bramwell, and Kelly Hinton, “The Vital Commons: An Agenda for the Great
Lakes — St. Lawrence Region,” (Mowat Centre, June 2011). .
16The Economist, “Safe Cities Index 2015: Assessing urban security in the digital age.” Economist Intelligence Unit (2015).
17 U.S. National Institute of Standards and Technology, “U.S. Manufacturing in Context,” Advanced Manufacturing Portal.
18 The Economist, “A third industrial revolution,” Special Report: Manufacturing and Innovation (April 21, 2012).
19 President’s Council of Advisors on Science and Technology, “Report to the President on Capturing Domestic Competitive
Advantage in Advanced Manufacturing,” Executive Office of the President (July 2012).
20 Deloitte LLP, “City of Hamilton: The Current and Future State of Hamilton’s Advanced Manufacturing Sector” (October 2013), 11.
21 Boston Consulting Group, “Takeoff in Robotics Will Power the Next Productivity Surge in Manufacturing,” Press Releases
(February 10, 2015).
22 KPMG LLP, “Canadian Manufacturing Outlook 2014 — Leveraging Opportunities, Embracing Growth” (2014).
Restoration, Transformation and Growth
April 2015
17
23 Robert Kavcic, “Great Lakes Region: North America’s Economic Engine” BMO Special Report (Bank of Montreal, April 2014).
24 Conference Board of Canada, “Advanced Skills and Innovation,” How Canada Performs: Hot Topics (June 2011).
25 The Economist, “3D Printing Will Disrupt Manufacturing,” GE Look Ahead Blog (2015).
26 PricewaterhouseCoopers LLP, “3D printing and the new shape of industrial manufacturing” PricewaterhouseCoopers LLP
(June 2014), 1.
27 PricewaterhouseCoopers, “Shale gas: Still a boon to US manufacturing?” PricewaterhouseCoopers LLP. December 2014, p. 1.
28 America Makes, Mission Statement.
29 Measured by units of output per unit of input.
30 Canadian Chamber of Commerce, “Barrier 1: Skills Shortages,” Top 10 Barriers to Competitiveness 2014 (2014).
31 PricewaterhouseCoopers. “Shale gas: Still a boon to U.S. Manufacturing?” PricewaterhouseCoopers LLP (December 2014).
32 Dina O’Meara, “Natural Gas and Canada’s Manufacturing Renaissance,” Energy Magazine (2015).
33Analytica Advisors, “2014 Canadian Clean Technology Industry Report” (2014).
34 International Renewable Energy Agency, “Renewable Energy Prospects: United States of America,” REmap 2030: A Renewable
Energy Roadmap (January 2015).
35 International Energy Agency, “Energy Policies of IEA Countries: The United States,” 2014 Review (2014).
36 David Thomas, “How the U.S. Economy Benefits from International Trade and Investment,” Trade Benefits America (Business
Roundtable, 2013).
37 Department of Foreign Affairs, Trade and Development Canada, “Global Markets Action Plan: The Blueprint for Creating Jobs
and Opportunities for Canadians Through Trade.” Global Markets Action Plan.
38 Industry Canada, Trade Data Online.
39 Ontario Trucking Association, Freight Economy.
40 Government of Canada, “Beyond the Border Action Plan in Brief,” Canada’s Economic Action Plan.
41 Alexander Moens and Nachum Gabler. “Measuring the Costs of the Canada-U.S. Border,” The Fraser Institute (August 2012).
42 Bryan Roberts, et al, “The Impact on the U.S. Economy of Changes in Wait Times at Ports of Entry: Report to U.S. Customs
and Border Protection,” National Center for Risk and Economic Analysis of Terrorism Events, University of Southern California (April 4,
2013).
43 Stephen Cryne, “Cross Border Mobility,” Canadian Employee Relocation Council Presentation to PNWER Summit (July 22, 2014).
44 Moens and Gabler, 2012.
45 The St. Lawrence Seaway Management System, “Great Lakes / St. Lawrence Seaway (Highway H2O) Facts,” Facts and Figures
(2013). http://www.seaway.ca/en/seaway/facts/index.html.
46 Betty Sutton, “Year of Action — Gaining Traction,” Administrator’s Column, Seaway Compass, Fall 2014 (2014), 2.
47 Martin Associates, The Economic Impacts of the Great Lakes-St. Lawrence Seaway System, October 2011.
48 St. Lawrence Seaway Management System, 2013.
49 Martin Associates, 2011.
50 Steve Arnold, “Great Lakes shipping fleet getting major renewal,” Hamilton Spectator (May 22, 2013).
51 Great Lakes — St. Lawrence Seaway System, “The System: Touching the Heartland,” (2009). 7.
52 John Schwartz, “Freight train late? Blame Chicago,” New York Times (May 7, 2012).
18
53 Richard Dobbs, et al, “Infrastructure Productivity: How to Save $1 Trillion a Year,” McKinsey Global Institute Report
(January 2013), 1.
54 American Society for Civil Engineers, “2013 Report Card for America’s Infrastructure,” (March 2013).
55 Federation of Canadian Municipalities, “The Canadian Infrastructure Report Card 2012,” (October 2012).
56 Martin Associates, “Infrastructure Investment Survey of the Great Lakes and St. Lawrence Seaway System” (January 2015).
57 Joseph Cortright, “Making Sense of Clusters: Regional Competitiveness and Economic Development.” Brookings Institution
Metropolitan Policy Program Discussion Paper (March 2006).
58 Cortright 2006.
59 Michael Porter, “Clusters and the New Economics of Competition,” Harvard Business Review (November 1998)
60Mary Jo Waits, “The Added Value of the Industry Cluster Approach to Economic Analysis, Strategy Development, and Service
Delivery,” Economic Development Quarterly, Vol 14. No 1, (February 2000)
61 The Economist, “Clustering — The phenomenon whereby firms from the same industry gather together in close proximity,”
(August 2009).
62 Harold Sirkin, “The Power of Industry Clusters,” Bloomberg Businessweek (October 2012).
63 Canadian Chamber of Commerce, "Greater Regulatory Harmonization between Canada and the United States," Transportation
Resolutions Transportation and Infrastructure Committee (2014). Restoration, Transformation and Growth
April 2015
19
References
America Makes. Mission Statement. https://americamakes.us/about/mission
American Society of Civil Engineers. 2013. “2013 Report Card for America’s Infrastructure.” http://www.infrastructurereportcard.
org/
Analytica Advisors. 2014. “2014 Canadian Clean Technology Industry Report.” Executive Summary. October 7. http://www.analyticaadvisors.com/publications
Arnold, Steve. 2013. “Great Lakes shipping fleet getting major renewal” Hamilton Spectator. May. http://www.thespec.com/newsstory/2883301-great-lakes-shipping-fleet-getting-major-renewal/
Austin, John, Elaine Dezenski, and Britany Affolter-Caine. 2008. “The Vital Connection: Reclaiming Great Lakes Economic
Leadership in the Bi-National US-Canadian Region.” Metropolitan Policy Program. The Brookings Institution. March.
http://www.brookings.edu/~/media/research/files/reports/2008/3/24%20greatlakes%20canada%20austin/greatlakes_
canada.pdf
Axworthy, Thomas S. 2010. “Understanding the value of our water”. Blue Economy Initiative. June 10. http://www.blue-economy.ca/
opinion/understanding-value-our-water
Baldwin, Richard. 2012. “WTO 2.0: Global Governance of Supply Chain Trade.” Centre for Economic Policy Research. Policy Insight No.
64. December.
Bitti, Mary Teresa. 2014. “Canada’s best-kept secret: 14 cool and innovative clean-tech companies”. Financial Post. November 11.
http://business.financialpost.com/2014/11/11/canadas-best-kept-secret-14-cool-and-innovative-clean-tech-companies/?__
lsa=1bf1-a0d9
Boston Consulting Group. 2015. “Takeoff in Robotics Will Power the Next Productivity Surge in Manufacturing.” Press Releases
(February 10).
Bureau of Economic Analysis of the U.S. 2013. “Balance of Payments and Direct Investment Position Data, Foreign Direct
Investment in the U.S.” http://www.bea.gov/international/index.htm#omc
Bureau of Economic Analysis. 2013. “Table 1. Real GDP by State, 2010-2013.” U.S. Department of Commerce. http://www.bea.gov/
newsreleases/regional/gdp_state/gsp_newsrelease.htm
Bureau of Labor Statistics, United States Department of Labor. 2013. “State and Area Employment, Hours, and Earnings.” http://
www.bls.gov/data/
Bureau of Transportation Statistics. 2013. “TransBorder Freight Data.” U.S. Department of Transportation. http://transborder.bts.
gov/programs/international/transborder/TBDR_QuickSearchPC.html
Canadian Chamber of Commerce. 2014. “Greater Regulatory Harmonization between Canada and the United States.”
Transportation Resolutions. Transportation and Infrastructure Committee.
Canadian Chamber of Commerce. 2014. “Barrier 1: Skills Shortages.” Top 10 Barriers to Competitiveness. http://www.chamber.ca/
advocacy/top-10-barriers-to-competitiveness/140206_Barrier_1.pdf
Canadian Intellectual Property Office. 2012. “A Foundation for the Future: Canadian Intellectual Property Office Annual Report
2011-12.” Annual Reports.
Canadian Wind Energy Association. 2013. “Installed Capacity.” http://canwea.ca/wind-energy/installed-capacity/
CBC. 2014. “Canada, U.S. name panel to oversee new $1 billion Detroit-Windsor Bridge”. CBC News Windsor. July 29. http://www.
cbc.ca/news/canada/windsor/canada-u-s-name-panel-to-oversee-new-1b-detroit-windsor-bridge-1.2721513
Central Intelligence Agency. “The World Factbook”. https://www.cia.gov/library/publications/the-world-factbook/
rankorder/2078rank.html
Conference Board of Canada. 2011. “Advanced Skills and Innovation.” How Canada Performs: Hot Topics (June).
Conference Board of Canada. 2013. How Canada Performs: Labor Productivity Growth. March.
Cortright, Joseph. 2006. “Making Sense of Clusters: Regional Competitiveness and Economic Development.” Discussion Paper. The
Brookings Institution Metropolitan Policy Program. The Brookings Institution. March.
20
Council on Foreign Relations. 2005. “Building a North American Community.” Independent Task Force Report No. 53. Council on
Foreign Relations Press. p 29. http://www.cfr.org/canada/building-north-american-community/p8102
Coy, Peter. 2014. “2015 Global Economic Outlook: Better Than 2014 — But Not By Much.” Bloomberg Businessweek. November 6.
http://www.businessweek.com/articles/2014-11-06/2015-global-economic-outlook-better-than-2014-but-not-by-much
Cryne, Stephen. 2014. “Cross Border Mobility.” Presentation to PNWER Summit. Canadian Employee Relocation Council. July 22.
http://www.pnwer.org/summit-presentations.html
Cubeddu, Luis, Alex Culiuc, Ghada Fayad, Yuan Gao, Kalpana Kochhar, Annette Kyobe, Ceyda Oner, Roberto Perrelli, Sarah Sanya,
Evridiki Tsounta and Zhongxia Zhang. 2014. “Emerging Markets in Transition.” International Monetary Fund. June. http://www.
imf.org/external/pubs/ft/sdn/2014/sdn1406.pdf
Cunningham, Storm. 2002. “The Restoration Economy: The Greatest New Growth Frontier.” Berrett-Koehler Publishers.
Deloitte. 2013. “City of Hamilton — The Current and Future State of Hamilton’s Advanced Manufacturing Sector”. Deloitte LLP and
Affiliates. October. p.11.
Dobbs, Richard, Herbert Pohl, Diaan-Yi Lin, Jan Mischke, Nicklas Garemo, Jimmy Hexter, Stefan Matzinger, Robert Palter and
Rushad Nanavatty. 2013. “Infrastructure Productivity: How to Save $1 Trillion a Year.” McKinsey Global Institute. January. http://
www.mckinsey.com/insights/engineering_construction/infrastructure_productivity
Economist Intelligence Unit. 2015. “The Safe Cities Index 2015: Assessing urban security in the digital age.” Economist Intelligence
Unit Reports.
Ellyn, Fortino. 2014. “Chicago Hosts U.S.-Canada Energy Summit; Cook County Board Opposes Canadian Nuclear Dump.” Progress
Illinois. October. http://www.progressillinois.com/posts/content/2014/10/16/chicago-hosts-us-canada-energy-summit-cookcounty-board-opposes-canadian-nu
Federation of Canadian Municipalities. 2014. “The Canadian Infrastructure Report Card 2012.” October 27. http://
canadainfrastructure.ca/en/index.html
Fink, Lawrence. 2015. Remarks from the World Economic Forum Annual Meeting 2015. www.weforum.org/sessions/summary/globaleconomic-outlook-5
Foreign Affairs, Trade, and Development Canada. “Global Markets Action Plan: The Blueprint for Creating Jobs and Opportunities
for Canadians through Trade.” Global Markets Action Plan. http://www.international.gc.ca/global-markets-marches-mondiaux/
index.aspx?lang=eng
Foreign Affairs, Trade and Development Canada. 2013. “Foreign Direct Investment Statistics.” http://www.international.gc.ca/
economist-economiste/statistics-statistiques/investments-investissements.aspx?lang=eng
Gauthier, Alexandre. 2014. “Ontario’s merchandise trade with the world.” Trade and Investment Series 2013. Library of Parliament,
Parliament of Canada. June. http://www.parl.gc.ca/Content/LOP/ResearchPublications/2014-33-e.html
Gold, Russell and Dan Gilbert. 2013. “U.S. Is Overtaking Russia as Largest Oil-and-Gas Producer.” The Wall Street Journal, citing the
Energy Information Agency. October 2. http://www.wsj.com/articles/SB10001424052702303492504579111360245276476
Government of Canada. “Beyond the Border Action Plan in Brief.” Canada’s Economic Action Plan. http://actionplan.gc.ca/en/content/
beyond-border
Government of Ontario. 2012. “Ontario’s Great Lakes Strategy”. The Government of Ontario. December. https://dr6j45jk9xcmk.
cloudfront.net/documents/896/5-1-5-great-lakes-strategy-en.pdf
Great Lakes St. Lawrence Seaway System. “Great Lakes / St. Lawrence Seaway (Highway H2O) Facts and Figures.” The St.
Lawrence Seaway Management Corporation. http://www.seaway.ca/en/seaway/facts/index.html
Great Lakes — St. Lawrence Seaway System. 2009. “The System: Touching the Heartland” 2009-2010 Directory. p.7. http://
greatlakes-seaway.com/en/pdf/Maritime-Final.pdf
Higher Education Quality of Council of Ontario. 2014. “Section 5 — Graduate Outcomes.” Quick Stats.
Hjartarson, Joshua, Matthew Mendelson, Allison Bramwell, and Kelly Hinton. 2011. “The Vital Commons: An Agenda for the Great
Lakes — St. Lawrence Region.” Mowat Centre. June.
Industry Canada. “Trade Data Online.” https://www.ic.gc.ca/eic/site/tdo-dcd.nsf/eng/home
Institut de la statistique du Québec. 2014. “Gender gap in university completion exceeds 10 percentage points in favour of women
among those aged 25 to 34.” News Releases (December 2014).
International Energy Agency. 2014. “Energy Policies of IEA Countries: The United States.” Review. http://www.iea.org/W/
bookshop/489-Energy_Policies_of_IEA_Countries_-_The_United_States
Restoration, Transformation and Growth
April 2015
21
International Monetary Fund. 2015. “Cross Currents,” World Economic Outlook Update. January 19. www.imf.org/external/pubs/ft/
weo/2015/update/01/pdf/0115.pdf
International Monetary Fund. 2014. “Regional Economic Outlook: Western Hemisphere — Rising Challenges.” April. http://www.
imf.org/external/pubs/ft/reo/2014/whd/eng/pdf/wreo0414.pdf
International Renewable Energy Agency. 2015. “Renewable Energy Prospects: United States of America.” REmap 2030: A Renewable
Energy Roadmap. January. http://www.irena.org/remap/IRENA_REmap_USA_report_2015.pdf
Kavcic, Robert. 2014. “BMO Special Report: Great Lakes Region: North America’s Economic Engine.” Bank of Montreal. April. http://
www.bmonesbittburns.com/economics/reports/20140425/GreatLakes1404.pdf
KPMG. 2014. “Canadian Manufacturing Outlook 2014 — Leveraging Opportunities, Embracing Growth.” KPMG LLP. http://www.
kpmg.com/ca/en/issuesandinsights/articlespublications/pages/canadian-manufacturing-outlook-2014.aspx
Kwan, Jennifer. 2013. “As a country, ‘Great Lakes’ economy would rank 4th.” Yahoo! Finance. April. https://ca.finance.yahoo.com/
blogs/balance-sheet/country-great-lakes-economy-rank-4th-144301343.html
Martin Associates. 2011. “The Economic Impacts of the Great Lakes — St. Lawrence Seaway System” October. http://www.
greatlakes-seaway.com/en/pdf/eco_impact_full.pdf
Martin Associates. 2015. “Infrastructure Investment Survey of the Great Lakes and St. Lawrence Seaway System.” January. http://
www.marinedelivers.com/sites/default/files/documents/infrastructure-investment-MD_2015.pdf
Miller, Eric. 2014. “Statement to the Senate Standing Committee on Foreign Affairs and International Trade.” Canadian Council of
Chief Executives. September 25. http://www.ceocouncil.ca/wp-content/uploads/2014/10/Statement-to-the-Senate-StandingCommittee-on-Foreign-Affairs-and-International-Trade-25-September-2014.pdf
Miller, Rich. 2015. “U.S. Retakes Helm of the Global Economy.” Bloomberg Business. January 1.
Moens, Alexander and Nachum Gabler. 2012. “Measuring the Costs of the Canada-U.S. Border.” Studies in Canada-US Relations.
The Fraser Institute. August. http://www.fraserinstitute.org/uploadedFiles/fraser-ca/Content/research-news/research/
publications/measuring-the-costs-of-the-canada-us-border.pdf
Morrow, Adrian and Jeffrey Jones. 2015. “Premier Wynne says Ontario ready to play leading role in economic growth.” The Globe
and Mail. January 5.
National Cooperative Freight Research Program. 2012. “Multimodal Freight Transportation Within the Great Lakes–Saint
Lawrence Basin.” NCFRP Report 17. Transportation Research Board. Washington, D.C. http://onlinepubs.trb.org/onlinepubs/
ncfrp/ncfrp_rpt_017.pdf
National Science Foundation. 2014. Business Research and Development and Innovation Survey: 2011 (December).
Norton, Roy. 2013. “Nurturing Michigan’s Most Important Relationship.” Dome Magazine. November 22.
O’Meara, Dina. 2015. “Natural Gas and Canada’s Manufacturing Renaissance” Energy Magazine.
Ontario Trucking Association. Freight Economy. http://ontruck.org/freight-economy
Organization for Economic Co-operation and Development. 2014. “OECD Economic Outlook.” Volume 2014/2. November. http://
www.oecd.org/eco/outlook/economicoutlook.htm
Petraeus, David H., Robert B. Zoellick and Shannon K. O’Neil. 2014. “North America: Time for a New Focus.” The Council on Foreign
Relations. Independent Task Force Report No. 71. p. 11, 29.
Plecash, Chris. 2014. “Clean-tech emerging as Canada’s fastest-growing industry, outlier in economy.” The Hill Times. September
6. http://www.hilltimes.com/news/news/2014/06/09/clean-tech-emerging-as-canadas-fastest-growing-industry-outlier-ineconomy/38742
Porter, Michael. 1998. “Clusters and the New Economics of Competition.” Harvard Business Review. November. https://hbr.
org/1998/11/clusters-and-the-new-economics-of-competition
President’s Council of Advisors on Science and Technology. 2012. “Report to the President on Capturing Domestic Competitive
Advantage in Advanced Manufacturing.” AMP Steering Committee Report. July. http://www.whitehouse.gov/sites/default/files/
microsites/ostp/pcast_amp_steering_committee_report_final_july_27_2012.pdf
PricewaterhouseCoopers. 2014. “3D printing and the new shape of industrial manufacturing.” PricewaterhouseCoopers LLP. June. p.
1. http://www.pwc.com/us/en/industrial-products/3d-printing.html
PricewaterhouseCoopers. 2014. “Shale gas: Still a boon to US manufacturing?” PricewaterhouseCoopers LLP. December. http://www.
pwc.com/en_US/us/industrial-products/publications/assets/shale-gas-boosts-us-manufacturing.pdf
22
Roberts, Bryan, Nathaniel Heatwole, Dan Wei, Misak Avetisyan, Oswin Chan, Adam Rose and Isaac Maya. 2013. “The Impact on
the U.S. Economy of Changes in Wait Times at Ports of Entry.” Report to U.S. Customs and Border Protection. National Center
for Risk and Economic Analysis of Terrorism Events University of Southern California. April. http://create.usc.edu/CBP%20
Final%20Report.pdf
Saint Lawrence Seaway Development Corporation. 2014. “Seaway Compass.” Fall Newsletter. U.S. Department of Transportation.
http://www.seaway.dot.gov/sites/seaway.dot.gov/files/docs/slsdc_newsletter_fall_2014.pdf
Sands, Christopher in Norton, Roy. 2013. “Nurturing Michigan’s Most Important Relationship.” Dome Magazine. November 22.
Schumpeter, Joseph A. 1942. Capitalism, Socialism and Democracy. London: Routledge.
Schwartz, John. 2012. “Freight train late? Blame Chicago.” New York Times, May 7.
Shlozberg, Reuven, Rob Dorling and Peter Spiro. 2014. “Low Water Blues: An Economic Impact Assessment of Future Low Water
Levels in the Great Lakes and St. Lawrence River”. The Council of the Great Lakes Region and the Mowat Centre. June 26. http://
councilgreatlakesregion.org/working-groups/low-water-blues/
Sirkin, Harold. 2012. “The Power of Industry Clusters.” Bloomberg Businessweek. October. http://www.businessweek.com/
articles/2012-10-22/the-power-of-industry-clusters
Synder, J.D., Kelly Christopherson, Leslie Grimm, Anthony Orlando and Aaron Galer.. 2014. “Global Models of Binational Regional
Collaboration: The Potential for Great Lakes Regional Innovation.” Center for Community and Economic Development (Michigan
State University, May 2014), 1.
Statistics Canada. 2013. “Contribution of industries to private sector employment, gross employment creation and gross
employment destruction, by North American Industry Classification System (NAICS), provinces and the territories, annual
(percentage) CANSIM Table 527-0011.” http://www5.statcan.gc.ca/cansim/pick-choisir?lang=eng&p2=33&id=5270011
Statistics Canada. 2014. “Domestic spending on research and development (GERD), funding sector, by province (Canada).” http://
www.statcan.gc.ca/tables-tableaux/sum-som/l01/cst01/scte01a-eng.htm
Statistics Canada. 2013. “Gross domestic product, expenditure based, by province and territory.” http://www.statcan.gc.ca/tablestableaux/sum-som/l01/cst01/econ15-eng.htm
Statistics Canada. 2013. “Labour force characteristics, unadjusted, by province.” http://www.statcan.gc.ca/tables-tableaux/sumsom/l01/cst01/lfss02b-eng.htm
Statistics Canada. 2013. “Population by year, by province and territory.” http://www.statcan.gc.ca/tables-tableaux/sum-som/l01/
cst01/demo02a-eng.htm
Sutton, Betty. 2014. “Year of Action — Gaining Traction.” Administrator’s Column. Seaway Compass, Fall 2014. Saint Lawrence
Seaway Development Corporation. p. 2. http://www.seaway.dot.gov/editorial-type/news-item
TD Bank Group. 2014. “Long-term Economic Forecast.” TD Economics. December 17. http://www.td.com/document/PDF/
economics/qef/long_term_dec2014.pdf
Times Higher Education. 2014. World University Rankings 2014-15.
The Economist. 2009. “Clustering — The phenomenon whereby firms from the same industry gather together in close proximity.”
August 24. http://www.economist.com/node/14292202
The Economist. 2012. “A Third Industrial Revolution.” Special report: Manufacturing and innovation. April 21.
The Economist. 2013. “Reshoring manufacturing: Coming home.” January 19. http://www.economist.com/news/specialreport/21569570-growing-number-american-companies-are-moving-their-manufacturing-back-united
The Economist. 2014. “3D printing will disrupt manufacturing.” GE Look Ahead Blog. June 4. http://gelookahead.economist.com/3dprinting-will-disrupt-manufacturing-2/
The Economist. 2014. “State of the debate. Is the US the new rising manufacturing star?” GE Look Ahead Blog. November 16. http://
gelookahead.economist.com/state-of-the-debate-is-the-us-the-new-rising-manufacturing-star/
The Gandalf Group. 2014. “Canadian Opinion About Canada-U.S. Trade, Commerce, and Globalization.” Canadian American Business
Council. November.
The Government of Ontario. 2012. “Ontario’s Great Lakes Strategy”. December. https://dr6j45jk9xcmk.cloudfront.net/
documents/896/5-1-5-great-lakes-strategy-en.pdf
The St. Lawrence Seaway Management System. “Great Lakes / St. Lawrence Seaway (Highway H2O) Facts.” Facts and Figures.
http://www.seaway.ca/en/seaway/facts/index.html
Thomas, David. 2013. “How the U.S. Economy Benefits from International Trade and Investment.” Trade Benefits America: Business
Roundtable.
Restoration, Transformation and Growth
April 2015
23
Transport Canada. 2013. “Transportation in Canada 2013, Overview Report.” https://www.tc.gc.ca/eng/policy/anre-menu.htm
U. S. Census Bureau. 2013. “U.S. and World Population Clock.” https://www.census.gov/popclock/
U.S. Census Bureau. 2013. “State by 6-Digit HS Code and Top Countries.” https://www.census.gov/foreign-trade/statistics/state/
data/index.html
U.S. Census Bureau. 2013. “Top Trading Partners — December.” https://www.census.gov/foreign-trade/statistics/highlights/top/
top1312yr.html
U.S. Department of Education. 2012. New State-by-State College Attainment Numbers Show Progress Toward 2020 Goal. (July).
U.S. Department of Energy. 2014. “WINDExchange—Installed Wind Capacity.” http://apps2.eere.energy.gov/wind/windexchange/
wind_installed_capacity.asp
U.S. Department of State. 2014. “U.S. Relations with Canada.” September. http://www.state.gov/r/pa/ei/bgn/2089.htm
U.S. Energy Information Administration. “Today in Energy.” http://www.eia.gov/todayinenergy/detail.cfm?id=4850
U.S. National Institute of Standards and Technology. “U.S. Manufacturing in Context.” Advanced Manufacturing Portal.
U.S. Patent and Trademark Office. 2013. “Patents by Country, State, and Year — All Patent Types.”
Waits, Mary Jo. 2000. “The Added Value of the Industry Cluster Approach to Economic Analysis, Strategy Development, and
Service Delivery,” Economic Development Quarterly, Vol 14. No 1. February. http://www.nga.org/files/live/sites/NGA/files/
pdf/0602INDUSTRYCLUSTER.pdf
Welsh, Hugh. 2013. “Why Manufacturing Jobs Are Returning To North America For The First Time In Decades.” Business Insider.
February 27. http://www.businessinsider.com/manufacturing-jobs-returning-to-america-2013-2
World Bank. 2013. “Population Data.” http://data.worldbank.org/indicator/SP.POP.TOTL
World Bank. 2015. “Global Economic Prospects, Having Fiscal Space and Using It.” Preliminary. January. http://www.worldbank.
org/en/publication/global-economic-prospects
24
CANADA
UNITED STATES
720 Spadina Avenue, Suite 218
Toronto, Ontario, Canada M5S 2T9
11075 East Boulevard #245A
Cleveland, Ohio 44106
Phone: (613) 668-2044
Fax: (416) 978-7203
E-mail: [email protected]
www.councilgreatlakesregion.org
Message from Mark Fisher, President and CEO of CGLR
On April 26-28, 2015, CGLR is hosting the firstever Great Lakes Economic Forum in Chicago,
Illinois. This landmark event in the GLSLR will
bring business, political, and government leaders
together alongside experts from academia and
the non-profit community to share insights on
the most pressing economic policy issues facing
the region.
As Joseph Schumpeter, author of Capitalism, Socialism and
Democracy notes, we must accept change from the old ways
to make room for the new. This paper is intended to spur
dialogue by framing the core themes and issues that will be
discussed and debated at the economic forum:
On its own, the region is an economic powerhouse and key
to Canada, the United States, and North America as a whole,
crucial for increasing our mutual competitiveness and
economic output in today’s aggressively borderless climate
of global trade and commerce.
• Moving Together: Multimodal Logistics — Border
Management — Infrastructure Modernization and
Financing
But in restoring, transforming, and growing the region’s binational economy, we must confront a number of challenges:
• Assembly-line manufacturing will no longer be the
centerpiece of our region’s future economic expansion;
• Border protection in the aftermath of 9/11 and
government rules that default to protectionism have made
the border less permeable;
• Regulatory practices are choking and fragmenting
supply chains;
• Our infrastructure is crumbling at a time when public
finances are increasingly constrained; and,
• Unemployment remains stubbornly high in many
communities throughout the region, especially for youth.
There is hope. The region’s indomitable spirit, foundation
of hard work, and ability to find new policy choices
across a broad spectrum of economic activities including
infrastructure modernization, workforce development, labor
mobility, energy, and multi-modal logistics and services, will
set the stage for a new and exciting economy.
We will need to collaborate more than ever to identify new
solutions, fortify the region’s strategic advantage, and be
able to capitalize on emerging opportunities within North
America and around the world.
The first Great Lakes Economic Forum, From Partnership Flows
Prosperity, is our moment to define an ambitious and practical
regional economic agenda that will drive us forward. Every
business, level of government, organization, and individual
has an important role to play in this process.
2
• Building Together: Advanced Manufacturing — Great
Lakes Energy Future — Workforce Development and
Labor Mobility
• Innovating Together: Regulatory Cooperation —
Economic Clusters — Blue Economy
The region’s indomitable spirit,
foundation of hard work, and ability
to find new policy choices across
a broad spectrum of economic
activities will set the stage for a
new and exciting economy.
Further, this paper builds upon the considerable research
that has already been conducted with respect to the state
of the GLSLR economy, its unique assets, and an agenda
for the future as outlined in seminal pieces like the
Brookings Institution’s The Vital Connection: Reclaiming Great
Lakes Economic Leadership in the Bi-National US-Canadian Region.
The authors argued then, as CGLR argues now, that
Canada and the United States should harness the full
potential of the GLSLR, recognizing this will only take place
with serious political leadership and purposeful action from
both countries.
_____________________________
Restoration, Transformation and Growth
April 2015
3
The Great Lakes – St. Lawrence Region
1
In January 2015, the International Monetary
Fund (IMF) revised its October 2014 global
growth projections downward, to 3.5 percent,
on account of a revised assessment of
prospects in China, Russia, the Euro zone,
and Japan. While economic activity is boosted
by the lower oil price, significant downside
risks remain, including shifts in sentiment
and volatility in global financial markets,
particularly emerging markets.2
Black Rock CEO Laurence Fink, at this year’s World
Economic Forum in Davos, Switzerland, noted there is more
pessimism about the state of the global economy than there
was at the same meeting last year. 3
However, in a volatile global economy, North America in
general and the United States in particular are bright lights.
The United States is the only major economy for which the
IMF raised growth prospects in its 2015 World Economic
Outlook update, suggesting that the United States is “again
the engine of global growth,”4 which, at its core, is fuelled by
trade with Canada and Mexico.
The United States and Canada enjoy the largest trade
relationship in the world, trading $782 billion in goods and
4
services in 2013. Two-way trade has tripled since the signing
of the Canada-U.S. Free Trade Agreement in 1989.
Trade and investment have also expanded in North America as
a result of the North American Free Trade Agreement (NAFTA),
which came into force in 1994. The region’s trade grew from
less than USD$300 billion in 1993 to more than USD$1.1 trillion
in 2013,5 evidence of the advantages of close proximity, shared
business cultures, and integrated supply chains.
Recent developments present new opportunities for the
North American economy, including: energy and fiscal
reforms underway in Mexico, a boom in unconventional
hydrocarbon production that has put North America in
a leading position in global energy production, and a
resurgence of manufacturing due in part to reshoring of
investment back from China.6
Within the broader context of a re-invigorated U.S. and
North American economy is the growing importance of
economic sub-regions. The largest and most dynamic of
these is the GLSLR, which comprises two provinces (Ontario
and Quebec), eight states (Illinois, Indiana, Minnesota,
Michigan, New York, Ohio, Pennsylvania, and Wisconsin),
over forty First Nations, and numerous city and municipal
governments, including several with global impact such as
New York, Chicago, and Toronto.
Sub-regions are critical because they are the most likely
units of economic organization, especially for small and
medium-sized enterprises. Organizing companies and
supply chains on a sub-regional basis makes sense because
the production cycle is sensitive to distance — fuel costs,
shipping time, etc. — especially when moving intermediate
goods through a geographically disaggregated production
cycle.7 Thus, from its vantage point as an economic subregion, the GLSLR is a driver of North America’s trade with
the rest of the world.
The region is home to leading research universities,
colleges, and educational institutes that are critical for talent
development and retention.9 19 of the top 100 universities
in the world are Great Lakes institutions.10 Combined,
the region produced 47% of university graduates in both
countries (2010).11
Academic institutions in the GLSLR collaborate with a largescale private sector research sector.12 In 2011, the U.S. portion
of the Great Lakes Region accounted for nearly 24.1% (US
$70,866 million) of the total research and development funding
in the country. The Canadian portion accounted for nearly
72.1% ($22,694 million) of the total research and development
funding in Canada,13 and generated 26.2% and 68% of patents
in the United States and Canada respectively (2012).14
“Cities and regions are competing with each other
in the global economy more so than national states.
Many regions are not within a single national state,
but are instead located at international borders and
transcend national territorial boundaries.”8
In terms of natural assets, the GLSLR is a bastion of
biodiversity, ranging from boreal forests and lakes to
wetlands and marshes. The region sustains one-fifth of
all fish species in North America, hundreds of millions of
migratory birds, and many other species.15 The great lakes
themselves contain 84% of North America’s water supply and
about 20% of global fresh water supply. The natural bounty of
the region is the basis for all its life and activity.
In spite of the image of the region as a declining rustbelt, the
GLSLR has emerged as a dynamic economic region with an
abundance of opportunity. The region accounts for roughly
40 percent of total Canada-U.S. cross-border trade and
approximately one third of total Canada-U.S. two-way trade
with the world.
World-class cities are important for the region as well. Two
of the top five best cities in the world to live in are in the
GLSLR, Toronto (#1) and Montreal (#2), according to a report
by the Economist Intelligence Unit (EIU) that ranks 50 major
cities across the world.16 This is at a time when more than
half of the world’s population now lives in cities. In North
America, the level of urbanization is 84% (EIU).
With a population of 107 million and a GDP of USD $5.2
trillion, if taken as a separate economic unit the GLSLR
would be the fourth largest economy in the world after
the United States, China, and Japan, supporting some 50
million jobs or roughly a third of the combined American and
Canadian workforce.
ONTARIO
MARATHON
HERON BAY
QUEBEC
THUNDER BAY
MICHIPICOTEN
TROIS RIVIERES
TACONITE HARBOR
MINNESOTA
SILVER BAY
TWO HARBORS
DULUTH
SUPERIOR
ONTONOGAN
ASHLAND
QUEBEC
HOUGHTON/HANCOCK
PRESQUE ISLE
MARQUETTE
MICHIGAN
(Upper Peninsula)
PORT INLAND
PARRY SOUND
CALCITE
PRESQUE ISLE
ALPENA
LUDINGTON
SAGINAW
MICHIGAN
PORT WASHINGTON
MUSKEGON
MILWAUKEE
OAK CREEK
WAUKEGAN
CHICAGO
CALUMET
GRAND HAVEN
HOLLAND
ST. JOSEPH
BURNS HARBOR
GARY
BUFFINGTON
INDIANA HARBOR
OGDENSBURG
MIDLAND
BATH
PICTON
BOWMANVILLE
OSHAWA
TORONTO
PORT CREDIT
CLARKSON
GODERICH
HARBOR
BEACH
MANITOWOC
CARDINAL
PRESCOTT
ONTARIO
OWEN SOUND
TRAVERSE CITY
FRANKFORT
PORT GYPSUM
MANISTEE
GREEN BAY
ILLINOIS
VALLEYFIELD
MELDRUM BAY
MACKINAW CITY
CHEBOYGAN
CHARLEVOIX
WISCONSIN
SERPENT HARBOUR
DRUMMOND ISLAND
BREVORT
STRAITS OF MACKINAC
GLADSTONE
ESCANABA
MENOMINEE
MARINETTE
MONTREAL
BRUCE MINES
CEDARVILLE
SOREL
CONTRECOUER
ST. MARYS RIVER
SOO LOCKS
SAULT STE. MARIE
THESSALON
MUNISING
BECANCOUR
HAMILTON
WELLAND CANAL
THOROLD
PORT COLBORNE
ESSEXVILLE
PORT HURON
MARYSVILLE
ST. CLAIR
MARINE CITY
DETROIT
RIVER ROUGE
ECORSE
WYANDOTTE
TRENTON
MONROE
NANTICOKE
PORT DOVER
PORT STANLEY
SARNIA
COURTRIGHT
ST. CLAIR RIVER
PORT LAMBTON
LAKE
ST. CLAIR
WINDSOR
KINGSVILLE
DETROIT RIVER
TOLEDO
MARBLEHEAD
KINGSVILLE
INDIANA
OSWEGO
ROCHESTER
ERIE
CONNEAUT
ASHTABULA
FAIRPORT HARBOR
CLEVELAND
TONAWANDA
BUFFALO
NEW YORK
DUNKIRK
PENNSYLVANIA
LORAIN
HURON
SANDUSKY
OHIO
Source: Chamber of Marine Commerce, modified from www.marinedelivers.com
Restoration, Transformation and Growth
April 2015
5
Building Together
Advanced Manufacturing
Advanced manufacturing entails a shift from production
driven by labour to technology-intensive production, which
requires fewer workers to produce the same output. But
clusters of productivity typically generate more enterprise
activity overall in sectors that are directly or indirectly
dependent on manufacturing.17
As a result, manufacturing employment, which represented
11.9 percent of total employment in the GLSLR in 2013, may
increase over time as advanced manufacturing brings with
it the dual forces of reduced labour requirements and new
manufacturing opportunities in key sectors (e.g. aerospace,
robotics, automotive, food processing, life sciences, plastics
and composites, and fabricated metals).
Even as manufacturing opportunities become available,
technological advancements or other changes in the
economy may mean that direct manufacturing employment
never returns to previous levels in the GLSLR unless reshoring also occurs at a much greater pace than predicted.22
However, longitudinal declines in manufacturing as a
percentage of total employment in the region (Figure 2) have
been, and may continue to be, offset by employment gains in
other sectors, notably education, health care, professional
services (Figure Y).23
Figure 2: Manufacturing Jobs in the GLSLR: 2004-2013
(% of total employment)
15.82 15.56
13.85 14.39 13.81
2004 2005 2006 2007 2008 2009 2010 2011 2012 2013
Source: Bureau of Labor Statistics, United States Department of Labor and
Great Lakes Region
Statistics Canada.
Note: U.S. data are manufacturing as a share of total non-farm employment,
while Canada data are manufacturing as a share of total employment.
Figure 1: What is Advanced Manufacturing?
Advanced manufacturing involves both new ways to manufacture existing
products, and the creation of new products arising from new advanced
technologies.18
The President’s Council of Advisors on Science and Technology defines
advanced manufacturing as “a family of activities that (a) depend on the use
of coordination of information, automation, computation, software, sensing
and networking and/or (b) make use of cutting edge materials and emerging
capabilities enabled by the physical and biological sciences, for example
nanotechnology, chemistry, and biology.”19
Advanced manufacturing is best viewed as a cluster of economic activities
encompassing much more than a single stand-alone enterprise. It has
implications for all facets of research, development, production, sales,
distribution, logistics, customer service, marketing, and support, extending
from the development of physical products to the delivery of services.20
Advanced manufacturing encompasses additive manufacturing (aka. 3D
Printing), robotics, digital manufacturing, and the industrial Internet.21
6
12.61 12.54 12.63 12.70
11.89
Figure 3: Employment trends in Great Lakes Region
Great Lakes Region (2002 = 100)
Employment
Laggards
130
130
120
120
110
All
Sectors
100
Employment
Leaders
Education
and Health
110
100
Construction
90
Manufacturing
80
70
new technologies such as 3D Printing (Box X) and the ability to
expand and adapt these skills for use in other applications.24
All
Sectors
90
Professional
Services
80
70
02
07
12
02
07
12
Source: BMO report (Robert Kavcic).
Claims that there will be fewer jobs in the GLSLR in the 21st
century than there were in 20th century are driven by the
mistaken impression that the 21st century GLSLR economy
will look like it has in the past. There are jobs; they just exist
in different sectors and have different characteristics.
It is no longer realistic to expect lifelong employment on an
assembly line following high-school graduation. The modern
labor force will require advanced skills that enable the use of
Success in the 21st century economy also depends on our
ability to be more productive.29 As the Conference Board of
Canada notes, productivity depends on dynamics at multiple
levels, including firm-specific activities related to investment
in physical capital.
One of the central challenges holding firms back from
increased productivity and innovation in manufacturing,
particularly in advanced manufacturing, has been the lack
of knowledge surrounding investments in new machinery,
equipment and technology, and limited application of
advanced information technologies. While the onus is on
workers to focus on skills development and lifelong learning,
it is also on employers to stay at the leading edge of valuecreating technologies.
Discussion Questions
1) What does your company need to accelerate
the shift to advanced manufacturing?
2) What are the benefits of integrating additive
manufacturing into your business?
3) How can government support bi-national
manufacturing R&D and commercialization?
Figure 4: The Transformative Prospects of 3D Printing (3DP)
3D printing has the potential to revolutionize the way we make almost everything.
The next industrial revolution in manufacturing will happen in America. — PRESIDENT BARACK OBAMA
3DP, or “additive manufacturing,” is transforming traditional manufacturing and accelerating the shift from mass
production to customization.25 American and Canadian manufacturers, big and small, are discovering the potential for
3DP technology to improve traditional manufacturing processes and to produce products that were virtually impossible
(or prohibitively expensive) using traditional methods.26 In a PWC survey of over 100 U.S. industrial manufacturers in
the United States, two thirds said they are currently implementing 3DP in some way and one in four said they plan to
adopt 3DP in the future.27
3D printing has emerged as one of the more visible aspects of the broader
wave of information and communications technologies that are empowering
business processes in manufacturing and beyond. Advanced 3D design software
increasingly enables modeling, prototyping, outsourcing, and testing to be done
virtually. Timelines from conception to delivery are being compressed, and product
adoption quickened.
America Makes was established in Youngstown, Ohio in 2012 as the pilot hub for
the National Network for Manufacturing Innovation (NNMI). America Makes’ focus
is to accelerate the adoption of additive manufacturing technologies in the U.S.
manufacturing sector and to increase domestic manufacturing competitiveness.
Its extensive network includes than 100 companies, non-profit organizations,
academic institutions, and government agencies.28
Restoration, Transformation and Growth
April 2015
7
Workforce Development and
Labor Mobility
There is immense human capital in the GLSLR ready
to take advantage of the opportunities in advanced
manufacturing, other knowledge-based sectors of our
economy, and in skilled trades. However, in order to build
the advanced workforce of the future, it will be critical to
support and invest in science, engineering, technology, and
math, together with creative thinking and hands-on skills
development, at all levels of learning.
High-quality post-secondary training and the concentration
of skills in urban areas give the GLSLR advantages over
other regions, but there are still skills shortages as
employers struggle to deploy the right talent to the right
areas at the right time. One of the major impediments to
business growth and infrastructure development is the
shortage of skilled trades workers available for deployment
when and where they are required. Employers report that
shortages in skilled trades are the number one barrier to
Canadian competitiveness.30
The changing nature of work to shorter-term, projectoriented employment, an aging workforce, and the shift from
traditional to advanced manufacturing are all factors that are
exacerbating the shortage in skilled trades in parts of the
economy and the GLSLR.
those in certified professions face a quagmire of different
certification requirements to do the same job in the eight
states and two provinces of the region.
In addition to certification and licensing, workers in the
region face border and immigration challenges. Even
though Canadian and American workers can utilize various
visa, intercompany transferee, or temporary worker
programs, dozens of issues impede labour mobility.
Crossing the border for work, whether for an hour or a
year, is not for the faint of heart or ill prepared. Employers
and employees avoid it whenever possible, creating
supply chain inefficiencies and diminishing regional
competitiveness. Some of the irritants include:
• Border delays related to paperwork;
• Burdensome or unclear procedures for low-risk business
travellers;
• Delays in identifying labor market needs and occupational
requirements;
• Health and safety equipment issues; and,
• Difficulty in obtaining waivers for minor criminal offences.
Discussion Questions
1) What skills do you see absent in today’s
workforce?
2) How do you see your labor needs changing?
3) Should business and government work more
closely to address skills gaps? If so, how?
4) Can labor market access rights — the right to
work in multiple jurisdictions — be separated
from citizenship rights?
5) Are there practices and models from
other jurisdictions that could be emulated
successfully here?
Energy
The U.S. and Canada enjoy the largest energy trade
relationship in the world and Canada is the single largest
foreign supplier of energy to the United States.
The problems faced by sectors characterized by shortterm deployments, such as construction, engineering,
after-sales service, and information technology, face
challenges that are particularly acute. The ideal situation
would be unimpeded labor mobility throughout the region,
but the reality is quite different. Skilled workers and
8
The North American energy landscape has been transformed
since 2008 with the development of vast shale oil and gas
reserves in the United States and the continued expansion
of oil sands production in Canada. In 2013, the United States
produced more oil and gas combined than any country in the
world, ahead of both Russia and Saudi Arabia.
Cheaper energy inputs driven by booming oil and gas
production in the United States and Canada are having
a profound effect on industries from petrochemicals
to steel manufacturing in both countries. In the United
States, maturing shale gas development is boosting U.S.
manufacturing through significant cost savings and job
creation.31 Lower natural gas prices benefit manufacturing
in two ways: both in direct use and indirectly when electricity
generators pass on savings to industrial customers.
both provinces sell surplus electricity to bordering states via
a high voltage grid. Access to cheap and abundant electricity
has been a vital feature of the region’s industrialization and
will be a crucial component of its revitalization.
The region is home to substantial shale gas reserves,
namely the Marcellus and Utica shale plays, but the
states and provinces of the GLSLR have adopted differing
positions regarding shale gas development. While New York
and Quebec have a moratorium on hydraulic fracturing,
neighboring Pennsylvania has moved forward aggressively
with shale gas development.
Natural gas is expected to play an increasingly important
role in the region, driven by mandates to close coal-fired
power plants and the sustained low price of natural gas due
to in part to high levels of production.
Across the globe, total renewable generation capacity is
forecast to grow as technology costs drop and governments
strengthen policies to combat climate change. In this regard,
provincial, state, and municipal governments are looking
at ways to get involved in the renewable sector, both as a
source for clean energy and to create jobs and economic
growth (e.g. In 2012 clean technology was Canada’s
fastest growing industrial sector).33 The opportunities for
deployment of renewable energy are vast, especially in
transportation, industry and building management, and
when combined with effective energy conservation and
efficiency standards.34
“On a North American side — the availability of shale
gas is changing the whole landscape for our industry.
What it is doing is giving us an energy competitiveness
as a North American manufacturer that we have not
seen in decades.”
— RICHARD PATON, PRESIDENT AND CEO OF
THE CANADIAN CHEMISTRY INDUSTRY ASSOCIATION.32
On top of this, Mexico recently opened its energy sector
to foreign investment, a move that is expected to lead to
increased production of hydrocarbons from that country.
North America’s dependence on energy imports is dwindling
and the region may one day be a net energy exporter. GLSLR
business and policy leaders will have to think seriously about
how the region fits into this new continental energy market.
The GLSLR is a strategic North American energy market and
transit corridor with assets in production, distribution, and
exploration of fossil fuels, nuclear power, and renewable
energy. The region is powered by a diverse mix of sources
including nuclear, coal, and hydroelectricity. Nuclear and
hydroelectricity are predominant in Ontario and Quebec and
However, as stated by the International Energy Agency, the
importance of "predictable, effective national policies to
encourage investment, greater coordination to encourage
the integration of renewables, and a common understanding
on the future of nuclear power"35 cannot be overstated. But,
like so many policy areas, action with respect to expanding
the GLSLR energy mark in a North American context will
require regional and national consensus.
Discussion Questions
1) Should the GLSLR have a regional energy
strategy? How can the region reconcile
divergent approaches to energy development?
2) Are there areas where jurisdictional
differences create extra costs and diminish
competitiveness?
3) What are the areas of opportunity for greater
collaboration on energy research and
technology?
4) What are the action items needed to
improve cross-border energy infrastructure,
inter-operability, and trade?
Restoration, Transformation and Growth
April 2015
9
Moving Together
Border Management
Today, 38.1 million jobs in the U.S. depend on trade36 while
one in five Canadian jobs is linked to exports.37 We are each
other’s largest trading partners, with over $600 billion
worth of two-way trade in goods and services in 2013.
Each year, the GLSLR generates approximately $184
billion in two-way trade, which accounts for approximately
one third of Canada-U.S. trade with the rest of the world
(2013 figures).38
What’s more, aside from the significance of the GLSLR
with respect to the volume and value of trade passing
through this continental gateway, four out of the five
busiest land crossings between the U.S. and Canada
are located in Ontario, with more trade flowing between
Windsor and Detroit than through any other border
crossing in the world.39
It is difficult to overstate the importance of free flowing
goods and efficient border management for the GLSLR. The
Government of Canada estimates conservatively that border
management policies that thicken the border cost the
Canadian economy $16 billion a year.40 A Fraser Institute
report (2012) also makes a clear link between additional
administration costs attributable to border security and
crossing wait times and negative affects on bilateral trade.41
Properly trained people are an important part of a smart
border. For example, U.S. estimates suggest that the
addition of one extra Customs and Border Protection
staff member to facilitate border crossings generates an
additional USD$2 million in U.S. GDP.42 Technology and data
are also crucial elements.
In 2011, President Obama and Prime Minister Harper
announced the Beyond the Border Action Plan (BTB) in
order to reduce barriers to the movement of goods and
people between the two countries.
BTB has provided a good first step to reducing delays
by attempting to move certain activities, such as cargo
inspection, away from the border, and reducing inspection
duplication through the principle of “inspected once,
cleared twice.” However, despite the gains that are
speeding up legitimate trade and travel, there is still a gap
between the objectives of high-level initiatives like BTB and
the realities of moving goods and people across the border.
A 2014 survey by the Canadian Employee Relocation
Council identifies ongoing problems for business travelers,
especially the failure to consistently apply rules at the
border and officials who are not aware of the needs of
business travellers.43 Shippers face many of the same
challenges and have added worries about the slow pace of
pilot projects involving pre-inspection, pre-clearance, and
single window programs that could lead to the adoption of
new practices and technology in freeing up the movement
of goods. 44
The region is home to an expansive network of highways
and rail lines, some of the world’s busiest international
airports, a growing number of world-class ports and the
bi-national St. Lawrence Seaway that connects North
American industry to Europe, South America, the Middle
East, and Africa.
10
In the early days of NAFTA, we proudly claimed that
automotive components crossed the borders many times
during the production of finished vehicle. This was evidence
that North America was becoming a seamless, integrated
market. Now, border and regulatory delays diminish this
advantage. A North American vehicle is subject to customs
inspections dozens of times, but a vehicle entering North
America from China is inspected only once.
The reduction of tariffs through the trade agreements of
the 1980s and 1990s made a significant contribution to
North American competitiveness by reducing transaction
costs. Today, while big data analytics have helped to
create risk assessment models to help customs officials
target likely offenders and make most crossings faster
and more routine, we need to find ways to eliminate, as far
as possible, border-related transaction costs so that we
can function as a truly integrated market in a borderless
global economy.
Discussion Questions
1) What is your vision of the border?
2) Has the BTB had a positive impact on your
business in the first three years of operation?
Successes? Ongoing challenges?
3) Are there dimensions to the border that are
unique to the GLSLR that could be addressed
by better partnerships between federal
authorities and key stakeholder groups? If
so, what are they and is there avenue to bring
these interests together?
4) Should we be doing a better job of engaging
federal as well as state/provincial legislators
on border issues?
5) Can we be more ambitious than NAFTA? Will
a Trans-Pacific Partnership force accelerated
NAFTA changes?
Figure 5: Overview of Multimodal logistics assets in GLSLR
Marine 15 large international marine ports
Transportation and 50 regional marine ports,
the Great Lakes — St. Lawrence
Seaway System (GLSLSS) and its
19 locks, and a network of inland
waterways, including, in particular,
the Mississippi River with its major
tributaries of the Ohio and Illinois
Rivers.
Rail Seven Class 1 railways, totalling
Transportation 30,778 miles of track and 68
intermodal terminals, several short
lines, and rail border crossings.
Road Extensive highway system and
Transportation several border crossings. In the
U.S., key north-south highways
include I-35, I-55, I-65, I-75, and
I-95 and on the east-west axis, I-70,
I-80, and I-90. In Canada, key freight
highways are east-west along the
St. Lawrence River and northern
edge of the Great Lakes.
Air The GLSLB serves as one of North
Transportation America’s major air cargo hubs and
includes 36 of North America’s 156
airports that handle over 10,000
tons of cargo per year. The GLSLB’s
20 largest airports make up 95.2%
of the regional air cargo traffic.
Major freight airports include
Chicago O’Hare and
Toronto Pearson.
Pipeline A network of pipelines in the
Transportation GLSLB moves a range of fuels and
Multimodal Logistics
The GLSLR is home to one of the world’s most interconnected and integrated multi-modal systems, from
the United States’ largest rail hub in Chicago to the vast
network of airports, roads, pipelines, ports, and waterways
(Figure X) that move major commodities including coal, iron
ore, agricultural and food products, automotive parts and
machinery, and petroleum products.
petroleum products including crude,
gasoline, and natural gas. these
pipelines are privately owned and
operated by energy companies.
Source: National Cooperative Freight Research Program, “Report 17:
Multimodal Freight Transportation Within the Great Lakes — St. Lawrence
Basin,” (2012).
Put simply, it is an economic platform that ties every aspect of
commerce in the region together and connects the region to
the North American marketplace and the rest of the world.
Restoration, Transformation and Growth
April 2015
11
The economic impact of this system on the GLSLR is
staggering. According to a report prepared for the U.S.
Transportation Research Board, the direct and indirect
impacts from freight transportation industries in the
region accounted for 3.8 million jobs, USD$627 billion in
gross output, USD$311 billion in gross domestic product,
USD$200 billion in personal income, and USD$87 billion in
taxes in 2007.
Further, this system plays a critical role in supporting
America’s and Canada’s global trade agenda. Almost 25
percent of marine traffic in the Great Lakes-St. Lawrence
Seaway system travels to and from overseas ports in Europe,
the Middle East, and Africa.45 In 2014, a new ClevelandEurope scheduled liner service was launched and the firstever international cargo shipments passed through the Port
of Munroe.46 This is a promising development in the U.S.
Administration’s desire to conclude a Transatlantic Trade and
Investment Partnership with Europe and the recent conclusion
of negotiations between Canada and the European Union on a
Comprehensive Economic and Trade Agreement.
Serious constraints and barriers in the
multi-modal system exist in the form of hard
infrastructure constraints (e.g. congestion and
age) and regulatory and operational issues
that hinder the free movement of goods and
commerce in the region.
Capacity bottlenecks are a particular challenge for road and
rail modes around major hubs. On the other hand, there is
untapped potential for greater utilization of the region’s air
and water modes, both of which have excess capacity.
Jurisdictions with access to competitive transportation
infrastructure and services, and who are able to fully optimize
all-modes, are at a distinct strategic advantage in attracting
investment, creating jobs and realizing economic growth.
Short Sea Shipping on the Great Lakes
St. Lawrence Seaway System
The Great Lakes-St. Lawrence Seaway (GLSL)
system is 3700 kilometres (2300 miles) in length
with 110 ports.
It is a crucial transportation link for trade
between North America and more than 59
overseas ports.
The seaway provides a cost-effective option for
cargos from Europe. (The port of Detroit is closer
to Rotterdam than to the Port of New Orleans.) 47
Every year, 164 million tonnes of cargo is shipped
on the GLSL system, generating some $34 billion
in economic activity. 48
Every 10,000 tons of cargo handled by a Great
Lakes port translates into half a million dollars of
economic benefit to the port community.49
Shipping provides 227,000 jobs in North America
(99,000 in Canada). 50
A Great Lakes freighter can carry one ton of cargo
607 miles (800 km) on one gallon of fuel. 51
12
“When it comes to rail traffic, Chicago is America’s
speed bump. Shippers complain that a load of freight
can make its way from Los Angeles to Chicago in 48
hours, and then take 24 hours to travel across the
city. A recent trainload of sulphur took some 27 hours
to pass through Chicago — an average speed of 1.13
miles per hour, or about a quarter the pace of many
electric wheelchairs.”52
Discussion Questions
1) Why are shippers and shipping lines
not making better use of the maritime
transportation system in the GLSLR?
2) What are the barriers to optimizing
transportation choices in the GLSLR?
3) What interests and incentives need to be
better addressed/aligned to make better use
of marine transportation in the GLSLR?
3) Would a regional multi-modal vision and
strategy for the GLSLR help to move freight and
remove bottlenecks? How would this work?
Infrastructure Modernization
and Financing
The GLSLR economy of today and the future requires
significant investment in public and private infrastructure.
The need for renewal applies to the wide range of physical
assets in the region, from our waterways, roads, bridges, rail
lines, airports and energy systems to our drinking water and
wastewater facilities.
The costs of renewal are astounding. McKinsey estimates
that $57 trillion will be needed by 2030 in order to keep pace
with projected global GDP growth.53 By 2020, it is estimated
that the infrastructure investment shortfall for the U.S.
will be USD$1.6 trillion.54 According to the Federation of
Canadian Municipalities, Canadian cities have an existing
infrastructure deficit of $172 billion.55
Important steps are being taken in the region to invest in
the critical corridors that support the movement of goods
throughout the region. For example, a January 2015 survey
by Martin Associates finds that a total of $7.1 billion is being
invested in asset renewal and modernization of vessels,
ports and terminals, and waterway infrastructure in the
Great Lakes-St. Lawrence seaway navigation system.56
Yet, like many parts of the United States and Canada,
the GLSLR continues to face challenges with respect to
building and renewing public infrastructure, particularly as
governments at all levels struggle to keep pace with growing
demands for improved infrastructure and better services at
a time of increasing government debt and tighter controls on
operating budgets.
Compounding these challenges is the reality that traditional
approaches to financing will not suffice. By giving the private
sector a role alongside government in designing, building,
financing, operating and maintaining public infrastructure,
we can harness private sector know-how, ingenuity and
capital in eliminating the region’s infrastructure deficit
and investment gap, providing we have the right rules and
administrative structures in place to manage contracts
between government and business. Such relationships would
likely need to involve alternative financing and procurement
(AFP) delivery models — or public-private partnerships (P3s)
— and other innovative financing mechanisms.
AFPs are a proven and effective means of addressing the
public infrastructure deficit. Based on a review of P3s in
operation or under construction in Canada from 20032012, which was commissioned by the Canadian Council
for Public Private Partnerships, the implementation of P3s
contributed to the creation of 517,430 full-time equivalent
jobs, the disbursement of $32.2 billion in total income/wages
and benefits, and the addition of $48.2 billion to total gross
domestic product. The use of P3s also supported the levying of
$7.5 billion in tax revenue, and $9.9 billion in total cost savings.
The use of AFPs in the GLSLR, however, has been slow
compared to many other jurisdictions. This is why the CGLR
announced a commitment to action at CGI America that will
identify ways of creating a more enabling environment for
AFPs in the region. This work will complement other efforts
aimed at encouraging private sector involvement in renewing
public infrastructure in the United States and Canada, such
as the Build America Investment Initiative, the National
Governors Association’s State Resource Center on Innovative
Infrastructure Strategies, and the Building Canada Plan.
In addition to AFPs, the quality of information sharing
pertaining to regional growth and infrastructure planning
is uneven in the GLSLR and the prioritization of investment
decisions for large-scale transportation projects that cross
jurisdictional boundaries is mostly uncoordinated. Planning
and investment decisions occurring in silos and weak
communication encumber our ability to boost the region’s
competitive edge and secure its long-term success in
globalized economy.
Discussion Questions
1) Are legislatures and federal, state/provincial
and city governments doing enough to explore
new ways of successfully delivering modern
infrastructure?
2) When is it effective for government to
partner with the private sector to deliver
infrastructure, and how can government and
business structure their partnerships to make
investments?
3) What are the some of the barriers that are
limiting the opportunity for governments
and businesses to work together on new
infrastructure investments?
4) How can investment in infrastructure become
a driver for economic development in the Great
Lakes region?
5) Do we have the right mechanisms in place to
facilitate closer cooperation on sharing best
practices with respect to innovative financing
and procurement models as well as regional
growth planning and the prioritization of
regional infrastructure investments?
Restoration, Transformation and Growth
April 2015
13
Innovating Together
Economic Corridors and Clusters
The GLSLR gateway, which is
defined by well-established
trade corridors, provides a
critical link to continental
and global markets. Over
the last decade, we have
witnessed the development of
clusters of innovation within
the region’s metropolitan
areas, from life sciences
and aerospace to ICT and
automotive.
An industry cluster is “a
group of firms and related
economic actors and institutions that are located near one
another and that draw productive advantage from their
mutual proximity and connections.”57 Clusters are a key
organizational unit for understanding and improving the
performance of regional economies.58
Clusters break the rules of vertical integration where a firm
performs all necessary functions in-house, and as Porter
argues, the existence of a cluster may go unrecognized.59
Clusters are important for regions because they generate
wealth, exports, jobs, and information. Firms gravitate
towards clusters because they provide economies of scale,
productivity advantages, marketing, and other competitive
advantages.60
The economies of scale that come from clusters reduce
costs, expand pools of shared labor and expertise, and
create positive synergies that spill over from one successful
enterprise to the next.61
The value of clusters lies in the potential for entire value
chains to be situated within a cluster, which are increasingly
extending across the border: manufacturing, research,
suppliers, distributors, academic institutions, support
services, and so forth.62 This creates efficiency and spillover
benefits and has the greatest potential for sustainability.
As the recovery from the Great Recession is firming up
in both the United States and Canada, the physical and
psychological barriers imposed by an international border
within the GLSLR have challenged clusters that would
14
normally emerge on the basis of geographic proximity. The
border has reduced the expansionary prospects of clusters in
some cases, but enterprises that have invested the time and
resources to overcome border barriers have been rewarded.
Discussion Questions
1) What can we do to promote cluster formation,
growth, and connectivity across the Great
Lakes states and provinces?
2) What lessons are there from the massive
cross-border automotive cluster?
3) How do we work together to strengthen the
region’s trade corridors?
Blue Economy
Water, water, everywhere! The Great Lakes, containing
roughly 21 percent of the world’s and 84 percent of North
America’s fresh water, form the largest group of freshwater
lakes on earth. They are often referred to as inland seas
because of their size and natural processes. However, as
large as they may be, only one percent of the waters of the
Great Lakes are renewed annually by precipitation, run-off
and groundwater. So while they are large, it doesn’t take
much to put them at risk.
The development of a blue economy epitomizes the triple
bottom line for the GLSLR: people, prosperity, and planet.
Effective stewardship of the lakes is therefore critical,
not only in terms of protecting the region’s natural places
and preserving our outdoor lifestyle, but also our future
prosperity. The lakes have been the foundation of the
region’s industrial economy and will be at the center of
global trade for decades to come.
The blue economy focuses on sustainable usage of shared
resources. This principle is key to the larger restoration
economy that we envision for the GLSLR — one in which
our physical, social and cultural assets are preserved and
where the legacies of past success become the seeds for
future prosperity through the development of new green
technologies and the export of services in areas like
remediation, environmental engineering, and sustainable
land use planning.
As illustrated at the Great Lakes-St. Lawrence Region
Summit in 2011, nascent blue economy initiatives exist
throughout the region, such as in Milwaukee, Cleveland,
southwestern Ontario and many parts of Michigan, but
they are not well networked with each other. As indicated
in 2011, this sector needs to reach its full potential in
attracting investors, exposing its products or tapping into
global networks.
Regulatory Cooperation
The United States and Canada have world-class regulatory
systems, but differences between regulations have
emerged over time as our integrated economies evolved
independently. These differences increase costs in an
integrated supply chain, raise the administrative burden on
business, and hinder cross-border trade.
The bi-national Regulatory Cooperation Council (RCC) was
introduced in tandem with the BTB. It brought together
federal regulators and businesses from both countries to
make inspection and certification practices more efficient
in 29 areas with a focus on four sectors: agriculture,
transportation, health and personal care products, and the
environment. The ultimate goal of this process is to reduce
and eliminate duplicative and unnecessary regulatory
requirements.
The experiment has yielded some successes in harmonizing
regulations in areas such as dangerous goods, motor
vehicle safety, and energy efficiency, but in other areas (e.g.
preclearance, marine safety and environmental standards),
progress has been slow. This has caused groups like the
Canadian Chamber of Commerce to call for a broader and
more institutionalized approach to regulatory harmonization
that would go beyond the RCC.63
Stakeholders outside of the 29 focus areas are virtually
unaware of its existence. The second phase of the RCC is
moving from a product focus to a regulator focus, mandating
that federal regulators meet regularly and agree to align
standards and practices wherever possible. This should
help to more deeply embed the practice of cooperation and
increase access and awareness by other stakeholders.
Discussion Questions
Discussion Questions
1) What is the best way to encourage networking
between the region’s blue economy clusters
and collaboration with the region’s academic
institutions?
1) Will the new approach yield broader results?
Can a slow, technical initiative maintain the
political momentum it needs to survive in the
long term?
2) What areas of the blue economy show
the most promise in terms of investment
attraction or product development in the short
to medium term?
2) If not, how can we build more durable
mechanisms for information sharing and
regulatory alignment?
3) Should we launch an annual international Blue
Economy Summit and Expo in the Great Lakes
to showcase the region as a world leader in
the blue economy?
3) Are there unnecessary or duplicative state,
provincial or municipal regulations that create
additional burdens on the GLSLR?
4) If so, should we elevate these issues to the
RCC or establish a separate regional process
to address them?
Restoration, Transformation and Growth
April 2015
15
Conclusion
The GLSLR has a wealth of assets including integrated
transportation infrastructure, diverse ecosystems,
innovative capacity and pools of talented workers. The
region has taken a monumental step into the future as a
distinct, unified sub-region, but much more work needs to
be done in order to build the region together, move goods
together, and innovate together.
The barriers to our future prosperity are real, and growing
policy fragmentation in key areas such as transportation,
energy, and infrastructure hinder the region’s ability to
capitalize on new and emerging opportunities. The Council
of the Great Lakes Region seeks to facilitate communication
and consensus building so that stakeholders throughout the
eight states and two provinces can restore, transform and
grow the bi-national Great Lakes St. Lawrence economy.
If you are interested in becoming a member of the Council of the
Great Lakes Region and/or a financial sponsor of its events and
research projects, please contact:
Mark P. Fisher, President and CEO
Council of the Great Lakes Region
Phone: (613) 668-2044
E-mail: [email protected]
720 Spadina Avenue, Suite 218 Toronto, Ontario, Canada M5S 2T9
11075 East Boulevard, #245A Cleveland, Ohio 44106
16
Acknowledgments
The Council of the Great Lakes Region would like to
thank the staff at Dawson Strategic for their assistance in
preparing this report.
Endnotes
1
All figures in Canadian dollars unless otherwise noted.
2
International Monetary Fund, “Cross Currents,” World Economic Outlook Update (January 19, 2015).
3
Remarks by Laurence Fink. World Economic Forum.
4
Rich Miller, “U.S. Retakes the Helm of the Global Economy,” Bloomberg Business (January 1, 2015).
5
Council on Foreign Relations, “Building a North American Community,” Task Force Report No. 53.
6
A good example of reshoring is Whirlpool’s decision to move its commercial washing machine production from Monterrey,
Mexico to Clyde, Ohio. For other case studies of American manufacturing companies reshoring operations back to the United
States, see the Reshoring Initiative website at: http://www.reshorenow.org/case-studies/.
7
Richard Baldwin, “WTO 2.0: Global Governance of Supply Chain Trade,” Centre for Economic Policy Research, Policy Insight No. 64
(December 2012).
8
J.D. Synder, et al. “Global Models of Binational Regional Collaboration: The Potential for Great Lakes Regional Innovation.”
Center for Community and Economic Development (Michigan State University, May 2014), 1.
9
For a detailed analysis of the R&D and human capital assets of the region, please see ‘The Vital Connection’ by Austin et al.
10 Times Higher Education, World University Rankings 2014-2015 (2014).
11 Author’s calculations with data from U.S. Department of Education, New State-by-State College Attainment Numbers Show Progress
Toward 2020 Goal, July 2012; Higher Education Quality of Council of Ontario, Quick Stats — Section 5 — Graduate Outcomes; and
Institut de la statistique du Québec, Gender gap in university completion exceeds 10 percentage points in favour of women among those
aged 25 to 34, December 2014.
12 John Austin, Elaine Dezenski, and Britany Affolter-Caine, “The Vital Connection: Reclaiming Great Lakes Economic
Leadership in the Bi-National US-Canadian Region.” Metropolitan Policy Program, The Brookings Institution. (March 2008).
13 National Science Foundation, Business Research and Development and Innovation Survey: 2011(December 2014); and Statistics
Canada, Domestic spending on research and development (GERD), funding sector, by province (Canada), 2011(December 2014).
14 Author’s calculations with data from U.S. Patent And Trademark Office, Patents By Country, State, and Year — All Patent Types
(December 2013) and Canadian Intellectual Property Office, A Foundation for the Future: Canadian Intellectual Property office
Annual Report 2011-12 (2012).
15 Joshua Hjartarson, Matthew Mendelsohn, Allison Bramwell, and Kelly Hinton, “The Vital Commons: An Agenda for the Great
Lakes — St. Lawrence Region,” (Mowat Centre, June 2011). .
16 The Economist, “Safe Cities Index 2015: Assessing urban security in the digital age.” Economist Intelligence Unit (2015).
17 U.S. National Institute of Standards and Technology, “U.S. Manufacturing in Context,” Advanced Manufacturing Portal.
18 The Economist, “A third industrial revolution,” Special Report: Manufacturing and Innovation (April 21, 2012).
19 President’s Council of Advisors on Science and Technology, “Report to the President on Capturing Domestic Competitive
Advantage in Advanced Manufacturing,” Executive Office of the President (July 2012).
20 Deloitte LLP, “City of Hamilton: The Current and Future State of Hamilton’s Advanced Manufacturing Sector” (October 2013), 11.
21 Boston Consulting Group, “Takeoff in Robotics Will Power the Next Productivity Surge in Manufacturing,” Press Releases
(February 10, 2015).
22 KPMG LLP, “Canadian Manufacturing Outlook 2014 — Leveraging Opportunities, Embracing Growth” (2014).
Restoration, Transformation and Growth
April 2015
17
23 Robert Kavcic, “Great Lakes Region: North America’s Economic Engine” BMO Special Report (Bank of Montreal, April 2014).
24 Conference Board of Canada, “Advanced Skills and Innovation,” How Canada Performs: Hot Topics (June 2011).
25 The Economist, “3D Printing Will Disrupt Manufacturing,” GE Look Ahead Blog (2015).
26 PricewaterhouseCoopers LLP, “3D printing and the new shape of industrial manufacturing” PricewaterhouseCoopers LLP
(June 2014), 1.
27 PricewaterhouseCoopers, “Shale gas: Still a boon to US manufacturing?” PricewaterhouseCoopers LLP. December 2014, p. 1.
28 America Makes, Mission Statement.
29 Measured by units of output per unit of input.
30 Canadian Chamber of Commerce, “Barrier 1: Skills Shortages,” Top 10 Barriers to Competitiveness 2014 (2014).
31 PricewaterhouseCoopers. “Shale gas: Still a boon to U.S. Manufacturing?” PricewaterhouseCoopers LLP (December 2014).
32 Dina O’Meara, “Natural Gas and Canada’s Manufacturing Renaissance,” Energy Magazine (2015).
33 Analytica Advisors, “2014 Canadian Clean Technology Industry Report” (2014).
34 International Renewable Energy Agency, “Renewable Energy Prospects: United States of America,” REmap 2030: A Renewable
Energy Roadmap (January 2015).
35 International Energy Agency, “Energy Policies of IEA Countries: The United States,” 2014 Review (2014).
36 David Thomas, “How the U.S. Economy Benefits from International Trade and Investment,” Trade Benefits America (Business
Roundtable, 2013).
37 Department of Foreign Affairs, Trade and Development Canada, “Global Markets Action Plan: The Blueprint for Creating Jobs
and Opportunities for Canadians Through Trade.” Global Markets Action Plan.
38 Industry Canada, Trade Data Online.
39 Ontario Trucking Association, Freight Economy.
40 Government of Canada, “Beyond the Border Action Plan in Brief,” Canada’s Economic Action Plan.
41 Alexander Moens and Nachum Gabler. “Measuring the Costs of the Canada-U.S. Border,” The Fraser Institute (August 2012).
42 Bryan Roberts, et al, “The Impact on the U.S. Economy of Changes in Wait Times at Ports of Entry: Report to U.S. Customs
and Border Protection,” National Center for Risk and Economic Analysis of Terrorism Events, University of Southern California (April 4,
2013).
43 Stephen Cryne, “Cross Border Mobility,” Canadian Employee Relocation Council Presentation to PNWER Summit (July 22, 2014).
44 Moens and Gabler, 2012.
45 The St. Lawrence Seaway Management System, “Great Lakes / St. Lawrence Seaway (Highway H2O) Facts,” Facts and Figures
(2013). http://www.seaway.ca/en/seaway/facts/index.html.
46 Betty Sutton, “Year of Action — Gaining Traction,” Administrator’s Column, Seaway Compass, Fall 2014 (2014), 2.
47 Martin Associates, The Economic Impacts of the Great Lakes-St. Lawrence Seaway System, October 2011.
48 St. Lawrence Seaway Management System, 2013.
49 Martin Associates, 2011.
50 Steve Arnold, “Great Lakes shipping fleet getting major renewal,” Hamilton Spectator (May 22, 2013).
51 Great Lakes — St. Lawrence Seaway System, “The System: Touching the Heartland,” (2009). 7.
52 John Schwartz, “Freight train late? Blame Chicago,” New York Times (May 7, 2012).
18
53 Richard Dobbs, et al, “Infrastructure Productivity: How to Save $1 Trillion a Year,” McKinsey Global Institute Report
(January 2013), 1.
54 American Society for Civil Engineers, “2013 Report Card for America’s Infrastructure,” (March 2013).
55 Federation of Canadian Municipalities, “The Canadian Infrastructure Report Card 2012,” (October 2012).
56 Martin Associates, “Infrastructure Investment Survey of the Great Lakes and St. Lawrence Seaway System” (January 2015).
57 Joseph Cortright, “Making Sense of Clusters: Regional Competitiveness and Economic Development.” Brookings Institution
Metropolitan Policy Program Discussion Paper (March 2006).
58 Cortright 2006.
59 Michael Porter, “Clusters and the New Economics of Competition,” Harvard Business Review (November 1998)
60 Mary Jo Waits, “The Added Value of the Industry Cluster Approach to Economic Analysis, Strategy Development, and Service
Delivery,” Economic Development Quarterly, Vol 14. No 1, (February 2000)
61 The Economist, “Clustering — The phenomenon whereby firms from the same industry gather together in close proximity,”
(August 2009).
62 Harold Sirkin, “The Power of Industry Clusters,” Bloomberg Businessweek (October 2012).
63 Canadian Chamber of Commerce, "Greater Regulatory Harmonization between Canada and the United States," Transportation
Resolutions Transportation and Infrastructure Committee (2014).
Restoration, Transformation and Growth
April 2015
19
References
America Makes. Mission Statement. https://americamakes.us/about/mission
American Society of Civil Engineers. 2013. “2013 Report Card for America’s Infrastructure.” http://www.infrastructurereportcard.
org/
Analytica Advisors. 2014. “2014 Canadian Clean Technology Industry Report.” Executive Summary. October 7. http://www.analyticaadvisors.com/publications
Arnold, Steve. 2013. “Great Lakes shipping fleet getting major renewal” Hamilton Spectator. May. http://www.thespec.com/newsstory/2883301-great-lakes-shipping-fleet-getting-major-renewal/
Austin, John, Elaine Dezenski, and Britany Affolter-Caine. 2008. “The Vital Connection: Reclaiming Great Lakes Economic
Leadership in the Bi-National US-Canadian Region.” Metropolitan Policy Program. The Brookings Institution. March.
http://www.brookings.edu/~/media/research/files/reports/2008/3/24%20greatlakes%20canada%20austin/greatlakes_
canada.pdf
Axworthy, Thomas S. 2010. “Understanding the value of our water”. Blue Economy Initiative. June 10. http://www.blue-economy.ca/
opinion/understanding-value-our-water
Baldwin, Richard. 2012. “WTO 2.0: Global Governance of Supply Chain Trade.” Centre for Economic Policy Research. Policy Insight No.
64. December.
Bitti, Mary Teresa. 2014. “Canada’s best-kept secret: 14 cool and innovative clean-tech companies”. Financial Post. November 11.
http://business.financialpost.com/2014/11/11/canadas-best-kept-secret-14-cool-and-innovative-clean-tech-companies/?__
lsa=1bf1-a0d9
Boston Consulting Group. 2015. “Takeoff in Robotics Will Power the Next Productivity Surge in Manufacturing.” Press Releases
(February 10).
Bureau of Economic Analysis of the U.S. 2013. “Balance of Payments and Direct Investment Position Data, Foreign Direct
Investment in the U.S.” http://www.bea.gov/international/index.htm#omc
Bureau of Economic Analysis. 2013. “Table 1. Real GDP by State, 2010-2013.” U.S. Department of Commerce. http://www.bea.gov/
newsreleases/regional/gdp_state/gsp_newsrelease.htm
Bureau of Labor Statistics, United States Department of Labor. 2013. “State and Area Employment, Hours, and Earnings.” http://
www.bls.gov/data/
Bureau of Transportation Statistics. 2013. “TransBorder Freight Data.” U.S. Department of Transportation. http://transborder.bts.
gov/programs/international/transborder/TBDR_QuickSearchPC.html
Canadian Chamber of Commerce. 2014. “Greater Regulatory Harmonization between Canada and the United States.”
Transportation Resolutions. Transportation and Infrastructure Committee.
Canadian Chamber of Commerce. 2014. “Barrier 1: Skills Shortages.” Top 10 Barriers to Competitiveness. http://www.chamber.ca/
advocacy/top-10-barriers-to-competitiveness/140206_Barrier_1.pdf
Canadian Intellectual Property Office. 2012. “A Foundation for the Future: Canadian Intellectual Property Office Annual Report
2011-12.” Annual Reports.
Canadian Wind Energy Association. 2013. “Installed Capacity.” http://canwea.ca/wind-energy/installed-capacity/
CBC. 2014. “Canada, U.S. name panel to oversee new $1 billion Detroit-Windsor Bridge”. CBC News Windsor. July 29. http://www.
cbc.ca/news/canada/windsor/canada-u-s-name-panel-to-oversee-new-1b-detroit-windsor-bridge-1.2721513
Central Intelligence Agency. “The World Factbook”. https://www.cia.gov/library/publications/the-world-factbook/
rankorder/2078rank.html
Conference Board of Canada. 2011. “Advanced Skills and Innovation.” How Canada Performs: Hot Topics (June).
Conference Board of Canada. 2013. How Canada Performs: Labor Productivity Growth. March.
Cortright, Joseph. 2006. “Making Sense of Clusters: Regional Competitiveness and Economic Development.” Discussion Paper. The
Brookings Institution Metropolitan Policy Program. The Brookings Institution. March.
20
Council on Foreign Relations. 2005. “Building a North American Community.” Independent Task Force Report No. 53. Council on
Foreign Relations Press. p 29. http://www.cfr.org/canada/building-north-american-community/p8102
Coy, Peter. 2014. “2015 Global Economic Outlook: Better Than 2014 — But Not By Much.” Bloomberg Businessweek. November 6.
http://www.businessweek.com/articles/2014-11-06/2015-global-economic-outlook-better-than-2014-but-not-by-much
Cryne, Stephen. 2014. “Cross Border Mobility.” Presentation to PNWER Summit. Canadian Employee Relocation Council. July 22.
http://www.pnwer.org/summit-presentations.html
Cubeddu, Luis, Alex Culiuc, Ghada Fayad, Yuan Gao, Kalpana Kochhar, Annette Kyobe, Ceyda Oner, Roberto Perrelli, Sarah Sanya,
Evridiki Tsounta and Zhongxia Zhang. 2014. “Emerging Markets in Transition.” International Monetary Fund. June. http://www.
imf.org/external/pubs/ft/sdn/2014/sdn1406.pdf
Cunningham, Storm. 2002. “The Restoration Economy: The Greatest New Growth Frontier.” Berrett-Koehler Publishers.
Deloitte. 2013. “City of Hamilton — The Current and Future State of Hamilton’s Advanced Manufacturing Sector”. Deloitte LLP and
Affiliates. October. p.11.
Dobbs, Richard, Herbert Pohl, Diaan-Yi Lin, Jan Mischke, Nicklas Garemo, Jimmy Hexter, Stefan Matzinger, Robert Palter and
Rushad Nanavatty. 2013. “Infrastructure Productivity: How to Save $1 Trillion a Year.” McKinsey Global Institute. January. http://
www.mckinsey.com/insights/engineering_construction/infrastructure_productivity
Economist Intelligence Unit. 2015. “The Safe Cities Index 2015: Assessing urban security in the digital age.” Economist Intelligence
Unit Reports.
Ellyn, Fortino. 2014. “Chicago Hosts U.S.-Canada Energy Summit; Cook County Board Opposes Canadian Nuclear Dump.” Progress
Illinois. October. http://www.progressillinois.com/posts/content/2014/10/16/chicago-hosts-us-canada-energy-summit-cookcounty-board-opposes-canadian-nu
Federation of Canadian Municipalities. 2014. “The Canadian Infrastructure Report Card 2012.” October 27. http://
canadainfrastructure.ca/en/index.html
Fink, Lawrence. 2015. Remarks from the World Economic Forum Annual Meeting 2015. www.weforum.org/sessions/summary/globaleconomic-outlook-5
Foreign Affairs, Trade, and Development Canada. “Global Markets Action Plan: The Blueprint for Creating Jobs and Opportunities
for Canadians through Trade.” Global Markets Action Plan. http://www.international.gc.ca/global-markets-marches-mondiaux/
index.aspx?lang=eng
Foreign Affairs, Trade and Development Canada. 2013. “Foreign Direct Investment Statistics.” http://www.international.gc.ca/
economist-economiste/statistics-statistiques/investments-investissements.aspx?lang=eng
Gauthier, Alexandre. 2014. “Ontario’s merchandise trade with the world.” Trade and Investment Series 2013. Library of Parliament,
Parliament of Canada. June. http://www.parl.gc.ca/Content/LOP/ResearchPublications/2014-33-e.html
Gold, Russell and Dan Gilbert. 2013. “U.S. Is Overtaking Russia as Largest Oil-and-Gas Producer.” The Wall Street Journal, citing the
Energy Information Agency. October 2. http://www.wsj.com/articles/SB10001424052702303492504579111360245276476
Government of Canada. “Beyond the Border Action Plan in Brief.” Canada’s Economic Action Plan. http://actionplan.gc.ca/en/content/
beyond-border
Government of Ontario. 2012. “Ontario’s Great Lakes Strategy”. The Government of Ontario. December. https://dr6j45jk9xcmk.
cloudfront.net/documents/896/5-1-5-great-lakes-strategy-en.pdf
Great Lakes St. Lawrence Seaway System. “Great Lakes / St. Lawrence Seaway (Highway H2O) Facts and Figures.” The St.
Lawrence Seaway Management Corporation. http://www.seaway.ca/en/seaway/facts/index.html
Great Lakes — St. Lawrence Seaway System. 2009. “The System: Touching the Heartland” 2009-2010 Directory. p.7. http://
greatlakes-seaway.com/en/pdf/Maritime-Final.pdf
Higher Education Quality of Council of Ontario. 2014. “Section 5 — Graduate Outcomes.” Quick Stats.
Hjartarson, Joshua, Matthew Mendelson, Allison Bramwell, and Kelly Hinton. 2011. “The Vital Commons: An Agenda for the Great
Lakes — St. Lawrence Region.” Mowat Centre. June.
Industry Canada. “Trade Data Online.” https://www.ic.gc.ca/eic/site/tdo-dcd.nsf/eng/home
Institut de la statistique du Québec. 2014. “Gender gap in university completion exceeds 10 percentage points in favour of women
among those aged 25 to 34.” News Releases (December 2014).
International Energy Agency. 2014. “Energy Policies of IEA Countries: The United States.” Review. http://www.iea.org/W/
bookshop/489-Energy_Policies_of_IEA_Countries_-_The_United_States
Restoration, Transformation and Growth
April 2015
21
International Monetary Fund. 2015. “Cross Currents,” World Economic Outlook Update. January 19. www.imf.org/external/pubs/ft/
weo/2015/update/01/pdf/0115.pdf
International Monetary Fund. 2014. “Regional Economic Outlook: Western Hemisphere — Rising Challenges.” April. http://www.
imf.org/external/pubs/ft/reo/2014/whd/eng/pdf/wreo0414.pdf
International Renewable Energy Agency. 2015. “Renewable Energy Prospects: United States of America.” REmap 2030: A Renewable
Energy Roadmap. January. http://www.irena.org/remap/IRENA_REmap_USA_report_2015.pdf
Kavcic, Robert. 2014. “BMO Special Report: Great Lakes Region: North America’s Economic Engine.” Bank of Montreal. April. http://
www.bmonesbittburns.com/economics/reports/20140425/GreatLakes1404.pdf
KPMG. 2014. “Canadian Manufacturing Outlook 2014 — Leveraging Opportunities, Embracing Growth.” KPMG LLP. http://www.
kpmg.com/ca/en/issuesandinsights/articlespublications/pages/canadian-manufacturing-outlook-2014.aspx
Kwan, Jennifer. 2013. “As a country, ‘Great Lakes’ economy would rank 4th.” Yahoo! Finance. April. https://ca.finance.yahoo.com/
blogs/balance-sheet/country-great-lakes-economy-rank-4th-144301343.html
Martin Associates. 2011. “The Economic Impacts of the Great Lakes — St. Lawrence Seaway System” October. http://www.
greatlakes-seaway.com/en/pdf/eco_impact_full.pdf
Martin Associates. 2015. “Infrastructure Investment Survey of the Great Lakes and St. Lawrence Seaway System.” January. http://
www.marinedelivers.com/sites/default/files/documents/infrastructure-investment-MD_2015.pdf
Miller, Eric. 2014. “Statement to the Senate Standing Committee on Foreign Affairs and International Trade.” Canadian Council of
Chief Executives. September 25. http://www.ceocouncil.ca/wp-content/uploads/2014/10/Statement-to-the-Senate-StandingCommittee-on-Foreign-Affairs-and-International-Trade-25-September-2014.pdf
Miller, Rich. 2015. “U.S. Retakes Helm of the Global Economy.” Bloomberg Business. January 1.
Moens, Alexander and Nachum Gabler. 2012. “Measuring the Costs of the Canada-U.S. Border.” Studies in Canada-US Relations.
The Fraser Institute. August. http://www.fraserinstitute.org/uploadedFiles/fraser-ca/Content/research-news/research/
publications/measuring-the-costs-of-the-canada-us-border.pdf
Morrow, Adrian and Jeffrey Jones. 2015. “Premier Wynne says Ontario ready to play leading role in economic growth.” The Globe
and Mail. January 5.
National Cooperative Freight Research Program. 2012. “Multimodal Freight Transportation Within the Great Lakes–Saint
Lawrence Basin.” NCFRP Report 17. Transportation Research Board. Washington, D.C. http://onlinepubs.trb.org/onlinepubs/
ncfrp/ncfrp_rpt_017.pdf
National Science Foundation. 2014. Business Research and Development and Innovation Survey: 2011 (December).
Norton, Roy. 2013. “Nurturing Michigan’s Most Important Relationship.” Dome Magazine. November 22.
O’Meara, Dina. 2015. “Natural Gas and Canada’s Manufacturing Renaissance” Energy Magazine.
Ontario Trucking Association. Freight Economy. http://ontruck.org/freight-economy
Organization for Economic Co-operation and Development. 2014. “OECD Economic Outlook.” Volume 2014/2. November. http://
www.oecd.org/eco/outlook/economicoutlook.htm
Petraeus, David H., Robert B. Zoellick and Shannon K. O’Neil. 2014. “North America: Time for a New Focus.” The Council on Foreign
Relations. Independent Task Force Report No. 71. p. 11, 29.
Plecash, Chris. 2014. “Clean-tech emerging as Canada’s fastest-growing industry, outlier in economy.” The Hill Times. September
6. http://www.hilltimes.com/news/news/2014/06/09/clean-tech-emerging-as-canadas-fastest-growing-industry-outlier-ineconomy/38742
Porter, Michael. 1998. “Clusters and the New Economics of Competition.” Harvard Business Review. November. https://hbr.
org/1998/11/clusters-and-the-new-economics-of-competition
President’s Council of Advisors on Science and Technology. 2012. “Report to the President on Capturing Domestic Competitive
Advantage in Advanced Manufacturing.” AMP Steering Committee Report. July. http://www.whitehouse.gov/sites/default/files/
microsites/ostp/pcast_amp_steering_committee_report_final_july_27_2012.pdf
PricewaterhouseCoopers. 2014. “3D printing and the new shape of industrial manufacturing.” PricewaterhouseCoopers LLP. June. p.
1. http://www.pwc.com/us/en/industrial-products/3d-printing.html
PricewaterhouseCoopers. 2014. “Shale gas: Still a boon to US manufacturing?” PricewaterhouseCoopers LLP. December. http://www.
pwc.com/en_US/us/industrial-products/publications/assets/shale-gas-boosts-us-manufacturing.pdf
22
Roberts, Bryan, Nathaniel Heatwole, Dan Wei, Misak Avetisyan, Oswin Chan, Adam Rose and Isaac Maya. 2013. “The Impact on
the U.S. Economy of Changes in Wait Times at Ports of Entry.” Report to U.S. Customs and Border Protection. National Center
for Risk and Economic Analysis of Terrorism Events University of Southern California. April. http://create.usc.edu/CBP%20
Final%20Report.pdf
Saint Lawrence Seaway Development Corporation. 2014. “Seaway Compass.” Fall Newsletter. U.S. Department of Transportation.
http://www.seaway.dot.gov/sites/seaway.dot.gov/files/docs/slsdc_newsletter_fall_2014.pdf
Sands, Christopher in Norton, Roy. 2013. “Nurturing Michigan’s Most Important Relationship.” Dome Magazine. November 22.
Schumpeter, Joseph A. 1942. Capitalism, Socialism and Democracy. London: Routledge.
Schwartz, John. 2012. “Freight train late? Blame Chicago.” New York Times, May 7.
Shlozberg, Reuven, Rob Dorling and Peter Spiro. 2014. “Low Water Blues: An Economic Impact Assessment of Future Low Water
Levels in the Great Lakes and St. Lawrence River”. The Council of the Great Lakes Region and the Mowat Centre. June 26. http://
councilgreatlakesregion.org/working-groups/low-water-blues/
Sirkin, Harold. 2012. “The Power of Industry Clusters.” Bloomberg Businessweek. October. http://www.businessweek.com/
articles/2012-10-22/the-power-of-industry-clusters
Synder, J.D., Kelly Christopherson, Leslie Grimm, Anthony Orlando and Aaron Galer.. 2014. “Global Models of Binational Regional
Collaboration: The Potential for Great Lakes Regional Innovation.” Center for Community and Economic Development (Michigan
State University, May 2014), 1.
Statistics Canada. 2013. “Contribution of industries to private sector employment, gross employment creation and gross
employment destruction, by North American Industry Classification System (NAICS), provinces and the territories, annual
(percentage) CANSIM Table 527-0011.” http://www5.statcan.gc.ca/cansim/pick-choisir?lang=eng&p2=33&id=5270011
Statistics Canada. 2014. “Domestic spending on research and development (GERD), funding sector, by province (Canada).” http://
www.statcan.gc.ca/tables-tableaux/sum-som/l01/cst01/scte01a-eng.htm
Statistics Canada. 2013. “Gross domestic product, expenditure based, by province and territory.” http://www.statcan.gc.ca/tablestableaux/sum-som/l01/cst01/econ15-eng.htm
Statistics Canada. 2013. “Labour force characteristics, unadjusted, by province.” http://www.statcan.gc.ca/tables-tableaux/sumsom/l01/cst01/lfss02b-eng.htm
Statistics Canada. 2013. “Population by year, by province and territory.” http://www.statcan.gc.ca/tables-tableaux/sum-som/l01/
cst01/demo02a-eng.htm
Sutton, Betty. 2014. “Year of Action — Gaining Traction.” Administrator’s Column. Seaway Compass, Fall 2014. Saint Lawrence
Seaway Development Corporation. p. 2. http://www.seaway.dot.gov/editorial-type/news-item
TD Bank Group. 2014. “Long-term Economic Forecast.” TD Economics. December 17. http://www.td.com/document/PDF/
economics/qef/long_term_dec2014.pdf
Times Higher Education. 2014. World University Rankings 2014-15.
The Economist. 2009. “Clustering — The phenomenon whereby firms from the same industry gather together in close proximity.”
August 24. http://www.economist.com/node/14292202
The Economist. 2012. “A Third Industrial Revolution.” Special report: Manufacturing and innovation. April 21.
The Economist. 2013. “Reshoring manufacturing: Coming home.” January 19. http://www.economist.com/news/specialreport/21569570-growing-number-american-companies-are-moving-their-manufacturing-back-united
The Economist. 2014. “3D printing will disrupt manufacturing.” GE Look Ahead Blog. June 4. http://gelookahead.economist.com/3dprinting-will-disrupt-manufacturing-2/
The Economist. 2014. “State of the debate. Is the US the new rising manufacturing star?” GE Look Ahead Blog. November 16. http://
gelookahead.economist.com/state-of-the-debate-is-the-us-the-new-rising-manufacturing-star/
The Gandalf Group. 2014. “Canadian Opinion About Canada-U.S. Trade, Commerce, and Globalization.” Canadian American Business
Council. November.
The Government of Ontario. 2012. “Ontario’s Great Lakes Strategy”. December. https://dr6j45jk9xcmk.cloudfront.net/
documents/896/5-1-5-great-lakes-strategy-en.pdf
The St. Lawrence Seaway Management System. “Great Lakes / St. Lawrence Seaway (Highway H2O) Facts.” Facts and Figures.
http://www.seaway.ca/en/seaway/facts/index.html
Thomas, David. 2013. “How the U.S. Economy Benefits from International Trade and Investment.” Trade Benefits America: Business
Roundtable.
Restoration, Transformation and Growth
April 2015
23
Transport Canada. 2013. “Transportation in Canada 2013, Overview Report.” https://www.tc.gc.ca/eng/policy/anre-menu.htm
U. S. Census Bureau. 2013. “U.S. and World Population Clock.” https://www.census.gov/popclock/
U.S. Census Bureau. 2013. “State by 6-Digit HS Code and Top Countries.” https://www.census.gov/foreign-trade/statistics/state/
data/index.html
U.S. Census Bureau. 2013. “Top Trading Partners — December.” https://www.census.gov/foreign-trade/statistics/highlights/top/
top1312yr.html
U.S. Department of Education. 2012. New State-by-State College Attainment Numbers Show Progress Toward 2020 Goal. (July).
U.S. Department of Energy. 2014. “WINDExchange—Installed Wind Capacity.” http://apps2.eere.energy.gov/wind/windexchange/
wind_installed_capacity.asp
U.S. Department of State. 2014. “U.S. Relations with Canada.” September. http://www.state.gov/r/pa/ei/bgn/2089.htm
U.S. Energy Information Administration. “Today in Energy.” http://www.eia.gov/todayinenergy/detail.cfm?id=4850
U.S. National Institute of Standards and Technology. “U.S. Manufacturing in Context.” Advanced Manufacturing Portal.
U.S. Patent and Trademark Office. 2013. “Patents by Country, State, and Year — All Patent Types.”
Waits, Mary Jo. 2000. “The Added Value of the Industry Cluster Approach to Economic Analysis, Strategy Development, and
Service Delivery,” Economic Development Quarterly, Vol 14. No 1. February. http://www.nga.org/files/live/sites/NGA/files/
pdf/0602INDUSTRYCLUSTER.pdf
Welsh, Hugh. 2013. “Why Manufacturing Jobs Are Returning To North America For The First Time In Decades.” Business Insider.
February 27. http://www.businessinsider.com/manufacturing-jobs-returning-to-america-2013-2
World Bank. 2013. “Population Data.” http://data.worldbank.org/indicator/SP.POP.TOTL
World Bank. 2015. “Global Economic Prospects, Having Fiscal Space and Using It.” Preliminary. January. http://www.worldbank.
org/en/publication/global-economic-prospects
24
CANADA
UNITED STATES
720 Spadina Avenue, Suite 218
Toronto, Ontario, Canada M5S 2T9
11075 East Boulevard #245A
Cleveland, Ohio 44106
Phone: (613) 668-2044
Fax:
(416) 978-7203
E-mail: [email protected]
www.councilgreatlakesregion.org

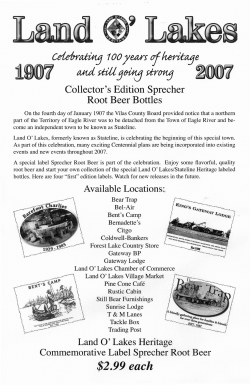


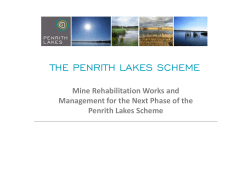


© Copyright 2026