
Lower Corporate Taxes: Who Benefits?
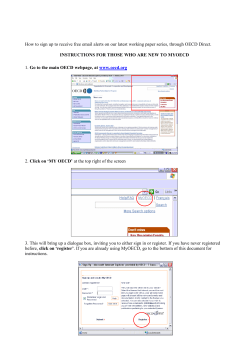
Fact Sheet # 4
Lower Corporate Taxes: Who Benefits?
T
he recent trend of cutting corporate taxes should be reversed. There is a much greater cost to citizens due to lost
programs and opportunities than the marginal benefits reaped through corporate tax cuts. Corporations have
an obligation to help sustain the public services and physical infrastructure that contribute to their productivity
and enable them to generate wealth.
The revenue generated by corporate taxes plays an important role in building and maintaining Canada’s physical and
social infrastructure. Yet successive cuts in recent years have rendered Canada’s combined federal and provincial
corporate tax rates the second lowest among G7 countries, and considerably lower than U.S. rates.25
The case for corporate tax cuts has been made on economic grounds – that tax cuts will enhance economic
performance. Yet Canadians are right to wonder: who benefits as corporate bank accounts have swelled and
business investment declines?
Corporate tax rates have decreased dramatically since 2000
Figure 6: Federal and Provincial Corporate Tax Rates,
2000 and 2014
30%
28.0%
Federal Government Corporate Tax
Rate
25%
Provincial Government Corporate
Tax Rate (Average)
20%
15.0%
15%
13.3%
11.4%
10%
5%
0%
2000
2014
Source: OECD Tax Database, Table II.1. http://www.oecd.org/tax/tax-policy/tax-database.htm
11
Percent
60
Figure 7: Canadian Combined Corporate Income Tax Rate
(1981-2014)
50.9
50
42.4
40
41.3
26.3
30
20
10
0
1981
1985
1989
1993
1997
2001
2005
2009
2013
Source: OECD, OECD Tax Database. Table II.1. http://www.oecd.org/tax/tax-policy/tax-database.htm; Statistics
Canada, CANSIM Table 180-0003 – Financial and taxation statistics for enterprises, by North American Industry
Classification System (NAICS), annual
Canadians households are picking up the slack
• Successive rounds of tax cuts have cost Canadian
families dearly by shifting the balance between
individual and corporate taxes. In 2014-15, for the first
time ever, more than half of the federal government’s
revenue is projected to come from personal income
taxes, up from a 30% share 50 years ago.26
profits, corporate taxes now make up roughly 14% of
federal government revenues, down from over 20%
before 1970.27 The overall share of corporate taxes paid
to all levels of government is even lower – at 8.3%.28
• Taken together, cuts to corporate taxes since 2007
are costing the federal government up to $13 billion
per year in foregone revenue.29
• The share of taxes paid to government by corporations,
however, has been trending down. Despite record
Figure 8: Federal Government Revenues by Income Source, 2000, 2007, 2014
Q3 2000
Q3 2007
Q3 2014
% change
Income taxes
44.5%
47.4%
49.6%
11.3%
Corporations and government businesses
15.5%
15.1%
13.9%
-10.3%
Other sources
40.0%
37.5%
36.5%
-8.8%
Source: Statistics Canada. Table 380-0080 - Revenue, expenditure and budgetary balance - General governments, quarterly (dollars)
12
Who benefits from corporate tax cuts?
• Governments promise that corporate tax cuts will
lead to increased economic activity and investment.
However, those promises have fallen short. Why?
Because record profits sit idle in bank accounts
causing foregone tax revenues to undermine the
quality of public programs, and further driving a
wedge between the wealthy and the rest.
• A study that tracked 198 of the top Canadian
companies that had year-end data from 2000 to 2009
revealed the companies were making 50% more
profit and paying 20% less tax in 2009 than in 2000.
What’s more, the number of jobs created by these
corporations was actually lower than the average
employment growth in Canada.30
• Between 2000 and 2014, a period when corporate
taxes fell to record lows (Figure 6), the total cash
reserves of private, non-financial corporations grew to
$673.5 billion, an increase of nearly 370%.31
• A one percentage point increase in the corporate
tax rate would generate $1.85 billion in federal
government revenue32 – more than enough to expand
the number of high quality child care spaces and the
stock of affordable housing units across the country.
Since 2000, corporate revenue has been increasingly piling up in bank
Figure 9: Total Currency and Deposits of Non-Financial
Corporations in Canada ($millions) 2000-2014
$800,000
$700,000
$600,000
$500,000
$400,000
$300,000
$200,000
$100,000
$0
Source: Statistics Canada. Table 378-0121 - National Balance Sheet Accounts, quarterly (dollars)
OECD, OECD Tax Database. Table II.1. http://www.oecd.org/tax/tax-policy/tax-database.htm
Toby Sanger (2013), “Canada’s (not so incredible) shrinking federal government,” The
Progressive Economic Forum, November 20, 2013. http://www.progressive-economics.
ca/2013/11/20/canadas-not-so-incredible-shrinking-federal-government/
27
Ibid.
28
Statistics Canada, CANSIM Table 380-0080 – Revenue, expenditure and budgetary balance,
General governments, quarterly (dollars)
29
Jim Stanford (2013), “Good time to rethink corporate tax cuts,” The Progressive Economics
Forum, November 14, 2013. http://www.progressive-economics.ca/2013/11/14/good-time-torethink-corporate-tax-cuts/
25
26
David MacDonald (2011), “Corporate Income Taxes, Profit, and Employment Performance
of Canada’s Largest Companies,” Behind the Numbers. Ottawa: Canadian Centre for Policy
Alternatives.
https://www.policyalternatives.ca/sites/default/files/uploads/publications/
National%20Office/2011/04/Corporate%20Income%20Taxes%2C%20Profit%2C%20and%20
Employment.pdf
31
Statistics Canada, CANSIM Table 378-0121 – Total currency and deposits for non-financial
corporations, National Balance Sheet Accounts, quarterly (dollars)
32
Jason Jacques, et al. (2013). Revenue Impacts Arising from Tax Adjust¬ments: 2014. Ottawa:
Office of the Parliamentary Budget Officer. http:// www.pbo-dpb.gc.ca/files/files/Ready_
Reckoner_2014_EN.pdf
30
Visit www.cpj.ca to learn more about Citizens for Public Justice, an organization inspired by faith to work for justice in Canadian public policy.
© Citizens for Public Justice, May 2015 13


© Copyright 2026