
PUNISHED FOR THEIR FATHERS? SCHOOL DISCIPLINE AMONG
PUNISHED FOR THEIR FATHERS?
SCHOOL DISCIPLINE AMONG CHILDREN OF THE PRISON BOOM
Wade C. Jacobsen
The Pennsylvania State University
April 2015
Fragile Families Working Paper: 14-08-FF
PLEASE DO NOT CITE WITHOUT PERMISSION
Keywords: school discipline, mass incarceration, child behavior problems, intergenerational
stigmatization, system avoidance
Direct correspondence to Wade C. Jacobsen, The Pennsylvania State University, 1001 Oswald Tower,
University Park, PA 16802; [email protected]. The Fragile Families and Child Wellbeing Study is
supported by the Eunice Kennedy Shriver National Institute of Child Health and Human Development
through grants R01HD36916, R01HD39135, and R01HD40421 as well as a consortium of private
foundations (http://www.fragilefamilies.princeton.edu/funders.asp). I thank Sara Jacobsen for her support
and the following for assistance with data access, coding, statistical consulting, and earlier drafts: staff at
the Department of Education Office of Civil Rights, Bob Apel, Sarah Brayne, Tenille Cannon, Louis
Donnelly, Glenn Firebaugh and graduate students in his 2014 “Writing for Publication” class (Anne
Delesio-Parson, April Gunsallus, Benjamin Gurrentz, Robert Hutchison, Christopher Inkpen, Julia
Laskorounskaia, Ellis Logan, and David Martin), Michelle Frisco, Amanda Geller, Kate Jaeger, Derek
Kreager, Brendan Lantz, Sara McLanahan, Ryan Nixon, Garrett Pace, Wayne Osgood, David Ramey,
Jacob Rugh, Tracey Shollenberger, Jeremy Staff, Naomi Sugie, Jeffery Ulmer, and Sara Wakefield.
PUNISHED FOR THEIR FATHERS:
SCHOOL DISCIPLINE AMONG CHILDREN OF THE PRISON BOOM
Running Head: Punished for Their Fathers
Abstract
By the late 2000s the US incarceration rate had risen to more than 4 times what it was in the mid1970s, and school suspension rates more than doubled. Many incarcerated men are fathers, yet
prior research has not examined the influence of paternal incarceration on children’s risk of
school discipline. Literature suggests multiple causal pathways: externalizing behaviors, lower
parental involvement in school, and intergenerational stigmatization. Using data from the Fragile
Families and Child Wellbeing Study, I examine the effects of recent paternal incarceration on
risk of exclusionary school discipline among urban nine year-olds. Results suggest that (1) recent
paternal incarceration increases children’s risk of being suspended or expelled from school; (2)
effects are largely due to student behavioral problems; (3) beyond behavior problems, effects are
not due to lower parental involvement following incarceration; and (4) although risk is highest
for blacks and boys, effects do not vary by race or gender.
2
[T]oo many Americans [go] to prison for too long, and at times for no truly good public
safety reason. . . One in 28 American children currently has a parent behind bars.
US Attorney General Eric Holder in a testimony before the US Sentencing
Commission on March 13, 2014
Too many schools resort too quickly to exclusionary discipline, even for minor
misbehaviors. [It] is so common that in some cases, pre-K students as young as three- and
four-years old are getting suspended.
US Secretary of Education Arne Duncan at the Release of the Joint
Department of Justice-Education School Discipline Guidance Package on
January 8, 2014
As incarceration has reached unprecedented levels in the United States, so have rates of
school discipline. For every 100 individuals in prison or jail in 2010, there were 114 children
suspended from school (Department of Education Office of Civil Rights 2014; Glaze and
Herberman 2013),1 and both systems of punishment disproportionately affect African American
males (Pettit and Western 2004; Skiba, Shure, and Williams 2012). Prior research finds school
discipline associated with later incarceration and other criminal justice involvement (Fabelo et al.
2011; Shollenberger 2013) but conceptualizes the relationship as a one-way “school-to-prison
pipeline” (Wald and Losen 2003). This paper suggests that among families, the reverse
relationship also occurs—incarceration has a causal effect on school discipline. Specifically, in
line with prior research on the intergenerational consequences of the prison boom (Haskins 2014;
Turney and Haskins 2014), I propose that recent paternal incarceration increases children’s risk
of exclusionary school discipline (i.e., suspension and expulsion). I test this hypothesis by
examining the overall relationship and exploring three causal pathways: student externalizing
behavior problems (i.e., hyperactivity, aggression, and delinquency) (Wakefield and Wildeman
2011), intergenerational stigmatization (Murray 2007), and lower parental involvement in
school.
3
Prior research finds high rates of exclusionary discipline among urban middle and high
school students (Balfanz, Byrnes, and Fox 2013; Losen and Skiba 2010), but few studies focus
on elementary school. Risk for some children may already be high at young ages. For example,
in one district more than 12% of black boys in elementary school were suspended in a single
year (Mendez, Knoff, and Ferron 2002). Thus, I use data from the Fragile Families and Child
Wellbeing Study, a longitudinal birth-cohort study of urban children up to age nine. Since racialethnic disparities in school suspension are lower in highly segregated urban areas (Eitle and Eitle
2004), I expect less of a race effect than has been documented in prior studies, most of which
have been limited to a single state or district (for review see Skiba et al. 2012). I focus instead on
the effects of recent paternal incarceration and the mechanisms of this relationship.
BACKGROUND
Exclusionary Discipline in the United States
Exclusionary school discipline, defined as punishment involving the removal of a student
from a classroom or school, includes in-school suspension (temporary exclusion from the
classroom), out-of-school suspension (temporary exclusion from school grounds), and expulsion
(permanent exclusion from the school). Expulsions are rare instances reserved for the most
serious offenses, but use of suspensions has increased for several decades. Political attention to
rising juvenile crime rates in the 1980s (Browne et al. 2010) led schools to adapt more “zerotolerance” approaches by increasing security measures (e.g., metal detectors, security officers,
armed police) and employing harsher punishments (Gottfredson and Gottfredson 2001). School
districts began mandating expulsions for violence, drugs, and gang-related activity in the early
1990s, but within a few years zero-tolerance approaches were being applied to less serious
offenses (on or off campus) and even minor disruptions (California Department of Education
4
2013; Maag 2012; Simon 2007; Skiba 2000). For example, of the more than 155,000 incidents
resulting in a suspension or expulsion in Connecticut in the 2006-2007 school year, 70% were
for attendance problems, disrespect, or something other than violence, weapons, drugs, theft, or
property damage (Connecticut Department of Education 2010).
These figures are worrisome given the potentially unstructured time suspended students
spend out of school and the growing evidence of negative consequences Ferguson (2001:39)
writes, “[Out-of-school] suspension has the potential to be the freest space of all that children can
win in a state of punishment. . . In general, there is little expectation that any schoolwork will be
done on the part of the school, no monitoring procedures, and plenty of TV watching.”
Unstructured socializing is associated with higher levels of delinquency (Osgood and Anderson
2004). Moreover, a suspension or expulsion may act as a negative label for children, prompting
more deviance (Lemert 1951). It is no surprise then that prior research finds exclusionary
discipline associated with poor school performance, grade retention, dropout, arrest, and
incarceration (Arcia 2006; Arum and Beattie 1999; Balfanz et al. 2013; Davis and Jordan 1994;
Fabelo et al. 2011; Shollenberger 2013). For elementary school children, it represents their first
official sanction; for some, a precursor to criminal justice involvement.
National data from the Department of Education Office of Civil Rights suggest the rise in
exclusionary discipline is disproportionately affecting children of certain demographic groups.
Figure 1 presents suspension rates by race since the mid-1970s. These represent the proportion of
elementary and secondary (i.e., middle and high school) students without disabilities who
received at least one out-of-school suspension in the previous year. The solid line shows that
from the mid-1970s up through the mid-1990s, the total suspension rate increased by more than
three quarters. Since then, it has hovered around 6% of students with rates for males on average
5
more than 120% greater than females and rates for blacks and Hispanics continually increasing
relative to whites. Disproportionality among blacks appears most dramatic; nearly 40% of all
students who are suspended are black, even though they make up only 17% of the student
population. Though much less frequent, similar disparities exist for expulsions. Whereas 0.2% of
students were expelled in the 2009 to 2010 school year, among blacks and Hispanics the figures
were 0.28% and 0.38% respectively.
Paternal Incarceration and Childhood Behavior Problems
As exclusion from school has become an increasingly common experience for
disadvantaged children, exclusion from broader society has become increasingly common for
their parents. The US incarceration rate has increased by more than 4 times what it was in 1972
(Travis, Western, and Redburn 2014). There are now nearly 2.3 million people, overwhelmingly
men, in jail or prison (Glaze and Herberman 2013), and many are parents who lived with their
children prior to incarceration (Mumola 2000). A disproportionate number of incarcerated men
are black or Hispanic (Mauer and King 2007). Therefore, mass incarceration like the overuse of
school discipline disproportionately affects minority children, especially blacks. Indeed, in a
classroom of 25 white students, one will have a parent incarcerated by age 14, but in an equalsize classroom of black students, the number jumps to six (Wildeman 2009).
Several processes might account for a relationship between paternal incarceration and
risk of exclusionary discipline, the most obvious of which is differences in student behavior
problems. Simply put, children of incarcerated fathers may be at greater risk of suspension or
expulsion because they misbehave more in class. A well-established literature finds evidence that
paternal incarceration, especially recent paternal incarceration, is associated with child
aggression and adolescent delinquency (Murray, Farrington, and Sekol 2012; Geller et al. 2012;
6
Roettger and Swisher 2011; Roettger et al. 2011; Swisher and Roettger 2012; Wakefield and
Wildeman 2011; Wildeman 2010). Behavioral problems may be responses to weakened family
bonds and intensified economic strain following the incarceration of a father. Prior studies find
that when violence or severe addiction does not prevent fathers from already having strong bonds
with their children, incarceration breaks up families and reduces father involvement (Edin,
Nelson, and Paranal 2004; Geller 2013; Turney and Wildeman 2013). Family instability may
increase children’s behavior problems (Ackerman et al. 1999) by reducing the quality of
mothering and level of supervision (Astone and McLanahan 1991; Osborne and McLanahan
2007). Moreover, more than half of fathers in state prisons are the primary breadwinners in their
families (Glaze and Maruschak 2008), putting those they leave behind at greater risk of
economic and material hardship (Schwartz-Soicher, Geller, and Garfinkel 2011; Sugie 2012;
Wildeman 2014). Children often express economic strain emotionally through aggression or
hyperactivity (Brooks-Gunn and Duncan 1997), increasing their risk of being removed from the
classroom or school.
To date, research on the effects of paternal incarceration on child behavior problems
generally find little or no heterogeneity by race and considerable variation by gender (for review
see Travis et al. 2014). Although paternal incarceration is associated with behavior problems for
both boys and girls (Geller et al. 2012), it has a stronger effect for boys, who tend to act out more
in response to father absence (Malone et al. 2004; Wildeman 2010). Thus, paternal incarceration
may place boys at a disproportionately higher risk of being excluded from school.
The Impact of Incarceration beyond Behavior
Ideally, students are disciplined for misbehavior, not background characteristics. Thus,
after accounting for student behavior problems, paternal incarceration should have no influence
7
on the decision to discipline. Nevertheless, prior literature suggests two reasons why there might
be an effect: intergenerational stigmatization and lower parental involvement. Consistent with
Braithwaite’s (1989:55) definition of stigmatization as shaming that produces a “class of
outcasts,” Uggen, Manza, and Thompson (2006) find evidence of the emergence of a “criminal
class” of previously incarcerated individuals who face legal and informal barriers to their rights
and responsibilities as citizens (e.g., Pager 2003). Some studies contend that children who are
affiliated with this class are also stigmatized (Murray 2007; Phillips and Gates 2011).
Although virtually no research has examined such stigmatization in school, some studies
offer important insights. Ferguson (2001:90-5) reports that the decisions educators make about
individual students are influenced by the often distorted perceptions they have of students’
families. She finds that once students are considered “at-risk,” their classroom behavior becomes
more visible, increasing their risk of punishment. This may be due to an increase in supervision
over the student or a change in expectations about their behavior. For example, other research
finds that when teachers know a parent has been incarcerated, they have lower expectations for
the student (Dallaire, Ciccone, and Wilson 2010), and lower expectations lead to poorer
performance, especially among younger students (Rosenthal and Jacobson 1968). Labeling
theories emphasize the harmful effects of anticipated stigmatization as well (Link and Phelan
2001). Out of fear of rejection from peers or teachers, students may choose not to talk about their
family circumstances at school (Nesmith and Ruhland 2008), leaving educators to make
decisions based on even more limited information.
Intergenerational stigmatization may not be the same for all demographic groups. Pager
(2003) finds that for job seekers racial minority status intensifies the stigma of a criminal history.
Other studies find that whereas white students are more likely to receive an attention or
8
hyperactivity disorder diagnosis for behavior problems (Morgan et al. 2013), racial minorities are
at greater risk of being punished (Skiba et al. 2012). Thus, the effects of paternal incarceration on
exclusionary discipline may be greater for blacks and Hispanics.
Lower Parental Involvement as an Alternative Explanation
Incarceration stigma is not frequently measured in survey research. Some studies measure
community attitudes toward ex-offenders (Hirschfield and Piquero 2010; Steffensmeier and
Kramer 1980), but measures of children’s stigmatization are scarce. Because rejection at school
could lead children to act out in defiance (Sherman 1993), some of the effect would be captured
by controlling for behavior problems. But to examine the impact of paternal incarceration stigma
above and beyond its impact on behavior, an alternative to attitudinal measures is to rule out all
other possible explanations and attribute any residual effect to stigmatization. For example,
Foster and Hagan (2009:187) interpret a negative effect of paternal incarceration on children’s
years of schooling, net of potential confounders including the propensity for incarceration, as a
“cautious and conservative confirmation of the harmful effects of stigma.”
One potential alternative to stigmatization is lower school involvement among parents
caught up in the criminal justice system. Prior studies suggest several reasons why parents would
be less involved in their children’s schooling following an incarceration. One reason is that the
incapacitation a father places more demands on the mother’s time and emotional capacity that
limit her ability to engage in effective parenting. One recent study finds paternal incarceration
associated with maternal neglect (Turney 2014). Similarly, added stressors following the
incarceration of a father may limit the mother’s ability to intervene when a child is faced with the
threat of suspension or expulsion. Additionally, mothers may be reluctant to seek help through
school resources for fear of stigmatizing their children. Henriques (1982)2 reports:
9
The school authorities had to be informed regarding children’s absence due to [the
parents] having to appear in court. Failure to inform school authorities could have
resulted in children’s being suspended or being labeled truants. Yet, some guardians
feared that once the school was informed, teachers and others would come to view
children differently.
“System avoidance,” defined as the tendency to evade surveilling—or formal recordkeeping—institutions out of fear of being tracked and apprehended, may be another reason for
lower parental involvement. Brayne (2014) finds previously incarcerated individuals less
involved in surveilling institutions, including schools (also see Goffman 2009). Given the
influence a romantic partner’s behavior has on an individual’s own behavior and criminal justice
involvement (Capaldi, Kim, and Owen 2008; Haynie et al. 2005), I extend Brayne’s (2014)
conceptualization by suggesting that previously incarcerated parents might avoid their children’s
schools and that mothers of children with previously incarcerated fathers may also be at risk of
school avoidance as a means of protecting the father or themselves. Specifically, recently
incarcerated fathers and their partners may be less likely to become involved in their children’s
schooling or even to respond to teachers’ phone calls or emails regarding their child’s behavior
problems.
Whatever the reasons for lower parental involvement, it may have either negative or
positive effects on discipline. The effect of lower school involvement would be negative (lower
risk of exclusionary discipline) if school administrators hesitate to remove a child from school
for minor disruptions because they are unable to contact the parents. For example, New York law
requires schools to notify a child’s parents before a suspension for minor disruptions takes place
(New York State Education Department 2010). It would be positive (greater risk of discipline) if
a lack of parent intervention gives students less protection from educator decision making.
Minimizing Bias in the Study of Paternal Incarceration
10
Selection bias often interferes with incarceration research due to nonrandom differences
between formerly incarcerated and other individuals (Travis et al. 2014). These may be
differences in individual demographic characteristics (Steffensmeier, Ulmer, and Kramer 1998),
family or neighborhood dynamics (Kubrin and Stewart 2006; Sampson, Laub, and Wimer 2006),
self-control (Gottfredson and Hirschi 1990), genetic traits (Wright and Beaver 2005), or
something else. Although these differences cannot be completely accounted for in observational
studies, their effects can be reduced by controlling for observed variables that could potentially
confound results, such as early developmental processes (Moffitt 1993), hyperactivity disorders
(Hutchison 2013; Morgan et al. 2013), and early exposure to violence or substance abuse
(Giordano 2010). Past research has consistently stressed that such “predetermining” factors be
accounted for when examining the intergenerational effects of incarceration (Hagan and
Dinovitzer 1999; Murray, Loeber, and Pardini 2012). For example, Johnson (2009) controls for
parent’s criminality, and although not the focus of his paper, finds paternal (but not maternal)
incarceration positively associated with discipline. Where criminality is not observed, an
alternative approach to reducing bias would be to limit the sample to cases with similar risk of
experiencing recent paternal incarceration, such as fathers with any incarceration history (e.g.,
Wildeman 2014).
Even when controlling for these other variables, standard regression techniques alone
may be insufficient for causal inference (Freedman 1991). An alternative is propensity score
matching which approaches an experimental design by matching a “treatment” group of recently
incarcerated fathers to a control group with a similar probability of recent incarceration based on
observed characteristics (Rosenbaum and Rubin 1983). An advantage over standard regression is
that it makes no assumptions about the functional form of the relationship between the treatment
11
and the outcome (Harding 2003). A limitation is that like regression, it assumes all selection is
on observed characteristics (Winship and Morgan 1999).
STUDY CONTRIBUTIONS
In examining the intergenerational relationship between two systems of punishment, the
current study makes several important contributions. First, it is among the first to test the effects
of a father’s incarceration on his children’s risk of being suspended or expelled from school.
Second, it provides a systematic investigation of the causal pathways of this relationship. In
doing so, it extends prior research on the effects of paternal incarceration on child behavior by
considering an important consequence of behavioral problems. If children of incarcerated fathers
are at greater risk of suspension or expulsion because they act out more, accounting for student
behavior problems will render the effect of paternal incarceration null. However, a remaining
positive effect could be the result of lower parental involvement or selection effects. If there
remains an effect of paternal incarceration beyond student behavior and parental involvement
after adjusting for selection effects, intergenerational stigma may be at play outside these other
processes.
Third, the study advances our knowledge of the prevalence and causes of school
discipline by focusing on younger children. It does this for two reasons: causal sequences of
behavior problems begin early (Moffitt 1993) and discipline among younger students has
received little attention, even though the most disadvantaged students are already at risk. Fourth,
the study offers an improvement over prior research on the causes of school discipline by
allowing for greater causal inference. Specifically, the data I use allow for the use of propensity
score matching and include a wider array of control variables than have been used in prior
studies. They also establish whether the father’s incarceration occurred during the child’s school
12
years, which is important because I would expect a true effect on school discipline if the father
was incarcerated while the child was attending school.
DATA AND METHODS
Sample
The Fragile Families and Child Wellbeing Study is a birth cohort study of about 5,000
children born in 20 of the largest (more than 200,000) cities in the US between 1998 and 2000
(Reichman et al. 2001). Unmarried parents were oversampled and represent about three-quarters
of the original sample, so the data are over-representative of socioeconomically disadvantaged
families. Mothers and fathers were interviewed either in person or by telephone shortly after the
birth of their child. Both parents were contacted again by telephone in follow-up waves around
the time of the child’s first, third, fifth, and ninth birthdays. By age nine, 76% of mothers and
59% of fathers had remained in the study. In addition to the biological mother and father surveys,
the primary caregiver (92% biological mother at age nine) was interviewed at home at the agethree (79% response rate) and age-five waves (81% response rate) and by telephone at the agenine wave (77% response rate). Children whose primary caregivers participated at age nine also
took part in a short in-home interview, and the teachers of these children were invited to
participate in a mail-in survey (62% of cases in which the primary caregiver participated also
include data from teachers).3 Neighborhood characteristics are based on census 2000 data from
the census tract of the mother’s residential address at each wave. School characteristics that are
not based on teacher responses are taken from school-level public data of the National Center for
Education Statistics.
My analyses rely on data from both the primary caregiver and teacher reports at the agenine wave (2,242 cases have both). In addition, my sample is limited to non-Hispanic black
13
(50%), non-Hispanic white (28%), and Hispanic children (23%) who meet the following three
criteria: (1) biological fathers were not deceased at any wave, (2) primary caregivers provided
valid data on whether the child had been absent from school for a suspension or expulsion in the
current or most recent school year, and (3) when reporting on the child’s behavior, teachers were
referring to the same or earlier academic year that caregivers were referring to when reporting on
child’s school discipline. This results in a sample size of 1,406 that is still representative of the
full sample on a wide range of variables (see Table A1). By the time they reached school-age
(about age five), half of the children have experienced at least one episode of paternal
incarceration. Twenty-three percent have had a father incarcerated while in school (referred to
here as a “recent” incarceration), between the age-five and age-nine waves. Most are in third
grade and already 6.4% have been suspended or expelled in that year. Because my focus is on
disadvantaged children, this suspension rate is higher than would be expected from a random
sample of the population; about 2.5% of elementary students were suspended in the 2009-2010
school year (Losen and Martinez 2013).
Variables
Dependent Variable. Exclusionary discipline is a binary measure taken from primary
caregiver questions about reasons for school absences in the current or most recent school year.
Cases in which respondents reported that the child had been absent due to a suspension or
expulsion are coded 1. By limiting the measure to discipline that results in a school absence, I do
not capture in-school suspensions, which are generally less serious. Although this underestimates
the extent of exclusionary discipline among these children, any statistical significance in results
is likely to be biased down.
14
Recent Paternal Incarceration. The primary variable of interest is recent paternal
incarceration, defined as an incarceration experienced during the child’s school-age years—
between the age-five and age-nine waves—but not at the time of the age-five interview. It is
based on information combined from three sources: father self-reports, mother reports, and
disposition data. The latter include information other than survey data gathered during data
collection, such as when interviewers searching for a father’s whereabouts learn he is in jail.
Some but not all fathers were interviewed in prison at the age-nine wave and the language in the
questions about incarceration varies slightly across waves, increasing the chances that
incarceration is underreported. Thus, drawing on multiple sources increases reliability. Another
limitation is that I cannot determine the length or timing of incarceration for all fathers or
whether it took place in a prison or jail. It is possible that for at least some cases, the
incarceration occurred recently enough that it took place after the child’s suspension or expulsion
in the current school year.
Student Behavior Problems. To minimize bias in reporting and to capture a wider array of
behavior problems than has been included in prior school discipline studies, I include three
measures of student behavior: (1) teacher-reported externalizing behavior, (2) parent-reported
externalizing behavior, and (3) self-reported delinquency. Teacher-reports are taken from a
modified version of the Social Skills Rating System (Gresham and Elliott 1990) in which
teachers were asked to rate the child’s behavior in the past month (0 = Never to 3 = Very often).
A sum composite is constructed from six items: “fights with others,” “threatens or bullies
others,” “argues with others,” “talks back to adults when corrected,” “gets angry easily,” “has
temper tantrums” (alpha = 0.92). Parent-reported externalizing behavior is based on a sum of 24
items from the Child Behavior Checklist, 6-18 (Achenbach and Rescorla 2001) coded on a scale
15
of 0 = not true to 2 = often or very true. Examples include “child physically attacks people” and
“disobedient at school” (alpha = 0.90). Delinquency is based on the Things You Have Done
Scale (Maumary-Gremaud 2000). Sixteen items asking “Have you ever . . .” are summed.
Examples include “cheated on a school test,” “had a fist fight with another person,” “skipped
school without an excuse,” “secretly taken a sip of alcohol,” and “smoked marijuana” (alpha =
0.70). Regression models use a natural log transformation of each of these measures (after
adding 1) to account for nonnormal distributions.
As has been the case in prior studies (Hinojosa 2008; Peguero and Shekarkhar 2011),
these measures are limited in that they do not permit me to establish whether the behavior
problems took place before the school discipline. However, with parent (but not teacher or
student) reports I can establish whether the behavior problems occur after the father’s
incarceration by controlling for the same measure (based on identical items) at the age-five wave
(alpha = 0.85). As an additional safeguard, I examine my results with and without each of these
measures separately before including all of them in a full regression model together.
Lower Parental Involvement. In line with Brayne’s (2014), conceptualization of system
avoidance as simply a lack of involvement in a given system, lower parental involvement is
based on five dichotomous items in the teacher questionnaire regarding the parents’ level of
involvement in the child’s schooling. Items ask whether parents “returned your phone calls,”
“attended parent/teacher informal meetings that you initiated,” “initiated contact with you,”
“attended regularly scheduled conferences,” “volunteered to help in your classroom or school.” I
sum these items and reverse code the resulting scale (alpha = 0.71) so that higher scores refer to
more less parental involvement or more avoidance.
16
Control Variables. Where possible, control variables are measured before the age-nine
wave to preserve the causal order. In addition to race and gender, I control for the father’s
incarceration history, one of the strongest predictors of recent incarceration. For current
purposes, this refers to any incarceration that took place prior to the child reaching school age
(age-five wave), and is taken from the same three sources of recent incarceration. I also control
for whether the mother was incarcerated by the same wave. Prior studies find null effects of
maternal incarceration on children’s externalizing and internalizing behaviors (Wildeman and
Turney 2014) and mixed effects on educational outcomes (Cho 2009, 2011). However, smallscale studies suggest that students with incarcerated mothers are stigmatized at school and at
greater risk of suspension (Dallaire et al. 2010; Trice and Brewster 2004).
To ensure that my results are not confounded by other types of father absence, I control
for whether the father was living with the child at the age-five wave. I also include 32 other
control variables that are described in Table A2. These include biological and early
developmental risk factors, family background and socioeconomic characteristics, student
disability and performance, teacher characteristics and experience, school security and racialethnic composition, and residential neighborhood disadvantage. No two variables have a
Pearson’s correlation at or above 0.7 (see Table A3), which minimizes the potential for
collinearity among such a large number of variables (Hoffmann 2010).
Analytic Strategy
Analyses are performed in four stages. First, I examine descriptive statistics of the
variables in my analysis for children with recently incarcerated (during school years), distally
incarcerated (before school years only), and never incarcerated fathers. Second, using logistic
regression, I examine the overall relationship between paternal incarceration and school
17
suspension. In doing so, I include interaction terms to test for variability in the relationship by
race and gender and control for a wide array of potential confounders. Then, to reduce bias due
to unobserved heterogeneity between incarcerated fathers and other fathers, I perform a
sensitivity check by limiting the sample to children whose fathers had ever experienced an
incarceration by the age-five wave. Third, I further adjust for selection bias by matching cases in
the full sample on the propensity to experience recent paternal incarceration, based on a long list
of observed covariates. As a robustness check I use two matching techniques, specifically nearest
neighbor and kernel matching (Leuven and Sianesi 2003). Fourth, I examine the effects of my
hypothesized mechanisms, student behavior and lower parental involvement, again using both
logistic regression models and propensity score matching as described above. While I have
eliminated missing cases from my primary variables of interest, there are a few missing cases
related to student behavior and control variables.4 To account for these, I use multiple imputation
with chained equations and perform my multivariate analyses using 20 multiply imputed
datasets. Descriptive statistics are presented with non-imputed data.
RESULTS
Descriptive Statistics
Descriptive statistics for the full analytic sample as well as for children with never
incarcerated (N = 650), distally incarcerated (N = 426), and recently incarcerated fathers (N =
320) are shown in Tables 1 and A4.5 “Recently” includes children whose fathers were
incarcerated during their school-age years, whether or not they were incarcerated before age five
as well. “Distally” includes children whose fathers were only incarcerated before the school-age
years. Shown in this way, one might expect increased disadvantage from “never” on the left of
the table toward “recently” on the right. Indeed, whereas only 3% of children who never
18
experienced paternal incarceration were suspended or expelled from school at age nine, 14% of
those with a recently incarcerated father were suspended or expelled.6 Children in the latter
category are disproportionately black, but unexpectedly not Hispanic. Only 4 in 10 lived with
their father at age five. Compared to children in the other categories, their parents have lower
levels of education and are much less likely to be married. On some characteristics such as
income, achievement, and hyperactivity disorder diagnosis they appear to be quite similar to the
distally incarcerated group. Consistent with the literature on mothers’ parenting (Turney 2014),
lower parental involvement is more severe with a distal incarceration and is only slightly worse
for those with a recent incarceration. However, children recently exposed to paternal
incarceration have somewhat higher levels of behavior problems than either of the other groups.
Overall Effect of Recent Paternal Incarceration
Bivariate results in Model 1 of Table 2 indicate the odds of being suspended or expelled
from school are 279% (e1.331)7 greater for children with a recently incarcerated father. The odds
of exclusionary discipline are 170% (e0.993) greater for males than for females and 171% (e0.995)
greater than for blacks than for whites, controlling for recent incarceration in Model 2. However,
Hispanic students in my sample are at no greater risk than whites (with or without controls).
Non-significant interaction terms in Model 3 suggest the effects of recent incarceration do not
vary by race or gender. I also checked for a three-way interaction with race, gender, and recent
incarceration, but results (not shown) were similar. In Model 4 I find that even when controlling
for early environmental and developmental risk factors as well as school and neighborhood
characteristics, having a recently incarcerated father is associated with a nearly three-fold
increase (e0.985) in the odds of being suspended or expelled from school. When these controls are
added the effect of race is no longer significant, but males remain at greater risk. Whether the
19
father or mother was incarcerated before the child was old enough to attend school does not
appear to influence risk of school discipline net of controls.
Because results may in part be driven by selection bias or unobserved heterogeneity, I
next perform a set of robustness checks that attempt to compare cases with similar risk of
experiencing a recent incarceration. First, in Model 5 I limit the sample to children whose fathers
had ever been incarcerated by the time the child was old enough to begin school, thus reducing
the chance that results are biased due to differences between previously incarcerated fathers and
other fathers. Log-odds and standard errors are similar to those of the previous model, suggesting
that even among children whose fathers have been to prison or jail, an incarceration that occurs
since the beginning of school is associated with increased risk of being suspended or expelled.
Next, I use propensity score matching techniques with the full sample to further minimize
bias. Because fathers in the Fragile Families Study were interviewed at each wave and recent
paternal incarceration is measured at the last wave, I am able to match cases on a set of fatherand mother-reported covariates of incarceration. Using logistic regression in each of the 20
imputed datasets, I generate a propensity score, or predicted probability of being in the treatment
group, with the list of covariates described in Table A5. I match cases with similar propensity
scores using two types of matching: nearest neighbor with replacement (five control cases
matched to each treatment case) and kernel (bandwidth = 0.06; kernel type = Epanechnikov). I
then check for balance in each dataset by (1) confirming that for each covariate, the mean of the
treatment group does not differ significantly from that of the control group after matching and
(2) examining the magnitude of the reduction in bias due to matching (average of 96% for kernel
matching, 94% for nearest neighbor) (see Table A6). I restrict my analyses to regions of common
20
support, meaning treatment cases with a propensity score higher than the maximum or less than
the minimum sore of the control cases are dropped from analyses in each dataset.
Results across the 20 datasets are combined using Rubin’s (1987) rules and presented in
Table 3. The average treatment effect on the treated (ATT) represents the increase in risk of
suspension or expulsion associated with having a recently incarcerated father. The effect is
moderate and statistically significant. Among children whose fathers are equally likely to have
been incarcerated since the child was old enough to begin school, 14% of those who actually
experienced an incarceration are expected to be suspended or expelled at age nine compared to
6% of the control group. Consistent with results of the logistic regression models, children with a
recently incarcerated father are more likely to be removed from school.
Accounting for Student Behavior and Lower Parental Involvement
With strong evidence of an effect of recent paternal incarceration on risk of exclusionary
discipline, I now test the hypothesized mechanisms of the relationship. Using Model 4 of Table 2
as a starting point, Table 4 adds student behavior problems and lower parental involvement as
mediating variables. Models 1, 2, and 3 add teacher-reported behavior problems, parent-reported
behavior problems, and self-reported delinquency separately. As expected, each is individually a
strong and significant predictor of school discipline. However, logistic regression coefficients
“rescale” when variables are added or removed from a model (Karlson, Holm, and Breen 2012)
because the residual variance is fixed; so, small changes in the coefficients do not necessarily
represent mediating effects of behavior problems. Therefore, I use the “binary mediation” routine
in Stata to standardize the models, and results indicate that about 10% of the effect of
incarceration net of controls is explained by teacher-reported behavior problems alone. Figures
for parent reports and self-reported delinquency are 18% and 2%, respectively. All together they
21
explain about 17% of the effect on school discipline, but only teacher reports are statistically
significant. Lower parental involvement is added in Model 5 revealing a negative but not
significant relationship.
With behavior accounting for less than a fifth of the relationship between recent
incarceration and exclusionary discipline, much remains to be explained. Before speculating that
the remaining effect is due to intergenerational stigmatization, it is again necessary to address
selection bias. While the results in Table 3 adjust for bias in the overall effect of paternal
incarceration on school discipline, they do not address bias that may be present in the direct
effect after accounting for student behavior. Thus, to test the robustness of this direct effect, I use
the same propensity scores and matching techniques employed for the results in Table 3, but I
compare the treatment and control groups on the predicted probability of school discipline that is
not due to student behavior. This predicted probability is estimated from a logistic regression
model in which suspension or expulsion is the outcome the three behavioral problem measures
are explanatory variables. An effect of incarceration beyond student behavior that is robust to the
minimization of selection bias might be attributed to intergenerational stigmatization.
Results based on both types of matching are presented in Table 5 and suggest only weak
evidence of a remaining effect. The average predicted probability of being removed from school
is about 0.08 for children in the control group and only 0.02 higher for children experiencing a
recent paternal incarceration. Results from kernel matching are more conservative than those of
nearest neighbor matching, so only the latter are statistically significant. In results based on both
matching types, the difference in the probability of exclusionary discipline after accounting for
student behavior problems is about 77% smaller than the difference indicated in Table 3 (0.08),
suggesting that student behavior accounts for a substantial portion of the effect of incarceration.
22
DISCUSSION AND CONCLUSION
Three major findings emerge from these analyses. First, results provide strong evidence
that children with a recently incarcerated father are at greater risk of being removed from school.
This finding extends previous work in sociology and demography by highlighting an additional
collateral consequence of mass incarceration (Travis et al. 2014) and establishing a link at the
family level between two major systems of punishment in the US. This finding also contributes
to education policy research by introducing a predictor of exclusionary discipline that has
become increasingly relevant in the lives of disadvantaged students over the past several decades
and may be even more salient than race to students in highly segregated urban areas (Eitle and
Eitle 2004; Skiba et al. 2012). While prior research focuses on the association between school
discipline and later criminal justice involvement (Fabelo et al. 2011; Shollenberger 2013), my
findings suggest that the reverse may also occur, intergenerationally. Specifically, a father’s
criminal justice involvement may have consequences for his children’s school discipline, thus
continuing a cycle of punishment among disadvantaged families.
Second, after adjusting for selection bias, I find that most of this relationship is due to
variation in student behavior problems as reported by teachers, and that none of the effects are
due to lower parental involvement as conceptualized here. This finding is consistent with a
growing number of studies documenting strong evidence of an effect of recent paternal
incarceration on child behavior problems (Geller et al. 2012; Wakefield and Wildeman 2011).
While I find weak evidence of an effect of intergenerational stigmatization beyond behavior,
there may still be an effect that operates through behavioral problems by causing children to act
out in defiance (Sherman 1993). This would be consistent with my finding that teacher- and
parent-reported externalizing behavior measures, which include more defiance-related items, are
23
more predictive of exclusionary discipline than self-reported delinquency. Relatedly, state-level
data suggest that the majority of school suspensions and expulsions are for non-violent offenses
and that the vast majority of these are acts of “insubordination” or “disrespect” (Connecticut
Department of Education 2010; Maryland State Board of Education 2012). Future research
should examine the effects of being removed from school for non-violent offenses on academic
and behavioral outcomes and whether alternative disciplinary tactics would be more appropriate.
Third, I find no evidence in my analyses that recent paternal incarceration has differential
effects on risk of school discipline for males and females or for blacks, whites, and Hispanics.
Contrary to prior studies (Skiba et al. 2012), I also find no evidence beyond bivariate analyses
that blacks are at greater risk of school discipline. However, much of the sample is from highly
segregated urban areas where race has less of an effect on school discipline that has been found
in prior studies (Eitle and Eitle 2004; Skiba et al. 2012). I also use a much younger sample and a
wider array of control variables than the majority of prior studies. It may be that recent paternal
incarceration has a stronger effect as children approach adolescence. Given that black children
are at greater risk of experiencing paternal incarceration (Wildeman 2009), future research
should employ survey data from children in less segregated communities and across older age
groups to investigate the extent to which paternal incarceration helps to explain racial-ethnic
discipline gaps.
Several cautions regarding interpretation should be reiterated. First, although use of
propensity score matching techniques substantially improves the strength of my findings, they
cannot completely rule out the possibility that results are confounded by omitted variables. In
other words, unique characteristics of recently incarcerated fathers in my sample may be
preventing me from comparing “like with like” (Firebaugh 2008). Next, although I can establish
24
that the father’s incarceration took place at some point between the age-five and age-nine waves
and that school discipline took place in the most recent school year at the age-nine wave, a more
precise causal order cannot be determined without information on the specific timing or length of
these punishments. Future research should collect data that allows for the examination of the
relationship between paternal incarceration (including distinctions between jail and prison
incarceration) and school discipline throughout childhood and adolescence. Finally, because my
focus here has been on disadvantaged urban families, readers should keep in mind that results
may not generalize beyond this population.
My findings are consistent with previous studies suggesting that mass incarceration has
had serious educational consequences for already disadvantaged children (Foster and Hagan
2007, 2009; Turney and Haskins 2014). Future research should continue to examine the
relationship between the rise of incarceration and the overuse of exclusionary discipline at
various levels of analysis. For example, more research is needed to understand the relationship
between incarceration and school suspension rates at neighborhood or community levels. Given
that much of the relationship appears to be due to behavior problems at the individual level,
research should investigate ways schools and communities can work to curb high rates of school
suspension, particularly as US incarceration rates begin to decline (Carson and Golineli 2013)
and many fathers return home to their families.
25
REFERENCES
Achenbach, Thomas. M. and Leslie A. Rescorla. 2001. Manual for the ASEBA School-Age
Forms & Profiles: An Integrated System of Multi-Informant Assessment. Burlington, VT:
University of Vermont Research Center for Children, Youth, & Families.
Ackerman, Brian P., Jen Kogos, Eric Youngstrom, Kristen Schoff, and Carroll Izard. 1999.
“Family Instability and the Problem Behaviors of Children from Economically
Disadvantaged Families.” Developmental Psychology 35(1):258–68.
Arcia, Emily. 2006. “Achievement and Enrollment Status of Suspended Students Outcomes in a
Large, Multicultural School District.” Education and Urban Society 38(3):359–69.
Arum, Richard and Irenee R. Beattie. 1999. “High School Experience and the Risk of Adult
Incarceration.” Criminology 37(3):515–40.
Astone, Nan Marie and Sara S. McLanahan. 1991. “Family Structure, Parental Practices and
High School Completion.” American Sociological Review 56(3):309–20.
Balfanz, Robert, Vaughan Byrnes, and Joanna Fox. 2013. “Sent Home and Put off-Track: The
Antecedents, Disproportionalities, and Consequences of Being Suspended in the Ninth
Grade.” Los Angeles, CA: The Civil Rights Project/Proyecto Derechos Civiles.
Braithwaite, John. 1989. Crime, Shame and Reintegration. Cambridge, UK: Cambridge
University Press.
Brayne, Sarah. 2014. “Surveillance and System Avoidance: Criminal Justice Contact and
Institutional Attachment.” American Sociological Review 79(3):367-91.
Brooks-Gunn, Jeanne and Greg J. Duncan. 1997. “The Effects of Poverty on Children.” The
Future of Children 7(2):55–71.
Browne, Angela, Kevin J. Strom, Kelle Barrick, Kirk R. Williams, and Robert Nash Parker.
2010. “Anticipating the Future Based on Analysis of the Past: Intercity Variation in
Youth Homicide, 1984-2006.” Washington, DC: National Institute of Justice, US
Department of Justice.
Capaldi, Deborah M., Hyoun K. Kim, and Lee D. Owen. 2008. “Romantic Partners’ Influence on
Men’s Likelihood of Arrest in Early Adulthood.” Criminology 46(2):267–99.
Carson, E. Ann and Daniela Golinelli. 2013. “Prisoners in 2012: Trends in Admissions and
Releases, 1991-2012.” Washington, DC: Bureau of Justice Statistics, US Department of
Justice.
26
Cho, Rosa M. 2009. “The Impact of Maternal Imprisonment on Children’s Educational
Achievement Results from Children in Chicago Public Schools.” Journal of Human
Resources 44(3):772–97.
Cho, Rosa M. 2011. “Understanding the Mechanism behind Maternal Imprisonment and
Adolescent School Dropout.” Family Relations 60(3):272–89.
Connecticut Department of Education. 2010. “Guidelines for In-School and Out-of-School
Suspensions.” Hartford, CT: Connecticut State Department of Education.
Dallaire, Danielle H., Anne Ciccone, and Laura C. Wilson. 2010. “Teachers’ Experiences with
and Expectations of Children with Incarcerated Parents.” Journal of Applied
Developmental Psychology 31(4):281–90.
Davis, James Earl and Will J. Jordan. 1994. “The Effects of School Context, Structure, and
Experiences on African American Males in Middle and High School.” Journal of Negro
Education 63(4):570–87.
Department of Education Office of Civil Rights. 2014. “Civil Rights Data Collection: State and
National Estimations.” Retrieved October 15, 2015 (http://ocrdata.ed.gov/
StateNationalEstimations).
Edin Kathryn, Timothy J. Nelson, Rechelle Paranal. 2004. “Fatherhood and Incarceration as
Potential Turning Points in the Criminal Careers of Unskilled Men.” Pp. 46–75 in
Imprisoning America: The Social Effects of Mass Incarceration, edited by M Patillo, D
Weiman, and B Western. New York, NY: Russell Sage Foundation.
Eitle, Tamela McNulty and David James Eitle. 2004. “Inequality, Segregation, and the
Overrepresentation of African Americans in School Suspensions.” Sociological
Perspectives 47(3):269–87.
Ender, Philip. 2011. “binary_mediation: Mediation with Binary Mediator and/or Response
Variables.” UCLA Statistical Consulting Group. Retrieved January 15, 2015
(http://www.ats.ucla.edu/stat/stata/ado/analysis/).
Fabelo, Antonio and Justice Center. 2011. Breaking Schools’ Rules: A Statewide Study of How
School Discipline Relates to Students’ Success and Juvenile Justice Involvement. New
York, NY: Justice Center, Council of State Governments.
Ferguson, Ann Arnett. 2001. Bad Boys: Public Schools in the Making of Black Masculinity. Ann
Arbor, MI: University of Michigan Press.
Firebaugh, Glenn. 2008. Seven Rules for Social Research. Princeton, NJ: Princeton University
Press.
27
Foster, Holly and John Hagan. 2007. “Incarceration and Intergenerational Social Exclusion.”
Social Problems 54(4):399-433.
Foster, Holly and John Hagan. 2009. “The Mass Incarceration of Parents in America: Issues of
Race/ethnicity, Collateral Damage to Children, and Prisoner Reentry.” The ANNALS of
the American Academy of Political and Social Science 623(1):179–94.
Freedman, David A. 1991. “Statistical Models and Shoe Leather.” Sociological Methodology
21(1):201–313.
Geller, Amanda. 2013. “Paternal Incarceration and Father–child Contact in Fragile Families.”
Journal of Marriage and Family 75(5):1288–1303.
Geller, Amanda, Carey E. Cooper, Irwin Garfinkel, Ofira Schwartz-Soicher, and Ronald B.
Mincy. 2012. “Beyond Absenteeism: Father Incarceration and Child Development.”
Demography 49(1):49–76.
Giordano, Peggy C. 2010. Legacies of Crime: A Follow-up of the Children of Highly Delinquent
Girls and Boys. New York, NY: Cambridge University Press.
Glaze, Lauren E. and Erin J. Herberman. 2013. “Correctional Populations in the United States,
2012.” Washington, DC: Bureau of Justice Statistics, US Department of Justice.
Glaze, Lauren E. and Laura M. Maruschak. 2008. “Parents in Prison and Their Minor Children.”
Washington, DC: Bureau of Justice Statistics, US Department of Justice.
Goffman, Alice. 2009. “On the Run: Wanted Men in a Philadelphia Ghetto.” American
Sociological Review 74(3):339–57.
Gottfredson, Gary D. and Denise C. Gottfredson. 2001. “What Schools Do to Prevent Problem
Behavior and Promote Safe Environments.” Journal of Educational and Psychological
Consultation 12(4):313–44.
Gottfredson, Michael R. and Travis Hirschi. 1990. A General Theory of Crime. Palo Alto, CA:
Stanford University Press.
Gresham, Frank M. and Stephen N. Elliott. 1990. Social Skills Rating System. Circle Pines, MN:
American Guidance Service.
Hagan, John and Ronit Dinovitzer. 1999. “Collateral Consequences of Imprisonment for
Children, Communities, and Prisoners.” Crime and Justice 26(1):121–62.
Harding, David J. 2003. “Counterfactual Models of Neighborhood Effects: The Effect of
Neighborhood Poverty on Dropping Out and Teenage Pregnancy.” American Journal of
Sociology 109(3):676–719.
28
Haynie, Dana L., Peggy C. Giordano, Wendy D. Manning, and Monica A. Longmore. 2005.
“Adolescent Romantic Relationships and Delinquency Involvement.” Criminology
43(1):177–210.
Henriques, Zelma Weston. 1982. Imprisoned Mothers and Their Children: A Descriptive and
Analytical Study. Washington, DC: University Press of America.
Hinojosa, Melanie Sberna. 2008. “Black-White Differences in School Suspension: Effect of
Student Beliefs about Teachers.” Sociological Spectrum 28(2):175–93.
Hirschfield, Paul J. and Alex R. Piquero. 2010. “Normalization and Legitimation: Modeling
Stigmatizing Attitudes Toward Ex-Offenders.” Criminology 48(1):27–55.
Hoffmann, John P. 2010. Linear Regression Analysis: Applications and Assumptions, Second
Edition. Provo, UT: Brigham Young University.
Hutchison, Robert. W. 2013. “Paying Attention to ADHD as a Predictor of Adolescent
Delinquency and Peer Friendships.” MA thesis, Department of Sociology and
Criminology, The Pennsylvania State University, State College, PA.
Johnson, Rucker. 2009. “Ever-Increasing Levels of Parental Incarceration and the Consequences
for Children.” Pp. 177–206 in Do Prisons Make Us Safer? The Benefits and Costs of the
Prison Boom, edited by S Raphael and M Stoll. New York, NY: Russell Sage
Foundation.
Karlson, Kristian Bernt, Anders Holm, and Richard Breen. 2012. “Comparing Regression
Coefficients Between Same-Sample Nested Models Using Logit and Probit: A New
Method.” Sociological Methodology 42(1):286–313.
Kubrin, Charis E. and Eric A. Stewart. 2006. “Predicting Who Reoffends: The Neglected Role of
Neighborhood Context in Recidivism Studies.” Criminology 44(1):165–97.
Lemert, Edwin M. 1951. Social Pathology: A Systematic Approach to the Theory of Sociopathic
Behavior. New York, NY: McGraw-Hill.
Link, Bruce G. and Jo C. Phelan. 2001. “Conceptualizing Stigma.” Annual Review of Sociology
27(1):363–85.
Losen, Daniel J. and Tia Elena Martinez. 2013. “Out of School and Off Track: The Overuse of
Suspensions in American Middle and High Schools.” Los Angeles, CA: The Civil Rights
Project/Proyecto Derechos Civiles.
Losen, Daniel J. and Russell J. Skiba. 2010. “Suspended Education: Urban Middle Schools in
Crisis.” Los Angeles, CA: The Civil Rights Project/Proyecto Derechos Civiles.
29
Maag, John W. 2012. “School-Wide Discipline and the Intransigency of Exclusion.” Children
and Youth Services Review 34(10):2094–2100.
Malone, Patrick S., Jennifer E. Lansford, Domini R. Castellino, Lisa J. Berlin, Kenneth A.
Dodge, John E. Bates, and Gregory S. Pettit. 2004. “Divorce and Child Behavior
Problems: Applying Latent Change Score Models to Life Event Data.” Structural
Equation Modeling 11(3):401–23.
Maryland State Board of Education. 2012. “School Discipline and Academic Success: Related
Parts of Maryland’s Education Reform.” Baltimore, MD: The Maryland State
Department of Education.
Mauer, Marc and Ryan S. King. 2007. “Uneven Justice: State Rates of Incarceration by Race and
Ethnicity.” Washington, DC: The Sentencing Project.
Maumary-Gremaud, Anne. 2000. “Things That You Have Done: Fast Track Project Technical
Report.” Durham, NC: Fast Track Data Center, Conduct Problems Preventions Research
Group.
Mendez, Linda M. Raffaele, Howard M. Knoff, and John M. Ferron. 2002. “School
Demographic Variables and Out-of-School Suspension Rates: A Quantitative and
Qualitative Analysis of a Large, Ethnically Diverse School District.” Psychology in the
Schools 39(3):259–77.
Moffitt, Terrie E. 1993. “Adolescence-Limited and Life-Course-Persistent Antisocial Behavior:
A Developmental Taxonomy.” Psychological Review 100(4):674.
Morgan, Paul L., Jeremy Staff, Marianne M. Hillemeier, George Farkas, and Steven Maczuga.
2013. “Racial and Ethnic Disparities in ADHD Diagnosis from Kindergarten to Eighth
Grade.” Pediatrics 132(1):85–93.
Mumola, Christopher J. 2000. “Incarcerated Parents and Their Children.” Washington, DC:
Bureau of Justice Statistics, US Department of Justice.
Murray, Joseph. 2007. “The Cycle of Punishment Social Exclusion of Prisoners and Their
Children.” Criminology and Criminal Justice 7(1):55–81.
Murray, Joseph, David P. Farrington, and Ivana Sekol. 2012. “Children’s Antisocial Behavior,
Mental Health, Drug Use, and Educational Performance after Parental Incarceration: A
Systematic Review and Meta-Analysis.” Psychological bulletin 138(2):175.
Murray, Joseph, Rolf Loeber, and Dustin Pardini. 2012. “Parental Involvement in the Criminal
Justice System and the Development of Youth Theft, Marijuana Use, Depression, and
Poor Academic Performance.” Criminology 50(1):255–302.
30
Nesmith, Ande and Ebony Ruhland. 2008. “Children of Incarcerated Parents: Challenges and
Resiliency, in Their Own Words.” Children and Youth Services Review 30(10):1119–30.
New York State Education Department. 2010. “Part 100 Regulations: 100.2 General School
Requirements: l. School Conduct and Discipline: 4. Parental Notice Concerning Student
Suspensions.” Retrieved January 15, 2015 (http://www.p12.nysed.gov/part100/pages/
1002.html#parentalstudentsuspension).
Osborne, Cynthia and Sara S. McLanahan. 2007. “Partnership Instability and Child Well-Being.”
Journal of Marriage and Family 69(4):1065–83.
Osgood, D. Wayne and Amy L. Anderson. 2004. “Unstructured Socializing and Rates of
Delinquency.” Criminology 42(3):519–50.
Pager, Devah. 2003. “The Mark of a Criminal Record.” American Journal of Sociology
108(5):937–75.
Peguero, Anthony A. and Zahra Shekarkhar. 2011. “Latino/a Student Misbehavior and School
Punishment.” Hispanic Journal of Behavioral Sciences 33(1):54–70.
Pettit, Becky and Bruce Western. 2004. “Mass Imprisonment and the Life Course: Race and
Class Inequality in US Incarceration.” American Sociological Review 69(2):151–69.
Phillips, Susan D. and Trevor Gates. 2011. “A Conceptual Framework for Understanding the
Stigmatization of Children of Incarcerated Parents.” Journal of Child and Family Studies
20(3):286–94.
Reichman, Nancy E., Julien O. Teitler, Irwin Garfinkel, and Sara S. McLanahan. 2001. “Fragile
Families: Sample and Design.” Children and Youth Services Review 23(4):303–26.
Roettger, Michael E. and Raymond R. Swisher. 2011. “Associations of Fathers’ History of
Incarceration with Sons’ Delinquency and Arrest Among Black, White, and Hispanic
Males in the United States.” Criminology 49(4):1109–47.
Roettger, Michael E., Raymond R. Swisher, Danielle C. Kuhl, and Jorge Chavez. 2011. “Paternal
Incarceration and Trajectories of Marijuana and Other Illegal Drug Use from
Adolescence into Young Adulthood: Evidence from Longitudinal Panels of Males and
Females in the United States.” Addiction 106(1):121–32.
Rosenbaum, Paul R. and Donald B. Rubin. 1983. “The Central Role of the Propensity Score in
Observational Studies for Causal Effects.” Biometrika 70(1):41–55.
Rosenthal, Robert and Lenore Jacobson. 1968. “Pygmalion in the Classroom.” The Urban
Review 3(1):16–20.
31
Rubin, Donald B. 1987. Multiple Imputation for Nonresponse in Surveys. Hoboken, NJ: John
Wiley & Sons, Inc.
Sampson, Robert J., John H. Laub, and Christopher Wimer. 2006. “Does Marriage Reduce
Crime? A Counterfactual Approach to Within-Individual Causal Effects.” Criminology
44(3):465–508.
Schwartz-Soicher, Ofira, Amanda Geller, and Irwin Garfinkel. 2011. “The Effect of Paternal
Incarceration on Material Hardship.” The Social Service Review 85(3):447.
Sherman, Lawrence W. 1993. “Defiance, Deterrence, and Irrelevance: A Theory of the Criminal
Sanction.” Journal of research in Crime and Delinquency 30(4):445–73.
Shollenberger, Tracey L. 2013. “Racial Disparities in School Suspension and Subsequent
Outcomes: Evidence from the National Longitudinal Survey of Youth 1997.” Los
Angeles, CA: The Civil Rights Project/Proyecto Derechos Civiles.
Simon, Jonathan. 2007. Governing through Crime: How the War on Crime Transformed
American Democracy and Created a Culture of Fear. New York, NY: Oxford University
Press.
Skiba, Russell J. 2000. “Zero Tolerance, Zero Evidence: An Analysis of School Disciplinary
Practice.” Bloomington, IN: Indiana University Center for Evaluation and Education
Policy.
Skiba, Russell. J., Shure, L., Williams, N. 2012. “Racial and Ethnic Disproportionality in
Suspension and Expulsion.” Pp. 89-118 in Disproportionality in Education and Special
Education, edited by AL Noltemeyer and CS Mcloughlin. Springfield, IL: Charles C.
Thomas Publisher, Ltd.
Steffensmeier, Darrell J. and John H. Kramer. 1980. “The Differential Impact of Criminal
Stigmatization on Male and Female Felons.” Sex Roles 6(1):1–8.
Steffensmeier, Darrell, Jeffery Ulmer, and John Kramer. 1998. “The Interaction of Race, Gender,
and Age in Criminal Sentencing: The Punishment Cost of Being Young, Black, and
Male.” Criminology 36(4):763–98.
Sugie, Naomi F. 2012. “Punishment and Welfare: Paternal Incarceration and Families’ Receipt
of Public Assistance.” Social Forces 90(4):1403–27.
Swisher, Raymond R. and Michael E. Roettger. 2012. “Father’s Incarceration and Youth
Delinquency and Depression: Examining Differences by Race and Ethnicity.” Journal of
Research on Adolescence 22(4):597–603.
32
Travis, Jeremy, Bruce Western, and Steve Redburn. 2014. The Growth of Incarceration in the
United States: Exploring Causes and Consequences. Washington, DC: National
Academy Press.
Trice, Ashton D. and JoAnne Brewster. 2004. “The Effects of Maternal Incarceration on
Adolescent Children.” Journal of Police and Criminal Psychology 19(1):27–35.
Turney, Kristin. 2014. “The Consequences of Paternal Incarceration for Maternal Neglect and
Harsh Parenting.” Social Forces 92(4):1607–36.
Turney, Kristin and Anna R. Haskins. 2014. “Falling Behind? Children’s Early Grade Retention
after Paternal Incarceration.” Sociology of Education 87(4):241–58.
Turney, Kristin and Christopher Wildeman. 2013. “Redefining Relationships Explaining the
Countervailing Consequences of Paternal Incarceration for Parenting.” American
Sociological Review 78(6):949–79.
Uggen, Christopher, Jeff Manza, and Melissa Thompson. 2006. “Citizenship, Democracy, and
the Civic Reintegration of Criminal Offenders.” The Annals of the American Academy of
Political and Social Science 605(1):281–310.
Wakefield, Sara and Christopher Wildeman. 2011. “Mass Imprisonment and Racial Disparities
in Childhood Behavioral Problems.” Criminology & Public Policy 10(3):793–817.
Wald, Johanna and Daniel J. Losen. 2003. “Defining and Redirecting a School-to-Prison
Pipeline.” New directions for youth development 2003(99):9–15.
Wildeman, Christopher. 2009. “Parental Imprisonment, the Prison Boom, and the Concentration
of Childhood Disadvantage.” Demography 46(2):265–80.
Wildeman, Christopher. 2010. “Paternal Incarceration and Children’s Physically Aggressive
Behaviors: Evidence from the Fragile Families and Child Wellbeing Study.” Social
Forces 89(1):285–309.
Wildeman, Christopher. 2014. “Parental Incarceration, Child Homelessness, and the Invisible
Consequences of Mass Imprisonment.” The ANNALS of the American Academy of
Political and Social Science 651(1):74–96.
Wildeman, Christopher and Kristin Turney. 2014. “Positive, Negative, or Null? The Effects of
Maternal Incarceration on Children’s Behavioral Problems.” Demography 51(3):1041–
68.
Winship, Christopher and Stephen L. Morgan. 1999. “The Estimation of Causal Effects from
Observational Data.” Annual Review of Sociology 25(1):659–706.
33
Wright, John Paul and Kevin M. Beaver. 2005. “Do Parents Matter In Creating Self-Control In
Their Children? A Genetically Informed Test of Gottfredson and Hirschi’s Theory Of
Low Self-Control.” Criminology 43(4):1169–1202.
34
ENDNOTES
1
Incarceration data are based on prison and jail population estimates for 2010. Suspension data
are based on the estimated number of children (excluding children with disabilities) who
received one or more out-of-school suspensions in the 2009-2010 school year.
2
Henriques (1982) focuses on children of incarcerated mothers. However, her findings should
also apply to children of incarcerated fathers, particularly residential fathers (see Dallaire et al.
2010).
3
See http://www.fragilefamilies.princeton.edu/study_design.asp for a helpful illustration of the
study design.
4
All but five variables are missing less than 10% of cases (none more than 24%). These five are
missing due to fathers’ attrition or because some mothers did not participate in the in-home visit.
5
These three categories do not sum to 1,406 because there are 10 children whose fathers were
not recently incarcerated but for whom incarceration status for earlier waves is unknown.
6
At age nine, 18% of participating children reported to have ever been suspended or expelled.
Unlike parent reports, these are not limited to disciplinary acts resulting in an absence from
school, so in-school suspensions are likely included. However, I use parent reports in my
analysis because they reduce the likelihood that the father’s incarceration occurred after the
suspension or expulsion. In a separate analysis, I examined the influence of an incarceration
occurring between ages three and five on child reports of suspension/expulsion by age nine but I
found no significant association net of a few basic demographic characteristics.
7
Percentage changes are calculated by exponentiating the log odds and then subtracting 1.00
from the resulting odds ratio and multiplying by 100.
35
0.16
Proportion of Enrolled Elem. And Sec. School Students
Black
Hispanic
0.14
White
Male
0.12
Female
Total
0.10
0.08
0.06
0.04
0.02
0.00
1976
1980
1984
1988
1992
1996
2000
2004
2008
Figure 1. Proportion of Elementary and Secondary School Students who Received an Out of School Suspension
Source: Author's estimates based on data from the US Department of Education, Civil Rights Data Collection
Note: Data were also available for the following years: 1974, 1978, 1986, 1990, 1994, 1997, 1998, 2002, 2006, and 20092010. These years were dropped and means imputed to obtain consistent intervals between years. Gender-specific data are
unavailable for 1976.
Table 1. Descirptive Statistics by Paternal Incarceration Status
No Recent Incarceration
Distal Incarceration
(At or before Y5 Only)
n = 426
Never Incarcerated
n = 650
Variable
Dependent Variable
Suspension or expulsion, Y9
Primary Explanatory Variable
Recent Paternal Incarceration, Y5-Y9
Mechanisms
TR Externalizing behavior, Y9
PR Externalizing behavior, Y9
SR Delinquency, Y9
TR Parental school avoidance, Y9
Selected Control Variables
Student Black NH
Student Hispanic
Student Male
Father incarcerated by Y5
Mother incarcerated by Y5
Residential father, Y5
PR Externalizing behavior problems, Y5
Valid N
Mean
Std Dev
Valid N
Mean
Std Dev
Recent Incarceration
(Since Y5 but not at Y5)
n = 320
Valid N
Mean
Std Dev
Total
N = 1,406
Valid N
Mean
Range
Std Dev
Min
Max
650
0.03
0.16
426
0.06
0.24
320
0.14
0.35
1406
0.06
0.24
0.00
1.00
650
0.00
0.00
426
0.00
0.00
320
1.00
0.00
1406
0.23
0.42
0.00
1.00
644
615
630
650
2.48
5.05
0.94
0.24
3.37
5.12
1.55
0.26
421
398
414
426
4.12
6.86
1.20
0.37
4.39
7.04
1.66
0.30
312
305
315
320
4.48
8.28
1.35
0.39
4.65
6.90
1.80
0.30
1387
1328
1368
1406
3.43
6.34
1.12
0.31
4.11
6.31
1.65
0.29
0.00
0.00
0.00
0.00
18.00
48.00
16.00
1.00
650
650
650
650
645
646
503
0.40
0.23
0.51
0.00
0.04
0.76
10.14
0.49
0.42
0.50
0.00
0.19
0.43
5.90
426
426
426
426
387
401
314
0.57
0.25
0.49
1.00
0.15
0.42
11.68
0.50
0.44
0.50
0.00
0.35
0.49
6.34
320
320
320
320
312
320
247
0.59
0.20
0.55
0.79
0.12
0.41
13.55
0.49
0.40
0.50
0.41
0.32
0.49
7.66
1406
1406
1406
1396
1350
1373
1068
0.50
0.23
0.51
0.49
0.09
0.58
11.37
0.50
0.42
0.50
0.50
0.28
0.49
6.61
0.00
0.00
0.00
0.00
0.00
0.00
0.00
1.00
1.00
1.00
1.00
1.00
1.00
39.00
Source : Fragile Families and Child Wellbeing Study, Birth to Year 9
Notes : NH = non-Hispanic; PR = parent-reported; TR = teacher-reported; SR = student-reported; Y0 to Y9 = birth to year 9
Table 2. Expected Change in Odds of Suspension or Expulsion Due to Recent Paternal Incarceration among Nine-Year Old Ubran Children
Model 1
Model 2
Model 3
Model 4
Recent Paternal
Add Race-Ethnicity and
Add Interactions
Add Controlsa
Incarceration
Gender
Model 5
Limit to EverIncarcerated by Year 5
Variable
Logit
Logit
Recent paternal incarceration
Student Black NH
1.331
SE
0.221 ***
b
b
Student Hispanic
Student Male
Recent paternal incarceration X Black NH
Recent paternal incarceration X Hispanic
Recent paternal incarceration X Male
Father incarcerated by Y5
Mother incarcerated by Y5
Residential father, Y5
PR Externalizing behavior problems, Y5
Constant
N
-3.141
0.152 ***
1,406
Logit
SE
Logit
SE
Logit
SE
SE
1.216
0.226 ***
1.630
0.687 *
0.985
0.275 ***
0.996
0.316 **
0.995
0.316 **
1.256
0.452 **
0.117
0.451
0.109
0.548
0.036
0.993
0.422
0.377
0.564
-0.033
0.562
0.134
0.689
0.336 **
0.636
0.868
0.500
1.014
---------0.543
-0.178
0.805
1.048
-8.157
0.280
---------0.320
0.436
0.285
0.324
1.339
0.876
------------0.065
0.950
1.155
-7.398
0.329
------------0.458
0.345
0.388
1.535
-4.331
0.249 ***
0.352 ***
1,406
0.929
-0.564
-0.787
0.128
-4.518
0.477 ***
1,406
1,406
***
**
**
***
**
**
**
***
678
Source : Fragile Families and Child Wellbeing Study, Birth to Year 9
Notes : Results are based on 20 imputed datasets. SE = logit standard error; NH = non-Hispanic
a
Other control variables include: mother/father impulsivity, mother/father substance abuse at year 3, child witnessed domestic violence by father at year 3, low birth weight, mother and
father depression, mother and father married at child's birth, mother and father living with both parents at age 15, either parent an immigrant, mother/father education level, mother
unemployed at year 3, mother household income between birth and year 5, child's teacher-reported academic performance, child grade level, child individualized education program (IEP),
child diagnosed with attention/hyperactivity disorder, teacher race-ethnicity, teacher education, teacher tenure, school racial-ethnic composition across two years, school security level,
residential neighborhood socioeconomic status between years 3 and 9.
b
Student white non-Hispanic is reference category.
*** p < .001; ** p < .01; * p < .05
Table 3. Estimated Effect of Recent Paternal Incarceration on Risk of School Discipline among Urban Children
Average Treatment Effect for the Treated
Propensity Score Matching Type
Nearest neighbor
Kernel
No Recent
Incarceration
0.056
0.058
Source : Fragile Families and Child Wellbeing Study, Birth to Year 9
*** p < .001; ** p < .01
Recent
Incarceration
0.140
0.140
Difference
0.084
0.082
SE
0.024 ***
0.031 **
Table 4. Expected Change in Odds of Suspension or Expulsion Due to Recent Paternal Incarceration among Nine-Year Old Ubran Children (N = 1,406)
Model 1
Model 2
Model 3
Model 4
Recent Paternal
Recent Paternal
Recent Paternal
Recent Paternal
Incarceration and TR
Incarceration and PR
Incarceration and SR
Incarceration and all
Behavior Problems
Behavior Problems
Delinquency
Behavior Problems,
Delinquency
Variable
Recent paternal incarceration
Logit
1.095
Student Black NHb
b
Student Hispanic
Student Male
Father incarcerated by Y5
Mother incarcerated by Y5
Residential father, Y5
PR Externalizing behavior problems, Y5 (log)
TR Externalizing behavior problems, Y9 (log)
PR Externalizing behavior problems, Y9 (log)
SR Delinquency, Y9 (log)
TR Parental school avoidance, Y9
Constant
SE
0.292 ***
Logit
0.914
SE
0.280 **
Logit
1.012
SE
0.278 ***
Logit
1.059
SE
0.296 ***
Model 5
Add TR Parental School
Avoidance
Logit
1.057
SE
0.296 ***
-0.304
0.491
0.193
0.458
0.021
0.453
-0.258
0.496
-0.241
0.499
-0.195
0.751
0.470
-0.239
0.793
0.822
0.610
0.092
1.043
0.384
-0.106
0.755
0.419
0.576
-0.116
0.566
-0.135
0.618
-0.131
0.619
0.287 ***
0.326
0.446
0.290 **
0.360
0.827
0.520
-0.194
0.776
0.949
0.287 **
0.323
0.438
0.290 **
0.331 **
0.680
0.377
-0.208
0.727
0.466
0.309 *
0.345
0.465
0.308 *
0.389
0.679
0.385
-0.207
0.723
0.466
0.309 *
0.347
0.466
0.308 *
0.389
0.893
---0.222 ***
------0.695
------0.203 **
1.257
0.432
0.395
0.236 ***
0.244
0.216
-8.303
1.314 ***
-8.188
1.352 ***
-8.810
1.408 ***
1.258
0.430
0.395
-0.164
-8.738
0.236 ***
0.244
0.216
0.502
1.428 ***
1.456
-8.987
0.302 *
0.340
0.463
0.303 **
0.338 *
0.226 ***
1.412 ***
----
Source : Fragile Families and Child Wellbeing Study, Birth to Year 9
Notes : Results based on 20 mulitply imputed datasets; SE = logit standard error; NH = non-Hispanic; PR = parent-reported; TR = teacher-reported; SR = self-reported
a
All models include the following control variables: mother/father impulsivity, mother/father substance abuse at year 3, child witnessed domestic violence by father at year 3, low
birth weight, mother and father depression, mother and father married at child's birth, mother and father living with both parents at age 15, either parent an immigrant, mother/father
education level, mother unemployed at year 3, mother household income between birth and year 5, child's teacher-reported academic performance, child grade level, child
individualized education program (IEP), child diagnosed with attention/hyperactivity disorder, teacher race-ethnicity, teacher education, teacher tenure, school racial-ethnic
composition across two years, school security level, residential neighborhood socioeconomic status across years 3 to 9.
b
Student white non-Hispanic is reference category.
*** p < .001; ** p < .01; * p < .05
Table 5. Estimated Effect of Recent Paternal Incarceration on Risk of School Discipline Net of Behavioral Problems
Average Treatment Effect for the Treated
Propensity Score Matching Type
Nearest neighbor
Kernel
No Recent
Incarceration
0.075
0.075
Source : Fragile Families and Child Wellbeing Study, Birth to Year 9
* p < .05
Recent
Incarceration
0.094
0.094
Difference
0.019
0.019
SE
0.010 *
0.013
Table A1. Comparing the Analytic Sample to the Full Sample
Analytic Sample (N = 1,406)
Variable
Suspension or expulsion, Y9
Recent Paternal Incarceration, Y5-Y9
TR Externalizing behavior, Y9
PR Externalizing behavior, Y9
SR Delinquency, Y9
TR Parental school avoidance, Y9
Student Black NH
Student Hispanic
Student Male
Father incarcerated by Y5
Mother incarcerated by Y5
Residential father, Y5
PR Externalizing behavior problems, Y5
Bio parent impulsivity (z-scores), Y1,Y3
Bio parent substance abuse, Y3
Child exposure to domestic violence, Y3
Low birth weight
Mother major depression, Y3
Father major depression, Y3
Mother and father married, Y0
Mother from two-parent family
Father from two-parent family
Either bio parent an immigrant
Mother and father education, Y0
Mother unemployed, Y3
Mother Hh income ($10,000), Y0-Y5
Student achievement (z-scores), Y9
Student grade 3, Y9
Student grade 4-5, Y9
Student IEP, Y9
Student diagnosed with ADD/ADHD by Y9
Teacher NH black
Teacher Hispanic
Teacher graduate degree
Teacher tenure (years)
School percent black
School percent Hispanic
School security level
Neigh. disadvantage (z-scores), Y3-Y9
Valid N
1406
1406
1387
1328
1368
1406
1406
1406
1406
1396
1350
1373
1068
1384
1132
1361
1372
1361
1145
1406
1406
1360
1406
1391
1231
1218
1402
1405
1392
1404
1386
1386
1394
1403
1388
1388
1342
1405
320
Mean
0.06
0.23
3.43
6.34
1.12
0.31
0.50
0.23
0.51
0.49
0.09
0.58
11.37
0.00
0.05
0.02
0.09
0.22
0.14
0.26
2.15
0.18
3.58
0.42
0.45
0.14
0.02
3.04
0.12
0.13
0.20
0.11
0.49
13.51
38.16
23.29
3.71
-0.04
0.18
Std Dev
0.24
0.42
4.11
6.31
1.65
0.29
0.50
0.42
0.50
0.50
0.28
0.49
6.61
0.60
0.22
0.14
0.29
0.41
0.34
0.44
0.88
0.39
3.36
0.49
0.50
0.35
0.90
0.57
0.33
0.34
0.40
0.31
0.50
9.80
37.17
30.21
1.38
0.91
0.81
Full Sample (N = 4,898)
Valid N
3585
3101
2218
3155
3283
4898
4892
4892
4897
4453
4028
4263
2742
4441
3163
4199
4759
4221
3291
4897
4898
4217
4897
4855
3937
4021
2247
3617
2231
3624
2222
2222
2234
2247
3502
3502
2142
4575
1405
Mean
0.06
0.22
3.35
6.14
1.06
0.70
0.48
0.27
0.52
0.46
0.10
0.51
11.15
0.01
0.05
0.03
0.10
0.21
0.14
0.24
2.09
0.20
3.38
0.43
0.47
0.26
0.00
3.14
0.13
0.12
0.20
0.11
0.50
13.04
38.70
24.17
3.69
-0.01
0.00
Mean
Difference
Std Dev
0.23
0.41
4.07
6.17
1.59
0.39
0.50
0.45
0.50
0.50
0.30
0.50
6.59
0.64
0.22
0.16
0.30
0.40
0.35
0.43
0.88
0.40
3.33
0.50
0.50
0.44
0.92
0.61
0.34
0.32
0.40
0.31
0.50
9.69
37.50
30.04
1.37
0.91
0.91
0.01
0.01
0.08
0.20
0.06
-0.38
0.02
-0.04
-0.01
0.03
-0.01
0.06
0.22
-0.01
0.00
0.00
-0.01
0.01
-0.01
0.02
0.06
-0.02
0.20
-0.01
-0.02
-0.11
0.03
-0.10
-0.01
0.01
-0.01
0.00
-0.01
0.47
-0.53
-0.88
0.02
-0.03
0.18
Source : Fragile Families and Child Wellbeing Study, Birth to Year 9
Notes : NH = non-Hispanic; Y0 to Y9 = birth to year 9; TR = Teacher-reported; PR = Parent-reported; SR = Student self-reported;
IEP = individualized education program; ADD/ADHD = Attention Deficit Disorder/Attention Deficit Hyperactivity Disorder
Table A2. Desciptions of Control Variables not Described in Text
Variable
Bio parent impulsivity (z-scores), Y1,Y3
Bio parent substance abuse, Y3
Child exposure to domestic violence, Y3
Low birth weight
Mother major depression, Y3
Father major depression, Y3
Description
Standardized mean composite measure of six self-report items from Dickman (1990) measured at one-year wave for fathers and three-year wave for
mothers. Higher scores signify more impulsive biological parents; alpha = 0.8.
Binary measure coded 1 if either parent meets the DSM-III-R criteria for drug or alcohol dependence as specified by the Composite International
Diagnostic Interview—Short Form; based on mother and father self-reports
Binary measure coded 1 if mother reported ever having been hit, slapped, or kicked by the child's father or another partner in front of the child or while the
child was in the house.
Binary measure coded 1 if child weighed less than 2500 lbs at birth. Multiple births (less than 2% of analytical sample) are coded as missing
Binary measure coded 1 if meets criteria for major depression based on Composite International Diagnostic Interview—Short Form (Kessler et al. 1998);
based on mother survey
Binary measure coded 1 if meets criteria for major depression based on Composite International Diagnostic Interview—Short Form (Kessler et al. 1998);
based on father survey
Mother and father married, Y0
Binary measure coded 1 if mother and father were reportedly married at the time the child was born
Mother from two-parent family
Binary meausre coded 1 if mother reports having lived with both biological parents at age 15
Father from two-parent family
Binary meausre coded 1 if father reports having lived with both biological parents at age 15
Either bio parent an immigrant
Binary measure coded 1 if either of the child’s biological parents was born outside the US
Mother and father education, Y0
Mean composite measure of mother and father self-reported education levels at time of child's birth. Responses range from 1 = less than high school to 4 =
bachelor's degree or higher
Mother unemployed, Y3
Binary measure coded 1 if mother reports looking for regular work and not currently working for regular pay
Mother Hh income ($10,000), Y0-Y5
Student achievement (z-scores), Y9
Mean of household income at birth, one-year, and three-year waves, coded in $10,000 units. Due to missing data, some cases were imputed by Fragile
Families Study staff. For more information see http://www.fragilefamilies.princeton.edu/documentation/core/4waves_ff_public.pdf
Mean composite of three teacher-rated items about the child's performance in language/literacy, science/social studies, and mathematics. Responses range
from 1 = far below average to 5 = far above average
Student grade, Y9
Set of dummy variables for student grade level; categories are second grade (reference), third grade, and fourth-fifth grade
Student IEP, Y9
Binary measure coded 1 if teacher reports that child is an IEP student
Student ADD/ADHD by Y9
Binary measure coded 1 if primary caregiver reports that child has ever been diagnosed with ADD or ADHD
Teacher race-ethnicity
Set of dummy variables including non-Hispanic white (reference), non-Hispanic black, and Hispanic
Teacher graduate degree
Binary measure coded 1 if teacher reports having a graduate degree
Teacher tenure (years)
Years of experience reported by teacher
School percent black
Percent black, averaged across most recent school year and one year prior; based on data from the National Center for Education Statistics
School percent Hispanic
Percent Hispanic, averaged across most recent school year and one year prior; based on data from the National Center for Education Statistics
School security level
Neigh. disadvantage (z-scores), Y3-Y9
Sum scale of seven binary items describing student school as reported by teacher: security guards, metal detectors, locked doors during day, visitor sign-in
requirement, limits on going to the restroom, teachers supervise hallways, hall pass requirement
Standardized mean composite of census 2000 tract characteristics (poverty rate, percent without a bachelor's degree, occupational status reversed, percent
on public assistaance, unemployment, household income reversed); based on mother's residence at each wave
Source : Fragile Families and Child Wellbeing Study
Notes : NH = non-Hispanic; PR = parent-reported; TR = teacher-reported; SR = student-reported; Y0 to Y9 = birth to year 9; IEP = individualized education program; ADD/ADHD = Attention Deficit
Disorder/Attention Deficit Hyperactivity Disorder
Table A3. Pearson Correlation Matrix of All Variables Used in Logistic Regression Analyses
Pearson's r Coefficient
(p value)
1 Suspension or expulsion, Y9
2 Recent Paternal Incarceration, Y5-Y9
3 TR Externalizing behavior problems, Y9
4 PR Externalizing behavior problems, Y9
5 SR Delinquency, Y9
6 TR Parental school avoidance, Y9
7 Student Black NH
8 Student Hispanic
9 Student Male
10 Father incarcerated by Y5
11 Mother incarcerated by Y5
12 Residential father, Y5
13 PR Externalizing behavior problems, Y5
14 Bio parent impulsivity (z-scores), Y1,Y3
15 Bio parent substance abuse, Y3
16 Child exposure to domestic violence, Y3
17 Low birth weight
18 Mother major depression, Y3
19 Father major depression, Y3
20 Mother and father married, Y0
21 Mother from two-parent family
22 Father from two-parent family
23 Either bio parent an immigrant
24 Mother and father education, Y0
25 Mother unemployed, Y3
26 Mother Hh income ($10,000), Y0-Y5
27 Student achievement (z-scores), Y9
28 Student grade 3, Y9
29 Student grade 4-5, Y9
30 Student IEP, Y9
31 Student diagnosed with ADD/ADHD by Y9
32 Teacher NH black
33 Teacher Hispanic
34 Teacher graduate degree
35 Teacher tenure (years)
36 School percent black
37 School percent Hispanic
38 School security level
39 Neigh. disadvantage (z-scores), Y3-Y9
1
1.000
0.170
(0.000)
0.349
(0.000)
0.281
(0.000)
0.216
(0.000)
0.055
(0.040)
0.125
(0.000)
-0.067
(0.012)
0.116
(0.000)
0.128
(0.000)
0.017
(0.534)
-0.026
(0.341)
0.215
(0.000)
0.054
(0.043)
-0.024
(0.416)
-0.016
(0.546)
-0.023
(0.397)
0.024
(0.374)
0.050
(0.091)
-0.094
(0.000)
-0.088
(0.001)
-0.080
(0.005)
-0.062
(0.031)
-0.130
(0.000)
0.090
(0.001)
-0.126
(0.000)
-0.075
(0.005)
-0.026
(0.337)
0.001
(0.966)
0.083
(0.002)
0.199
(0.000)
0.082
(0.002)
-0.042
(0.116)
0.027
(0.315)
-0.040
(0.131)
0.154
(0.000)
-0.063
(0.019)
0.155
(0.000)
0.149
(0.000)
2
3
4
5
6
7
8
9
10
11
12
13
14
15
16
17
18
19
20
21
22
23
24
25
26
27
28
29
30
31
32
33
34
35
36
37
38
39
1.000
0.138
(0.000)
0.168
(0.000)
0.077
(0.004)
0.140
(0.000)
0.104
(0.000)
-0.042
(0.112)
0.039
(0.149)
0.329
(0.000)
0.061
(0.026)
-0.184
(0.000)
0.181
(0.000)
0.077
(0.004)
0.105
(0.000)
0.120
(0.000)
0.028
(0.298)
-0.004
(0.877)
0.028
(0.338)
-0.234
(0.000)
-0.142
(0.000)
-0.098
(0.001)
-0.104
(0.000)
-0.234
(0.000)
0.084
(0.002)
-0.200
(0.000)
-0.095
(0.000)
-0.026
(0.331)
-0.003
(0.907)
0.094
(0.000)
0.060
(0.024)
0.030
(0.260)
-0.007
(0.805)
0.001
(0.960)
-0.028
(0.293)
0.103
(0.000)
0.008
(0.766)
0.062
(0.023)
0.105
(0.000)
1.000
0.396
(0.000)
0.288
(0.000)
0.142
(0.000)
0.251
(0.000)
-0.113
(0.000)
0.174
(0.000)
0.195
(0.000)
0.079
(0.004)
-0.152
(0.000)
0.245
(0.000)
0.121
(0.000)
0.043
(0.152)
0.010
(0.717)
0.000
(0.989)
0.045
(0.098)
0.069
(0.021)
-0.169
(0.000)
-0.152
(0.000)
-0.104
(0.000)
-0.104
(0.000)
-0.176
(0.000)
0.174
(0.000)
-0.208
(0.000)
-0.254
(0.000)
-0.089
(0.001)
0.024
(0.366)
0.136
(0.000)
0.253
(0.000)
0.079
(0.004)
-0.002
(0.935)
0.004
(0.884)
-0.050
(0.064)
0.178
(0.000)
-0.025
(0.364)
0.201
(0.000)
0.218
(0.000)
1.000
0.294
(0.000)
0.083
(0.003)
0.041
(0.140)
-0.060
(0.029)
0.108
(0.000)
0.169
(0.000)
0.014
(0.617)
-0.104
(0.000)
0.566
(0.000)
0.185
(0.000)
0.074
(0.016)
0.035
(0.212)
-0.010
(0.724)
0.114
(0.000)
0.041
(0.175)
-0.111
(0.000)
-0.090
(0.001)
-0.060
(0.041)
-0.024
(0.420)
-0.142
(0.000)
0.067
(0.016)
-0.179
(0.000)
-0.183
(0.000)
-0.108
(0.000)
-0.005
(0.858)
0.213
(0.000)
0.367
(0.000)
0.018
(0.527)
0.027
(0.338)
0.025
(0.362)
-0.013
(0.649)
0.048
(0.080)
-0.003
(0.906)
0.076
(0.007)
0.108
(0.000)
1.000
0.069
(0.011)
0.145
(0.000)
-0.113
(0.000)
0.201
(0.000)
0.088
(0.001)
0.078
(0.005)
-0.055
(0.043)
0.233
(0.000)
0.081
(0.003)
0.053
(0.076)
0.032
(0.245)
0.003
(0.922)
0.079
(0.004)
0.019
(0.536)
-0.045
(0.094)
-0.092
(0.001)
-0.048
(0.097)
-0.060
(0.041)
-0.094
(0.001)
0.067
(0.014)
-0.125
(0.000)
-0.112
(0.000)
-0.036
(0.185)
-0.023
(0.392)
0.098
(0.000)
0.217
(0.000)
0.072
(0.008)
-0.061
(0.025)
0.010
(0.704)
0.005
(0.842)
0.139
(0.000)
-0.084
(0.002)
0.099
(0.000)
0.088
(0.001)
1.000
0.164
(0.000)
0.005
(0.859)
0.045
(0.089)
0.199
(0.000)
0.064
(0.019)
-0.118
(0.000)
0.059
(0.053)
0.135
(0.000)
0.057
(0.056)
-0.012
(0.669)
0.001
(0.969)
0.033
(0.220)
0.055
(0.064)
-0.244
(0.000)
-0.107
(0.000)
-0.074
(0.009)
0.032
(0.272)
-0.342
(0.000)
0.110
(0.000)
-0.279
(0.000)
-0.249
(0.000)
-0.132
(0.000)
0.086
(0.001)
0.052
(0.051)
0.008
(0.778)
0.008
(0.781)
-0.038
(0.162)
0.024
(0.371)
0.009
(0.739)
0.115
(0.000)
0.034
(0.208)
0.047
(0.084)
0.219
(0.000)
1.000
-0.541
(0.000)
0.023
(0.389)
0.159
(0.000)
0.008
(0.782)
-0.219
(0.000)
0.050
(0.102)
0.022
(0.411)
0.040
(0.182)
-0.049
(0.070)
0.072
(0.008)
0.035
(0.202)
0.009
(0.754)
-0.277
(0.000)
-0.229
(0.000)
-0.229
(0.000)
-0.222
(0.000)
-0.146
(0.000)
0.120
(0.000)
-0.265
(0.000)
-0.157
(0.000)
0.026
(0.335)
-0.022
(0.405)
0.065
(0.016)
-0.007
(0.804)
0.303
(0.000)
-0.201
(0.000)
0.082
(0.002)
-0.063
(0.018)
0.675
(0.000)
-0.366
(0.000)
0.270
(0.000)
0.415
(0.000)
1.000
-0.031
(0.245)
0.002
(0.941)
0.003
(0.905)
0.064
(0.018)
-0.033
(0.281)
0.017
(0.518)
-0.055
(0.063)
0.007
(0.792)
-0.043
(0.115)
-0.025
(0.360)
-0.026
(0.377)
-0.070
(0.008)
0.101
(0.000)
0.095
(0.001)
0.431
(0.000)
-0.224
(0.000)
0.007
(0.793)
-0.106
(0.000)
-0.029
(0.286)
-0.025
(0.355)
0.072
(0.007)
-0.007
(0.803)
-0.042
(0.114)
-0.126
(0.000)
0.370
(0.000)
-0.091
(0.001)
-0.018
(0.504)
-0.359
(0.000)
0.627
(0.000)
-0.118
(0.000)
0.045
(0.096)
1.000
-0.004
(0.891)
0.040
(0.139)
-0.031
(0.254)
0.083
(0.007)
0.008
(0.770)
0.017
(0.578)
-0.024
(0.385)
-0.001
(0.966)
0.033
(0.223)
-0.006
(0.837)
-0.013
(0.616)
0.002
(0.947)
0.034
(0.236)
-0.025
(0.392)
-0.027
(0.318)
-0.017
(0.540)
-0.034
(0.207)
-0.096
(0.000)
-0.105
(0.000)
0.017
(0.530)
0.135
(0.000)
0.119
(0.000)
-0.038
(0.154)
-0.034
(0.200)
-0.008
(0.760)
0.036
(0.180)
-0.002
(0.930)
-0.007
(0.810)
0.001
(0.972)
0.009
(0.745)
1.000
0.168
(0.000)
-0.341
(0.000)
0.166
(0.000)
0.214
(0.000)
0.107
(0.000)
0.121
(0.000)
0.053
(0.052)
0.077
(0.005)
0.139
(0.000)
-0.415
(0.000)
-0.189
(0.000)
-0.200
(0.000)
-0.133
(0.000)
-0.397
(0.000)
0.162
(0.000)
-0.383
(0.000)
-0.158
(0.000)
-0.058
(0.031)
0.015
(0.571)
0.074
(0.006)
0.109
(0.000)
0.074
(0.006)
0.050
(0.066)
-0.005
(0.856)
-0.033
(0.218)
0.166
(0.000)
0.064
(0.017)
0.071
(0.010)
0.224
(0.000)
1.000
-0.070
(0.011)
0.012
(0.709)
0.083
(0.002)
0.057
(0.056)
0.049
(0.075)
0.018
(0.526)
0.052
(0.057)
0.108
(0.000)
-0.103
(0.000)
-0.079
(0.004)
-0.006
(0.835)
-0.043
(0.145)
-0.137
(0.000)
0.107
(0.000)
-0.136
(0.000)
-0.054
(0.047)
-0.069
(0.011)
0.041
(0.129)
-0.013
(0.629)
0.063
(0.022)
-0.007
(0.805)
0.007
(0.803)
-0.038
(0.163)
0.000
(0.987)
-0.024
(0.381)
0.033
(0.235)
-0.019
(0.502)
0.038
(0.165)
1.000
-0.157
(0.000)
-0.133
(0.000)
-0.114
(0.000)
-0.088
(0.001)
-0.043
(0.120)
-0.130
(0.000)
-0.169
(0.000)
0.343
(0.000)
0.157
(0.000)
0.144
(0.000)
0.111
(0.000)
0.190
(0.000)
-0.128
(0.000)
0.303
(0.000)
0.109
(0.000)
-0.006
(0.825)
0.009
(0.741)
-0.101
(0.000)
-0.076
(0.005)
-0.068
(0.013)
0.011
(0.685)
-0.041
(0.132)
-0.010
(0.718)
-0.176
(0.000)
0.041
(0.132)
-0.141
(0.000)
-0.219
(0.000)
1.000
0.2312
(0.000)
0.074
(0.028)
0.032
(0.307)
0.033
(0.281)
0.141
(0.000)
0.070
(0.036)
-0.124
(0.000)
-0.084
(0.006)
-0.065
(0.046)
-0.053
(0.105)
-0.176
(0.000)
0.069
(0.026)
-0.170
(0.000)
-0.126
(0.000)
-0.099
(0.001)
0.035
(0.260)
0.155
(0.000)
0.276
(0.000)
0.022
(0.487)
0.011
(0.712)
-0.002
(0.960)
-0.049
(0.107)
0.090
(0.003)
0.013
(0.677)
0.059
(0.062)
0.116
(0.000)
1.000
0.149
(0.000)
0.061
(0.025)
-0.016
(0.566)
0.168
(0.000)
0.064
(0.032)
-0.188
(0.000)
-0.064
(0.018)
-0.098
(0.001)
-0.006
(0.844)
-0.259
(0.000)
0.158
(0.000)
-0.221
(0.000)
-0.111
(0.000)
-0.019
(0.492)
-0.013
(0.624)
0.074
(0.006)
0.077
(0.004)
-0.036
(0.179)
0.052
(0.056)
-0.026
(0.340)
-0.018
(0.501)
0.031
(0.247)
0.055
(0.041)
0.077
(0.005)
0.154
(0.000)
1.000
-0.032
(0.282)
-0.033
(0.274)
0.138
(0.000)
0.176
(0.000)
-0.035
(0.238)
-0.039
(0.197)
-0.069
(0.028)
-0.074
(0.018)
-0.001
(0.965)
0.012
(0.701)
-0.043
(0.151)
0.025
(0.395)
0.018
(0.551)
0.015
(0.619)
-0.043
(0.148)
-0.002
(0.947)
-0.049
(0.102)
0.008
(0.801)
-0.013
(0.655)
-0.036
(0.231)
0.014
(0.647)
-0.044
(0.140)
0.037
(0.220)
0.035
(0.241)
Source : Fragile Families and Child Wellbeing Study
Notes: NH = non-Hispanic; PR = parent-reported; TR = teacher-reported; SR = student-reported; Y0 to Y9 = birth to year 9; IEP = individualized education program; ADD/ADHD = Attention Deficit Disorder/Attention Deficit Hyperactivity Disorder
1
-0.006
(0.817)
0.037
(0.175)
0.035
(0.241)
-0.028
(0.298)
-0.008
(0.767)
0.033
(0.261)
0.004
(0.896)
-0.040
(0.142)
0.026
(0.338)
-0.037
(0.178)
-0.038
(0.166)
0.002
(0.941)
-0.015
(0.572)
-0.021
(0.440)
0.021
(0.443)
-0.019
(0.492)
-0.017
(0.529)
0.021
(0.442)
0.052
(0.053)
-0.038
(0.169)
-0.001
(0.972)
-0.026
(0.344)
-0.002
(0.931)
1.000
-0.013
(0.631)
0.030
(0.308)
-0.090
(0.001)
-0.011
(0.684)
-0.062
(0.031)
-0.053
(0.069)
-0.054
(0.047)
0.043
(0.119)
-0.029
(0.290)
-0.067
(0.013)
-0.032
(0.236)
0.005
(0.864)
0.067
(0.014)
-0.001
(0.962)
0.045
(0.096)
-0.022
(0.413)
-0.004
(0.893)
0.012
(0.647)
0.085
(0.002)
-0.042
(0.121)
0.004
(0.892)
0.063
(0.021)
1.000
0.118
(0.000)
-0.070
(0.010)
-0.074
(0.007)
-0.065
(0.026)
0.010
(0.742)
-0.044
(0.106)
0.090
(0.001)
-0.090
(0.001)
-0.001
(0.966)
0.025
(0.361)
-0.029
(0.291)
0.051
(0.061)
0.055
(0.041)
0.004
(0.888)
-0.034
(0.213)
-0.006
(0.815)
0.012
(0.649)
0.031
(0.260)
-0.033
(0.228)
-0.011
(0.698)
0.017
(0.538)
1.000
-0.071
(0.016)
-0.077
(0.009)
-0.052
(0.096)
-0.085
(0.006)
-0.076
(0.010)
0.024
(0.427)
-0.062
(0.036)
-0.039
(0.185)
-0.007
(0.814)
0.029
(0.325)
0.023
(0.450)
0.050
(0.093)
-0.012
(0.696)
-0.013
(0.654)
-0.014
(0.636)
0.025
(0.395)
0.038
(0.201)
-0.051
(0.087)
0.061
(0.043)
0.030
(0.305)
1.000
0.217
(0.000)
0.231
(0.000)
0.053
(0.065)
0.501
(0.000)
-0.143
(0.000)
0.549
(0.000)
0.213
(0.000)
0.045
(0.091)
-0.045
(0.093)
-0.066
(0.015)
-0.061
(0.023)
-0.110
(0.000)
-0.047
(0.081)
-0.023
(0.386)
0.035
(0.196)
-0.229
(0.000)
-0.108
(0.000)
-0.177
(0.000)
-0.422
(0.000)
1.000
0.159
(0.000)
0.167
(0.000)
0.203
(0.000)
-0.092
(0.001)
0.261
(0.000)
0.137
(0.000)
0.013
(0.622)
0.001
(0.964)
-0.057
(0.034)
-0.061
(0.023)
-0.078
(0.004)
0.059
(0.029)
-0.006
(0.812)
0.023
(0.400)
-0.203
(0.000)
0.114
(0.000)
-0.080
(0.004)
-0.186
(0.000)
1.000
0.180
(0.000)
0.239
(0.000)
-0.101
(0.001)
0.235
(0.000)
0.058
(0.042)
-0.042
(0.141)
0.019
(0.515)
-0.049
(0.087)
-0.036
(0.206)
-0.080
(0.005)
-0.003
(0.905)
-0.021
(0.459)
0.010
(0.735)
-0.207
(0.000)
0.077
(0.008)
-0.135
(0.000)
-0.250
(0.000)
1.000
-0.119
(0.000)
-0.013
(0.663)
-0.024
(0.400)
-0.015
(0.606)
-0.050
(0.080)
0.141
(0.000)
0.007
(0.818)
-0.085
(0.003)
-0.081
(0.005)
0.146
(0.000)
-0.007
(0.810)
-0.058
(0.042)
-0.180
(0.000)
0.331
(0.000)
-0.067
(0.023)
-0.014
(0.622)
1.000
-0.258
(0.000)
0.643
(0.000)
0.291
(0.000)
0.105
(0.000)
-0.064
(0.017)
-0.072
(0.007)
-0.059
(0.026)
-0.090
(0.001)
-0.125
(0.000)
0.009
(0.733)
0.040
(0.136)
-0.201
(0.000)
-0.245
(0.000)
-0.172
(0.000)
-0.526
(0.000)
1.000
-0.225
(0.000)
-0.127
(0.000)
-0.071
(0.009)
-0.011
(0.682)
0.000
(0.999)
0.023
(0.394)
0.077
(0.005)
0.019
(0.485)
0.011
(0.699)
-0.049
(0.070)
0.118
(0.000)
0.018
(0.511)
0.063
(0.024)
0.200
(0.000)
1.000
0.284
(0.000)
0.082
(0.002)
-0.035
(0.190)
-0.080
(0.003)
-0.081
(0.002)
-0.089
(0.001)
-0.100
(0.000)
-0.040
(0.135)
0.067
(0.012)
-0.278
(0.000)
-0.172
(0.000)
-0.240
(0.000)
-0.567
(0.000)
1.000
0.134
(0.000)
-0.019
(0.475)
-0.344
(0.000)
-0.163
(0.000)
-0.010
(0.712)
-0.015
(0.573)
-0.036
(0.175)
0.022
(0.421)
-0.082
(0.002)
-0.042
(0.122)
-0.047
(0.084)
-0.204
(0.000)
1.000
-0.681
(0.000)
-0.112
(0.000)
-0.071
(0.008)
0.010
(0.707)
-0.012
(0.660)
0.043
(0.105)
0.041
(0.128)
-0.008
(0.778)
-0.065
(0.016)
0.037
(0.171)
-0.065
(0.015)
1.000
-0.035
(0.189)
-0.062
(0.019)
-0.012
(0.666)
0.060
(0.026)
-0.036
(0.181)
-0.063
(0.018)
-0.004
(0.886)
0.103
(0.000)
-0.069
(0.011)
0.035
(0.195)
1.000
0.357
(0.000)
0.018
(0.514)
-0.006
(0.831)
0.097
(0.000)
-0.019
(0.492)
0.046
(0.087)
0.010
(0.725)
0.064
(0.020)
0.081
(0.003)
1.000
-0.022
(0.407)
-0.012
(0.644)
0.018
(0.502)
0.025
(0.351)
-0.027
(0.308)
0.013
(0.637)
0.046
(0.093)
0.013
(0.622)
1.000
-0.172
(0.000)
0.059
(0.029)
0.028
(0.300)
0.373
(0.000)
-0.155
(0.000)
0.162
(0.000)
0.223
(0.000)
1.000
-0.063
(0.019)
-0.037
(0.174)
-0.184
(0.000)
0.469
(0.000)
-0.026
(0.342)
0.090
(0.001)
1.000
0.193
(0.000)
0.092
(0.001)
-0.097
(0.000)
0.048
(0.079)
0.037
(0.170)
1.000
-0.077
(0.004)
-0.066
(0.015)
0.032
(0.242)
-0.079
(0.003)
1.000
-0.442
(0.000)
0.362
(0.000)
0.458
(0.000)
1.000
-0.081
(0.003)
0.097
(0.000)
1.000
0.346
(0.000)
1.000
Table A4. Descirptive Statistics for Other Control Variables, by Paternal Incarceration Status
No Recent Incarceration
Distal Incarceration
(At or before Y5 Only)
n = 426
Never Incarcerated
n = 650
Variable
Bio parent impulsivity (z-scores), Y1,Y3
Bio parent substance abuse, Y3
Child exposure to domestic violence, Y3
Low birth weight
Mother major depression, Y3
Father major depression, Y3
Mother and father married, Y0
Mother from two-parent family
Father from two-parent family
Either bio parent an immigrant
Mother and father education, Y0
Mother unemployed, Y3
Mother Hh income ($10,000), Y0-Y5
Student achievement (z-scores), Y9
Student grade 3, Y9
Student grade 4-5, Y9
Student IEP, Y9
Student diagnosed with ADD/ADHD by Y9
Teacher NH black
Teacher Hispanic
Teacher graduate degree
Teacher tenure (years)
School percent black
School percent Hispanic
School security level
Neigh. disadvantage (z-scores), Y3-Y9
Valid N
650
585
647
640
647
588
650
640
597
607
650
647
650
648
650
650
641
649
641
641
644
648
634
634
616
650
Mean
-0.13
0.03
0.00
0.08
0.19
0.10
0.46
0.53
0.55
0.19
2.56
0.11
5.05
0.20
0.70
0.18
0.08
0.09
0.17
0.09
0.49
14.03
30.71
21.18
3.58
-0.25
Std Dev
0.54
0.16
0.04
0.26
0.39
0.29
0.50
0.50
0.50
0.39
0.93
0.31
4.05
0.90
0.46
0.38
0.27
0.29
0.37
0.29
0.50
9.96
35.14
28.60
1.35
0.98
Valid N
413
302
400
413
400
309
426
423
362
350
426
400
426
425
426
426
423
426
420
420
421
425
425
425
410
425
Mean
0.13
0.06
0.03
0.11
0.27
0.20
0.09
0.35
0.35
0.11
1.82
0.25
2.32
-0.12
0.64
0.19
0.13
0.16
0.23
0.14
0.49
13.17
43.83
25.80
3.79
0.24
Std Dev
0.62
0.24
0.16
0.31
0.44
0.40
0.29
0.48
0.48
0.31
0.66
0.43
1.74
0.82
0.48
0.40
0.34
0.37
0.42
0.34
0.50
9.68
37.73
31.99
1.41
0.76
Recent Incarceration
(Since Y5 but not at Y5)
n = 320
Valid N
314
244
308
309
308
247
320
318
270
258
320
308
320
319
319
319
318
319
316
316
319
320
319
319
306
320
Mean
0.08
0.09
0.05
0.11
0.21
0.15
0.07
0.29
0.36
0.07
1.78
0.24
2.35
-0.13
0.65
0.18
0.18
0.17
0.22
0.10
0.49
13.00
45.16
23.73
3.87
0.18
Std Dev
0.62
0.29
0.22
0.31
0.41
0.36
0.25
0.45
0.48
0.26
0.63
0.43
2.04
0.92
0.48
0.39
0.38
0.38
0.41
0.31
0.50
9.65
37.55
30.22
1.37
0.81
Total
N = 1,406
Valid N
1384
1132
1361
1372
1361
1145
1406
1391
1231
1218
1406
1360
1406
1402
1405
1405
1392
1404
1386
1386
1394
1403
1388
1388
1342
1405
Mean
0.00
0.05
0.02
0.09
0.22
0.14
0.26
0.42
0.45
0.14
2.15
0.18
3.58
0.02
0.67
0.19
0.12
0.13
0.20
0.11
0.49
13.51
38.16
23.29
3.71
0.00
Range
Std Dev
0.60
0.22
0.14
0.29
0.41
0.34
0.44
0.49
0.50
0.35
0.88
0.39
3.36
0.90
0.47
0.39
0.33
0.34
0.40
0.31
0.50
9.80
37.17
30.21
1.38
0.91
Source : Fragile Families and Child Wellbeing Study, Birth to Year 9
Notes : NH = non-Hispanic; Y0 to Y9 = birth to year 9; IEP = individualized education program; ADD/ADHD = Attention Deficit Disorder/Attention Deficit Hyperactivity Disorder
Min
-1.23
0.00
0.00
0.00
0.00
0.00
0.00
0.00
0.00
0.00
1.00
0.00
0.18
-1.98
0.00
0.00
0.00
0.00
0.00
0.00
0.00
1.00
0.00
0.00
0.00
-2.70
Max
2.04
1.00
1.00
1.00
1.00
1.00
1.00
1.00
1.00
1.00
4.00
1.00
35.85
2.19
1.00
1.00
1.00
1.00
1.00
1.00
1.00
52.00
100.00
98.69
7.00
2.46
Table A5. Desciptions of Propensity Score Covariates
Variable
Father criminal justice contact by Y5
Mother criminal justice contact by Y5
Description
Binary variable coded 1 if father reports having been stopped by the police but not arrested, booked or charged for an offense, or incarcerated by the agefive wave. Incarceration data based on mother and father reports.
Binary variable coded 1 if mother reports having been stopped by the police but not arrested, booked or charged for an offense, or incarcerated by the
age-five wave. Incarceration data based on mother and father reports.
Father black NH
Binary variable coded 1 if father is non-Hispanic black
Father age
Approximate age in years in the year 2000, based on father reports and the interview year
Father unemployment, Y0-Y5
Father Hh income ($10,000), Y3-Y9
Mother Hh income ($10,000), Y3-Y9
Father neigh. disadvantage (z-scores), Y5
Father married, Y5
Father impulsivity (z-scores), Y1
Father cognitive ability, Y1
Father and mother education, Y0
Sum composite of four binary measures (one for each wave between baseline and age-five) each coded 1 if father reports looking for regular work and
not currently working for regular pay at a given wave.
Mean of household income at age-three, age-five, and age-nine waves, coded in $10,000 units. Due to missing data, some cases were imputed by
Fragile Families Study staff. For more information see http://www.fragilefamilies.princeton.edu/documentation/core/4waves_ff_public.pdf
Mean of household income at age-three, age-five, and age-nine waves, coded in $10,000 units. Due to missing data, some cases were imputed by
Fragile Families Study staff. For more information see http://www.fragilefamilies.princeton.edu/documentation/core/4waves_ff_public.pdf
Standardized mean composite of census 2000 tract characteristics (poverty rate, percent without a bachelor's degree, occupational status reversed,
percent on public assistaance, unemployment, household income reversed); based on father's residence at age-five wave
Binary measure coded 1 if (1) father or mother report that they are married to each other at the age-five wave or (2) father reports being married to
another partner at the same wave
Standardized mean composite measure of six self-report items from Dickman (1990) measured at age-one wave. Higher scores signify more
impulsivity; alpha = 0.8
Sum of 8 word association items from the Similarities subtest of the Weschler Adult Intelligence Scale--Revised; alpha = 0.6 in the full Fragile Families
sample. Some fathers were not asked until the age-three wave.
Mean composite measure of mother and father self-reported education levels at time of child's birth. Responses range from 1 = less than high school to
4 = bachelor's degree or higher
Source : Fragile Families and Child Wellbeing Study
Notes : Y0 to Y9 = birth to year 9
Table A6. Common Support and Bias Reduction for Propensity Score Matching
Models in 20 Imputed Datasets
Bias Reduction
Treatment Cases
(Percent Reduction in Median
Imputed
Absolute Value after Matching)
Dataset
Nearest
Off-Support
On-Support
Kernel
Neighbor
1
2
318
96
97
2
1
319
91
96
3
2
318
94
96
4
0
320
93
98
5
1
319
95
96
6
0
320
98
98
7
0
320
94
97
8
7
313
89
97
9
0
320
94
96
10
0
320
94
95
11
0
320
94
98
12
1
319
96
94
13
2
318
94
95
14
0
320
97
99
15
2
318
92
94
16
1
319
97
95
17
0
320
92
96
18
3
317
96
96
19
2
318
92
97
20
1
319
95
97
Mean
1
319
94
96
Source : Fragile Families and Child Wellbeing Study, Birth to Year 9
Note : All covariate mean differences between treatment and control groups were
statistically insignificant after matching in each of the 20 imputed datasets.
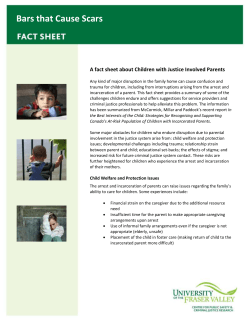

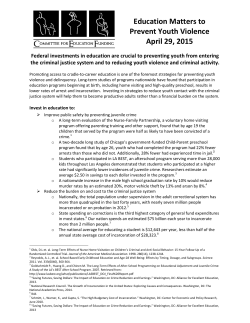


© Copyright 2026