
Environmental systems analysis of biogas systems—Part II: The
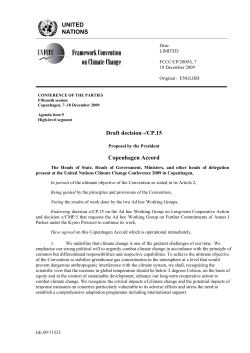
ARTICLE IN PRESS
Biomass and Bioenergy 31 (2007) 326–344
www.elsevier.com/locate/biombioe
Environmental systems analysis of biogas systems—Part II: The
environmental impact of replacing various reference systems
Pål Börjesson, Maria Berglund
Environmental and Energy Systems Studies, Department of Technology and Society, Lund University, Gerdagatan 13, SE-223 62 Lund, Sweden
Received 23 September 2005; received in revised form 12 January 2007; accepted 15 January 2007
Available online 19 March 2007
Abstract
This paper analyses the overall environmental impact when biogas systems are introduced and replace various reference systems for
energy generation, waste management and agricultural production. The analyses are based on Swedish conditions using a life-cycle
perspective. The biogas systems included are based on different combinations of raw materials and final use of the biogas produced (heat,
power and transportation fuel). A general conclusion is that biogas systems normally lead to environmental improvements, which in
some cases are considerable. This is often due to indirect environmental benefits of changed land use and handling of organic waste
products (e.g. reduced nitrogen leaching, emissions of ammonia and methane), which often exceed the direct environmental benefits
achieved when fossil fuels are replaced by biogas (e.g. reduced emissions of carbon dioxide and air pollutants). Such indirect benefits are
seldom considered when biogas is evaluated from an environmental point of view. The environmental impact from different biogas
systems can, however, vary significantly due to factors such as the raw materials utilised, energy service provided and reference system
replaced.
r 2007 Elsevier Ltd. All rights reserved.
Keywords: Anaerobic digestion; Energy crops; Organic waste; Fossil fuel systems; Life cycle perspective
1. Introduction
Anaerobic digestion and biogas production are promising means of achieving both global and local environmental benefits. Biogas is a renewable energy carrier, and
the introduction of anaerobic digestion of farm residues
and municipal organic waste may reduce potentially
negative environmental impact of current agricultural
practices and waste handling procedures. The development
and implementation of biogas systems in Sweden is being
stimulated by both existing and coming governmental
incentives. Today, biogas is exempted from energy and
environmental taxes, which improves the competitiveness
of biogas compared with fossil fuels. Several on-going and
planned biogas projects in Sweden have obtained governmental investment grants that aim at speeding up the
transition of Sweden to an ecologically sustainable society.
In addition, the new national waste handling policy
Corresponding author. Tel.: +46 46 222 86 42; fax: +46 46 222 86 44.
E-mail address: [email protected] (P. Börjesson).
0961-9534/$ - see front matter r 2007 Elsevier Ltd. All rights reserved.
doi:10.1016/j.biombioe.2007.01.004
includes a ban on landfilling with organic waste from the
year 2005 and an obligation to use biological treatment
methods (e.g. anaerobic digestion or composting) of wet
organic waste.
Previously almost all biogas produced in Sweden was
used for heat production in small-scale boilers or in largescale district heating plants. However, there is an increasing
interest in the use of biogas as a transportation fuel. One
reason is the increasing price of petrol and diesel due to
increased raw oil prices and national taxes, e.g. the tax on
carbon dioxide, whereas the cost of alternative fuels for
heat production, mainly wood fuels used in district heating
systems, has not increased to the same extent. The EU
directive on alternative transportation fuels is likely to
increase the interest in biogas as a transportation fuel
further. Today, the total biogas production in Sweden
amounts to approximately 5 PJ/year, of which 3 PJ comes
from digestion of sewage sludge at waste water treatment
plants. Of this total, some 0.5 PJ is up graded and used for
transportation services (e.g. in busses, trucks, taxies and
private cars) [1].
ARTICLE IN PRESS
P. Börjesson, M. Berglund / Biomass and Bioenergy 31 (2007) 326–344
Biogas can also be used for electricity production,
preferably in combined heat and power plants with high
total conversion efficiency. Combined heat and power
production provides higher profitability than stand-alone
power production [2]. During 2003, an electricity certificate
system was introduced in Sweden that aims at increasing
the production of renewable electricity, e.g. wind power
and biomass-based electricity. The additional revenue from
the trade of these certificates increases the profitability of,
and thus the interest in the production of biogas-based
electricity.
The biogas potential in Sweden is estimated to be some
50 PJ/year, which is ten times higher than the current
production and corresponds to 3–4% of the current energy
consumption in Sweden. Of this total, slightly less than
40 PJ originates from agricultural biomass resources, such
as manure, crop residues and dedicated ley crops [1,3].
Digestion of municipal organic waste and organic waste
from the food industry could contribute to some 8 PJ, and
sewage sludge to 4 PJ/year.
The big differences among biogas systems make them
complex to study from an environmental point of view. The
environmental impact of each system is more or less unique
because of the great variety of potential raw materials,
digestion technologies, and fields of application for the
biogas and digestates produced [4–6]. Furthermore, the
total environmental impact of the introduction of a biogas
system depends largely on the reference system replaced,
concerning energy supply, waste handling and farming
practice. Today, there is a lack of broad environmental
systems analyses of biogas production systems that include
the variation between different biogas fuel chains and the
indirect environmental impact of replacing different reference systems. Our research project Energy and Environmental Systems Analyses of Biogas Systems was initiated to
fill this gap. The results of the project are presented in two
reports (in Swedish) [4,7] and three papers, of which this is
the third, analysing the total environmental impact of
replacing various reference systems by biogas production
systems. The first paper assesses the energy performance of
various biogas systems [8], and the second the fuel-cycle
emissions from these systems [5].
The aim of this paper is to assess the total environmental
impact of the introduction of various biogas systems and
the replacement of different reference systems. The analysis
includes both the direct environmental effects of replacing
various energy carriers and energy systems, and indirect
effects of changed handling of raw materials, e.g. waste
management and farming practice. The purpose is also to
identify factors of major importance for an accurate
comparison between a biogas and a reference system, and
to identify the most promising application of a biogas
system from an environmental point of view. The calculations are aimed to be as transparent as possible in order to
make the results useful in future analyses and to enable the
reader to make her/his own calculations based on specific
local conditions.
327
2. Methods and assumptions
The analysis includes six different end-use technologies,
namely large- and small-scale boilers for heat production,
large- and small-scale gas turbines for co-generation of
heat and power, and heavy- and light-duty vehicles. The
biogas production includes six raw materials that are
digested in large-scale biogas plants, or in farm-scale
biogas plants in the case of agricultural raw materials (see
[5,8] and Section 3). The reference systems chosen are
assumed to be realistic alternatives to the biogas systems
studied, based on current Swedish conditions. The emissions are expressed per energy service unit, that is, heat,
heat and power, and kinetic energy for transportation, in
order to allow for variations in the conversion efficiency
among the final energy services. The functional unit used is
1 MJ of heat, 1 MJ of heat and power and 1 MJ of kinetic
energy. This functional unit is chosen in order to account
for variations in conversion efficiencies between the biogas
system and the reference system compared.
The analysis is based on literature reviews and refers
mainly to Swedish conditions and state-of-the-art technologies. An extensive description of our calculations on fuelcycle emissions from various biogas systems and the system
boundaries applied is given in [4,5,7,8]. Data on fuel-cycle
emissions from the reference systems are based on
previously published studies; a summary of the emissions
assumed is given in the Appendix.
The analysis includes both fuel-cycle emissions and
indirect environmental effects. Fuel-cycle emissions are
defined as emissions from the production and final use of
energy carriers. The indirect environmental effects are here
defined to be caused by emissions that are not directly
related to the energy conversion in the systems, for
example, changed emissions of ammonia and nitrous oxide
from arable land and leakage of nitrate due to changed
farming practice, or emissions of methane, ammonia and
nitrous oxide from the storage of manure (see Section 4).
The electricity used in the systems studied is assumed to
be produced in condensing plants using natural gas,
reflecting the estimated, long-term, marginal production
of electricity in the Scandinavian countries [9]. Thus, the
fuel-cycle emissions from the reference systems have been
recalculated when other sources of electricity have been
assumed in the studies quoted. The heat used in the biogas
plants is assumed to be produced from biogas, based on
present conditions at Swedish biogas plants.
Uncontrolled losses of methane from the production of
biogas is here assumed to correspond to 1% of the biogas
produced when the biogas is used for heat or combined
heat and power production, and 2% when the biogas is
upgraded and used as a transportation fuel [10]. Uncontrolled losses of methane will also increase the emission of
other pollutants due to the corresponding reduction in
energy efficiency in the biogas systems.
Energy crops are assumed to be cultivated on set-aside
arable land, and hence replacement of food or fodder
ARTICLE IN PRESS
P. Börjesson, M. Berglund / Biomass and Bioenergy 31 (2007) 326–344
328
kg raw material or
hectares of arable land
Reference system
based on fossil fuels
Biogas system
Energy
input
System boundary
System boundary
Energy
input
Alternative
handling of the
raw materials
or arable land
lies fallow
Prod. of
chemical
fertilizers
kg plant
nutrients
1 MJ of
energy service
Prod. of
fossil
fuels
System
enlargement
Energy
conversion
kg plant
nutrients
1 MJ of
energy service
Fig. 1. Comparing biogas systems and reference systems based on fossil fuels.
production is not included in the study. Other raw
materials are assumed to be waste products. Consequently,
the analysis includes only the additional energy input and
emission associated with the handling and transport of
these waste products, and none of the input used in the
production of the main product.
The potential need to expand the system boundaries and
system enlargement is taken into account in the analysis.
System enlargement is here assumed to be required when
there are differences between the biogas system and
reference system studied as regards total energy output
per tonne of raw material or hectare of arable land, or reuse of plant nutrients (see Section 5). When the alternative
handling of the raw materials does not generate any usable
energy service or arable land lies fallow, fossil fuels are
assumed to be used in the reference system to provide the
same energy output as in the biogas system (Fig. 1). The
analysis also includes reference systems that are based on
bioenergy (e.g. combustion of raw materials or cultivation
of willow, (Fig. 2). In these reference systems, less raw
materials or arable land is generally needed to provide the
same energy service as in the corresponding biogas system
due to differences in conversion losses. This difference is
assumed to be compensated for by an additional use of
fossil fuels in the biogas system. Any difference regarding
output of plant nutrients between two systems compared is
assumed to be compensated for by an additional production and utilisation of chemical fertilisers in the system that
provides less organic fertiliser available for recirculation.
The analysis does not comprise other potential benefits of
recycled organic matter.
The analysis includes emissions of carbon dioxide of
fossil origin (CO2), carbon oxide (CO), nitrogen oxides
(NOx), sulphur dioxide (SO2), hydrocarbons, except for
methane (HC), methane (CH4), particles, ammonia (NH3)
and nitrous oxide (N2O). Emissions to water include
nitrate (NO
3 ). These emissions are classified into the
following environmental impact categories: global warming potential (GWP), acidification potential (AP), eutrophication potential (EP), and photochemical oxidant
creation potential (POCP). The category indicators used
are given in the Appendix.
3. Comparison between different biogas and reference
systems
An overview of the biogas and reference systems
compared is given in Table 1. The reference systems
included are assumed to represent an efficient and an
inefficient system, respectively, from a land use and
resource utilisation perspective. Methanol from lignocellulosic biomass (willow) is assumed to represent a liquid
biofuel produced by gasification from which also other
similar transportation fuels could be synthesised.
3.1. Ley crops
Ley crop-based biogas is compared with reference
systems based on willow or fossil fuels, the latter implying that the arable land lies fallow. The fossil fuelbased reference systems are assumed not to include
any extra energy input for the management of the
ARTICLE IN PRESS
P. Börjesson, M. Berglund / Biomass and Bioenergy 31 (2007) 326–344
329
kg raw material or
hectares of arable land
Reference system
based on bioenergy
Biogas system
Prod. of
additional
fossil fuels
Energy
input
Prod. of
Alternative
chemical
handling of the
raw materials or
cultivation of
fertilizers
Energy
input
System
enlargement
System boundary
Energy
conversion
kg plant
nutrients
System boundary
energy crops
Energy
conversion
1 MJ of
energy service
kg plant
nutrients
1 MJ of
energy service
Fig. 2. Comparing biogas systems and reference systems based on bioenergy.
Table 1
Overview of the comparisons carried out between biogas systems and reference systemsa
Biogas system
Reference systemb
Heat
Heat and electricity
Heavy- and light-duty vehicles
Ley crops
Fallow land & fossil fuel
Willowc
L&F
L
L&F
L
L
Straw
Not recovered & fossil fuel
Combustion
L&F
L&F
L&F
L
Tops and leaves of sugar beets (s-b tops)
Not recovered & fossil fuel
L&F
L&F
L
Manure
Conventional storage & fossil fuel
L&F
L&F
L
Municipal organic waste (MOW) and food industry waste (FIW)
Composting & fossil fuel
Combustion
L
L
L
L
Letters indicate whether large-scale (‘‘L’’) and/or farm-scale (‘‘F’’) biogas systems were investigated.
a
‘‘Fossil fuel’’ refers to fuel oil (concerning heat production), natural gas (combined heat and power production), petrol (light-duty vehicles) and diesel
(heavy-duty vehicles).
b
Acronyms within parentheses are also used in Figs. 3–8.
c
Wood chips from willow are assumed to be used in the heat reference system, whereas methanol from willow is assumed to be used in the transportation
alternatives.
fallow land. Emissions from the reference systems based
on willow are calculated for the cultivation and harvesting of the crop and transportation to the incineration or methanol production plant. The comparisons
also include differences in field emissions of NO
3
(see Section 4).
3.2. Straw
Straw-based biogas systems are compared with reference systems that use straw for heat production or fossil
fuels. The same collection and transportation modes are
assumed to be used in both the biogas systems and the
ARTICLE IN PRESS
330
P. Börjesson, M. Berglund / Biomass and Bioenergy 31 (2007) 326–344
biomass-based reference systems. Straw is not collected in
the fossil fuel-based systems. Leaving straw in the field is
not assumed to increase the diesel consumption for
ploughing, or to significantly affect the nutrient leaching
or the soil organic matter content compared to the biogas
system.
3.3. Tops and leaves of sugar beets
Biogas systems based on tops and leaves of sugar beets
are compared with reference systems based on fossil fuels.
The reference systems do not include harvesting or
handling of the cropping residues. Leaving the residues in
the field is assumed not to increase the diesel consumption
for ploughing etc. The comparisons include field emissions
of NH3 and NO
3 (see Section 4).
3.4. Manure
Biogas systems based on liquid manure from pigs are
compared with reference systems based on fossil fuels,
which also include spreading of the manure on arable land.
The diesel consumption and fuel-cycle emissions are
assumed to be the same for the spreading of 1 tonne of
manure as for the spreading of 1 tonne of digestate. The
comparisons also include field emissions of NH3, N2O and
NO
3 , and emission of NH3 and CH4 from the storage of
the manure (see Section 4).
3.5. Municipal organic waste and food industry waste
Biogas production from municipal organic waste and
food industry waste is compared with reference systems
based on the combustion of the waste in large-scale
incineration plants, or with reference systems based on
fossil fuels for energy production purposes and largescale composting of the waste. All reference systems
include the collection and transportation of the waste
to the incineration plant or composting facility. The
same mode for collecting and transporting the waste is
assumed to be used in the biogas systems as in the reference
systems.
Ash produced in the combustion of the waste is assumed
to be used as landfill. However, the analysis does not
include emissions from the transportation and landfilling of
the ash or leakages from the landfill.
The composting includes the energy used in the mixing
of the compost and the emission of NH3, N2O and CH4
from the biological decomposing processes (see Section 4).
The diesel consumed for tractor operations at the
composting site is estimated to be, on average, 15 MJ/
tonne of waste [11]. The fuel-cycle emissions from these
operations are given in the Appendix. The compost
produced is assumed to be used as fertiliser.
4. Indirect environmental effects of replacing various waste
handling and cropping systems
An introduction of biogas systems may lead to indirect
environmental effects that are not direct results of the
replacement of other energy systems. Such indirect effects
are seldom considered in environmental analyses of biogas
systems, though they can affect the results significantly.
The potential indirect effects considered here are divided
into the following categories: (i) changed emissions from
the handling and storage of raw materials and digestate,
and (ii) changed nutrient leaching due to changed cropping
practices.
4.1. Changed emissions from the handling and storage of
raw materials and digestate
4.1.1. Liquid manure
Storage of liquid manure leads to spontaneous emissions
of methane and ammonia, which can be reduced when the
digestion of manure and the collection of the biogas
produced replace conventional storage systems for manure.
Calculations based on Danish conditions show that the
emissions of CH4 may be reduced, on average, by 1.6 kg
CH4/tonne of pig slurry, or from 3.1 to 1.5 kg [12]. The
manure is here assumed to be stored in the pig house for 15
days, based on current, average conditions. Reducing the
storage time to 1 day would reduce the emissions to
approximately 15% of the current levels. The emission of
CH4 is also affected by the temperature, duration of the
storage, precipitation, content of straw etc. [13,14].
The reduction in NH3 emissions when introducing
biogas production is here estimated to amount to, on
average, 100 g of NH3/tonne of manure [15]. This is
equivalent to about 20% of the emissions from an
uncovered storage tank. However, the conventional
storage of manure is here assumed to be in tanks using
semi-permeable cover materials, such as straw, Leca
granules etc., reducing the emissions of NH3 by 70–85%.
Support for the assumption that N2O emissions are
reduced by this type of storage has not been found in the
literature. The emissions of CH4 will also be reduced from
manure tanks with semi-permeable cover sheets, but
mainly temporarily, since a large part of the CH4 produced
during storage is released when the manure is pumped and
spread on the fields. About 30–40% of the methane
produced during storage may be oxidised into carbon
dioxide when passing through the semi-permeable cover
sheet [16].
Spreading of digested manure is here assumed to
increase the emission of NH3 slightly, and decrease the
emission of N2O, compared with undigested manure [17].
Digested manure contains less easily decomposed organic
matter than conventional manure, and thus less ‘‘energy’’
for the nitrous oxide-forming microorganisms, leading to
an estimated reduction, on average, from 40 to 25 g N2O/
tonne of manure [16,18]. The increased emission of NH3,
ARTICLE IN PRESS
P. Börjesson, M. Berglund / Biomass and Bioenergy 31 (2007) 326–344
here assumed to be, on average, from 250 to 310 g NH3/
tonne when using efficient spreading technology, is due to
the higher content of ammonium in digested manure,
which potentially can be converted into NH3 [19].
4.1.2. Tops and leaves of sugar beets
Tops and leaves of sugar beets left on the field after
harvest contain approximately 100–160 kg N/hectare.
Approximately 20–40% of the nitrogen can be lost to the
next cropping season through emissions of ammonia and
nitrogen gas to the atmosphere, and leakage of nitrate into
the ground water [20]. On average 3 tonne dry matter of
tops and leaves of sugar beets are estimated to be available
to be harvested for biogas production per hectare and year.
This harvest is estimated to reduce the nitrogen losses by
30 kg N/hectare and year, of which one-third is estimated
to be in the form of ammonia, equivalent to 770 g NH3/
tonne of tops and leaves of sugar beets.
4.1.3. Composting of organic waste
Composting of organic waste causes biological emissions
of NH3, N2O and CH4 (Table 2). The total losses of
nitrogen are estimated to be, on average, 35% of the
nitrogen content in the organic waste, based on current
composting technology, and excluding gas-cleaning equipment [18]. Emissions of ammonia are assumed to
contribute to 93% and nitrous gas to 5% of the total
nitrogen emissions. The emissions of methane are assumed
to correspond to 0.35% of the total emissions of carbon
dioxide.
Table 2
Biological emissions from large-scale composting of organic wastea
Municipal organic
waste
Food industry waste
a
NH3
(kg/tonne)
N2O (g/tonne)
CH4 (g/tonne)
2.0
110
420
1.0
56
120
Based on [11,18]. Excluding external gas cleaning.
331
4.2. Changed nutrient leaching from changed cropping
practices
The potential nutrient leaching from arable land
depends on various factors, such as cropping systems,
fertilisation strategies, precipitation and soil type. An
introduction of biogas systems is here assumed to affect
the nutrient leaching in the following cases: (i) changed
cropping systems, including land lying fallow, cultivation of ley crops or of willow, (ii) recovery of tops
and leaves of sugar beets, and (iii) replacement of
undigested liquid manure by digested manure as a
fertiliser. Recovery of straw is here assumed not to affect
the nutrient leaching since straw contains little nitrogen.
Further, long-term field trials show small variations in
nitrogen leaching between recovery and non-recovery of
straw.
Land lying fallow is here estimated to cause the lowest
nitrogen leaching, followed by ley crop cultivation
and thereafter willow cultivation (Table 3). Nitrogen
leaching from fallow land refers to long-term fallow
periods (several years) without soil tillage. The figures on
nitrogen leaching are based on average conditions in
southern Sweden, where the leakage may vary from
about 10 up to 60 kg N/hectare and year depending
on local conditions [21]. Thus, the assumptions made
here about changes in nitrogen leaching are rough, but
represent modest changes. Recovery of tops and leaves of
sugar beets is estimated to reduce the nitrogen leaching by
25–30%, based on results from field trials in southern
Sweden [22].
Digestion of liquid manure increases its quality as a
fertiliser since organic-bound nitrogen is converted into
ammonium available to plants. Increased concentration of
ammonium allows for a higher precision in fertilisation and
thereby reduced risk of nitrogen leakage. Normally, the
amount of ammonium corresponds to 70% of the total
nitrogen content in undigested manure, whereas it is about
85% in digested manure [12]. Results from field trails in
southern Sweden show that the nitrogen leaching may be
reduced by about 20% when digested manure replaces
undigested manure [23].
Table 3
Estimations of changed nitrogen leaching from changed cropping practices
Changed nitrogen leaching
Ley crops replace fallow landa
Ley crops replace willowa
Tops and leaves of sugar beets are recovered instead of left on the fieldb
Digested liquid manure replaces conventional liquid manurec
(kg N/hectare, year)
ðgNO
3 =tonneÞ
+5
5
10
7.5
+750
750
3000
1100
Increased leaching is indicated by (+), and decreased leaching by ().
a
Based on [21] (referring to fallow) and [24] (willow). The ley crop yield amounts to 30 tonne/hectare and year [8].
b
Based on [21,22]. The yield of tops and leaves of sugar beets amounts to 16 tonne/hectare and year [8].
c
Based on [23]. The application rate of manure amounts to 30 tonne/hectare and year [8].
ARTICLE IN PRESS
P. Börjesson, M. Berglund / Biomass and Bioenergy 31 (2007) 326–344
332
Table 4
Additional need of fossil fuels in biogas systems to compensate for a lower
output of energy services per hectare of arable land or per tonne of raw
material than in the biomass-based reference systemsa
Biogas system/reference system
End-use application
Proportions of energy
carriers for the end-use in
the biogas system
Biogas
(%)
Fossil fuel
(%)
Ley crops/willow
Heat, large-scale
Light-duty vehicles
Heavy-duty vehicles
45
70
75
55
30
25
Straw/incineration of strawc
Heat, large-scale
Heat, small-scale
45
50
55
50
Food industry waste/incineration of the
wasted
Heat, large-scale
80
20
b
Municipal organic waste/incineration of the
wasted
Heat, large-scale
Table 5
Additional production of commercial fertilisers in the reference systems to
compensate for improved utilisation of plant nutrients in the biogas
system due to utilisation of the digestates as fertilisersa
60
40
a
Fuel oil is assumed to be used for the additional heat production, and
petrol and diesel for the additional transport in light-duty and heavy-duty
vehicles, respectively. Conversion efficiencies and fuel-cycle emissions
from the use of fossil fuels are given in the Appendix.
b
The biomass yield is assumed to be 9 tonne dry matter/hectare of
willow, and 6.8 tonne dry matter/hectare of ley crops. The heat value of
willow is 18.7 GJ/tonne dry matter, and the methanol production is
assumed to correspond to 9.4 GJ/tonne dry matter. The biogas yield from
ley crops is 10.6 GJ/tonne dry matter [8,25,26].
c
The heat value of straw is 17.6 GJ/tonne dry matter, and the biogas
yield 7.1 GJ/tonne dry matter [8,25].
d
The heat value of organic waste is estimated to be 21 GJ/tonne dry
matter, and the biogas yield to 16 and 12.4 GJ/tonne dry matter of food
industry waste and municipal organic waste, respectively [8,11].
5. System enlargement
It is crucial that the system boundaries are determined in
a coherent way in order to make the comparisons between
energy systems accurate. An expansion of the system
boundaries is required when there are differences between
the systems compared concerning the efficiency in land use
or energy output per tonne of biomass, and differences in
the utilisation of plant nutrients.
5.1. Differences in land use and in energy output efficiency
The willow yield (dry matter) is estimated to be, on
average, 30% higher per hectare than the ley crop yield
[25]. In addition, the heat output is estimated to be
approximately 70% higher per dry tonne of willow than
per dry tonne of ley crops used for biogas production.
Combustion of straw and organic waste is also assumed to
provide high heat output compared to the digestion of the
raw materials. The difference between the systems is
comparatively small when willow is used for methanol
Nitrogen (kg/
tonne raw
material)
Phosphorus
(kg/tonne raw
material)
Ley crops
Willow or fallow
4.3
0.48
Tops and leaves of sugar beets
Not recovered
1.3
—
Manure
Conventional storage
0.51
—
Food industry waste
Compostinga
Combustion
1.6
2.2
—
0.8
Municipal organic waste
Compostinga
Combustion
3.0
4.2
—
1.2
a
Refers to large-scale composting without gas cleaning. All of the
phosphorus in the compost is assumed to be available for recycling,
whereas the nitrogen losses are significant from composting and a
comparatively low share of the nitrogen is plant available (see the
Appendix).
production since the methanol production route is less
energy efficient than the biogas production route. Difference in energy output per hectare or tonne of raw material
is assumed to be compensated for by an additional use
of fuel oil in the system that provides less energy output
(see Table 4).
5.2. Differences in the utilisation of plant nutrient
Improved efficiency in the utilisation of plant nutrients
due to digestion of raw materials and utilisation of the
digestates as fertilisers is here assumed to be balanced by an
additional production of commercial fertilisers in the
reference systems, presupposing the same output of plantavailable N and P in both systems (Table 5). Energy use
and emissions from the production of commercial fertilisers are given in the Appendix. All phosphorus in the
digestate is assumed to be plant available, whereas the
amount of plant-available nitrogen is assumed to be 85%
in digestates from manure, and 70% in the digestates from
the other raw materials.
6. Changed environmental impact of introducing various
biogas systems
The following (Figs. 3–8) gives an overview of the results
of the comparisons carried out. Each group of two columns
represents one comparison, the left column expressing the
emission from the biogas systems, and the right
the emissions from the corresponding reference system.
Comparisons that include reference systems based on fossil
ARTICLE IN PRESS
Reference systems based on oil
Reference
system
based on
bioenergy
150
100
50
0.3
0.2
0.1
Manure
Oil
Straw
Combustion
Manure
Oil
Straw
Combustion
Oil
Straw
Fallow+oil
Ley crops
Suger beet
tops
Oil
Straw
Combustion
Oil
Manure
Oil
S-b tops
Oil
Straw
Fallow+oil
Leycrops
Suger beet
tops
Oil
0.2
50
0
Oil
0.4
100
Straw
0.6
Leycrops
0.8
150
Fallow+oil
POCP (mg C2H2-eq/MJ heat)
Straw
Combustion
Oil
Manure
Suger beet
tops
Oil
Oil
Straw
1
0
60
Biogas system:
40
20
Combustion
Straw
Oil
Manure
Suger beet
tops
Oil
Oil
Straw
Fallow+oil
0
Reference system:
System enlargement
System enlargement
End-use emissions
End-use emissions
Production of biogas
Production of
energy carriers
Additional handling
of raw materials
Ley crops
Particles (mg particles/MJ heat)
333
0
Fallow+oil
0
AP(g SO2-eq./MJ heat)
EP (g PO4-eq./MJ heat)
200
Ley crops
GWP (g CO2-eq./MJ heat)
P. Börjesson, M. Berglund / Biomass and Bioenergy 31 (2007) 326–344
Indirect environmental
effects
Fig. 3. Life-cycle emissions from small-scale heat production.
fuels are given to the left in the diagrams, and the
bioenergy-based comparisons to the right. The category
‘‘system enlargement’’ refers in the biogas systems to
emissions from the production and final use of additional
fossil fuels needed to achieve an equivalent energy output
per tonne of raw materials or per hectare. In the reference
systems it refers to emissions from additional production of
commercial fertilisers needed to achieve an equivalent
output of plant nutrients from the systems. The category
‘‘Additional handling of raw materials’’ is used in the
reference system to account for emissions from the
handling of raw materials that are not used for energy
production purposes, for example, emissions from the
spreading of manure and composting of waste products.
Emissions that are defined as causing ‘‘indirect environmental effects’’ are given as the difference between the
systems compared. These differences are always assigned to
the system that causes the highest indirect environmental
impact.
6.1. Heat
The emissions of greenhouse gases per MJ heat is
calculated to decrease by approximately 75–90% when
biogas-based heat replaces fossil fuel based, the highest
reductions being from the replacement of handling manure
ARTICLE IN PRESS
P. Börjesson, M. Berglund / Biomass and Bioenergy 31 (2007) 326–344
0.4
M.O.W.
Compost.+oil
Ley crops
Willow
Straw
Combustion
F.I.W.
Combustion
M.O.W.
Combustion
Ley crops
Willow
Straw
Combustion
F.I.W.
Combustion
M.O.W.
Combustion
Manure
Oil
F.I.W.
Compost.+oil
Manure
Oil
M.O.W.
Combustion
F.I.W.
Combustion
Ley crops
Willow
Straw
Combustion
M.O.W.
Compost.+oil
Manure
Oil
F.I.W.
Compost.+oil
S-b tops
Oil
Straw
Oil
Ley crops
Fallow+oil
S-b tops
Oil
0.5
S-b tops
Oil
1
Straw
Oil
1.5
Straw
Oil
2
Ley crops
Fallow+oil
POCP (mgC2H2-eq/MJ heat)
2.5
Ley crops
Fallow+oil
0
0
30
20
10
0
Biogas system:
Reference system:
20
System enlargement
System enlargement
End-use emissions
End-use emissions
Production of biogas
Production ofenergy carriers
M.O.W.
Combustion
F.I.W.
Combustion
Straw
Combustion
Ley crops
Willow
M.O.W.
Compost.+oil
Additional handling of
raw materials
F.I.W.
Compost.+oil
Manure
Oil
S-b tops
Oil
0
Straw
Oil
10
Ley crops
Fallow+oil
Particles (mg particles/MJ heat)
0.1
M.O.W.
Combustion
F.I.W.
Combustion
Straw
Combustion
Ley crops
Willow
M.O.W.
Compost.+oil
F.I.W.
Compost.+oil
Manure
Oil
S-b tops
Oil
Straw
Oil
50
0.2
M.O.W.
Compost.+oil
100
0.3
F.I.W.
Compost.+oil
Reference systems
based on bioenergy
150
0
AP (gSO2-eq./MJ heat)
Reference systems based on oil
EP (g PO4-eq./MJ heat)
200
Ley crops
Fallow+oil
GWP (g CO2-eq./MJ heat)
334
Indirect environmental
effects
Fig. 4. Life-cycle emissions from large-scale heat production.
and food industry waste. On the other hand, replacing
biomass-based heat production is calculated to increase the
emissions of greenhouse gases by approximately 50–500%
when replacing combustion of willow and organic waste, or
even up to 40 times when biogas replaces large-scale
combustion of straw. This is mainly due to the decreased
heat output per tonne of raw materials which require
additional use of fossil fuels for the heat production in the
biogas system.
In the biogas systems, emissions of CO2 contribute to
about 60–75% and CH4 to 25–40% of the life-cycle
emissions of greenhouse gases. In the fossil fuel-based
reference systems, CO2 contributes to almost all emissions
of greenhouse gases, except for systems including storage
of manure in which losses of CH4 and N2O contribute to
about 45% of the life-cycle emissions. Emissions of N2O
can also be of great importance when chemical fertilisers
are used in the cultivation of energy crops or when
additional production of chemical fertilisers is needed in
the reference systems, for example, combustion of willow
or organic waste.
The calculations show large variations in the AP and EP
among the comparisons carried out, especially when the
indirect environmental effects are included. The indirect
environmental effects are mainly caused by emissions of
NH3 from the composting of waste, field emissions of NO
3
from the use of manure, and field emissions of NO
3 and
NH3 from the handling of tops and leaves of sugar beets.
ARTICLE IN PRESS
Biogas system:
8
NG
Manure
NG
NG
Reference system:
System enlargement
System enlargement
End-use emissions
End-use emissions
Production of biogas
Production ofenergy carriers
6
4
S-b tops
NG
Straw
0
Manure
NG
Manure
NG
S-b tops
NG
Straw
Fallow+NG
0
10
NG
0.2
20
S-b tops
0.4
30
NG
0.6
Ley crops
0
Straw
0.8
POCP (mgC2H2-eq/MJ heat & power)
AP (g SO2-eq./MJ heat
& power)
1
2
Additional handling of
raw materials
NG
Manure
NG
S-b tops
NG
Straw
Fallow+NG
0
Ley crops
Particles (mg particles/MJ heat
& power)
0.1
NG
Manure
NG
S-b tops
NG
Straw
0
Fallow+NG
50
0.2
Fallow+NG
100
0.3
Fallow+NG
150
335
0.4
Ley crops
Reference systems based on natural gas
Ley crops
GWP (g CO2-eq./MJ heat
& power)
200
Ley crops
EP (g PO4-eq./MJ heat & power)
P. Börjesson, M. Berglund / Biomass and Bioenergy 31 (2007) 326–344
Indirect environmental
effects
Fig. 5. Life-cycle emissions from small-scale cogeneration of heat and power.
Using these raw materials for biogas production and to
replace fossil fuel-based reference systems is estimated to
reduce the AP and EP by up to 95%. The differences
between the biomass-based reference systems and their
equivalent biogas systems are not as large, or typically less
than 750%.
The POCP increases typically by 20–70% when biogasbased heat replaces combustion of waste or fossil fuelbased heat production. However, the emissions of POCP
are reduced when the incineration of willow and straw, in
which incomplete combustion causes high emissions of CO
and HC, is replaced or when conventional storage of
manure and composting of waste, which cause high
emissions of CH4, are replaced.
Biogas-based heat is calculated to always decrease the
emissions of particles in the comparisons carried out,
typically by between 30% and 70%. Replacing the
combustion of straw is calculated to decrease the emissions
of particles even further, or by up to 90%.
6.2. Heat and power
The environmental effects of introducing biogas for the
cogeneration of heat and power are similar to those
achieved when biogas is used for stand-alone heat
production from fossil fuel (see previous section). However, the benefits of this introduction is generally somewhat
smaller since the end-use emissions are normally lower
ARTICLE IN PRESS
0.2
6
4
Compost.+NG
M.O.W.
Compost.+NG
Compost.+NG
M.O.W.
Compost.+NG
NG
NG
F.I.W.
S-b tops
S-b tops
F.I.W.
NG
30
20
10
0
Biogas system:
8
NG
Straw
Compost.+NG
M.O.W.
F.I.W.
Compost.+NG
NG
Manure
NG
S-b tops
NG
Straw
Fallow+NG
Ley crops
NG
0.5
Straw
1
Fallow+NG
1.5
Fallow+NG
POCP (mgC2H2-eq/MJ heat
& power)
Compost.+NG
M.O.W.
F.I.W.
Compost.+NG
NG
Manure
NG
S-b tops
NG
Straw
Fallow+NG
Ley crops
2
Manure
0.1
0
0
0
Reference system:
System enlargement
System enlargement
End-use emissions
End-use emissions
Production of biogas
Production ofenergy carriers
2
Additional handling of
raw materials
Compost.+NG
M.O.W.
Compost.+NG
F.I.W.
NG
Manure
NG
S-b tops
NG
Straw
Fallow+NG
0
Ley crops
Particles (mg particles/MJheat
& power)
0.3
NG
50
0.4
Manure
100
0.5
Ley crops
AP (g SO2-eq./MJ heat
& power)
2.5
Reference systems based
on natural gas
Ley crops
GWP (g CO2-eq./MJ heat
& power)
150
EP(g PO4-eq./MJ heat
& power)
P. Börjesson, M. Berglund / Biomass and Bioenergy 31 (2007) 326–344
336
Indirect environmental
effects
Fig. 6. Life-cycle emissions from large-scale cogeneration of heat and power.
from natural gas-based heat and power production than
from corresponding heat production based on fuel oil.
6.3. Transportation
The contribution to the GWP will normally be reduced
by between 50% and 80% when biogas replaces petrol and
diesel as a transportation fuel in light- and heavy-duty
vehicles. On the other hand, using ley crop-based biogas to
replace methanol from willow is calculated to increase the
greenhouse gas emission by 30–50%, mainly due to the
need for additional petrol or diesel in the biogas system to
compensate for the lower energy output per hectare.
Concerning the contribution to the AP and EP, the
effects of introducing biogas as a transportation fuel are
similar to those achieved when biogas is used for heat or
combined heat and power production (see previous
sections). The life-cycle emissions are substantially reduced
when biogas from tops and leaves of sugar beets, manure
and organic waste are utilised, mainly due to the reduced
emissions of NO
3 and NH3. Biogas from ley crops and
straw will also lead to a reduced contribution to the AP
and EP when diesel is replaced in heavy-duty vehicles,
whereas using biogas from these raw materials to replace
petrol in light-duty vehicles may lead to an increased
contribution.
ARTICLE IN PRESS
50
1
Manure
Petrol
F.I.W.
Compost.+petrol
M.O.W.
Compost.+ petrol
Ley crops
Willow/methanol
Manure
Petrol
F.I.W.
Compost.+petrol
M.O.W.
Compost.+ petrol
Ley crops
Willow/methanol
S-b tops
Petrol
S-b tops
Petrol
0
Straw
Petrol
0.5
Straw
Petrol
Ley crops
Willow/methanol
M.O.W.
Compost.+ petrol
F.I.W.
Compost.+petrol
Manure
Petrol
S-b tops
Petrol
Straw
Petrol
Ley crops
0
1.5
Ley crops
Fallow+petrol
5
337
2
Ley crops
Fallow+petrol
Ley crops
Willow/methanol
M.O.W.
Compost.+ petrol
F.I.W.
Compost.+petrol
Manure
Petrol
S-b tops
Petrol
10
300
200
100
0
Biogas system:
Reference system:
40
System enlargement
System enlargement
30
End-use emissions
End-use emissions
20
Production of biogas
Production ofenergy carriers
10
Additional handling of
raw materials
Ley crops
Willow/methanol
M.O.W.
Compost.+ petrol
F.I.W.
Compost.+petrol
Manure
Petrol
S-b tops
Petrol
Straw
Petrol
0
Ley crops
Fallow+petrol
Particles (mg particles/MJ kinetic
energy)
Straw
Petrol
0
Ley crops
Fallow+petrol
400
EP (g PO4-eq./MJ kinetic
energy)
800
Reference
system
based on
bioenergy
POCP (mg C2H2-eq/MJ kinetic
energy)
Reference systems based on petrol
Fallow+petrol
AP (gSO2-eq./MJkinetic
energy)
GWP (g CO2-eq./MJ kinetic
energy)
P. Börjesson, M. Berglund / Biomass and Bioenergy 31 (2007) 326–344
Indirect environmental
effects
Fig. 7. Life-cycle emissions from transportation fuels used in light-duty vehicles.
The contribution to the POCP will be reduced by
approximately 50–70% when biogas is used in light-duty
vehicles and by about 20–65% when biogas is used in
heavy-duty vehicles. The reduction will be even greater,
about 80%, when biogas from manure is utilised.
The life-cycle emissions of particles will be reduced
further when biogas replaces diesel in heavy-duty vehicles,
about 50–80%, than when biogas replaces petrol in lightduty vehicles, about 15–60%. However, when ley cropbased biogas replaces methanol from willow, the life-cycle
emissions of particles may increase by 10–30%.
7. Sensitivity analysis
Several factors included in this environmental analysis
have been identified to significantly affect the result. Some
of these factors are based on rather uncertain input data,
mainly due to differences in local conditions or limited
knowledge due to lack of data from monitoring and
measurements, experiments, field trials etc. In the following
section the importance of various critical factors in
different environmental impact categories is analysed
further.
ARTICLE IN PRESS
F.I.W.
Compost.+diesel
M.O.W.
Compost.+diesel
Ley crops
Willow/methanol
M.O.W.
Compost.+diesel
Ley crops
Willow/methanol
S-b tops
Diesel
Ley crops
Fallow+diesel
F.I.W.
Compost.+diesel
Ley crops
Willow/methanol
M.O.W.
Compost.+diesel
F.I.W.
Compost.+diesel
Manure
Diesel
S-b tops
Diesel
Straw
Diesel
Ley crops
Fallow+diesel
40
Manure
Diesel
2
Manure
Diesel
4
0
100
75
50
25
as
0
Biogas system:
Reference system:
30
System enlargement
System enlargement
20
End-use emissions
End-use emissions
Production of biogas
Production ofenergy carriers
10
Additional handling of
raw materials
Ley crops
Willow/methanol
M.O.W.
Compost.+diesel
F.I.W.
Compost.+diesel
Manure
Diesel
S-b tops
Diesel
Straw
Diesel
Ley crops
0
Fallow+diesel
Particles (mg particles/MJ kinetic
energy)
0
Ley crops
Willow/methanol
M.O.W.
Compost.+diesel
F.I.W.
Compost.+diesel
Manure
Diesel
S-b tops
Diesel
6
POCP (mg C2H2-eq/MJ kinetic
energy)
AP(gSO2-eq./MJkinetic
energy)
Straw
Diesel
0
S-b tops
Diesel
100
0.5
Straw
Diesel
200
1
Straw
Diesel
300
Reference
system
based on
bioenergy
Ley crops
Fallow+diesel
Reference systems based on diesel
400
Ley crops
Fallow+diesel
GWP (g CO2-eq./MJ kinetic
energy)
500
EP(gPO4-eq./MJkinetic
energy)
P. Börjesson, M. Berglund / Biomass and Bioenergy 31 (2007) 326–344
338
Indirect environmental
effects
Fig. 8. Life-cycle emissions from transportation fuels used in heavy-duty vehicles.
7.1. GWP—losses of methane
Biogas production causes uncontrolled losses of
methane, which are normally of small magnitude in well
functioning biogas systems, but can be significant in
systems with defective technology. Even moderate losses
of CH4 can affect the GWP significantly since CH4 is a
21-times more potent greenhouse gas than CO2. In our
calculations the uncontrolled losses of CH4 are estimated
to be 1% of the biogas produced when used for heat or
combined heat and power production, and 2% when the
biogas is used as a transportation fuel (see Section 4). The
biogas produced in the storage of digestates is reported to
correspond to 5–10%, or even up to 20%, of the total
amount of biogas produced at biogas plants. Recent
measurements of emissions from some Swedish biogas
production plants indicate that the uncontrolled losses of
methane may amount to about 0.5–1% of the total flow of
methane at the plant. Losses of CH4 during upgrading and
pressurisation of the biogas have been reported to typically
correspond to 0.2–2%, in some cases and even up to 13%
of the total amount of gas treated at the upgrading plant.
ARTICLE IN PRESS
P. Börjesson, M. Berglund / Biomass and Bioenergy 31 (2007) 326–344
339
Table 6
The amount of methane that has to be lost from biogas systems to result in an equivalent contribution to the GWP as from the reference systema
Small-scale
boilers (%)
Large-scale
boilers (%)
Microturbine
(%)
Large-scale
turbine (%)
Light-duty
vehicles (%)
Heavy-duty
vehicles (%)
Ley crops
Fossil fuel
Willow
16
15
—
11
11
15
—
11
—
Straw
Fossil fuel
Combustion of straw
15
—
14
—
10
10
14
10
Tops and leaves of sugar beets
Fossil fuel
16
15
11
11
14
11
Manure
Fossil fuel
32
31
28
27
30
27
Food industry waste
Fossil fuel
Combustion of the waste
23
—
19
22
19
Municipal organic waste
Fossil fuel
Combustion of the waste
20
—
16
20
16
a
‘‘—’’ indicates that the emissions of greenhouse gases are higher from the biogas system than from the reference system, even without losses of methane
from the biogas systems.
The degree of losses can be due to the upgrading
technology, the required CH4 content of the upgraded
gas, and occasional uncontrolled leakages [10,27].
The need for biogas for energy purposes might
occasionally be limited, leading to deliberate release of
CH4. For instance, experiences from Sweden show that the
production of biogas may exceed demand by 30% during
the summer season due to limited needs for heat in the
residential sector during this period. The environmental
impact of deliberate release of CH4 can be reduced by
flaring the excess biogas.
The effects of increased losses of CH4 from biogas systems
are shown in Table 6, expressed as the point at which losses
of CH4 cause an equivalent contribution to the GWP as the
reference system. The losses of CH4 may typically amount to
about 10–20% of the biogas produced, or even up to 30%
for manure-based biogas, before the emissions of greenhouse
gases from the biogas systems exceed those from the
reference systems. The emissions of greenhouse gases are
always lower from the biomass-based reference systems than
from the corresponding biogas systems, even without losses
of CH4 from the biogas systems.
7.2. Eutrophication and acidification
The eutrophication and acidification are significantly
affected by the variations in indirect emissions of nitrate
(NO
3 ) to water and ammonia (NH3) to air caused by
changed cropping practices and handling of the wastes and
residues. The assumptions made here about these indirect
emissions are uncertain (see Section 4.2). The actual nitrate
leakage can vary greatly depending on location, and
reliable input data are limited due to the lack of long-term
field trials dedicated to monitor the specific aspects
analysed here. The estimations on the emissions of
ammonia are also uncertain, as the assumptions are based
on limited input data and specific technologies (see Section
4.1.2). For example, the emission of ammonia from
composting may be significantly reduced, by up to 80%,
if the composting facility uses gas-cleaning equipment [18].
On the other hand, defective composting technology
without gas cleaning in combination with a decreased
carbon/nitrogen-ratio in the waste may lead to increased
emission of ammonia (see Fig. 9) [28]. Fig. 9 shows also the
effects on the eutrophication and AP of assuming half or
twice the difference in nitrate leakage, and emissions of
ammonia from tops and leaves of sugar beets, as assumed
in the base case for large-scale heat production.
7.3. Photochemical oxidants and particles
The production phase is normally the main contributor
to the POCP in biogas systems, except when biogas is used
to replace petrol as a transportation fuel in light-duty
vehicles. HC are normally the major contributor to the
POCP, by about 50–70%, whereas the contribution from
CH4 is about 15–40%. Most of the HC are emitted by
tractors and trucks used in the biogas production chain.
However, there are large variations among different types
of tractors as well as between different tractor operations
regarding emissions of hydrocarbons. Concerning the
reference systems, the end-use emissions are normally the
main contributor to the POCP of which HC often stands
for 60–90% of the emissions, except for combustion of
straw where CO is the main contributor. Thus, the
emissions of POCP can be reduced significantly by
ARTICLE IN PRESS
P. Börjesson, M. Berglund / Biomass and Bioenergy 31 (2007) 326–344
0.6
3.5
2.5
2
1.5
1
0.5
0
NO3-
NH3
0.5
0.4
0.3
0.2
0.1
Biogas system
Manure
Conv. storage
S-b tops
Not recovered
Ley crops
Willow
Ley crops
Fallow
M.O.W.
Composting
F.I.W.
Composting
Manure
Conv. storage
S-b tops
Not recovered
Ley crops
Willow
Ley crops
Fallow
M.O.W.
Composting
F.I.W.
Composting
S-b tops
Not recovered
0
S-b tops
Not recovered
3
NO3-
NH3
EP (g PO4-eq./MJ heat)
AP (g SO2-eq./MJ heat)
340
Reference system
Indirect environmental effects
Indirect environmental effects
Fuel-cycle emissions
Fuel-cycle emissions
Fig. 9. Effects on the contribution to the eutrophication and acidification potentials of assuming half or twice the difference in nitrate leakage, and
emissions of ammonia from tops and leaves of sugar beets, as assumed in the base case of large-scale heat production. Corresponding changes in emissions
of ammonia from the composting of organic waste are 80% decrease and 40% increase.
improved end-use and exhaust gas cleaning technologies.
In reference systems including manure, this contributes to
the emissions of CH4 by 35–90% of the POCP. The level of
emission of CH4 from the handling and storage of the
manure thereby significantly influences the contribution to
the POCP in these systems (similar to the GWP discussed
in Section 7.1).
Most of the emissions of particles from biogas systems
normally originate from the production phase. As in the
case of POCP, the life-cycle emissions of particles are
relatively sensitive to assumed emissions from tractors and
trucks used in the biogas production chain. In the reference
systems, the main contributor is normally the end-use,
except for combined heat and power production based on
natural gas. Concerning heavy-duty vehicles using diesel,
for example, up to 90% of the life-cycle emissions of
particles derive from the end-use. The emission levels may
be reduced significantly compared to the state-of-the-art
technology assumed here by improved exhaust gas cleaning
equipment, such as particle filters.
8. Conclusions and discussion
Promotion of biogas systems is here shown to have the
potential to be an effective strategy in combating several of
today’s serious environmental problems, not only climate
change but also eutrophication, acidification and air
pollution. An introduction of biogas systems may lead to
direct benefits such as reduced emissions of air pollutants
when fossil fuels are replaced, but also indirect benefits
from changed land use and handling of organic byproducts. The indirect benefits can be the most important,
for example, the reduced nitrogen leaching and emissions
of ammonia and methane achieved when manure, crop
residues, and organic waste are utilised for biogas
production. However, when biogas systems replace other
bioenergy systems, such as willow or straw for heat or
methanol production, or combustion of organic waste for
heat recovery, the emissions of, for example, greenhouse
gases may increase. Thus, in order to maximise the various
potential benefits, and to minimise potential negative
effects, it is crucial that biogas systems are designed and
located wisely.
This paper shows that the environmental impact of
introducing biogas can vary significantly due to the raw
materials digested, the energy service provided and the
reference systems replaced. This complexity calls for special
attention to the methodology employed, to reach fair and
consistent comparisons, that is, in setting the system
boundaries. For example, the results are affected strongly
by the assumptions made about the need for systems
enlargement to attain equivalent outputs of energy services
and plant nutrients. Another conclusion is that there are
various uncertainties regarding the availability of accurate
input data, assumptions about technologies and geographical conditions. In order to achieve more secure results in
future environmental studies of biogas systems, these need
to be based on data referring to the specific local conditions
valid for the actual biogas system.
Acknowledgement
We gratefully acknowledge the economic support
provided by Göteborg Energi AB.
Appendix
See Tables A1–A6.
ARTICLE IN PRESS
P. Börjesson, M. Berglund / Biomass and Bioenergy 31 (2007) 326–344
341
Table A1
Fuel-cycle emissions from heat production in the reference systemsa
CO2 (g)
CO (mg)
NOx (mg)
SO2 (mg)
HC (mg)
Particles (mg)
CH4 (mg)
Small-scale boiler, fuel oil
End-use
91
Production
7.2
Electricity
(+0.31)
19
3.3
(+0.12)
120
30
(+0.62)
59
12
(0.02)
5.0
4.2
(+0.015)
6.0
1.8
(+0.01)
—
3.9
(0.05)
Small-scale boiler, strawc
End-use
—
Production
1.6
3500
2.3
110
15
8.0
0.65
55
1.1
55
0.23
—
0.006
Large-scale boiler, fuel oild
End-use
84
Production
6.8
Electricity
(+0.29)
17
3.1
(+0.11)
110
28
(+0.58)
200
11
(0.02)
4.0
4.0
(+0.014)
6
1.7
(+0.01)
—
3.7
(0.05)
Large-scale boiler, wood chipse
End-use
—
Production
3.7
330
12
58
37
44
2.3
22
3.0
—
2.9
5.6
—
Large-scale boiler, strawf
End-use
—
Production
1.5
360
1.9
100
14
47
0.59
1.0
0.98
24
0.21
—
0.005
Large-scale boiler, food industry wasteg
End-use
—
33
Production
2.0
0.26
Electricity
(+0.062)
(+0.024)
58
13
(+0.12)
64
1.1
(0)
1.7
1.3
(+0.003)
4.0
1.4
(+0.002)
0.56
0.40
(0.01)
Large-scale boiler, municipal org wasteg
End-use
—
33
Production
4.9
6.0
Electricity
(+0.062)
(+0.024)
58
40
(+0.12)
64
2.1
(0)
1.7
3.8
(+0.003)
4.0
1.8
(+0.002)
0.56
0.40
(0.01)
b
The emissions are expressed per MJ of heat.
a
‘‘End-use’’ refers to the end-use emissions and ‘‘Production’’ to the emissions from the production and distribution of the energy carriers. Emissions
caused by the electricity input have been recalculated to natural gas-based electricity when other sources of electricity have been assumed in the cited
references. These recalculated values are presented in the rows marked ‘‘Electricity’’.
b
The conversion efficiency in oil-fuelled, small-scale boilers (o0.1 MW) is 85%. Data on fuel-cycle emissions are based on [29,30].
c
The conversion efficiency in straw-fuelled, small-scale boilers is 70%. Data on end-use emissions are based on data from [31–34], and data on emissions
from the production on [5,8].
d
The conversion efficiency in oil-fuelled, large-scale boilers (430 MW) is 90%. Data on fuel-cycle emissions are based on [29,35].
e
The conversion efficiency in wood chip-fuelled, large-scale boilers is 90%. Data on fuel-cycle emissions are based on [26,29,35].
f
The conversion efficiency in straw-fuelled, large-scale boilers is 85%. Data on end-use emissions are based on data from [31–34], and data on emissions
from the production on [5,8].
g
The conversion efficiency in organic waste fuelled, large-scale boilers is 90%. Based on data from [29,35].
Table A2
Fuel-cycle emissions from heat and power generation in the reference systemsa
CO2 (g)
CO (mg)
NOx (mg)
SO2 (mg)
HC (mg)
Particles (mg)
CH4 (mg)
Microturbine, NG
End-use
Production
70
5.0
15
7.5
70
25
1.0
1.3
1.0
3.8
1.0
2.5
4.0
13
Large-scale turbine, NGc
End-use
Production
66
4.7
29
7.1
120
24
1.0
1.2
1.0
3.5
1.0
2.4
4.0
12
b
The emissions are expressed per MJ of heat and power.
a
‘‘End-use’’ refers to the end-use emissions and ‘‘Production’’ to the emissions from the production and distribution of the energy carriers. Data on fuelcycle emissions are based on [29,36,37].
b
The overall conversion efficiency in a natural gas-fuelled microturbine is 80%, divided between electricity 30% and heat 50% [38–39]. Microturbines
are assumed to have 50% lower emissions of NOx and CO than large-scale gas turbines [40].
c
The overall conversion efficiency in a natural gas-fuelled, large-scale gas turbine is 85%, divided between electricity 40% and heat 45% [38,39].
ARTICLE IN PRESS
P. Börjesson, M. Berglund / Biomass and Bioenergy 31 (2007) 326–344
342
Table A3
Fuel-cycle emissions from the reference systems for transportationa
CO2 (g)
CO (mg)
NOx (mg)
SO2 (mg)
HC (mg)
Particles (mg)
CH4 (mg)
Light-duty vehicle, petrol
End-use
Production
Electricity
440
34
(+3.1)
1100
13
(+1.2)
210
200
(+6.3)
54
120
(0.2)
160
240
(+0.15)
21
6.0
(+0.1)
41
11
(0.5)
Light-duty, methanolc
End-use
Production
Electricity
65
96
(+55)
3100
120
(+21)
210
370
(+110)
15
44
(4)
210
100
(+2.6)
10
9.3
(+1.8)
—
5.0
(2.0)
Heavy-duty vehicles, dieseld
End-use
Production
Electricity
180
11
(+0.65)
28
5.3
(+0.25)
1800
100
(+1.3)
4.0
47
(0.05)
28
83
(+0.031)
28
2.5
(+0.022)
15
4
(0.1)
Heavy-duty, methanole
End-use
Production
Electricity
—
51
(+31)
28
68
(+12)
830
200
(+61)
—
11
(2.0)
56
29
(+1.5)
5.6
4.3
(+1.0)
—
3
(2.0)
b
The emissions are expressed per MJ of kinetic energy.
a
‘‘End-use’’ refers to the end-use emissions and ‘‘Production’’ to the emissions from the production and distribution of the energy carriers. Emissions
caused by the electricity input have been recalculated to natural gas-based electricity. These recalculated values are presented in the rows marked
‘‘Electricity’’. Fuel-cycle data are based on [26].
b
The conversion efficiency in petrol-fuelled, light-duty vehicles is 17%.
c
The conversion efficiency in methanol-fuelled, light-duty vehicles is 17%. Refers to 85% (volume) of methanol and 15% of petrol.
d
The conversion efficiency in diesel-fuelled, heavy-duty vehicles is 40%.
e
The conversion efficiency in methanol-fuelled, heavy-duty vehicles is 40%.
Table A4
Emissions from additional handling of the raw materials that are not used for energy production purposes in the reference systems
CO2 (kg)
CO (g)
NOx (g)
SO2 (g)
HC (g)
Particles (g)
1.7
1.7
15
0.30
0.53
0.23
21
1.1
1.1
0.23
33
0.21
3.0
0.095
190
10
11
0.79
6.7
0.36
0.03
0.44
16
0.6
0.60
0.50
2.7
0.17
0.17
0.028
a
Spreading
Manure and digested residues
b
Composting
Collecting and transport–MOW
Collecting and transport–FIW
Direct energy consumption
Indirect energy consumption
The emissions are expressed per tonne of raw material.
a
Data on fuel-cycle emissions are based on [33].
b
Data on fuel-cycle emissions are based on [26,33].
Table A5
Energy use and emissions from the production of fertilisersa
Primary energy (MJ/kg)
N
P
45
25
a
Life-cycle emissions, production (per kg N and P)
CO2 (kg)
CO (g)
NOx (g)
SO2 (g)
HC (g)
Particles (g)
CH4 (g)
N2O (g)
3.2
2.9
0.36
4.6
8.0
18
4.6
39
0.18
3.9
0.82
9.5
3.1
7.2
18
0.29
Data on energy use and life-cycle emissions are based on [41].
ARTICLE IN PRESS
P. Börjesson, M. Berglund / Biomass and Bioenergy 31 (2007) 326–344
343
Table A6
Impact category indicators used in this studya
Impact category
indicators
Global warming potential,
GWP 100 (g CO2-eq/g)
CO2
CO
NOx
SO2
HC
Particles
CH4
N2O
NO
3 (to water)
NH3
1
a
Eutrophication
(g PO3
4 -eq/g)
Acidification (g SO2-eq/g)
0.13
0.7
1
Photochemical oxidant
creation potential
(g C2H2-eq/g)
0.032
0.42
21
310
0.007
0.1
0.35
1.88
Data on characterisation indicators are based on [42].
References
[1] Linné M, Jönsson O. Sammanställning och analys av potentialen för
produktion av förnyelsebar metan (biogas och SNG) i Sverige [in
Swedish, Compilation and analysis of the potential for production of
renewable methane (biogas and SNG) in Sweden]. Sweden: Swedish
Gas Centre Malmö; 2004.
[2] Lantz M. Gårdsbaserad produktion av biogas för kraftvärme—
ekonomi och teknik [in Swedish: Farm based biogas production for
combined heat and power production–economy and technology].
Master’s thesis, Environmental and Energy Systems Studies. Lund,
Sweden: Lund University; 2004.
[3] Nordberg Å, Lindberg A, Gruvberger C, Lilja T, Edström M.
Biogaspotential och framtida anläggningar i Sverige [in Swedish:
Biogas potential and future plants in Sweden]. JTI report Kretslopp
& Avfall no 17. Uppsala, Sweden: Swedish Institute of Agricultural
Engineering; 1998.
[4] Börjesson P, Berglund M. Miljöanalys av biogassystem [in Swedish,
Environmental analysis of biogas systems]. Report no 45, Environmental and Energy Systems Studies. Lund, Sweden: Lund University;
2003.
[5] Börjesson P, Berglund M. Environmental systems analysis of biogas
systems—part I: fuel-cycle emissions. Biomass and Bioenergy
2006;30:469–85.
[6] R.V.F. Utvärdering av storskaliga system för kompostering och
rötning av källsorterat bioavfall [in Swedish, Evaluation of large-scale
systems for composting and anaerobic digestion of source sorted
organic waste], vol. 6. Malmö, Sweden: RVF The Swedish Association of Waste Management; 2005.
[7] Berglund M, Börjesson P. Energianalys av biogassystem [in Swedish,
Energy systems analysis of biogas systems]. Report no 44, Environmental and Energy Systems Studies. Lund, Sweden: Lund University;
2003.
[8] Berglund M, Börjesson P. Assessment of energy performance in the
life-cycle of biogas production. Biomass and Bioenergy
2006;30:254–66.
[9] Mattsson N, Unger T, Ekvall T. Effects of perturbations in a
dynamic system—the case of Nordic power production. Journal of
Industrial Ecology, submitted for publication.
[10] The Swedish Association of Waste Management (RVF). Metoder att
mäta och reducera emissioner från system med rötning och
uppgradering av biogas [in Swedish, Methods of measuring and
reducing emissions from anaerobic digestion and upgrading of
biogas]. Report 2005:07, Malmö, Sweden, 2005.
[11] Sundqvist J-O, Baky A, Björklund A, Carlsson M, Eriksson O,
Frostell B, et al. Systemanalys av energiutnyttjande från avfall—
utvärdering av energi, miljö och ekonomi: Fallstudie—Uppsala
[12]
[13]
[14]
[15]
[16]
[17]
[18]
[19]
[20]
[21]
[22]
[in Swedish, Systems analysis of energy recovery from waste—an
evaluation of energy, environment and economy: case study
Uppsala]. IVL report 1380. Stockholm, Sweden: IVL Swedish
Environmental Research Institute Ltd.; 1999.
Sommer SG, Møller HB, Petersen SO. Reduktion af drivhusgasemission fra gylle og organisk affald ved biogasbehandling [in Danish,
The reduction of greenhouse gases from manure and organic waste
using digestion and biogas production]. DJF-rapport no 31. Tjele,
Denmark: Husdyrbrug, Danish Institute of Agricultural Sciences;
2001.
Dustan A. Review of methane and nitrous oxide emission factors for
manure management in cold climates. Report 299. Uppsala, Sweden:
Swedish Institute of Agricultural Engineering (JTI); 2002.
Hillhost MA, de Mol RM. Dynamic model for the methane emission
from manure storage. Paper presented at the sixth international
conference on greenhouse gas control technologies. Kyoto, Japan,
2002.
Nicholson RJ, Webb J, Moore A. A review of the environmental
effects of different livestock manure storage systems, and a suggested
procedure for assigning environmental ratings. Biosystems Engineering 2002;81:363–77.
Sommer S, Petersen S, Sörgard H. Greenhouse gas emission from
stored livestock slurry. Journal of Environmental Quality
2000;29:744–51.
Petersen S. Nitrous oxide emissions from manure and inorganic
fertilisers applied to spring barley. Journal of Environmental Quality
1999;28:1610–8.
Sonesson U. The ORWARE simulation model—compost and
transport sub-models. Report 215, Department of Agricultural
Engineering. Uppsala, Sweden: Swedish University of Agricultural
Sciences; 1996.
Sommer S, Hutchings NJ. Ammonia emission from field applied
manure and its reduction—invited paper. European Journal of
Agronomy 2001;15:1–15.
Christensson K, Linné M. Production of biogas for an improved
nitrogen economy and retention—a cooperation between Skåne
Energy Agency and the VEGOMIL-project. Lund, Sweden:
Energikontoret Skåne; 2000.
Johnsson H, Mårtensson K. Kväveläckage från Svensk åkermark [in
Swedish, Nitrogen leaching from Swedish arable land]. Report 5248.
Stockholm, Sweden: The National Swedish Environmental Protection Agency; 2002.
Hessel K, Aronsson H, Lindén B, Stenberg M, Rydberg T, Gustafson
A. Höstgrödor–fångrödor–utlakning [in Swedish, Winter crops–catch
crops–nutrient leaching]. Eco hydrology, Water Quality Managment,
Department of Soil Sciences, vol. 46. Uppsala, Sweden: Swedish
University of Agricultural Sciences; 1998.
ARTICLE IN PRESS
344
P. Börjesson, M. Berglund / Biomass and Bioenergy 31 (2007) 326–344
[23] Blomqvist J. Flytgödselns kväveeffekt och kväveutlakning i kombination med och utan fånggröda [in Swedish, The effects on nitrogen
supply and leakage from liquid manure fertilization in combination
with and without catch crops]. Borgeby, Sweden: Hushållningssällskapet i Malmöhus län; 1993.
[24] Börjesson P. Environmental effects of energy crop cultivation in
Sweden—part I: identification and quantification. Biomass and
Bioenergy 1999;16:137–54.
[25] Börjesson P. Energy analysis of biomass production and transportation. Biomass and Bioenergy 1996;11:305–18.
[26] Blinge M, Arnäs P-O, Bäckström S, Furnander Å, Hovelius K.
Livscykelanalys (LCA) av drivmedel [in Swedish, Life cycle assessment of transportation fuels]. KFB-report, vol. 5. Stockholm,
Sweden: Swedish Transportation and Communications Research
Board; 1997.
[27] Persson M. Utvärdering av uppgraderingstekniker för biogas [in
Swedish, Evaluation of biogas upgrading technologies]. Rapport
SGC 142. Malmö, Sweden: Swedish Gas Centre; 2003.
[28] Eklind Y. Carbon and nitrogen turnover during composting and
quality of compost products. Doctoral dissertation. Uppsala,
Sweden: Horticultural Research Station, Swedish University of
Agricultural Sciences; 1998.
[29] Uppenberg S, Almemark M, Brandel M, Lindfors L-G, Marcus H-O,
Stripple H, et al. Miljöfaktabok för bränslen—Del 1, Huvudrapport
[in Swedish, Environmental data on fuels—part I]. Report B 1334A2, IVL. Stockholm, Sweden: Swedish Environmental Research
Institute Ltd; 2001.
[30] Gustavsson L, Karlsson Å. A system perspective on heating of
detached houses. Energy Policy 2002;30:553–74.
[31] Praks O. Halmpannor på gårdsnivå [in Swedish, Farm-scale
combustion of straw]. Report 203, Department of Agricultural
Building Technology. Lund, Sweden: Swedish University of Agricultural Sciences; 1993.
[32] Nilsson D. Energy, exergy and emergy analysis of using straw as fuel
in district heating plants. Biomass and Bioenergy 1997;13:63–73.
[33] Hansson P-A, Burström A, Norén O, Bohm M. Bestämning
av motoremissioner från arbetsmaskiner inom jord-och skogsbruk
[34]
[35]
[36]
[37]
[38]
[39]
[40]
[41]
[42]
[in Swedish, Engine emissions from agricultural tractors and
forestry machines]. Report 232, Department of Agricultural Engineering. Uppsala, Sweden: Swedish University of Agricultural
Sciences; 1998.
Nikolaisen L, Nielsen C, Larsen M, Nielsen V, Zielke U, Kristensen
JK, et al. Halm til energiformål [in Danish, Straw for energy
purposes]. Århus, Denmark: Videncenter for Halm- og Flisfyrning;
1998.
Brännström-Nordberg B-M, Münter M, Strömberg P, Wallenius A.
LCA värme: Vattenfalls livscykelanalyser–produktion av värme
[in Swedish, LCA of heat: life cycle inventories from Vattenfall—
the production of heat]. Stockholm, Sweden: Vattenfall, AB;
2001.
The National Swedish Environmental Protection Agency. Kartläggning av dataunderlag för el och drivmedel [in Swedish, Emission data
of electricity and transportation fuels]. Report 4537. Stockholm,
Sweden, 2000.
Environmental Protection Agency (EPA). Emission factor documentation for AP-42 section 3.1 statonary gas turbines. In: Compilation
of air pollutant emission factors, AP-42, 5th ed., vol. I, Stationary
points and area sources. Washington, USA, 2002.
Persson C, Olsson J. Jämförelse mellan olika kraftvärmeteknologier
[in Swedish, A comparison between different technologies for
combined heat and power production]. Report SGC 128. Sweden:
Swedish Gas Centre Malmö; 2002.
ASUE. BHKW-Kenndaten 2001—module, anbieter & kosten.
Arbeitsgemeinschaft fur Sparsamen und Umweltfreunlichen Energieverbrauch e.V, Kaiserslautern, Germany, 2001.
Norén C, Thunell J. Hur bra är energigaserna? [in Swedish, The
perfomance of gases for energy]. Report SGC 116. Malmö, Sweden:
Swedish Gas Centre; 2001.
Davis J, Haglund C. Life cycle inventory (LCI) of fertiliser
production: fertiliser products used in Sweden and Western Europe.
SIK-report 654. Göteborg, Sweden: The Swedish Institute for Food
and Biotechnology; 1999.
Baumann H, Tillman A-M. The hitch hiker’s guide to LCA. Lund,
Sweden: Studentlitteratur; 2004.


© Copyright 2026