
Read the full comments here - Center for Science in the Public Interest
Page 1
May 8, 2015
Richard D. Olson, M.D., M.P.H.
Designated Federal Officer, 2015 Dietary Guidelines Advisory Committee
Office of Disease Prevention and Health Promotion
Office of the Assistant Secretary for Health
U.S. Department of Health and Human Services
1101 Wootton Parkway, Suite LL100
Tower Building
Rockville, MD 20852
Kellie Casavale, Ph.D., R.D.
Deputy Designated Federal Officer, 2015 Dietary Guidelines Advisory Committee
Nutrition Advisor; Office of Disease Prevention and Health Promotion
Office of the Assistant Secretary for Health
U.S. Department of Health and Human Services
1101 Wootton Parkway, Suite LL100
Tower Building
Rockville, MD 20852
Colette I. Rihane, M.S., R.D.
Lead USDA Co-Executive
Secretary, 2015 Dietary Guidelines Advisory Committee
Director, Office of Nutrition Guidance and Analysis
Center for Nutrition Policy and Promotion
U.S. Department of Agriculture
3101 Park Center Drive, Room 1034
Alexandria, VA 22302
Shanthy A. Bowman, Ph.D.
USDA Co-Executive Secretary
Nutritionist, Food Surveys Research Group
Beltsville Human Nutrition Research Center
Agricultural Research Service
U.S. Department of Agriculture
10300 Baltimore Avenue
BARC-West Bldg 005, Room 125
Beltsville, MD 20705–2350
Re: The Dietary Guidelines for Americans, 2015
Dear Dr. Olson, Dr. Casavale, Ms. Rihane, and Dr. Bowman:
The Center for Science in the Public Interest (CSPI) presents these comments on
the expert report prepared for the eighth edition of the Dietary Guidelines for Americans
Page 2
(DGA) by the Dietary Guidelines for Americans Committee (DGAC). Overall, we
strongly support the conclusions and policy recommendations in the report.
CSPI is a non-profit consumer education and advocacy organization that since
1971 has been working to improve the public’s health through better nutrition and food
safety policies. CSPI’s work is supported primarily by its 900,000 subscribers to its
Nutrition Action Healthletter, the nation’s largest-circulation health newsletter. CSPI is
an independent organization that does not accept any government or corporate funding.
Specifically, we make the following points:
A) We strongly support the DGAC’s focus on the broad range of factors, including
policy and environmental approaches, that influence people’s diet and weightrelated behaviors. The final DGA report should continue to reflect these sensible
and science-based changes to our food environment and public policies to support
and facilitate Americans making healthier food and beverage choices across the
lifespan.
B) We commend the DGAC’s attention to a variety of healthy dietary patterns and
the continued emphasis that healthy diets should meet nutrient needs with whole
foods.
C) We have specific views with regard to the following nutrients and food sources:
a. We unequivocally support the DGAC’s recommendations to reduce
consumption of added sugars, including the need for a line on added
sugars on the Nutrition Facts label that includes a percentage of a Daily
Value based on 10 percent of calories or less in a 2,000-calorie diet, and
for amounts expressed in teaspoons as well as grams to maximize
consumer understanding.
b. The DGAC should strongly recommend reducing daily sodium intake to
2,300 milligrams (mg) per day for the general population and to 1,500 mg
per day for at-risk subgroups.
c. We support the DGAC Scientific Report’s conclusion that the Guidelines
should include a recommendation to “lower red and processed meat.”
d. The DGA should continue to advise Americans to replace foods rich in
saturated fat with ones higher in monounsaturated or polyunsaturated fats.
e. The final Dietary Guidelines should advise Americans to limit their
consumption of cholesterol-rich foods (primarily whole eggs and egg
yolks) to lower their risk of heart disease and type 2 diabetes.
f. We concur with the DGAC report that additional measures are needed to
encourage consumption of fruits and vegetables as part of a healthy diet.
g. We support the Report’s emphasis on whole grains as part of a healthful
diet and encourage USDA and HHS to provide clear recommendations to
help people translate this advice into healthier consumption patterns.
D) We support the development of policies, as the DGAC recommends, to promote
water as the primary beverage of choice. We also support public education and
policy changes to encourage access to clean water, including a symbol for water
as part of the graphics for MyPlate.
Page 3
E) We endorse the DGAC’s recognition of sustainability—or food security—as an
essential component of federal dietary guidance.
We strongly urge those tasked with finalizing the Dietary Guidelines to maintain
the emphasis in the DGAC’s report on changing the food environment to improve the
nutritional quality of foods and beverages that are widely available and consumed.
Introduction
As the DGAC’s expert report recognizes, achieving a healthy overall dietary
pattern is more important than any specific food or nutrient. A variety of dietary patterns
are linked to reduced risk of chronic diseases, including cancer and heart disease, and
those diets share many of the same characteristics, including higher intakes of fruits,
vegetables, low- and non-fat dairy foods, fish, poultry, legumes, whole grains, healthy
oils, and lower intakes of added sugars, saturated fat, sodium, and red and processed
meat. We also applaud the report’s continued recommendation that nutrients in the diet
should come from whole foods rather than fortified, processed foods, or supplements.
Moreover, we want to underscore the significance of the report’s
recommendations for policies and environments that support and improve public health.
Despite public reports to the contrary, the basic nutrition advice in the Guidelines has
been largely unchanged for years; what has not yet been altered is the public’s underconsumption of fruits, vegetables, and whole grains, and the over-promotion and
consequent over-consumption of unhealthful foods. To translate the unbiased science in
the expert report into action is not merely a good idea—it is a necessary and critical
corollary to the scientific examination of the evidence in the DGAC’s report and belongs
in the final Guidelines.
Contrary to some criticism, both concern with policy implementation and a
broader view of health is consistent with past Guidelines and reports. In its 2010 report,
the DGAC stated that “all segments of society—from parents to policy makers and
everyone else in between—must now take responsibility and play a leadership role in
creating gradual and steady change to help current and future generations live healthy and
productive lives.” 1 To that end, in this comment in the discussion of added sugars, as
1
In fact, many substantial matters of policy have been addressed in past Guidelines and
Committee reports. These include, in no particular order: the need for physical activity (DG
1980-2010, DGAC 1995-2010); alcohol consumption, warnings against use of driving or
machinery (DG 1980-2010, DGAC 1995-2010); reducing healthcare costs through diet (DGAC
1995); poverty as a barrier to nutritional implementation (DGAC 1995, DGAC/DG 2010); racial
health disparities (DGAC 2005, DGAC/DG 2010); the cost and availability of fruits and
vegetables (DGAC 2005, DGAC/DG 2010); the geographic distribution of fast food and
convenience store versus grocery stores (DGAC/DG 2010); opportunities for safe and enjoyable
outdoor activities (DGAC 2005, DGAC/DG 2010); benefits of plant-based diets (DGAC/DG,
1995, 2000, 2005, 2010); the need to reduce screen time for children (i.e., television, video
games, computer use (DGAC/DG 2010); policies impacting sustainable agriculture and
aquaculture (DGAC/DG 2010); land use policy and zoning policy (DGAC 2010); food safety and
technology (hand sanitation, kitchen cleanliness, temperature control) (DGAC/DG 2000-2010);
Page 4
below, we provide new information on a compelling recent consumer survey we
conducted regarding the inclusion of added sugars on the Nutrition Facts Panel and for
measurements of added sugars in teaspoons as well as grams. The Dietary Guidelines is
a living document that must be given meaning by its impact on policies including the
labeling of foods.
Next, we comment on several specific food groups, foods, and nutrients,
including added sugars, sodium, red and processed meats, saturated fat, fruits and
vegetables, and whole grains. Last in this section, our comments address water as a
primary beverage and sustainability—or, as it might better be understood—food security.
In addition to the critical matters discussed above, we raise five additional
discrete points of concern. In each of these matters, we believe the Committee’s findings
did not reflect a careful reading of the current body of scientific evidence and
incorporating the Committee’s findings in the DGA would be harmful for consumers.
We urge that the final Guidelines more accurately reflect current science on these
questions, and ensure that consumers are aware of risks and potential risks to their health
in these areas.
In particular, for aspartame, methyl mercury exposures, and caffeine, the
Committee’s conclusions reflect a lack of concern for risks to pregnant women and
prenatal exposures. In addition, the Committee’s neglect of the science on the harm from
artificial food dyes to susceptible children should be corrected in the final Guidelines.
The potential for serious and lasting health impacts in these areas impacting highly
vulnerable sub-populations warrants a considerably clearer and more protective approach.
The areas in which we think the Guidelines should provide advice different from
that recommended by the expert report, based on the evidence, include:
1) We support the DGAC’s recommendation for increasing fish consumption, but
disagree with its blanket assessment that the health benefits outweigh the risks
from methylmercury, particularly as concerns the risks of consuming albacore
tuna. Far clearer messages are required to enable consumers—especially
pregnant women—to maximize the benefits of consuming fish while minimizing
risks.
2) The Dietary Guidelines should not state that aspartame is safe, as such a
conclusion is not supported by the evidence, and other scientific authorities are
economic incentives for food manufacturers as barrier for health (DGAC 2010); the need to
increase comprehensive education for health, nutrition and physical education (DGAC 2010 indepth; and included in prior years); improving public/private partnerships for health (DGAC/DG
2010); developing legislation and policies in diverse sectors (public health, retail, transportation,
etc.) (DGAC/DG 2010); and the advisability of limiting food and beverage marketing to children
(DGAC/DG 2010).
Page 5
undertaking more thorough reviews of the safety of aspartame. We are concerned
that aspartame is a carcinogen and also that aspartame may affect reproduction.
3) For clarity of message and to protect public health, we strongly urge that the 2015
Guidelines maintain the definition of “moderate drinking” as a maximum of one
drink a day for women and two drinks a day for men as was recommended in the
2010 Dietary Guidelines.
4) The Committee’s advice to pregnant women on caffeine is incorrect. Even
moderate intake of caffeine during pregnancy appears to be associated with
serious risks, including low birth weight. Moreover, the committee failed to
consider the evidence linking coffee consumption by pregnant women to
childhood leukemia. The advice should be to avoid caffeine in coffee or other
non-de-minimis forms during pregnancy.
5) The Committee failed to consider the safety of artificial food dyes. Yet artificial
food dyes have been demonstrated to negatively impact behavior in susceptible
children and in Europe are generally used only with warning labels. The final
Guidelines should call for individuals and institutions to phase food dyes out of
the diets of children and to emphasize the health value from a rainbow of real
fruits and vegetables instead.
The following sections focus on the major issues raised by the Committee report; our
five specifics concerns are addressed in the final sections of the comment.
A) Policy and Environmental Approaches
We strongly support the DGAC’s focus on the broad range of factors,
including policy and environmental approaches, that influence people’s diet
and weight-related behaviors. The final DGA report should continue to
reflect these sensible and science-based changes to our food environment and
public policies to support and facilitate Americans making healthier food
and beverage choices across the lifespan.
A change to healthier dietary patterns on a broad scale requires a comprehensive,
coordinated system-wide approach that engages all levels of the socio-ecological model.
In particular, policy, environmental, and systems changes must make healthy foods and
beverages more accessible, affordable, and desirable, while making less healthy foods
less accessible, affordable, and desirable, particularly for at-risk populations. This
approach to improving diet, promoting health, and reducing diet-related chronic disease
through changing the policies and environments where youth and adults spend the
majority of their time has been promoted by numerous public health authorities,
including the Centers for Disease Control and Prevention, 2 Community Preventive
2
Keener, D., Goodman, K., Lowry, A., Zaro, S., & Khan, L. K. (2009). Recommended
Community Strategies and Measurements to Prevent Obesity in the United States:
Implementation and Measurement Guide. Centers for Disease Control and Prevention.
Page 6
Services Task Force, 3 Institute of Medicine, 4 President’s Cancer Panel, 5 and now the
2015 DGAC.
In addition, education and promotion campaigns and initiatives should be
considered as important complements to policy and environmental changes. Such “wrap
around” efforts increase the likelihood that policy, systems, and environmental changes
will result in positive habits. However, educational interventions by themselves are less
likely to be successful if the surrounding environment does not easily enable the behavior
change. Policy, systems, and environmental changes can also be used to influence
physical activity opportunities and choices and reduce sedentary behavior.
We support the DGAC’s use of the socio-ecological model and recognition that
individual diet, physical activity, and weight management behaviors are influenced by
individual biological, household, community, societal, and cultural factors, we well as
public and private policies, systems, and environments. We are pleased that the DGAC
found at least promising, and many times much stronger, evidence that multi-component
obesity prevention approaches in child care settings, schools, and worksites improve
weight-related outcomes and that the committee found moderate-to-strong evidence that
school and worksite policies improve diet outcomes. The fact that the DGAC found that
multi-component interventions that addressed both diet and physical activity and used a
variety of strategies were most likely to be successful in preventing obesity points to the
need for a multi-component, collaborative, and sustainable approach.
Specific Policy and Environmental Change Recommendations
We strongly support many of the actions for communities and populations
recommended by the DGAC and urge the DGA to include and expand upon these
recommendations. We recommend that the DGA states the following recommendations:
•
•
•
3
Make healthy lifestyles and chronic disease prevention a national and local
priority, and incentivize collaborations by multiple sectors of influence at
all levels that promote individual healthy lifestyle behavior change and
create a “culture of health;”
Integrate prevention within the health care system and provide incentives
and support for preventive lifestyle screening, referral, interventions, and
services;
Model prevention and create cultures of health within health care settings;
Community Preventive Services Task Force. (2014). Obesity Prevention and Control:
Interventions in Community Settings. The Guide to Community Preventive Services. Available at
http://www.thecommunityguide.org/obesity/communitysettings.html. Accessed March 11, 2015.
4
Sanchez, E., Burns, A. C., & Parker, L. (Eds.). (2009). Local government actions to prevent
childhood obesity. National Academies Press.
5
Reuben, S.H. & The President’s Cancer Panel. (August 2007). Promoting Healthy Lifestyles:
Policy, Program, and Personal Recommendations for Reducing Cancer Risk. Available at
http://deainfo.nci.nih.gov/advisory/pcp/annualReports/pcp07rpt/pcp07rpt.pdf. Accessed March
11, 2015.
Page 7
•
•
•
•
•
•
•
•
•
•
Make healthy foods accessible and affordable;
Limit access to high-calorie, nutrient-poor foods and sugar-sweetened
beverages in public places;
Encourage healthy eating and physical activity in child care and education
settings;
Within schools, maintain comprehensive school meal guidelines that
increase intake of vegetables without added salt, fruits without added
sugars, and whole grains and limit sodium, added sugars, saturated fat, and
trans fats; make drinking water freely available throughout the day;
prohibit marketing of unhealthy foods; eliminate all sugar-sweetened
beverages, including mid-calorie drinks;
Implement Nutrition Facts and Front-of-Package labels that help
consumers make healthy choices and, on the Nutrition Facts label, provide
added sugar amounts in grams and teaspoons as well as a percentage daily
value;
Align nutrition policies, agriculture policies, and food assistance programs
with the DGA and transform the food system to promote population
health;
Reduce added sugars through measures like pricing/taxes of sugar drinks,
and reduce sodium content in foods through regulatory limits;
Expand access to and use of healthy built environments and make physical
activity accessible, affordable, and safe;
Promote a sustainable and safe food supply to ensure long-term food
security;
Encourage consumer behavior consistent with food safety principles to
prevent foodborne illness.
A Call to Action
We strongly recommend that the DGA prominently feature the DGAC’s
recommendations for policies and environments that support and promote healthy diets
and lifestyles. The DGA should emphasize the important role that the food environment
and public policies play in the ability of Americans to follow the DGA’s
recommendations. The DGA should include a call to action for a wide range of
stakeholders—including policy-makers at all levels of government, public health experts,
the food and beverage industry, restaurants and food retailers, media companies, schools,
businesses, community-based organizations, and others—to make healthy lifestyles and
disease prevention top priorities.
Those and other sectors all have a role to play in promoting healthy behaviors and
creating environments that promote a healthy way of life. The key stakeholders must
become champions for a healthy diet and lifestyle and work in partnership across sectors
to change policies and environments that make eating healthy foods and beverages and
maintaining a healthy weight not just easier, but the cultural norm. Many of the
recommended population-level strategies involve changes in federal policies, and the
federal government must move forward with making evidence-based changes in policies
Page 8
and practices. The federal government should also encourage and incentivize policy
changes at other levels of government and in the private sector that promote healthy
environments and behaviors.
B) Dietary Patterns
We commend the DGAC’s recognition of a variety of healthy dietary
patterns and the continued emphasis that healthy diets meet nutrient needs
with whole foods.
We applaud the DGAC’s focus on overall dietary patterns and the common
characteristics of healthy diets. We further support the DGAC’s assessment that the
overall body of evidence identifies a healthy dietary pattern as one that is:
•
•
•
•
higher in fruits, vegetables, whole grains, low or non-fat dairy, seafood, legumes,
and nuts;
moderate in alcohol, among those who choose to drink, except for children and
other individuals for whom alcohol consumption is not recommended;
lower in red and processed meats; and
low in sugar-sweetened foods and drinks and refined grains.
Because individuals may have difficulty piecing together individual aspects of
dietary recommendations, and may find certain diets easier to follow than others, the new
guidelines should include several dietary patterns 6 as acceptable models of healthy
dietary behavior. The 2015 DGA should include these findings in the recommendations
and emphasize the importance of consuming an overall healthy dietary pattern, because
the combination of healthy dietary habits has more impact on lowering disease risk than
any one specific nutrient or food.
Research participants randomized to healthy diet patterns had a lowering of blood
pressure, 7 and a lower number of cardiovascular events, 8 compared to participants
following standard diets. Additionally, individuals in prospective cohort studies with
higher diet scores representing healthy diet patterns are less likely to be overweight or
obese, 9 have lower risk of major chronic diseases, including diabetes, cardiovascular
6
Healthy Eating Index (HEI)-2005), an “alternate” HEI-2010 based on the Harvard Food
Pyramid, the Dietary Approaches to Stop Hypertension (DASH) diet, and the Mediterranean diet
(and alternative scores adapted for non-Mediterranean countries).
7
Appel, L. J., Moore, T. J., Obarzanek, E., Vollmer, W. M., Svetkey, L. P., Sacks, F. M., et al.
(1997). A clinical trial of the effects of dietary patterns on blood pressure. New England Journal
of Medicine, 336 (16), 1117-1124.
8
Estruch, R., Ros, E., Salas-Salvadó, J., Covas, M. I., Corella, D., Arós, F., et al. (2013). Primary
prevention of cardiovascular disease with a Mediterranean diet. New England Journal of
Medicine, 368 (14), 1279-1290.
9
Vergnaud, A. C., Romaguera, D., Peeters, P. H., van Gils, C. H., Chan, D. S., Romieu, I., et al.
(2013). Adherence to the World Cancer Research Fund/American Institute for Cancer Research
guidelines and risk of death in Europe: results from the European Prospective Investigation into
Page 9
disease, and cancer, 10 and have a lower risk of premature death. 11 The patterns most
well-studied include those recommended by the 2005 Dietary Guidelines for Americans:
Healthy Eating Index (HEI)-2005; an “alternate” HEI-2010 based on the Harvard Food
Pyramid; the Dietary Approaches to Stop Hypertension (DASH) diet; and the
Mediterranean diet (and alternative scores adapted for non-Mediterranean countries).
Furthermore, clinical trials have demonstrated that the DASH and OmniHeart diets lower
blood pressure and LDL (“bad”) cholesterol. 12
Each of the recommended dietary patterns shares many of the same core elements
identified by the DGAC, namely higher intakes of fruits, vegetables, low-fat dairy foods,
fish, poultry, beans, nuts, whole grains, healthy oils (providing more monounsaturated
and polyunsaturated fats), and lower intakes of added sugars, sodium, and red and
processed meats.
Nutrition and Cancer cohort study. The American Journal of Clinical Nutrition, 97 (5), 11071120; Boggs, D. A., Rosenberg, L., Rodríguez-Bernal, C. L., & Palmer, J. R. (2013). Long-term
diet quality is associated with lower obesity risk in young African American women with normal
BMI at baseline. The Journal of Nutrition, 143 (10), 1636-1641; Romaguera, D., Norat, T.,
Vergnaud, A. C., Mouw, T., May, A. M., Agudo, A., et al. (2010). Mediterranean dietary patterns
and prospective weight change in participants of the EPIC-PANACEA project. The American
Journal of Clinical Nutrition, 92 (4), 912-921.
10
World Cancer Research Fund/American Institute for Cancer Research. (2007). Food, Nutrition,
Physical Activity, and the Prevention of Cancer: a Global Perspective. Washington DC: AICR;
Thomson, C. A., McCullough, M. L., Wertheim, B. C., Chlebowski, R. T., Martinez, M. E.,
Stefanick, M. L., et al. (2014). Nutrition and physical activity cancer prevention guidelines,
cancer risk, and mortality in the women's health initiative. Cancer Prevention Research, 7 (1),
42-53; Kabat, G. C., Matthews, C. E., Kamensky, V., Hollenbeck, A. R., & Rohan, T. E. (2015).
Adherence to cancer prevention guidelines and cancer incidence, cancer mortality, and total
mortality: a prospective cohort study. The American Journal of Clinical Nutrition, ajcn-094854;
Chiuve, S. E., Fung, T. T., Rimm, E. B., Hu, F. B., McCullough, M. L., Wang, M., et al. (2012).
Alternative dietary indices both strongly predict risk of chronic disease. The Journal of Nutrition,
jn-111; Sofi, F., Abbate, R., Gensini, G. F., & Casini, A. (2010). Accruing evidence on benefits
of adherence to the Mediterranean diet on health: an updated systematic review and metaanalysis. The American Journal of Clinical Nutrition, 92 (5), 1189-1196.
11
Liese, A. D., Krebs-Smith, S. M., Subar, A. F., George, S. M., Harmon, B. E., Neuhouser, M.
L., et al. (2015). The Dietary Patterns Methods Project: Synthesis of Findings across Cohorts and
Relevance to Dietary Guidance. The Journal of Nutrition, jn-114; McCullough, M. L., Patel, A.
V., Kushi, L. H., Patel, R., Willett, W. C., Doyle, C., et al. (2011). Following cancer prevention
guidelines reduces risk of cancer, cardiovascular disease, and all-cause mortality. Cancer
Epidemiology Biomarkers & Prevention, 20 (6), 1089-1097; Liese, A. D., Krebs-Smith, S. M.,
Subar, A. F., George, S. M., Harmon, B. E., Neuhouser, M. L., et al. (2015). The Dietary Patterns
Methods Project: Synthesis of Findings across Cohorts and Relevance to Dietary Guidance. The
Journal of Nutrition, jn-114.
12
Appel, L. J., Sacks, F. M., Carey, V. J., Obarzanek, E., Swain, J. F., Miller, E. R., et al. (2005).
Effects of protein, monounsaturated fat, and carbohydrate intake on blood pressure and serum
lipids: results of the OmniHeart randomized trial. JAMA, 294 (19), 2455-2464; Appel et al, 1997.
Page 10
Both the American Institute for Cancer Research (AICR)’s Recommendations for
Cancer Prevention 13 and the American Cancer Society’s guidelines on nutrition and
physical activity for cancer prevention 14 call for consuming an overall healthy diet with
an emphasis on plant foods, and overlap considerably with the DGAC recommendations
and the other die patterns highlighted above. That overall pattern specifically focuses on
vegetables, fruits, whole grains, limiting processed and red meat consumption, limiting
sugar-sweetened beverages, and choosing foods and beverages in amounts to help
achieve and maintain a healthy body weight. Both organizations’ guidelines have been
examined in relation to cancer incidence 15 and mortality; 16 significant reductions in risk
were observed with greater adherence to all of the guidelines (diet, alcohol, physical
activity, obesity) as well as the diet pattern, specifically. Research has confirmed that
nonsmoking (former and never smoker) adult men and women whose lifestyles were
most consistent with American Cancer Society (ACS) cancer prevention guidelines for
weight control, diet, physical activity, and alcohol had a significantly lower risk of dying
from cancer, cardiovascular disease, or any cause. 17
We agree with the DGAC report that the DGA should continue to recommend
that nutrient needs be met primarily by consuming nutrient-dense, whole foods as part of
an overall healthy dietary pattern. This approach is consistent with recommendations
from the Institute of Medicine, 18 American Cancer Society, 19 American Institute for
Cancer Research, 20 and others, and research showing that the nutrient density and overall
healthfulness of fruits, vegetables, whole grains, and low-fat dairy products cannot be
duplicated by simply adding vitamins or minerals to nutrient-poor foods. The American
Cancer Society’s Nutrition and Physical Activity Guidelines for Cancer Prevention notes,
“it is likely that foods and nutrients have additive or synergistic effects on health and
interact in complex ways that are difficult to study and are poorly understood.” 21
Similarly, the American Institute for Cancer Research’s Recommendations for Cancer
Prevention are “base[d]…on foods and whole diets rather than specific nutrients…The
recommendations contribute to whole diets and overall level of physical activity most
likely to prevent cancer. This does not imply one particular diet, or a specific form of
13
WCRF/AICR, 2007.
Kushi, L. H., Doyle, C., McCullough, M., Rock, C. L., Demark‐Wahnefried, W., Bandera, E.
V., et al. (2012). American Cancer Society guidelines on nutrition and physical activity for cancer
prevention. CA: A Cancer Journal for Clinicians, 62 (1), 30-67.
15
Vergnaud et al., 2014; Thomson, 2014; Kabat, G. C., Matthews, C. E., Kamensky, V.,
Hollenbeck, A. R., & Rohan, T. E. (2015). Adherence to cancer prevention guidelines and cancer
incidence, cancer mortality, and total mortality: a prospective cohort study. The American
Journal of Clinical Nutrition, ajcn-094854.
16
Romaguera et al., 2010; Thomson, 2014; McCullough et al., 2011.
17
McCullough et al., 2011.
18
Stallings, V. A., & Yaktine, A. L. (Eds.). (2007). Nutrition standards for foods in schools:
leading the way toward healthier youth. National Academies Press.
19
Kushi et al., 2012.
20
WCRF/AICR, 2007.
21
Kushi et al., 2012.
14
Page 11
physical activity, but rather key elements designed to be incorporated into existing and
traditional diets.” 22
We support the DGAC’s recommendations that most Americans should rely on
healthy diets, not vitamin or mineral supplements, to lower their risk of cancer, heart
disease, and other illness. Clinical trials have found that folic acid can lower the risk of
neural tube birth defects, 23 calcium supplements lower the risk of recurrent colorectal
adenomas, 24 a low-dose multivitamin and mineral supplement may lower the risk of all
cancers combined in men, 25 and folic acid can lower the risk of stroke in China, where
grains are not fortified with folic acid. 26 However, other clinical trials have found that
several nutrients, including beta-carotene, selenium, and vitamin E, do not lower, and
may even increase, cancer risk. 27 The majority of the evidence does not suggest that
individuals should take single or combined dietary supplements for prevention of cancer
or cardiovascular disease. 28
Another benefit of a focus in the DGA on overall healthy dietary patterns is that it
allows individuals to consume a wide range of foods and beverages and meet nutrient
needs in a variety of ways. This makes it easier for individuals to consume a healthful
diet that is tailored to their individual physical needs and social and cultural preferences
but still meets the overarching recommendations for a healthy dietary pattern. The DGA
should provide several examples of specific diets that meet the overarching healthy diet
pattern recommendations.
22
WCRF/AICR, 2007.
Williams, J., Mai, C. T., Mulinare, J., Isenburg, J., Flood, T. J., Ethen, M., et al. (2015).
Updated Estimates of Neural Tube Defects Prevented by Mandatory Folic Acid Fortification—
United States, 1995–2011. MMWR. Morbidity and mortality weekly report, 64 (1), 1-5.
24
Grau, M. V., Baron, J. A., Sandler, R. S., Wallace, K., Haile, R. W., Church, T. R., et al.
(2007). Prolonged effect of calcium supplementation on risk of colorectal adenomas in a
randomized trial. Journal of the National Cancer Institute, 99 (2), 129-136.
25
Gaziano, J. M., Sesso, H. D., Christen, W. G., Bubes, V., Smith, J. P., MacFadyen, J., et al.
(2012). Multivitamins in the prevention of cancer in men: the Physicians' Health Study II
randomized controlled trial. JAMA, 308 (18), 1871-1880.
26
Huo, Y., Li, J., Qin, X., Huang, Y., Wang, X., Gottesman, R. F., et al. (2015). Efficacy of folic
acid therapy in primary prevention of stroke among adults with hypertension in China: the
CSPPT randomized clinical trial. JAMA,313(13), 1325-1335.
27
Kushi et al., 2012; Bjelakovic, G., Nikolova, D., Gluud, L. L., Simonetti, R. G., & Gluud, C.
(2012). Antioxidant supplements for prevention of mortality in healthy participants and patients
with various diseases. The Cochrane Library; Klein, E. A., Thompson, I. M., Tangen, C. M.,
Crowley, J. J., Lucia, M. S., Goodman, P. J., et al. (2011). Vitamin E and the risk of prostate
cancer: the Selenium and Vitamin E Cancer Prevention Trial (SELECT). JAMA, 306 (14), 15491556.
28
Fortmann, S. P., Burda, B. U., Senger, C. A., Lin, J. S., Beil, T. L., O’Connor, E., & Whitlock,
E. P. (2013). Vitamin, mineral, and multivitamin supplements for the primary prevention of
cardiovascular disease and cancer: A systematic evidence review for the US preventive services
task force. Evidence Syntheses (108).
23
Page 12
C) We have specific views with regard to the following components of the diet:
added sugars, sodium, red and processed meats, saturated fat, fruits and
vegetables, and whole grains.
a. Added Sugars
We unequivocally support the DGAC’s recommendations to reduce
consumption of added sugars, including the need for a line on added
sugars on the Nutrition Facts label that includes a percentage of a
Daily Value based on 10 percent of calories or less in a 2,000-calorie
diet, and for amounts expressed in teaspoons as well as grams to
maximize consumer understanding.
First, we concur that the scientific evidence underscoring concerns with added
sugars in the diet is strong. With regard to high consumption of added sugars, the DGAC
concluded that there was “strong evidence” for an increased risk of excess body weight,
obesity, and type 2 diabetes and “moderate evidence” for an increased risk of
hypertension, stroke, coronary heart disease, high blood pressure, serum triglycerides,
and dental caries. After reviewing the evidence, the Committee found that “strong
evidence supports reducing added sugars intake to reduce health risks” and that a limit on
“added sugars to a maximum of 10 percent of total daily caloric intake” was supported by
the food pattern modeling analysis and the scientific evidence review on added sugar and
chronic disease risk. 29 By that 10 percent standard, an individual who consumes a 2,000calorie diet could consume up to 200 calories’ worth (50 grams, 12 teaspoons) of added
sugars. 30
Convincing evidence from randomized trials suggests that drinking sugarsweetened beverages, the largest source of added sugars in Americans’ diets, leads to
weight gain in both children and adults. 31 Sugar-sweetened beverages are also associated
with cardiovascular disease, type 2 diabetes, the metabolic syndrome, gout, and dental
caries. 32 Recent clinical studies have found that high intakes of fructose-containing
29
Science Based Chapter, Cross-cutting Topics of Public Health Importance, 2015 DGAC slides.
See also Scientific Report of the Dietary Guidelines Advisory Committee, 2015, Part D. Chapter
6, at 20.
30
World Health Organization. (2003). Diet, nutrition and the prevention of chronic diseases.
WHO technical report series (916) 1-60.
31
Te Morenga, L., Mallard, S., & Mann, J. (2013). Dietary sugars and body weight: systematic
review and meta-analyses of randomised controlled trials and cohort studies. BMJ, 346, e7492; de
Ruyter, J. C., Olthof, M. R., Seidell, J. C., & Katan, M. B. (2012). A trial of sugar-free or sugarsweetened beverages and body weight in children. New England Journal of Medicine, 367 (15),
1397-1406.
32
Malik, V. S., Popkin, B. M., Bray, G. A., Després, J. P., & Hu, F. B. (2010). Sugar-sweetened
beverages, obesity, type 2 diabetes mellitus, and cardiovascular disease risk. Circulation, 121
(11), 1356-1364; Malik, V. S., Popkin, B. M., Bray, G. A., Després, J. P., Willett, W. C., & Hu,
F. B. (2010). Sugar-sweetened beverages and risk of metabolic syndrome and type 2 diabetes A
meta-analysis. Diabetes care, 33 (11), 2477-2483; Choi, H. K., & Curhan, G. (2008). Soft drinks,
Page 13
sugars raise levels of triglycerides, visceral fat, liver fat, blood glucose, insulin, and
small, dense LDL-cholesterol. 33 Moreover, the higher diets are in added sugars (with no
apparent threshold), the lower they are in a variety of vitamins and minerals. 34
A recent prospective study of more than 11,000 people in the National Health and
Nutrition Examination Survey (NHANES) III—a nationally representative sample of
Americans—followed for 15 years found higher risks of cardiovascular mortality with
increasing added-sugars consumption. Those who consumed at least 10 percent but less
than 25 percent of their calories from added sugars had a 30 percent higher risk of dying
of a heart attack, stroke, or other cardiovascular event than those who consumed less than
10 percent of their calories from added sugars. The risk was nearly three times higher for
those who consumed at least 25 percent of their calories from added sugars (more than 10
percent of the study population). 35
A recent clinical study provides further support for these findings. Researchers
fed 85 adults aged 18 to 40 beverages sweetened with enough high-fructose corn syrup to
supply 0, 10, 17.5, or 25 percent of their calories for two weeks. (On average, adults
aged 20 to 60 get about 14 percent of their calories from HFCS, table sugar, and other
added sugars.) The higher the dose, the higher the subjects’ fasting LDL cholesterol,
after-meal triglycerides, and uric acid levels. (High uric acid levels are linked to a higher
risk of gout.) “The dose-dependent increases of these risk factors for CVD, which were
shown to be statistically independent of body weight gain, provide a plausible
fructose consumption, and the risk of gout in men: prospective cohort study. BMJ, 336 (7639),
309-312; Touger-Decker, R., & Van Loveren, C. (2003). Sugars and dental caries. The American
Journal of Clinical Nutrition, 78 (4), 881S-892S.
33
Stanhope, K. L., Schwarz, J. M., Keim, N. L., Griffen, S. C., Bremer, A. A., Graham, J. L., et
al. (2009). Consuming fructose-sweetened, not glucose-sweetened, beverages increases visceral
adiposity and lipids and decreases insulin sensitivity in overweight/obese humans. The Journal of
Clinical Investigation, 119 (5), 1322; Stanhope, K. L., Bremer, A. A., Medici, V., Nakajima, K.,
Ito, Y., Nakano, T., et al. (2011). Consumption of fructose and high fructose corn syrup increase
postprandial triglycerides, LDL-cholesterol, and apolipoprotein-B in young men and women. The
Journal of Clinical Endocrinology & Metabolism, 96 (10), E1596-E1605; Maersk, M., Belza, A.,
Stødkilde-Jørgensen, H., Ringgaard, S., Chabanova, E., Thomsen, H., et al. (2012). Sucrosesweetened beverages increase fat storage in the liver, muscle, and visceral fat depot: a 6-mo
randomized intervention study. The American Journal of Clinical Nutrition, 95 (2), 283-289.
34
Marriott, B. P., Olsho, L., Hadden, L., & Connor, P. (2010). Intake of added sugars and
selected nutrients in the United States, National Health and Nutrition Examination Survey
(NHANES) 2003–2006. Critical Reviews in Food Science and Nutrition, 50 (3), 228-258.
35
Yang, Q., Zhang, Z., Gregg, E. W., Flanders, W. D., Merritt, R., & Hu, F. B. (2014). Added
sugar intake and cardiovascular diseases mortality among US adults. JAMA Internal Medicine,
174 (4), 516-524. (We note that the findings were remarkably robust, as they were “largely
consistent across age group, sex, race/ethnicity (except among non-Hispanic blacks), educational
attainment, physical activity, health eating index, and body mass index.”).
Page 14
mechanistic support for the recent epidemiologic findings that there is increased risk of
CVD mortality with increased intake of added sugar across quintiles,” note the authors. 36
In 2003–2006, added sugars (sugar, high-fructose corn syrup, etc.) provided about
14 percent of total calories for the average American, and 25 percent or more of calories
for over 36 million Americans. 37 According to data from the National Health and
Nutrition Examination Survey (NHANES) 2007–2008 and the U.S. Department of
Agriculture’s (USDA) average per-capita loss-adjusted food availability data for 2012,
Americans consumed between 18 and 23 teaspoons (about 300 to 390 calories worth) of
added sugars per day, though consumption has declined modestly (about 15 percent) in
the last 15 years. 38 Consuming foods high in added sugars makes it more difficult to
meet nutrient needs and stay within calorie limits. In contrast, foods high in natural
sugars, such as fruits and dairy products, are often high in other nutrients.
While we support the DGAC’s recommendation for consuming no more than
10 percent of calories from added sugars, and believe that that could form an adequate
basis for FDA to include a percent DV for added sugars on the labels of packaged foods,
we believe that a lower recommendation would also be appropriate. Specifically,
Americans should get no more than five to ten percent of their calories from added
sugars. That recommendation would align the DGA with recommendations from the
World Health Organization and the American Heart Association (AHA). 39 Such sciencebased recommendations and guidelines to reduce added sugar intake have existed for
years:
•
36
In 1999, the Center for Science in the Public Interest (CSPI), along with leading
health experts and organizations, petitioned the FDA to adopt a DV of 10
teaspoons, or 42 grams, for added sugars (168 calories or about 8 percent of a
Stanhope, K. L., Medici, V., Bremer, A. A., Lee, V., Lam, H. D., Nunez, M. V., et al. (2015). A
dose-response study of consuming high-fructose corn syrup–sweetened beverages on
lipid/lipoprotein risk factors for cardiovascular disease in young adults. The American journal of
clinical nutrition, ajcn100461. These results may differ from those of other studies or metaanalyses (often funded by industry) because some studies used sucrose as a control, did not
measure postprandial triglycerides at their peak (after dinner), restricted calories, or for other
reasons that are described in the Supplemental Discussion in the “Supplemental data” link in the
online article.
37
Marriott et al., 2010.
38
Welsh, J. A., Sharma, A. J., Grellinger, L., & Vos, M. B. (2011). Consumption of added sugars
is decreasing in the United States. The American Journal of Clinical Nutrition, 94 (3), 726-734;
U.S. Department of Agriculture, Economic Research Service. (2014). Food Availability (Per
Capita) Data System. Available at http://www.ers.usda.gov/data-products/food-availability%28per-capita%29-data-system.aspx. Accessed March 20, 2015.
39
World Health Organization. (2015). Guideline: Sugars intake for adults and children. Geneva;
Johnson, R. K., Appel, L. J., Brands, M., Howard, B. V., Lefevre, M., Lustig, R. H., et al. (2009).
Dietary sugars intake and cardiovascular health: a scientific statement from the American Heart
Association. Circulation, 120 (11), 1011-1020.
Page 15
2,000-calorie diet). 40 That was based on the U.S. Department of Agriculture’s
(USDA) recommendation that people consuming a 2,000-calorie diet limit their
consumption of added sugars to 10 teaspoons per day (8.4 percent of calories). 41
40
•
In 2003, the World Health Organization (WHO) recommended that individuals
consume less than 10 percent of their calories from “free” sugars. That includes
added sugars and the “free” sugars in fruit juices, honey, and syrups, so the
percentage of calories from added sugars would be less than 10 percent.
•
In 2005, the DGA recommended quantitative limits for added sugars combined
with solid fats based on the discretionary calorie allowance for each level of
calorie intake. 42 For example, after lower-calorie, nutrient-dense foods in each
food group were selected, someone consuming a 2,000-calorie diet would have up
to 267 discretionary calories to expend on solid fats and added sugars (assuming
no alcohol, which is not the case for many U.S. adults). Dividing those calories
equally between solid fats and added sugars, a reasonable and realistic
recommendation, would mean that no more than 133 calories (33 grams or
8 teaspoons) per day should come from added sugars. That would amount to
6 percent of calories in a 2,000-calorie diet.
•
In 2009, the American Heart Association (AHA) recommended that women and
men consume no more than 100 calories (25 grams) or 150 calories (37.5 grams)
per day from added sugars, respectively. That is equivalent to roughly 6 percent
of total calories (based on intakes of 1,800 calories for women and 2,200 for
men. 43 The AHA recommendation was based on amounts of discretionary
calories for added sugars and solid fats detailed in the appendices of previous
versions of the DGA.
•
In 2015, the WHO, following a comprehensive review of the science, published
an evidence-informed guideline that provides two strong recommendations: 1) “a
reduced intake of free sugars throughout the life course;” 2) “reducing intake of
free sugars to less than 10 percent of total energy intake.” 44 The WHO also made
Center for Science in the Public Interest. (August 3, 1999). Petition to the FDA to Require
Better Sugar Labeling on Foods. Available at www.cspinet.org/reports/sugar/sugarpet1.pdf.
Accessed April 23, 2015.
41
U.S. Department of Agriculture, Center for Nutrition Policy and Promotion. (1996). The Food
Guide Pyramid. Home and Garden Bulletin, 252. Available at
http://www.cnpp.usda.gov/sites/default/files/archived_projects/FGPPamphlet.pdf. Accessed
March 20, 2015.
42
U.S. Department of Agriculture and U.S. Department of Health and Human Services. (2005).
Dietary Guidelines for Americans, 2005. 6th Edition, Washington, DC.
43
Johnson, R. K., Appel, L. J., Brands, M., Howard, B. V., Lefevre, M., Lustig, R. H., et al.
(2009). Dietary sugars intake and cardiovascular health a scientific statement from the American
Heart Association. Circulation, 120 (11), 1011-1020.
44
World Health Organization. (2015). Guideline: Sugars intake for adults and children. Geneva.
Page 16
a conditional recommendation for an even lower sugar intake, to “below 5
percent.”
A quantitative recommendation for added sugars must be included in the main
body (and not just an appendix) of the DGA, as it has important implications for national
programs and policies, including school meals, snacks and drinks in schools, and food
labeling.
Policy Recommendations to Reduce Added Sugars Consumption
We also support the policy implications of the DGAC’s conclusions on the need
for policies that address over-consumption of added sugars. They are on-point and sorely
needed. Specifically, we agree that the DGA should endorse policies that would
discourage excessive consumption of added sugars, and reduce consumption of sugarsweetened beverages, including the following:
•
•
•
•
•
•
Revising the Nutrition Facts label to have a line for added sugars, with
amounts expressed in both grams and teaspoons, along with a percent DV;
Economic and pricing approaches, including incentives and disincentives;
Continued efforts to reduce added sugars in foods and beverages in school
meals and snacks;
Limiting the presence and advertising of foods and beverages high in
added sugars to young children, youth, and adolescents;
Health promotion efforts and policies to reduce the availability of sugarsweetened beverages in post-secondary institutions and worksites;
Public education campaigns to raise public awareness of health harms of
and alternatives to added sugars.
All of those policies are an appropriate response to decades of food marketing and
promotion, lobbying, and attempted influence over health research findings by sugar
interests. 45 Connecting dietary advice to consumption patterns is critical to achieving
public health improvements.
The Risks of Consuming Sugar-Sweetened Beverages Also Should Be Addressed
Sugar-sweetened beverages, including soda pop, fruit drinks, energy drinks,
sports drinks, juices and sweet teas, are the largest source of calories in Americans’
45
See, e.g., Union of Concerned Scientists. (June 2014). Added Sugar, Subtracted Science; Union
of Concerned Scientists. (May 2014). Sugar-Coating Science.
Page 17
diets. 46 Although consumption has slowly been declining, 47 Americans are still
consuming far more sugar drinks than is healthy. The National Health and Nutrition
Examination Survey (NHANES) 2005–2008 found that about half the U.S. population
consumes sugar drinks on any given day. Males and females aged 12 to 19 consume an
average of 273 and 171 total calories per day from sugar drinks, respectively. 48 That is
more than any other age group.
Soft drinks are the only beverage/food that has been directly linked to obesity, in
large part due to the large volumes consumed, the large amounts of added sugars, and the
liquid form. Randomized controlled trials have provided convincing evidence that
drinking sugar-sweetened beverages can lead to weight gain. 49 Evidence from
intervention studies shows that calories consumed in liquid form are less satiating than
the same number of calories consumed from food. 50 That can lead people to overeat and
eventually gain weight.
Sugar-sweetened beverages provide calories with few nutrients, which makes it
difficult for consumers to meet nutritional needs and stay within calorie requirements.
Given that sugar-sweetened beverages make a unique direct contribution to obesity and
other non-communicable diseases, the DGA should emphasize strongly that Americans
should consume these beverages only rarely, comparing the amount in typical servings to
the recommended maximum daily intake and that public policies should be developed
that encourage consumption of healthier beverages, including water, and discourage the
availability of sugar drinks.
Furthermore, the FDA, as a department within HHS, should align its updates to
the Nutrition Facts label by including a percent DV for added sugars on the labels of all
46
U.S. Department of Agriculture and U.S. Department of Health and Human Services.
(December, 2010). Table 2-2. Top 25 sources of calories among Americans ages 2 years and
th
older, NHANES 2005–2006. Dietary Guidelines for Americans, 2010. 7 Edition, Washington,
DC: U.S. Government Printing Office. Page 12.
47
Beverage Digest. (2014). U.S. beverage results for 2014. Available at http://beveragedigest.com/pdf/top-10_2014.pdf. Accessed May 7, 2015.
48
Ogden, C. L. (2011). Consumption of sugar drinks in the United States, 2005-2008 (p. 71). US
Department of Health and Human Services, Centers for Disease Control and Prevention, National
Center for Health Statistics.
49
Te Morenga, L., Mallard, S., & Mann, J. (2013). Dietary sugars and body weight: systematic
review and meta-analyses of randomised controlled trials and cohort studies. BMJ, 346, e7492; de
Ruyter, J. C., Olthof, M. R., Seidell, J. C., & Katan, M. B. (2012). A trial of sugar-free or sugarsweetened beverages and body weight in children. New England Journal of Medicine, 367 (15),
1397-1406.
50
DiMeglio, D. P., & Mattes, R. D. (2000). Liquid versus solid carbohydrate: effects on food
intake and body weight. International journal of obesity, 24 (6), 794-800; Mourao, D. M.,
Bressan, J., Campbell, W. W., & Mattes, R. D. (2007). Effects of food form on appetite and
energy intake in lean and obese young adults. International Journal of Obesity, 31 (11), 16881695.
Page 18
processed foods, as the DGA recommended. 51 In addition, added sugars should be
indicated on labels in teaspoons to ease consumer understanding. Few Americans are
familiar with the metric measures used for total sugars (and other nutrients), because they
are unrelated to their common experiences, such as measuring sugar into coffee or tea.
They do, however, instantly understand measurements such as teaspoons, tablespoons,
and cups, which are commonly used in cooking and baking and used on the Nutrition
Facts label to indicate serving sizes. 52
CSPI’s Studies on Consumer Understanding of Labels Underscores Need for a Line
for Added Sugars, a Daily Value for Added Sugars, and for Measurements in
Teaspoons on the Nutrition Facts Panel, as the DGAC Recommended
CSPI has been conducting surveys on labeling of added sugars for years. Prior
results were compelling, but a recent survey adds further evidence that underscores the
public’s desire for additional and clearer information on sugars.
A 2010 national telephone survey commissioned by CSPI found that 72 percent of
respondents favored listing teaspoons of added sugars on the label (38 percent preferred
listing only teaspoons, while 34 percent preferred both teaspoons and grams). Just 20
percent of respondents preferred listing sugar amounts in grams only. 53
There is also ample reason to provide a daily value (DV) for added sugars to
facilitate consumer understanding. In a survey we commissioned in July 2014 of 1,045
consumers, 78 percent indicated that they either could not tell (58 percent) or did not
know (another 20 percent) the “recommended daily limit of added sugars” from a version
51
Percentage Daily Values (DVs) are an essential tool for consumer comprehension and use of
nutrition information. In its proposal, FDA notes: “Section 2(b)(1)(A) of the 1990 amendments
mandated that FDA regulations implementing section 403(q) of the FD&C Act require that
nutrition labeling must be conveyed to the public in a manner which enables the public to readily
observe and comprehend such information and to understand its relative significance in the
context of a total daily diet. In particular, the percent DV of a nutrient present in food is declared
on food labels to help consumers understand the relative significance of nutrition information in
the context of a total daily diet, compare the nutritional values of food products, and to plan
general diets. We also noted that the percent DV information advises the consumer how much of
a recommended intake of that nutrient is provided by the food.” See 79 F.R. 11880, 11887.
52
A 2010 nationally representative telephone survey conducted by Center for Science in the
Public Interest (CSPI) found that 72 percent of respondents thought that including teaspoons as a
measurement for sugar on food labels would be of assistance: 38 percent preferred listing only
teaspoons of added sugars on the label, while 34 percent of respondents preferred both teaspoons
and grams. Just 20 percent of those polled preferred listing sugar only in grams. Center for
Science in the Public Interest. (August 2, 2011). Unrealistic serving sizes understate calories,
sodium, saturated fat, says CSPI. Press Release. Available at
http://cspinet.org/new/201108021.html. Accessed April 23, 2015.
53
Center for Science in the Public Interest. (August 2, 2011). Unrealistic serving sizes understate
calories, sodium, saturated fat, says CSPI. Press Release. Available at
http://cspinet.org/new/201108021.html. Accessed April 23, 2015.
Page 19
of a label displaying a line for added sugars but not a percentage DV for added sugars. 54
In contrast, when shown a label including the percentage DV, 66 percent of consumers
correctly identified the information.
In April 2015, we commissioned a new survey that focused on added-sugars
labeling with April 2015, of 1,011 consumers. 55 The results were instructive:
•
•
•
•
54
Only 18 percent of consumers correctly identified the number of teaspoons of
sugar in one gram of sugar, while 53 percent indicated outright that they “didn’t
know” the amount. That is, Americans simply don’t understand grams.
When informed that a beverage contained 40 grams of sugar per serving, and
asked to convert the number to teaspoons of sugar, 40 percent of consumers
indicated they did not know the answer, and only about 25 percent came within
five teaspoons of the correct answer—9½ teaspoons. It is clear that Americans
cannot convert grams into the more familiar measurement of teaspoons.
Next, we asked respondents to review two nutrition labels, one with the sugar
expressed only as grams, the other only as teaspoons. When asked which label
“more clearly conveys to you the amount of sugar in a 20-ounce bottle,” 61
percent of respondents preferred teaspoons while only 28 percent preferred the
current measurement of grams. A second question asked consumers to review
three labels with differences in the line for sugars, showing: grams alone,
teaspoons alone and both teaspoons and grams. A majority – 61 percent –
preferred grams and teaspoons together, while 18 percent wanted only teaspoons
and 14 percent only grams. In sum, 79 percent identified a desire for
measurements in teaspoons, while a mere 14 percent preferred listing grams alone
(which is even lower than the 20 percent of those surveyed who indicated a
preference for grams in CSPI’s 2010 survey).
Last, we asked whether inclusion of a percentage DV for added sugars would be
helpful in figuring out how many servings of either a high-sugar muffin or soft
drink would fit into a healthy daily diet. For the soft drink, we provided two
identical labels, one with, and one without, a DV for sugars. A stunning 80
percent of consumers identified the label including the DV as the one that would
“make it easier” for them “to determine whether drinking one bottle would fit into
a healthy daily diet.” The results to the same question (with the label order
switched) with regard to a hypothetical muffin were similar: 84 percent of
respondents identified the label with the DV as more helpful.
Center for Science in the Public Interest. (July 10-13, 2014). Food Label Study of 1,045
Consumers by Online Caravan.
55
Center for Science in the Public Interest. (April 23-26, 2014). Sugar Nutrition Facts Label
Survey of 1011 Consumers by Online Caravan. We would be pleased to provide the Departments
with a copy of the survey.
Page 20
For all of those questions, there were no significant differences in the answers
given by men and women, across socio-economic classes, more- or less-well-educated
consumers, or among racial and ethnic groups.
b) Sodium
The DGAC should strongly recommend reducing daily sodium intake to
2,300 milligrams (mg) per day for the general population and to 1,500 mg per
day for at-risk subgroups.
We applaud the DGAC for emphasizing sodium reduction in its Scientific Report.
Sodium continues to be a major public health problem, with Americans consuming an
average of roughly 3,500 mg per day—far more than the recommended amount. Excess
sodium consumption is linked to the development and worsening of high blood pressure
and an increased risk of heart disease, stroke, kidney failure, gastric cancer, and
osteoporosis. As the DGAC noted, despite the methodological flaws and limitations that
plague many studies, it is clear that higher sodium intakes are associated with a higher
risk of cardiovascular disease.
Reports of increased risks among people with low intakes are likely to be due to
reverse causation, residual confounding, or errors in sodium assessment. 56 For example,
a recent observational study (PURE) of roughly 101,000 people in 17 countries reported
that “an estimated sodium intake” between 3,000 and 6,000 mg per day and 6 g per day
was associated with a lower risk of death and cardiovascular events. 57 However, this
study has several serious limitations:
•
56
Illness may have caused low sodium intakes. The people in this study who
consumed the least sodium also had the most illness, suggesting that it was illness
that caused their low sodium intake rather than low sodium intake that caused
their illness (a methodological problem known as reverse causation). As a letter
in the New England Journal of Medicine notes, “the group in which urinary
sodium levels were less than 3.00 g (making up 10.6% of the total study
population) included persons with the highest rates of cardiovascular disease,
diabetes mellitus, current alcohol use, and diuretic use.” 58 Although it is possible
to control for these factors, it is difficult to adequately control for all of them and
for others that the authors failed to measure or failed to measure well. O’Donnell
et al. acknowledge that “reverse causation cannot be completely ruled out and
Cobb, L. K., Anderson, C. A., Elliott, P., Hu, F. B., Liu, K., Neaton, J. D., et al. (2014).
Methodological Issues in Cohort Studies That Relate Sodium Intake to Cardiovascular Disease
Outcomes: A Science Advisory from the American Heart Association. Circulation, 129 (10),
1173-1186.
57
O'Donnell, M., Mente, A., Rangarajan, S., McQueen, M. J., Wang, X., Liu, L., et al. (2014).
Urinary sodium and potassium excretion, mortality, and cardiovascular events. New England
Journal of Medicine, 371(7), 612-623 .
58
Batuman, V. (2014). Sodium and cardiovascular disease. N Engl J Med, 371(22), 2134-2135.
Page 21
may account in part for the increased risk observed in the group of participants
with a low estimated sodium excretion.”
•
Sodium intake measures were unreliable. As another letter to the Journal
noted, “a single morning urine sample is an inaccurate measure of usual sodium
intake, ignoring day-to-day variability in sodium intake, diurnal variation in
sodium excretion, and the effects of medication.” 59 Furthermore, the Kawasaki
formula (which was used to estimate 24-hour urine levels from a spot urine) also
overestimates sodium exposure in non-Asian populations. In addition, the study
inflated the validity of using a spot urine sample to estimate long-term sodium
intake. 60
•
Results may not apply to Americans. Only about 14 percent of the participants
in the PURE study came from high-income countries like the United States.
Roughly 60 percent came from China, India, and other lower-income countries
where other factors might have altered sodium intakes and the risk of dying. Nor
is there any evidence that the PURE subjects who consumed the least sodium
were doing so to protect their health. As the O’Donnell paper notes, “our findings
should not be interpreted as evidence that the intentional reduction of sodium
intake would alter the risk of death or cardiovascular disease.”
In contrast, lower sodium intakes are linked to a lower cardiovascular risk in
studies with fewer flaws. In the Trials of Hypertension Prevention (TOHP), the
researchers used three to seven 24-hour urine samples taken over 1 to 4 years to get a
reliable estimate of each person’s typical sodium intake. TOHP found a higher risk of
cardiovascular events at higher sodium intakes and no indication of an increased risk at
lower sodium intakes (down to below 1,500 mg per day). 61
To help Americans achieve a healthier sodium intake, the Committee has
recommended that the general population limit sodium to less than 2,300 mg or the age-
59
Cook, N. R., O'Donnell, M., Mente, A., & Rangarajan, S. (2014). Sodium and cardiovascular
disease. N Engl J Med, 371, 2134.
60
O’Donnell et al. cites an accompanying study by Mente et al., which cites an earlier validation
study that “showed an intraclass correlation coefficient of 0.71 (95% confidence interval [CI],
0.65 to 0.76) for the Kawasaki estimate versus measured 24-hour sodium excretion.” However,
Mente et al. calculated the intraclass correlation of 0.71 after excluding roughly half of the
subjects, whose 24-hour urine samples were judged incomplete. The ICC based on the full
sample was only 0.59. Mente, A., O'Donnell, M. J., Rangarajan, S., McQueen, M. J., Poirier, P.,
Wielgosz, A., et al. (2014). Association of urinary sodium and potassium excretion with blood
pressure. New England Journal of Medicine,371(7), 601-611; Mente, A., O’Donnell, M. J.,
Dagenais, G., Wielgosz, A., Lear, S. A., McQueen, M. J., et al. (2014). Validation and
comparison of three formulae to estimate sodium and potassium excretion from a single morning
fasting urine compared to 24-h measures in 11 countries. Journal of hypertension, 32(5), 10051015.
61
Cook, N. R., Appel, L. J., & Whelton, P. K. (2014). Lower levels of sodium intake and reduced
cardiovascular risk. Circulation, 129, 981-989.
Page 22
appropriate Dietary Reference Intake (DRI) amount. 62 Although we believe the ultimate
target intake should be even lower (1,500 mg per day), 2,300 mg or less can be viewed as
an interim recommendation based on current consumption levels and the amount of
sodium in the food supply. Reducing sodium consumption to less than 2,300 mg or less
per day would be a good first step. We also agree with the Committee’s conclusion that
adults who would benefit from blood pressure lowering—namely people with
prehypertension or hypertension, which includes two-thirds of the adult population—
should reduce their sodium intake ideally to 1,500 mg per day.
Confusingly, the DGAC also recommended that people with hypertension or
prehypertension should consume no more than 2,400 mg of sodium per day. We
recognize that 2,400 mg was recommended because that was the estimated average
urinary sodium excretion when subjects in the DASH sodium trial were assigned to a
2,300 mg diet. However, recommending less than 2,300 mg for the general population
and no more than 2,400 mg for adults who would benefit from blood pressure lowering
would result in confusion.
We urge HHS and USDA to simplify the messaging in the final policy document
and recommend less than 2,300 mg for the general population. At-risk subgroups should
be advised that a greater reduction to 1,500 mg would be desirable, and that if they
cannot immediately reach either target level, that reducing sodium by at least 1,000 mg
per day—and more to reach the 1,500 mg/day level—would be beneficial.
To help individuals lower their sodium intake, the Committee has recommended
that a “primary emphasis be placed on policies and population-based strategies for
sodium reduction while at the same time paying attention to consumer education.” We
strongly agree. Despite decades of dietary guidance advising Americans to reduce their
sodium consumption, high intakes have persisted. It is clear that relying on individual
behavior change alone is not enough. With nearly 80 percent of the sodium we eat
coming from packaged and restaurants foods, Americans will continue to have difficulty
reducing their sodium intake unless there are changes to the food supply (or people are
encouraged to switch to diets based to a much greater extent on low-sodium natural
foods, such as fruits and vegetables, as we urge below). As the Committee advised, HHS
and USDA should work with the food and restaurant industry to lower the amount of
sodium in the food supply. The DGAC also said that it could be achieved by
implementing the recommendations contained in the 2010 IOM report “Strategies to
Reduce Sodium Intake in the United States,” including modifying the GRAS status of salt
and establishing sodium limits for foods.
The Agencies should also continue to move forward with existing efforts to
reduce sodium intake in children. As the DGAC’s Scientific Report discusses, the
62
We recommend that the final policy document specify the amount of sodium that corresponds
to the DRI amount for each age group so that policies can be set accordingly. Per the 2006 IOM
DRIs for sodium, the Upper Levels (mg/day) are: Age 1-3: 1,500; Age 4-8: 1,900; Age 9-13:
2,200; Age 14-18: 2,300. Hellwig, J. P., Otten, J. J., & Meyers, L. D. (Eds.). (2006). Dietary
Reference Intakes: The Essential Guide to Nutrient Requirements. National Academies Press.
Page 23
concern over excess sodium consumption and negative health effects is not just limited to
adults. American children are also at risk of developing heart disease and elevated blood
pressure at an earlier age, because about 90 percent of them consume too much sodium. 63
The prevalence of elevated blood pressure in children is already on the rise, and blood
pressure rises with age. The evidence shows that in children, just like in adults, blood
pressure decreases as sodium intake goes down. In addition, lowering sodium intake can
significantly blunt the age-associated rise in blood pressure. Accordingly, federal efforts
are needed to lower sodium intake in children, such as continuing the tiered reduction in
the School Meals program.
For children and adults, there is consensus that the U.S. population has to reduce
sodium intake. A target of 2,300 mg is reasonable for the general population, with a
second recommendation to reduce intake ideally to 1,500 mg in people with prehypertension or hypertension. Achieving these targets will not happen without a
significant commitment from industry to reduce sodium in packaged and restaurant foods
and for industry and consumers to reduce portion sizes. Additionally, reducing sodium in
the foods purchased or made available through schools, government feeding programs,
and workplaces is essential to achieving the enormous health benefits of sodium
reduction across the population.
c) Red and Processed Meats
We support the DGAC Report’s recommendation to consume a diet that is
“lower in red and processed meats.”
We applaud the DGAC for its proposal to alter the current Dietary Guidelines
language regarding meat intake from “choose lean meat and poultry” to “consume dietary
patterns that are…lower in red and processed meats.” That is an important and necessary
change, supported by clear, consistent, and still-mounting evidence of the link between
regular consumption of red and processed meats and certain types of cancer.
Studies report that both red and processed meats are significantly associated with
an increased risk of total mortality, cardiovascular disease mortality, and cancer
mortality. 64 In cohorts of roughly 37,700 men and 83,600 women, researchers estimated
that 8 to 9 percent of deaths could have been prevented over a period of 22 to 28 years if
all participants had consumed less than ½ serving (about 1½ oz.) per day of red meat.
We are pleased that the DGAC also acknowledged that diet and weight status affect the
risk of breast and colorectal cancers, two of the most common types. We urge that the
63
Centers for Disease Control and Prevention. (2014). CDC Vital Signs: Reducing Sodium in
Children’s Diets. Available at http://www.cdc.gov/VitalSigns/pdf/2014-09-vitalsigns.pdf.
Accessed May 7, 2015.
64
Pan, A., Sun, Q., Bernstein, A.M., et al. (2012). Red meat consumption and mortality: results
from 2 prospective cohort studies. Arch Intern Med, 172(7), 555-563; Kushi et a., 2012;
WCRF/AICR, 2007; Sinha, R., Cross, A. J., Graubard, B. I., Leitzmann, M. F., & Schatzkin, A.
(2009). Meat intake and mortality: A prospective study of over half a million people. Archives of
Internal Medicine, 169 (6), 562-571.
Page 24
2015 DGA include a recommendation to lower consumers’ red and processed meat
intake.
We also applaud the DGAC for recommending increased consumption of
healthier protein sources, including plant protein sources. In particular, the DGA should
recommend that people replace red and processed meats with seafood, nuts, legumes, and
lean poultry. Major health organizations already support these recommendations for
protein foods. For example, the American Cancer Society recommends consuming a
healthy diet with an emphasis on plant foods. 65 The American Heart Association
recommends that the general population eat a variety of (preferably fatty) fish at least
twice a week and include oils and foods rich in alpha-linolenic acid (flaxseed, canola, and
soybean oils; flaxseed and walnuts). 66 It is essential that the DGA contain clear,
consistent, and actionable guidance for consumers regarding the types of protein foods
that should and should not be a regular part of their diet.
Clear Evidence Links Regular Consumption of Red and Processed Meats to Some
Cancers
There is clear, consistent, and still-mounting evidence of the link between regular
consumption of red and processed meats and certain types of cancer. The evidence that
diets high in red meat (beef, pork, lamb) and processed meats (hot dogs, bacon, sausage,
deli meats, etc.) increase the risk of colorectal cancer is convincing. 67
Evidence indicates approximately a 15 to 20 percent increased risk of cancers of
the colon and/or rectum per 100 grams (g) of red meat or 50 g of processed meats
consumed per day. 68 For this reason, the American Cancer Society has recommended
limiting the consumption of both red and processed meats for more than a decade. 69
Since the 2010 Dietary Guidelines for Americans were issued, the evidence
supporting the link between red meat and processed meat consumption and colorectal
cancer has increased. In 2011, AICR and WCRF published a Continuous Update Project
report on colorectal cancer, in which new evidence was added to the existing evidence
base. The expert panel concluded that both red and processed meats are a “convincing
cause” of colorectal cancer:
65
Kushi et al., 2012.
American Heart Association. (2015). Fish 101. Available at
http://www.heart.org/HEARTORG/GettingHealthy/NutritionCenter/Fish101_UCM_305986_Article.jsp. Accessed May 1, 2015.
67
World Cancer Research Fund/American Institute for Cancer Research. (2011). Continuous
Update Project Report. Food, Nutrition, Physical Activity, and the Prevention of Colorectal
Cancer.
68
WCRF/AICR, 2007; Chan, D. S., Lau, R., Aune, D., Vieira, R., Greenwood, D. C., Kampman,
E., & Norat, T. (2011). Red and processed meat and colorectal cancer incidence: meta-analysis of
prospective studies. PloS One, 6 (6), e20456; WCRF/AICR, 2011.
69
Kushi et al., 2012.
66
Page 25
•
•
A substantial amount of data from cohort studies showed a dose-response
relationship, supported by evidence for plausible mechanisms operating in
humans…red meat is a convincing cause of colorectal cancer.
There is a substantial amount of evidence, with a dose-response relationship
apparent from cohort studies. There is strong evidence for plausible mechanisms
operating in humans…processed meat is a convincing cause of colorectal
cancer. 70
Higher Intakes of Red Meat Are Also Associated with a Higher Risk of Cardiovascular
Disease
Studies report a higher risk of heart disease and stroke among people who
consume higher intakes of red meat. 71 Red meat is likely to raise those risks in part
because it is one of the largest sources of saturated fat in the average American’s diet. 72
The American Heart Association and American College of Cardiology recommend that
adults with high cholesterol levels lower their saturated fat intake to 5-6 percent of
calories to lower their risk of cardiovascular disease. That conclusion was based on the
highest quality evidence. 73
Moreover, a pooled analysis of 11 cohort studies on roughly 345,000 people
reported that the risk of coronary events falls by 13 percent and the risk of coronary
deaths drops by 26 percent for every 5 percent of calories from saturated fat that is
replaced by polyunsaturated fat. 74 In addition, evidence suggests that the heme iron in
red meat and the sodium in processed meats may also raise the risk of cardiovascular
disease, indicating that a healthy dietary pattern should be low even in lean red meat. 75
Last, research on carnitine and its impact on gut microbes may describe a
convincing mechanism linking red meat consumption to heart disease. This research is
further outlined in the attachment to this comment, a 2013 cover story from our Nutrition
Action newsletter detailing six reasons to lower meat consumption, including the risk of
heart disease as well as the carcinogenic heterocyclic amines created in common cooking
processes for meats.
70
WCRF/AICR, 2011.
Bernstein, A. M., Pan, A., Rexrode, K. M., Stampfer, M., Hu, F. B., Mozaffarian, D., & Willett,
W. C. (2012). Dietary protein sources and the risk of stroke in men and women. Stroke, 43(3),
637-644.
72
National Cancer Institute. (2013). Table 1. Top Food Sources of Saturated Fat Among US
Population, 2005-2006 NHANES. Available at
http://appliedresearch.cancer.gov/diet/foodsources/sat_fat/sf.html. Accessed May 1, 2015.
73
Eckel, R. H., Jakicic, J. M., Ard, J. D., de Jesus, J. M., Miller, N. H., Hubbard, V. S., et al.
(2014). 2013 AHA/ACC guideline on lifestyle management to reduce cardiovascular risk: a
report of the American College of Cardiology/American Heart Association Task Force on
Practice Guidelines. Journal of the American College of Cardiology, 63(25_PA), 2960-2984.
74
Jakobsen, M. U., O'Reilly, E. J., Heitmann, B. L., Pereira, M. A., Bälter, K., Fraser, G. E., et al.
(2009). Major types of dietary fat and risk of coronary heart disease: a pooled analysis of 11
cohort studies. The American journal of clinical nutrition, 89(5), 1425-1432.
75
Pan et al., 2012.
71
Page 26
Higher Intakes of Red and Processed Meat Increase the Risk of Type 2 Diabetes
The DGAC reported that “moderate evidence indicates that healthy dietary
patterns … lower in red and processed meats …reduce the risk of developing type 2
diabetes.” We concur. Meta-analyses of multiple cohorts have consistently reported an
increased risk of type 2 diabetes among people who consume more red or processed
meat. 76
Researchers suggest that a variety of constituents of red meat--including saturated
fat, sodium, advanced glycation end products, nitrates or nitrites, heme iron,
trimethylamine N-oxide (TMAO), branched amino acids, and endocrine disruptor
chemicals—could be responsible. 77
d) Fats
The Dietary Guidelines for Americans should continue to advise Americans
to replace foods rich in saturated fat with ones higher in monounsaturated or
polyunsaturated fats.
In 2010, the DGA recommended limiting saturated fat intake to less than
10 percent of total calories based on evidence from controlled trials and prospective
cohort studies showing that saturated fat intake raises serum total and LDL-cholesterol
levels, which increase the risk of cardiovascular disease. Strong evidence from
controlled trials shows that replacing saturated fat with polyunsaturated and
monounsaturated fats results in favorable effects on lipid profiles and a lower risk of
cardiovascular events. 78 The DGA should continue to advise Americans to replace foods
76
Pan, A., Sun, Q., Bernstein, A. M., Manson, J. E., Willett, W. C., & Hu, F. B. (2013). Changes
in red meat consumption and subsequent risk of type 2 diabetes mellitus: three cohorts of US men
and women. JAMA internal medicine, 173(14), 1328-1335; Pan, A., Sun, Q., Bernstein, A. M.,
Schulze, M. B., Manson, J. E., Willett, W. C., & Hu, F. B. (2011). Red meat consumption and
risk of type 2 diabetes: 3 cohorts of US adults and an updated meta-analysis. The American
journal of clinical nutrition, 94(4), 1088-1096; Feskens, E. J., Sluik, D., & van Woudenbergh, G.
J. (2013). Meat consumption, diabetes, and its complications. Current diabetes reports, 13(2),
298-306; InterAct Consortium. (2013). Association between dietary meat consumption and
incident type 2 diabetes: the EPIC-InterAct study. Diabetologia, 56(1), 47-59; Micha, R., Michas,
G., & Mozaffarian, D. (2012). Unprocessed red and processed meats and risk of coronary artery
disease and type 2 diabetes–an updated review of the evidence. Current atherosclerosis
reports, 14(6), 515-524; Aune, D., Ursin, G., & Veierød, M. B. (2009). Meat consumption and
the risk of type 2 diabetes: a systematic review and meta-analysis of cohort studies.
Diabetologia, 52(11), 2277-2287.
77
Kim, Y., Keogh, J., & Clifton, P. (2015). A review of potential metabolic etiologies of the
observed association between red meat consumption and development of type 2 diabetes
mellitus. Metabolism.
78
Mensink, R. P., Zock, P. L., Kester, A. D., & Katan, M. B. (2003). Effects of dietary fatty acids
and carbohydrates on the ratio of serum total to HDL cholesterol and on serum lipids and
apolipoproteins: a meta-analysis of 60 controlled trials. The American Journal of Clinical
Nutrition, 77 (5), 1146-1155; Hooper, L., Summerbell, C. D., Thompson, R., Sills, D., Roberts, F.
Page 27
rich in saturated fat with ones higher in monounsaturated or polyunsaturated fats.
We note that some meta-analyses have reached flawed conclusions concerning the
impact of lowering saturated fat on coronary heart disease and mortality. For example,
Chowdhury, et al. concluded that “current evidence does not clearly support
cardiovascular guidelines that encourage high consumption of polyunsaturated fatty acids
and low consumption of total saturated fats.” However, that conclusion ignored, among
other things, the results of its own meta-analysis (buried in a supplement) showing a
19 percent reduction in the risk of heart disease when the authors appropriately excluded
a trial that replaced saturated fat with a margarine high in trans fats. 79 Moreover, a
pooled analysis of 11 cohort studies on roughly 345,000 people reported that the risk of
coronary events falls by 13 percent and the risk of coronary deaths drops by 26 percent
for every 5 percent of calories from saturated fat that is replaced by polyunsaturated fat. 80
For decades, researchers have acknowledged the difficulties of convincing
sufficiently large numbers of subjects to sufficiently change their diets for sufficiently
long periods of time to lower not just the risk of cardiovascular disease but cardiovascular
or all-cause mortality. Recognizing those difficulties, the National Heart, Lung, and
Blood Institute, AHA, ACC, and other health authorities have concluded that evidence
from clinical trials demonstrating a reduction in LDL cholesterol and other
cardiovascular risk factors are sufficient to support recommendations to lower saturated
fat intake. 81 That conclusion is backed by a strong, consistent, and growing body of
evidence from randomized controlled trials on diets that lower LDL cholesterol, along
with trials on drugs that lower LDL by different mechanisms (statins and ezetimibe) and
lower the risk of cardiovascular disease, cardiovascular mortality, and all-cause
mortality. 82
G., Moore, H. J., & Davey Smith, G. (2012). Reduced or modified dietary fat for preventing
cardiovascular disease. The Cochrane Library; Mozaffarian, D., Micha, R., & Wallace, S. (2010).
Effects on coronary heart disease of increasing polyunsaturated fat in place of saturated fat: a
systematic review and meta-analysis of randomized controlled trials. PLoS Medicine, 7 (3),
e1000252.
79
Chowdhury, R., Warnakula, S., Kunutsor, S., Crowe, F., Ward, H. A., Johnson, L., et al.
(2014). Association of dietary, circulating, and supplement fatty acids with coronary risk: a
systematic review and meta-analysis. Annals of Internal Medicine, 160 (6), 398-406; Liebman, B.
F., Katan, M. B., & Jacobson, M. F. (2014). Association of dietary, circulating, and supplement
fatty acids with coronary risk. Annals of Internal Medicine, 161 (6), 454; Willett, W. C.,
Stampfer, M. J., & Sacks, F. M. (2014). Association of dietary, circulating, and supplement fatty
acids with coronary risk. Annals of Internal Medicine, 161(6), 453.
80
Jakobsen et al., 2009.
81
Levy, R. I. (1985). Cholesterol and cardiovascular disease: no longer whether, but rather when,
in whom, and how? Circulation; Eckel et al., 2014; Antonopoulos, S. (2002). Third report of the
National Cholesterol Education Program (NCEP) expert panel on detection, evaluation, and
treatment of high blood cholesterol in adults (Adult Treatment Panel III) final
report. Circulation,106(3143), 3421.
82
Kohno, T. (2014). Report of the American Heart Association (AHA) Scientific Sessions 2014,
Chicago. Circulation Journal: Official Journal of the Japanese Circulation Society; Stone, N. J.,
Merz, C. N. B., ScM, F. A. C. C., Blum, F. C. B., McBride, F. P., Eckel, F. R. H., et al. (2013).
Page 28
In 2011–2012, Americans aged 2 and older averaged 11 percent of calories from
saturated fat, slightly more than the current DGA recommendation of under 10 percent. 83
Furthermore, 71 percent of the total population consumed more than 10 percent of
calories from saturated fat. The American Heart Association and the American College
of Cardiology recommended that people who would benefit from LDL-cholesterol
lowering (i.e., those at high risk for cardiovascular disease and stroke) should reduce
saturated fat intake to even lower levels (i.e., 5 to 6 percent of calories), 84 as used in the
OmniHeart, Dietary Approaches to Stop Hypertension (DASH), and the Dietary Effects
on Lipoproteins and Thrombogenic Activity (DELTA) trials. 85 That conclusion was
based on the highest quality evidence.
Although we support the DGAC’s recommendation to consume less than 10
percent of calories from saturated fat, we note that the American Heart Association
recommends that healthy Americans over age 2 should ideally consume no more than 7
percent of calories from saturated fat. 86 This lower saturated fat intake would more
closely match the DASH, OmniHeart, and DELTA trials and would be more consistent
with a diet rich in vegetables, fruits, low-fat dairy products, whole grains, poultry, fish,
legumes, nuts, and vegetable oils, and limited in sweets, sugar-sweetened beverages, and
red meat, as noted by the AHA/ACC 2013 guidelines.
The DGA should recommend that people replace foods high in saturated fat, such
as red meat, full-fat dairy products, many desserts, and foods made with palm or coconut
oils, with foods rich in polyunsaturated and/or monounsaturated fats, such as nuts, seeds,
seafood, non-tropical oils, soyfoods, and margarines or shortenings with the least
saturated fat. Americans should consume those unsaturated fats as part of a diet rich in
fruits, vegetables, whole grains, legumes, and low-fat dairy products.
2013 ACC/AHA guideline on the treatment of blood cholesterol to reduce atherosclerotic
cardiovascular risk in adults: a report of the American College of Cardiology/American Heart
Association Task Force on Practice Guidelines.
83
U.S. Department of Agriculture, Agricultural Research Service. (2014). Energy Intakes:
Percentages of Energy from Protein, Carbohydrate, Fat, and Alcohol, by Gender and Age. What
We Eat in America, NHANES 2011-2012. Available at
http://www.ars.usda.gov/SP2UserFiles/Place/80400530/pdf/1112/Table_5_EIN_GEN_11.pdf.
Accessed March 4, 2015.
84
Eckel et al., 2014.
85
Appel et al., 2005; Obarzanek, E., Sacks, F. M., Vollmer, W. M., Bray, G. A., Miller, E. R.,
Lin, P. H., et al. (2001). Effects on blood lipids of a blood pressure–lowering diet: the Dietary
Approaches to Stop Hypertension (DASH) Trial. The American Journal of Clinical Nutrition, 74
(1), 80-89; Ginsberg, H. N., Kris-Etherton, P., Dennis, B., Elmer, P. J., Ershow, A., Lefevre, M.,
et al. (1998). Effects of reducing dietary saturated fatty acids on plasma lipids and lipoproteins in
healthy subjects. The Delta Study, Protocol 1. Arteriosclerosis, Thrombosis, and Vascular
Biology, 18 (3), 441-449.
86
American Heart Association. (2015). Know Your Fats. Available at
http://www.heart.org/HEARTORG/Conditions/Cholesterol/PreventionTreatmentofHighCholester
ol/Know-Your-Fats_UCM_305628_Article.jsp. Accessed March 20, 2015.
Page 29
e) Dietary Cholesterol
The final Dietary Guidelines should advise Americans to limit their
consumption of cholesterol-rich foods (primarily whole eggs and egg yolks) to
lower their risk of heart disease and type 2 diabetes.
The 2015 DGAC’s conclusion that dietary cholesterol should no longer be
considered a “nutrient of concern” has received considerable attention in the media and
has been widely misinterpreted as permission to eat more eggs. Underscoring this
impression, an egg industry marketing campaign is also trumpeting the inclusion of eggs
in a healthy diet. 87 However, we are concerned that the DGAC’s conclusion about
dietary cholesterol is inconsistent with the AHA/ACC guidelines, evidence from clinical
trials and cohort studies, and the overall dietary pattern recommended by the DGAC.
The DGAC states that it "will not bring forward [the recommendation in previous
editions of the DGA to limit cholesterol to 300 mg/day] because available evidence
shows no appreciable relationship between consumption of dietary cholesterol and serum
cholesterol, consistent with the conclusions of the AHA/ACC report.” However, the
AHA/ACC did not conclude that there is no appreciable relationship between dietary and
serum cholesterol. It concluded that “there is insufficient evidence to determine whether
lowering dietary cholesterol reduces LDL-C.” 88 The DGAC report did not present
evidence to support its conclusion that there is “no appreciable relationship” between
dietary cholesterol and serum cholesterol. In fact, that conclusion directly contradicts the
AHA/ACC conclusion, which specifically states that “there are insufficient data to make
a statement.”
The AHA/ACC’s conclusion is based on what it saw as insufficient research. In
contrast, the DGAC’s conclusion misinterprets the alleged absence of evidence as the
presence of evidence that high doses of cholesterol cause no harm. We question the
scientific rigor and logic of that conclusion.
Contrary to the DGAC’s conclusion, dietary cholesterol is very much a “nutrient
of concern,” because it increases LDL cholesterol, a well-established risk factor for
coronary heart disease. Furthermore, the consumption of whole eggs is associated with
the risk of type 2 diabetes and the risk of coronary heart disease (CHD) in people with
diabetes. The Guidelines should clarify that the healthy dietary pattern it recommends
does not include one or more eggs per day. That message has been lost in the media
87
Tinker, B. (February 19, 2015). Cholesterol in food not a concern, new report says. CNN.
Available at http://www.cnn.com/2015/02/19/health/dietary-guidelines/. Accessed March 20,
2015; Whoriskey, P. (February 10, 2015). The U.S. government is poised to withdraw
longstanding warnings about cholesterol. The Washington Post. Available at
http://www.washingtonpost.com/blogs/wonkblog/wp/2015/02/10/feds-poised-to-withdrawlongstanding-warnings-about-dietary-cholesterol/. Accessed March 20, 2015; O’Connor, A.
(February 19, 2015). Nutrition panel calls for less sugar and eases cholesterol and fat restrictions.
The New York Times. Available at http://well.blogs.nytimes.com/2015/02/19/nutrition-panelcalls-for-less-sugar-and-eases-cholesterol-and-fat-restrictions/?_r=0. Accessed March 20, 2015.
88
Eckel et al., 2014.
Page 30
frenzy over the DGAC’s decision to de-list cholesterol as a nutrient of concern. The
Guidelines should counter the mistaken impression, created by the DGAC’s report, that
consuming whole eggs in any quantity has been thoroughly investigated and deemed to
be part of a healthy dietary pattern. In fact, the DGAC gave the public the green light to
consume high levels of eggs based in part on cohort studies that never assessed those
levels.
Dietary Cholesterol Increases the Risk of Heart Disease
First, clinical studies show that dietary cholesterol at levels that are commonly
consumed by Americans raises serum LDL-cholesterol, a well-established risk factor for
heart disease.
Weggemans, et al., identified 17 studies—including 11 metabolic ward studies—
involving 556 individuals conducted between 1974 and 1999. The diets were designed to
maintain stable body weight. The authors’ meta-analysis found that for each additional
100 mg/day of dietary cholesterol, serum LDL cholesterol increased by roughly 2 mg/dL.
Among the studies they included, 10 involved individuals who consumed an increase of
167 to 560 mg/day of cholesterol. (See figure below.) Those increases indicate that
consuming one to three egg yolks per day would increase LDL by 4 to 12 mg/dL (0.10 to
0.31 mmol/l). The authors concluded that “the advice to limit the consumption of eggs
and other foods rich in dietary cholesterol may still be important in the prevention of
coronary heart disease.” 89
It should be noted that most participants in the studies included in the
Weggemans, et al., meta-analysis were normal-weight young adults. Few of those
studies have investigated the impact of dietary cholesterol on people who are middleaged or older, who are overweight or obese, or who have diabetes, pre-diabetes,
hypertension, or prehypertension, even though those groups comprise major segments of
the U.S. population.
89
Weggemans, R. M., Zock, P. L., & Katan, M. B. (2001). Dietary cholesterol from eggs
increases the ratio of total cholesterol to high-density lipoprotein cholesterol in humans: a metaanalysis. The American journal of clinical nutrition, 73(5), 885-891.
Page 31
In a 1997 meta-analysis of metabolic-ward studies, Clarke, et al., concluded that
200 mg/day (equivalent to about one egg/day) of dietary cholesterol increases LDL
cholesterol by roughly 4 mg/dL, a calculation that is consistent with Weggemans, et al., 90
(yet there was little overlap: only two studies on a total of 21 people were included in
both meta-analyses 91).
The AHA/ACC report appeared to minimize the importance of the findings of
Clarke by noting that earlier meta-analyses were based on 6 studies on 128 participants
and that “these studies predate our search.” There is absolutely no valid scientific
justification for the AHA/ACC’s or DGAC’s ignoring studies that were done before
1997. Given the strict control of diets in metabolic-ward studies—and the relative
paucity of recent metabolic ward studies—the results from those studies should be given
extra credence. 92
In contrast to those meta-analyses, Griffin and Lichtenstein reviewed studies on
the effect of dietary cholesterol on lipids conducted only between 2003 and 2013. 93 They
included only four studies that they categorized as assessing “dietary cholesterol
90
Clarke, R., Frost, C., Collins, R., Appleby, P., & Peto, R. (1997). Dietary lipids and blood
cholesterol: quantitative meta-analysis of metabolic ward studies. BMJ, 314(7074), 112.
91
Ginsberg, H. N., Karmally, W., Siddiqui, M., Holleran, S., Tall, A. R., Blaner, W. S., &
Ramakrishnan, R. (1995). Increases in dietary cholesterol are associated with modest increases in
both LDL and HDL cholesterol in healthy young women. Arteriosclerosis, thrombosis, and
vascular biology, 15(2), 169-178; Chenoweth, W., Ullmann, M., Simpson, R., & Leveille, G.
(1981). Influence of dietary cholesterol and fat on serum lipids in men. The Journal of
nutrition,111(12), 2069-2080.
92
The critical importance of dietary cholesterol in the induction of atherosclerosis was established
in landmark animal studies by Anitschkow in 1933. Stamler, J., & Shekelle, R. (1988). Dietary
cholesterol and human coronary heart disease. The epidemiologic evidence. Archives of
pathology & laboratory medicine, 112(10), 1032-1040.
93
Griffin, J. D., & Lichtenstein, A. H. (2013). Dietary cholesterol and plasma lipoprotein profiles:
randomized controlled trials. Current nutrition reports, 2(4), 274-282.
Page 32
supplementation while controlling for background diet” without weight loss, which
applies to the vast majority of Americans. However, unlike the metabolic ward studies
included in Clarke and 11 of the 17 studies included in Weggemans, Griffin and
Lichtenstein considered the background diet in those studies “controlled” if subjects were
only told to follow a diet (e.g., an NCEP Step 1 diet or a “lacto-vegetarian” diet).
Those diets are far less controlled than diets in studies where researchers provide
all meals throughout the study. Furthermore, the studies had other limitations. One study
tested egg consumption along with an endurance training program. 94 Another had a
crossover design but no washout period. 95 Two were funded by the egg industry, which
could influence the results. 96 The studies in that review should carry far less weight than
the earlier, controlled, metabolic-ward studies, regardless of their date of publication.
Some researchers (often with ties to the egg industry) have claimed that 70
percent of the population are hypo-responders to dietary cholesterol. 97 However, some
studies classify subjects as hypo- or hyper-responders based on a single experiment. 98 In
fact, when Dutch researchers retested people who were classified as hypo- or hyperresponders after a single 2-week experiment, they found that much of the initial variation
in response was due to chance intra-individual fluctuation. 99
The findings of controlled trials on the effects of lipids on total and LDLcholesterol are utilized in an online calculator constructed by Martijn Katan, a leader in
94
Vislocky, L. M., Pikosky, M. A., Rubin, K. H., Vega-López, S., Gaine, P. C., Martin, W. F., et
al. (2009). Habitual consumption of eggs does not alter the beneficial effects of endurance
training on plasma lipids and lipoprotein metabolism in untrained men and women. The Journal
of nutritional biochemistry, 20(1), 26-34.
95 Chakrabarty, G., Bijlani, R. L., Mahapatra, S. C., Mehta, N., Lakshmy, R., Vashisht, S., &
Manchanda, S. C. (2002). The effect of ingestion of egg on serum lipid profile in healthy young
free-living subjects. Indian journal of physiology and pharmacology, 46(4), 492-498.
96
Herron, K. L., McGrane, M. M., Waters, D., Lofgren, I. E., Clark, R. M., Ordovas, J. M., &
Fernandez, M. L. (2006). The ABCG5 polymorphism contributes to individual responses to
dietary cholesterol and carotenoids in eggs. The Journal of nutrition, 136(5), 1161-1165; Flacco,
M. E., Manzoli, L., Boccia, S., Capasso, L., Aleksovska, K., Rosso, A., et al. (2015). Head-tohead randomized trials are mostly industry sponsored and almost always favor the industry
sponsor. Journal of clinical epidemiology.
97
Fernandez, M. L. (2006). Dietary cholesterol provided by eggs and plasma lipoproteins in
healthy populations. Current Opinion in Clinical Nutrition & Metabolic Care, 9(1), 8-12; Carroll,
A.E. (2015). Behind New Dietary Guidelines, Better Science. The New York Times. Available at
http://www.nytimes.com/2015/02/24/upshot/behind-new-dietary-guidelines-better-science.html.
Accessed May 1, 2015.
98
Herron, K. L., Vega-Lopez, S., Conde, K., Ramjiganesh, T., Shachter, N. S., & Fernandez, M.
L. (2003). Men classified as hypo-or hyperresponders to dietary cholesterol feeding exhibit
differences in lipoprotein metabolism. The Journal of nutrition, 133(4), 1036-1042.
99
Katan, M.B., Beynen, A.C., de Vries, J.H., & Nobels, A. (1986). Existence of consistent hypoand hyper-responders to dietary cholesterol in man. American journal of epidemiology, 123(2),
221-234.
Page 33
the field of lipid research. 100 The calculator shows that, based on clinical trials, one DV’s
worth of cholesterol (300 mg) has about half the effect on LDL-cholesterol as one DV’s
worth of saturated fat (20 grams). That estimate, and the well-controlled feeding studies
that the calculator relies on, indicate that dietary cholesterol still is a significant
contributor to coronary heart disease—and a “nutrient of concern.” Furthermore, recent
evidence suggests that egg yolks may also promote cardiovascular disease because their
phosphatidylcholine leads to the production of TMAO (trimethylamine-N-oxide), which
enhances atherosclerosis. 101
In addition to the clinical studies, a number of cohort studies in the general
population examined the relationship between the consumption of dietary cholesterol or
eggs and cardiovascular disease, and two meta-analyses have been conducted on cohort
studies on egg consumption and the risk of heart disease, stroke, and diabetes. 102 Neither
meta-analysis found an association with eggs and stroke or heart disease.
However, those cohort studies have serious limitations. First, the range of egg
consumption between the lowest- and highest-exposure groups was small, with people in
the highest intake group typically consuming only one or more eggs per day. For
example, in one U.S. study, only 6 percent of 37,851 men and 9 percent of 80,082 women
consumed at least 1 egg per day, and only 1.6 percent of women reported consuming 2
eggs or more per day. 103 That narrow range limits the sensitivity of the studies.
Furthermore, although the DGAC’s cholesterol conclusion was widely interpreted as a
go-ahead to eat unlimited quantities of eggs, it was based in part on cohort studies that
never examined the impact of eating more than 1 egg per day. The DGAC has
therefore—perhaps inadvertently—implicitly sanctioned an egg-rich diet without
acknowledging a lack of evidence on the consequences of eating such a diet.
Yet a 20-year cohort study of roughly 21,000 U.S. male physicians reported a 22
percent increased risk of all-cause mortality among men who did not have diabetes and
who consumed at least 7 eggs per week. 104 The same authors reported a 28 percent
100
Katan, M.B. (2012). Katan Calculator: Predicted effect of diet on blood lipids and lipoproteins.
Available at http://www.katancalculator.nl/. Accessed May 1, 2015.
101
Tang, W. W., Wang, Z., Levison, B. S., Koeth, R. A., Britt, E. B., Fu, X., et al. (2013).
Intestinal microbial metabolism of phosphatidylcholine and cardiovascular risk. New England
Journal of Medicine, 368(17), 1575-1584.
102
Shin, J. Y., Xun, P., Nakamura, Y., & He, K. (2013). Egg consumption in relation to risk of
cardiovascular disease and diabetes: a systematic review and meta-analysis. The American
journal of clinical nutrition, ajcn-051318; Rong, Y., Chen, L., Zhu, T., Song, Y., Yu, M., Shan,
Z., et al. (2013). Egg consumption and risk of coronary heart disease and stroke: dose-response
meta-analysis of prospective cohort studies. BMJ, 346, e8539.
103
Hu, F. B., Stampfer, M. J., Rimm, E. B., Manson, J. E., Ascherio, A., Colditz, G. A., et al.
(1999). A prospective study of egg consumption and risk of cardiovascular disease in men and
women. JAMA, 281(15), 1387-1394. The median intake in the highest quintile was 0.79 eggs per
day for men and 0.67 eggs per day for women.
104
Djoussé, L., & Gaziano, J. M. (2008). Egg consumption in relation to cardiovascular disease
and mortality: the Physicians' Health Study. The American journal of clinical nutrition, 87(4),
964-969.
Page 34
higher risk of heart failure among physicians who ate one egg per day and a 64 percent
higher risk among those who ate at least two eggs per day. 105 Similarly, when
researchers tracked more than 14,000 African-American and white adults in the
Atherosclerosis Risk in Communities Study for 13 years, they found a 23 percent
increased risk of heart failure for each serving of eggs consumed per day. 106 In addition,
a number of cohort studies have reported an increased risk of type 2 diabetes or of CVD
in people with type 2 diabetes.
Dietary Cholesterol Increases the Risk of Heart Disease or Mortality in People with
Type 2 Diabetes
Cohort studies consistently report that egg consumption is associated with a
higher risk of heart disease or mortality in people with type 2 diabetes. For example, in a
study of 1,941 adults aged 70 to 79, those who had type 2 diabetes and consumed eggs
(possibly more than one per occasion) at least three times per week had five times the risk
of incident CVD compared to those who consumed eggs less than once a week. 107
Similarly, in a study that tracked 37,851 men for 8 years and 80,082 women for 14 years,
men with diabetes who consumed one or more eggs per day had twice the risk of
coronary heart disease—and women with diabetes had a 49 percent higher risk—than
those who consumed less than one egg per week. 108
When researchers tracked approximately 21,000 male physicians for 20 years in
the study mentioned in the prior section, the risk of all-cause mortality among those with
diabetes was twice as high if they consumed at least five to six eggs per week versus if
they ate less than 1 egg per week. 109 And among 5,672 women with type 2 diabetes,
every 200 mg of cholesterol per 1,000 calories was associated with a 37 percent higher
risk of cardiovascular disease. 110
In two meta-analyses of those and/or other studies, Shin, et al., reported that
among people with diabetes, those who consumed the most eggs (at least one per day)
had a 69 percent higher risk of CVD than those who consumed the least (less than 1 egg
per week or never), while Rong, et al., reported that people with diabetes who consumed
the most eggs had a 54 percent higher risk of coronary heart disease than those who
105
Djoussé, L., & Gaziano, J. M. (2008). Egg consumption and risk of heart failure in the
Physicians’ Health Study. Circulation, 117(4), 512-516.
106
Nettleton, J. A., Steffen, L. M., Loehr, L. R., Rosamond, W. D., & Folsom, A. R. (2008).
Incident heart failure is associated with lower whole-grain intake and greater high-fat dairy and
egg intake in the Atherosclerosis Risk in Communities (ARIC) study. Journal of the American
Dietetic Association,108(11), 1881-1887.
107
Houston, D. K., Ding, J., Lee, J. S., Garcia, M., Kanaya, A. M., Tylavsky, F. A., et al. (2011).
Dietary fat and cholesterol and risk of cardiovascular disease in older adults: the Health ABC
Study. Nutrition, Metabolism and Cardiovascular Diseases, 21(6), 430-437.
108
Hu et al., 1999.
109
Djousse´ & Gaziano, 2008 (AJCN).
110
Tanasescu, M., Cho, E., Manson, J. E., & Hu, F. B. (2004). Dietary fat and cholesterol and the
risk of cardiovascular disease among women with type 2 diabetes. The American journal of
clinical nutrition, 79(6), 999-1005.
Page 35
consumed the least. 111
The DGAC’s failure to describe the impact of dietary cholesterol on people with
diabetes is irresponsible. People with diabetes comprise a large and growing segment of
the population and face a greater risk of heart disease than others. Since 2001, health
authorities including the National Heart, Lung, and Blood Institute have considered
people with diabetes to have the same elevated risk of a cardiovascular event as those
who have existing coronary heart disease. The risk of cardiovascular disease is 70
percent higher among people aged 20 or older with diagnosed diabetes than among
others, according to the CDC. 112 Accordingly, cholesterol goals for people with diabetes
(e.g., LDL less than 100 mg/dL) are far stricter than those for people without the disease.
Furthermore, diabetes is remarkably prevalent in the United States. An estimated
14 percent of men and 11 percent of women aged 20 or older have diabetes. 113 However,
an estimated 28 percent of these people are undiagnosed, according to the National
Diabetes Statistics Report. 114 Even if the Dietary Guidelines were to warn people with
diabetes to limit their intake of whole eggs, the 8.1 million Americans with undiagnosed
disease would have no way of knowing that frequent eating of eggs might raise their risk
of CVD. That’s a reason to encourage the general population to limit their egg (yolk)
intake.
Furthermore, an estimated 37 percent of adults aged 20 years or older—and 51
percent of those aged 65 or older—have pre-diabetes. 115 To our knowledge, studies have
not examined the association between egg consumption and risk of CVD in people with
pre-diabetes. However, the sheer size of this at-risk group and the “diabetes tsunami”
that experts predict in the coming years are cause for concern and another reason why the
Dietary Guidelines should encourage the entire population to reduce consumption of
cholesterol.
Higher Levels of Egg Consumption Increase the Risk of Developing Type 2 Diabetes
Egg consumption is consistently associated with a higher risk of type 2 diabetes.
When researchers tracked roughly 20,000 men in the Physicians’ Health Study for 20
years, those who consumed at least 7 eggs per week had a 58 percent higher risk of type 2
diabetes than those who consumed no eggs. Similarly, among approximately 36,000
women who were followed for 12 years in the Women’s Health Study, those who
111
Shin et al., 2013; Rong et al., 2013.
Centers for Disease Control and Prevention. (2014). National Diabetes Statistics Report:
Estimates of Diabetes and Its Burden in the United States, 2014. Atlanta, GA: U.S. Department of
Health and Human Services.
113
Rates increase with age, to 26 percent among adults aged 60 years and older, and are higher in
African Americans (18 percent) and Hispanics (19 percent) than in non-Hispanic whites
(10 percent). These percentages include people whose diabetes is undiagnosed. Scientific Report
of the 2015 Dietary Guidelines Advisory Committee. Table D1.27, p. 92.
114
CDC, National Diabetes Statistics Report, 2014
115
Id.
112
Page 36
consumed at least 7 eggs per week had a 77 percent higher risk of type 2 diabetes. 116 In a
meta-analysis of those and other studies that tracked more than 69,000 people for nearly
15 years, Shin, et al., found that the people in the highest category of egg consumption (at
least 1 egg per day) had a 42 percent higher risk of type 2 diabetes than those in the
lowest category of consumption (less than 1 egg per week). 117
Those findings are especially troubling given the current prevalence of type 2
diabetes, which imposes an enormous economic and human toll. Diabetes increases the
risk not just of heart disease and stroke but also of blindness, kidney disease, and
amputations. 118 Experts estimate that in 2012, the disease cost the nation $176 billion in
direct medical expenses and $69 billion in indirect costs (including disability, work loss,
and premature death). 119 Despite these high costs, the DGAC ignored the evidence that
dietary cholesterol may raise the risk of type 2 diabetes.
The DGAC’s Dismissal of Concerns about Dietary Cholesterol Undermines the Advice
on Healthy Dietary Patterns. The Final Guidelines Must Clearly State the Limited
Role of Eggs in a Healthy Dietary Pattern.
The DGAC’s conclusion that dietary cholesterol is not a nutrient of concern
threatens to undermine the DGAC’s advice on dietary patterns. The key dietary pattern
recommended by the DGAC is “rich in vegetables, fruit, whole grains, seafood, legumes,
and nuts; moderate in low- and non-fat dairy products and alcohol (among adults); lower
in red and processed meat; and low in sugar-sweetened foods and beverages and refined
grains.” Although the pattern doesn’t include an unlimited quantity of whole eggs, many
people may now wrongly believe that it does because of publicity following the release of
the DGAC’s report. 120
116
Djoussé, L., Gaziano, J. M., Buring, J. E., & Lee, I. M. (2009). Egg consumption and risk of
type 2 diabetes in men and women. Diabetes Care,32(2), 295-300. Although the same authors
found no increased risk of diabetes in the Cardiovascular Health Study, that cohort of older
people was far smaller (3,898 men and women) with only 313 new cases of diabetes. Djoussé,
L., Kamineni, A., Nelson, T. L., Carnethon, M., Mozaffarian, D., Siscovick, D., & Mukamal, K.
J. (2010). Egg consumption and risk of type 2 diabetes in older adults. The American journal of
clinical nutrition, 92(2), 422-427.
117
Egg consumption has not been linked to a higher risk of type 2 diabetes in Finnish and
Japanese studies, possibly because the consumption of eggs in those populations is associated
with unmeasured factors that lower the risk of diabetes. Virtanen, J. K., Mursu, J., Tuomainen, T.
P., Virtanen, H. E., & Voutilainen, S. (2015). Egg consumption and risk of incident type 2
diabetes in men: the Kuopio Ischaemic Heart Disease Risk Factor Study. The American journal of
clinical nutrition, 101(5), 1088-1096;Kurotani, K., Nanri, A., Goto, A., Mizoue, T., Noda, M.,
Oba, S., et al. (2014). Cholesterol and egg intakes and the risk of type 2 diabetes: The Japan
Public Health Center-based Prospective Study. British Journal of Nutrition, 112(10), 1636-1643.
118
CDC, National Diabetes Statistics Report, 2014
119
Id.
120
Abutaleb, Y. (February 19, 2015). “Love to eat eggs? U.S. panel now says they're not a health
risk.” Reuters. Available at http://www.reuters.com/article/2015/02/19/us-usa-health-dietidUSKBN0LN21O20150219. Accessed May 7, 2015; Healy, M. (February 19, 2015).
“Cholesterol is back on the menu in new federal dietary guideline.” LA Times. Available at
Page 37
The DGAC’s report provides “three USDA Food Patterns (Healthy U.S.-style,
Healthy Vegetarian, and Healthy Mediterranean-style) at the 2000 calorie level.” 121
Those patterns include only 3 eggs (3 oz.) per week. 122 The patterns presumably limit
eggs to conform to the DASH and OmniHeart clinical trials that provide strong evidence
for the AHA/ACC’s and DGAC’s dietary pattern guidelines. The 2,100-calorie DASH
and OmniHeart diets contained less than 150 mg of cholesterol per day. 123
Similarly, the USDA Healthy Mediterranean-Style Pattern contains only 232 mg
of cholesterol for a 2,000-calorie diet and the Healthy Vegetarian Pattern contains only
120 mg of cholesterol in a 2,000-calorie diet. 124 USDA’s Food Patterns presumably limit
eggs to leave room for the fruits, vegetables, and other foods in the DGAC's healthy
dietary pattern. Eggs are also limited in the Healthy Eating Index and in most variations
of a Mediterranean diet, which, like DASH/OmniHeart diets, have been associated with a
lower risk of disease. Therefore, it is critical that the DGA clarify that a healthy dietary
pattern would contain only about three whole eggs per week.
In summary, the DGAC’s conclusion that dietary cholesterol is not a “nutrient of
concern” is not based on the best scientific evidence available—that is, controlled clinical
studies, especially metabolic-ward studies, demonstrating that dietary cholesterol raises
LDL cholesterol, a known risk factor for heart disease. Furthermore, the DGAC relied on
the AHA/ACC, rather than conduct its own review of studies on dietary cholesterol, yet
the DGAC’s conclusion (i.e., there is “no appreciable relationship” between dietary and
serum cholesterol) significantly overstates that made by the AHA/ACC (i.e., there is
“insufficient evidence” to determine whether lowering dietary cholesterol lowers LDL).
Moreover, the DGAC’s conclusions about dietary cholesterol are misleading the
public about a healthy intake of whole eggs. The DGAC ignored consistent evidence
from cohort studies reporting that people who consume one or more eggs per day have an
increased risk of type 2 diabetes and an increased risk of cardiovascular disease if they
already have diabetes. By ignoring this evidence, the DGAC has led the public to believe
that a healthy dietary pattern could contain an unlimited quantity of eggs, even though the
DGAC’s own healthy dietary patterns allow only 3 whole eggs per week. It is crucial
that the final DGA clearly and definitively correct these serious misconceptions.
http://www.latimes.com/science/sciencenow/la-sci-sn-dietary-guidelines-cholesterol-20150219story.html. Accessed May 7, 2015; Editorial Board. (February, 2015). “Scientists get egg on their
faces.” Chicago Tribune. Available at http://www.chicagotribune.com/news/opinion/editorials/ctcholesterol-guidelines-edit-0223-20150220-story.html. Accessed May 7, 2015.
121
DGAC Report, Table D1.32; Table 3, Appendix E-3.7.
122
The USDA Healthy Vegetarian Pattern allows 4 eggs per week for those who consume 2,800
calories per day and 1 to 2 eggs for those who consume 1,000 to 1,400 calories per day. DGAC
Report, Table A1, Appendix E-3.7.
123
Appel et al., 1997; Appel et al., 2005.
124
The cholesterol levels in a Healthy Mediterranean-Style Pattern range from 92 mg/day for a
1,000-calorie diet to 300 mg/day for a 3,200-calorie diet. Cholesterol levels in a Healthy
Vegetarian-Style Pattern range from 78 mg per day for a 1,000-calorie diet to 160 mg/day for a
3,200-calorie diet. DGAC Report, Tables B1, B2, Appendix E-3.7.
Page 38
f) Fruits and Vegetables
We concur with the DGAC report that additional measures are needed to
encourage consumption of fruits and vegetables as part of a healthy diet.
Americans currently eat a diet that is low in vegetables and fruits, and this dietary
pattern contributes to increased risk of chronic disease and poor health. Among the U.S.
population, 90 percent do not eat the daily-recommended amount of vegetables, and 80
percent do not eat the daily-recommended amount of fruit. Americans eat few
vegetables, and consumption has even declined by about 10 percent since 2003. 125 Fruit
intake has declined by about 16 percent since the late 1990s, and consumption of fresh
fruit has remained low, but stable. With the exception of children 1–8 years of age, fruit
and vegetable intake among children is low.
Fresh, frozen, and canned fruits and vegetables contribute many important
nutrients of public health concern, including fiber, potassium, iron, folate, and vitamin A.
The DASH and OmniHeart diets, which are rich in fruits and vegetables, lower blood
pressure, LDL cholesterol, and triglycerides. 126 A diet rich in fruits and vegetables is
associated with a decreased risk of cardiovascular disease. 127 High intakes of vegetables
and fruits were the only dietary characteristics consistently associated with many positive
health outcomes. Therefore, the DGAC recommends that the U.S. population be
encouraged to eat a diet rich in fruits and vegetables.
We agree that it will take bold action to achieve healthy dietary patterns in the
U.S. and that environmental and policy changes are important in achieving this goal. The
DGAC notes the importance of implementing comprehensive nutrition standards to
increase fruits and vegetables in school meals. School-based environmental
modifications that also include nutrition education and parent involvement are especially
effective in increasing children’s fruit and vegetable consumption. The DGA also should
recommend that the Supplemental Nutrition Assistance Program (SNAP) give further
consideration to financial incentives for people to buy more fruits and vegetables,
because studies have shown that discounting the cost at stores or farmers markets leads to
greater purchases and, presumably, consumption. 128
125
U.S. Department of Agriculture, Economic Research Service. (2014). Food Availability (Per
Capita) Data System: Loss-Adjusted Food Availability Documentation. Available at
http://www.ers.usda.gov/data-products/food-availability-(per-capita)-data-system/loss-adjustedfood-availability-documentation.aspx. Accessed March 20, 2015.
126
Appel et al., 1997.
127
Wang, X., Ouyang, Y., Liu, J., Zhu, M., Zhao, G., Bao, W., & Hu, F. B. (2014). Fruit and
vegetable consumption and mortality from all causes, cardiovascular disease, and cancer:
systematic review and dose-response meta-analysis of prospective cohort studies. BMJ, 349,
g4490; WCRF/AICR, 2007; Thomson, 2014.
128
U.S. Department of Agriculture, Food and Nutrition Service. (September, 2014). Evaluation of
the Healthy Incentives Pilot (HIP) Final Report: Summary. Available at
http://www.fns.usda.gov/sites/default/files/HIP-Final-Summary.pdf. Accessed March 20, 2015;
Dimitri, C., Oberholtzer, L., Zive, M., & Sandolo, C. (2014). Enhancing food security of low-
Page 39
We urge USDA and HHS to:
1. Strengthen their efforts to encourage all Americans to make half their plates fruits
and vegetables at every meal;
2. Strengthen and promote policies that increase children’s access to more fruits and
vegetables in school meals and the school food environment;
3. Promote policies that increase access to more fruits and vegetables in all other
federal nutrition programs;
4. Fund research on best practices, behavioral economics, and multi-component
interventions that will add to the evidence base concerning how to most
effectively increase American’s fruit and vegetable consumption;
5. Support private efforts to promote the consumption of fruits and vegetables.
g) Whole Grains
We support the Report’s emphasis on whole grains as part of a healthful diet
and encourage USDA and HHS to provide clear recommendations to help
people translate this advice into healthier consumption patterns.
The DGA should include a strong recommendation to consume fewer grains and
to substitute refined grains with whole grains, as recommended by the DGAC. The
advice should be clear that people should substitute refined grains with whole grains, and
not eat more whole grains, as most Americans eat too many grain foods. The DGA
should recommend that Americans limit their consumption of all grains, particularly
white flour and white rice, to four or five small servings a day (for a 2,000-calorie diet)
and that at least half those grains should be whole grains. The Guidelines should not
advise people to consume at least 3 ounce-equivalents of whole grains per day. Instead,
it should focus on percentage of whole grains advice.
To effectively encourage Americans to consume more whole grains without
inadvertently encouraging people to overconsume refined grains, it is important that the
DGA clearly and articulately address whole grains in the diet.
First, the DGA should clearly recommend that consumers reduce their overall
grain intake. As the DGAC pointed out, Americans eat too many grain-based foods.
People get the wrong message when recommendations advise them to “Eat more whole
grains,” since that message could lead people to overeat. Instead, the DGA should warn
that most people consume excessive amounts of grains (from breads, cereals, pasta, rice,
tortillas, pizza crust, cakes, cookies, pies, etc.), and clearly recommend that consumers
income consumers: An investigation of financial incentives for use at farmers markets. Food
Policy.
Page 40
reduce grain intake overall and replace refined grains with whole grains. Furthermore,
the DGA should include illustrations to convey an appropriate size serving of pasta, rice,
etc.
Second, the DGA should continue to recommend that consumers replace foods
made with refined grains with 100 percent whole grains, including wheat berries, quinoa,
rolled or steel-cut oats, brown rice, whole wheat bread, or foods labeled “100 percent
whole grain.” The USDA and HHS should recommend that the percentage of total grains
that are whole grains be labeled on foods to help guide consumers. Furthermore, the
Guidelines should warn consumers that foods with labels such as “8 grams whole grain”
or “made with whole grains” may be mostly refined grain. This straightforward advice
would help people follow the Guidelines by encouraging them to avoid foods with high
amounts of refined grains.
Third, the DGA should not advise people to consume at least 3 ounce-equivalents
of whole grains per day. Instead, focus on the percentage of whole grains advice. The
2010 DGA states that the minimum recommended amount of whole grains for most
Americans is 3-ounce equivalents per day (e.g., 1 one-ounce slice of bread; 1 ounce
uncooked pasta or rice; ½ cup cooked rice, pasta, cereal; 1 tortilla; 1 pancake; 1 ounce
ready-to-eat cereal). To give consumers examples of ways to meet the recommendation,
the Guidelines provides three examples (Figure 4-1 of 2010 DGA). However, practically
no one understands what an “ounce-equivalent” of grains means.
Consumers cannot assume that one slice of bread or one serving of breakfast
cereal is an “ounce-equivalent,” because the weight of a single serving can vary widely.
For example, the weight of one serving (1 cup) of Post Shredded Wheat cereal is 1.7
ounces, while one large blueberry muffin weighs almost 5 ounces. Foods labeled as
containing “8 grams of whole grain per serving” can be misleading. Moreover, for
example, 8 grams of whole grain in a 57-gram serving of uncooked pasta would be only
14 percent whole grain. A 55-gram serving of Post Selects Blueberry Morning cereal
contains 17 grams of whole grain and 16 grams of sugars per 55 gram serving. That
leaves up to 22 grams of refined grain per serving (assuming other ingredients are minor).
Thus, someone would consume more refined grain than whole grain from this “whole
grain-rich” cereal. And few consumers take time to check serving sizes to see how many
ounce equivalents they contain. Ultimately, the Guidelines risks that Americans ignore
the whole grain advice altogether—or consume excess calories from bread, cereal, rice,
etc.—if they do not communicate adequately about how to implement recommendations.
Instead of the current confusion, the Guidelines should advise consumers to look
for foods that are 100 percent whole grain, or at least with whole grain the first
ingredient.
Page 41
D) Water Promotion
We support the development of policies to promote water as the primary
beverage of choice. We also support public education and policy changes to
encourage access to clean water, including a symbol for water as part of the
graphics for MyPlate.
Water is an essential nutrient. 129 Without water, human life can be sustained for
only a few days. Adequate hydration is crucial for the proper function and regulation of
the kidneys and heart thus affecting heart rate, blood pressure, vaso-vagal response, lipid
regulation, removal of body waste products, and thermoregulation; good hydration also
supports mental concentration, mood, skin health, helps prevent headaches, and lubricates
joints. While hydration can come from many sources, low intake of plain water is
associated with poor dietary quality and physical inactivity in youth. 130
Between 2005 and 2010, more than a quarter (28 percent) of children aged 4–13
years old in the United States did not have a drink of plain water on two consecutive
days. 131 Plain water accounted for less than one-third of total daily dietary water intake
from beverages and foods for children aged 4-13 years old. 132 While it is possible to
meet all hydration needs with other sources, plain tap water is ideal because, unlike
sugar-sweetened beverages, it does not contain calories and has virtually no adverse
effects. 133
Recent research shows that substituting drinking water for sugar drinks (sodas,
juice drinks, pre-sweetened tea and coffee drinks, sports drinks, and energy drinks) can
129
National Research Council. (2005). Dietary Reference Intakes for Water, Potassium, Sodium,
Chloride and Sulfate. Washington DC; The National Academies Press.
130
Park, S., Blanck, H. M., Sherry, B., Brener, N., & O'Toole, T. (2012). Factors associated with
low water intake among US high school students—National Youth Physical Activity and
Nutrition Study, 2010. Journal of the Academy of Nutrition and Dietetics, 112 (9), 1421-1427.
131
Drewnowski, A., Rehm, C. D., & Constant, F. (2013). Water and beverage consumption
among children age 4–13y in the United States: analyses of 2005–2010 NHANES data. Nutr J, 12
(1), 85.
132
Id.
133
Popkin, B. M., Armstrong, L. E., Bray, G. M., Caballero, B., Frei, B., & Willett, W. C. (2006).
A new proposed guidance system for beverage consumption in the United States. The American
Journal of Clinical Nutrition, 83 (3), 529-542.
Page 42
help reduce intake of calories from added sugars among both children and adults 134 and
reduce the risk of dental caries. 135
Science-based organizations, such as the Institute of Medicine’s Committee on
Accelerating Progress in Obesity Prevention, 136 Centers for Disease Control and
Prevention, 137 and the American Heart Association’s Voices for Healthy Kids, 138
embrace the importance of water in chronic disease prevention and have called for
improvements in community-wide drinking water access. The American Academy of
Pediatrics encourages water as the best source of hydration for young people. 139
We recommend that HHS and USDA promote plain tap water as the primary
beverage of choice. That recommendation would build on that provided in the 2010
DGA (“To limit excess calories and maintain healthy weight, individuals are encouraged
to drink water and other beverages with few or no calories...”) and the strengthened
recommendations for drinking water made in the 2015 DGAC report:
•
134
“Strategies are needed to encourage the U.S. population to drink water
when they are thirsty. Water provides a healthy, low-cost, zero-calorie
beverage option,” 140 and
Pan, A., Malik, V. S., Schulze, M. B., Manson, J. E., Willett, W. C., & Hu, F. B. (2012). Plainwater intake and risk of type 2 diabetes in young and middle-aged women. The American
Journal of Clinical Nutrition, 95 (6), 1454-1460; Pan, A., Malik, V. S., Hao, T., Willett, W. C.,
Mozaffarian, D., & Hu, F. B. (2013). Changes in water and beverage intake and long-term weight
changes: results from three prospective cohort studies. International Journal of Obesity, 37 (10),
1378-1385; Tate, D. F., Turner-McGrievy, G., Lyons, E., Stevens, J., Erickson, K., Polzien, K., et
al. (2012). Replacing caloric beverages with water or diet beverages for weight loss in adults:
main results of the Choose Healthy Options Consciously Everyday (CHOICE) randomized
clinical trial. The American Journal of Clinical Nutrition, 95 (3), 555-563; Wang, Y. C., Ludwig,
D. S., Sonneville, K., & Gortmaker, S. L. (2009). Impact of change in sweetened caloric beverage
consumption on energy intake among children and adolescents. Archives of Pediatrics &
Adolescent Medicine, 163 (4), 336-343; Zheng, M., Rangan, A., Olsen, N. J., Andersen, L. B.,
Wedderkopp, N., Kristensen, P., et al. (2015). Substituting sugar-sweetened beverages with water
or milk is inversely associated with body fatness development from childhood to
adolescence. Nutrition, 31 (1), 38-44.
135
Guido, J. A., Martinez Mier, E. A., Soto, A., Eggertsson, H., Sanders, B. J., Jones, J. E., et al.
(2011). Caries prevalence and its association with brushing habits, water availability, and the
intake of sugared beverages. International Journal of Paediatric Dentistry, 21 (6), 432-440.
136
Institute of Medicine. (2012). Accelerating Progress in Obesity Prevention: Solving the
Weight of the Nation. Washington, DC: The National Academies Press.
137
Centers for Disease Control and Prevention. (2014). Water & Nutrition. Available at
http://www.cdc.gov/healthywater/drinking/nutrition/. Accessed September 5, 2014.
138
American Heart Association. (2015). Voices for Healthy Kids: Healthy Drinks. Available at
http://www.heart.org/HEARTORG/Advocate/Voices-for-Healthy-Kids--HealthyDrinks_UCM_460610_SubHomePage.jsp. Accessed September 5, 2014.
139
Schneider, M. B., & Benjamin, H. J. (2011). Sports drinks and energy drinks for children and
adolescents: are they appropriate? Pediatrics, 127 (6), 1182-1189.
140
U.S. Department of Agriculture and Department of Health and Human Services. (2015).
Scientific Report of the 2015 Dietary Guidelines Advisory Committee. Available at
Page 43
•
“Approaches might include: Making water a preferred beverage choice.
Encourage water as a preferred beverage when thirsty.” 141
In addition to including strong language on drinking water in the 2015 DGA,
including such slogans such as “Water: First for Thirst,” we recommend education and
promotion to encourage water as a preferred beverage. In 2014, national leaders in
nutrition urged DGAC to encourage a symbol for water on MyPlate. 142 MyPlate is a
powerful teaching tool for young people, to whom SSBs are heavily marketed. 143 The
addition of a water symbol would enable MyPlate to promote water consumption along
with its other messages. Such a MyPlate message would synergize with the Partnership
for a Healthier America’s Drink Up campaign to raise public awareness about the
benefits of drinking water, 144 as well as with key strategies of the Centers for Disease
Control and Prevention designed to decrease consumption of SSBs. 145
Encouraging water consumption would build demand for improved access to
clean and safe tap water, needed in many homes, schools, and other sites across the
country, 146 as recommended by the DGAC:
•
“Free, clean water should be available in public settings, as well as child
care facilities, schools, worksites, publically funded athletic stadiums and
arenas, transportation hubs (e.g., airports) and other community places and
should be promoted in all settings where beverages are offered;” and,
http://www.health.gov/dietaryguidelines/2015-scientific-report/06-chapter-1/d1-3.asp. Accessed
March 8, 2015.
141
Id.
142
Ritchie L, et al. (2014). Letter to Chairwoman Millen and Members of the Dietary Guidelines
Advisory Committee, September 10, 2014. Available at www.npi.ucanr.edu/files/207504.pdf.
Accessed March 8, 2015.
143
Yale Rudd Center for Food Policy and Obesity. (2013). Study Synopses: Sugar-Sweetened
Beverage (SSB) Marketing to Youth. Available at
http://www.yaleruddcenter.org/resources/upload/docs/what/policy/SSBtaxes/SSBStudies_Marketi
ng_to_Youth.pdf. Accessed September 3, 2014; RWJF. (2012). Food and Beverage Marketing to
Children and Adolescents: Limited Progress by 2012, Recommendations for the Future.
Available at http://www.rwjf.org/content/dam/farm/reports/issue_briefs/2013/rwjf404379.
Accessed September 3, 2014.
144
Partnership for a Healthier America. (2015). Drink Up Campaign. Available at
http://ahealthieramerica.org/our-work/you-are-what-you-drink/. Accessed September 3, 2014.
145
Centers for Disease Control and Prevention. (2010). The CDC Guide to Strategies for
Reducing the Consumption of Sugar-Sweetened Beverages. Available at
http://www.cdph.ca.gov/SiteCollectionDocuments/StratstoReduce_Sugar_Sweetened_Bevs.pdf.
Accessed September 3, 2014.
146
Hood, N. E., Turner, L., Colabianchi, N., Chaloupka, F. J., & Johnston, L. D. (2014).
Availability of drinking water in US public school cafeterias. Journal of the Academy of Nutrition
and Dietetics, 114 (9), 1389-1395; Patel, A. I., Hecht, K., Hampton, K. E., Grumbach, J. M.,
Braff-Guajardo, E., & Brindis, C. D. (2014). Tapping into water: key considerations for achieving
excellence in school drinking water access. American Journal of Public Health, 104 (7), 13141319.
Page 44
•
“Make water accessible in public settings, child care facilities, schools,
worksites and other community places where beverages are offered.”
Finally, adding water to the MyPlate graphic would support effective implementation of
the provisions of the Healthy, Hunger-Free Kids Act of 2010 requiring ready access to
water in childcare and in schools, also recommended by the DGAC.
E) Sustainability
We endorse the DGAC’s recognition of sustainability—or food security—as
an essential component of federal dietary guidance.
To improve population nutrition while ensuring food security over the long-term,
dietary patterns and the food production methods to support them must be sustainable.
We specifically endorse the conclusion of the DGAC that “the availability and
acceptability of healthy and sustainable food choices will be necessary to attain food
security for the U.S. population over time.” We commend the DGAC’s careful
consideration of the scientific evidence on this topic and its recognition of sustainability
as an essential component of federal dietary guidance.
Contrary to what is suggested by the industry outcry over the inclusion of these
topics in the expert report, the scope of the committee’s review was limited to the impact
of food-related production and consumption patterns on future food security. That is an
essential and appropriate topic. It makes little sense for the committee or the final
Guideline to recommend healthy dietary patterns that are rich in fruits and vegetables if
the future availability of these are threatened by climate change and other man-made
environmental consequences of current consumption.
The sustainability moniker is, perhaps, unduly broad—a better name for the
inquiry would be “food security,” as it suggests the more tailored exploration of issues
related to the expert report’s investigation. Moreover, the expert report used its
environmental analysis as a supplement to the core nutrition principles it articulated; not
as a primary source. It concluded, rightly, that the public health goal to encourage greater
consumption of fruits and vegetables has a fortunate alignment with the environmental
footprint associated with food production.
The Committee’s findings reflect a rigorous and comprehensive assessment of the
latest scientific evidence and were prepared in close consultation with experts spanning
nutrition, agricultural, and environmental sciences. Its prioritization of these issues is
consistent with a range of scientific consensus organizations, including the National
Research Council, a committee of the Institute of Medicine, and the Academy of
Nutrition and Dietetics. 147 Furthermore, the DGAC’s findings are well aligned with
147
Institute of Medicine. (2014). Sustainable Diets: Food for Healthy People and a Healthy
Planet: Workshop Summary. Washington, DC: The National Academies Press; National Research
Council. (2010). Toward sustainable agricultural systems in the 21st century. Washington, DC:
The National Academies Press; Nordin, S. M., Boyle, M., & Kemmer, T. M. (2013). Position of
Page 45
dietary guidance published by the governments of Germany, Sweden, the Netherlands,
Australia, and Brazil. 148
More specifically, the DGAC’s comprehensive review of the literature found
moderate to strong evidence that, “dietary patterns that promote health also promote
sustainability.” The DGAC’s conclusion supports the assertion that sustainable dietary
choices support both long-term and short-term nutritional health and are closely linked to
the choices recommended for optimal nutrition. Less resource-intensive dietary patterns
support nutrition and reduce greenhouse-gas emissions, land, water, and energy use, and
ecosystem harm. Our nation’s ability to meet future food needs will depend on those
environmental outcomes, particularly in the context of a changing climate, with more
extremes in weather such as drought, resource shortages, changes in global dietary
patterns, and population growth. 149 The DGAC’s review of the effects of individual and
population-level dietary patterns on food security is both timely and in the interest of
public health.
The DGAC’s review indicates that a broad range of dietary patterns high in plantbased foods and low in animal-based foods are more nutritious and sustainable than the
U.S. population’s current average dietary pattern. Consistent with current scientific
literature, the DGAC notes that diets high in animal-based foods, particularly red and
processed meats, are associated with an increased risk of heart disease, diabetes, and
cancer, and worse environmental outcomes.
Seafood consumption is another key dietary component in which health and food
security go hand in hand. However, in recognition of overfishing and rising global
demand, the DGAC encourages the consumption of a variety of seafood associated with
sustainable fishing and aquaculture practices. We applaud the DGAC’s attention to
sustainable seafood production methods. While the report is not comprehensive in its
examination of which methods are best to conserve resources and protect public health,
consideration of food security should be part of the Dietary Guidance concerning
seafood.
In summary, we endorse the DGAC’s conclusion that, “linking health, dietary
guidance, and the environment will promote human health and the sustainability.” The
DGAC’s findings reflect a substantial body of science that illustrates the synergies
between healthy dietary choices and a more secure food system.
the Academy of Nutrition and Dietetics: Nutrition security in developing nations: Sustainable
food, water, and health. Journal of the Academy of Nutrition and Dietetics, 113 (4), 581-595.
148
Health Council of the Netherlands. (June 2011). Guidelines for a healthy diet: the ecological
perspective. Publication no. 2011/08E; Nordic Council of Ministers, Nordic Council of Ministers
Secretariat. (2012). Nordic Nutrition Recommendations 2012: Integrating nutrition and physical
activity; German Council for Sustainable Development. (2013). The Sustainable Shopping
Basket: A guide to better shopping.
149
Nellemann, C. (Ed.). (2009). The environmental food crisis: the environment's role in averting
future food crises: a UNEP rapid response assessment. UNEP/Earthprint.
Page 46
Comments Concerning Additional Issues of Significance to Consumer and Public
Health
1) We support the DGAC’s recommendation for increasing fish consumption,
but disagree with its blanket assessment that the health benefits outweigh the
risks from methylmercury, particularly as concerns the risks of consuming
albacore tuna. Far clearer messages are required to enable consumers—
especially pregnant women—to maximize the benefits of consuming fish
while minimizing risks.
Our support for the DGAC’s assessment that a healthy dietary pattern includes
“seafood” is tempered by the discussion of methylmercury risks in albacore tuna in
Chapter 5. We strongly disagree with its simplistic “one-size fits all” conclusion that the
health benefits of seafood consumption outweigh the risks due to mercury. While that is
true for many individuals, it is not true for people who consume above-average amounts
of high-mercury fish, and/or who are members of vulnerable subpopulations. And, even
for individuals for whom the benefits of seafood consumption outweigh the risks of
mercury, their net benefits increase when mercury levels are lower.
The DGAC relied heavily on a model developed by a Food and Agricultural
Organization and World Health Organization expert consultation in 2010 in reaching its
conclusions. 150 However, that model only considers a small fraction of the adverse
neurodevelopmental effects associated with mercury, and has not been validated.
Furthermore, many epidemiological studies published since the consultation contradict its
findings.
The implication that pregnant women could safely consume 12 ounces a week of
canned albacore tuna with net benefits for infant development and that the FDA/EPA
advice should therefore consider loosening its current recommendation of 6 ounces per
week of that tuna variety, is out of step with the scientific evidence and public health
goals. Available varieties of canned albacore tuna contain 0.35 ppm mercury, on
average. 151 In contrast, other top-consumed seafood choices contain 25 to 40 times less
mercury on average, including canned salmon (0.008 ppm), shrimp (0.009 ppm), and
tilapia (0.013 ppm). 152 FDA lists 49 commercial species with lower average mercury
levels than canned albacore tuna. Twelve ounces of canned albacore tuna contains on
150
Food and Agriculture Organization of the United Nations & World Health Organization.
(2011). Consultation on the Risks and Benefits of Fish Consumption. Rome, 25–29 January 2010.
FAO Fisheries and Aquaculture Report. No. 978. Rome, FAO. 50.
151
FDA. (2014). Mercury Levels in Commercial Fish and Shellfish (1990-2010). Available at
http://www.fda.gov/food/foodborneillnesscontaminants/metals/ucm115644.htm.
152
Id.
Page 47
average 119 µg of mercury. That dose exceeds the levels found to cause harm in recent
epidemiological studies. 153
Prenatal and infant periods are critical points of neurological development.
Advising the public, especially pregnant and breastfeeding mothers, to consume fish high
in fatty acids and low in mercury would greatly benefit the public health, particularly
cognitive development. Advice to pregnant women regarding fish consumption needs to
balance two important objectives: women need to eat more fish to obtain
neurodevelopmental benefits from omega-3 polyunsaturated fatty acids, but they should
choose low-mercury fish, to minimize methylmercury exposure, which poses substantial,
well-documented hazards to neurodevelopment.
A generalized statement that benefits outweigh the risks of contaminants is
unhelpful and for some consumers, dangerously inaccurate. As recognized by the
Institute of Medicine, advice to consumers should be “tailored to individual
circumstances to better inform consumers.” 154 While it is true that for the majority of
consumers, the benefits of seafood consumption outweigh the risks, there is a substantial
minority for whom the risks may outweigh the benefits, depending on the amount
consumed and the species selected. The needs of these individuals, who include women
who are or may become pregnant, breastfeeding women, children, and high-seafood
consumers, including subsistence fishers, should not be overlooked by broad-brush
population-based assessments. For pregnant and nursing women, and small children,
clear guidance is needed on how to choose varieties of seafood that are low in mercury
and high in omega-3 fatty acids. Furthermore, even for consumers for whom the benefits
outweigh the risks, the benefits will outweigh the risks even more if they choose species
lower in methylmercury.
The Guidelines should clearly identify “excellent choices,” “good choices,”
“choices good in moderation,” and “do not eat” for women who are pregnant, may
become pregnant, or who are breastfeeding. Advice should, in addition, define similar
choices for children of different ages so that parents could effectively manage their
children’s exposure. Finally, advice is also needed for people who eat large quantities of
high-mercury species. Doing that would help Americans optimize fish consumption so
as to maximize benefits and minimize risks.
153
See, e.g., comment #4032, submitted by Dr. Edward Groth; comment #233 submitted on
behalf of 13 scientific experts to the Dietary Guidelines Advisory Committee; comment #207
from Stoney Brook University to the Dietary Guidelines Advisory Committee; and comment
#4032 submitted on the Scientific Report of the 2015 DGAC.
154
Nesheim, M. C., & Yaktine, A. L. (Eds.). (2007). Seafood Choices: Balancing Benefits and
Risks. National Academies Press. Available at http://www.nap.edu/catalog/11762/seafoodchoices-balancing-benefits-and-risks.
Page 48
2) The Dietary Guidelines should not state that aspartame is safe, as such a
conclusion is not supported by the evidence, and other scientific authorities
are undertaking more thorough reviews of the safety of aspartame. We are
concerned that aspartame is a carcinogen and also that aspartame may affect
reproduction.
We urge that that the Dietary Guidelines not state that aspartame is safe. Stating
that aspartame is safe, as suggested by the report, would be premature, irresponsible, and
probably incorrect, for five reasons:
1) In April 2014, aspartame was designated “high priority” for review by the
authoritative International Agency for Research on Cancer (IARC). 155 We expect
that IARC’s review will be the most definitive review of the cancer evidence on
aspartame, carefully considering studies on both animals and humans. In contrast,
the DGAC only considered human studies included in the European Food Safety
Authority’s review; the DGAC did not consider animal studies. Yet this is an
inexcusable omission: three independent, well-conducted animal studies that
were more sensitive than any previous study found that aspartame caused cancer.
IARC’s conclusions may well contradict the DGAC’s less-informed finding that
aspartame appears to be safe.
2) The U.S. National Toxicology Program (NTP) and the independent and respected
Ramazzini Institute (RI), both involved in identifying agents that cause cancer,
have an ongoing partnership. 156 NTP and RI collaborated to develop an
immunohistochemistry method to better characterize lesions identified as
leukemias/lymphomas in some RI studies (including studies on aspartame), 157
because different pathologists have reported different numbers of
leukemias/lymphomas in some RI studies. 158 Those lesions are difficult to
155
World Health Organization International Agency for Research on Cancer. (2014). Report of
the Advisory Group to Recommend Priorities for IARC Monographs during 2015-2019. Lyon,
France. Available at: http://monographs.iarc.fr/ENG/Publications/internrep/14-002.pdf.
156
U.S. Department of Health and Human Services National Toxicology Program. (2014).
Partnerships. Available at: http://ntp.niehs.nih.gov/about/org/partnerships/index.html.
157
Soffritti, M., Padovani, M., Tibaldi, E., Falcioni, L., Manservisi, F., & Belpoggi, F. (2014).
The carcinogenic effects of aspartame: The urgent need for regulatory re‐evaluation. American
journal of industrial medicine, 57(4), 383-397; Personal communication, David Malarkey, Group
Leader/NTP Pathologist, NTP Pathology Group, April 8, 2015.
158
U.S. Department of Health and Human Services National Toxicology Program & U.S.
Environmental Protection Agency. (2011). Summary Report of the National Toxicology Program
and Environmental Protection Agency-Sponsored Review of Pathology Materials from Selected
Ramazzini Institute Rodent Cancer Bioassays. Available at
ntp.niehs.nih.gov/ntp/about_ntp/partnerships/international/summarypwg_report_ri_bioassays.pdf;
Pathology Working Group (PWG) Reports for Ramazzini Institute Studies: Pathology QA
(Quality Assurance) Review and PWG Coordinator’s Report for Ramazzini Institute Acrylonitrile
Studies; for Ethyl-tertiary-butyl Ether; for Vinyl Chloride; for Methyl-tertiary-butyl Ether
Page 49
diagnose using light microscopy 159 and were the most frequent cancer type found
in the two rat studies of aspartame conducted by the RI. 160 (Other cancer types
were also found in both rat studies and the study in mice 161 of aspartame.) An
international pathology working group is planned for 2016, which will use results
from this method. 162 That review should resolve, or, at a minimum, greatly
reduce uncertainty over the extent to which aspartame causes
leukemias/lymphomas in rats. It is plausible that that international review, using
results from the NTP-funded method, will produce conclusions that contradict the
finding of the DGAC that aspartame appears to be safe.
3) The DGAC did not include any members who were toxicologists or otherwise
expert in reviewing animal carcinogenicity studies and thus was unable to
independently assess the three cancer bioassays 163 that found an association
between aspartame and various cancers in rats and mice. The Committee did
invite an FDA Division Director from the Office of Food Additive Safety, who,
while not a toxicologist (his academic degrees are in engineering and technology
management), would presumably have access to toxicologists on staff. However,
FDA is on record as stating that it “could not conduct a complete and definitive
review” of the first bioassay on aspartame since it was provided “only limited
data and information” and that it “has not received any data” on the other two
studies. 164 Therefore, the DGAC was unable to assess a major portion of the
evidence on aspartame’s possible long-term effects in rodents. Meanwhile, the
pathology data from the three RI studies are being electronically transferred to the
Studies; and Methyl Alcohol Studies. Available at http://www.nih.gov/icd/od/foia/index.htm.
Accessed April 29, 2015.
159
Gift, J. S., Caldwell, J. C., Jinot, J., Evans, M. V., Cote, I., & Vandenberg, J. J. (2013).
Scientific considerations for evaluating cancer bioassays conducted by the Ramazzini
Institute. Environmental health perspectives, 121(11-12), 1253.
160
Soffritti, M., Belpoggi, F., Esposti, D. D., Lambertini, L., Tibaldi, E., & Rigano, A. (2006).
First experimental demonstration of the multipotential carcinogenic effects of aspartame
administered in the feed to Sprague-Dawley rats. Environmental Health Perspectives, 379-385;
Soffritti, M., Belpoggi, F., Tibaldi, E., Degli Esposti, D., & Lauriola, M. (2007). Life-span
exposure to low doses of aspartame beginning during prenatal life increases cancer effects in
rats. Environmental Health Perspectives, 115(9), 1293.
161
Soffritti, M., Belpoggi, F., Manservigi, M., Tibaldi, E., Lauriola, M., Falcioni, L., & Bua, L.
(2010). Aspartame administered in feed, beginning prenatally through life span, induces cancers
of the liver and lung in male Swiss mice. American journal of industrial medicine, 53(12), 11971206.
162
Personal communication, Fiorella Belpoggi, Director, Cesare Maltoni Cancer Research
Center, Ramazzini Institute.
163
Id.
164
Citizen Petition Denial Letter Responses from FDA/CFSAN to Paul Stoller, MD, available at
http://www.regulations.gov/#!documentDetail;D=FDA-2009-P-0156-0003; and Betty Martini,
available at http://www.regulations.gov/#!documentDetail;D=FDA-2002-P-0247-0023. Accessed
October 24, 2014.
Page 50
Toxicology Data Management System Enterprise (TDMSE) of the NTP 165 and is
available on the RI website. 166
4) The DGAC relied on an assessment by the European Food Safety Authority
(EFSA) that was severely flawed. It was produced by panelists with conflicts of
interest 167 who cut and pasted sections from an industry review on aspartame into
a draft of the report. 168 EFSA glossed over key positive animal study findings,
overlooked weakness of negative studies, and ignored information and analysis
conducted by U.S. government scientists relevant to interpretation of the RI
data. 169
5) Most important, there is compelling evidence that aspartame causes cancer in
animals. As previously noted, cancers at multiple sites were observed in two
species in three high-quality rodent bioassays. Those studies were published in
peer-reviewed journals, including two papers in Environmental Health
Perspectives, which is published by the U.S. National Institute of Environmental
Health Sciences (NIEHS). The finding in a recent prospective human cohort
study170 of a statistically significant increased risk in the incidence of similar
(lymphohematopoietic 171) tumor types as seen in two animal studies lends further
support to the conclusion that aspartame is likely carcinogenic in humans,
165
Personal communication, John Bucher, Associate Director, NTP and Director, NTP Division,
April 7, 2015.
166
Ramazzini Institute. (2015). Carcinogens. Available at http://www.ramazzini.org/centro-diricerca/cancerogeni/.
167
Milstone, E. (2013). EFSA on Aspartame January 2013: A lost, but not the last, opportunity.
Submitted 2/22/13 to Ms. Claudia Heppner, Head of EFSA “Food Ingredients and Packaging”
Unit and Mr. George Kass, Senior Scientific Officer, EFSA “Food Ingredients and Packaging”
Unit. Available at
http://sro.sussex.ac.uk/43821/1/EM_Letter_to_EFSA_on_Aspartame_22Feb2013.pdf. The
panel’s composition changed slightly (two additional members were added) by the time the final
report was published.
168
Cicolella, A. (2013). Re-evaluation of Aspartame. Available at
http://www.efsa.europa.eu/en/events/documents/130409-p08.pdf. Accessed April 29, 2014.
Submitted to EFSA as part of the public consultation on the draft EFSA scientific opinion on the
re-evaluation of aspartame as a food additive.
169
Id.; Milstone, 2013; See also Comments submitted by Center for Science in the Public Interest,
Kathleen Burns PhD, Director, Sciencecorps, James Huff PhD, Guest Researcher, National
Institute of Environmental Health Sciences (for affiliation purposes only), Ronald Melnick PhD,
Ron Melnick Consulting LLC on Draft scientific opinion on the re-evaluation of aspartame as a
food additive, EFSA Panel on Food Additives and Nutrient Sources added to Food Consultation.
Available at http://www.cspinet.org/new/pdf/aspartame-efsa-final-comments-21913.pdf.
170
Schernhammer, E. S., Bertrand, K. A., Birmann, B. M., Sampson, L., Willett, W. C., &
Feskanich, D. (2012). Consumption of artificial sweetener–and sugar-containing soda and risk of
lymphoma and leukemia in men and women. The American journal of clinical nutrition, 96(6),
1419-1428.
171
Leukemias and lymphomas (seen in the rodent studies) and non-Hodgkins lymphoma and
multiple myeloma, and possibly leukemia, in the human study.
Page 51
although a subsequent study did not find an increase. 172 The fact that results were
only observed in men and not women is not a scientifically sound basis for
dismissing the results of the Schernhammer16 study. As the study authors noted,
compared to women, men have higher activity of an enzyme that converts
methanol (a breakdown product of aspartame) to formaldehyde, a known human
carcinogen. Formaldehyde, as well as chemicals that metabolize to
formaldehyde, cause lymphohematopoietic and other cancers in animal studies
conducted by the RI as well as other laboratories. 173 The evidence that
formaldehyde caused these cancers in humans came well after the development of
the base of evidence in animal studies.
Thus, the DGAC’s conclusion that aspartame is or appears to be safe is premature
at best and very likely wrong. We urge that the final Guidelines not include any
statement about the safety of aspartame, other than noting that the studies that have been
conducted raise safety questions and need to be analyzed in greater detail. The safety of
aspartame should instead be reviewed for the 2020 Dietary Guidelines after the IARC
evaluation and the international pathology review are completed.
In addition the Committee’s particular advice to consumers regarding
consumption of aspartame is problematic and would be very difficult for consumers to
implement. We do commend the Committee for recommending water as the preferred
beverage and for its recognition of water as a healthy, low-cost, zero-calorie beverage
option. We urge that recommendation be included prominently in the Guidelines. We
agree that low-calorie sweeteners should not be recommended as a primary
replacement/substitute for added sugars in foods and beverages.
However, the report indicates that if individuals choose to drink beverages that
are sweetened with aspartame, they should stay below the aspartame Acceptable Daily
Intake (ADI). But a recommendation that exposure not exceed the ADI is not appropriate
for suspected carcinogens, because carcinogens should be assumed to cause cancer at
rates proportional to the amounts consumed, unless there are specific reasons why that
might not be the case. In fact, as noted by Scherhammer, et al., aspartame caused cancers
in animal studies at levels much lower than the ADI. If anything, the Guidelines should
recommend that the amount of artificial sweeteners be listed on labels.
The report also states that “[t]o be cautious, adults and children should be aware
of the amount of aspartame they are consuming, given the need for more long-term
human studies.” That statement is unhelpful. First, consumers cannot “be aware” of the
amount they are consuming since the amount of aspartame contained in products is not
172
McCullough, M. L., Teras, L. R., Shah, R., Diver, W. R., Gaudet, M. M., & Gapstur, S. M.
(2014). Artificially and Sugar-Sweetened Carbonated Beverage Consumption Is Not Associated
with Risk of Lymphoid Neoplasms in Older Men and Women. The Journal of nutrition, jn-114.
173
Gift et al., 2013.
Page 52
even listed on labels (as it is in Canada). Second, most consumers are not aware that
aspartame can be present in foods that are not labeled “sugar-free” or “diet,” such as
cereal (e.g., General Mills Original Fiber One) and yogurt (e.g., Dannon Light and Fit
Strawberry Non Fat Yogurt, Yoplait Light Yogurt Very Vanilla Fat Free). Finally, even
if, through considerable research, individuals could determine how much aspartame they
were consuming, it is unclear how that knowledge would be useful to them.
The report states that “aspartame in amounts commonly consumed is safe and
poses minimal health risk for healthy individuals without phenylketonuria” (emphasis
added). The amount “commonly consumed” is not defined or described. Furthermore,
aspartame appears to be a potent carcinogen, judging from the RI animal studies;
significant increases in cancers relative to controls were noted in animals treated with
much smaller doses than are generally used in animal studies. Amounts “commonly
consumed” may thus increase the risk of cancer to an unacceptable degree. Also, many
people who consume aspartame and other no- or low-calorie sweeteners suffer from
metabolic disorders and are not healthy; yet there is no advice directed toward them.
Aspartame is also associated with a risk of pre-term delivery, as the DGAC report
notes. In light of that, and since in utero exposure to suspected human carcinogens is of
particular concern, pregnant women should be advised to avoid aspartame.
3) For clarity of message and to protect public health, we strongly urge that the
2015 Guidelines maintain the definition of “moderate drinking” as a
maximum of one drink a day for women and two drinks a day for men as
was recommended in the 2010 Dietary Guidelines.
The DGAC’s scientific report repeats the mistake made by the advisory panel in
2010, but was appropriately corrected in the final 2010 Guidelines. It effectively
increases the maximum of one drink a day to three for women and from a maximum of
two drinks a day to four for men by using the word “average.” 174 An “average” of two
drinks a day for a man over the course of a week would allow four drinks on three days
of that week, as an example of how this advice could be interpreted.
The higher recommended limits are based on the finding that few people who
drink at those limits or less meet clinical standards for alcohol use disorder. Five drinks
at a time for men or four drinks for women are often defined as a “binge” or as “heavy
episodic drinking.” Drinking at those levels will bring the average adult close to the .08
legal limit for drinking and driving.
174
U.S. Department of Agriculture and Department of Health and Human Services. (2015).
Scientific Report of the 2015 Dietary Guidelines Advisory Committee. Available at:
http://health.gov/dietaryguidelines/2015-scientific-report/. Appendix E5, lines 249-252.
Page 53
Alcohol consumption at these “average” levels fails to reflect the evidence
regarding alcohol’s role in health and would lead to greater alcohol-related injury and
death on our roadways and elsewhere. The report repeatedly characterizes alcohol
consumption as “a component of a healthy dietary pattern,” but the report itself
recommends against starting to drink as a health measure. 175
The report also contradicts itself, stating “there is an inverse association between
dietary patterns that are…moderate in alcohol...and risk of colon/rectal cancer” 176 while
Table D2.2 presents evidence that alcohol is a convincing or probable cause of six kinds
of cancer, including colorectal cancer. Alcohol’s role in depression is ignored. 177 Yet
the literature on alcohol’s role in depression is well documented. 178
Finally, significant problems related to alcohol use can occur from drinking at
these proposed maximums. According to the National Highway Traffic Safety
Administration, in 2012 more than 1,700 Americans died in automobile crashes where
the driver’s blood alcohol concentration (BAC) was between .01 and .07, 179 the level to
which BAC could rise after consumption of three drinks for women or four drinks for
men on a single occasion.
In practice, impairment begins at levels substantially lower than .08 (as reflected
in the fact that most European countries set the maximum BAC for drivers at .05 or
lower), 180 which underscores the need to retain the maximums of one drink per day for
women and two drinks per day for men that were in the 2010 Dietary Guidelines.
4) The Committee’s advice to pregnant women on caffeine is incorrect. Even
moderate intake of caffeine during pregnancy appears to be associated with
serious risks, including low birth weight. Moreover, the committee failed to
consider the evidence linking coffee consumption by pregnant women to
childhood leukemia. The advice should be to avoid caffeine in coffee or other
non-de-minimis forms during pregnancy.
Regarding caffeine consumption during pregnancy, the Committee concluded that
“[b]ased on existing evidence, pregnant women, or women planning to become pregnant,
should be cautious and adhere to current recommendations of the ACOG [American
College of Obstetrics and Gynecology] regarding caffeine consumption, and consume no
175
Id., Part A, p. 4, lines 133-134.
Id., Part D, chapter 2, p. 30.
177
Id., Part D, chapter 2, p. 38.
178
Boden, J. M., & Fergusson, D. M. (2011). Alcohol and depression. Addiction,106(5), 906-914.
179
National Highway Traffic Safety Administration. (2012). Traffic Safety Facts. p. 42. Available
at http://www-nrd.nhtsa.dot.gov/Pubs/812032.pdf. Accessed April 16, 2015.
180
European Transport Safety Council. (2014). Blood Alcohol Content (BAC) Drink Driving
Limits Across Europe. Available at http://etsc.eu/blood-alcohol-content-bac-drink-driving-limitsacross-europe/. Accessed April 16, 2015.
176
Page 54
more than 200 mg per day.” Yet substantial evidence published after ACOG’s advice
indicates that following that recommendation could increase the risk of both adverse
pregnancy outcomes and childhood leukemia. We urge the Guidelines to instead use
language similar to the clearer, stronger language that FDA did in its advice from 1981
on “Caffeine and Pregnancy,” which recommended that “Pregnant women should avoid
caffeine-containing foods and drugs if possible, or consume them only sparingly.” 181
First, the data indicate an incremental risk of adverse pregnancy outcomes
associated with “moderate” levels of caffeine. Caffeine has diverse acute and chronic
pharmacological effects and readily crosses the placenta; also, the fetus has a relative
inability to metabolize the drug. Those phenomena provide strong and biologically
plausible mechanisms by which maternal consumption of caffeine could affect pregnancy
outcomes.
A series of four successive reviews published from 1985 to 1997 investigating the
evidence that caffeine contributes to fetal growth restriction and low birth weight
concluded most recently, in 1997, that the evidence was “strong.” 182 Since then, findings
from new studies converge to indicate the now scientifically robust finding that maternal
caffeine contributes to low birth weight. A recent large prospective study, Sengpiel et al.
(2013), examined caffeine consumption in nearly 60,000 pregnant women. 183 A robust
dose-response relation was found for the outcomes of low birth weight and small for
gestational age. Those findings were confirmed in the latest comprehensive metaanalysis of maternal caffeine consumption and pregnancy outcomes by Chen et al.
(2014). 184 The finding of a dose-response relation without a discernible threshold is
strongly indicative of a causal contribution of caffeine to low birth weight.
The Committee appears to have taken no notice of the Chen meta-analysis,
relying instead upon a 2014 meta-analysis by Greenwood, et al. The Goodwin study also
concluded that there is evidence across multiple studies for an incremental dose-response
curve for caffeine and multiple serious birth outcomes:
An increment of 100 g [sic: mg] caffeine was associated with a 14% (95% CI 10–
19%) increase in risk of spontaneous abortion, 19% (5–35%) stillbirth, 2% (-2 to
181
FDA. (1981). Caffeine and Pregnancy. HHS Publication No. (FDA) 81-1081.
James, J. E., & Paull, I. (1985). Caffeine and human reproduction. Reviews on environmental
health, 5(2), 151-167; James, J. E. (1991). Caffeine and health (pp. 42-7). London: Academic
Press; James, J. E. (1997). Understanding caffeine: A biobehavioral analysis. Sage Publications,
Inc.
183
Sengpiel, V., Elind, E., Bacelis, J., Nilsson, S., Grove, J., Myhre, R., et al. (2013). Maternal
caffeine intake during pregnancy is associated with birth weight but not with gestational length:
results from a large prospective observational cohort study. BMC medicine, 11(1), 42.
184
Chen, L. W., Wu, Y., Neelakantan, N., Chong, M. F., Pan, A., & van Dam, R. M. (2014).
Maternal caffeine intake during pregnancy is associated with risk of low birth weight: a
systematic review and dose–response meta-analysis. BMC medicine, 12(1), 174.
182
Page 55
6%) preterm delivery, 7% (1–12 %) low birth weight, and 10% (95% CI 6–14%)
SGA [small for gestational age]. 185
As that indicates, for miscarriage, and only slightly less so with low birth weight
and SGA, a consistent positive association across virtually all of the studies included in
the meta-analysis was found. As the authors note, adjustment for smoking and other
differences among studies were not consistently associated with the observed differences
in the results; the heterogeneity in results “mostly reflected variation in the size of the
association, rather than whether there was an association.” 186 The Greenwood authors
also acknowledge the plausible biological mechanisms, evidence from animal studies,
mounting evidence from observational human studies, and dose-response slopes.
Furthermore, Greenwood et al. note that there is no identifiable threshold below
which the associations are not apparent. Although the authors state that the size of the
associations are modest and might be explained by bias in study design or publication,
the results of the meta-analysis for miscarriage in particular are striking in that the lowest
estimated effect at the 95 percent confidence interval is a 10 percent increase in risk of
miscarriage per 100 mg/caffeine. Thus, associations exist within the range for normal,
even low, consumption of coffee, which contains on the order of 100 mg/cup (although
associations are stronger above 300 mg/day). In plain terms, the data show that for each
cup of coffee consumed, there is a significantly increased risk of miscarriage, low birth
weight, and SGA.
Women should be informed of the increase in risks associated with 100 mg of
caffeine, rather than being referred to a general policy that is widely understood, on
pregnancy-advice sites, as indicating that there are no risks to pregnancy at levels of
maternal consumption of 200 mg/day or lower. 187 While in absolute terms the risk of
adverse pregnancy outcomes may remain small, the magnitude of incremental risk being
increased by a purely voluntary activity (i.e., 14 percent for miscarriage per 100 mg of
caffeine, or 28 percent per two cups of coffee) is not. Consumption of coffee may confer
some benefit to some pregnant women; however, some women may only be drinking
coffee while pregnant out of longstanding habit or an addiction to caffeine—and those
women might choose differently if advised of the risks.
185
Greenwood, D. C., Thatcher, N. J., Ye, J., Garrard, L., Keogh, G., King, L. G., & Cade, J. E.
(2014). Caffeine intake during pregnancy and adverse birth outcomes: a systematic review and
dose–response meta-analysis. European journal of epidemiology, 29(10), 725-734.
186
Id.
187
American College of Obstetricians and Gynecologists. (2013). Committee Opinion: Moderate
Caffeine Consumption During Pregnancy. Number 462, August 2010, Reaffirmed 2013.
Available at http://www.acog.org/Resources-And-Publications/Committee-Opinions/Committeeon-Obstetric-Practice/Moderate-Caffeine-Consumption-During-Pregnancy. Accessed Nov. 1,
2014.
Page 56
Critically, the risk curve lacks a “threshold” as suggested by the current advice
and is instead linear for miscarriage, low birth weight, and SGA. While the impact of a
miscarriage or stillbirth is obviously devastating, it is also the case that low birth weight
and SGA inflicts serious health consequences, some of them life-long, for children, as
noted in the Greenwood meta-analysis. 188 SGA is associated with “increased risk of
perinatal mortality and morbidity, including perinatal asphyxia,” as well as “increased
incidence of obesity, hypertension, hypercholesterolemia, cardiovascular disease, and
type 2 diabetes.” 189 Furthermore, it makes sense to include a safety factor in
recommending a dose of caffeine well below the lowest observed effect level.
The only sound evidence-based recommendation that can be made at this time is
for caffeine abstinence or de minimis consumption during pregnancy. In that context,
caffeine abstinence refers specifically to avoidance of coffee, tea, cola and other caffeinecontaining sodas, caffeine-containing “energy” drinks or other caffeine-containing
supplements and drugs. The negligible caffeine content of chocolate and chocolate
confectionaries, chocolate cake, hot chocolate, and decaffeinated coffee and tea is such
that those products generally need not form part of the maternal caffeine-avoidance
regimen. 190 Given the increase in risks, the final Guidelines should indicate that:
“Pregnant women should avoid caffeine-containing foods and beverages.”
On another aspect of caffeine, the Committee failed to consider two metaanalyses on maternal coffee consumption and childhood leukemia—one in 2014 that
found a dose-related increased risk of childhood acute leukemia (both acute
lymphoblastic leukemia and acute myeloid leukemia) 191 associated with maternal coffee
consumption and another in 2011 that found an increased risk of childhood acute
leukemia associated with maternal coffee consumption, especially among non-smoking
mothers. 192 CSPI and two distinguished experts 193 called that issue to the attention of the
Committee, but were ignored.
As those comments indicated, the evidence linking maternal coffee consumption
during pregnancy and childhood acute leukemia is strong, and the increased lifetime
188
Greenwood, 2014, p. 732.
Id.
190
James, 1991; James, 1997.
191
Cheng, J., Su, H., Zhu, R., Wang, X., Peng, M., Song, J., & Fan, D. (2014). Maternal coffee
consumption during pregnancy and risk of childhood acute leukemia: a metaanalysis. American
journal of obstetrics and gynecology,210(2), 151-e1.
192
Milne, E., Royle, J. A., Bennett, L. C., De Klerk, N. H., Bailey, H. D., Bower, C., et al. (2011).
Maternal consumption of coffee and tea during pregnancy and risk of childhood ALL: results
from an Australian case–control study. Cancer Causes & Control, 22(2), 207-218.
193
Comments from CSPI (comment ID #836), comments from Dr. Peter Infante, former Director,
Office of Standards Review, Health Standards Program, U.S. Occupational Safety and Health
Administration (comment ID #865 and #815), and Dr. Steven Bayard, former Director, Office of
Risk Assessment, Directorate of Science, Technology and Medicine, US Occupational Safety and
Health Administration (comment ID #823).
189
Page 57
childhood acute leukemia risk due to maternal coffee drinking of 1–2 cups per day during
pregnancy was calculated as 19 per 100,000—an unacceptable risk. Those meta-analyses
provide further justification for advising women to avoid coffee/caffeine during
pregnancy.
5) The Committee failed to consider the safety of artificial food dyes. Yet
artificial food dyes have been demonstrated to negatively impact behavior in
susceptible children and in Europe are generally used only with warning
labels. The final Guidelines should call for individuals and institutions to
phase food dyes out of the diets of children and to emphasize the health value
from a rainbow of real fruits and vegetables instead.
A possible link between food ingredients and adverse behaviors such as
hyperactivity was first raised in the 1970s, and while it attracted the attention of scientists
as well as the public, the Food and Drug Administration (FDA) largely dismissed it.
(The FDA even sponsored one of the early studies that found that some children were
affected by dyes.) Over the past 40 years, numerous studies have demonstrated that food
dyes and other ingredients can prompt adverse behavioral responses in children.
FDA has acknowledged the growing body of evidence that dyes can affect
behavior. After evaluating the numerous studies implicating artificial dyes in behavioral
disorders, the agency concluded in 2011 that:
Exposure to food and food components, including artificial food colors and
preservatives, may be associated with adverse behaviors, not necessarily related to
hyperactivity, in certain susceptible children with Attention Deficit Hyperactivity
Disorder (ADHD) and other problem behaviors, and possibly in susceptible
children from the general population. 194
FDA official Mitchell Cheeseman cited that finding in an article responding to
criticism of the agency’s inaction on food dyes. 195 The agency, however, still has not
pursued regulatory action to protect the public by banning dyes or requiring a notice on
labels warning that the dyes may cause adverse behavioral reactions.
That contrasts with the British Food Standards Agency, which has encouraged the
food industry to stop using certain food dyes; lists food establishments with products free
from these food dyes; and advises consumers to eliminate certain food dyes from the diet
194
U.S. Food and Drug Administration Food Advisory Committee. (2011). Overview and
Evaluation of Proposed Association Between Artificial Food Colors and Attention Deficit
Hyperactivity Disorders (ADHD) and Problem Behaviors in Children. Available at
http://www.fda.gov/downloads/AdvisoryCommittees/CommitteesMeetingMaterials/FoodAdvisor
yCommittee/UCM273033.pdf.
195
Cheeseman, M. A. (2012). Artificial food color additives and child behavior. Environmental
health perspectives, 120(1), a15.
Page 58
of children showing signs of hyperactivity or ADHD. 196 The European Parliament
requires that foods throughout the European Union (EU) that contain certain food dyes
bear a warning notice, “may have an adverse effect on activity and attention in
children.” 197 As a result of those actions, few foods marketed in the EU contain some of
the dyes most commonly used in the United States (including Red 40, Yellow 5, and
Yellow 6, which together comprise more than 90 percent of the dyes used in this
country).
Meanwhile, the evidence of harm to children continues to mount. Three separate
meta-analyses, including one sponsored by an arm of the food industry, have concluded
that dyes can trigger hyperactivity or ADHD symptoms in sensitive children. 198 A recent
review concludes that “food colo[r] elimination is a potentially valuable treatment
approach for ADHD.” 199 It is important to recognize that ADHD can be debilitating to
children and their families, because it makes it challenging for children to study, focus on
hobbies, and maintain friendships. While the number of children with ADHD who are
adversely affected by food dyes is not known, dyes nevertheless contribute an entirely
preventable amount to the enormous costs to society of ADHD in children, estimated to
be between $36 billion and $54.2 billion (in 2005 dollars, assuming a prevalence of
5 percent). 200 Indeed, removing dyes from the food supply may be one of the only public
health measures that could be deployed to reduce behavioral problems in children.
196
UK Food Standards Agency. (2014). Products Free From the Colours Associated with
Hyperactivity. Available at http://www.food.gov.uk/policyadvice/additivesbranch/foodcolours/colourfree/#.UlL9gRD0hD4; UK Food Standards Agency.
Food Additives and Children’s Behavior. Available at http://www.food.gov.uk/policyadvice/additivesbranch/foodcolours/colourfree/#.UlL9gRD0hD4.
197
European Union. (2008). Regulation (EC) No 1333/2008 of the European Parliament and of
the Council of 16 December 2008 on food additives. Available at http://eurlex.europa.eu/LexUriServ/LexUriServ.do?uri=OJ:L:2008:354:0016:0033:en:PDF.
198
Sonuga-Barke, E. J., Brandeis, D., Cortese, S., Daley, D., Ferrin, M., Holtmann, M., et al.
(2013). Nonpharmacological interventions for ADHD: systematic review and meta-analyses of
randomized controlled trials of dietary and psychological treatments. American Journal of
Psychiatry, 170(3), 275-289; Nigg, J. T., Lewis, K., Edinger, T., & Falk, M. (2012). Metaanalysis of attention-deficit/hyperactivity disorder or attention-deficit/hyperactivity disorder
symptoms, restriction diet, and synthetic food color additives. Journal of the American Academy
of Child & Adolescent Psychiatry, 51(1), 86-97; Schab, D. W., & Trinh, N. H. T. (2004). Do
artificial food colors promote hyperactivity in children with hyperactive syndromes? A metaanalysis of double-blind placebo-controlled trials. Journal of Developmental & Behavioral
Pediatrics, 25(6), 423-434.
199
Stevenson, J., Buitelaar, J., Cortese, S., Ferrin, M., Konofal, E., Lecendreux, M., et al. (2014).
Research Review: The role of diet in the treatment of attention‐deficit/hyperactivity disorder–an
appraisal of the evidence on efficacy and recommendations on the design of future
studies. Journal of Child Psychology and Psychiatry, 55(5), 416-427.
200
Pelham, W. E., Foster, E. M., & Robb, J. A. (2007). The economic impact of attentiondeficit/hyperactivity disorder in children and adolescents. Ambulatory Pediatrics, 7(1), 121-131.
Page 59
Moreover, artificial dyes are sometimes used in school foods and often used in
snack foods as cheap substitutes for real fruits and vegetables, misleading children about
the healthfulness of their diet and the foods they are being served. Children should be
eating a rainbow of real nutrients. The Guidelines’ emphasis on increasing the fruits and
vegetables consumed by children would be well served by policies that require labeling
or prohibitions to protect children from artificial dyes.


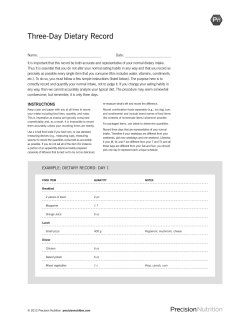


© Copyright 2026