
Illinois Property Taxes - Center for Tax and Budget Accountability
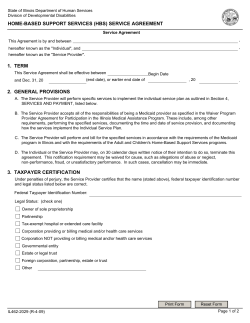
Issue Brief
I L L I N O I S P R O P E R T Y T A X E S —U P D A T E D
by Amanda Kass, Research Director
May 14, 2015
The property tax is the largest single revenue source in Illinois, even
though Illinois does not have a state property tax. The property tax is
purely a local tax, imposed and administered by local governments
(counties, townships, municipalities, school districts, special districts,
etc.). It is imposed on the value of real property (land, buildings, and
permanent fixtures).
From assessment to payment, the property tax is a three part process.
First, a value, or assessment, is placed on the property. Next, the taxing district (schools, counties, etc.) file a levy with the county clerk.
The levy is the dollar amount of revenue the applicable unit of government needs. Last, the county clerk calculates the tax rate that is required to produce the aggregate amount of the all levies made, based
on the assessed value of each property in the district.
Steps in the Property Tax Cycle
1 Assessment — Local assessing officials establish a
value for each property.
2 Review — An appeal of assessed value by property
owner.
3 Equalization — Application of equalization factor
(multiplier) to assure that the median level of
assessments in a county is 33 and 1/3 percent of the
total FMV in that county.
4 Levy — Taxing districts determine the dollar amount
of property tax revenue needed to pay for services.
5 Extension — County clerk apportions the levy
among the properties in a taxing district according
to its assessed value.
6. Collection and distribution— Taxpayers pay
their bills and payments are allocated to the local
taxing authorities.
Most Illinois property is assessed at 33 and 1/3 percent of its market
value. By law, the state must equalize any assessment discrepancies
to ensure that the median level of assessments in each county is actually 33 and 1/3 percent of the total fair market value of property in that
county. (Farmland is assessed on its agricultural value, not market value). To do this, the Illinois Department of Revenue reviews
the aggregate assessed value in each county, and then assigns an equalization factor ( or multiplier) to that county, needed to
make the overall assessment the 33 and 1/3 percent of total fair market value requisite. Cook County is the only county that has
an equalization factor great than one. This is because Cook County has a classification system, which assesses property at different rates depending on its use—e.g. residential, commercial, industrial.
Who Pays The Property Tax And Where Does The Money Go?
Figure 1
Figure 2
2013 Property Tax Extensions by Class
2013 Property Tax Extensions by District
Other Special Districts
5.1%
Commercial
22.52%
Cities, Villages &
Incorporated Towns
16.3%
Minerals
0.12%
Residential
64.43%
Industrial
9.23%
K-12
Schools
58.3%
County
7.0%
Sanitary
2.0%
Farm
3.26%
Source: Illinois Department of Revenue
Township
2.5%
Railroads
0.44%
Park
3.8%
Source: Illinois Department of Revenue
© 2015, Center for Tax and Budget Accountability
Community Colleges
3.9%
Page 1 (continued on back)
K-12 Education and the Property Tax
Figure 3 shows the percentage of property taxes used to fund local K-12 schools, broken down by region. In 2013 (the latest
regional data available) almost 60% of all property taxes went to K-12 education statewide.
Figure 3
2013
Statewide
Cook County
Collar Counties
Rest of State
Total Property Tax Levied
$27,128,941,225
$12,149,576,492
$8,567,246,035
$6,412,118,699
School Portion
$16,111,238,058
$6,792,979,558
$5,655,826,868
$3,662,431,632
School as a Percentage of Total
Tax
59.4%
55.9%
66.0%
57.1%
Source: Illinois Department of Revenue.
Illinois relies more on property taxes to fund local schools than all other states.
Figure 4
2011-2012
Illinois Rank
Comment
Percentage of Revenue for Schools from
Local Governments
1st at 63.3%
National average is 44.6%
Sources: National Center for Education Statistics. Figure for Illinois was adjusted to exclude state contribution to the
Teachers’ Retirement System for unfunded pension liabilities ($1.7 billion). If that amount is included, Illinois ranks second.
How Do Property Tax Revenues Compare to Other Tax Revenues?
Property tax collections are the greatest source of revenue in the state. In fact, property tax revenues alone are greater than
personal and corporate income taxes and sales taxes combined.
Figure 5
Property Tax Levy
2013 Collections
($ Billions)
$19,994
Sales Tax Revenues
$6,331
Corporate and Personal Income Tax
Revenues
$8,208
Source: Illinois Department of Revenue
How Does Illinois Compare to the Nation?
Figure 6 illustrates Illinois national rankings in property taxes collected.
Figure 6
Illinois Rank (FY2012)
Comment
10th at $1,991 per capita
National Average is $1,383
Property Tax Revenue as a Percentage of Total
State and Local Revenue
4th at 21.5%
National Average is 13.9%
Property Tax Revenue as a Percent of Personal
Income
9th at 4.4%
National Average is 3.2%
Per Capita Property Tax Revenue
Sources: State and local revenue from the 2012 Census of Governments: State & Local Finances; population from U.S. Census Bureau, 2008-2012 American
Community Survey; and, personal income data from U.S. Bureau of Economic Analysis and Bureau of the Census.
C E N T E R F O R T AX AN D B UD G E T A C C O U N T AB I L I T Y
7 0 E . L AK E S T , S UI T E 1 7 00
C H I C AG O , I L 60 601
P H O N E : (3 1 2 ) 3 22 -1 041
F AX : (3 1 2 ) 5 78 -9 25 8
W W W . C T B AO N L I N E . O R G
Page 2
© 2015, Center for Tax and Budget Accountability


© Copyright 2026