
Assignment 1: Total Sort (1 P.) Assignment 2: MapReduce Cost
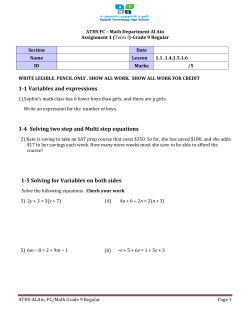
Distributed Data Management SS 2015
Prof. Dr.-Ing. Sebastian Michel
MSc. Evica Milchevski, MSc. Kiril Panev
TU Kaiserslautern, FB Informatik – Lehrgebiet Informationssysteme
Sheet 3: Handout 14.05.2015, Presentation 26.05.2015
http://dbis.informatik.uni-kl.de
Assignment 1: Total Sort
(1 P.)
We have seen in the lecture that creating a sorted output is only possible within the output of a reducer,
but not globally across the individual output files. The naive solution to perform a total sort is to use
only one reducer but this is apparently for large data not advisable. Instead, one way to split work across
multiple reducers is to let each reducer handle a specific key range, such that the reducers’ output files
need just to be “concatenated” to have a fully sorted output.
(a) MapReduce job for Total Sort: Write pseudo code of a MapReduce job that is doing this total
sort based on key ranges. For this, assume input in form of pairs of integer values of employee id and
salary. We know the salary is between 0 and 100,000 and want to sort by salary in descending order.
(b) Load Balancing using Histograms: Without knowledge of the distribution of the salary values
(i.e., how many employees have a specific salary) it is not possible to group by partitions that impose
roughly the same load to each reducer, in terms of number of tuples to process. Luckily, we have the
following histogram at hand that shows 20 equi-width cells in the range 0 to 100,000, showing how many
employees have a salary that falls in that cell. Assume that data is uniformly distributed within each cell.
(i) Compute given this histogram the ranges in total sort that would lead to 10 equally sized partitions;
do this as accurate as possible.
(ii) How can you actually create such an equi-width histogram with an a priori fixed number of cells in
MapReduce? Write pseudo code of the appropriate Map and Reduce functions.
20
Frequency
15
12
11
11
10
10
9
7 7
9
9
9
7
7
6
6
5
2
2
1 1
2
1
0
0 1 2 3 4 5 6 7 8 9 10 11 12 13 14 15 16 17 18 19
Cell
(c) Load Balancing using a given Distribution Function: Instead of having a histogram as in
part(b) assume that we know that the salaries are distributed following a normal (Gaussian) distribution
with mean µ = 60000 and standard deviation σ = 10000. Compute the ranges that would lead to
10 equally sized partitions. Hint: interpret the cumulative distribution function (cdf) of the normal
distribution or directly use its quantile function.
Assignment 2: MapReduce Cost Modeling
(1 P.)
Assume that we have one MapReduce job, j, where the reducer just emits the data recived on input. The
job reads from one input file F with size |F |. The MapReduce job is processed with m map tasks and r
reduce tasks. Let |Mi | be the average output size of a map task and |Ri | be the average input size of a
reduce task, measured in disk pages. The size of the intermediate data D of job j is |D| = |Mi | × m =
|Ri | × r.
1
Distributed Data Management SS 2015
Prof. Dr.-Ing. Sebastian Michel
MSc. Evica Milchevski, MSc. Kiril Panev
TU Kaiserslautern, FB Informatik – Lehrgebiet Informationssysteme
Sheet 3: Handout 14.05.2015, Presentation 26.05.2015
http://dbis.informatik.uni-kl.de
Further, let Cr be the cost of reading/writing data remotely, Cl be the cost of reading/writing data locally,
and Ct be the cost of transferring data from one node to another. All costs are measured in seconds per
page. The sort buffer size is B + 1 pages at both the map side and the reduce side. To simplify we assume
that pages are read from disk before the sorting phase at the mappers side.
(a) What is the cost of j to read the data on input at the map side, Tread , and write the data after
processing, Twrite , at the reduce side?
(b) What is the cost of j to sort the data at the map and reduce nodes, Tsort ?
(c) What is the cost of j to transfer the data between map and reduce nodes, Ttr ?
(d) What is the total cost of j?
Recall from the lecture, that the sorting at the map and reduce side is done using the external merge sort.
Input partitions at the reducer side are already sorted. When analyzing the complexity of a MapReduce
job the number of I/Os is what is being considered, since the execution time is dominated by this. In each
pass of the external merge sort algorithm, you must read a page and write each page once. Let N be the
number of pages. With a buffer size of B with data of N pages there are going to be dlogB−1 (d N
B e)e + 1
passes.
Assignment 3: Rackaware Replica Placement in a DFS
(1 P.)
Consider the following topology of nodes and racks in a data center (DC). Assume that two nodes within
the same rack can send (read/write) data with a network bandwidth of 10 000 Mbit/s, whereas two nodes
from different racks only have a bandwidth of 1000 Mbit/s available.
DC
Rack 1
n11
n12
Rack 3
Rack 2
n13 n21
n22
n23 n31
n32
n33
The probability that the entire DC breaks (e.g., in a disaster) down is 1/20, the probability that a specific
rack (switch) breaks down is 1/10, the probability that specific node breaks down is 1/4. For simplicity,
we assume that the probability that a failure happens is independent of other failures.
Obviously, if the DC breaks down the entire nodes are unavailable, likewise, if a rack breaks down the
enclosed nodes become unavailable, too. One failing node does not affect other nodes. Thus, you can
interpret the directed edges in the topology as a “affects” relation.
(a) Fault Tolerance: Describe two different valid replica placement strategies (having only one replica
on a node) and compute for each of them the probability that none of the replicas is available. Consider
for the computation of the probability the case of the above topology and 2 replicas of a block (so there
are 3 blocks in total).
(b) Write Cost: Consider a file that is split into 3 blocks of each 128MB size. Compute for both strategies
you devised in part (a) the time it takes to create all replicas (following the replication principle “one
after the other” as mentioned in the lecture). Discuss the pros and cons of the write/replication costs
with respect to the fault tolerance.
2


© Copyright 2026