
3 201 June
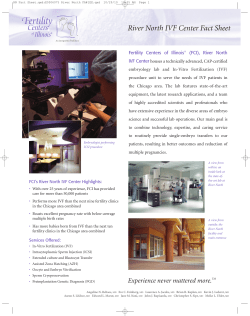
June 2013
Selector Aust Equities Ex 50 Fund
Quarterly Newsletter No.34
In this quarterly edition we review performance and
attribution. We introduce Virtus Health an IPO. We do a
roundup of investor day briefing season. Our macro
focus is on the US and at home we take a look at the
Federal Budget. Photo: STOP (fast) Press.
Selector Funds Management Limited
ACN 102756347 AFSL 225316
Level 3, 10 Bridge Street
Sydney NSW 2000 Australia
Tel 612 8090 3612
www.selectorfund.com.au
About Selector
We are a boutique fund manager and we have a combined experience of
over 150 years. We believe in long term wealth creation and building lasting
relationships with our investors.
Our focus is stock selection. Our funds are high conviction, concentrated and
index unaware. As a result we have low turnover and produce tax effective
returns.
First we identify the best business franchises with the best management teams.
Then we focus on valuations.
When we arrive at work each day we are reminded that;
“The art of successful investment is the patient investor taking money from the
impatient investor”.
Our fund is open to new subscriptions. Please forward to us contact details if
you would like future newsletters to be emailed to family, friends or business
colleagues.
Selector Funds Management Limited
ACN 102756347 AFSL 225316
Level 3, 10 Bridge Street Sydney NSW 2000, Australia
Telephone 612 8090 3612 Web www.selectorfund.com.au
June 2013 Selector Australian Equities Fund Quarterly Newsletter #34
Dear Investor,
As we rule off for another financial year, investors are again jumpy. This time the culprit is the US Federal
Reserve chairman Ben Bernanke. Ever since the global crisis of 2008, governments have been scrambling to
keep their respective economies afloat. The US in particular has been ever vigilant with a bond buying program
known as “quantitative easing” with the intention of supporting the US economy, resulting in the Federal Funds
rate remaining close to zero. But Bernanke’s comments in June that the central bank could start winding back
its US$85 billion a month bond buying program later this year and potentially ending by mid next year, sent
investors fleeing.
The upshot has been a reassessment on the state of the US economy. Bernanke has previously commented
that getting the unemployment rate down was a top priority, with the central bank now tipping the jobless rate
to fall from the current 7.6% to between 6.5% and 6.8%. The fallout following Bernanke’s comments has seen
the US dollar strengthen at the expense of most other currencies including the Australian dollar which has
fallen sharply below parity.
Over the course of the year, global share markets have staged a strong recovery, catching most investors off
guard. Some of the major market moves include the German DAX up 24.1%, the US Dow Jones Industrial
Average up 15.7%, the UK FTSE index up 11.6% and the local All Ordinaries Accumulation Index up 20.7%.
While our local index has risen strongly, the gains haven’t been shared equally, with a large number of
businesses feeling the pinch of a struggling resources market and tougher domestic conditions. Governments
haven’t helped the cause, implementing a range of new taxes in order to plug a growing deficit. With elections
planned for September and the dollar on the wane, we remain positive on the long term health of the economy
despite some near term obstacles.
In this quarterly newsletter we revisit aspects of the financial year and comment on performance. We take a
closer look at the newly floated IVF business Virtus Health, provide a round-up commentary on a number of
investor day presentations we attended and end with a look at the US economy and our own via the recently
released budget papers.
During the past quarter and for the financial year the Fund delivered a negative gross return of 0.40% and a
positive gross return of 36.63% respectively, as compared to the All Ordinaries Accumulation Index which
returned a negative 3.33% for the past quarter and a positive 20.67% over the past financial year. These results
are pleasing and provide us with confidence that our investment approach is delivering meaningful results.
To all our investors we trust that you find the report informative.
Regards
Tony Scenna
Corey Vincent
Selector Funds Management Limited
ACN 102756347 AFSL 225316
Level 3, 10 Bridge Street Sydney NSW 2000, Australia
Telephone 612 8090 3612 Web www.selectorfund.com.au
1
June 2013 Selector Australian Equities Fund Quarterly Newsletter #34
Table of Contents
Page 1: Letter to investors
Page 4: Performance June quarter 2013
Page 4: Performance table since inception
Page 4: Portfolio Top 10
Page 5: Virtus Health – business review
Page 11: US on the mend
Page 13: Investor day – Aristocrat Leisure
Page 14: Investor day – Fletcher Building
Page 16: Investor day – New News Corp & Fairfax Media
Page 17: Investor day – NIB Holdings
Page 18: Sticking to the facts – Federal budget
Page 21: Company visit diary June quarter 2013
Page 23: Portfolio statistics June quarter 2013
Fretting about time
Almost everything we do in life is measured against time - our age, when we eat, sporting events, school life,
when we work, when we sleep. In the world of investments, the notion of time constantly surprises us. When
our business expectations happen quicker than we envisage we are pleased. Equally, events that take longer to
realise, result in disappoint. But as investors we have little control on either time or on the course of events.
We fret so much and measure so many points that sometimes we underestimate the importance of time. Think
about all the risks in investing - management risk, industry risk, economic risk, interest rate risk and finally time
risk. In this context, time would be the lowest form of risk.
So rather than measuring time points, spend that time to better understand what you have so has to allow time
to work to your advantage rather than against you. SFM
Selector Funds Management Limited
ACN 102756347 AFSL 225316
Level 3, 10 Bridge Street Sydney NSW 2000, Australia
Telephone 612 8090 3612 Web www.selectorfund.com.au
2
June 2013 Selector Australian Equities Fund Quarterly Newsletter #34
Performance June 2013
For the quarter ending June 2013, the Fund delivered a gross negative return of 0.40% as compared with the
3.33% fall in the All Ordinaries Accumulation Index. Performance statistics are detailed on page 23.
Performance table since inception
% Returns
3 months
1 Year
3 years
5 years
Since inception compound p.a.
Top 10 June 2013*
Aristocrat Leisure
Flexigroup
Flight Centre
IOOF Holdings
IRESS
ResMed Inc.
SEEK
Sirtex Medical
Super Retail Group
Technology One
Top 10 = 56.45%
Gross Fund Return %
All Ords Index %
-0.40
+36.63
+11.73
+10.09
+9.22
-4.11
+15.47
+3.36
-2.18
2.27
All Ords Acc
Index %
-3.33
+20.67
+7.96
+2.19
+6.61
Top 10 March 2013*
ARB Corporation
Blackmores
Flexigroup
Flight Centre
IOOF Holdings
IRESS
ResMed Inc.
SEEK
Sirtex Medical
Super Retail Group
Top 10 = 54.85%
*Listed in alphabetical order
Selector runs a high conviction index unaware stock selection investment strategy with typically 15-25 stocks
chosen for the Fund. As shown above, the Fund’s top 10 positions usually represent the great majority of its
equity exposure. Current and past portfolio composition has historically been very unlike that of your average
run-of-the-mill “index hugger” fund manager. Our stock selection to this point has not included either retail
banks or the large resource companies, RIO and BHP. Our goal remains to focus on truly differentiated broad
cap stock selection rather than the closet index hugging portfolios offered by most large fund managers.
Selector Funds Management Limited
ACN 102756347 AFSL 225316
Level 3, 10 Bridge Street Sydney NSW 2000, Australia
Telephone 612 8090 3612 Web www.selectorfund.com.au
3
June 2013 Selector Australian Equities Fund Quarterly Newsletter #34
Performance attribution for the quarter
Top 5 stock contributors
%
ResMed
+1.02
Aristocrat Leisure
+1.02
Flexigroup
+0.98
Flight Centre
+0.86
Sirtex Medical
+0.76
Top 5 stock detractors
Jumbo Interactive
ARB Corporation
IOOF
Fleetwood Corporation
SEEK
%
-1.56
-0.62
-0.58
-0.55
-0.49
A strong performance from the markets during the year hasn’t necessarily translated across the universe of
listed stocks. The following table breaks down some of the main indexes and as a snapshot it is pretty clear
some investors aren’t too pleased with how things have panned.
Australian stock exchange index performance 2012 - 2013
30 June 2012
30 June 2013
S&P ASX 50
32,409.93
40,715.26
S&P ASX 100
7,963.65
9,927.80
S&P ASX 300
31,730.00
38,737.44
S&P All Ordinaries
31,714.27
38,270.32
S&P ASX Small Ordinaries
4,975.35
4,721.68
S&P ASX 200 Materials
61,963.11
57,398.64
S&P ASX 200 Energy
80,257.74
86,588.63
% Change
+25.6
+24.7
+22.1
+20.7
-5.1
-7.4
+7.9
Overall the main index, the All Ordinaries Accumulation Index rose 20.7% for the year, although the returns can
be split into two very distinct halves. For the period to December 2012, the index rose 15.5% while the second
half has seen a more muted response, rising 4.4%. That said performance has varied across the listed landscape
with both the materials (read resources sector) and the small ordinaries index, both struggling to record gains.
Similarly, the market’s gain for the year has masked a number of declines among a host of top line businesses
following profit downgrades. The list includes AGL Energy, Ausenco, Boral, Coca-Cola Amatil, Newcrest Mining,
UGL Engineering, WorleyParsons, Lend Lease, Transfield Services, AMP, Cochlear and Transpacific Industries
Group to name a few.
Ultimately though the price performance of a share is directly linked to a company’s underlying business. Over
time, those businesses that perform better, by investing sensibly, earning more profits and generating better
returns on capital employed will be valued more highly by investors. It all sounds sensible, however, the
difficult part is identifying the right businesses enjoying such key metrics and staying the course during difficult
periods.
Identifying and selectively targeting management teams and businesses that make the grade consume the
majority of our time and are reflected in the Fund’s investment holdings. The Fund’s performance is a direct
reflection of how these businesses have performed over the short and long term, so in this regard the results
generated by the Fund over the past year are both pleasing and reinforcing of our investment philosophy. SFM
Selector Funds Management Limited
ACN 102756347 AFSL 225316
Level 3, 10 Bridge Street Sydney NSW 2000, Australia
Telephone 612 8090 3612 Web www.selectorfund.com.au
4
June 2013 Selector Australian Equities Fund Quarterly Newsletter #34
Virtus Health (VRT)
Parting with your money on a new investment should come with a warning, particularly if the vendors happen
to be the financially savvy types from private equity. A sleight of hand here, a deft touch there and before you
know it, a promising purchase can quickly turn sour. Recent flops include national retailer Myer, flogged to the
market during 2010 at the issue price of $4.10 and more recently KFC franchisee operator Collins Foods,
following its 2011 $200 million raising at the offer price of $2.50 per share. In both cases, private equity made a
clean exit, while new shareholders were left nursing heavy losses as each share traded significantly below the
offer prices. Fast forward and the situation today is little improved, with the Myer shares now changing hands
at $2.38 and Collins Foods on a better footing, although remaining well under water at $1.68.
The birth of Virtus Health
And yet there may still be hope. During the quarter the Fund invested in one of the largest new public offerings
in recent years. Virtus Health listed on the exchange in June, having raised $339 million in new capital,
providing the group with a market capitalisation of $452 million, based on an issue price of $5.68 per share.
So strong was the demand for stock, that founding investor Quadrant Private Equity completely exited their
45% shareholding, thereby pocketing a significant portion of the funds gathered. At its conclusion, new
shareholders represent the bulk of the registry, while existing shareholders, including management, contracted
specialists and company scientists continue to hold around 25%.
Virtus Health the business
Virtus Health is the country’s largest provider of Assisted Reproductive Services (ARS), a general term that
refers to methods used to achieve pregnancy by artificial or partially artificial means. One of the most common
and perhaps well known ARS processes is that of In-Virto Fertilisation or IVF. The involvement of Quadrant
Private Equity led to the establishment of Virtus Health in 2008 following the integration of three founding ARS
practices.
The origin of these practices and the specialists involved dated back to the early 1980’s, with the early
evolution of ARS. These clinics formed the nucleus of the business today and included the consolidation of four
IVF clinics based in Sydney under the banner IVF Australia, Melbourne IVF and Queensland Fertility Group.
Background on ARS
The use of ARS has flourished over the past four decades because not all adults can conceive naturally. With
better technology and improvements to overall success rates, couples have been offered a viable alternative.
The first human IVF pregnancy was achieved in Australia in 1973, but, unfortunately, it resulted in an early
miscarriage. On 25 July, 1978 the first IVF baby was born in England, while Australia’s Candice Reed became our
first and the world’s third IVF baby in 1980. Since those early days, the number of IVF cycles completed in
Australia each year has risen steadily as illustrated by Chart 1.
Since 2000, completed IVF cycles have grown at about 10% a year, hitting 40,000 during 2012. However, as we
will discuss further, IVF comes with a hefty price tag and the onset of the financial crisis and introduction of a
Medicare funding cap in 2009 certainly impacted the number of couples seeking treatment, such that cycle
numbers are only now approaching the previous peak reached in 2009. Of the 24,000 women that undertook
an IVF treatments, involving 40,000 cycles, 12,000 babies were born.
Selector Funds Management Limited
ACN 102756347 AFSL 225316
Level 3, 10 Bridge Street Sydney NSW 2000, Australia
Telephone 612 8090 3612 Web www.selectorfund.com.au
5
June 2013 Selector Australian Equities Fund Quarterly Newsletter #34
Chart 1: IVF Cycles in Australia
A widely accepted definition of infertility is the inability to achieve pregnancy after twelve months of regular
unprotected intercourse. Causes of infertility are varied however an equal weight (35%-40%) can be
attributed to both males and females while unexplained issues (20%-30%) make up the balance. Supportive
data suggests that around 12% of women aged 18-54 and 17% of all couples will experience infertility at
either the first or subsequent child. However one of the biggest battles that couples face surrounds the
decision of when to have children, with Chart 2 highlighting this trend. Technology is now offering patients
better targeted medical options and allowing even late age couples a chance to conceive but there are no
guarantees.
Chart 2: Increasing median age of mothers
Chart 2: Female fertility declines with age
Selector Funds Management Limited
ACN 102756347 AFSL 225316
Level 3, 10 Bridge Street Sydney NSW 2000, Australia
Telephone 612 8090 3612 Web www.selectorfund.com.au
6
June 2013 Selector Australian Equities Fund Quarterly Newsletter #34
Chart 3: Success rate for embryo transfer by age group
Fertility drops with advancing age and the rate of conception success beyond forty years becomes a challenge
as Chart 3 highlights. For females under 39 years of age, the chance of success using embryo transfer can vary
between 32%-43%, however beyond the age of 40 years the rate of success drops dramatically to 16% and only
2% for women over 45 years. Yet despite these odds, couples are grabbing the chance that IVF provides.
7
Virtus Health business model
The company operates a vertically integrated business model. That is, it provides a one stop shop to assist
patients experiencing infertility issues. Via a network of 33 clinics located throughout the eastern seaboard of
Australia, Virtus Health offers independent fertility specialists access to the group’s complete service offering
that encompasses over 824 staff including 164 scientific staff, 35 embryology and diagnostic laboratories and 6
day hospitals.
Graph 4: Australian IVF cycles and Virtus Health market share
Chart 4: IVF cycles undertaken in Australia 2012
Selector Funds Management Limited
ACN 102756347 AFSL 225316
Level 3, 10 Bridge Street Sydney NSW 2000, Australia
Telephone 612 8090 3612 Web www.selectorfund.com.au
June 2013 Selector Australian Equities Fund Quarterly Newsletter #34
As Graph 4 illustrates, Virtus Health has thus far concentrated business activities within the three states of
NSW, Victoria and Queensland. During 2012, these regions completed 81% of total IVF cycles undertaken in
Australia, with the company enjoying leading market share positions of 35%, 47% and 52% respectively in each
of the three states.
The role of the fertility specialist
However, for the model to work effectively and financially, Virtus Health remains reliant on the services of the
contracted fertility specialists. Currently numbering 82, these independent fertility specialists enter into
exclusive arrangements to utilise the services of Virtus Health when undertaking IVF treatments for patients. As
such, a binding commercial relationship exists whereby one party is highly reliant on the other. In terms of
remuneration, each fertility specialist is initially engaged for a five year period, upon which a set fee is paid for
the management of each IVF cycle undertaken. In short, for each completed IVF cycle, the patient pays Virtus
Health the full cost of the service from which a set fee is paid to the specialist.
As with any profession, gaining the necessary experience and establishing a reputable IVF practice takes many
years. Virtus Health aims to assist its fertility specialists by providing both marketing and training services.
Typically, an experienced IVF specialist averages over 200 IVF cycles per annum, whereas someone new to the
profession will take upwards of two years to reach that target. Since 2010, Virtus Health has focused on
growing the number of specialists on its books from 64 to 82. This is an important undertaking as specialists
who retire or leave need to be replaced by newer, up and coming doctors.
Who pays what?
The Virtus Health prospectus sets out the various sources of funding available to the patient who undertakes an
IVF procedure. As a medical services provider, Virtus Health is unique in having a high percentage of its revenue
paid directly by the patient. The group is also free to set its own prices but is cognisant of the amount
ultimately borne by the patient, referred to as the out of pocket expenses.
It is estimated that a standard IVF cycle will cost the patient something approaching $10,000 and that fee is
paid to the clinic at the time of egg collection. From this fee, Virtus Health runs its business covering expenses
including staff, laboratories and day hospitals while also paying the IVF specialist a management fee of $1,400
on average per IVF cycle. The patient on the other hand seeks reimbursement from a number of parties
including the Government, under the various codes of Medicare and through individual private health cover.
Under this example, a patient may end up with an out of pocket bill totaling $3,500. Should a patient require
the added services of advanced diagnostics, the total cost for an IVF cycle can hit $14,000. Under such a
scenario the patient picks up the bulk of the additional expense, with a final out of pocket bill of $7,500.
As Table 1 and 2 outline, the group’s track record since 2010 has been supported by underlying demand.
Operating a high fixed cost business structure, profits are highly reliant on the number of IVF cycles completed.
The group’s two largest cost lines include staff costs and provider fees. While staff costs are relatively fixed and
are incurred irrespective of IVF volumes undertaken, provider fees reflect the payments to external IVF
specialists. As such, a rising provider fee cost line should be viewed in a positive light as it reflects increasing
volumes of completed IVF cycles.
Selector Funds Management Limited
ACN 102756347 AFSL 225316
Level 3, 10 Bridge Street Sydney NSW 2000, Australia
Telephone 612 8090 3612 Web www.selectorfund.com.au
8
June 2013 Selector Australian Equities Fund Quarterly Newsletter #34
During 2010, Virtus Health undertook 13,109 IVF cycles, serviced by an average of 62 fertility specialists. During
2014, management expects this to hit 15,409 delivered by some 82 specialists. The business generates high
gross margins and requires low levels of ongoing capital expenditure, projected at approximately $10 million
per annum. By 2014, management forecasts group revenues of $206 million, generating earnings before
interest and tax (EBIT) of $54 million and margins of 26%.
If achieved, the group’s net profit forecasts of $32 million, represents an earnings per share of 39 cents and a
dividend payment of 26 cents, placing the shares on a prospective 2014 PER of 14 and a fully franked yield of
4.6%. Management has indicated the company’s payout ratio will remain within the 50%-70% range, which is
commercially sensible considering the significant level of debt the group now carries on its balance sheet.
However, maintaining historical IVF cycle growth rates may become a challenge. Patients undertaking IVF
treatment are not guaranteed success and as such couples may need to undertake a number of cycles, each
time incurring a significant out of pocket expense. Coupled with this, the company’s stated intention of lifting
procedure costs annually by 3%-5% and with further cuts to Medicare funding expected, patients have been
left to shoulder a greater portion of the cost.
Table 1: Summary of Virtus Health Earnings 2010 - 2014
9
Selector Funds Management Limited
ACN 102756347 AFSL 225316
Level 3, 10 Bridge Street Sydney NSW 2000, Australia
Telephone 612 8090 3612 Web www.selectorfund.com.au
June 2013 Selector Australian Equities Fund Quarterly Newsletter #34
Table 2: Virtus Health business metrics
10
At time of listing the group was carrying $144 million of debt, courtesy of private equity’s preferred use of
leverage when in ownership. As such, not only is Quadrant walking away with the lion’s share of new capital
raised, as well as, picking up a pre-float dividend payment of $31 million, it has also asked new shareholders to
pay off the group’s debts. Under this scenario, new investors are taking on the extra risk of backing a new
business, operated by a new management team, with a highly geared balance sheet, operating in an industry
highly susceptible to regulatory change.
Management, fertility specialists and competition
Despite these shortcomings, the business offers enough attractive features to warrant an investment.
Management led by CEO Sue Channon is an unknown quantity in the public arena although her involvement
with Virtus Health stretches back to 2004, where she led the NSW fertility clinic operations and co-ordinated
the group's geographical expansion. Channon starts her public life with over 30 years of healthcare experience,
on a base salary of $465,000 and a shareholding of 353,044 shares, valued at $2 million. CFO Glenn Powers has
worked alongside Channon since 2008 and has overseen the acquisition and integration of the group's
expansion into Victorian and Queensland.
The largest stakeholders in the business are the fertility specialists. On listing they will collectively hold 24%. Of
the issued capital with escrow provisions in place covering a portion of each specialist's shareholding. As we
noted earlier, these contracted specialists are critical to the business's long term success and in order to
Selector Funds Management Limited
ACN 102756347 AFSL 225316
Level 3, 10 Bridge Street Sydney NSW 2000, Australia
Telephone 612 8090 3612 Web www.selectorfund.com.au
June 2013 Selector Australian Equities Fund Quarterly Newsletter #34
provide incentives to both existing and new specialists, the company will grant options on an annual basis
should benchmarks be met. In crude terms, the IVF specialists are to complete 50 cycles in a financial year
before being considered with future grants subject to 50 cycle increments. So as the number of IVF cycles
performed rises so does the benchmark rise in order to earn additional options. Options granted are valued at
$258,000, while the actual number of shares offered takes into account the prevailing share price at the time.
As such in order for the options to vest profitability, not only does the specialist need to maintain a high
percentage of completed annual IVF cycles, they also require the share price to rise.
Perhaps a key strength for the group is its competitive market position. The Australian IVF industry is relatively
concentrated with close to 75% of the clinics operated by one of four corporate owners. In total there are close
to 110 fertility clinics with Virtus Health operating the largest number totaling 33, followed by Health Bridge
with 19 clinics, Genea operating 14 and City Fertility controlling 9. Importantly, the contractual relationship that
exists between the fertility specialists and the clinics acts as a significant barrier to new entrants.
CEO Channon has made no secret of the fact that Virtus Health will look to expand beyond its current
operations. Further options under consideration include expanding into new states including South and
Western Australia as well as offshore into New Zealand and parts of Asia.
The group is conscience of the opportunity that currently exists, particularly patients living in the less affluent
regions of each state of operation. This has resulted in a low cost IVF model, branded The Fertility Centre (TFC).
To date, there are three centres in operation, one in each state and the aim is to offer limited services at a
lower cost. Should the patient require a higher level of service, the opportunity exists to visit a full service clinic.
Summary
Virtus Health taps into a market that offers couples unable to conceive naturally with options. As a result IVF
treatment has become a standard of treatment that has overcome both economic and regulatory challenges.
While the company appears not to possess any significant advantage over its rivals, we would argue that
business scale and industry reputation places it in a strong position to succeed. We remain wary that private
equity may have sold us a lemon but on the evidence thus far we see reasons for feeling upbeat on Virtus
Health’s long term prospect. Since listing on 11 June the shares have enjoyed a positive start and ended the
year trading at $6.45, representing a gain of 13.6% on its listing price. SFM
US on the mend.
Back in 2011 we wrote in our December quarterly report, that despite the ongoing upheaval in world markets,
we remained positive on the US market, titling our article “Why we are bullish on the US economy”. Fast
forward and the following picture as depicted in Chart 5 has economists once again re-modeling their numbers
in determining the US economy’s direction. In 2009, US budget outlays outpaced revenues by some 10% of
gross domestic product, with an annual deficit exceeding $US1 trillion.
Selector Funds Management Limited
ACN 102756347 AFSL 225316
Level 3, 10 Bridge Street Sydney NSW 2000, Australia
Telephone 612 8090 3612 Web www.selectorfund.com.au
11
June 2013 Selector Australian Equities Fund Quarterly Newsletter #34
Chart 5: US budget outlays v revenues % of GDP
In more recent times, this deficit has reduced, and some are now suggesting the fall is happening too fast, too
soon. As the blue line in Chart 5 edges closer to the black line, Congressional Budget Office estimates that the
US deficit could shrink to as a low as 2.1% of GDP by 2015. Despite the political paralysis, the Government has
proved remarkably successful at slashing the deficit through a variety of tax increases and cuts in domestic and
military programs. What has many concerned however is that this is being achieved despite the US
unemployment rate remaining high at 7.5%.
Beyond the short term, deficits are expected to continue, but considering the extent to which the US
Government has so successfully reduced the deficit in recent times, this script is still to be written. Overall, the
figures demonstrate how the economic recovery has begun to refill the government’s coffers and how quickly
circumstances can change for the better.
This is best reflected by Standard & Poor’s credit rating for the US improving from negative to stable. Having
cut the US AAA ranking in August 2011, the ratings agency sees improvement on the horizon, noting that “We
see some improvement lately in terms of moving, if gradually and hesitantly, but nonetheless towards fiscal
consolidation. The US economic performance will match or exceed that of its peers in the coming years. We
forecast that the external position of the US on a flow basis will not deteriorate.”
The portfolio is positioned for an improving US economy, with a number of the Fund’s holdings primed to
benefit from a stronger earnings profile and assisted by a weakening Australian dollar. SFM
Selector Funds Management Limited
ACN 102756347 AFSL 225316
Level 3, 10 Bridge Street Sydney NSW 2000, Australia
Telephone 612 8090 3612 Web www.selectorfund.com.au
12
June 2013 Selector Australian Equities Fund Quarterly Newsletter #34
Investor day
During the quarter we attended a number of investor day briefings. Not all companies undertake such an
event, however if done well, it is a worthy exercise, as it provides investors with an opportunity to meet
management and more formally consider the merits of the business. To this end we can make the following
comments on our most recent investor days that included the following businesses.
Aristocrat Leisure (ALL)
We attended gaming operator Aristocrat Leisure’s investor day during March keen to learn more about the
group’s transformation program under the leadership of CEO Jamie Odell. When Odell first joined the business
as CEO in February 2009, he spoke of the need to make changes. Words like strategic review, rightsizing, 3 to 5
year turnarounds, are terms that we approach with extreme caution. In short, we were unsure on a number of
fronts despite our positive view towards the Aristocrat brand.
Three years on and the results are beginning to flow. The Fund made its first investment in the group during
2012, post the company’s capital raising and once our initial reservations were addressed. In our opinion, the
most important developments undertaken thus far revolve around personnel changes and a re-focus on what
made Aristocrat a force within the industry, delivering the best game content. On this score, Odell has
assembled what he and his team considers to be the best creative and technical talent within the industry. On
this point investments have been directed to building gaming studios located closer to the key US market.
In his closing comments Odell outlined the key business drivers as listed below;
1. Business returns – an emphasis on delivering sustainable profits thereby delivering sustainable returns.
2. Technology – enable and deliver games although regulation will control rollout.
3. Talent – look beyond our shores to attract the best talent, make the appropriate long term
investments.
4. Segments – focus on market segments where the company has the skills to compete successfully.
5. Share – identify core markets and take market share.
6. Content – invest to stay ahead of the curve and remaining relevant to the end consumer.
During May, Aristocrat unveiled its first half result ending March, having changed the group’s financial year end
to September, as it more closely aligns to the key US market buying cycle. A solid result was delivered,
representing the group’s fourth consecutive year of profit growth. Revenues were up and Odell noted that the
end of the original turnaround window in 2014 was fast approaching.
Table 3 provides a quick snapshot of the group’s earnings among the three key markets of Australia, North
America and the Rest of World operations. Importantly, while earnings before interest and tax remained
relatively unchanged at $75.3 million, net profits rose 12% to $53 million, largely assisted by an almost halving
of the group’s interest bill.
Operationally most pleasing were the improvements made in the group’s key North American operations. In US
dollar terms, revenues rose 12% to $190.3 million, while segment profits kept pace rising 13% to $69.2 million.
The group’s installed base of participating machines rose 8.5% to 6,922 on an average fee per day revenue
share of $40.80. In short, along with the group’s Oasis systems business, annuity type revenues now represent
Selector Funds Management Limited
ACN 102756347 AFSL 225316
Level 3, 10 Bridge Street Sydney NSW 2000, Australia
Telephone 612 8090 3612 Web www.selectorfund.com.au
13
June 2013 Selector Australian Equities Fund Quarterly Newsletter #34
on our assessment, approximately 60% of revenues, partly fulfilling Odell’s desire to build more sustainable
earnings streams.
Table 3: Aristocrat half year results march 2013
A$ million
Segment revenue
Australian & New Zealand
Americas
Rest of World & Japan
Total segment revenue
Segment profit
Australian & New Zealand
Americas
Rest of World & Japan
Total segment profit
Unallocated expenses
Group design & development
Foreign exchange
Corporate
Total unallocated expenses
EBIT
Interest
Profit before tax
Income tax
Profit after tax
HY13
HY12
95.5
196.0
91.7
383.2
102.4
179.6
132.3
414.3
40.1
71.2
30.5
141.8
42.8
61.6
42.4
146.8
(55.5)
0.9
(11.9)
(66.5)
75.3
(6.0)
69.3
(16.1)
53.2
(54.6)
(2.1)
(13.9)
(70.6)
76.2
(11.5)
64.7
(17.0)
47.7
Lastly, renewed confidence in the business has led the board to return more to investors with the interim
dividend increasing from 4 cents to 7 cents. Aristocrat is on track to earn $105 million in profits this year,
however this figure should be considered in light of the approximately $250 million earned in 2007. There is
still much to do and while Odell may have assembled the best industry talent there is, the results are still to
come. We remain on board and will follow the group’s progress with interest.
Fletcher Building (FBU)
The company held its investor day during May in the basement of a Sydney hotel. The bland surroundings were
perhaps a reflection of a new management team intent on maintaining a low profile and a strong cost focus to
make up for past mistakes. CEO Mark Adamson, appointed during 2012, spoke of the enormous task at hand.
His opening line perhaps best summed up the Fletcher Building business, "It is a complex beast".
And that complexity is largely due to previous CEO Jonathan Ling’s acquisition spree during boom conditions.
The board acknowledged as much when thanking Ling on his retirement noting that at "As chief executive,
Jonathan has overseen two large acquisitions that have nearly doubled the size of Fletcher Building. Just as
significantly he has successfully steered Fletcher Building through one of the worst economic downturns in
recent times.
Selector Funds Management Limited
ACN 102756347 AFSL 225316
Level 3, 10 Bridge Street Sydney NSW 2000, Australia
Telephone 612 8090 3612 Web www.selectorfund.com.au
14
June 2013 Selector Australian Equities Fund Quarterly Newsletter #34
The company's sound financial position and the strength of its management team are fitting testament to
Jonathan's leadership".
Some shareholders may disagree with that assessment judging by the numbers outlined in Table 4. While the
group is certainly larger as a result of both the Formica and GE Crane acquisitions in 2007 and 2011
respectively, the same cannot be said of profits and the returns generated on capital employed. In fact, on any
proper assessment shareholders have suffered badly from a series of business mis-steps to put it kindly.
Table 4: Fletcher Building historical financial summary
$NZ ‘M
FY12
FY09
Revenue
8,873
7,103
Operating profit
403
159
Net profit after tax
185
(46)
Return on funds %
EPS (¢)
DPS (¢)
7.3
27.2
34.0
3.4
(8.7)
38.0
FY06
5,520
675
379
FY03
3,221
331
168
26.1
81.3
40.0
24.4
43.4
19.0
Having given Fletcher's a wide berth since its spinoff from the Fletcher Challenge group in 2001, our interest
was piqued with the appointment of Adamson, following his successful restructure of the Formica business
during a period of extreme market upheaval.
Our assessment on management thus far is positive and deserving of further analysis. Importantly, we don't
underestimate the enormity of what Adamson is aiming to do, particularly when you consider the sheer scale
of the business and it's many moving parts - a NZ$9.0 billion building materials business, operating from
multiple global locations and employing some 19 ,000 staff. At its core, the new Fletcher Building business will
focus on removing layers of duplication and introducing a central unit, aptly named FB Unite to drive greater
efficiency and support business development. Equally important is the desire to drive scale within each of the
business units without relying on acquisitions.
Adamson, makes no apology that the new Fletcher Building needs to perform in any business cycle, invest and
embrace technology to streamline operations and remove obstacles that prevent operational excellence. The
turnaround is expected to take the typical 3 to 5 years but management has been prepared to put some
numbers on the table. Under FB Unite, some NZ$75-NZ$100 million in savings are expected to flow from 2015
onwards, although the company needs to invest upfront to achieve those returns.
When compared to the 2013 company earnings before interest and tax guidance range of NZ$560-NZ$610
million, it is clear how significant and extensive the changes are likely to be. We will end where we started,
noting that Fletcher Building is both a complex business operating in a cyclical sector of the market. That said,
CEO Adamson is a breath of fresh air, who pulls no punches in his assessment of what needs to be done and
what will be done. Mark this stock down as one to watch.
Selector Funds Management Limited
ACN 102756347 AFSL 225316
Level 3, 10 Bridge Street Sydney NSW 2000, Australia
Telephone 612 8090 3612 Web www.selectorfund.com.au
15
June 2013 Selector Australian Equities Fund Quarterly Newsletter #34
New News Corp (NNC) and Fairfax Media (FXJ)
These organisations operate at different spectrums of the media landscape. While News Corp has become one
of the world's most dominant media operators, Fairfax Media has remained local. One has a market worth
valued at$76 billion, the other $1.3 billion. It is no secret that when one speaks of media these days it is in the
context of whether it operates under the banner of old media or new. For this we can thank the internet, a
wave that has cast aside the traditional median of print publishing and exposed the vulnerability of an industry
as it struggles to adapt.
News Corp has chosen to adapt by splitting the business in two. Ironically the new News Corp as it is now
known, houses a collection of the traditionally old media assets including print publishing and a mix of newer
ones such as pay television operator Fox Sports. In contrast, the old News Corp has been renamed 21st Century
Fox and is primarily anchored by the group's cable and satellite pay television operations both in the US via the
Fox Network brand and offshore through the various Sky operations in Italy, Germany and the UK. To this we
can add the remaining assets of film and US television as well as a pile of cash and long duration debt.
Not surprisingly investors are grappling with how to value the new News Corp (we’re still grappling with the
name chosen), since it remains largely exposed to print revenue. Table 5 below outlines the revenue and
earnings of the group as it would have applied in 2012. Clearly old media comprising news publishing
contributes the bulk of revenues and profits. The addition of digital assets such as REA Group and local
subscription based television operator Foxtel (50%) and Fox Sports adds appeal but doesn't address the
concern amongst investors regarding the ongoing structure issues facing print.
Table 5: New News Corp proforma earnings 2012
Segments
Brands
News | Information
Wall Street Journal | Australian | Sun
Cable Network | Program Fox Sports
Digital real estate
Listed REA Group
Book Publishing
Harper Collins
Other
Amplify (start up) | corporate expenses
Total Group
Associates*
Foxtel (50%)
Revenue $US’M
7,058
486
286
1189
121
9,140
1,200*
EBITDA $US’M
939
131
129
111
(189)
1,124
338*
* Actual earnings 9 months to March 2013
In contrast, Fairfax Media’s future is more precarious. While the group's balance sheet is in far stronger shape
with net debt levels now under $100 million, the same cannot be said of revenues and profits. At the group's
investor day CEO Greg Hywood spoke of the ongoing challenges his management team faces. During 2012 the
Fairfax of the Future program was unveiled, a $251 million savings program in an attempt to address the
company's structural issues. Printing plants were to close and 20% of the group's 10,000 workers would lose
their jobs, many included career journalists.
However, the difficulty in all this is in knowing where the bottom is and this is precisely the issue that confronts
management today. An industry in transition requires business to constantly adapt and in announcing a further
$60 million of cost savings at investor day, Hywood was highlighting the enormity of the task.
Selector Funds Management Limited
ACN 102756347 AFSL 225316
Level 3, 10 Bridge Street Sydney NSW 2000, Australia
Telephone 612 8090 3612 Web www.selectorfund.com.au
16
June 2013 Selector Australian Equities Fund Quarterly Newsletter #34
In the past, papers were all about classifieds - jobs, homes and cars, because it was the classifieds that made
the money. Today, Fairfax no longer has that edge. By failing to counter the online upstarts like SEEK and
Carsales years ago, the company is now aiming to reinvent itself as it moves the business into the digital world.
Future revenues will be sourced from three areas, subscription, advertising and digital transactions. But for all
of management’s best intentions, the leaking of revenues from print to online continues uninterrupted and
with so much still riding on print revenues it is hard to see how Hywood can stop the inevitable.
It would seem that if Hywood his true to his word, that Fairfax will not use profits from good businesses to
subsidise loss making businesses, then at some point in the future it is inevitable that the printing presses will
be turned off for good. At that point the group may have completed its transition but at what cost to revenues
and profits remains the big unknown, suffice to say that the numbers are likely to be significantly lower than
the case today.
In summary, the challenges confronting the media industry are real and ongoing. Despite the appearance of
something new, we remain wary of venturing in and will look to give the new News Corp a wide berth for now,
while Fairfax Media continues to languish in the too hard basket.
NIB Holdings (NHF)
Listed since 2007, health insurer NIB has built up considerable credibility among its investors by sticking to its
core business and undertaking sensible expansion. CEO Mark Fitzgibbon and CFO Michelle McPherson are a
strong duo who have steered the ship thus far. The investor day was a reminder that management aim to be as
transparent as possible when discussing the business and the health insurance industry in general.
As Fitzgibbon sees it, the group doesn’t have a sustainable competitive advantage but makes up for it by being
nimble and at the forefront of industry change. So while many may view NIB as just another health insurer,
Fitzgibbon sees NIB as a finance company, helping customers transact for a whole range of healthcare options.
As Table 6 highlights, both Australia and New Zealand’s health outlay is significant and rising. It appears
therefore inevitable that with an increasing health spend, the funding onus will shift from the government to
the private sector.
Table 6. Health statistics Australia and New Zealand
Australia
Gross Domestic Product (GDP)
A$1,500b
Population
23m
Number of insured people
10.8m (47%)
Inflation
2.5%
Unemployment
5.5%
Health spend (% of GDP)
9.3%
Health spend
A$130.3B
New Zealand
A$175b
4.4m
1.3m (30%)
0.9%
6.2%
10.5%
A$16.7b
NIB’s strategic game plan is to wrestle more of the business from competitors as governments look to
relinquish their traditional funding role. While this will provide excellent options to grow, customers are having
to pay more, with some reducing on their cover in order to make ends meet. At the same time, the growth of
Selector Funds Management Limited
ACN 102756347 AFSL 225316
Level 3, 10 Bridge Street Sydney NSW 2000, Australia
Telephone 612 8090 3612 Web www.selectorfund.com.au
17
June 2013 Selector Australian Equities Fund Quarterly Newsletter #34
online comparator sites like iselect and choosi are leading to higher churn rates within the industry, as
members look to grab the best deal.
In recent years this has led to higher levels of lapse rates, circa 10% and management clearly admit that more
must be done to address this important issue. A greater level of resources has been earmarked and the group is
now proactively engaging with both present and past members to either maintain or recapture their business.
Overall Fitzgibbon outlines a number of key business objectives including;
1. Remain focused on the youth market and extending into the over 55 years age bracket.
2. Extend into geographic regions as illustrated by the group’s recent move into New Zealand
3. Grow international inbound business for both workers and students.
4. Provide a one stop fee for service medical travel insurance product.
5. Address the costs of doing business.
Fitzgibbon is very confident of growing the group’s top line with an innovative range of products and services.
Presently NIB captures about $1.3 billion in premiums each year, representing a market share of 7%. The two
main competitors remain Medicare Private and BUPA who collectively control some 65% of the health
premiums market. The impending sale of Medicare Private and a likely change in the Federal Government will
refocus attention on this sector.
An investment NIB is not without risk. That said, NIB operates in an industry that has a number of favourable
tailwinds, none more so than the need for individuals to provide for their own health cover needs. The Fund
has an investment in NIB and our meeting with management reinforced our confidence in both their strategic
endeavours and the underlying industry dynamics. SFM
Sticking to the facts – federal budget
Treasurer Wayne Swan delivered a budget in May that has left many bamboozled by the extent to which the
expected surplus that was promised has turned into a resounding deficit. The Government argues that a series
of external factors conspired to negate the steps taken to deliver the promised surplus. Unfortunately, for the
ordinary voter trying to discern fact from fiction, this is not an easy task, since politicians are experts in the art
of spin. Treasurer Swan has gone to great lengths to explain that the missing surplus is largely due to the
strength of the Australian dollar. Manufacturing has been hammered and revenues lost, much of which was
required to pay for the billions invested elsewhere. But before we venture down the path of the missing
surplus, let’s for a moment return to the facts. Wikipedia defines the word fact as something that has really
occurred or is actually the case. Governments struggle to deal with facts because it always involves discussing
the truth. So to avoid any confusion, reproduced below in Table 7 are the Government’s actual budget
positions since 1995.
To put some timelines into perspective, The Liberal Government took office in 1996 with John Howard as Prime
Minister for the period 11 March 1996 until 3 December 2007. The Labor Party Government took office in
December 2007 and was initially led by Kevin Rudd as Prime Minister until Julia Gillard took over as the 27th
Australian Prime Minister on 24 June 2010. In the last few days of June, Kevin Rudd regained the leadership
which saw the departure of former Treasurer Wayne Swan, a position he held since the Labor Party came to
office in December 2007.
Selector Funds Management Limited
ACN 102756347 AFSL 225316
Level 3, 10 Bridge Street Sydney NSW 2000, Australia
Telephone 612 8090 3612 Web www.selectorfund.com.au
18
June 2013 Selector Australian Equities Fund Quarterly Newsletter #34
Table 7: Federal Government budgets 1995 – 2017
Budget Year
Receipts
Payments Surplus | (Deficit)
$m
$m
$m
1994-95
1995-96
1996-97
1997-98
1998-99
1999-00
2000-01
2001-02
2002-03
2003-04
2004-05
2005-06
2006-07
2007-08
2008-09
2009-10
2010-11
2011-12
2012-13 (e)
2013-14 (e)
2014-15 (e)
2015-16 (e)
2016-17 (e)
113,458
124,429
133,592
140,736
152,063
166,199
182,996
187,588
204,613
217,775
235,984
255,943
272,637
294,917
292,600
284,662
302,024
329,874
350,410
375,993
401,171
428,931
453,642
127,619
135,538
139,689
140,587
148,175
153,192
177,123
168,655
197,243
209,785
222,407
240,136
253,321
271,843
316,046
336,900
346,102
371,032
367,286
391,198
409,149
424,969
443,748
(14,160)
(11,109)
(6,099)
149
3,889
13,007
5,872
(1,067)
7,370
7,990
13,577
15,807
19,316
23,074
(23,446)
(52,238)
(44,078)
(41,158)
(16,876)
(15,205)
(7,978)
3,962
9,894
Net Debt | (Net Surplus)
$m
Net Interest
Payments $m
83,492
95,831
96,281
82,935
72,065
53,869
42,719
38,180
29,047
22,639
10,741
(4,531)
(29,150)
(44,820)
(16,148)
42,283
84,551
147,334
161,603
178,104
191,552
191,172
185,662
7,292
8,861
9,489
8,279
8,649
7,514
6,195
5,352
3,758
3,040
2,502
2,303
228
-1,015
-1,196
2,386
4,608
6,609
8,238
7,835
8,405
9,752
7,726
Source: Historical Australian Government Data
Now to the casual observer the figures in the reproduced table lead to a number of clear outcomes without the
need to rely on external commentators confusing the facts. Firstly, Government receipts have continued to
grow, despite the onset of the global crisis that started in 2008. Since 1995, this number has risen from $113
billion to $330 billion by 2012. Similarly, payments have climbed from $128 billion to $371 billion over the same
period.
Secondly, since taking office in 1997, the Liberal Party have delivered surpluses in every year, except 2001-02
where a $1.1 billion deficit was recorded. In contrast, the Labor Party have failed to register a surplus
despite the promise and a commitment to do so.
As a consequence Australia no longer enjoys the legacy of a strong balance sheet. In the space of six years
Australia’s net debt position has reversed from a net surplus of $44 billion to a net deficit of $147 billion and
counting.
Selector Funds Management Limited
ACN 102756347 AFSL 225316
Level 3, 10 Bridge Street Sydney NSW 2000, Australia
Telephone 612 8090 3612 Web www.selectorfund.com.au
19
June 2013 Selector Australian Equities Fund Quarterly Newsletter #34
So these are the facts. No matter how you spin it or recast the numbers, the inescapable conclusions are pretty
clear. Receipts have gone up and not collapsed despite Ex-Treasurer Swan’s best efforts to convey a different
view. Payments however have gone up even faster and for that we are now left with rising deficits and higher
debts. With that, the Government is now incurring an interest bill that is set to hit $8.2 billion this year as
compared to receiving interest of $1.0 billion when it took office.
Discussions on whether this Government took the most prudent course of action during and post the global
crisis are open to debate but one thing is clear, if company directors are held to account for misleading the
facts then the same should apply to those that hold the highest office in the land. There is nothing wrong in
charting a course and sticking to it, even if many disagree with the direction taken. What is not acceptable is
the extent to which one is prepared to spin the truth when the facts are indisputable. SFM
20
Selector Funds Management Limited
ACN 102756347 AFSL 225316
Level 3, 10 Bridge Street Sydney NSW 2000, Australia
Telephone 612 8090 3612 Web www.selectorfund.com.au
June 2013 Selector Australian Equities Fund Quarterly Newsletter #34
Company visit diary June Quarter 2013
April
MIN
NVT
AAX
SUL
MYX
IFL
FXL
PXS
FGE
MRM
SYD
VRT
TRS
RMD
VRT
MNY
SIV
Mineral Resources UBS conference meeting
Navitas UBS conference
Ausenco UBS conference meeting
Super Retail Group UBS conference meeting
Mayne Pharma Group UBS conference meeting
IOOF Holdings UBS conference meeting
Flexigroup UBS conference meeting
Pharmaxis Q3 conference call
Forge Group UBS conference meeting
Mermaid Marine Australia UBS conference meeting
Sydney Airports full year results presentation
Virtus Health pre IPO meeting
The Reject Shop business update
ResMed Inc. Q3 conference call
Virtus Health management meeting
Money3 Corporation conference meeting
Silver Chef conference meeting
10/04/13
10/04/13
10/04/13
10/04/13
10/04/13
10/04/13
10/04/13
11/04/13
11/04/13
11/04/13
15/04/13
19/04/13
24/04/13
26/04/13
29/04/13
29/04/13
30/04/13
SAI
SKE
OSH
SYD
AUB
RWH
RCR
IFL
TOX
ARP
AGK
CTX
IIN
WOR
FBU
COH
JIN
NEA
DMP
SYD
GEM
WOR
SAI Global macquarie conference
Skilled Group macquarie conference
Oil Search macquarie conference
Sydney Airport macquarie conference
Austbrokers Holdings macquarie conference
Royal Wolf Holdings macquarie conference
RCR Tomlinson macquarie conference
IOOF macquarie conference
Tox Free Solutions macquarie conference
ARB Corporation macquarie conference
AGL Energy macquarie conference
Caltex Australia macquarie conference
Iinet macquarie conference
WorleyParsons macquarie conference
Fletcher Building macquarie conference
Cochlear management site visit
Jumbo Interactive conference call
NearMap management meeting
Domino's Pizza Enterprises management meeting
Sydney Airport annual general meeting
GE Education management meeting
WorleyParsons annual general meeting
01/05/13
01/05/13
01/05/13
01/05/13
01/05/13
01/05/13
01/05/13
01/05/13
01/05/13
01/05/13
01/05/13
02/05/13
02/05/13
02/05/13
02/05/13
06/05/13
07/05/13
07/05/13
13/05/13
16/05/13
16/05/13
17/05/13
May
Selector Funds Management Limited
ACN 102756347 AFSL 225316
Level 3, 10 Bridge Street Sydney NSW 2000, Australia
Telephone 612 8090 3612 Web www.selectorfund.com.au
21
June 2013 Selector Australian Equities Fund Quarterly Newsletter #34
SOM
FBU
FPH
TNE
ALQ
PXS
ALL
Somnomed management meeting
Fletcher Building investor day
Fisher & Paykel Healthcare full year results
Technology One management meeting half year
ALS full year results meeting
Pharmaxis management meeting
Aristocrat Leisure half year results meeting
20/05/13
22/05/13
23/05/13
26/05/13
27/05/13
28/05/13
29/05/13
COH
SRX
NWS
FXJ
OTH
NHF
STX
FPH
RMD
AUB
Cochlear market briefing
Sirtex Medical site visit
News Corp investor day
Fairfax Media investor day
Onthehouse Holdings management meeting
NIB Holdings investor day
Sirtex Medical UBS health conference
Fisher & Paykel Healthcare Corporation UBS health conference
ResMed Inc. UBS health conference
Austbrokers Holdings site visit
03/06/13
04/06/13
05/06/13
06/06/13
12/06/13
14/06/13
18/06/13
18/06/13
18/06/13
20/06/13
June
Selector Funds Management Limited Disclaimer
The information contained in this document is general information only. This document has not been prepared
taking into account any particular Investor’s or class of Investors’ investment objectives, financial situation or
needs.
The Directors and our associates take no responsibility for error or omission; however all care is taken in
preparing this document.
The Directors and our associates do hold units in the fund and may hold investments in individual companies
mentioned in this document. SFM
Selector Funds Management Limited
ACN 102756347 AFSL 225316
Level 3, 10 Bridge Street Sydney NSW 2000, Australia
Telephone 612 8090 3612 Web www.selectorfund.com.au
22


© Copyright 2026