
San Francisco City CarShare: Longer-Term Travel-Demand and Car Ownership Impacts Robert Cervero
San Francisco City CarShare: Longer-Term Travel-Demand and Car Ownership Impacts Robert Cervero Aaron Golub Brendan Nee Prepared for Department of Transportation & Parking City of San Francisco May 2006 University of California at Berkeley Institute of Urban and Regional Development TABLE OF CONTENTS 1. INTRODUCTION .........................................................................................................5 2. CITY CARSHARE TRENDS AND USAGE ...............................................................5 3. CITY CARSHARE TRAVEL CHARACTERISTICS..................................................7 3.1. User Profiles.......................................................................................................7 3.2. Trip Patterns and Purposes...............................................................................10 3.3. Trip Occupancies, Modes, and Trip Chaining .................................................11 3.4. Car Preference..................................................................................................13 4. CARSHARE MEMBERS: MARKET SHARES, BACKGROUNDS, AND CAR OWNERSHIP TRENDS ...................................................................................14 4.1. Trip Purpose: All Trips ...................................................................................15 4.2. Market Shares ..................................................................................................15 4.3. Modal Splits by Trip Purpose ..........................................................................18 4.4. Travel Consumption.........................................................................................18 4.5. Socio-Demographic Characteristics.................................................................20 4.6. Car Ownership Patterns and Trends ................................................................22 5. EVALUATION............................................................................................................24 5.1. Travel Distances and Times.............................................................................24 5.2. Vehicle Miles Traveled....................................................................................25 5.3. Fuel Consumption Metric ................................................................................28 5.4. Net Impacts ......................................................................................................28 6. PREDICTIVE MODELS.............................................................................................30 6.1. Car Ownership Model......................................................................................30 6.2. Changes in Car Ownership Model...................................................................32 6.3. City CarShare Mode Choice Model.................................................................35 6.4. Overall Mode Choice Model ...........................................................................36 6.5. Average Daily VMT Model.............................................................................38 7. CONCLUSION............................................................................................................39 ACKNOWLEDGMENTS .................................................................................................40 NOTES...............................................................................................................................41 APPENDIX A: In-Vehicle Travel Survey........................................................................43 APPENDIX B: Home Based Survey – Cover Letter........................................................44 APPENDIX C: Home Based Survey – Background Survey ............................................45 APPENDIX D: Home Based Survey – Travel Diary .......................................................47 2 LIST OF FIGURES AND TABLES FIGURE 1: Trends in San Francisco City CarShare Reservations, April 2001–May 2005..................................................................................5 FIGURE 2: Trends in San Francisco City CarShare Reservation Hours per Month, April 2001–May 2005..................................................................................7 FIGURE 3: City CarShare POD Locations, March 2005................................................8 FIGURE 4: City CarShare Member Household Locations, March 2005........................9 FIGURE 5: Distribution of Walking Distances to Nearest POD from Members’ Residences, 2005..........................................................................................9 FIGURE 6: Desire Line Map of Surveyed CarShare Trips, 2005 In-Vehicle Survey ..10 FIGURE 7: Distribution of Trip Purposes Using City CarShare Vehicles, March 2005 and September–October 2002; In-Vehicle Survey................11 FIGURE 8: Mean Occupancy Levels of City CarShare Trips by Purpose, 2005 In-Vehicle Survey ......................................................................................12 FIGURE 9: Likely Other Modes if CarSharing was Unavailable, 2005 In-Vehicle Survey ........................................................................................................12 FIGURE 10: Likely Other Modes by Trip Purpose, 2005 In-Vehicle Survey................13 FIGURE 11: Reason CarShare Vehicle was Chosen, 2005 In-Vehicle Survey..............14 TABLE 1: Chronology and Scope of Four Surveys Conducted to Date of San Francisco City CarShare Members and Non-Members .............................15 FIGURE 12: Trip Purposes of Trips by Members and Non-Members, Survey #5 (2005)........................................................................................16 TABLE 2: Modal Comparison: Percent Distribution of Mode, All Trip Purposes, City CarShare Members and Non-Members, Survey #5 (2005)................16 FIGURE 13: Shares of Members and Non-Members with Supply-Side Attributes Associated with Mode Choice, Survey #5 (2005) .....................................17 TABLE 3: Percent Distribution of Mode by Trip Purposes, City CarShare Members and Non-Members, Survey #5 (2005) .......................................18 TABLE 4: Comparison of Travel Statistics for Individual Trips Among Members and Non-Members, Survey #5 (2005) .......................................................20 FIGURE 14: Comparison of Age Distributions Among CarShare Members (May 2005 and March–April 2003) with Residents (20 Years and Older) of San Francisco (2000)..................................................................21 FIGURE 15: Comparison of Household Types Among CarShare Members (in March–April 2003) and All Residents of San Francisco (in 2000)......22 3 FIGURE 16: Comparison of Motor Vehicle Ownership Distribution Among the Members of San Francisco CarShare in 1st and 2nd Years of CarShare Program......................................................................................................23 TABLE 5: Changes in Household Motor Vehicle Ownership: Members and Non-Members ............................................................................................23 TABLE 6: Members: Trends in Daily Travel, Survey #1, Survey #4, Survey #5.......26 TABLE 7: Non-Members: Trends in Daily Travel, Survey #1, Survey #4, Survey #5 ...................................................................................................27 TABLE 8: Difference of Difference of Means: Changes of Members Minus Changes of Non-Members, Weekday/Workday ........................................29 FIGURE 17: Percentage Point Differences in Changes in Mean Daily Travel Characteristics: Members Relative to Non-Members, Long-Term Analysis (Survey #1 to Survey #5) and Intermediate to Longer Term Analysis (Survey #4 to Survey #5) ............................................................30 TABLE 9: Binomial Logit Model for Predicting the Likelihood of Owning at Least One Vehicle; Survey #5 ...................................................................31 FIGURE 18: Sensitivity Analysis for Binomial Logit Model for Predicting the Likelihood of Owning at Least One Vehicle; Survey #5...........................32 TABLE 10: Ordinal Logit Estimates for Predicting Net Changes in Vehicle Ownership Among Survey Respondents ...................................................33 TABLE 11: Binomial Logit Model for Predicting the Likelihood Respondents Reduced Motor Vehicle Ownership; Survey #5 ........................................34 FIGURE 19: Sensitivity Analysis of Binomial Logit Model for Predicting the Likelihood Respondents Reduced Motor Vehicle Ownership; Survey #5 ...................................................................................................34 TABLE 12: Binomial Logit Model for Predicting Likelihood Member Respondents from Survey #5 Chose City CarShare for Trip.....................35 TABLE 13: Multinomial Logit Model for Predicting Likelihood Member Respondents from Survey #5 Chose City CarShare (CCS), Private Automobile (Auto), Public Transit (Transit), Bicycle, or Walking...........37 TABLE 14: Regression Model for Predicting Respondents’ Average Daily VMT; Survey #5, All Trip Purposes, All Day Types ...........................................38 4 San Francisco City CarShare: Longer-Term Travel-Demand and Car Ownership Impacts 1. INTRODUCTION This is the fourth of a series of studies on the impacts of San Francisco’s pioneering City CarShare program on travel behavior and car ownership patterns, conducted through the Institute of Urban and Regional Development at UC Berkeley.1 While early analyses suggested carsharing stimulated motorized travel, after two years into the program, these impacts had been tempered. In part, because some City CarShare members had reduced car ownership levels, net reductions in vehicle miles traveled were found by the program’s second anniversary. This report examines the longer term impacts of the City CarShare program on travel demand and car ownership. It complements the previous analyses that focused on shortand intermediate-term impacts. It gives particular focus to the question of whether the travel reduction evidence uncovered two years into the City CarShare program were sustained or gained momentum four years after the program’s inception, or perhaps were short-lived and reversed course. As in the earlier studies, a matched pair comparison of travel patterns between members and a statistical control group of non-members is used. Factors that explain carshare members’ travel choices and car-shedding behavior are also modeled. The interested reader is referred to earlier reports for background on the City CarShare program, discussions of survey instruments and approaches, and details on the research methodology. This report is organized as follows. First, trends in City CarShare services and usage are presented. This is followed by discussions on carshare travel characteristics based on surveys of users. Section four of the report summarizes travel, demographic and carownership attributes of both carshare members and non-members drawn from a traveldiary home-based survey. Next, the impacts of carsharing are analyzed by comparing travel consumption among members and non-members. The sixth section employs statistical models to reveal the relationship between membership, among other things, and car ownership changes, travel mode choice, and vehicle miles traveled. The report concludes with summary discussions on the longer term impacts of carsharing in the San Francisco Bay Area and their broader policy implications. 2. CITY CARSHARE TRENDS AND USAGE City CarShare was launched in the city of San Francisco in early March 2001. Figure 1 shows that the program gained steady popularity during its first four years—the monthly number of reservations grew from less than a thousand during the first year to well over 5,000 by mid 2005. (In this paper, a “reservation” is counted as a formal lease, of unlimited duration, by a City CarShare member, marked by a member picking up and returning a car to a POD, or point-of-departure; the reader should keep in mind that multiple trips can be, and usually are, made as part of a reservation.) In terms of the 5 number of monthly reservation hours, Figure 2 shows these rose to over 20,000 in 2005. The mileage logged on CarShare vehicles in May 2005 reached 106,000 compared to half as much three years earlier. Also, the number of PODs grew from 6 in the second month of the program to 43 by mid 2005, and the number of reservable vehicles increased from 12 to 87 over the same period. Part of the growth is explained by the program’s expansion to the East Bay (Berkeley and Oakland) in 2003. Active membership in City CarShare has trended upwards in recent times as well, from over 1,800 in September 2002 to 3,800 in May 2005. By mid 2005, the typical City CarShare reservation spanned 3 hours and 45 minutes, and cars were driven, on average, 20 miles during the reservation period. 6000 No. of CarShare Reservatiosn per Month 5000 4000 3000 2000 1000 0 1 3 5 7 9 11 13 15 17 19 21 23 25 27 29 31 33 35 37 39 41 43 45 47 49 2001 2002 2003 2004 2005 Months of City CarShare Program Figure 1. Trends in San Francisco City CarShare Reservations, April 2001–May 2005. 6 No. of CarShare Reservation Hours per Month 25000 20000 15000 10000 5000 2001 2002 2003 2004 49 46 43 40 37 34 31 28 25 22 19 16 13 10 7 4 1 0 2005 Months of City CarShare Program Figure 2. Trends in San Francisco City CarShare Reservation Hours per Month, April 2001 – May 2005. 3. CITY CARSHARE TRAVEL CHARACTERISTICS Because past travel-diary surveys disclosed that carsharing captured a small share of total trips made by City CarShare members, a survey of actual City CarShare usage was conducted for 79 vehicles (62 in San Francisco and 17 in the East Bay) that were located at the 40 POD parking lots (26 in San Francisco and 14 in the East Bay) in March 2005, four years after the City CarShare program was inaugurated. Figure 3 shows the POD locations at the time of the survey. This was the second “in-vehicle” survey conducted of City CarShare usage, following the Autumn 2002 survey reported in San Francisco City CarShare: Travel-Demand Trends and Second-Year Impacts. All members leasing vehicles during the 20-day survey period were asked to fill out a self-administered survey about their carshare usage. (See Appendix A for a copy of the survey instrument.) Members completed the one-page clipboard survey upon returning cars to PODs. In all, 619 responses were received. This section discusses these in-vehicle travel survey findings, drawing comparisons to the 2002 survey results as appropriate. 3.1 User Profiles Demographically, surveyed City CarShare users were evenly split between male and female, with a mean age of 39.6 years. The racial/ethnic distribution of surveyed users 7 Figure 3. City CarShare POD Locations, March 2005. was: white (77.1%); Asian (6.5%); African American (4.5%), Latino (4.2%); and Other (7.7%). The median household income of surveyed carshare users was $50,000, similar to the regional average from the 2000 Census. Around one-third of respondents lived alone and over three-quarters were from households without cars.2 Four years into the program, carsharing in the Bay Area served a fairly distinct and unique market— moderate-income, non-traditional households without cars. Figure 4 maps the locations of City CarShare members’ homes at the time of the survey. In 2005, the largest number of members resided in the central and northeastern parts of San Francisco—in general, the densest areas of the city where parking is constrained and fairly expensive. A visual comparison of Figures 3 and 4 reveal a close correspondence between the locations of PODs and City CarShare residences. As a cross-sectional “snapshot” comparison, it is unclear whether supply chased demand or vice-versa—whether PODs were located where most members resided or people joined City CarShare because PODs were close by. We suspect it is likely more the latter than the former. Figure 5 shows the distribution of walking distances between members’ homes and the nearest PODs. With most members living within 1/2 mile of a POD, at a 3 mph walking speed, most can reach a City CarShare vehicle within 10 minutes by foot. 8 Figure 4. City CarShare Member Household Locations, March 2005. 45 40 35 Percent 30 25 20 15 10 5 0 1 2 3 4 5 Distance to Nearest POD, miles Figure 5. Distribution of Walking Distances to Nearest POD from Members’ Residences, 2005. 9 6 3.2 Trip Patterns and Purposes The spatial distribution of leased City CarShare trips is revealed by the desire line map shown in Figure 6. Visually, it is apparent that many carsharing trips were lateral and cross-jurisdictional in nature, taken to points outside of San Francisco, Oakland, and Berkeley. Many tended to be long-haul journeys along corridors not necessarily wellserved by public transit. The distribution of trip purposes among City CarShare users was similar in 2005 (four years into the program) and 2002 (1½ years into the program). Figure 7 shows that in both years, around three out of ten reservations were mainly for shopping. Next in frequency was social-recreational travel followed by personal business. Journeys to work constituted only around one out of ten carshare reservations. Carsharing for socialrecreational excursions tended to have the longest duration: on average, 4 hours and 41 minutes, compared to an average for all trip purposes of 3 hours and 56 minutes. Those using City CarShare vehicles for shopping returned the vehicle, on average, within 3 hours and 25 minutes, the shortest usage of all trip purposes.3 This was also the case in 2002. Over half of City CarShare reservations were to multiple destinations. Three-leg circuits (from a POD to Destination 1 to Destination 2 back to POD) constituted 27 percent of reservations. The share of reservations from a POD to a destination and back (i.e., two trip legs, or an “unlinked” trip) was 41 percent. Figure 6. Desire Line Map of Surveyed CarShare Trips, 2005 In-Vehicle Survey. 10 31.1% 29.5% Shopping 17.6% 19.2% Personal business (e.g., to bank) 21.5% 20.9% Social-Recreational 11.0% 10.7% Go to work 2005 15.6% 15.3% Other 3.2% Medical 0% 5% 2002 5.6% 10% 15% 20% 25% 30% 35% Percent of Respondents' Trip Purposes Figure 7. Distribution of Trip Purposes Using City CarShare Vehicles, March 2005 and September-October 2002; In-Vehicle Survey. 3.3 Trip Occupancies, Modes, and Trip Chaining Among the CarShare trips surveyed in March 2005, the average vehicle occupancy was 1.44 persons (including the driver), below the 1.59 value surveyed in 2002. Around twothirds of carshare trips were drive-alone.4 The highest occupancies were for City CarShare trips to school (nearly 2 persons); the least discretionary trips (i.e., for personal purposes, medical care, and work), on the other hand, were made mainly by solo-drivers (Figure 8). These patterns match occupancy levels for private car travel in the San Francisco Bay Area, although the occupancy level for carshare trips is higher than for private car commute trips. City CarShare users were asked what modes they would have otherwise taken had carshare vehicles not been available for the particular trips being surveyed. Figure 9 shows that three out of ten trips would likely not have been made—i.e., suppressed trips. Carsharing draws more trips from public transit than any other modal option. Only 11 percent of trips would otherwise have been by private car (either as driver or passenger), comparable to the share that would have been non-motorized (i.e., by foot or bike). Breakdowns of these data by trip purpose (Figure 10) shows that nearly 40 percent of shopping trips would not have been made if City CarShare vehicles were unavailable. For personal business, school, medical, and work trips, carsharing substitutes mainly for transit trips. Over one in five school trips would have been by non-motorized means (walking or bicycle). City CarShare users were also asked how they reached PODs: 77.8 percent walked, 13.8 percent took public transit, 5.6 percent biked, 1.6 percent drove alone (including using a 11 motorcycle), and 1.2 percent got a ride. The respectable shares of transit and bicycle access trips suggest that policy strategies like integrated transit-carshare pricing (as practiced in Switzerland) and putting bicycle racks in or near PODs might hold promise for inducing carsharing. School 1.93 Trip Purpose Social-Rec 1.68 Other 1.56 Shop 1.46 Personal 1.38 Medical 1.36 Work 1.32 0.0 0.5 1.0 1.5 2.0 2.5 Average Occupancy Level How Would Have Otherwise Traveled Figure 8. Mean Occupancy Levels of City CarShare Trips by Purpose, 2005 InVehicle Survey. Wouldn't Travel 30.1% Transit 28.6% Taxi 8.7% Rent Car 7.5% Walk 6.9% Get a Ride 6.4% Drive Myself 4.7% Bike 3.9% Other 3.2% 0% 5% 10% 15% 20% 25% 30% Percent Figure 9. Likely Other Modes if CarSharing was Unavailable, 2005 In-Vehicle Survey. 12 35% Likely Other Mode, by Purpose Other Trip Purpose Social-Rec Medical School Personal Shop Work 0% 10% 20% 30% 40% 50% 60% 70% 80% 90% 100% Likely Mode Taken if City CarShare Were Not Available bike walk drive myself get ride taxi transit car rental wouldn't travel other Figure 10. Likely Other Modes by Trip Purpose, 2005 In-Vehicle Survey. 3.4 Car Preference Four years into the City CarShare program, a variety of vehicles was available to members—compacts, sedans, and minivans, among others. This contrasts with the early years when Volkswagen Beetles were the only vehicles available. Surveyed users were asked why they selected particular vehicles. Figure 11 shows that around half were indifferent to the type of vehicle they used. This also means, however, that for around half of users, vehicle type did matter. Diversifying the CarShare fleet, one could surmise, would likely hold appeal to significant numbers of members by expanding choices. There were no associations between the desire for a particular type of car and factors like age, gender, income, or household type of the CarShare member. 13 Reason CarShare Vehicle Was Chosen Car type didn't matter 49.09% 26.52% Only car available Needed this car type 18.78% Wanted different car but unavailable 5.60% 0% 10% 20% 30% 40% 50% 60% Percent Figure 11. Reason CarShare Vehicle Was Chosen, 2005 In-Vehicle Survey. 4. CARSHARE MEMBERS: MARKET SHARES, BACKGROUNDS, AND CAR OWNERSHIP TRENDS The remainder of this report draws upon the results of the fifth of a series of surveys conducted of City CarShare members and a statistical control group. Besides compiling personal, household, and car-ownership background information, the five surveys also solicited detailed travel-diary information for all trips (not just by CarShare vehicles as was the case with the in-vehicle survey). Complete travel-diary information enabled the travel-behavior impacts of the City CarShare program to be gauged. The first set of background and travel-diary surveys were conducted several weeks before City CarShare’s March 2001 inaugural. Those who signed up to immediately join the program (“members”) and those hoping to one day become members (hereafter called “non-members” and functioning as a control group) were surveyed. (These non-members were ideal controls because they displayed comparable levels of motivation, having taken the time to sign up for the program, but had not formally joined due to factors like lack of a neighborhood POD.) Similar surveys were then conducted of both members and nonmembers three months, nine months, and two years into the program. The latest, and fifth, travel-diary survey, conducted in May 2005 and reported in this study, marks a point in time a little more than four years since City CarShare’s inception. Table 1 summarizes the scheduling and scope of background and travel-diary surveys conducted over the five time points. In all, 527 members and 45 non-members responded to the fifth survey (with response rates being 18.7 percent and 32.1 percent, respectively).5 The survey included not only members who lived in San Francisco, 399 14 of whom responded, but also 173 others living elsewhere in the Bay Area. While previous surveys were conducted for both weekends and weekdays (and further distinguished by whether the day was a workday), this fifth survey was conducted only for weekdays and did not distinguish whether the survey date corresponded with a workday. This was done mainly because of the small sample and low response rate of prior weekend and non-workday surveys. Survey mailbacks and financial incentives were used to increase response rates.6 Individual trip records obtained from the fifth survey totaled 2,475 for members and 233 for non-members—a larger number of surveyed member trips than from the prior survey. See Appendices B, C, and D for copies of the survey cover letter, background survey, and travel diary instrument. (See the previous reports for information on questionnaires and methodology for the previous four surveys.) Table 1. Chronology and Scope of Four Surveys Conducted to Date of San Francisco City CarShare Members and Non-Members. Event Dates Scope Survey # 1 Feb., 2001 (Before opening of CarShare) Travel Diary + Background Survey Opening of San Francisco Early March 2001 City CarShare Survey # 2 June, 2001 (3 months) Travel Diary + Background Survey (New members only) Survey # 3 Oct. – Nov., 2001 (7 months) Travel Diary+ Background Survey (New members only) Survey # 4 Mar. – April, 2003 (2 years) Travel Diary + Background Survey (For update purpose) Survey # 5 May 2005 (4 years) Travel Diary + Background Survey (For update purpose) 4.1 Trip Purpose: All Trips Figure 12 shows the distribution of all members’ and non-members’ trips as recorded in the travel-diary surveys of May 2005. For both groups, most trip purposes were nondiscretionary, such as going to work and returning home. Shopping was the most common discretionary activity among members and non-members. These distributions of trip purposes are similar to those of the four previous travel-diary surveys. 4.2 Market Shares By the end of City CarShare’s fourth year, carsharing made up 4.8 percent of members’ total trips (Table 2). This is up from 2.2 percent three months into the program, but down from 8.1 percent at the nine-month mark and 6.5 percent in 2003, some two years into the program. Thus, while there was a surge in carshare activities in the early years of City 15 20.9% 22.7% To Work 29.4% 32.6% To Home 11.8% 9.9% Shop Member 4.9% 4.2% Personal Business Non-Member 0.9% 1.4% Medical 4.7% 7.4% Social 3.0% 5.1% Eat a Meal 6.4% 5.6% Recreation 0% 10% 20% 30% 40% 50% Percent Figure 12. Trip Purposes of Trips by Members and Non-Members, Survey #5 (2005). CarShare, the novelty effect of sharing cars might have worn off over time, with market shares having dipped in recent years. Adjusting for trip length, carsharing made up 5.4 percent of total vehicle miles traveled (VMT) by members at the end of year-four—again up from the 3-month mark, but considerably down from what was recorded at nine months and at two years into the program. Still, the most popular form of conveyance by members—representing 47.6 percent of all trips in May 2005—was “non-motorized transport” (i.e., walking or cycling). Rail transit comprised most of the mileage logged by City CarShare members in 2005 (33.5 percent), even more than the miles traversed by private car. Table 2. Modal Comparison: Percent Distribution of Mode, All Trip Purposes, City CarShare Members and Non-Members, Survey #5 (2005). Members Non-Members 4.8% 0.0% Private Car 16.9% 33.4% Bus Transit 10.8% 4.7% Rail Transit 18.0% 14.2% Walk-Bike 47.6% 45.1% Other 1.1% 2.6% Total 100.0% 100.0% City CarShare 16 Among the trips recorded in Survey #5, the largest share of rail-transit journeys by members (47.3 percent) was via Muni (San Francisco Municipal Railway’s light-rail transit, tramways, and cable cars), followed by the heavy-rail Bay Area Rapid Transit (BART) at 45.3 percent and commuter-rail (CalTrain) at 4.5 percent. Among all trips (including walking and biking), Muni constituted 8.5 percent of journeys made by members; and BART, 8.1 percent. In terms of the usual mode taken to work, BART was the most popular option among members, accounting for 21.4 percent of their commute trips, followed by bicycle (18.5 percent), walking (17 percent), and bus-transit (14 percent). Figure 13 presents summary statistics on three “supply-side” factors that might have swayed mode-choice decisions among members and non-members. As found in earlier surveys, most members do not have available off-street parking spaces. Also consistent with previous background surveys, most members have a transit pass that allows unlimited monthly transit rides (in most instances, a Muni Fast Pass). The majority of members also own a bicycle. Many members clearly have options for private car travel, particularly for trips within the city of San Francisco. Predictive models presented later in this report account for the role of these and other factors in explaining mode choice and carshare usage. Non-Member 55.6% Supply-Side Attrubute Off-Street Residential Parking Member 40.5% 44.4% Transit Pass 52.8% 53.3% Own Bikes 65.1% 0% 20% 40% 60% 80% 100% Percent Figure 13. Shares of Members and Non-Members with Supply-Side Attributes Associated with Mode Choice, Survey #5 (2005). 17 4.3 Modal Splits by Trip Purpose Table 3 reveals the modes that were relied upon most heavily for specific trip purposes, broken down by members and non-members. Members generally took “green modes” to work or school. Nearly 90 percent of their journeys to work or school were by public transit, foot, or bicycle—a far higher share than for non-members. Members and nonmembers also differed in how they made shopping, social, and personal-business trips, with the former more likely to take transit or non-motorized transportation while the latter group was more inclined go by private car. Compared to experiences two years into the City CarShare program, carsharing was relied upon just slightly less for work-school travel and slightly more for social-personal business travel. Carsharing’s market share was up slightly for shopping, however. 4.4 Travel Consumption Compared to the prior surveys, a significantly larger share of survey respondents who were City CarShare members in May 2005 lived outside of the city of San Francisco— 30.1 percent in 2005, compared to just 2.8 percent in 2003 and 14 percent in late 2001, nine months into the program. This was mainly due to the expansion of carsharing to the East Bay. However, a similar pattern of larger shares of the control group living outside of San Francisco was also found, likely an artifact of some having moved during the twoto five-year survey period. Table 3. Percent Distribution of Mode by Trip Purposes, City CarShare Members and Non-Members, Survey #5 (2005). Member Non-Member Trip Purpose WorkSchool Return Home Shop Trip Purpose SocialPersonal Business WorkSchool Return Home Shop SocialPersonal Business Car Share 1.6% 4.3% 4.6% 7.0% 0.0% 1.5% 0.0% 0.0% Private Car 8.9% 16.6% 19.7% 26.0% 31.3% 25.4% 40.7% 58.4% Bus Transit 13.4% 12.0% 6.6% 11.5% 8.3% 3.0% 11.1% 0.0% Rail Transit 27.7% 21.4% 6.6% 15.7% 12.5% 20.9% 0.0% 8.3% Walk-Bike 47.9% 44.4% 53.9% 39.8% 47.9% 44.7% 48.2% 33.3% Other 0.5% 1.3% 8.6% 0.0% 0.0% 4.5% 0.0% 0.0% Total 100.0% 100.0% 100.0% 100.0% 100.0% 100.0% 100.0% 100.0% 18 The high share of survey respondents living and working within San Francisco, coupled with the city’s relatively small geographical size (49 square miles), translated into fairly short average trips, as shown in Table 4. The table presents travel statistics for all of the trips surveyed in the travel survey, broken down by member and non-member. The typical member journey of around 2.9 miles was slightly less than what was recorded in 2003 as well as below that at the 3 month (4.5 miles) and 9 month (3.5 miles) marks of the City CarShare program. The mean travel time of around 20½ minutes was also a bit below that found in earlier surveys. Mean journey-to-work times among members surveyed in May 2005 was 13.4 minutes, considerably below the average for San Francisco commuters of 30.7 minutes and the regional average of 28.3 minutes from the 2000 Census.7 Because members walked and biked a lot, the average VMT per trip was just over two miles in May 2005. The mode-adjusted VMT, which accounts for occupancy levels of private car trips and nets out transit trips (since no new buses or rail vehicles are added to accommodate these trips) was under a half-mile, also lower than in the past. Table 4 also presents estimated mean levels of gasoline consumption, calculated using information on fuel economy given the make, year, and model of vehicles used for trips. As found in the past, fuel consumption levels of typical trips by CarShare members were considerably below those of non-members, a product of shorter trips, more nonmotorized travel, and higher occupancy levels among trips made by car. Across some variables in Table 4, standard deviation statistics were generally high compared to mean values. This suggests relatively high variation within groups—i.e., amongst members themselves. High within-group variation usually translates into statistically insignificant relationships. This means very large mean differences between members and non-members will have to exist for relationships to be statistically significant. 19 Table 4. Comparison of Travel Statistics for Individual Trips Among Members and Non-Members, Survey #5 (2005). Member Mean Non-Member Std. Dev. Mean Std. Dev. Trip Distance (miles) Trip Time (minutes) 2.90 5.33 4.06 7.68 20.6 20.3 17.4 15.3 Vehicle Miles Traveled (VMT) 2.01 1.38 3.00 5.58 Mode-Adjusted VMT (MVMT) 0.42 0.29 1.47 2.74 Gasoline Consumption, All trips 0.013 0.009 0.055 0.103 Key: Travel Distance = total daily highway-network travel distance, in miles; Travel Time = total daily highway-network travel duration, in minutes; VMT = vehicle miles traveled over highway network [representing total miles logged in motorized vehicles; all non-vehicle (i.e., walk and bicycle) trips were assigned zero values]; MVMT = mode-adjusted VMT (representing total miles logged in motorized vehicles, adjusted for occupancy levels and accounting for whether new vehicle trips are added; values for walking, bicycle, and transit are zero since none of these trips add vehicles to city streets); Gasoline Consumption = estimated gallons of gasoline consumption per day, adjusted for occupancy level and fuel economy of vehicles used for each trip; equals [MVMT/miles per gallon (mpg)] wherein mpg was estimated for city highway conditions given the make, year, and model of vehicle used for a trip.8 4.5 Socio-Demographic Characteristics Background survey data provided an update on the socio-demographic profiles of members four years into the City CarShare program. City CarShare’s first wave of members were found to be fairly unrepresentative of the Bay Area’s and even San Francisco’s population, drawn disproportionately from professional-class residents who did not own cars and who lived either alone or in non-traditional households. By the end of the second year, City CarShare’s membership, while still unique in its composition, was slightly more representative of the city’s population as a whole. This pattern generally held four years after City CarShare’s launching. In May 2005, the mean age of City CarShare members was 39 years, three years higher than the average for the city of San Francisco in 2000 (from the Census) and what was found in the 2003 survey.9 City CarShare tended to draw customers largely from the mid-stages of lifecycle—over two-thirds were below 45 years of age (Figure 14). Also, 53.5 percent of surveyed members were women (compared to 49.2 percent of San Francisco residents in the 2000 Census). Whites made up 82.8 percent of surveyed members (considerably above the 49.6 percent and 48.8 percent shares for San Francisco and Alameda County, respectively, in the 2000 Census). The share of surveyed members who are white is similar to that found in year-two of the program. The 8.8 percent and 20 2.1 percent of surveyed members who are Asian Americans and African Americans, respectively, are well below the shares for San Francisco as well as Oakland and Berkeley from the 2000 Census.10 Those who identified themselves as Latino comprised 3.3 percent of the year-four members, below the 4.6 percent found in the year-two survey and well below the 14.1 percent and 19.0 percent of San Francisco and Alameda County Latino residents, respectively, in the 2000 Census. Members’ median annual personal income of $58,150 in 2005 was above the Census averages for San Francisco as well as the East Bay. Around three-quarters of CarShare members surveyed in 2005 had full-time jobs; 14.2 percent worked part-time, 4.1 percent were students, and 6.5 percent were not working. In terms of household types, City CarShare attracted a comparatively large share of individuals who lived with one or more unrelated adults—21 percent of members surveyed in May 2005 versus 17.4 percent of San Francisco households in 2000 (Figure 15). Around 35 percent of members lived alone in 2005, similar to the citywide average. 20-24 2.6% 2.3% 8.6% 27.8% 25-34 34.0% 20.6% Age 35-44 28.3% 32.6% 16.6% 16.4% 17.3% 45-54 SF City Residents (Age 20 and Over) SF CarShare Members (2003) CarShare Members (2005) 10.1% 7.7% 10.7% 55-64 65 and over 16.3% 1.9% 3.0% 0% 43.2% 10% 20% 30% 40% 50% Percent Figure 14. Comparison of Age Distributions Among CarShare Members (May 2005 and March–April 2003) with Residents (20 Years and Older) of San Francisco (2000). 21 12.2% 11.4% 9.8% Household Type Married, with Children Married, no Children 19.5% 17.0% Not Married, Children 2.4% 2.7% 24.6% SF Residents (2000) SF CarShare Members (2003) CarShare Memers (2005) 7.2% 17.4% Unrelated Adults 36.3% 21.0% 38.6% 41.8% 35.5% Live Alone 0% 10% 20% 30% 40% 50% Percent Figure 15. Comparison of Household Types Among CarShare Members (in MarchApril 2003) and All Residents of San Francisco (in 2000). Overall, members’ mean household size was 1.93, compared to 2.3 for San Francisco as a whole (and 2.63 for the nine-county Bay Area). Around 80 percent of members surveyed in May 2005 lived in one- or two-person households. CarShare membership also ran in the family: 32.6 percent of surveyed members’ reported another City CarShare member in the household. 4.6 Car Ownership Patterns and Trends By City CarShare’s second anniversary, the prior survey found that City CarShare members had begun to shed private cars. The convenience of having a fleet of vehicles available on demand prompted some carsharers, it appeared, to get rid of second cars, put off purchasing vehicles, and perhaps forego car ownership altogether. Did this pattern hold four years after City CarShare’s inauguration? In May 2005, 62.8 percent of members were from zero-vehicle households and 28.7 percent were from one-vehicle households.11 (Motor vehicles include not just automobiles but also motorcycles, recreational vehicles, trucks, and mopeds.) Thus, 91.5 percent were from 0-1 vehicle households, above the 83.3 percent share during the program’s first year and 90.3 percent found for year-two and well above the year-2000 average of 70.6 percent for all San Francisco households. The 62.8 percent of members from zero-car households was well above that of all previous surveys (Figure 16). The share of members residing in zero-car households increased by about 21 percent between the nine-month and four-year anniversaries of City CarShare. This was matched by drop-offs in shares of members living in one or two-plus car households. 22 Household Motor Vehicles 41.9% None 56.7% 62.8% 41.4% One 33.7% SF CarShare Members (2001: 9 28.7% months) SF CarShare Members (2003: 2 Years) CarShare Members (2005: 4 Years) 16.7% Two or more Percent 9.6% 8.5% 0% 10% 20% 30% 40% 50% 60% 70% Figure 16. Comparison of Motor Vehicle Ownership Distributions Among the Members of San Francisco CarShare in 1st and 2nd Years of CarShare Program. To further probe trends in car ownership, the May 2005 survey asked respondents directly whether they reduced, increased, or did not change the number of vehicles in their household since joining City CarShare. Non-members (i.e., the control group) were asked about vehicle ownership changes since January 2001. Table 5 shows that while levels of car-shedding were similar among members and non-members, members were less likely to increase car ownership. Compared to the 2003 survey results, when members were asked if they had gotten rid of private vehicles within the past two years, the degree of car-shedding among members appears to have leveled off. In 2003, 29.1% of surveyed members had gotten rid of one or more vehicles within the past two years, a higher share than found in the 2005 survey. Table 5. Changes in Household Motor Vehicle Ownership: Members and NonMembers. Change in Motor Vehicle Ownership Reduced by Two and More Members (A) Non-members (B) Difference between Members and Non-members (A-B) 2.0% 8.9% -6.9% Reduced by One 22.2% 15.6% 6.6% Did Not Change 58.4% 43.2% 15.2% Increased by One 15.8% 28.9% -13.1% 1.6% 4.4% -2.8% 100.0% 100.0% Increased by Two and More Total 23 5. EVALUATION This section addresses the central question of this research: whether over the longer run, some four years following City CarShare’s inception, carsharing has significantly impacted travel behavior, and if so, in what direction? Has the sharing of cars in the Bay Area’s densest and most populous urban centers reduced motorized travel, as was found two years into the program, or perhaps stimulated travel, as was found early on? All trips made by each surveyed person are included in the analyses that follow—what was called “aggregate analyses” in the previous reports. Changes in mean trip distance, travel time, VMT, and several additional indicators of travel consumption are examined between the period of February 2001 (several weeks prior to City CarShare’s inauguration, called Survey #1) and May 2005 (several months following the program’s fourth anniversary, called Survey #5)—a “long-term before-and-after analysis.” A second set of analyses is presented for the “intermediate to longer term” period: from March 2003 (representing the program’s second anniversary, called Survey #4) to May 2005 (Survey #5). In carrying out the analyses in this section, data for those living outside of San Francisco (i.e., mainly the East Bay) were omitted. This was necessary in order to make valid comparisons to earlier years, when PODs were limited to the city of San Francisco. Removing cases with non-San Francisco residences reduced the year-2005 sample size by 30 percent.12 This loss in statistical power, however, was necessary to ensure “applesto-apples” comparisons of differences of means. Table 6 summarizes travel-consumption statistics for members for the three survey periods. Table 7 does likewise for non-members. The statistical results are summarized in this section. 5.1 Travel Distances and Times Compared to the first survey (pre-CarShare, February 2001) and the fourth survey (second anniversary, March 2003), mean daily travel distances of City CarShare members fell slightly by the fifth survey as shown in Table 6 (fourth anniversary, May 2005). For non-members, they rose over the long-term, but largely stabilized over the 2003–2005 period (Table 7). None of these changes, however, were statistically significant (based on the p-values, or probabilities, in both tables). Mean travel times steadily fell for both groups over the three survey periods, although more rapidly for non-members. Because average travel times fell while distances increased, average travel speeds rose markedly among members, in part from the substitution of City CarShare trips for travel formerly by foot and bicycle. Clearly, carsharing has enhanced mobility, allowing members to conveniently reach more destinations in and around San Francisco and to do so more quickly. As with the distance variable, the changes in travel times were not statistically significant for either members 24 or non-members. For members, declines were statistically significant during the 2003– 2005 period at the 0.10 probability level. 5.2 Vehicle Miles Traveled Did carsharing affect VMT? During City CarShare’s first two years, average daily VMT fell slightly for members yet increased for non-members. While factors like changing fuel prices (which rose) and rainfall (which was much lower during Survey #4 than Survey #1) might have impacted VMT during survey periods, these potential confounders affected both members and non-members equally, meaning their influences are netted out when comparing trends. By City CarShare’s fourth anniversary, CarShare members’ VMT had fallen fairly noticeably from earlier levels. They fell for non-members relative to the 2003 levels, but were higher than in 2001. Most of the decline for members appeared to be attributable to both mode shifts (particularly higher shares of walk and bicycle travel) as well as a shortening of mean daily travel distances. Still, the changes were not statistically significant, for either members or non-members. Adjusting for mode and occupancy levels for car trips, however, did yield statistically significant results, more so than any of the “travel consumption” metrics. As shown in Table 6, members’ mean MVMT fell by 67 percent over the long term (2001 to 2005) and by 38 percent over the intermediate term (2003 to 2005). These are dramatic drops, and are statistically significant at the 5 percent “alpha” level for the “long term” and nearly the 5 percent level for the “intermediate to longer term.” Such declines were a combination of not only shifts to “green modes” and shorter travel, but also relatively high occupancy levels for private car trips, including those in City CarShare vehicles. Table 7 shows the mode-adjusted VMT for non-members rose in the first two years, but as with members, appears to have fallen some since 2003, although these relationships were not statistically significant. Members’ mode-adjusted VMT declines four years into the program are more substantial than that found for the 2001–2003 period, suggesting that carshare membership instills a resourcefulness in travel habits, whether in the form of multi-occupant carshare travel or taking transit, walking, or cycling when carshare vehicles are not used to get around. This finding supports one of the original hypotheses of this research: over the long haul, carsharing promotes judiciousness in travel behavior, tied to participants becoming more mindful of the marginal costs of driving a car. 25 Table 6. Members: Trends in Daily Travel, Survey #1, Survey #4, Survey #5. Long-Term Before & After Analysis Cross-Sectional Survey Results Survey #1 (February 2001) Survey #4 (March 2003) Std. Mean Dev. Survey #5 (May 2005) Std. Mean Dev. Mean Std. Dev. Travel Distance 15.7 21.2 15.7 17.7 14.6 Travel Time 114.4 120.6 108.3 77.5 96.4 VMT (Vehicle Miles Traveled) 4.50 11.32 4.40 13.31 3.02 MVMT (Mode-adjusted VMT) 2.80 7.28 1.49 4.86 .93 Gasoline Consumption 0.074 0.231 0.047 0.167 0.03 12.8 Intermediate to Longer Term Analysis Diff. of Means (S5 – S1) t-Statistic (2 tailed pvalue) Diff. of Means (S5 – S4) -1.1 -0.393 (0.69) -1.218 (0.224) -1.031 (0.303) -2.323 (0.021) -1.501 (0.134) -1.1 50.7 -18.0 5.68 -1.48 1.40 -1.87 .116 -0.044 -11.9 -1.38 -0.56 -0.017 tStatistic (2 tailed pvalue) -0.736 (0.462) -1.899 (0.058) -1.504 (0.133) -1.899 (0.058) -1.241 (0.21) Key: Travel Distance = total daily highway-network travel distance, in miles; Travel Time = total daily highway-network travel duration, in minutes; VMT = vehicle miles traveled over highway network [representing total miles logged in motorized vehicles; all non-vehicle (i.e., walk and bicycle) trips were assigned zero values]; MVMT = mode-adjusted VMT (representing total miles logged in motorized vehicles adjusted for occupancy levels and accounting for whether new vehicle trips are added; values for walking, bicycle, and transit are zero since none of these trips add vehicles to city streets); Gasoline Consumption = estimated gallons of gasoline consumption per day adjusted for occupancy level and fuel economy of vehicles used for each trip; equals [MVMT/miles per gallon (mpg)] wherein miles per gallon (mpg) was estimated for city highway conditions given the make, year, and model of vehicle used for a trip; S1 = Survey #1 (February 2001 – two weeks prior to City CarShare); S4 = Survey #4 (March 2003 – end of City CarShare’s second year of operation); S5 = Survey #5 (May 2005 – two months into the fourth year of operation). 26 Table 7. Non-Members: Trends in Daily Travel, Survey #1, Survey #4, Survey #5. Long-Term Before & After Analysis Cross-Sectional Survey Results Survey #1 (February 2001) Survey #4 (March 2003) Std. Mean Dev. Survey #5 (May 2005) Std. Mean Dev. Mean Std. Dev. Travel Distance 19.2 19.6 23.2 28.4 22.6 Travel Time 149.9 206.0 125.1 93.0 98.7 VMT (Vehicle Miles Traveled) 6.73 15.49 13.10 28.30 9.51 MVMT (Mode-adjusted VMT) 5.45 13.14 9.42 20.85 6.7 Gasoline Consumption 0.212 0.596 0.464 1.290 0.310 Diff. of Means (S5 – S1) 30.4 -3.4 74.7 -51.2 26.44 2.78 18.88 1.28 0.712 0.098 tStatistic (2 tailed p-value) 0.483 (0.630) -1.544 (0.125) 0.466 (0.642) 0.287 (0.775) 0.549 (0.584) Intermediate to Longer Term Analysis Diff. of Means (S5 – S4) -0.6 -26.4 -3.59 -2.69 -0.154 tStatistic (2 tailed p-value) 0.067 (0.947) -1.044 (0.299) -0.431 (0.668) -0.446 (0.657) -0.520 (0.604) Key: Travel Distance = total daily highway-network travel distance, in miles; Travel Time = total daily highway-network travel duration, in minutes; VMT = vehicle miles traveled over highway network [representing total miles logged in motorized vehicles; all non-vehicle (i.e., walk and bicycle) trips were assigned zero values]; MVMT = mode-adjusted VMT (representing total miles logged in motorized vehicles adjusted for occupancy levels and accounting for whether new vehicle trips are added; values for walking, bicycle, and transit are zero since none of these trips add vehicles to city streets); Gasoline Consumption = estimated gallons of gasoline consumption per day adjusted for occupancy level and fuel economy of vehicles used for each trip; equals [MVMT/miles per gallon (mpg)] wherein mpg was estimated for city highway conditions given the make, year, and model of vehicle used for a trip;13 S1 = Survey #1 (February 2001 – two weeks prior to City CarShare); S4 = Survey #4 (March 2003 – end of City CarShare’s second year of operation); S5 = Survey #5 (May 2005 – two months into the fourth year of operation). 27 5.3 Fuel Consumption Metric Despite the fact that, upon becoming CarShare members, a number of San Franciscans began driving in lieu of traveling by transit, foot, or bicycle, members’ average daily fuel consumption fell steadily during the program’s first four years. This likely reflected a combination of members reducing private car ownership, switching to more fuel-efficient City CarShare vehicles, and carrying passengers for many carshare trips (thus increasing average occupancy levels relative to private car trips). While the changes in mean fuel consumption among members were not statistically significant at an alpha of .05, the relatively low p-values for both evaluation periods are not inconsequential values. By comparison, mean fuel consumption rose among non-members during the first two survey periods and fell during the 2003–2005 period, though these changes were not statistically significant. Such declines might have been attributable to spikes in gasoline prices during the 2003–2005, however as a matched-pair study, such factors are controlled for since rising gasoline prices presumably affected both members and nonmembers similarly over the evaluation period. 5.4 Net Impacts Before-and-after comparisons over the first four years of the City CarShare program reveal marked declines in travel consumption among members compared to nonmembers. Most of these declines attributable to carsharing accrued during the first several years of the program; however, over the intermediate-to-longer term periods, levels of travel suppression appear to have stabilized or perhaps slightly reversed themselves. That is, declines in VMT during the 2001–2003 period that might be attributable to carsharing did not carry over to the 2003–2005 period. This inference of stabilized or slightly reversed impacts during the intermediate-to-longer term period is drawn from Table 8. The table presents the “difference of difference of means” results—i.e., the degree to which changes in travel over two time points differed among members and non-members. The table shows, for example, that even though mean daily VMT (in unadjusted and mode-adjusted terms) among members fell between 2003 and 2005, they fell even more for non-members. (This is reflected by the positive “Difference of Difference of Means” values for VMT and MVMT in the “Intermediate to Longer Term Analysis” in Table 8.) Average daily VMT did fall more for members over the longer-term 2001–2005 “before and after” period; however, as noted before, reductions occurred mainly during the first two years. None of the “difference of difference” changes were statistically significant, attributable to fairly large within-group variations. Overall, these results show evidence of sustained net reductions in CarShare members’ VMT and fuel consumption some four years into the City CarShare program, due mainly to shorter, higher occupancy, and reduced private car travel during the first several years of the program. Table 8 indicates that while mean daily travel distances fell more rapidly for members than non-members over both study periods, mean daily travel times increased more. This 28 indicates that mean travel speeds increased more rapidly for non-members than members over the 2001–2005 period. Again, none of these relationships was statistically significant. While absolute differentials shown in Table 8 do not appear to be particularly large, in relative terms they were more substantial (Figure 17). For example, the long-term percentage point differential for mode-adjusted VMT (i.e., MVMT) was -90.3—a product of a mean 66.8 percent decline for members and a 23.5 percent increase for non-members over the 2001–2005 period. In relative terms, the biggest long-term environmental benefits of carsharing in the San Francisco Bay Area came from reduced gasoline consumption, followed by VMT reductions, and reduced travel distances. CarShare members’ propensities to walk, bike, take public transit, and when they drive, to have other occupants in the vehicle, largely account for these sustained benefits. It is noted from Figure 17 that benefits over the 2003–2005 period were substantially smaller than over the longer 2001–2005, further reflecting the fact that most environmental benefits accrued in the first few years of the program. Table 8. Difference of Difference of Means: Changes of Members Minus Changes of Non-Members, Weekday/Workday. Long-Term Before & After Analysis (Surveys #1 to #5) Difference of Difference of Means Travel Distance Travel Time VMT (Vehicle Miles Traveled) MVMT (Mode-adjusted VMT) Gasoline Consumption t-Statistic (2 tailed P Value) -0.457 (0.648) 0.693 (0.489) -0.576 (0.565) -0.597 (0.551) -0.683 (0.495) -4.50 33.20 -4.26 -3.15 -0.14 See Table 6 or 7 key for variable descriptions. 29 Intermediate to Longer Term Analysis (Surveys #4 to #5) Difference of Difference of Means -0.5 14.50 2.21 2.13 0.14 t-Statistic (2 tailed P Value) -0.048 (0.962) 0.460 (0.646) 0.239 (0.811) 0.337 (0.436) 0.443 (0.658) -42.2% Travel Distance (miles) -18.3% Long Term (2001-2005) -84.5% -8.0% -95.9% -8.5% -114.8% -4.1% -140% -120% -100% -80% -60% 14.8% Travel Time (min.) Intermediate-to-Long Term (2003-2005) -40% -20% 5.2% VMT MVMT Gasoline Consumption (Gallons) 0% 20% 40% Percentage Point Difference Figure 17. Percentage Point Differences in Changes in Mean Daily Travel Characteristics: Members Relative to Non-Members, Long-Term Analysis (Survey #1 to Survey #5) and Intermediate to Longer Term Analysis (Survey #4 to Survey #5). 6. PREDICTIVE MODELS This section presents the results of predictive models that shed additional light on City CarShare’s long-term impacts. Factors that might explain changes in car ownership and travel patterns are highlighted. All models are based on results of the fifth survey (from May 2005). 6.1 Car Ownership Model Table 9 presents a best-fitting binomial logit model that predicts whether a respondent owned at least one vehicle in May 2005. This model shows that membership in City CarShare and living near a POD significantly increased the likelihood that an individual lives in a car-less household. Larger households with children were more likely to own at least one car. Living in dense, transit-friendly San Francisco lowered the odds of owning one or more vehicles. 30 Does living near a POD influence car ownership? Table 9 suggests it did. As the number of PODs within a half mile of a members’ home increased, the likelihood of owning a car fell. City CarShare PODs are generally located in dense neighborhoods that are well served by transit, both of which are conducive to car-free living. Figure 18 plots the probabilities estimated from the model in Table 9 as a function of “Number of PODs within a half mile of home” for various sub-groups. For the “typical” survey respondent (i.e., household size of 2, living in San Francisco, no children, with one POD within a half mile of home), the probability of owning at least one vehicle jumps from 31.2 percent if the person is a member to 50.3 percent if he or she is a nonmember. For the same “typical” individual, the likelihood of owning a vehicle increases another 16.3 percent if the household has children. Each additional POD within a half mile of a member’s home lowers his or her likelihood of owning a vehicle by 4 percent to 6.5 percent. Table 9. Binomial Logit Model for Predicting the Likelihood of Owning at Least One Vehicle; Survey #5. Coefficient Estimate Standard Error City CarShare Member (1 = yes; 0 = no) -0.801 0.326 0.014 Number of PODs within a half mile of home -0.261 0.101 0.010 Lives in San Francisco (1 = yes; 0 = no) -0.682 0.204 0.001 Household Size 0.272 0.096 0.004 Has Children (1 = yes; 0 = no) 0.690 0.292 0.018 Constant 0.410 0.384 0.285 Variables Summary Statistics: Number of Cases 572 -2 L (c): Log Likelihood Value, Constant-only Model 736.25 -2 LL (B): Log Likelihood Value, Parameterized Model 684.93 Model Chi-Square (probability): -2[L (c) - L (B)] 51.319 (0.000) R-Square (McFadden): 1 – [L (B)/ L (C)] 0.075 31 Probability Probability of Owning at least one Vehicle 0.9 0.8 0.7 0.6 0.5 0.4 0.3 Non-Member, Non-San Francisco, Children Non-Member, Non-San Francisco, No Children CCS Member, Non-San Francisco, Children Non-Member, San Francisco, No Children CCS Member, San Francisco, Children CCS Member, San Francisco, No Children 0.2 0.1 0 0 1 2 3 4 Number of Carsharing PODs within 1/2 mile of home address Figure 18. Sensitivity Analysis for Binomial Logit Model for Predicting the Likelihood of Owning at Least One Vehicle; Survey #5. 6.2 Changes in Car Ownership Model The previous models examined factors that influenced car ownership levels in 2005 as well as factors associated with car-shedding. What factors influence changes in car ownership? This section explores this question by examining factors that explain decreases as well as increases, plus the status quo (no change), in vehicle ownership. CarShare members were asked to list the cars they had acquired and gotten rid of since becoming members of City CarShare. An analysis of their responses was conducted by estimating an ordinal logit model that predicted five rank-ordered outcomes: net reduction of 2 or more cars; net reduction of 1 car; no change; net increase of one car; or net increase of 2 or more cars. Table 10 presents the results. Of most interest are the “Location” variables that associated predictor variables with rank-order outcomes.14 The negative sign on “Member Status” indicates a value of 1 (i.e., being a CarShare member) lowers the rank-order—i.e., is associated with the lower valued categories of net declines in car ownership. Similarly, having a transit pass and having at least one POD near one’s residence were associated with net declines in household cars. Car-shedding also increased with age. Driving to work and living in a household with children, on the other hand, encouraged increased car ownership, for members and non-members alike. Overall, the model exhibited a reasonably good statistical fit. 32 Table 10. Ordinal Logit Estimates for Predicting Net Changes in Vehicle Ownership Among Survey Respondents. Threshold Net ∆: -2 or more cars Net ∆: -1 car No Change Net ∆: + 1 car Location Member Status (1=City CarShare; 0=no) Owns a Transit Pass (1=yes; 0=no) POD within ½ mile of Residence (1=yes; 0=no) Has Children (1=yes; 0=no) Age (Years) Drive-to-Work (1=yes; 0=no) Summary Statistics: Number of Cases = 530 Model Chi-Square (probability) = 61.45 (.000) R-Square (McFadden) = .069 Coefficient Estimate Standard Error Probability -7.301 -4.222 -0.260 3.644 0.811 0.676 0.638 0.953 .000 .000 .684 .000 -0.978 -0.414 -0.497 0.514 -0.029 2.765 0.402 0.199 0.225 0.297 0.010 0.479 .015 .038 .028 .084 .003 .000 Table 11 presents a best-fitting binomial logit model that predicts whether a respondent reduced car ownership by one or more cars in their household since joining City CarShare. Controlling for several demographic variables and vehicle ownership levels, being a City CarShare member significantly increased the likelihood someone got rid of a car. A sensitivity analysis of this model revealed that for the “typical” survey respondent (i.e., 39 years old, living in San Francisco), the odds of reducing car ownership jumps from 5.4 percent if the person is a non-member to 18.8 percent if he or she is a member. Figure 19 shows how the likelihood of car-shedding varies by age, membership status, and city of residence. Car-shedding is more likely to occur for individuals living in San Francisco, but membership in City CarShare has the largest impact on a persons’ odds of carshedding. 33 Table 11. Binomial Logit Model for Predicting the Likelihood Respondents Reduced Motor Vehicle Ownership; Survey #5. Coefficient Estimate Standard Error City CarShare Member (1 = yes; 0 = no) 1.408 0.565 0.013 Age 0.038 0.010 0.000 Lives in San Francisco (1 = yes; 0 = no) 0.374 0.267 0.162 -4.723 0.814 0.000 Variables Constant Probability Summary Statistics: Number of Cases 563 -2 L (c): Log Likelihood Value, Constant-only Model 517.776 -2 LL (B): Log Likelihood Value, Parameterized Model 497.988 Model Chi-Square (probability): -2[L (c) - L (B)] 19.788 (0.000) R-Square (McFadden): 1 – [L (B)/ L (C)] 0.0382 0.45 CCS Member, San Francisco 0.4 CCS Member, Non-San Francisco Non Member, San Francisco 0.35 Non Member, Non-San Francisco Probability 0.3 0.25 0.2 0.15 0.1 0.05 0 20 25 30 35 40 Age 45 50 55 60 Figure 19. Sensitivity Analysis of Binomial Logit Model for Predicting the Likelihood Respondents Reduced Motor Vehicle Ownership; Survey #5. 34 65 6.3 City CarShare Mode Choice Model A binomial logit equation was also estimated to predict whether member respondents opted to travel by carsharing or otherwise (public transit, private car, bike or walk). The model only considered trips within San Francisco for which the appropriate transportation data was available. Table 12 shows the resulting coefficients for significant predictive variables. As shown, members were less likely to choose carsharing for work trips and more likely to choose it where public transit was slow relative to automobile travel. The model also suggests that carsharing decreased with increasing numbers of vehicles per household member (though not statistically significant). Members who had not purchased any new vehicles since joining City CarShare and members with children in the household were more likely to choose carsharing for a trip. In this light, carsharing can be considered self-reinforcing; it facilitates reducing the number of private vehicles in the household (as was seen earlier), which in turn, induces more carshare use, according to this model. Table 12. Binomial Logit Model for Predicting Likelihood Member Respondents from Survey #5 Chose City CarShare for Trip. Variables Coefficient Estimate Standard Error Probability Modal and Travel Attributes: Total Travel Time Differential: Transit– Automobile (minutes)a 0.061 0.031 0.054 Work Trip (1=yes; 0=no) -1.655 0.688 0.018 No. of Vehicles Per Household Member -1.103 0.839 0.192 Has Children in the Household (1=yes; 0=no) 1.023 0.242 0.000 Forgone purchase of cars since joining City CarShare (or January 2001 for non-members) (1=yes; 0=no) 2.009 0.883 0.025 -11.345 2.240 0.000 Socio-Economic Controls: Constant Summary Statistics Number of Cases 1645 -L (0): 1033.5 - L (B): 176.5 Model Chi-Square (probability): Goodness of Fit (adjusted Rho squared) 1714 (.0000) 0.822 Notes: a For transit travel, travel time consists of that occurring “in vehicle” (BART, Muni rail, or Muni bus) and “out of vehicle” (including walk time for access and transfers and waiting time, and driving to access transit, if any). For drive-alone travel, total time consists of in-vehicle network highway travel time. Model was run as a panel, because of the multiple trips per respondent. The panel identifier was significant at the 99.9% level. 35 6.4 Overall Mode Choice Model A more detailed multinomial logit equation was estimated that predicted the choice of modes among walk, bike, automobile, carshare and transit, based on a variety of socioeconomic information and trip characteristics. Table 13 shows the resulting coefficients for significant predictive variables. In terms of specific trip attributes’ impacts on mode choice, all modes became preferable to walking as the travel time differential (transit minus auto) increased. Choice of auto was slightly more positively sensitive than transit and carshare to travel time differentials. Riding a bicycle was less preferred for longer trips. Carshare choice was most sensitive among the motorized modes to the travel time differential squared. Compared to walking, work trips tended to favor bike and public transit mode choice, and disfavor (though not significant statistically) automobile use. In terms of socio-economic influences on choice, bike use tended to decline with age, while private car use and carsharing tended to rise. With respect to cycling and walking, bike ownership reduced the likelihood of using any of the three motorized modes and had a more pronounced and significant effect on the choice to carshare. With respect to walking and driving, carsharing, transit use, and bicycle use decline as incomes rise, according to the model. Finally, with respect to walking and driving, possession of a transit pass significantly increases the likelihood of choosing transit, and reduces the likelihood of carsharing and biking. 36 Table 13. Multinomial Logit Model for Predicting Likelihood Member Respondents from Survey #5 Chose City CarShare (CCS), Private Automobile (Auto), Public Transit (Transit), Bicycle, or Walking. (Walking is the base mode, with all coefficients equal to zero). Coefficient Estimate Variables Standard Error Probability Trip Characteristics: Total Travel Time Differential: Transit– Automobile (minutes)a [Specific to CCS] 0.403 0.079 0.000 Total Travel Time Differential: Transit– Automobile (minutes) [Specific to Auto] 0.389 0.060 0.000 Total Travel Time Differential: Transit– Automobile (minutes) [Specific to Transit] 0.380 0.061 0.000 Total Travel Time Differential: Transit– Automobile (minutes) [Specific to Bicycle] 0.215 0.030 0.000 -0.0039 0.0021 0.065 Total Travel Time Differential Squared [Specific to CCS] Total Travel Time Differential Squared [Specific to Auto] -0.0030 0.0014 0.028 Total Travel Time Differential Squared [Specific to Transit] -0.0032 0.0017 0.060 Work Trip (1=yes; 0=no) [Specific to Auto] -0.743 0.457 0.107 Work Trip (1=yes; 0=no) [Specific to Transit] 0.537 0.178 0.003 Work Trip (1=yes; 0=no) [Specific to Bicycle] 0.893 0.231 0.000 Socio-economic Controls: Age (years) [Specific to CCS] 0.039 0.017 0.024 Age (years) [Specific to Auto] 0.041 0.018 0.025 Age (years) [Specific to Bicycle] -0.027 0.018 0.134 Gender (1= male, 0 = female) [Specific to Bicycle] 0.868 0.341 0.013 City CarShare Member (1=yes; 0=no) [Specific to Bicycle] -1.156 0.558 0.041 Forgone Vehicle Purchase from 2001 to 2005 (1=yes; 0=no) [Specific to Auto] -0.919 0.467 0.052 Bike owner (1=yes; 0=no) [Specific to CCS] -1.554 0.523 0.004 Bike owner (1=yes; 0=no) [Specific to Auto] -0.712 0.525 0.178 Bike owner (1=yes; 0=no) [Specific to Transit] -0.567 0.242 0.021 Personal Income (1000 dollars/year) [Specific to CCS] -0.015 0.006 0.018 Personal Income (1000 dollars/year) [Specific to Transit] -0.006 0.004 0.096 Personal Income (1000 dollars/year) [Specific to Bicycle] -0.014 0.007 0.056 Possess Transit Pass (1=yes; 0=no) [Specific to Auto] -0.6484 0.5283 0.223* Possess Transit Pass (1=yes; 0=no) [Specific to Transit] 0.8989 0.2934 0.003 Possess Transit Pass (1=yes; 0=no) [Specific to Bicycle] -1.1012 0.4173 0.010 Constants City CarShare -6.839 1.243 0.000 Auto -5.284 1.243 0.000 Transit -4.679 0.616 0.000 Bicycle SUMMARY STATISTICS -1.149 1.253 0.361 Number of Cases 1356 -L (0): 1827.7 -L (B): 1212.3 Model Chi-Square (Probability): 1230 (.0000) 0.320 Goodness of Fit (adjusted Rho squared) Notes: a For transit travel, travel time consists of that occurring “in vehicle” (BART, Muni rail, or Muni bus) and “out of vehicle” (including walk time for access and transfers and waiting time, and driving to access transit, if any). For drive-alone travel, total time consists of in-vehicle network highway travel time. Model was run as a panel because of the multiple trips per respondent. The panel identifier was significant at the 0.001 probability level. 37 6.5 Average Daily VMT Model From a best-fitting multiple regression model, City CarShare membership significantly reduced daily VMT (Table 14). This was after controlling for the influences of other predictors, like respondents’ socio-economic characteristics. All else being equal, City CarShare membership typically lowered daily travel by 7 vehicle miles. Residing in dense, transit-friendly San Francisco reduced the figure by another 3 vehicle miles. Owning a bicycle cut down on daily travel by nearly an additional 4 vehicle miles. Every additional car added per household member, however, raised daily VMT by 13. Four years into the City CarShare program, the combination of being a CarShare member, owning a bicycle, and reducing car ownership all serve to shrink the transportation sector’s ecological footprint in the San Francisco Bay Area. Table 14. Regression Model for Predicting Respondents’ Average Daily VMT; Survey #5, All Trip Purposes, All Day Types. Variables Coefficient Estimate Standard Error Probability Member Status: City CarShare Member (1=yes; 0=no) -7.08 3.46 .040 13.07 2.09 .000 -3.784 1.890 .046 Age (years) .750 .432 .083 Age squared -.008 .005 .077 Personal income, annual (in $1000s) -.086 .056 .127 Personal income, annual (in $1000s), squared .0004 .00025 . .095 -3.064 2.030 .132 4.206 10.232 .681 Socio-Economic Controls: No. of Vehicles Per Household Member Owns a bicycle (0=no; 1=yes) Resides in San Francisco (0=no; 1=yes) Constant Summary Statistics Number of Cases 459 R-Square .148 F Statistics (probability) 8.214 (.000) 38 7. CONCLUSION Based on the results from a series of five surveys of City CarShare members and nonmembers, there is clear evidence of a net reduction in the vehicle miles traveled and fuel consumption of CarShare members. Matched-pair comparisons revealed that members’ mean VMT and fuel consumption went down faster than non-members’ over the 2001– 2005 period, an era marked by rising fuel prices. Reduced travel was matched by increased accessibility afforded to those who joined City CarShare. Rising personal benefits matched by declining social costs (reflected by VMT and fuel consumption) suggests carsharing is a “win-win” proposition—benefiting users as well as non-users. While net long-term benefits appear to be associated with carsharing in the San Francisco Bay Area, the largest reductions in members’ average VMT and fuel consumption accrued during the first several years of the program. Over the past few years, earlier declines appear to have leveled off and indeed might have eroded slightly. While these results indicate the benefits of carsharing sustain themselves over the long term, there is nonetheless a maturation process wherein early gains appear to taper off with time. Part of the explanation for long-term reductions in VMT and fuel consumption is rooted in the tendency of members to sell off private cars and forego the purchase of additional ones. Of the members surveyed, 17 percent stated that they had reduced vehicle ownership since joining City CarShare. Membership in City CarShare was a significant variable in predicting the likelihood of vehicle shedding, with members about 12 percent more likely to shed a vehicle than non-members. Older, childless members who lived within a half mile of one or more PODs were most likely to shed vehicles. CarShare membership was also seen to be a self-reinforcing behavior, much like car ownership is for inducing car use. Membership was associated with reduced car ownership, and reduced car ownership was associated with more carshare use for trips. Interestingly, possessing a transit pass lowered the probability of private car use compared to carshare use, and the significant use of transit to access carsharing vehicles suggests there are real synergies between public transit and car sharing. It was not just average VMT that fell among members relative to non-members. Because carshare vehicles tended to be small, fuel-efficient, and carry several people, per capita levels of gasoline consumption and greenhouse gas emissions have also trended downwards. Mindful of the cumulative costs of driving, CarShare members, we believe, have also become more judicious and selective when deciding whether to use a car, take public transit, walk, bike, or even forego a trip. These factors, coupled with reduced personal car ownership, have given rise to a more resourceful form of automobility in San Francisco’s transportation sector. 39 ACKNOWLEDGMENTS This research was supported by a Value Pricing Demonstration Grant from the U.S. Department of Transportation. We thank the staff of City CarShare for providing background data and assisting with the conduct of in-vehicle and travel-diary surveys. We also thank Billy Charlton of the San Francisco Transportation Authority and Mike Mauch of the Institute of Transportation Studies at UC Berkeley for assistance with various transportation-related data from the San Francisco travel model. We thank Mike Duncan of the Department of City and Regional Planning at UC Berkeley for assistance with GIS. Finally, we thank Chris Amado of the Institute of Urban and Regional Development for assistance with survey preparation and other administrative help. 40 Notes 1 R. Cervero, N. Creedman, M. Pohan, and M. Pai, City CarShare: Assessment of Short-Term Travel-Behavior Impacts. Berkeley: Institute of Urban and Regional Development, University of California, Berkeley, Working Paper 2002-01, May, 2002; R. Cervero, N. Creedman, M. Pohan, M. Pai, and Y. Tsai. City CarShare: Assessment of Intermediate-Term Travel-Behavior Impacts. Berkeley: Institute of Urban and Regional Development, University of California, Berkeley, Working Paper 2002-02, July, 2002; R. Cervero and Y. Tsai. San Francisco City CarShare: Travel-Demand Trends and Second-Year Impacts. Berkeley: Institute of Urban and Regional Development, University of California, Berkeley, Working Paper 2003-05, August, 2003. 2 The distribution of household types were: live alone (33.5%); married/no children (28.6%); unrelated adults (20.8%); married/children (14.0%); not-married/children (3.1%). The distribution of motor vehicles in household was: 0 (77.4%); 1 (17.6%); 2 (3.8%); 3 (1.2%). 3 Other patterns of City CarShare reservation durations were: men averaged longer reservations (4 hours, 16 minutes) than women (3 hours, 34 minutes); the longest reservations were made by members who are married and have children (4 hours, 48 minutes), and the shortest were by those who are married and have no children (3 hours, 37 minutes). 4 The distribution of occupancy levels were: 1 person (65.4%); 2 persons (27.8%); 3 persons (4.5%); 4 persons (1.9%); 5 persons (0.3%). 5 Travel diary and background surveys were sent to 1,967 San Francisco residents (with valid mailing addresses in the city), composed of 1,808 San Francisco City CarShare members and 159 non-members (control group). To ensure all days of the week were represented in survey responses, each survey recipient was randomly assigned two days from which they were asked to choose one of the days for completing the travel-diary survey. However, if neither day worked for them (e.g., they were out of town), they were provided an alternative set of two days on the same days of the week. 6 As an incentive, a $1 bill was included with the survey materials, with the exception of three groups who were offered $5 to complete the survey: non-members (i.e., the control group), those who have been members since the very beginning of City CarShare (in March 2001), and those who had completed the previous three surveys. These larger incentives were felt to be necessary to ensure adequate response rates among these groups. After the due-date for returning surveys had passed, non-respondents in the control group were offered an even larger incentive ($20) in hopes of getting over 50 responses from this group. The higher incentive worked, for 24 percent of the responses from the control group came from the remailing of surveys to this group. 7 U.S. Bureau of the Census, Summary Tape File 3A, 2000 Census: San Francisco; see: http://censtats.census.gov/data/CA/1600667000.pdf. 8 Source: http://www.fueleconomy.gov/feg/findacar.htm. 9 While 30 percent of surveyed members lived outside of San Francisco, the average age of CarShare members residing in San Francisco was even higher—around 41 years. 10 The shares were three to four times larger for the city as a whole: 30.8 percent of San Franciscans were Asian American and 7.8 percent were African American in 2000. 11 Other shares were: two motor vehicles in the household – 6.6 percent of members; and three of more motor vehicles in the household – 1.9 percent. 41 12 For the 2005 survey, out of the 527 members who supplied complete travel-diary data, 363 (68.9 percent) lived in San Francisco. Among non-members who were surveyed and provided complete travel-diary data, 36 of the 45 (i.e., 80 percent) lived in San Francisco. 13 Source: http://www.fueleconomy.gov/feg/findacar.htm. 14 The “Threshold” variables” indicate the cumulative logits when the predictor variables are equal zero and as with a constant in a regression model, serve mainly to position estimates— i.e., to calculate predicted probabilities. 42 Appendix A: In-Vehicle Travel Survey 43 Appendix B: Home Based Survey – Cover Letter 44 Appendix C: Home Based Survey – Background Survey 45 46 2 TRAVEL SURVEY TRIP 10. Fill in or check all that apply. Trip began at: _____________________________________________________________________ _____________________________________________ City:___________________ 2. Trip ended at: _____________________________________________________________________ _____________________________________________ City:___________________ 3. Time of departure:______________ AM / PM (Circle one) 4. Time of departure:______________ AM / PM (Circle one) 5. Main mode of transportation (check one): 1 Private motor vehicle Date of Recorded Trips (12:01 to midnight):________________________________ 9 Please help us study Bay Area transportation issues by completing this survey about all of your 24-hour travel, including trips made by private car, transit, car sharing, bike , foot, or other means 9 You do not need to own or even drive a car to fill out this survey; we are collecting information on all travel. 9 Your responses will be strictly confidential and compiled with many other responses in summary form. Please specify the Vehicle Number from the front page: __________ Were you: Your help is much appreciated! the driver a passenger Including yourself, how many people were in the vehicle? _________________ 2 City CarShare vehicle 1 4 Rail transit (specify type of service):__________________________________ 5 Bike 6 Walk VEHICLE 1 7 Other (specify): _________________ 6. 7. Please provide as much information as possible on the private motor vehicles you used to make trips on this date. Include all vehicles used even if you don’t own them. You DO NOT need to include this information for City CarShare cars. st 3 Bus VEHICLE 2 VEHICLE 3 Make: Purpose of trip: 1 Go to work 2 Go to school Model: 3 Return home 4 Go shopping Year: 5 Social (e.g., visit a friend) 6 Personal Business (e.g., to bank) 7 Eat a meal 8 Medical 9 Recreational 10 Other (specify): _________________ Number of Cylinders (4, 6, 8)*: Odometer Reading (in Miles): *Information on the make, model and year is the most important. Information on the number of cylinders would also be useful, particularly if the engine is a non-standard option for the model. If you paid for the following, record the amount: $ ______ . ___ parking $ ______ . ___ transit fare If you used more than 3 motor vehicles, please record information about these other vehicles on additional pages. $ ______ . ___ toll $ ______ . ___ other (specify): _________________ 47 Appendix D: Home Based Survey – Travel Diary 1. nd 2 Are there any OTHER motor vehicles at your residence (including cars, trucks, vans, SUVs, RVs, motorcycles and mopeds) not listed on the previous page? VEHICLE A TRIP 9. Fill in or check all that apply. VEHICLE B Make: Make: Model: Model: Year: Year: Number of Cylinders (4, 6, 8)*: Odometer Reading (in Miles): Number of Cylinders (4, 6, 8)*: Odometer Reading (in Miles): VEHICLE C Make: Model: Model: Year: Year: Number of Cylinders (4, 6, 8)*: Odometer Reading (in Miles): Number of Cylinders (4, 6, 8)*: Odometer Reading (in Miles): Trip began at: _____________________________________________________________________ _____________________________________________ City:___________________ 9. Trip ended at: _____________________________________________________________________ _____________________________________________ City:___________________ 10. Time of departure:______________ AM / PM (Circle one) 11. Time of departure:______________ AM / PM (Circle one) 12. Main mode of transportation (check one): 1 Private motor vehicle VEHICLE D Make: 8. Please specify the Vehicle Number from the front page: __________ Were you: Including yourself, how many people were in the vehicle? _________________ 2 City CarShare vehicle 3 3 Bus 4 Rail transit (specify type of service):__________________________________ 5 Bike 6 Walk 7 Other (specify): _________________ 13. Purpose of trip: If you owned more than 4 motor vehicles, please record information about these other vehicles on additional pages. rd the driver a passenger Please use the following pages to record information for each trip made on this date. For each trip made with a private motor vehicle, indicate the vehicle number that was used for each trip (i.e., VEHICLE 1, VEHICLE 2, VEHICLE 3, etc., as listed on the FRONT of this booklet). 1 Go to work 2 Go to school 3 Return home 4 Go shopping 5 Social (e.g., visit a friend) 6 Personal Business (e.g., to bank) 7 Eat a meal 8 Medical 9 Recreational 10 Other (specify): _________________ 14. If you paid for the following, record the amount: 9 Pages are provided to record up to 10 trips. $ ______ . ___ parking 9 Consider a trip any journey that is over 300 feet (the length of a football field) in distance by any means (walk, drive, bike, transit, etc.). Count every segment of a journey a separate trip—e.g., from work to grocery store and then to home are 2 trips. Walking to a bus stop, bussing to work, and then walking from the bus stop to work would be 3 separate trips, if each walk segment were longer than 300 feet. $ ______ . ___ transit fare $ ______ . ___ toll $ ______ . ___ other (specify): _________________ 48 TRIP 8. Fill in or check all that apply. TRIP 1. Fill in or check all that apply. 1. Trip began at: _____________________________________________________________________ _____________________________________________ City:___________________ 1. Trip began at: _____________________________________________________________________ _____________________________________________ City:___________________ 2. Trip ended at: _____________________________________________________________________ _____________________________________________ City:___________________ 2. Trip ended at: _____________________________________________________________________ _____________________________________________ City:___________________ 3. Time of departure:______________ AM / PM (Circle one) 3. Time of departure:______________ AM / PM (Circle one) 4. Time of departure:______________ AM / PM (Circle one) 4. Time of departure:______________ AM / PM (Circle one) 5. Main mode of transportation (check one): 5. Main mode of transportation (check one): 1 Private motor vehicle 1 Private motor vehicle Please specify the Vehicle Number from the front page: __________ Please specify the Vehicle Number from the front page: __________ Were you: Were you: the driver a passenger Including yourself, how many people were in the vehicle? _________________ 2 City CarShare vehicle Including yourself, how many people were in the vehicle? _________________ 3 Bus 2 City CarShare vehicle 7. 3 Bus 4 Rail transit (specify type of service):__________________________________ 4 Rail transit (specify type of service):__________________________________ 5 Bike 5 Bike 6 Walk 7 Other (specify): _________________ 6. the driver a passenger 6 Walk 7 Other (specify): _________________ Purpose of trip: 6. Purpose of trip: 1 Go to work 2 Go to school 1 Go to work 2 Go to school 3 Return home 4 Go shopping 3 Return home 4 Go shopping 5 Social (e.g., visit a friend) 6 Personal Business (e.g., to bank) 5 Social (e.g., visit a friend) 6 Personal Business (e.g., to bank) 7 Eat a meal 8 Medical 7 Eat a meal 8 Medical 9 Recreational 10 Other (specify): _________________ 9 Recreational 10 Other (specify): _________________ If you paid for the following, record the amount: 7. If you paid for the following, record the amount: $ ______ . ___ parking $ ______ . ___ parking $ ______ . ___ transit fare $ ______ . ___ transit fare $ ______ . ___ toll $ ______ . ___ toll $ ______ . ___ other (specify): _________________ $ ______ . ___ other (specify): _________________ 49 TRIP 2. Fill in or check all that apply. TRIP 7. Fill in or check all that apply. 1. Trip began at: _____________________________________________________________________ _____________________________________________ City:___________________ 1. Trip began at: _____________________________________________________________________ _____________________________________________ City:___________________ 2. Trip ended at: _____________________________________________________________________ _____________________________________________ City:___________________ 2. Trip ended at: _____________________________________________________________________ _____________________________________________ City:___________________ 3. Time of departure:______________ AM / PM (Circle one) 3. Time of departure:______________ AM / PM (Circle one) 4. Time of departure:______________ AM / PM (Circle one) 4. Time of departure:______________ AM / PM (Circle one) 5. Main mode of transportation (check one): 5. Main mode of transportation (check one): 1 Private motor vehicle 1 Private motor vehicle Please specify the Vehicle Number from the front page: __________ Please specify the Vehicle Number from the front page: __________ Were you: Were you: the driver a passenger Including yourself, how many people were in the vehicle? _________________ 2 City CarShare vehicle Including yourself, how many people were in the vehicle? _________________ 3 Bus 2 City CarShare vehicle 7. 3 Bus 4 Rail transit (specify type of service):__________________________________ 4 Rail transit (specify type of service):__________________________________ 5 Bike 5 Bike 6 Walk 7 Other (specify): _________________ 6. the driver a passenger 6 Walk 7 Other (specify): _________________ Purpose of trip: 6. Purpose of trip: 1 Go to work 2 Go to school 1 Go to work 2 Go to school 3 Return home 4 Go shopping 3 Return home 4 Go shopping 5 Social (e.g., visit a friend) 6 Personal Business (e.g., to bank) 5 Social (e.g., visit a friend) 6 Personal Business (e.g., to bank) 7 Eat a meal 8 Medical 7 Eat a meal 8 Medical 9 Recreational 10 Other (specify): _________________ 9 Recreational 10 Other (specify): _________________ If you paid for the following, record the amount: 7. If you paid for the following, record the amount: $ ______ . ___ parking $ ______ . ___ parking $ ______ . ___ transit fare $ ______ . ___ transit fare $ ______ . ___ toll $ ______ . ___ toll $ ______ . ___ other (specify): _________________ $ ______ . ___ other (specify): _________________ 50 TRIP 6. Fill in or check all that apply. TRIP 3. Fill in or check all that apply. 1. Trip began at: _____________________________________________________________________ _____________________________________________ City:___________________ 1. Trip began at: _____________________________________________________________________ _____________________________________________ City:___________________ 2. Trip ended at: _____________________________________________________________________ _____________________________________________ City:___________________ 2. Trip ended at: _____________________________________________________________________ _____________________________________________ City:___________________ 3. Time of departure:______________ AM / PM (Circle one) 3. Time of departure:______________ AM / PM (Circle one) 4. Time of departure:______________ AM / PM (Circle one) 4. Time of departure:______________ AM / PM (Circle one) 5. Main mode of transportation (check one): 5. Main mode of transportation (check one): 1 Private motor vehicle 1 Private motor vehicle Please specify the Vehicle Number from the front page: __________ Please specify the Vehicle Number from the front page: __________ Were you: Were you: the driver a passenger Including yourself, how many people were in the vehicle? _________________ 2 City CarShare vehicle Including yourself, how many people were in the vehicle? _________________ 3 Bus 2 City CarShare vehicle 7. 3 Bus 4 Rail transit (specify type of service):__________________________________ 4 Rail transit (specify type of service):__________________________________ 5 Bike 5 Bike 6 Walk 7 Other (specify): _________________ 6. the driver a passenger 6 Walk 7 Other (specify): _________________ Purpose of trip: 6. Purpose of trip: 1 Go to work 2 Go to school 1 Go to work 2 Go to school 3 Return home 4 Go shopping 3 Return home 4 Go shopping 5 Social (e.g., visit a friend) 6 Personal Business (e.g., to bank) 5 Social (e.g., visit a friend) 6 Personal Business (e.g., to bank) 7 Eat a meal 8 Medical 7 Eat a meal 8 Medical 9 Recreational 10 Other (specify): _________________ 9 Recreational 10 Other (specify): _________________ If you paid for the following, record the amount: 7. If you paid for the following, record the amount: $ ______ . ___ parking $ ______ . ___ parking $ ______ . ___ transit fare $ ______ . ___ transit fare $ ______ . ___ toll $ ______ . ___ toll $ ______ . ___ other (specify): _________________ $ ______ . ___ other (specify): _________________ 51 TRIP 4. Fill in or check all that apply. TRIP 5. Fill in or check all that apply. 1. Trip began at: _____________________________________________________________________ _____________________________________________ City:___________________ 1. Trip began at: _____________________________________________________________________ _____________________________________________ City:___________________ 2. Trip ended at: _____________________________________________________________________ _____________________________________________ City:___________________ 2. Trip ended at: _____________________________________________________________________ _____________________________________________ City:___________________ 3. Time of departure:______________ AM / PM (Circle one) 3. Time of departure:______________ AM / PM (Circle one) 4. Time of departure:______________ AM / PM (Circle one) 4. Time of departure:______________ AM / PM (Circle one) 5. Main mode of transportation (check one): 5. Main mode of transportation (check one): 1 Private motor vehicle 1 Private motor vehicle Please specify the Vehicle Number from the front page: __________ Please specify the Vehicle Number from the front page: __________ Were you: Were you: the driver a passenger Including yourself, how many people were in the vehicle? _________________ 2 City CarShare vehicle Including yourself, how many people were in the vehicle? _________________ 3 Bus 2 City CarShare vehicle 7. 3 Bus 4 Rail transit (specify type of service):__________________________________ 4 Rail transit (specify type of service):__________________________________ 5 Bike 5 Bike 6 Walk 7 Other (specify): _________________ 6. the driver a passenger 6 Walk 7 Other (specify): _________________ Purpose of trip: 6. Purpose of trip: 1 Go to work 2 Go to school 1 Go to work 2 Go to school 3 Return home 4 Go shopping 3 Return home 4 Go shopping 5 Social (e.g., visit a friend) 6 Personal Business (e.g., to bank) 5 Social (e.g., visit a friend) 6 Personal Business (e.g., to bank) 7 Eat a meal 8 Medical 7 Eat a meal 8 Medical 9 Recreational 10 Other (specify): _________________ 9 Recreational 10 Other (specify): _________________ If you paid for the following, record the amount: 7. If you paid for the following, record the amount: $ ______ . ___ parking $ ______ . ___ parking $ ______ . ___ transit fare $ ______ . ___ transit fare $ ______ . ___ toll $ ______ . ___ toll $ ______ . ___ other (specify): _________________ $ ______ . ___ other (specify): _________________ 52


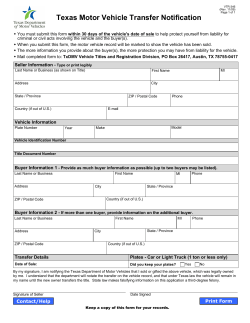
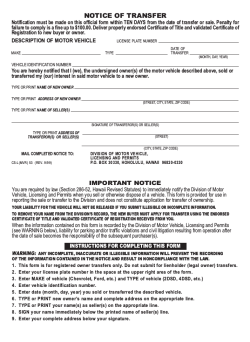

© Copyright 2026