
Risks to Health and the Environment Final Report
Risks to Health and the Environment
Related to the Use of Mercury Products
Final Report
prepared for
The European Commission, DG Enterprise
by
Risk & Policy Analysts Limited,
Farthing Green House, 1 Beccles Road, Loddon, Norfolk, NR14 6LT
Tel: 01508 528465 Fax: 01508 520758
Email: [email protected]
Web: www.rpaltd.co.uk
RPA REPORT - ASSURED QUALITY
Project: Ref/Title
J372/Mercury
Approach:
In accordance with the Contract, Scoping Meeting with
the Commission and associated discussions
Final Report
Report Status:
Authors:
Dr P Floyd & P Zarogiannis, RPA
Dr M Crane, Crane Consultants
Prof S Tarkowski, Nofer Institute of Occupational
Medicine (Poland)
Prof V Bencko, Charles University of Prague
Approved for Issue by:
Ms M Postle, Director
Date:
9 August, 2002
If printed by RPA, this report will be on chlorine free, 100% recycled paper.
Risk & Policy Analysts
EXECUTIVE SUMMARY
Overview
Mercury and its compounds are hazardous materials which may pose risks to people and to
the environment. This report presents an assessment of the risks associated with the use of
mercury in a range of products.
The key requirements of the study were:
•
•
•
•
to identify usage of mercury in dental amalgam, batteries, measuring instruments (such
as thermometers and manometers), lighting, other electrical components and other lesser
uses;
to review data used to evaluate the toxicity of mercury and mercury compounds to
humans and to the environment;
to derive predicted environmental concentrations (PECs) associated with use of the
products under consideration and compare with those associated with other sources of
mercury; and
to characterise the associated risks.
Mercury Use in Products under Study
The use of mercury in the main product groups - dental amalgam, batteries, discharge lamps,
measuring (and control) equipment and electrical control and switching equipment has been
characterised. Although research and consultation has enabled aspects of the various
lifecycles to be quantified, comprehensive data were not obtained for all areas with
particular reference to the last two product groups (measuring (and control) equipment and
electrical control and switching).
The mercury used in the products within the EU (and the three accession countries) comes:
from primary production (in Spain); as a by-product of non-ferrous metal production; from a
mercury recycling plant; or as an import (usually within the product, as in the case of
thermometers). Some data on these production routes (and associated emissions) were
obtained but determining the precise scale and extent of the mercury ‘business’ proved
difficult. However, it would appear that the recovery of mercury from decommissioned
chlor-alkali facilities is rapidly become the major source of mercury within the EU.
Overall, there is clear evidence that the use of mercury in batteries and lamps has
significantly reduced in recent years. There has also been a decline in the use of dental
amalgam and, as importantly, there has been a significant increase in the use of mercury
recovery devices (separators) in dental surgeries. Although there has been a reduction in the
use of mercury thermometers and sphygmomanometers (for measuring blood pressure), it
has been difficult to estimate the overall use of mercury within this sector. Similarly, whilst
there has been a move away from the extensive use of mercury tilt switches in domestic
products (including cars, white goods, etc.), the extent of mercury use in other applications
within this sector has been difficult to determine.
Page i
Mercury Products - Risks to Health and the Environment
It is estimated that the current usage of mercury in these product groups is about 120 tonnes
per year (60% of which is associated with dental amalgam) in the EU with, perhaps, a
further 50 tonnes per year used in the three accession countries under study (Czech Republic,
Poland and Slovenia). It is estimated that the emissions to the environment associated with
the production of mercury used in these products, product manufacture and product use is
less than 25 tonnes per year.
Mercury Use in Other Products
Mercury is used in numerous diverse products and applications, ranging from its use in
lighthouses (some lights revolve in a bath of mercury) to recoil suppression systems in rifles.
However, these account for a relatively low consumption with one notable exception. It
would appear that, perhaps, 50 tonnes per year of mercury is used in the manufacture (within
the EU) of skin lightening creams and other cosmetic products, most of which are exported
to, and consumed in, Africa. It should be noted that the marketing of mercury containing
cosmetic products (with the exception of trace amounts in eye products) is not permitted
within the EU.
Other Sources of Mercury
Large quantities (thousands of tonnes) of mercury are used in chlor-alkali plants throughout
the world. Most EU countries have such plants (as does the Czech Republic and Poland) and
current estimates of mercury consumption (within the EU) are of the order of 150 tonnes per
year. As indicated above, the planned phase-out of mercury usage in chlor-alkali plants will
lead to a substantial flow of recovered mercury onto the market over the next 20 years
(perhaps 650 tonnes per year within Europe). The associated emissions (primarily to
atmosphere) are estimated to be less than 10 tonnes per year although significant amounts of
mercury are unaccounted for.
Although mercury is a trace constituent of fossil fuels, fossil fuel consumption within the EU
may release in the order of a further 150 tonnes per year into the environment which is
comparable to a recent estimate that total anthropogenic emissions from the EU (and the
three accession countries) are of the order of 160 tonnes per year.
Apart from anthropogenic sources of mercury, there are ‘natural’ releases from forest fires,
volcanoes and ‘evaporation’ from the oceans. Within the EU, recent estimates suggest that
‘natural’ emissions within the EU may amount to 200 tonnes per year.
Predicting Environmental Concentrations
The behaviour of mercury in the environment is complex. Most releases are in elemental
form to atmosphere which is then slowly oxidised to bivalent mercury (inorganic mercury).
The inorganic mercury enters the terrestrial and aquatic environments through deposition. A
portion of the inorganic mercury is methylated (particularly within sediments) to produce
methyl mercury (organic mercury) which enters the water column. There is a general
consensus that the key concern is organic mercury, which is highly toxic and bio-accumulates
- particularly in fish.
Page ii
Risk & Policy Analysts
For this study, the EUSES model was used (with some modifications) to predict mercury
concentrations in the three main environmental compartments (air, terrestrial and aquatic).
In essence, the model was run twice:
Run 1: 100% of emissions considered to be as elemental mercury in order to obtain
predictions for the atmospheric compartment; and
Run 2: 100% of emissions considered to be as inorganic mercury (mercuric chloride) to
obtain predictions for the terrestrial and aquatic compartments.
The key inputs to the EUSES model were emissions (derived from the lifecycle analysis for
the product groups) and toxicity data for humans and the environment. It was assumed, as a
worst case, that the organic mercury concentrations would be 10% of the inorganic mercury
concentrations.
The PECs (predicted environmental concentrations) for each compartment showed that the
products’ use, their manufacture and the production of the associated mercury contributed a
percent to typical existing concentrations at continental level. At a regional level, the
contribution was higher.
At a ‘local’ level (i.e. close to production facilities), significant air concentrations (elemental
mercury) were predicted close to the primary production site in Spain. Otherwise, local
values were very close to the regional values.
Risks Associated with Products under Study
Typical intakes of mercury are of the order of 10 µg/day. About 75% is elemental and
inorganic mercury, most of which is associated with the inhalation of vapours from dental
amalgam used in fillings. The remaining 25% is organic mercury (primarily methyl mercury
in fish and fish products). For this study, reference doses of 2.0 and 0.1 µg per kg of
bodyweight per day have been used as ‘safe’ levels for inorganic (including elemental) and
organic mercury respectively.
Risks to humans associated with exposure to mercury in the environment are considered
against a ‘margin of safety’ (MOS) value which is derived by dividing the reference dose by
the appropriate predicted environmental concentration (PEC).
At a regional level, MOS values associated with elemental and inorganic mercury were found
to be in excess of 100 (i.e. mercury intake is more than 100 times below ‘safe’ levels) whilst
the MOS value for organic mercury was 18.
At a local level, MOS values associated with elemental mercury and inorganic mercury were
generally found to be in excess of 100 although the higher atmospheric emissions close to the
primary production site in Spain led to an MOS value of 6.5 and that for lamp production
was found to be 55. For organic mercury, the local MOS values were essentially the same as
the regional value (18).
In terms of risks to the environment, the criterion of importance is the ratio of the predicted
environmental concentration (PEC) to the predicted no-effect concentration (PNEC).
PEC/PNEC ratios of greater than unity are indicators that there may be a risk of concern.
Page iii
Mercury Products - Risks to Health and the Environment
PEC/PNEC ratios were derived for water, sediment, soil and (local) secondary poisoning
(poisoning through the predatory food chain). The key findings may be summarised as
follows:
•
•
•
•
for water, the PEC/PNEC ratios for inorganic and organic mercury were significantly
less than unity;
for sediment, the PEC/PNEC ratios were significantly less than unity for inorganic
mercury whilst those for organic mercury were in the range 0.2 - 0.4;
for soil, the PEC/PNEC ratios for inorganic mercury were about 0.2; and
for secondary poisoning, the PEC/PNEC ratios were significantly less than unity for the
terrestrial food chain (inorganic mercury) whilst those for the aquatic food chain
(organic mercury) approached unity (0.9).
Recommendations
Overall, using the TGD/EUSES approach (with modifications), it would appear that there
are unlikely to be significant risks to the environment associated with the mercury containing
products under study - with particular reference to dental amalgam, batteries, lamps,
measuring and electrical equipment. Of the products under study, the key contributor is
dental amalgam, which accounts for over half of the mercury used.
The modelling results suggest that the risks are primarily associated with organic mercury.
However, given the complexity of the behaviour of mercury in the environment, the modelling
has necessitated simplifying assumptions which clearly introduces a degree of uncertainty.
Furthermore, changes to some critical parameters (such as partition coefficients) can make
significant changes to the results.
Nevertheless, in accordance with the TGD, the results suggest a Conclusion (ii) which states
that there is at present no need for further information and/or testing and no need for risk
reduction measures beyond those which are being applied already. To this, could be added
or are already planned, since there are a number of Directives (Water Framework Directive,
RoHS Directive, ELV Directive, etc.) which will lead to further controls on the usage and
emissions of mercury.
However, it is recognised that there is widespread concern over the presence of mercury in
the environment and a desire to further limit the potential impacts of mercury usage. Of the
estimated 160 tonnes per year of mercury emitted to the environment from anthropogenic
sources in the EU and the three accession countries, the products under study account for
less than 25 tonnes per year. There may, however, be areas where further reductions could
be achieved in usage and/or associated emissions across the range of products examined
here. Such reductions should be proportional to the relative emissions within the context of
the overall anthropogenic use of mercury and the associated emissions.
In relation to the products under study, dental amalgam is the largest use with over 10 tonnes
per year of mercury being emitted to the environment. The dominant source of emissions is
releases from crematoria and this may be an area for further investigation. Measuring and
control equipment would also appear to be a key source with emissions of 8.5 tonnes per year
Page iv
Risk & Policy Analysts
- primarily to the atmosphere from landfills. Within this sector, there may be areas where
usage and/or emissions could be reduced. The other three products areas (batteries, lighting
and electrical equipment) have significantly lower usage and emissions.
More generally, it is worth noting that the production of skin lightening creams involves the
consumption of mercury in greater quantities than those used for measuring and control
equipment - although this may be an area where more enforcement rather than more controls
is required.
It is important to stress that any proposed controls would need a further investigation of the
advantages and drawbacks under the requirements of the Marketing and Use Directive
(76/769/EEC).
Finally, it is recommended that consideration should be given to classification and labelling
under Directive 67/548/EEC based upon the developmental toxicity of methyl mercury and,
perhaps, of other organic mercury compounds.
Page v
Mercury Products - Risks to Health and the Environment
Page vi
Risk & Policy Analysts
CONTENTS
Page
EXECUTIVE SUMMARY
i
1.
1.1
1.2
1.3
1.4
INTRODUCTION
Overview
Background
Sources of Information
Structure of the Report
1
1
3
4
2.
2.1
2.2
2.3
GENERAL SUBSTANCE INFORMATION
Physico-chemical Properties of Mercury and Mercury
Compounds
Environmental Classification and Labelling
Human Health Classification and Labelling
3.
3.1
3.2
3.3
3.4
3.5
3.6
3.7
3.8
GENERAL INFORMATION ON MERCURY USAGE
Overview of Mercury Production and Usage
Dental Amalgam
Batteries
Lighting
Measuring (& Control) Equipment
Electrical Control and Switching Equipment
Other Products
Summary of Product Usage and Emissions
9
14
22
30
36
46
55
62
4.
4.1
4.2
4.3
4.4
4.5
OVERVIEW OF EXPOSURE TO MERCURY
Background to Discussion
Releases of Mercury into the Environment
Fate and Behaviour in the Environment
Measured Levels in the Environment
Human Exposure
63
63
65
68
71
5.
CALCULATIONS OF PREDICTED ENVIRONMENTAL
CONCENTRATIONS (PECS)
Introduction
Production
Formulation and Processing (Product Manufacture)
Private Use and Recovery of Mercury in Products
Predicted Environmental Concentrations
73
73
75
77
78
5.1
5.2
5.3
5.4
5.5
5
5
6
Page vii
Mercury Products - Risks to Health and the Environment
CONTENTS (cont.)
Page
6.
6.1
6.2
6.3
EFFECTS OF MERCURY
Overview
Environmental Toxicity
Human Toxicity
85
85
95
7.
7.1
7.2
7.3
7.4
RISK CHARACTERISATION
Overview
Risks to the Environment
Risks to Humans
Discussion
101
101
104
105
8.
8.1
8.2
8.3
8.4
8.5
8.6
OVERALL FINDINGS
Mercury Use in Products under Study
Mercury Use in Other Products
Other Sources of Mercury
Predicting Environmental Concentrations
Risks Associated with Products under Study
Recommendations
107
107
108
108
109
110
9.
REFERENCES
113
ANNEX 1: TECHNICAL SPECIFICATION FOR STUDY
ANNEX 2: LIST OF CONSULTEES
ANNEX 3: LIST OF MERCURY CONTAINING PRODUCTS
ANNEX 4: ANALYSIS OF AQUIRE DATA FOR CONSISTENCY
Page viii
Risk & Policy Analysts
1.
INTRODUCTION
1.1
Overview
Mercury and its compounds are hazardous materials which may pose risks to people
and to the environment. This report presents an assessment of the risks associated
with the use of mercury in a range of products.
Specifically, the key elements of the study were specified in the Technical
Specifications (reproduced in Annex 1) as follows:
•
•
•
•
•
1.2
to identify the usage of mercury in dental amalgam, batteries, measuring
instruments (such as thermometers and manometers), lighting, other electrical
equipment and other lesser uses;
to review data used to evaluate the toxicity of mercury and mercury compounds to
humans and to the environment;
to derive predicted environmental concentrations (PECs) associated with the use
of the products under consideration;
to characterise the associated risks; and
to compare these with the risks associated with other sources of mercury.
Background
European legislation has significantly reduced the use of mercury in a range of
products in recent years. In addition, there is a number of EU Directives which
regulate mercury in relation to health and safety, water quality, pesticides, foodstuffs,
atmospheric emissions and waste disposal. Directives of interest include:
•
•
•
•
•
•
•
Council Directive 82/176/EEC which laid down emission limits values and
quality objectives for mercury discharges by the chlor-alkali electrolysis industry;
Council Directive 84/156/EEC which laid down limit values and quality
objectives for mercury discharges by sectors other than the chlor-alkali industry;
Council Directive 89/677/EEC which restricted the use of mercury in preservative
paints used for anti-fouling and for wood, textiles and yarn;
Council Directive 91/157/EEC which introduced requirements for the safe
collection/disposal of spent batteries and accumulators;
Council Directive 91/188/EEC which prohibited the marketing and use of mercury
compounds in plant protection products;
Commission Directive 98/101/EC which prohibits marketing of batteries with
more than 0.0005% mercury by weight (more than 2% for button cells);
Council Directive 2000/53/EC which prohibits use of mercury in new road
vehicles from 2003;
Page 1
Mercury Products - Risks to Health and the Environment
•
•
Directive 2000/60/EC of the European Parliament and Council which established
the framework for, inter alia, regulating discharges to water (the Water
Framework Directive); and
Proposed Directive COM (2000) 347 which, if adopted, will impose restrictions
on the use of certain hazardous substances (including mercury) in electrical and
electronic equipment (the RoHS Directive).
It should be noted that under the Water Framework Directive, mercury and its
compounds have been designated1 as ‘priority hazardous substances’ (based, in part,
upon the recommendations of international fora - as outlined below). As such, this
designation requires, in principle, the “cessation or phasing out of discharges,
emissions and losses within 20 years”. However, as mercury is naturally occurring,
this requirement is modified as follows:
“... cessation of discharges, emissions and losses into water of those
priority hazardous substances which derive from human activities.”
(Decision 2455/2001/EC, para 4)
In addition, some member countries have moved to implement a more comprehensive
phase-out of mercury use. Examples of relevant national legislation include:
•
•
•
Denmark: Prohibition of Sale and Export of Mercury and MercuryContaining Products (Statutory Order 692 dated September 1998), which
provides for a gradual phase-out of products containing more than 50 ppm
mercury (i.e. 0.005% by wt);
Sweden: A Chemical Strategy for a Non-Toxic Environment (Bill 2000/01:65),
which is seeking a complete phase-out of mercury in new products by 2003; and
Netherlands: Decree on Products Containing Mercury (dated 9 September
1998) which is also seeking a ban on mercury-containing equipment by 2003 although there are exemptions for a range of specified products.
One of the aims of this study is to inform discussions on further possible restrictions
on mercury through the provision of up to date and relevant information from across
the EU (as well as from three accession countries - Poland, Czech Republic and
Slovenia).
Mercury and its compounds are also the subject of other international initiatives
which will need to be taken into account. These include:
•
1
2
Page 2
the 1998 Aarhus Protocol on Heavy Metals2 relating to cadmium, lead and
mercury. This UN Economic Commission for Europe (UNECE) Protocol has
been signed up to by 36 countries (including all EU states and the three accession
countries of interest to this study). Each party which has signed the protocol is
Decision 2455/2001/EC of the European Parliament and Council dated 20 November 2001.
Full text and associated information available from www.unece.org/env.
Risk & Policy Analysts
•
•
•
1.3
required to reduce their total annual mercury emissions to below 1990 levels with
the use of best available techniques and the setting of limit values for emissions.
With regard to mercury products in particular, the Protocol requires that the
contracting parties should apply control measures on the content of Hg in alkalinemanganese batteries (0.05% for batteries used in extreme conditions and 0.025%
for all other alkaline-manganese cells) and should also consider applying product
management measures including substitution of products, reduction or substitution
of mercury in products, appropriate labelling for safe use and disposal of products
and use of economic instruments and voluntary agreements. Precautionary
measures should be considered for mercury-containing measuring and electrical
control equipment, fluorescent lamps, dental amalgam, pesticides, paints, and
batteries;
HELCOM3 (the Helsinki Commission or, more formally, the Baltic Marine
Environment Protection Commission) has an active interest in limiting mercury
emissions to the Baltic Sea;
similarly, OSPAR4 (the OSPAR Commission for the Protection of the Marine
Environment of the North-East Atlantic) has an active interest in limiting mercury
emissions to the Atlantic Ocean; and
UNEP (the United Nations Environment Programme) is currently undertaking a
Global Mercury Assessment (as discussed further below).
Sources of Information
The starting point for the study was two earlier studies undertaken for the
Commission:
•
•
WS Atkins (1998): Assessment of the Risk to Health and to the Environment
of Mercury Contained in Certain Products, Final Report dated August 1998.
This report focuses on the risks associated with electrical equipment, measuring
instruments and lighting - but not batteries nor dental amalgam; and
ERM (1998): Analysis of the Advantages and Drawbacks of Restricting the
Marketing and Use of Mercury in Certain Products, Final Report dated
December 1998. This report focuses on the potential for substitution of mercury
in dental amalgam, electrical equipment, measuring instruments and lighting - but
not batteries.
In order to extend and refine the data presented in these reports, there has been an
extensive review of literature and other sources of information as well as consultation
with a range of interested parties. Particular attention has been given to recent
submissions to the Global Mercury Assessment being co-ordinated by UNEP.
Submissions from EU Governments and others can be inspected (and downloaded)
3
4
The contracting parties are Denmark, Estonia, European Commission, Finland, Germany, Latvia,
Lithuania, Poland, Russia and Sweden. Further information is available from www.helcom.fi.
The contracting parties are Belgium, Denmark, European Commission, Finland, France, Germany,
Iceland, Ireland, Luxembourg, the Netherlands, Norway, Portugal, Spain, Sweden, Switzerland and the
UK. Further information is available from www.ospar.org
Page 3
Mercury Products - Risks to Health and the Environment
from www.chem.unep.ch/mercury. This website is a valuable resource containing
current information from a wide range of countries and organisations, as well as a
large collection of relevant reports and other documents. UNEP has prepared an
initial draft report on the submissions received (UNEP, 2002).
Further information on the changing usage of mercury-containing products has been
sought from the Europroms database5. The focus of this data-base is on trade (i.e.
imports and exports) with EU members states, both ‘intra EU’ and ‘extra EU’.
However, these data do not provide a direct route to reliably estimate usage by
individual member states (nor, indeed, by the EU-15 as a whole). Against this
background, the Europroms data have been used to illustrate trends in usage rather
than as a primary source of usage data.
1.4
Structure of the Report
An overview of the properties of mercury and its compounds is presented in Section 2
with a detailed review of mercury usage in products presented in Section 3.
The complex behaviour of mercury in the environment together with an overview of
typical concentrations in the EU environment are presented in Section 4.
The predicted environmental concentrations (PECs) associated with the usage of
mercury in products are presented in Section 5. Section 6 provides a review of the
toxicity of mercury and its compounds to people and to the environment.
Combining the results from Sections 5 and 6 enables an estimate to be made as to
whether there are significant risks associated with the products under consideration
and this is presented in Section 7. Section 8 summarises the overall findings.
5
Page 4
Eurostat (2001): Europroms - European Production and Market Statistics, data-base available
from the European Commission which includes comprehensive data on products on a quarterly and
annual basis up until 1999.
Risk & Policy Analysts
2.
GENERAL SUBSTANCE INFORMATION
2.1
Physico-chemical Properties of Mercury and Mercury Compounds
Physico-chemical properties and classification numbers of mercury and mercury
compounds of relevance are summarised in Table 2.1.
Table 2.1: Main Physico-chemical Properties and Chemical Registration Numbers of
Mercury and Mercury Compounds
Substance
Mercury
Mercuric
chloride
Mercuric
sulphide
Mercuric
oxide
Methyl
mercury *
Methyl
mercuric
chloride
Dimethyl
mercury
CAS No.
(EC No.)
7439-97-6
(231-106-7)
7487-94-7
(231-299-8)
1344-48-5
(215-696-3)
21908-53-2
(244-654-7)
Molecular
Weight
Melting
point oC
Boiling
point oC
Solubility
in water
201
-39
357
0.06 mgl-1
271
276
302
69,000 mgl-1
233
sublimes
at 400
n/a
insoluble
217
500
n/a
50 mgl-1
CH3Hg+
22967-92-6
216
CH3Hg Cl
115-09-3
(204-064-2)
251
170
n/a
near
insoluble
C2H6Hg
593-74-8
(209-805-3)
231
-43
92
9,000 mgl-1
Formula
Hg
HgCl2
HgS
HgO
Sources: Croner (1999): Substances Hazardous to the Environment, London, Croner
Publications; ChemFinder Internet site, www.chemfinder.com; and Sigma-Aldrich Material Safety
Data Sheets.
* Note that methyl mercury is an ion rather than a chemical compound and, as such, does not exist
in a ‘free’ state.
2.2
Environmental Classification and Labelling
Commission Directive 98/98/EC of December 1998 (which adapted Council
Directive 67/548/EEC on the Classification, Packaging and Labelling of
Dangerous Substances to technical progress for the 25th time) introduced
environmental classification and labelling for mercury and its compounds as shown in
Table 2.2.
Table 2.2: Classification of Mercury Compounds for Environmental Effects
Substance
Classification
Risk Phrases
N: Dangerous to the
environment
R 50/53: Very toxic to aquatic
organisms, may cause longterm adverse effects in the
aquatic environment
Mercury
Inorganic mercury compounds in
general (except mercuric
sulphide)
Organic mercury compounds in
general
Page 5
Mercury Products - Risks to Health and the Environment
2.3
Human Health Classification and Labelling
Mercury and mercury compounds of interest for this study have also been given
classifications under Directive 67/548/EEC for human health and safety. These are
summarised in Table 2.3.
Table 2.3: Classification of Mercury Compounds for Human Health and Safety
Substance
Classification
Risk Phrases
Safety Phrases
Mercury
Toxic (T)
Mercuric chloride
Very Toxic (T+)
Corrosive (C)
Toxic (T)
Very Toxic (T+)
R 23
R 33
R 28
R 34
R 48/24/25
R 26/27/28
R 33
S (1/2); S 7; S 45;
S 60; S 61
S (1/2); S 36/37/39;
S 45; S 60; S 61
Mercuric oxide (and inorganic
mercury compounds in general
- but with some exceptions)
Organic mercury compounds in
general
S (1/2); S 13; S 28;
S 45; S 60; S 61
R 26/27/28
S (1/2); S 13; S 28;
R 33
S 36; S 45; S 60; S61
Sources: The National Chemical Emergency Centre UK Internet site, www.the-ncec.com
International Labour Organisation, International Chemical Safety Cards
Note: Classifications confirmed on www.kemi.se/nclass which maintains data on classification
on behalf of the European Chemical Bureau (ecb.jrc.it/classification_labelling). Latest
classification for mercury and its compounds is based on 25th ATP (Directive 98/98/EC).
Risk Phrases:
R 23
R 26/27/28
R 28
R 33
R 34
R 48/24/25
Very Toxic (T+)
Toxic by inhalation;
Very toxic by inhalation, in contact with skin and if swallowed;
Very toxic if swallowed;
Danger of cumulative effects;
Causes burns; and
Toxic: danger of serious damage to health by prolonged exposure in
contact with skin and if swallowed.
Safety Phrases:
S 1/2
Keep locked up and out of reach of children;
S7
Keep container tightly closed;
S 13
Keep away from food, drink and animal feeding stuffs;
S 28
After contact with skin, wash immediately with plenty of water;
S 36
Wear suitable protective clothing;
S 36/37/39
Wear suitable protective clothing, eye/face protection and gloves;
S 45
In case of accident or if you feel unwell, seek medical advice
immediately (show label where possible);
S 60
This material and its container must be disposed of as hazardous waste;
and
S 61
Avoid release to the environment. Refer to special instructions/safety
data sheet.
Page 6
Risk & Policy Analysts
It should be noted that risk phrases associated with substances toxic to reproduction
are not currently applied to mercury and its compounds. Such phrases include:
R 60
R 61
R 62
R 63
May impair fertility;
May cause harm to the unborn child;
Possible risk of impaired fertility; and
Possible risk of harm to the unborn child.
As explored in more detail in Section 6.3, developmental toxicity effects are
considered to occur with exposure to low levels of methyl mercury. On this basis,
and with reference to the guidance provided by the 28th ATP6, it would appear that
methyl mercury (at least) could be designated a Category 1 substance (due to
observed developmental toxicity in humans) and require the risk phrase R61. For
other organic mercury compounds, it may be the case that a Category 3 designation
(‘substances which cause concern for humans owing to possible developmental toxic
effects’) and an associated R63 risk phrase is more appropriate.
6
Commission Directive 2001/59/EC of August 2001 (which adapted Council Directive 67/548/EEC on
the Classification, Packaging and Labelling of Dangerous Substances to technical progress for the
28th time).
Page 7
Mercury Products - Risks to Health and the Environment
Page 8
Risk & Policy Analysts
3.
GENERAL INFORMATION ON MERCURY USAGE
3.1
Overview of Mercury Production and Usage
3.1.1
Introduction
There are three sources of mercury for use in the products of interest:
•
•
•
extraction of mercury from mercury ore;
production of mercury as a by-product of non-ferrous metals processing; and
recovered mercury from waste streams and other sources.
The general picture has changed dramatically in the last few years with the
commitment of the chlor-alkali industry to phase-out the use of mercury cells in
European chlorine production. This will lead to the recovery and potential re-use of
perhaps 15,000t of mercury over the next 20 years (ERM, 2000).
3.1.2 Mined (Primary) Production
Mercury is a naturally occurring metallic element, found in rocks, soils and
sediments, which comprises part of the earth’s crust at levels of approximately 0.5
ppm. It is commonly found as the red sulphide ore, cinnabar (HgS), which provides
the main source of mined mercury.
The worldwide primary production of mercury peaked in the early 1970s at about
10,000 tonnes per annum. Since then, there has been a steady decline to perhaps
1,650 tonnes in 2000 (USGS, 2001) as presented in Table 3.1. Estimated world
resources are about 600,000 tonnes - mainly in Kyrgyzstan, Russia, Slovenia, Spain
and Ukraine. World reserves (i.e. currently accessible) are estimated to be 240,000
tonnes (see Table 3.1). The decline in production has been accompanied by a
dramatic decline in price from around €1,000 per flask7 in the late 1960s to less than
€100 per flask in 1991, compared with a current price of about €180 per flask (i.e.
about €5 per kg).
Within the EU, Minas de Almadén y Arrayanes SA (MAYASA) of Spain is the main
producer (accounting, historically, for more than 30% of the world’s mined
production) with smaller amounts being produced in Finland (as a by-product of zinc
mining at Kokkola - see below) and, formerly, at the Idrija mine in Slovenia as set out
in Table 3.2. Also, the cinnabar mines of Mount Amiata in Italy were a major source
of mercury for many centuries but were finally closed in 1976. Of note is that nearly
75% of Spain’s current sales is exported to Asia with only 15% (about 150 t/year)
being used within the EU (consultation). Of the three accession countries of interest,
only Slovenia is associated with the primary production of mercury.
7
Quantities of mercury are often expressed in flasks. One flask is about 2.5 litres and weighs 34.5 kg.
Page 9
Mercury Products - Risks to Health and the Environment
Table 3.1: Mercury World Mine Production 1996-2000 (metric tonnes)
Country
1996
1998
2000*
Reserves
Algeria
China
Finland
Italy
Kyrgyzstan
Mexico
Russia
Slovakia
Slovenia
Spain
Tajikistan
Ukraine
USA
Other
World Total
(rounded)
368
510
88
0
584
15
50
0
5
862
45
30
?
0
224
230
54
0
620
15
50
20
5
675
35
20
?
0
240
200
45
0
550
25
50
0
0
500
40
?
?
0
3,000
2,560
1,950
1,640
69,000
13,000
90,000
61,000
240,000
* estimates (by US Geological Survey - USGS)
Source: USGS, 2001
Table 3.2: Mercury Primary Production in EU and the 3ACs1 (1996-2000) (metric tonnes)
Country
2
Spain
1996
1997
1998
1999
1053
863
675
1352 (sales)
2000
1095 (sales)
236 (mined)
Slovenia
5
5
5
closed
closed
Sources: USGS (2001) and consultation.
Notes:
1) 3ACs = Czech Republic, Poland and Slovenia
2) The figures for Spain are derived from direct consultation with MAYASA and that ‘sales’ now
include mined production, recovered mercury from the chlor-alkali industry and sales from stock. It
will be noted that in 2000, the actual mined production was 236 tonnes, much lower than the 500
tonnes estimated by USGS (as presented in Table 3.1).
3.1.3 Production from Non-Ferrous Metals Processing
Many ores contain traces of mercury and their processing (usually involving heat)
generates mercury vapour which is recovered from the gas cleaning stream. Due to
the large quantities of ores, even low concentrations of mercury can generate
significant quantities (for example - 200,000 t/year of ore containing 0.01% mercury
will produce 20 t/year). Within the EU, the overall mercury production rate is
estimated to be about 350 t/year (EC, 2001), primarily associated with zinc and lead
smelting/refining. Within the EU, there are 10 zinc smelters with capacities of greater
than 100,000 t/year and 7 primary lead smelters/refiners with capacities of greater
Page 10
Risk & Policy Analysts
than 40,000 t/year located in Belgium, France, Germany, Italy, the Netherlands, Spain
and the UK. There is also extensive lead/zinc mining and processing in Poland
(especially in the Tarnowskie Góry area). It is worth noting that although Ireland
mines the most zinc ore in Europe, the associated processing is carried out in Finland.
Of the associated mercury recovery operations, those in Finland have been regularly
recorded as primary mercury production as shown in Table 3.3. However,
consultation with some of the other large zinc smelters indicates much lower
quantities of mercury being produced which, in some cases, is sent directly to landfill
in the form of mercurous chloride (calomel).
Table 3.3: Mercury Production in Finland (1996-2000) (metric tonnes)
Country
1996
1997
1998
1999
2000
Finland
88
63
54
55
77
Sources: Finnish Ministry of Trade and Industry (www.gsf.fi/explor/finmipr9800.htm) and USGS
(2001).
3.1.4 Reclaimed Mercury (Secondary Production)
Factors including moves to minimise releases of mercury to the environment have led
to an increase in the recovery of mercury from waste products. By way of example,
Finland has one plant recovering mercury from dental amalgam. Similarly, a mercury
recycling facility in Manchester, UK8 recovers mercury from lights, dental amalgam,
button cells and thermometers and the mercury is reused in lights, barometers and
other uses.
Although the overall quantity of secondary (reclaimed) mercury production (within
the EU and the three accession countries) is difficult to estimate, it was, until recently,
perhaps of the order of 50 t/year. However, the situation has now changed
dramatically as the mercury from decommissioned chlor-alkali plants begins to enter
the market. By way of example, MAYASA reports that 400t of mercury from
decommissioned chlor-alkali plants were processed for re-sale in 2000. In the coming
years, the chlor-alkali industry would be expected to generate about 650 t/year (i.e.
15,000 tonnes over the period 1998-2020).
3.1.5 Trade in Mercury
Recent data from Europroms indicate that the EU is a net exporter of mercury, as
shown in Table 3.4.
Table 3.4: EU Trade in Elemental Mercury (i.e. not in products)
Year
Imports into EU
1997
250t
1998
120t
1999
430t
Source: Europroms data
8
Exports from EU
810t
670t
910t
Exports from Spain
510t
300t
510t
See www.mercuryrecycling.co.uk
Page 11
Mercury Products - Risks to Health and the Environment
As indicated in Section 1.3, caution must be exercised in relying on data such as those
presented in Table 3.4. Nevertheless, as would be expected, the export figures are
dominated by those from Spain (MAYASA) although the Europroms values are
slightly lower than those provided by MAYASA. In relation to the products under
study, there are imports (into the EU) of products containing mercury (such as
thermometers and batteries). However the imported quantities of liquid mercury as a
‘raw’ material for these products is likely to be limited9. In other words, the imported
quantities of mercury required for the products under consideration are likely to be
well below the quoted figure of 400 t/year. Possible explanations include:
•
•
•
imported figures include figures for material that is re-exported (for example, in
transit through the Port of Rotterdam in the Netherlands);
some imports may be destined for mercury recovery plants; and
some imports may be destined for use in chlor-alkali plants.
Indeed, the ‘real’ situation may be more complex. By way of example, the 1999
imports include over 60t destined for Spain, which according to MAYASA, were reexported with minimal processing. Although efforts have been made to clarify other
key national figures for recent imports and exports with the relevant national
authorities, these have not produced any useful data.
3.1.6 Overview of Mercury Uses
Mercury is found in a wide range of products including dental amalgam,
pharmaceuticals, thermometers, manometers, batteries, fungicides/pesticides,
fluorescent tubes, high-pressure lights, neon lighting, thermostats (and other switch
sensors) on heating/ventilation systems, industrial plant controls, electrical equipment
(relays, etc.), mercury cells used in chlorine production, etc.
This study is focused on the use of mercury in certain products and excludes mercury
usage in chlorine production, for pharmaceuticals and for agrochemical purposes.
The main use ‘types’ have therefore been defined as follows:
•
•
•
•
•
•
dental amalgam (see Section 3.2);
batteries (see Section 3.3);
lighting (see Section 3.4);
measuring and control equipment (see Section 3.5);
electrical equipment (see Section 3.6); and
other products (see Section 3.7).
There are few estimates of the current consumption of mercury in the EU. In the mid1990s, the usage of mercury within the above product groups was estimated as
summarised in Table 3.5. Current usage (for 2000) for the EU-15 countries together
with that for the three accession countries is also presented, based on the results of
data collection carried out for this study.
9
By way of example, some dental products (including sachets of mercury) are imported from suppliers
located in Australia and the US.
Page 12
Risk & Policy Analysts
Table 3.5: EU Mercury Consumption by Product Group (t/year)
Product
mid-1990s1
19962
20003
EU-15
3ACs
Dental amalgam
not given
69
70
20
Batteries
not given
5-8
8
1
Lighting
21
>12
5.2
0.7
Measuring and control
56
<63
28
5
equipment
Electrical equipment
28
not given
8
1
Sub-totals:
>105
c150
119.2
27.7
Other products
<2
73
c50
c5
All of the above:
>107
c220
c170
c33
Sources: 1) WS Atkins (1998); 2) Eurochlor (1999); and 3) based on information presented below
where the 3ACs = Czech Republic, Poland and Slovenia.
Page 13
Mercury Products - Risks to Health and the Environment
3.2
Dental Amalgam
3.2.1 Overview
Mercury-based dental amalgam contains 40-50% mercury which is mixed with other
powdered metals prior to insertion into the dental cavity. Mercury may be applied
from a dispenser or from capsules (generally 400 or 600 mg). The typical filling uses
0.7 g amalgam (i.e. 350 mg mercury) and the residual mercury (and associated waste)
is usually collected in situ.
3.2.2
Control Issues
At the outset, it is important to emphasise that measures to control the use of mercury
amalgam are primarily a result of concerns over subsequent releases to the
environment rather than over health risks to patients. Nevertheless, it is recognised
that oral health personnel may be exposed to mercury vapour during frequent
amalgam preparation and insertion with an associated low level of risk. In order to
minimise such risks, dentists are provided with authoritative advice on best practice
for amalgam usage10.
At an International Level
The position of OSPAR (2000) is that the earlier PARCOM recommendation 93/2:
“equipment should be installed to separate water and amalgam to enable collection of
the amalgam as from 1 January 1997” has largely been implemented by OSPAR
signatories. Reduction in mercury usage and increased use of amalgam separators is
also encouraged by the Aarhus Protocol (UNECE, 1998).
At a National Level
A summary of controls at a national level is provided in Table 3.6.
Table 3.6: National Controls for Dental Amalgam
Country
Austria
Belgium
Denmark
Finland
France
10
Control
All surgeries are provided with amalgam separators
All surgeries in process of being provided with
amalgam separators
Being phased out under Order 692 and may only be
used in molar teeth to replace worn fillings. Amalgam
separators in all public health dentists
In line with HELCOM Recommendation 6/4, waste
water may only be discharged after 95% amalgam
separation - Council of State Decision 112/1997.
Currently, >90% surgeries have separators
As of 2000, all surgeries require separators and
amalgam used must be pre-dosed (thus avoiding
‘loose’ mercury)
Source & Comment
consultation
consultation
HELCOM (2001),
consultation
Submission to UNEP
(2001), HELCOM
(2001) and consultation
INRS (2002)
See, for example, FDI World Dentist Federation (1999): Recommendations on Dental Mercury
Hygiene, based on FDI General Assembly 1998 and available from www.fdi.org.uk.
Page 14
Risk & Policy Analysts
Table 3.6: National Controls for Dental Amalgam
Country
Germany
Greece
Netherlands
Portugal
Sweden
United
Kingdom
Poland
Czech Republic
3.2.3
Control
Since 1990, a minimum of 95% mercury collection
required from amalgam separators which are provided
in nearly all surgeries
Separators not required
Since 1994, a minimum of 95% mercury collection
required from amalgam separators
All surgeries in process of being provided with
amalgam separators (currently 20%)
Since 1985, a minimum of 95% mercury collection
required from amalgam separators. All surgeries
provided with separators
As of 1997, 25% of surgeries provided with separator.
New guidance recommends wider provision to
implement PARCOM recommendation 93/2
Separators not required but extracted amalgam fillings
are collected and treated
Separators required for new dentist chairs from January
2002. By January 2005, all surgeries must be provided
with separators
Source & Comment
OSPAR (1997),
submission to UNEP
(2001) & consultation
consultation
OSPAR (1997)
consultation
OSPAR (1997)
WS Atkins (1997)
DEFRA (2001)
consultation
consultation
Quantities Used
EU Wide
No estimate of mercury usage in dental amalgams is provided by WS Atkins (1998)
nor by ERM (1998). Estimates for 1990 and 2000 based on the more detailed
information presented below suggests that the mercury consumption in the EU in
dental amalgam was likely to have been of the order of 110 t/year in 1990 which has
now reduced to the order of 70 t/year with, perhaps, a further 20 t/year used in the
three accession countries.
By Country
More detailed information on the use of mercury dental amalgams by country is
presented in Table 3.7.
Table 3.7: Dental Amalgam Consumption by Country (t/year)
Country
Austria
c1990
Belgium
3.7 (1990)
Denmark
2.0 (1991)
1.8 (1992/3)
c1.0 (current)
1.2 (1987)
c1.0 (1996/97)
<0.2 (current)
Finland
c2000
Source & Comment
Amalgam usage has not changed in recent
years (consultation)
OECD (1995). Amalgam usage reduced
by >25% in recent years (consultation)
OECD (1995), HELCOM (2001) &
consultation. Amalgam usage reduced
>50% amongst children in recent years
OECD (1995), consultation. Amalgam
usage reduced >50% in recent years - now
very limited
Page 15
Mercury Products - Risks to Health and the Environment
Table 3.7: Dental Amalgam Consumption by Country (t/year)
Country
France
c1990
16.0 (1990-92)
Germany
24.1 (1985)
29 (1993)
c2000
20-25 (current)
Greece
Ireland
Netherlands
1.6 (1996)
5.5 (1989)
5.2 (1990)
Portugal
Sweden
United Kingdom
1.7 (1991)
11.4 (1989-90)
12 (1997)
EU Total
Poland
c110
13*
c70
13*
Czech Republic
5.8*
5.8
Source & Comment
OECD (1995), detailed report with French
submission to UNEP (2001)
OECD (1995), submission to UNEP
(2001) and consultation. Amalgam usage
reduced 30-40% in recent years
Usage reduced by >50% in recent years
(consultation)
CTC (1999)
OECD (1995), Slooff et al. (1995)
Usage reduced by >50% in recent years
(consultation)
OECD (1995). Amalgam usage reduced
by >50% in early 1990s (submission to
UNEP (2001)
OECD (1995), WS Atkins (1997) amalgam usage reduced by >25% in
period 1992-97
RPA estimates
Amalgam used in about 60% of fillings.
Similar practice to Germany of early
1990s with no reduction (consultation)
Amalgam usage not declining - and may
even be increasing as covered by national
health insurance (consultation)
Note: * RPA estimate
As a first estimate, it can be seen from Table 3.7 that about 70 t/year was used by
about 65% of the EU-15 population in 199011 giving an EU-15 total consumption of
the order of 110 t/year. Consultation with dental associations (and other sources)
suggests that this value has dropped significantly in most EU countries in recent years
- perhaps to 70 t/year with, perhaps, a further 20 t/year used in the three accession
countries.
3.2.4
Lifecycle and Emissions
Manufacture
Dental amalgam is formulated in the dental surgeries. The most common method is
the use of mixing pre-packed capsules of alloy particles and mercury, although ‘bulk’
mercury is still used (particularly in the UK).
The mercury used in dental surgeries may have passed through several stages (and
several companies) as illustrated below:
11
Base information (such as population data) on the EU-15 and accession countries is taken from the
Eurostat Yearbook (EC, 2001).
Page 16
Risk & Policy Analysts
•
•
•
•
Company A produces mercury (primary or secondary). Such producers include
MAYASA and mercury recovery facilities. As discussed earlier, these may well
now include some of the chlor-alkali facilities;
Company B refines mercury (in some cases) to produce high quality (tripledistilled) mercury which is packaged in capsule (or sachet) form. There are major
facilities in Germany and the Netherlands;
Company C packages capsules with alloys for distribution. This is generally
undertaken by national companies using supplies originating from within the EU although there may be some imports as well; and
Company D distributes mercury amalgam to dentists together with a wide range of
other dental supplies. Within the EU, this market appears to be dominated by two
non-EU companies
In relation to emissions of mercury to the environment, it can be seen that the focus of
attention will be on Companies A and B since no emissions would (normally) be
associated with Companies C and D.
Usage
The use of mercury amalgam for dental fillings generates waste. The waste includes
excess amalgam, old fillings which have been drilled out and amalgam present in
teeth being extracted.
Although the new separators will recover 95% or more of the waste amalgam, it is
sometimes claimed that the prior use of traps and filters provided a reasonably high
recovery rate. A study in Denmark found that the mercury in waste water reduced
from 57g to 8g per dentist per year with separators fitted (as reported in ArenholtBindslev, 1998). These figures can be used to indicate the recovery rate from traps
and filters as illustrated in Box 3.1.
Box 3.1: Recovery with & without Separators
Suppose waste quantity was X g/dentist/year and the recovery rates without separators (but
with traps and filters) and with separators were A and B respectively. Then, using the waste
water figures of 57 and 8 g/dentist/year gives:
for the ‘without separators’ situation:
for the ‘with separators’ situation:
X - AX = X (1- A) = 57; and
X - BX = X (1 - B) = 8
Then, (1-A)/(1-B) = 57/8 = 7.1 which gives: 1 - A = 7.1 - 7.1B; which gives 7.1B - 6.1 = A
Now, if the separators gave a recovery rate of, say, 95%, then B = 0.95, giving: A = 0.64
and if the separators gave a recovery rate of, say, 98%, then B = 0.98, giving: A = 0.86
In other words, the Danish work suggests that recovery rates using filters and traps would be
of the order of 64-86%.
Page 17
Mercury Products - Risks to Health and the Environment
Taking account of the calculation presented in Box 3.1 and given the widespread
implementation of separators within the EU, we estimate an overall recovery rate of
around 90%. Once collected, most amalgam is sent to metal recycling plants for
mercury recovery - although extracted teeth (which may contain amalgam fillings)
tend to be disposed of as clinical waste.
Crematoria
In 1999, 3.5 million people died in the EU and a further 0.5 million died in the three
accession countries. Over 30% of the dead (1.2 million = 4 million x 0.3) were
cremated. The cremation rates vary greatly from near 0% in Greece and Poland to
over 70% in Denmark and the Czech Republic12. If it was assumed that there were 8
fillings with 350 mg of Hg per person cremated, this would give a maximum emission
(in the EU and three accession countries) of: 1.2 million x 8 x 350 x 10-9 = 3.4 tonnes
of mercury vapour.
Emissions to Environmental Media
For this and the other products under consideration, the estimation of mercury
releases has been based on the two-stage approach used in Sweden (KEMI, 1997):
•
•
the estimation of the distribution factors for the different pathways; and
the estimation of emission factors for the subsequent releases to air and water.
Distribution factors
For new fillings, the assumed distribution is 60% to new fillings, 20% excess
amalgam (which is recovered), 20% amalgam to waste (90% of which is recovered
and 10% to sewer). For a current usage of 90 t/year (in the EU and the three
accession countries), this would lead to 54 t/year being inserted in new fillings.
For existing fillings (which have a typical life span of around 10 years), the assumed
distribution is: 65% to waste (i.e. old filings being drilled out); 10% in extracted teeth
(or lost) which are then sent to (clinical) waste (with 25% incineration); and 25% in
corpses (with a 30% cremation rate). As indicated in Table 3.7, the usage ten years
ago was about 130 t/year (in the EU and the three accession countries), of which 78
t/year (i.e. 60% of 130 t/year) would have been expected to have gone into fillings at
that time. Ten years on, these fillings will have come to the end of their life which
would give rise to a current ‘waste’ stream (from these now ‘old’ fillings) of 78 t/year
- i.e. 144% of the current filling rate (= 78/54).
In other words, when considering the quantity of mercury entering the environment, it
is necessary to consider losses associated with the insertion of new fillings and the
disposal of old fillings. The resultant ‘lifecycle’ of mercury used in dental amalgam
is shown in Figure 3.1. The associated emission factors are discussed further below.
12
The Cremation Society of Great Britain: International Cremation Statistics, available from
www.members.aol.com/CremSoc4/Stats.
Page 18
Risk & Policy Analysts
Mercury Usage
in Dental
Amalgam
Excess
amalgam
100%
20%
Recovered
(including
separators)
75%
25%
90%
20%
To waste
recovery
10%
Recycled
Watercourses
20%
38%
Sewer
Agricultural
60%
9%
65%
Disposal of
Amalgam
New Fillings
10%
Extracted
(or lost)
25%
75%
25%
33%
Incinerator
75%
25%
144% of Current Filling Rate
End-of-life
10 years
Old Fillings
70%
30%
Landfill/
Burial
Atmosphere
1.4%
10%
90%
Crematoria
Figure 3.1: Mercury in Dental Amalgam - Lifecycle & Emissions
Emission factors
We have assumed that (relatively, at least) there is negligible emission of mercury to
any environmental compartment from recovered mercury. By way of example, the
measured emissions at the Finnish plant (which produces mercury from zinc smelting)
are less than 0.02% (Finnish Environment Institute, 1999). A current IPPC
application for a UK mercury recycling company suggests that compliance with the
recent IPPC Guidance Note on ‘Best Available Techniques in the Non-ferrous Metals
Industries’ (EC, 2001) will lead to even lower emissions. Furthermore, mercury
losses during the lifetime of a filling (i.e. when in the mouth) have been neglected.
It should be noted that not all ‘recovered’ mercury will be recycled to re-enter the
mercury supply chain. In some cases, recovered amalgam may be disposed of
directly to landfill (as clinical waste) whilst elsewhere mercury may be recovered and
then disposed of to landfill as mercuric sulphide (as happens with some plants in
Finland where lamps are recycled - see S3.4.4). For the purposes of this analysis, we
have assumed that 75% of mercury in recovered amalgam is recycled.
As indicated above, 10% of waste amalgam will enter the sewer. WS Atkins (1998)
utilise the following factors with regard to the fate of mercury ending up in sewage
treatment plants:
•
•
•
•
watercourses:
agricultural soil:
landfill:
incineration:
20%;
38%;
33%; and
9%.
Page 19
Mercury Products - Risks to Health and the Environment
These figures were based on practices and trends in the EU in the early 1990s and
take into account the treatment of sewage and the disposal of use of sludge for
agricultural purposes and have been assumed to remain valid.
In the case of batteries (discussed in S3.3.3), the Swedish report (KEMI, 1997) asserts
that 0.5% of mercury disposed of to landfill finds its way to the atmosphere through
volatilisation in the first year and, perhaps, 0.1% per year thereafter. Given the
relative immobility of mercury in batteries, it will be assumed that these figures can
also be applied to mercury in amalgam (and in sulphide form). An annualised figure
of 1.4% (based on losses over 10 years) is used - as illustrated in Box 3.2. It is
acknowledged that landfill leachate may contain mercury (and other heavy metals)
and, for older ‘uncontained’ sites, may enter local ground/surface waters. However,
the concentrations (associated with municipal waste sites, at least) tend not to be
significant (Schmid et al., 2000).
Box 3.2: Annualised Losses to Atmosphere from Landfill
In the case of batteries and dental amalgam disposed of to landfill, it has been assumed that there is a loss of
0.5% in the first year and 0.1% per year for the next nine years. This is equivalent to an annual loss of 1.4%
per year as the emissions will be comprise those from this and previous years’ disposal as shown in the table
below.
Year of
disposal
1992
0.6%
0.1%
0.1%
0.1%
0.5%
<1989
1989
1990
1991
1992
1993
1994
1995
1996
1997
1998
1999
2000
2001
2002
2003
2004
Total Emission:
1993
0.5%
0.1%
0.1%
0.1%
0.1%
0.5%
1.4%
1994
0.4%
0.1%
0.1%
0.1%
0.1%
0.1%
0.5%
1.4%
1995
0.3%
0.1%
0.1%
0.1%
0.1%
0.1%
0.1%
0.5%
1996
0.2%
0.1%
0.1%
0.1%
0.1%
0.1%
0.1%
0.1%
0.5%
1.4%
1.4%
Year of Emissions
1997
1998
1999
0.1%
0.1%
0.1%
0.1%
0.1%
0.1%
0.1%
0.1%
0.1%
0.1%
0.1%
0.1%
0.1%
0.1%
0.1%
0.1%
0.1%
0.1%
0.1%
0.1%
0.1%
0.1%
0.1%
0.1%
0.5%
0.1%
0.1%
0.5%
0.1%
0.5%
1.4%
1.4%
1.4%
2000
0.1%
0.1%
0.1%
0.1%
0.1%
0.1%
0.1%
0.1%
0.1%
0.5%
1.4%
2001
0.1%
0.1%
0.1%
0.1%
0.1%
0.1%
0.1%
0.1%
0.1%
0.5%
1.4%
2002
0.1%
0.1%
0.1%
0.1%
0.1%
0.1%
0.1%
0.1%
0.1%
0.5%
1.4%
2003
0.1%
0.1%
0.1%
0.1%
0.1%
0.1%
0.1%
0.1%
0.1%
0.5%
1.4%
2004
0.1%
0.1%
0.1%
0.1%
0.1%
0.1%
0.1%
0.1%
0.1%
0.5%
1.4%
With regard to incineration, WS Atkins (1998) indicate that a retention rate of
mercury of 50% is reasonable for incinerators across Europe (although possible rates
of 90% are also mentioned13). The Swedish report however, indicates an overall
retention rate of 30%. The consultants believe that advances in incineration
technology since the time of those two reports as well as the tightening of emission
13
Indeed, in its submission to UNEP, Sweden notes that its single hazardous waste incinerator has now
virtually eliminated mercury emissions with a 99.9% retention rate.
Page 20
Risk & Policy Analysts
limits may allow for a 25% value of emissions to the atmosphere to be considered
reasonable for the present situation across Europe14. Subsequently, the remaining
75% of mercury is likely to be disposed of as hazardous waste to landfill as part of the
fly ash residue. In contrast, most crematoria have minimal controls to retain mercury
discharges and a value of 90% discharge to atmosphere will be assumed, although
about 40% of Sweden’s 68 crematoria have now been provided with filters to reduce
mercury emissions by 95% or more (Swedish submission to UNEP, 2001).
Summary
Based on an annual consumption of 90 t/year within the EU and the three accession
countries and the associated lifecycle and emissions outlined above, the overall endpoints were calculated to give the results presented in Table 3.8.
Table 3.8: Dental Amalgam Emissions & End-Points (t/year)
Parameter
Consumption
End-points:
Amount (t/year)
90
Recycled
59.8
Water Course
Agricultural soil
Atmosphere
Landfill/burial
1.4
2.6
6.5
43.5
Accumulation1
Check Totals:
-23.8
Comment
Based on S3.2.3 above
It has been assumed that 75% of recovered
amalgam is recycled
After sewage treatment
Associated with sewage sludge disposal
Dominated by crematoria
This represents the additional flow entering the
waste stream from ‘old’ fillings. As such, this
equates to a reduction in the overall ‘inventory’
of mercury present in dental amalgam (within
the EU and the three accession countries) as
less mercury is used for new fillings than was
the case ten years ago
90.00
Note:
1) Accumulation relates to the quantity of mercury in circulation within the product rather than to
the total quantity of mercury present in the environment associated with the product.
14
Under Directive 2000/76/EC on the incineration of waste, mercury stack concentrations would be
limited to 0.05 mg/m3. This would equate to a maximum mercury emission to atmosphere of the order
of 25 kg/year for a 60,000 t/year municipal waste incinerator with a flow through the stack of 60,000
m3/hr.
Page 21
Mercury Products - Risks to Health and the Environment
3.3
Batteries
3.3.1 Types of Battery
There are numerous types of batteries which may be grouped as follows:
•
•
•
•
‘flooded’ lead-acid batteries of which the most common form is the standard
battery used to start engines in vehicles, and have been in use since the nineteenth
century;
‘sealed’ lead-acid batteries which appeared in the 1970s and may be used in
vehicles but also are widely used in back-up power supplies for computers, etc.;
primary (disposable) portable batteries of which the vast majority are the
standard disposable batteries used in the home (torches, toys, etc.); and
secondary (rechargeable) portable batteries of which most are used in electronic
equipment (calculators, cameras, mobile phones, etc.).
An indication of the relative scale of usage was derived from the Europroms data as
shown in Table 3.9.
Table 3.9: EU Imports and Exports of Batteries (1999)
Type of battery
Numbers of batteries in 1999 which were
Exported2
Imported1
34 million
27 million
43 million
17 million
4474 million
5270 million
619 million
393 million
Lead-acid batteries (flooded)
Sealed lead-acid batteries
Primary (disposable) portable batteries
Secondary (rechargeable) portable batteries
Source: Europroms data
Notes
1) The numbers of batteries imported are based on summing the data for intra-EU imports and
extra-EU imports for each of the EU countries. As indicated in Section 1.3, these data provide
an indication of relative usage (based on trade statistics) rather than a direct measure of
consumption.
2) The export figures were derived in the same way as those for imports.
Since lead-acid batteries are much heavier than portable batteries (a typical car battery
weighs 13 kg whilst the typical ‘C’ portable battery weighs 67g), the overall weights
of material involved are much closer than Table 3.9 might suggest.
3.3.2 Mercury in Batteries
As discussed in Section 3.1.3, lead ores may contain small amounts of mercury.
However, the mercury will be driven off during the smelting process. As such,
mercury is not a significant impurity in the lead used in lead-acid batteries
(particularly as most of the lead will be re-used and will therefore be re-refined).
Furthermore, mercury is not a significant impurity of sulphuric acid (the electrolyte
used in lead-acid batteries). In short, lead acid batteries are ‘mercury-free’ (ICON,
Page 22
Risk & Policy Analysts
2001 and EC, 2001a). As a result, lead-acid batteries will not be affected by the
requirement of the ‘end-of-life vehicles directive’ for the presence of mercury (not
intentionally introduced) to be limited to 0.1% by weight15 (since the mercury
concentrations in lead-acid batteries will be much lower than 0.1%).
In relation to portable batteries, all lithium batteries and secondary (rechargeable)
batteries have always been mercury-free. However, there are a number of portable
batteries (both ‘cylinders’ and ‘button cells’) which contain (or have contained) small
amounts of mercury which have been added to enhance performance as indicated in
Table 3.10
Table 3.10: Types of Portable Dry Batteries which Contain Mercury
Type &
Form
Main Materials
Alkaline-manganese
(Zn anode, MnO2
cathode)
Previously,
<0.025% by wt.
Now mercury free1
Zinc-mercury (Zn
anode, mercuric oxide
(HgO) cathode)
32% by wt.
Silver oxide, Alkalinemanganese, Zinc-air
(various designs with
Zn anode)
up to 2% by wt
Primary
(disposable):
Cylinder
Primary
(disposable):
Button
Mercury Present?
Comment
Standard portable battery which
makes up about half of the total
numbers of primary portable
batteries. Note that zinc-carbon
batteries (the other main kind of
cylinder battery) are mercury free
Formerly used where size is of
importance
(hearing
aids,
photography, etc.). Zinc-mercury
cells were banned in EU from 1
January 2000
Silver oxide used in watches.
Zinc-air particularly used
hearing aids
for
Notes:
1) Generally, to be ‘mercury free’ requires the mercury content to be less than 0.0005% (5 ppm) by
weight - but see Nordic Ecolabelling requirements below.
3.3.3
Control Issues
Council Directive 91/157/EEC16 required Member States to prohibit, from 1 January
1993, the marketing of:
•
•
alkaline manganese batteries for prolonged use in extreme conditions containing
more than 0.05% mercury by weight; and
all other alkaline manganese batteries containing more than 0.025% mercury by
weight.
Alkaline manganese button cells (and batteries comprising button cells) with higher
mercury concentrations were, however, permitted to remain on the market. The
15
16
Commission Decision 2002/525/EC of 27 June 2002 amending Annex II of Directive 2000/53/EC on
end-of-life vehicles.
Council Directive 91/157/EEC of 18 March 1991 on Batteries and Accumulators Containing
Certain Dangerous Substances, OJ L078, 26/03/1991.
Page 23
Mercury Products - Risks to Health and the Environment
Directive also required Member States to provide appropriate systems for the
collection, recycling and disposal of spent batteries (and accumulators). These
requirements (including mercury content limits) were also used in the Aarhus
Protocol (UNECE, 1998).
As of January 1994, the main EU suppliers had agreed to provide ‘mercury free’
general purpose (i.e. primary cylinder) batteries17 - although non-members of the
European Portable Battery Association continued to import batteries with up to
0.025% mercury by weight (as permitted by Directive 91/157). Commission
Directive 98/101/EC18 required Member States to prohibit, from 1 January 2000, the
marketing of:
•
•
batteries and accumulators containing more than 0.0005% (5 ppm) mercury by
weight; and
button cells (and batteries made up of button cells) containing more than 2%
mercury by weight.
In Scandinavian countries, ecolabels for primary batteries require a strict limit of 1
ppm of mercury (Nordic Ecolabelling, 2000) - although industry claims that this is
below ‘natural levels’ in other battery materials. For rechargeable batteries, the limit
is 5 ppm (Nordic Ecolabelling, 2000a).
3.3.4
Quantities Used
EU Wide
As discussed in more detail below, it is estimated that in the mid-1990s, the quantity
of mercury in battery usage in the EU was probably of the order of 40 t/year with over
30 t/year associated with zinc-mercury button cells and over 5 t/year associated with
other button cells.
Given the actions of industry to move to mercury free batteries and the
implementation of Directive 98/101/EC, the current mercury usage in batteries has
probably dropped to the order of 8 t/year. Although zinc-mercury batteries are now
effectively banned within the EU and global production has generally ceased, it is
worth noting that such batteries are still available through specialist suppliers and,
indeed, are still manufactured in the US.
Recent trends in battery usage were explored using Europroms as illustrated in Figure
3.2 (overleaf). Particular focus is given to figures for zinc-mercury batteries
(predominantly button cells) and other button cells which may contain up to 2%
mercury. As can be seen, the numbers (both imports and exports) for zinc-mercury
buttons (‘PrimBut-ZnHg’) have declined sharply since 1997, although this decline is
17
18
EPBA (2000): Effective Recycling of Batteries: The EPBA Two Step Plan, available from EPBA
website.
Commission Directive 98/101/EC of 22 December 1998 adapting to technical progress Council
Directive 91/157/EEC on Batteries and Accumulators Containing Certain Dangerous Substances,
OJ L001, 05/01/1999.
Page 24
Risk & Policy Analysts
not so dramatic when considering all primary zinc-mercury batteries together
(‘PrimAll-ZnHg’). In relation to the other kinds of button cell, the figures for silver
oxide buttons have remained fairly constant whilst those for other buttons have shown
increases in the last few years.
1E3
Figure 3.2: EU Trends in Primary
Batteries Containing Mercury
Units (x10^6)
1E2
1E1
1E0
PrimBut-ZnHg
PrimAll-ZnHg
PrimBut-AlkMn
PrimBut-AgO
PrimBut-ZnAir
Battery Type
1995-Imp
1997-Imp
1999-Imp
1995-Exp
1997-Exp
1999-Exp
As indicated above, most of the mercury in batteries is associated with button cells
and an estimate of button cells sales and associated mercury content has been
provided by the industry as shown in Table 3.11. It should be noted that lithium cells
(which do not contain mercury) account for about 70% of the primary button sales.
Table 3.11: Mercury Content in Button Cells Currently Sold in EU (& Switzerland) by
Members of the European Portable Battery Association
Quantity of
Mercury
Alkaline Button
12.3
0.45
205 kg
Zinc-mercury Button
0
n/a
0 kg
Silver oxide Button
295
0.34
295 kg
Zinc-air Button
243
1.24
1628 kg
Total
550
0.81
2128 kg
Source: consultation - note that figures exclude goods imported with button cells fitted.
Button Cell
Sales (million)
% Mercury
There is some divergence between the figures presented in Table 3.11 and the
Europroms data (as shown in Figure 3.2). In particular, the Europroms data suggest a
significant trade in zinc-mercury batteries (which are no longer sold by EPBA
members) although these 1999 pre-date the ban introduced on 1 January 2000. In
addition, the Europroms data suggest a higher market share for alkaline button cells
than that suggested by the EPBA data.
Page 25
Mercury Products - Risks to Health and the Environment
As can be seen from Table 3.11, the EPBA figures suggest a mercury usage of over
2,000 kg/year in button cells. For comparison purposes, data from ERM (2001)
suggest an EU consumption of about 125,000 t/year of primary portable mercury-free
batteries which, with a ‘natural’ level of, say, 3 ppm mercury, would correspond to a
mercury flow of about 375 kg/year.
By Country
Germany, France and the UK are the prime consumers of (portable) batteries each
accounting for nearly 20% of EU battery sales followed by Italy and Spain (each
around 11%). Some further information on battery usage is presented in Table 3.12.
Table 3.12: Mercury Usage in Portable Batteries (mainly Button Cells) by Country (t/year)
%EU button
Country
c1990
late 1990s
Source & Comment
market1
Austria
2.0%
Belgium (&
3.7%
Luxembourg)
Denmark
0.4 - 0.9
1.8%
HELCOM (2001)
(1992-93)
Finland
0.75 (1996/97)
1.2%
Consultation - primarily
zinc-mercury button cells
France
20.1%
Germany
16.1 (1991)
3.1 (2000)
20.2%
Submission to UNEP
125m button
(2001) with 32% recycled
cells (excl.
leaving 2.1t to waste
lithium) (1998)
Greece
1.9%
Ireland
0.5%
Italy
11.0%
Netherlands
2.6 (1990)
3.8%
Slooff et al. (1995)
Portugal
1.4%
Spain
11.5%
Sweden
0.8 (1997)
2.6%
Submission to UNEP
0.1 (1998)
(2001) - ban on zincmercury batteries led to
dramatic reduction
United Kingdom
27m button
18.3%
BBMA website (figure
cells (1999)
relates to ‘consumer
sales’ and includes
lithium cells)
EU Total
75
8
RPA estimates
Poland
n/a
Czech Republic
0.22 (2000)
n/a
Submission to UNEP
(2001)
Slovenia
n/a
Note:
1) ERM (2001) estimate total EU button sales (i.e. including lithium) to be over 1,100 t/year (of
the order of 500 million cells/year). The % figures presented relate to button cell waste arising
based on sales in 2000.
Page 26
Risk & Policy Analysts
3.3.5
Lifecycle & Emissions
Manufacture
Inspection of batteries within a typical EU household will reveal batteries from
various countries including the UK, Japan, Germany, Indonesia, China and the USA.
Major manufacturers include Duracell, Energizer, Rayovac, Philips, Sony, Varta, and
Panasonic. Some countries (for example, Austria) have no production facilities and
others (for example, Poland) have facilities for the domestic market.
In relation to button cells specifically, there are only three manufacturing plants in the
EU - two in the UK and one in Germany each operated by one of the major
manufacturers. Button cells are not produced in any of the three accession countries
under study.
It is clear from the information outlined above that not only are large numbers of
batteries (and button cells) manufactured within the EU (and some batteries in the
three accession countries) but there would also appear to be large numbers of imports
and exports (of roughly equal proportions as indicated by Figure 3.2).
Detailed data on individual countries (beyond that presented in Europroms) and
companies have been difficult to obtain. The most comprehensive data found relate to
Germany which suggest that the current mercury usage in batteries is around 3 t/year.
A more detailed inspection of the German submission to UNEP (and related
documents) reveals a dramatic reduction in mercury consumption in batteries over the
last decade which is associated with the decline in use of zinc-mercury button cells
(which were banned from January 2000). However, these still accounted for 70% of
Germany’s estimated consumption of 3.1 tonnes of mercury in batteries in 2000.
Similarly, all EU-15 countries report some trade in zinc-mercury batteries (as reported
by Europroms data) - albeit prior to the introduction of the EU ban on such batteries.
Given that Germany accounts for about 20% of the button cell market and assuming
that the German figures can be extrapolated to the EU as a whole, these data suggest a
significantly higher figure for the EU as a whole - perhaps 15 t/year than that of
around 2 t/year suggested by industry. Although the latter figure relates only to sales
by EPBA members (and does not therefore include any sales of zinc-mercury batteries
- see Table 3.11), there would appear to be a degree of uncertainty as to the quantities
of mercury used in portable batteries - with particular reference to that associated with
sales of zinc-mercury batteries (many of which are likely to be imported within
products).
In the absence of more detailed data, we shall opt, conservatively, for a current (i.e.
2002) mercury usage in batteries of 8 t/year within the EU and a further 1 t/year in the
three accession countries (note that the 50 million population of the Czech Republic,
Poland and Slovenia is about 13% of that of the EU’s 376 million).
Page 27
Mercury Products - Risks to Health and the Environment
Recycling of Portable Batteries
Although the vast majority of lead-acid batteries are recycled (and have been for
many years), the recycling of portable batteries is not so well established.
There are established (portable) battery collection/recycling operations in several
countries. 1999 data from Austria, Belgium, Germany and the Netherlands suggest
existing battery collection rates of 30% to 55% (EBPA, 2001).
However, in
Germany, the national ‘voluntary’ agreement initiated in 1988 was not considered to
be an unqualified success (Jörgens & Busch, 2000) and, as a result, the Batteries
Ordinance (BatV) was implemented in 1998 which requires:
•
•
•
retailers to take back all batteries;
retailers to advise customers of the take back scheme; and
customers to return batteries to retailers (or recycling centres).
There is no national portable battery collection/recycling operation in the UK,
although there are a number of local initiatives (SWAP, 2000). It is worth noting that
the near exclusive use of silver oxide button cells in watches which are replaced in the
UK, generally, by jewellers lends itself to a recycling scheme and a 75% target
appears feasible (SWAP, 2000a).
Consultation has indicated that, from 1 January 2002, a new law in Poland requires
producers and importers of portable batteries to recycle 50% of the batteries sold.
Emissions to Environmental Media
As before, the estimation of mercury releases has been based on the two-stage
approach used in Sweden (KEMI, 1997):
•
•
the estimation of the distribution factors for the different pathways; and
the estimation of emission factors for the subsequent releases to air and water.
Distribution factors
The fate of mercury in present in batteries (mainly button cells) is presented in Figure
3.3. Given the relatively short life of a portable battery/cell (ERM (2001) in its report
for the battery industry use a figure of three years), there is negligible accumulation
and given the nature of batteries, the breakage rate is negligible. These assumptions
concur with those used by KEMI. The assumed disposal route distributions (and
again these concur with those used by KEMI) are: 20% recovery (as an overall
average for the EU and accession countries), 20% to incineration and 60% to landfill
(this corresponds to 25% of municipal solid waste (MSW) being incinerated).
Page 28
Risk & Policy Analysts
For
Collection
Mercury Usage
in Portable
Batteries
100%
Disposal of
Used
Batteries
New Batteries
100% of Current Usage
3 years
0%
Recycled
75%
25%
20%
100%
Recovered
Breakage
(negligible)
Landfill
1.4%
75%
75%
25%
Incinerator
80%
Disposed to
Solid Waste
Atmosphere
25%
Used
Batteries
Figure 3.3: Mercury in Batteries - Lifecycle & Emissions
Emission factors
As for the dental amalgam, we have assumed that 75% of the recovered mercury is
recycled and 25% sent to landfill. For batteries in landfills, the Swedish report
(KEMI, 1997) asserts that 0.5% finds its way to the atmosphere through volatilisation
in the first year and, perhaps, 0.1% per year thereafter. As before, an annualised
figure of 1.4% is used (to represent average losses over 10 years). With regard to
incineration (and as discussed in S3.2.4), an incinerator will emit 25% to atmosphere
with the remaining 75% (mainly in fly ash) sent to landfill.
Summary
Based on an annual consumption of 9 t/year within the EU and the three accession
countries and the associated lifecycle and emissions outlined above, the overall endpoints were calculated to give the results presented in Table 3.13.
Table 3.13: Mercury in Batteries Emissions & End-Points (t/year)
Parameter
Consumption
End-points:
Recycled
Water Course
Agricultural soil
Atmosphere
Landfill/burial
Accumulation
Check Totals:
Amount (t/year)
9.00
1.35
0.00
0.00
0.55
7.10
0.00
9.00
Comment
Based on S3.3.3 above
It has been assumed that 75% of recovered
batteries are recycled
Dominated by incinerator emissions
Page 29
Mercury Products - Risks to Health and the Environment
3.4
Lighting
3.4.1 Types of Lamp containing Mercury
Mercury is present in a range of discharge lamps. Continuing technological
development has resulted in not only increased lighting efficiency but also a reduction
in mercury content (apart from high-pressure sodium lamps) as illustrated in Table
3.14 by the ‘typical’ figures provided for the mercury content in lamps in 1993, 1997
and currently.
Table 3.14: Changing Mercury Content in Lamps
Lamp Type
Mercury Present
Fluorescent tube
(double end)
30-40 mg/tube (1993)
15 mg/tube (1997)
10 mg/tube (currently)
Compact fluorescent
lamp (CFL - single
end)
5 mg/lamp (1993, 1997 &
currently)
Energy efficient CFLs are widely used for
general lighting
High pressure
mercury vapour
75 mg/lamp (1993)
39 mg/lamp (1997)
30 mg/lamp (currently)
Used where bright light is required - e.g.
security lighting. Small lamps (with less
than 1 mg/lamp) are also used for
‘executive’ car headlamps
Metal halide
High-pressure
sodium
60 mg/lamp(1993)
30 mg/lamp (1997)
25 mg/lamp (currently)
20 mg/lamp (1993)
25 mg/lamp (1997)
30 mg/lamp (currently)
Uses & Comment
Fluorescent tubes are the most widely used
form of artificial light, particularly in
commercial and industrial premises. Note
that modern tubes use 10% of the mercury
used 20 years ago
Homes and offices
Used for high intensity lighting (note that
low-pressure sodium lamps used in street
lighting for example are mercury free)
Low-pressure tubes used in shop signs, etc.
Blue colours may contain neon or argon gas
and mercury vapour
Sources: International Association for Energy Efficient Lighting (1993): Mercury: A Broader
Perspective, IAEEL Newsletter 3/93 (from www.iaeel.org); European Lighting Companies
Federation (1997): Discharge Lamps and the Environment, Brussels, ELC; and consultation.
‘Neon’
3.4.2
10 mg/tube (estimate)
Control Issues
At an International Level
The criteria for eco-labelling of light bulbs were revised in 199919 and further
revisions are now being processed following a meeting of the European Eco-labelling
Board (EUEB) in May 200220. The current specified maximum mercury levels (with
those planned in brackets) in lights are as follows:
19
20
Commission Decision of 27 July 1999 Establishing the Ecological Criteria for the Award of the
Community Eco-label to Light Bulbs.
As reported on the European Commission’s website: europa.eu.int/comm/environment/ecolabels/news/
news.htm.
Page 30
Risk & Policy Analysts
•
•
single-ended bulbs: 6 mg/bulb (to be reduced to 4 mg/bulb); and
double-ended bulbs: 7.5 mg/bulb (10,000-20,000 hour life) and 10 mg/bulb
(>20,000 hour life). These will be reduced to 5 mg/bulb (>12,500 hour life) and
8 mg/bulb (>20,000 hour life) respectively.
Reduction in mercury content and increased recycling is also encouraged by the
Aarhus Protocol (UNECE, 1998) as well as by OSPAR and HELCOM. In the longer
term, all fluorescent lamps within the EU are likely to have to comply with mercury
limits of 5 mg/lamp (single-ended) and 10 mg/lamp (double-ended) to comply with
the proposed RoHS Directive21
In view of the continuing drive to reduce the mercury content of lamps, it is worth
noting an argument (advanced by industry) that the fossil fuel savings due to use of
CFLs over ordinary incandescent mercury-free light bulbs results in net savings of
mercury emissions (since mercury is emitted by fossil-fuel combustion for electricity
generation).
At a National Level
Several countries have adopted (or are considering) measures to further reduce the
mercury usage in lamps as illustrated in Table 3.15.
Table 3.15: Controls for Mercury in Lamps by Country
Country
Austria
Denmark
Sweden
3.4.3
Control
There has been a ‘deposit’ on fluorescent lamps since
1991 with a 15 mg/lamp limit implemented in 1996 (Note
a similar system for mercury lamps is used in Latvia)
Being phased out under Order 692 (see Section 1.2)
Further restrictions on mercury in light sources is under
consideration (see Section 1.2)
Source & Comment
CTC (1999) & OECD
(1995)
HELCOM (2001)
HELCOM (2001)
Quantities Used
EU Wide
The lighting industry is dominated world-wide by three manufacturers which produce
over 65% of all lamps - Philips, Osram (Siemens) and GE Lighting.
European Lighting Companies Federation (ELC) figures from 1997 suggest 5.2 t/year
of mercury was supplied in lighting units22 - mainly (over 85%) in fluorescent tubes
as illustrated in Table 3.16. More recent figures suggest that although the average
mercury content per lamp has declined, this has been more than offset by the increase
21
22
Proposed Directive on the Restriction of the Use of Certain Hazardous Substances in Electrical
and Electronic Equipment, COM(2000) 347, OJ C365E pp 195-197 dated 19 Dec 2000 - which is
currently progressing through the European Parliament.
No specific quantitative data have been obtained for ‘neon’ tubes but the mercury usage is expected to
make a negligible contribution to the overall use.
Page 31
Mercury Products - Risks to Health and the Environment
in the number of lamps produced giving a current estimate of 5.9 t/year of mercury in
lamps. This figure represents the mercury used in ‘European’ (rather than EU) lamp
production and also includes those lamps destined for export.
The figures quoted above are significantly lower than that of 21 t/year used by WS
Atkins (1998).
Table 3.16: Mercury Usage in European Lamp Production
Lamp Type
Mercury Used in 1997
mg Hg
millions
Hg used
/lamp
produced (kg/year)
Mercury Used Currently
mg Hg* millions*
Hg used
/lamp
produced (kg/year)
Fluorescent tube
15
300
4,500
10
500
4,000
(double end)
Compact fluorescent
5
40
200
5
140
600
lamp (CFL - single end)
High pressure mercury
30
10
300
30
vapour
45
1,300
High-pressure sodium
25
6.4
160
30
Metal halide
60
2.7
80
25
Totals:
5,240
5,900
Source:
European Lighting Companies Federation (1997): Discharge Lamps and the
Environment, Brussels, ELC; and consultation - note * indicates approximate figures.
Recent trends in lamp usage were explored using Europroms as illustrated in Figure
3.4.
Figure 3.4: EU Trends in Lighting
Units (x10^6)
1E3
1E2
1E1
Fluorescent (double) Fluorescent (single)
Hg Vapour
Na Vapour
Discharge - other
Lamp Type
1995-Imp
1997-Imp
1999-Imp
1995-Exp
From Figure 3.4, several observations can be made:
Page 32
1997-Exp
1999-Exp
Risk & Policy Analysts
•
•
•
imports of single-ended fluorescent lamps (CFL) have increased significantly
during the late 1990s;
imports of mercury vapour lamps have increased dramatically during the late
1990s; and
in broad terms, the numbers of lamps involved are comparable (bar those for
‘other’ discharge lamps) with those presented in Table 3.16.
Closer examination of the data on mercury vapour lamps indicates that Germany is
the lead importer. One potential explanation could be the increased use of mercury
vapour headlamps (also referred to as xenon or HID headlamps) for ‘executive’ cars.
However, the mercury content of these new lamps is very low (the order of 0.5
mg/lamp) and work for DG Environment suggests that the overall usage of mercury
would be a few kilograms23 - and this has been confirmed by consultation with a
leading supplier.
By Country
Very few meaningful data on lamp use by individual country have been obtained.
3.4.4
Lifecycle & Emissions
Manufacture
Philips has over 40 lamp manufacturing sites in geographic Europe24 (i.e. including
many more countries than those within the EU) although not all produce lamps
containing mercury. Osram (Siemens) and GE Lighting have fewer production sites.
There are believed to be manufacturing sites in Belgium, France, Germany, Ireland,
Italy, Netherlands, Spain, UK and Poland. In recent years, there has been a move to
reduce costs by relocating eastwards and this has resulted in the large companies
establishing sites in Poland (Philips), Slovakia (Osram) and Hungary (GE Lighting).
Overall, given the lack of detailed data, the overall figure of 5.9 tonnes of mercury per
year in lamps will be used as a basis for subsequent calculations. 12% of this usage
(0.7t) has been assigned to the three accession countries (based on relative population
and a slightly lower consumption rate) leaving 5.2t used by the EU-15 countries.
Use
Lamps are distributed by wholesalers and retailers and are used directly by the
consumer or in the assembly of other products containing lamps.
23
24
Sander K et al. (2000): Heavy Metals in Vehicles, report prepared for DG Environment and dated 27
March 2000.
Philips presentation for the 3rd Quarter of 2001 (3Q01) available from www.investor.philips.com.
Page 33
Mercury Products - Risks to Health and the Environment
Disposal
Most European countries have initiated collection and recovery schemes for used
lamps. This may result from a desire to encourage recycling and/or from prohibitions
on landfilling such items. In the longer term, such schemes are likely to be mandatory
under the proposed WEEE Directive25.
The recovered mercury may be reused as, for example, is done by a UK company
which has a contract to recycle 1 million fluorescent tubes per year from UK
Government buildings. By contrast, in Finland, there are three plants which recover
mercury from fluorescent lights, convert it to mercuric sulphide (the same compound
found in the natural ore, cinnabar) and dispose of it to landfill as hazardous waste
(HELCOM, 2001).
Emissions to Environmental Media
As before, the estimation of mercury releases has been based on the two-stage
approach used in Sweden (KEMI, 1997):
•
•
the estimation of the distribution factors for the different pathways; and
the estimation of emission factors for the subsequent releases to air and water.
Distribution factors
The mercury in lamps cycle is presented in Figure 3.5.
5%
Breakage
Mercury Usage
in Lamps
Recovered
75%
Recycled
5%
For
Collection
100%
20%
New Lamps
Disposal of
Used Lamps
70%
5.9%
75%
Disposed to
Solid Waste
5%
Used Lamps
100%
Landfill
100% of Current Usage
c3 years
25%
95%
10%
25%
25%
Disposed
with Steel
Scrap
Atmosphere
75%
Incinerator
90%
Figure 3.5: Mercury in Lamps - Lifecycle & Emissions
25
Proposed Directive on Waste Electrical and Electronic Equipment, COM(2000) 347 dated 19 Dec
2000 as amended by COM(2001) 315 dated 28 August 2001.
Page 34
Risk & Policy Analysts
Given the expanding lamp market and typical lamp lifetimes of several years, some
accumulation might be expected. However, as indicated in Table 3.16, the average
mercury content per lamp has declined giving rise to only a marginal increase in
overall mercury usage. On this basis, no accumulation has been assumed. A small
proportion of mercury containing lamps may enter the steel scrap recovery cycle (5%)
whilst 20% may be recovered directly from collection/recycling schemes. Although a
small proportion (5%) may be broken in service, the vast majority, perhaps 70%, will
enter the solid waste disposal stream (of which 25% will be incinerated).
Emission factors
We have assumed that there is no emission of mercury to any environmental
compartment from recovered mercury. However, as the Finnish operations indicate, a
proportion of recovered mercury is then sent to landfill rather than re-entering the
secondary mercury production stream (perhaps 25% in total).
For lamps which enter landfills or are broken, most of the mercury vapour will be lost
to atmosphere. However, in fluorescent tubes (which account for most of the mercury
present in lamps), over 99% of the mercury present is embedded in the tube coating
(NEMA, 2000). For lamp breakage, it is assumed, pessimistically, that 5% of the
mercury vapour is lost to atmosphere. For landfilled lamps, it has been assumed that
5% is lost in the first year with 0.1% per year thereafter giving an annualised rate of
5.9% (over 10 years) and these values are also used for other landfill operations.
With regard to incineration (and as discussed in S3.2.4), an incinerator will emit 25%
to atmosphere with the remaining 75% (fly ash) sent to landfill. In the case of items
entering the steel scrap system, the emissions to atmosphere are likely to be relatively
higher from arc furnaces and an emission factor of 90% is used (as used by KEMI).
Summary
Based on an annual consumption of 5.9 t/year within the EU and the three accession
countries and the associated lifecycle and emissions outlined above, the overall endpoints were calculated to give the results presented in Table 3.17.
Table 3.17: Mercury in Lamps Emissions & End-Points (t/year)
Parameter
Consumption
End-points:
Amount (t/year)
5.90
Recycled
0.89
Water Course
Agricultural soil
0.00
0.00
Atmosphere
0.82
Landfill/burial
Accumulation
Check Totals:
Comment
Based on S3.4.3 above
It has been assumed that 75% of mercury
recovered from lamps is re-used
Emissions associated with incineration (34%),
scrap steel (32%) and landfill (32%)
4.20
0.00
5.90
Page 35
Mercury Products - Risks to Health and the Environment
3.5
Measuring (& Control) Equipment
3.5.1 Overview of Use
Measuring and control equipment that contains mercury includes:
•
•
•
•
temperature measurement and control (thermometers and temperature control
devices);
pressure measurement (including sphygmomanometers, barometers, manometers,
and vacuum gauges);
gyroscopes and compasses; and
other specialist uses (including sling psychrometers (for humidity measurement),
steam flow meters, pH-meter and calomel reference electrodes, gas meter pressuresafety devices, air-flow measurement devices, diffusion pumps, carburettor-adjusting
devices, sample collectors for offshore oil, Coulter counters for particle
measurements, mercury porosimeters (for pore property measurements), etc.).
Approximately 16% of all process instrumentation measures, indicates, or controls
temperature. According to a recent survey, industrial temperature measurement is
growing at a rate of 3.6% annually including both mercury and non-mercury equipment
(Montgomery, 2001).
The following paragraphs provide a brief overview of the technical characteristics of
some of the main mercury-containing measuring equipment.
Thermometers
Traditional ‘mercury in glass’ thermometers used for domestic, medical and scientific
purposes have now largely been replaced by alternatives - although mercury is still
considered to be the ‘best’ medium for max-min ‘U’ thermometers (consultation).
Furthermore, the presence of mercury cannot necessarily be excluded from industrial
temperature control devices. In closed loop temperature control systems, for example, a
device is needed to take the output from the temperature control device and convert it
into heating or cooling production. This final control device may well be a mercury
displacement relay, especially in industrial environments where heavy duty systems
require the final control device to carry high currents, rather than a common
electromechanical relay which may wear out quickly (Montgomery, 2001).
Sphygmomanometers
The mercury sphygmomanometer is still seen as the ‘gold standard’ and is often used as a
reference for determining the accuracy of automated devices. However, environmental
concerns have led to a change in attitude: in the UK, for instance, it is now generally
recommended that consideration is given to the selection of a mercury-free product when
opportunity arises (MDA, 2000).
Page 36
Risk & Policy Analysts
Barometers
A mercury barometer consists of a one metre glass tube filled with mercury. One end of
the tube is sealed while the other end of the tube is submerged in a container filled with
mercury. The changes in the height of the mercury column (and, hence, atmospheric
pressure) are measured in a scale attached to the mercury column. Although other types
of barometers exist (such as aneroid barometers), mercury ones are still widely used.
Manometers & Vacuum Gauges
An extension of the mercury barometer is the mercury U-tube manometer. In practical
terms, a mercury manometer or gauge is a glass or plastic tube, usually U-shaped
containing a certain amount of the metal that moves up and down in response to vacuum
(pressure) changes. The vacuum (pressure) is read from marks along the side of the glass
or plastic tube. In non-mercury gauges the pressure is read from a dial or a digital
display.
An example of vacuum measurement is to be found in milking systems which have
vacuum lines that remove and transport milk from cows’ udders to a bulk tank. As part
of this system, vacuum gauges measure pressure in the vacuum line. By monitoring the
gauges, farmers can be alerted to large pressure fluctuations in the vacuum line, which
can result in health problems for the cows or indicate operational inefficiencies.
Historically, such systems relied on mercury manometers but, generally, these are now
only used for calibration (Maine State (US), not dated and consultation).
Sling Psychrometers (Hygrometers)
Sling psychrometers (or hygrometers) are used in the measurement of relative humidity.
They consist of two (often mercury) thermometers mounted together, one of which has a
cloth wick over its bulb and is called a wet-bulb thermometer. When a reading is to be
taken, the wick is first dipped in water and then the instrument is whirled around. During
the whirling, the water evaporates from the wick, cooling the wet-bulb thermometer. The
temperature difference provides the basis for estimation of the relative humidity.
Coulter Counters
Coulter counters are widely used in hospital laboratories for counting and measuring the
size of microscopic particles. Some models contain mercury in the pressure gauge, onoff switch, timing count gauge, vacuum gauge, and possibly other gauges, depending on
the model (SHP, 2000).
The useful life of such equipment is usually of the order of 10 years. Data for other
equipment from the University of Minnesota show the following lifespans:
•
•
•
•
thermometer: 5 years;
barometer: 10 years;
manometers: 10 years; and
sphygmomanometer: 10 years (UMN, not dated).
Page 37
Mercury Products - Risks to Health and the Environment
3.5.2
Control Issues
At an International Level
The position of OSPAR (2000) is that the earlier PARCOM Recommendation 89/3 - which
proposed measures on the recycling of mercury contained in measuring (and control)
equipment and promoted the replacement of the metal whenever suitable alternatives
became available - is being acted upon. As such, OSPAR (2000) recommends that no
further controls are necessary but will ask the EC to consider further controls under the
Marketing and Use Directive26.
UNECE (1998) encourages consideration to be given to bans on mercury use in
thermometers and other measuring equipment. It is worth noting that, in the longer term,
although mercury will not be permitted in electrical and electronic equipment under the
proposed RoHS Directive (see S3.4.2), ‘laboratory equipment’ will be exempted (which
is likely to include some of the ‘specialist uses’ listed above) as indeed are atomic
absorption spectrophotometer lamps.
At a National Level
As noted by OSPAR and as shown in Table 3.18, some countries have already taken action
regarding the use of mercury-containing measuring equipment - with particular regard to
thermometers.
Table 3.18: Controls of Mercury in Measuring (& Control) Equipment by Country
Country
Denmark
France
Netherlands
Sweden
United
Kingdom
26
Control
Statutory Order 692 of 1998 bans the use of mercury in products,
although derogations for specialist uses in thermometers (to
2004) and other measuring equipment (until further notice) are in
place. Danish EPA may also grant exemptions. No mercury
thermometers were found in Denmark during a 1996
investigation by the authorities
Mercury thermometers banned under Order of 24 December
1998
Thermometers being phased out under 1998 Decree (see S1.2)
but exemptions for barometers (to 2005), calibration and other
specialist equipment
Manufacture and sale of mercury in thermometers and other
measuring equipment has been banned since 1993 - but with
exemptions (Ordinance 1998: 944)
Indirect regulation of mercury in medical facilities (i.e. hospitals
and doctors’ surgeries) through the COSHH Regulations (which
govern the safe use and disposal of hazardous substances in the
workplace). The cost of compliance is regarded as high which is
driving medical staff to seek non-mercury alternatives
Source & Comment
HELCOM (2001),
consultation
consultation
consultation
HELCOM (2001),
UNEP (2002)
MDA (2000),
consultation
Council Directive 76/769/EEC on the Approximation of the Laws, Regulations and Administrative
Provisions of the Member States relating to Restrictions on the Marketing and Use of Certain
Dangerous Substances and Preparations.
Page 38
Risk & Policy Analysts
3.5.3
Quantities Used
Typical Mercury Quantities by Item of Equipment
Table 3.19 summarises the average content of mercury in different types of measuring
equipment. It should be borne in mind that, in most cases, there are now non-mercury
equivalents which tend to be used in preference.
Table 3.19: Typical Quantities of Mercury Contained in Measuring Equipment
Type of Equipment
Medical thermometers
Industrial thermometers – special application thermometers
Quantity of Hg Contained (g)
0.5 - 1.5
10
Household thermometers
0.5 - 2.25
Gas debit meter
up to 25
Counter collectors
~70
Sphygmomanometers
85
Gyroscopes/compasses
15 - 400
Manometer
up to 150
Barometer
40 - 1000
Porosimeter
1,500
Environmental manometer
3,000
Pressure transmitter
8,000
Sources: ERM, 1998; WS Atkins, 1998; Environment Canada (2000); and consultation.
Previous EU Wide Estimates
WS Atkins (1998) indicates that 55 t/year are used in measuring equipment27, based on data
available from reports dating back to the mid-1990s.
Another study performed in the late 1990s was the Swedish study on mercury in products as
a source of transboundary pollution transport (KEMI, 1997). The Swedish report differs in
the respect that measuring and control equipment are considered as one group of products.
However, while this group includes thermostats (which in the other two reports - WS
Atkins (1998) and ERM (1998) - belong to the electrical control equipment group), they do
not include switches which are grouped with lighting equipment. The KEMI report uses
the widely-quoted study by Maxson et al. (1991) as a starting point and estimates that in
1997 the consumption of mercury in measuring equipment in Europe was 40% lower than
the 1989 consumption reported by Maxson et al. With a 1989 consumption of just over 115
t/year, the 1997 consumption was believed to be 70 t/year.
Table 3.20 provides an overview of the most recently documented data on the consumption
of mercury in measuring equipment.
27
Although ERM (1998) uses slightly different values, they are based on those derived by WS Atkins.
Page 39
Mercury Products - Risks to Health and the Environment
Table 3.20: Recent Estimates of EU Mercury Consumption in Measuring & Control Equipment
Product type
WS Atkins, 1998
Medical thermometers
23 t/year
Other thermometers
28 t/year
Other measuring equipment
4 t/year
Total
55 t/year
KEMI, 1997
70 t/year*
70 t/year*
*also includes thermostats and applies to all of Europe (i.e. not only EU Member States).
Current Estimates at a National Level
An indication of mercury usage in measuring (and control) equipment at a national level
is given in Table 3.21.
Table 3.21: Mercury Usage in Measurement (& Control Equipment) by Country (t/year)
Country
Commentary
Austria
Thermometers are believed to be the main source of mercury in the domestic waste
stream. However, the mercury emissions are decreasing due to continuous
replacement of mercury measuring devices with alternative ones (electronic and
gallium ones are mentioned as the preferred options) (UNEP, 2002)
Denmark
The quantity of mercury used in measuring equipment in Denmark in 1993-93 was
estimated to be 0.5 t/year (HELCOM, 2001). Consultation with the Danish EPA
suggests that current usage is 0.1-0.2 t/year. This figure is believed to be equally
divided between sphygmomanometers, laboratory equipment and chemical
reagents. The decline in the use of mercury in Denmark was rapid in the early
1990s. From the late 1990s, however, the levels of use of mercury have been
largely stabilised. As the use of mercury in thermometers has been phased out,
mercury in thermometers may account for only 10% or less of total mercury
contained in measuring equipment
Finland
In 1987, the mercury consumption in measuring equipment was estimated as 1.6
t/year (OECD, 1995). By 1996/97, this had reduced to about 300 kg/year
(consultation)
France
In 1990/92, the mercury consumption in measuring equipment was estimated as
12.5 t/year (OECD, 1995)
Germany
In 1987/90, the mercury consumption in thermometers was estimated as 11-15
t/year with a further 20 t/year used in laboratories (OECD, 1995)
Netherlands
In 1989, the mercury consumption in measuring equipment was estimated to be
less than 2.8 t/year (OECD, 1995)
Sweden
Usage has been reduced to tens of kg per year - see below
United
Usage has been reduced to around 1.6 t/year - see below
Kingdom
Poland
It has not been possible to collect data on the use of mercury in measuring
equipment in Poland. There is no central institution for registering products
introduced to the market and the Polish Ministry of Health does not hold any
information on the quantities of mercury used either. At present, there is no
regulation requiring those who manufacture or import such articles to report on the
quantities manufactured or imported. Therefore it is very difficult if not impossible
to quantify the consumption of mercury in measuring equipment in Poland (based
on information from team members in Poland)
Czech Republic Consultation suggests that the quantity of mercury to be found in thermometers and
sphygmomanometers in Czech hospitals to be 15-25t. Assuming that the annual
consumption of mercury does not exceed 10% of this, the current consumption of
mercury in the Czech Republic is assumed to be no more than 1.5-2.5 t/year
Page 40
Risk & Policy Analysts
Sweden
In 1997, the annual sales of mercury in ‘other regulated products’ was 40-50 kg. This
category includes thermometers (0.2 kg) and other measuring equipment (including
porosimeters (9 kg), switches, contacts, relays and thermostats (HELCOM, 2001). The
low consumption in these applications was the result of legislation introduced in the early
1990s (see Section 3.5.2).
Since 1997, there has been a gradual decline in the already limited use of mercury in
measuring equipment. Consultation with the Swedish authorities has revealed that in
1998 only 250-300 mercury thermometers were still in use in all Swedish hospitals
containing approximately 0.5-0.6 kg of mercury. Today, Swedish hospitals (effectively
Swedish County Councils) do not purchase mercury thermometers or
sphygmomanometers any more. It is believed that almost all mercury thermometers have
been removed from Swedish hospitals and local authorities intend to remove the few
remaining sphygmomanometers in the near future.
Mercury collection programmes in Sweden have targeted thermometers over the years in
the 1990s and about 0.69 tonnes of mercury were collected from 1992 to 1996 across the
country.
With regard to the use of mercury in sphygmomanometers, such equipment is used in
both industrial and medical facilities, although mercury-based ones are only used in
medical facilities over the last ten years. Those used are usually of small size and
intended to be placed around toes and fingers. For the time being, the use of mercury in
such equipment is exempt from mercury-related legislation, however fibre optic
technology is being developed for medical use after showing good results in industrial
applications. Consultation suggests that the estimated use of mercury in
sphygmomanometers at present is considered to be lower that 1 kg per year.
Overall, it is likely that the current mercury consumption in measuring and control
equipment will be of the order of 20-30 kg/year.
United Kingdom
Information on the use of mercury in measuring equipment in the medical sector of the
UK is fragmented. There are separate Supplying Authorities for England, Scotland,
Wales and Northern Ireland within the UK’s National Health Service (NHS). Moreover,
individual Health Trusts (hospitals) may bypass the central state authorities and purchase
equipment directly from suppliers and manufacturers.
The English branch of NHS Purchase and Supply Services confirmed that mercury use in
measuring equipment is declining. Figures for 2001 show a 50% decrease in the number
of supplied thermometers (82,320) and sphygmomanometers (1,224) compared to 2000
figures. Naturally, some hospitals may have simply abandoned the central state suppliers
and have opted for direct purchase from the manufacturers/merchants. Nevertheless, the
downward trend is clear. As already indicated, one of the prime reasons behind this
reduction is believed by consultees to be the requirements imposed by workplace safety
Page 41
Mercury Products - Risks to Health and the Environment
legislation and, in particular, the Control of Substances Hazardous to Health (COSHH)
Regulations (as mentioned in Table 3.17). All of the thermometers supplied by the
English NHS Supplies Agency in 2000 were manufactured in China. On the other hand,
around 60% of the supplied sphygmomanometers were of EU origin with the rest
originating mainly from Japan.
Information from the Northern Ireland region also indicates a significant reduction in the
number of mercury-filled units over the last 3-4 years, again mainly due to the
requirements of the COSHH Regulations. The central NHS Supplies Agency in Northern
Ireland no longer purchases mercury-filled thermometers nor sphygmomanometers although such equipment is still in use.
Other users of mercury-containing measuring equipment in the UK include laboratories,
veterinary practitioners and educational establishments. In addition, there are a number
of specialists who buy, sell, restore and repair antique barometers.
Consultation with companies manufacturing and supplying mercury-containing
measuring equipment has shown that:
•
•
•
in general, consumption of mercury has decreased over recent years and several
consultees indicated that this reduction exceeds 50% compared to 1998 figures;
the decline in the use of mercury in the UK is expected to reflect EU trends; and
a significant proportion of measuring equipment originates from non-EU countries.
The majority of clinical thermometers are imported from China, while Japanese and
Indian products are also widely distributed.
Initial estimates of the quantities of mercury used in the UK are given in Table 3.22.
Table 3.22: Estimates of Present Use of Mercury in Measuring Equipment in the UK
Estimated volume of UK
Estimated consumption
Product
Typical Hg content (g)
sales
of mercury (kg/year)
Medical
350,000 1
0.5 - 1.5
300
thermometers
Domestic and
industrial
350,000
0.5 - 10
780
thermometers
Sphygmo5,700
85
485
manometers
Barometers
875
40
35
Total for above uses:
1,600 kg
Source: Consultation with state authorities and private companies.
Note: 1) It has been assumed that the English NHS Supplies figure accounts for 80% of total NHSsupplied thermometers in the UK (England accounts for 50 million of the UK’s 60 million population).
Additionally, it has been suggested that individual UK Health Trusts (hospitals) may have purchased
collectively equal or even greater numbers of thermometers than those provided by the NHS.
Furthermore, industry consultation suggests that there is a significant additional UK market for
clinical/medical thermometers (presumably directly to consumers).
Page 42
Risk & Policy Analysts
Summary
The use of measuring equipment that contains mercury has been shown to be on the
decline, although insufficient data have been obtained to provide precise detail in most
countries - particularly in southern Europe.
In some countries, such as Denmark and Sweden, thermometers and other measuring
equipment containing mercury are not imported nor sold any more while the use of
mercury thermometers has been banned in France and the Netherlands. In the UK a
significant reduction in mercury consumption has taken place since the mid-1990s.
For the accession countries, limited information exists and the consultants have not been
notified of any legislation imposed or other trend in the use of mercury in measuring
equipment. For the Czech Republic, only an initial estimate of a consumption of 1.5 - 2.5
t/year has been reached.
Overall, a 50% reduction in the consumption figures quoted by WS Atkins in 1998 seems
a reasonable scenario. This would bring mercury consumption in measuring equipment
in the EU to about 28 t/year. For the three accession countries, a total of 5 t/year (on the
basis of Czech data) could also be suggested as reasonable.
3.5.4
Lifecycle and Emissions
Manufacture
As outlined above, many thermometers and other measuring equipment are imported,
primarily from China, India and Japan.
Within the EU, there are major manufacturers in the UK and Germany. In general, it is
believed that emissions of mercury during the manufacture of measuring equipment are
minimal and they do not contribute significantly to the total mercury load of the different
environmental compartments. This is considered in more detail in Section 5.
Product Use and Disposal
For the estimation of mercury releases from the use of mercury-containing measuring
equipment, two stages were followed based on the emission patterns indicated in the
Swedish publication (KEMI, 1997):
•
•
the estimation of the distribution factors for the different pathways; and
the estimation of emission factors for the subsequent releases to air and water.
The lifecycle and emission factors are shown in Figure 3.6 and discussed in more detail
below.
Page 43
Mercury Products - Risks to Health and the Environment
Mercury Usage
in Measuring &
Control
Equipment
New
equipment
For
Collection
25%
Disposed to
Solid Waste
80%
20%
42%
50%
5-10 years
75%
Landfill
9.5%
25%
75%
25%
Atmosphere
Incinerator
Watercourses
5%
20%
Sewer
Old
equipment
Recycled
75%
15%
Disposal of
equipment
182% of Current Usage
Recovered
100%
38%
Agricultural
20%
Breakage
10%
Figure 3.6: Mercury in Measuring & Control Equipment - Lifecycle & Emissions
Distribution factors
For collection, the Swedish report assumed a factor of 10%. Although this figure may
have been seen as high if applied to EU countries in general a few years ago, there is little
doubt that there has been a substantial increase in the awareness of the problems
presented by mercury in recent years. As a result, we have assumed a distribution factor
of 15% for the collection of manometers, barometers and sphygmomanometers which are
due to be replaced (or possibly serviced) by specialist companies and for the recovery of
mercury from industrial measuring equipment (where the bulk of mercury may be
difficult to dispose of to the solid waste stream or to the sewer).
With regard to disposal, it is assumed that 80% of mercury used will be disposed of as
solid waste (75% of which will go to landfill). Additionally, 5% of equipment is
assumed to break before it completes its useful lifetime.
Although the current ‘inputs’ to mercury in measuring equipment have reduced
significantly in recent years, typical lifetimes are of the order of 5-10 years. As a result
the quantities of mercury ‘outputs’ (to the waste and recovery streams) will be
significantly greater to reflect the greater consumption of 5-10 years ago. For the
purposes of this analysis, the consumption of 5-10 years ago will be assumed to
correspond to the earlier figure of 55 t/year derived by WS Atkins (for the mid-1990s) for
the EU together with the 5 t/year for the three accession countries (which has been
assumed to have remained relatively constant over the last few years). Five to ten years
on, these items of equipment will have come to the end of their life which would give rise
to a current ‘waste’ stream (from these now ‘old’ equipment) of 60 t/year - i.e. 182% of
the current usage rate (= 60/33).
Page 44
Risk & Policy Analysts
Emission factors
As before, it has been assumed that there is no emission of mercury to any environmental
compartment from recovered mercury and that 25% of the recovered mercury is sent to
landfill.
In the event of breakage, 10% is assumed to be lost to atmosphere, 20% to sewer, 20% is
recovered and 50% enters the solid waste stream. The above figures are based on the
assumption that the majority of mercury from broken measuring equipment is generally
disposed of to landfill (or to sewer to a lesser extent) and it is only collected and recycled
by medical and industrial facilities where proper equipment and procedures for recovery
are invariably in place.
For landfilled materials, it has been assumed that 5% is lost in the first year with 0.5% per
year thereafter giving an annualised rate of 9.5% (over 10 years). It should be noted that
in contrast to the products previously considered, much of the mercury entering the
landfill (in measuring and control equipment) will be in liquid elemental form.
With regard to incineration (and as discussed in S3.2.4), an incinerator will emit 25% to
atmosphere with the remaining 75% (fly ash) sent to landfill.
Summary
Based on an annual consumption of 33 t/year within the EU and the three accession
countries and the associated lifecycle and emissions outlined above, the overall endpoints were calculated to give the results presented in Table 3.23.
Table 3.23: Mercury in Measuring and Control Equipment Emissions & End-Points (t/year)
Parameter
Consumption
End-points:
Amount (t/year)
33.00
Recycled
7.21
Water Course
Agriculture
0.12
0.23
Atmosphere
8.08
Landfill/burial
44.43
Accumulation1
-27.06
Comment
Based on S3.5.3 above
It has been assumed that 75% of mercury
recovered from equipment is re-used
Atmospheric emissions dominated by emissions
from landfill (58%) and incineration (39%)
This represents the additional flow entering the
waste stream from ‘old’ equipment. As such,
this equates to a reduction in the overall
‘inventory’ of mercury present in measuring and
control equipment (within the EU and the three
accession countries)
Check Totals:
33.00
Note:
1) Accumulation relates to the quantity of mercury in circulation within the product rather than to
the total quantity of mercury present in the environment associated with the product.
Page 45
Mercury Products - Risks to Health and the Environment
3.6
Electrical Control and Switching Equipment
3.6.1 Overview of Use
Mercury finds various applications in the field of electrical control and switching
equipment primarily due to its excellent conductivity and its liquid state at room
temperature. Stability and reliability coupled with low corrosion potential and relatively
low price make mercury components for electrical and electronic equipment very useful
and appealing. Types of products that may contain mercury include:
•
switches, contacts and relays:
a) level (and motion) switches, which are used when switching on and off is
triggered by movement;
b) reed switches, known as circuit breakers, with their electrical contacts wetted
with mercury to provide instant closure and opening of a circuit;
c) multipoled switches, which are used in machinery with moving parts;
d) thermo switches, which are used in thermostats;
e) silent switches;
f) mechanical switches (for example, solenoids), which are used when frequent
switching is necessary; and
g) contacts which are used to close, break, transfer or guide the current to different
streams of current. A number of contacts forms a relay.
•
mercury vapour tubes and arc-rectifiers:
a) valves that produce radiation of electromagnetic nature, such as X-rays,
microwaves and radio waves, with the help of tubes containing mercury vapour;
and
b) arc-rectifiers used in industrial control equipment and welding torches (OSPAR,
2000; ERM, 1998).
The following paragraphs provide a brief overview of the technical characteristics of
some of the main mercury-containing measuring equipment.
Switches
Switches are used to control (open and close) electrical circuits. They are activated by a
change in temperature (temperature switch - i.e. a thermostat), pressure (pressure switch),
or position/motion (tilt switch, float switch).
Mercury switches frequently have far fewer components than mechanical type electrical
switches with levers, springs, pivoting electrodes, etc. The use of a hermetically sealed
container, inside which switching takes place, ensures that there is no exposed spark, thus
these devices can be safely operated in explosive atmospheres (fuel areas, hospital rooms,
coating booths, etc.) (Kahlsico, 2000).
Silent/tilt switches are small tubes with an electrical contact at one end of the tube. As
the tube tilts, mercury collects at the end where the electrodes are situated. Such switches
Page 46
Risk & Policy Analysts
are used in numerous applications such as: light switches, sump pump float controls,
automobile trunk lamps, chest freezer door lamps, and washing machine lift covers (Sass
et al., 1994). Although consultation indicates that there is a general move away from
mercury switches, they are still used widely in security applications (for example, motion
alarms).
Mercury safety valve/mercury flame sensors detect the presence of a pilot light for a gas
burner and controls the flow of gas into the burner if the pilot light is out. They find
applications in both residential and commercial equipment (e.g. ovens) (Environment
Canada, 2000).
Reed switches are small circuit controls with mercury wetted electrical contacts
(Environment Canada, 2000). Mercury is able to provide an instantaneous circuit when
the switch is closed and to permit instantaneous current interruption when the circuit is
broken. Reed switches eliminate the static produced in ordinary hard-contact-type
switches. Such equipment is used in applications where static would impair the operation
of the electronic device. Reed switches are reported to be less expensive than solid-state
alternatives and therefore are still favoured by some users. However, solid-state relays
and electro-optical switches are rapidly replacing mercury-wetted switches (Sass et al.,
1994 and consultation). Mercury-wetted reed switches are often used for applications
where electronic noise and interference from switch ‘bounce’ are a concern (Inland Ispat
Indiana Harbor et al., 2001).
Relays
Relays are devices in which low power signals (from control devices) are used to actuate
larger power operations (such as motorised valves) by opening or closing electrical
contacts in a circuit. Mercury-wetted ‘reed’ relays are used for switching of signals and
power levels since the load does not affect either contact life or performance as no solid
metal-to-metal contact occurs. They are primarily used in test, calibration and
measurement equipment where stable contact resistance over the life of the product is
necessary. They are usually produced in relatively small quantities as they are intended to
be used in specialist equipment (Inland Ispat Indiana Harbor et al., 2001).
Displacement/plunger relays are generally used for high-current, high-voltage
applications, resistance heating, welding, lighting, power supply switching, and industrial
process controllers (Inland Ispat Indiana Harbor et al., 2001).
Other Applications
The transistor, developed in 1947, has replaced most vacuum tubes and some gas-filled
tubes. Some tubes, however, have not been replaced by solid-state devices, although
inroads are being made. Examples of such applications include microwave ovens, radar
installations, X-ray machines, or mercury-arc rectifiers. Gas-filled mercury tubes use a
pool of mercury as the cold cathode pool (Sass et al., 1994).
Mercury arc rectifiers were extensively used in the past to provide DC in high power
applications, powers ranging from kilowatts up to a few megawatts, at voltages ranging
Page 47
Mercury Products - Risks to Health and the Environment
from 110V to 30kV. An arc between a pool of mercury and a metal anode which only
allows current to pass in one direction are the basic components of the rectifier. Multiple
anodes are typically used, fed from a multiple-phase transformer, with the arc jumping
from the cathode pool to each anode in sequence. There may be three, six or even twelve
transformer phases, each feeding one anode. Six and twelve-phase systems used starconnected three-phase transformers with interphase transformers between the star
common connections. Construction is either a glass bulb, cooled by an external fan or
water jacket, or a steel tank for very large units with capacities above about 500 amperes.
However, mercury arc rectifiers have now been made totally obsolete by semiconductors,
although there are a few still in service in old installations (Harrison, 2001 and
consultation).
3.6.2
Control Issues
At an International Level
PARCOM Recommendation 89/3 proposed, among others, measures on recycling mercury
used in electrical equipment; it also promoted the use of equipment not containing mercury,
where the cost of replacement is not extremely high (OSPAR, 2000). HELCOM
Recommendation 18/5 was concerned with the reduction of emissions and subsequent
pollution of mercury resulting from electrical (and light) equipment (CTC, 1999).
Reduction in mercury usage and increased recycling is also encouraged by the Aarhus
Protocol (UNECE, 1998).
Although there is a general presumption against future mercury usage in switches and
relays under the proposed RoHS Directive, many current uses will be exempted including
not only laboratory/medical equipment but also thermostats and heating regulators.
Consultation with the association representing the European manufacturers of (electrical)
domestic equipment (CECED) has shown that a relatively recent CENELEC28 safety
standard (EN 60335-1:1994/A13:1998) which gives presumption of conformity of domestic
appliances (refrigerators, washing machines, toasters, etc.) to the EEC Low Voltage
Directive (LVD) 73/23/EEC contains the following provision:
“Appliances shall not incorporate components containing liquid mercury”
(sub-clause 22.41).
Additionally, a new IEC29 standard (IEC 60355-1:2001), which is being currently
transposed to Europe, indicates that:
“Appliances shall not incorporate components, other than lamps,
containing liquid mercury” (sub-clause 22.41).
28
29
European Committee for Electrotechnical Standardisation.
International Electrotechnical Commission.
Page 48
Risk & Policy Analysts
The CECED secretariat has notified the consultants that their member associations have
confirmed that their member companies duly conform with the above standards and
therefore, mercury is no longer used in domestic electrical appliances. It should be noted
that associations from Finland, Greece, Ireland, Luxembourg and Portugal do not appear in
the list of members of CECED (although national associations of manufacturers from
Norway, Switzerland and Turkey are included) (CECED, 2002).
At a National Level
Specific controls over limiting mercury use in electrical equipment have been
implemented in various countries as indicated in Table 3.24.
Table 3.24: Controls for Mercury in Electrical Equipment by Country
Country
Denmark
Netherlands
Sweden
3.6.3
Control
Being phased out under Order 692 (see Section 1.2)
although some switches, relays and electrodes exempt
until further notice
Under the 1998 Decree (see Section 1.2), most mercury
containing electrical equipment now banned
Manufacture and sale of mercury in electrical equipment
has been banned since 1993 (with some exemptions).
Manufacture and sale of all such equipment now banned
by The Chemical Product Ordinance 1998:944
Source & Comment
HELCOM (2001) and
submission to UNEP
(2001)
consultation
HELCOM (2001) and
submission UNEP
(2001)
Quantities Used
Typical Quantities of Mercury Contained in Electrical Control Equipment
The typical quantities of mercury contained in electrical and switching equipment are
given in Table 3.25. As for measuring equipment, there are now non-mercury equivalents
in most cases, which tend to be used in preference.
Table 3.25: Typical Quantities of Mercury Contained in Electrical Control Equipment
Type of equipment
Quantity of Hg contained (g)
Modern mercury switch
0.01 - 1
Flame sensor (for gas installations)
2.5
Silent switches* (for lights)
2.6
Displacement switch and solenoids*
up to 130
Thermostat (old mercury tilt switch*)
3-6
Freezer light*
2
Washing machine* (power shut off)
up to 2
Automobile light switch*
0.7 - 1.5 (average 0.8)
Automobile ABS switch
~3
Automobile ride-control switch
1
Mercury vapour tubes and arc-rectifiers*
up to 5000 (average 250)
Sources: Inland Ispat Indiana Harbor et al., 2001; Ecology Center et al., 2001; US EPA, 2000a; and
consultation.
Note: * indicates items that are now believed to be obsolete.
Page 49
Mercury Products - Risks to Health and the Environment
Previous EU Wide Estimates
The ERM (1998) and WS Atkins (1998) reports provide slightly differing figures of
mercury consumption in electrical control equipment. ERM indicates a consumption of
24 t/year, while WS Atkins assumes a 29 t/year consumption. The KEMI report (1997)
has incorporated electrical control equipment into electrical and lighting equipment and
has considered thermostats as part of the measuring equipment group, hence a
comparison of the Swedish estimates with those made by the former two reports is
unrealistic. Additionally the estimated Swedish report figure of >230 t/year of mercury
consumption in electrical lighting and control equipment in 1997 is applicable to all
Europe (i.e. both EU and non-EU countries).
Current Markets
The European markets for electrical control and switching equipment are large. Those for
switches and relays are each of the order of a billion euros per year (EPIA, 2002 & VDC,
2000). Of course, these markets cover the full range of equipment (ranging from simple
mechanical switches to solid-state relays) and it is unlikely that the mercury containing
equipment30 market accounts for more than 1% (consultation).
Despite numerous approaches to companies and trade associations, very little definitive
information has been provided. Although there remains a considerable degree of
uncertainty, it would appear that:
•
•
•
•
•
the current EU mercury switch market is of the order of five to ten million switches
per year - split between those with up to one gramme of mercury per switch and
smaller switches with the order of 0.1 gramme of mercury per switch;
the current mercury consumption is perhaps several tonnes of mercury per year;
the mercury switch market has declined by about 25% in recent years as customers
have moved to non-mercury alternatives;
although there are manufacturing facilities in Belgium and Germany (and possibly
elsewhere), there are many imports, primarily from the US; and
mercury vapour tubes and arc rectifiers are no longer supplied.
Against this background, the current consumption of mercury-containing equipment will
be taken, perhaps conservatively, as 8 t/year for the EU with a further 1 t/year in the three
accession countries (i.e. 12% of EU figure). Although these figures are uncertain, these
findings would suggest that the figures advanced in the earlier reports (as outlined above)
were unduly conservative.
Current Estimates at a National Level
An indication of mercury usage in electrical control and switching equipment at a
national level is given below.
30
Note that a simple modern mercury switch sells for about one euro.
Page 50
Risk & Policy Analysts
Denmark
The 1992-93 consumption of mercury in electrical control and switching equipment in
Denmark was estimated to be 0.2-0.4 t/year with a decreasing trend given that in 1990 the
respective figures were 0.3-1.6 t/year.
According to the Danish EPA, electrical switches and relays have been banned since 1
July 1994. The use of mercury is only allowed in small film-wetted switches. A realistic
estimate of the present situation in Denmark indicates that the use of mercury in electrical
components is only marginal.
Sweden
Swedish legislation which came into force in 1993 prohibits the manufacture, import and
sale of mercury containing electrical components. Therefore, the consumption of mercury
in Sweden is believed to be negligible. However, consultation with the Swedish authorities
yielded information on the quantities of mercury which are still present in Sweden as
illustrated in Table 3.26.
Table 3.26: Mercury Stored in Electrical Components in Sweden (2002 estimates)
Type of equipment
Electrical and technical products stored in industry
Estimated Hg quantity (tonnes)
1
Electronics built into products (dealt with by dismantlers)
General household uses (heating oil-level indicators, doorbells, other
unusual applications) 2
Rectifiers for power sea cables
Mercury components in cars
White goods switches
Source: Consultation
Notes: 1) also includes thermometers and other measuring devices
2) also includes indoor/outdoor thermometers and barometers
27 - 32
2-3
1-2
1.8
1
0.3
It is worth noting that European carmakers have reportedly phased-out mercury light
switches in automobiles since 1992 in order to meet the Swedish ban on vehicles
containing mercury (Ecology Center et al., 2001 and consultation). Furthermore, the EU
ELV Directive bans the use of mercury in vehicles from 1 July 200331.
United Kingdom
Consultation suggests that the UK market for mercury switches is of the order of a
million switches per year, which represents a significant portion of the EU market. The
leading UK supplier imports the ‘basic’ switches from the US which are then
incorporated into further casings and/or mountings for resale.
31
Although, the presence of small amounts of mercury in HID (xenon) headlamps (as discussed in S3.4.3)
now being fitted to some Swedish cars will be exempt.
Page 51
Mercury Products - Risks to Health and the Environment
3.6.4
Lifecycle and Emissions
Similarly to measuring equipment, the basis for emissions estimates for mercury
contained in switching and electrical control equipment is the KEMI (1997) report and
the WS Atkins 1998 report (the latter for product manufacture only).
Product Manufacture
In general, it is believed that emissions of mercury during the manufacture of switching
and electrical control equipment are limited. This is discussed further in Section 5.
Product Use and Disposal
For the estimation of mercury releases from the use of mercury-containing switching and
electrical control equipment, two stages were followed:
•
•
the estimation of the distribution factors for the different pathways; and
the estimation of emission factors for the subsequent releases to air and water.
Distribution Factors
The lifetime of mercury switches and other mercury containing electrical control
equipment could extend to decades. In practice, the lifetime will be determined by that of
the item within which the equipment is contained - which is more likely to be of the order
of 5 - 10 years. For the purposes of this assessment, it will be assumed that the quantity
of mercury requiring disposal will be 150% of the current usage - i.e. 13.5 t/year which is
equivalent to current usage (9 t/year) plus 50% additional inputs from ‘old’ equipment.
The 1997 Swedish report assumed an arbitrary 10% distribution factor for re-collection of
mercury-containing switches and electrical equipment. Switches and other mercurycontaining electrical equipment are rarely collected for recycling when they are replaced
by owners but are more likely to end up in the recycling stream if replaced by
professionals. Additionally, some switches and thermostats and especially vapour tubes
and arc-rectifiers are bulky items that cannot simply be disposed of to the solid waste
stream as they are. As for measuring equipment, a factor of 15% will be used here to
accommodate more recent practices in the recycling of hazardous substances like mercury
from electrical equipment.
An additional 5% factor is used to account for the quantities of mercury in switches and
other equipment which are being recovered by the steel scrap industry and used in steel
production.
Physical breakage is a very infrequent occurrence with respect to mercury switching and
electrical control equipment. Such articles may fail to perform but they seldom break and
release their mercury contents. Hence, ‘breakage’ emissions will be negligible.
The remaining 80% of the mercury has been assumed to enter the solid waste stream.
Page 52
Risk & Policy Analysts
The lifecycle (and emission factors) are shown in Figure 3.7.
Mercury Usage
in Electrical
Control &
Switching
Equipment
Breakage
(negligible)
Recovered
c0%
15%
New
equipment
25%
For
Collection
Landfill
Disposed to
Solid Waste
Old
equipment
9.5%
75%
80%
150% of Current Usage
Recycled
100%
Disposal of
equipment
5-10 years
75%
5%
25%
25%
Disposed
with Steel
Scrap
Atmosphere
75%
10%
Incinerator
90%
Figure 3.7: Mercury in Electrical Control and Switching Equipment - Lifecycle &
Emissions
Emission factors
As before, it has been assumed that there is no emission of mercury to any environmental
compartment from recovered mercury and that 25% of the recovered mercury is sent to
landfill.
For landfilled materials, it has been assumed - as for measuring and control equipment
considered previously - that 5% is lost to atmosphere in the first year with 0.5% per year
thereafter giving an annualised rate of 9.5% (over 10 years).
With regard to incineration (and as discussed in S3.2.4), an incinerator will emit 25% to
atmosphere with the remaining 75% (fly ash) sent to landfill.
In the case of items entering the steel scrap system, the emissions to atmosphere are likely
to be relatively higher from arc furnaces and an emission factor of 90% is used (as for
lamps - see S3.4.4).
Page 53
Mercury Products - Risks to Health and the Environment
Summary
Based on an annual consumption of 9 t/year within the EU and the three accession
countries and the associated lifecycle and emissions outlined above, the overall endpoints were calculated to give the results presented in Table 3.27.
Table 3.27: Mercury in Electrical Control and Switching Equipment
Emissions & End-Points (t/year)
Parameter
Consumption
End-points:
Amount (t/year)
9.00
Recycled
1.52
Water Course
Agriculture
0.00
0.00
Atmosphere
2.30
Landfill/burial
9.68
Accumulation1
Check Totals:
-4.50
Comment
Based on S3.6.3 above
It has been assumed that 75% of mercury
recovered from equipment is re-used
Atmospheric emissions associated with
emissions from landfill (44%), incineration
(29%), and scrap steel processing (26%)
This represents the additional flow entering the
waste stream from ‘old’ equipment. As such,
this equates to a reduction in the overall
‘inventory’ of mercury present in electrical
control and switching equipment (within the EU
and the three accession countries)
9.00
Note:
1) Accumulation relates to the quantity of mercury in circulation within the product rather than to
the total quantity of mercury present in the environment associated with the product.
Page 54
Risk & Policy Analysts
3.7
Other Products
3.7.1 Overview
It is claimed that mercury is (or has been) used in a variety of other products including
‘executive toys’, pads to absorb rifle recoil, arm/leg weight bands, golf balls, etc. Other
uses include cosmetic and pharmaceutical products - although, as indicated in S3.1.6, the
latter are beyond the scope of this study.
During the course of this study, the most comprehensive listing of mercury containing
products found was one prepared for the Minnesota Pollution Control Agency which is
reproduced as Annex 3. Although most of the products listed are covered in the
preceding sub-sections, the following paragraphs outline some of the other uses of
mercury which cannot be readily classified under the main usage categories which have
been examined in this report. Only limited information is available on these uses and
little or no information on the consumption of mercury has been obtained.
3.7.2
Golf Balls
There is often anecdotal evidence that mercury is used in golf balls. However, research
indicates that although mercury filled centres were experimented with in the early 1900s,
there have been no golf balls with mercury centres on the market for many years32 - and
this has been confirmed by consultation with a number of well known golf ball
manufacturers.
3.7.3 Pigments
Natural (and synthetic) cinnabar (mercuric sulphide) has been used as the red pigment,
vermilion, for thousands of years (in China, at least). In Europe, the use of vermilion was
a vital part of paintings by Monet, Rembrandt and Titian. Given the concerns over health
and the environment associated with the use of mercury and its compounds in recent
decades, its commercial use has practically disappeared.
However, although becoming increasingly hard to find, artists in Europe can still buy
vermilion pigment (some of which is still natural cinnabar imported from China).
Historically, mercury pigments have been used in plastics (as indicated in Annex 3).
Although it would appear that the French company specifically identified still sells
cadmium pigments, there is no indication that mercury pigments are sold.
32
See, for example, www.erupegolf.com
Page 55
Mercury Products - Risks to Health and the Environment
3.7.4
Childrens’ Shoes
Many references33 may be found to the use of mercury in shoes which have flashing lights
- mainly designed for children. However, few of these references provide the requisite
detail to permit informed comment. It would appear that although some of the earliest
versions of these shoes (dating from the early 1990s) did incorporate a liquid mercury tilt
switch, these were soon replaced with a non-mercury pressure switch. The lights tend to
be powered by lithium (non-mercury) button cells.
3.7.5
Lighthouses
Lighthouses around the world rely on rotating a large lens assembly, weighing up to a few
tonnes, every 10 seconds or so. Traditionally, the lens assembly floats in a bath of a few
hundred kilograms of mercury. Although there is anecdotal evidence that the presence of
the mercury may have contributed to depression and, even, suicide amongst lighthouse
personnel, most lighthouses are no longer manned.
Although some such arrangements have been replaced with non-mercury alternatives,
others retain their mercury baths. No estimate of the number of lighthouses still using
mercury baths in the EU has been derived although the Swedish authorities estimate that
there is 1t in use in Swedish lighthouses (consultation).
3.7.6
Gold Mining
Mercury may be used to extract gold from crushed ore through the formation of an
amalgam. The amalgam is then decomposed by the addition of nitric acid or, more
simply, by heating. Although this is a significant use of mercury which accounts for 510% of the global mercury supply (as suggested by Vonkemann, 2000), gold mining
within the EU is minimal.
In South America, there is widespread artisanal gold mining in which mercury is used
and released to the environment. Of note is that one of the countries involved is French
Guiana (or Guyane) which is an overseas department of France. Current gold production
is estimated to be about 3 t/year (of up to 200 t/year for South America as a whole) and it
is estimated that for each tonne of gold produced, one tonne of mercury is released to the
environment (representing up to 50% of the mercury used in the process) (Veiga, 1997).
On this basis, mining in French Guiana could result in the emission of around 3 t/year of
mercury to the environment.
3.7.7 The Use of Mercury in Medicines
Although technically outside the scope of this study, this section has been included to
indicate the relative usage of mercury in medicines. Studies undertaken by the US Food
and Drug Administration (FDA) have shown that several ophthalmic, otic, injectable and
topical drugs and vaccines for humans may contain mercury compounds such as
33
See, for example, http://sneakers.pai.com/lightup.htm.
Page 56
Risk & Policy Analysts
thiomersal (thimerosal in the US), phenylmercuric acetate, and phenylmercuric nitrate.
Furthermore, a large variety of mercury compounds was identified in human and animal
homeopathic products and in traditional medicine products (such as herbal pills from
China). It was estimated that about 1,000 homeopathic products in the US market may
contain small amounts of mercury. The mercury compound content of the above
products varied from 1 ppm to more than 100 ppm and the total quantity of those
compounds used in all products was estimated to be approximately 75-80 kg/year (FDA,
2001).
In Ireland, the Health and Safety Authority identified a plant which uses mercury as a
preservative in eye care products. Recent mercury consumption has been about 5 kg/year
with emissions of less than 0.5 g/year to waste water (emission factor: <0.01%) and zero
emissions to other environmental media (Irish submission to UNEP, 2001).
Thiomersal
Mercury is used in medicinal products, mainly in the form of thiomersal. The substance
finds applications particularly in vaccines either as a preservative to avoid microbial
contamination due to repeated withdrawal of doses from a container or for other reasons.
In Sweden, it has been calculated that by taking the yearly consumption of these vaccines
and a mercury concentration of 25 µg per dose, the total amount used is around 20 grams
per year (Swedish submission to UNEP, 2001).
A thorough toxicological assessment of the use and potential risk of thiomersal, when
administered to humans, has been made by the European Agency for the Evaluation of
Medicinal Products (EMEA). The assessment concluded that there was no risk of acute
toxic reactions in the doses used. However, a risk of sensitisation was identified and all
products containing thiomersal should carry a warning statement in the catalogue text.
Furthermore, the EMEA recommends the use of thiomersal-free vaccines for young
children (EMEA, 2000).
3.7.8 Mercury in Cosmetic Products
Mercury and its compounds are not permitted in cosmetics marketed within the EU34,
although trace amounts are permitted in preservatives (as discussed above) for eye makeup and eye make-up remover35.
A study undertaken by the Danish National Environmental Research Institute (NERI) in
1999 found that several brands of soap and cream with significant levels of mercury are
sold in Tanzania. These products are used to make skin and hair lighter in colour and
their origin was found to be the EU. Soaps usually contain 1-3% mercury iodide, while
the creams contain 1-10% mercuric ammonium.
34
35
Council Directive 76/768/EEC of 27 July 1976 relating to cosmetic products.
Eighth Commission Directive 86/1999/EEC of 26 March 1986 adapting Council Directive 76/768/EEC to
technical progress permits up to 0.007% (70ppm) of mercury as thiomersal or phenylmercuric salts in eye
products.
Page 57
Mercury Products - Risks to Health and the Environment
The distribution of mercury-containing cosmetics products is prohibited in the EU, North
America and many African countries. In Tanzania, the import of soap containing
mercury is forbidden although large volumes of such products are smuggled into the
country and are used for the bleaching of skin and hair. During this study, three brands of
soap and two brands of cream were found in Tanzanian markets. All three soaps were
marketed as antiseptics and had a declared concentration of 2% mercury iodide (or 0.88%
mercury). On the other hand, the two creams claimed to produce a lighter skin colour and
contained hydroquinone, allantoine and vitamins. Analyses revealed that the three soaps
contained on average 0.69% mercury (i.e. slightly less than labelled), while the suspicions
about the presence of mercury in the two creams were not confirmed. Four of the
samples belong to products made in the UK while the fifth was of Italian origin (NERI,
1999).
The Danish report indicates that such products can also be found in areas of the EU. By
way of example, the Danish EPA issued a press release on 22 March 2000 according to
which seven brands of mercury-containing soap had been found in shops in Copenhagen.
At the time it was believed that the products were made in the UK and Spain and were
sold to the Danish companies either directly or through dealers in France (Danish EPA,
2000a). The soaps were intended to be used as bleaching agents and contained 1-3%
mercury iodide. Later that year (in December 2000), the Danish authorities issued a new
press release according to which five shops in Copenhagen had been notified to the police
for marketing soaps containing mercury. New brands of such soaps were identified (apart
from those known since Spring 2000) and their origin was Italy and Spain (Danish EPA,
2000b).
An Irish company is reported to produce mercuric iodine soap. The company uses 95
t/year of potassium mercuric iodine solution which is equivalent to 17.2 t/year of
mercury. No effluent discharges of air emissions were detected during on-site
investigations by the Irish authorities while solid waste is forwarded for disposal off the
company’s site (Irish submission to UNEP, 2001).
In summary, although the sale of mercury soap is prohibited in the EU (as it is a cosmetic
product), its manufacture for export outside the EU is not. However, it would appear that
some of these products are sold within the EU (perhaps after being exported to and then
re-imported from a non-EU country).
3.7.9 Mercury in Chemical Agents
Another significant ‘other’ use of mercury is the use of mercury containing chemicals. In
the laboratory, the standard COD ‘dichromate’ test involves the use of mercuric sulphate
to suppress chloride interference (if chloride levels are high). It is worth adding that, in
light of concerns over mercury, one of the leading suppliers now offers an alternative
manganese III method. In the chemical industry, mercury compounds are used as
catalysts for the production of, for example, vinyl chloride and urethane foams. In the
fireworks and explosives industry, mercuric fulminate is sometimes used as a detonator.
Page 58
Risk & Policy Analysts
The Swedish government is considering an amendment of Ordinance 1998:944, by which
the use of mercury in chemicals for analysis and reagents would be banned from 1
January 2004, since earlier information campaigns for phasing out reagents such as those
used in the determination of COD in laboratories have been unsuccessful (Swedish
submission to UNEP, 2001).
Mercury in Hospital Laboratory Reagents
Two tissue fixatives used in medical laboratories contain significant amounts of mercury:
Zanker’s solution and B5. While the former contains 72 g of mercury per litre, the latter
contains 37 g of mercury per litre. These reagents can be substituted in many cases by
other fixatives but not in all. Different fixatives have different fixative and staining
properties and require the preparation of different specimens, therefore practitioners may
still show some preference to mercury-containing fixatives for reasons of convenience
(Torke, 1994).
3.7.10 Other Mercury-containing Hospital Equipment
Significant amounts of mercury may be found in Bougie tubes and Canter tubes used by
medical practitioners in hospitals. The Bougie tube is a mercury weighted instrument
that is used to ‘pound’ an opening in the oesophagus when there are cancerous growths or
other obstructions. The Canter tube is a tube almost 2 meters long which is filled with
mercury and is inserted down the patient’s gastrointestinal tract. Information from the
US indicates that non-mercury alternatives are now available for both these devices
(Torke, 1994).
3.7.11 The Use of Mercury as an Archery Stabiliser
Stabilisers aim to provide a smooth feeling of the bow, to reduce the possibility of torque
affecting arrow flight and to reduce vibration during and after shots. Mercury-filled rods
were introduced as anti-torque stabilisers in the late 1960s along with other liquids although the use of mercury was never popular in Europe (consultation).
Later, liquids were replaced by foam and sand. Many modern bows use lightweight, stiff
aluminium or carbon rods with rubber mountings which are fitted between the rod and
the end-weights in order to dampen vibration. The most up-to-date stabilising system
consists of multiple thin rods with a moveable weight which allows the archer to tune the
stabiliser (Elliot, 2000).
3.7.12 Rifle Recoil
Recoil suppression systems in rifles and shotguns usually incorporate a lead or steel
weight mounted on springs to reduce recoil. There are, however, alternative systems
which use liquid mercury (170g or more per gun) which are widely marketed in the US.
Page 59
Mercury Products - Risks to Health and the Environment
3.7.13 Mercury-containing Lamps in LCD Monitors
Liquid Crystal Displays contain mercury due to the presence of back lamps that contain
the metal. The typical number of back lamps in a portable (laptop) computer is 2 but a 38
cm (15 inch) LCD monitor will normally contain 4 lamps and an even larger monitor
could contain 6, 8 or more lamps in order for the appropriate levels of brightness to be
maintained. The mercury content of an LCD back light was reported in 2001 to be
between 2.5 and 3.5 mg. It is worth noting that the updated EC eco-label criteria for
personal computers which were issued on 22 August 2001 require that the background
lighting of LCD monitors should not contain more than 3 mg of mercury per lamp on
average (Commission Decision 2001/686/EC) (AEA Technology, 2001).
Screens using organic light emitting diodes could replace mercury-containing LCD
monitors, however their use is considered more feasible in mobile phones at the moment
rather than computers. It is expected that this technology will be introduced to portable
computers by the year 2004.
Within the EU, laptop sales are of the order of 7 million per year and account for about
20% of personal computer sales. This would give a mercury consumption of:
7 million laptops x 4 lamps/laptop x 3 mg/lamp = 84 kg/year
With regard to televisions (for which the introduction of an EC eco-label is currently
under way), LCD technology is also applicable - although CRT displays are to be found
in the great majority of equipment. From an environmental point of view, LCD
technology is superior in that it allows for the mercury back lights to be easily separated
from the display and be recycled (AEA Technology, 2002).
It should be noted that the contribution of such lights is probably included in the overall
‘lamp’ figures presented in Section 3.4.
3.7.14 Summary
From the preceding discussion, it is clear that mercury has been or may continue to be
used in a diverse range of products. Although determining the quantities involved is very
uncertain, Table 3.28 provides some preliminary estimates.
Table 3.28: Mercury Usage in Other Products
Type of product
Estimated Mercury Usage in the EU
Golf balls
Negligible
Pigments
Children’s shoes
Lighthouses
Page 60
Perhaps up to 50 kg/year
Negligible (as most shoes containing mercury will have been disposed
of)
Number of lighthouses with mercury baths not known but quantity of
mercury in use could be of the order of 10-15 tonnes. The associated
mercury consumption will be low, perhaps up to 100 kg/year
Risk & Policy Analysts
Table 3.28: Mercury Usage in Other Products
Type of product
Estimated Mercury Usage in the EU
Chemical agents and hospital
laboratory reagents
Mercury usage (in French Guiana) likely to be 6 t/year or more with 3
t/year emitted to the environment
Based on US data of 75 - 80 kg/year, the EU consumption is not
expected to exceed 100 kg/year as a worst case scenario
From the Irish data of 17.2 t/year and given that several UK, Italian
and Spanish companies are active in the business (given the large
African market), a consumption of 50 t/year is possible, although
some UK companies deny that they manufacture soap in the UK.
However, the use of such products (and associated emissions) will
tend to be outside the EU.
Perhaps of the order of 100-200 kg/year (note that agents are
gradually being replaced with non-mercury alternatives)
Archery stabiliser
Negligible
Rifle recoil
Probably, small to negligible use in the EU
Gold mining
Medicines
Cosmetic products
LCD monitors
All the above
80-100 kg/year in laptops but may well have already been accounted
for in ‘lamps’
The order of 50 t/year within the EU with, perhaps, a further 5
t/year in the three accession countries
Page 61
Mercury Products - Risks to Health and the Environment
3.8
Summary of Product Usage and Emissions
The overall consumption of mercury in the products under study is of the order of 200
t/year within the EU and the three accession countries being considered (Czech Republic,
Poland and Slovenia).
Although much of the mercury is recovered for re-use from the disposal of mercury
containing products, most of the mercury will end up in landfills. Since mercury usage is
generally declining, the quantities of mercury entering the waste stream are now greater
than those entering into product use. This, in turn, is leading to a reduction in the total
‘inventory’ of mercury within the products in circulation. However, since mercury
cannot be simply destroyed, there will continue to be a mercury build up in the
environment - most noticeably in landfills.
The results of the analyses presented in the previous sub-sections are summarised in
Table 3.29
Table 3.29: Mercury Usage in Products within EU and Three Accession Countries1
Current
End-points and Quantities (t/year)
Product
Usage
Re-use
Air
Water
Soil
Landfill
(t/year)
Change
in Inv Q2
(t/year)
Dental
Amalgam
90.0
59.8
6.5
1.4
2.6
43.5
-23.8
Batteries
9.0
1.35
0.55
0
0
7.1
0
Lighting
5.9
0.9
0.8
0
0
4.2
0
33.0
7.2
8.1
0.1
0.2
44.4
-27.1
9.0
1.5
2.3
0
0
9.7
-4.5
146.9
70.7
18.3
1.5
2.8
108.9
-55.3
Measuring
Equipment
Electrical
Equipment
All the
above
Other
Products3
c55
not determined
Notes:
1) Czech Republic, Poland and Slovenia.
2) Inv Q represents ‘inventory quantity’ - i.e. the quantity of mercury in circulation within products.
3) Likely to dominated by cosmetic products (see S3.7.8 and Table 3.28).
Page 62
Risk & Policy Analysts
4.
OVERVIEW OF EXPOSURE TO MERCURY
4.1
Background to Discussion
This section provides a general discussion of the sources of environmental and human
exposure to mercury. It is intended to provide an overview of the total exposure to
mercury, from all sources. Section 5 then provides an estimate of the environmental
exposure and exposure of humans via the environment for the uses of concern for this
study. The remainder of this section is structured as follows:
•
•
•
•
consideration is given first to environmental releases, both anthropogenic and
natural with quantitative data presented on releases, based on a review of recent
literature;
fate and behaviour of mercury in the environment is then discussed, with
information presented on speciation in the environment and transport within and
between environmental media;
a summary of relevant data on environmental concentrations is provided together
with an indication of changes over time. This provides a basis on which to put the
estimated exposure for the uses of concern into context; and
finally, an overview of human exposure - both occupation and non-occupational is given.
4.2
Releases of Mercury to the Environment
4.2.1
Introduction
The natural releases and anthropogenic emissions of mercury have been investigated
over the years and estimates on the relevant figures have been reached. However,
these estimates are under constant revision as more monitoring data become available,
as knowledge of the complex lifecycle of mercury improves and as additional up-todate information is collected. As will be shown in the next paragraphs, while
anthropogenic emissions of mercury have reduced in real terms due to increased
awareness, controls and regulation as well as advances in technology, the contribution
of anthropogenic sources to the global mercury load seems to have increased recently.
The underlying reason is that there has been a dramatic fall in the estimates of the
contribution of natural sources. This does not mean that the actual natural releases
have been reduced, but instead, reflects the realisation by scientists that earlier
estimates had probably been unduly conservative.
4.2.2 Natural Releases of Mercury into the Environment
There is a variety of natural sources of mercury released into the environment,
including forest fires, volcanoes, evaporation from soil or water and volcanoes,
amongst others. As detailed by UNEP (2002), historical deposition of mercury from
anthropogenic sources contributes significantly to global mercury cycling, making
estimation of natural sources problematic. As indicated above, estimates of natural
Page 63
Mercury Products - Risks to Health and the Environment
emissions (as opposed to the emissions themselves) reported in the literature have
declined in recent years. For example:
•
•
•
•
Jones and Slotten (1996) report global estimates from the 1980s for atmospheric
emissions of 60 t/year from volcanic activity, 1-2,000 t/year from other
continental sources (crustal degassing, forest fires and biological mobilisation),
2,000 t/year from the world’s oceans and 200 t/year as fluvial input;
Lindquist et al. (1991) estimate total global natural emissions to be of the order of
3,000 t/year;
more recent emissions estimates are provided by Mason et al. (1994) who reported
global natural emissions of 1,050 t/year; and
Within the EU, the most recent estimate for natural emissions is of the order of
200 t/year (EC, 2001b).
Most ‘natural’ emissions are in elemental form - although those from volcanoes tend
to be mercuric oxide. In broad terms the emissions from the oceans are roughly equal
to the atmospheric deposition over the oceans (based on Lee et al., 2000)
4.2.3 Anthropogenic Releases of Mercury into the Environment
There are a number of sources of anthropogenic mercury emissions into the
environment. Until relatively recently, it was considered that the anthropogenic
emissions were of a similar order to ‘natural’ emissions. However, it has recently
been suggested that anthropogenic emissions account for 60-80% of the total mercury
emissions (EC, 2001b and UNEP, 2002). Within Europe (both EU and non-EU
countries), it has been estimated that the total anthropogenic emissions have reduced
from 860 t/year in 1980 to about 340 t/year by 1995 due, largely, to a combination of
improved emission control measures and changes in industrial processes (EC, 2001b).
At a global level, recent estimates of anthropogenic releases are of the order of several
thousand tonnes (UNEP, 2002).
Apart from those associated with the production and use of mercury-containing
products which are the focus of this study (as discussed in Section 3), other
anthropogenic sources of mercury emissions include:
•
36
combustion of fossil fuels - mercury is a natural component of both coal and
oil at concentrations typically of the order of 0.1 to 1 ppm and 0.01 to 1 ppm
respectively. The EU consumes about 600 and 300 million t/year of oil and
coal respectively (mainly in power stations36). Taking (geometric) mean
mercury concentrations of 0.3 ppm for coal and 0.1 ppm for oil would lead to
potential emissions of the order of 150 t/year.
It must be emphasised that the mercury emissions from oil-fired power stations are much lower than
those from coal-fired power stations. This is because the fuel oil used in power stations has a very low
mercury content. In other words, the mercury emissions will be associated with the processing of the
crude oil in the refineries and combustion of other products rather than with the combustion of the fuel
oil. The behaviour of mercury in oil processing is complex as described in NRM (2001).
Page 64
Risk & Policy Analysts
•
•
•
chlor-alkali plants - only four countries out of those of interest (Denmark,
Luxembourg, Ireland and Slovenia) do not have chlor-alkali plants using
mercury cells - with Germany having by far the greatest number. The total
quantity of mercury involved is of the order of 10-15,000t (Vonkeman, 2000
and ERM, 2000). Within the EU, the 1999 mercury consumption in chloralkali plants was of the order of 150 t/year (based on OSPAR, 2001 and
Vonkeman, 2000). The associated emissions (mainly to atmosphere) have
been steadily reducing over the past 20 years to less than 10 t/year in 2000
(Eurochlor, 2001). However, significant quantities of mercury, perhaps 40
t/year, are unaccounted for37 (OSPAR, 2001);
other industrial processes - with particular reference to pig iron and steel
production and cement production which together generated estimated (EC,
2001b) emission of around 35 t in 1995 across Europe (i.e. both EU and nonEU countries); and
(old) submarine ballast tanks - mercury used to be used in submarine ballast
tanks and was a major source of near-shore marine contamination. There are a
number of lost submarines which are rumoured to still contain significant
amounts of mercury.
Mercury also enters the environment through the disposal of solid and liquid wastes,
some of which will be associated with the production and use of mercury-containing
products (as indicated in Section 3).
4.3
Fate and Behaviour in the Environment
4.3.1 Speciation and Transformation of Mercury in the Environment
Overview
Mercury is a liquid under standard conditions but it occurs in a variety of different
forms in the environment, with transformation processes between forms depending
upon the conditions in the environmental medium in question. These forms include
elemental mercury, mercuric (Hg2+) compounds and organomercurials (particularly
methyl and dimethyl mercury). The main source of organic mercury compounds is a
microbial conversion of inorganic mercury entering surface water. In the air,
dimethyl mercury, which is volatile, readily dissociates (by photolysis) to form
methyl mercury. Methyl mercury is stable and bio-accumulates - particularly in
aquatic organisms - and is the most toxic form of mercury.
Mercury in the Atmosphere
In the atmosphere, the main form present - and the majority of that emitted - is
elemental mercury. Elemental mercury has a half-life in the atmosphere of several
37
Similar situations are found elsewhere. For example, detailed figures for 1996 determined a mercury
consumption in US chlor-alkali plants of 150 tonnes, emissions of 8 tonnes and 101 tonnes
unaccounted for (Sznopek & Goonan, 2000).
Page 65
Mercury Products - Risks to Health and the Environment
months to a year. Due to its relatively long lifetime in the atmosphere, elemental
mercury in the vapour phase can be transported over large distances.
Whilst monovalent mercury is not found in the atmosphere, bivalent mercury may be
present in organic form (methyl or dimethyl mercury) or inorganic form (for example,
mercuric chloride). Bivalent forms may be attached to particulate matter (especially
in the sub-micron range) and may result from (slow) oxidation of elemental gaseous
mercury. The bivalent forms have a much shorter half-life in the atmosphere (days)
as they undergo both dry and wet deposition (Lee et al., 2001).
Methyl mercury may constitute a few percent of the atmospheric mercury - but its
source and associated chemistry have yet to be fully demonstrated38.
Mercury in the Aquatic and Terrestrial Environments
Elemental mercury is oxidised in water to Hg2+ in the presence of oxygen, a process
enhanced by the presence of organic substances in the aquatic environment. Bivalent
mercury can react in a number of ways in the aquatic environment, such as:
•
•
•
formation of HgS in anaerobic conditions in the presence of hydrogen sulphide;
reaction to form elemental mercury, which is then readily lost to the atmosphere,
thought to be a key process in natural loss to air through degassing39; and
reaction to form methyl mercury via biochemical processes (WHO, 1976).
Methyl mercury is key species of interest for the current study, due to its greater
potential for entry into food chains and subsequent bioconcentration, as compared to
elemental or inorganic mercury. It is also the most toxic form of mercury. Methyl
mercury is formed naturally in the environment, mainly in the freshwater and marine
sediments, although it may also be formed in the water column (WHO, 1990). A
wide range of microorganisms is capable of methylating mercury, including some soil
organisms in addition to those in the aquatic environment.
In the terrestrial environment, the majority of mercury present is in inorganic form
with relatively less organic mercury than in the aquatic environment.
4.3.2 Uptake of Mercury by Organisms
In the aquatic environment, mercury is taken up readily by invertebrates and by fish,
with accumulation in the former being greater than in the latter. Organic mercury and
salts of bivalent mercury can be readily taken up by organisms in the aquatic and
terrestrial environment. Generally, organic mercury is taken up more readily than
inorganic mercury and is also released more slowly.
38
39
One suggested source is landfills, see Lindberg SE et al. (2001): Methylated Mercury Species in
Municipal Landfill Gas Sampled in Florida, USA, Atmospheric Environment, 35(Aug):4001.
Elemental mercury may also be formed from organomercurial compounds, through chemical or
enzymatic cleavage of the carbon-mercury bond.
Page 66
Risk & Policy Analysts
Values for bioconcentration factors40 reported in the recent literature range up to
several thousand and several tens of thousands for inorganic and organic mercury
respectively. It should be noted, however, that the measured bioconcentration ratios
are not a result of environmental partitioning (as is the case with many organic
chemicals), but rather as a result of biomagnification in the food
chain. Bioconcentration factors for use in the current assessment are considered in
more detail in Section 5.
Accumulation of mercury in plants is generally far less pronounced than for aquatic
organisms, with concentrations in plants generally being significantly lower than
those in the soil. Bioconcentration factors may be greater for methyl mercury, as
indicated by Gnamuš et al. (2000) who report of value of 1.8 in Idrija, near to the
former mercury mining complex. Bioconcentration factors may also be higher for
certain plant species, such as mushrooms, and Falandysz et al. (2002) report BCF
values for caps or whole fruiting bodies of mushrooms between 130±78 to
160±120. The value for Claviata excipulformis, an inedible mushroom, was 910±330
(Gucia et al., 2002).
It is generally thought that uptake to and concentrations in plants are dictated
primarily by soil, rather than air, concentrations. Uptake is limited by the binding
characteristics of soil , the solubility of specific compounds and by the physiology of
plant roots.
40
Ratio of the concentration of mercury in the organism to the concentration in the environment or food.
Page 67
Mercury Products - Risks to Health and the Environment
4.4
Measured Levels in the Environment
4.4.1 Overview
Table 4.1 details the concentrations of mercury in each of the major environmental
compartments.
Table 4.1: Mercury Levels in the Environment
Levels (measured as mercury)
rural
Elsewhere
Typical Global1
Netherlands2
3
1 - 4 ng/m (rural)
1.5 - 2.0 ng/m3 (UK3)
20 - 50 ng/m3 (urban)
rural: 0.03-0.06 mg/kg
urban: 0.09-0.16 mg/kg
0.03 - 0.15 mg/kg dw
0.3 mg/kg dw
(means, Germany4)
0.033-0.058 mg/kg
(Polish regions5)
Compartment
Air
Soil
Ground Water
(>10m depth)
0.5 - 15 ng/l
50 ng/l
Surface Water
0.01 - 6 ng/l (dissolved - rivers)
2 - 12 ng/l (dissolved - lakes)
0.04 - 0.8 ng/l (methyl mercury lakes)
10 ng/l
(dissolved)
60 ng/l (total)
Sediment
0.2 - 0.4 mg/kg dw
0.3 mg/kg dw
98% sites < 100 ng/l4
mean: c0.3 mg/kg4
main river/lake means:
<0.05 - 0.28 mg/kg5
0.2 - 4 ng/l (North Sea6)
Sea Water
0.05 - 3 ng/l
Marine
0.2 - 0.4 mg/kg dw
Sediment
Sources:
1) OECD (1995): Risk Reduction Monograph No. 4 - Mercury
2) VROM (2001): Environmental Quality Standards in the Netherlands
3) Lee et al. (2000): Sources, Sinks and Levels of Atmospheric Mercury in the UK
4) German submission to UNEP (2001)
5) Central Statistics Office (2000) supported by a detailed review of Polish scientific literature
from the 1990s
6) OSPAR (2000)
4.4.2 Atmospheric Levels
Background mercury levels across Europe are generally in the range 1.3 - 2.1 ng/m3.
As would be expected the levels tend to be higher (by an order of magnitude or more)
in industrial areas and in areas close to emission sources such as smelters and chlorakali plants (EC, 2001b and Lee et al., 2000). Generally, elemental mercury accounts
for more than 90% of the total mercury present whilst organic mercury accounts for
less than 2% (EC, 2001b).
Currently, there are inadequate data to robustly demonstrate how atmospheric levels
of mercury are changing over time. However, given the recent suggestions that
anthropogenic sources dominate the global emissions of mercury and that these are
now reducing (see S4.2.2), it would be expected that this would be reflected in
Page 68
Risk & Policy Analysts
environmental measurements. Evidence of an increased mercury flux to the
atmosphere over the past 100 years or so has been found in the Arctic by the Arctic
Monitoring and Assessment Programme (AMAP). These findings were one of the
main drivers for the establishment of UNEP’s Global Mercury Assessment (AMAP,
2001).
Until relatively recently, there have been few instruments capable of measuring the
range of mercury forms present in the atmosphere. As a result, there would appear to
be no comprehensive long term monitoring records.
Within the UK, particulate phase mercury (i.e. bivalent forms bound to fine
particulate matter) which accounts for less than 10% of the total atmospheric mercury
has been monitored at a number of sites since the early 1970s. It should be noted that
particulate phase mercury tends to be associated with coal combustion (both in power
stations and in the home - EC, 2001b). The monitoring results (Lee et al., 2000)
indicate fluctuating levels over the period from the early 1970s to around 1990 but
neither an upward nor downward trend - although there is a noticeable peak in
1983/84.
Although the data are far from conclusive, there is other evidence to suggest that the
reduction in EU mercury emissions is now being reflected in atmospheric mercury
levels. Monitoring data for mercury levels (annual averages) in precipitation from
two sites in the Netherlands (NL Sites 1 & 2) and four sites in Sweden (Sweden S1 S4) (from RIVM, 1999 and EC, 2001b respectively) are shown in Figure 4.1.
Figure 4.1: Hg Levels in Precipitation
in the Netherlands and Sweden
30
NL Site 1
Hg in Precipitation (ng/l)
25
NL Site 2
20
Sweden S1
15
Sweden S2
10
Sweden S3
5
Sweden S4
0
1995
1996
1997
Year
1998
1999
Page 69
Mercury Products - Risks to Health and the Environment
4.4.3
Levels in the Aquatic Environment
As for levels in the atmosphere, there are few data sets which can be used to show
changes of mercury levels over time. However, data from the Netherlands (RIVM,
2001) indicate a reduction in fresh water concentrations in recent years as shown in
Figure 4.2.
Figure 4.2: Hg Levels in Freshwater
in the Netherlands (90%ile Values)
Concentration (microg/l)
1.00
Rhine
Meuse
0.10
Scheldt
Ijsselmeer
0.01
1984
1988
1992
1996
2000
Year
In relation to the presence of methyl mercury in the aquatic environment, extensive
monitoring in the 80km of river from the Idrija mine to the Gulf of Trieste (Horvat et
al., 2000) shows methyl mercury levels in the range 0.02 - 0.6 ng/l which correspond
to about 0.5% of the total mercury concentrations (ranging from 3 to >300 ng/l at the
mine). Similarly, in the Everglades in Florida, methyl mercury has been found to
contribute from <0.2% to 2% of the total mercury content in sediments (Gilmour et
al., 1998). However, in lakes, the relative concentrations may well be higher - as the
USEPA (2001) reports that methyl mercury accounts for 10% of the mercury present.
Levels in Fish
As already noted, most mercury present in the aquatic environment is of the inorganic
bivalent form. However, the bioconcentration of methyl mercury tends to lead to
relatively higher concentrations in fish (and other aquatic organisms) - particularly
amongst fish at the top of the food chain (such as sharks). Levels of mercury in fish
may be of the order of 0.1 mg/kg wet weight and this is usually associated with
methyl mercury.
4.4.4 Levels in the Terrestrial Environment
Most terrestrial mercury is in the form of inorganic salts with minimal organic
mercury present. Typical concentrations in soil are of the order of 0.1 mg Hg/kg dry
weight (dw). As would be expected there are reports of much higher concentrations
Page 70
Risk & Policy Analysts
on contaminated industrial sites and mean values of 2.5 mg/kg and 0.065 mg/kg have
been reported for total mercury and methyl mercury respectively in the Idrija area of
Slovenia, near to the mine-smelter area (Gnamuš et al, 2000). Similarly, the German
submission to UNEP reports high localised concentrations at sites which used to
impregnate telegraph poles, railway sleepers, etc. with mercuric chloride.
Levels in Plants & Food
Typical mercury levels in plants are less than <0.1 mg Hg/kg fresh weight as
illustrated by crop samples listed in Table 4.2. Higher concentrations are again
reported in contaminated areas, such as in Almaden (Spain) near to the mercury mine,
where concentrations in vegetation of over 100 mg/kg were reported in the 1980s
(WHO, 1989).
Table 4.2: Mercury Levels in Crops (mg/kg fresh weight)
Crop
UK1
Fresh Fruit
0.0006 (mean)
Green Vegetables
0.0004 (mean)
Potatoes
0.0010 (mean)
Other Vegetables (eg Carrots)
0.0006 (mean)
Cereals
0.0040 (mean)
Sources: 1) MAFF (1999) and 2) CSO (2000)
Note that 1 mg/kg is equivalent to 1 part per million
4.5
Poland2
0.0001 - 0.0134 (max)
0.0001 - 0.0039 (max)
0.0001 - 0.0030 (max)
0.0001 - 0.0058 (max)
0.0001 - 0.0070 (max)
Human Exposure
4.5.1 Overview
For typical citizens of the EU and the three accession countries, uptake of mercury is
dominated by inhalation of vapours from dental amalgam and by ingestion of
foodstuffs (particularly fish). As would be expected, exposure is greater where past
industrial activities have led to significant mercury emissions to the environment.
4.5.2
Non-Occupational Exposure
Typical mercury intakes within the EU (and three accession countries) are of the order
of 10 µg/day as shown in Table 4.3.
As can be seen from Table 4.3, a significant contribution to the human uptake of
mercury is associated with dietary intake of fish (and fish products). In view of this,
the EU has established a maximum mercury content of 0.5 mg/kg (wet weight) for
‘fishery products’ with a higher limit of 1 mg/kg for a range of specified fish
species41.
41
As specified in Commission Regulation (EC) No. 466/2001 Setting Maximum Levels for Certain
Contaminants in Foodstuffs dated 8 March 2001 (as amended by Commission Regulation (EC) No.
221/2002 dated 6 February 2002).
Page 71
Mercury Products - Risks to Health and the Environment
Table 4.3: Daily Uptake of Mercury by Humans
Pathway
Global1
UK Data2
Europe3
Direct Inhalation
negligible
negligible
< 0.2 µg/day
Inhalation of Dental
3 - 17 µg/day
1 - 10 µg/day
3 - 17 µg/day
Amalgam Vapours
Dermal Absorption
negligible
negligible
negligible
Ingestion of Foodstuffs
(excluding fish products) 0.25 µg/day
1-2 µg/day
0.36 µg/day
mainly as inorganic salts
Ingestion of Fish Products could be >100 µg/day
>5 µg/day for some
2.3 µg/day
mainly as methyl mercury
Sources: 1) OECD (1995): Risk Reduction Monograph No. 4 - Mercury; 2) Based on Lee et al.
(2000); and 3) WHO (2000): Air Quality Guidelines - Mercury.
Mercury levels in blood and urine provide are often used as (short term) ‘biomarkers’
for mercury intake while hair provides a proven (long term) guide to methyl mercury
intake. Detailed data on mercury levels in blood in the Czech Republic have been
provided42. The median for 1,207 adults was found to be 0.78 µg/l with a range of
0.01 - 7.13 µg/l. The median for 764 children was slightly lower at 0.46 µg/l but with
a very similar range. Similar values are reported for Germany (German submission to
UNEP, 2001) with median values of 0.6 and 0.4 µg/l and 95% values of 2.1 and 1.4
µg/l amongst 3,958 adults and 712 children respectively. The corresponding median
value of mercury in urine was 0.5 µg/l (with a 95% value of 3.9 µg/l) for both children
and adults. ATSDR (1999) reports similar levels amongst the general US population
and that elevated mercury levels in blood of 109 µg/l have been found amongst
women using skin-lightening creams (as discussed in S3.7.8). Similar elevated levels
have been found in amongst those eating contaminated fish and amongst workers (see
below).
4.5.3
Occupational Exposure
As would be expected, occupational exposures are somewhat greater than ‘typical’
general population exposures due to greater environmental concentrations. By way of
example, atmospheric mercury levels of 300 ng/m3 are still measured around the
abandoned Idrija mine (compared to 1-2 ng/m3 typical background levels).
Data from mercury miners and workers in a range of industries (including chlor-alkali
works, lamp manufacture, thermometer manufacture, metal processing, etc.) provide
useful indicators to the human toxicity of mercury. In broad terms, chronic exposure
to mercury levels in the workplace above 0.1 mg/m3 were found to lead to classic
symptoms of mercury poisoning (tremors, mental disturbance, etc.) in a range of
studies from the 1930s through to 1970 (WHO, 1976). Such studies have led to
increased controls on occupational exposure.
However, the key data on the effects of exposure to mercury and its compounds were
derived from studies on the consumption of foodstuffs with elevated levels of mercury
and, more importantly, methyl mercury as discussed in Section 6.3.
42
The data are also published: Central European Journal of Public Health, Vol 8 #2, pp 117-119 (2000).
Page 72
Risk & Policy Analysts
5.
CALCULATIONS OF PREDICTED ENVIRONMENTAL
CONCENTRATIONS (PECS)
5.1
Introduction
The EUSES software model generates predicted environmental concentrations (PECs)
based on estimated releases on all spatial scales which are derived from the use
patterns and substance properties.
In order to undertake the analysis, EUSES considers emissions associated with
production, formulation, processing, private use and recovery. Some of these aspects
have been considered in Section 3 and these provide a robust basis for estimation of
release factors. Therefore, default values indicated by the Technical Guidance
Document (European Commission, 1996) have been substituted, where appropriate,
with calculated emission factors. The emission factors used in the EUSES analysis
are summarised in the subsections below.
Modelling the behaviour of mercury emissions is not straightforward as the initial
release is usually in the form of elemental mercury which becomes inorganic mercury
in the environment. A portion may then be methylated to form methyl mercury particularly in the aquatic compartment. As indicated in Section 4, methyl mercury
may make up to 10% of the mercury present (particularly in lakes) - which will be
taken as a worst case scenario in the analysis which follows.
This section concludes with a description on the use of EUSES and a summary of the
PEC results together with an associated commentary.
5.2
Production
The ‘production’ step has been taken as the collection and refining of mercury from a
gas (or vapour) stream after heating ore (mercury or other non-ferrous metal) or
recovered mercury-containing items. All mercury production sites (whether primary
or secondary) are covered by the requirements of IPPC. Recent guidance (European
Commission, 2001a) suggests 1997 emission factors of:
•
•
primary production: 0.01 to air; 7.8 x 10⁻⁶ to water; and 0 to waste; and
secondary production: 2 x 10⁻⁶ to air; 3 x 10⁻⁷ to water; and minimal solid waste.
Clearly, the impact of the primary production emission factor to air could have a
significant impact on the analysis. A much lower figure may be appropriate given the
IPPC requirements. It is worth noting that MAYASA claim43 an overall emission
factor of less than 0.00l.
43
Lopez FA et al. (2000): Considerations on the Implementation of IPPC and the Primary Mining
of Mercury, CSIC (National Centre of Mining, Spain) Report 2399 prepared on behalf of MAYASA
and submitted to European IPPC Bureau.
Page 73
Mercury Products - Risks to Health and the Environment
A further indication of lower emission factors is provided by the Finnish zinc
processing plant. The Kokkola plant produces about 225,000 t/year of zinc and about
65 t/year of mercury. The zinc ore is roasted which drives off the mercury which is
then cleaned from the gas stream using sulphuric acid. The precipitate is mixed with
lime and heated to 700oC to distil off the metallic mercury vapour. The associated
emissions to the environment are estimated to be less than 10 kg/year to air and 3
kg/year to water (sea) (Finnish Environment Institute, 1999). These figures
correspond to emission factors of <1.5 x 10⁻⁴ to air and 4.6 x 10⁻⁵ to sea.
In relation to secondary production (which includes the refining of mercury from
chlor-alkali plants), consultation suggests that the above figures of a few grammes per
tonne44 of mercury can be achieved and are consistent with the BAT requirements
(essentially enclosed handling and scrubbing of ventilation gases).
The EUSES model requires the use of emission factors for emissions to the air,
wastewater, surface water and industrial soil. The above figures account for on-site
wastewater treatment and there is no discharge to industrial soil. Solid waste residues
(including waste water sludges/residues) are generally returned to the furnace.
Residues requiring off-site disposal will be sent directly to engineered landfills.
Table 5.1 summarises the emission factors used for the production of mercury.
Table 5.1: Release Fractions for Mercury Production used in EUSES Modelling
Production
Route
Primary Mined
Production
By-product of
other NonFerrous Primary
Production
Secondary
Production
Fraction of
tonnage released to
Air
Wastewater
Value
Source & Comment
0.001
0
Report for MAYASA
Emissions processed on site
Although EC (2001a) data suggest lower
figure, source uncertain. Higher value
derived for ‘by-product’ production used
No discharge to land
Finnish Environment Institute (1999)
Emissions processed on site
Finnish Environment Institute (1999)
No discharge to land.
EC (2001a), supported by consultation
Emissions processed on site
EC (2001a), supported by consultation
No discharge to land (minimal solid
waste to landfill)
Surface Water
4.6 x 10⁻⁵
Industrial soil
Air
Wastewater
Surface Water
Industrial soil
Air
Wastewater
Surface Water
0
1.5 x 10⁻⁴
0
4.6 x 10⁻⁵
0
2 x 10⁻⁶
0
3 x 10⁻⁷
Industrial soil
0
For the purposes of the analysis which follows it has been assumed that these
emission factors should be applied to the total current EU consumption of mercury in
the products under study - i.e. 119.2 tonnes. Whilst it is recognised that some
products are imported (e.g. thermometers), it is possible that the mercury used will
have originated in the EU.
44
Note that an emission factor of 1 x 10⁻⁶ corresponds to an emission of 1 g per tonne produced.
Page 74
Risk & Policy Analysts
It is further assumed, in the absence of detailed evidence of the sources of mercury
used in the products under study, that the production quantity will be divided equally
amongst primary production, by-product production and secondary production - i.e.
39.7 t per production route.
5.3
Formulation and Processing (Product Manufacture)
5.3.1
Dental Amalgam
It has been assumed that, generally, no ‘formulation’ stage is involved in the
manufacture of the various products under study. Instead, product manufacturing
operations are considered to take place at the ‘processing’ stage where mercury is
used and processed along with other substances in order to produce the end products
which are then forwarded to the consumers. The exception is that mercury used in
dental amalgam must be of the highest quality and may be re-refined (through triple
distillation) prior to ‘processing’. It would be expected that the emission factors
would essentially be the same as for ‘secondary production’ (see Table 5.1). Limited
data from consultation suggest only minor atmospheric emissions and for the
purposes of this analysis, the same factors will be used as those shown in Table 5.1.
For this analysis it has been assumed (conservatively) that the current EU
consumption of mercury used in dental amalgam (70 t/year) is formulated within the
EU and that, as discussed in S3.2.4, the ‘formulator’ provides pre-packed mercury for
the use by the ‘processor’. As such it has been assumed that there are no emissions
associated with ‘processing’ (i.e. packaging the mercury with the other amalgam
materials). The associated emission factors are shown in Table 5.2.
Table 5.2: Release Fractions for Dental Amalgam used in EUSES Modelling
Process Step
Formulation
Processing
Fraction of
tonnage released to
Air
Wastewater
Surface Water
Value
Source & Comment
2 x 10⁻⁶
0
3 x 10⁻⁷
Industrial soil
0
All media
0
EC (2001a), supported by consultation
Emissions processed on site
EC (2001a), supported by consultation
No discharge to land (minimal solid
waste to landfill)
Zero emissions assumed
5.3.2 Other Products
For batteries and other products, the default EUSES emission factors have been
overridden and replaced with emission factors adapted from the estimates presented in
the WS Atkins report (1998) on product manufacture emissions. It should be noted
that attempts to obtain more site-specific data to refine these figures have not been
successful. It has been assumed that all solid waste arisings from product
manufacturing facilities (i.e. for batteries, lamps, etc.) are disposed of to landfill (as
opposed to a portion going to incinerators as would occur with municipal waste).
Given that the mercury used in product manufacture will tend to be in elemental form,
Page 75
Mercury Products - Risks to Health and the Environment
it has been assumed that 9.5% of the mercury disposed to landfill will be released to
atmosphere (using the same approach as used in Section 3.5.4). By way of example, a
solid waste stream of 140 g waste per kg of mercury used would lead to atmospheric
emissions of 13.3 g/kg which is equivalent to emission factor of 0.0133.
No emission estimates are given in the WS Atkins report with regard to batteries
manufacture. It has been assumed that the emissions from manufacture will be
similar to those for the electronics industry as in both cases, production essentially
entails the incorporation of a small amount of mercury into the product. The emission
factors used in ‘processing’ are summarised in Table 5.3.
Table 5.3: Release Fractions for ‘Processing’ used in EUSES Modelling
Product
Manufacture
Batteries and
Electrical
Control &
Switching
Equipment
Lamp Production
Measuring &
Control
Equipment
Fraction of
tonnage released to
Value
Air (plant)
3.0 x 10⁻⁷
Source & Comment
-4
Air (landfill)
4 .75 x 10
Wastewater
Surface Water
3 x 10⁻⁵
0
Industrial soil
0
Air (plant)
Air (landfill)
Wastewater
Surface Water
0.022
1.33 x 10⁻²
3 x 10⁻⁵
0
Industrial soil
0
Air (plant)
3.0 x 10⁻⁷
Air (landfill)
1.33 x 10
Wastewater
Surface Water
3 x 10⁻⁵
0
Industrial soil
0
Based on WS Atkins (1998) with
additional landfill emissions
Based on WS Atkins (1998)
Discharges to water and soil associated
with sewage treatment plant discharges
(calculated by EUSES)
-2
Based on WS Atkins (1998) with
additional landfill emissions
Based on WS Atkins (1998)
Discharges to water and soil associated
with sewage treatment plant discharges
(calculated by EUSES)
Based on WS Atkins (1998) with
additional landfill emissions
Based on WS Atkins (1998)
Discharges to water and soil associated
with sewage treatment plant discharges
(calculated by EUSES)
These emission factors are applied to the quantities of mercury used in the
manufacture of products within the EU. For most of the products listed in Table 5.3,
there are significant imports and, in some cases, exports as illustrated in Table 5.4.
Based on the discussions presented in Section 3 for each of the product groups,
estimates have been made as to the likely quantities of mercury used in product
manufacture within the EU (as opposed to the quantities consumed (i.e. sold) in the
products within the EU). Clearly, such estimates carry a degree of uncertainty.
Page 76
Risk & Policy Analysts
Table 5.4: Quantities of Mercury used in EU Product Manufacture
Tonnes of Hg/year used in EU for
Product
Comment
Consumption
Batteries
8.0
3.0
Lamp Production
5.2
5.2
28
8.0
8.0
4.0
Measuring &
Control
Equipment
Electrical
Control &
Switching
Equipment
5.4
Production
As discussed in Section 3.3,
although batteries are imported and
exported in similar quantities, most
of the mercury consumed is likely to
be associated with imported zinc
mercury cells
Lamps are both imported and
exported. As shown in Table 3.16
and Figure 3.4, most mercury is
associated with double-ended
fluorescent tubes which appear to be
imported and exported in similar
quantities.
As discussed in Section 3.5, it
would appear that most measuring
equipment is now imported
As discussed in Section 3.6.3, a
significant portion of mercury
switches are now imported
Private Use and Recovery of Mercury in Products
The emission factors which were calculated in Section 3 for each of the products
under study were carried forward to the EUSES analysis. Since EUSES requires
inputs to atmosphere, wastewater, surface water and industrial soil, a degree of
backtracking was required for ‘dental amalgam’ and ‘measuring and control
equipment’ in order to generate values for release fractions to waste water45.
The calculations in Section 3 have also taken into account any recovery and recycling
issues within each of the application categories. Where recovery takes place (with
subsequent re-use of mercury), this has been incorporated in the respective flowchart
and the emission calculations have been adjusted. Therefore, the ‘recovery’ life cycle
step has not been included in the EUSES modelling as the effects are taken into
account in the ‘private use’ step.
Table 5.5 summarises the emission factors for releases during ‘private use’ of
mercury-containing equipment. In each case, the values have been based on
emissions per tonne (of current consumption) used in the EU. It should be noted that
these figures account for emissions associated with the disposal of ‘old’ products and
equipment. As discussed in Section 3, this ‘disposal’ stream may be significantly
greater (in terms of mass flow rate) than the current consumption since the usage of
mercury is declining in some sectors.
45
In essence and with reference to Figures 3.1 and 3.6, emissions ‘downstream’ of sewer were not used
and the input to sewer was used as the input to wastewater for EUSES.
Page 77
Mercury Products - Risks to Health and the Environment
Table 5.5: Release Fractions for ‘Private Use’ used in EUSES Modelling
Product
Manufacture
Dental Amalgam
Batteries
Lamps
Measuring &
Control
Equipment
Electrical
Control &
Switching
Equipment
Fraction of Tonnage
Released to
Air
Wastewater
Surface Water
Industrial soil
Air
Wastewater
Surface Water
Industrial soil
Air
Wastewater
Surface Water
Industrial soil
Air
Wastewater
Surface Water
Industrial soil
Air
Wastewater
Surface Water
Industrial soil
Value
0.0702
0.0762
0
0
0.0612
0
0
0
0.1388
0
0
0
0.2436
0.0182
0
0
0.2554
0
0
0
Source & Comment
Based on Section 3.2 calculations
(adjusted to account for discharges to
wastewater)
Based on Section 3.3 calculations
Based on Section 3.4 calculations
Based on Section 3.5 calculations
(adjusted to account for discharges to
wastewater)
Based on Section 3.4 calculations
5.5
Predicted Environmental Concentrations
5.5.1
Introduction
The EUSES model was used to generate PECs which when combined with toxicity
data (as discussed in Section 6) enabled the risks to the environment and to humans to
be characterised. This exercise was undertaken for the main product groups used in
the EU. At the outset, it must be emphasised that the behaviour of mercury and its
compounds does not lend itself to analysis using the EUSES model and the results
generated must be treated with a degree of caution.
5.5.2
Approach to EUSES
Emissions from the different types of mercury production sites (primary production in
Spain, production from non-ferrous metal primary production and secondary
production) were considered separately. It was assumed that each of the three
mercury production routes produced 39.7 t/year of mercury (to give a combined
figure of 119.2 t/year which is the EU consumption of the products under study).
Product manufacture was modelled for each of the five main product groups data
under study to give a further five scenarios. In order to account for the degree of
imports associated with batteries, measuring equipment and electrical equipment, the
runs were based on the quantities of mercury used in EU product manufacture
Page 78
Risk & Policy Analysts
(assumed to be 3, 8 and 4 t/year respectively). For all the product manufacture
activities (bar dental amalgam), it was necessary to account for both local plant losses
and atmospheric losses associated with the disposal of solid waste.
Finally, the ‘private use’ of each product group was also modelled (using the total
consumption figures). The listing of the modelled ‘use patterns’ is shown in Table
5.6.
Table 5.6: Use Patterns Modelled with EUSES
Use Pattern
1. Production
2. Dental
Amalgam
3. Batteries
4. Batteries
5. Lighting
Modelling Stage
Production
Formulation
Processing
Formulation
Private Use
Formulation
Mercury Emissions Modelled
From primary production
From non-ferrous by-products
From secondary production
From re-refining mercury to be used in dental amalgam
From use and disposal of dental amalgam (as described in S3.2)
From plants producing batteries within EU
Processing
From disposal of plant waste (see Table 5.3)
Private Use
From use and disposal of batteries (as described in S3.3)
Formulation
From plants producing lamps within EU
Processing
From disposal of plant waste (see Table 5.3)
Private Use
From use and disposal of lamps (as described in S3.4)
From plants producing measuring equipment within EU
From disposal of plant waste (see Table 5.3)
From use and disposal of measuring equipment (as described in
7. Measuring
Private Use
S3.5)
Equipment
Formulation
From plants producing electrical equipment within EU
8. Electrical
Equipment
Processing
From disposal of plant waste (see Table 5.3)
From use and disposal of electrical equipment (as described in
9. Electrical
Private Use
S3.6)
Equipment
Note: Since EUSES can model a maximum of ten ‘use patterns’, it was necessary to combine some
‘uses’ into a single ‘use pattern’ by adapting some of the modelling steps.
6. Measuring
Equipment
Formulation
Processing
The EUSES model was run twice:
•
•
Run 1: 100% of emissions considered to be as elemental mercury; and
Run 2: 100% of emissions considered to be as inorganic mercury (mercuric
chloride).
Although attempts were made to extend EUSES to organic mercury, the analysis was
considered to be rather tenuous (since organic mercury is not released but forms in the
environment). Instead, consideration is given to using the PECs for inorganic
mercury as a basis on which to estimate the potential PECs for organic mercury.
Page 79
Mercury Products - Risks to Health and the Environment
5.5.3 Properties Used
As noted in the TGD (EC, 1996), care must be taken when applying EUSES to metals
and their compounds. EUSES requires basic data on the properties of the mercury
compounds (as presented in Section 2) and these were entered. However, the ‘flow’
of mercury through the environment is complex and a number of further data points
and assumptions were required as outlined below.
Partition Coefficients
EUSES estimates partition coefficients from log Kow (the octanol-water partition
coefficient). However, such methods are not directly applicable to metals (and their
compounds) and, as a result, specific values for each of the partition coefficients must
be provided. These specific values are based on theory and/or observations. A listing
of those values used in EUSES for elemental and inorganic mercury is presented in
Table 5.7.
Table 5.7: Partition Coefficients used in EUSES Modelling
Compound
Elemental
Mercury
Inorganic
Mercury
Partition
Coefficient
Value
Henry’s Law
constant (airwater)
680
Pa.m3/mole
A range of values was found including around 500
(USEPA, 1997); 700 (Sunderland & Gobas, 2001);
720 (INERIS, 2000); and 860 (PhysProp database1). A geometric mean value was selected
126,000 l/kg
(log K = 5.1)
The same values were used as derived for
inorganic mercury
Solids-water
in suspended
sediment and
sediment
Solids-water
in soil
1,000 l/kg
Henry’s Law
constant (airwater)
680
Pa.m3/mole
Solids-water
in suspended
sediment
126,000 l/kg
(log K = 5.1)
Solids-water
in sediment
126,000 l/kg
(log K = 5.1)
Solids-water
in soil
60,000 l/kg
(log K = 4.8)
Source & Comment
Value quoted in INERIS, 2000
Wide ranging values were found from 0.32
(PhysProp data-base) to 3.6 x 10⁻⁵ (INERIS, 2000).
However, the value for elemental mercury was
used since, in practice, >90% of atmospheric
mercury is elemental and it takes time for the
elemental mercury convert to its bivalent state
(see, for example, Lee et al., 2000 and EC, 2001b).
Thus, use of this value will more accurately
predict the environmental fate following a release
(most of which are to atmosphere)
Log K values found include 4.9 (Sunderland &
Gobas, 2001) and 5.23 (Eurochlor, 1999 &
INERIS, 2000). A geometric mean of 5.1 was
used
The same K values tend to be used for this and the
SS-water partition coefficients. Hence, the same
value was used
Values quoted in INERIS (2000) range from 6,800
- 60,000 and the highest value was used.
Data-base sources:
1) SRC PhysProp Database on http://escsyrres.com/interkow
2) Hazardous Substances Data Base on http://toxnet.nlm.nih.gov
Page 80
Risk & Policy Analysts
Vapour Pressures
The true vapour pressures for mercury and mercuric chloride were used since a
(minimal) degree of evaporation would be expected. The values were 0.267 Pa and
0.1 Pa respectively - although these were not used by EUSES to derive Henry’s Law
constants.
Aerosol Particles
A feature of inorganic mercury is that a significant proportion is bound to particles in
the atmosphere which are deposited more rapidly than elemental mercury. For the
purposes of this analysis a value of 9% was selected which is consistent with
observations reported by Lee et al. (2000) and EC (2001b).
Bio-concentration
To reflect the importance of bio-concentration in fish, a bio-concentration factor
(BCF) of 5,000 for inorganic mercury was used. A BCF value of 50,000 was used for
organic mercury in later stages of the analysis. These values are towards the higher
end of the ranges suggested by ATSDR (1999) and INERIS (2000).
5.5.4 PECs - Air Compartment
For the air compartment, the values derived from using elemental mercury were used.
The results are summarised in Table 5.8.
Table 5.8: PEC Values for Air (ng/m3) for Mercury & Products
Parameter
Value
Comment
Typical measured value in EU
1.3 - 2.1
See Section 4.4.2
Continental PEC associated with
This represents about 5-10% of typical EU
manufacture and use of mercury in
0.10
levels
products under study
Regional PEC associated with
For the ‘worst’ region, this represents 10manufacture and use of mercury in
0.27
20% of typical EU levels
products under study
Local PEC values associated with mercury production:
Primary production (Spain)
30.5
Level significantly above ‘background’
Production from non-ferrous by1.18
products
Secondary production
0.30
Local PEC values associated with product manufacture:
Dental amalgam
0.28
Batteries
0.28
Lamps
3.62
Measuring equipment
1.28
Electrical equipment
0.31
Level marginally above regional PEC value
Ditto - note that level is associated with
landfill emissions rather than from plant
Levels are associated with landfill
emissions rather than from plant
Page 81
Mercury Products - Risks to Health and the Environment
Overall, the use of mercury in the products under study, the associated product
manufacture as well as the associated production of mercury make, as would be
expected, a minor contribution to mercury in air concentrations at continental and
regional levels.
In terms of ‘local’ concentrations, the PEC values are dominated by those associated
with the primary production of mercury in Spain. Otherwise, the PEC values tend to
be within the ‘typical’ range of values found in the EU although those for lamp
manufacture are slightly higher, due primarily to the relatively high air emission
factor used (see Table 5.3). As noted in Table 5.8, the PEC values for some of the
product manufacture sites are associated with subsequent losses to atmosphere from
solid waste disposal rather than from the product manufacturing site itself.
5.5.5 PECs - Soil Compartment
For the soil compartment, the values derived from using inorganic mercury were used.
The results are summarised in Table 5.9.
Table 5.9: PEC Values for Soil (µ
µg/kg dw) for Mercury & Products
Parameter
Value
Comment
Typical measured value in EU
50 - 100
See Section 4.4.4 & Table 4.1
Continental PEC associated with
This represents a few % of typical EU
manufacture and use of mercury in
1.63
levels
products under study
Regional PEC associated with
For the ‘worst’ region, this represents 4 manufacture and use of mercury in
4.34
8% of typical EU levels
products under study
Local PEC values1 associated with mercury production:
Primary production (Spain)
6.18
Values essentially close to ‘regional’ PEC
Production from non-ferrous by4.66
value - although higher around the primary
products
production site
Secondary production
4.61
Local PEC values1 associated with product manufacture:
Dental amalgam
4.61
Batteries
4.61
Lamps
4.78
Measuring equipment
4.66
Electrical equipment
4.61
Values essentially close to ‘regional’ PEC
value
Note: 1) Local values based on agricultural PEC averaged over 180 days
As can be seen the scenarios considered make a minor contribution to mercury in soil
concentrations at continental and regional levels. Furthermore, there is very little
‘local’ effect on soil concentrations associated with emissions from mercury
production and product manufacture facilities.
This findings appear consistent with the emissions to ‘soil’ being much lower than
those to atmosphere (see Table 3.29).
Page 82
Risk & Policy Analysts
5.5.6 PECs - Aquatic Compartment
Water
For the water compartment, the values were first derived for inorganic mercury using
EUSES. As a ‘worst case’ estimate, it was assumed that the organic mercury
concentration would be 10% of the inorganic concentration (as this is an upper limit
of that observed in the aquatic environment). The associated results are summarised
in Table 5.10.
Table 5.10: PEC Values for Water (ng/l - dissolved) for Mercury & Products
Parameter
Typical measured value in EU
Value
Inorganic
1 - 10
Organic
<10% of
inorganic
Continental PEC associated with
manufacture and use of mercury in
0.03
0.003
products under study
Regional PEC associated with
manufacture and use of mercury in
0.64
0.064
products under study
Local PEC values associated with mercury production:
Primary production (Spain)
Production from non-ferrous by0.64
0.064
products
Secondary production
Comment
See Table 4.1 & Section 4.4.3
This represents perhaps 1% of
typical EU levels
For the ‘worst’ region, this
represents a significant fraction
of typical EU levels
Values the same as ‘regional’
PEC value (due to minimal
discharges to water)
Local PEC values associated with product manufacture:
Dental amalgam
0.64
0.064
Batteries
0.69
0.069
Lamps
0.67
0.067
Measuring equipment
0.67
0.067
Electrical equipment
0.67
0.067
Values very close to ‘regional’
PEC value (due to minimal
discharges to water)
Overall, a similar pattern emerges as for the air and soil compartments. Contributions
to continental and regional concentrations are dominated by product use. The
contributions of the various product groups are dominated by those associated with
dental amalgam and measuring equipment due to their higher levels of emission (see
Table 3.29).
As for the soil compartment, there is very little ‘local’ effect on water concentrations
associated with emissions from production and product manufacture facilities.
Sediment
For sediments (as for the water compartment), the values were first derived for
inorganic mercury using EUSES. As a ‘worst case’ estimate, it was assumed that - as
for water - the organic mercury concentration would be 10% of the inorganic
concentration. The associated results are summarised in Table 5.11.
Page 83
Mercury Products - Risks to Health and the Environment
Table 5.11: PEC Values for Sediment (µ
µg/kg dw) for Mercury & Products
Parameter
Typical measured value in EU
Continental PEC associated with
manufacture and use of mercury in
products under study
Regional PEC associated with
manufacture and use of mercury in
products under study
Value
Inorganic
300
Organic
<10% of
inorganic
Comment
See Table 4.1 & Section 4.4.3
4.2
0.42
This represents about 1% of
typical EU levels
81
8.1
For the ‘worst’ region, this
represents about 25% of typical
EU levels
As before, contributions to continental and regional concentrations are dominated by
product use. As for water, the overall significance is of the order of 1% as indicated
by the continental concentrations. The results indicate that the ‘worst’ region may
experience sediment concentrations which are about 25% of ‘typical’ EU levels,
which again is consistent with the results for water.
Local PEC values for sediment are calculated by EUSES for an ‘emission episode’
and are not directly comparable to the longer term continental and regional values.
The predicted effects of these emission episodes are explored further in Section 7.
5.5.7
Summary
The behaviour of mercury and its associated derivative compounds in the
environment is complex. An attempt has been made to account for this behaviour by
using EUSES for elemental mercury and inorganic mercury (mercuric chloride). As a
worst case, the results for organic mercury (methyl mercury chloride) were assumed
to be 10% of the inorganic mercury concentrations.
Specific data on partition coefficients were derived - although some of the values are
uncertain. However, some assumptions have been made to ‘force’ the model to
reflect reality. In particular, the Henry’s Law constant for elemental mercury was
applied to inorganic mercury since the balance of loads between the air and other
compartments is mainly governed by the behaviour of the elemental mercury released
(initially) to the atmosphere.
As already indicated, the results of the modelling are dominated by the emissions
associated with product use which total 22.6 t/year (from Table 3.29). For
comparison, the corresponding emissions (for the EU-15 and three accession
countries under study) from all anthropogenic sources are 161 t/year (from EC,
2001b). Such figures suggest that, whilst there are clearly uncertainties in the results,
it would be expected that the environmental concentrations associated with the
products under study form a minor part of observed levels in the environment.
Page 84
Risk & Policy Analysts
6.
EFFECTS OF MERCURY
6.1
Overview
Mercury and its compounds are persistent, bioaccumulative and toxic and may pose
risks to people and to the environment. The greatest risk to humans and wildlife is
associated with the formation of methyl mercury and its bioconcentration in the
aquatic food chain (USEPA, 2000).
6.2
Environmental Toxicity
6.2.1
Methodological Considerations
Limited data are presented on environmental toxicity in WS Atkins (1998) and OECD
(1995). However, more information on ecotoxicity (NOEC, LOEC, EC50, etc.) by
species and compartment is presented by Eurochlor (1999a). Similarly, the French
Institut National de l’Environnement Industriel et des Risques has compiled a review
of toxicological and environmental data on mercury and its compounds (INERIS,
2000).
The Eurochlor (1999a) and INERIS (2000) documents have been reviewed so as to
provide a range and comparison of NOEC values for input into the EUSES program
(JRC, 1997) which, in accordance with the TGD, requires the selection of the most
sensitive results for a range of taxonomic groups.
It is a requirement of the TGD (European Commission, 1996) that the validity of tests
and documentation should be taken into account when selecting values. As there is
neither the time nor resources in this study to examine source documentation, prevalidated data points from the literature have been used in preference to other data.
Both Eurochlor (1999a) and INERIS (2000) documents consider the quality of data
points presented46 and data from these documents have been used in preference.
However, there remains a paucity of data for the terrestrial compartment and NOECs
have been supplemented, where necessary, with data from other sources. In relation
to the aquatic environment, a review of ecotoxicology data from AQUIRE (the
USEPA data-base for the aquatic environment) was undertaken and a comparison
made with the validated data in Eurochlor (1999a). This found no significant
difference in the most sensitive values for this most complete data set (i.e. the aquatic
compartment). This provides a degree of reassurance over the use of the data
provided in Eurochlor (1999a) and INERIS (2000). A summary of this review is
provided in Annex 4.
46
Eurochlor (1999) ranks sources on the basis of validity. All values appearing in INERIS (2000) have
been validated by RIVM (1999): Environmental Risk Limits in the Netherlands, RIVM. No.
601640 001, and Slooff et al. (1995): Integrated Criteria Document Mercury, RIVM. No. 601014
008.
Page 85
Mercury Products - Risks to Health and the Environment
6.2.2 Micro-organisms
The EUSES software model requires data on NOECs (No Observed Effect
Concentrations) for micro-organisms which could affect the operation of sewage
treatment plants. The TGD refers to specific populations to be considered such as
Pseudomonas putida. INERIS (2000) reports a (geometric) mean NOEC of 11 µg/l
for inorganic mercury (based on 6 and 16 hr NOEC values). For organic mercury,
INERIS (2000) provides a NOEC of 0.2 µg/l for bacteria (based on an 18 hr NOEC
value). These values have been used in the analysis for inorganic (and elemental) and
organic mercury respectively.
6.2.3 Aquatic Compartment
Ideally, the TGD and EUSES software model require data on long-term NOECs (No
Observed Effect Concentrations) for fish, Daphnia, algae and other aquatic species. It
is considered that there are sufficient NOEC data to provide such information in
relation to inorganic and organic mercury in the freshwater environment. For the
purposes of this study, we have derived freshwater NOEC values for inorganic
mercury (typically mercuric chloride) and organic mercury (typically methyl mercury
chloride) as indicated in Table 6.1.
Table 6.1: Aquatic (Freshwater) Data used in EUSES Modelling
Inorganic Mercury
NOEC Fish
NOEC µg/l
0.3
NOEC Daphnia
0.7
NOEC Algae
2.5
NOEC Other aquatic
species
Methyl Mercury
NOEC Fish
0.62
0.07
NOEC Daphnia
0.09
NOEC Algae
NOEC Other aquatic
species
1
0.03
Source Document
INERIS (2000) Geometric mean for Pimephales
promelas (fathead minnow)
INERIS (2000) Geometric mean for Daphnia magna
(water flea)
Eurochlor (1999a) and INERIS (2000) for Microcystis
aeruginosa (blue-green algae)
Eurochlor (1999a) for Hyalella azteca (an amphipod)
INERIS (2000) for Pimephales promelas (fathead
minnow)
INERIS (2000) and Eurochlor (1999a) for Daphnia
pulex (water flea)
No direct data, so used ‘marine’ value from Eurochlor
(1999a) for Laminaria saccharina (oarweed)
Eurochlor (1999a) for Dugesia dorotocephala
(turbellarian flatworm)
Fuller information on the sources, test duration and associated end-points (where
available) is presented in Table 6.2 for inorganic and organic mercury in the
freshwater environment. Since it is understood that marine environmental risk
assessments will be required when the revised TGD (currently in draft form) is
formally adopted, further data on the marine environment have been presented. As
can be seen, there are relatively fewer marine data for organic mercury but it would
appear that the NOEC values for the two environments are broadly comparable.
Page 86
Risk & Policy Analysts
Table 6.2: Summary of NOECs for Aquatic Organisms
Group
Mercury
Form
Marine Data NOEC µg/l
10
Fundulus heteroclitus (mummichog) - Sharp &
Neff, 1980 (32d - hatching success)
10
as above
inorganic
mercury
Freshwater Data NOEC µg/l
0.68 - 1
0.3
Fish
methyl
mercury
0.25 - 6
inorganic
mercury
Crustaceans
& Other
Invertebrates
0.1 - 70
methyl
mercury
no data
0.15 - 29
no data
0.07
Low: Crepidula fornicata (slipper limpet) Thain, 1984 (112d - reproduction)
High: Penaeus indicus (Indian prawn) McClurgh, 1984 (28d - growth)
Low: Clavopsella michaeli (a coelenterate) Piraino, 1991 (8d)
High: Ophryotrocha diadema (a marine worm) Reish, 1978 and Reish & Carr, 1978 (geometric
mean) (28d)
0.3
Mytilus edulis (blue mussel) - Pelletier, 1988
(32d - growth)
0.3
ditto
0.62 - 54
0.7
0.03 - 0.1
0.09
Low: Geometric Mean - Pimephales promelas
(fathead minnow); low [0.5] based on Snarski &
Olson, 1982 (41 wk - growth & reproduction)
High: Brachydanio rerio (zebra fish) - Dave &
Xiu, 1991 (14d - mortality)
Geometric Mean – Pimephales promelas (fathead
minnow); low [0.09] based on Snarski & Olson,
1982 (30d - growth of progeny)
Low: Geometric Mean - Salvelinus fontinalis
(brook trout); low value [0.08] - Christensen, 1975
(248d - growth of larvae)
High: Oncorhynchus kisutch (coho salmon) Devlin & Mottet, 1992 (48d - embryo mortality)
Pimephales promelas (fathead minnow) - Mount,
19743 (60d - mortality, reproduction)
Low: Hyalella azteca (an amphipod) - Borgmann
et al, 1993 (6-10 wk - reproduction)
High: Geometric Mean - Viviparis bengalensis
(snail) - Muley & Mane, 1988 (7d mortality)
Geometric Mean - Daphnia magna (water flea);
low [0.07] Enserink et al., 1991 (21d)
Low: Dugesia dorotocephala (turbellarian
flatworm) - Best et al., 1981 (14d - fissioning,
neurotoxic effects)
High: Daphnia pulex (water flea) - Tian-yi &
McNaught, 1992 (30d - reproduction & growth)
Daphnia pulex (water flea) as above
Source1
Eurochlor
INERIS
Eurochlor
INERIS
Eurochlor
INERIS
Eurochlor
INERIS
Page 87
Mercury Products - Risks to Health and the Environment
Table 6.2: Summary of NOECs for Aquatic Organisms
Group
Mercury
Form
inorganic
mercury
Aquatic
Plants
Marine Data NOEC µg/l
0.9 - 330
0.9
methyl
mercury
inorganic
mercury
Protozoa
methyl
mercury
Low: Fucus serratus (toothed wrack) Strömgren, 1980 (10d - growth)
High: Dunaliella tertiolecta (green algae) Portmann, 1972 (18d - growth)
Freshwater Data NOEC µg/l
5 TT - 250
Fucus serratus (toothed wrack) as above
Laminaria saccharina (oarweed) - Thompson &
Burrows, 1984 (14d - development of zoospores,
growth of sporophytes)
no data
2.5
2.5
Cristigera sp. - Gray & Ventilla, 1973 (4-9 hr reproduction)
16TT- 87
2.5
ditto
1
1
8
no data
14
no data
0.2
Low: Microcystis aeruginosa (blue-green algae) Bringmann & Kühn, 1978 (8d TT - population,
growth)
High: Anacystis nidulans (blue-green algae) - Lee
et al, 1992 (14d - growth)
Microcystis aeruginosa (blue-green algae) as above
based on saltwater data
no data
Low: Chilomonas paramecium (cryptomonad) Bringman & Kühn, 1981 (48h TT - growth)
High: Geometric Mean - Tetrahymena pyriformis
(ciliate) based on Calabrese et al, 1973 (4h mortality)
Chilomonas paramecium (cryptomonad) as above
Tetrahymena pyriformis (ciliate) - Thrasher et al.,
1972 (2-6 hr - growth)
Poterioochromonas malhamensis (chrysophyte) Röderer, 1983 (3d)
Source1
Eurochlor
INERIS
Eurochlor
INERIS
Eurochlor
INERIS
Eurochlor
INERIS
Notes:
1) Eurochlor values are NOECs (unless otherwise indicated) as presented in Eurochlor (1999a): Risk Assessment for the Marine Environment - Mercury (Appendices
4a, 4b and 6). TT refers to ‘toxicity threshold’ which appears to be equivalent to 2 x NOEC (as interpreted by INERIS)
INERIS values are NOECs as presented in INERIS (2000): Compilation of Toxicological and Environmental Data on Chemicals – Mercury and its Derivatives
2) This value appears in the Eurochlor report but was rejected on grounds of validity as it was from a secondary source. However, the original source is validated by
Sloof et al. (1995) and RIVM (1999)
Page 88
Risk & Policy Analysts
Fish
In terms of fish, both Eurochlor (1999a) and INERIS (2000) provide geometric mean
values for the fathead minnow Pimephales promelas of 0.68 µg/l and 0.3 µg/l
inorganic mercury respectively. The lower of these values (INERIS, 2000) has been
used since the geometric mean includes a reported result of 0.09 µg/l (from Snarski &
Olson, 1982) which was not considered by Eurochlor to be of sufficient reliability to
be included in their analysis.
As regards methyl mercury, Eurochlor (1999a) reports the most sensitive species as
the brook trout Salvelinus fontinalis with a NOEC of 0.15 µg/l methyl mercury,
having eliminated the lower NOEC value of 0.07 µg/l for the fathead minnow
Pimephales promelas owing to secondary reporting and consequent low validity.
INERIS (2000), however, validates this lower value and, as such a NOEC for fish of
0.07 µg/l methyl mercury has been used in the EUSES modelling.
Crustaceans and Other Invertebrates (including Daphnia)
The lowest NOEC value found for crustaceans and other invertebrates is 0.07 µg/l
inorganic mercury for the water flea Daphnia magna reported in INERIS (2000).
However, given the range of values reported for this species, INERIS (2000) provides
a geometric mean value of 0.7 µg/l. This is higher than the 0.62 µg/l inorganic
mercury value reported by Eurochlor (1999a) for Hyalella azteca (an amphipod). The
values of 0.7 and 0.62 are used for Daphnia and ‘other aquatic species’ respectively
(as shown in Table 6.1).
In terms of methyl mercury, the most sensitive species is the turbellarian flatworm
Dugesia dorotocephala with a NOEC of 0.03 µg/l reported in Eurochlor (1999a). The
most sensitive NOEC endpoint for the water flea Daphnia pulex of 0.09 µg/l is
reported in both Eurochlor (1999a) and INERIS (2000). The values of 0.09 and 0.03
are used for Daphnia and ‘other aquatic species’ respectively (as shown in Table 6.1).
Aquatic Plants (including Algae)
Eurochlor (1999a) reports a threshold value of 5 µg/l for inorganic mercury for the
most sensitive freshwater species, the blue-green alga Microcystis aeruginosa. Using
the same original source material, INERIS (2000) reports a NOEC value of 2.5 µg/l.
As regards methyl mercury, there is no NOEC value in the literature for the
freshwater environment and Eurochlor (1999a) uses the value of 1 µg/l methyl
mercury found for the oarweed Laminaria saccharina. This value has been taken
forward to EUSES modelling.
Protozoa
A range of NOECs for protozoa are reported in Eurochlor (1999a). The most
sensitive freshwater result is a ‘toxicity threshold’ value of 16 µg/l for the
cryptomonad Chilomonas paramecium which is reduced to 8 µg/l in the INERIS
(2000) documentation using the same source data for inorganic mercury.
Page 89
Mercury Products - Risks to Health and the Environment
In terms of methyl mercury, Eurochlor (1999a) reports that the ciliate Tetrahymena
pyriformis is the most sensitive species with a NOEC value of 14 µg/l. INERIS
(2000) reports a lower NOEC value of 0.2 µg/l for the protozoan Poterioochromonas
malhamensis.
PBT Assessment for the Marine Environment
As already indicated, marine environmental risk assessments are likely to be required
when the revised TGD (currently in draft form) is formally adopted. These, in turn,
are likely to require a PBT (persistence, bioaccumulation and toxicity) assessment
which will involve two steps:
•
•
identification of PBT substances using specific criteria; and
an evaluation of the sources, major emissions and pathways to the marine
environment to sufficiently establish the most appropriate and effective measures
to reduce the releases to the marine environment.
Table 6.3 summarises the proposed PBT and vPvB (very persistent and very
bioaccumulating) criteria that it is understood will be used in the first step.
Table 6.3: Proposed Criteria for Identification of PBT and vPvB Substances
Criterion
P
B
T
PBT Criteria
Half-life > 60 d in marine water or > 40 d
in freshwater1 or half-life > 180 d in
marine sediment or > 120 d in freshwater
sediment1
BCF > 2,000
Chronic NOEC < 0.01 mg/L or CMR
(carcinogenic, mutagenic or toxic for
reproduction) or endocrine disrupting
effects
vPvB Criteria
Half-life > 60 d in marine or freshwater
or >180 d in marine or freshwater
sediment
BCF > 5,000
Not applicable
Notes:
1) For the purpose of marine environmental risk assessment, half-life data in freshwater and
freshwater sediment can be overruled by data obtained under marine conditions.
It is intended that, generally, such criteria will be applied to organic compounds.
Since metals (including mercury and its compounds) do not ‘biodegrade’ in the usual
sense of the word, they would all be classified as (very) persistent (however defined).
As noted in Section 5.5.3, BCF factors of 5,000 and 50,000 have been used in this
analysis for inorganic and organic mercury respectively. As such, mercury and its
compounds would be expected to meet the proposed ‘very bioaccumulating’ criterion.
For completeness, it can be seen from Table 6.3, that the (PBT) toxicity criteria would
be met for both inorganic and organic compounds.
The conclusion that mercury and its compounds are likely to be classified, at least, as
PBT substances is not surprising and is, of course, one of the key drivers for the
activities of OSPAR and other bodies to limit mercury discharges to the marine
environment and for the designation of mercury and its compounds as priority
hazardous substances under the Water Framework Directive.
Page 90
Risk & Policy Analysts
6.2.4 Terrestrial Compartment - Soil
Within the terrestrial compartment, the focus of interest is on the effects of inorganic
mercury since methylation appears to be mainly limited to the aquatic environment.
However, historically, organomercurials have been used as anti fungal agents for
seeds and plants - although this use has been banned for some time within the EU.
As a result, the presence of organic mercury in the terrestrial compartment is likely to
be associated with contamination (UNEP, 2002). Interestingly, work is under way to
develop genetically-modified crops which can be planted in contaminated areas (not
necessarily within the EU) to break down the organic mercury into the less harmful
inorganic mercury (as discussed in Petra & Sharma, 2000).
On this basis, the analysis has been restricted to inorganic mercury and, ideally, the
TGD and EUSES software model require data on NOECs for plants, earthworms,
micro-organisms and other terrestrial species. Table 6.4 summarises the NOEC
values used with further detail provided below.
Table 6.4: Terrestrial Data used in EUSES Modelling
Inorganic Mercury
NOEC Plants
NOEC
mg/kg dw
0.125
NOEC Earthworms
<0.5
NOEC Micro-organisms
1.4
NOEC Other terrestrial
species (excluding birds
& mammals)
0.121
Source Document
Pennisetum thypoideum (cereal) - Mhatre et al, 1984
(quoted in Eurochlor, 1999)
Octochaetus pattoni (earthworm) - various sources
quoted in Eurochlor, 1999.
Microorganisms ATP - Zelles et al., 1985 (quoted in
INERIS, 2000)
Eyrepocnemis plorans (grasshopper) - Devkota &
Schmidt, 1999 (quoted in USEPA ECOTOX data-base)
Plants
Data on NOECs for plants from three studies are presented by Eurochlor (1999) for
inorganic mercury.
No data are presented by INERIS (2000). Searches of the
USEPA’s ECOTOX data-base and a more general search of the Web of Science
abstract data-base produced some further information. Petra & Sharma (2000) review
the results of numerous studies on the impacts of mercury (both inorganic and
organic) upon plants. As would be expected, there is a consensus that organic
mercury is more toxic to plants than inorganic mercury.
For inorganic mercury (mercuric chloride), the lowest NOEC found was that of 0.125
mg/kg dw presented in Eurochlor (1999) based on the effects on leaf area and leaf
injury of short-term (24 hr) exposure to mercuric concentrations in the range 1 - 1,000
µg/l. It is considered that this value may err on the side of pessimism as it is
noticeably lower than the values reported elsewhere (and, indeed, was assigned a
‘validity score’ of 3 by Eurochlor to indicate a low level of reliability).
Page 91
Mercury Products - Risks to Health and the Environment
Earthworms
Limited data on NOECs for earthworms are presented by Eurochlor (1999) and
INERIS (2000). As for plants, searches of ECOTOX and the Web of Science were
undertaken but produced limited information.
For inorganic mercury (mercuric chloride), the lowest value found was that of 0.5
mg/kg dw presented in Eurochlor (1999) for Octochaetus pattoni based on a 60d
LCLo (lowest lethal concentration) for inhibition of reproduction (and an LC50 of
0.75 mg/kg dw). Clearly, the NOEC value will be lower.
Of note is that for organic mercury (methyl mercury chloride), the only NOEC found
was that of 3.7 mg/kg dw presented in INERIS (2000) for the ‘standard’ manure
worm (Eisenia foetida) based on an 84d test. This value can be compared with the
corresponding inorganic NOEC of 100 mg/kg dw47.
Micro-organisms
Limited data on NOECs for micro-organisms are presented by INERIS (2000),
although not by Eurochlor (1999). As before, searches of ECOTOX and the Web of
Science were undertaken but produced no significant findings.
For inorganic mercury (mercuric chloride), the lowest NOEC found was that of 1.4
mg/kg dw presented in INERIS (2000) for effects on levels of ATP (adenosine
triphosphate) based on a 48d test.
NOEC for other terrestrial species
Limited data on NOECs for other species are presented by Eurochlor (1999) for
inorganic mercury. No data are presented by INERIS (2000). As before, searches of
ECOTOX and the Web of Science were undertaken.
For inorganic mercury (mercuric chloride), the lowest NOEC found48 was that of
0.121 mg/kg dw for development effects on Eyrepocnemis plorans (grasshopper).
The same result was also obtained for another grasshopper species, Aiolopus
thalassinus.
47
48
Fischer E & Koszorus L (1992): Sublethal Effects, Accumulation Capacities and Elimination Rates of
As, Hg and Se in the Manure Worm, Eisenia Fetida (Oligochaeta, Lumbricidae), Pedobiologia, Vol 36
pp 172-178 (as reported on the USEPA ECOTOX data-base).
Devkota B & Schmidt GH (1999): Effects of Heavy Metals (Hg2+, Cd2+, Pb2+) during the Embryonic
Development of Acridid Grasshoppers (Insecta, Caelifera), Archives of Environmental Contamination
and Toxicology, Vol 36 pp 405-414 (as reported on the USEPA ECOTOX data-base).
Page 92
Risk & Policy Analysts
6.2.5 Terrestrial Compartment - Birds
The TGD and EUSES software model require data on NOECs for birds. NOEC
values were derived for inorganic mercury (typically mercuric chloride) and organic
mercury (typically methyl mercury chloride). Table 6.5 summarises the NOEC
values used with further detail provided below.
Table 6.5: Bird Data used in EUSES Modelling
Inorganic Mercury
NOEC (Feed)
NOEC
1.1 mg/kg feed
Source Document
Starlings - Nicholson et al., 1984 (quoted in Eurochlor,
1999 and INERIS, 2000)
Methyl Mercury
NOEC (Feed)
0.36 mg/kg feed
Pheasants (& chickens) - Gardiner, 1972 (quoted in
INERIS, 2000)
For inorganic mercury (mercuric chloride), the lowest NOEC found was that of 1.1
mg/kg feed presented in Eurochlor (1999) and in INERIS (2000) for starlings based
on a 56d test.
For organic mercury (methyl mercury chloride), the lowest NOEC found was that of
0.36 mg/kg feed presented in INERIS (2000) for pheasants and chickens based on a
20d test.
6.2.6 Terrestrial Compartment - Mammals
The EUSES software model requires data on NOAELs (no observed adverse effect
level) for oral, dermal and inhalation routes for mammals. NOAEL values have been
derived for inorganic mercury (typically mercuric chloride but also including
elemental mercury vapour) and organic mercury (typically methyl mercury chloride).
ATSDR (1999) presents an authoritative overview of the toxic effects of mercury and
its compounds on mammals and humans and has been used as the source document
for the values used in EUSES. Comparisons were also made with data presented in
Eurochlor (1999) and INERIS (2000).
Table 6.6 summarises the NOAEL values used with further detail provided below.
Table 6.6: Mammal Data used in EUSES Modelling
Inorganic Mercury
Oral
NOAEL
0.23 mg/kg/day
Dermal
Inhalation
Organic Mercury
Oral
0.23 mg/kg/day
0.075 mg/m3
0.011 mg/kg/day
Dermal
Inhalation
0.011 mg/kg/day
0.0075 mg/m3
Source Document
Rat - Dieter et al., 1992 & NTP, 1993 (quoted in
ATSDR, 1999)
Taken to be the same as for oral route (EUSES default)
Warfvinge et al., 1995 (quoted in ATSDR, 1999)
Monkey - by Kawaski et al., 1986 (quoted in INERIS,
2000)
Taken to be the same as for oral route (EUSES default)
Taken to be 10% of corresponding value for inorganic
mercury
Page 93
Mercury Products - Risks to Health and the Environment
Oral Route
For inorganic mercury, the lowest NOAEL was found to be 0.23 mg/kg/day (as
reported in ATSDR, 1999) for renal effects after a 26 wk test.
For organic mercury, the lowest ‘systemic’ NOAEL reported in ATSDR (1999) is
0.02 mg/kg/day (based on renal effects for a 2 year rat study undertaken by
Verschuuren et al., 1976). The same value is derived for neurological effects (based
on the ‘hopping reaction’ of cats after a 2 year study undertaken by Charbonneau et
al., 1976). Reference is also made to Bornhausen et al., 1980 in which the NOAEL
for developmental effects (performance in offspring) after 4 days exposure was
determined to be 0.004 mg/kg/day. However, ATSDR (1999) notes that this finding
has yet to be confirmed by other studies.
INERIS (2000) reports a NOEC of 0.22 mg/kg feed (based on a 1 year monkey study
undertaken by Kawaski et al., 1986). Using the NOEC (feed) to NOAEL (oral)
conversion (for monkeys) provided by EUSES gives a NOAEL of 0.011 mg/kg/day
and it is this value which will be taken forward in the analysis.
Dermal Route
No data on the effects of dermal exposure are reported by ATSDR (1999) nor by
Eurochlor (1999) and INERIS (2000). For this route, the NOAEL has been assumed
to be the same as for the oral route (which is the EUSES default).
Inhalation Route
Data on inhalation toxicity generally relates to exposure of elemental mercury vapour.
ATSDR (1999) reports an inhalatory NOAEL of 0.1 mg/m3 (for renal effects based on
an 18 month study of various mammals undertaken by Ashe et al., 1953). For
immunological/lymphoreticular effects, ATSDR (1999) reports a slightly lower value
of 0.075 mg/m3 (based on a 10 wk study on mice undertaken by Warfvinge et al.,
1995) and this value will be taken forward in the analysis for inorganic mercury.
No data have been located for the effects on animals of inhalation of organic mercury
vapours. In the absence of such data, the NOAEL value has been assumed to be 10%
of that for inorganic mercury derived above.
Page 94
Risk & Policy Analysts
6.3
Human Toxicity
6.3.1 Overview
Limited data are presented on human toxicity in WS Atkins (1998). There is a wealth
of information on human toxicity of mercury and mercury compounds and much of it
has been reviewed in a comprehensive US report (ATSDR, 1999). Furthermore, an
authoritative review of mercury toxicity has been recently published by the World
Health Organisation (WHO, 2000). A further review of these and other key
documents has also been published recently by the UK Government (DEFRA, 2002).
Recent reviews which concentrate on the assessment of health effects of exposure to
methyl mercury include NIEHS (1999), National Research Council (2000) and US
EPA (2001). In broad terms, methylated mercury is more toxic than inorganic
mercury salts, which, in turn, are more toxic than elemental mercury. Interestingly,
the ingestion of elemental mercury (from, say, thermometers) is very unlikely to result
in adverse effects due to the very low absorption by the intestine (less than 0.01%)
The prime effects of exposure to mercury and its compounds are:
•
•
•
for mercury vapour (via inhalation), effects on the nervous system (for example,
tremors and memory loss) although these are often reversible;
for inorganic mercury compounds (via ingestion), the kidney is the target organ;
and
for organic mercury compounds (via ingestion), the damage is mainly to the
central nervous system and the effects are irreversible. Such effects have been
observed in children whose mothers were exposed to methyl mercury when
pregnant.
Mercury and its compounds are not considered to be carcinogenic.
The EUSES software model requires data on NOAELs (no observed adverse effect
level) for oral, dermal and inhalation routes for humans. NOAEL values have been
derived for inorganic mercury (typically mercuric chloride but also including
elemental mercury vapour) and organic mercury (typically methyl mercury chloride).
Table 6.7 summarises the NOAEL values used with further detail provided below.
Table 6.7: Human Data used in EUSES Modelling
Inorganic Mercury
Oral
Dermal
Inhalation
Organic Mercury
Oral
Dermal
Inhalation
NOAEL
2 µg/kg/day
2 µg/kg/day
0.2 µg/m3
Source Document
ATSDR (1999)
Taken to be the same as for oral route (EUSES default)
ATSDR (1999)
0.1 µg/kg/day
0.1 µg/kg/day
0.02 µg/m3
USEPA (2001)
Taken to be the same as for oral route (EUSES default)
Taken to be 10% of corresponding value for inorganic
mercury
Page 95
Mercury Products - Risks to Health and the Environment
6.3.2
Inhalation
About 80% of inhaled mercury vapour is absorbed via the lungs and retained by the
body. The absorption rate for inorganic mercury is about half of this value (although
it does depend on other factors - such as associated particle sizes). As already
mentioned (see Section 4.5.3), systemic effects have been observed after long-term
(occupational) exposure to levels of the order of 0.1 mg/m3. Some studies have
observed other effects, notably neurological, at lower concentrations (ATSDR, 1999)
- down to 0.026 mg/m3. On this basis and after various adjustments and safety
factors, the US has set an MRL (minimal risk level) for long term exposure to
mercury vapour as 0.2 µg /m3.
Although WHO (2000) reports some (human) effects at lower workplace exposure
levels - down to 0.01 mg/m3 - WHO has recommended a ‘safe’ guideline of 1 µg/m3.
These various calculations are illustrated in Box 6.1.
Box 6.1: Deriving a ‘Safe’ Level from Occupational LOAELs
1) WHO (2000):
LOAEL (workers):
Increase by a factor of three to correct for ‘true’ exposure:
Reduce by a factor of three to adjust for longer ‘public’ exposure:
Divide by 10 to account for variations in population sensitivity
Divide by 2 for LOAEL uncertainty:
20 µg/m3
60 µg/m3
20µg/m3
2 µg/m3
1 µg/m3
2) ATSDR (1999):
LOAEL (workers):
Reduce by a factor of 168/40 to adjust for longer ‘public’ exposure
(40 hours worker exposure vs 168 (24 x 7) hours public exposure):
Divide by 10 to account for variations in population sensitivity
Divide by 3 for LOAEL uncertainty:
26µg/m3
6.2 µg/m3
0.6 µg/m3
0.2 µg/m3
Several studies during recent decades demonstrated that mercury vapours are released
from dental amalgam filling into the oral cavity. The estimate for the rate of release
in people with amalgam fillings is 3 - 17 µg Hg/day (WHO, 1990). The concentration
of mercury vapour in the oral cavity can reach occupational health danger levels, but
the quantity of vapour is small because the volume of the cavity is small (Clarkson,
2002). Two well conducted epidemiological studies demonstrated that dental
amalgam did not affect mental health (Bjorkman et al., 1996; and Saxe et al., 1995).
The value taken forward in the analysis is a NOAEL value of 0.2 µg/m3 for inhalation
for inorganic mercury. No data have been located for the inhalation of organic
mercury and a value of 0.02 µg/m3 is assumed.
6.3.3 Dermal Exposure
Dermal exposure is not generally considered to be a significant route when
considering the toxicity of mercury and its compounds. However, ATSDR (1999)
reports a case in which the accidental spillage of a few drops of dimethyl mercury on
the latex gloves of a chemistry professor led to death within several months (via both
Page 96
Risk & Policy Analysts
dermal exposure - as the gloves were readily penetrated by the dimethyl mercury and inhalation).
The NOAEL values taken forward in the analysis are assumed to be the same as those
derived for the oral route (which is also the EUSES default).
6.3.4
Ingestion
Overview
As already noted, absorption of elemental mercury in the intestine is very low while
that for inorganic mercury compounds is of the order of 10-15%. By contrast, there is
almost complete absorption of methylated mercury compounds (WHO, 2000).
The greatest amount of work undertaken on mercury toxicity is in relation to ingestion
of mercury contaminated foodstuffs. This has been spurred by various tragedies
including Minamata and Niigata in Japan in which industrial discharges of methyl
mercury and other mercury compounds (during the late 1950s and early 1960s) led to
elevated levels of methyl mercury in fish. By 1971, 269 cases of Minamata disease49
had been reported of which 55 proved fatal and by 1989, there were 2217 confirmed
cases in Minamata and 911 in Niigata. In Iraq in 1971-72, ingestion of bread made
with cereals treated with organic mercury fungicides led to 6,000 hospital admissions
and 500 deaths (WHO, 1996).
Inorganic Mercury
Many of the ingestion toxicity tests relate to mercuric chloride which has been found
to be more toxic than the natural ore mercuric sulphide. Inspection of the results
presented in ATSDR (1999) suggests that the effects are dependent on the ingestion
rate (mg/kg bw/day50) rather than on the dose (ingestion rate x time). The most
susceptible part of the body appears to be the kidneys with reported NOAELs of 0.93
and 0.23 mg/kg/day for acute and intermediate exposures respectively. On this basis
and after various adjustments and safety factors, the US has set MRLs for acute and
intermediate ingestion exposures (to inorganic mercury) as 7 and 2 µg/kg/day
respectively. The latter value has been taken forward as the NOAEL value for the
oral route for inorganic mercury.
Organic Mercury
In relation to organic mercury, the greatest public health concern relates to methyl
mercury exposure from ingestion of contaminated food, particularly the edible tissue
of fish. All exposure intake values estimated for methyl mercury are presented in
Table 6.8.
49
50
The symptoms of Minimata disease are those of methyl mercury poisoning and include uncoordinated
movements, abnormal reflexes, speech problems and seizures.
mg/kgbw/day refers to mg ingested per kg of bodyweight per day (and is usually shortened to
mg/kg/day).
Page 97
Mercury Products - Risks to Health and the Environment
Table 6.8: Exposure Estimates for Methyl mercury and Percentage (%) of Total Exposure
Based on Adults in the General Population
Exposure Source
Exposure Estimate
(mg/kg/day)
4.3 x 10⁻⁹
5.6 x 10⁻⁸
0
Percent of Total
Exposure
0.005%
0.061%
0%
Percent of RfD1
Ambient water intake
0.004%
Drinking water intake2
0.056%
Nonfish dietary intake
0%
Freshwater/estuarine
6.5 x 10⁻⁵
70.6%
65.0%
fish intake
Marine fish intake
2.7 x 10⁻⁵
29.3%
27.0%
Air intake
4.6 x 10⁻⁹
0.005%
0.005%
Soil Intake
1.3 x 10⁻⁹
0.001%
0.001%
-5
Total intake
9.2 x 10
100%
92.1%
Source: US EPA (2001)
Notes:
1) The USEPA’s ‘reference dose’ (RfD) is set at 0.1 µg/kg/day (i.e. 1 x 10⁻⁴ mg/kg/day).
2) This represents the high end of the range of estimates. Because the contribution of ambient water
or drinking water intake to total exposure is so negligible in comparison to the sum of intake from
other sources, there is no difference in the total exposure estimated using either of these two
alternatives.
The major toxic effects of methyl mercury are on the central nervous system. The
mechanisms and outcomes of toxic effects on the developing brain differ from those
on the mature organ.
In adults, paresthesia (prickling sensation) is the first symptom to appear at the lowest
dose. This may progress to cerebellar ataxia (clumsiness or unsteadiness), dysarthria
(speech disorder), constriction of the visual fields and loss of hearing. These signs
and symptoms are caused by the loss of neuronal cells in specific anatomical regions
of the brain (Clarkson, 2002). Although, most epidemiological studies and clinical
reports on adults demonstrated signs and symptoms of toxic effects of methyl mercury
associated mainly with the central nervous system, recent reports indicate the
possibility that methyl mercury may have adverse effects on the cardiovascular
system (Salonen et al., 1995; Salonen et al., 2000).
A number of epidemiological studies involving new-borns and children from mothers
exposed to methyl mercury indicated higher susceptibility of the developing brain,
compared to the mature organ. The first such indications come from the studies of
Minamata and Iraq outbreaks of methyl mercury poisonings. It was possible to
construct a dose-response relationship between peak hair mercury levels in pregnancy
versus number of abnormal offspring showing developmental delays and abnormal
neurological findings (Marsh et al., 1987; Cox et al., 1989). There are no data to
indicate that methyl mercury is carcinogenic in humans.
The quantitative health risk assessment for non-carcinogenic chemicals is based on
the reference dose (RfD). This is an estimate of a daily exposure of the human
population, including sensitive subgroups, that is likely to be without an appreciable
risk of deleterious health effects during a lifetime. The earlier RfD of 0.1 µg/kg/day
Page 98
Risk & Policy Analysts
was established in 1995 by the US EPA as the Agency’s consensus estimate. Marsh
et al. (1987) was chosen as the most appropriate study at that time for determination
of an RfD to protect infants born to mothers exposed to methyl mercury during
pregnancy.
Since that time, considerable new data on the health effects of methyl mercury have
appeared in the literature. Neurotoxicity, particularly in developing organisms, has
been observed as the adverse effect at the lowest dose of methyl mercury. The
National Research Council (NRC) of the National Academy of Sciences in the USA
and US EPA considered three epidemiological studies most suitable for quantitative
risk assessment: the Seychelles Child Development Study (Davidson et al., 1998 &
2001); studies of Children in the Faroe Islands (Grandjean et al., 1997; Murata et al.,
1999); and the study of Children in New Zealand (Mitchell et al., 1982). All cohorts
consisted of children exposed in utero through maternal consumption of contaminated
marine food.
In both the Faroe Islands and the New Zealand studies,
neurodevelopmental toxic effects of methyl mercury were found to be dose-related.
These effects include developmental deficits in memory, attention and language. No
evidence of impairment associated with exposure was found in the Seychelles study.
In 1999, ATSDR published a revised Minimal Risk Level for methyl mercury of 0.3
µg/kg/day, based on a dose of 1.3 µg/kg/day derived from the Seychelles study data,
which does not necessarily reflect the NOAEL.
The Committee on Toxicological Effects of Methylmercury, established in 1999 by
the US National Research Council, reviewed and evaluated scientific data on health
effects of methyl mercury. In its published report, NRC (2000) concluded that
differences in the study designs and in the characteristics of the study populations
might explain the differences in findings between the Faroe and Seychelles studies.
Taking into account that a large body of scientific evidence showing adverse
developmental neurotoxic effects was available from well-designed epidemiological
studies, the Committee concluded that a RfD should not be derived from a study such
as the Seychelles study which did not observe any associations with exposure to
methyl mercury. Given the strength of the Faroe Islands study, the Committee
concluded that it would be most appropriate if a RfD was derived from this critical
study.
US EPA followed the recommendations of the NRC in the subsequent development of
a RfD. The critical endpoint was drawn from the series of neuropsychological test
results from the Faroese cohort. The RfD derived in this assessment is 0.1 µg/kg
bw/day. In the published document (US EPA, 2001), the authors emphasise that there
are currently no data that would support the derivation of a RfD applicable to children
specifically. The derived RfD is applicable to lifetime daily exposure for all
populations including sensitive subgroups - with particular reference to preventing the
occurrence of developmental effects amongst children whose mothers are exposed to
methyl mercury during pregnancy.
Page 99
Mercury Products - Risks to Health and the Environment
Page 100
Risk & Policy Analysts
7.
RISK CHARACTERISATION
7.1
Overview
The purpose of the risk characterisation is to assess whether the predicted
concentrations in the environment exceed those concentrations which produce adverse
effects in either the environment or in humans. The TGD procedure (as incorporated
into EUSES) involves:
•
•
•
•
selecting the lowest NOEC for the area of interest (based on the toxicity data
presented in Section 6);
dividing the lowest NOEC by an assessment (or safety) factor to derive the PNEC
(predicted no-effect concentration);
selecting the appropriate PEC (based on the results of the EUSES analysis
presented in Section 5); and
dividing the PEC by the PNEC to give an indication of the level of the associated
risk.
Where there are several relevant NOECs (as in this case), the TGD (and EUSES)
recommends an assessment factor of 10. However, in the case of metals, it is
anticipated that a lower factor will be incorporated into the revised TGD. At an
expert workshop51, it was agreed that a value between 1 (exceptionally) and 5 would
be more appropriate. For this analysis, an assessment factor of 5 will be used to err
on the side of caution and to reflect some of the uncertainties in both the analysis and
the derivation of NOECs.
7.2
Risks to the Environment
7.2.1
Aquatic Environment
The lowest NOECs derived for the aquatic environment were 0.3 and 0.03 µg/l for
inorganic and organic mercury respectively (see Table 6.1). Applying an assessment
factor of 5 gives PNECs of 0.06 µg/l (60 ng/l) and 6 ng/l respectively. Since
measured concentrations (for inorganic mercury) are typically in the range 1 - 10 ng/l
(see Table 4.1), it can be seen that only PECs which are far in excess of existing
concentrations will to lead to PEC/PNEC ratios of greater than one.
The resultant PEC/PNEC ratios for the PECs associated with mercury production,
product manufacture and product use are presented in Table 7.1. Since the ‘local’
PEC values are very similar to the regional PEC value (see Table 5.10), the regional
and local PEC/PNEC ratios are very similar.
51
Report of the Expert Consultation Workshop on Statistical Extrapolation Techniques for
Environmental Effects Assessment held in London, 17/18 January 2001 to discuss aspects of the
revised TGD.
Page 101
Mercury Products - Risks to Health and the Environment
Table 7.1: PEC/PNEC Ratios for the Aquatic Environment (Water) for Mercury & Products
Mercury Species
Parameter
Inorganic
Regional PEC/PNEC associated with
manufacture and use of mercury in products
0.011
under study
Local PEC/PNEC ratios associated with mercury production:
Primary production (Spain)
Production from non-ferrous by-products
0.011
Secondary production
Organic
0.011
0.011
Local PEC/PNEC ratios associated with product manufacture:
Dental amalgam
0.011
0.011
Batteries
0.012
0.012
Lamps
0.011
0.011
Measuring equipment
0.011
0.011
Electrical equipment
0.011
0.011
EUSES also derives a PNEC for sediments (based on the PNEC for water), which for
inorganic mercury was estimated to be 7.56 mg/kg dw and for organic mercury, a
PNEC of 21.3 µg/kg dw was derived52. The associated PEC/PNEC ratios are
presented in Table 7.2.
Table 7.2: PEC/PNEC Ratios for the Aquatic Environment (Sediment) for Mercury & Products
Parameter
Mercury Species
Inorganic
Regional PEC/PNEC associated with
manufacture and use of mercury in products
0.011
under study
Local PEC/PNEC ratios associated with mercury production:
Primary production (Spain)
Production from non-ferrous by-products
0.006
Secondary production
Organic
0.38
0.22
Local PEC/PNEC ratios associated with product manufacture:
Dental amalgam
Batteries
Lamps
0.006
0.22
Measuring equipment
Electrical equipment
52
The calculation of the PNEC in sediment (TGD Eqn. 54) depends directly on the solid-water partition
coefficient in sediment - i.e. the resultant PNEC varies with the value used. Whilst Eurochlor (1999)
and INERIS (2000) use the same value (126,000 l/kg) derived for inorganic mercury, Sunderland &
Gobas (2001) suggest a much lower value of 100 l/kg. In this analysis, a geometric mean of 3,550 was
used.
Page 102
Risk & Policy Analysts
It may be noted that as local PEC values were not generated by EUSES (see Table
5.11), it was necessary to have a ‘shadow’ EUSES run based on methyl mercury
chloride and then to scale the ‘local’ results against the pre-derived ‘regional’ values
(i.e. 10% of the inorganic values as presented in Table 5.11).
As can be seen from Tables 7.1 and 7.2, the PEC/PNEC ratios are generally well
below unity in all cases. The exceptions are the results for organic mercury in
sediments where relatively higher results were obtained due, in part, to the choice of
partition coefficient.
7.2.2 Terrestrial Compartment
The lowest NOEC derived for the terrestrial environment was 0.121 mg/kg dw for
inorganic mercury (see Table 6.4). Applying (as for the aquatic compartment) an
assessment factor of 5 gives a PNEC of 24 µg/kg dw. Since existing concentrations
are typically in the range 50 - 100 µg/kg dw (see Table 4.1), it can be seen that PECs
which contribute significantly to the existing concentrations may lead to PEC/PNEC
ratios of greater than one.
The associated PEC/PNEC ratios are presented in Table 7.3.
Table 7.3: PEC/PNEC Ratios for the Terrestrial Environment for Mercury & Products
Parameter
Mercury Species: Inorganic
Regional PEC/PNEC associated with
manufacture and use of mercury in products
0.18
under study
Local PEC/PNEC ratios associated with mercury production:
Primary production (Spain)
0.25
Production from non-ferrous by-products
0.19
Secondary production
0.19
Local PEC/PNEC ratios associated with product manufacture:
Dental amalgam
0.19
Batteries
0.19
Lamps
0.20
Measuring equipment
0.19
Electrical equipment
0.19
As can be seen from Table 7.3, the PEC/PNEC ratios are below unity in all cases.
7.2.3
Secondary Poisoning
EUSES considers two routes to secondary poisoning of birds or mammals:
•
•
water to fish to fish-eating birds or mammals; and
soil to earthworm to worm-eating birds or mammals.
Page 103
Mercury Products - Risks to Health and the Environment
These food chains are associated with organic mercury in the aquatic environment and
with inorganic mercury in the terrestrial environment. PNECs are derived from
NOEC data presented in Section 6 on birds (Table 6.5) and mammals (Table 6.6) as
well as accounting for the bio-concentration factors. These values are then compared
to the water and soil PECs at a ‘local’ level and the results are summarised in Table
7.4.
Table 7.4: PEC/PNEC Ratios for Local Secondary Poisoning for Mercury & Products
Aquatic Food Chain
(Organic Mercury)
Local PEC/PNEC ratios associated with mercury production:
Primary production (Spain)
Production from non-ferrous by-products
0.92
Secondary production
Scenario
Terrestrial Food Chain
(Inorganic Mercury)
<0.001
Local PEC/PNEC ratios associated with product manufacture:
Dental amalgam
0.92
Batteries
Lamps
Measuring equipment
0.93
<0.001
Electrical equipment
As can be seen from Table 7.4, PEC/PNEC ratios are predicted to approach unity for
the aquatic food chain due not only to the low PNECs for organic mercury but also to
the high bio-concentration factor used (50,000). By contrast, there is a negligible risk
of secondary poisoning via the terrestrial food chain. The results of the risks to the
environment are discussed further in Section 7.4.
7.3
Risks to Humans
7.3.1 Direct Risks
No attempt has been made to quantify risks in the workplace due to the high level of
awareness of mercury risks and the (generally) strict measures which have been taken
to reduce worker exposures.
7.3.2
Man Exposed via the Environment
The ‘margins of safety’ (MOS) for man exposed via environmental routes are shown
in Table 7.5 using the ‘reference doses’ of 2 and 0.1 µg/kg bw/day for inorganic
(including elemental) and organic mercury respectively (see Table 6.7). The MOS
values are simply the ratios of the reference dose to the human intake of the substance
via the environment (including inhalation, dietary intake, etc.) for each scenario.
Page 104
Risk & Policy Analysts
EUSES calculates the MOS for both inhalation (MOS-air) and total environmental
exposure (MOS-total) and both are presented in Table 7.5. For mercury, the MOS-air
values will tend to be associated with elemental mercury whilst the MOS-total values
will tend to be associated with dietary intake of inorganic and organic mercury.
As can be seen from Table 7.5, the MOS values exceed unity in all cases.
Table 7.5: Margin of Safety (MOS) Values for Human Exposure via the Environment for
Mercury & Products at Regional and Local Levels
Parameter
MOS-Air
(Mercury)
Regional MOS values associated with
manufacture and use of mercury in products
>100
under study
Local MOS values associated with mercury production:
6.5
Primary production (Spain)
>100
Production from non-ferrous by-products
>100
Secondary production
MOS-Total
(Inorganic)
MOS-Total
(Organic)
>100
18
>100
18
>100
18
Local MOS values associated with product manufacture:
Dental amalgam
>100
Batteries
>100
Lamps
7.4
55
Measuring equipment
>100
Electrical equipment
>100
Discussion
As detailed in the Technical Guidance Document (TGD), there are three broad
conclusions that can be drawn from an environmental risk assessment of an existing
substance.
•
•
•
Conclusion (i) there is a need for further information and/or testing;
Conclusion (ii) there is at present no need for further information and/or testing
and no need for risk reduction measures beyond those which are being applied
already; or
Conclusion (iii) there is a need for limiting the risks; risk reduction measures
which are already being applied shall be taken into account.
As stated in the TGD, where the PEC/PNEC ratio is found to be less than or equal to
one for each compartment, Conclusion (ii) shall apply. As can be seen from Tables
7.1 to 7.4, this condition is met for the use of mercury in the products under study although the PEC/PNEC ratio approaches unity in relation to secondary poisoning via
the aquatic food chain. In other words, further risk reduction measures (over and
beyond those already planned) would not be required on the basis of the risk
assessment alone.
Page 105
Mercury Products - Risks to Health and the Environment
However, it is recognised that there is widespread concern over the presence of
mercury in the environment and a desire to further limit the potential impacts of
mercury usage. Although it would appear that the broad objective of the Aarhus
Convention (see Section 1.2) to reduce mercury emissions to below 1990 levels has
been met (since most uses show a significant decline during the 1990s), the
Convention requires further precautionary measures to be considered. Similarly,
HELCOM and OSPAR have an interest in reducing mercury emissions to the marine
environment.
Under the revised TGD, which is in preparation, there is little doubt that mercury and
its compounds will be designated PBT (persistent, bioaccumulative and toxic)
substances in respect of the marine environment. Such factors led to the designation
of mercury and its compounds as priority hazardous substances under the Water
Framework Directive which will necessitate consideration to be given to further
reductions in usage and emissions.
In relation to human toxicity, the assessment of human exposure via the environment
suggests that there is a considerable margin of safety (i.e. MOS >1) associated with
the products under study as shown in Table 7.5. However, the developmental
toxicity effects of methyl mercury may result in further pressures to limit the use and
emissions of mercury and its compounds.
Of the estimated 160 t/year of mercury emitted to the environment from
anthropogenic sources in the EU and the three accession countries (EC, 2001b), the
products under study account for less than 25 t/year. There may, however, be areas
where further reductions could be achieved in usage and/or associated emissions
across the range of products examined here. Such reductions should be proportional
to the relative emissions within the context of the overall anthropogenic use of
mercury and the associated emissions.
In relation to the products under study, dental amalgam is the largest use with over 10
t/year of mercury being emitted to the environment. The dominant source of
emissions is releases from crematoria and this may be an area for further
investigation. Measuring and control equipment would also appear to be a key source
with emissions of 8.5 t/year - primarily to the atmosphere from landfills. Within this
sector, there may be areas where usage and/or emissions could be reduced. The other
three products areas (batteries, lighting and electrical equipment) have significantly
lower usage and associated emissions.
More generally, it is worth noting that the production of skin lightening creams
involves the consumption of mercury in greater quantities than those used for
measuring and control equipment - although as discussed in Section 3.7, this may be
an area where more enforcement rather than more controls is required.
Finally, it is important to stress that any proposed controls would need a further
investigation of the advantages and drawbacks under the requirements of the
Marketing and Use Directive (76/769/EEC).
Page 106
Risk & Policy Analysts
8.
OVERALL FINDINGS
8.1
Mercury Use in Products under Study
It has been possible to characterise the use of mercury in the main product groups
which are the subject of this study - dental amalgam, batteries, discharge lamps,
measuring (and control) equipment and electrical control and switching equipment.
Although research and consultation has enabled aspects of the various lifecycles to be
quantified, comprehensive data were not obtained for all areas with particular
reference to the last two product groups (measuring (and control) equipment and
electrical control and switching).
The mercury used in the products within the EU (and the three accession countries)
comes: from primary production (in Spain); as a by-product of non-ferrous metal
production; from a mercury recycling plant; or as an import (usually within the
product, as in the case of thermometers). Some data on these production routes (and
associated emissions) were obtained but determining the precise scale and extent of
the mercury ‘business’ proved difficult. However, it would appear that the recovery
of mercury from decommissioned chlor-alkali facilities is rapidly become the major
source of mercury within the EU.
Overall, there is clear evidence that the use of mercury in batteries and lamps has
significantly reduced in recent years. There has also been a decline in the use of
dental amalgam and, as importantly, there has been a significant increase in the use of
mercury recovery devices (separators) in dental surgeries. Although there has been a
reduction in the use of mercury thermometers and sphygmomanometers (for
measuring blood pressure), it has been difficult to estimate the overall use of mercury
within this sector. Similarly, whilst there has been a move away from the extensive
use of mercury tilt switches in domestic products (including cars, white goods, etc.),
the extent of mercury use in other applications within this sector has been difficult to
determine.
For each product group, it was possible to develop a flowchart for the lifecycle and
associated emissions (based on an approach adopted by the Swedish authorities).
It is estimated that the current usage of mercury in these product groups is about 120
tonnes per year (60% of which is associated with dental amalgam) in the EU with,
perhaps, a further 50 tonnes per year used in the three accession countries under study
(Czech Republic, Poland and Slovenia). It is estimated that the emissions to the
environment associated with the production of mercury used in these products,
product manufacture and product use is less than 25 tonnes per year.
8.2
Mercury Use in Other Products
Mercury is used in numerous diverse products and applications, ranging from its use
in lighthouses (some lights revolve in a bath of mercury) to recoil suppression
systems in rifles. However, these account for a relatively low consumption with one
Page 107
Mercury Products - Risks to Health and the Environment
notable exception. It would appear that, perhaps, 50 tonnes per year of mercury is
used in the manufacture (within the EU) of skin lightening creams and other cosmetic
products, most of which are exported to, and consumed in, Africa. It should be noted
that the marketing of mercury containing cosmetic products (with the exception of
trace amounts in eye products) is not permitted within the EU.
8.3
Other Sources of Mercury
Large quantities (thousands of tonnes) of mercury are used in chlor-alkali plants
throughout the world. Most EU countries have such plants (as does the Czech
Republic and Poland) and current estimates of mercury consumption (within the EU)
are of the order of 150 tonnes per year. As indicated above, the planned phase-out of
mercury usage in chlor-alkali plants will lead to a substantial flow of recovered
mercury onto the market over the next 20 years (perhaps 650 tonnes per year within
Europe). The associated emissions (primarily to atmosphere) are estimated to be less
than 10 tonnes per year although significant amounts of mercury are unaccounted for.
Although mercury is a trace constituent of fossil fuels, fossil fuel consumption within
the EU may release in the order of a further 150 tonnes per year into the environment
which is comparable to a recent estimate that total anthropogenic emissions from the
EU (and the three accession countries) are of the order of 160 tonnes per year.
Apart from anthropogenic sources of mercury, there are ‘natural’ releases from forest
fires, volcanoes and ‘evaporation’ from the oceans. Within the EU, recent estimates
suggest that ‘natural’ emissions within the EU may amount to 200 tonnes per year.
8.4
Predicting Environmental Concentrations
The behaviour of mercury in the environment is complex. Most releases are in
elemental form to atmosphere which is then slowly oxidised to bivalent mercury
(inorganic mercury). The inorganic mercury enters the terrestrial and aquatic
environments through deposition. A portion of the inorganic mercury is methylated
(particularly within sediments) to produce methyl mercury (organic mercury) which
enters the water column.
Extensive research is ongoing into the precise reactions (physical, chemical and
biological) which govern the rates of transformation amongst the three main forms of
mercury in the different environmental compartments. There is, however, a general
consensus that the key concern is organic mercury, which is highly toxic and bioaccumulates - particularly in fish.
For this study, the EUSES model was used (with some modifications) to predict
mercury concentrations in the three main environmental compartments. In essence,
the model was run twice:
Page 108
Risk & Policy Analysts
•
•
Run 1: 100% of emissions considered to be as elemental mercury in order to
obtain predictions for the atmospheric compartment; and
Run 2: 100% of emissions considered to be as inorganic mercury (mercuric
chloride) to obtain predictions for the terrestrial and aquatic compartments.
The key inputs to the EUSES model were emissions (derived from an analysis of
mercury production, product manufacture, product use and subsequent recovery or
disposal) and toxicity data for humans and the environment. It was assumed, as a
worst case, that the organic mercury concentrations would be 10% of the inorganic
mercury concentrations.
The PECs (predicted environmental concentrations) for each compartment showed
that the products’ use, their manufacture and the production of the associated mercury
contributed a percent to typical existing concentrations at continental level. At a
regional level, the contribution was higher.
At a ‘local’ level (i.e. close to production facilities), significant air concentrations
(elemental mercury) were predicted close to the primary production site in Spain.
Otherwise, local values were very close to the regional values.
8.5
Risks Associated with Products under Study
Typical intakes of mercury are of the order of 10 µg/day. About 75% is elemental
and inorganic mercury, most of which is associated with the inhalation of vapours
from dental amalgam used in fillings. The remaining 25% is organic mercury
(primarily methyl mercury in fish and fish products). For this study, reference doses
of 2.0 and 0.1 µg per kg of bodyweight per day have been used as ‘safe’ levels for
inorganic (including elemental) and organic mercury respectively. The ‘margin of
safety’ (MOS) values can then be derived for the typical EU adult intake of 10 µg/day
as follows:
for inorganic mercury,
•
intake = 7.5 µg/day = 0.11 µg/kg bw/day (for a 65 kg adult);
•
‘safe’ level = 2.0 µg/kg bw/day; and
•
therefore, MOS = 2.0/0.11 = 18 (in other words, daily intake is 18 times below
safe levels)
for organic mercury,
•
intake = 2.5 µg/day = 0.04 µg/kg bw per day (for a 65 kg adult);
•
‘safe’ level = 0.1 µg/ kg bw/day; and
•
therefore, MOS = 0.1/0.04 = 2.5 (in other words, daily intake is 2.5 times
below safe levels)
Page 109
Mercury Products - Risks to Health and the Environment
At a regional level, MOS values associated with elemental and inorganic mercury
were found to be in excess of 100 (i.e. mercury intake is more than 100 times below
‘safe’ levels) whilst the MOS value for organic mercury was 18.
At a local level, MOS values associated with elemental mercury and inorganic
mercury were generally found to be in excess of 100 although the higher atmospheric
emissions close to the primary production site in Spain led to an MOS value of 6.5
and that for lamp production was found to be 55. For organic mercury, the local MOS
values were essentially the same as the regional value (18).
In terms of risks to the environment, the criterion of importance is the ratio of the
predicted environmental concentration (PEC) to the predicted no-effect concentration
(PNEC). PEC/PNEC ratios of greater than unity are indicators that there may be a
risk of concern and these were calculated at both regional and local levels.
PEC/PNEC ratios were derived for water, sediment, soil and (local) secondary
poisoning (poisoning through the predatory food chain). The key findings may be
summarised as follows:
•
•
•
•
8.6
for water, the PEC/PNEC ratios for inorganic and organic mercury were
significantly less than unity;
for sediment, the PEC/PNEC ratios were significantly less than unity for inorganic
mercury whilst those for organic mercury were in the range 0.2 - 0.4;
for soil, the PEC/PNEC ratios for inorganic mercury were about 0.2; and
for secondary poisoning, the PEC/PNEC ratios were significantly less than unity
for the terrestrial food chain (inorganic mercury) whilst those for the aquatic food
chain (organic mercury) approached unity (0.9).
Recommendations
Overall, using the TGD/EUSES approach (with modifications), it would appear that
there are unlikely to be significant risks to the environment associated with the
mercury containing products under study - with particular reference to dental
amalgam, batteries, lamps, measuring and electrical equipment. Of the products
under study, the key contributor is dental amalgam, which accounts for over half of
the mercury used.
The modelling results suggest that the risks are primarily associated with organic
mercury. However, given the complexity of the behaviour of mercury in the
environment, the modelling has necessitated simplifying assumptions which clearly
introduces a degree of uncertainty. Furthermore, changes to some critical parameters
(such as partition coefficients) can make significant changes to the results.
Nevertheless, in accordance with the TGD, the results suggest a Conclusion (ii) which
states that there is at present no need for further information and/or testing and no
need for risk reduction measures beyond those which are being applied already. To
Page 110
Risk & Policy Analysts
this, could be added or are already planned, since there are a number of Directives
(Water Framework Directive, RoHS Directive, ELV Directive, etc.) which will lead
to further controls on the usage and emissions of mercury.
However, it is recognised that there is widespread concern over the presence of
mercury in the environment and a desire to further limit the potential impacts of
mercury usage. Of the estimated 160 tonnes per year of mercury emitted to the
environment from anthropogenic sources in the EU and the three accession countries,
the products under study account for less than 25 tonnes per year. There may,
however, be areas where further reductions could be achieved in usage and/or
associated emissions across the range of products examined here. Such reductions
should be proportional to the relative emissions within the context of the overall
anthropogenic use of mercury and the associated emissions.
In relation to the products under study, dental amalgam is the largest use with over 10
tonnes per year of mercury being emitted to the environment. The dominant source of
emissions is releases from crematoria and this may be an area for further
investigation. Measuring and control equipment would also appear to be a key source
with emissions of 8.5 tonnes per year - primarily to the atmosphere from landfills.
Within this sector, there may be areas where usage and/or emissions could be
reduced. The other three products areas (batteries, lighting and electrical equipment)
have significantly lower usage and emissions.
More generally, it is worth noting that the production of skin lightening creams
involves the consumption of mercury in greater quantities than those used for
measuring and control equipment - although this may be an area where more
enforcement rather than more controls is required.
It is important to stress that any proposed controls would need a further investigation
of the advantages and drawbacks under the requirements of the Marketing and Use
Directive (76/769/EEC).
Finally, it is recommended that consideration should be given to classification and
labelling under Directive 67/548/EEC based upon the developmental toxicity of
methyl mercury and, perhaps, of other organic mercury compounds.
Page 111
Mercury Products - Risks to Health and the Environment
Page 112
Risk & Policy Analysts
9.
REFERENCES
AEA Technology (2001): Revision of the EU Ecolabel Criteria for Computers, report
prepared for the UK Department for the Environment, Food and Rural Affairs, dated
August 2001.
AEA Technology (2002): Development of EU Ecolabel Criteria for Televisions, report
prepared for the UK Department for the Environment, Food and Rural Affairs, dated
January 2002.
Aldenberg T & Slob W (1993): Confidence Limits for Hazardous Concentrations based on
Logistically Distributed NOEC Toxicity Data, Ecotoxicology and Environmental
Safety Vol 25, pp 48-63.
AMAP (2001): Heavy Metals, Fact Sheet 3 produced by the Arctic Monitoring and
Assessment Programme, downloadable form www.amap.no.
Arenholt-Bindslev D (1998): Environmental Aspects of Dental Filling Materials, European
Journal of Oral Sciences, Vol 106, pp 713-720.
ATSDR (1999): Toxicological Profile for Mercury, report prepared by Research Triangle
Institute for the US Agency for Toxic Substances and Disease Registry and dated
March 1999.
Bjorkman L et al. (1996): Physical and Mental Health Related to Dental Amalgam Fillings
in Swedish Twins. Comm. Dent.. Oral Epidemiol. Vol 24 pp260-267.
Central Statistics Office (2000): Environment 2000, Polish CSO, Warszawa.
Clarkson T.W. (2002): The Three Faces of Mercury, Environmental Health Perspectives,
Vol 110 (Suppl.1), pp 11-23.
Clean Technology Centre (1999): Inventory and Tracking of Dangerous Substances used
in Ireland and Development of Measures to Reduce their Emissions/Losses to the
Environment: A-4 Mercury, report prepared for the Irish EPA and dated December
1999.
Cox C et al. (1989): Dose-response Analysis of Infants Prenatally Exposed to
Methylmercury: an application of a single compartment model to single-strand hair
analysis, Env.Res Vol 49, pp 318-332.
Danish EPA (2000a): Warning: Sale of Mercury Soaps is Banned, press release of 22
March 2000, Danish Environmental Protection Agency, Copenhagen and available
from www.mst.dk/news/0280000.htm.
Danish EPA (2000b): Warning: New Findings of Dangerous Mercury Soaps, press
release of 7 December 2000, Danish Environmental Protection Agency, Copenhagen
and available from www.mst.dk/news/0210000.htm.
Davidson PW et al. (1998): Effects of Prenatal and Postnatal Methylmercury Exposure from
Fish Consumption on NeuroDevelopment: Outcomes at 66 months of age in the
Seychelles child development study, JAMA, Vol 280, pp 701-707.
Davidson PW et al. (2001): Methylmercury and Neurodevelopment: Reanalysis of the
Seychelles Child Development Study Outcomes at 66 Months of Age, JAMA, Vol 285,
pp 1291-1293.
DEFRA (2001): Dental Amalgam: An Environmental Code of Practice, consultation
document issued by UK Department for Environment, Food & Rural Affairs.
Page 113
Mercury Products - Risks to Health and the Environment
DEFRA (2002): Contaminants in Soil: Collation of Toxicological Data and Intake
Values for Humans - Mercury, R&D Publication TOX 7 published by the UK
Department for Environment, Food & Rural Affairs and Environment Agency.
Ecology Center et al (2001): Toxics in Vehicles: Mercury - Implications for Recycling
and Disposal, report dated January 2001.
Elliot M (ed) (2000): Archer’s Reference Guide (Recurve), Balbardie Archers, 3rd Edition
dated December 2000 and available from www.socalarchery/Archey%20Info/
archref_02.pdf.
EMEA (2000): EMEA Position Statement - Recent Developments Concerning Thiomersal in
Vaccines, London, European Agency for the Evaluation of Medicinal Products. This
and related documents available from www.eudra.org/emea.html.
Environment Canada (2000): The Status of Mercury in Canada, Report #2 - A
Background Report to the Commission for Environmental Cooperation, North
American Task Force on Mercury, Environment Canada, Transboundary Air Issues
Branch, Ontario, dated May 2000 and available from: www.cec.org/
programs_projects/pollutants_health/smoc/pdfs/hgcan-e.pdf.
Environment Canada (not dated): Managing Mercury-Bearing Electrical Products,
Pollution Prevention Fact Sheet #21 available from www.on.ec.gc.ca/epb/fpd/fsheets/
4021-e.html.
EPBA (2001): EPBA Position Paper on DG Environment Proposal for a EU Battery
Directive, dated 17 April 2001 and available from www.epba-europe.org
EPIA (2002): European Packaging and Interconnection: At the Forefront of Electronics,
European Packaging and Interconnection Industries Association, Brussels available
from www.eeca.org/pdf/epiaflyer.pdf.
ERM (1996): Mercury in the UK, report for UK Department of the Environment dated
March 1996.
ERM (1998): Analysis of the Advantages and Drawbacks of Restricting the Marketing
and Use of Mercury in Certain Products, report prepared for DG Industry (now DG
Enterprise) and dated December 1998.
ERM (2000): Mercury Concerns in Decommissioning Chlor-alkali Facilities in Western
Europe, report prepared for the Dutch Ministry of Housing, Spatial Planning and the
Environment and dated September 2000.
ERM (2001): Assessment of the Environmental Impacts Associated with the Transport
of Waste Batteries in Europe, report prepared for the European Portable Battery
Association and dated August 2001.
Eurochlor (1999): Risk Assessment - Mercury, Final Report dated June 1999 (available on
UNEP website and from Eurochlor).
Eurochlor (1999a): Risk Assessment for the Marine Environment - Mercury, Report
prepared for OSPARCOM and dated August 1999.
Eurochlor (2001): Reduction of Mecury Emissions from the West European Chlor
Alkali Industry, document dated June 2001 (available on UNEP website and from
Eurochlor).
European Commission (1996): Technical Guidance Document in Support of Commission
Directive 93/67/EEC on Risk Assessment for New Notified Substances and
Page 114
Risk & Policy Analysts
Commission Regulation (EC) No 1488/94 on Risk Assessment for Existing
Substances, Luxembourg, European Commission (in 4 volumes).
European Commission (2001): Eurostat Yearbook : The Statistical Guide to Europe,
Data for 1998-99, Luxembourg, European Commission.
European Commission (2001a): IPPC Reference Document on Best Available Techniques
in the Non-Ferrous Metals Industries, available from the European IPPC Bureau
(www.eippcb.jrc.es) and dated December 2001.
European Commission (2001b): Ambient Air Pollution by Mercury (Hg) Position Paper,
Luxembourg, Commission of the European Communities.
Falandysz J et al. (2002): Total Mercury and its Bioaccumulation Factors of Mushrooms
from the Zaborski Landscape Park, Poland, paper presented at SETAC Europe 12th
Annual Meeting, 12-16 May 2002, Vienna.
FDA (2001): Mercury Compounds in Drugs and Food, Center for Drug Evaluation and
Research , US Food and Drug Administration and available from www.fda.gov/cder/
fdama/mercuryreport.htm.
Finnish Environment Institute (1999): Finnish Expert Report on Best Available
Techniques in Zinc Production, Helsinki, Edita Ltd.
Gilmour CC et al. (1998): Methylmercury Concentrations and Production Rates across a
Trophic Gradient in the Northern Everglades, Biogeochemcistry, Vol 40, pp327-345.
Gnamuš A et al. (2000): Mercury in the Soil-Plant-Deer-Predator Food Chain of a
Temperate Forest in Slovenia, Environmental Science and Technology, 34 (16), p
3337.
Grandjean P et al. (1997): Cognitive Deficit in 7-Year-Old Children with Prenatal Exposure
to Methylmercury, Neurotoxicol. Teratol. Vol 19 pp 417-428.
Gucia M et al. (2002): Bioconcentration Features of Mercury in Mushrooms in Trojmiejski
Landscape Park, Poland, paper presented at SETAC Europe 12th Annual Meeting,
12-16 May 2002, Vienna.
Harrison (2001): Mercury Arc Rectifiers, Online Museum of Electronic Equipment,
available from www.netcmuk.co.uk/~wwl/mercarc.html.
HELCOM (2001): Mercury - A Compilation of the Information given by the
Contracting Parties, Working Document from the Helsinki Commission dated
October 2001.
Horvat M et al. (2000): Past and Current Status of Mercury Research carried out by the
Jožef Stefan Institute, Slovenia.
ICON (2001): Lead: the Facts, report prepared by Imperial College Consultants Ltd., dated
December 2001 and available from www.ldaint.org/factbook/index.htm.
INERIS (2000): Mercury and its Derivatives, report by the French Institut National de
l’Environnement Industriel et des Risques, dated July 2000.
Inland Ispat Indiana Harbor et al (2001): A Guide To Mercury Reduction In Industrial
And Commercial Settings, report dated July 2001 and available from www.deltainstitute.org/publications/Steel-Hg-Report-0627011.pdf.
INRS (2002): Risks to Health and the Environment related to the Use of Mercury in
Products, a note prepared for RPA by INRS (Institut National de Recherche et de
Securité) summarising relevant points from the French submission to UNEP.
Page 115
Mercury Products - Risks to Health and the Environment
Jones AB & Slotton DG (1996): Mercury Effects, Sources and Control Measures, report
published by the San Francisco Estuary Institute and dated September 1996
Jörgens H & Busch P-O (2000): Germany: Self-Commitment on the Collection and Recovery
of Spent Batteries and the Reduction of Mercury Content in Batteries, presented to the
NEAPOL conference in Ghent, Nov 30 - Dec 1, 2000.
JRC (1997): EUSES - European Union System for the Evaluation of Substances, Ispra
(Italy), European Commission Joint Research Centre.
Kahlsico (2000): Mercury Switches. Tilt Actuated Electrical Switches and Transducers.
Kahl Scientific Instrument Corp (www.kahlsico.com/mercuryswitches.html).
KEMI (1997): Mercury in Products - A Source of Transboundary Pollutant Transport,
Report 10/97 by the Swedish National Chemicals Inspectorate (KEMI), Stockholm.
Land & Water Resources Council (1999): Labeling and Collection of Mercury-Added
Products, report for the Maine Legislature dated January 1999.
Lee DS et al. (2000): Sources, Sinks and Levels of Atmospheric Mercury in the UK,
DERA report prepared for UK Dept. of the Environment, Transport and the Regions
and dated December 2000.
Lindqvist O et al. (1991): Mercury in the Swedish Environment: Recent Research on Causes
Consequences and Corrective Methods, Water, Air and Soil Pollution, Vol 55 (1-2).
MAFF (1999): UK 1997 - Total Diet Study, Ministry of Agriculture, Fisheries and Food
Surveillance Information Sheet No. 191 dated November 1999 and available from
www.foodstandards.gov.uk/maff/archive/food/infsheet.
Maine State (not dated): Maine’s Voluntary Mercury Manometer Replacement
Program, Maine Department of Environmental Protection and available from:
www.state.me.us/dep/rwm/publications/hgmanometer.htm
Marsh DD et al. (1987):
Fetal Methylmercury Poisoning: relationship between
concentration in single strands of maternal hair and child effects, Arch. Neurol. Vol
44, pp 1017-1022.
Mason RP et al. (1994): The Biogeochemical Cycling of Elemental Mercury - Anthropogenic
Influences, Geochem. Cosmochim. Acta, 58(15), p3198, as cited in UNEP (2002).
Maxson P A et al (1991): Mercury - Rational Paths Through Uncharted Territory, report
prepared for DG Environment and dated December 1991.
MDA (2000): Blood Pressure Measurement Devices – Mercury and Non-mercury,
Medical Devices Agency Device Bulletin dated July 2000, London, UK Department
of Health.
Mitchell JW et al. (1982): Mercury in Takeaway Fish in New Zealand, N.Z. Med. J., Vol
95(702), pp 112-114.
Montgomery T (2001): Industrial Temperature Primer, Wilkerson Instrument Company,
Lakeland, Florida, USA and available from www.wici.com/technical_info/articles/
temp_primer.pdf
Murata K et al. (1999): Evoked Potentials in Faroese Children Prenatally Exposed to
Methylmercury, Neurotoxicol. Teratol. Vol 21, pp 471-472.
National Research Council (2000): Toxicological Effects of Methylmercury, Committee on
the Toxicological Effects of Methylmercury, National Research Council, Washington,
DC, National Academy Press.
Page 116
Risk & Policy Analysts
NEMA (2000): Environmental Impact Analysis: Spent Mercury-Containing Lamps,
report by the (US) National Electrical Manufacturers Association dated January 2000
and available from www.nema.org/papers/enviimpact.doc.
NERI (1999): Mercury in Soap in Tanzania, National Environmental Research Institute
Technical Report No 306, Copenhagen, Danish Ministry of Environment and Energy.
NIEHS (National Institute of Environmental Health Sciences) (1999) Scientific Issues
relevant to Assessment of Health Effects from Exposure to Methylmercury, workshop
organised by Committee on Environmental and Natural Resources (CENR), Office of
Science and Technology Policy (OSTP), The White House, 18-20 November 1998.
Nordic Ecolabelling (2000): Ecolabelling of Primary Batteries Criteria Document, dated
14 December 2000.
Nordic Ecolabelling (2000a): Ecolabelling of Rechargeable Batteries Criteria Document,
dated 23 March 2000.
NRM (2001): Mercury in Petroleum and Natural Gas: Estimation of Emissions from
Production, Processing and Combustion, USEPA Report EPA-600/R-01-066
prepared by the National Risk Management Research Laboratory, dated September
2001.
OECD (1995): Risk Reduction Monograph No. 4 Mercury, Paris, OECD.
OSPAR (1997): Background Document on Further Restrictions on the Discharge of
Mercury, Oslo and Paris Commissions.
OSPAR (2000): OSPAR Background Document on Mercury and Organic Mercury
Compounds, OSPAR Commission.
OSPAR (2001): Mercury Losses from the Chlor-Alkali Industry in 1999, OSPAR
Commission.
Patra M & Sharma A (2000): Mercury Toxicity in Plants, Botanical Review, Vol 66, #3, pp
379-422.
RIVM (1999): Assessment of Air Quality for Arsenic, Cadmium, Mercury and Nickel in
the Netherlands, RIVM Report 729999 002 dated December 1999.
RIVM (2001): Dutch Environmental Data Compendium, Bilthoven (the Netherlands),
RIVM and available from www.rivm.nl/environment/data.
Salonen JT et al. (1995): Intake of Mercury from Fish, Lipid Peroxidation and Risk of
Myocardial Infarction and Coronary Cardiovascular and Any Death in Eastern
Finnish Men, Circulation, Vol 91, pp 645-655.
Salonen JT et al. (2000): Mercury Accumulation and Accelerated Progression of Carotid
Atherosclerosis: a population based prospective 4-year follow-up study in men in
eastern Finland, Atherosclerosis, Vol 148, pp 265-273.
Sass B M et al (1994): Mercury Usage and Alternatives in the Electrical and Electronics
Industries, Risk Reduction Engineering Laboratory, US EPA Report EPA/600/R94/046\7, dated January 1994.
Saxe SR et al (1995): Dental Amalgam and Cognitive Function in Older Women: Findings
from the Nun Study, J.Am.Dent.Assoc. Vol 126, pp 1495-1501.
Schmid J et al. (2000): Dangerous Substances in Waste, European Environment Agency
Technical Report No. 38, dated February 2000 and available from www.eea.eu.int.
Page 117
Mercury Products - Risks to Health and the Environment
Slooff W et al (1995): Integrated Criteria Document Mercury, Bilthoven (NL), National
Institute of Public Health and Environmental Protection (report for DG Environment).
SHP (2000): Is There Mercury in Your Coulter Counter? Sustainable Hospitals Project,
Lowell Center, Massachusetts and available from: www.sustainablehospitals.org/
HTMLSrc/IP_Merc_Coulter.html.
Sunderalnd EM & Gobas FAPC (2001): Development of a Mercury Cycling Model for
the Bay of Fundy/Gulf of Maine Region, Progress Report prepared for the Gulf of
Maine Council on the Marine Environment and dated February 2001.
SWAP (2000): The Issues Surrounding the Collection and Identification of PostConsumer Batteries, report by Save Waste and Paper Ltd. for the UK National
Household Hazardous Waste Forum, dated March 2000.
SWAP (2000a): An Evaluation of Silver Oxide Button Cell Recycling, report by Save
Waste and Paper Ltd. for the UK National Household Hazardous Waste Forum, dated
January 2000.
Sznopek JL & Goonan TG (2000): The Materials Flow of Mercury in the Economies of
the United States and the World, US Geological Survey Circular 1197 and available
from http://greenwood.cr.usgs.gov/pub/circulars/c1197.
Torke K (1994): Best Management Practices for Hospitals and Medical Facilities, Palo
Alto Regional Water Quality Control Plant, Palo-Alto, California and available from
www.city.palo-alto.ca.us/cleanbay/pdf/hosp.pdf.
UMN (not dated): Useful Life Of Equipment, University of Minnesota Purchasing Services,
and available from www.purchasing.umn.edu/documents/Methods/Equip.html.
UNECE (1998): 1998 Aarhus Protocol on Heavy Metals, signed by 36 members of the UN
Economic Commission for Europe in June 1998 and available from
www.unece.org/env.
UNEP (2001): Global Mercury Assessment, submissions from EU Governments and others
can be inspected (and downloaded) from www.chem.unep.ch/mercury.
UNEP (2002): Global Mercury Assessment - Draft Report, report dated 25 April 2002
and downloadable from www.chem.unep.ch/mercury.
US EPA (1997): Mercury Study Report to Congress: Vol 3 Fate & Transport of
Mercury in the Environment, Office of Air Quality Planning and Standards and
Office of Research & Development Report dated December 1997.
US EPA (2000): Mercury Research Strategy, Cincinnati (US), EPA.
US EPA (2000a): Mercury Reduction Options, prepared by Ross & Associates for the US
EPA Great Lakes Binational Toxics Strategy, draft report dated September 2000.
US EPA (2001): Water Quality Criterion for the Protection of Human Health:
Methylmercury, EPA 0823-R-01-001, Washington, DC.
US Geological Survey (2001): Minerals Yearbook - 2000, available from www.minerals.
usgs.gov/minerals/pubs.
VDC (2000): The World Market For Switches in the Electronics Industry, Fifth Edition
- Volume II: Europe. Report Highlights, Venture Development Corporation,
Natick, Massachusetts, January 2000 and available from www.vdc-corp.com/
components/archives/99/ br99-16a.html.
Page 118
Risk & Policy Analysts
Veiga MM (1997): Mercury in Artisanal Gold Mining in Latin America: Facts, Fantasies
and Solutions, paper prepared for the UNIDO Expert Group Meeting for the
Abatement of Global Mercury Pollution Deriving from Artisanal Gold Mining,
Vienna, 1-3 July 1997.
Vonkeman GH (2000): Data and Trends on Mercury, Briefing Paper prepared for the
International EUPHEMET Workshop: Toward an Integrated EU Policy for Heavy
Metals, Athens 17-18 April 2000.
VROM (2001): Environmental Quality Standards in the Netherlands, Alpen aan den
Rijn, Kluwer (NB: VROM is the Dutch Ministry of Housing, Spatial Planning and the
Environment).
WHO (1976): Environmental Health Criteria 1, Mercury, Geneva, World Health
Organisation, International Programme on Chemical Safety.
WHO (1989): Environmental Health Criteria 86, Mercury - Environmental Aspects,
Geneva, World Health Organisation, International Programme on Chemical Safety.
WHO (1990): Environmental Health Criteria 101, Methylmercury, Geneva, World
Health Organisation, International Programme on Chemical Safety.
WHO (1996): Guidelines for Drinking-Water Quality - Mercury, Geneva, WHO (pp 285298) available from www.who.int/water_sanitation_health/GDWQ/Chemicals/
mercuryfull.htm.
WHO (2000): Air Quality Guidelines - Mercury, Copenhagen, WHO Regional Office for
Europe and available from www.who.nl/aqg/6.9-Mercury.pdf
WS Atkins (1997): Amalgam Purchase, Use, Recovery and Release, report for the UK
Department of the Environment, Transport and the Regions and dated December
1997.
WS Atkins (1998): Assessment of the Risk to Health and to the Environment of
Mercury Contained in Certain Products, report prepared for DG Industry (now DG
Enterprise) and dated August 1998.
Page 119
Mercury Products - Risks to Health and the Environment
Page 120
Risk & Policy Analysts
ANNEX 1
TECHNICAL SPECIFICATION FOR STUDY
Mercury Products - Risks to Health and the Environment
Risk & Policy Analysts
Extract from Tender Documentation:
4. TECHNICAL SPECIFICATIONS
4.1.
INTRODUCTION - CONTEXT OF THE CONTRACT
The reduction of risks to human health and the environment related to the use of
mercury has been an objective of a wide range of regulations in the European Union.
There are several Directives setting emission standards for industrial and other
combustion plants or immission standards for water quality. In addition, there are
specific rules governing the use of mercury in specific applications or products, e.g.
Council directive 82/176/EEC on limit values and objectives for mercury discharges
by the chlor-alkali electrolysis industry, Directive 89/677/EEC on the use of mercury
in paint and Directive 91/157/EEC on batteries and accumulators containing certain
dangerous substances (adapted to technical progress by Commission Directive
98/101/EC). Further limitations for the marketing and use of certain products
containing mercury are under consideration. Some Member States, namely Denmark
and Sweden have initiated a more comprehensive phase-out of mercury in products on
a national level. A recent Commission Proposal for a Council Directive on the
restriction of the use of certain hazardous substances in electrical and electronic
equipment takes a similar orientation for that sector on Community level. The
requirements under this proposed Directive are to be reviewed by the Commission by
1 January 2004 to take into account new scientific evidence.
The regulatory measures and efforts from industry to substitute mercury have led to a
sharp reduction in the use of this metal and this process of substitution is expected to
continue.
Against this background, the study will contribute to a better empirical and scientific
basis for the future discussions on the possible need for further restrictions on the use
of mercury.
4.2. Objectives, tasks, requirements and information
4.2.1. Objectives
The aim of the study is to up-date earlier studies (see 4.2.2.) on the risks to health and
the environment posed by mercury in certain products. All stages of the life cycle
should be taken into account including e.g. production, formulation, use, and disposal.
While the study is to focus on present use of mercury in products, it should also
examine to which extent mercury concentrations measured (particularly in the
waste-stream) at present are influenced by former uses and non-anthropogenic
sources. The study should also assess the relative risks from mercury in products
compared with the other sources of mercury.
It is mandatory to complete the study within the time period specified under point 1.3.
Page A1-1
Mercury Products - Risks to Health and the Environment
4.2.2. Approach and tasks
The methodology of the study should be based on the Technical Guidance Document
in support of Commission Regulation (EC) No. 1488/94 on risk assessments of
existing substances (ISBN 92-827-8011 to 8014), however, taking recent
developments of methodologies for risk assessment of metals and the particular
behaviour of mercury in the environment into account.
Tasks
The study should adapt, up-date and extend an earlier assessment of the risks to health
and the environment from mercury in certain products1 and use data contained in the
pertaining study on advantages add drawbacks on marketing and use of certain
products containing mercury2. In general, it is to be based on recent data in order to
take account of the potential results of reduced mercury use. The scope of products is
to be widened to batteries and consider the impact of policy measures taken in that
field. The geographic area investigated is to include the Poland, the Czech Republic
and Slovenia to the extent where data are available.
Particular attention will be paid to the following points:
1
2
•
Human toxicity. The evaluation of toxicity to humans should be expanded and
take recent information into account.
•
Derivation of PEC (Predicted Environmental Concentration) values. The
derivation of PEC values should be revised with regard to methodology and based
to the extent possible on monitored data.
•
Derivation of PNEC (Predicted No Effect Concentration) values. The derivation
of PNEC values should be revised especially with regard to data used, aiming at
an application of the probabilistic method.
•
Risk characterisation. The risk characterisation should be revised and could be
further improved by addressing the effects of environmental characteristics of
mercury toxicity and by the inclusion of PNEC values adapted to the water/soil
conditions using probabilistic approaches for European water/soil characteristics.
•
The study should also assess the relative risks from mercury currently used in
products in the European Union as compared with the other sources of mercury
(non-product use, natural, historical,). In this context the study should also discuss
the potential influence of different use patterns of mercury outside the Union
(imports via products and transboundary pollution).
Assessment of the Risks to Health and the Environment of Mercury in Certain Products, WS Atkins,
Final Report, August 1998.
Analysis of the Advantages and Drawbacks of Restricting the Marketing and Use of Mercury in
Certain Products, Environmental Resources Management (ERM), December 1998.
Page A1-2
Risk & Policy Analysts
ANNEX 2
LIST OF CONSULTEES
Mercury Products - Risks to Health and the Environment
Risk & Policy Analysts
The research team is particularly grateful to the assistance provided by the following
organisations:
AB Ardent
Association of Public Health Dentists (Denmark)
Asturiana del Zinc
Austrian Federal Ministry of Environment
Austrian Medical Association
Bosch GmbH
Britannia Zinc
Bundeszahnärztekammer
CAL Controls (UK)
Claushuis Metaalmaatschappij BV (Netherlands)
Cookson Precious Metals Ltd (UK)
Danfoss (Denmark)
Danish Environment Protection Agency
Department for the Environment, Food & Rural Affairs (UK)
Dutch Ministry of Housing, Spatial Planning and the Environment
European Committee of Domestic Equipment Manufacturers (CECED)
European Lighting Companies Federation
FDI World Dental Association
Finnish Dental Association
French Ministry of Spatial Planning and the Environment
French National Institute of Research and Safety (INRS)
Fujitsu Components Europe BV (Netherlands)
Gascoigne-Melotte (Belgium)
GE Lighting
Hella KG Huck & Co (Germany)
Hellenic Dental Association
Henry Schein
HI Instruments (Finland)
Instituto Superiore di Sanito (Italy)
International Archery Association
International Council for Mining & Metals
International Zinc Association
Irish Health and Safety Authority
James Scientific Instruments Ltd (UK)
Lead Development Association
Mater Health Trust (Northern Ireland - UK)
MAYASA
Medical Devices Agency (UK)
Mercury Recycling Ltd
Miele (Germany)
NHS English Purchase and Supply Agency (UK)
Odin Research & Development
Omron Electronics Europe
Ordem dos Médicos Dentistas (Portugal)
Osram (Siemens)
Page A2-1
Mercury Products - Risks to Health and the Environment
Philips
Polamp-Warsaw
Quicks Archery (UK)
Ragim SrL (Italy)
RIVM (Netherlands)
Rota-Dent Ltd (UK)
Russell Scientific Instruments (UK)
S Brannan & Sons Ltd
Southern Dental Industries (SDI)
Shermond Surgical Supply Ltd (UK)
Siemens AG
Société de Médecine Dentaire (Belgium)
Star Refining plc
Swedish Environmental Protection Agency
Swedish Federation of County Councils
Swedish National Chemicals Inspectorate (KemI)
Syndicat de al Measur (France)
Tridonic (Austria)
UNEP (Global Mercury Assessment)
Universal Hospital Supplies Ltd (UK)
Westfalia (Germany)
In addition, we would like to acknowledge the assistance provided by a number of further
companies which asked not to be named.
Page A2-2
Risk & Policy Analysts
ANNEX 3
LIST OF MERCURY CONTAINING PRODUCTS
Source: Original data presented in Gilkeson J (1996): Mercury Products
Study, report for the Minnesota Pollution Control Agency dated April 1996
(and revised August 1998) as reproduced in Land & Water Resources Council
(1999): Labeling and Collection of Mercury-Added Products, report for
the Maine Legislature dated January 1999.
Mercury Products - Risks to Health and the Environment
Risk & Policy Analysts
Uses of mercury for its mechanical properties as a high-density, low-friction fluid
•
telescope mirrors
•
Canter Tube: 6’ tube used in medical procedures to trace GI tract
•
Bougie Tube: used in medical procedures for esophageal dilation
•
lighthouse lamp bearing
•
waste water treatment plant pivot arm bearing
•
archery as a bow stabilizer; two models: 6” 8 oz.; 10” 11 oz. (Neutralizer®)
•
DC watt hour meters (no longer made but may still be in use)
•
bubbler or trap used in laboratories to seal reaction vessels for monitoring gas evolution
•
weights and counterweights in grandfather clocks
Pressure and flow rate measurement and control devices (manometers), tube type and
well type Note: devices in this category have extensive application in the natural gas industry
•
sphygmomanometers (blood pressure “cuffs”)
•
laboratory manometers (pressure measurement devices)
•
commercial-industrial manometers (many types and uses)
•
dairy barn manometers (tube type, measures milking system vacuum)
•
barometers - atmospheric pressure (well type, climatology and meteorology uses)
•
gas meter pressure safety device (tube device, likely no longer made but in use)
•
permeter - used to measure permeability of sand mass to flow of air (foundry application)
•
air flow measurement devices using a Pitot Tube and manometer (foundry and other
applications; may also be called an airway controller)
•
mercury diffusion pump (laboratory/educational use)
Temperature measurement and sensing devices
•
Mercury in glass thermometers, (ASTM and laboratory)
•
cup case (for tank sample temperature testing)
•
tapered bulb thermometers (armored)
•
sling psychrometer (for measuring relative humidity)
•
mason’s hygrometer (stationary, for measuring relative humidity)
•
oven temperature control (home and commercial)
•
candy/deep-fry thermometers (home and commercial)
•
weather measurement thermometers (home, commercial, scientific)
•
minimum/maximum thermometers (home, commercial, scientific)
•
fever thermometers (home, commercial, veterinary)
•
other specialty uses, e.g., Clerget sugar test, blood bank, incubator/water bath, dairy
•
Mercury flame sensor/mercury safety valve (stainless steel bulb, capillary tube, and
bellows control device) used for ‘unsupervised burners’ in certain gas fired devices with
standing pilot or electronic ignition pilot , e.g., residential and commercial 0vens/ranges,
commercial griddle with concealed pilot, unit heaters, some light industrial oven
applications, furnaces, infrared heaters, ‘cycle pilot’ devices)
•
Mercury thermostat sensors (w/stainless steel capillary tube) (used in gas ovens operating
up to 750°F (not used in self-cleaning ovens), discontinued in 1970’s. Currently produced
devices use oil or sodium-potassium mixture.)
Thermo-electric devices (mercury movement opens and closes an electrical circuit at a
preset or adjustable set point)
•
thermostats (1, 2 or 4 glass tubes of mercury are used in conjunction with relay control
device); mercury-thallium models are used for temperatures to neg. 60°C
Page A3-1
Mercury Products - Risks to Health and the Environment
•
•
thermal switch with integral or remote mounted solid state control (similar to a
thermostat)
thermoregulator (an adjustable mercury in glass device with an electrical output
dependent on the position of the mercury column)
Electrical properties (switches, relays, sensors)
•
cathode in mercury-cell chloralkali production facilities
•
dropping mercury electrode (DME) technique for polarography and analytical chemistry
•
displacement or plunger relays (generally for high current, high voltage applications, e.g.,
resistance heating, welding, lighting, power supply switching, and industrial process
controllers
•
wetted reed relays (printed circuit board mount) - primarily used in test, calibration,
measurement equipment where stable contact resistance over the life of the product is
necessary. One industry source states that 90% of market is for specialized equipment
produced in quantities of 10-200 units per year; mass production applications do not need
mercury-wetted reed relays
•
telecommunications industry switching equipment and boards used in central facilities
•
tilt switches (including SPST, SPDT, NO, NC, wide angle, omni-directional, circuit board
mount)
•
temperature control (mounted on bimetal coil or attached to bulb device)
•
pressure control (mounted on bourdon tube or on diaphragm)
•
fluid level control (mounted in float, on lever arm, on diaphragm or on plunger)
•
airflow/fan limit controls (mounted to vane in airflow)
•
pneumatic tube communication systems
•
‘man down’ alarms
•
swimming pool alarms
•
safety shut off
•
steam irons
•
electric space heaters (may have been discontinued by early 1995)
•
outboard motors
•
limit switches for industrial machinery
•
automobile hood, trunk, vanity mirror, glove box, emergency brake lights
•
automobile automatic roll bar
•
automobile ‘ride control’ automatic leveling suspension
•
automobile security systems (tilt and trembler devices)
•
building security systems (tilt and trembler devices)
•
‘silent’ wall switches, single pole and three-way; identifiable by “top” mark on one
end of switch (discontinued by GE in 1991; Leviton only other reported
manufacturers)
•
commercial popcorn poppers
•
film editing equipment
•
greenhouse louver positioning devices
•
washing machine spin cycle shut-off (no longer in production)
•
chest freezer lid light
•
security system applications (including automobile, computer and other applications
where movement of a ‘momentary contact’ switch triggers an alarm)
•
anti-tamper device in gas meters and pay phones (unable to confirm gas meter
application with major gas meter manufacturer)
Page A3-2
Risk & Policy Analysts
automatic car washes (Ryko: treadle on/off switch and detection of top brush position)
•
ice fishing tip-up lights
•
fishing lure (manufactured in Canada possibly for tip-ups)
•
lawn tractor/riding mower fuel level indicator
•
electric organs - non-keyboard controls such as tone
•
fire alarm box switch
•
marine auto-pilot
•
level and rotation sensors and controls (automobile, aircraft, and defense applications)
•
laptop computer - screen shutoff when cover closed
•
portable phone mute/privacy switch when phone is in horizontal position
•
cameras (still, video, film); overridable position sensor to protect from sunlight
damage
proximity sensors, magnetically activated, applications unknown
g-sensors
•
automobile ABS sensors (used to pulse system and disengage auto 4wd)
•
some older automobile air bag sensors
•
auto seat belt mechanisms (electrically activated inertia lock)
•
security system applications
rectifiers, oscillators, phanatrons, thyratrons, ignitrons, excitrons, cathode tubes; inverters
switches or relays in some remote reading devices for utility meters, purpose unknown
•
•
•
•
•
Electrical Discharge Properties/Lighting
•
fluorescent lamps: general purpose straight, U-bent, circline, compact high output,
bilirubin blue, blacklight, “bug-zapper” devices
•
high intensity discharge
•
mercury vapor lamps
•
high pressure sodium lamps
•
metal halide lamps used in automobile headlights (new use, xenon-mercury-halide)
•
‘CS - compact source mercury lamps’ (photographic, lab uses)
•
‘Special mercury lamps’ (UV properties)
•
neon lamps (most colors except red, orange, pink)
•
spectral lamps - monochromatic light source for laboratory and research applications
•
cold cathode lamps for illumination
•
germicidal lamps (hot cathode, cold cathode, slimline)
Electronic Properties/Semiconductors
•
mercury-cadmium telluride semiconductors/infrared sensors Extensive defense and
satellite uses; no substitute with comparable performance for many applications. One
researcher estimates annual mercury consumption for this use at 100 pounds. Includes
photovoltaic and photoconductive cells.
Medical, pharmaceutical, cosmetic/human contact
•
vaccines and other biologic products
•
homeopathic medications (at least 17 compounds used, many applications)
•
over-the-counter (OTC) nasal sprays (preservative)
•
OTC ophthalmic and contact lens products (preservative)
•
eye-area cosmetics (up to 65 ppm mercury) (preservative)
•
hemorrhoid ointments and creams (preservative, discontinued early 1995)
•
OTC disinfectants: Mercurochrome® [merbromin], tincture of merthiolate
•
merbromin solution used in plastic reconstructive surgery as disinfectant and marker
Page A3-3
Mercury Products - Risks to Health and the Environment
•
•
•
•
•
•
mercuric chloride peritoneal lavage in cancer surgery (Great Britain)
skin bleaching creams (OTC discontinued in US by early 1970s)
diuretic (mersalyl and salts are still manufactured, extent of use unknown)
traditional Chinese medicine (including herbal balls)
spiritist use
tattoo pigments (discontinued in US, likely in 1970’s)
Medical and laboratory/no human contact (active ingredient or preservative)
•
tissue fixatives for pathology, histology (e.g., Zanker’s, B5)
•
tissue stains (Harris hematoxylin stain may be mercury-free)
•
Hayem diluting fluid for red blood cell count) contains mercuric chloride
•
reagents for various diagnostic and laboratory tests:
•
arsenic-calcium reagent (260 ppm)
•
Precision reagent (240 ppm)
•
CPK reagent (2.7 ppm)
•
colorimetric chloride analysis (mercuric thiocyanate or mercuric nitrate titration)
•
Nessler’s Reagent/Channing’s Solution (mercury potassium iodide); used for total
•
Kjeldahl nitrogen (no apparent alternate method) and nitrogen ammonia (USEPA
•
accepted/approved).
•
Millon’s Reagent (mercury-nitric acid solution, for albumin)
•
salinity (mercuric nitrate titration)
•
Radiometer (brand) blood gas analyzer reference electrode
•
ESA (brand) Model 3010B Lead Analyzer electrode (used for testing blood lead levels)
•
preservative in various products such as pregnancy test kits and possibly in similar
diagnostic products
•
thimerosal used as preservative for sucrose buffers in disc electrophoresis
Veterinary medicine and other veterinary/livestock uses:
•
vaccines for cattle, swine, and dogs
•
other medications:
•
Dip-A-Way (contains merbromin, mfd. by Universal Aquarium System)
•
Wound Control (contains merbromin, mfd. by Universal Aquarium System)
•
RX ICK Control (contains merbromin, mfd. by Wardley Corp.)
•
Aqueous Red Mercury Blister (contains mercuric iodide; mfd by QA Laboratories and
P.C. Laboratories)
•
Phillips Corona Ointment antiseptic dressing for horses and other animals
•
udder wash with thimerosal - discontinued many years ago
Pesticides
•
food uses canceled in 1969 and US pesticide registrations canceled by early 1995. Last
four uses to be canceled were as a turf fungicide, a mildewcide for fresh cut wood, a
fungicide and preservative in latex paint, and outdoor fabric treatment
•
marine anti-fouling paint (discontinued in 1970’s)
Pigments (reds and oranges)
•
Used in engineering plastics where high temperature stability is required. Past uses
included many automotive parts, vinyl, ABS, polycarbonate. The only remaining
manufacturer is SLMC in France; one US auto manufacturer reports recently
Page A3-4
Risk & Policy Analysts
discontinuing a mercury containing color concentrate used in plastic component
manufacturing.
Catalysts (primarily for urethane and vinyl)
•
polymer curing
•
monomer production
•
acetylene production (probably no longer used)
•
vinyl and anthraquinone production (unconfirmed)
•
Battery electrodes (mercuric oxide battery, mercury-cadmium battery)
Other uses
•
battery anti-gassing (zinc anode coating in alkaline, carbon zinc batteries)
•
fireworks (no longer used by US manufacturers but may be used elsewhere)
•
Explosives: mercury fulminate, apparently no longer manufactured
•
School laboratory experiments and demonstrations
Note: this use is prone to mismanagement and release, and generates hazardous
nonrecyclable waste; chemical principles and phenomena can be demonstrated with less
toxic or non-toxic substances.
Amalgamating properties and amalgams
•
dental
•
gold mining/extraction (used in small scale artisanal’ mining, large scale mining
reportedly uses other chemical or mechanical processes)
•
mirror silvering (discontinued about 1900)
•
gold porcelain paint (availability and use in US unconfirmed)
•
gun cleaning: mercury is poured into the barrel and then removed, reportedly to remove
lead, copper and brass residues
Home uses that have resulted in documented mercury poisoning (a sampling)
•
fabrication of fishing sinkers with mercury, lead, copper, and solder (heating)
•
gold smelting (heating)
•
recovery of silver from dental amalgam (heating)
•
recovery of mercury from products such as batteries (heating)
•
use of interior latex paints with high mercury preservative levels
•
vapor exposure from spilled mercury and broken products such as thermometers
•
consumption of treated grain or meat from animals fed treated grain
•
fluorescent lamp breakage/acrodynia in 2 year old (ingestion/inhalation)
•
use of ‘folk’ medicines containing mercury (ingestion/inhalation/dermal contact)
•
use of a beauty cream containing calomel (mercurous chloride)
Note: mercury poisoning from use of the cream (“Crema de Belleza’ made in Mexico)
was documented in individuals in California, New Mexico and Texas in 1995 and 1996.
Total mercury content of the cream was 6 to 8%.
Page A3-5
Mercury Products - Risks to Health and the Environment
Page A3-6
Risk & Policy Analysts
ANNEX 4
ANALYSIS OF AQUIRE DATA FOR CONSISTENCY
Mercury Products - Risks to Health and the Environment
Risk & Policy Analysts
A4.1 Introduction
This annex provides a brief description of an analysis of mercuric chloride toxic
effects data for freshwater and saltwater taxa using data from the USEPA AQUIRE
database. These data are analysed in both the standard TGD fashion, by selecting the
most sensitive results in three taxonomic groups, and by using the statistical
extrapolation methodology of Aldenberg & Slob (1993), which is also allowed under
the TGD. Results based on AQUIRE data are then compared with those presented by
Eurochlor in two reports from 1999.
A4.2 Analysis of Data from AQUIRE
A4.2.1 LC50 Data
AQUIRE was searched for lethal and sublethal data on mercuric chloride.
1197 data entries were found. These were separated into freshwater and saltwater
species and the data for each species were consolidated. First, the most sensitive time
period was found. Then, if more than one result for this time period was available for
the same species, the geometric mean of these results was calculated. LC50 data (or
EC50 data for lethality surrogates such as immobility) were available for 141
freshwater and 64 saltwater species.
Freshwater Data
The most sensitive freshwater LC50 data were:
•
•
•
algae: Chlorella vulgaris 12-d EC50 of 128 µg/l;
invertebrates: Bosmina longirostris (waterflea) 96-h LC50 of 0.55 µg/l. The
standard European test species Daphnia magna had a 21-d LC50 of 8.06 µg/l; and
fish or amphibians: the most sensitive species in the LC50 toxicity distribution
was the clawed toad Xenopus laevis, with a 7-d LC50 of 0.16 µg/l. The next most
sensitive species was a fish, the channel catfish, Ictalurus punctatus, with a 4-d
post-hatch LC50 of 0.3 µg/l. The standard European test species Oncorhynchus
mykiss (rainbow trout) had a 4-d post hatch LC50 of 0.69 µg/l.
These data show that crustaceans, amphibians and the early life stages of fish are the
most sensitive to mercuric chloride lethal toxicity.
Saltwater Data
The most sensitive saltwater LC50 data were:
•
algae: No standard European saltwater algal species results were reported on the
AQUIRE database, but a 96-h EC50 of 4.0 µg/l was reported for the dinoflagellate
Gonyaulax polyedra;.
Page A4-1
Mercury Products - Risks to Health and the Environment
•
•
invertebrates: The mollusc Villorita cyprinoides cochi was the most sensitive
saltwater species, with a 96-h LC50 of 1.57 µg/l. The standard North American
mysid shrimp test species, Americamysis bahia, was the next most sensitive, with
a 35-d LC50 of 1.8 µg/l. A 24-h EC 50 of 13 µg/l was found for the Pacific oyster
Crassostrea gigas, a species often used in European risk assessments; and
fish: The most sensitive saltwater fish species found on the AQUIRE database
was the spot, Leiostomus xanthurus, with a 96-h LC50 of 36 µg/l.
These data show that invertebrates were the most sensitive species tested. However,
early life stage tests with fish species are missing, so the relative insensitivity of
saltwater fish may be an artefact.
Statistical Extrapolation for LC50 Data
A logistic distribution fitted the freshwater LC50 toxicity data and the Aldenberg &
Slob (1993) statistical extrapolation method estimated a median HC5 (Hazardous
Concentration to 5% of Species) of 3.4 µg/l, with a lower 95% confidence limit (95%
CL) on the HC5 of 1.8 µg/l. A logistic distribution also fitted the saltwater data well.
The Aldenberg & Slob (1993) approach produced estimated median HC5 and lower
95% CL values of 4.7 and 2.5 µg/l respectively.
A4.2.2 Sublethal Data
There were far fewer sublethal data available in AQUIRE, and most of these were
EC50 values for sublethal responses, rather than NOEC or LOEC values. These data
were treated in the same way as the LC50 data, with the additional criteria that only
the most sensitive endpoint was selected for each species (e.g., reproduction or
growth) and results should be reported as mass per litre. Only endpoints of direct
demographic relevance (i.e., growth and reproduction) were selected for analysis.
Sublethal data meeting the above criteria were found for 32 different freshwater and
saltwater species.
Freshwater Data
The most sensitive sublethal freshwater data were:
•
•
•
algae: a population growth rate LOEC of 5 µg/l for the blue-green alga
Microcystis aeruginosa;
invertebrates: a 21-d reproduction EC50 of 6.7 µg/l for the waterflea Daphnia
magna; and
fish: none found.
Saltwater Data
The most sensitive sublethal saltwater data were:
•
Page A4-2
algae: a 5-d growth EC50 of 10 µg/l for the diatom Ditylum brightwellii;
Risk & Policy Analysts
•
•
invertebrates: an 11-d population change LOEC of 1.65 µg/l for the saltwater
hydroid Campanularis flexuosa; and
fish: a 32-d hatching success EC50 of 37.18 µg/l for the mummichog Fundulus
heteroclitus.
These most sensitive chronic data either do not differ substantially from the most
sensitive acute data, or tend to be slightly higher, which may reflect either a low acute
to chronic ratio or the paucity of chronic data on the AQUIRE database. There is also
some confusion in the reporting of the algal data: it is likely that data in both the LC50
and the sublethal categories are from similar types of experiment on population
growth rate, but have been reported differently on the database. This has no effect on
an overall analysis of the data.
Statistical Extrapolation of Sublethal Data
Because of the relatively low number of data, freshwater and saltwater data were
analysed together to estimate an HC5 according to the Aldenberg & Slob (1993)
method. The data fitted a logistic distribution, with a median HC5 value of 1.8 µg/l
and a lower 95% CL of 0.45 µg/l.
A4.3
Comparison of Results with Eurochlor
The results reported above were then compared with those from the Eurochlor reports
(Eurochlor, 1999 & 1999a). The following points emerge:
•
•
•
Eurochlor followed the recommendations of the Technical Guidance Document
(TGD) and concentrated on ‘chronic’ (i.e., long-term exposure) data. The
AQUIRE database contained more data on lethal effects than those reported by
Eurochlor, but fewer useful data on long-term effects;
Eurochlor divided mercury compounds into two categories: organic and inorganic,
while we divided inorganic mercury into specific salts, such as mercuric chloride
as reported here; and
there are some inconsistencies in the use of terminology between the Eurochlor
report and our analysis.
Eurochlor separate tests into LC50/EC50 and
LOEC/NOEC results. We separated tests into lethal and sublethal results.
However, in the overall analysis this distinction does not affect any conclusions
drawn from either of the separate analyses.
Conclusions on Most Sensitive Test Results for Different Taxonomic Groups
Comparison of Eurochlor inorganic mercury conclusions and the results of this
analysis suggest the following:
•
freshwater fish: Eurochlor found that the most sensitive lethality study was a 96-h
LC50 of 26 µg/l for the guppy, Poecilia reticulata. In our analysis the channel
catfish, Ictalurus punctatus, with a 4-d post-hatch LC50 of 0.3 µg/l, and
Page A4-3
Mercury Products - Risks to Health and the Environment
•
•
•
•
•
Oncorhynchus mykiss (rainbow trout) with a 4-d post hatch LC50 of 0.69 µg/l
showed the most sensitive lethality results. However, the most sensitive
vertebrate was the clawed toad Xenopus laevis, with a 7-d LC50 of 0.16 µg/l.
Eurochlor found that the most sensitive chronic result was a 41 week growth and
reproduction NOEC of 0.5 µg/l for the fathead minnow Pimephales promelas.
Our analysis did not find any useful chronic freshwater fish data;
saltwater fish: Eurochlor found that the most sensitive lethality study was a 96-h
LC50 of 67 µg/l for the mummichog, Fundulus heteroclitus. In our analysis the
spot, Leiostomus xanthurus, was the most sensitive, with a 96-h LC50 of 36 µg/l.
Eurochlor found that the most sensitive chronic study was a 32-d reproduction
NOEC of 10 µg/l with the mummichog. Our analysis found a 32-d hatching
success EC50 of 37 µg/l for the same species;
freshwater invertebrates: Eurochlor found that the most sensitive lethality value
was a 96-h LC50 of 1 µg/l for the crustacean Crangonyx pseudogracilis. In our
analysis, the waterflea Bosmina longirostris was the most sensitive, with a 96-h
LC50 of 0.55 µg/l. Eurochlor found that the most sensitive chronic result was a 10
week reproduction NOEC of 0.62 µg/l for the crustacean Hyalella azteca. Our
analysis found that the most sensitive result was a 21-d reproduction EC50 of 6.7
µg/l for the waterflea Daphnia magna;
saltwater invertebrates: Eurochlor found that the most sensitive lethality study
was a 96-h LC50 of 10 µg/l with the copepod Acartia tonsa. In our analysis the
mollusc Villorita cyprinoides cochi was the most sensitive saltwater species, with
a 96-h LC50 of 1.57 µg/l. The standard North American mysid shrimp test
species, Americamysis bahia, was the next most sensitive, with a 35-d LC50 of 1.8
µg/l. Eurochlor found that the most sensitive chronic studies were a 112-d
reproduction NOEC of 0.25 µg/l with the mollusc Crepidula fornicata and a 44-d
reproduction NOEC of 0.8 µg/l for the crustacean Americamysis bahia. Our
analysis found that an 11-d population change LOEC of 1.65 µg/l for the saltwater
hydroid Campanularis flexuosa was the most sensitive;
freshwater algae: Eurochlor found that the most sensitive short-term result was 9
µg/l for a static 96-h EC 50 with Selenastrum capricornutum. In our analysis the
most sensitive result was a 12-d EC50 of 128 µg/l with Chlorella vulgaris.
Eurochlor found that the most sensitive longer-term result was an 8-d LOEC of 5
µg/l with Microcystis aeruginosa. Our analysis agreed with Eurochlor's; and
saltwater algae: Eurochlor found that the most sensitive short-term result was a 5d EC50 of 10 µg/l for the diatom Ditylum brightwellii. Our analysis found a 96-h
EC50 of 4.0 µg/l for the dinoflagellate Gonyaulax polyedra. Eurochlor found that
the most sensitive longer-term results were a 10-d growth NOEC of 0.9 µg/l for
Fucus serratus and a 13-d growth LOEC of 0.77 µg/l for Isochrysis galbana. Our
analysis found a 5-d growth EC50 of 10 µg/l for the diatom Ditylum brightwellii.
Comparison of Results Based Upon a Safety Factor Approach
Eurochlor uses a safety factor approach to predict a safe concentration for inorganic
mercury of 0.025 µg/l. This is based upon long-term NOEC data from at least three
species representing three trophic levels, and a safety factor of 10. The important
Page A4-4
Risk & Policy Analysts
datum in this set is the 112-d reproduction NOEC of 0.25 µg/l for Crepidula
fornicata, found by Thain (1984 - as reported in Eurochlor, 1999a).
Using the same approach with data from the AQUIRE database suggests a safe
concentration for mercuric chloride of 0.165 µg/l based upon an 11-d population
change LOEC of 1.65 µg/l for the saltwater hydroid Campanularis flexuosa, found by
Moore & Stebbing (19761). However, caution must be exercised as this is a
comparative value for this analysis only. This result is very close to LC50 values of
0.3 µg/l for channel catfish early life stages, and 0.69 µg/l for rainbow trout early life
stages. It is also the same as the 7-d LC50 of 0.16 µg/l for the most sensitive
vertebrate, the clawed toad Xenopus laevis.
Comparison of Results based upon Aldenberg & Slob Statistical Extrapolation
Eurochlor (using studies ascribed a validity of 1 or 2) predicted a PNEC of 0.47 µg/l.
Our comparative analysis (using all freshwater LC50/EC50 data, all saltwater
LC50/EC50 data, and all ‘chronic’ sublethal data) estimated HC5s (Hazardous
Concentration to 5% of Species) of 3.4 µg/l (with a lower 95% confidence level (CL)
of 1.8 µg/l), 4.7 µg/l (lower 95% CL = 2.5 µg/l) and 1.8 µg/l (lower 95% CL = 0.45
µg/l) respectively.
As can be seen, the lower 95% CL for the HC5 derived from the chronic data is very
close to the PNEC estimated by Eurochlor.
A4.4
Overall Conclusions
The results presented here for mercuric chloride from the AQUIRE database compare
well with the results Eurochlor found for all inorganic mercury salts. As such, it is
considered ‘safe’ to use the data provided by Eurochlor (1999a) and INERIS (2000)
in this analysis. Where additional data are available from other reliable data-bases,
such as AQUIRE, these will also be used.
1
Moore MN & Stebbing ARD (1976): The Quantitative Cytochemical Effects of Three Metal Ions on a
Lysosomal Hydrolase of a Hydroid, J.Mar.Biol.Assoc.U.K Vol 56 pp 995-1005.
Page A4-5
Mercury Products - Risks to Health and the Environment
Page A4-6
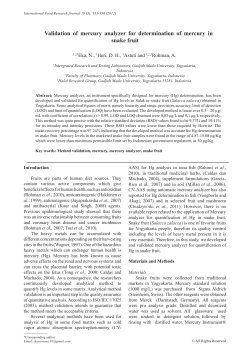


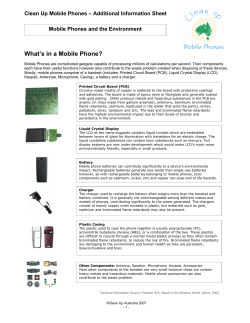
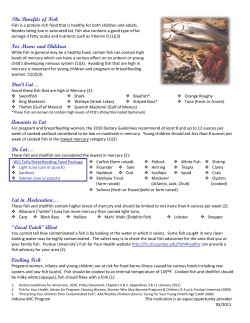
© Copyright 2026