
Reading the Mind in the Eyes
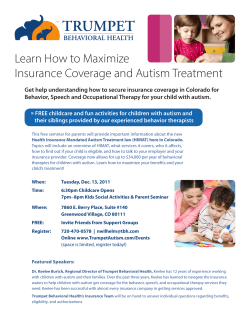
J Autism Dev Disord
DOI 10.1007/s10803-015-2427-4
ORIGINAL PAPER
The ‘‘Reading the Mind in the Eyes’’ Test: Investigation
of Psychometric Properties and Test–Retest Reliability
of the Persian Version
Behzad S. Khorashad1 • Simon Baron-Cohen2 • Ghasem M. Roshan3
Mojtaba Kazemian4 • Ladan Khazai5 • Zahra Aghili6 • Ali Talaei7 •
Mozhgan Afkhamizadeh8
•
Ó Springer Science+Business Media New York 2015
Abstract The psychometric properties of the Persian
‘‘Reading the Mind in the Eyes’’ test were investigated, so
were the predictions from the Empathizing–Systemizing
theory of psychological sex differences. Adults aged
16–69 years old (N = 545, female = 51.7 %) completed
the test online. The analysis of items showed them to be
generally acceptable. Test–retest reliability, as measured
by Intra-class correlation coefficient, was 0.735 with a
95 % CI of (0.514, 0.855). The percentage of agreement
for each item in the test–retest was satisfactory and the
mean difference between test–retest scores was -0.159
(SD = 3.42). However, the internal consistency of Persian
version, calculated by Cronbach’s alpha (0.371), was poor.
Females scored significantly higher than males but academic degree and field of study had no significant effect.
Keywords Theory of mind Reading the Mind in the
Eyes test Reliability Persian Empathy Sex differences
& Simon Baron-Cohen
[email protected]
3
Evolution and Human Behaviour Group, Psychiatry and
Behavioral Sciences Research Centre, Mashhad University of
Medical Sciences, No. 101, 4th Fl., Daneshju 19st,
9188977361 Mashhad, Iran
4
Mojtaba Kazemian
[email protected]
Evolution and Human Behaviour Group, Psychiatry and
Behavioral Sciences Research Centre, Mashhad University of
Medical Sciences, No. 9, Motahari Shomali 41st,
9193974567 Mashhad, Iran
5
Ladan Khazai
[email protected]
Psychiatry and Behavioral Sciences, University of Miami,
Unit 1221, 100 Lincoln Rd., Miamibeach, FL 33139, USA
6
Psychiatry and Behavioral Sciences Research Centre,
Mashhad University of Medical Sciences, Unit 4, No. 134,
Asrar 1st, Daneshgah Av., Mashhad, Iran
7
Psychiatry and Behavioral Sciences Research Centre,
Mashhad University of Medical Sciences, Bu-Ali Sq., Amel
Blvd., Mashhad, Iran
8
Department of Endocrinology, Imam Reza Hospital,
Mashhad University of Medical Sciences, Imam Reza Sq.,
Mashhad, Iran
Introduction
Emotion recognition has been defined as ‘‘the ability to
read subtle cues indicating the emotional state of another
person’’ (Baron-Cohen and Wheelwright 2004). These cues
can be visual and verbal, both revealing an internal emotional state. Emotion recognition is part of a broader set of
cognitive capabilities for analyzing the clues on beliefs and
desires of conspecifics which is called social cognition. The
ability to use such social cues is sometimes referred to as
employing a ‘‘theory of mind’’ (henceforth ToM); the
Behzad S. Khorashad
[email protected]
Ghasem M. Roshan
[email protected]
Zahra Aghili
[email protected]
1
2
Evolution and Human Behaviour Group, Psychiatry and
Behavioral Sciences Research Centre, Mashhad University of
Medical Sciences, No. 17, Toufigh 9 Lane, Shahid Sadeghi
Blv., 91858-84714 Mashhad, Iran
Autism Research Centre, Department of Psychiatry,
Cambridge University, Douglas House, 18B Trumpington
Rd., Cambridge CB2 8AH, UK
123
J Autism Dev Disord
capability to attribute mental states to the self and to others
in order to predict behaviour (Premack and Woodruff 1978;
Apperly et al. 2006; Samson 2009). It is a core aspect of
cognition in the social evolution of human and non-human
primates and is key for success in social interaction. Fluency
in this ability confers social and vocational advantages
(Begeer et al. 2010; Bender et al. 2012; Peterson et al. 2007;
Woolley et al. 2010). On the other side, deficits in emotion
recognition may lead to serious interpersonal and social
difficulties. Several studies have found that conditions such
as autism, schizophrenia and anorexia nervosa, involve a
difficulty in recognizing another’s state of mind (BaronCohen 1995; Lind et al. 2014). Therefore, there have been
numerous studies in recent years attempting to design an
instrument for measuring atypical, as well as typical, variations in emotion recognition and social cognition.
The ‘‘Reading the Mind in the Eyes test’’ (hereafter the
Eyes test) is one such measure, which due to its simplicity,
has been widely used. The first version of Eyes test was an
effort towards developing an adult test for detecting subtle
individual differences in the ability of ‘mind reading’
(Baron-Cohen et al. 1997). The task involved looking at the
pictures of strangers’ faces and choosing which of two
words that best describes what the person in the picture is
feeling or thinking. In order to improve the test’s psychometric properties, it was revised by the same team (BaronCohen et al. 2001a). The revised version has 36 pictures of
the eye region of males and females, and the participants
have to choose one of the four words that best describes the
mental state of the person in picture. Each correctly answered item is awarded one point and each incorrectly
answered or unanswered item is scored as zero. The final
score is sum of all acquired points.
The English version of revised Eyes test has been
translated into many languages, including Turkish (Yildirim et al. 2011), Spanish (Fernandez-Abascal et al.
2013), Japanese (Kunihira et al. 2006), German (Pfaltz
et al. 2013), Swedish (Hallerback et al. 2009), French
(Prevost et al. 2014) and Italian (Vellante et al. 2013); all
available for free at www.autismresearchcentre.com/arc_
tests. It has also been translated into Persian and used in
some studies (Nejati et al. 2012). The psychometric aspects
of the Persian version, however, have never been tested in
an independent systematic study. Therefore, one aim of the
present study is to evaluate the psychometric properties of
the Persian Eyes test.
Eyes Test and Empathizing–Systemizing Theory
The Eyes test, originally developed as a sensitive measure
of subtle cognitive deficits in individuals with autism
spectrum conditions (ASC), correlates with scores on the
self-report Empathy Quotient (EQ) in the general
123
population (Baron-Cohen 2010). Empathizing is defined as
the drive to identify another’s mental states and to respond
to these with an appropriate emotion (Baron-Cohen et al.
2003). Empathy encompasses two components: cognitive
empathy, which is the capacity to recognize what someone
else believes or feels (the same ToM); and affective empathy, which is the capacity to experience an appropriate
emotion in response to someone else’s thoughts and feelings. EQ is negatively correlated to the Systemizing Quotient (SQ). Systemizing is defined as the drive to analyze
and construct rule-based systems (Baron-Cohen et al. 2003;
Wheelwright et al. 2006; Wheelwright et al. 2006). It involves identifying the ‘‘input-operation-output’’ rules that
govern and predict how a system behaves. Systemizing is
an algorithmic process: understanding systems in a
relatively finite and closed fashion (Lai et al. 2012). It is,
therefore, reasonable to expect Eyes test scores to be high
whenever the SQ is low and EQ is high and vice versa.
There are some studies supporting this notion. In a study of
the psychometrics of the Italian version of the Eyes test,
Vellante et al. (2013) found that performance of typical
participants on the EQ is correlated with their score on the
Eyes test. Baron-Cohen et al. (2003) reported that people
with high-functioning autism or Asperger Syndrome,
whose ability in theory of mind is impaired, score higher
on the SQ compared to general population. Auyeung et al.
(2009) reported that children with ASC scored significantly
lower on the EQ, and significantly higher on the SQ,
compared to typical samples. Grove et al. (2014) found that
weak performance on the Eyes test is related to EQ in
children with ASC and their relatives in comparison to
typical individuals. Chapman et al. (2006), in an attempt to
reveal the origins of differences in empathy, studied prenatal testosterone and EQ and Eyes test scores and found a
negative correlation between fetal androgens and both
measures. These studies, in harmony with the Empathizing-Systemizing Theory (E–S theory) (Baron-Cohen 2010),
suggest that people can be classified based on their EQ and
SQ along two dimensions of Empathizing and Systemizing.
According to E–S theory, five types of cognitive style are
defined: Type E (EQ [ SQ), Type S (SQ [ EQ), Type B
(SQ = EQ), Extreme Type S (SQ EQ) and Extreme
Type E (EQ SQ). This E–S discrepancy is reflected in
the academic interests of students. Several studies have
found that students in different academic fields have different EQ and SQ profiles (Billington et al. 2007). Individuals interested in fields of sciences that are about lawful
systems such as mathematics, engineering, computer sciences and the natural sciences are more likely to have a
profile of Type S or extreme Type S, whereas individuals in
the humanities and social sciences show the opposite pattern (Billington et al. 2007; Focquaert et al. 2007; Manson
and Winterbottom 2011). Considering the correlation
J Autism Dev Disord
between performance in Eyes test and EQ/SQ, we predicted our participants in the humanities and medicine to
score significantly higher than those in science and engineering on the Eyes test.
Eyes Test and Gender
Performance on the Eyes test has been widely demonstrated to show sex differences, with females scoring
higher than males. However this advantage has been
variable from small to large in different studies, with Cohen’s d ranging from 0.22 to 0.94 (Vellante et al. 2013).
There are also some studies that reported no sex difference
(Ahmed and Stephen 2011). Similar difference have been
observed in the EQ and SQ: females on average have
higher EQ and males have higher SQ (Baron-Cohen 2010).
Given these differences, one might speculate that fields of
sciences and engineering might be more attractive for
males, and medicine and humanities more attractive for
females.
The Persian Eyes Test
As noted earlier the Eyes test has been translated into Persian and used as a measure of theory of mind in some
studies of the Iranian population, however, its validity and
reliability has not been studied independently. The main
aim of the present study is to do so. However, as Vellante
et al. (2013) point out, there is no gold standard for the
validity of Eyes test to be measured against. Consequently,
different authors have used various strategies to validate
translated versions of Eyes test. Prevost et al. for instance,
investigated the validity of French Eyes test by comparing it
with its English original version. The authors ‘‘found that
distributions are similar in the English and the French
versions, and the mean total scores were not different between the Francophone and the Anglophone populations,
suggesting that the translation exhibited a satisfactory validity’’ (Prevost et al. 2014). It should be noted, however,
that although consistency among various translations can be
taken as supporting evidence for the validity of test, any
difference found in cross-cultural studies does not necessarily refute the validity of translations. There is considerable amount of research showing that cultural backgrounds
can significantly influence aspects of social cognition
(Mason and Morris 2010) including theory of mind (Shahaeian et al. 2011) and even performance on the Eyes test
(Adams et al. 2010).
The present study aimed at investigating the psychometrics of a Persian version of the Eyes test and exploring
the effect of culture on participants’ performance on this
test. Due to the inherent difficulties in validation of such a
test, our strategy was to compare the results of our Persian
Eyes test to other validating studies. Using E–S theory, we
make predictions concerning the way performance in Eyes
test would correlate with academic degree and field of
study. Our hypotheses were as follows: (1) We expected
the Persian Eyes test to be reliable based on the conventional statistical analysis (see below). (2) We expected that
each item of the Persian Eyes test would be adequately
difficult and discriminant among participants (see Method).
(3) We expected that females would perform significantly
better than males on the Eyes test. (4) We expected that
those studying medicine and humanities would score significantly higher than those studying sciences and engineering. (5) We expect that performance on the Eyes test
would not be correlated with academic degree. (6) Finally,
we expect our results to be relatively similar to findings of
other studies. Since we do not have access to the detailed
results of other studies (the score of each participant) we
cannot determine whether our results (for example, mean
scores) are statistically different or not from other studies.
However, we expected to replicate the general findings.
This will be examined for the mean score and also each
item, separately.
Methods
Translation
The Eyes test has been translated into Persian several
times, none of which were satisfactory in our opinion. We
came to the conclusion that some of chosen terms for
target words or foils were not accurate and might be
confusing for Persian participants. Since the accuracy of
translations is critical for the Eyes test to reliably measure
ToM, we created our own Persian translation. In order to
so, we used the forward–backward translation method
(Guillemin et al. 1993). First, eight experts in English
literature translated the original test into Persian, and then
one professional translator translated the Persian version
back into English. Once the translations were returned,
they were sent to a third expert, a Professor in English
literature, to check the translations. She was instructed to
confirm whether the target and foils of each item has been
properly translated, and if not, why not. She was also
requested to propose her alternative for each word, explaining its advantage over the previous one. Finally, the
authors chose the appropriate word, considering the
available options and recommendations of the third expert. All the translators were native Iranians. In addition,
the glossary of the original test was translated into Persian
(by the third translator) and attached to the Persian version so the participants could check the meaning of words
that were unfamiliar to them.
123
J Autism Dev Disord
Procedure
The Eyes test was designed as an online test using www.
kwiksurvey.com, the premium version which is for online
surveys and available for free. Before the Eyes test begins,
participants completed a socio-demographic questionnaire
that included questions about age, gender, field of study,
and the highest completed academic degree. Participants
were asked to provide their email address. They were told
that a personalized report of results would be sent to them
via their email, if they provided their email address. It was
thought that this would motivate participants. Hence,
although providing email address was optional, those not
providing email address and gender identity were excluded
from the study. A written description explaining to participants how to answer the questionnaire and that this is a
newly designed measure of ‘‘theory of mind, a key ability
in social interaction’’ was attached to the test. The test was
distributed online via email and social networks.
Specifically, we used social virtual groups in Facebook,
Google Plus and Twitter designed for the Perspolice FC
Fans page, the Esteghlal FC Fan page and the Sepahan
Fans Page which are the three most popular football teams
in Iran’s Premier football League.
The Eyes test followed the format of the standard version of the test (Baron-Cohen et al. 2001a, b) and was
designed so that at any one time participants were presented with a single image on a blank background, along
with four options on the left side of the picture, simultaneously (see Fig. 1). It was instructed that there is no time
limitation for participants and they should choose the answer they believe best describes what the person in each
photo was thinking or feeling. The translated glossary was
available for all participants to use in order to avoid difficulties with words.
The study began in October, 2012. Data collection lasted
for 3 months. In order to evaluate the test–retest reliability,
a subgroup of participants was invited to answer the test
again 1 year later, in the October, 2013 following the same
procedure. Another 3-month interval was given for retest.
N = 44 participants agreed to complete the Eyes test
twice. The study finished in January, 2014.
Participants
A total of 545 participants took part. The sample comprised
of N = 282 women (51.7 %) and N = 263 men, with a
mean age of 25.8 (SD 6.21; range 16 to 69). All participants were volunteers who were invited and participated
online. They were all Iranians living inside Iran. There was
no fee or other incentive for taking part in the study. The
research project conformed to the 1995 Declaration of
Helsinki and received ethical approval from Mashhad
University of Medical Sciences Ethics Committee.
Statistical Analysis
The Statistical Package for the Social Sciences (SPSS)
version 11.5 (SPSS Inc., Chicago, IL, USA) was used to
analyze the data. The scores of Eyes test was calculated
using the sum across all items or across items considered
acceptable (see below). To evaluate the normality of value,
descriptive statistics and the Kolmogorov–Smirnov test
was used. Mann–Whitney U-test and Kruskal–Wallis test
were used to assess the influence of gender, field of study,
age and academic degree in the Eyes test. Test–retest reliability analysis of Eyes test was based on a sub-sample of
N = 44 participants completing the test twice, 1 year later.
The internal consistency was evaluated using Cronbach’s
Alpha. The association of test and retest scores was
evaluated using Intra-class Correlation Coefficient (ICC)
and Spearman’s rank correlation coefficient. We used an
established approach (Hallerback et al. 2009) in using the
Bland–Altman method to assess test–retest reliability
(Bland and Altman 1986). In addition, following the procedure used by Hutchins (Hutchins et al. 2008), we
assessed the agreement value for each item separately by
calculating the percentage agreement (proportion of cases
in which participants selected either target or foil at both
time points). An agreement value of at least 70 % was
considered as a criterion for acceptable retest reliability.
Item Analysis
Fig. 1 An example of Persian Eyes test items
123
Item analysis is used to evaluate the statistical property of
participants’ responses to an individual test item. Most of the
studies, investigating the psychometrics of Eyes test, followed the conventional two conditions for validating items
(Baron-Cohen et al. 2001a, b). Items were considered to be of
satisfactory difficulty if (First Condition) at least 50 % of
participants selected the target word and (Second Condition)
no more than 25 % of participants selected one of the foils.
However, the low percentage of target-choosing participants
J Autism Dev Disord
in some questions may not be due to the unreliability of item,
but, as noted (Vellante et al. 2013), it may be due to its
difficulty and its ‘‘lower margin for differentiation’’.
Similarly, items that are chosen by the majority of participants are not necessarily valid either: they may be easy
enough to be answered correctly by most participants. To
address this problem, we computed the difficulty and discrimination coefficient of each item in order to test if it yields
the necessary degree of reliability and validity (Linda and
Algina 2006). We also assumed that a reliable and valid item
would be able to appropriately distinct between those with a
higher score and those with a lower score on Eyes test. Based
on Kelley (Kelley 1939), we defined the higher score and
lower score groups as the upper 27 % and the lower 27 % of
participants, ordered according to their final score on Eyes
test. These two groups were compared to each other based on
how they answered each item.
Difficulty Coefficient
The difficulty of an item is measured by the proportion of
the persons who answer a test item correctly. The higher
this proportion is the lower would be the item’s difficulty.
The very easy and the very difficult items lead to whether
all examinees selecting the correct answer or selecting the
answer by absolute chance. In neither case, the test can
discriminate various abilities of facial affect recognition
among participants. To calculate the difficulty of an item
the number of participants who answered it correctly is
divided by the total number of participants who answered
it. This proportion is indicated by the letter p, which
indicates the difficulty of the item (Linda and Algina
2006). It is calculated by the following formula:
Pi ¼ Ai =Ni 100
ð1Þ
where Pi = difficulty index of item i; Ai = number of
correct answers in upper 27 % and lower 27 % groups of
participants; Ni = The sum of number of those in upper
27 % and lower 27 % groups.
Difficulty levels are classified in the following way: very
difficult (p \ 30 %); moderately difficult (31 % \ p \
50 %); medium difficulty (51 % \ p \ 70 %); moderately
easy (71 % \ p \ 90 %); and very easy (p [ 90 %). The ideal
distribution of items, based on their difficulty, would be as
follows: 5 % very difficult, 20 % moderately difficult, 50 %
medium difficult, 20 % moderately easy and 5 % very easy.
The mean Di of all items should be around 50–60 % (Zainudin
et al. 2012).
Discrimination Coefficient
The purpose of many tests is to provide information about
individual differences. Therefore, the items of a valid and
reliable test must be able to appropriately differentiate
between participants who are relatively strong from those
who are relatively weak. In many cases, such as Eyes test,
there is no gold standard to compare the test with, and there
is only the total score of the test itself. The goal, in such
situations, is to discover items for which high-scoring
participants have a high probability of answering them
correctly and low-grading participants have a low probability of answering them correctly. These items would be
able to discriminate those participants who know the material from those who do not (Linda and Algina 2006). The
Index of Discrimination is used here as a strategy to investigate the validity of items in measuring various abilities
in emotion recognition.
It is calculated through the following formula:
Di ¼ ðPu Pl Þ 100
ð2Þ
where Di: index of discrimination of item i; Pu: the proportion of those in upper 27 % group who correctly scored
item i (chose the target word); Pl: the proportion of those in
lower 27 % group who correctly scored item i.
Based on a simulation (Linda and Algina 2006), Ebel
and Frisbie offered the following guidelines to interpret
the D values: D [ 39 = Excellent; 39 [ D [ 30 = Good;
29 [ D [ 20 = Mediocre; 19 [ D [ 0 = Poor; -1 [ D =
Worst. We used the same guideline in this study.
Results
Socio-Demographic Data
The final sample included N = 545 participants (females = 51.7 %). The mean age of the sample was
25.8 years (SD = 6.17, Min = 16, Max = 69), with no
significant sex differences in age (males: 25.3 ± 6.2; females: 25.2 ± 6.05; U = 33,545, p = 0.425). Of all participants, N = 503 answered the question that asked for their
field of study, among whom 29.4 % (N = 160) had studied
engineering, 19.4 % (N = 106) sciences, 26.8 % (N = 146)
humanities and 16.7 % (N = 91) of them had studied medicine. The distribution of academic degree among our participants was as follows: Diploma 7.3 % (N = 40), Bachelor
47.9 (N = 261), Master 23.9 (N = 130), Doctor of Medicine 16.7 % (N = 91) and Ph.D 4.2 % (N = 23). There was
no gender differences in having an academic degree (Diploma: male = 8.3 %, female = 6.0 %, p = 0.30; Bachelor: male = 48 %, female = 47 %, p = 0.725; Masters:
male = 24.4 %, female = 23.0 %, p = 0.650; Ph.D:
male = 4.5 %, females = 4 %, p = 0.701; Doctor of
Medicine: males = 14.4 %, females = 18 %, p = 0.251).
However, significant sex differences were detected in field of
study. A significantly higher proportion of females had
123
J Autism Dev Disord
Table 1 Distribution of
responses to Eyes test in
percentages
Item
Test
1
2
3
4
Q1
53.8
23.1
20.4
2.8
Q2
19.6
72.1
5.3
Q3
2.2
3.3
Q4
9.4
Q5
Item
Test
1
2
3
4
Q19
4.2
16.1
9.9
69.7
2.9
Q20
3.7
91.4
4.4
0.6
53.4
41.1
Q21
21.3
56.1
21.8
0.8
63.7
17.4
9.5
Q22
80.7
1.7
7
10.6
32.5
8.8
58.2
0.6
Q23
2.9
2.2
51.9
42.9
Q6
10.8
78.3
8.4
2.4
Q24
64.6
29.4
1.7
4.4
Q7
3.1
38.7
18.7
39.4
Q25
7.3
32.5
20.9
39.3
Q8
72.7
20.2
1.7
5.5
Q26
4.4
2.8
78
14.9
Q9
20.4
6.8
11.7
61.1
Q27
0.7
47.5
30.1
21.7
Q10
43.9
26.8
13.8
15.6
Q28
47
7
11.4
34.7
Q11
9.9
22
52.1
16
Q29
12.5
30.6
18.7
38.2
Q12
16.1
0.9
74.3
8.6
Q30
6.2
86.8
5.7
1.3
Q13
64
4.2
2.9
28.8
Q31
4.4
58.3
10.6
26.6
Q14
3.3
1.8
1.3
93.6
Q32
79.1
5.1
9.7
6.1
Q15
80.7
2.8
10.5
6.1
Q33
2.6
26.1
4.8
66.6
Q16
13.4
59.4
3.9
23.3
Q34
5
17.1
65.1
12.8
Q17
57.8
27.9
1.7
12.7
Q35
28.8
53
5
13.2
Q18
82.4
6.2
5.1
6.2
Q36
1.5
4
68.6
25.9
Correctly identified descriptors are marked in bold
The highlighted items have failed to fulfill either first condition or second condition
studied humanities (33.3 % in comparison to males =
19.3 %, p \ 0.0001), and a significantly lower percentage of
them had studied engineering (20 % in comparison to
males = 39.4 %, p \ 0.0001). There was no significant sex
differences in those studied medicine (males = 14.8 %, females = 18.4, p = 0.254) or sciences (males = 17.4 %,
females = 21.2 %, p = 0.264).
Distribution of Responses
The mean score of all participants was 22.76
(SD = 3.41, min = 9, max = 31). Table 1 indicates the
123
responses of all items of the Eyes test and the percentage of participants who chose them. This had been
used as an index of item difficulty by most studies
(Baron-Cohen et al. 2001a, b) in which items were
considered to be of satisfactory difficulty if at least
50 % of participants selected the target word and of no
more than 25 % of participants selected one of the
foils. In 6 items, the first condition was not met (7, 10,
25, 27, 28, 29) and in 15 items the second condition
was not met (3, 5, 7, 10, 13, 17, 23, 24, 25, 27, 28, 29,
33, 35, 36). This was similar to other studies of the
Eyes test in other countries.
J Autism Dev Disord
Table 2 A comparison of the percentage of participants who chose the target in different version of the eyes test
Item
Persian
Italian (Vellante
et al. 2013)
German (Pfaltz
et al. 2013)
French (Prevost
et al. 2014)
Spanish (FernandezAbascal et al. 2013)
English (BaronCohen et al. 2001b)
Q1
53.8
69.5
65.8
84
66.9
85.2
Q2
72.1
56
49.4
70
63.8
78.7
Q3
53.4
65
85.1
93
75.2
86.1
Q4
63.7
65.5
74.2
54
81.1
73
Q5
58.2
84
64.5
71
92.5
77
Q6
78.3
69
72.9
80
75.2
80.3
Q7
Q8
18.7
72.7
42.5
67
49
77.4
33
68
64.6
88
68
67.2
Q9
61.1
90.5
78.6
81
81.9
77
Q10
43.9
63.5
76
60
71
73
Q11
52.1
71
74.3
57
74.1
68
Q12
74.3
71.5
87.7
75
80.8
87.7
Q13
64
63.5
55.8
34
80.8
69.7
Q14
93.6
80
73.4
85
88.9
80.3
Q15
80.7
83
84.5
84
86.9
69.7
Q16
59.4
76
76
79
85.8
77
Q17
57.8
54
50.3
48
54.3
65.6
Q18
82.4
92
81.9
86
96.4
58.2
Q19
69.7
52.5
57.4
43
39
69.7
Q20
91.4
73.5
81.3
92
89.4
88.5
Q21
56.1
73
39.4
86
75.2
73.8
Q22
Q23
80.7
51.9
90.5
62.5
72.9
61.7
87
37
70.8
65.5
79.5
77.9
Q24
64.6
58.5
57.4
84
73.5
73.8
Q25
39.3
67
42.6
76
70.5
71.3
Q26
78
76.5
78.1
68
75.2
65.6
Q27
47.5
63
67.1
49
64.1
65.6
Q28
47
70
63.9
73
83.6
66.4
Q29
38.2
66.5
69
66
81.1
77.9
Q30
86.8
91
86.5
80
88.6
91
Q31
58.3
66.5
32.3
69
57.1
51.6
Q32
79.1
73
66.5
80
78
50
Q33
66.6
54
77.4
60
61.3
58.2
Q34
65.1
71
71
63
72.1
77
Q35
53
36.5
60.6
47
77.7
65.6
Q36
68.6
76.5
85.8
71
87.5
76.2
Mean
22.76
24.85
24.5
24.8
27.18
26.2
The italicized items have failed to fulfil the first condition in Persian Eyes test
Validity
Comparison of Items Among Different Studies
To assess the validity of the new Persian version of Eyes
test, we compared it with other non-English versions of
Eyes test. Table 2 shows a comparison of the percentage of
participants choosing the target word in different studies.
The italicized items failed to fulfill the first condition of
item difficulty (Baron-Cohen et al. 2001a, b). Since we
lacked the detailed data of other studies, we could not investigate whether the differences among various studies are
statistically significant or not. However, the mere observation of percentage of target-choosing participants may be
123
J Autism Dev Disord
fruitful. Among the highlighted items of Table 2 (items 7,
10, 25, 27, 28 and 29), three (items 7, 25 and 27) had failed
to fulfil the first condition in similar studies (Table 3).
Item Analysis
Item analysis of the Persian Eyes test showed that most
items are sufficiently difficult and discriminant. Except
item 9, all the items could significantly differentiate those
in upper 27 percentile from those in lower 27. This was
specifically interesting in some items. For instance item 7,
which was correctly answered only by 18.7 % of participants could differentiate the upper and lower 27 percentiles with considerable accuracy (p B 0.001), but item
9, answered correctly by 61.1 % of participants, was not
significantly different between skillful and unskillful mind
readers.
This was also true considering the discrimination index.
Most of the items had mediocre to excellent discriminant
coefficients. According to our guideline (Zainudin et al.
2012), eight items had poor Di: 9, 13, 14, 20, 23, 24, 27 and
29. Interestingly, items 9, 13, 14, 20, 23 and 24 had been
answered correctly by more than 50 % of participants. One
item (item 26) had an excellent Di, eleven items (items 3, 8,
15, 17, 18, 21, 22, 28, 33, 35, 36) had a good Di, and
sixteen items (items 1,2, 4, 5, 6, 7, 10, 11, 12, 16, 19, 25,
30, 31, 32, 34) had a mediocre Di.
The mean difficulty coefficient of all items was
62.49 %, which is desirable for a test. The distribution of
items, based on their difficulty, was also appropriate. 3 %
of items were very difficult (item 7), 3 % were very easy
(item 14), 17 % were moderately difficult (items 3,10, 25,
27, 28 and 29), 27 % were moderately easy (items 2, 6, 12,
15, 18, 20, 22, 26, 30 and 32) and 50 % had a medium
difficulty (items 1,4, 5, 8, 9, 11, 13, 16, 17, 19, 21, 23, 24,
31, 33, 34, 35 and 36). Table 4 shows the index of difficulty and index of discrimination for each item.
Fig. 2 The Bland–Altman plot of two Eyes test assessments
Internal consistency, measured by Cronbach’s alpha, was
0.371 with a 95 % CI from 0.293 to 0.444.
the Spearman’s rank correlation coefficient, and as expected we found a significantly positive correlation between the scores (rs = 0.642, p \ 0.001). Test–retest
reliability of the Eyes test was also evaluated using Intraclass Correlation Coefficient. The ICC for total scores was
0.735 with a 95 % CI of (0.514, 0.855). Also, based on
Hutchins et al. (2008), we calculated the percentage
agreement of each item separately in order to assess the
reliability of Eyes test (Table 5). We found that twelve
items (items 1, 10, 11, 16, 21, 24, 25, 27, 28, 29, 31 and 35)
failed to fulfil Hutchins’s criterion of acceptable reliability
(agreement percentage [ 70 %). However, ten items of
these twelve had an agreement percentage more than 60 %,
and item 24 percentage was 54 %. The only item that had
an agreement percentage less than 50 % was item 29
(47.7 %).
As an additional measure of agreement, the Bland–
Altman approach was used (Bland and Altman 1986). The
mean difference was -0.159 (SD = 3.42). The upper limit
of agreement was 6.56 with 95 % confidence interval
4.6–8.52. The lower limit of agreement was -6.88 with
95 % confidence interval ranging from -4.92 to -8.84.
The Bland–Altman plot is shown in Fig. 2.
Test–Retest Reliability
Gender Differences
N = 44 participants performed the test twice. Their mean
score was 23.80 (SD = 3.92) at the test and 23.95
(SD = 3.56) at the retest. Using two related sample Wilcoxon Signed Ranks test, we found no significant difference between the two scores (p = 0.709). To examine the
relation between the scores in test and retest, we calculated
Females on average performed better than males. Females’
mean score on the Eyes test was 23.13 (SD = 3.16), which
in comparison with male’s mean score (22.43, SD = 3.63),
was significantly higher (U = 33,583, p = 0.016). In addition, as shown in Table 6, the percentage of males and
females who chose the target for each item was calculated.
Reliability Analysis
Internal Consistency
123
J Autism Dev Disord
The Chi square test was used to determine if there is any
item in which males’ and females’ performance was significantly different. Females did better on items 13, 18, 20
and 23, whereas males performed better in items 1, 4 and
25. The target in the items 13, 18, 20 and 23 is anticipating,
decisive, friendly and defiant whereas the target in items 1,
4 and 25 is playful, insisting and interested.
Academic Degree and Field of Study
The mean and standard deviation of groups with different
fields of study and with different academic degrees is depicted in Table 7. The best performance among various
academic fields and degrees occurred in Medicine and
Diploma subgroups, respectively.
Different groups with different academic fields and
degrees were compared to determine if there is any
significant difference among them. Using the Kruskal–
Wallis test, no significant differences were detected either among different field of studies (p = 0.235) or
among different academic degrees (p = 0.076). However,
comparing the mean score of those studied medicine
(N = 91) with all the others (N = 412) showed a significant advantage among medical doctors (U = 17,612,
p = 0.026). No other significant difference was obtained
in any comparison among different fields of study and
different academic degrees. The possible effects of academic degree and field of study were also examined in
males and females separately and independently. The
Kruskal–Wallis test was used, and no significant difference was found among groups.
Finally we tested whether exclusion of any item would
alter the found differences in performances of different
subgroups (sex, academic field and degree) or not. The
criteria, based on which, we excluded items were those we
had used to investigate the psychometrics of Eyes test:
Percentage of Agreement between test and retest (Agreement) (Hutchins et al. 2008), discrimination of those in
upper and lower 27th percentiles, and the conventional two
conditions (Baron-Cohen et al. 2001a, b). The items that
failed to fill each criterion were recognized and excluded
separately and then all the descriptive statistics and analyses were performed again. Table 8 compares the consequences of applying each strategy to examine the reliability
of Eyes test. The internal consistency of the Eyes test was
not improved no matter which criterion used for exclusion.
Neither were the differences among subgroups when the
exclusion criteria were Percentage of Agreement, discrimination of those in upper and lower 27th percentiles
and the first condition. However when items which had
failed the second condition were excluded the difference
among sexes disappeared (p = 0.761).
Discussion
Our study assessed the psychometric properties and test–
retest reliability of the Persian Eyes test. In order to so, 545
participants were invited using electronic mail and social
networks. It was supposed that this sampling would lead to
a more demographically varied and more populated sample
in comparison to previous studies which mostly studied the
Eyes test among university students. For instance, Vellante
et al. (2013) investigated 200 undergraduate students attending the University of Cagliari, Pfaltz et al. (2013)
studied 155 students from University of Basel, and Fernandez-Abascal et al. (2013) examined the test among 358
first-year psychology undergraduates enrolled at the
Universidad Nacional de Educacio´n a Distancia (UNED,
Spain). In addition, our sample size was considerably
larger than most of similar studies. Yildirim et al. study
(2011) of the Turkish Eyes test sampled their participants
from general population (N = 130).
The internal consistency of Eyes test, measured by
Chronbach’s alpha, was relatively poor in our Persian
version of Eyes test, as well as in most the similar studies
(Vellante et al. 2013). Voracek and Dressler (2006) found
that Cronbach’s alpha was 0.63 in men and 0.60 in women.
Harkness et al. (2010) found Cronbach’s alpha 0.58 in a
sample including 93 college students. According to Prevost
et al. (2014) the Chronbach’s alpha of French version of
Eyes test was 0.53, while the Italian version’s has been
0.60 based on Vellante et al. (2013). Our version’s alpha
was 0.371 which is equally weak. Some authors have
suggested that the limits of internal consistency of Eyes test
are more likely originated in the inherent variability of
facial affect recognition abilities among population rather
than the translations (Prevost et al. 2014). This is also
supported by this fact that excluding any item(s), no matter
based on what criterion, did not improve the internal
consistency of test (Table 8).
Test–retest reliability of Eyes test has been investigated
in different studies using different approaches and with
different intervals. For Persian version, the Intra-class
Correlation Coefficient, the percentage agreement of items
in test and retest, the Bland–Altman plot and the Spearman’s rank correlation coefficient of mean scores in test
and retest were calculated. The retesting was 1 year after
the test. This time interval is longer than most studies
where retesting took place from 1 week (French, German
and Turkish) to 1 month (Italian) to 1 year (Spanish). The
results were generally satisfactory, indicating that there
was no learning effect among our participants after 1 year.
The ICC for total score of Persian eyes test (0.735) was
higher than Turkish (0.65) and Spanish (0.63) studies, and
lower than the Italian’s (0.833). As in Swedish (in which
123
J Autism Dev Disord
the Pearson correlation between the scores of Eyes test the
first and second time was r = 0.60, p \ 0.01) and Spanish
studies (in which the Spearman Rho correlation between
test and retest for each was positive and significant except
item 18), the test and retest total scores of Persian Eyes
test, as well as each item, were positively and significantly correlated (Vellante et al. 2013; FernandezAbascal et al. 2013; Hallerback et al. 2009). Taking the
Bland–Altman approach, we could demonstrate that most
responses on all items were consistent from test to retest,
mean differences were 0 and most differences fell with
95 % CI. According to the plot, any individual result can
vary in the range of ±6 out of 36 when the test is repeated. As Hallerback et al. (2009) emphasized, this
means that any obtained test score must be regarded as an
approximation.
Percentage of agreement between the participant’s performance in test and retest was also measured for each item
(Table 5). Following the procedure used by others
(Hutchins et al. 2008), the minimum accepted value of
agreement was considered to be 70 %. Based on this criterion, 11 items (items 9, 10, 11, 16, 21, 24, 25, 27, 28, 29,
31 and 35) failed to achieve the acceptable reliability,
among these item 29 was the only item in which less than
50 % of participants selected the same answer twice; item
24 was answered in the same way by 54 % and all the other
ten items had been answered by more than 60 % and less
than 70 % of participants. This is in concordance with
results of German (10 items), Turkish (19 items) and
Swedish (8 items out of 28 items) studies. Items 16, 21, 29
and 31 failed to fulfill the 70 % criterion in both the Persian
and German studies, as well as items 9, 10, 21, 24, 27, 28
and 31 in both Persian and Turkish version. Since the
Swedish study had used the child version of Eyes test, it
was not possible to identify the shared failing items.
Considering all of these together it seems that the reliability of Persian Eyes test is as acceptable as other
studies. In addition, as Table 8 shows, the exclusion of
items that failed to fulfill the 70 % criterion (Hutchins et al.
2008), did not change either the internal consistency of the
Eyes test or any of the results.
The validity of Eyes test, as different authors have
previously mentioned, is difficult to investigate since there
is no gold standard to be used (Hallerback et al. 2009;
Prevost et al. 2014). In order to solve this problem, we
developed two strategies to validate the Persian version:
First, to compare the results of Persian Eyes test as a whole,
as well as its each item, to similar studies investigating the
psychometrics of Eyes test. Second, to analyze each item of
Persian Eyes test according to discrimination and difficulty
indices.
Comparing the Persian Eyes test to other versions
showed that our results were weaker compared to other
123
studies. As previously mentioned, in our sample, the target
word in 6 items (Items 7, 10, 25, 27, 28 and 29) was
selected by less than 50 % (the first condition). In the
French version (Prevost et al. 2014) seven items (Items 7,
13, 17, 19, 23, 27 and 35), in the German version (Pfaltz
et al. 2013) five items (items 2, 7, 21, 25 and 31), in the
Turkish version (Yildirim et al. 2011) four items (Items 19
and 21, plus items 25 and 35 that had been excluded during
the pilot study), in the Italian version (Vellante et al. 2013)
two items (items 7 and 35) and in the Spanish version
(Fernandez-Abascal et al. 2013) just one item (item 19)
had the same condition. Consistently, the number of items
in other versions of Eyes test in which some foils were
selected by more than 25 % of participants (the second
condition), were similar to ours. In the French version 10
items (items 4, 7, 11, 13, 17, 19, 23, 27, 34 and 35), in the
German version 6 items (items 2, 7, 13, 17, 19, 24 and 35),
in the Turkish version 4 items (items 17, 19, 21 and 23), in
the Italian version 7 items (items 3, 4, 7, 17, 19, 24 and 35)
and in the Spanish version 4 items (items 17, 19, 31 and
33) failed to meet that criteria, as did 13 items of the
Persian Eyes test (items 3, 5, 7, 10, 13, 17, 23, 24, 25, 27,
28, 29 and 33). It should be noted, however, that in comparison to other studies our sample size was clearly larger
and, also, demographically more varied (see above). Thus
the wider range of scores and the lower mean score,
alongside the less acceptable items (in terms of fulfilling
the first and second conditions) in our results may reflect
the more diverse strata of general population participated
in our study.
In addition, there are similarities in the list of problematic items among different studies. For example item 7
failed to meet the first condition in the French (33 %),
German (49 %), Italian (42.5 %) and Persian (18.7 %)1
studies, and item 17, failed to meet the second condition in
the Persian (27.9 % of participants chose the foil ‘‘affectionate’’), German (40 % chose the foil ‘‘affectionate’’),
French (39 % chose the foil ‘‘affectionate’’), Italian (32 %
chose the foil ‘‘affectionate’’) and Spanish (27.3 % chose
the foil ‘‘affectionate’’) studies. Seemingly, participants
tend to mistake ‘‘affectionate’’ to ‘‘doubtful’’ regardless of
their language or nationality. More interestingly, Persian
participants had chosen the foils 2 (friendly) and 4
(dispirited) in the item 7 considerably more frequent than
foil 1 (apologetic); this is similar to how Italians (25.2 %
for foil 2 and 10 % for foil 4), French (39 % for foil 2 and
16 % for foil 4), Germans (22.2 % for foil 2 and 15 % for
foil 4) and Turkish (12 % for foil 2 and 23.9 % for foil 4)
had answered item 7. Examples such as item 7 show that
though there are differences in percentage of participants
1
The number in the parenthesis is percentage of participants
choosing the target in item 7 in each study.
J Autism Dev Disord
answering to Eyes test, the overall pattern of answering is
highly similar between various studies. Other items happened to be problematic in some and not others; such as
item 19 which is problematic in Italian, French and Spanish
studies but not in Persian and German studies. Instead of
translational errors or cultural differences, such similarities
point to inherent features of items which make them difficult for various participants. An analytic comparison of
each item between different versions of Eyes test in future
studies seems to be very crucial to illuminate the nature of
these similarities and differences.
Another aspect of comparing Persian Eyes test to other
versions is the possible differences among subgroups of
participants.
First, men scored significantly worse than females,
echoing the frequently replicated advantage of females
over males (Hallerback et al. 2009; Baron-Cohen et al.
1997; Vellante et al. 2013; Yildirim et al. 2011). This can
be taken as supporting the validity of the Persian Eyes test.
This is specifically notable given that male and female
participants of our study had no significant difference in
age and academic degree, suggesting that sex-dependent
performance in Eyes test is not influenced by age and
educational level—which may be cautiously interpreted as
overall intelligence.
In addition, there are items on which males and females
performed significantly different (Table 6). Females performed better on items anticipating, decisive, friendly and
defiant (items 13, 18, 20 and 23) whereas males outperformed females in recognizing playful, insisting and interested faces (items 1, 4 and 25). Previously there have
been some reports on sex differences in detecting various
states of mind. In one study females were faster in detecting
happy facial expressions while men spent a considerably
longer time viewing the nose and mouth (Vassallo et al.
2009). Other studies propose that these sex differences are
based on the type of emotion. It is suggested that females
are better at recognizing facial expressions of fear and
sadness (Mandal and Palchoudhury 1985; Nowicki and
Hartigan 1988), and males are superior at detecting anger
(Mandal and Palchoudhury 1985; Rotter and Rotter 1988;
Wagner 1986; Sawada et al. 2014). Evolutionary hypotheses have also been provided to explain the origins of
such differences (Hampson et al. 2006). Although it seems
that females do score ser than men when it comes to
emotion recognition, whether these differences are seen for
all emotions remains to be answered (Kret and De 2012).
This is crucially important to determine that the widely
replicated female superiority in Eyes test is an indication of
an overall female psychological advantage over males or
just a reflection of capability of detecting some emotions. If
the latter is the case, the advantage of females in the Eyes
test would be due to the higher frequency of items in which
females perform better, not a general ability in reading
minds.
Since prenatal testosterone and sex chromosomes are
physiological differences between men and women, an
interesting idea for future research is to investigate the
Eyes test results among patients with disorders of sex development (DSD), conditions where androgen or chromosomal profiles are atypical. This may be helpful for
revealing the possible origin of sex differences in performance in Eyes test.
Further support for the validity of the Persian Eyes test
comes from the comparison of subgroups with various
educational levels. As noted earlier there was no significant
difference between those with diploma, bachelor, Master,
Ph.D and M.D degrees. This shows that higher education
does not affect ToM, as measured by the Persian Eyes test.
This is in opposition to Yildirim’s study that showed those
with university education score significantly higher than
those with primary and high school education. However, it
should be considered that in our study the lowest educational degree was Diploma. One can speculate that
although different levels of higher education do not affect
the performance in Eyes test, but there is a minimum level
below which the performance of participants deteriorates
significantly.
Considering the E–S theory, our study has led to some
notable findings. First of all, among those studied Humanities and engineering there were significant sex differences, with females scoring higher in the first and males in
the second. This is consistent with E-S theory that predicts
those with the S type brain, which is more common among
men, tend to ‘analyze and construct rule-based systems’
(such as is involved in engineering) rather than to identify
another’s mental states and to respond to these with an appropriate emotion (which is involved in the humanities)
which is an aspect of those with E type brain, and more
common among women. However, opposite to what theory
predicts, we found no significant difference among various
fields of study in performance on the Eyes test. Although the
medicine subgroup had scored significantly better than other
groups, post hoc comparison between groups showed that
there was no overall main effect and the significant advantage of those studied medicine is nominal. The mean score
among other three subgroups (humanities, engineering and
sciences) were very close. There are several explanations for
this inconsistency. First, one might assume that there is no
correlation between performance in Eyes test and EQ. Reviewing the relevant literature shows that this is unlikely
(Manson and Winterbottom 2011; Focquaert et al. 2007;
Billington et al. 2007). Secondly, it might be due to an uncontrolled third factor varying between the subgroups, such
as overall and verbal intelligence. This is important considering the studies investigating the correlation between verbal
123
J Autism Dev Disord
Table 3 Percentage of
participants in the upper and
lower 27th percentile choosing
the target in each item
item
Lower 27 %
Upper 27 %
Item
Lower 27 %
Upper 27 %
Q1**
41.5
66.1
Q19**
55.9
78.8
Q2*
60.2
87.3
Q20**
81.4
97.5
Q3**
30.5
67.8
Q21**
35.6
72
Q4**
48.3
77.1
Q22**
61.9
92.4
Q5**
44.9
71.2
Q23*
45.8
63.6
Q6**
67.8
89.9
Q24*
52.5
69.5
Q7**
9.3
30.5
Q25**
27.1
49.2
Q8**
50.8
86.4
Q26**
50
91.5
Q9
55.9
62.7
Q27**
41.5
56.8
Q10**
37.3
58.5
Q28**
31.4
66.9
Q11**
39.8
62.7
Q29*
28.8
44.9
Q12**
62.7
86.4
Q30**
73.3
94.9
Q13*
55.1
74.6
Q31**
46.6
72
Q14**
81.4
99.2
Q32**
68.6
89
Q15**
Q16**
59.3
49.2
89.8
75.4
Q33**
Q34**
54.2
47.5
85.6
76.3
Q17**
41.5
72
Q35**
38.1
72
Q18**
62.7
94.9
Q36**
49.2
86.4
* p \ 0.01; ** p \ 0.0001
Table 4 Item analysis of Eyes
Test: Difficulty index (Pi)a and
index of Discrimination (Di)b
for each item
Item
Di
Pi
Item
Di
Pi
Item
Di
Pi
Item
Di
Pi
Q1
24.58
53.81
Q12
23.73
74.58
Q23
17.80
54.66
Q34
28.81
61.86
Q2
27.12
73.73
Q13
19.49
64.83
Q24
16.95
61.02
Q35
33.90
55.08
Q3
37.29
49.15
Q14
17.80
90.25
Q25
22.03
38.14
Q36
37.29
67.80
Q4
28.81
62.71
Q15
30.51
74.58
Q26
41.53
70.76
Q5
26.27
58.05
Q16
26.27
62.29
Q27
15.25
49.15
Q6
22.03
78.81
Q17
30.51
56.78
Q28
35.59
49.15
Q7
21.19
19.92
Q18
32.20
78.81
Q29
16.10
36.86
Q8
35.59
68.64
Q19
22.88
67.37
Q30
21.19
84.32
Q9
6.78
59.32
Q20
16.10
89.41
Q31
25.42
59.32
Q10
21.19
47.88
Q21
36.44
53.81
Q32
20.34
78.81
Q11
22.88
51.27
Q22
30.51
77.12
Q33
31.36
69.92
a
Very difficult (p \ 30 %); Moderately difficult (31 % \ p \ 50 %); Medium difficulty (51 % \ p \ 70 %);
Moderately easy (71 % \ p \ 90 %); Very easy (p [ 90 %)
b
D [ 39: Excellent; 39 [ D [ 30: Good; 29 [ D [ 20: Mediocre; 19 [ D [ 0: Poor; -1 [ D: Worst
intelligence and performance in Eyes test (Peterson and
Miller 2012). When comparing sex differences we could
cautiously infer that there is no significant difference between our male and female participants regarding their
educational level. But it is not the same considering the
subgroups in various academic fields. This is because most
Iranian students have to choose their academic field of study
according to their rank in the National University Examination which is taken at the end of the last year of high
school and is very competitive. This causes most of the
students to choose their academic field of study based on
their available options, and not their preferences and
123
interests. And those with highest grades mostly, if not exclusively, regard ‘medicine’ as their first option. Thus, one
might claim that various academic subgroups in Iran may not
be similar based on their general intelligence. In addition, it
has been noted that performance on the Eyes test is correlated
with social skills and affective as well as cognitive empathy
(Grove et al. 2014). Thirdly, it has been suggested that
medical students have higher abilities on the Eyes test.
However, this is not consistent in the literature either (for a
review see (Pedersen 2010)). Although most of these studies
used measures other than the Eyes test to evaluate the ToM
but some used the Eyes test (Dehning et al. 2013).
J Autism Dev Disord
Table 5 Percentage of
agreement between the
participant’s performance in test
and retest
Item
Both correct
Both wrong
One correct and one wrong
Same response
Q1
54.55
22.73
22.73
77.27
Q2
61.36
13.64
25.00
77.27
Q3
54.55
18.18
27.27
72.73
Q4
54.55
27.27
18.18
77.27
Q5
59.09
31.82
9.09
86.36
Q6
77.27
6.82
15.91
86.36
Q7
20.45
70.45
9.09
75.00
Q8
59.09
13.64
27.27
70.45
Q9
50.00
13.64
36.36
63.64
Q10
40.91
34.09
25.00
63.64
Q11
31.82
38.64
29.55
61.36
Q12
36.36
6.82
56.82
70.45
Q13
47.73
31.82
20.45
77.27
Q14
86.36
2.27
11.36
88.64
Q15
Q16
79.55
36.36
9.09
29.55
11.36
34.09
84.09
63.64
Q17
43.18
31.82
25.00
70.45
Q18
86.36
0.00
13.64
86.36
Q19
61.36
15.91
22.73
72.73
Q20
84.09
2.27
13.64
86.36
Q21
43.18
29.55
27.27
68.18
Q22
65.91
15.91
18.18
81.82
Q23
47.73
22.73
29.55
70.45
Q24
43.18
15.91
40.91
54.55
Q25
29.55
38.64
31.82
63.64
Q26
75.00
9.09
15.91
84.09
Q27
38.64
34.09
27.27
65.91
Q28
45.45
22.73
31.82
63.64
Q29
4.55
61.36
34.09
47.73
Q30
79.55
9.09
11.36
86.36
Q31
Q32
40.91
79.55
34.09
4.55
25.00
15.91
68.18
84.09
Q33
59.09
15.91
25.00
72.73
Q34
59.09
11.36
29.55
70.45
Q35
47.73
25.00
27.27
65.91
Q36
56.82
20.45
22.73
72.73
The italicized items have failed to fulfill the 70 % agreement criterion of Hutchins (Hutchins et al. 2008)
Another strategy we used to analyze the validity of the
Persian Eyes test was to evaluate its items according to discrimination and difficulty indices. An appropriate measure
should be difficult enough that it can reveal more subtle
variations among the general population (Hallerback et al.
2009). Our results indicated that participants in the upper 27
percentile (based on their final score) performed on all items
(except item 9) significantly better in comparison to those in
lower 27 percentile (Table 3). The calculated discrimination
index for each item, too, showed that all items, though with
different efficiencies, can discriminate among the participants (the index of item 9, again, was considerably lower
than others), (Table 4). This is particularly plausible on
items which were previously considered as problematic: 4
out of 6 items that failed to meet the first condition, and 8 out
of 13 items that failed to meet the second condition, had
mediocre to good discrimination indexes. Since to the best of
our knowledge this is the first study to evaluate the discrimination and difficulty indices of Eyes test items, we
could not compare our results to previous studies.
123
J Autism Dev Disord
Finally, any attempt to exclude some items from the
Eyes test remained inconclusive (Table 8). As this shows,
the internal consistency and test–retest reliability of the
whole test, measured by Cronbach’s Alpha and ICC, does
not change dramatically in different conditions. This is true
of other results except one: the female advantage disappears when excluding those items which failed to meet the
second condition. Considering the similar results of other
studies, this low internal consistency may be originated
from the nature of the test not the reliability of translated
items and thus, no exclusion seems to be inevitable.
These findings suggest that the validity of an item in
Eyes test cannot be dismissed based only on one criterion
such as first and second conditions that has been traditionally used for exclusion of items. Instead a multiple
approach, considering various measures of validity and
reliability, would be necessary. Suggesting an algorithm
for validating the items of Eyes test, however, is far beyond
Table 6 Percentage of males and females choosing the target in each
item
Item
Males
Females
Item
Males
Females
Q1*
59.3
48.2
Q19
68.1
71.3
Q2
71.9
72
Q20**
87.1
95.4
Q3
51
55.7
Q21
57.4
55
Q4*
70.3
57.4
Q22
79.8
81.6
Q5
56.7
59.2
Q23*
46.4
56.7
Q6
76
80.5
Q24
63.5
65.6
Q7
Q8
17.5
68.8
19.9
76.2
Q25*
Q26
44.5
76
34
79.8
Q9
60.1
62.1
Q27
44.9
46.9
Q10
47.9
37.9
Q28
49.4
44.3
Q11
47.5
55.7
Q29
39.5
36.5
Q12
71.5
77
Q30
85.6
87.9
Q13**
57
70.6
Q31
60.8
55.7
Q14
92
95
Q32
76.8
81.2
Q15
79.1
83.2
Q33
63.5
69.1
Q16
57
61.3
Q34
67.3
63.1
Q17
55.1
60.3
Q35
49.8
56.8
Q18*
77.9
86.5
Q36
65.8
71.3
* p \ 0.01; ** p \ 0.001
the scope of this study. Nonetheless, our study showed that
some previously invalid items may bear some importance
considering the ability of participants in reading minds of
others through their eyes. The comparative study of items,
explained here, clearly demonstrated that in spite of disparities there are inherent similarities in how participants
with various cultural backgrounds perform in Eyes test.
These findings in combination with previous studies
showing that the Eyes test is sensitive to sex differences
and to differences among people who choose different
academic fields (Baron-Cohen et al. 2001a), that it is sensitive to various levels of prenatal testosterone in children
(Chapman et al. 2006) and in adults who have been administrated oxytocin (Domes et al. 2007), suggests that the
Eyes test is measuring a substantial aspect of human cognition; otherwise such correlations would not be evident.
Whether ToM, as measured by Eyes test, can be improved through practice or not remains an open question.
Although our study implied a negative answer, there are
studies that have proposed performance in Eyes test may be
improved, at least temporarily, by reading literary fiction
(Kidd and Castano 2013).
This study was not without limitations. First the participants performed the test online, so the experimenters
could not control the environmental factors affecting the
participants while performing the test. Secondly, although
the demographic combination of our participants was more
diverse than most of the similar studies, it was not a representative sample of the general population. All of our
participants were users of the World Wide Web, meaning
that they have at least an elementary level of education.
The range of scores among educationally more varied
samples might be more extended. The mean age of our
participants, too, was relatively young. Thirdly, our study
lacked any measure of intelligence (verbal or nonverbal)
which may influence the performance on Eyes test.
In conclusion, the Eyes test is an easy-to-use, easy-toscore measure of facial affect recognition (Vellante et al.
2013). This study indicated that psychometric properties
of the Persian Eyes test, the revised version for adults,
are generally acceptable except items 9 and 29 which
its translations have to be reconsidered both in target
and foils, regarding their failure according to several
criteria.
Table 7 Eyes test score in different subgroups of participants defined by academic degree and field of study
Statistics
Medicine
Humanities
Engineering
Sciences
Mean
23.60
22.70
22.73
22.90
23.82
22.47
22.76
22.60
23.60
SD
2.95
3.21
3.39
3.55
2.99
3.43
3.31
4.07
2.90
Number
91
146
160
106
40
261
130
23
91
123
Diploma
Bachelor
Master
Ph.D
Doctor of medicine
J Autism Dev Disord
Table 8 The results after excluding problematic items according to each criterion
Criterion
Descriptive statistics
U
p value
p value
Field of
study
p value
0.371
33,583
\0.05
0.076
0.235
–
0.437
31,946
\0.05, 0.01
0.375
0.458
9, 10, 11, 16, 21, 24, 25,
27, 28, 29, 31, 35
8–25
0.303
36,527
0.761
0.295
0.76
3, 5, 13, 17, 23, 24, 33, 35, 36
8–28
0.416
32,025
\0.05, 0.01
0.164
0.408
7, 10, 25, 27, 28, 29
9–30
0.385
33,591
\0.05
0.113
0.241
9
Mean
Range
Eyes test
22.76
9–31
Agreement
16.6
4–18
[25 %
17.422
\50 %
20.46
27th percentile
22.18
Cronbach’s
alpha
Sex
Acknowledgments This study was part of a medical doctorate
dissertation which was fully supported by Mashhad University of
Medical Sciences. SBC was supported by the Autism Research Trust
during the period of this work. This article is thoroughly the original
work of authors without any financial interest or benefit.
Conflict of interest It is strictly ascertained that there would be no
matter of concern as a subject for conflict of interests.
References
Adams, R. B., Jr., Rule, N. O., Franklin, R. G., Jr., Wang, E.,
Stevenson, M. T., Yoshikawa, S., et al. (2010). Cross-cultural
reading the mind in the eyes: An fMRI investigation. Journal of
Cognitive Neuroscience, 22(1), 97–108. doi:10.1162/jocn.2009.
21187.
Ahmed, F. S., & Stephen, M. L. (2011). Executive function
mechanisms of theory of mind. Journal of Autism and Developmental Disorders, 41(5), 667–678. doi:10.1007/s10803-0101087-7.
Apperly, I. A., Riggs, K. J., Simpson, A., Chiavarino, C., & Samson,
D. (2006). Psychological Science, 17, 841.
Auyeung, B., Baron-Cohen, S., Ashwin, E., Knickmeyer, R., Taylor,
K., Hackett, G., et al. (2009). Fetal testosterone predicts sexually
differentiated childhood behavior in girls and in boys. Psychological Science, 20(2), 144–148. doi:10.1111/j.1467-9280.2009.
02279.x.
Baron-Cohen, S. (1995). Mindblindness: An essay on autism and
theory of mind. Cambridge, MA: MIT Press.
Baron-Cohen, S. (2010). Empathizing, systemizing, and the extreme
male brain theory of autism. Progress in Brain Research, 186,
167–175.
Baron-Cohen, S., Jolliffe, T., Mortimore, C., & Robertson, M. (1997).
Another advanced test of theory of mind: Evidence from very
high functioning adults with autism or asperger syndrome.
Journal of Child Psychology and Psychiatry, 38, 813–822.
Baron-Cohen, S., Richler, J., Bisarya, D., Gurunathan, N., &
Wheelwright, S. (2003). The systemizing quotient: An investigation of adults with Asperger syndrome or high-functioning
autism, and normal sex differences. Philosophical Transactions
of the Royal Society of London. Series B, Biological Sciences,
358, 361–374.
Baron-Cohen, S., & Wheelwright, S. (2004). The empathy quotient:
An investigation of adults with Asperger syndrome or high
functioning autism, and normal sex differences. Journal of
Autism and Developmental Disorders, 34, 163–175.
Baron-Cohen, S., Wheelwright, S., Hill, J., Raste, Y., & Plumb, I.
(2001a). The ‘‘Reading the Mind in the Eyes’’ Test revised
version: A study with normal adults, and adults with Asperger
Degree
Excluded items
syndrome or high-functioning autism. Journal of Child Psychology and Psychiatry, 42, 241–251.
Baron-Cohen, S., Wheelwright, S., Skinner, R., Martin, J., & Clubley, E.
(2001b). Journal of Autism and Developmental Disorders, 31, 5.
Begeer, S., Malle, B. F., Nieuwland, M. S., & Keysar, B. (2010).
Using Theory of Mind to represent and take part in social
interactions: Comparing individuals with high-functioning autism and typically developing controls. European Journal of
Developmental Psychology, 7, 104–122.
Bender, L. C., Linnau, K. F., Meier, E. N., Anzai, Y., & Gunn, M. L.
(2012). Interrater agreement in the evaluation of discrepant
imaging findings with the Radpeer system. AJR: American
Journal of Roentgenology, 199, 1320–1327.
Billington, J., Baron-Cohen, S., & Wheelwright, S. (2007). Cognitive
style predicts entry into physical sciences and humanities:
Questionnaire and performance tests of empathy and systemizing. Learning and Individual Differences, 17, 260–268.
Bland, J. M., & Altman, D. G. (1986). Statistical methods for
assessing agreement between two methods of clinical measurement. Lancet, 1, 307–310.
Chapman, E., Baron-Cohen, S., Auyeung, B., Knickmeyer, R. F., Taylor,
K. F., & Hackett, G. (2006). Fetal testosterone and empathy:
Evidence from the empathy quotient (EQ) and the ‘‘reading the
mind in the eyes’’ test. Social Neuroscience, 1(2), 135–148.
Dehning, S., Gasperi, S., Tesfaye, M., Girma, E., Meyer, S., Krahl,
W., et al. (2013). Empathy without borders? Cross-cultural heart
and mind-reading in first-year medical students. Ethiopian
Journal of Health Sciences, 23, 113–122.
Domes, G., Heinrichs, M., Michel, A., Berger, C., & Herpertz, S. C.
(2007). Oxytocin improves ‘‘mind-reading’’ in humans. Biological Psychiatry, 61(6), 731–733.
Fernandez-Abascal, E. G., Cabello, R., Fernandez-Berrocal, P., &
Baron-Cohen, S. (2013). Test-retest reliability of the ‘Reading
the Mind in the Eyes’ test: A one-year follow-up study.
Molecular Autism, 4, 33.
Focquaert, F., Steven, Megan S., Wolford, George L., Colden, Albina,
Miller, L. S., & Gazzaniga, Michael S. (2007). Emphatizing and
systemizing cognitive traits in the sciences and humanities.
Personality and Individual Differences, 43, 619–625.
Grove, R., Baillie, A., Allison, C., Baron-Cohen, S., & Hoekstra, R.
A. (2014). The latent structure of cognitive and emotional
empathy in individuals with autism, first-degree relatives and
typical individuals. Molecular Autism, 5(1), 42. doi:10.1186/
2040-2392-5-42.
Guillemin, F., Bombardier, C., & Beaton, D. (1993). Cross-cultural
adaptation of health-related quality of life measures: Literature
review and proposed guidelines. Journal of Clinical Epidemiology, 46(12), 1417–1432.
Hallerback, M. U., Lugnegard, T., Hjarthag, F., & Gillberg, C. (2009).
The Reading the Mind in the Eyes test: Test–retest reliability of
a Swedish version. Cognitive Neuropsychiatry, 14, 127–143.
123
J Autism Dev Disord
Hampson, E., van Anders, S. M., & Mullin, L. I. (2006). A female
advantage in the recognition of emotional facial expressions:
Test of an evolutionary hypothesis. Evolution and Human
Behavior, 27(6), 401–416.
Harkness, K. L., Alavi, N., Monroe, S. M., Slavich, G. M., Gotlib, I.
H., & Bagby, R. M. (2010). Gender differences in life events
prior to onset of major depressive disorder: The moderating
effect of age. Journal of Abnormal Psychology, 119(4), 791–803.
doi:10.1037/a0020629.
Hutchins, T. L., Bonazinga, L. A., Prelock, P. A., & Taylor, R. S.
(2008). Beyond false beliefs: The development and psychometric evaluation of the perceptions of children’s theory of mind
measure-experimental version (PCToMM-E). Journal of Autism
and Developmental Disorders, 38, 143–155.
Kelley, T. L. (1939). The selection of upper and lower groups for the
validation of test items. Journal of Educational Psychology, 30,
17–24.
Kidd, D. C., & Castano, E. (2013). Reading literary fiction improves
theory of mind. Science, 342(6156), 377–380. doi:10.1126/
science.1239918.
Kret, M. E., & De, G. B. (2012). A review on sex differences in processing
emotional signals. Neuropsychologia, 50(7), 1211–1221.
Kunihira, Y., Senju, A., Dairoku, H., Wakabayashi, A., & Hasegawa,
T. (2006). ‘Autistic’ traits in non-autistic Japanese populations:
Relationships with personality traits and cognitive ability.
Journal of Autism and Developmental Disorders, 36, 553–566.
Lai, M. C., Lombardo, M. V., Chakrabarti, B., Ecker, C. F., Sadek, S.
A., Wheelwright, S., et al. (2012). Individual differences in brain
structure underpin empathizing–systemizing cognitive styles in
male adults. Neuroimage, 61(4), 1347–1354.
Lind, S. E., Bowler, D. M., & Raber, J. (2014). Spatial navigation,
episodic memory, episodic future thinking, and theory of mind in
children with autism spectrum disorder: Evidence for impairments in mental simulation? Frontiers in Psychology, 5, 1411.
doi:10.3389/fpsyg.2014.01411.
Linda, C., & Algina, J. (2006). Introduction to classical and modern
test theory. Mason, OH: Cengage Learning.
Mandal, M. K., & Palchoudhury, S. (1985). Responses to facial
expression of emotion in depression. Psychological Reports,
56(2), 653–654.
Manson, C., & Winterbottom, M. (2011). Examining the association
between empathising, systemising, degree subject and gender.
Educational Studies, 38, 73–88.
Mason, M. F., & Morris, M. W. (2010). Culture, attribution and
automaticity: A social cognitive neuroscience view. Social
Cognitive and Affective Neuroscience, 5(2–3), 292–306.
doi:10.1093/scan/nsq034.
Nejati, V., Zabihzadeh, A., Maleki, G., & Tehranchi, A. (2012). Mind
reading and mindfulness deficits in patients with major depression disorder. Procedia: Social and Behavioral Sciences, 32,
431–437.
Nowicki, S., Jr., & Hartigan, M. (1988). Accuracy of facial affect
recognition as a function of locus of control orientation and
anticipated interpersonal interaction. The Journal of Social
Psychology, 128(3), 363–372.
Pedersen, R. (2010). Empathy development in medical education—A
critical review. Medical teacher, 32(7), 593–600. doi:10.3109/
01421590903544702.
Peterson, E., & Miller, S. F. (2012). The Eyes test as a measure of
individual differences: How much of the variance reflects verbal
IQ? Frontiers in Psychology, 3, 220. doi:10.3389/fpsyg.2012.
00220.
123
Peterson, C. C., Slaughter, V. P., & Paynter, J. (2007). Social maturity
and theory of mind in typically developing children and those on
the autism spectrum. Journal of Child Psychology and Psychiatry, 48(12), 1243–1250.
Pfaltz, M. C., McAleese, S., Saladin, A., Meyer, A. H., Stoecklin, M.,
Opwis, K., et al. (2013). The Reading the Mind in the Eyes Test:
Test–retest reliability and preliminary psychometric properties
of the German version. International Journal of Advances in
Psychology (IJAP), 2, 1–9.
Premack, D., Woodruff, G., & Kennel, K. (1978). Paper-marking test
for chimpanzee: Simple control for social cues. Science,
202(4370), 903–905.
Prevost, M., Carrier, M. E., Chowne, G., Zelkowitz, P., Joseph, L., &
Gold, I. (2014). The Reading the Mind in the Eyes test:
Validation of a French version and exploration of cultural
variations in a multi-ethnic city. Cogn Neuropsychiatry, 19,
189–204.
Rotter, N., & Rotter, G. (1988). Sex differences in the encoding and
decoding of negative facial emotions. Journal of Nonverbal
Behavior, 12, 139–148.
Samson, D. (2009). Reading other people’s mind: Insights from
neuropsychology. Journal of Neuropsychology, 3(1), 3–16.
doi:10.1348/174866408X377883.
Sawada, R., Sato, W., Kochiyama, T., Uono, S., Kubota, Y.,
Yoshimura, S., et al. (2014). Sex differences in the rapid
detection of emotional facial expressions. PloS one, 9(4),
e94747. doi:10.1371/journal.pone.0094747.
Shahaeian, A., Peterson, C. C., Slaughter, V., & Wellman, H. M.
(2011). Culture and the sequence of steps in theory of mind
development. Developmental Psychology, 47(5), 1239–1247.
doi:10.1037/a0023899..
Vassallo, S., Cooper, S. L., & Douglas, J. M. (2009). Visual scanning
in the recognition of facial affect: Is there an observer sex
difference? Journal of Vision, 9(3), 11.1–11.10. doi:10.1167/9.3.
11.
Vellante, M., Baron-Cohen, S., Melis, M., Marrone, M., Petretto, D. R.,
Masala, C., et al. (2013). The ‘‘Reading the Mind in the Eyes’’
test: Systematic review of psychometric properties and a validation study in Italy. Cognitive Neuropsychiatry, 18, 326–354.
Voracek, M., & Dressler, S. G. (2006). Lack of correlation between
¨ s CC¸£Reading the
digit ratio (2D:4D) and Baron-CohenCC¸O
Mind in the EyesCC¸¥ test, empathy, systemising, and autismspectrum quotients in a general population sample. Personality
and Individual Differences, 41, 1481–1491.
Wagner, H. N., Jr., (1986). Images of the brain: Past as prologue.
Society of Nuclear Medicine, 27(12), 1929–1937.
Wheelwright, S., Baron-Cohen, S., Goldenfeld, N., Delaney, J., Fine,
D., Smith, R., et al. (2006). Predicting Autism Spectrum
Quotient (AQ) from the Systemizing Quotient-Revised (SQ-R)
and Empathy Quotient (EQ). Brain Research, 1079, 47–56.
Woolley, A. W., Chabris, C. F., Pentland, A., Hashmi, N., & Malone,
T. W. (2010). Evidence for a collective intelligence factor in the
performance of human groups. Science, 330(6004), 686–688.
doi:10.1126/science.1193147.
Yildirim, E. A., Kasar, M., Guduk, M., Ates, E., Kucukparlak, I., &
Ozalmete, E. O. (2011). Investigation of the reliability of the
‘‘Reading the Mind in the Eyes test’’ in a Turkish population.
Turk Psikiyatri Dergisi, 22, 177–186.
Zainudin, S., Ahmad, K., Ali, N. M., & Zainal, N. F. A. (2012).
Determining course outcomes achievement through examination
difficulty index measurement. Procedia: Social and Behavioral
Sciences, 59, 270–276.


© Copyright 2026