
Statistical Temporal Analysis of Freight
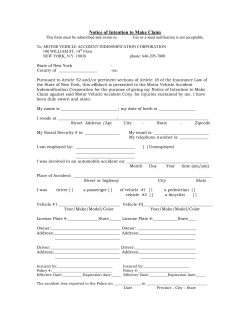
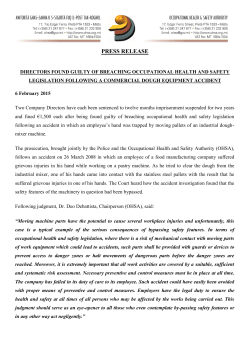
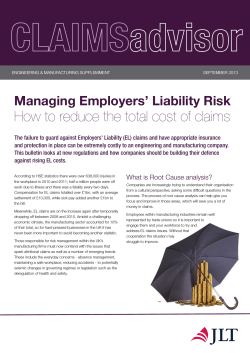
Liu 15-1615 1 Statistical Temporal Analysis of Freight-Train Derailment Rates in the United States: 2000 to 2012 Xiang Liu, Ph.D. Assistant Professor Department of Civil and Environmental Engineering Rutgers, The State University of New Jersey Phone: (848)-445-2868 Email: [email protected] Liu 15-1615 2 ABSTRACT Safety is the top priority for every rail system in the world. A widely used measure for rail safety is accident rate, which is defined as the number of train accidents normalized by traffic exposure. Of interest in rail safety research is to understand the temporal trend of accident rates, the significant factors affecting the trend, as well as how to predict future accident rates. For this purpose, this paper presents a statistical analysis of U.S. freight-train derailment rates by railroad, year and accident cause from 2000 to 2012, using a negative binomial regression model. The accident and traffic data used in the analysis came from the Federal Railroad Administration of the U.S. Department of Transportation. The analysis leads to several observations, including: There is a significant temporal decline in freight-train derailment rate (-5.8% per year), and the rate of decline is identical among the four largest freight railroads in the U.S. The rate of change in accident rate varies by accident cause. Freight-train derailment rates due to broken rails or welds and track geometry defects declined by 7% annually, respectively; bearing-failure-caused derailment rate decreased by 11% annually; and derailment rate caused by train handling errors fell by 9% annually. Using the regression model, future train derailment rates by accident causes are projected and can be used to evaluate the safety benefit of potential accident prevention strategies. This research aims to provide policy makers and practitioners with a statistical method to analyze the temporal trend of train accident rate for local, regional and national development of rail safety policy and practice. Keywords: Rail Safety, Train Accident Rate, Temporal Trend, Statistical Modeling, Regression Liu 15-1615 1 3 INTRODUCTION Rail offers a safe and efficient way to transport freight and passengers. While rail transportation provides substantial societal benefits, train accident risks must be mitigated to the maximum extent feasible. Safety is critical for every rail system in the world. One commonly used metric of assessing rail safety is accident rate, which is defined as the number of train accidents normalized by traffic exposure, such as train-miles, car-miles, gross ton-miles or passenger-miles (1-7). In the United States, FRA-reportable accident (an accident whose damage cost to infrastructure, rolling stock and signals exceeds a specified monetary threshold) and traffic exposure data are reported by railroads to the Federal Railroad Administration (FRA) of U.S. Department of Transportation (USDOT). Using these data, the FRA publishes annual train accident rates, which have been extensively used in development of rail safety policy and practice. The FRA-published accident rates were based on an empirical approach using reported (observed) accident count data divided by the corresponding traffic exposure (e.g., million trainmiles). This empirical approach provides a high-level, preliminary assessment of rail operational safety performance, however, it does not tell whether the change in accident rate is statistically significant. Generally, the empirical accident rate analysis is subject to a type of statistical error called Regression to the Mean (RTM) (8). The RTM refers to the tendency that a random variable that deviates from the mean will return to "normal" given nothing has changed. In the context of rail safety, it implies that a high accident rate in one year may be followed by a lower rate in the next year due to the random variation, even if there is no actual safety change. For example, U.S. Class I railroad mainline freight-train derailment rate was 0.843 per million trainmiles in 2006, followed by 0.754 per million train-miles in 2007. In this example, the empirical train derailment rate declined by 10 percent ((0.843 – 0.754)/0.843). However, is this accident rate reduction statistically significant to indicate safety improvement? More generally, how should the statistical trend of train accident rates be modeled to understand the associated safety implications? This paper is developed to address both questions. 2 METHODOLOGY 2.1 Definition of Transportation Safety Transportation safety research communities widely accept the following notion of safety (8): “Safety is the number of accidents by kind and severity, expected to occur on the entity during a specified period.” One highlight of this notion is “the number of accidents that are expected to occur.” The difference between the observed and expected number of accidents represents the stochastic nature of accident occurrence and severity. The following sub-section will illustrate the theoretical framework for modeling rail transportation safety, measured by the expected number of accidents. If the safety is measured by other metrics, the methodology can be adapted accordingly. Liu 15-1615 2.2 4 Statistical Theory for Modeling Train Accident Occurrence It is assumed that each time a train enters a track segment there is a probability (p) that this train will be involved in an accident. Train accident probability is affected by infrastructure conditions, train characteristics, operational factors, environmental factors and many other variables (1-3, 9, 10). Holding these conditions constant, it can be assumed that accident probability is constant (assuming homogeneous track characteristics, rolling stock, and operational conditions within the study period). Under these assumptions, each train pass can be viewed as a Bernoulli experiment (Bernoulli probability is denoted as p). The probability theory tells that the sum of independent, identically distributed Bernoulli variables constructs a binomial distribution (11) (Equation 1): N P( X n) p n (1 p) N n n (1) Where: n = number of train accidents N = total number of train passes on a given segment during the study period p = probability that a train is involved in an accident each time it enters a segment Let p , given a large number of train passes (N is large) and relatively low accident N probability, equation (1) can be re-written as: N lim P( X n) lim N N n N n 1 N N n n exp( ) n! Poisson( ) (2) Equation (2) indicates that the number of train accidents within traffic exposure can be approximated by a Poisson distribution. This assumption was widely adopted in previous studies (4-6, 12, 13, 14, 15), without an explicit explanation to the rationale. In the Poisson distribution, the Poisson mean (λ) represents the expected train derailment count. This parameter needs to be estimated based on sample data. Let λ* represent an estimator of λ. λ* can be estimated as a function with a combination of predictor variables. The exponential function is commonly used to ensure that the estimated accident count is strictly non-negative (4-6) (Equation 3): Liu 15-1615 5 k i* exp bp X ip M i p 0 Where: λi* bp Xip Mi (3) = estimated (expected) derailment count on the ith segment = parameter coefficient for the pth predictor variable = the pth predictor variable on the ith segment = traffic exposure (e.g., gross ton-miles) on the ith segment 2.3 Negative Binomial Regression A number of studies have been performed to determine the “best” functions and estimators to quantify the statistical association between the response variable (accident count) and affecting factors (traffic exposure, infrastructure, rolling stock and operational factors). Negative binomial regression (also called Poisson-gamma regression) is prevalent in the literature (e.g., 4-6, 16-19). This model allows for a large variance in accident count data and has been shown to be adequate in many accident rate analyses (e.g., 4-6, 8). In statistics, a negative binomial distribution can be interpreted as the probability distribution of the number of “successes” in a sequence of independent and identically distributed Bernoulli trials before a specified number of “failures” occurs (11). In the context of rail safety, this may be interpreted as the distribution of the number of accidents within traffic exposure. Hilbe (2007) provides technical details of the negative binomial regression model, and compared it with other types of regression models (20). This paper starts with this commonly used regression technique. If the negative binomial regression model does not provide a good fit to the empirical U.S. freight-train data, other regression models will be used. 3 SCOPE OF THE ANALYSIS AND DATA SOURCES 3.1 Research Scope This research aims to address the following questions: 1) Did U.S. freight-train derailment rate change from 2000 to 2012? 2) How did this change vary by railroad and accident cause? 3) What are the predicted future accident rates? 4) What are the safety implications of the results? All the analyses in this paper were focused on freight-train derailments on U.S. Class I railroad main tracks. Each Class I railroad has the operating revenue exceeding $378.8 million (2009 dollars). Class I railroads accounted for approximately 68% of U.S. railroad route miles, 97% of total ton-miles transported and 94% of the total freight rail revenue (21). Derailments are the most common type of FRA-reportable mainline train accidents in the U.S. (22, 23). 3.2 Accident Data The FRA requires all the railroads operating in the U.S. to submit detailed accident reports for the accidents or incidents that exceeded a specified monetary threshold of damage cost to infrastructure and rolling stock. The reporting threshold is periodically adjusted for inflation and increased to $10,500 in 2014 (24). FRA compiles these accident reports into the rail equipment Liu 15-1615 6 accident (REA) database, which contains information regarding accident location, speed, consist type, damage cost and other useful information. The FRA REA database has been widely used in previous rail safety studies (1, 3, 9, 10, 13, 14, 22, 23, 25-28). 3.3 Traffic Data Train-mile data are commonly used to analyze train derailment rate (1, 3-6, 29). Railroads report to the FRA their monthly train-mile data, which are available through the FRA Operational Data database. 4 RESULTS 4.1 Variables There are two principal predictor variables (affecting factors) used in the statistical analysis. The first variable is “year”, representing the temporal change in accident rate. The second predictor variable is “railroad” (A, B, C and D) that anonymously represents the four largest freight railroads in the United States. The two predictor variables construct three terms in the model, representing the marginal effect of each variable and their combined effect. The model has the following basic structure: i exp( R RTi )M i where: µRi Ti Mi αR, R (4) = expected number of freight-train derailments in year i for a specific railroad = year (for example, Ti is 2000 for year 2000) = million train-miles in year i = parameter coefficients specific to each railroad (A, B, C, D) This type of exponential function was used in several rail safety studies in European nations (4-6, 29). However, this statistical technique has not been widely used to analyze U.S. train accident rates. Liu 15-1615 7 TABLE 1 Freight-Train Derailment and Traffic Data, Class I Mainlines, 2000 to 2012 Year 2000 2001 2002 2003 2004 2005 2006 2007 2008 2009 2010 2011 2012 Number of Train Derailments Railroad A B C 144 79 52 152 84 48 116 75 43 107 104 57 128 110 66 133 86 58 145 87 59 127 76 42 121 64 44 82 53 30 84 52 47 93 38 34 64 29 30 Year 2000 2001 2002 2003 2004 2005 2006 2007 2008 2009 2010 2011 2012 Railroad A 145.6 149.2 149.1 160.4 172.8 178.9 185.1 174.8 170.9 143.8 155.7 161.7 175.9 Million Train-Miles B C 96.4 81.1 92.0 76.2 95.2 78.9 94.8 80.1 98.2 83.9 96.5 87.7 97.1 91.0 93.3 87.9 90.0 85.8 74.7 75.5 79.6 77.9 83.7 76.7 83.9 80.4 D 164 172 181 179 158 171 141 114 111 80 57 79 81 D 163.3 159.2 163.0 164.5 165.3 170.3 184.3 164.6 155.1 127.5 138.3 142.2 142.0 4.2 Parameter Estimator The parameter coefficients (1, 2) were estimated using a commercial software called Statistical Analysis System (SAS). The software generates each parameter estimator and its standard error using the maximum likelihood method in a negative binomial model (Table 2). The last column in Table 2 is the P-value of a parameter estimator, which represents the statistical significance of a predictor variable using the Wald Test (20). A generally acceptable rule is that if a predictor variable has its P-value smaller than 5%, this variable is significant. Some important observations were made from the statistical analysis: Liu 15-1615 8 1) There is no statistical difference among the four Class I railroads in terms of expected annual derailment rate because the differences in railroad-specific parameter coefficients (e.g., αB - αA, and - ) are statistically zero 2) The variable “year” (its parameter coefficient is ) is significantly negative (P < 0.0001), indicating that there is a significant temporal decline in train derailment rate for all the four Class I railroads TABLE 2 Significance Test of Predictor Variables Standard Error 22.35 Wald Chi-Square αA (Railroad A) Estimate 142.42 40.62 P-value <.0001 (Railroad -0.07 0.01 40.73 <.0001 αB - αA -26.27 31.73 0.69 0.41 αC - αA -28.22 34.62 0.66 0.42 αD - αA -64.02 37.03 2.99 0.08 - 0.01 0.02 0.68 0.41 C - 0.01 0.02 0.66 0.42 D - 0.03 0.02 2.96 0.09 After removing insignificant terms, the regression model is re-fitted and the “final” model is (Table 3): TABLE 3 Regression Analysis Results of the Final Model Parameter α Estimate 119.2537 -0.0596 Standard Wald ChiError Square 15.61 58.39 0.01 58.71 Pr > ChiSq <.0001 <.0001 Deviance = 2.16; df = 50, P > 0.5 4.3 Model Evaluation The goodness-of-fit of a negative binomial model can be evaluated using a statistical criterion called “deviance” (20). Statistical theory tells that the deviance asymptotically follows a Chi Square distribution (20). Based on this property, the P-value in the deviance test can be calculated. In general, if the P-value in the deviance test is larger than 5%, the model appears to be an adequate fit to the empirical data (4-6, 16). Through model diagnostics, the expected Liu 15-1615 9 number of Class I mainline freight-train derailments is estimated as: i exp(119.2537 0.0596Ti )M i (5) Equation (5) is mathematically equivalent to i Mt exp(119.2537 0.0596Ti ) (6) Define Zi i Mt (7) Where: Zi = expected freight-train derailment rate per million train-miles in year i From Equations (6) and (7), the expected train derailment rate at a specific year is estimated as follows: Zi exp(119.2537 0.0596Ti ) (8) Based on Equation (8), the annual reduction of derailment rate is: i Zi Zi 1 exp(119.2537 0.0596Ti ) exp(119.2537 0.0596(Ti 1)) exp(0.0596) 1 5.8% Zi 1 exp(119.2537 0.0596(Ti 1)) (9) Where: i= annual rate of change in train derailment rate in year i compared to the previous year Equation (9) indicates that freight-train derailment rate declined by an average of 5.8 percent annually from 2000 to 2012. If this trend continues in the future, train derailment rates can be projected (Figure 1). Freight-Train Derailment Rate per Million Train-Miles Liu 15-1615 10 1.2 1.0 Projected Derailment Rate 0.8 0.6 0.4 0.2 0.0 2000 2002 2004 2006 2008 2010 2012 2014 2016 2018 Year FIGURE 1 Empirical (dot) versus estimated freight-train derailment rates (line), Class I mainlines, 2000 to 2012 (projected derailment rates from 2013 to 2017) The projected (expected) train derailment rate in 2013 is 0.486 per million train-miles using the regression model based on the 2000 to 2012 trend, compared with the observed (empirical) derailment rate of 0.453 based on the latest FRA train safety data (6.7% difference). This appears to indicate a reasonable accuracy of the regression model. Further analysis can be conducted to evaluate the uncertainty associated with statistical prediction, and quantify the confidence interval of the projected accident rate. The temporal change in the overall accident rate is conceivably a net result of changing accident rate by accident cause, which is discussed in the next sub-section. 4.4 Accident-Cause-Specific Train Derailment Rate The FRA specifies more than three hundred accident causes accounting for a variety of circumstances and conditions that may result in train accidents (30). These causes are hierarchically organized and classified into five categories – track, equipment, human factor, signal and miscellaneous (30). Within each of these major cause groups, the FRA organizes individual cause codes into subgroups of related causes such as roadbed, track geometry, etc. within the track group, and similar subgroups within the other major cause groups (30). In this paper, we used a variation on the FRA subgroups developed by Arthur D. Little Inc. (ADL) in which similar cause codes were combined into groups based on expert opinions (31). ADL’s groupings are similar to the FRA’s subgroups but are more fine-grained thereby allowing greater resolution for certain causes. The ADL cause groups were used to analyze accident-causespecific derailment frequency and severity in previous studies (e.g., 13, 23, 32, 33). Broken rails or welds (08T), track geometry defects (04T), bearing failures (10E) and train handling errors (09H) are leading derailments causes on Class I mainlines (22, 23), so they were used as an example in this paper to illustrate the methodology for analyzing accident-cause-specific Liu 15-1615 11 derailment rate (Table 4). The methodology can be adapted to other accident causes as well. TABLE 4 Selected Accident Cause Group (32) ADL Cause Group FRA Cause Code Description T202 Broken Rail - Base T203 Broken Rail - Weld (plant) T204 Broken Rail - Weld (field) T207 Broken Rail - Detail fracture from shelling or head check T208 Broken Rail - Engine burn fracture T210 Broken Rail - Head and web separation (outside joint bar limits) T212 Broken Rail - Horizontal split head T218 Broken Rail - Piped rail T219 Rail defect with joint bar repair T220 Broken Rail - Transverse/compound fissure T221 Broken Rail - Vertical split head T101 Cross level of track irregular (at joints) T102 Cross level of track irregular (not at joints) T103 Deviation from uniform top of rail profile T104 Disturbed ballast section T105 Insufficient ballast section T106 Superelevation improper, excessive, or insufficient T107 Superelevation runoff improper T108 Track alignment irregular (other than buckled/sunkink) T199 Other track geometry defects (Provide detailed description in narrative) 10E (Bearing Failures) E52C Journal (plain) failure from overheating E53C Journal (roller bearing) failure from overheating 09H (Train Handling , Excluding Brakes) H524 Excessive horsepower H599 Other causes relating to train handling or makeup (in narrative) 08T (Broken Rails or Welds) 04T (Track Geometry, Excluding Wide Gauge) For each accident cause group, a similar exponential function is developed using the negative binomial regression, as described previously: Liu 15-1615 12 Zci exp(c cTi ) (10) Where: Zci = accident-cause-specific freight-train derailment rate per million train-miles in year i c, βc = parameter coefficients (dependent on accident causes) Ti = year An individual negative binomial regression model was developed for each cause group. The deviance test (20) shows that each regression model is adequate (Table 5). TABLE 5 Parameter Estimates of Accident-Cause-Specific Freight-Train Derailment Rate, Class I Mainlines, 2000 to 2012 Parameter Broken Rails or Welds Estimate Standard Error α 142.8269 -0.0723 Deviance = 0.28; df = 11; P > 0.5 Parameter Track Geometry Defects Estimate Standard Error α 143.4730 -0.0730 Deviance = 0.85; df = 11; P > 0.5 Parameter Estimate α 218.6475 -0.1106 Deviance = 0.59; df = 11; P > 0.5 Parameter α 22.888 0.011 37.339 0.019 Bearing Failures Standard Error 32.134 0.016 Train Handling Errors Estimate Standard Error 193.7095 -0.0982 Deviance = 0.62; df = 11; P > 0.5 38.735 0.019 Wald ChiSquare 38.940 40.090 Pr > ChiSq Wald ChiSquare 14.760 15.360 Pr > ChiSq Wald ChiSquare 46.300 47.570 Pr > ChiSq Wald ChiSquare 25.010 25.840 Pr > ChiSq <.0001 <.0001 0.000 <.0001 <.0001 <.0001 <.0001 <.0001 Based on Table 5, the following models are used to estimate accident-cause-specific annual train derailment rate on Class I mainlines: Liu 15-1615 13 Zi ,rail exp(142.8269 0.0723Ti ) (11) Zi , geometry exp(143.4730 0.0730Ti ) (12) Zi ,bearing exp(218.6475 0.1106Ti ) (13) Zi ,handling exp(193.7095 0.0982Ti ) (14) Where: Zi, rail = expected broken-rail-caused train derailment rate per million train-miles Zi, geometry = expected track-geometry-defect-caused train derailment rate per million train-miles Zi, bearing = expected bearing-failure-caused train derailment rate per million train-miles Zi,handling= expected train-handling-error-caused train derailment rate per million train-miles The empirical and estimated train derailment rates for the four accident causes were compared (Figure 2). 0.20 0.20 Track Geometry Defects (Excluding Wide Gauge) Train Derailments per Million Train-Miles Broken Rails or Welds 0.15 0.15 0.10 0.10 0.05 0.05 0.00 2000 2002 2004 2006 2008 2010 0.00 2000 2012 2002 2004 2006 2008 2010 2012 0.20 0.20 Bearing Failures Train Handling Errors 0.15 0.15 0.10 0.10 0.05 0.05 0.00 2000 2002 2004 2006 2008 2010 2012 0.00 2000 2002 2004 2006 2008 2010 2012 Year FIGURE 2 Freight-train derailment rate by accident cause, Class I mainlines, 2000 to 2012 Liu 15-1615 14 Broken rails had a higher derailment rate than the other accident causes, highlighting the importance of broken rail prevention (14, 22, 23). The annual rate of change in accident-causespecific derailment rate is estimated as follows: Broken rails or welds: -7% Track geometry defects (excluding wide gauge): -7% Bearing failures: -11% Train handling errors (excluding braking errors): -9% The analysis shows that bearing failures and train handling errors had a higher percent reduction in annual derailment rate, compared to track geometry defects and broken rails within the same study period. The temporal trends of accident-cause-specific derailment rates were compared (Figure 3). Given these trends, broken rails may continue to be leading derailment causes in the projected future. Bearing failures had a higher derailment rate than train handling errors until 2008, but the difference became minor recently, in part due to the faster declining rate of bearing-failure-caused derailments (11% reduction per year). 0.18 Train Derailment Rate per Million Train-Miles 0.16 0.14 0.12 Broken Rails or Welds 0.10 0.08 Projected Rates Bearing Failures 0.06 Track Geometry Defects 0.04 Train Handling Errors 0.02 0.00 1998 2000 2002 2004 2006 2008 2010 2012 2014 2016 Year FIGURE 3 Temporal trend of train derailment rate by accident cause (projected derailment rates from 2013 to 2017) 2018 Liu 15-1615 15 5 DISCUSSION In this section, implications of this research are discussed with respect to rail transportation safety and risk analysis. 5.1 Temporal Change in Rail Safety This research finds that the overall freight-train derailment rate on U.S. Class I railroad mainlines declined by 5.8% annually from 2000 to 2012. This change may in part be due to continued investment in infrastructure and rolling stock, safety culture, operations, training and education, research and other safety initiatives. Additionally, this analysis finds that annual derailment rates are statistically identical among the largest four freight railroads. However, the change of derailment rate could vary by accident cause. The top two train derailment causes (broken rails and track geometry defects) had similar declining rates (approximately 7% annual reduction), whereas bearing-failure-caused train derailment rate had a more significant decline (11% annual reduction). 5.2 Implications for Transportation Risk Analysis Many train safety and risk analyses were based on the average accident rate information within a multi-year study period. In view of declining accident rate, using the average accident rate may fail to represent up-to-date rail operational safety. An adjustment factor may be needed to estimate the most recent accident rate based on historical trends, when no better information is available. In the long run, any rail safety risk analysis should be periodically revisited and possibly revised to reflect changes in accident rate and other risk factors. 6 ONGOING RESEARCH 6.1 Casual Analysis of Train Derailment Rate The intent of this research is exploratory rather than explanatory. Put another way, this work is focused on identifying what the temporal trend is, instead of explaining why it is. The causal relationship between train accident rate and affecting factors calls for future research to better understand the causal factors of rail safety and how changing these factors may affect safety (25). 6.2 Train Derailment Severity Analysis This paper focuses on train derailment rate (likelihood). In addition, train derailment severity (e.g., number of cars derailed, property damage, casualties) is also critical in railroad safety and risk analysis (22, 23). Train derailment severity may vary by accident cause, accident speed, train length and other factors (10). The next step of this work is to incorporate train derailment severity into a larger rail safety management framework. 6.3 Crude Oil Transportation Risk Analysis This paper includes all types of train accidents. Of recent interest is crude oil train accident rate. The negative binomial regression model described in this paper can be used to model the temporal variation in crude oil train accident rate, and thus evaluate the safety trend before and after the implementation of certain safety improvement strategies. Liu 15-1615 16 7 CONCLUSION A statistical methodology is developed to model the temporal trend of freight-train derailment rates on U.S. Class I mainlines from 2000 to 2012. Within the study period, the analysis shows that the national freight-train derailment rate decreased by 5.8% per year, and there is no significant difference among the four largest U.S. Class I freight railroads in annual derailment rates. Broken rails or welds were the leading derailment cause, and its derailment rate declined by 7% per year. Track geometry defects, bearing failures and train handling errors all had declining train derailment rates, among which the derailment rate reduction due to bearing failures was more substantial, at a 10.5% reduction per year. In 2017, the projected overall train derailment rate is below 0.4 per million train-miles (a 64% reduction compared to year 2000) if the current safety trend continues. The time-varying accident rate should be better understood and taken into account in train safety and risk analyses and decision making. ACKNOWLEDGEMENT I am very grateful to four anonymous reviewers for their constructive comments that have significantly improved the quality of this paper. I also thank Mr. Bryan Schlake, lecturer of Rail Transportation Engineering at Pennsylvania State University at Altoona, for his careful editorial review. However, I am solely responsible for all the analyses and results presented herein. REFERENCES 1. Nayak, P.R., D.B. Rosenfield, and J.H. Hagopian. Event Probabilities and Impact Zones for Hazardous Materials Accidents on Railroads. Report DOT/FRA/ORD-83/20. FRA, U.S. Department of Transportation, Washington D.C., 1983. 2. Treichel, T.T. and C.P.L. Barkan. Working Paper on Mainline Freight Train Accident Rates. Research and Test Department, Association of American Railroads, Washington D.C., 1993. 3. Anderson, R.T. and C.P.L. Barkan. Railroad Accident Rates for Use in Transportation Risk Analysis. Transportation Research Record, No. 1863, 2004, pp. 88-98. 4. Evans, A.W. Rail Safety and Rail Privatization in Great Britain. Accident Analysis and Prevention, Vol. 39, No. 3, 2007, pp. 510-523. 5. Evans, A.W. Rail Safety and Rail Privatization in Japan. Accident Analysis and Prevention, Vol. 42, No. 4, 2010, pp. 1296-1310. 6. Evans, A.W. Fatal Train Accidents on Europe’s Railways: 1980-2009. Accident Analysis and Prevention, Vol. 43, No. 1, 2011, pp. 391-401. 7. Silla, A. and V.P. Kallberg. The Development of Railway Safety in Finland. Accident Analysis and Prevention, Vol. 45, 2012, pp. 737-744. 8. Hauer, E. Observational Before-After Studies in Road Safety. Pergamon Press, Elsevier Science Ltd., Oxford, England, 1997. 9. Bagheri, M., F.F. Saccomanno, S. Chenouri, and L.P. Fu. Reducing the Threat of InTransit Derailments Involving Dangerous Goods through Effective Placement Along the Train Consist. Accident Analysis and Prevention, Vol. 43, 2011, pp. 613-620. 10. Liu, X., M.R. Saat, and C.P.L. Barkan. Analysis of U.S. Freight-Train Derailment Severity Using Zero-Truncated Negative Binomial Regression and Quantile Regression. Accident Analysis and Prevention, Vol. 59, 2013, pp. 87-93. Liu 15-1615 17 11. Ross, S. Introduction to Probability Models. Academic Press, Waltham, Massachusetts, 2007. 12. Glickman T.S., and D.B. Rosenfield. Risks of Catastrophic Derailments Involving the Release of Hazardous Materials. Management Science, Vol. 30, No. 4, 1984, pp. 503511. 13. Liu, X., C.P.L. Barkan, and M.R. Saat. Analysis of Derailments by Accident Cause: Evaluating Railroad Track Upgrades to Reduce Transportation Risk. Transportation Research Record, No. 2261, 2011, pp. 178-185. 14. Liu, X., A. Lovett, C.T. Dick, M.R. Saat, and C.P.L. Barkan. Optimization of Rail Defect Inspection Frequency for the Improvement of Railway Transportation Safety and Efficiency. In Press, Journal of Transportation Engineering, 2014. 15. Kawprasert, A. and C.P.L. Barkan. Effects of Route Rationalization on Hazardous Materials Transportation Risk. Transportation Research Record: Journal of the Transportation Research Board, No. 2043, 2008, pp. 65-72. 16. Miaou, S.P. The Relationship between Truck Accidents and Geometric Design of Road Sections: Poisson versus Negative Binomial Regressions. Accident Analysis and Prevention, Vol. 26, No. 4, 1994, pp. 471-482. 17. Lord, D., S.P. Washington, and J.N. Ivan. Poisson, Poisson-gamma and Zero Inflated Regression Models of Motor Vehicle Crashes: Balancing Statistical Fit and Theory. Accident Analysis and Prevention, Vol. 37, No. 1, 2005, pp. 35-46. 18. Lord, D. Modeling Motor Vehicle Crashes Using Poisson-gamma Models: Examining the Effects of Low Sample Mean Values and Small Sample Size on the Estimation of the Fixed Dispersion Parameter. Accident Analysis and Prevention, Vol. 38, No. 4, 2006, pp. 751-766. 19. Oh, J., S.P. Washington, and D. Nam. Accident Prediction Model for Railway-Highway Interfaces. Accident Analysis and Prevention, Vol. 38, No. 4, 2006, pp. 346-356. 20. Hilbe, J.M. Negative Binomial Regression. Cambridge University Press, Cambridge, England, 2007. 21. Class I Railroad Statistics. http://www.aar.org/~/media/aar/Industry%20Info/AAR%20Stats%202010%201123.ash. Association of American Railroads, Washington D.C., 2011. 22. Barkan, C.P.L., C.T. Dick, and R.T. Anderson. Analysis of Railroad Derailment Factors Affecting Hazardous Materials Transportation Risk. Transportation Research Record, No. 1825, 2003, pp. 64-74. 23. Liu, X., M.R. Saat, and C.P.L. Barkan. Analysis of Causes of Major Train Derailment and their Effect on Accident Rates. Transportation Research Record, No. 2289, 2012, pp. 154-163. 24. Railroad Equipment Accident/Incident Reporting Threshold 1957-2013. Federal Railroad Administration, U.S. Department of Transportation, Washington D.C., 2014. 25. Dennis, S.M. Changes in Railroad Track Accident Rates. Transportation Quarterly, Vol. 56, No. 4, 2002, pp. 161-174. 26. Liu, X., M.R. Saat, and C.P.L. Barkan. Safety Effectiveness of Integrated Risk Reduction Strategies for Rail Transport of Hazardous Materials. Transportation Research Record, No. 2374, 2013, pp. 102-110. Liu 15-1615 18 27. Liu, X., M.R. Saat, C.P.L. Barkan. Integrated Risk Reduction Framework to Improve Railway Hazardous Materials Transportation Safety. Journal of Hazardous Materials, Vol. 260, 2013, pp. 131-140. 28. Liu, X., M.R. Saat, and C.P.L. Barkan. Probability Analysis of Multiple-Tank-Car Release Incidents in Railway Hazardous Materials Transportation. Journal of Hazardous Materials, 2014, Vol. 276, pp. 442-451. 29. Evans, A.W. Estimating transport fatality risk from past accident data. Accident Analysis and Prevention, Vol. 35, 2003, pp. 459-472. 30. FRA Guide for Preparing Accident/Incident Reports. Federal Railroad Administration, U.S. Department of Transportation, Washington D.C., 2011. 31. Arthur D. Little, Inc. (ADL). Risk Assessment for the Transportation of Hazardous Materials by Rail, Supplementary Report: Railroad Accident Rate and Risk Reduction Option Effectiveness Analysis and Data (Second Revision). ADL, Cambridge, 1996. 32. Anderson, R.T. Quantitative Analysis of Factors Affecting Railroad Accident Probability and Severity. M.S. Thesis, University of Illinois at Urbana-Champaign, Urbana, IL, 2005. 33. Schafer, D.H., and C.P.L. Barkan. Relationship between Train Length and Accident Causes and Rates. Transportation Research Record: Journal of the Transportation Research Board, No. 2043, 2008, pp. 73-82.


© Copyright 2026