
Hampshire Ageing Profile - Hampshire County Council
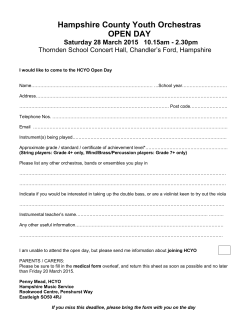
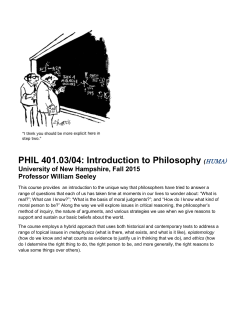
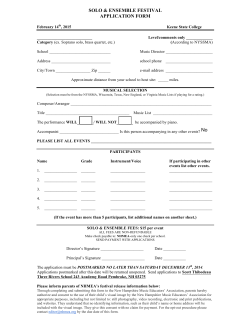
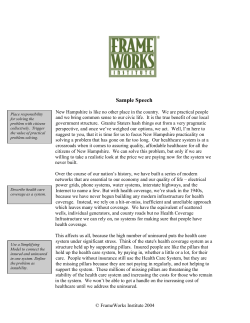
Hampshire Ageing Profile Published by Research and Intelligence, Spring 2015 1 www.hants.gov.uk Contents Introduction Trends in Hampshire’s older population o Historical trends in Hampshire’s older population o The population aged 65 years and over o The population aged 85 years and over o Centenarians – the population aged 100 years and over o Gender Differences at Older Ages o Measures of an Ageing population Old Age Support Ratio Ageing Index Median Age Characteristics of Hampshire’s Older Population o Living arrangements o Household Tenure o Qualifications and Economic status Qualifications Economic Activity o Health and care General Health Limiting Long Term Illness and disability Provision of Unpaid Care within Private Households o Diversity Ethnicity / Country of birth Religion Conclusion 2 3 4 4 8 11 14 17 20 20 22 24 26 26 29 33 33 36 38 38 41 43 45 45 45 47 Introduction Across the world populations are getting older with larger proportions of populations occupying the older age groups. In fact many countries are moving towards an era in which their elderly populations are outnumbering their child population. Across the European Union for example, Eurostat data shows that in 2011 Germany and Italy had some of the highest proportions of their total population aged 65 and over at 20.6% and 20.3% respectively1. England and Wales is a little way behind these levels, but still 9.2 million people or 16% of the England and Wales population are aged 65 and over according to the 2011 Census results. And across Hampshire 17.1% of the population are aged 65 and over, equating to more then 300,000 people. But what does ageing mean? Does a person aged 65 and over today have similar characteristics to those of someone aged 65 and over in 2001 or even earlier for example? Are there more female older people than males? Are many older people widows and living alone? Do a significant number rely on care from others whilst suffering from long term illnesses and disabilities? This report aims to investigate these questions using the results from the 2011 Census and comparing where possible to figures from the 2001 and earlier censuses where appropriate, in order to understand what it means to be an ‘older’ person in today’s Hampshire. Analyses of a wide range of Census datasets will be used to help tease out the main characteristics of the elderly population including their living arrangements, housing tenure, health and care status. Please note that throughout this report Hampshire should be understood as referring to the combined administrative areas of Hampshire County Council, Portsmouth City Council and Southampton City Council. For more information on this report or Hampshire Population Data more widely please contact the Demography Team: http://www3.hants.gov.uk/facts-figures-contacts 1 http://epp.eurostat.ec.europa.eu 3 Trends in Hampshire’s older population Ageing is the process of growing old and population ageing can be seen as the shift in the distribution of a country's population towards older ages. This is usually reflected in an increase in the population's mean and median ages, a decline in the proportion of the population composed of children, coupled with a rise in the proportion of the population that is elderly. To begin our quest to understand what it means to be old in today’s Hampshire we have to start by establishing how we define old, whether to determine who is old by this definition and how numbers have changed over time, but also how they relate to the population of Hampshire as a whole, before moving on to look at the characteristics of this population group. The World Health Organisation (WHO) states that ‘most developed world countries have accepted the chronological age of 65 years as a definition of 'elderly' or older person’2. As such, this is the definition used in this report. Beyond this we’ve broken this broad group up into two more specific age related groups to gain a better picture of trends: namely 85 years of age and over; and 100 years and older. Where practicable this report will describe each of these three groupings. Historical trends in Hampshire’s older population Ever since the first modern censuses of the population across England and Wales were taken way back in middle of the eighteenth century, we can see evidence of Hampshire’s population getting older. Using the Vision of Britain website we can track Hampshire’s population back to 18513. Figure 1 charts Hampshire’s population aged 65 and over since this time to the most recent Census in 2011. Over this period the older population has increased rapidly both numerically and as a proportion of the Hampshire’s total population. In 1851, a time characterised by high death rates and low life expectancy, coupled with high birth rates, the 65 and over population was relatively small at 18,260 people which equated to just 5.2% of the total population across Hampshire at the time. By 1931 – the halfway point on this timescale – the numbers of people aged 65 and over had increased 3.8 times, to 70,300, and now accounted for 8.0% of Hampshire’s total population. 2 http://www.who.int/healthinfo/survey/ageingdefnolder/en/ The boundaries of Hampshire County have changed over time so in order to maintain comparability the figures used in this report come from redistricted census data. For more information regarding the redistricting of the data please the Vision of Britain website http://www.visionofbritain.org/ 3 4 Figure 1 Hampshire - Historic Trends in the Population aged 65 years and over 5.2% 2011 1931 1851 8.0% aged 65 & over aged 65 & over 17.1% 301,600 70,300 18,300 aged 65 & over 350,000 300,000 Numbers aged 65 and over 250,000 Population 65 and over Fastest growth 18,260 200,000 in 2011 1981 to 1991 150,000 16 and a half times bigger than in 1851 19.4% 100,000 50,000 5 0 1851 1861 1871 1881 1891 1901 1911 1921 1931 1941 1951 1961 1971 1981 1991 2001 2011 Figure 2 4444 1851 Hampshire - Historic Trends in the Population aged 85 years and over 1851 1931 0.2% 0.3% 2011 2.5% (43,300) Aged 85 and over (2,790) 720 Aged 85 and over 1861 1871 1881 1891 1901 1911 1921 1931 times bigger than in 1851 1941 1951 1961 1971 1981 1991 Fastest growth Population 85 and over in 2011 60 Aged 85 and over 1981 to 1991 6 61.9% 2001 2011 Jump forward to today and a time of high life expectancy and much lower fertility and mortality and 17.1% of Hampshire’s population are aged 65 and over (equating to 301,600 people). This is an increase of over 4 times the number seen in 1931 and more than 16 times greater than the number of Hampshire’s residents aged 65 and over living in 1851. Figure 2 highlights the changes in the 85 years of age and over population group since 1851. Its clear that at all points in time the number of Hampshire residents aged 85 and over is considerably smaller than those aged 65 and over. Indeed in 1851 just 720 people were aged 85 or older and accounted for just 0.2% of the total population. By 1931 the pace of growth had largely been in line with that of the entire 65 and over population, in that it had grown 3.8 times from the 1851 level to 2,790 people across Hampshire. However those aged 85 and over still accounted for just 0.6% of the total population. By 2011, the population aged 85 and over had grown more rapidly than the 65 and over population as a whole, increasing to 43,300, approximately 15.5 times bigger than in 1931. This rapid rate of growth, highlights how a range of social, economic, environmental and medical improvements since 1851 have enabled an explosion of the population in the very oldest age groups).Those aged 85 and over now account for 2.5% of Hampshire’s total population. Indeed it is almost 2.5 times larger than the total 65 and over population of 1851. 7 Population aged 65 years and over So, historically and across Hampshire as a whole at least, more people are living to the older age groups. But is this true everywhere or are there district wide differences in the numbers and proportions surviving to these older ages?. Using data from the last 4 censues we can look at this in more detail to investigate how different district populations have aged, firstly at all those aged 65 and over. Across the 30 year period between 1981 and 2011, the population of Hampshire aged 65 and over has grown at a rapid pace, from 201,850 to 301,560 people, which represents an increase of almost 50% or an additional 99,710 older people.The most recent decade alone saw a 15.3% rise in its numbers (see Figure 3). Its no surprise therefore that within Hampshire county each district has also seen a decade on decade increase in both the number and proportion of the total population aged 65 and over since 1981. The New Forest has the highest number of individuals aged 65 and over in 2011 with 44,140, compared to Rushmoor, the lowest, at a quarter of this at 11,440. These two authorities also had the largest and smallest proportions of their populations aged 65 and over, with a quarter of the New Forest’s popuation aged 65 and over, compared to just 12.2% of Rushmoors population falling into this age group. The district of Hart experienced the largest growth across the period 1981 to 2011, its older population more than doubling over the period (reaching 15,000 by 2011). A very different story emerges however, when looking at the 65 and over population of the two cities. Though both saw a rise between 1981 and 1991 in their elderly populations, since then however, both numbers of those aged 65 and over as well as the proportion of the total population in this age group, has fallen in both Portsmouth and Southampton. In Portsmouth the decline was over 13%. Figure 4 maps the percentage of the population aged 65 and over across Hampshire for 2001 and 2011 at Lower Super Output Area level (LSOA) and as such shows the most recent changes seen across Hampshire in the older population. 8 Figure 3 17.1% Population aged 65 and over 15.9% 15.5% By 49.4% 14.0% 301,560 261,440 238,610 201,850 since 1981 17.1% 17.1% 65 and over 65 and over in in2011 2011 1981 1991 18.2% 9 2001 9.6% 2011 15.3% Figure 4 Percentage of the population aged 65 years and over 2001 2011 10 Population aged 85 years and over As a greater and greater number of people survive to the older ages it becomes more important to break this group down further in order to tease out trends and patterns. This next section follows on from the historical analysis and looks in more detail at the trends in the population aged 85 and over. Once again it’s clear that across Hampshire as a whole, there are more very elderly people today than there have been in the past. Indeed between 1981 and 2011 the population of Hampshire aged 85 and over increased by approximately 2.8 times (180.7%) from 15,410 to 43,250. This represents an extra 27,840 very elderly individuals across Hampshire. The most recent decade alone saw a 30.3% rise in its numbers (see Figure 5). Once again all 11 of Hampshire’s districts have seen growth in the their very elderly populations aged 85 and over. In addition the two cities have also experienced marked increases in this population sub-group. The New Forest had the most people aged 85 and over with 7,330 individuals in 2011, this compared to a low of 1,580 in Rushmoor. The New Forest also had the highest proportion of it’s population aged 85 and over with 4.2% occupying this age group whilst Basingstoke and Deane and Rushmoor were the lowest across Hampshire at only 1.7%. Across the entire period 1981 to 2011 Fareham experienced the highest percentage growth (321.9%), whilst in the most recent decade between 2001 and 2011 Hart showed the most growth at 42.6%. Figure 6 illustrates the changes experienced across Hampshire as described above mapping the percentage of the population aged 85 and over for Hampshire in 2001 and 2011. 11 Figure 5 Population aged 85 and over 2.5% By 2.0% 2.8 times 33,180 since 1981 2.5% 85 and over in 2011 43,250 1.5% 23,430 1.1% 15,410 England and Wales (2.2%) 1981 1991 52.0%12 2001 41.6% 2011 30.3% Figure 6 Percentage of the population aged 85 years and over 2001 2011 13 Centenarians – Hampshire’s population aged 100 years and over We can further break the older population of Hampshire down and look at centenarians (those aged 100 or more years of age). In Hampshire, as with the rest of the country, this group occupies a small but important part of the population. Published only for the previous 2 censuses, numbers have risen from 289 in 2001 by 99 people to 388 in 2011 (see Figure 7). This increase of 99 individuals across the decade equates to a growth rate of 34.3%, and currently the 100 plus population accounts for 0.02% of Hampshire’s total population, a similar level to the England and Wales average. Across the districts, the New Forest had the highest number of centenarians in 2011 with 68, whilst Hart had the lowest at just 13 people of this age. The largest growth over the decade was seen in Eastleigh in which the numbers of centenarians grew by 154.5% followed by the New Forest at 106.1%. Two of Hampshire’s districts saw their centenarian population decline, Gosport (down 13.6%) and Fareham (down 21.4%), though since numbers are low these are not significant declines. 14 Figure 7 Centenarians - Aged 100 years or more Hampshire 388 Centenarians 0.02% England and Wales 11,190 (0.02%) New Forest has 68 people aged 100 or more Increased by 99 people since 2001 Most growth in Eastleigh – 154.5% since 2001 15 The New Forest had 68 Centenarians in 2011, whilst Hart had only 13 people aged 100 or more. The largest growth over the decade (2001-2011) was seen in Eastleigh with the number of Centenarians growing by 154.5% Centenarian s Gosport (-13.6%) and Fareham (-21.4%) saw their Centenarian population decline Summary of Hampshire’s ageing population at the District level The 85 & Over population was largest in the New Forest with 7,330 individuals within this age category, whilst Rushmoor had just 1,580. Rushmoor along with Basingstoke and Deane had the smallest percentage of their population aged 85 or over, at just 1.7%. 85 & Over Across the period of 1981 – 2011 Fareham experienced the highest percentage growth at 321.9% Over the 30 year period of 1981 – 2011 the 65 and over population has grown from 201,850 to 301,560, representing almost a 50% increase. The New Forest saw the highest number of individuals aged 65 & over in 2011 at 44,140, this equalled a quarter of their district’s population. The two cities, Southampton & Portsmouth, saw decreases in this 65 & Over 16 age group (Portsmouth saw a decline of over 13%). Figure 8 Gender Differences at Older Ages The previous section highlighted the increase in the older population of Hampshire and with it the variation across districts. It showed how Hampshire’s population has aged with more and more people occupying the very oldest age groups. This next section looks at how these trends have varied by gender across Hampshire. Women, as a group, live longer than men. In all developed countries and most undeveloped ones, women outlive men, sometimes by a margin of as much as 10 years4. Across Hampshire latest figures suggest the gender differences in life expectancy varies from a high of 4.8 years difference between male and female survival in Portsmouth, to a low of 2.3 years in Gosport5. Whilst no definitive reason fully explains this, evidence suggests a mixture of behavioural as well as biological differences between the sexes, as well as social factors all play a part in explaining the survival gap6. Interestingly, more recent evidence suggests this gap between male and female survival may be narrowing7. Again the reasons aren’t fully understood, though some have suggested that as women take on more of the behaviours previously confined to men (including smoking and drinking) they have become more likely to suffer from those diseases more associated with men. Looking specifically at the data for Hampshire its clear that the gender difference amongst the older population is evident, though there is also some evidence of a decline over recent years. However in 2011 there were still more older women than men with 56% of the 65 years and over population across Hampshire being female (and 44% male). As age increases the gender divide grows with just a third of those aged 85 and over being males. Looking at comparative figures for 1981 we can see how much this gender gap has reduced across Hampshire. At this time 40% of those aged 65 years and over were males (its now 44%) and just a quarter of those aged 85 and over were males (compared to one third today). Looking at the district level, for the total population aged 65 and over at least, there is very little difference, with districts all exhibiting a 55:45 split in the proportions of the population being female and male respectively. However, some small differences do emerge when we look at the 85 and over population with the largest differential being amongst Rushmoor elderly where over 70% are females, compared to Basingstoke and Deane where 65% of those aged 85 and over are females. 4 https://www.cmu.edu/CSR/case_studies/women_live_longer.html Life Expectancy at Birth 2007-09, ONS Health Geography Team 6 https://www.cmu.edu/CSR/case_studies/women_live_longer.html 7 http://www.longevitypanel.co.uk/life-expectancy-by-gender.html 5 17 Figure 9 65 + 57.9% 42.1% 2001 85 + 71.5% 28.5% Survival Differences at older ages 2011 compared to 2001 As the population ages survival differences between genders increase, with more women surviving longer The gender gap has decreased over the decade from 2001-2011, with the 65 & over category seeing the gap close by 2.3% and 4.4% within the18 85 & overs 65 + 2011 85 + 55.6% 67.1% 44.4% 32.9% Figure 10 Gender differences within the Districts Within the Aged 85 and over Within the Aged 65 and over category all districts exhibited category there was an average roughly a 55:45 split in the proportions of the population being female and male. gender split of 67:33 (females: males) across the districts The 85 & over category saw small differences within some of the districts; the largest was in Rushmoor where over 70% were females, whilst Basingstoke and Deane saw the smallest percentage at 65% 19 Measurements of an Ageing Population The previous section showed how Hampshire’s older population has grown both numerically as well as a proportion of the total population, and how these changes have varied both by area, by more specific age groupings, and by gender. However, in order to fully assess the extent of Hampshire’s ageing population we need to expand this analysis to look at the population as a whole and how the increase in the older population relates to how other sections of Hampshire’s population have changed over time. 3 measures can be used to assess this. They are:– Old age support ratio; Ageing index; Medium age. This report will now look at each of these measures in turn to understand what has been occurring across Hampshire and how this impacts on Hampshire’s ageing population. Old Age Support Ratio (OASR) The Old Age Support Ratio (OASR) is the ratio of the working age population (16 to 64) to those of retirement age (65 and over). It should be noted that the measure is used here as an indicator of the changing age structure of the population and is not meant to imply that all those aged 65 and over are dependent or in need of support and neither that all those aged 16-64 are working or provide support. Indeed later sections of this report will highlight the numbers working into their late sixties and beyond as well as the large numbers of older people providing care to others. In 1981 the support ratio for Hampshire indicated that there were 22 people aged 65 and over for every 100 individuals of working age. This increased over the next two decades to reach 24 people in 1991 and almost 25 people by the year 2001. The largest increase however was seen in the most recent decade, where the ratio grew to 26.6 older people for every 100 people of working age. All 11 of Hampshire County Council’s districts experienced rising OASR levels over the period 1981 and 2011. The biggest increase in the OASR was evident in Havant in which the ratio grew from 19.5 in 1981 to 34.7 by the time of the 2011 Census. However, this picture is not universal and the two cities of Portsmouth and Southampton actually showed declines in their OASR over time. For example, Portsmouth’s older population fell from over 28 people per 100 people of working age in 1981 to just under 20 older people by 2011. In 2011 the highest OASR in Hampshire was in the New Forest at almost 43 in comparison to a low of 18 older people per 100 people of working age in Rushmoor. 20 Figure 11 Old Age Support Ratio (2011) The New Forest (42.7) Havant (34.7) and Fareham (32.8) had some of the highest 1981 - 22.1 support ratios in Hampshire compared to a 1991 - 24.0 low of just (18.0) in Rushmoor 2001 - 24.7 2011 - 26.6 21 Ageing Index The second measure to be considered in this section is the Ageing Index. The Ageing Index is the number of older people (aged 65 and over) per 100 children (those aged under 16). In Hampshire, the ageing index in 1981 stood at 61.4 indicating that for every 100 children there were 61.4 older people. By 2011, this had increased significantly to 92.6, an increase over the three decades of 31.2 older people per 100 children (a figure of 100 would indicate an equal number of older people and children). In 1981 the New Forest had an ageing index of 96.3, which was already above the current overall Hampshire level. By 2011 this had increased to 152.5 showing that for every 100 children in the New Forest there are 52.5 more older people. The lowest indices are seen in Portsmouth (72.5), Basingstoke and Deane (71.3), Rushmoor (60.4). These large changes in the ageing index seen both across Hampshire as a whole as well as within districts, are much larger than those seen in the previous section (the OASR) which looked at the ratio of older people to those of working age, suggesting that the ageing of the population of Hampshire has been coupled more so with a greater proportionate fall in the child population, than the working age population. 22 Figure 12 New Forest (152.5) Fareham (117.2) Havant (116.2) East Hampshire (103.3) Winchester (101.3) Ageing Index (2011) An Equal Number of Children and Elderly (100) All experience populations in which those aged 65 and over outweighed the numbers of children. 92.6 79.5 77.1 61.4 1981 1991 2001 2011 23 Median Age As with the measures above, the median age of a population can help to provide an overview of any changes in the age structure of the population of an area and in particular it’s ageing or otherwise. The median age is the middle value when all the ages are arranged in order from youngest to oldest. Ages used are the age at last birthday (in whole years). In 2011 Hampshire County Council area had a median age of 42 years, slightly higher than the South East Region (at 40 years of age) and higher still than the England and Wales average of 39. It had increased by 3 years from 39 years in 2001. The New Forest had the highest median age at 47 years in 2011, up 4 years from 2001, followed closely by East Hampshire, Fareham and Havant all at 44 years and each up 3 or 4 years on their 2001 median age values. At the opposite end of the spectrum, the cities of Portsmouth and Southampton had the lowest median ages of 34 and 32 years respectively, however, each had increased one year from their 2001 levels. At the smaller geographic levels there is even greater variation in median age, as shown by the map on Figure 13 overleaf. 24 Figure 13 Median Age (2011) The New Forest ward of Milford had the highest median age in Hampshire at 61 in stark comparison to the lowest wards of Central Southsea, Bargate, Bevois, Swaythling and St Luke at a mere 25 years. New Forest (44) East Hampshire 44 (40) Fareham 44 (40) Havant 44 (41) 25 Test Valley 43 (39) 42 Winchester 42 (40) Eastleigh 41 (38) Hart 41 (38) Gosport 40 (37) England and Wales 39 (37) Rushmoor 36 (34) Portsmouth 34 (35) 32 Basingstoke and Deane 39 (37) Southampton (33) Hampshire CC (39) 47 Figures in brackets indicate 2001 median age Characteristics of Hampshire’s Older Population As the above evidence clearly shows, Hampshire’s population has and continues to age, and although rates, as well as the overall level, varies across the county; all parts of Hampshire are showing an increasingly elderly population. But what does it mean to be an elderly person in Hampshire and does it vary not only across the county, but also over time? The rest of this report looks at the characteristics of the older population of Hampshire as collected in numerous censuses in order to see how the elderly population varies over space and changes over time across Hampshire. Living arrangements We can begin to look at the changing face of the older population across Hampshire by looking at the numbers living in private households versus those living in communal establishments. Although any change seen may reflect, at least in part, changes in policy regarding the care and support of our elderly population, it is still worth while investigating numbers both now and those in 2001 of our most vulnerable elderly living in care. In 2001 4.4% of Hampshire’s older population (aged 65 and over) lived in communal establishments (largely care homes). When looking at those aged 85 and over this percentage rose to 20%, or one fifth of all very elderly people across Hampshire living within communal establishments at this time. The lowest levels of communal establishment living were seen in Southampton (3.2% and 12.5% respectively) and highest levels in East Hampshire (amongst the 65 and over population at 5.6%) and Fareham (amongst the 85 and over population just over a quarter at 25.4%). By 2011 the overall number of people aged 65 and over living in communal establishments had fallen slightly (from 11,600 in 2001 to 11,300 in 2011) whilst the communal establishment population aged 85 and over had risen by 300 to 6,900 but as a proportion of all 85 and over people across Hampshire this had reduced to 16.1%. Low levels were again seen in Southampton (11.6% of the 65 and over population) and also Hart and Basingstoke and Deane (2.7% of their 85 and over populations). Highest levels were seen in Winchester (4.9% and 20.6% respectively). So whilst a significant proportion of Hampshire’s elderly population live in communal establishments, the vast majority live in private households. The rest of this report will focus on those living in private households unless otherwise stated. Focussing on those living in private households we can investigate how the older population live in terms of their family structure. Today the majority (61.1%) of those 26 aged 65 and over live in a couple household (married or cohabiting). This is slightly higher than the national average (58.6%) but varies across the county with a high of 67.5% living in a couple in Hart, to a low in Portsmouth of just half the 65 and over population. Across the area as a whole couple living has increased since 2001 (up from 57.0%) and a larger proportion of those living in a couple household are now living in a cohabiting couple 3.1% compared to just 1.6% in 2001. This increase in couple living amongst the current older population of Hampshire can be attributed largely to the improved mortality amongst older males resulting in a smaller proportion of widows (25.3% in 2011 compared to 31.4% in 2001) across the area. Contrasting this though has been the substantial increase in the number of divorcees amongst this group (up from 12,570 in 2001 to 21,640 in 2011). One person households are a key group amongst the older population, particularly as they can help to identify those who may be isolated and lonely (other key factors include those who are recently divorced or widowed). Amongst Hampshire’s older residents 31.2% live alone, indeed 43.9% of all one person households are aged 65 and over. Portsmouth has the largest proportion of elderly one person households at 39.0%, with Hart the lowest at 25.4%. Unfortunately it isn’t possible to compare directly with 2001 data as they looked at pensioner households (65 and over for males and 60 and over for females). So Hampshire’s elderly are more likely to be living with someone today than they were in previous decades, but not necessarily married to them. Correspondingly there has been a decline in the proportion living in widow households but more in divorced households. Both are likely to be at least partly as a result of lower mortality amongst men but also, with regards to divorce at least, a change in societal norms. A worrying finding perhaps is the still very large proportion of older people living alone and the implications this may have for isolation, health and care issues. 27 Figure 14 Living arrangements of Hampshire’s elderly population (65 and over) 38.9% Not living in a couple 112,810 Married/Civil Partner 58.0% (55.4) Widowed 25.3% (31.4%) Divorced 7.5% (5.0%) 61.1% Living in a couple 177,500 Single 4.0% (5.1%) Cohabiting 3.1% (1.6%) Separated 0.8% (0.6%) Single Hampshire had more people living as married/civil partners 4.0 % than England and Wales but had fewer people stating that they were Single. Cohabitation in Hampshire was higher than the national average. 28 (2001 figures in brackets) Tenure So we have investigated how older people live across Hampshire, we now turn to look at the tenure of their homes – whether they own them or rent and how this varies across the county and whether this has changed over time. In 2011 the vast majority of Hampshire’s older population own their own property (81.4%); either with a mortgage (9.7%) or outright (71.7%). The remaining 18.6% rent property. However, the proportions vary quite significantly across the county with a high of 90.8% in Fareham being owner occupiers to a low of 69.2% in Southampton. Rushmoor has the highest proportion of older people living in homes with a mortgage at 12.1%. In terms of those living in rented accommodation 73% live in socially rented properties (equating to 39,400 older people across the county). The remaining 27% of renters live in privately rented or rent free accommodation. The New Forest has the smallest proportion of social renters at 59% of all its renters compared with Southampton the highest at 80.4%. If we compare this with figures from the 2001 Census we see a slight swing towards owner occupation from renting, with renters accounting for just under a quarter of all older people in 2001 compared to 18.6% in 2011. Of renters, there is also a slight move towards proportionately fewer social renters (75.0% in 2001 compared to 73.0 in 2011). Whilst the overall trends are the same across the county, the actual figures do vary considerably across the districts. For example, Basingstoke and Deane has seen an 8 percentage point rise in owner occupiers since 2001 compared to just 2.4 percentage points increase in the New Forest. Looking at renters the greatest changes are seen again in Basingstoke and Deane which saw a 6.7 percentage point fall in private renters (falling from 23.1% of all 65 and over people living in Basingstoke and Deane in 2001 to 16.4% in 2011) and a 1.6 percentage point fall in social renters (down from 6.4% in 2001 to 4.8% in 2011). 29 Figure 15 Tenure of the population aged 65 and over 18.6% Rented Of the 236,400 elderly who own their homes: Of the 53,900 elderly who rent their homes: (24.1%) 81.4% Owned (75.9%) 2001 figures in brackets 88.1% own outright 73.1% socially rent 11.9% own with mortgage or 26.9% privately rent loan 30 Figure 16 A summary of Tenure within the Districts for People Aged 65 & Over 60% of those aged 65 and over own Basingstoke and Deane their property has seen the highest outright in percentage point rise in Southampton. owner occupiers with an This compares to 8% rise from 2001 80% of those living in Fareham. The New Forest saw the lowest percentage point rise in owner occupiers with just 2.4% more since 2001 31 When looking at renters the greatest change was seen within the private renters. Within Basingstoke and Deane figures fell from 23.1% in 2001 to 16.4% in 2011 of all older people But what does this mean for the life of our older people? Are they more affluent since they are more likely to own their own home? What about those renting or those with a mortgage, are they more deprived? To dig down into these questions the report now looks at the economic activity by tenure of our older population in order to see whether there are conclusions to be drawn. In order to look at this question we have had to concentrate on the household representative person (HRP). A HRP is defined as the oldest full-time worker in most households or a person chosen from the household based on their age and economic activity, (referred to as the ‘head of household’ in earlier censuses). In 2011 the vast majority of elderly HRP were classified as retired (84.2%) and just 13.9% were employed. However, in terms of how the make-up of their housing tenure was defined the divide was very evident. 18% of those in employment were owner occupiers but with mortgages, compared to just 6.6% of those classified as retired. Almost the reverse was true when looking at those living in social rented dwellings – here the proportions were 8.8% of those in employment and 16.9% of those categorised as retired. Clearly employment status amongst the elderly is linked to housing tenure but the direct nature of the link is unclear. For example, have those in employment chosen to remain in the workforce or is it that having a mortgage to pay off or rent to pay necessitated the need to remain in employment. 32 Qualifications and Economic status Turning to look more closely at the education and working lives of our older population the Census allows us to examine highest qualifications and economic status as well as the last job people undertook if they aren’t in employment. Qualifications Looking first at the qualifications of our older population it is clear that there is a range of qualification levels. For example, some 47.0% have no qualifications; while one fifth have a degree. These figures compare favourably with the country as a whole where 52.9% have no qualifications and 17.6% have been educated to degree level or higher. Figure 17: highest qualification for pop aged 65+8 8 The census splits qualifications into the following groups: No qualifications; Level 1: 1-4 O Levels/CSE/GCSEs (any grades), entry level, Foundation Diploma, NVQ Level 1, Foundation GNVQ; Level 2: 5+O Level (passes)/CSEs (Grade 1)/GCSEs (Grades A*-C), School Certificate, 1 A Level/2-3 AS Levels/VCEs, Intermediate/Higher Diploma Apprenticeship: Level 3: 2+ A Levels/VCEs, 4+ AS Levels, Higher School Certificate, Progression/Advance Diploma, NVQ Level 3; Advanced GNVQ, City and Guilds Advanced Craft, ONS, OND, BTEC National, RSA Advanced Diploma; Level 4 and above: Degree, Higher Degree, NVQ Level 4-5, HNC, HND, RSA Higher Diploma, BTEC Higher Level, Professional qualifications (e.g. Nursing, teaching accountancy); Other: Vocational/Work related qualifications, Foreign Qualifications (where level unknown). 33 Looking within Hampshire’s districts, over half of those aged 65 and over living in Gosport, Portsmouth, Rushmoor and Southampton have no qualifications, compared less than 40% in Winchester, Hart and East Hampshire. Looking at those with at least degree level qualifications, the highest proportions are seen in Winchester with a third of older people educated to this level. Over a quarter of older people in East Hampshire and Hart are also educated to this level. These figures compare to the low of just 13.1% of those living in Southampton. Such findings are unsurprising perhaps given the education system at the time our older population would have been at school. It was a time when education was largely seen as a privilege and not an entitlement. The 11 plus was the main way through which qualifications were possible and these were often gender biased towards males. 20% of the population having degree level qualifications is quite an interesting finding given the limited access to university education at the time. However, this group also includes teaching and nursing qualifications which would no doubt account for a substantial proportion of this group, as well as those gaining degrees in later life. Again it’s not possible to directly compare with earlier censuses, the 2001 Census looks only at those aged between pensionable aged and 74 years. Pensionable age at the time was 65 years and older for men and 60 years and older for women. This compares to the 2011 data which looks at all those aged 65 and over. However, even amongst this restricted group we can see some significant shifts by 2011. For example, those with no qualifications was much higher at 56.4% across the area as a whole, and just East Hampshire, Hart and Winchester had fewer than half of their 65-74 year olds without qualifications. Conversely, those with degree level or equivalent qualifications was much lower in 2001, with just 10% of those aged pension age to 74 having such qualifications compared to a fifth of all 65 and overs in 2011. 34 A summary of qualifications within Hampshire’s Older Population Over half of the 65 and over population living in Gosport, Portsmouth, Rushmoor, & Southampton have No Qualifications The lack of qualifications within the older population is perhaps unsurprising given the education system at the time. Level. population have a qualification at Degree Level. The highest proportion of Degree Level qualifications are Southampton saw a low of just 13.1% of the older population stating that they were educated to Degree However, 20% of the seen within Winchester with a 35 third of the older population. Figure 18 Economic Activity We’ve already seen that in 2011 a significant proportion of our older population are still in employment. In fact 11% or some 33,700 people aged 65 and over in 2011 were still in some form of employment. When comparing the types of jobs those in employment have with those whom have retired we can see some interesting patterns. Excluding those who have never worked; (which accounts for about 5.3% of all Hampshire older people) which we will look at later; those still in employment are more likely to be employed as managers, directors or senior officials, as associate professional or in technical occupations or within the caring and leisure sectors. The retired population are more likely to of been employed in administrative and secretarial professions, within sales and customer service occupations, or elementary occupations. Amongst those still in employment 14.5% were employed within professional occupations, whilst 19.3% of those retired previously had jobs within administrative and secretarial occupations. When looking at the district level for economic activity it is clear to see that the New Forest saw the highest amount of those still in employment within all occupations with 4,621 people aged 65 and over still working. The highest number of these was seen within the occupational roles of managers, directors, and senior officials with 757 (16.4%) people still working in the field. This could be due to them having shares within the business that they are employed in especially at the director level as this does not specify which type of director they are. The lowest number of 65 and overs in employment was seen within the district of Gosport at 1,178, with the largest proportion of these working within the elementary occupations (234). As previously stated those of the older population found within Hampshire whom have never been in employment equated to 5.3% or 14,188 people. When investigating this at the district level Rushmoor saw the highest amount of its population having never worked at 8.2%, while the lowest district was Hart at 3.8% of its total population. 36 Figure 19 5.3% of Hampshire’s older population have never worked 11% or 33,700 people aged 65 & over were still in some form of employment in 2011 Of those still in employment aged 65 and over, 14.5% were employed within professional occupations Out of all the districts Gosport has the lowest level of employement in the 65+ age group. 19.3% of the older population were employed within administrative and secretarial roles before retirement The New Forest has the highest number of 65+ still in employement at 4,621 people 37 Summary of the Economic Activity of Hampshire's Older Population Health and care Just like the population in general, older people want to enjoy good health and live a life without the need for significant care or support. Using Census data we can investigate how the older population of Hampshire feel about their general health, whether they suffer from any long term illnesses or disabilities that limit their daily life and also whether they provide care to others. General Health The 2011 Census asked respondents to rate their general health with the following question: What is your general health? Very good; Good; Fair; Bad; Very bad. A slightly different question to that asked in 2001 which asked respondents to look back over the last 12 months to assess their health and rate it as either Good, Fairly good or Not good. Thus the 2 sets of data are not quite comparable – however, looking at the changes over time will still give us an indication of how self perceived health amongst the older population has changed over time. In 2011 the majority (57.1%) of the elderly population aged 65 and over living in private households across Hampshire stated themselves as being in Very Good or Good general health. This compares to just 16.4% of those living in communal establishments across Hampshire. And also compares favourably to the England and Wales average figure of 49.1%. However, the population of all age groups across Hampshire whom reported experiencing Very Good or Good Health was 84.1%, reflecting the effect age has in general on health status. The elderly population of Hart stated the highest level of very good/good health at 65.0%, whilst at the opposing end of the spectrum, Portsmouth and Southampton experienced the lowest self reporting of good or very good health at 49.0% and 48.8% respectively. A third of Hampshire’s older population reported their health as fair, in line with the national picture, but much lower than for those living in communal establishments (46.9%). Looking back to 2001 81.8% of those in private households rated their health as either good or fair, this compares to figures from 2011 of 88.9% suggesting that older people across Hampshire in 2011 were more likely to rate their health positively. Turning to bad or very bad self reported general health status 11.1% of those aged 65 and over living in private households across Hampshire rated their health as Bad 38 or Very bad, less than the England and Wales figure of 15.5% and also for those living within communal establishments (36.7%) within Hampshire. However, clearly in comparison to the total population of Hampshire, the elderly reported a much higher level of negative health outcomes (4.1% reported bad or very bad health amongst the total population). Once again there is variation across Hampshire’s districts with highs in Portsmouth of 15.4% and a low in Hart at only 8.4%. Health is one of the few areas in which we can look at the very old (those aged 85 years and over). Amongst this population sub-group, the reporting of bad or very bad health is almost double that of the whole 65 and over group living in private households at 20.0% across Hampshire. Poor health is highest amongst those living in Portsmouth (24.2%) and lowest in Test Valley (17.3%). Whilst amongst those living in communal establishments the proportions are similar to the 65 and older group as a whole. However, good and very good health remains for a third of those aged 85 and older living in private households across Hampshire. 39 Figure 20 Summary of the General Health of the older population Hart saw a low of 8.4% of its elderly population living within a communal establishment stating that they had Bad/Very Bad Health, this compared to a high in Portsmouth of 15.4% Portsmouth and Southampton saw the lowest amount of their elderly populations stating Good/Very Good Health at 49% & 48.8% 57.1% of those 65 & over living in private households rated their health as Good/Very Good. 36.7% of those 65 & over living in communal households rated their health as Bad/Very Bad. Hart saw the highest level of Good/ Very Good Health at 65% 16.4% of the elderly population living in communal households rated their health as good/very good. 11.1% of those 65 & over living in private households rated their health as Bad/Very Bad; this was less than the national average Those 85 or over reporting Bad or Very Bad Health was double that of those aged 65 & over category. 40 Limiting Long Term Illness and disability The Census goes on to ask if respondents have a long term illness or disability that limits their daily activities (including problems related to old age). In 2011 the yes response option was broken down into ‘yes, a little’ and ‘yes, a lot’. Looking at those not affected by a limiting long term illness or disability, in 2011 this represented well over half (58.4%) of those aged 65 and over living in private households across Hampshire. Once again this was higher than the national picture (46.4%). In stark, though somewhat expected, contrast these figures compared to just 4.0% of those aged 65 and older living in communal establishments within Hampshire. Hart experienced the highest proportions stating that they were not limited by a long term illness at 60.8% of the 65 and older population, whilst in contrast Southampton had the lowest rate across Hampshire at below half its older population (46.3%). Turning to those who report some level of illness or disability that limits their daily activities, just over a quarter stated that their activities are limited a little, and a further fifth were limited a lot, equating to 45% of Hampshire’s 65 and over private household population being limited to some degree by a long term health or disability in 2011. This compares to the 2001 older population where 55.6% had their daily activities limited by an illness or disability. Again the vast majority of those within the communal establishment setting had a limiting long term illness or disability both in 2001 (93.1%) and 2011 (96.0%). Interestingly a lower proportion is seen in 2001. If we focus in on those who stated at the 2011 Census that their daily activities were limited a lot by an illness or disability we find that across Hampshire levels are generally lower than the national average (of 25.5%), with just Portsmouth (26.4%) and Southampton (26.8%) above this level. Lowest levels were seen in Hart (15.3%) Once again if we look at the very old (those aged 85 and over) we can see that for some 20% of Hampshire’s private household residents, life into very old age remains without a limiting long term illness or disability of any sort. However, by this age, many more do suffer and of these 80% almost half are limited a lot. Once again highest levels are seen in Portsmouth (52.7%) and lowest in Hart (43.1%). This section has shown that whilst health and disability problems do increase with age, Hampshire residents not only report proportionately fewer negative outcomes than the national average, but also that levels of bad health and limiting health status have declined since 2001. The findings suggest that today’s older population of Hampshire feel healthier than previous decades and live with fewer limiting long term illnesses and disabilities. In addition those with limiting long term health and disability problems in particular are much more likely to be within the communal establishment setting today. 41 Figure 21 42 Provision of Unpaid Care within Private Households So Hampshire’s older population today reports being healthier than in previous decades, but does this have any bearing on the care that older people themselves provide. Does having a healthier older population mean there is less of a need for carers now than in the past? Or do other factors relating to cost associated with care, as well as changes in the working patterns of families put more pressure to provide informal unpaid care upon the older population? Across Hampshire, 9.2% of all people provide some level of unpaid care. This increases to 13.8% amongst those aged 65 and over (or some 40,020 people). Highest levels are seen in the New Forest where 15.0% of all those aged 65 and over provide some level of unpaid care to others. And lowest levels were in Rushmoor at only 12.2%. These compare to 2001 figures of 9.1% across all ages and 11.4% of all those aged 65 and over providing some level of unpaid care. So the proportion of the population providing some level of care has increased across all but most notably across the older population – older people are providing a greater share of the unpaid care provision. Indeed in 2001 19.5% of all unpaid care was provided by those aged 65 and over. Today that has risen to almost a quarter at 23.6%. Just over half of those older people providing care do so for between 1 and 19 hours per week but a third care for 50 or more hours each week, though levels of care varies markedly around the county. For example in Winchester just over a quarter of those carers aged 65 and over provide 50 or more hours of unpaid care a week, compared to 41.3% of those in Southampton. And compared to the population as a whole older people of Hampshire are more likely to provide more hours of care. 38.1% of all those who provide 50 or more hours are aged 65 and over compared to a fifth of those providing 1-19 hours each week. A similar trend was seen in 2001 though proportions aged 65 and over have increased for all amounts of care provided (15.7% of those providing 1-19 hours of care to 33.6% of those providing 50 or more hours of care per week). This analysis has shown that having a healthier older population has not given rise to a decline in the levels of unpaid care provided by either the population as a whole or the older population, as might have been expected. But rather older people today are providing more unpaid care than in previous decades and they provide a proportionately higher level of excessive care (50 or more hours per week) than the population as a whole. 43 Figure 22 Provision of unpaid care within Private Households 33.5% Of all the unpaid carers in Hampshire… Provide 50+ hours 11.2% Provide 20-49 hours 23.6% 55.3% Are aged 65 and over (40,020) Provide 1-19 hours 44 Diversity So far we have shown how Hampshire’s older population has grown, become healthier and be more likely to live together, and, at least in property terms; wealthier. But the report now turns to look at the diversity of Hampshire’s older population – its ethnicity, country of birth and religious affiliations. Ethnicity / Country of birth Turning first to ethnicity, Hampshire has a largely White British population with 89% of the whole population categorising themselves as such in the 2011 Census (compared to 80.5% across the country as a whole). Though this has fallen from 94% in 2001, White British is still by far the main ethnic group across the whole of Hampshire. Looking at the older population is the even more evident. 95.9% of the whole of the 65 and over population describe themselves as White British in 2011, only marginally down from the level in 2001 of 96.6%. The most prolific non-white ethnic group within the older population is the Asian ethnic group at 1.0% of the total population aged 65 and over across Hampshire, equating to 3,000 people. The majority of whom live in Southampton, Rushmoor, Portsmouth and Basingstoke and Deane. Turning to those living in institutions we see an even greater majority of white ethnic group residents. 96.5% of Hampshire’s institutionalised population who are aged 65 and over define themselves as white British. Fewer than expected residents are of Asian ethnic group (0.2% of the institutionalised population compared to 1.0% of the whole 65 and over population). Similarly the black ethnic group is less represented within the institutionalised population compared to the general population (0.1 vs 0.2%). We can also look at the country of birth of our older population to see how this differs from the population as a whole and whether it has changed over time since the information was also collected in 2001. Once again the tables aren’t quite comparable as the 2001 data refers to those of pensionable age and over, whilst the 2011 data refers to those aged 65 and over. However, some interesting similarities emerge. As you might expect the vast majority of the older population in both 2001 and 2011 were born in England (87.9% in 2001 and 2011). The nest most popular birth place in both 2001 and 2011 was Scotland at about 2.7% at each time point, followed by Wales at 2.4% in 2001 and 2.0% in 2011. Around 7% reported a birth place outside of the United Kingdom in both censuses. Religion It is interesting to look at religion by age and there are some quite steep contrasts. For example, across Hampshire 59.7% of those of all ages report having Christian 45 beliefs. This proportion jumps to 81.8% amongst the 65 and over population and jumps further to 85.1% amongst the 85 and over population. Contrast this with those who report that they have no religion. Here figures drop from a high of 29.5% of the population of Hampshire as a whole to 9.3% of those aged 65 and over and further still to 5.8% amongst the very old (those aged 85 and over). What it isn’t possible to detangle from this is whether those in the older age groups have always felt they belonged to a religious group or whether the closer to the end of ones life brings about an increasing need to believe. Those older people with religious beliefs other than Christian or no religious affiliation occupy very small groups, with only Hindu and Buddhist religions making up greater than 1% of any district’s 65 and over population. Both these fall within Rushmoor where 2.1% of the 65 and over population state Buddhism as their religion and 1.4% state Hindu. 46 Conclusion This report has aimed to show what it means to be an older person today in Hampshire. Using Census data going back to 1851 the report has highlighted the large increases in both the numbers and proportions of Hampshire’s population that can be labelled as ‘elderly’ (defined for this report as being aged 65 years and older). And the 65 and over population is still growing, with the most recent Census indicating an increase of 15.3% in numbers since 2001, whilst the population aged 85 and over has increased by almost a third over the same period (30.3%). Indeed 17% of Hampshire’s population are now considered elderly (65 and over). And for many parts of Hampshire the older population outnumbers the child population. Whilst a fascinating story in itself, this does little to aid our understanding of what it means to be older in today’s Hampshire. In order to that, the report went on to look at the characteristics of the older population using cross tabulations from the 2011 Census and where possible compared them to similar tables from earlier censuses. From this analysis it was clear that Hampshire’s older population of today; whilst both larger in size as well as a proportion of Hampshire’s overall population; is also healthier, ‘wealthier’ and a little more diverse than those of previous decades. Today’s older population across Hampshire report less general poor health than previous decades and are less likely to suffer from long term illnesses or disabilities, though figures are much higher than the population as a whole and do increase sharply with age. Figures also vary significantly across the county with the two cities reporting higher levels of poor health and disability. In addition to the generally lower levels of poor health and fewer illnesses reported is the contrasting finding that more older people provide unpaid care to others. More older people today live within a couple household and own their own property. Though more are also divorced and a significant number live alone. Many home owners still have a mortgage or are private renters, which might help explain the higher proportion of older people still in employment than previous decades. Older people of today have a range of qualification levels with significant numbers without any formal qualifications. And a significant number have never formally worked (presumably many keeping the home and family was their main occupation). Older people today across Hampshire are less diverse than the population as a whole with more reporting to be white British, born in the UK and being Christian. It should be noted that this report focussed solely on Census information and so is limited to the factors collected by it. It can thus highlight trends and findings in these characteristics and whilst reasons behind the figures are explored, they are unlikely to present the full story and as such readers should be aware that many other factors are likely to play a part in fully understanding what it means to be older today in Hampshire. 47 Healthier According to the 2011 Census the older population of Hampshire both feel healthier and report fewer long term limiting illnesses than previous decades. However, they also provide more unpaid care to others and are more likely to shoulder a greater burden of excessive care. ‘Wealthier’ According to the 2011 Census more older people today across Hampshire own their own home. They are more likely to live in a couple household. However, they are also more likely to still be working and also are more likely to be divorced. a little More Diverse According to the 2011 Census the older population across Hampshire is a little more diverse than previous decades. However, the vast majority of Hampshire’s older population are Christian, white British. 48


© Copyright 2026