
Untitled
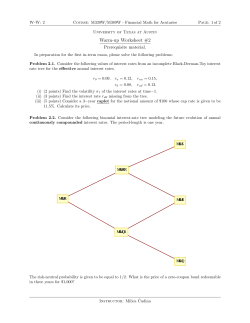
Trim: 152 x 229 mm
ffirs.indd 03/06/2015 Page i
How to Calculate
Options Prices
and Their Greeks
Trim: 152 x 229 mm
ffirs.indd 03/06/2015 Page iii
How to Calculate
Options Prices
and Their Greeks:
Exploring the
Black Scholes
Model from
Delta to Vega
PIERINO URSONE
Trim: 152 x 229 mm
ffirs.indd 03/20/2015 Page iv
This edition first published 2015
© 2015 Pierino Ursone
Registered office
John Wiley & Sons Ltd, The Atrium, Southern Gate, Chichester, West Sussex, PO19 8SQ, United
Kingdom
For details of our global editorial offices, for customer services and for information about how to apply
for permission to reuse the copyright material in this book please see our website at www.wiley.com.
All rights reserved. No part of this publication may be reproduced, stored in a retrieval system,
or transmitted, in any form or by any means, electronic, mechanical, photocopying, recording or
otherwise, except as permitted by the UK Copyright, Designs and Patents Act 1988, without the prior
permission of the publisher.
Wiley publishes in a variety of print and electronic formats and by print-on-demand. Some material
included with standard print versions of this book may not be included in e-books or in print-ondemand. If this book refers to media such as a CD or DVD that is not included in the version you
purchased, you may download this material at http://booksupport.wiley.com. For more information
about Wiley products, visit www.wiley.com.
Designations used by companies to distinguish their products are often claimed as trademarks. All
brand names and product names used in this book are trade names, service marks, trademarks or registered trademarks of their respective owners. The publisher is not associated with any product or vendor
mentioned in this book.
Limit of Liability/Disclaimer of Warranty: While the publisher and author have used their best efforts
in preparing this book, they make no representations or warranties with the respect to the accuracy
or completeness of the contents of this book and specifically disclaim any implied warranties of merchantability or fitness for a particular purpose. It is sold on the understanding that the publisher is not
engaged in rendering professional services and neither the publisher nor the author shall be liable for
damages arising herefrom. If professional advice or other expert assistance is required, the services of
a competent professional should be sought.
Library of Congress Cataloging-in-Publication Data is available
9781119011620 (hbk)
9781119011644 (ePDF)
9781119011637 (epub)
Cover Design: Wiley
Cover image: ©Cessna152/shutterstock
Set in 10/12pt Times by Laserwords Private Limited, Chennai, India
Printed in Great Britain by TJ International Ltd, Padstow, Cornwall, UK
Trim: 152 x 229 mm
ftoc.indd 03/06/2015 Page v
Table of contents
Preface
ix
CHAPTER 1
INTRODUCTION
1
CHAPTER 2
THE NORMAL PROBABILITY DISTRIBUTION
7
Standard deviation in a financial market
The impact of volatility and time on the standard deviation
CHAPTER 3
VOLATILITY
The probability distribution of the value of a Future
after one year of trading
Normal distribution versus log-normal distribution
Calculating the annualised volatility traditionally
Calculating the annualised volatility without μ
Calculating the annualised volatility applying
the 16% rule
Variation in trading days
Approach towards intraday volatility
Historical versus implied volatility
CHAPTER 4
PUT CALL PARITY
Synthetically creating a Future long position, the reversal
Synthetically creating a Future short position, the conversion
Synthetic options
Covered call writing
Short note on interest rates
8
8
11
11
11
15
17
19
20
20
23
25
29
30
31
34
35
v
Trim: 152 x 229 mm
ftoc.indd 03/06/2015 Page vi
TABLE OF CONTENTS
vi
CHAPTER 5
DELTA Δ
Change of option value through the delta
Dynamic delta
Delta at different maturities
Delta at different volatilities
20–80 Delta region
Delta per strike
Dynamic delta hedging
The at the money delta
Delta changes in time
CHAPTER 6
PRICING
Calculating the at the money straddle using
Black and Scholes formula
Determining the value of an at the money straddle
CHAPTER 7
DELTA II
Determining the boundaries of the delta
Valuation of the at the money delta
Delta distribution in relation to the at the money straddle
Application of the delta approach, determining
the delta of a call spread
CHAPTER 8
GAMMA
The aggregate gamma for a portfolio of options
The delta change of an option
The gamma is not a constant
Long term gamma example
Short term gamma example
Very short term gamma example
Determining the boundaries of gamma
Determining the gamma value of an at the money straddle
Gamma in relation to time to maturity,
volatility and the underlying level
Practical example
Hedging the gamma
Determining the gamma of out of the money options
Derivatives of the gamma
37
38
40
41
44
46
46
47
50
53
55
57
59
61
61
64
65
68
71
73
75
76
77
77
78
79
80
82
85
87
89
91
Trim: 152 x 229 mm
ftoc.indd 03/06/2015 Page vii
Table of contents
vii
CHAPTER 9
VEGA
93
Different maturities will display different volatility regime changes
Determining the vega value of at the money options
Vega of at the money options compared to volatility
Vega of at the money options compared to time to maturity
Vega of at the money options compared to the underlying level
Vega on a 3-dimensional scale, vega vs maturity and vega vs volatility
Determining the boundaries of vega
Comparing the boundaries of vega with the boundaries of gamma
Determining vega values of out of the money options
Derivatives of the vega
Vomma
CHAPTER 10
THETA
A practical example
Theta in relation to volatility
Theta in relation to time to maturity
Theta of at the money options in relation to the
underlying level
Determining the boundaries of theta
The gamma theta relationship α
Theta on a 3-dimensional scale, theta vs
maturity and theta vs volatility
Determining the theta value of an at the money straddle
Determining theta values of out of the money options
CHAPTER 11
SKEW
Volatility smiles with different times to maturity
Sticky at the money volatility
CHAPTER 12
SPREADS
Call spread (horizontal)
Put spread (horizontal)
Boxes
Applying boxes in the real market
The Greeks for horizontal spreads
Time spread
Approximation of the value of at the money spreads
Ratio spread
95
96
97
99
99
101
102
104
105
108
108
111
112
114
115
117
118
120
125
126
127
129
131
133
135
135
137
138
139
140
146
148
149
Trim: 152 x 229 mm
ftoc.indd 03/10/2015 Page viii
TABLE OF CONTENTS
viii
CHAPTER 13
BUTTERFLY
Put call parity
Distribution of the butterfly
Boundaries of the butterfly
Method for estimating at the money butterfly values
Estimating out of the money butterfly values
Butterfly in relation to volatility
Butterfly in relation to time to maturity
Butterfly as a strategic play
The Greeks of a butterfly
Straddle–strangle or the “Iron fly”
CHAPTER 14
STRATEGIES
Call
Put
Call spread
Ratio spread
Straddle
Strangle
Collar (risk reversal, fence)
Gamma portfolio
Gamma hedging strategies based on Monte Carlo scenarios
Setting up a gamma position on the back of prevailing
kurtosis in the market
Excess kurtosis
Benefitting from a platykurtic environment
The mesokurtic market
The leptokurtic market
Transition from a platykurtic environment
towards a leptokurtic environment
Wrong hedging strategy: Killergamma
Vega convexity/Vomma
Vega convexity in relation to time/Veta
INDEX
155
158
159
161
163
164
165
166
166
167
171
173
173
174
175
176
177
178
178
179
180
190
191
192
193
193
194
195
196
202
205
Trim: 152 x 229 mm
flast.indd 03/06/2015 Page ix
Preface
n September 1992 I joined a renowned and highly successful market-making
company at the Amsterdam Options Exchange. The company early recognised
the need for hiring option traders having had an academic education and being very
strong in mental calculation. Option trading those days more and more professionalised and shifted away from “survival of the loudest and toughest guy” towards a
more intellectual approach. Trading was a matter of speed, being the first in a deal.
Strength in mental arithmetic gave one an edge. For instance, when trading option
combinations, adding prices and subtracting prices – one at the bid price, the other
for instance at the asking price – being the quickest brought high rewards.
After a thorough test of my mental maths skills, I was one of only two, of the
many people tested, to be employed. There I stood, in my first few days in the open
outcry pit, just briefly after September 16th 1992 (Black Wednesday). On that day
the UK withdrew from the European EMS system (the forerunner of the Euro), the
British pound collapsed, the FX market in general became heavily volatile – all
around the time the management of the company had decided to let me start trading
Dollar options.
With my mentor behind me, I stood in the Dollar pit (training on the job) trying to compete with a bunch of experienced guys. My mentor jabbed my back each
time when a trade, being brought to the pit by the floorbrokers, seemed interesting.
In the meantime he was teaching me put–call parity, reversals and conversions,
horizontal and time spreads, and whereabouts the value of at the money options
should be (just a ballpark figure). There was one large distinction between us and
the other traders; we were the only ones not using a computer printout with options
prices. My mentor was certain that one should be able to trade off the top of the
head; I was his guinea pig.
In those days, every trader on the floor was using a print of the Black Scholes
model, indicating fair value for a large set of options at a specific level in the underlying asset. These printouts were produced at several levels of the underlying, so
that a trader did not need to leave the pit to produce a new printout when new levels
were met. Some days, however, markets could be so volatile that prices would “run
off” the sheet. As a result the trader would have to leave the pit to print a new price
sheet. It was exactly these moments when trading in the pit was the busiest: not
having to leave the pit was an advantage as there were fewer traders to compete
I
ix
Trim: 152 x 229 mm
x
flast.indd 03/06/2015 Page x
PREFACE
with. So, not having to rely on the printouts would create an edge while liquidity in
trading would be booming at those times.
All the time we kept thinking of how to outsmart the others, how to value
options at specific volatility levels and how, for instance, volatility spreads would
behave in changing market circumstances. Soon we were able, when looking at
option prices in other trading pits, to come up with fairly good estimates on the
prevailing volatilities. We figured out how the delta of in the money options relate to
the at the money options, how the at the moneys have to be priced and how to value
butterflies on the back of the delta of spreads and more. Next to that we had our
weekly company calculation and strategy sessions. There was a steady accumulation of knowledge on options pricing and valuing some of the Greeks.
After having run my own company from 1996 to 2001 at the Amsterdam
exchange, I entered the energy options market, a whole different league. There
was no exchange to trade on, no clearing of trades (hence counterparty risk), the
volumes were much larger and it was professional against professional. As a market maker on the exchange one was in general used to earning a living on the back
of the margins stemming from the differences in bid and asking prices (obviously
we were running some strategies at the same time as well). Now however, with
everyone knowing exactly where prices should be, all margins had evaporated. As
a result, the only way to earn money was to have a proper assessment of the market
and have the right position to optimise the potential profits. So I moved from an
environment where superior pricing was a guarantee for success to an area where
only the right strategy and the right execution of this strategy would reap rewards.
It truly was a challenge how to think of the best strategy as there is a plethora of
possible option combinations.
It has been the combination of these two worlds which has matured me in
understanding how option trading really works. Without knowing how to price an
option and its Greeks it would be onerous to find the right strategy. Without having
the right market assessment it is impossible to generate profits from options trading.
In this book I have written down what I have learned in almost 20 years of
options trading. It will greatly contribute to a full understanding of how to price
options and their Greeks, how they are distributed and how strategies work out
under changing circumstances. As mentioned before, when setting up a strategy
one can choose from many possible option combinations. This book will help the
reader to ponder options and strategies in such a way that one can fully understand
how changes in underlying levels, in market volatility and in time impact the profitability of a strategy.
I wish to express my gratitude to my friends Bram van der Lee and Matt Daen
for reviewing this book, for their support, enthusiasm and suggestions on how to
further improve its quality.
Pierino Ursone
Trim: 152 x 229 mm
c01.indd 03/06/2015 Page 1
CHAPTER
1
Introduction
he most widely used option model is the Black and Scholes model. Although
there are some shortcomings, the model is appreciated by many professional
option traders and investors because of its simplicity, but also because, in many
circumstances, it does generate a fair value for option prices in all kinds of markets.
The main shortcomings, most of which will be discussed later, are:
the model assumes a geometric Brownian motion where the market might deviate
from that assumption (jumps); it assumes a normal distribution of daily (logarithmic) returns of an asset or Future while quite often there is a tendency towards a
distribution with high peaks around the mean and fat tails; it assumes stable volatility while the market is characterised by changing (stochastic) volatility regimes;
it also assumes all strikes of the options have the same volatility; it doesn’t apply
skew (adjustment of option prices) in the volatility smile/surface, and so on.
So in principle there may be a lot of caveats on the Black and Scholes model.
However, because of its use by many market participants (with adjustments to make
up for the shortcomings) in combination with its accuracy on many occasions, it
may remain the basis option model for pricing options for quite some time.
This book aims to explore and explain the ins and outs of the Black and Scholes model (to be precise, the Black ’76 model on Futures, minimising the impact of
interest rates and leaving out dividends). It has been written for any person active
in buying or selling options, involved in options from a business perspective or
just interested in learning the background of options pricing, which is quite often
seen as a black box. Although this is not an academic work, it could be worthwhile
for academics to understand how options and their derivatives perform in practice,
rather than in theory.
The book has a very practical approach and an emphasis on the distribution
of the Greeks; these measure the sensitivity of the value of an option with regards
to changes in parameters such as the strike, the underlying (Future), volatility (a
measurement of the variation of the underlying), time to expiry or maturity, and the
T
1
Trim: 152 x 229 mm
c01.indd 03/06/2015 Page 2
HOW TO CALCULATE OPTIONS PRICES AND THEIR GREEKS
2
interest rate. It further emphasises the implications of the Greeks and understanding them with regards to the impact they will/might have on the P&L of an options
portfolio. The aim is to give the reader a full understanding of the multidimensional
aspects of trading options.
When measuring the sensitivity of the value of an option with regards to
changes in the parameters one can discern many Greeks, but the most important
ones are:
Delta: the price change of an option in relation to the change of the underlying;
Vega: the price change of an option in relation to volatility;
Theta (time decay): the price change of an option in relation to time;
Rho: the price change of an option in relation to interest rate.
These Greeks are called the first order Greeks. Next to that there are also second order Greeks, which are derivatives of the first order Greeks – gamma, vanna,
vomma, etcetera – and third order Greeks, being derivatives of the second order
Greeks – colour, speed, etcetera.
The most important of the higher order Greeks is gamma which measures the
change of delta.
TABLE 1.1
Parameters
Strike
First order Greeks
Delta
Second order Greeks
Gamma
Third order Greeks
Colour
Underlying
Vega
Vanna
Speed
Volatility
Theta
Vomma
Ultima
Time to maturity
Rho
Charm
Zomma
Interest rate
Veta
Vera
When Greeks are mentioned throughout the book, the term usually relates to
delta, vega, theta and gamma, for they are the most important ones.
The book will also teach how to value at the money options, their surrounding
strikes and their main Greeks, without applying the option model. Although much is
based on rules of thumb and approximation, valuations without the model can be very
accurate. Being able to value/approximate option prices and their Greeks off the top of
the head is not the main objective; however, being able to do so must imply that one
fully understands how pricing works and how the Greeks are distributed. This will
enable the reader to consider and calculate how an option strategy might develop in a
four dimensional way. The reader will learn about the consequences of options pricing
with regards to changes in time, volatility, underlying and strike, all at the same time.
People on the verge of entering into an option strategy quite often prepare themselves by checking books or the internet. Too often they find explanations of a certain strategy which is only based on the payoff of an option at time of maturity – a
Trim: 152 x 229 mm
c01.indd 03/06/2015 Page 3
3
Introduction
Short the 40 put at $1.50 (at inception: Future at 50, volatility 28%, maturity 1 year)
6.00
4.00
2.00
P&L at expiry
0.00
30 31 32 33 34 35 36 37 38 39 40 41 42 43 44 45 46 47 48 49 50 51 52 53 54 55 56 57 58 59 60
–2.00
Future level
–4.00
–6.00
–8.00
–10.00
CHART 1.1 P&L distribution of a short 40 put position at expiry
two-dimensional interpretation (underlying price versus profit loss). This can be quite
misleading since there is so much to say about options during their lifetime, something
some people might already have experienced when confronted with adverse market
moves while running an option strategy with associated losses. A change in any one
of the aforementioned parameters will result in a change in the value of an option. In
a two-dimensional approach (i.e. looking at P&L distribution at expiry) most of the
Greeks are disregarded, while during the lifetime of the option they can make or break
the strategy.
Throughout the book, any actor who is active in buying or selling options –
i.e. a private investor, trader, hedger, portfolio manager, etcetera – will be called a
trader.
Many people understand losses deriving from bad investment decisions when
buying options or the potentially unlimited losses of short options. However, quite
often they fail to see the potentially devastating effects of misinterpretation of the
Greeks.
For example, as shown in chart 1.1, a trader who sold a 40 put at $1.50 when
the Future was trading at 50 (volatility at 28%, maturity 1 year), had the right view.
During the lifetime of the option, the market never came below 40, the put expired
worthless, and the trader consequently ended up with a profit of $1.50.
The problem the trader may have experienced, however, is that shortly after
inception of the trade, the market came off rapidly towards the 42 level. As a result
of the sharp drop in the underlying, the volatility may have jumped from 28% to
40%. The 40 put he sold at $1.50 suddenly had a value of $5.50, an unrealised loss
of $4. It would have at least made the trader nervous, but most probably he would
have bought back the option because it hit his stop loss level or he was forced by
Trim: 152 x 229 mm
c01.indd 03/06/2015 Page 4
HOW TO CALCULATE OPTIONS PRICES AND THEIR GREEKS
4
Short the 50 straddle once, long the 40 60 strangle twice
60,000
40,000
0
35
36
37
38
39
40
41
42
43
44
45
46
47
48
49
50
51
52
53
54
55
56
57
58
59
60
61
62
63
64
65
P&L at expiry
20,000
Future level
-20,000
-40,000
-60,000
CHART 1.2 P&L distribution of the combination trade at expiry
his broker, bank or clearing institution to deposit more margin; or even worse, the
trade was stopped out by one of these institutions (at a bad price) when not adhering
to the margin call.
So an adverse market move could have caused the trader to end up with a loss
while being right in his strategy/view of the market. If he had anticipated the possibility of such a market move he might have sold less options or kept some cash for
additional margin calls. Consequently, at expiry, he would have ended up with the
$1.50 profit. Anticipation obviously can only be applied when understanding the
consequences of changing option parameters with regards to the price of an option.
A far more complex strategy, with a striking difference in P&L distribution at
expiry compared to the P&L distribution during its lifetime, is a combination where
the trader is short the 50 call once (10,000 lots) and long the 60 call twice (20,000
lots) and at the same time short the 50 put once (10,000 lots) and long the 40 put twice
(20,000 lots). He received around $45,000 when entering into the strategy. The P&L
distribution of the combination trade at expiry is shown above in Chart 1.2.
The combination trade will perform best when the market is at 50 (around
$45,000 profit) and will have its worst performance when the market is either at 40
or at 60 at expiry (around $55,000 loss).
The strategy has been set up with 1 year to maturity; a lot can happen in the time
between inception of the trade and its expiry. In an environment where the Future
will rapidly change and where as a result of the fast move in the market the volatility
might increase, the P&L distribution of the strategy could look, in a three dimensional
way, as follows (P&L versus time to maturity versus underlying level):
Chart 1.3 shows the P&L distribution of the combination trade in relation to
time. When looking at expiry, at the axis “Days to expiry” at 0, the P&L distribution
Trim: 152 x 229 mm
c01.indd 03/06/2015 Page 5
5
Introduction
P&L Chart
60,000
40,000
20,000
0
–20,000
60,000 -80,000
–40,000
40,000 -60,000
35 –60,000
38
41
44
47
50
53 Future level
56
365
P&L in Dollars
80,000
20,000 -40,000
0 -20,000
–20,000 -0
–40,000 -–20,000
–60,000 -–40,000
59
304
243
62
183
Days to expiry
122
65
61
0
CHART 1.3 Combination trade, long 20,000 40 puts and 60 calls, short 10,000 50 puts and
50 calls
is the same as the distribution depicted in the two-dimensional chart 1.2. The best
performance is at 50 in the Future, resulting in a P&L of around $45,000 and the
worst case scenario is when the Future is at 40 or at 60, when the loss will mount
up to around $55,000. However, when the maturity is 365 “days to expiry” and the
market starts moving and consequently the volatility will, for instance, increase,
the performance will overall be positive, there will be some profit at the 50 level
in the Future. This is the smallest amount, but still a few thousand up: a profit of
around $35,000 when the Future is at 60 and around $10,000 when the Future is
at 40. These P&L numbers keep changing during the lifetime of the strategy. For
instance, the $35,000 profit at 60 in the Future (at 365 days to expiry) will turn
into a $55,000 loss at expiry when the market stays at that level – losses in time,
called the time decay or theta. Also, when the trade has been set up, the P&L of
the portfolio increases with higher levels in the Future, so there must be some sort
of delta active (change of value of the portfolio in relation to the change of the
Future). Next to that, the P&L distribution displays a convex line between 50 and
65 at 365 days to expiry, which means that the delta will change as well; changes
in the delta are called the gamma.
So the P&L distribution of this structure is heavily influenced by its Greeks:
the delta, gamma, vega and theta – a very dynamic distribution. Thus, without an
understanding of the Greeks this structure would not be understandable when looking at the P&L distribution from a more dimensional perspective.
Trim: 152 x 229 mm
6
c01.indd 03/06/2015 Page 6
HOW TO CALCULATE OPTIONS PRICES AND THEIR GREEKS
It is of utmost importance that one realises that changing market conditions
can make an option portfolio with a profitable outlook change into a position with
an almost certainly negative P&L; or the other way around, as shown in the example above. Therefore it is a prerequisite that when trading/investing in options one
understands the Greeks.
This book will, in the first chapters, discuss probability distribution, volatility
and put call parity, then the main Greeks: delta, gamma, vega and theta. The first
order Greeks, together with gamma (a second order Greek), are the most important
and will thus be discussed at length. As the other Greeks are derived from these, they
will be discussed only briefly, if at all. Once the regular Greeks are understood one
can easily ponder the second and third order Greeks and understand how they work.
In the introduction of a chapter on a Greek, the formula of this Greek will
be shown as well. The intention is not to write about mathematics, its purpose
is to show how parameters like underlying, volatility and time will influence that
specific Greek. So a mathematical equation like the one for gamma, γ = ϕ( d1) ,
Fσ T
should not bring despair. In the chapter itself it will be fully explained.
In the last chapter, trading strategies will be discussed, from simple strategies
towards complex structures. The main importance, though, is that the trader must
have a view about the market; without this it is hard to determine which strategy is
appropriate to become a potential winner. An option strategy should be the result
of careful consideration of the market circumstances. How well the option strategy
performs is fully related to the trader making the right assessment on the market’s
direction or market circumstances. A potential winning option strategy could end
up disastrously with an unanticipated adverse market move. Each strategy could be
a winner, but at the same time a loser as well.
The terms “in”, “at” or “out” of the money will be mentioned throughout the book.
“At the money” refers to an option which strike is situated at precisely the level of the
underlying. When not meant to be precisely at the money, the term “around the at the
money” will be applied. “Out of the money” options are calls with higher strikes and
puts with lower strikes compared to the at the money strike; “in the money” options are
calls with lower strikes and puts with higher strikes compared to the at the money strike.
The options in the book are treated as European options, hence there will be no
early exercise possible (exercising the right entailed by the option before maturity
date), as opposed to American options. Obviously, American option prices might
differ from European (in relation to dividends and the interest rate level), however
discussing this falls beyond the scope of the book. When applying European style
there will be no effect on option pricing with regards to dividend.
For the asset/underlying, a Future has been chosen; it already has a future dividend pay out and the interest rate component incorporated in its value.
For reasons of simplicity and also for making a better representation of the
effect of the Greeks, 10,000 units has been applied as the basis volume for at the
money options where each option represents the right to buy (i.e. a call) or sell (i.e.
a put) one Future. The 10,000 basis volume could represent a fairly large private
investor or a fairly small trader in the real world. For out of the money options, larger
quantities will be applied, depending on the face value of the portfolio/position.
Trim: 152 x 229 mm
c02.indd 03/06/2015 Page 7
CHAPTER
2
The Normal Probability
Distribution
he “Bell” curve or Gaussian distribution, called the normal standard distribution, displays how data/observations will be distributed in a specific range
with a certain probability. Think of the height of a population; let’s assume a
group of people where 95% of all the persons are between 1.10 m and 1.90 m,
1.1
implying a mean of 1.50 m ( 1.9 +
). Looking at Chart 2.1, one can see that
2
95% of the observations are within 2 standard deviations on either side of
T
Probability distribution expressed in standard deviations
50%
50%
68%
95%
99,7%
–4.00
–3.80
–3.60
–3.40
–3.20
–3.00
–2.80
–2.60
–2.40
–2.20
–2.00
–1.80
–1.60
–1.40
–1.20
–1.00
–0.80
–0.60
–0.40
–0.20
0.00
0.20
0.40
0.60
0.80
1.00
1.20
1.40
1.60
1.80
2.00
2.20
2.40
2.60
2.80
3.00
3.20
3.40
3.60
3.80
4.00
Mean
Amount of Standard Deviations
CHART 2.1 Normal probability distribution
7
Trim: 152 x 229 mm
8
c02.indd 03/06/2015 Page 8
HOW TO CALCULATE OPTIONS PRICES AND THEIR GREEKS
the mean (on the chart at 0.00), totalling 4 standard deviations. So 0.80 m
(the difference between 1.90 and 1.10) represents 4 standard deviations, resulting
in a standard deviation of 0.20 m.
With a mean of 1.50 m and a standard deviation of 0.20 m one could say that
there is a likelihood of 68% for the people to have a height between 1.30 and 1.70
m, a high likelihood of 95% for people to have a height between 1.10 and 1.90 m
and almost certainty, around 99.7%, for people to have a height between 0.90 and
2.10 m. Or to say it differently; hardly any person is taller than 2.10 m or smaller
than 0.90 m.
STANDARD DEVIATION IN A
FINANCIAL MARKET
The same could be applied to the daily returns of a Future in a financial market.
According to its volatility it will have a certain standard deviation. When, for
instance, a Future which is trading at 50 with a daily standard deviation of 1%, one
could say that with 256 trading days in a year (365 days minus the weekends and
some holidays), in 68% of these days, being 174 days, the Future will move during
each trading day between 0 and 50 cents up or down. Twenty-seven per cent (95%
minus 68%) of the days (69 days) it will shift between 50 cents and a dollar up or
down. There will be around 13 days where the Future will move more than 1 dollar
during the day.
In the financial markets where a Future trades at 50 (hence a mean of 50), a
standard deviation of σ× T (or simply σ T ) will be applied, where σ stands for
volatility and T stands for the square root of time to maturity (expressed in years).
THE IMPACT OF VOLATILITY AND
TIME ON THE STANDARD DEVIATION
Volatility is the measure of the variation of a financial asset over a certain time
period. An asset with high volatility displays sharp directional moves and large
intraday moves; one can think of times when exchanges experience turbulent
moments, when for instance geopolitical issues arise and investors seem to be panicking a bit. With low volatility one could think of the infamous summer lull; at
some stage markets hardly move for days, volumes are very low and people are not
investing during their summer holidays.
For T, the square root of time to maturity is represented in an annualised form,
meaning that when maturity is in 3 months time, T will be ¼ (year), where its
square root is ½.
So with a Future (F) trading at 50.00, volatility (σ) at 20% and maturity (T) 3 months
(¼ year), the standard deviation will be: σ× T × F = 20% × ½ × 50.00 = 5.00.
This implies that when 2 standard deviations are applied, the Future at maturity
Trim: 152 x 229 mm
c02.indd 03/06/2015 Page 9
9
The Normal Probability Distribution
Probability distribution different maturities and different volatility, Future at 50
10% Volatility 1 Year
20% Volatility 1 Year
20% Volatility 0.50 Year
20% Volatility 0.11 Year
10 13 16 19 22 25 28 31 34 37 40 43 46 49 52 55 58 61 64 67 70 73 76 79 82 85 88
Future
CHART 2.2 Chart 2.2 shows the probability distributions for the Future, currently trading at 50,
at two different volatility levels and three different times to maturity.
will be expected to be somewhere between 40.00 and 60.00 with 95% certainty
(sometimes called the confidence level).
Obviously, when volatility and/or time to maturity increase the range gets
larger (in essence an increase in the standard deviation); a decrease in volatility
and/or time to maturity will result in a smaller range (a decrease in the standard
deviation).
The dashed line in Chart 2.2 (10% volatility and 1 year to maturity) displays the
distribution with a standard deviation of: σ× T × F, being 10% times the square
root of 1 times 50, which makes $5. When applying 3 standard deviations, the 35/65
range can be calculated (being 3 × 5 = 15 points lower and higher compared to the
current Future level) where the 99.7% probability applies.
This is exactly the same as the distribution for the Future with a volatility of
20% and a maturity of 3 months (the earlier example). In the standard deviation
formula (σ T ) the volatility has doubled from 10% to 20%. With regards to T,
3 months’ maturity is one quarter of a year. By taking the square root of a quarter,
it means that the T component has actually been halved. So by halving the standard
deviation for the T component and multiplying it by 2 for the σ component, the
outcome will be exactly the same probability distribution.
It is important to realise that the surface of the different distributions has
the same size every time. The total chance has to be kept at 100% all the time.
Maturity can be shorter, though the height of the chart will be higher then, in order
to keep the surface at the same size. A higher volatility (with unchanged time to
maturity) will result in a much broader/wider area in the Future; to compensate
Trim: 152 x 229 mm
10
c02.indd 03/06/2015 Page 10
HOW TO CALCULATE OPTIONS PRICES AND THEIR GREEKS
for that (keeping the total size of the charts at the same level) the height of the
chart/distribution will be lower.
In conclusion: the effect on the standard deviations is linear with regards to
volatility moves and has a square root function with regards to time changes. This
feature will come back several times when discussing the Greeks. One just needs
to recall how the charts will change (keeping size/surface constant) with changes in
volatility and changes in time; it will help to explain other features in option theory
as well.
Trim: 152 x 229 mm
c03.indd 03/06/2015 Page 11
CHAPTER
3
Volatility
olatility is the measure of the variation (or the dispersion) of the returns (profits/
losses) of a Future over a certain period of time.
One could say: the riskier the asset, the higher the volatility (think of market
crashes). The lower an asset’s risk, the lower its volatility (think of the summer
lull). So, in highly volatile markets one could expect large moves of the Future
where at low volatile markets there might be days where the Future hardly moves.
V
THE PROBABILITY DISTRIBUTION OF THE VALUE OF
A FUTURE AFTER ONE YEAR OF TRADING
In option trading volatility is expressed on an annualised basis. It is a calculation
of the daily returns based on a full year’s expectation of the combined returns. The
annualised volatility predicts the probability of the outcome of the value of a Future
after one year of trading (usually 256 trading days).
The probability is based on the Gaussian distribution. With low volatility (for
example, 10% as depicted in chart 3.1), one could expect the Future, which initially
started at 50, to settle somewhere between 40 and 60 after one year of trading.
(Here a 95% confidence level has been applied, being 95% of all probable occurrences, and hence 2 standard deviations of 10%.) If the volatility is twice as high
(20%), the range for the Future to settle after one year of trading would (almost)
double as well, now between 30 and 70.
When volatility is at 40%, the range (almost) doubles again.
NORMAL DISTRIBUTION VERSUS LOG-NORMAL DISTRIBUTION
Charts 3.1, 3.2 and 3.3 show that the distribution range for the Future to settle
after one year of trading would double with double volatility, however the word
11


© Copyright 2026