
2015 Q1 Report
Q1 2015 Dream Global REIT Table of contents Letter to unitholders 1 Management’s discussion and analysis 2 Condensed consolidated financial statements 41 Notes to the condensed consolidated financial statements 45 Corporate information IBC Letter to unitholders Our business has performed well and the results for the first quarter were in line with expectations as Dream Global REIT remained focused on executing its business plan. We continue to drive value in our portfolio through active asset management, including leasing, asset repositioning as well as redevelopment. In addition, we continued the sale of assets from our original portfolio at attractive prices as part of our capital recycling program. In January 2015, we further expanded our relationship with the Public Officials Benefits Association (“POBA”), a South Korean pension fund, with the sale of a 50% interest in Officium, a property located in Stuttgart, for $36.8 million. This increased POBA’s overall ownership interest to 577,000 square feet in eight of the Trust’s properties. Dream Global REIT will continue to provide ongoing management for these properties. The joint venture with POBA recognized the strength and value of our operating platform and set the stage for discussions with other potential joint venture partners as international capital continues to be attracted to Germany. Our leasing team in Germany continues to see high levels of activity, which is translating into more potential tenants touring our buildings and driving our leasing performance. The strength of the German economy is resulting in many companies expanding their space to accommodate their growing businesses. Vacancy rates in the Big 7 German office markets further declined during the first three months of 2015 to an average rate of 7.5% from 8.1% in Q1 2014. In February 2015, we completed the acquisition of Millerntorplatz 1 in Hamburg, the Trust’s largest single asset by gross leasable area. This property, which is 87% occupied, provides good upside potential through leasing and developing a retail component in currently unused space. This $136 million acquisition was completed at a going-‐in cap rate of 6.1% and financed with a ten-‐year mortgage at an interest rate of 1.71%. Overall, the market for acquisitions in Germany continues to be quite attractive and competitive and our acquisition pipeline remains strong. In line with our plan to improve the quality and stability of our cash flow, we continue to actively pursue opportunities to dispose of assets from the lnitial Portfolio. We have completed the sale of ten assets during the first quarter of 2015 for approximately $21 million at 103% of the assets’ book value and remain on track to close the sale of, or have under contract to sell, approximately $135 million of assets in 2015. The German lending environment remains attractive with mortgage rates at their lowest level in the Trust’s history. In addition to low market rates, increased competition in the German lending market has put pressure on credit spreads. Coupled with our success in building strong relationships with German lenders, we continue to achieve highly attractive interest rates for new acquisitions. This environment is also conducive for refinancing in-‐place mortgages and replacing that debt with lower interest rates and longer maturities. We are excited about the opportunities that exist both within our diverse portfolio and the German real estate market. On behalf of our management team and our Board of Trustees, I’d like to thank you for your continued support of Dream Global REIT. P. Jane Gavan President and Chief Executive Officer May 6, 2015 Dream Global REIT 2015 First Quarter Report | 1 Management’s discussion and analysis All dollar amounts in our tables are presented in thousands of Canadian dollars, except rental rates, unit and per unit amounts. SECTION I – OVERVIEW AND FINANCIAL HIGHLIGHTS KEY PERFORMANCE INDICATORS Portfolio (1) Number of properties (1) Gross leasable area (“GLA”) (in square feet) (1) Occupancy rate – including committed (period-‐end) (1) Occupancy rate – in-‐place (period-‐end) (1) Average in-‐place net rent per square foot (period-‐end) (1) Market rents above in-‐place net rents (2) Operating results (3) Investment properties revenue (4) Net operating income (“NOI”) Total portfolio Initial Properties Acquisition Properties (5) Funds from operations (“FFO”) (6) Adjusted funds from operations (“AFFO”) Distributions Declared distributions DRIP participation ratio (for the period) (7) Per unit amounts Distribution Basic: FFO AFFO Diluted: FFO Financing Weighted average face rate of interest on (1) debt (period-‐end) (1)(8)(9) Interest coverage ratio (1)(8)(9) Debt-‐to-‐adjusted EBITDFV (years) (1)(8)(9) Level of debt (net debt-‐to-‐gross book value, net of cash) (1)(9)(10) Debt – average term to maturity (years) Unsecured convertible debentures As at March 31, 2015 As at December 31, 2014 As at March 31, 2014 237 266 293 13,863,404 14,839,661 15,820,974 86.0% 85.3% 87.7% 85.6% 84.7% 86.9% € 9.26 € 8.86 € 8.72 3.3% 2.9% 1.5% $ 56,910 $ 61,690 $ 67,133 38,298 43,069 45,800 12,321 16,537 21,627 25,977 26,532 24,173 21,244 23,428 24,756 19,862 22,401 23,084 $ 22,353 $ 22,263 $ 22,006 15% 16% 18% $ 0.20 $ 0.20 $ 0.20 0.19 0.21 0.23 0.18 0.20 0.21 0.19 0.21 0.22 3.10% 3.23% 3.35% 3.02 times 3.26 times 3.41 times 10.49 9.18 9.00 52% 51% 56% 4.6 4.3 4.2 $ 152,898 $ 152,365 $ 150,822 (1) Reflects Owned Share of joint venture properties starting in Q4 2014. Number of properties includes the joint venture properties but excludes properties classified as assets held for sale starting in Q1 2015. Joint venture properties are accounted for using the equity method in our condensed consolidated financial statements. (2) Results from operations were converted into Canadian dollars from euros using the average exchange rates found on page 28. (3) Investment properties revenue (non-‐GAAP measure) is defined as total revenue, including the share of investment property revenue from investments in joint ventures from the date of closing of the sale of the respective properties. The reconciliation of investment property revenue can be found in the section “Non-‐GAAP measures and other disclosures”. (4) NOI (non-‐GAAP measure) is defined as total of net rental income, including the share of net rental income from investment in joint ventures from the date of closing of the sale of the respective properties. The reconciliation of NOI to net rental income can be found in the section “Non-‐GAAP measures and other disclosures” under net operating income. (5) FFO (non-‐GAAP measure) – The reconciliation of FFO to net income can be found in the section “Our results of operations” under the heading “Funds from operations and adjusted funds from operations”. (6) AFFO (non-‐GAAP measure) – The reconciliation of AFFO to cash generated from (utilized in) operating activities can be found in the section “Non-‐GAAP measures and other disclosures” under the heading “Cash generated from operating activities to AFFO reconciliation”. (7) A description of the determination of basic and diluted amounts per unit can be found in the section “Non-‐GAAP measures and other disclosures” under the heading “Weighted average number of units”. (8) The calculations of the following non-‐GAAP measures are included in the section “Non-‐GAAP measures and other disclosures” under the headings “Interest coverage ratio”, “Debt-‐to-‐adjusted EBITDFV” and “Level of debt (net debt-‐to-‐gross book value, net of cash)”. (9) This metric includes the REIT’s share of the mortgages on the POBA properties starting in Q4 2014. (10) This metric excludes the revolving credit facility. Dream Global REIT 2015 First Quarter Report | 2 FINANCIAL OVERVIEW The first quarter results were in line with our expectations with funds from operations (“FFO”) and adjusted funds from operations (“AFFO”) of $21.2 million and $19.9 million, respectively. By comparison, the FFO and AFFO for Q1 2014 were $24.8 million and $23.1 million, respectively. The reduction in both metrics in Q1 2015 from the 2014 levels reflects the impact from the Deutsche Post lease terminations and the Lonestar guarantee expiry, which were both effective as at July 1, 2014. Partially offsetting these items were the acquisitions we completed in 2014 and the strong leasing performance. On a per unit basis, basic FFO and basic AFFO were 19 cents and 18 cents, respectively, in Q1 2015, compared to 23 cents and 21 cents for Q1 2014. In the first quarter, we completed the acquisition of Millerntorplatz 1 in Hamburg, our largest asset by size in our portfolio. With this acquisition, all proceeds from the sale of a 50% interest in seven assets to the Public Officials Benefit Association (“POBA”) have been fully reinvested. We also extended our relationship with POBA by selling them a 50% interest in Officium, a property located in Stuttgart. Our retained 50% interest in the eight joint venture assets is reflected as an investment in joint ventures in the consolidated balance sheet and is equity accounted for in our condensed consolidated financial statements. Our leasing momentum and the leasing pipeline remain strong as we approach mid-‐year, buoyed by solid economic metrics in Germany. The previously identified expiry of short-‐term lease extensions in connection with Deutsche Post’s 2014 lease terminations resulted in negative leasing absorption in Q1. Our overall in-‐place and committed occupancy decreased to 86.0% in Q1 2015 from 87.7% in Q1 2014, reflecting the DPI 2014 terminations. Also contributing to the decline was the sale to POBA of 50% of eight assets that tend to have a higher occupancy. The overall effect of these items was significantly mitigated by strong leasing and renewals across our entire portfolio as well as the acquisitions we completed. Year-‐over-‐year, in-‐place rents increased from €8.72 per square foot in Q1 2014 to €9.26 per square foot in Q1 2015, largely due to the completed acquisitions, which have a higher average per square foot rent. We are also seeing an increase in rents upon lease renewal and when new leases are signed on vacant space. At €9.57 per square foot, average market rents in our portfolio remain above in-‐place rents at the end of Q1 2015. At 3.3%, the spread between our in-‐place and market rents has widened in Q1 2015, highlighting improving market rents. The lending environment in Germany remains favourable with historically low interest rates and lending margins. The Trust is able to take advantage of these conditions as evidenced by the decline in the average face interest rate to 3.10% at the end of Q1 2015, from 3.23% at the end of Q4 2014. Our leverage was 52% (debt-‐to-‐gross book value, net of cash) at the end of Q1 2015, up slightly from 51% at the end of Q4 2014, reflecting the use of cash on hand to fund the acquisition of Millerntorplatz 1 in February. The current leverage ratio is in the targeted range of 50% to 60% debt-‐to-‐gross book value (net of cash). On an overall basis, management was pleased with the Trust’s performance in Q1 2015. OUTLOOK We continued on our strategy to strengthen the quality of our overall portfolio in Q1 with the acquisition of our property at Millerntorplatz 1 in Hamburg and the expansion of our joint venture with POBA through the sale of a 50% interest in Officium in Stuttgart. Our ability to find quality assets and reinvest into properties of equal or better quality will enable us to continue to grow and realize value from our platform. Millerntorplatz 1 is 87% occupied, was acquired at a going-‐in capitalization rate (“cap rate”) of 6.1% and was financed with a ten-‐year mortgage at an interest rate of 1.71%. This property offers significant upside through retail development and leasing opportunities. Further contributing to the stability of the portfolio was the sale of ten non-‐core assets from our Initial Properties portfolio. From these sales, we realized $21.3 million in gross proceeds, which represented 103% of their fair value at the last reporting period prior to the sale. For 2015, we will continue to dispose of properties from our Initial Properties portfolio and redeploy the proceeds into newer multi-‐tenant properties located in major German office markets. The German economy continues to perform well with the German government estimating gross domestic product (“GDP”) growth to be 1.8% in 2015, up from 1.6% in 2014. In Q1, net absorption of office space was positive across the “Big 7” office markets and office vacancy rates declined. Strong economic growth should translate into robust demand for office space. We are excited about 2015 and feel we are well positioned to take advantage of our platform and portfolio. We will consider doing another joint venture to further monetize the value of our platform and within our Initial Properties portfolio there are many opportunities to create value through leasing and redevelopment. Dream Global REIT 2015 First Quarter Report | 3 BASIS OF PRESENTATION Our discussion and analysis of the financial position and results of operations of Dream Global Real Estate Investment Trust (“Dream Global REIT”, the “REIT” or the “Trust”) should be read in conjunction with the audited consolidated financial statements and unaudited interim condensed financial statements of the Trust for the periods ended December 31, 2014 and March 31, 2015, respectively. The Trust’s basis of financial reporting is International Financial Reporting Standards (“IFRS”). The REIT complies with IFRS 11, “Joint Arrangements”, and accounts for investments in joint ventures in its condensed consolidated financial statements using the equity method of accounting. All references herein to “consolidated” refer to amounts as reported under IFRS. For the purpose of this management’s discussion and analysis (“MD&A”), all references to “REIT’s Interest” or “Owned Share” refer to a non-‐GAAP financial measure representing Dream Global REIT’s proportionate share of the financial position and results of operations of its entire portfolio, including equity accounted investments under the assumption that all investments in joint ventures have been proportionately consolidated. For a reconciliation of the Trust’s results of operations and statement of financial position, please see “Non-‐GAAP measures and other disclosures” in this MD&A. This MD&A has been dated as at May 6, 2015. For simplicity, throughout this discussion, we may make reference to the following: • “Debentures”, meaning the 5.5% convertible unsecured subordinated debentures of the Trust due July 31, 2018; • “GLA”, meaning gross leasable area; • “GRI”, meaning gross rental income; • “Initial Properties”, meaning the income-‐producing properties we acquired on August 3, 2011; • “Acquisition Properties”, meaning the income-‐producing properties acquired subsequent to the Trust’s initial public offering on August 3, 2011; • “Units”, meaning the Units of the Trust; and • “POBA”, meaning Public Officials Benefit Association, a South Korean pension fund. Certain information has been obtained from CB Richard Ellis Germany (“CBRE”), Colliers International (“Colliers”) and Jones Lang LaSalle (“JLL”), commercial firms that provide information relating to the German real estate industry. Although we believe this information is reliable, the accuracy and completeness of this information is not guaranteed. We have not independently verified this information and make no representation as to its accuracy. When we use terms such as “we”, “us” and “our”, we are referring to the REIT and its subsidiaries. When we refer to Deutsche Post as being the lessee or the tenant of the Initial Properties, we are referring to Deutsche Post Immobilien GmbH (“DPI”), which is a wholly owned subsidiary of Deutsche Post. Deutsche Post has provided a letter of support with respect to DPI and its ability to carry out its obligations under leases for the Initial Properties. Market rents disclosed throughout the MD&A are management’s estimates and are based on current leasing fundamentals. The current estimated market rents are at a point in time and are subject to change based on future market conditions. In addition, certain disclosure incorporated by reference into this report includes information regarding our largest tenants that has been obtained from publicly available information. We have not independently verified any such information. Certain information herein contains or incorporates comments that constitute forward-‐looking information within the meaning of applicable securities legislation. Forward-‐looking information is based upon a number of assumptions and is subject to a number of risks and uncertainties, many of which are beyond Dream Global REIT’s control, which could cause actual results to differ materially from those that are disclosed in or implied by such forward-‐looking information. These risks and uncertainties include, but are not limited to, global and local economic, business and government conditions; the financial condition of tenants; concentration of our tenants; our ability to refinance maturing debt; leasing risks, including those associated with the ability to lease vacant space and the timing of lease terminations; our ability to source and complete accretive acquisitions; changes in tax and other laws or the application thereof; and interest and currency rate fluctuations. Dream Global REIT 2015 First Quarter Report | 4 Although the forward-‐looking statements contained in this management’s discussion and analysis are based upon what we believe are reasonable assumptions, there can be no assurance that actual results will be consistent with these forward-‐looking statements. Factors that could cause actual results to differ materially from those set forth in the forward-‐looking statements and information include, but are not limited to, general economic conditions; local real estate conditions, including the development of properties in close proximity to the Trust’s properties; timely leasing of vacant space and re-‐leasing of occupied space upon expiration; dependence on tenants’ financial condition; the uncertainties of acquisition activity; the ability to effectively integrate acquisitions; interest rates; availability of equity and debt financing; the Trust’s continued exemption from the specified investment flow-‐through trust (“SIFT”) rules under the Income Tax Act (Canada); and other risks and factors described from time to time in the documents filed by the Trust with securities regulators. All forward-‐looking information is as of May 6, 2015, except where otherwise noted. Dream Global REIT does not undertake to update any such forward-‐looking information whether as a result of new information, future events or otherwise, except as required by law. Additional information about these assumptions and risks and uncertainties is contained in our filings with securities regulators. These filings are also available on our website at www.dreamglobalreit.ca. BACKGROUND Dream Global REIT is an unincorporated, open-‐ended real estate investment trust that was formed to provide investors with the opportunity to invest in real estate exclusively outside of Canada. Dream Global REIT was founded by Dream Asset Management Corporation (“DAM”), a subsidiary of Dream Unlimited Corp. (TSX: DRM), which is our asset manager. Our Units are listed on the Toronto Stock Exchange under the trading symbol DRG.UN. As at March 31, 2015, our portfolio consisted of 237 properties comprising approximately 13.9 million square feet of GLA located in Germany, including eight properties held within a joint venture of which Dream Global REIT retained a 50% ownership interest and excluding 20 assets that are held for sale. We will be exempt from the SIFT rules, taking into account all proposed amendments to such rules, as long as we comply at all times with our investment guidelines which, among other things, only permit us to invest in properties or assets located outside of Canada. We do not rely on the REIT exception under the Income Tax Act (Canada) in order to be exempt from the SIFT rules. As a result, we are not subject to the same restrictions on our activities as those that apply to Canadian real estate investment trusts that do rely on the REIT exception. This gives us flexibility in terms of the nature and scope of our investments and other activities. Because we do not own taxable Canadian property, as defined in the Income Tax Act (Canada), we are not subject to restrictions on our ownership by non-‐Canadian investors. OUR OBJECTIVES We are committed to: • managing our investments to provide stable, sustainable and growing cash flows through investments in commercial real estate located outside of Canada. To date, 100% of our portfolio is located in Germany; • building a diversified portfolio of commercial properties; • capitalizing on internal growth and seeking accretive acquisition opportunities in our target markets; • increasing the value of our assets and maximizing the long-‐term value of our Units through the active and efficient management of our assets; and • providing predictable cash distributions per unit, on a tax-‐efficient basis. Dream Global REIT 2015 First Quarter Report | 5 Distributions We currently pay monthly distributions to unitholders of 6.667 cents per unit, or 80 cents per unit on an annual basis. At March 31, 2015, approximately 14.6% of our total Units were enrolled in the Distribution Reinvestment and Unit Purchase Plan (“DRIP”). Annualized distribution rate Monthly distribution rate Period-‐end closing unit price Annualized distribution yield on closing unit price $ $ $ March 31, 2014 2015 0.80 0.0667 9.84 8.13% $ $ $ 0.80 0.0667 9.28 8.62% $ $ $ December 31, 2014 2013 0.80 0.0667 8.57 9.33% $ $ $ 0.80 0.0667 8.42 9.50% $ $ $ September 30, 2014 2013 0.80 0.0667 9.08 8.81% $ $ $ 0.80 0.0667 9.41 8.50% $ $ $ 2014 0.80 0.0667 9.82 8.15% $ $ $ June 30, 2013 0.80 0.0667 9.94 8.05% OUR STRATEGY Our core strategy to meet our objectives includes the following: Optimizing the performance, value and long-‐term cash flow of our properties We manage our properties to optimize their performance, value and long-‐term cash flow. We seek to do this by achieving high occupancy and rental rates. Together with our management team in Canada, we also have an established management team in Germany and Luxembourg, bringing a history with our Initial Properties, deep market knowledge and established relationships with other market participants. Leasing, capital expenditure and construction initiatives are either internally managed or overseen by us, while property management services, including general maintenance, rent collection and administration of operating expenses and tenant leases, are carried out by third-‐party service providers under the oversight of our internal team. Diversifying our portfolio to mitigate risk We continuously seek to diversify our portfolio to increase value on a per unit basis, further improve the sustainability of our distributions and strengthen our tenant profile. We focus on adding high-‐quality tenants in the most desirable office markets in Germany in addition to increasing our overall asset base in the largest office markets in Germany. A key criterion when considering potential acquisitions is the multi-‐tenant nature of a property. Investing in stable income-‐producing properties outside of Canada When considering acquisition opportunities, we look for properties with quality tenancies and strong occupancy, and assess how acquisition opportunities complement our properties and have the potential to create additional value. In considering future acquisitions, we intend to focus on countries with a stable business and operating environment, a liquid market for real estate investments, a legal framework that provides adequate rights and protections for owners of property, and a manageable foreign investment regime. We will consider investment opportunities in income-‐producing properties that are accretive, provide stable, sustainable and growing cash flows, and enable us to realize synergies within our portfolio of properties. The execution of this strategy will be continuously reviewed and will also include dispositions of properties and optimizing our capital structure. Maintaining and strengthening a conservative financial profile We operate our investments in a disciplined manner, with a focus on financial analysis and balance sheet management to ensure we maintain a prudent capital structure and conservative financial profile. We intend to generate stable cash flows sufficient to fund our distributions while maintaining a conservative debt ratio. Our preference will be to stagger our debt maturities to mitigate our interest rate risk and limit refinancing exposure in any particular period. We have also implemented a foreign exchange hedging strategy to provide greater certainty regarding the payment of distributions to unitholders and interest to debenture holders. Dream Global REIT 2015 First Quarter Report | 6 OUR ASSETS Throughout this document, we make reference to the following two asset categories: Initial Properties As at March 31, 2015, this category included 207 properties (excluding assets held for sale). The assets can be characterized as national and regional administration offices, mixed use retail, banking and distribution properties, and regional logistics headquarters of Deutsche Post as well as other third-‐party tenants, including Postbank as well as municipal and state government agencies. The properties are generally strategically located near central train stations and main retail areas and are easily accessible by public transportation. Acquisition Properties As at March 31, 2015, this category included 30 office properties, which were acquired since the beginning of 2012. These properties are high-‐quality, multi-‐tenant office buildings located in Germany’s largest office markets and are generally newer or recently refurbished buildings. A 50% interest in eight of the 30 properties was sold in Q4 2014 and Q1 2015. These assets are now jointly owned with POBA, a South Korean pension fund. The majority of our portfolio is concentrated in Germany’s largest office markets: (1) Geographic composition of portfolio Berlin Cologne Düsseldorf Frankfurt Hamburg Hannover Munich Nuremberg Stuttgart Other Total (1) Reflects the REIT’s Owned Share basis. Total GLA (sq. ft.) 437,957 985,362 1,712,535 1,162,142 1,629,544 614,191 552,753 605,751 521,526 5,641,643 13,863,404 Dream Global REIT 2015 First Quarter Report | 7 Total GLA (%) 3 7 12 9 12 4 4 4 4 41 100 Total GRI (%) 4 11 14 9 19 3 7 6 5 22 100 TENANTS Through our active acquisitions, dispositions and leasing program, we continue to focus on the diversification of our tenant base. The table below highlights the diversification away from the single-‐tenant nature of our Initial Properties. At the end of Q1 2015, Deutsche Post’s GRI was approximately 26.3% of the Trust’s overall occupied and committed GRI, down from 29.5% at the end of 2014. Tenant composition Total annualized GRI (%) Deutsche Post Freshfields Bruckhaus Deringer ERGO Direkt Lebensversicherungs AG Imtech Deutschland GmbH & Co. KG Deutsche Rentenversicherung Knappschaft Bahn-‐See BNP Paribas Fortis SA/NV Deutsche Postbank AG CinemaxX Entertainment GmbH & Co. KG Google Germany GmbH Maersk Deutschland A/S & Co. KG Other third-‐party tenants Total 26.3 3.5 3.1 2.5 2.1 2.0 1.7 1.6 1.3 1.3 54.6 100.0 (1) Reflects the REIT’s Owned Share. (2) Source: Standard & Poor’s, Fitch (3) n/a means not applicable. (1) Credit rating (2)(3) BBB+ n/a AA-‐ n/a n/a A+ A+ n/a AA BBB+ n/a Deutsche Post Deutsche Post is an integral part of the German economy and continues to be an important part of day-‐to-‐day life in Germany. Through its acquisition of DHL in 2002, Deutsche Post DHL has become a global logistics market leader. It employs (1) approximately 480,000 people in more than 220 countries and territories. As the only provider of universal postal services in Germany, Deutsche Post must provide certain minimum levels of service to German residents. Some of the space leased to Deutsche Post is occupied by Postbank, a public company controlled by Deutsche Bank and integral to its retail banking business. Postbank offers retail financial services in its branches within Deutsche Post’s network, which generates increased traffic through the postal services offered in those branches. As at March 31, 2015, our portfolio featured approximately 144 Postbank branches, allowing for the delivery of integrated financial and postal services. Leases for 38 Postbank branches are direct leases. Postbank branches are typically located at ground level with a view to attracting a high volume of retail and business customers seeking financial or postal services. Freshfields Bruckhaus Deringer (“Freshfields”) Freshfields is the second largest tenant in our portfolio as measured by GRI. Freshfields is an international law firm with offices (2) in Europe, Asia, North America and the Middle East. Freshfields occupies 71% of the space in our property located at Feldmühleplatz 1 and generated approximately 3.5% of the REIT’s overall GRI as at March 31, 2015. ERGO Direkt Lebensversicherungs AG (“ERGO”) ERGO is the third largest tenant in our portfolio as measured by GRI. With approximately 46,000 employees in over (3) 30 countries, ERGO is one of the largest insurance companies in Germany. ERGO, which belongs to the Munich RE group of companies, occupies the entire space in our property located at Karl-‐Martell-‐Strasse 60 in Nuremberg, and generated approximately 3.1% of the REIT’s overall GRI as at March 31, 2015. Imtech Deutschland GmbH & Co. KG (“Imtech”) Imtech Germany & Eastern Europe is a leader in the energy and technical building equipment sector in Germany, Poland, Austria, Hungary, Romania, Russia and Switzerland. Imtech Germany & Eastern Europe employs approximately 5,000 people (4) and is part of the Royal Imtech N.V. Group, which is based in the Netherlands and employs approximately 23,000 people. This tenant occupies the entire space in our property located at Hammer Strasse 30-‐34 in Hamburg, which is Imtech’s German head office, and generated approximately 2.5% of the REIT’s overall GRI as at March 31, 2015. Dream Global REIT 2015 First Quarter Report | 8 Deutsche Rentenversicherung Knappschaft Bahn-‐See (“Deutsche Rentenversicherung”) Deutsche Rentenversicherung is Germany’s state pension fund, covering approximately 52.7 million people. About €259 billion (5) was paid to recipients in 2013 alone. Deutsche Rentenversicherung occupies approximately 38% of the space in our property located at Millerntorplatz 1 in Hamburg, and generated approximately 2.1% of the REIT’s overall GRI as at March 31, 2015. BNP Paribas Fortis SA/NV (“BNP Paribas Fortis”) BNP Paribas Fortis is a financial services provider, offering services to private and professional clients, corporate clients and public entities through a number of networks. The company is owned approximately 75% by the BNP Paribas Group and 25% by (6) the Belgian State. BNP Paribas Fortis occupies approximately 55% of the space in Cäcilienkloster in Cologne as well as 8% in Z-‐UP in Stuttgart and generated approximately 2.0% of the REIT’s overall GRI as at March 31, 2015. Deutsche Postbank AG (“Postbank”) Postbank is one of Germany’s largest financial service providers, with approximately 14 million clients, 14,900 employees and total assets of approximately €158 billion. Postbank mainly focuses on private customers and small to medium-‐sized companies and has the densest branch network of any bank in Germany with 1,100 of its own branches and 4,500 Deutsche Post partner (7) branches, as well as 700 Postbank advisory centres. As at March 31, 2015, Postbank generated approximately 1.7% of the REIT’s overall GRI. CinemaxX Entertainment GmbH & Co. KG (“CinemaxX”) CinemaxX is a well-‐known cinema chain in Germany and Denmark with 33 cinemas and 2,000 employees in these (8) two countries. CinemaxX occupies approximately 62% of the GLA in our property located at Bertoldstrasse 48/Sedanstrasse 7 in Freiburg and generated approximately 1.6% of the REIT’s overall GRI as at March 31, 2015. Google Germany GmbH (“Google”) Google is an American multinational corporation specializing in internet-‐related services and products and employs over (9) 40,000 people worldwide. Google Hamburg is the company’s commercial headquarters for Germany, Austria, Switzerland and the Nordics and occupies approximately 75% of the GLA in ABC Bogen, our property located in the heart of Hamburg at ABC Strasse 19. Google generated approximately 1.3% of the REIT’s overall GRI as at March 31, 2015. Maersk Deutschland A/S & Co. KG (“Maersk”) Maersk is one of the world’s largest shipping companies and operates in approximately 130 countries. Through its various (10) divisions, the group employs approximately 89,000 people and generated over US$47 billion in revenues in 2013. Maersk occupies approximately 61% of the GLA in Humboldt House, our property located at Am Sandtorkai 37 in Hamburg. Maersk generated approximately 1.3% of the REIT’s overall GRI as at March 31, 2015. (1) (2) (3) (4) (5) (6) (7) (8) (9) (10) As disclosed at Deutsche Post DHL’s website at www.dpdhl.com As disclosed at Freshfields’ website at www.freshfields.com As disclosed at ERGO’s website at www.ergo.com As disclosed at Imtech’s website at www.imtech.de As disclosed at Deutsche Rentenversicherung’s website at www.deutsche-‐rentenversicherung.de As disclosed at BNP Paribas’ website at www.bnpparibas.com As disclosed at Deutsche Postbank AG’s website at www.postbank.com As disclosed at CinemaxX’s website at www.cinemaxx.com As disclosed at Google’s website at www.google.com and www.google.ca/about/jobs/locations/hamburg As disclosed at Maersk’s website at www.maersk.com MARKET OVERVIEW – GERMANY German economy The German economy has established itself as a key location for production sites and is a country with a favourable business environment. Similar to Canada, Germany is a country with a history of political, legal and financial stability and provides an attractive climate for long-‐term investment. Dream Global REIT 2015 First Quarter Report | 9 Recent developments Overall, the German economy continues to be the main driving force of Europe and was ranked as one of the highest-‐growth (1) (2) countries in Europe at the beginning of 2015. Germany’s labour market is very robust and its unemployment rate at 5.3% at the end of February 2015 remains among the lowest in the European Union. The German government revised its current gross domestic product (“GDP”) outlook for 2015 upwards to 1.8%, largely due to strong export and increased consumer spending. Economic impact on the German real estate sector Germany remains one of the most highly sought-‐after real estate investment markets in Europe, benefiting from strong local and international investor demand. During the first three months of 2015, the total investment volume for commercial real (3) estate reached €9.5 billion. International investors continued to show a strong interest in the German commercial real estate market with a market share of more than 50%. Of the ten largest transactions during the quarter, seven were carried out by (3) foreign investors. The share of single-‐asset transactions increased drastically in Q1 to approximately 70% of all transactions (3) completed. (3) The office sector remains the dominant asset class, with 45% of all transactions in Q1 2015 taking place in this category. In (3) total, approximately €4.3 billion was invested in German office properties during Q1 2015. The underlying fundamentals in the office sector remain strong with overall net absorption of office space continuing to be positive across the “Big 7” office markets. Vacancy rates in all seven major real estate markets reached record lows at the end (1) of Q1 2015 with overall office vacancies declining by 10 basis points since the end of 2014 to 7.5% at March 31, 2015. (1) JLL Office Market Overview Q1 2015 (2) ILO labour market statistics overview, Destatis – Germany’s Federal Statistical Office (3) JLL Investment Market Overview Q1 2015 SECTION II – EXECUTING THE STRATEGY OUR OPERATIONS Occupancy Overall in-‐place and committed occupancy was 86.0% at March 31, 2015, an increase of 70 basis points quarter-‐over-‐quarter from 85.3% at the end of 2014. Occupancy in our Initial Properties increased from 80.1% at the end of 2014 to 80.9% at the end of Q1 2015, primarily due to the removal of vacancy pertaining to properties that were sold but have not closed at the end of the quarter. These properties are classified under “Assets held for sale” in the condensed consolidated financial statements and have been removed from our property level metrics disclosed under “Our Operations”, including occupancy and vacancy rates, lease maturities, weighted average remaining lease term (“WALT”) and rental rates. Occupancy in our Acquisition Properties decreased from 97.9% at the end of 2014 to 96.1% at March 31, 2015, reflecting the addition of Millerntorplatz 1, our newest acquisition completed in Q1 2015 with an occupancy rate below the average rate in our Acquisitions Properties portfolio, as well as anticipated lease expiries during Q1 2015. The table below details the percentage of occupied and committed space for the total portfolio as well as the comparative portfolio. The comparative portfolio comprises properties owned by the Trust at December 31, 2014 and March 31, 2015, and excludes properties that were acquired or sold during the first quarter of 2015. Portfolio (%) Initial Properties Acquisition Properties(2) Total March 31, 2015 80.9 (1) 96.1 86.0 Total portfolio December 31, 2014 80.1 97.9 85.3 Comparative portfolio December 31, 2014 81.9 (1) 98.2 87.0 March 31, 2015 (1) 80.9 96.8 85.9 (1) Occupancy excludes properties held for sale. Excluding these properties resulted in a 300 basis point increase in our Initial Properties occupancy as at March 31, 2015. (2) Reflects the REIT’s Owned Share. Dream Global REIT 2015 First Quarter Report | 10 Vacancy schedule The table below highlights our leasing activity for the three months ended March 31, 2015. During Q1 2015, our overall space available for lease decreased by approximately 236,000 square feet. The decrease in vacancy was largely the result of the reclassification of 20 assets from our Initial Properties portfolio to properties held for sale, while expiry of short-‐term lease extensions in connection with Deutsche Post’s 2014 terminated space increased vacancy. In our Acquisitions Properties portfolio, an anticipated 40,000 square foot lease expiry in Q1 2015 increased vacancy. Overall, we maintained a high retention rate of 67% across the entire portfolio in Q1 2015. For the three months ended March 31, 2015 (in square feet) Initial Properties Acquisition Properties(1) Available for lease – January 1, 2015 Change in vacancy due to acquisitions Change in vacancy due to dispositions(2) Assets held for sale Remeasurements Subtotal – Available for lease Expiries(3) Early termination and bankruptcies Deutsche Post extension expiries New leases Renewals Future leases for the period 2,085,616 -‐ (55,763) (354,365) (10,923) 1,664,565 80,628 -‐ 105,515 (19,339) (64,885) (4,811) 93,521 47,089 (16,032) -‐ 505 125,083 152,083 15,819 -‐ (2,386) (79,083) (30,339) Available for lease – March 31, 2015 1,761,673 181,177 Total 2,179,137 47,089 (71,795) (354,365) (10,418) 1,789,648 232,711 15,819 105,515 (21,725) (143,968) (35,150) 1,942,850 (1) Reflects the REIT’s Owned Share. (2) The reduction in vacancy in our Acquisition Properties resulted from the sale of a 50% interest in eight properties to POBA. (3) Expiries pertaining to Acquisition Properties include 16,285 square feet of space subject to a head lease. As we lease this space, it is reflected under both expiries and new leases and therefore is not factored into the calculation of the retention ratio. Dream Global REIT 2015 First Quarter Report | 11 The table below highlights our occupancy, leasing activity and rental rates for the last eight quarters. Committed occupancy includes in-‐place occupancy as well as space for which leases have been signed but do not commence until a future quarter. Occupancy Q2 2014 Q1 2014 Q4 2013 Q3 2013 Q2 2013 11,920,554 12,660,524 13,788,078 13,787,918 13,874,523 13,577,298 13,403,456 13,205,395 85.3% 87.1% 87.9% 87.7% 86.4% 86.2% 85.7% 11,867,554 12,568,632 13,603,696 13,644,620 13,753,248 13,496,358 13,183,857 13,010,931 84.7% 85.9% 87.0% 86.9% 85.9% 84.8% 84.5% (232,711) (210,323) (203,087) (175,716) (113,105) (168,754) (130,075) (89,824) (15,819) (18,214) (38,709) (8,908) (24,143) (2,489) (22,021) (7,418) 21,725 143,968 37,589 153,804 89,075 143,271 21,370 133,149 46,185 52,633 35,285 115,914 51,992 111,609 36,689 75,373 35,150 31,773 101,670 68,328 142,236 30,840 60,250 98,003 (47,687) -‐ (5,371) (99,214) 92,220 (1,756,589) 38,223 -‐ 103,806 -‐ 10,796 -‐ 71,755 (22,021) 112,823 -‐ (105,515) (231,311) -‐ -‐ -‐ -‐ -‐ -‐ -‐ (153,202) 99,214 (236,682) 1,492,986 (171,383) -‐ 38,223 -‐ 103,806 -‐ 10,796 -‐ 49,734 -‐ 112,823 €9.26 €8.86 €8.90 €8.74 €8.72 €8.46 €8.17 €8.14 4.5% (0.4)% 1.8% 0.3% 3.0% 3.5% 0.4% 3.5% In-‐place occupancy 85.6% Leasing activity Net leasing absorption (before DP terminations) Deutsche Post terminations Expiries of Deutsche Post extensions Deutsche Post/Postbank renewals and extensions Net leasing absorption Average in-‐place rent (€/sq. ft./year) % change Q3 2014 Future leases In-‐place occupancy (square feet) New leases Renewals (1) Committed occupancy Expiries Early termination and bankruptcies Q4 2014 Committed occupancy (square feet) Q1 2015 (1)(2) 86.0% (1) Reflects the REIT’s Owned Share. (2) Excludes properties held for sale. In-‐place rental rates In-‐place rents have increased from approximately €8.86 per square foot/year at December 31, 2014 to approximately €9.26 per square foot/year at March 31, 2015, reflecting higher in-‐place rents in the Acquisition Properties as well as higher rents on renewals and new leases. The majority of the leases in the Acquisition Properties portfolio include rent adjustment clauses linked to an increase in the consumer price index (“CPI”). Overall, average market rents remain above in-‐place rents as at March 31, 2015. For the quarter ended on March 31, 2015, the spread between in-‐place rents and market rents was 3.3%. The difference between in-‐place rents and market rents in our Initial Properties is approximately 14.0%, allowing for rental rate growth in this segment of our portfolio, which has approximately 1.8 million square feet of vacancy as at March 31, 2015. For certain Acquisition Properties, where in-‐place rents exceeded market rents, the purchase price was adjusted to reflect such above-‐market rents. The gap between market and in-‐place rental rates is narrowing, reflecting the underlying market conditions, a trend which is expected to continue. The weighted average remaining lease term is 5.3 years for this category of assets, which allows for sufficient time for market rents to increase. Dream Global REIT 2015 First Quarter Report | 12 The table below provides a comparison between in-‐place rents and market rents in our portfolio as at March 31, 2015. In $ (as at March 31, 2015) In-‐place rent Market rent $ 7.18 $ 8.31 7.92 8.63 7.36 8.39 21.48 20.87 $ 12.62 $ 13.04 (per square foot/year) Initial Properties – Deutsche Post Initial Properties – third party Total Initial Properties(1) Acquisition Properties(2) Overall In € (as at March 31, 2015) In-‐place rent Market rent € 5.27 € 6.10 5.81 6.33 5.40 6.16 15.77 15.32 € 9.26 € 9.57 % of market rents above (below) in-‐place rents 15.7 8.9 14.0 (2.9) 3.3 (1) Excludes properties held for sale. (2) Reflects the REIT’s Owned Share. Market rent represents management’s best estimate of the net rental rate that would be achieved in the event that a unit becomes vacant in a new arm’s length lease after a reasonable marketing period with an inducement and lease term appropriate for the particular space. Market rent by property is determined on a quarterly basis by our leasing and portfolio management teams. The basis of calculating market rents depends on leasing deals that are completed for similar space in comparable properties in the area. Market rents may differ by property or by unit within the property and depend upon a number of factors. Some of the factors include the condition of the space, the location within the building, the extent of office build-‐out for the units, appropriate lease term and normal tenant inducements. Market rental rates are also compared against the external appraisal information that is gathered on a quarterly basis, as well as other external market data sources. At March 31, 2015, the WALT of all leases was approximately 4.4 years. WALT at March 31, 2015 (years) (1) Initial Properties – Deutsche Post Initial Properties – third party WALT at December 31, 2014 3.4 5.4 3.5 5.4 Total Initial Properties Acquisition Properties(3) 3.9 5.3 3.9 5.3 Overall 4.4 4.4 (2) (1) For the purpose of calculating WALT, month-‐to-‐month leases are reflected as leases with a one-‐year term. (2) Excludes properties held for sale. (3) Reflects the REIT’s Owned Share. Leasing and tenant profile Lease rollover profile The following table outlines our lease maturity profile by asset type as at March 31, 2015. Our lease maturity profile remains staggered with less than 13% (excluding space leased on a month-‐to-‐month basis) of our portfolio expiring prior to 2018. (in square feet) Initial Properties Acquisition Properties Total Total (%) Current Month-‐to-‐ vacancy month 2015 2016 2017 2018 2019 to 2039 1,761,673 339,922 178,592 166,073 174,373 4,676,290 1,945,388 9,242,311 181,177 43,228 1,942,850 383,150 14.0% 2.8% 147,685 326,277 2.4% 550,169 716,242 5.1% 540,261 714,634 5.2% 290,621 4,966,911 35.8% 2,867,952 4,813,340 34.7% 4,621,093 13,863,404 100% Dream Global REIT 2015 First Quarter Report | 13 Total Deutsche Post leases The leases with Deutsche Post, which generally expire on June 30, 2018 (many of which provide Deutsche Post with an option to extend the term until June 30, 2023) and contractual extensions described below, comprise approximately 41% of the portfolio’s GLA and account for approximately 26.3% of the portfolio’s GRI. Below is a detailed expiry schedule for all Deutsche Post leases within our Initial Properties: Total GLA (sq. ft.) Deutsche Post lease expiries Q2 2015 Q3 2015 Q4 2015 Total near-‐term lease expiries 2016 2017 (1) 2018 2019 2020 2023 45,069 13,307 -‐ 58,376 -‐ 29,145 4,614,121 662,915 325,026 5,745 Total Deutsche Post lease expiries 5,695,328 (1) Subject to lease extensions. Rent adjustment The rents under the Deutsche Post leases are subject to automatic adjustments (up or down) in relation to the German CPI. If the CPI for Germany changes by more than 4.3 index points as compared to the index at the commencement of the applicable lease or the previous rent adjustment, the rent payable under the Deutsche Post leases is automatically adjusted by 100% of the index change, with effect as of the time of the index change. Based on the index at the last CPI adjustment date, the index will have to exceed 107.2 index points before the next adjustment will become effective. CPI numbers from March 2015 indicate that the CPI has reached 107.0 index points. Termination rights and head lease In general, the Deutsche Post leases have a fixed term of ten years, expiring on June 30, 2018. These leases entitle Deutsche Post to terminate space in 2012, 2014 and 2016, subject to certain limitations and requirements. The rights of Deutsche Post to terminate a lease are limited by various tests that apply collectively to the Deutsche Post leases and the leases in respect of the remaining properties forming the portfolio that the vendor acquired from Deutsche Post in July 2008 (the “Caroline DP Leases”), considered as a whole. Deutsche Post exercised or waived their termination rights with respect to 2012 and 2014. In addition, by June 30, 2017, Deutsche Post is required to provide the REIT with a list of Deutsche Post leases and/or Caroline DP Leases for which the term of such lease shall be extended for two additional years. This list must amount to at least 33.33% of the total reference rent of all Deutsche Post leases and Caroline DP Leases, considered as a whole, which at the beginning of the lease had no termination options. With the contractual extension, the Trust will receive a continuation of income of at least 15% pertaining to the Deutsche Post leases that are scheduled to expire in 2018 for the additional two years. 2012 termination rights One of the opportunities that Deutsche Post terminations afforded the REIT is the ability to take advantage of the large blocks of contiguous vacant space that the tenant left, making the terminated space more attractive for re-‐leasing to some prospective tenants. When combined with higher rents that we generally achieve on the terminated space, we see this reflected in the overall performance of the terminated properties. Through our leasing efforts, as of March 31, 2015, we have been able to (1) successfully replace approximately 76% of the GRI generated by the terminated properties prior to the 2012 terminations. (1) Compared to GRI of the terminated properties as of Q2 2012, excluding properties sold or held for sale. GRI as of March 31, 2015 includes in-‐place leases and leases committed for future occupancy. Dream Global REIT 2015 First Quarter Report | 14 2014 termination rights On July 1, 2014, Deutsche Post terminated a total of approximately 1,757,000 square feet of space, of which approximately 1,493,000 square feet were either extended by Deutsche Post or re-‐leased to Postbank. Of the 1,493,000 square feet, approximately 812,000 square feet will not expire until 2019 or later. Through our efforts in negotiating lease extensions with Deutsche Post, as well as third-‐party leases for 2014 terminated (1) buildings, we have been able to replace approximately 77% of the GRI generated from the 2014 terminated properties as at March 31, 2015. (1) Compared to GRI of the terminated properties as of Q2 2014, excluding properties sold or held for sale. GRI as of March 31, 2015 includes in-‐place leases and leases committed for future occupancy. 2016 termination rights Excluding dispositions and early renewals, Deutsche Post has the right to terminate up to approximately 408,000 square feet effective as at June 30, 2016. Due to our active disposition program, the amount of space subject to Deutsche Post’s 2016 termination right was reduced by 76,000 square feet during Q1 2015. OUR RESOURCES AND FINANCIAL CONDITION Investment properties As at March 31, 2015, the value of our investment property portfolio was $2.1 billion (December 31, 2014 – $2.1 billion). The REIT’s management is responsible for determining fair value measurements included in the condensed consolidated financial statements, including fair values of investment properties, which are valued on a highest-‐and-‐best-‐use basis. Fair values for investment properties are calculated using both the direct income capitalization and discounted cash flow (“DCF”) methods. The results of both methods are evaluated by considering the reasonableness of the range of values calculated under both methods. Fair value of a property is determined at the point within that range that is most representative of the fair value in the circumstances. Changes in the value of our investment properties for the three months ended March 31, 2015 and for the year ended December 31, 2014 are summarized in the table below as follows: Balance at beginning of period Additions Acquisitions Building improvements Lease incentives and initial direct leasing costs Amortization of lease incentives Disposals (Initial Properties) Reclassified to assets held for sale POBA joint venture assets reclassified to assets held for sale Fair value adjustments Transaction and other costs related to acquisition Foreign currency translation Balance at end of period (per condensed consolidated financial statements) $ $ Dream Global REIT 2015 First Quarter Report | 15 For the three months ended March 31, 2015 For the year ended December 31, 2014 2,079,671 2,390,244 $ 143,691 2,580 3,216 (512) (142) (23,511) (69,368) 14,444 (7,523) (63,106) 2,079,440 $ 422,166 12,730 14,908 (1,458) (144) (161,174) (573,521) 97,505 (20,866) (100,719) 2,079,671 Investment properties held for sale For the three months ended March 31, 2015 For the year ended December 31, 2014 $ $ $ $ Balance at beginning of period Building improvements Lease incentives and initial direct leasing costs Investment properties reclassified as held for sale Investment properties reclassified as held for sale – POBA joint venture asset Fair value adjustments Disposals Disposals – POBA joint venture asset Foreign currency translation Balance at end of period 42,897 49 -‐ 23,511 69,368 819 (21,202) (69,368) (1,179) 44,895 21,147 11 (131) 161,174 573,521 (4,392) (130,746) (573,521) (4,166) 42,897 During the three months ended March 31, 2015, one Acquisition Property was reclassified as assets held for sale and then subsequently sold to POBA at a fair value of $69.4 million, with the REIT retaining a 50% interest. In addition, we reclassified other properties from the Initial Properties valued at $23.5 million as assets held for sale. We acquired one property during Q1, valued at $143.7 million (including transaction costs). During the three months ended March 31, 2015, due primarily to capitalization rate (“cap rate”) compression, the fair value of the Acquisition Properties increased by $14.4 million. Due to depreciation of the Canadian dollar against the euro since December 31, 2014, the investment property value decreased by $63.1 million, representing an unrealized foreign exchange loss. Acquisitions During the three months ended March 31, 2015, we completed the following acquisitions: Acquired GLA (sq. ft.) Office property Millerntorplatz 1, Hamburg Total Occupancy at acquisition (%) 374,477 374,477 (1) Purchase price 88 $ 88 $ 136,136 136,136 Date acquired February 6, 2015 (1) Excludes transaction costs of $7.6 million. Dispositions The REIT completed the sale of ten properties, excluding a 50% interest in one property sold to POBA, during the three months ended March 31, 2015, for an aggregate gross sales price of approximately $21.3 million, which represented 103% of their fair value at the last reporting period prior to sale. A portion of the net proceeds of $15.5 million was used to reduce our term loan credit facility. Nine of the assets sold were reclassified as assets held for sale at December 31, 2014. As of March 31, 2015, we have also entered into agreements to dispose of an additional 17 properties, bringing the total number of properties under contract for sale to 20, with a total fair value of $44.9 million. As at the quarter ended March 31, 2015, these properties were reclassified as assets held for sale on the balance sheet and excluded from the value of investment properties, as the REIT has committed to a plan of sale for these investment properties. In total, we realized a fair value gain of $0.8 million on these properties and dispositions. Building improvements Building improvements represent investments made in our investment properties to ensure our buildings are operating at an optimal level. During the three months ended March 31, 2015, we spent $2.6 million on building improvements. In general, building improvements are non-‐recoverable from the tenants unless specifically provided for in the lease agreement. Dream Global REIT 2015 First Quarter Report | 16 Initial direct leasing costs and lease incentives Initial direct leasing costs include external leasing fees and related costs, and broker commissions incurred in negotiating and arranging tenant leases. Lease incentives include costs incurred to make leasehold improvements to tenant spaces and cash allowances. Initial direct leasing costs and lease incentives are dependent on asset type, lease terminations and expiries, the mix of new leasing activity compared to renewals, portfolio growth and general market conditions. Short-‐term leases generally have lower costs than long-‐term leases. During the three months ended March 31, 2015, we incurred $3.2 million of lease incentives and initial direct leasing costs. As at March 31, 2015, we had outstanding initial direct leasing cost commitments of $2.1 million, for lease terms in excess of ten years on average. Investment in joint ventures As at March 31, 2015, the value of the investment in joint ventures was $179.1 million (December 31, 2014 – $160.0 million). The Trust participates in partnerships (“joint ventures”) with other parties that own investment properties and accounts for its interests using the equity method in the condensed consolidated financial statements. The discussion of our operations includes our share of the joint ventures. Refer to the section “Non-‐GAAP measures and other disclosures” for a reconciliation to the condensed consolidated financial statements. Name Location POBA joint venture Löwenkontor Vordernbergstrasse 6/Heilbronner Strasse 35 (Z-‐UP) Speicherstrasse 55 (Werfthaus) Derendorfer Allee 4–4a (doubleU) Neue Mainzer Strasse 28 (K26) ABC-‐Strasse 19 (ABC Bogen) Marsstrasse 20–22 Liebknechtstr. 33/35, Heßbrühlstr. 7 (Officium) Berlin, Germany Stuttgart, Germany Frankfurt, Germany Düsseldorf, Germany Frankfurt, Germany Hamburg, Germany Munich, Germany Stuttgart, Germany Ownership interest (%) March 31, December 31, 2015 2014 50 50 50 50 50 50 50 50 50 50 50 50 50 50 50 100 During Q1 2015, the REIT entered into another joint venture agreement with POBA to sell a 50% interest in an Acquisition Property that was held in a separate subsidiary. Altogether, the REIT now has a total of eight Acquisition Properties under this arrangement. The closing of this property was completed at the end of January 2015. As a result, an Acquisition Property valued at $69.4 million and the related mortgage valued at $40.7 million were derecognized as at March 31, 2015. The total consideration to the REIT for the 50% interest in the investment property was $36.8 million. The consideration consisted of the assumption of working capital of $0.1 million and POBA assuming 50% of the outstanding mortgage, which totalled $20.3 million, with the balance of $16.3 million paid to the REIT in cash. The REIT incurred transaction costs of $0.2 million relating to the sale, resulting in net proceeds to the REIT of $16.1 million. The REIT recorded a gain on the sale of $2.0 million, including $0.4 million of deferred tax gain. During the three months ended March 31, 2015, due primarily to cap rate compression, the fair value of the investment properties held by the joint venture increased in fair value by $16.6 million. The REIT’s 50% share of this increase was $8.3 million, which is reflected in the investment in joint ventures as at March 31, 2015. During Q1 2015, the REIT recorded fee income relating to the POBA joint venture of $0.7 million (three months ended March 31, 2014 – nil), which is included in interest and other income. The investment properties that the joint ventures hold are consistent in terms of the class and type of properties held in the Trust’s portfolio. Dream Global REIT 2015 First Quarter Report | 17 OUR CAPITAL Liquidity and capital resources Dream Global REIT’s primary sources of capital are cash generated from operating activities, a credit facility, mortgage financing and equity and debt issues. Our primary uses of capital include the payment of distributions, costs of attracting and retaining tenants, recurring property maintenance, major property improvements, debt amortization and interest payments, and property acquisitions. We expect to meet all of our ongoing obligations through current cash and cash equivalents, cash generated from (utilized in) operating activities, available credit facilities, debt refinancings and, as growth requires and when appropriate, new equity or debt issues. In our condensed consolidated financial statements, our current liabilities exceed our current assets by $28.6 million. The main contributor to the shortfall, which resulted in an increase in current liabilities, was the current portion of the term loan credit facility associated with the assets held for sale at March 31, 2015. The total amount of $36.0 million will be paid out of the proceeds when the respective asset sales close. Generally, working capital balance fluctuates significantly from period to period depending on the timing of receipts and payments. The accounts payable outstanding at the end of any reporting period depends primarily on the timing of leasing costs and capital expenditures incurred, as well as the impact of transaction costs incurred on any acquisitions completed during the reporting period. As at March 31, 2015, we had $67.9 million of cash on hand. After reserving for current payables and operating requirements, approximately $30.0 million is available for general purposes. Our debt-‐to-‐book value net of cash, at March 31, 2015, is 52%. Excluding cash and convertible debentures, our debt-‐to-‐book value is 46%. Debt March 31, Total debt Less debt related to: Investment in joint ventures Debt (per condensed consolidated financial statements) Mortgage debt Less mortgage debt related to: Investment in joint ventures Mortgage debt (per condensed consolidated financial statements) $ $ $ $ 2015 1,387,329 166,576 1,220,753 March 31, 2015 888,500 166,576 721,924 December 31, 2014 $ 1,381,132 152,736 $ 1,228,396 December 31, 2014 $ 854,061 152,736 $ 701,325 Debt strategy Our debt strategy is to obtain secured mortgage financing on a fixed rate basis, with a term to maturity that is appropriate in relation to the lease maturity profile of our portfolio. Our preference is to have staggered debt maturities to mitigate interest rate risk and limit refinancing exposure in any particular period. We also intend to enter into long-‐term loans at fixed rates when borrowing conditions are favourable. This strategy will be complemented with the use of unsecured convertible debentures and floating rate credit facilities. We operate within a targeted debt-‐to-‐book value range of 50% to 60% (net of cash). The increase in the debt-‐to-‐book value ratio at March 31, 2015 compared to December 31, 2014 reflects the decrease in cash on hand used to fund the Millerntorplatz 1 acquisition in February as well as the new debt associated with that property. Dream Global REIT 2015 First Quarter Report | 18 The key performance indicators in the management of our debt are as follows: For the three months ended Financing activities (1)(2) Weighted average interest rate (2) Weighted average effective rate (2)(3) Level of debt (debt-‐to-‐book value, net of cash, net of convertible debentures) (2)(3) Level of debt (debt-‐to-‐book value, net of cash) (2)(3) Interest coverage ratio (2)(3)(4) Debt-‐to-‐adjusted EBITDFV (years) (2) Proportion of total debt due in current year (2) Debt – average term to maturity (years) (2) Variable rate debt as percentage of total debt For the year ended March 31, December 31, 2015 2014 3.10% 3.44% 46% 52% 3.02 times 10.5 4.4% 4.6 (5) n/a 3.23% 3.54% 45% 51% 3.26 times 9.2 5.3% 4.3 1% (1) Weighted average interest rate is calculated as the weighted average face rate of all interest bearing debt. (2) Reflects the REIT’s Owned Share. (3) Level of debt, interest coverage ratio and debt-‐to-‐adjusted EBITDFV are non-‐GAAP measures. Calculations for each reconciled to IFRS balances can be found under “Non-‐GAAP measures and other disclosures”. (4) Calculated as total debt divided by adjusted EBITDFV. (5) n/a means not applicable. We currently use cash flow performance and debt level indicators to assess our ability to meet our financing obligations. Our current interest coverage ratio for the first quarter is 3.02 times and reflects our ability to cover interest expense requirements. We also monitor our debt-‐to-‐adjusted EBITDFV ratio to gauge our ability to pay off existing debt. Our current debt-‐to-‐adjusted EBITDFV ratio is 10.5 years, and reflects the approximate amount of time to pay off all debt from operating cash flows. Financing activities We finance our ownership of assets using equity as well as conventional mortgage financing, term debt, floating rate credit facilities and convertible debentures. New debt During the three months ended March 31, 2015, we obtained the following new mortgage: Property Millerntorplatz 1, Hamburg Total $ $ Mortgage ($000s) Mortgage (€000s) Face rate Date of funding Date of maturity 84,283 € 84,283 € 59,400 59,400 1.71% February 6, 2015 February 6, 2025 On February 6, 2015, the Trust drew on a mortgage with a principal balance of $84.3 million (€59.4 million) at a fixed rate of 1.71% per annum, maturing on February 6, 2025, in connection with the acquisition of Millerntorplatz 1, in Hamburg. During the first quarter of 2015, the REIT sold a 50% interest in an additional Acquisition Property as part of a joint venture agreement with POBA. In conjunction with this sale, $40.7 million of the mortgage debt relating to the asset was assumed by the joint venture (net of deferred financing costs – $40.2 million). As the REIT retained a 50% interest in the POBA joint venture, the REIT in total owed a $166.6 million mortgage debt through its obligations in the joint venture investments. Dream Global REIT 2015 First Quarter Report | 19 Debt composition (1) Term loan credit facility (1)(3) Mortgage debt (1) Debentures Total Percentage Fixed $ $ 345,931 $ 888,500 152,898 1,387,329 $ 100% (2) March 31, 2015 Total 345,931 888,500 152,898 1,387,329 100% $ $ Variable 7,957 -‐ -‐ 7,957 1% $ $ Fixed (2) December 31, 2014 Total 366,749 $ 854,061 152,365 1,373,175 $ 99% 374,706 854,061 152,365 1,381,132 100% (1) Balance shown is net of deferred financing costs and mark-‐to-‐market adjustments. (2) As at March 31, 2015, 100% of the term loan credit facility is subject to an interest rate swap in place until August 3, 2016. Pursuant to the term loan credit facility agreement we are required to have a minimum of 80% subject to an interest rate swap. The portion subject to the swap has been presented as fixed rate debt. (3) Includes the REIT’s share of mortgages related to the POBA joint venture. Amounts recorded as at March 31, 2015 for the Debentures are net of $4.4 million of premiums allocated to their conversion features on issuance. The premiums are amortized to interest expense over the term to maturity of the related debt using the effective interest rate method. Term loan credit facility Concurrent with the closing of our initial public offering, we obtained a term loan credit facility (the “Facility”) from a syndicate of German and French banks for gross proceeds of $448.4 million (€328.5 million). During the three months ended March 31, 2015, we repaid $17.9 million (€13.1 million) in connection with the disposition of ten properties, as well as mandatory repayments. As at March 31, 2015, the remaining principal balance on the Facility was $346.1 million (€254.1 million). The initial term of the Facility is five years with a two-‐year renewal option. Variable rate interest is payable quarterly under the Facility at a rate equal to the three-‐month EURIBOR, plus a margin of 200 basis points and agency fees of 10 basis points. Pursuant to the requirements of the Facility, we entered into an interest rate swap to fix 80% of the interest payments at 1.89% plus margin and agency fees, and purchased an instrument to cap 10% of the Facility, such that the interest rate does not exceed 5% on that portion. As at March 31, 2015, the weighted average rate of the Facility was 4.21%. Including financing costs, the effective interest rate under the Facility was 4.21%. At December 31, 2014, the weighted average rate was 4.21% and the effective rate was 4.21%. The Facility requires that at each interest rate payment date the debt service coverage ratio be equal to or above 145% and that the loan-‐to-‐value ratio not exceed 59% during the first three years the loan is outstanding and 54% during the final two years. As at March 31, 2015, we were in compliance with these covenants. Under the terms of the Facility, we were required to pay additional interest of 1% per annum beginning on August 3, 2013 on €100 million plus a 15% prepayment amount, less any amounts repaid. Mandatory repayments of between 110% and 125% (with the average being 115%) of the principal allocated to a particular Initial Property are required for any Initial Property sold or refinanced by the Trust. Since the initial public offering, the Trust has repaid $101.4 million (€74.4 million) in principal payments including prepayment amounts on various property dispositions. Opportunities to repay the balance of the Facility subject to the additional 1% interest rate will come from maximizing the leverage on new acquisitions and from additional dispositions of non-‐core properties from the Initial Properties portfolio. Revolving credit facility On October 9, 2013, the Trust entered into a credit agreement with a Canadian bank to provide a revolving credit facility not to exceed €25 million. The interest rate on Canadian dollar advances is prime plus 200 basis points and/or bankers’ acceptance rates plus 300 basis points. The interest rate for euro advances is 300 basis points over the three-‐month EURIBOR rate. The revolving credit facility has a term of two years. On August 14, 2014, the Trust entered into an amending agreement to increase this facility to €50 million, and effective April 1, 2015, the facility was further increased to €75 million, with no changes in the interest rate spreads or covenant requirements. The revised facility expires on September 25, 2016. The revolving credit facility was undrawn at March 31, 2015. There was an undrawn letter of credit commitment for €1.2 million against the facility at March 31, 2015. Dream Global REIT 2015 First Quarter Report | 20 Convertible debentures As at March 31, 2015, the total principal amount of Debentures outstanding was $161 million, convertible into an aggregate of 12,384,619 Units. The Debentures bear interest at 5.5% per annum, are payable semi-‐annually on July 31 and January 31 each year, and mature on July 31, 2018. Each $1,000 principal amount of the Debentures is convertible at any time by the holder into 76.9231 Units, representing a conversion price of $13.00 per unit. On or after August 31, 2014, and prior to August 31, 2016, the Debentures may be redeemed by the Trust, in whole or in part, at a price equal to the principal amount plus accrued and unpaid interest on not more than 60 days’ and not less than 30 days’ prior written notice, provided the weighted average trading price for the Units for the 20 consecutive trading days, ending on the fifth trading day immediately preceding the date on which notice of redemption is given, is not less than 125% of the conversion price. On or after August 31, 2016, and prior to July 31, 2018, the maturity date, the Debentures may be redeemed by the Trust at a price equal to the principal amount plus accrued and unpaid interest. The conversion feature of the Debentures is remeasured in each reporting period to fair value, with changes in fair value recorded in comprehensive income. During the three-‐month period ended March 31, 2015, the Trust recorded a fair value gain attributed to the conversion feature in the amount of $4.3 million. The table below highlights our debt maturity profile: Scheduled principal repayments on non-‐ Debt maturities matured debt Remainder of 2015 2016 2017 2018 2019 2020 and thereafter Acquisition date fair value adjustments Transaction costs (1) Total $ $ 35,959 $ 298,963 68,071 337,958 29,871 534,853 1,305,675 $ 18,763 $ 20,778 15,549 12,011 10,792 23,200 101,093 $ $ (1) Includes the REIT’s share of mortgages related to the POBA joint venture. Total 54,722 319,741 83,620 349,969 40,663 558,053 1,406,768 (4,424) (15,015) 1,387,329 Commitments and contingencies We are contingently liable with respect to guarantees that are issued in the normal course of business and with respect to litigation and claims that may arise from time to time. In the opinion of management, any liability that may arise from such contingencies would not have a material adverse effect on our condensed consolidated financial statements. As at March 31, 2015, the REIT’s future minimum commitments under operating leases are as follows: Operating lease payments Less than 1 year 1–5 years Longer than 5 years Total $ $ 655 974 -‐ 1,629 During the three months ended March 31, 2015, the Trust paid $0.2 million in minimum lease payments, which have been included in comprehensive income for the period. Dream Global REIT 2015 First Quarter Report | 21 Foreign currency contracts At March 31, 2015, we had various currency forward contracts in place to sell euros for Canadian dollars for the next 36 months. On settlement of a contract, we realize a gain or loss on the difference between the forward rate and the spot rate. We also mark the contracts to market quarterly and recorded an unrealized gain of $5.9 million for the three-‐month period ended March 31, 2015. The Trust currently has foreign exchange forward contracts to sell €118.3 million in total from April 2015 to March 2018 at an average exchange rate of $1.428 per euro. Equity The table below highlights our outstanding equity: Unitholders’ equity March 31, 2015 Units Number of Units 111,904,406 $ Amount 1,107,553 December 31, 2014 Number of Units 111,466,697 $ Amount 1,120,220 Units Our Declaration of Trust authorizes the issuance of an unlimited number of two classes of units: Units and Special Trust Units. The Special Trust Units may only be issued to holders of securities exchangeable for Units, are not transferable and are used to provide holders of such securities with voting rights with respect to Dream Global REIT. Each Unit and Special Trust Unit entitles the holder thereof to one vote for each Unit at all meetings of unitholders of the Trust. The Trust has a Deferred Unit Incentive Plan (“DUIP”) that provides for the grant of deferred trust units and income deferred units to trustees, officers, employees, affiliates and their service providers, including DAM, our asset manager. The following table summarizes the changes in our outstanding equity: Total Units outstanding on December 31, 2014 Units issued pursuant to the DUIP (1) Units issued pursuant to the DRIP Total Units outstanding on March 31, 2015 Units issued pursuant to the DUIP Units issued pursuant to the DRIP on April 15, 2015 Total Units outstanding on April 30, 2015 (1) Distribution Reinvestment and Unit Purchase Plan. Units 111,466,697 51,188 386,521 111,904,406 3,124 112,079 112,019,609 For the three months ended March 31, 2015, 51,188 Units were issued pursuant to the Deferred Unit Incentive Plan (December 31, 2014 – 86,415 Units) to trustees, officers and employees. Dream Global REIT 2015 First Quarter Report | 22 Distribution policy Our Declaration of Trust provides our trustees with the discretion to determine the percentage payout of income that would be in the best interest of the Trust. Amounts retained in excess of the declared distributions are used to fund leasing costs and capital expenditure requirements. Given that working capital tends to fluctuate over time and should not affect our distribution policy, we disregard it when determining our distributions. We also exclude the impact of leasing costs, which fluctuate with lease maturities, renewal terms and the type of asset being leased. We evaluate the impact of leasing activity based on averages for our portfolio over a two-‐ to three-‐year time frame. We exclude the impact of transaction costs expensed on business combinations as these are considered to be non-‐recurring. In order to manage the exposure to currency risk of unitholders and holders of Debentures, the Trust has entered into foreign exchange forward contracts. Distributions declared for the three months ended March 31, 2015 were $22.4 million. Of this amount, $3.3 million was reinvested in additional units pursuant to the DRIP, resulting in a cash payout ratio of 85.2%. Three months ended March 31, 2015 Declared 4% bonus amounts distribution 2015 distributions Paid in cash or reinvested in Units Payable at March 31, 2015 Total distributions 2015 reinvestment Reinvested to March 31, 2015 Reinvested on April 15, 2015 Total distributions reinvested Distributions paid in cash Reinvestment to distribution ratio (for the period) Cash payout ratio $ $ $ $ $ 14,892 $ 7,461 22,353 $ 2,221 $ 1,088 3,309 $ 19,044 14.8% 85.2% 89 $ -‐ 89 $ 89 $ 43 132 $ Total 14,981 7,461 22,442 2,310 1,131 3,441 We currently pay monthly distributions to unitholders of $0.06667 per unit, or $0.80 per unit on an annual basis. At March 31, 2015, approximately 14.6% of our total Units were enrolled in the DRIP. Dream Global REIT 2015 First Quarter Report | 23 OUR RESULTS OF OPERATIONS Basis of accounting Our discussion of results of operations includes our proportionate share of income from investments in joint ventures. Refer to “Non-‐GAAP measures and other disclosures” for a reconciliation to our condensed consolidated financial statements. Investment properties revenue Investment properties operating expenses Net rental income Other income Interest and other income Share of net income from investment in other joint ventures Other expenses Portfolio management General and administrative Depreciation and amortization Interest expense Fair value adjustments, loss on sale of investment properties and other activities Fair value adjustments to investment properties Fair value adjustments to financial instruments Internal direct leasing costs Gain (loss) on sale of investment properties Income before income taxes Current income taxes expense Deferred income taxes expense Provision for income taxes Net income Total net income for the period attributable to: Unitholders of the Trust Shareholders of the subsidiaries Net income Foreign currency translation adjustments for the period attributable to: Unitholders of the Trust Shareholders of the subsidiaries Comprehensive income (loss) for the period attributable to: Unitholders of the Trust Shareholders of the subsidiaries Three months ended March 31, (1) (1) 2015 2014 $ $ $ $ 56,910 (18,612) 38,298 1,069 5 1,074 (1,450) (4,668) (30) (11,008) (17,156) 15,949 7,688 (542) 976 24,071 46,287 (143) (2,774) (2,917) 43,370 43,234 136 43,370 (37,387) (231) (37,618) 5,847 (95) 5,752 $ $ $ $ 67,133 (21,333) 45,800 56 3 59 (1,278) (3,650) (25) (12,014) (16,967) (6,223) (8,168) (512) (476) (15,379) 13,513 (195) (826) (1,021) 12,492 12,492 -‐ 12,492 46,513 -‐ 46,513 59,005 -‐ 59,005 (1) Results from operations were converted into Canadian dollars from euros using the following average exchange rates: the three-‐month period ended March 31, 2015 was converted at $1.397:€1; the three-‐month period ended March, 31, 2014 was converted at $1.512:€1. Investment properties revenue Investment properties revenue includes net rental income from investment properties as well as the recovery of operating costs and property taxes from tenants. Dream Global REIT 2015 First Quarter Report | 24 Investment properties revenue for the quarter was $56.9 million, a decrease of $10.2 million, or 15.2%, over the prior year comparative quarter. Excluding the $4.7 million negative impact of a weaker euro, the decrease was $5.5 million. The primary drivers for this decrease were the Deutsche Post terminations and expiry of the Lonestar head lease payments as well as Initial Properties sales, partially offset by a $4.9 million increase in revenue due to acquisitions and leasing. Investment properties operating expenses Investment properties operating expenses comprises occupancy costs and property taxes as well as certain expenses that are not recoverable from tenants, the majority of which are related to major repairs and maintenance. Operating expenses fluctuate with changes in occupancy levels and levels of repairs and maintenance. Investment properties operating expenses for the quarter were $18.6 million, a decrease of $2.7 million, or 12.8%, over the prior year comparative quarter mainly due to dispositions of certain Initial Properties, partially offset by an increase due to acquisitions in 2014 and 2015. Net operating income (“NOI”) Initial Properties Acquisition Properties (1) Net operating income (1) $ $ Three months ended March 31, 2015 2014 12,321 25,977 38,298 $ $ 21,627 24,173 45,800 Net operating income (“NOI”) is a non-‐GAAP measure. See “Non-‐GAAP measures and other disclosures” for the definition of NOI and a reconciliation to net rental income. For the three months ended March 31, 2015, net operating income was $38.3 million, representing a decrease of $7.5 million compared to the same quarter in 2014. Excluding the $3.2 million negative impact of a weaker euro against the dollar, net operating income decreased by $4.3 million compared to the same quarter last year, mainly as a result of the impact of the Deutsche Post terminations and Lonestar head lease payment expiry effective July 1, 2014, as well as our disposition program in relation to our Initial Properties. Net operating income for the Acquisition Properties was 16.4% higher in 2015 compared to 2014. The net operating income contributed by new acquisitions since April 2014 has more than offset the reduction due to the sale of 50% of the joint venture assets to POBA. The table below summarizes our revenue and operating expenses in euros: Three months ended March 31, Investment properties revenue Investment properties operating expenses Net operating income (1) € € 2015 40,746 (13,326) 27,420 € € 2014 44,397 (14,108) 30,289 Net operating income (“NOI”) is a non-‐GAAP measure. See “Non-‐GAAP measures and other disclosures” for the definition of NOI. Interest and other income Interest and other income comprises interest earned on notes receivable and the POBA management fees earned, as well as fees earned on the POBA loan facility. Except for the fees earned from the POBA joint venture arrangement, the income included in interest and other income is not necessarily of a recurring nature and the amounts may vary quarter-‐over-‐quarter, depending on cash balances. Interest and other income for the quarter was $1.1 million, higher than the prior year comparative quarter. Included in the income were fees earned from managing the POBA joint venture and POBA loan facility, in the amount of $0.7 million. Portfolio management Our portfolio management team comprises the employees of our advisory subsidiaries in Germany and Luxembourg who are responsible for providing asset management services for the investment properties, including asset strategy and leasing activities. Portfolio management expense was $1.5 million for the three months ended March 31, 2015, slightly higher than the same quarter in 2014 by $0.2 million, reflecting the need to add resources to support our business growth and corporate strategy. Dream Global REIT 2015 First Quarter Report | 25 General and administrative General and administrative expenses totalled $4.7 million for the three months ended March 31, 2015, representing increases of $1.0 million over the same period last year. The increase mainly resulted from higher asset management fees and regulatory and corporate compliance costs associated with the new acquisitions. Interest expense Interest expense was $11.0 million for the three-‐month period ended March 31, 2015, a decrease of $1.0 million compared to the same quarter last year. Excluding the impact of a weaker euro against the Canadian dollar, the interest expense decreased by $0.3 million. The repayments on our term credit facility during the year relating to property dispositions resulted in interest savings of $0.7 million. New mortgage debt placed on properties we acquired accounted for a $0.2 million increase. We currently have interest rate swaps in place that fix the interest rate payable on €254.1 million at an underlying rate of 1.89%. The REIT does not apply hedge accounting in relation to these swaps and, as a result, their impact is not included in interest expense but accounted for through the fair value adjustments as described below. During the quarter, $1.7 million of swaps were settled, almost the same amount as in the same quarter last year. Excluding the impact of the weaker euro, the swap settlement was slightly higher, reflecting the slight decrease in underlying interest rates. Including the swaps and the additional 1% interest rate on the Facility, the actual weighted average interest rate on the Facility as at March 31, 2015 is 4.21%. Any adjustments arising from the interest rate swaps are reflected in the fair value adjustments to financial instruments and not in interest expense. Fair value adjustment to investment properties For the three months ended March 31, 2015, a gain of $15.9 million was recognized compared to a loss of $6.2 million in the comparative quarter last year. The gain in the current quarter was driven by a $22.7 million fair value recognized for Acquisition Properties due to yield compressions experienced in certain markets, offset by a $7.7 million fair value loss mainly related to transaction costs of the property acquired in the quarter. There was also a $0.9 million fair value gain on properties sold and properties under contract for sale (properties held for sale) during the quarter. Fair value adjustment to financial instruments For the three months ended March 31, 2015, we incurred an unrealized gain in the fair value of financial instruments of $7.7 million compared to a loss of $8.2 million in the comparative period. The fair value adjustments in the quarter mainly comprise the following components: • a $0.3 million loss recognized on the fair value change in the interest rate swaps and cap as a result of the settlement of one contract in the quarter for $1.7 million and a decrease in the forward price of interest rates. A $1.3 million loss was recognized in the comparative quarter last year due to a similar decrease in the forward price of interest rates; • a $4.3 million fair value gain recognized on the conversion feature of the convertible debentures, mainly reflecting a decrease in the credit spread and risk-‐free interest rate applicable to our Units, compared to a loss of $0.3 million in the same period in 2014; • an unrealized gain of $5.9 million was recognized related to our foreign currency forward contracts due to a depreciation of the euro compared to the Canadian dollar, versus a $5.9 million unrealized loss during the comparative quarter due to a depreciation of the Canadian dollar compared to the euro; and • a $2.3 million loss was recognized related to our DUIP, mainly reflecting an increase in the market price of our Units compared to a loss of $0.6 million in the same period in 2014. Dream Global REIT 2015 First Quarter Report | 26 Internal direct leasing costs During the first quarter of 2014, we adopted a change in accounting policy regarding the accounting treatment of incremental internal leasing costs governed by International Accounting Standard (“IAS”) 17, after consideration of an IFRS Interpretations Committee agenda decision issued in April 2014. Incremental internal leasing costs are now expensed during the period incurred. Prior to adopting this interpretation, incremental leasing costs were capitalized to investment properties; however, we have restated all affected prior periods to give effect to this change in accounting policy. This interpretation does not affect the accounting treatment of leasing costs paid to third parties, which will continue to be capitalized in accordance with IAS 17. A total of $0.5 million of incremental internal leasing staff costs incurred during the three months ended March 31, 2015 have been classified as internal direct leasing costs of the respective properties, the same amount incurred in the comparative periods in 2014. Gain (loss) on sale of investment properties Gain on sale of investment properties for the quarter was $1.0 million, compared to a $0.5 million loss on the sale of investment properties during the same quarter last year. The increase was mainly attributable to the $2.0 million gain on the sale of an Acquisition Property to the POBA joint venture during the quarter, reduced by the $1.0 million loss on the sale of investment properties related to the associated transaction costs during the quarter. Income taxes We recognized current income tax expenses of $0.1 million for the three months ended March 31, 2015, compared to current income tax expenses of $0.2 million for the comparative period in 2014. We also recognized deferred income tax expenses of $2.8 million for the three months ended March 31, 2015, compared to a deferred income tax expense of $0.8 million for the comparative period in 2014. The difference is mainly a result of the deferred income tax impact associated with the loss carry-‐forwards, fair value adjustments related to investment properties net of tax depreciation, and fair value changes related to financial instruments. Asset management fee On August 3, 2011, DAM elected to receive the base asset management fees payable on the Initial Properties acquired on August 3, 2011 by way of deferred trust units under the Asset Management Agreement for up to $3.5 million per year for the next five years. These deferred trust units vest 20% annually, commencing on the fifth anniversary date of being granted. On termination of the Asset Management Agreement, unvested trust units will vest immediately. During the three months ended March 31, 2015, asset management expenses pertaining to the Initial Properties were $0.5 million. A total of 83,349 deferred units were granted during the period as compensation for the fees. The asset management fees were recorded based on the fair value of the deferred units issued, with an appropriate discount applied to reflect the restricted period of exercise. In addition, the Trust paid in cash an asset management fee of $1.3 million for the three months ended March 31, 2015, for properties acquired since the acquisition of our Initial Properties. It further paid a financing fee of $0.1 million related to mortgage financing services provided during the three months ended March 31, 2015, and acquisition fees of $0.7 million related to properties acquired during the three months ended March 31, 2015. During the three months ended March 31, 2015, the REIT also reimbursed DAM for out-‐of-‐pocket and incidental costs of $0.2 million for the three months ended March 31, 2015. Shared Services and Cost Sharing Agreement The Trust entered into a shared services and cost sharing agreement with DAM on December 1, 2013. The agreement was for a one-‐year term and will be automatically renewed for further one-‐year terms unless and until the agreement is terminated in accordance with its terms or by mutual agreement of the parties. Pursuant to the agreement, DAM will be providing additional administrative and support services in order to expand and improve DAM’s service capability in connection with the provision of its asset management services. DAM will receive an annual fee sufficient to reimburse it for all the expenses incurred in providing these additional administrative and support services. Additionally, the Trust will also reimburse DAM in each calendar year for its share of costs incurred in connection with certain business transformation services provided by DAM. During the three months ended March 31, 2015, the Trust recorded an amount of $0.1 million payable to DAM pursuant to the Shared Services and Cost Sharing Agreement. Dream Global REIT 2015 First Quarter Report | 27 The Trust’s future commitment under the Shared Services and Cost Sharing Agreement over the remaining terms to 2020 is $1.0 million. Impact of foreign exchange Exchange rate fluctuations between the Canadian dollar and the euro impact the Trust’s reported revenues, expenses, income, cash flows, assets and liabilities. The table below summarizes changes in the exchange rates. Three months ended March 31, 2015 2014 Change Average exchange rate (Cdn. dollars to one euro) Exchange rate at period-‐end (Cdn. dollars to one euro) 1.397 1.362 1.512 1.523 -‐7.6% -‐10.5% Comprehensive income was impacted by a foreign currency translation loss of $37.6 million for the three months ended March 31, 2015. The exchange rates decreased from $1.404:€1 as at December 31, 2014 to $1.362:€1 as at March 31, 2015. The quarterly results of our euro-‐denominated operations included in net income were translated at an average exchange rate of $1.397:€1 compared to $1.512:€1 in the same quarter last year. Funds from operations and adjusted funds from operations Net income for the period Add (deduct): Net income attributable to non-‐controlling interest Net FFO impact attributable to non-‐controlling interests Amortization of lease incentives Internal direct leasing costs (Gain) loss on sale of investment properties Tax on gains on sale of investment properties Deferred income taxes Cash settlement on interest rate swap Gain (loss) on settlement of foreign currency contracts Fair value adjustments to investment properties Fair value adjustments to financial instruments (1) FFO Add (deduct): Amortization of financing costs Amortization of initial discount on convertible debentures Amortization of fair value adjustment on acquired debt Deferred unit compensation expense Deferred asset management fees Straight-‐line rent Deduct: Normalized leasing costs and tenant incentives Normalized non-‐recoverable recurring capital expenditures (1) AFFO (1) Three months ended March 31, 2015 2014 $ $ $ $ 43,370 (136) (56) 533 542 (976) -‐ 2,774 (1,662) 492 (15,949) (7,688) 21,244 863 287 (30) 449 481 (369) 22,925 (1,723) (1,340) 19,862 $ $ $ $ Funds from operations (“FFO”) and adjusted funds from operations (“AFFO”) are non-‐GAAP measures. See “Non-‐GAAP measures and other disclosures”. Dream Global REIT 2015 First Quarter Report | 28 12,492 -‐ (36) 379 512 476 66 826 (1,603) (2,747) 6,223 8,168 24,756 812 265 (98) 339 642 32 26,748 (2,061) (1,603) 23,084 Funds from operations Three months ended March 31, 2015 2014 FFO FFO per unit – basic FFO per unit – diluted $ $ $ 21,244 0.19 0.19 $ $ $ 24,756 0.23 0.22 Total FFO for the quarter was $21.2 million, a decrease of $3.5 million or 14.2% over the prior year comparative quarter, reflecting the impact from Deutsche Post lease terminations and expiry of the Lonestar head lease payments effective July 1, 2014, largely offset by completed acquisitions and leasing activity subsequent to the first quarter of 2014. For the quarter ended March 31, 2015, basic FFO on a per unit basis decreased to $0.19 per unit from $0.23 per unit in the prior year comparative quarter. For the quarter ended March 31, 2015, diluted FFO on a per unit basis was also $0.19 per unit, a decrease from $0.22 per unit in the prior year comparative quarter. Adjusted funds from operations Three months ended March 31, 2015 2014 AFFO AFFO per unit – basic $ $ 19,862 $ 0.18 $ 23,084 0.21 Total AFFO for the quarter ended March 31, 2015 was $3.2 million lower than the prior year comparative quarter, reflecting the positive impact of acquisitions completed and leasing activity subsequent to the first quarter of 2014, reduced by the impact of terminated Deutsche Post space as well as the expiry of the Lonestar head lease payments, both effective on July 1, 2014. For the quarter ended March 31, 2015, basic AFFO on a per unit basis was $0.18 per unit, a decrease from $0.21 per unit in the prior year comparative quarter. Dream Global REIT 2015 First Quarter Report | 29 QUARTERLY INFORMATION (per condensed consolidated financial statements) The following table shows quarterly information since April 1, 2013: Investment properties revenue Investment properties operating expenses Net rental income Other income Interest and other income Share of net losses from investment in joint ventures Other expenses Portfolio management General and administrative Amortization and depreciation Interest expense Fair value adjustments, loss on sale of investment properties and other activities Fair value adjustments to investment properties Fair value adjustments to financial instruments Internal direct leasing costs Gain (loss) on sale of investment properties Contract termination fees Income before taxes Current income taxes recovery (expense) Deferred income taxes recovery (expense) Recovery of (provision for) income taxes Net income Total income for the period attributable to: Unitholders of the Trust Shareholders of the subsidiaries Net income Add (deduct): Income allocated to non-‐controlling interest Net FFO impact attributable to non-‐controlling interests Amortization of lease incentives Internal direct leasing costs (Gain) loss on sale of investment properties Tax on gains on sale of investment properties Deferred income taxes Term debt swap settlement Gain (loss) on settlement of Forex contracts Fair value adjustments to investment properties Fair value adjustments to financial instruments FFO FFO per unit – basic FFO per unit – diluted Funds from operations Add (deduct): Amortization of financing costs Accretion of debenture conversion feature Amortization of fair value adjustment of debt Contract termination fees incurred on sale to the POBA joint venture Deferred compensation expense Deferred asset management expense Straight-‐line rent Deduct: Normalized leasing costs and tenant incentives Normalized non-‐recoverable recurring capital expenditures AFFO AFFO per unit – basic Weighted average number of Units Basic Diluted Quarterly average exchange rate ($:€1) Q1 2015 Q4 2014 $ 51,458 $ 60,042 (17,573) (18,325) 33,885 41,717 1,014 382 10,931 2,494 11,945 2,876 (1,450) (1,067) (4,049) (4,557) (30) (45) (9,834) (11,690) (15,363) (17,359) 7,740 (12,876) 7,688 876 (542) (324) 976 44,332 -‐ (510) 15,862 31,498 46,329 58,732 (185) 110 (2,774) 1,455 (2,959) 1,565 $ 43,370 $ 60,297 $ 43,234 $ 59,388 136 909 $ 43,370 $ 60,297 (136) (909) (56) 634 533 554 542 324 (976) (44,332) -‐ (159) 2,774 (1,455) (1,662) (1,695) 492 (128) (15,949) 11,173 (7,688) (876) $ 21,244 $ 23,428 $ 0.19 $ 0.21 0.19 0.21 $ 21,244 $ 23,428 863 859 287 281 (30) (96) -‐ 510 449 377 481 616 (369) (129) 22,925 25,846 (1,723) (1,938) (1,340) (1,507) $ 19,862 $ 22,401 $ 0.18 $ 0.20 111,760,819 111,301,061 125,953,069 125,355,097 1.397 1.419 Q3 2014 Q2 2014 $ 61,388 $ 67,514 (17,872) (20,435) 43,516 47,079 8 (28) 7 9 15 (19) (1,019) (1,207) (4,295) (4,350) (30) (38) (12,221) (12,273) (17,565) (17,868) 49,335 42,011 6,914 3,434 (577) (541) (1,172) (811) -‐ -‐ 54,500 44,093 80,466 73,285 (857) (383) (8,223) (8,140) (9,080) (8,523) $ 71,386 $ 64,762 $ 71,386 $ 64,762 -‐ -‐ $ 71,386 $ 64,762 -‐ -‐ (29) (34) 110 424 577 541 1,172 811 337 98 8,223 8,140 (1,628) (1,567) (666) (1,651) (49,335) (42,011) (6,914) (3,434) $ 23,233 $ 26,079 $ 0.21 $ 0.24 0.21 0.23 $ 23,233 $ 26,079 904 909 276 270 (96) (97) -‐ -‐ 394 538 638 645 (182) (378) 25,167 27,966 (1,958) (2,119) (1,523) (1,648) $ 21,686 $ 24,199 $ 0.20 $ 0.22 110,878,351 110,469,257 124,824,789 124,295,625 1.442 1.496 Dream Global REIT 2015 First Quarter Report | 30 Q1 2014 Q4 2013 $ 67,133 $ 62,528 (21,333) (20,656) 45,800 41,872 56 352 3 10 59 362 (1,278) (409) (3,650) (3,332) (25) (16) (12,014) (11,288) (16,967) (15,045) (6,223) 891 (8,168) (9,460) (512) (679) (476) (550) -‐ -‐ (15,379) (9,798) 13,513 17,391 (195) (142) (826) (2,019) (1,021) (2,161) $ 12,492 $ 15,230 $ 12,492 $ 15,230 -‐ -‐ $ 12,492 $ 15,230 -‐ -‐ (36) 3 379 259 512 679 476 550 66 (33) 826 2,019 (1,603) (1,585) (2,747) (1,456) 6,223 (891) 8,168 9,460 $ 24,756 $ 24,235 $ 0.23 $ 0.22 0.22 0.22 $ 24,756 $ 24,235 812 794 265 260 (98) (92) -‐ -‐ 339 313 642 539 32 (440) 26,748 25,609 (2,061) (1,884) (1,603) (1,466) $ 23,084 $ 22,259 $ 0.21 $ 0.20 109,987,243 109,482,435 123,638,848 123,028,441 1.512 1.430 Q3 2013 Q2 2013 $ 56,915 $ 54,413 (17,436) (18,222) 39,479 36,191 351 446 (2) 13 349 459 (1,006) (882) (3,399) (3,045) (33) (24) (10,441) (9,700) (14,879) (13,651) (3,901) (8,352) (1,808) (4,570) (586) (374) (79) (252) -‐ -‐ (6,374) (13,548) 18,575 9,451 100 (316) (983) (128) (883) (444) $ 17,692 $ 9,007 $ 17,692 $ 9,007 -‐ -‐ $ 17,692 $ 9,007 -‐ -‐ -‐ -‐ 108 112 586 374 79 252 (126) 79 983 128 (1,574) (1,533) (456) 52 3,901 8,352 1,808 4,570 $ 23,001 $ 21,393 $ 0.21 $ 0.22 0.21 0.21 $ 23,001 $ 21,393 744 666 254 250 (88) (84) -‐ -‐ 356 378 529 523 (268) (623) 24,528 22,503 (1,776) (1,629) (1,381) (1,267) $ 21,371 $ 19,607 $ 0.20 $ 0.20 109,116,985 99,037,061 122,552,770 112,358,396 1.376 1.337 NON-‐GAAP MEASURES AND OTHER DISCLOSURES The following additional non-‐GAAP measures are important measures used by management in evaluating the Trust’s underlying operating performance and debt management. These non-‐GAAP measures are not defined by IFRS, do not have a standardized meaning and may not be comparable with similar measures presented by other income trusts. Funds from operations (“FFO”) Management believes FFO is an important measure of our operating performance. This non-‐IFRS measurement is a commonly used measure of performance of real estate operations; however, it does not represent net income or cash flow from operating activities as defined by IFRS and is not necessarily indicative of cash available to fund Dream Global REIT’s needs. In compliance with Canadian Securities Administrators Staff Notice 52-‐306 (Revised), “Non-‐GAAP Financial Measures and Additional GAAP Measures”, FFO has been reconciled to net income in the section “Our results of operations” under the heading “Funds from operations and adjusted funds from operations”. Adjusted funds from operations (“AFFO”) Management believes AFFO is an important measure of our economic performance and is indicative of our ability to pay distributions. This non-‐IFRS measurement is commonly used for assessing real estate performance; however, it does not represent cash generated from (utilized in) operating activities as defined by IFRS and is not necessarily indicative of cash available to fund Dream Global REIT’s needs. Our calculation of AFFO includes an estimated amount (8% of net rental income) of normalized non-‐recoverable capital expenditures, as well as initial direct leasing costs and tenant incentives that we expect to incur based on our current portfolio and expected average leasing activity over time. Our estimates of initial direct leasing costs and lease incentives are based on the average of our expected leasing activity over the next two to three years. Our estimates of normalized non-‐recoverable capital expenditures are based on our expected average expenditures for our current property portfolio. This estimate may differ from actual amounts incurred due to the timing of expenditures and the related leasing activities. In compliance with Canadian Securities Administrators Staff Notice 52-‐306 (Revised), “Non-‐GAAP Financial Measures and Additional GAAP Measures”, AFFO has been reconciled to cash generated from operating activities in this section under the heading “Cash generated from operating activities to AFFO reconciliation”. Net operating income (“NOI”) NOI is defined by the Trust as the total investment properties revenue less investment properties operating expenses, including the share of net rental income from investment in joint ventures. This non-‐GAAP measurement is an important measure used by the Trust in evaluating property operating performance; however, it is not defined by IFRS, does not have a standard meaning and may not be comparable with similar measures presented by other income trusts. In compliance with Canadian Securities Administrators Staff Notice 52-‐306 (Revised), “Non-‐GAAP Financial Measures and Additional GAAP Measures”, NOI has been reconciled to net rental income in the table below: Net rental income (per condensed consolidated financial statements) Add: Share of net rental income from investments in joint ventures NOI $ $ Dream Global REIT 2015 First Quarter Report | 31 Three months ended March 31, 2015 2014 33,885 $ 4,413 38,298 $ 45,800 -‐ 45,800 Weighted average number of units The basic weighted average number of Units outstanding used in the FFO and AFFO calculations includes all Units. The diluted weighted average number of Units assumes the conversion of the Debentures and incremental unvested deferred trust units related to the Deferred Unit Incentive Plan represented by the potential Units that would have to be purchased in the open market to fund the unvested obligation. The weighted average number of Units outstanding for basic FFO and AFFO and diluted FFO calculations for the three months ended March 31, 2015 is noted in the table below. Diluted FFO includes interest and amortization adjustments related to the Debentures of $2.7 million for the three months ended March 31, 2015. Weighted average Units outstanding for basic per unit amounts Weighted average Units outstanding for diluted per unit amounts Three months ended March 31, 2015 2014 111,760,819 125,953,069 109,987,243 123,638,848 Investment in joint ventures The Trust’s proportionate share of the financial position and results of operation of its investment in joint ventures, which are accounted for using the equity method under IFRS in the condensed consolidated financial statements, are presented and discussed throughout the MD&A using the proportionate consolidation method, which is a non-‐GAAP measure. A reconciliation of the financial position and results of operations to the condensed consolidated balance sheets and condensed consolidated statements of comprehensive income is included in the following tables. Dream Global REIT 2015 First Quarter Report | 32 Balance sheet reconciliation to condensed consolidated financial statements Assets NON-‐CURRENT ASSETS Investment properties Investment in joint ventures Notes receivable Derivative financial instruments Other non-‐current assets CURRENT ASSETS Amounts receivable Prepaid expenses Derivative financial instruments Cash Assets held for sale Total assets Liabilities NON-‐CURRENT LIABILITIES Debt Deposits Derivative financial instruments Deferred Unit Incentive Plan Deferred income tax liabilities CURRENT LIABILITIES Debt Amounts payable and accrued liabilities Income tax payable Derivative financial instruments Distributions payable Liabilities related to assets held for sale Total liabilities $ $ $ $ Amounts per condensed consolidated financial statements 2,079,440 179,140 4,784 8,369 1,908 2,273,641 17,353 2,428 966 67,920 88,667 46,259 2,408,567 1,162,948 1,646 2,256 12,040 3,102 1,181,992 57,805 43,960 1,369 6,686 7,461 117,281 1,741 1,301,014 Share from investment in POBA joint ventures $ $ $ $ 316,970 (153,410) -‐ -‐ 522 164,082 2,026 98 -‐ 3,714 5,838 -‐ 169,920 163,345 163 -‐ -‐ -‐ 163,508 3,231 3,237 (56) -‐ -‐ 6,412 -‐ 169,920 March 31, 2015 Total $ $ $ $ 2,396,410 25,730 4,784 8,369 2,430 2,437,723 19,379 2,526 966 71,634 94,505 46,259 2,578,487 1,326,293 1,809 2,256 12,040 3,102 1,345,500 61,036 47,197 1,313 6,686 7,461 123,693 1,741 1,470,934 Amounts per condensed consolidated financial statements $ $ $ $ Dream Global REIT 2015 First Quarter Report | 33 2,079,671 159,967 4,930 -‐ 1,698 2,246,266 17,455 2,360 -‐ 121,939 141,754 44,363 2,432,383 1,157,882 1,802 3,420 9,365 719 1,173,188 70,514 49,485 1,268 8,853 7,431 137,551 1,424 1,312,163 Share from investment in POBA joint ventures $ $ $ $ 284,417 (134,237) -‐ -‐ 484 150,664 2,228 28 -‐ 3,122 5,378 -‐ 156,042 149,747 146 -‐ -‐ -‐ 149,893 2,989 3,111 49 -‐ -‐ 6,149 -‐ 156,042 December 31, 2014 Total $ $ $ $ 2,364,088 25,730 4,930 -‐ 2,182 2,396,930 19,683 2,388 -‐ 125,061 147,132 44,363 2,588,425 1,307,629 1,948 3,420 9,365 719 1,323,081 73,503 52,596 1,317 8,853 7,431 143,700 1,424 1,468,205 Statement of comprehensive income reconciliation to condensed consolidated financial statements Amounts per condensed consolidated financial statements Investment properties revenue $ Investment properties operating expenses Net rental income Other income Interest and other income Share of net income from investment in joint ventures Share of net income from investment in other joint ventures Other expenses Portfolio management General and administrative Depreciation and amortization Interest expense Fair value adjustments, gain (loss) on sale of investment properties and other activities Fair value adjustments to investment properties Fair value adjustments to financial instruments Internal direct leasing costs Gain (loss) on sale of investment properties Income before income taxes Current income taxes recovery (expense) Deferred income taxes expense Recovery of (provision for) income taxes Net income $ Total net income for the period attributable to: Unitholders of the Trust $ Shareholders of the subsidiaries Net income Foreign currency translation adjustments for the period attributable to: Unitholders of the Trust Shareholders of the subsidiaries Comprehensive income (loss) for the period attributable to: Unitholders of the Trust Shareholders of the subsidiaries $ 51,458 (17,573) 33,885 1,014 10,926 5 11,945 (1,450) (4,049) (30) (9,834) (15,363) 7,740 7,688 (542) 976 15,862 46,329 (185) (2,774) (2,959) 43,370 43,234 136 43,370 (37,387) (231) (37,618) 5,847 (95) 5,752 Share of income from investments in POBA joint ventures $ $ $ $ Dream Global REIT 2015 First Quarter Report | 34 5,452 (1,039) 4,413 55 (10,926) -‐ (10,871) -‐ (619) -‐ (1,174) (1,793) 8,209 -‐ -‐ -‐ 8,209 (42) 42 -‐ 42 -‐ -‐ -‐ -‐ -‐ -‐ -‐ -‐ -‐ -‐ $ $ $ $ Three months ended March 31, 2015 2014 Total 56,910 (18,612) 38,298 1,069 -‐ 5 1,074 (1,450) (4,668) (30) (11,008) (17,156) 15,949 7,688 (542) 976 24,071 46,287 (143) (2,774) (2,917) 43,370 43,234 136 43,370 (37,387) (231) (37,618) 5,847 (95) 5,752 $ $ $ $ 67,133 (21,333) 45,800 56 -‐ 3 59 (1,278) (3,650) (25) (12,014) (16,967) (6,223) (8,168) (512) (476) (15,379) 13,513 (195) (826) (1,021) 12,492 12,492 -‐ 12,492 46,513 -‐ 46,513 59,005 -‐ 59,005 Cash generated from operating activities to AFFO reconciliation AFFO is not defined by IFRS and, therefore, may not be comparable to similar measures presented by other real estate investment trusts. In compliance with Canadian Securities Administrators Staff Notice 52-‐306 (Revised), “Non-‐GAAP Financial Measures and Additional GAAP Measures”, the table below reconciles AFFO to cash generated from operating activities. Cash generated from operating activities Add (deduct): Change in non-‐cash working capital Share of net income from investment in POBA joint venture Internal direct leasing costs Non-‐cash impact of income attributable to non-‐controlling interest Depreciation and amortization Unrealized loss on settlement of foreign exchange contracts Tax on gains on sale of investment properties Investment in lease incentives and initial direct leasing costs Adjustments for investment in joint ventures: Fair value adjustments to investment properties Amortization of lease incentives Normalized leasing costs and tenant incentives Normalized non-‐recoverable recurring capital expenditures AFFO Three months ended March 31, 2015 2014 $ $ 14,185 $ 1,160 10,926 542 (131) (30) 1,245 -‐ 3,216 (8,209) 21 (1,723) (1,340) 19,862 $ 21,707 2,798 -‐ 512 (32) (25) 169 66 1,553 -‐ -‐ (2,061) (1,603) 23,084 Net income, cash generated from (utilized in) operating activities and distributions declared In any given period, actual distributions declared may differ from cash generated from (utilized in) operating activities, primarily due to seasonal fluctuations in non-‐cash working capital and the impact of leasing costs, which fluctuate with lease maturities, renewal terms and the type of asset being leased. These seasonal or short-‐term fluctuations are funded, if necessary, with our existing credit facilities. The Trust determines the distribution rate by, among other considerations, its assessment of cash flow as determined using adjusted cash generated from (utilized in) operating activities (a non-‐GAAP measure), which includes cash generated from (utilized in) operating activities of our investments in joint ventures that are equity accounted and excludes the fluctuations in non-‐cash working capital, and transaction costs on acquisitions and dispositions, as well as investment in lease incentives and initial direct leasing costs. As such, the Trust believes the cash distributions are not an economic return of capital, but a distribution of sustainable adjusted cash flow from operating activities. Based on current facts and assumptions, the Trust does not anticipate cash distributions will be reduced or suspended in the foreseeable future. The Trust funds its working capital needs and investments in lease incentives and initial direct leasing costs with cash and cash equivalent on hand and its credit facilities. Accordingly, management believes adjusted cash generated from (utilized in) operating activities is an important measure that reflects our ability to pay cash distributions. This non-‐GAAP measurement does not represent cash generated from (utilized in) operating activities, as defined by IFRS. In any given period, the Trust anticipates that actual distributions declared will, in the foreseeable future, continue to vary from net income as net income includes non-‐cash items such as fair value adjustments to investment properties and fair value adjustments to financial instruments. Accordingly, the Trust does not use net income as a proxy for distributions. Dream Global REIT 2015 First Quarter Report | 35 As required by National Policy 41-‐201, “Income Trusts and Other Indirect Offerings”, the following table outlines the differences between cash generated from (utilized in) operating activities (per condensed consolidated financial statements) and distributions declared, as well as the differences between net income and distributions declared, in accordance with the guidelines. Net income for the period $ Cash generated from (utilized in) operating activities (per condensed consolidated financial statements) Add: Investment in joint ventures’ cash flows from operating activities Cash generated from (utilized in) operating activities (including investment in joint ventures) Add (deduct): Lease incentives and initial direct leasing costs Change in non-‐cash working capital Adjusted cash generated from (utilized in) operating activities (including investment in joint ventures) Distributions declared Surplus (shortfall) of adjusted cash generated from (utilized in) operating activities over distributions declared Surplus (shortfall) of net income over distributions declared Shortfall of cash flow from operating activities (per condensed consolidated financial statements) over distributions declared $ Three months ended March 31, 2015 2014 43,370 14,185 $ 202 14,387 3,302 3,699 21,388 22,353 12,492 21,707 (965) 21,017 (8,168) 4,052 (9,514) (299) $ -‐ 21,707 1,553 2,798 26,058 22,006 Distributions declared exceeded adjusted cash generated from (utilized in) operating activities for the three months ended March 31, 2015 by $8.2 million (shortfall of $0.3 million for the same period in 2014). This shortfall was mainly driven by the short-‐term fluctuations in our investment in lease incentives and initial direct leasing costs incurred for the three months ended March 31, 2015 and changes in our non-‐cash working capital during the same period, as well as the impact of the Deutsche Post terminations and Lonestar head lease payment expiry on our net rental income in Q1 2015. We exclude fluctuations in non-‐cash working capital and investment in lease incentives and initial direct leasing costs in determining our distribution rate and we expect the effect of the Deutsche Post terminations and Lonestar head lease payment expiry to be short term as we lease up the resulting vacant space. Accordingly, the Trust believes the cash distributions are not an economic return of capital, but a distribution of sustainable adjusted cash flow from operating activities. For similar reasons, distributions declared exceeded adjusted cash generated from (utilized in) operating activities for the three months ended March 31, 2015 by $1.0 million (for the three months ended March 31, 2014, adjusted cash generated from (utilized in) operating activities exceeded distributions declared by $4.1 million). These shortfalls were funded by cash and cash equivalents and our existing credit facilities. Net income exceeded distributions declared by $21.0 million for the three months ended March 31, 2015 (shortfall of $9.5 million of net income over distributions declared for the same period in 2014). As a general rule, we do not take fluctuations in working capital into consideration and we use a normalized amount as a proxy for leasing and building improvement costs in establishing our distribution policy. The surplus or shortfall in net income for each period reflects mainly fair value adjustments to financial instruments and investment properties. These non-‐cash items do not impact cash flows and are not considered when we establish our distribution policy. Dream Global REIT 2015 First Quarter Report | 36 Level of debt (debt-‐to-‐gross book value) Management believes this non-‐GAAP measurement is an important measure in the management of our debt levels. Level of debt as shown below is determined as total debt, divided by total assets. In compliance with Canadian Securities Administrators Staff Notice 52-‐306 (Revised), “Non-‐GAAP Financial Measures and Additional GAAP Measures”, the table below calculates the level of debt. Amounts per condensed Share of amounts consolidated from investment financial statements in joint ventures (1) Non-‐current debt Current debt Total debt Less cash Total adjusted debt, net of cash Total assets Adjustments: Investment in joint ventures Less cash Total assets, net of cash Debt-‐to-‐gross book value Debt-‐to-‐gross book value, net of cash Debt-‐to-‐gross book value, net of cash, net of convertible debentures $ $ 1,162,948 57,805 1,220,753 67,920 1,152,833 2,408,567 (179,140) 2,229,427 67,920 2,161,507 $ $ 163,345 3,231 166,576 3,714 162,862 169,920 179,140 349,060 3,714 345,346 March 31, 2015 Total $ $ 1,326,293 61,036 1,387,329 71,634 1,315,695 2,578,487 -‐ 2,578,487 71,634 2,506,853 54% 52% 46% (1) Non-‐current debt includes convertible debentures valued at $152,898 at March 31, 2015. (1) Amounts per consolidated financial statements Non-‐current debt Current debt Total debt Less cash Total adjusted debt, net of cash Total assets Adjustments: Investment in joint ventures Less cash Total assets, net of cash Debt-‐to-‐gross book value Debt-‐to-‐gross book value, net of cash Debt-‐to-‐gross book value, net of cash, net of convertible debentures $ $ 1,157,882 70,514 1,228,396 121,939 1,106,457 2,432,383 (159,967) 2,272,416 121,939 2,150,477 (1) Non-‐current debt includes convertible debentures valued at $152,365 at December 31, 2014. Dream Global REIT 2015 First Quarter Report | 37 December 31, 2014 Share of amounts from investment in joint ventures Total $ $ 149,747 2,989 152,736 3,122 149,614 156,042 159,967 316,009 3,122 312,887 $ $ 1,307,629 73,503 1,381,132 125,061 1,256,071 2,588,425 -‐ 2,588,425 125,061 2,463,364 53% 51% 45% Interest coverage ratio Management believes this non-‐GAAP measurement is an important measure in determining our ability to cover interest expense based on our operating performance. Interest coverage ratio as shown below is calculated as net rental income plus interest and fee income, less general and administrative expenses and portfolio management expenses, all divided by interest expense on total debt. In compliance with Canadian Securities Administrators Staff Notice 52-‐306 (Revised), “Non-‐GAAP Financial Measures and Additional GAAP Measures”, the table below calculates the interest coverage ratio. For the three months ended March 31, 2015 Amounts per condensed Share of amounts consolidated from investment financial statements in joint ventures Total Net rental income Add: Interest and other income Less: General and administrative expenses Less: Portfolio management expenses Interest expense Interest coverage ratio $ $ 33,885 1,014 4,049 1,450 29,400 9,834 $ $ 4,413 55 619 -‐ 3,849 1,174 $ $ 38,298 1,069 4,668 1,450 33,249 11,008 3.02 Amounts per consolidated financial statements Net rental income Add: Interest and other income Less: General and administrative expenses Less: Portfolio management expenses Interest expense Interest coverage ratio $ $ Dream Global REIT 2015 First Quarter Report | 38 178,112 418 16,852 4,571 157,107 48,198 For the year ended December 31, 2014 Share of amounts from investment in joint ventures Total $ $ 1,352 14 206 -‐ 1,160 373 $ $ 179,464 432 17,058 4,571 158,267 48,571 3.26 Debt-‐to-‐adjusted EBITDFV Management believes this non-‐GAAP measurement is an important measure in determining the time it takes the Trust, based on its operating performance, to repay its debt. Debt-‐to-‐adjusted EBITDFV as shown below is calculated as total debt divided by the sum of net income for the quarter adjusted for fair value adjustments to investment properties and financial instruments, gain/loss on sale of investment properties, interest expense, depreciation and income taxes. A further adjustment is made for properties acquired during the quarter to reflect net rental income as if the properties were held for the full quarter. In compliance with Canadian Securities Administrators Staff Notice 52-‐306 (Revised), “Non-‐GAAP Financial Measures and Additional GAAP Measures”, the table below calculates the debt-‐to-‐adjusted EBITDFV. Amounts per condensed consolidated financial statements Non-‐current debt Current debt Total debt Net income for the quarter Fair value adjustments to investment properties Fair value adjustments to financial instruments Internal direct leasing costs Gain on sale of investment properties Depreciation and amortization Interest expense Provision for (recovery of) income taxes Adjusted net rental income of properties acquired in the quarter EBITDFV (1) EBITDFV – adjusted for foreign exchange Debt-‐to-‐adjusted EBITDFV (three months ended) Debt-‐to-‐adjusted EBITDFV (years) annualized $ $ 1,162,948 57,805 1,220,753 32,444 (7,740) (7,688) 542 (976) 30 9,834 2,959 642 30,047 March 31, 2015 Total Share of amounts from investment in joint ventures $ $ $ $ $ 163,345 3,231 166,576 10,926 (8,209) -‐ -‐ -‐ -‐ 1,174 (42) -‐ 3,849 1,326,293 61,036 1,387,329 43,370 (15,949) (7,688) 542 (976) 30 11,008 2,917 642 33,896 33,061 42.0 10.5 (1) EBITDFV is adjusted to the period-‐end exchange rate from the quarterly average exchange rate. Amounts per consolidated financial statements Non-‐current debt Current debt Total debt Net income for the quarter Fair value adjustments to investment properties Fair value adjustments to financial instruments Internal direct leasing costs (Gain) loss on sale of investment properties Depreciation and amortization Interest expense Provision for (recovery of) income taxes Adjusted net rental income of properties acquired in the quarter EBITDFV (1) EBITDFV – adjusted for foreign exchange Debt-‐to-‐adjusted EBITDFV (three months ended) Debt-‐to-‐adjusted EBITDFV (years) annualized $ $ 1,157,882 70,514 1,228,396 57,810 12,876 (876) 324 (44,332) 45 11,690 (1,565) 892 36,864 (1) EBITDFV is adjusted to the period-‐end exchange rate from the quarterly average exchange rate. Dream Global REIT 2015 First Quarter Report | 39 December 31, 2014 Share of amounts from investment in joint ventures Total $ $ 149,747 2,989 152,736 2,487 (1,703) -‐ -‐ -‐ -‐ 373 3 -‐ 1,160 $ $ $ 1,307,629 73,503 1,381,132 60,297 11,173 (876) 324 (44,332) 45 12,063 (1,562) 892 38,024 37,627 36.7 9.2 SECTION III – DISCLOSURE CONTROLS AND PROCEDURES AND INTERNAL CONTROLS OVER FINANCIAL REPORTING At March 31, 2015, the Chief Executive Officer (“CEO”) and Chief Financial Officer (“CFO”) of the Trust, along with the assistance of senior management, have designed disclosure controls and procedures to provide reasonable assurance that material information relating to Dream Global REIT is made known to the CEO and CFO, and have designed internal controls over financial reporting to provide reasonable assurance regarding the reliability of financial reporting and the preparation of the condensed consolidated financial statements in accordance with IFRS. During the three months ended March 31, 2015, there have not been any changes that have materially affected, or are reasonably likely to materially affect, the internal controls over financial reporting. Please refer to our 2014 Annual Report or our Annual Information Form dated March 30, 2015 and filed on SEDAR (www.sedar.com). SECTION IV – RISKS AND OUR STRATEGY TO MANAGE Investing in Units of the Trust involves a moderate degree of risk. For a full list and explanation of our risks and uncertainties, please refer to our 2014 Annual Report or our Annual Information Form dated March 30, 2015 and filed on SEDAR (www.sedar.com). SECTION V – CRITICAL ACCOUNTING POLICIES CRITICAL ACCOUNTING JUDGMENTS, ESTIMATES AND ASSUMPTIONS IN APPLYING ACCOUNTING POLICIES Preparing the condensed consolidated financial statements requires management to make judgments, estimates and assumptions that affect the reported amounts of assets, liabilities, revenue and expenses, and the disclosures of contingent liabilities. Management bases its judgments and estimates on historical experience and other factors it believes to be reasonable under the circumstances, but that are inherently uncertain and unpredictable, the result of which forms the basis of the carrying amounts of assets and liabilities. However, uncertainty about these assumptions and estimates could result in outcomes that could require a material adjustment in the future to the carrying amounts of the asset or liability affected. Dream Global REIT’s critical accounting judgments, estimates and assumptions in applying accounting policies are described in Note 4 to the condensed consolidated financial statements and also in our annual consolidated financial statements for the year ended December 31, 2014. CHANGES IN ACCOUNTING ESTIMATES AND CHANGES IN ACCOUNTING POLICIES Accounting policy changes Dream Global REIT’s accounting policy changes are described in Note 3 to the condensed consolidated financial statements. Additional information relating to Dream Global REIT, including our Annual Information Form dated March 30, 2015, is available on SEDAR at www.sedar.com. Dream Global REIT 2015 First Quarter Report | 40 Condensed consolidated balance sheets (unaudited) (in thousands of Canadian dollars) Note 2014 Assets NON-‐CURRENT ASSETS Investment properties Investment in joint ventures Notes receivable Derivative financial instruments Other non-‐current assets CURRENT ASSETS Amounts receivable Prepaid expenses Derivative financial instruments Cash Assets held for sale Total assets Liabilities NON-‐CURRENT LIABILITIES Debt Deposits Derivative financial instruments Deferred Unit Incentive Plan Deferred income tax liabilities CURRENT LIABILITIES Debt Amounts payable and accrued liabilities Income tax payable Derivative financial instruments Distributions payable Liabilities related to assets held for sale 6 7 20 11 8 9 11 16 10 11 12 19 10 13 11 14 16 20 15 2,079,440 $ 179,140 4,784 8,369 1,908 2,273,641 17,353 2,428 966 67,920 88,667 46,259 2,408,567 $ 1,162,948 $ 1,646 2,256 12,040 3,102 1,181,992 57,805 43,960 1,369 6,686 7,461 117,281 1,741 1,301,014 Total liabilities Equity Unitholders’ equity Retained earnings (deficit) Accumulated other comprehensive income (loss) Total unitholders’ equity Non-‐controlling interest Total equity Total liabilities and equity $ $ $ $ 1,095,381 11,943 (5,871) 1,101,453 6,100 1,107,553 2,408,567 $ See accompanying notes to the condensed consolidated interim financial statements. On Behalf of the Board of Trustees of Dream Global Real Estate Investment Trust: MICHAEL J. COOPER Trustee P. JANE GAVAN Trustee Dream Global REIT 2015 First Quarter Report | 41 March 31, 2015 December 31, 2,079,671 159,967 4,930 -‐ 1,698 2,246,266 17,455 2,360 -‐ 121,939 141,754 44,363 2,432,383 1,157,882 1,802 3,420 9,365 719 1,173,188 70,514 49,485 1,268 8,853 7,431 137,551 1,424 1,312,163 1,091,317 (8,808) 31,516 1,114,025 6,195 1,120,220 2,432,383 Condensed consolidated statements of net income and comprehensive income (unaudited) (in thousands of Canadian dollars) Note Investment properties revenue Investment properties operating expenses Net rental income Other income Interest and other income Share of net income from investment in joint ventures Other expenses Portfolio management General and administrative Depreciation and amortization Interest expense Fair value adjustments, gain (loss) on sale of investment properties and other activities Fair value adjustments to investment properties Fair value adjustments to financial instruments Internal direct leasing costs Gain (loss) on sale of investment properties Income before income taxes Current income taxes expense Deferred income taxes expense Provision for income taxes Net income Total net income for the period attributable to: Unitholders of the Trust Shareholders of the subsidiaries Net income Foreign currency translation adjustments for the period attributable to: Unitholders of the Trust Shareholders of the subsidiaries Comprehensive income (loss) for the period attributable to: Unitholders of the Trust Shareholders of the subsidiaries See accompanying notes to the condensed consolidated interim financial statements. $ $ $ 7 17 6, 16 18 6, 7 19 20 Dream Global REIT 2015 First Quarter Report | 42 $ Three months ended March 31, 2015 2014 51,458 (17,573) 33,885 1,014 10,931 11,945 (1,450) (4,049) (30) (9,834) (15,363) 7,740 7,688 (542) 976 15,862 46,329 (185) (2,774) (2,959) 43,370 43,234 136 43,370 $ $ $ 67,133 (21,333) 45,800 56 3 59 (1,278) (3,650) (25) (12,014) (16,967) (6,223) (8,168) (512) (476) (15,379) 13,513 (195) (826) (1,021) 12,492 12,492 -‐ 12,492 (37,387) (231) (37,618) 5,847 (95) 5,752 $ 46,513 -‐ 46,513 59,005 -‐ 59,005 Condensed consolidated statements of changes in equity Balance at January 1, 2015 Net income for the period (unaudited) (in thousands of Canadian dollars, except number of Units) Note Number of Units Unitholders’ equity 111,466,697 $ -‐ 1,091,317 $ -‐ -‐ -‐ -‐ Distributions paid 14 Distributions payable 14 -‐ Distribution Reinvestment Plan 15 385,994 Unit Purchase Plan 15 527 3,486 5 Deferred Unit Incentive Plan 15 51,188 -‐ 508 65 -‐ Issue costs Foreign currency translation Adjustment Balance at March 31, 2015 -‐ 111,904,406 $ 1,095,381 $ (8,808) $ 43,234 (15,022) Note -‐ -‐ 11,943 $ of Units equity 1,075,520 $ -‐ Distributions paid Distributions payable 14 Distribution Reinvestment Plan 15 Unit Purchase Plan 15 Deferred Unit Incentive Plan 15 -‐ 459,047 1,063 31,730 -‐ Issue costs Foreign currency translation Adjustment Balance at March 31, 2014 -‐ 110,190,817 $ -‐ -‐ 4,106 10 Total 1,120,220 6,195 $ 43,234 136 43,370 -‐ -‐ (15,022) -‐ (15,022) (7,461) -‐ (7,461) -‐ -‐ 3,486 -‐ 3,486 5 -‐ 5 -‐ -‐ 508 -‐ 508 65 -‐ 65 (37,387) (5,871) $ Accumulated other comprehensive (37,387) 1,101,453 $ (231) 6,100 $ (37,618) 1,107,553 Deficit income Total (127,702) $ 12,492 86,187 $ -‐ 1,034,005 12,492 (14,817) (7,346) 4,106 10 (14,817) (7,346) -‐ -‐ -‐ -‐ -‐ -‐ 282 (58) -‐ -‐ -‐ -‐ 282 (58) -‐ -‐ 46,513 1,079,860 $ (137,373) $ 132,700 $ 46,513 1,075,187 See accompanying notes to the condensed consolidated interim financial statements. 1,114,025 $ -‐ -‐ Number Unitholders’ 109,698,977 $ -‐ 14 -‐ Net income for the period Non-‐ controlling interest Attributable to unitholders of the Trust Balance at January 1, 2014 31,516 $ -‐ (7,461) -‐ (unaudited) (in thousands of Canadian dollars, except number of Units) Attributable to unitholders of the Trust Accumulated Retained other Total earnings comprehensive unitholders’ (deficit) income (loss) equity Dream Global REIT 2015 First Quarter Report | 43 Condensed consolidated statements of cash flows (unaudited) (in thousands of Canadian dollars) Note Three months ended March 31, 2015 2014 Generated from (utilized in) operating activities Net income Non-‐cash items: Share of net income from investment in joint ventures Deferred income taxes expense Amortization of lease incentives Amortization of financing costs Amortization of fair value adjustment on acquired debt Amortization of initial discount on convertible debentures (Gain) loss on sale of investment properties Depreciation and amortization Deferred unit compensation expense and deferred asset management fees Straight-‐line rent adjustment Fair value adjustments to financial instruments Fair value adjustments to investment properties Cash settlement on foreign exchange contracts Cash settlement on interest rate swap Lease incentives and initial direct leasing costs Change in non-‐cash working capital Generated from (utilized in) investing activities Investment in building improvements Acquisition of investment properties Net proceeds from sale of interest to POBA Cash assumed by the POBA joint venture Net proceeds from disposal of investment properties Distributions from investment in joint ventures Generated from (utilized in) financing activities Mortgage proceeds Financing costs on debts placed Mortgage principal repayments Repayment of term loan credit facility Drawdown on revolving credit facility Units issued for cash Unit issue costs Distributions paid on Units Decrease in cash Effect of exchange rate changes on cash Cash, beginning of period Cash, end of period See accompanying notes to the condensed consolidated interim financial statements. 43,370 (10,931) 2,774 512 774 (30) 287 (976) 30 930 (336) (7,688) (7,740) (753) (1,662) (3,216) (1,160) 14,185 (2,629) (140,701) 16,094 (5,186) 20,357 1,627 (110,438) 107,393 (1,730) (23,127) (17,876) -‐ 5 65 (18,967) 45,763 (50,490) (3,529) 121,939 67,920 Dream Global REIT 2015 First Quarter Report | 44 12 18 6 21 6, 16 5 7 6 15 14 $ $ $ $ 12,492 (3) 826 379 812 (98) 265 476 25 981 32 8,168 6,223 (2,917) (1,603) (1,553) (2,798) 21,707 (2,372) (121,254) -‐ -‐ 18,572 -‐ (105,054) 13,237 (920) (4,172) (9,852) 38,068 10 (430) (18,025) 17,916 (65,431) 4,149 106,292 45,010 Notes to the condensed consolidated financial statements (All dollar amounts in thousands of Canadian dollars, except unit amounts) Note 1 ORGANIZATION Dream Global Real Estate Investment Trust (the “REIT” or the “Trust”), formerly called Dundee International REIT, is an open-‐ ended investment trust created pursuant to a Declaration of Trust dated April 21, 2011, under the laws of the Province of Ontario, and is domiciled in Ontario. The condensed consolidated financial statements of the REIT include the accounts of the REIT and its consolidated subsidiaries. The REIT’s portfolio comprises office, industrial and mixed use properties located in Germany. The address of the Trust’s registered office is 30 Adelaide Street East, Suite 1600, Toronto, Ontario, Canada M5C 3H1. The Trust is listed on the Toronto Stock Exchange under the symbol DRG.UN. The Trust’s condensed consolidated financial statements for the period ended March 31, 2015 were authorized for issue by the Board of Trustees on May 6, 2015, after which date the condensed consolidated financial statements may only be amended with Board approval. Note 2 SUMMARY OF SIGNIFICANT ACCOUNTING POLICIES Basis of presentation These condensed consolidated interim financial statements have been prepared in accordance with International Accounting Standard (“IAS”) 34, “Interim Financial Reporting” (“IAS 34”), as issued by the International Accounting Standards Board (“IASB”). Accordingly, certain information and footnote disclosures normally included in annual consolidated financial statements prepared in accordance with International Financial Reporting Standards (“IFRS”), as issued by the IASB, have been omitted or condensed. These condensed consolidated interim financial statements have been prepared using the same significant accounting policies and methods as those used in the consolidated financial statements for the year ended December 31, 2014. These condensed consolidated interim financial statements should be read in conjunction with the Trust’s consolidated financial statements for the year ended December 31, 2014. Note 3 ACCOUNTING POLICIES SELECTED AND APPLIED FOR SIGNIFICANT TRANSACTIONS AND EVENTS Future changes in accounting standards Revenue recognition IFRS 15, “Revenue from Contracts with Customers” (“IFRS 15”), provides a comprehensive five-‐step revenue recognition model for all contracts with customers. The IFRS 15 revenue recognition model requires management to exercise significant judgment and make estimates that affect revenue recognition. IFRS 15 is effective for annual periods beginning on or after January 1, 2017, with earlier application permitted. The Trust is currently evaluating the impact of adopting this standard on the consolidated financial statements. Dream Global REIT 2015 First Quarter Report | 45 Financial instruments The final version of IFRS 9, “Financial Instruments” (“IFRS 9”), was issued by the IASB in July 2014 and will replace IAS 39, “Financial Instruments: Recognition and Measurement”. IFRS 9 introduces a model for classification and measurement, a single, forward-‐looking “expected loss” impairment model and a substantially reformed approach to hedge accounting. The new single, principle-‐based approach for determining the classification of financial assets is driven by cash flow characteristics and the business model in which an asset is held. The new model also results in a single impairment model being applied to all financial instruments, which will require more timely recognition of expected credit losses. It also includes changes in respect of an entity’s own credit risk in measuring liabilities elected to be measured at fair value, so that gains caused by the deterioration of an entity’s own credit risk on such liabilities are no longer recognized in profit or loss. IFRS 9 is effective for annual periods beginning on or after January 1, 2018; however, it is available for early adoption. In addition, the own credit changes can be early adopted in isolation without otherwise changing the accounting for financial instruments. The Trust is currently evaluating the impact of adopting this standard on the consolidated financial statements. Presentation of financial statements IAS 1, “Presentation of Financial Statements” (“IAS 1”), was amended by the IASB to clarify guidance on materiality and aggregation, the presentation of subtotals, the structure of financial statements and disclosure of accounting policies. The amendment gives guidance that information within the consolidated balance sheets and statements of comprehensive income should not be aggregated or disaggregated in a manner that obscures useful information, and that disaggregation may be required in the statement of comprehensive income in the form of additional subtotals as they are relevant to understanding the entity’s financial position or performance. The amendments to IAS 1 are effective for periods beginning on or after January 1, 2016. The Trust is currently evaluating the impact of adopting this standard on the consolidated financial statements. Equity method in separate financial statements IAS 27, “Separate Financial Statements” (“IAS 27”), was amended by the IASB to restore the option to use the equity method to account for investments in subsidiaries, joint ventures and associates in an entity’s separate financial statements. An entity can now account for investments at cost, in accordance with IFRS 9 or using the equity method as described in IAS 28. The amendment to IAS 27 is effective for periods beginning on or after January 1, 2016. The Trust is currently evaluating the impact of adopting this standard on the consolidated financial statements. Acquisitions of interests in joint operations IFRS 11, “Joint Arrangements” (“IFRS 11”), has been amended to require the application of IFRS 3 to transactions where an investor obtains an interest in a joint operation that constitutes a business. The amendment to IFRS 11 is effective for periods beginning on or after January 1, 2016. The Trust is currently evaluating the impact of adopting this standard on the consolidated financial statements. Financial instruments – disclosures IFRS 7, “Financial instruments: Disclosures” (“IFRS 7”), has been amended by the IASB to require additional disclosures on transition from IAS 39 to IFRS 9. The amendment to IFRS 7 is effective for periods beginning on or after January 1, 2018. The Trust is currently evaluating the impact of adopting this standard on the consolidated financial statements. Note 4 CRITICAL ACCOUNTING JUDGMENTS, ESTIMATES AND ASSUMPTIONS IN APPLYING ACCOUNTING POLICIES The preparation of the condensed consolidated interim financial statements requires management to make judgments, estimates and assumptions that affect the application of accounting policies and the reported amounts of assets and liabilities, income and expense. Actual results may differ from those estimates. In preparing these condensed consolidated interim financial statements, the significant judgments made by management in applying the Trust’s accounting policies and the key sources of estimation uncertainty were the same as those that applied to the consolidated financial statements for the year ended December 31, 2014. Dream Global REIT 2015 First Quarter Report | 46 Note 5 PROPERTY ACQUISITION The following acquisition was completed during the three months ended March 31, 2015: Property type Millerntorplatz 1, Hamburg Total (1) Includes transaction costs. Interest acquired Purchase (1) price Office 100% $ $ 143,691 143,691 Date acquired February 6, 2015 On February 6, 2015, the REIT acquired Millerntorplatz 1, an office property located in Hamburg, Germany, for $143,691. The acquisition was partially financed by a new mortgage of $84,283. The assets acquired and liabilities assumed in the transaction were allocated as follows: For the three months ended March 31, 2015 (1) Investment properties Total purchase price The consideration paid consists of: Cash Liabilities assumed Net transaction costs Total consideration $ $ $ $ (1) Includes transaction costs. 143,691 143,691 140,701 3,129 (139) 143,691 Note 6 INVESTMENT PROPERTIES The REIT has determined that it has two asset classes of investment properties reflecting their distinct nature, characteristics and risks. Initial Properties The Initial Properties consist of the properties that were acquired on August 3, 2011. These properties consist of national and regional administration offices, mixed use retail, banking and distribution properties, and regional logistics headquarters of Deutsche Post. The properties are generally situated in city centres and geographically dispersed throughout Germany and are smaller and older than the properties acquired subsequent to 2011. Acquisition Properties These investment properties were acquired during 2012 to 2015, consist of high-‐quality office buildings located in Germany’s largest office markets, and are generally newer or recently refurbished buildings. Dream Global REIT 2015 First Quarter Report | 47 Balance as at January 1, 2015 Purchase of investment properties: Acquisition of properties Building improvements Lease incentives and initial direct leasing costs Total additions to investment properties Disposal of investment properties: Sales of investment properties Transfers to disposal groups classified as assets held for sale – POBA (1) joint venture assets Transfers to disposal groups classified as assets held for sale Total disposal of investment properties Gains (losses) and amortization included in net income: Change in fair value of investment properties Amortization of lease incentives Total gains (losses) and amortization included in net income Gains and losses included in other comprehensive income: Foreign currency translation loss Total losses included in other comprehensive income Balance as at March 31, 2015 Changes in unrealized gain included in net income for the period ended March 31, 2015: Change in fair value of investment properties $ $ $ Total 2,079,671 143,691 2,580 3,216 149,487 (142) (69,368) (23,511) (93,021) 6,921 (512) 6,409 (63,106) (63,106) 2,079,440 6,921 $ $ $ Initial Properties Acquisition Properties 795,362 -‐ 1,393 2,557 3,950 (142) -‐ (23,511) (23,653) 166 (464) (298) (22,895) (22,895) 752,466 166 1,284,309 $ $ $ 143,691 1,187 659 145,537 -‐ (69,368) -‐ (69,368) 6,755 (48) 6,707 (40,211) (40,211) 1,326,974 6,755 (1) POBA joint venture refers to the Public Officials Benefit Association joint venture. Balance as at January 1, 2014 Purchase of investment properties: Acquisition of properties Building improvements Lease incentives and initial direct leasing costs Total additions to investment properties Disposal of investment properties: Sales of investment properties Transfers to disposal groups classified as assets held for sale – POBA (1) joint venture assets Transfers to disposal groups classified as assets held for sale Total disposal of investment properties Gains (losses) and amortization included in net income: Change in fair value of investment properties Amortization of lease incentives Total gains (losses) and amortization included in net income Gains and losses included in other comprehensive income: Foreign currency translation loss Total losses included in other comprehensive income Balance as at December 31, 2014 Changes in unrealized gain (losses) included in net income for the year ended December 31, 2014: Change in fair value of investment properties $ $ $ Total 2,390,244 422,166 12,730 14,908 449,804 (144) (573,521) (161,174) (734,839) 76,639 (1,458) 75,181 (100,719) (100,719) 2,079,671 36,405 (1) POBA joint venture refers to the Public Officials Benefit Association joint venture. Dream Global REIT 2015 First Quarter Report | 48 $ $ $ Initial Properties 985,212 -‐ 9,949 11,085 21,034 (144) -‐ (161,174) (161,318) (13,186) (1,247) (14,433) (35,133) (35,133) 795,362 (11,541) $ $ $ Acquisition Properties 1,405,032 422,166 2,781 3,823 428,770 -‐ (573,521) -‐ (573,521) 89,825 (211) 89,614 (65,586) (65,586) 1,284,309 47,946 Straight-‐line rent receivable, composed of free rent and contractual rent increases accrued to rental revenue, of $1,655 (December 31, 2014 – $1,429) has been included in other non-‐current assets. During the three months ended March 31, 2015, the balance of the investment properties decreased by $231, reflecting the reclassification to assets held for sale of $23,511, the sale of an Acquisition Property to the POBA joint venture for a fair value of $69,368, as well as an unrealized foreign exchange loss of $63,106 due to depreciation of the Canadian dollar against the euro since December 31, 2014. These reductions were mostly offset by an acquisition during the quarter totalling $143,691. (Refer to Note 5 for details of the acquisition.) The REIT retained a 50% interest in the asset sold to the joint venture with POBA and is classified as an investment in joint ventures. (Refer to Note 7 for details on joint arrangements.) During the three months ended March 31, 2015, the fair value of the Acquisition Properties increased by $14,444, partially reduced by a write-‐off of $7,689 of capitalized transaction and other costs, resulting in a net increase in fair value adjustments of $6,755. During the three months ended March 31, 2015, the REIT disposed of ten investment properties that were acquired in 2011 as part of the Initial Properties, nine of which were reclassified as assets held for sale as at December 31, 2014. Net proceeds of $20,357 (December 31, 2014 – $126,425) were received on these sales and a loss on sale of $987 (December 31, 2014 – $4,464) related to the transaction costs incurred was recorded. As at March 31, 2015, the REIT had entered into binding purchase and sale agreements to sell 20 properties, valued at $44,895, and these properties have been reclassified as assets held for sale. In total, the REIT also recorded a fair value gain of $819 on these properties. (Refer to Note 16 for details on the assets held for sale.) Fair value hierarchy Investment properties measured at fair value in the condensed consolidated balance sheets are categorized by level according to the significance of the inputs used in making the measurements. Recurring measurements Investment properties Initial Properties Acquisition Properties Total Non-‐recurring measurements Properties reclassified to assets held for sale $ $ $ Quoted prices in active markets for identical March 31, instruments 2015 (Level 1) 752,466 1,326,974 2,079,440 44,895 $ $ $ -‐ -‐ -‐ -‐ Significant other observable inputs (Level 2) Significant unobservable inputs (Level 3) $ $ $ $ $ $ -‐ -‐ -‐ 44,895 752,466 1,326,974 2,079,440 -‐ Note 7 JOINT ARRANGEMENTS The Trust participates in partnerships (“joint ventures”) with other parties that own investment properties and accounts for its interests using the equity method. During Q1 2015, the REIT entered into another joint venture agreement with POBA to sell a 50% interest in an Acquisition Property, which was held in a separate subsidiary. Altogether, the REIT now has a total of eight Acquisition Properties under this arrangement. The closing of this property was completed at the end of January 2015. Pursuant to this arrangement, the REIT no longer has control of this property subsidiary and, as such, has classified its 50% interest in the entity as investment in joint venture and accounted for the investment using the equity method. As a result, an Acquisition Property valued at $69,368 and the related mortgage valued at $40,698 were derecognized as at March 31, 2015. The total consideration to the REIT for the 50% interest in the investment property was $36,782. The consideration consisted of the assumption of working capital of $102 and POBA assuming 50% of the outstanding mortgage, which totalled $20,349, with the balance of $16,331 paid to the REIT in cash. The REIT incurred transaction costs of $237 relating to the sale, resulting in net proceeds to the REIT of $16,094. The REIT recorded a gain on the sale of $1,963, including $390 of deferred tax gain. Dream Global REIT 2015 First Quarter Report | 49 During Q1 2015, the REIT recorded fee income relating to the POBA joint venture of $663 (three months ended March 31, 2014 – nil), which is included in interest and other income. The investment properties that the joint ventures hold are consistent in terms of the class and type of properties held in the Trust’s portfolio. Name Location POBA joint venture Löwenkontor Vordernbergstrasse 6/Heilbronner Strasse 35 (Z-‐UP) Speicherstrasse 55 (Werfthaus) Derendorfer Allee 4–4a (doubleU) Neue Mainzer Strasse 28 (K26) ABC-‐Strasse 19 (ABC Bogen) Marsstrasse 20–22 Liebknechtstr. 33/35, Heßbrühlstr. 7 (Officium) Lorac Investment Management S.à r.l. Berlin, Germany Stuttgart, Germany Frankfurt, Germany Düsseldorf, Germany Frankfurt, Germany Hamburg, Germany Munich, Germany Stuttgart, Germany Luxembourg, Luxembourg Ownership interest (%) March 31, December 31, 2015 2014 50 50 50 50 50 50 50 50 50 50 50 50 50 50 50 50 100 50 Name Löwenkontor Vordernbergstrasse 6/Heilbronner Strasse 35 (Z-‐UP) Speicherstrasse 55 (Werfthaus) Derendorfer Allee 4–4a (doubleU) Neue Mainzer Strasse 28 (K26) ABC-‐Strasse 19 (ABC Bogen) Marsstrasse 20–22 Liebknechtstr. 33/35, Heßbrühlstr. 7 (Officium) Investment in POBA joint venture Lorac Investment Management S.à r.l. Total investment in joint ventures $ $ 22,439 11,278 20,655 19,788 27,588 36,549 25,295 15,388 178,980 160 179,140 Name Share of net income at % ownership interest for three months ended March 31, 2015 2014 Löwenkontor Vordernbergstrasse 6/Heilbronner Strasse 35 (Z-‐UP) Speicherstrasse 55 (Werfthaus) Derendorfer Allee 4–4a (doubleU) Neue Mainzer Strasse 28 (K26) ABC-‐Strasse 19 (ABC Bogen) Marsstrasse 20–22 Liebknechtstr. 33/35, Heßbrühlstr. 7 (Officium) Share of net income from POBA joint venture Lorac Investment Management S.à r.l. Share of net income from investment in joint ventures $ $ Dream Global REIT 2015 First Quarter Report | 50 Net assets at % ownership interest March 31, December 31, 2015 2014 2,042 159 365 335 315 3,784 2,245 1,681 10,926 5 10,931 $ $ $ $ 21,038 11,553 21,064 20,162 28,170 33,830 23,990 -‐ 159,807 160 159,967 -‐ -‐ -‐ -‐ -‐ -‐ -‐ -‐ -‐ 3 3 The following table presents the POBA joint venture at 100% and the Trust’s ownership interest in the assets, liabilities, revenues, expenses and cash flows in the equity accounted investments in which the Trust participates. POBA joint venture at 100% March 31, December 31, 2015 2014 POBA joint venture at 50% March 31, December 31, 2015 2014 Non-‐current assets Investment properties Other non-‐current assets Current assets Amounts receivable Prepaid expenses Cash Total assets Non-‐current liabilities Debt Deposits Current liabilities Debt Amounts payable and accrued liabilities Income tax payable Total liabilities Net assets $ $ 633,940 1,044 634,984 4,052 196 7,428 11,676 646,660 326,690 326 327,016 6,462 6,474 (112) 12,824 339,840 306,820 316,970 522 317,492 2,026 98 3,714 5,838 323,330 163,345 163 163,508 3,231 3,237 (56) 6,412 169,920 153,410 $ $ 568,834 968 569,802 4,456 56 6,244 10,756 580,558 299,494 292 299,786 5,978 6,222 98 12,298 312,084 268,474 $ $ $ $ 284,417 484 284,901 2,228 28 3,122 5,378 290,279 149,747 146 149,893 2,989 3,111 49 6,149 156,042 134,237 Investment properties revenue Investment properties operating expenses Net rental income Other income Interest income and other income Other expenses General and administrative Interest expense Fair value adjustments to investment properties Fair value adjustments to investment properties Income before income taxes Current income taxes Net income for the period $ $ POBA joint venture March 31, 2015 At 100% At 50% 10,904 (2,078) 8,826 110 110 (1,238) (2,348) (3,586) 16,418 21,768 84 21,852 $ $ 5,452 (1,039) 4,413 55 55 (619) (1,174) (1,793) 8,209 10,884 42 10,926 Cash flow generated from (utilized in): Operating activities Investing activities Financing activities Decrease in cash $ $ Dream Global REIT 2015 First Quarter Report | 51 POBA joint venture March 31, 2015 At 100% At 50% 404 434 (4,840) (4,002) $ $ 202 217 (2,420) (2,001) Note 8 OTHER NON-‐CURRENT ASSETS Other assets Fixtures and computer equipment Straight-‐line rent receivable Total $ $ March 31, 2015 37 216 1,655 1,908 December 31, 2014 $ $ 37 232 1,429 1,698 Note 9 AMOUNTS RECEIVABLE March 31, 2015 Trade receivables Less: Provision for impairment of trade receivables Trade receivables, net Other amounts receivable 2014 $ 11,908 (1,131) 10,777 6,576 $ 12,509 (1,165) 11,344 6,111 $ 17,353 $ 17,455 Total December 31, As at March 31, 2015, other amounts receivable include unbilled amounts from tenants in relation to operating cost recoveries of $4,163 (December 31, 2014 – $2,244). The carrying amount of amounts receivable approximates fair value due to their current nature. As at March 31, 2015, trade receivables of approximately $2,777 (December 31, 2014 – $3,599) were past due but not considered impaired as the Trust has ongoing relationships with these tenants and the aging of these trade receivables is not indicative of default. Note 10 DEBT Mortgage debt Convertible debentures Term loan credit facility Total Less: Current portion Non-‐current debt $ $ March 31, December 31, 2015 2014 721,924 152,898 345,931 1,220,753 (1) 57,805 $ 701,325 152,365 374,706 1,228,396 70,514 1,162,948 $ 1,157,882 (1) The current portion of debt includes $35,959 of the term loan credit facility associated with the assets held for sale. This balance will be paid from the proceeds from disposition when the respective asset sales close. First-‐ranking mortgages on all of the investment properties have been provided as security for either the mortgage debt or the term loan credit facility. Mortgage debt On February 6, 2015, the Trust drew on a mortgage with a principal balance of €59,400 ($84,283) at a fixed rate of 1.71% per annum, maturing on February 6, 2025, in connection with the acquisition of Millerntorplatz 1, in Hamburg. The mortgage requires quarterly repayments with a principal amortization of 1.25% per annum of the initial loan amount. Effective January 1, 2015, the Trust completed refinancings of two mortgages in the amounts of €43,619 and €27,674 related to two Acquisition Properties. The face rates of those mortgages were reduced from 2.07% and 2.09% to 1.92% and 1.88%, respectively, and the terms of the mortgages have been extended for an additional two years. On February 27, 2015, the Trust also completed the refinancing of an additional property for €16,500, at a face rate of 1.75% for eight years, while discharging the assumed mortgage with a face rate of 4.17%. Dream Global REIT 2015 First Quarter Report | 52 During the first quarter of 2015, the REIT sold a 50% interest in an additional Acquisition Property as part of the joint venture agreement with POBA. In conjunction with this sale, 50% of the mortgage debt relating to the asset was assumed by POBA. Since the investment in the joint venture is equity accounted, 100% of the debt, which totalled $40,698, on the property has been removed from mortgage debt in the Trust’s financial statements. Convertible debentures On August 3, 2011, the Trust issued a $140,000 principal amount of convertible unsecured subordinated debentures (the “Debentures”). On August 29, 2011, the Trust issued an additional $21,000 principal amount of Debentures. The Debentures bear interest at 5.5% per annum, payable semi-‐annually on July 31 and January 31 each year, and mature on July 31, 2018. Each Debenture is convertible at any time by the debenture holder into 76.9231 Units per one thousand dollars of face value, representing a conversion price of $13.00 per REIT Unit. On or after August 31, 2014, and prior to August 31, 2016, the Debentures may be redeemed by the Trust, in whole or in part, at a price equal to the principal amount plus accrued and unpaid interest on not more than 60 days’ and not less than 30 days’ prior written notice, provided the weighted average trading price for the Trust’s Units for the 20 consecutive trading days, ending on the fifth trading day immediately preceding the date on which notice of redemption is given, is not less than 125% of the conversion price. On or after August 31, 2016, and prior to July 31, 2018, the maturity date, the Debentures may be redeemed by the Trust at a price equal to the principal amount plus accrued and unpaid interest. The Debentures were initially recorded on the consolidated balance sheets as debt of $152,894 less costs of $6,931. In addition, the Trust allocated $8,106 to the conversion feature on initial recognition, which was deducted from the principal balance and will be accreted to the principal amount of the Debenture over its term. As at March 31, 2015, the outstanding principal amount is $161,000 (December 31, 2014 – $161,000). Term loan credit facility On August 3, 2011, the Trust obtained a term loan credit facility (the “Facility”) for gross proceeds of €328,500 ($448,395). Costs relating to the Facility were $10,896. These costs were reduced by proceeds of $9,555 received from the vendor to compensate the Trust for higher than expected financing costs. The Facility initially had a term of five years, which could be extended for a further two years, subject to the satisfaction of certain conditions precedent at the time of the extension. Variable rate interest is calculated and payable quarterly under the Facility at a rate equal to the aggregate of the three-‐month EURIBOR plus a margin of 200 basis points (the “margin”) and an agency fee of 10 basis points. Pursuant to the Facility, the Trust was required to enter into an interest rate swap that fixed 80% of the variable interest rate payable under the Facility (the “Fixed Rate Portion”) at a fixed interest rate not to exceed 3.5%, excluding the margin, and was required to purchase a cap instrument to cover 10% of the variable rate interest payable so that such interest rate does not exceed 5% (excluding the margin). The remaining 10% of interest payable would continue to be calculated quarterly on a variable rate basis. To comply with the Facility’s requirement, on the day of closing the Trust entered into an interest rate swap to pay a fixed rate of 4.05% on 80% of the Facility and an interest rate cap of 5.00% on 10% of the Facility at a cost of $9,986. No amortization of principal under the Facility is required during the first three years of the Facility term. Thereafter, interest together with amortization of principal equal to 2% per annum of the initial loan amount will be payable on a quarterly basis (including the extension term, if any). Effective August 3, 2013, the Trust was required to pay the additional interest of 1% on the portion of the €100,000 plus a 15% prepayment amount, less any amounts repaid. Additionally, an applicable prepayment fee of 0.25% is payable for repayments made prior to August 3, 2015. No repayment fee is payable for repayments made in the final year of the Facility. During the period ended March 31, 2015, the Trust repaid €13,096 ($17,876) in connection with the disposed properties including prepayment amounts, and mandatory repayments, in accordance with the terms of the Facility. During the year ended December 31, 2014, the Trust repaid €46,561 ($67,036) in connection with the disposed properties including prepayment amounts, and mandatory repayments, in accordance with the terms of the Facility. As a result of the disposition program, the €100,000 plus 15% prepayment portion has been reduced to €40,563 as at March 31, 2015, all of which was allocated to the Fixed Rate Portion of the Facility, since the variable portion of the Facility has been repaid. Factoring the additional 1% the Trust has to pay on the €40,563 ($55,259), the Trust paid a rate of 4.21% (December 31, 2014 – 4.23%) on the Fixed Rate Portion of €254,063. As at March 31, 2015, the Trust does not carry any variable portion of the Facility (December 31, 2014 – €5,673 at 3.23%), resulting in a blended rate of 4.21% as at March 31, 2015 (December 31, 2014 – 4.21%). The Facility requires certain bank accounts to be pledged, and that all net rental income from the Initial Properties be paid into a rent collections account established by the Trust, to be released only after budgeted non-‐recoverable operating expenses (including an agreed property and asset management fee) are paid. Dream Global REIT 2015 First Quarter Report | 53 The Facility includes default and cash trap covenants requiring the Trust to maintain certain loan-‐to-‐value and debt service coverage ratios, each of which are calculated on a quarterly basis. The Facility agreement requires the debt service coverage ratio to be equal to or above 145% at each interest payment date. If these ratios are not met at any time, the lenders may withhold 50% of the excess cash flow on a monthly basis as additional security for the Facility until the ratios are once again satisfied. On satisfaction of the relevant ratio, the excess cash flow may again be distributed to the Trust; however, any cash previously trapped will not be released and will be used at the time of each future quarterly testing date until the ratio is satisfied for two consecutive quarters. As at March 31, 2015, the Trust was in compliance with its loan covenants. In addition, the Facility required that DAM and Dundee Corporation combined maintained at least $120,000 of equity in the REIT for a two-‐year period until August 3, 2013 and continue to maintain at least $48,000 of equity for the remainder of the term of the Facility. As at March 31, 2015, DAM and Dundee Corporation combined are in compliance with the requirements. Revolving credit facility On October 10, 2013, the REIT entered into an agreement with a Canadian bank to provide a revolving credit facility not to exceed €25,000. The REIT increased the revolving credit facility to €50,000 on August 14, 2014 and increased to €75,000 subsequently on April 1, 2015, with no change to the covenants or interest rate spreads and the term has been extended to September 25, 2016. The REIT has provided a general security agreement as collateral for the facility. The interest rate on any Canadian dollar advances is prime plus 200 basis points and/or bankers’ acceptance rates plus 300 basis points. For euro advances, the rate is 300 basis points over the three-‐month EURIBOR rate. Total financing costs incurred amounted to $816 as at March 31, 2015. The revolving credit facility agreement requires the Trust to maintain: a debt-‐to-‐book value rating not to exceed 0.6:1; a minimum interest coverage ratio of 2:1; and a minimum net worth of $700,000. As at March 31, 2015, the outstanding balance of the credit facility was €nil ($nil) and the Trust was in compliance with the covenants of the revolving credit facility. As at March 31, 2015, the Trust had an undrawn letter of credit in the amount of $1,635 committed against the credit facility. The weighted average interest rates for the fixed and floating components of debt are as follows: Fixed rate Mortgage debt (1) Term loan credit facility Convertible debentures Total fixed rate debt Variable rate Term loan credit facility Total variable rate debt Total debt Face interest rates March 31, December 31, 2015 2014 2.19% 4.21% 5.50% 3.18% -‐ -‐ 3.18% 2.33% 4.23% 5.50% 3.30% 3.23% 3.23% 3.30% Weighted average effective interest rate March 31, December 31, 2015 2014 2.40% 4.21% 7.31% 3.52% -‐ -‐ 3.52% 2.49% 4.23% 7.31% 3.61% 3.22% 3.22% 3.61% Maturity dates 2017–2025 2016 2018 2016 $ $ March 31, 2015 721,924 $ 345,931 152,898 1,220,753 -‐ -‐ 1,220,753 $ Debt amount December 31, 2014 701,325 366,749 152,365 1,220,439 7,957 7,957 1,228,396 (1) As at March 31, 2015, 100% of the term loan credit facility is subject to an interest rate swap in place until August 3, 2016, pursuant to the term loan credit facility agreement, and has been presented as fixed rate debt. Dream Global REIT 2015 First Quarter Report | 54 The scheduled principal repayments and debt maturities are as follows: Remainder of 2015 2016 2017 2018 2019 2020 and thereafter Acquisition date fair value adjustments Transaction costs Mortgages $ $ 9,635 13,040 64,019 143,330 38,498 462,666 731,188 $ $ Convertible Term loan debentures 42,672 303,438 -‐ -‐ -‐ -‐ 346,110 $ $ -‐ -‐ -‐ 161,000 -‐ -‐ 161,000 Total $ $ 52,307 316,478 64,019 304,330 38,498 462,666 1,238,298 (4,424) (13,121) 1,220,753 Interest rate derivatives The following table provides details on the interest rate derivatives outstanding as at March 31, 2015: Hedging item Notional Interest rate swaps Interest rate cap $ Total $ 352,642 44,752 397,394 Rate 4.05% 5.00% Maturity Carrying value 2016 $ 2016 $ (8,942) -‐ (8,942) Note 11 DERIVATIVE FINANCIAL INSTRUMENTS March 31, 2015 Interest rate swaps (note 22) $ Foreign exchange forward contracts (note 22) Conversion feature on the convertible debentures (notes 10 and 22) Total December 31, 2014 8,942 $ (5,170) $ 10,623 1,492 (4,165) (393) $ 158 12,273 March 31, 2015 Current portion Non-‐current portion Total assets Current portion Non-‐current portion Total liabilities $ (966) (8,369) (9,335) 6,686 2,256 8,942 Total derivative financial instruments $ December 31, 2014 $ -‐ -‐ -‐ 8,853 3,420 12,273 (393) $ 12,273 The movement in the conversion feature on the convertible debentures was as follows: For the three months ended March 31, 2015 Balance at beginning of period Remeasurement of conversion feature Balance at end of period Dream Global REIT 2015 First Quarter Report | 55 $ $ 158 (4,323) (4,165) Foreign exchange forward contracts The Trust has various currency forward contracts in place to sell euros for Canadian dollars for the next 36 months. The Trust currently has foreign exchange forward contracts to sell €118,290 total from April 2015 to March 2018 at an average exchange rate of $1.428 per euro. Note 12 DEFERRED UNIT INCENTIVE PLAN The movement in the Deferred Unit Incentive Plan balance was as follows: As at January 1, 2014 Compensation during the year Asset management fees during the year Issue of deferred units Remeasurements of carrying value As at December 31, 2014 Compensation during the period Asset management fees during the period Issue of deferred units Remeasurements of carrying value As at March 31, 2015 $ $ 6,306 1,648 2,541 (793) (337) 9,365 449 481 (508) 2,253 12,040 On August 3, 2011, DAM elected to receive the first $3,500 of the base asset management fees payable on the properties acquired on August 3, 2011 by way of deferred trust units under the Asset Management Agreement in each year for the next five years. The deferred trust units granted to DAM vest annually over five years, commencing on the fifth anniversary date of the units being granted. On termination of the Asset Management Agreement, unvested trust units granted to DAM vest immediately. Deferred units granted to DAM for payment of asset management fees are initially measured, and subsequently remeasured at each reporting date, at fair value. The deferred units are considered to be restricted stock, and the fair value is estimated by applying a discount to the market price of the corresponding Units. The discount is estimated based on a hypothetical put–call option, valued using a Black Scholes option pricing model, which takes into consideration the volatility of the Canadian REIT and the German real estate equity markets, the respective holding period of the deferred units, and the risk-‐free interest rate. The carrying value of the deferred units granted to DAM is most sensitive to changes in volatility and the relative weighting of the put option and call option values. The fair value of the deferred trust units is based on the market price of Dream Global REIT units and the application of an appropriate discount rate to reflect the vesting period. The significant unobservable inputs used in determining the discount include the following: For the three months ended March 31, 2015 For the year ended December 31, 2014 Risk-‐free rate Expected volatility 0.6%–1.1% 17.8%–36.9% 1.3%–1.5% 20.0%–34.0% Dream Global REIT 2015 First Quarter Report | 56 The volatility of the units is estimated based on comparable companies in both the German and Canadian real estate markets. The discount rate used to value the deferred trust units is determined by weighting a put-‐and-‐call model calculated using the Black Scholes option pricing model. A higher volatility or risk-‐free rate will decrease the value of the deferred trust units and vice versa. Fair value as at March 31, 2015 Units at March 31, 2015, closing price of $9.84 per unit Discount rate of 20% per unit for units issued in 2011 Discount rate of 23% per unit for units issued in 2012 Discount rate of 26% per unit for units issued in 2013 Discount rate of 49% per unit for units issued in 2014 Discount rate of 54% per unit for units issued in 2015 $ $ 14,489 (233) (814) (1,023) (2,200) (734) 9,485 Fair value as at December 31, 2014 Units at December 31, 2014, closing price of $8.57 per unit Discount rate of 24% per unit for units issued in 2011 Discount rate of 25% per unit for units issued in 2012 Discount rate of 46% per unit for units issued in 2013 Discount rate of 49% per unit for units issued in 2014 $ $ 11,695 (244) (771) (1,576) (2,043) 7,061 During the three months ended March 31, 2015, $481 of asset management fees were recorded (March 31, 2014 – $642) based on the fair value of the deferred units issued, with an appropriate discount to reflect the restricted period of exercise, and are included in general and administrative expenses. The fees were settled by the grant of 83,349 deferred trust units during the period (March 31, 2014 – 84,194) and 24,478 deferred trust units granted on April 1, 2015 (April 1, 2014 – 30,343). As at April 1, 2015, 1,472,486 unvested deferred trust units and income deferred units (April 1, 2014 – 1,026,614) were outstanding with respect to the asset management fee. Compensation expense of $449 for the period (March 31, 2014 – $339) was also included in general and administrative expenses. On February 18, 2015, 132,200 deferred trust units were granted to senior management and trustees. Of the 132,200 units granted, 105,000 relate to trustees and key management personnel. The grant date value for the deferred trust units of the grant was $9.21. On February 26, 2014, 110,300 deferred trust units were granted to senior management and trustees. Of the 110,300 units granted, 67,000 relate to trustees and key management personnel. The grant date value for the deferred trust units of the grant was $8.88. On May 7, 2014, 26,000 deferred trust units were granted to trustees and an additional 23,723 deferred trust units were granted to trustees who elected to receive their 2014 annual retainer in the form of deferred units rather than cash. Note 13 AMOUNTS PAYABLE AND ACCRUED LIABILITIES March 31, December 31, 2015 Trade payables Accrued liabilities and other payables Accrued interest Total $ $ Dream Global REIT 2015 First Quarter Report | 57 9,525 32,802 1,633 43,960 $ $ 2014 11,473 34,253 3,759 49,485 Note 14 DISTRIBUTIONS The following table breaks down distribution payments for the three months ended March 31: 2015 Paid in cash Paid by way of reinvestment in Units Less: Payable at December 31, 2014 (December 31, 2013) Plus: Payable at March 31, 2015 (March 31, 2014) Total $ $ 18,967 3,486 (7,431) 7,461 22,483 $ $ 2014 18,025 4,106 (7,314) 7,346 22,163 The distribution for the month of March 2015 in the amount of $0.0667 per unit, declared on March 19, 2015 and payable on April 15, 2015, amounted to $7,461. The amount payable as at March 31, 2015 was satisfied on April 15, 2015 by $6,373 cash and $1,088 through the issuance of 107,673 Units. The distribution for the month of April 2015 was declared in the amount of $0.0667 per unit, payable on May 15, 2015. The Trust declared distributions of $0.0667 per unit per month for the months of January 2015 to March 2015. Note 15 EQUITY Total March 31, 2015 Number of Units 111,904,406 $ December 31, 2014 Amount Number of Units 1,107,553 111,466,697 $ Amount 1,120,220 REIT Units The REIT is authorized to issue an unlimited number of Units and an unlimited number of Special Trust Units. The Special Trust Units may only be issued to holders of Exchangeable Notes. Distribution Reinvestment and Unit Purchase Plan The Distribution Reinvestment Plan (“DRIP”) allows holders of Units, other than unitholders who are resident of or present in the United States of America, to elect to have all cash distributions from the REIT reinvested in additional Units. Unitholders who participate in the DRIP receive an additional distribution of Units equal to 4% of each cash distribution that was reinvested. The price per unit is calculated by reference to a five-‐day weighted average closing price of the Units on the Toronto Stock Exchange preceding the relevant distribution date, which is typically on or about the 15th day of the month following the declaration. For the three months ended March 31, 2015, 385,994 Units were issued pursuant to the DRIP for $3,486 (March 31, 2014 – 459,047 Units for $4,106). The Unit Purchase Plan feature of the DRIP facilitates the purchase of additional Units by existing unitholders. Participation in the Unit Purchase Plan is optional and subject to certain limitations on the maximum number of additional Units that may be acquired. The price per unit is calculated in a similar manner to the DRIP. No commission, service charges or brokerage fees are payable by participants in connection with either the reinvestment or purchase features of the DRIP. For the three months ended March 31, 2015, 527 Units were issued under the Unit Purchase Plan for $5 (March 31, 2014 – 1,063 Units for $10). Deferred Unit Incentive Plan The Deferred Unit Incentive Plan (“DUIP”) provides for the grant of deferred trust units to trustees, officers and employees as well as affiliates and their service providers, including the asset manager. Deferred trust units are granted at the discretion of the trustees and earn income deferred trust units based on the payment of distributions. Once issued, each deferred trust unit and the related distribution of income deferred trust units vests evenly over a three-‐ or five-‐year period on the anniversary date of the grant except for certain deferred trust units granted to DAM under the Asset Management Agreement. Subject to an election option available for certain participants to postpone receipt of Units, such Units will be issued immediately on vesting. Up to a maximum of 2,074,000 deferred trust units are issuable under the DUIP. As of March 31, 2015, 2,074,000 deferred trust units were granted. For the three months ended March 31, 2015, 51,188 Units were issued to trustees, officers and employees pursuant to the DUIP for $508 (March 31, 2014 – 31,730 Units for $282). Dream Global REIT 2015 First Quarter Report | 58 Note 16 ASSETS HELD FOR SALE As at March 31, 2015, the Trust classified 20 properties as held for sale. Management has committed to a plan of sale, and therefore the properties have been reclassified as current assets for sale. Investment properties Other non-‐current assets Prepaid expenses and other assets Assets held for sale Amounts payable and accrued liabilities Liabilities related to assets held for sale Net assets $ $ March 31, December 31, 2015 2014 44,895 16 1,348 46,259 (1,741) (1,741) 44,518 $ $ 42,897 1 1,465 44,363 (1,424) (1,424) 42,939 Investment properties held for sale Balance at beginning of period Building improvements Lease incentives and initial direct leasing costs Investment properties reclassified as held for sale Investment properties reclassified as held for sale – POBA joint venture assets Fair value adjustments Disposals Disposals – POBA joint venture assets Foreign currency translation Balance at end of period For the three For the year months ended ended March 31, December 31, 2015 2014 $ $ 42,897 49 -‐ 23,511 69,368 819 (21,202) (69,368) (1,179) 44,895 $ $ 21,147 11 (131) 161,174 573,521 (4,392) (130,746) (573,521) (4,166) 42,897 Note 17 INTEREST EXPENSE Interest on debt Interest on debt incurred and charged to comprehensive income is recorded as follows: Three months ended March 31, 2015 Interest on term loan credit facility Interest on convertible debentures Interest on mortgage debt Standby fees on revolving credit facility Amortization of financing costs, discounts and fair value adjustments on acquired debt Interest other Interest expense Dream Global REIT 2015 First Quarter Report | 59 $ $ 2,265 2,190 4,121 209 1,031 18 9,834 $ $ 2014 3,225 2,190 5,551 69 979 -‐ 12,014 Note 18 FAIR VALUE ADJUSTMENTS TO FINANCIAL INSTRUMENTS Three months ended March 31, 2015 Fair value loss on interest rate swaps and cap Fair value gain (loss) on conversion feature of convertible debentures Fair value loss on Deferred Unit Incentive Plan Fair value gain (loss) on foreign exchange forward contracts $ $ (292) 4,323 (2,253) 5,910 7,688 2014 $ $ (1,307) (327) (644) (5,890) (8,168) Note 19 INCOME TAXES Reconciliation of tax expense Three months ended March 31, 2015 2014 Income before income taxes Income attributable to shareholders of subsidiaries Income before income taxes attributable to Unitholders of the Trust Tax calculated at the German corporate tax rate of 15.825% Increase (decrease) resulting from: Income related to equity accounted investments Effect of different tax rates in countries in which the group operates Income distributed and taxable to unitholders Tax benefits not previously recognized Impact from sale of assets Other items Provision for income taxes $ $ Deferred income tax assets (liabilities) consist of the following: 46,329 (136) 46,193 7,310 (1,472) (30) (2,830) (266) 390 (143) 2,959 March 31, 2015 $ $ 13,513 -‐ 13,513 2,138 -‐ (51) (1,091) (110) -‐ 135 1,021 Deferred tax liability related to difference in tax and book basis of investment properties Deferred tax asset related to difference in tax and book basis of financial instruments Deferred tax asset related to tax loss carry-‐forwards Deferred tax asset related to differences in tax and book basis of financing costs Deferred tax liability related to investment in joint venture Total deferred income tax liabilities $ $ (18,453) 1,753 13,369 271 (42) (3,102) December 31, 2014 $ $ (14,619) 2,110 11,443 390 (43) (719) Note 20 RELATED PARTY TRANSACTIONS AND ARRANGEMENTS Deferred units granted to DAM for payment of asset management fees are included in general and administrative expenses during the period as they relate to services provided during the year, and the units and fees are initially measured by applying a discount to the fair value of the corresponding Units. The discount is estimated by applying the Black Scholes option pricing model, taking into consideration the volatility of the Canadian REIT equity market and the German real estate industry. Once recognized, the liability is remeasured at each reporting date at a discount to the fair values of the corresponding Units, with the change being recognized in comprehensive income as a fair value adjustment to financial instruments. Dream Global REIT 2015 First Quarter Report | 60 During the three months ended March 31, 2015, the REIT recognized $1,769 (three months ended March 31, 2014 – $1,760) in relation to asset management fees under the Asset Management Agreement with DAM, which is included in general and administrative expenses. Of this total, $481 (three months ended March 31, 2014 – $642) was payable in deferred trust units and $1,288 (three months ended March 31, 2014 – $1,118) was payable in cash. As at April 1, 2015, a total of 1,472,486 (April 1, 2014 – 1,026,614) deferred trust units and income deferred trust units were previously granted under this agreement and remained unvested. The REIT also paid $681 for asset acquisition fees incurred on acquisitions completed in the three months ended March 31, 2015 (three months ended March 31, 2014 – $706), which were capitalized as acquisition costs and then written off on remeasurement of the investment properties. The REIT also incurred $91 in financing fees related to the mortgage financing service during the quarter (three months ended March 31, 2014 – $123). The fees were either charged to prepaid financing costs or deferred financing costs and amortized over the term of the mortgage financing. During the three months ended March 31, 2015, the REIT also reimbursed DAM for out-‐of-‐pocket and incidental costs of $152, pursuant to the terms of the Asset Management Agreement, which has been included in general and administrative expenses. As at March 31, 2015, the Trust has recorded $4,449 (December 31, 2014 – $3,871) in amounts payable and $806 (December 31, 2014 – $1,185) in amounts receivable related to the Asset Management Agreement with DAM. Shared Services and Cost Sharing Agreement The Trust entered into a shared services and cost sharing agreement with DAM on December 1, 2013. The agreement was for a one-‐year term and will be automatically renewed for further one-‐year terms unless and until the agreement is terminated in accordance with its terms or by mutual agreement of the parties. Pursuant to the agreement, DAM will be providing additional administrative and support services in order to expand and improve DAM’s service capability in connection with the provision of its asset management services. DAM will receive an annual fee sufficient to reimburse it for all the expenses incurred in providing these additional administrative and support services. Additionally, the Trust will also reimburse DAM in each calendar year for its share of costs incurred in connection with certain business transformation services provided by DAM. During the three months ended March 31, 2015, the Trust recorded an amount of $85 payable to DAM pursuant to the Shared Services and Cost Sharing Agreement. The Trust’s future commitment under the Shared Services and Cost Sharing Agreement over the remaining term to 2020 is $1,075. Non-‐controlling interest and notes receivable DAM has co-‐invested with the Trust in properties with their share of interest ranging from 0.26% to 5.2%. For the three months ended March 31, 2015, the non-‐controlling interest and net income attributable to DAM amounted to $6,100 and $136, respectively. As part of the co-‐investing transactions, the Trust provided interest bearing loans to DAM for financing its equity interests, bearing interest at 8.5% per annum for a ten-‐year term. As at March 31, 2015, the notes receivable outstanding and interest accrued amounted to $4,784 and $245, respectively. Note 21 SUPPLEMENTARY CASH FLOW INFORMATION Three months ended March 31, 2015 2014 Increase in amounts receivable Decrease (increase) in prepaid expenses and other assets Decrease in amounts payable and accrued liabilities Increase (decrease) in tenant deposits Change in non-‐cash working capital $ $ 224 71 (1,339) (116) (1,160) $ $ 3,094 (195) (5,852) 155 (2,798) The following amounts were paid on account of interest: Three months ended March 31, 2015 2014 Debt $ Dream Global REIT 2015 First Quarter Report | 61 10,987 $ 13,243 Note 22 FINANCIAL INSTRUMENTS Fair value measurements The following tables summarize fair value measurements recognized in the consolidated balance sheets or disclosed in the Trust’s consolidated financial statements by class of asset or liability and categorized by level according to the significance of the inputs used in making the measurements. Carrying value as at March 31, 2015 Recurring measurements Financial liabilities Interest rate swaps Foreign exchange forward contracts Conversion feature on the convertible debentures Fair values disclosed Convertible debenture excluding conversion feature $ (8,942) 5,170 4,165 (152,898) $ Carrying value as at December 31, 2014 Recurring measurements Financial liabilities Interest rate swaps Foreign exchange forward contracts Conversion feature on the convertible debentures Fair values disclosed Mortgage debt Convertible debenture excluding conversion feature $ (10,623) (1,492) (158) (701,325) (152,365) $ Level 1 -‐ -‐ -‐ -‐ $ Level 1 -‐ $ -‐ -‐ -‐ -‐ Fair value as at March 31, 2015 Level 2 Level 3 (8,942) 5,170 -‐ -‐ $ -‐ -‐ 4,165 (169,625) Fair value as at December 31, 2014 Level 2 Level 3 (10,623) (1,492) -‐ -‐ -‐ $ -‐ -‐ (158) (722,208) (160,037) Amounts receivable, amounts in escrow, cash, the Deferred Unit Incentive Plan, deposits, amounts payable and accrued liabilities, income taxes payable, and distributions payable are carried at amortized cost, which approximates fair value due to their short-‐term nature. The carrying value of the term loan credit facility approximates fair value due to the short-‐term nature of its rates, which are reset every three months. Transfers between levels in the fair value hierarchy are recognized as of the date of the event or change in circumstances that resulted in the transfer. There were no transfers in or out of Level 3 fair value measurements during the year. Valuation processes The REIT’s management is responsible for determining fair value measurements included in the consolidated financial statements, including Level 3 fair values. The inputs, processes and results for recurring measurements, including those valuations calculated by an independent consultant, are reviewed each quarter by senior management to ensure conformity with IFRS. The Trust uses the following techniques to determine the fair value measurements categorized in Level 2: Interest rate derivatives The fair value of interest rate derivatives was calculated as the present value of the estimated future cash flows based on observable yield curves. The fair value measurement of the interest rate swaps was valued by a qualified independent valuation professional. Dream Global REIT 2015 First Quarter Report | 62 Foreign currency derivatives The fair value of foreign currency derivatives was determined using forward exchange rates at the measurement date, with the resulting value discounted back to present value. The Trust uses the following techniques to determine the fair value measurements categorized in Level 3: Convertible debentures The convertible debentures have two components of value – a conventional bond and a call on the equity of the Trust through conversion. Based on its terms, the conversion feature is an embedded derivative and has been separated from the host contract and classified as a financial liability through profit or loss. Effective April 1, 2013, the Trust has utilized a valuation technique based on the paper by K. Tsiveriotis and C. Fernandes to determine the fair value of the conversion feature. This model uses significant unobservable inputs; therefore, the resulting valuation is classified as Level 3. In this model, a convertible bond consists of two components, an equity component and a debt component, and these components have different default risks. The equity component is discounted at the risk-‐free interest rate. The equity component has no default risk since the Trust can always issue its own units. The debt component is discounted at the risk-‐free interest rate plus a credit spread. The fair value measurement of the conversion feature of the convertible debentures was valued by a qualified independent valuation consultant. The significant unobservable inputs used in the fair value measurement of the conversion feature of the convertible debentures as at March 31, 2015 are the following: • Volatility: Expected volatility as at March 31, 2015 was derived from the historical prices of the REIT. Historical prices were not available for a term equal to the term to maturity of the debenture; as such, the consultant used the entire historical data up until March 31, 2015. The volatility used was 17.2328% (December 31, 2014 – 17.2724%). • Credit spread: The credit spread of the convertible debentures was imputed from the traded price of the convertible debenture as at March 31, 2015. The credit spread used was 2.8067% (December 31, 2014 – 4.1092%). A higher volatility will increase the value of the conversion feature. A lower credit spread will decrease the value of the conversion feature. The following table shows the changes in fair value of the conversion feature of the convertible debentures from a 5% increase or decrease in volatility and a 1% increase or decrease in credit spread, all other inputs being constant: Increase/(decrease) in fair value as at March 31, 2015 $ Impact of change to volatility Impact of change in credit spread Increase +5% Decrease -‐5% Increase +1% Decrease -‐1% 1,112 $ Dream Global REIT 2015 First Quarter Report | 63 (473) $ 2,844 $ (3,000) Appendix Owned GLA (sq. ft.) Occupancy (March 31, 2015) Hamburg Nordrhein-‐Westfalen Bavaria Nordrhein-‐Westfalen Berlin Hamburg 374,477 296,735 268,931 246,376 242,664 221,391 87% 98% 100% 100% 99% 100% Düsseldorf Hannover Darmstadt Köln Hamburg Stuttgart Hamburg München Stuttgart Berlin München Freiburg München Hamburg Mannheim Nürnberg München Hamburg Frankfurt Düsseldorf München Frankfurt Freiburg Stuttgart Nordrhein-‐Westfalen Niedersachsen Hessen Nordrhein-‐Westfalen Hamburg Baden-‐Württemberg Hamburg Bavaria Baden-‐Württemberg Berlin Bavaria Baden-‐Württemberg Bavaria Hamburg Baden-‐Württemberg Bavaria Bavaria Hamburg Hessen Nordrhein-‐Westfalen Bavaria Hessen Baden-‐Württemberg Baden-‐Württemberg 217,173 211,893 209,866 200,915 172,306 170,120 165,467 154,773 134,162 129,179 122,572 121,553 115,400 113,391 100,603 94,649 81,907 79,218 75,914 71,114 64,775 61,641 57,613 44,317 97% 90% 100% 99% 100% 100% 72% 96% 90% 99% 96% 100% 100% 95% 98% 100% 87% 100% 97% 100% 99% 95% 100% 100% Total Acquisition Properties 4,621,092 96.1% Initial Properties Grüne Str. 6-‐8/Kurfürstenstr. 2 Am Hauptbahnhof 16-‐18 Poststr.4-‐6,Göbelstr.30,Bismarckstr Kurfürstenallee 130 Karlstal 1-‐21/Werftstr. 201 Franz-‐Zebisch-‐Str. 15 E.-‐Kamieth-‐Str. 2 b Überseering 17/Mexikoring 22 Am Neumarkt 40/Luetkensallee 49 Bahnhofstr. 82-‐86 Czernyring 15 Marienstr. 80 Rüppurrer Str.81,87,89/Ettlinger 67 Gerokstr. 14-‐20 Hindenburgstr. 9/Heeserstr. 5 Zimmermannstr. 2/Eisenstr. Friedrich-‐Karl-‐Str. 1-‐7 Blücherstr. 12 Kaiserstr. 24 Bahnhofsplatz 2,3,4, Pepperworth 7 Dortmund Saarbrücken Darmstadt Bremen Kiel Weiden Halle Hamburg Hamburg Gießen Heidelberg Offenbach am Main Karlsruhe Dresden Siegen Marburg Oberhausen Koblenz Gütersloh Hildesheim Nordrhein-‐Westfalen Saarland Hessen Bremen Schleswig-‐Holstein Bavaria Sachsen-‐Anhalt Hamburg Hamburg Hessen Baden-‐Württemberg Hessen Baden-‐Württemberg Sachsen Nordrhein-‐Westfalen Hessen Nordrhein-‐Westfalen Rheinland-‐Pfalz Nordrhein-‐Westfalen Niedersachsen 299,567 293,737 232,300 203,949 180,837 166,601 161,156 160,785 160,397 149,499 133,379 114,114 111,778 110,434 101,498 99,751 97,606 94,569 94,488 87,084 100% 12% 60% 93% 96% 100% 40% 93% 89% 57% 57% 96% 97% 87% 90% 98% 94% 68% 61% 52% Address City State Acquisition Properties: Millerntorplatz 1 Im Mediapark 8 (Cologne Tower) Karl-‐Martell-‐Straße 60 Feldmuhleplatz 1+15 Greifswalder Str. 154-‐156 Straßenbahnring 15, 17-‐19/Hoheluftchausee 18-‐20/Lehmweg 8, 8a, 7 Moskauer Str. 25-‐27 Podbielskistraße 158-‐168 Robert-‐Bosch-‐Str. 9–11 Cäcilienkloster 2, 6, 8, 10 Hammer Str. 30-‐34 Oasis III Schlossstr. 8 Leopoldstr. 252 Liebknechtstraße 33/35, Heßbrühlstraße 7 Beuthstraße 6-‐8/Seydelstraße 2-‐5 Westendstr. 160-‐162/Barthstr. 24-‐26 Bertoldstr. 48/Sedanstr. 7 Marsstraße 20 -‐ 22 Am Sandtorkai 37 Reichskanzler-‐Müller-‐Str. 21-‐25 Am Stadtpark 2 Dillwächterstr.5/Tübinger Str. 11 ABC-‐Str. 19 Speicherstr. 55 Derendorfer Allee 4 Werner-‐Eckert-‐Straße 8-‐12 Neue Mainzer Str. 28 Lörracher Str. 16/16a Vordernbergstr. 6/Heilbronner Str. 35 Hamburg Köln Nürnberg Düsseldorf Berlin Hamburg Dream Global REIT 2015 First Quarter Report | 64 Address City State Klubgartenstr. 10 Pausaer Str. 1-‐3 Am Hauptbahnhof 2 Husemannstr. 1 Kapellenstr. 44 Kommandantenstr.43-‐51 Stresemannstr. 15 Bahnhofsring 2 Heinrich-‐von-‐Bibra-‐Platz 5-‐9 Kaiser-‐Karl-‐Ring 59-‐63/Dorotheenstr Bürgerreuther Str. 1 Bahnhofplatz 10 77er Str. 54 Wiener Str. 43 Logenstr. 37 Bahnhofsplatz 1 Rathausplatz 2 Auhofstr. 21 Bahnhofstr. 40 Joachim-‐Campe-‐Str. 1.3/5/7, Postho Heinrich-‐von-‐Stephan-‐Str. 8-‐10 Am Bahnhof 5 Friedrich-‐Ebert-‐Str. 28 Postplatz 3 Ostbahnstr. 5 Poststr. 2 U 3 Poststr. 5-‐7 Bahnhofsplatz 9 Friedrich-‐Ebert-‐Str. 75-‐79 Hainstr. 5 A Baarstr. 5 Rathausplatz 4 Europaplatz 17 Unter den Zwicken 1-‐3 Stadtparkstr. 2 Schützenstr. 17,19 Willy-‐Brandt-‐Str. 6 Bahnhofstr. 2 Theodor-‐Heuss-‐Platz 13 Stembergstr. 27-‐29 Poststr. 14 Bahnhofplatz 3,5 Poststr. 2 Königstr. 12 Möllner Landstr. 47-‐49/Reclamstr 20 Lippertor 6 Südbrede 1-‐5 Bahnhofstr. 169 Vegesacker Heerstr. 111 Koblenzer Str. 67 Kardinal-‐Galen-‐Ring 84/86 Martinistr. 19 Kalkumer Str. 70 Robert-‐Wahl-‐Str. 7/7a Falkenbergstr. 17-‐23 Balhornstr.15,17/B.Köthenbürger-‐Str Goslar Plauen Mülheim Gelsenkirchen Einbeck Duisburg Wuppertal Leer Fulda Bonn Bayreuth Fürth Celle Stuttgart Kaiserslautern Schweinfurt Wilhelmshaven Aschaffenburg Flensburg Salzgitter Leverkusen Zwickau Pinneberg Bautzen Landau Helmstedt Heide Emden Bremerhaven Bad Hersfeld Iserlohn Lüdenscheid Bad Kreuznach Halberstadt Schwabach Peine Auerbach Cham Neuss Arnsberg Rastatt Heidenheim Gummersbach Rottweil Hamburg Lippstadt Ahlen Bietigheim-‐Bissingen Bremen Bonn Rheine Recklinghausen Düsseldorf Balingen Norderstedt Paderborn Niedersachsen Sachsen Nordrhein-‐Westfalen Nordrhein-‐Westfalen Niedersachsen Nordrhein-‐Westfalen Nordrhein-‐Westfalen Niedersachsen Hessen Nordrhein-‐Westfalen Bavaria Bavaria Niedersachsen Baden-‐Württemberg Rheinland-‐Pfalz Bavaria Niedersachsen Bavaria Schleswig-‐Holstein Niedersachsen Nordrhein-‐Westfalen Sachsen Schleswig-‐Holstein Sachsen Rheinland-‐Pfalz Niedersachsen Schleswig-‐Holstein Niedersachsen Bremen Hessen Nordrhein-‐Westfalen Nordrhein-‐Westfalen Rheinland-‐Pfalz Sachsen-‐Anhalt Bavaria Niedersachsen Sachsen Bavaria Nordrhein-‐Westfalen Nordrhein-‐Westfalen Baden-‐Württemberg Baden-‐Württemberg Nordrhein-‐Westfalen Baden-‐Württemberg Hamburg Nordrhein-‐Westfalen Nordrhein-‐Westfalen Baden-‐Württemberg Bremen Nordrhein-‐Westfalen Nordrhein-‐Westfalen Nordrhein-‐Westfalen Nordrhein-‐Westfalen Baden-‐Württemberg Schleswig-‐Holstein Nordrhein-‐Westfalen Dream Global REIT 2015 First Quarter Report | 65 Owned GLA (sq. ft.) Occupancy (March 31, 2015) 86,572 85,443 84,303 80,591 80,500 80,122 79,215 78,627 77,606 75,815 75,534 73,631 73,391 72,192 71,465 67,503 64,970 64,264 61,826 61,602 61,011 60,738 59,218 57,571 53,645 53,468 53,363 53,327 52,165 51,207 51,027 49,529 48,549 47,145 46,877 46,532 46,512 46,129 46,128 45,820 45,659 45,656 45,558 45,494 45,371 44,341 44,130 43,620 43,484 43,157 42,191 41,847 41,781 41,487 41,249 40,927 51% 76% 81% 94% 91% 100% 60% 82% 100% 100% 100% 72% 62% 92% 36% 87% 97% 96% 98% 46% 79% 67% 100% 68% 98% 20% 92% 98% 94% 100% 93% 27% 39% 15% 78% 49% 56% 61% 95% 99% 92% 86% 98% 88% 90% 89% 91% 99% 90% 100% 76% 97% 52% 67% 98% 93% Address City State August-‐Bebel-‐Str. 6 Cavaillonstr. 2 Hauptstr. 279/Hommelstr. 2 Bismarckstr. 21-‐23 Hindenburgstr. 8/Hohenstauf 9,17,19 Steinerother Str. 1 U 1a Heinrich-‐von-‐Stephan-‐Platz 6 Mühlenstr. 5-‐7 Alsenberger Str 61 Apostelweg 4-‐6 Brückenstr. 21 Lönsstr. 20-‐22 Kurt-‐Schumacher-‐Str. 5 Lilienstr. 3 Stadtring 3-‐5 Ölmühlweg 12 Bahnhofsplatz 10,12,14 Goethestr. 2-‐6 Im Bungert 6-‐8 Gerstenstr. 5 Gustav-‐König-‐Str. 42 Worthingtonstr. 15 Palleskestr. 38 Zwieseler Str. 27-‐29 Markendorfer Str. 10 Hellersdorfer Str. 78 Kreuzstr. 20-‐24 Bahnhofstr. 6/Luisenstr. 4-‐5 Tunnelweg 1 Poststr. 30 Bahnhofsplatz 2 König-‐Heinrich-‐Str. 11 Poststr. 24-‐26 Konrad-‐Adenauer-‐Str. 49-‐51 Feldschlößchenstr./Kunadstr. o. Nr. Bahnhofstr. 29 Poststr. 12 Petristr. 26 Dr.-‐Friedrich-‐Uhde-‐Str. 18 Augsburger Str. 380 Gartenstr. 29/30 Poststr. 1-‐3 Poststr. 48 Bahnhofstr. 2 Ruthenstr. 19/21 Bahnhofanlage 2-‐4 Königswiese 1 Wilhelmstr. 11/Kamperdickstr. 29 Kaiserstr. 140 Ludwigsplatz 1 Goldbacher Str. 74 In der Trift 10/12 Bahnhofstr. 6 Alleestr. 6 Uferstr. 2 Lindenstr. 11 Torgau Weinheim Idar-‐Oberstein Bünde Bocholt Betzdorf Naumburg Delmenhorst Hof Hamburg Neunkirchen Castrop-‐Rauxel Lünen Leipzig Nordhorn Königstein Kleve Duisburg Bergisch Gladbach Neubrandenburg Sonneberg Crailsheim Frankfurt am Main Regen Frankfurt an der Oder Berlin Bonn Villingen-‐Schwenningen Husum Albstadt Herborn Merseburg Ratingen Tübingen Dresden Meppen Lehrte Heilbad Heiligenstadt Einbeck Stuttgart Pirna Korbach St Ingbert Gifhorn Hameln Schwetzingen Gelsenkirchen Kamp-‐Lintfort Radevormwald Alsfeld Aschaffenburg Olpe Quakenbrück Neustadt Höxter Bitterfeld Sachsen Baden-‐Württemberg Rheinland-‐Pfalz Nordrhein-‐Westfalen Nordrhein-‐Westfalen Rheinland-‐Pfalz Sachsen-‐Anhalt Niedersachsen Bavaria Hamburg Saarland Nordrhein-‐Westfalen Nordrhein-‐Westfalen Sachsen Niedersachsen Hessen Nordrhein-‐Westfalen Nordrhein-‐Westfalen Nordrhein-‐Westfalen Mecklenburg-‐Vorpommern Thüringen Baden-‐Württemberg Hessen Bavaria Brandenburg Berlin Nordrhein-‐Westfalen Baden-‐Württemberg Schleswig-‐Holstein Baden-‐Württemberg Hessen Sachsen-‐Anhalt Nordrhein-‐Westfalen Baden-‐Württemberg Sachsen Niedersachsen Niedersachsen Thüringen Niedersachsen Baden-‐Württemberg Sachsen Hessen Saarland Niedersachsen Niedersachsen Baden-‐Württemberg Nordrhein-‐Westfalen Nordrhein-‐Westfalen Nordrhein-‐Westfalen Hessen Bavaria Nordrhein-‐Westfalen Niedersachsen Bavaria Nordrhein-‐Westfalen Sachsen-‐Anhalt Dream Global REIT 2015 First Quarter Report | 66 Owned GLA (sq. ft.) Occupancy (March 31, 2015) 40,745 40,540 39,192 38,276 37,925 37,679 37,612 37,266 36,687 36,273 35,971 35,795 35,290 35,234 35,189 34,984 34,871 34,839 34,737 34,347 33,959 33,136 33,119 32,676 32,330 32,296 32,253 32,191 31,116 30,014 29,746 29,472 29,445 29,341 29,236 29,056 28,764 28,205 27,793 27,775 27,771 27,502 27,051 26,922 26,895 26,658 26,468 26,159 25,643 25,477 25,153 24,894 24,446 23,495 23,240 23,183 86% 91% 48% 96% 99% 95% 91% 99% 65% 97% 100% 90% 100% 97% 81% 100% 100% 86% 100% 100% 16% 100% 84% 89% 97% 75% 99% 97% 89% 14% 91% 13% 100% 98% 100% 90% 88% 68% 65% 93% 67% 100% 96% 92% 93% 100% 100% 94% 74% 24% 95% 94% 97% 100% 79% 86% Address City State Bahnhofsplatz 8 Bahnhofstr. 32 Bahnhofstr. 46 Poststr. 19-‐23 Brückenstr. 26 Bahnhofstr. 27 Lindenstr. 15 Lindenstr. 42 Hörder Semerteichstr. 175 Innungsstr. 57-‐59 Wilhelmstr. 5 Geistmarkt 17 Lyoner Passage 14 Martin-‐Pöhlmann-‐Str 5/Friedrich-‐e Steinstr. 6 Am Markt 4-‐5 Am Stadtpark 5 Saarbrücker Str. 292-‐294 Speckweg 24-‐26 Kasseler Str. 1 -‐ 7 Lübecker Str./Wedringer Str. o. Nr. Ooser Karlstr. 21/23/25 Güterstr. 2-‐4 Eisenbahnstr. 15 Poststr. 6 Bismarckstr. 12/Fr.Hoffmann-‐Str. Lagerstr. 1 Bahnhofstr. 3 Bahnhofstr. 43 Bahnhofstr. 33 U. 33 A Friedrichstr. 2 Königstr. 20 Kornmarkt 15 Marktstr. 51 Übacher Weg 4 Niederwall 3 Hochstr. 31/Postgasse 5 Sattigstr. 33 Robert-‐Koch-‐Str. 3 Kaiserstr. 35 Bahnhofstr. 8-‐10 Poststr. 28 Melanchthonstr. 96 Hauptstr. 141 Poststr. 1/2 Herrlichkeit 7 Grenzstr. 24 Mercedesstr. 5 Bahnhofstr. 41 Kolpingstr. 4 Münchner Str. 50 Schönbornstr. 1 Langener Landstr. 237-‐239 Löbauer Str. 63 Albert-‐Steiner-‐Str. 10 Fritz-‐Brandt-‐Str. 25 Marktredwitz Sulzbach-‐Rosenberg Unna Hilden Miltenberg Öhringen Landstuhl Grevenbroich Dortmund Berlin Ibbenbüren Emmerich Köln Selb Pulheim Norden Papenburg Saarbrücken Mannheim Warburg Magdeburg Baden-‐Baden Bitburg Tuttlingen Beckum Steinfurt Meschede Osterburken Riesa Stendal Monheim Brilon Osterode Essen Alsdorf Lübbecke Bochum Görlitz Laatzen Minden Borken Hemer Bretten Rheda-‐Wiedenbrück Spremberg Syke Halle Hannover Eberbach Georgsmarienhütte Fürstenfeldbruck Geisenheim Bremerhaven Bautzen Herzogenrath Zerbst Bavaria Bavaria Nordrhein-‐Westfalen Nordrhein-‐Westfalen Bavaria Baden-‐Württemberg Rheinland-‐Pfalz Nordrhein-‐Westfalen Nordrhein-‐Westfalen Berlin Nordrhein-‐Westfalen Nordrhein-‐Westfalen Nordrhein-‐Westfalen Bavaria Nordrhein-‐Westfalen Niedersachsen Niedersachsen Saarland Baden-‐Württemberg Nordrhein-‐Westfalen Sachsen-‐Anhalt Baden-‐Württemberg Rheinland-‐Pfalz Baden-‐Württemberg Nordrhein-‐Westfalen Nordrhein-‐Westfalen Nordrhein-‐Westfalen Baden-‐Württemberg Sachsen Sachsen-‐Anhalt Nordrhein-‐Westfalen Nordrhein-‐Westfalen Niedersachsen Nordrhein-‐Westfalen Nordrhein-‐Westfalen Nordrhein-‐Westfalen Nordrhein-‐Westfalen Sachsen Niedersachsen Nordrhein-‐Westfalen Nordrhein-‐Westfalen Nordrhein-‐Westfalen Baden-‐Württemberg Nordrhein-‐Westfalen Brandenburg Niedersachsen Sachsen-‐Anhalt Niedersachsen Baden-‐Württemberg Niedersachsen Bavaria Hessen Bremen Sachsen Nordrhein-‐Westfalen Sachsen-‐Anhalt Dream Global REIT 2015 First Quarter Report | 67 Owned GLA (sq. ft.) Occupancy (March 31, 2015) 22,710 22,634 22,627 22,454 22,017 21,960 21,726 21,668 21,659 21,187 21,031 20,942 20,742 20,681 20,670 20,668 20,578 20,433 20,128 19,985 19,454 19,444 19,340 19,047 18,831 18,800 18,683 18,498 18,275 18,200 18,156 17,733 17,690 17,661 16,991 16,563 16,359 16,279 16,126 16,043 15,893 15,782 15,501 15,178 14,763 14,560 14,533 14,504 13,936 13,725 13,326 13,117 12,803 12,686 12,667 12,654 95% 77% 100% 87% 85% 96% 99% 64% 96% 100% 100% 100% 100% 75% 100% 81% 17% 92% 90% 85% 100% 93% 99% 97% 100% 87% 100% 100% 90% 93% 100% 76% 100% 100% 100% 100% 100% 100% 100% 99% 98% 100% 90% 100% 80% 94% 100% 100% 100% 100% 100% 90% 100% 100% 79% 97% Owned GLA (sq. ft.) Occupancy (March 31, 2015) 12,631 12,625 12,498 12,379 12,112 11,597 11,334 11,050 10,813 10,732 10,324 10,315 10,132 9,717 9,023 8,995 8,881 8,196 7,702 100% 100% 100% 100% 76% 100% 95% 100% 100% 100% 100% 100% 100% 100% 100% 100% 100% 100% 100% 9,242,311 80.9% 13,863,404 86.0% Address City State Dahmestr. 17 Bünder Str. 36 Poststr. 1 Gorsemannstr. 22 Bahnhofstr. 11 Poststr. 3-‐5 Prochaskaplatz 7 Bahnhofstr. 49/49a Gutachstr. 56 Unterstr. 14 Am Markt 4 Hauptstr. 40 Sandstr. 4 Langfuhren 9 Weinbergstr. 50 De-‐Lenoncourt-‐Str. 2 Rosenstr. 1/Fünfhausenstr. 19/21 Melcherstätte 8 Wetterstr. 20/Poststr. 2 Mittenwalde Löhne Erftstadt Bremen Alpirsbach Barsinghausen Dannenberg Aalen Titisee-‐Neustadt Bochum St. Georgen Porta Westfalica Germersheim Bad Säckingen Bad Neuenahr-‐Ahrweiler Dillingen Springe Stuhr Herdecke Brandenburg Nordrhein-‐Westfalen Nordrhein-‐Westfalen Bremen Baden-‐Württemberg Niedersachsen Niedersachsen Baden-‐Württemberg Baden-‐Württemberg Nordrhein-‐Westfalen Baden-‐Württemberg Nordrhein-‐Westfalen Rheinland-‐Pfalz Baden-‐Württemberg Rheinland-‐Pfalz Saarland Niedersachsen Niedersachsen Nordrhein-‐Westfalen Total Initial Properties Total Portfolio Dream Global REIT 2015 First Quarter Report | 68 Corporate information HEAD OFFICE AUDITORS Dream Global Real Estate Investment Trust State Street Financial Centre 30 Adelaide Street East, Suite 1600 Toronto, Ontario M5C 3H1 Phone: (416) 365-3535 Fax: (416) 365-6565 PricewaterhouseCoopers LLP PwC Tower, 18 York Street, Suite 2600 Toronto, Ontario M5J 0B2 INVESTOR RELATIONS Phone: (416) 365-3538 Toll free: 1 877 365-3535 From Germany: 0 800 189-0344 E-mail: [email protected] Website: www.dreamglobalreit.ca TRANSFER AGENT (for change of address, registration or other unitholder enquiries) Computershare Trust Company of Canada 100 University Avenue, 9th Floor Toronto, Ontario M5J 2Y1 Phone: (514) 982-7555 or 1 800 564-6253 Fax: (416) 263-9394 or 1 888 453-0330 E-mail: [email protected] CORPORATE COUNSEL Osler, Hoskin & Harcourt LLP Box 50, 1 First Canadian Place, Suite 6100 Toronto, Ontario M5X 1B8 STOCK EXCHANGE LISTING The Toronto Stock Exchange Listing symbols: REIT Units: DRG.UN 5.5% Convertible Debentures: DRG.DB DISTRIBUTION REINVESTMENT AND UNIT PURCHASE PLAN The purpose of our Distribution Reinvestment and Unit Purchase Plan (“DRIP”) is to provide unitholders with a convenient way of investing in additional units without incurring transaction costs such as commissions, service charges or brokerage fees. By participating in the Plan, you may invest in additional units in two ways: Distribution reinvestment: Unitholders will have cash distributions from Dream Global REIT reinvested in additional units as and when cash distributions are made. Cash purchase: Unitholders may invest in additional units by making cash purchases. If you register in the DRIP you will also receive a “bonus” distribution of units equal to 4% of the amount of your cash distribution reinvested pursuant to the Plan. In other words, for every $1.00 of cash distributions reinvested by you under the Plan, $1.04 worth of units will be purchased. 0,; dream.ca/global )URPbUHVSRQVLEOHb VRXUFHV &
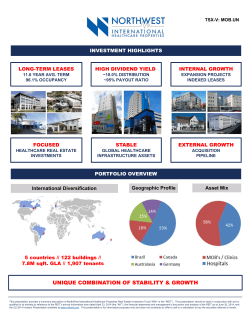


© Copyright 2026