
2015 Q1 Report
Q1 2015 Dream Industrial REIT Table of contents Letter to unitholders 1 Management’s discussion and analysis 2 Condensed consolidated financial statements 41 Notes to the condensed consolidated financial statements 45 Corporate information IBC Letter to unitholders Dream Industrial REIT continued to deliver strong results in the first quarter of 2015, with a 2.5% increase in AFFO compared to the same quarter in the prior year and 180,000 square feet of lease commitments, representing a 29% increase over the prior quarter. We continue to make improvements to our operational platform by strengthening our leasing and property operations teams and enhancing our tenant relationships. The first quarter of 2015 was a successful quarter in terms of leasing momentum, with signed commitments for future occupancy totalling 180,000 square feet versus 140,000 square feet in the prior quarter. This is a reflection of the efforts of our leasing teams across the country, the strength of our core markets as well as the quality of our assets in those markets. Our business performed well and in line with our expectations, with 20 cents per unit of AFFO and 614,000 square feet of new leases and renewals commenced during the quarter at 9.9% higher rents over expiries and terminations. Although our occupancy declined at quarter-‐end to 95.3% from 96% in the prior quarter, we believe our occupancy bottomed out in March and will come back up as our commitments start to take place in the coming quarters. In our Western Canada portfolio, we continue to experience positive leasing with rent increases on renewals and a retention ratio of 78%. We have yet to see any negative impact on leasing or our receivables from the decline in oil prices, and we continue to closely monitor our markets and strengthen the relationships with our tenants. In our Ontario and Eastern Canada portfolios, we experienced a drop in occupancy this quarter due to expected vacancies, many of which will be backfilled with new and existing tenants expanding into the vacated space. Despite the slight increase in availability rates across Canadian industrial markets, the industry continues to be on solid footing. According to CBRE, the main driver of the increase in availability relates to the 4.4 million square feet of warehouse space vacated by Target on its departure, which is expected to be purchased by users. Our financial metrics, including comparative properties net operating income, are stable at the end of the quarter, with debt-‐to-‐ total assets of 52.4%, weighted average term to maturity of 3.9 years and $144 million of unencumbered assets. This provides us with the capacity and flexibility to acquire and successfully finance growth when appropriate to do so in a way that will add value to our unitholders. At the same time, the Trust has maintained its AFFO payout ratio at 86.6%. In summary, we will continue to execute on enhancing the strength of our business by driving organic net operating income growth and identifying opportunities to intensify the use of our sites. We thank our unitholders for their continued support. Brent Chapman President and Chief Executive Officer May 5, 2015 Dream Industrial REIT 2015 First Quarter Report | 1 Management’s discussion and analysis (All dollar amounts in our tables are presented in thousands of Canadian dollars, except rental rates, unit and per unit amounts unless otherwise stated) SECTION I – OVERVIEW AND FINANCIAL HIGHLIGHTS FINANCIAL OVERVIEW Adjusted funds from operations (“AFFO”) per unit for the quarter was 20.2 cents, an increase of 0.5 cents, or 2.5%, over the prior year comparative quarter, which reflects growth in comparative properties net operating income (“NOI”) as well as the effect of accretive acquisitions completed in the third quarter of 2014. Funds from operations (“FFO”) per unit for the quarter was 23.7 cents, an increase of 0.3 cents, or 1.3%, over the prior year comparative quarter. The increase resulted from the same factors as the increase in AFFO per unit. Occupancy (including commitments on vacant space) decreased from 96.0% at the end of Q4 2014 to 95.3%. A total of 614,000 square feet of new leases and renewals commenced in the quarter and expiries totalled 757,000 square feet. Approximately 60% of our expiries renewed during the quarter, with Western Canada at 78%. Known vacancies in Ontario and Eastern Canada reduced the portfolio average, but were in line with our expectations. Our occupancy includes 180,000 square feet of commitments on vacant space, of which 78% will commence during Q2 2015. In April 2015, we completed a 60,000 square foot lease in Québec for a term of five months which is expected to contribute $0.3 million to NOI. This short-‐ term lease has not been included in committed occupancy. In-‐place rent was $7.10 per square foot compared to $7.05 at December 31, 2014, which we estimate is approximately $0.28, or 3.9%, below the current rental market rates. The multi-‐tenant nature of two-‐thirds of our portfolio, and its associated relatively short weighted average lease term of 3.5 years, provide the Trust with a good opportunity for rent growth in the short to medium term. Our portfolio size remained at 16.9 million square feet, with investment properties totalling $1.7 billion, reflecting a weighted average capitalization rate of 6.70% on stabilized NOI, which is consistent with the December 31, 2014 capitalization rates. As at March 31, 2015, the ratio of secured debt, excluding convertible debentures, to total assets was 44.9%. Debt-‐to-‐total assets stood at 52.4% at March 31, 2015, including the convertible debentures. The weighted average remaining term on our debt was 3.9 years and the weighted average face interest rate on our debt was 4.01%, which is higher than we are currently seeing in the market for comparable mortgage debt. Overall, the Trust has performed in line with management’s expectations for the quarter. OUTLOOK We enter 2015 with stable industrial market fundamentals after experiencing positive growth during 2014 with historically low availability rates. Overall, market fundamentals for industrial real estate continued to be strong as the Western Canada market hasn’t shown significant signs of weakness, and the Ontario and Eastern Canada markets are poised for growth due to the forecasted increases in the manufacturing and export sectors. As of the date of this MD&A, we have obtained leasing commitments for over one million square feet of new and renewal leasing commencing in 2015, which represents approximately 53% of our 2.1 million square feet of remaining expiries for the year. In 2015, we will continue to be focused on growing our AFFO and enhancing the quality and stability of our cash flows by: • • • • Enhancing our operations and strengthening our relationships with tenants in order to grow NOI internally; Leveraging the decreasing vacancy in our markets to capture rental rate increases; Recycling capital from non-‐core assets into assets that meet our investment criteria and enhance the quality of our portfolio; and Exploring selected value-‐add intensification opportunities within our existing portfolio. Dream Industrial REIT 2015 First Quarter Report | 2 KEY PERFORMANCE INDICATORS Performance is measured by these and other key indicators: As at Portfolio Number of properties Gross leasable area (“GLA”) (in millions of sq. ft.) Occupancy rate – including committed Occupancy rate – in place Average occupancy for the period Average in-‐place base rent per sq. ft. Weighted average remaining lease term (years) Estimated market rent in excess of in-‐place rent (%) Three months ended Operating results Investment properties revenue (1) NOI (1) FFO (1) AFFO Fair value increase (decrease) to investment properties Distributions Declared distributions DRIP participation rate (2) Per unit amounts Distribution rate Basic (1) FFO (1) AFFO Diluted (1) FFO (1) AFFO (3) Payout ratio (%) FFO AFFO March 31, 2015 $ March 31, 2015 216 16.9 95.3% 94.2% 94.7% 7.10 4.3 3.9% December 31, 2014 216 16.9 96.0% 95.2% 94.6% 7.05 4.4 4.4% $ 2014 2014 205 15.6 96.3% 95.3% 94.9% 6.96 4.6 6.0% $ December 31, March 31, March 31, 2014 $ 43,940 29,703 18,621 15,603 911 $ $ 13,427 7.7% $ 44,588 29,989 18,833 15,541 (1,919) 13,404 5.9% $ 40,914 27,215 17,044 14,006 501 $ 12,487 8.5% $ 0.17 $ 0.17 $ 0.17 0.24 0.20 0.24 0.20 73.8% 86.6% 0.25 0.20 0.24 0.20 72.9% 86.6% 0.24 0.20 0.23 0.20 74.8% 88.8% As at March 31, 2015 Financing (4) Weighted average effective interest rate Weighted average face interest rate Weighted average remaining term to maturity (years) (2) Interest coverage ratio (2) Debt-‐to-‐adjusted EBITDA Unencumbered assets $ December 31, 2014 3.83% 4.01% 3.9 3.0 times 8.5 144,187 $ March 31, 2014 3.85% 4.07% 3.9 3.0 times 8.5 166,094 $ 3.86% 4.17% 4.2 2.9 times 8.5 138,022 (1) NOI, FFO and AFFO are non-‐GAAP measures. Reconciliation to the relevant GAAP measures can be found under the heading “Our results of operations”. See “Non-‐GAAP measures and other disclosures” for description of these non-‐GAAP measures. (2) A description of the determination of basic and diluted amounts per unit, interest coverage ratio and debt-‐to-‐adjusted EBITDA (non-‐GAAP measures) can be found under the heading “Non-‐GAAP measures and other disclosures”. (3) Payout ratios for FFO and AFFO are calculated as the ratio of distribution rate to diluted FFO and AFFO per unit, respectively. (4) Weighted average effective interest rate is calculated as the weighted average interest rate of all interest bearing debt including issue costs and mark-‐to-‐ market adjustments. Dream Industrial REIT 2015 First Quarter Report | 3 BASIS OF PRESENTATION Our discussion and analysis of the financial position and results of operations of Dream Industrial Real Estate Investment Trust (“Dream Industrial REIT” or “Dream Industrial” or the “Trust”) should be read in conjunction with the audited consolidated financial statements of Dream Industrial for the year ended December 31, 2014 and the condensed consolidated financial statements for the period ended March 31, 2015. This management’s discussion and analysis (“MD&A”) is dated as at May 5, 2015. For simplicity, throughout this discussion, we may make reference to the following: • • • “REIT Units”, meaning the REIT Units “LP B Units” and “subsidiary redeemable units”, meaning the Class B Units of Dream Industrial LP “Units”, meaning REIT Units and LP B Units When we use terms such as “we”, “us” and “our”, we are referring to the Dream Industrial REIT and its subsidiaries. Market rents disclosed throughout the MD&A are management’s estimates and are based on current period leasing fundamentals. The current estimated market rents are at a point in time and are subject to change based on future market conditions. Certain information herein contains or incorporates comments that constitute forward-‐looking information within the meaning of applicable securities legislation. Forward-‐looking information is based on a number of assumptions and is subject to a number of risks and uncertainties, many of which are beyond the Trust’s control, which could cause actual results to differ materially from those disclosed in or implied by such forward-‐looking information. These risks and uncertainties include, but are not limited to, general and local economic and business conditions; the financial condition of tenants; our ability to refinance maturing debt; leasing risks, including those associated with the ability to lease vacant space; our ability to source and complete accretive acquisitions; and interest rates. Although the forward-‐looking statements contained in this MD&A are based on what we believe are reasonable assumptions, there can be no assurance that actual results will be consistent with these forward-‐looking statements. Factors that could cause actual results to differ materially from those set forth in the forward-‐looking statements and information include, but are not limited to, general economic conditions; local real estate conditions, including the development of properties in close proximity to the Trust’s properties; timely leasing of vacant space and re-‐leasing of occupied space upon expiration; dependence on tenants’ financial condition; the uncertainties of acquisition activity; the ability to effectively integrate acquisitions; interest rates; availability of equity and debt financing; our continued compliance with the REIT exemption under the specified investment flow-‐through trust (“SIFT”) legislation; and other risks and factors described from time to time in the documents filed by the Trust with securities regulators. All forward-‐looking information is as of May 5, 2015. Dream Industrial does not undertake to update any such forward-‐looking information whether as a result of new information, future events or otherwise, except as required by applicable law. Additional information about these assumptions, risks and uncertainties is contained in our filings with securities regulators. Certain filings are also available on our website at www.dreamindustrialreit.ca. BACKGROUND Dream Industrial REIT is an unincorporated, open-‐ended real estate investment trust that was formed to provide investors with the opportunity to invest in a Canadian focused, pure-‐play industrial REIT. Dream Industrial was founded on July 20, 2012 under the name Dundee Industrial REIT by Dream Office Real Estate Investment Trust (“Dream Office REIT”), which had a retained investment of 24.2% at May 5, 2015. Our REIT Units are listed on the Toronto Stock Exchange under the trading symbol DIR.UN. At March 31, 2015, we owned 216 light industrial income-‐producing buildings totalling 16.9 million square feet of GLA. Our properties are located in primary and secondary markets in seven Canadian provinces. Dream Industrial REIT 2015 First Quarter Report | 4 OUR OBJECTIVES We are committed to: • Managing our business to provide growing cash flow and stable and sustainable returns, through adapting our strategy and tactics to changes in the real estate industry and the economy; • Building and maintaining a diversified, growth-‐oriented portfolio of light industrial properties in major Canadian markets, based on an established platform; • Providing predictable and sustainable cash distributions to unitholders while prudently managing our capital structure over time; and • Maintaining a REIT that satisfies the REIT exception under the SIFT legislation in order to provide certainty to unitholders with respect to taxation of distributions. Distributions We currently pay monthly distributions of $0.058 per Unit, or $0.70 per Unit on an annual basis. At March 31, 2015, approximately 7.7% of our total Units were enrolled in the Distribution Reinvestment and Unit Purchase Plan (“DRIP”) (see a description of Our equity on page 18). Annualized distribution rate Monthly distribution rate Period-‐end closing price Annualized distribution yield on (1) closing price (%) 2015 Q1 2014 Q4 Q3 Q2 Q1 2013 Q4 Q3 Q2 $ 0.70 $ 0.70 $ 0.70 $ 0.70 $ 0.70 $ 0.70 $ 0.70 $ 0.70 $ 0.058 $ 0.058 $ 0.058 $ 0.058 $ 0.058 $ 0.058 $ 0.058 $ 0.058 $ 9.01 $ 8.42 $ 9.05 $ 9.73 $ 9.40 $ 8.85 $ 8.74 $ 9.08 7.8% 8.3% 7.7% 7.2% 7.4% 7.9% 8.0% 7.7% (1) Annualized distribution yield is calculated as the annualized distribution rate divided by period-‐end closing unit price. OUR STRATEGY Dream Industrial REIT is a growth-‐oriented owner of income-‐producing light industrial properties across Canada providing stable and predictable distributions to unitholders on a tax-‐efficient basis. Our strategy is to grow our portfolio by investing in key markets across Canada to generate stable cash flows for our unitholders. We will continue to review and modify our strategy to meet the ever changing real estate and economic conditions. Our strategy includes: Optimizing the performance, value and cash flow of our portfolio We actively manage our assets to optimize performance, maintain value, retain and attract tenants and maximize cash flows to our unitholders. Dream Industrial REIT employs experienced staff in all markets where we are active. We strive to ensure that our assets are the most attractive and cost-‐effective premises for our tenants. Maintaining and strengthening our conservative financial profile We operate our business in a disciplined manner with a strong focus on maintaining a conservative financial structure. We actively manage our mortgage maturity profile, maintain a conservative debt ratio and generate cash flows sufficient to fund our distributions. Growing and diversifying our portfolio to reduce risk We seek to grow and diversify our portfolio to increase value on a per Unit basis, further improve the sustainability of our distributions, strengthen our tenant profile and mitigate risk. We anticipate that growing our portfolio will also reduce our cost of capital, allowing us to both refinance existing mortgages at lower rates and increase our ability to competitively bid on acquisition opportunities. We have experience in each of Canada’s key real estate markets and across all asset classes, which we believe will provide us with the flexibility to pursue acquisitions in whichever markets offer compelling investment opportunities. Seeking accretive growth opportunities Dream Industrial REIT seeks to invest in desirable, highly functional properties located in major industrial centres that are well-‐leased on a long-‐term basis to quality tenants. When evaluating acquisitions we consider a variety of criteria, including per Dream Industrial REIT 2015 First Quarter Report | 5 Unit accretion; replacement cost of the asset, its functionality and appeal to future tenants; and how the asset complements our existing portfolio. OUR PROPERTIES Dream Industrial REIT owns and manages high-‐quality light industrial properties located in primary and secondary markets across Canada. Today, our portfolio consists of 216 properties comprising 16.9 million square feet of GLA. Our properties are located in desirable business parks, situated close to highways, and generally considered functional and well suited for their respective markets. The occupancy rate across our portfolio is 95.3%. Our occupancy rate includes lease commitments totalling approximately 180,000 square feet for space that is currently being readied for occupancy but for which rent is not yet being recognized. Our properties are geographically diversified as follows: Western Canada Ontario Québec Eastern Canada Total March 31, 2015 Number of Owned GLA % of owned Number of Owned GLA properties (sq. ft.) GLA properties (sq. ft.) 77 60 40 39 216 4,825,191 5,031,825 4,274,667 2,812,378 16,944,061 28.5 29.7 25.2 16.6 100.0 December 31, 2014 77 60 40 39 216 4,824,509 5,031,825 4,274,667 2,811,898 16,942,899 % of owned GLA 28.5 29.7 25.2 16.6 100.0 Our portfolio consists of multi-‐tenant buildings totalling 10.7 million square feet, or comprising 64% of total GLA, and single-‐ tenant buildings totalling 6.2 million square feet, or 36% of total GLA. Of the 6.2 million square feet of single-‐tenant space, 5.2 million square feet is located in Ontario and Québec. Multi-‐tenant space is distributed more evenly throughout the provinces in the portfolio, with a relatively higher concentration of 4.1 million square feet in Alberta and Saskatchewan. The differences between single-‐ and multi-‐tenant buildings can be seen in the following operating metrics: • Average tenant size – single tenants typically occupy significantly more space on an individual basis than those tenants in multi-‐tenant buildings; • Average lease term – single tenants typically have lease terms that are significantly longer than those for multi-‐tenant buildings, which tends to offset the concentration risk of having a large single tenant in a building; and • Average in-‐place rents per square foot – they are typically moderately higher in multi-‐tenant buildings. Multi-‐tenant buildings with shorter lease terms allow a landlord to bring rents to market rates on a more regular basis, thereby taking advantage of supply-‐constrained market conditions. Small bay multi-‐tenant buildings tend to have higher construction costs and tend to be located in denser urban markets, which increases the barriers to competition from new supply. Selective ownership of single-‐tenant buildings provides a source of stable cash flow with relatively less management effort required. In addition to the geographic distribution, maintaining a balance of the two building types in the portfolio is part of our diversification strategy. Dream Industrial REIT 2015 First Quarter Report | 6 SECTION II – EXECUTING THE STRATEGY The following key performance indicators related to our operations influence the cash generated from operating activities. OUR OPERATIONS March 31, 2015 Multi-‐tenant Single-‐tenant Performance indicators Occupancy rate – including committed (1) Occupancy rate – in place Average in-‐place base rental rates (per sq. ft.) Tenant maturity profile ̶ average term to maturity (years) Owned GLA (in millions of sq. ft.) $ buildings 94.3% 92.6% 7.44 $ 3.5 10.7 buildings 97.0% 97.0% 6.52 $ 5.7 6.2 Multi-‐tenant Single-‐tenant Total 95.3% 94.2% 7.10 4.3 16.9 December 31, 2014 buildings buildings $ 94.8% 93.5% 7.38 $ 3.6 10.7 98.1% 98.1% 6.50 $ 5.8 6.2 Total 96.0% 95.2% 7.05 4.4 16.9 (1) Based on physical occupancy, excluding future commitments. Occupancy At March 31, 2015, the overall percentage of occupied and committed space across our portfolio remained high at 95.3%, which was 0.7% lower than occupancy at December 31, 2014, and 1% lower than occupancy at March 31, 2014. (percentage) 2015 2014 2014 Western Canada Ontario Québec Eastern Canada Total Portfolio size (millions of sq. ft.) 97.8 97.1 91.4 93.4 95.3 16.9 97.5 97.9 93.5 93.9 96.0 16.9 98.3 98.0 94.0 93.4 96.3 15.6 Dream Industrial REIT 2015 First Quarter Report | 7 March 31, December 31, March 31, Occupancy roll-‐forward Leasing activity for the first quarter included approximately 455,000 square feet of renewals and approximately 159,000 square feet of new leases. The following table details the change in occupancy (including committed) during the three months ended March 31, 2015: For the three Occupancy (including committed) at beginning of period Vacancy committed for future occupancy Occupancy at beginning of period Remeasurements/reclassifications Occupancy at beginning of period – restated Expiries (all leases) Early terminations and bankruptcies New leases Renewals Occupancy – March 31, 2015 Vacancy committed for future occupancy Occupancy (including committed) – March 31, 2015 Weighted months ended average rate March 31, 2015 As a % of (sq. ft.) total GLA per sq. ft. $ $ $ $ 6.87 5.84 7.26 7.60 16,268,573 (139,732) 16,128,841 (30) 16,128,811 (757,065) (24,608) 159,248 454,635 15,961,021 179,993 16,141,014 96.0% (0.8%) 95.2% 0.0% 95.2% (4.5%) (0.1%) 0.9% 2.7% 94.2% 1.1% 95.3% The committed occupancy on vacant space based on existing contractual commitments at March 31, 2015 totalled 180,000 square feet. Of this committed space, 78% becomes occupied in Q2 2015 with the balance taking occupancy in Q3 2015. For the three months ended Tenant retention ratio Expiring rents on renewed space (per sq. ft.) Renewal to expiring rent spread (per sq. ft.) March 31, 2015 $ $ 60.1% 7.23 0.37 The tenant retention ratio for the total portfolio was 60.1% during the first quarter. The Western Canada tenant retention ratio was 78%, while known vacancies in Ontario and Québec reduced the portfolio average. Dream Industrial REIT 2015 First Quarter Report | 8 In-‐place rental rates At March 31, 2015, estimated current market rents were 3.9% higher than portfolio average in-‐place base rents, presenting us with the opportunity to capture gains when space is renewed or newly leased. Estimated market rent represents management’s best estimate of the net rental rate that would be achieved in the event that a unit becomes vacant in a new arm’s length lease after a reasonable marketing period with an inducement and lease term appropriate for the particular space. Market rent by property is determined on a quarterly basis by our leasing and portfolio management teams. Market rents may differ by property or by units and depend upon a number of factors. Some of the factors considered include the condition of the space, the location within the building, the amount of office build out for the units, lease term and a normal level of tenant inducements. Market rental rates are also compared against the external appraisal information that are gathered on a quarterly basis as well as other external market data sources. March 31, 2015 Estimated market rent/ market in-‐place rent in-‐place base rent Western Canada Ontario Québec Eastern Canada Total (1) rent 8.96 6.02 6.13 7.20 7.10 $ $ December 31, 2014 Estimated Average Total portfolio $ $ (%) 9.65 6.11 6.23 7.35 7.38 7.7 1.5 1.6 2.1 3.9 March 31, 2014 Estimated Average Estimated market rent/ Average Estimated market rent/ in-‐place in-‐place market in-‐place rent (1) base rent rent 8.88 6.02 6.09 7.17 7.05 9.65 6.12 6.21 7.35 7.36 $ $ Estimated $ $ (%) 8.7 1.7 2.0 2.5 4.4 market in-‐place rent (1) base rent rent $ $ 9.73 6.18 6.22 7.35 7.38 8.66 6.07 6.01 7.12 6.96 $ $ (%) 12.4 1.8 3.5 3.2 6.0 (1) Estimate only; based on current market rents with no allowance for increases in future years. Subject to changes in market conditions in each market. Leasing and tenant profile The average remaining lease term and other portfolio information are detailed in the following table. Overall, our average remaining lease term is 4.3 years and our average tenant size is 12,000 square feet. Our single-‐tenant buildings have an average remaining lease term of 5.7 years and our multi-‐tenant buildings have an average remaining lease term of 3.5 years. Average Average Average Average remaining Average in-‐place remaining Average in-‐place remaining lease term tenant size base rent lease term tenant size base rent Total portfolio Western Canada Ontario Québec Eastern Canada Total March 31, 2015 (years) 4.3 3.9 5.8 3.1 4.3 (sq. ft.) (per sq. ft.) 9,112 18,444 26,943 6,485 12,109 $ $ 8.96 6.02 6.13 7.20 7.10 December 31, 2014 (years) 4.4 3.9 5.8 3.2 4.4 (sq. ft.) (per sq. ft.) 9,103 18,246 26,997 6,488 12,123 $ $ Dream Industrial REIT 2015 First Quarter Report | 9 8.88 6.02 6.09 7.17 7.05 March 31, 2014 Average Average Average in-‐place lease term tenant size base rent (years) 4.3 4.2 6.3 3.4 4.6 (sq. ft.) (per sq. ft.) 8,968 17,486 27,408 6,531 11,900 $ $ 8.66 6.07 6.01 7.12 6.96 The following table details our lease maturity profile by region at March 31, 2015. The table distinguishes between lease expiries that have yet to be renewed or re-‐leased and expiries for which we have leasing commitments. In the remainder of 2015, 2,084,000 square feet contractually expire. As at March 31, 2015, leasing commitments for 887,000 square feet of new and renewal leases commencing in 2015 had been obtained which represents 42.6% of the expiring tenancies. As of the date of this MD&A, commitments commencing in the remainder of 2015 total over one million square feet. Our current maturity profile is well balanced with 12.3% of leases expiring in the remainder of 2015, 15.0% expiring in 2016 and 13.4% expiring in 2017. Monthly and short-‐term 2015 tenancies remainder 2016 2017 2018 2019 2020+ Total (in sq. ft.) Western Canada (1) Expiries Expiries committed for renewals Expiries profile, net of renewals Vacancies committed for new leases Expiries, net of commitments obtained Ontario (1) Expiries Expiries committed for renewals Expiries profile, net of renewals Vacancies committed for new leases Expiries, net of commitments obtained Québec (1) Expiries Expiries committed for renewals Expiries profile, net of renewals Vacancies committed for new leases Expiries, net of commitments obtained Eastern Canada (1) Expiries Expiries committed for renewals Expiries profile, net of renewals Vacancies committed for new leases Expiries, net of commitments obtained Total portfolio (1) Expiries Expiries committed for renewals Expiries profile, net of renewals Vacancies committed for new leases Expiries, net of commitments obtained -‐ -‐ -‐ -‐ -‐ (637,111) (658,181) (716,223) (691,642) (475,794) 322,720 12,000 55,644 17,700 -‐ (314,391) (646,181) (660,579) (673,942) (475,794) 52,356 -‐ -‐ -‐ -‐ (262,035) (646,181) (660,579) (673,942) (475,794) -‐ (672,622) (666,430) (720,877) (906,441) (648,836) -‐ 258,675 9,604 -‐ -‐ -‐ -‐ (413,947) (656,826) (720,877) (906,441) (648,836) -‐ 87,644 -‐ -‐ -‐ -‐ -‐ (326,303) (656,826) (720,877) (906,441) (648,836) (1,894) (265,595) (599,045) (511,836) (209,741) (436,209) -‐ 67,065 122,771 -‐ 18,753 -‐ (1,894) (198,530) (476,274) (511,836) (190,988) (436,209) -‐ -‐ -‐ -‐ -‐ -‐ (1,894) (198,530) (476,274) (511,836) (190,988) (436,209) (7,622) (508,403) (612,584) (323,541) (290,432) (319,683) -‐ 58,364 7,555 -‐ -‐ -‐ (7,622) (450,039) (605,029) (323,541) (290,432) (319,683) -‐ 39,993 -‐ -‐ -‐ -‐ (7,622) (410,046) (605,029) (323,541) (290,432) (319,683) (9,516) (2,083,731) (2,536,240) (2,272,477) (2,098,256) (1,880,522) -‐ 706,824 151,930 55,644 36,453 -‐ (9,516) (1,376,907) (2,384,310) (2,216,833) (2,061,803) (1,880,522) -‐ 179,993 -‐ -‐ -‐ -‐ (9,516) (1,196,914) (2,384,310) (2,216,833) (2,061,803) (1,880,522) (1) Expiries includes current in-‐place expiries and future expiries committed for renewals. Dream Industrial REIT 2015 First Quarter Report | 10 (1,949,156) (5,128,107) -‐ 408,064 (1,949,156) (4,720,043) -‐ 52,356 (1,949,156) (4,667,687) (1,540,786) (5,155,992) -‐ 268,279 (1,540,786) (4,887,713) -‐ 87,644 (1,540,786) (4,800,069) (2,091,021) (4,115,341) -‐ 208,589 (2,091,021) (3,906,752) -‐ -‐ (2,091,021) (3,906,752) (675,249) (2,737,514) 45,089 111,008 (630,160) (2,626,506) -‐ 39,993 (630,160) (2,586,513) (6,256,212) (17,136,954) 45,089 995,940 (6,211,123) (16,141,014) -‐ 179,993 (6,211,123) (15,961,021) The following table details expiring rents across our portfolio as well as our estimate of average market rents based on current leasing activity in similar properties at March 31, 2015. For the remainder of 2015, the expiring rents exceed estimated market rents for similar properties by 2% largely driven by certain single-‐tenant leases. For 2016, the estimated market rents are 3.3% above the expiring rents. This represents an opportunity to increase rents as space is re-‐leased. (per sq. ft.) Expiring rents Western Canada Ontario Québec Eastern Canada Portfolio average (1) Estimated market rents Western Canada Ontario Québec Eastern Canada Estimated market rent average Market rent over expiring rent Current monthly Remainder of tenancies 2015 2016 2017 2018 $ $ -‐ -‐ 4.97 2.40 2.91 $ $ 8.98 6.57 5.84 6.30 6.93 $ $ 8.18 6.16 4.18 7.29 6.60 $ $ 9.86 6.23 5.73 7.53 7.39 $ $ 10.49 6.42 5.57 8.17 7.92 $ $ $ $ 9.06 5.78 4.71 7.21 6.82 3.3% $ $ 9.31 6.02 5.38 6.35 6.79 -‐2.0% 10.23 6.31 5.80 7.55 7.54 2.0% $ $ 10.80 6.26 5.29 7.87 7.88 -‐0.5% $ $ -‐ -‐ 6.15 6.25 6.23 (1) Estimate only; based on current market rents with no allowance for increases in future years. Subject to changes in market conditions in each market. Initial direct leasing costs and lease incentives Initial direct leasing costs include leasing fees and related costs and broker commissions related to negotiating and arranging tenant leases. Lease incentives include costs incurred to make leasehold improvements to tenant spaces and cash allowances. Initial direct leasing costs and lease incentives are dependent upon asset type, lease terminations and expiries, the mix of new leasing activity compared to renewals, portfolio growth and general market conditions. Short-‐term leases generally have lower costs than long-‐term leases. During the three months ended March 31, 2015, a total of 614,000 square feet was leased and occupied with related costs of $1.7 million, representing an average rate of $2.83 per square foot leased. Performance indicators Operating activities Portfolio size (sq. ft.) Occupied and committed Square footage leased and occupied in 2015 Lease incentives and initial direct leasing costs for square footage leased and occupied in 2015 Dream Industrial REIT 2015 First Quarter Report | 11 $ Total 16,944,061 95.3% 613,883 1,736 Tenant base profile Our tenant base consists of a diverse range of high-‐quality businesses and, with 1,333 tenants, we believe our exposure to any single large lease or tenant is low. The average size of our tenants is 12,000 square feet, averaging 88,000 square feet across our single-‐tenant buildings and 8,000 square feet across our multi-‐tenant buildings. The following table outlines the contributions of our top ten tenants to our rental revenue. Annualized Weighted average Owned area Owned area base rent remaining lease term Tenant (%) (years) Spectra/Premium Industries TC Transcontinental Gienow Windows & Doors Inc. Molson Breweries Properties The Brick Warehouse LP Clean Harbors Industrial Royal Group Inc. United Agri Products Canada Inc. Nellson Nutraceutical Canada Array Canada Inc. Total (sq. ft.) 642,368 523,345 351,306 225,000 327,000 113,506 346,035 275,335 210,710 209,754 3,224,359 (%) 3.8 3.1 2.1 1.3 1.9 0.7 2.0 1.6 1.2 1.2 18.9 3.6 3.1 2.2 2.1 2.0 1.7 1.7 1.2 1.2 1.0 19.8 10.2 7.0 7.6 7.8 9.2 5.0 2.8 8.5 4.5 5.8 7.3 On an annualized base rent basis, no single tenant represents more than 5% of total revenue of the portfolio, and the weighted average remaining lease term for the top ten tenants stands strong at 7.3 years. Dream Industrial REIT 2015 First Quarter Report | 12 OUR RESOURCES AND FINANCIAL CONDITION Investment properties At March 31, 2015, the fair value of our investment property portfolio was $1.7 billion, reflecting a weighted average capitalization rate (“cap rate”) of 6.70% on stabilized NOI, excluding property management income. The valuation approach for investment properties uses both the direct capitalization method and discounted cash flow method. The results of both methods are evaluated by considering the reasonableness of the range of values calculated under both methods. Fair value of a property is determined at the point within that range that is most representative of the fair value in the circumstances. The direct capitalization method applies a cap rate to stabilized NOI and incorporates allowances for vacancy and management fees. The resulting capitalized value is further adjusted for extraordinary costs to stabilize income and non-‐ recoverable capital expenditures, where applicable. Individual properties were valued using cap rates in the range of 6.00% to 8.25%. The discounted cash flow method discounts the expected future cash flows, generally over a term of ten years, and uses discount rates and terminal capitalization rates specific to each property. The fair value of our investment properties excluding vacant land is set out below. $ $ Western Canada Ontario Québec Eastern Canada Total March 31, December 31, 2015 649,375 434,950 327,937 271,258 1,683,520 $ $ 2014 647,117 435,430 327,396 270,816 1,680,759 The key valuation metrics for investment properties are set out in the table below: March 31, 2015 Weighted Range (%) average (%) Western Canada Ontario Québec Eastern Canada Total Capitalization rates – Total portfolio 6.00–8.25 6.00–7.75 6.50–8.00 6.50–7.75 6.00–8.25 6.43 6.60 7.07 7.06 6.70 December 31, 2014 Range (%) Weighted average (%) 6.00–8.25 6.00–7.75 6.50–8.00 6.50–7.75 6.00–8.25 6.42 6.60 7.17 7.05 6.71 Dispositions The following dispositions were completed during the three months ended March 31, 2015: 4501–4509 1st Street SE, Calgary 4515–4519 1st Street SE, Calgary 4523–4529 1st Street SE, Calgary 4021 9th Street SE, Calgary Total Disposed 13,200 $ 14,340 11,400 45,344 84,284 $ GLA Gross (1) proceeds 2,300 $ 1,900 1,700 5,000 10,900 $ Loss on (2) sale (154) $ (229) (59) (521) (963) $ Mortgage discharged -‐ -‐ -‐ 3,277 3,277 Date disposed February 4, 2015 February 4, 2015 February 4, 2015 February 17, 2015 (1) Gross proceeds before transaction costs. (2) Carrying value of assets approximated gross proceeds. The loss on sale arises entirely from the write-‐off of fair value adjustments and costs associated with the debt discharge, transaction costs and the write-‐off of allocated goodwill associated with the cash-‐generating unit. Dream Industrial REIT 2015 First Quarter Report | 13 Building improvements and leasing costs The table below represents costs incurred during the three months ended March 31: Building improvements Recoverable capital expenditures Other capital expenditures Initial leasing costs and lease incentives Leasing costs Landlord’s work Tenant improvements Other leasing costs Total Three months ended March 31, 2015 $ $ 13 $ 101 493 535 323 480 1,945 $ 2014 180 363 471 533 230 223 2,000 Other capital expenditures primarily consisted of upgrades completed on certain properties which tend to increase the Trust’s ability to obtain higher rental rates. Other leasing costs consisted of costs incurred to bring certain properties and units up to the Trust’s operating standards as identified at the time of acquisition and costs incurred towards major reconfiguration to attract and put in place high value tenancies or to improve the quality of the asset. OUR FINANCING Liquidity and capital resources Dream Industrial’s primary sources of capital are cash generated from operating activities, credit facilities, mortgage financing and refinancing, and equity and debt issues. Our primary uses of capital include the payment of distributions, costs of attracting and retaining tenants, recurring property maintenance, major property improvements, debt principal repayments, interest payments and property acquisitions. We expect to meet all of our ongoing obligations with current cash and cash equivalents, cash generated from (utilized in) operations, draws on the revolving credit facility, conventional mortgage refinancings and, as growth requires and when appropriate, new equity or debt issues. In our condensed consolidated financial statements prepared under IFRS, our current liabilities exceed our current assets by $151.9 million. Typically, real estate entities seek to address liquidity needs by having a balanced debt maturity schedule, undrawn credit facilities, and a pool of unencumbered assets. We are able to use our revolving credit facility on short notice which eliminates the need to hold a significant amount of cash and cash equivalents on hand. Working capital balances fluctuate significantly from period to period depending on the timing of receipts and payments. Debt obligations that are due within one year amount to $116.7 million, which we typically refinance with mortgages of terms between five and ten years. Amounts payable outstanding at the end of any reporting period depends primarily on the timing of leasing costs, capital expenditures incurred as well as the impact of transaction costs incurred on any acquisitions completed during the reporting period. Our unencumbered assets pool as at March 31, 2015 is $144.2 million. With our balanced debt maturity schedule, undrawn credit facility and unencumbered assets pool, we have sufficient liquidity as at March 31, 2015. Dream Industrial REIT 2015 First Quarter Report | 14 Financing activities Our debt strategy includes managing our maturity schedule to help mitigate interest rate risk and limit exposure in any given year, as well as fixing the rates and extending loan terms as long as possible when interest rates are favourable. Summary of debt, capital and liquidity The key performance indicators in the management of our capital are as follows: Financing metrics Debt (1) Weighted average effective interest rate Weighted average face interest rate (2) Interest coverage ratio (3) Debt-‐to-‐adjusted EBITDA (4) Level of debt (debt-‐to-‐total assets) Variable rate debt as percentage of total debt Liquidity metrics Maximum proportion of debt maturities and principal repayments due in any one year Weighted average term to maturity (years) Encumbered assets Cash on hand Unencumbered assets Undrawn lines of credit March 31, 2015 $ $ 910,846 3.83% 4.01% 3.0 8.5 52.4% 2.4% 19.1% (2019) 3.9 1,539,333 1,939 144,187 50,800 December 31, 2014 $ $ 921,293 3.85% 4.07% 3.0 8.5 52.9% 4.4% 18.8% (2019) 3.9 1,514,665 78 166,094 33,572 (1) Weighted average effective interest rate is calculated as the weighted average interest rate of all interest bearing debt including issue costs and mark-‐to-‐ market adjustments. (2) The interest coverage ratio (non-‐GAAP measure) for the three months ended March 31, 2015 and year ended December 31, 2014 is calculated as net rental income plus interest and fee income, less general and administrative expenses, plus deferred unit compensation expense, all divided by interest expense on debt excluding deferred financing and mark-‐to-‐market adjustments. The detailed calculation of interest coverage ratio can be found under the heading “Non-‐GAAP measures and other disclosures”. (3) Debt-‐to-‐adjusted EBITDA (non-‐GAAP measure) is determined as total debt at principal amount outstanding divided by adjusted EBITDA. The calculation for debt-‐to-‐adjusted EBITDA can be found under the heading “Non-‐GAAP measures and other disclosures”. (4) Level of debt (non-‐GAAP measure) is determined as total debt at principal amount outstanding divided by total assets. The calculation for level of debt can be found under the heading “Non-‐GAAP measures and other disclosures”. We currently use cash flow performance and debt level indicators to assess our ability to meet our financing obligations. Our current interest coverage ratio is 3.0 times, demonstrating our ability to more than adequately cover interest expense requirements. At March 31, 2015, our weighted average face rate of interest is 4.01% and, after accounting for market adjustments and financing costs, the weighted average effective interest rate for outstanding debt is 3.83%. Mortgages Revolving credit facility Convertible debentures Total Percentage Weighted average face rate (period-‐end) Average term to maturity (years) $ $ Fixed 763,737 -‐ 125,675 889,412 97.6% 4.03% 3.9 $ $ March 31, 2015 Total Variable -‐ 21,434 -‐ 21,434 2.4% 3.01% 1.3 $ $ 763,737 21,434 125,675 910,846 100.0% 4.01% 3.9 $ $ Dream Industrial REIT 2015 First Quarter Report | 15 December 31, 2014 Fixed 755,194 -‐ 125,490 880,684 95.6% 4.10% 4.0 $ $ Variable -‐ 40,609 -‐ 40,609 4.4% 3.42% 1.5 $ $ Total 755,194 40,609 125,490 921,293 100.0% 4.07% 3.9 Mortgages payable are recorded net of $7.0 million of fair value adjustments upon initial recognition and $2.3 million of financing costs. At March 31, 2015, amounts recorded for the convertible debentures are net of a $2.3 million discount allocated to their conversion features on issuance and fair value adjustment and net of $2.7 million of financing costs. The fair value adjustments, discounts and financing costs are amortized to interest expense over the term to maturity of the related debt using the effective interest rate method. Mortgage financing activities New mortgage financing is highlighted in the table below. Three months ended March 31, 2015 Term to maturity Amount (years) New mortgage $ 33,000 Face Effective interest rate interest rate (%) 7.0 (%) 2.63 2.75 On March 5, 2015, we completed financing for a $33 million mortgage on a portfolio of four properties with a term of seven years at a face interest rate of 2.63% and an effective interest rate of 2.75%, which was used to refinance a $10.1 million mortgage on a portfolio of three properties at a face interest rate of 4.69%. Revolving credit facility The following table summarizes details of the Trust’s revolving credit facility as at March 31, 2015: (4) Revolving credit facility $ Borrowing capacity Letter of credit and forwards Principal amount Available (1) (2) (3) agreement outstanding to be drawn Interest rate 75,000 $ 2,500 $ 21,700 $ 50,800 3.01% Maturity date June 30, 2016 (1) Excludes financing costs. (2) Formula-‐based amount available to be drawn as at March 31, 2015. (3) Bankers’ acceptance (“BA”) rate plus 1.75% or the bank’s prime rate plus 0.75%. (4) Nineteen properties are secured as first-‐ranking mortgages on the facility. Changes in debt levels are as follows: Face Revolving Convertible interest rate Mortgages credit facility debentures Total Debt as at January 1, 2015 New debt placed Scheduled repayments Lump sum repayments (1) Other adjustments Debt as at March 31, 2015 4.07% 2.63% 4.21% 4.01% $ $ Three months ended March 31, 2015 755,194 33,000 (5,888) (17,650) (919) 763,737 $ $ 40,609 -‐ -‐ (19,228) 53 21,434 $ $ 125,490 -‐ -‐ -‐ 185 125,675 $ $ (1) Other adjustments include financing costs on new debt placed, write-‐off of fair value adjustments, and amortization of finance costs and fair value adjustments. Dream Industrial REIT 2015 First Quarter Report | 16 921,293 33,000 (5,888) (36,878) (681) 910,846 Our current debt profile is balanced with maturities well-‐distributed over the next ten years. The following is our debt maturity profile as at March 31, 2015: Weighted Scheduled average effective average principal interest rate on face rate on repayments on balance due balance due non-‐maturing debt Amount % at maturity (%) at maturity (%) 119,095 134,664 125,590 93,405 173,900 264,758 911,412 (5,274) 4,708 910,846 Debt maturities 2015 $ 101,929 2016 114,970 2017 108,791 2018 80,709 2019 163,242 2020 and thereafter 244,506 Total $ 814,147 Unamortized financing costs Unamortized fair value adjustments Total $ $ 17,166 19,694 16,799 12,696 10,658 20,252 97,265 $ $ $ 13.07 14.77 13.78 10.25 19.08 29.05 100.00 3.07 3.15 3.84 3.62 5.29 3.69 3.87 Weighted 3.43 4.03 4.46 3.36 4.66 3.87 4.02 Convertible debentures The total principal amounts outstanding for all of the convertible debentures are as follows: Outstanding Outstanding REIT Units principal principal if converted Conversion March 31, May 5, Date issued price 2015 5.25% Debentures 5.25% Debentures 6.75% Debentures Total December 13, 2012 December 19, 2012 (1) May 15, 2013 Maturity date December 31, 2019 $ December 31, 2019 November 30, 2017 13.80 $ 13.80 12.37 $ 86,250 25,000 19,420 130,670 $ $ May 5, 2015 86,250 25,000 19,420 130,670 2015 6,250,000 1,811,594 1,569,927 9,631,521 (1) The 6.75% Debentures were assumed as part of the C2C acquisition on May 15, 2013. The fair value of the conversion feature of the convertible debentures is remeasured each period, with changes in fair value being recorded in comprehensive income. At March 31, 2015, the conversion feature amounted to a $1.2 million financial asset (December 31, 2014 – $3 financial liability) and was included in other non-‐current assets on the condensed consolidated balance sheet. Commitments and contingencies We are contingently liable with respect to guarantees that are issued in the normal course of business and with respect to litigation and claims that may arise from time to time. In the opinion of management, any liability that may arise from such contingencies would not have a material adverse effect on our condensed consolidated financial statements. Dream Industrial did not enter into any operating or finance leases as lessee during this reporting period. As at March 31, 2015, the Trust has entered into lease agreements with tenants that may require leasing and tenant improvement costs of approximately $3.5 million (March 31, 2014 – $3.3 million). The Trust’s future commitment for business transformation activities under the Shared Services and Cost Sharing Agreement with DREAM Asset Management Corp. (“DAM”) is $2.0 million (March 31, 2014 – $2.4 million). We are presently in the early stages of business transformation activities that will transform our operating platform to allow us to improve data integrity, realize operating efficiencies, establish business analytic tools and ultimately generate better business outcomes. This initiative will form the foundation of our continuous improvement culture. Dream Industrial REIT 2015 First Quarter Report | 17 OUR EQUITY Our discussion of equity includes LP B Units, which are economically equivalent to REIT Units. However, pursuant to International Financial Reporting Standards (“IFRS”), the LP B Units are classified as a liability in our condensed consolidated financial statements. Unitholders’ equity March 31, 2015 Number of Units REIT Units Retained earnings Add: LP B Units Accumulated other comprehensive loss Total 58,196,975 -‐ 18,551,855 -‐ 76,748,830 $ $ Amount 577,858 46,732 167,152 (1,776) 789,966 December 31, 2014 Number of Units 58,035,125 -‐ 18,551,855 -‐ 76,586,980 Amount $ $ 576,399 52,774 156,206 (522) 784,857 Our Declaration of Trust authorizes the issuance of an unlimited number of two classes of units: REIT Units and Special Trust Units. The Special Trust Units may only be issued to holders of LP B Units, are not transferable separately from these Units, and are used to provide voting rights with respect to Dream Industrial REIT to persons holding LP B Units. The LP B Units are held by wholly owned subsidiaries of Dream Office REIT. Both the REIT Units and Special Trust Units entitle the holder to one vote for each Unit at all meetings of the unitholders. The LP B Units are exchangeable on a one-‐for-‐one basis for REIT Units at the option of the holder. The LP B Units and corresponding Special Trust Units together have economic and voting rights equivalent in all material respects to REIT Units. The REIT Units have economic and voting rights equivalent in all material respects to each other. At March 31, 2015, Dream Office REIT, indirectly through its wholly owned subsidiaries, held 18,551,855 LP B Units representing a total ownership interest of approximately 24.2%. The following table summarizes the changes in our outstanding equity. Total Units outstanding on January 1, 2015 Units issued pursuant to DRIP Units issued pursuant to Unit Purchase Plan Units issued pursuant to Deferred Unit Incentive Plan (“DUIP”) Total Units outstanding on March 31, 2015 Percentage of all Units Units issued pursuant to Unit Purchase Plan Units issued pursuant to DRIP on April 15, 2015 Units vested and issued pursuant to DUIP on April 15, 2015 (1) Total Units outstanding on May 5, 2015 Percentage of all Units REIT Units 58,035,125 109,846 1,150 50,854 58,196,975 75.8% 222 40,450 3,202 58,240,849 75.8% LP B Units 18,551,855 -‐ -‐ -‐ 18,551,855 24.2% -‐ -‐ -‐ 18,551,855 24.2% Total 76,586,980 109,846 1,150 50,854 76,748,830 100.0% 222 40,450 3,202 76,792,704 100.0% (1) The date of this report. Normal course issuer bid On December 15, 2014, the Toronto Stock Exchange accepted the Trust’s Notice of Intention to make a normal course issuer bid, which commenced on December 17, 2014 and will remain in effect until the earlier of December 16, 2015 or the date on which the Trust has purchased the maximum number of REIT Units permitted under the bid. Under the bid, the Trust has the ability to purchase for cancellation up to a maximum of 5,688,097 REIT Units (representing 10% of the REIT’s public float of 56,880,965 REIT Units as at December 1, 2014). To the date of this report, no purchases have been made. Dream Industrial REIT 2015 First Quarter Report | 18 Distribution policy Our Declaration of Trust provides our trustees with the discretion to determine the percentage payout of income that would be in the best interest of the Trust. Amounts retained in excess of the declared distributions are used to fund leasing costs and capital expenditure requirements. 2015 distributions Paid in cash or reinvested in Units Payable at March 31, 2015 (2) Total distributions 2015 reinvestment Reinvested to March 31, 2015 Reinvested on April 15, 2015 Total distributions reinvested Distributions paid in cash Reinvestment to distribution ratio Ratio of distributions paid in cash $ $ $ $ $ Three months ended March 31, 2015 Declared 3% bonus (1) distributions distributions 8,950 $ 4,477 13,427 $ 679 $ 354 1,033 $ 12,394 7.7% 92.3% 20 $ -‐ 20 $ 20 $ 11 31 $ Total 8,970 4,477 13,447 699 365 1,064 (1) Unitholders registered in the DRIP are also eligible to receive a bonus distribution of Units equal to 3% of the amount of the cash distribution reinvested pursuant to the DRIP. (2) Includes distributions on LP B Units. Distributions declared for the three months ended March 31, 2015 were $13.4 million. Of the distributions declared for the three months ended March 31, 2015, $1.0 million, or approximately 7.7%, was reinvested in additional Units resulting in a ratio of distributions paid in cash of 92.3%. Dream Industrial REIT 2015 First Quarter Report | 19 OUR RESULTS OF OPERATIONS 2015 $ 43,940 $ (14,237) 29,703 Three months ended Investment properties revenue Investment properties operating expenses Net rental income Other revenue Interest and fee income Other expenses General and administrative Interest: Interest expense on debt Subsidiary redeemable units Depreciation and amortization Fair value adjustments and other items Fair value adjustments to investment properties Fair value adjustments to financial instruments Gains (costs) on transactions and other activities Income before income taxes Recovery (deferred) income taxes Net income for the period 3 3 $ 2014 911 (9,982) (2,116) (11,187) 4,266 (107) 4,159 $ March 31, 2014 40,914 (13,699) 27,215 1 1 (2,202) (8,795) (3,246) (10) (14,253) 44,588 $ (14,599) 29,989 March 31, December 31, (2,160) (8,889) (3,246) (14) (14,309) (1,919) 11,580 (1,089) 8,572 24,253 60 24,313 $ 8 8 (1,959) (8,119) (2,849) (5) (12,932) 501 (9,336) (1,035) (9,870) 4,421 (310) 4,111 Investment properties revenue Investment properties revenue includes net rental income from investment properties as well as the recovery of operating costs and property taxes from tenants. Investment properties revenue totalled $43.9 million for the quarter, an increase of $3.0 million, or 7.4%, compared to the prior year comparative quarter, primarily due to acquisitions completed in September 2014. Investment properties revenue decreased by $0.6 million, or 1.5%, when compared to the prior quarter. The increase in revenue due to rental rates and a slight increase in average occupancy were offset by certain recovery adjustments recorded in Q4 2014 that did not occur in Q1 2015 and the sale of four properties in February 2015. Investment properties operating expenses Operating expenses comprise occupancy costs and property taxes as well as certain expenses that are not recoverable from tenants, the majority of which are related to leasing. Operating expenses fluctuate with changes in occupancy levels, weather, utility costs, realty taxes, and repairs and maintenance. Investment properties operating expenses increased by $0.5 million, or 3.9%, over the prior year comparative quarter due to growth in our portfolio. Investment properties expenses decreased by $0.4 million, or 2.5%, when compared to the prior quarter, primarily due to the properties sold in February 2015, offset by an increase in bad debt expenses. Dream Industrial REIT 2015 First Quarter Report | 20 General and administrative General and administrative expenses primarily comprise expenses related to corporate management, trustees’ fees and expenses, investor relations and asset management fees. The following table summarizes our general and administrative expenses for the three months ended March 31, 2015, December 31, 2014 and March 31, 2014: Three months ended Asset management fee Deferred compensation expenses Professional fees (1) General corporate expenses Total March 31, December 31, $ $ 2015 1,044 338 328 492 2,202 $ $ 2014 1,049 319 392 400 2,160 March 31, 2014 $ $ 966 291 248 454 1,959 (1) Includes corporate management and Board of Trustees’ fees and expenses. General and administrative expenses increased by $0.2 million, or 12.4%, from the prior year comparative quarter, primarily due to higher fees resulting from the acquisitions completed in Q3 2014, an increase in deferred compensation expenses resulting from the issuance of additional units, an increase in professional fees and a slight increase in general corporate expenses. General and administrative expenses were consistent with last quarter. Fair value adjustments to investment properties The value of investment properties remained stable at $1.7 billion. The fair value gain of $0.9 million in Q1 2015 reflects periodic adjustments that were made to individual properties, and totals 0.1% of the total fair value of the portfolio. Interest expense – Debt Interest expense on debt for the quarter ended March 31, 2015 increased by $0.7 million compared to the prior year comparative quarter. The increase in interest expense resulting from carrying new debt from the acquisitions completed in September 2014 and the interest costs incurred on the credit facility during Q1 2015 were offset by savings in interest costs from the refinancing of mortgages completed during 2014 and Q1 2015 at lower interest rates. The decrease of $0.1 million in interest expense on debt when compared to the prior quarter is a result of interest savings on the mortgage refinancing completed in Q1 2015 as well as interest savings from the credit facility repayments in Q1 2015. Fair value adjustments to financial instruments Fair value adjustments to financial instruments include fair value adjustments on the conversion feature of convertible debt, remeasurement of the carrying value of subsidiary redeemable units and remeasurement of the deferred trust units. For the quarter ended March 31, 2015, we recognized a loss of $10.9 million on the measurement of the subsidiary redeemable units due to the increase in the trading value of REIT Units at the end of Q1 2015 compared to the end of Q4 2014. During Q1 2015, the remeasurement of the conversion feature of the convertible debentures resulted in a gain of $1.2 million primarily as a result of fluctuations in inputs, such as volatility and trading price and credit spreads, used to value the conversion feature of the convertible debentures. The remeasurement of the deferred trust units resulted in a loss of $0.2 million during Q1 2015 due to the increase in the trading value of REIT Units at the end of Q1 2015 compared to the end of Q4 2014. Dream Industrial REIT 2015 First Quarter Report | 21 Gains (costs) on transactions and other activities The following table summarizes the nature of expenses included: Three months ended Debt settlement costs Net loss on sale of investment properties Investment in business transformation activities Internal leasing costs Acquisition costs Total March 31, December 31, 2015 $ $ -‐ (963) (145) (1,008) -‐ (2,116) $ $ 2014 March 31, 2014 -‐ -‐ (113) (976) -‐ (1,089) $ $ (59) -‐ (100) (841) (35) (1,035) Included in gains (costs) on transactions and other activities in Q1 2015 is $0.1 million related to process and technology improvement costs. We are presently in the early stages of a new initiative that will transform our operating platform to allow us to improve data integrity, realize operating efficiencies, establish business analytic tools and ultimately generate better business outcomes. This initiative will form the foundation of our continuous improvement culture. Internal leasing costs increased by $0.2 million when compared to the same quarter in the prior year largely as a result of an increase in compensation expenses. Related party transactions Dream Industrial and its subsidiaries enter into transactions with related parties which are disclosed in Note 20 to the condensed consolidated financial statements. Pursuant to the Asset Management Agreement and Shared Services and Cost Sharing Agreement, during Q1 2015, we paid $1.3 million to DAM. Pursuant to the Services Agreement, during Q1 2015, we paid $1.6 million to Dream Office REIT. Net operating income We define NOI as the total of investment property revenue less investment property operating expenses, including the share of net rental income from investments in joint venture and property management income, if any. NOI is an important measure used by management in evaluating property operating performance; however, it is not defined by IFRS, does not have a standard meaning and may not be comparable with similar measures presented by other income trusts. Three months ended $ $ Total portfolio Western Canada Ontario Québec Eastern Canada Net operating income Net rental income reported per condensed consolidated financial statements March 31, December 31, 2015 2014 11,323 7,533 5,932 4,915 29,703 29,703 $ $ March 31, 2014 11,551 7,616 6,041 4,781 29,989 29,989 $ $ 9,798 7,281 5,290 4,846 27,215 27,215 For the three months ended March 31, 2015, net operating income was $29.7 million, an increase of $2.5 million compared to the prior year comparative period. The increase is attributable to the increase in comparative properties growth and due to the income generated by investment properties acquired in September 2014. Net operating income for the three months ended March 31, 2015 decreased by $0.3 million when compared to the previous quarter, primarily due to certain recovery adjustments recorded in Q4 2014 that did not occur in Q1 2015 and the sale of four properties in February 2015. Dream Industrial REIT 2015 First Quarter Report | 22 NOI BY REGION (Three months ended March 31, 2015) 17% Western Canada 38% Ontario 20% Québec Eastern Canada 25% NOI comparative properties Net operating income shown below details comparative and non-‐comparative items to assist in understanding the impact each component has on NOI. The comparative properties disclosed in the following table are properties acquired prior to January 1, 2014 and exclude the properties sold in February 2015, which were classified as assets held for sale as at December 31, 2014. Comparative properties NOI excludes lease termination fees, straight-‐line rents, bad debt expenses and amortization of tenant inducements. Western Canada Ontario Québec Eastern Canada Comparative properties NOI Lease termination fees Acquisitions Straight-‐line rent Bad debt expenses Amortization of tenant inducements NOI NOI from sold properties NOI including income from sold properties Net rental income reported per condensed consolidated financial statements Average occupancy (comparative properties) In-‐place rental rates (per sq. ft.) at quarter-‐end (comparative properties) Three months ended March 31, 2015 $ $ $ $ $ 9,800 7,024 5,097 4,913 26,834 15 2,403 640 (129) (95) 29,668 35 29,703 29,703 94.5% 7.14 $ $ $ $ $ Growth 2014 Amount % 9,346 7,150 5,099 4,841 26,436 97 -‐ 665 (129) (40) 27,029 186 27,215 27,215 94.8% 6.94 $ $ $ $ 454 (126) (2) 72 398 (82) 2,403 (25) -‐ (55) 2,639 (151) 2,488 5 (2) -‐ 1 2 10 9 Overall, the comparative properties NOI for the first quarter of 2015 increased by $0.4 million, or 1.5%, when compared to the same period in 2014. The growth in comparative properties NOI resulted from a growth in the Western Canada region, where we experienced an increase in the weighted average occupancy and rental rates, and an increase in the Eastern Canada region, where we experienced a growth in rental rates. The decrease in NOI in the Ontario region resulted primarily from a decrease in average occupancy. Dream Industrial REIT 2015 First Quarter Report | 23 NOI prior quarter comparison The comparative properties discussed in the following table include properties acquired prior to October 1, 2014 and exclude the properties sold in February 2015, which were classified as assets held for sale as at December 31, 2014. Comparative properties NOI over the previous quarter remained stable at $29.2 million as a result of increase in occupancy and rental rates in Q1 2015, which was offset by certain recovery adjustments recorded in Q4 2014 that did not occur in Q1 2015. Western Canada Ontario Québec Eastern Canada Comparative properties NOI Lease termination fees Straight-‐line rent Bad debt expenses Amortization of tenant inducements NOI NOI from sold properties NOI including income from sold properties Net rental income reported per condensed consolidated financial statements Average occupancy (comparative properties) In-‐place rental rates (per sq. ft.) at quarter-‐end (comparative properties) Dream Industrial REIT 2015 First Quarter Report | 24 $ $ $ $ $ Three months ended March 31, December 31, 2015 2014 11,137 $ 7,435 5,752 4,913 29,237 15 640 (129) (95) 29,668 $ 35 $ 29,703 29,703 $ 94.7% 7.10 $ 11,160 $ 7,520 5,852 4,708 29,240 6 770 (75) (75) 29,866 $ 123 $ 29,989 $ 29,989 94.6% 7.05 Growth Amount % (23) -‐ (85) (1) (100) (2) 205 4 (3) -‐ 9 (130) (54) (20) (198) (1) (88) (286) (1) Funds from operations and adjusted funds from operations Net income Add (deduct): Amortization of tenant inducements Interest expense on subsidiary redeemable units Fair value adjustments to investment properties Fair value adjustments to financial instruments Net loss on sale of investment properties Fair value adjustments of DUIP included in general and administrative expenses Debt settlement costs Internal leasing costs Acquisition costs Deferred income taxes FFO Funds from operations Add (deduct): Amortization of fair value adjustments on debt Deferred unit compensation expense excluding fair value adjustments Straight-‐line rent Investment in business transformation activities Deduct: Normalized initial direct leasing costs and lease incentives Normalized recurring capital expenditures AFFO $ $ $ $ Three months ended March 31, 2015 4,159 $ 95 3,246 (911) 9,982 963 (28) -‐ 1,008 -‐ 107 18,621 $ 18,621 $ (654) 366 (640) 145 17,838 1,397 838 15,603 $ 2014 4,111 40 2,849 (501) 9,336 -‐ (36) 59 841 35 310 17,044 17,044 (792) 327 (665) 100 16,014 1,255 753 14,006 Funds from operations FFO FFO per Unit ̶ basic FFO per Unit ̶ diluted $ $ $ Three months ended March 31, 2015 18,621 0.24 0.24 2014 $ $ $ 17,044 0.24 0.23 Diluted FFO per Unit for the three months ended March 31, 2015 was $0.24, an increase of 1.3% when compared to the comparative quarter in 2014 primarily due to acquisitions completed in September 2014 as well as growth in comparative properties NOI. Adjusted funds from operations AFFO AFFO per Unit ̶ basic AFFO per Unit ̶ diluted $ $ $ Three months ended March 31, 2015 15,603 0.20 0.20 2014 $ $ $ 14,006 0.20 0.20 Basic AFFO per Unit increased by 0.6 cents, or 3.0%, when compared to the comparative quarter in 2014, primarily due to the acquisitions completed in September 2014 combined with a growth in comparative properties NOI. Dream Industrial REIT 2015 First Quarter Report | 25 QUARTERLY INFORMATION The following tables show quarterly information since April 1, 2013. Key leasing, financing and portfolio information Leasing Occupancy rate – including committed (period-‐end) Occupancy rate – in place (period-‐end) Tenant retention rate Average in-‐place base rent per sq. ft. (period-‐end) Estimated market rent in excess of in-‐place rent (%) Financing Weighted average effective interest rate Weighted average face interest rate Debt – average term to maturity (years) Interest coverage ratio (times) Unencumbered assets (in millions) Debt-‐to-‐total assets Portfolio Number of properties Gross leasable area (in millions of sq. ft.) $ $ 2015 Q1 95.3% 94.2% 60.1% 7.10 3.9% 3.83% 4.01% 3.9 3.0 144.2 52.4% 216 16.9 $ $ Q4 96.0% 95.2% 70.3% 7.05 $ 4.4% 3.85% 4.07% 3.9 3.0 166.1 $ 52.9% 216 16.9 Q3 2014 Q2 Q1 Q4 95.5% 93.9% 68.9% 7.03 $ 5.0% 3.86% 4.11% 4.1 3.0 119.2 $ 52.8% 220 17.0 5.1% 3.82% 4.16% 4.1 3.0 120.6 $ 52.4% 205 15.6 Q3 Q2 95.6% 94.0% 57.9% 96.3% 95.3% 80.3% 7.04 $ 6.96 $ 6.0% 3.86% 4.17% 4.2 2.9 138.0 52.4% 205 15.6 $ 95.7% 94.4% 69.6% 2013 Q3 95.1% 94.1% 71.1% Q2 95.8% 95.2% 66.2% 6.92 $ 6.89 $ 6.90 6.4% 3.84% 4.18% 4.1 2.9 122.2 $ 52.6% 206 15.7 6.8% 3.83% 4.18% 4.4 2.9 112.0 $ 52.5% 206 15.7 4.9% 3.81% 4.19% 4.5 2.9 83.6 53.0% 206 15.7 Results of operations 2015 Q1 Investment properties revenue $ 43,940 Investment properties operating expenses (14,237) Net rental income 29,703 Other revenue 3 Other expenses (14,253) Fair value adjustments and other items (11,187) Income before income taxes 4,266 Recovery (deferred) income taxes (107) Net income $ 4,159 Other comprehensive income (loss) Unrealized gain (loss) on interest rate swap $ (1,254) (1,254) Comprehensive income $ 2,905 2014 Q4 $ $ $ 44,588 $ 40,319 $ 40,428 $ (14,599) (12,293) (12,894) 29,989 28,026 27,534 1 3 5 (14,309) (13,591) (13,053) 8,572 8,574 3,158 24,253 23,012 17,644 60 48 (1,127) 24,313 $ 23,060 $ 16,517 $ (423) $ 47 $ (309) $ (423) 47 (309) $ 23,890 $ 23,107 $ 16,208 $ Dream Industrial REIT 2015 First Quarter Report | 26 Q1 40,914 (13,699) 27,215 8 (12,932) (9,870) 4,421 (310) 4,111 163 163 4,274 $ 2013 Q4 Q3 Q2 41,149 $ 37,842 $ 34,703 (14,089) (10,621) (9,949) 27,060 27,221 24,754 5 17 186 (13,001) (12,988) (12,117) (3,096) 7,762 21,414 10,968 22,012 34,237 464 (1,352) (272) $ 11,432 $ 20,660 $ 33,965 $ -‐ $ -‐ $ -‐ -‐ -‐ -‐ $ 11,432 $ 20,660 $ 33,965 Calculation of funds from operations NET INCOME $ Add (deduct): Amortization Interest expense on subsidiary redeemable units Fair value adjustments to investment properties Fair value adjustments to financial instruments Net loss on sale of investment properties Fair value adjustments of DUIP included in general and administrative expenses Debt settlement (costs) gains Internal leasing costs Acquisition recovery (costs) FFO share related to non-‐controlling interest of C2C Recovery (deferred) income taxes FFO $ FFO per Unit ̶ basic(1) $ FFO per Unit ̶ diluted(1)(2) $ 2015 2014 Q1 4,159 95 3,246 (911) 9,982 963 (28) -‐ 1,008 -‐ -‐ 107 18,621 0.24 0.24 Q4 Q3 $ 24,313 $ 23,060 $ 75 58 3,246 2,982 1,919 3,569 (11,580) (13,218) -‐ -‐ (56) (33) -‐ -‐ 976 975 -‐ -‐ -‐ -‐ (60) (48) $ 18,833 $ 17,345 $ $ 0.25 $ 0.24 $ $ 0.24 $ 0.23 $ Q2 16,517 $ 37 2,849 (7,124) 4,758 -‐ (10) -‐ 1,131 (2,023) -‐ 1,127 17,262 $ 0.24 $ 0.24 $ Q1 4,111 $ 40 2,849 (501) 9,336 -‐ (36) 59 841 35 -‐ 310 17,044 $ 0.24 $ 0.23 $ 2013 Q4 11,432 $ 21 2,848 182 1,775 -‐ (61) 13 1,126 -‐ -‐ (464) 16,872 $ 0.24 $ 0.23 $ Q3 Q2 20,660 $ 33,965 71 20 2,850 2,849 (2,263) (846) (6,114) (32,149) -‐ -‐ (71) (53) (49) -‐ 664 563 -‐ 11,018 (23) (67) 1,352 272 17,077 $ 15,572 0.24 $ 0.23 0.24 $ 0.23 (1) The LP B Units are included in the calculation of basic and diluted FFO per Unit. (2) Diluted FFO for Q1 2015, Q4 2014, Q3 2014, Q2 2014, Q1 2014, Q4 2013, Q3 2013 and Q2 2013 excludes $2.0 million, $2.0 million, $2.0 million, $2.0 million, $2.0 million, $2.0 million, $2.0 million and $1.8 million in interest on convertible debentures, respectively. Dream Industrial REIT 2015 First Quarter Report | 27 FUNDS FROM OPERATIONS $ Add (deduct): Amortization of fair value adjustments on debt Deferred unit compensation expense excluding fair value adjustments Straight-‐line rent Investment in business transformation activities FFO share related to non-‐controlling interest of C2C AFFO share related to non-‐controlling interest of C2C Adjusted for: Normalized initial direct leasing costs and lease incentives Normalized recurring capital expenditures Adjusted funds from operations $ (1) AFFO per Unit ̶ basic and diluted $ Weighted average Units outstanding for FFO and AFFO Basic (in thousands) Diluted (in thousands) 2015 2014 Q1 18,621 (654) 366 (640) 145 -‐ -‐ 17,838 1,397 838 15,603 0.20 76,701 86,773 $ $ $ Q4 18,833 $ (768) 375 (770) 113 -‐ -‐ 17,783 1,401 841 15,541 $ 0.20 $ 76,572 86,610 Q3 17,345 $ (750) 383 (733) 100 -‐ -‐ 16,345 1,293 776 14,276 $ 0.20 $ 72,699 82,735 Q2 Q1 2013 Q4 Q3 Q2 17,262 $ 17,044 $ 16,872 $ 17,077 $ 15,572 (765) (792) (812) (877) (924) 314 327 351 378 493 (660) (665) (784) (823) (801) 100 -‐ -‐ 16,251 1,279 767 14,205 $ 0.20 $ 71,440 81,447 (1) The LP B Units are included in the calculation of basic AFFO per Unit. Dream Industrial REIT 2015 First Quarter Report | 28 100 -‐ -‐ -‐ -‐ -‐ 23 67 -‐ 16,014 -‐ 15,627 1,255 1,248 (20) (56) 15,758 14,351 1,267 1,138 753 749 762 683 14,006 $ 13,630 $ 13,729 $ 12,530 0.20 $ 0.19 $ 0.19 $ 0.19 71,289 71,133 70,931 66,930 81,196 80,955 80,761 75,830 NON-‐GAAP MEASURES AND OTHER DISCLOSURES The following non-‐GAAP measures are important measures used by management in evaluating the Trust’s underlying operating performance and debt management. These non-‐GAAP measures are not defined by IFRS, do not have a standardized meaning and may not be comparable with similar measures presented by other income trusts. Funds from operations Management believes FFO is an important measure of our operating performance. This non-‐GAAP measurement is a commonly used measure of performance of real estate operations; however, it does not represent net income or cash generated from (utilized in) operating activities, as defined by IFRS, and is not necessarily indicative of cash available to fund Dream Industrial REIT’s needs. In compliance with Canadian Securities Administrators Staff Notice 52-‐306 (Revised), “Non-‐GAAP Financial Measures and Additional GAAP Measures”, FFO has been reconciled to net income under the heading “Funds from operations and adjusted funds from operations”. Adjusted funds from operations Management believes AFFO is an important measure of our economic performance and is indicative of our ability to pay distributions. This non-‐GAAP measurement is commonly used for assessing real estate performance; however, it does not represent cash generated from (utilized in) operating activities, as defined by GAAP, and is not necessarily indicative of cash available to fund the Trust’s needs. In calculating AFFO, we also normalize leasing costs, which fluctuate with lease maturities, renewal terms and the type of asset being leased. We also evaluate the impact of leasing activity based on averages for our portfolio over a two-‐ to three-‐year time frame and exclude the impact of transaction costs expensed on business combinations. In determining AFFO, the Trust assumes 8% of NOI, adjusted for straight-‐line rent, property management income and amortization of tenant inducements for normalized initial direct leasing costs and recurring capital expenditures. Management uses 8% of NOI as the normalized initial direct leasing costs and recurring capital expenditures based on assessments of the condition of our properties, history from vendors, internal capital expenditure budgets, level of expiries and appraisal data, taking into account that these expenditures typically are not incurred at a rate that is consistent from period to period. This assumption will be re-‐evaluated from time to time based on actual experience as our expenditure pattern is established in the future. In compliance with Canadian Securities Administrators Staff Notice 52-‐306 (Revised), “Non-‐GAAP Financial Measures and Additional GAAP Measures”, AFFO has been reconciled to cash generated from operating activities under the heading “Cash generated from (utilized in) operating activities to AFFO reconciliation”. NOI NOI is defined by the Trust as the total investment property revenue less investment property operating expenses, including the share of net rental income from investments in joint ventures and property management income, if any. This non-‐GAAP measurement is an important measure used by the Trust in evaluating property operating performances; however, it is not defined by IFRS, does not have a standard meaning and may not be comparable with similar measures presented by other income trusts. During Q1 2015, the Trust did not have any investments in joint ventures; NOI is the same as net rental income presented in the condensed consolidated financial statements. In compliance with Canadian Securities Administrators Staff Notice 52-‐306 (Revised), “Non-‐GAAP Financial Measures and Additional GAAP Measures”, NOI has been reconciled to net rental income under the heading “Net operating income”. Stabilized NOI Stabilized NOI for an individual property is defined by the Trust as investment property revenues less property operating expenses adjusted for items such as average lease up costs, long-‐term vacancy rates, non-‐recoverable capital expenditures, management fees, straight-‐line rents and other non-‐recurring items. This non-‐GAAP measurement is an important measure used by the Trust in determining the fair value of individual investment properties; however, it is not defined by IFRS, does not have a standard meaning and may not be comparable with similar measures presented by other income trusts. Dream Industrial REIT 2015 First Quarter Report | 29 Comparative properties NOI Comparative properties NOI is an important non-‐GAAP measure used by management to evaluate the performance of the properties fully owned by the Trust in the current and comparative period presented. This non-‐GAAP measure is not defined by IFRS, does not have a standard meaning and may not be comparable with similar measures presented by other income trusts. Comparative properties NOI excludes lease termination fees and certain other adjustments, straight-‐line rents, bad debt expenses and amortization of tenant inducements. In compliance with Canadian Securities Administrators Staff Notice 52-‐306 (Revised), “Non-‐GAAP Financial Measures and Additional GAAP Measures”, comparative properties NOI has been reconciled to net rental income under the headings “NOI comparative properties” and “NOI prior quarter comparison”. Weighted average number of Units The basic weighted average number of Units outstanding used in the FFO and AFFO calculations includes the weighted average of all REIT Units, LP B Units, and vested but unissued deferred trust units and income deferred trust units. The diluted weighted average number of Units assumes the conversion of the convertible debentures and includes the unvested deferred trust units and income deferred trust units. Weighted average Units outstanding for basic per unit amounts (in thousands) Weighted average Units outstanding for diluted per unit amounts (in thousands) Three months ended March 31, 2015 76,701 86,773 2014 71,289 81,196 Level of debt (debt-‐to-‐total assets) Management believes this non-‐GAAP measurement is an important measure in the management of our debt levels. Level of debt as shown below is determined as total debt at principal amount outstanding divided by total assets. In compliance with Canadian Securities Administrators Staff Notice 52-‐306 (Revised), “Non-‐GAAP Financial Measures and Additional GAAP Measures”, the table below calculates the level of debt (debt-‐to-‐total assets). Amounts per condensed consolidated financial statements Non-‐current debt Current debt Total debt Add (deduct): Unamortized financing costs Unamortized mark-‐to-‐market adjustments Total debt at principal amount outstanding Total assets Debt-‐to-‐total assets Dream Industrial REIT 2015 First Quarter Report | 30 March 31, 2015 $ $ 770,766 140,080 910,846 5,274 (4,708) 911,412 1,739,976 52.4% $ $ December 31, 2014 778,059 143,234 921,293 5,315 (5,430) 921,178 1,742,710 52.9% Debt-‐to-‐adjusted EBITDA Management believes this non-‐GAAP measurement is an important measure in determining the time it takes the Trust, based on its operating performance, to repay its debt. Debt-‐to-‐adjusted EBITDA as shown below is determined as total debt at principal amount outstanding divided by annualized adjusted EBITDA for the quarter. Adjusted EBITDA is calculated as net income before taxes adjusted for: fair value adjustments to investment properties and financial instruments, gains (costs) on transactions and other activities, interest expense, depreciation and amortization and other items included in investment properties revenue. In compliance with Canadian Securities Administrators Staff Notice 52-‐306 (Revised), “Non-‐GAAP Financial Measures and Additional GAAP Measures”, the table below calculates the debt-‐to-‐adjusted EBITDA. Three months ended Three months ended Amounts per condensed consolidated financial statements Non-‐current debt Current debt Total debt Add (deduct): Unamortized financing costs Unamortized mark-‐to-‐market adjustments Total debt at principal amount outstanding Net income before taxes Add (deduct): Fair value adjustments to investment properties Fair value adjustments to financial instruments Gains (costs) on transactions and other activities Interest – debt Interest – subsidiary redeemable units Depreciation and amortization Other items included in investment properties revenues(1) Adjusted EBITDA – quarterly Adjusted EBITDA – annualized Debt-‐to-‐adjusted EBITDA (years) March 31, 2015 $ $ 770,766 140,080 910,846 5,274 (4,708) 911,412 4,266 (911) 9,982 2,116 8,795 3,246 10 (560) 26,944 107,776 8.5 December 31, 2014 $ $ 778,059 143,234 921,293 5,315 (5,430) 921,178 24,253 1,919 (11,580) 1,089 8,889 3,246 14 (701) 27,129 108,516 8.5 (1) Includes adjustments for lease termination fees, straight-‐line rent and amortization of tenant inducements. Interest coverage ratio Management believes this non-‐GAAP measurement is an important measure in determining our ability to cover interest expense based on our operating performance. Interest coverage ratio as shown below is calculated as net rental income plus interest and fee income, less general and administrative expenses, plus deferred unit compensation expense, all divided by interest expense on total debt excluding deferred financing and mark-‐to-‐market adjustments. In compliance with Canadian Securities Administrators Staff Notice 52-‐306 (Revised), “Non-‐GAAP Financial Measures and Additional GAAP Measures”, the table below calculates the interest coverage ratio. Amounts per condensed consolidated financial statements Net rental income Add (deduct): Interest and fee income General and administrative expenses Deferred unit compensation expense Interest expense incurred, at contractual rate Interest coverage ratio (times) $ $ Dream Industrial REIT 2015 First Quarter Report | 31 Three months ended March 31, 2015 29,703 3 (2,202) 338 27,842 9,168 3.0 $ $ 2014 27,215 8 (1,959) 291 25,555 8,672 2.9 Adjusted cash generated from (utilized in) operating activities In any given period, actual distributions declared may differ from cash generated from (utilized in) operating activities, primarily due to seasonal fluctuations in non-‐cash working capital and the impact of lease incentives and initial direct leasing costs, which fluctuate with lease maturities, renewal terms and the type of asset being leased. These seasonal or short-‐term fluctuations are funded, if necessary, with our revolving credit facility. The Trust determines distributions and the distribution rate by, among other considerations, its assessment of cash flow as determined using adjusted cash generated from (utilized in) operating activities (a non-‐GAAP measure), which excludes the fluctuations in non-‐cash working capital, transaction costs on business combinations and investment in lease incentives and initial direct leasing costs. As such, the Trust believes the cash distributions are not an economic return of capital, but a distribution of sustainable adjusted cash generated from (utilized in) operating activities. The Trust anticipates that actual distributions declared will, in the foreseeable future, continue to vary from net income as net income includes non-‐cash items such as fair value adjustments to investment properties and fair value adjustments to financial instruments. Accordingly, the Trust does not use net income as a proxy for distributions. As required by National Policy 41-‐201, “Income Trusts and Other Indirect Offerings”, the following table also outlines the differences between cash generated from (utilized in) operating activities and cash distributions, as well as the differences between net income and cash distributions, in accordance with the guidelines. As the Trust uses adjusted cash generated from (utilized in) operating activities (a non-‐GAAP measure) in determining its cash available for distribution, the following table also outlines the difference between adjusted cash generated from (utilized in) operating activities and distributions paid and payable. Net income Cash generated from (utilized in) operating activities Add (deduct): Investment in lease incentives and initial direct leasing costs Change in non-‐cash working capital Adjusted cash generated from (utilized in) operating activities (1) Distributions paid and payable Excess of adjusted cash generated from (utilized in) operating activities over distributions paid and payable Shortfall of net income over distributions paid and payable Excess of cash generated from (utilized in) operating activities over distributions paid and payable Three months ended March 31, $ $ 2015 4,159 $ 14,811 2014 4,111 15,631 1,831 334 16,976 13,447 3,529 1,457 (1,865) 15,223 12,508 2,715 (9,288) 1,364 $ (8,397) 3,123 (1) Includes distributions on LP B Units. For the three months ended March 31, 2015, adjusted cash generated from (utilized in) operating activities exceeded distributions paid and payable by $3.5 million ($2.7 million for the three months ended March 31, 2014). Excess of cash generated from (utilized in) operating activities over distributions paid and payable was $1.4 million for the three months ended March 31, 2015 compared to a $3.1 million excess for the three months ended March 31, 2014. Dream Industrial REIT 2015 First Quarter Report | 32 For the three months ended March 31, 2015, distributions paid and payable exceeded net income by $9.3 million compared to an $8.4 million shortfall of net income over distributions paid and payable for the three months ended March 31, 2014. Net income is net of distributions paid and payable on subsidiary redeemable units of $3.2 million for the three months ended March 31, 2015 ($2.8 million for the three months ended March 31, 2014), which amounts are also included in distributions paid and payable. For the three months ended March 31, 2015, actual distributions paid and payable exceeded net income (excluding distributions paid and payable on subsidiary redeemable units) by $6.0 million ($5.5 million for the three months ended March 31, 2014). These shortfalls were primarily driven by the $10.0 million fair value loss recorded for financial instruments for the period ($9.3 million for the three months ended March 31, 2014). As these non-‐cash items are excluded from cash generated from (utilized in) operating activities and adjusted cash generated from (utilized in) operating activities (non-‐GAAP term), they do not affect the Trust’s determination of distributions and the distribution rate. Based on current facts and assumptions, the Trust does not anticipate cash distributions will be reduced or suspended in the foreseeable future. Of the distributions paid and payable for the three months ended March 31, 2015, $1.1 million were reinvested into the DRIP. Over time, reinvestments pursuant to the DRIP will increase the number of Units outstanding, which may result in upward pressure on the total amount of cash distributions. Our Declaration of Trust provides our trustees with the discretion to determine the percentage payout of income that would be in the best interest of the Trust, which allows for any unforeseen expenditures and the variability in cash distributions as a result of additional Units issued pursuant to the Trust’s DRIP. Cash generated from (utilized in) operating activities to AFFO reconciliation AFFO is not defined by IFRS and, therefore, may not be comparable to similar measures presented by other real estate investment trusts. In compliance with Canadian Securities Administrators Staff Notice 52-‐306 (Revised), “Non-‐GAAP Financial Measures and Additional GAAP Measures”, the table below reconciles AFFO to cash generated from (utilized in) operating activities. Three months ended March 31, 2015 2014 Cash generated from (utilized in) operating activities Add (deduct): Initial direct leasing costs and lease incentives incurred Change in non-‐cash working capital Amortization of financing costs on debt Depreciation of property and equipment Debt settlement costs Investment in business transformation activities Internal leasing costs Acquisition costs Normalized initial direct leasing costs and lease incentives Normalized recurring capital expenditures AFFO Dream Industrial REIT 2015 First Quarter Report | 33 $ $ 14,811 $ 1,831 334 (281) (10) -‐ 145 1,008 -‐ (1,397) (838) 15,603 $ 15,631 1,457 (1,865) (239) (5) 59 100 841 35 (1,255) (753) 14,006 SECTION III – DISCLOSURE CONTROLS AND PROCEDURES At March 31, 2015, the Chief Executive Officer and the Chief Financial Officer (the “Certifying Officers”), together with other members of management, have designed disclosure controls and procedures to provide reasonable assurance that material information relating to Dream Industrial is made known to the Certifying Officers, and have designed internal controls over financial reporting to provide reasonable assurance regarding the reliability of financial reporting and the preparation of the condensed consolidated financial statements in accordance with IFRS. During the three months ended March 31, 2015, there have not been any changes that have materially affected, or are reasonably likely to materially affect, the internal control over financial reporting. Please refer to our 2014 Annual Report or our Annual Information Form for the year ended December 31, 2014, filed on SEDAR (www.sedar.com). SECTION IV – RISKS AND OUR STRATEGY TO MANAGE For a full list and explanations of our risks and uncertainties, please refer to our 2014 Annual Report or our Annual Information Form for the year ended December 31, 2014, filed on SEDAR (www.sedar.com). SECTION V – CRITICAL ACCOUNTING POLICIES CRITICAL ACCOUNTING JUDGMENTS, ESTIMATES AND ASSUMPTIONS IN APPLYING ACCOUNTING POLICIES Preparing the condensed consolidated financial statements requires management to make judgments, estimates and assumptions that affect the reported amounts of assets, liabilities, revenue and expenses, and the disclosures of contingent liabilities. Management bases its judgments and estimates on historical experience and other factors it believes to be reasonable under the circumstances, but that are inherently uncertain and unpredictable, the result of which is the basis of the carrying amounts of assets and liabilities. However, uncertainty about these assumptions and estimates could result in outcomes that could require a material adjustment in the future to the carrying amounts of the asset or liability affected. Dream Industrial’s critical accounting judgments, estimates and assumptions in applying accounting policies are described in Note 4 to the condensed consolidated financial statements and also in our annual consolidated financial statements for the year ended December 31, 2014. CHANGES IN ACCOUNTING ESTIMATES AND CHANGES IN ACCOUNTING POLICIES Future accounting policy changes Dream Industrial’s changes in accounting policies are described in Note 3 to the condensed consolidated financial statements. Additional information relating to Dream Industrial REIT, including the latest Annual Information Form of Dream Industrial REIT, is available on SEDAR at www.sedar.com. Dream Industrial REIT 2015 First Quarter Report | 34 SECTION VI – SUPPLEMENTARY INFORMATION The following tables within this section below include supplementary information to our portfolio as at March 31, 2015. PROPERTY LIST AND SELECTED DATA Property 7140 40th Street SE, Calgary Total GLA in square feet Year built/ renovated Clear ceiling height (warehouse component) in feet Total site area in acres No. of tenants Weighted average remaining lease term in years In-‐place and committed occupancy 351,306 1978/2007 30.0 13.8 1 7.6 100.0% 1919 84th Avenue (Park 19), Edmonton 48,365 1975/1987 21.0 3.7 1 4.2 100.0% 2721 Hopewell Place NE, Calgary 37,690 2006 22.0 1.9 1 7.5 100.0% 204 26229 Township Road 531A (Parkland County), Edmonton 34,904 2005 24.0 9.0 1 4.9 100.0% 6908 6th Street SE (Glenmore Business Park), Calgary 31,467 1978 18.0 3.2 1 4.5 100.0% 3917 81st Avenue, Edmonton 30,353 2006 28.0 5.5 1 6.1 100.0% 2876 Sunridge Way NE (Sunridge Business Park), Calgary 30,000 2000 16.0 2.3 1 5.7 100.0% 3250 Sunridge Way NE (Sunridge Business Park), Calgary 27,180 2000 24.0 2.1 1 5.3 100.0% 15301 100th Street, Grand Prairie 27,058 2005 24.0 13.2 1 4.9 100.0% 2240 Premier Way (GE Turbine), Edmonton 26,381 2003 30.0 1.5 1 3.3 100.0% 7121 6th Street SE (Glenmore Business Park), Calgary 19,274 1984 20.0 0.9 1 1.7 100.0% 6715 85th Avenue, Fort St. John 17,405 2006 28.0 29.7 1 6.5 100.0% 120 Pond Street East, Brooks 14,305 2006 24.0 5.2 1 6.5 100.0% Western Canada Single-‐tenant 695,688 26.5 92.0 13 6.4 100.0% 310 Henderson Drive, Regina 373,284 1976 24.0 24.0 2 8.5 100.0% 15303 128th Avenue, Edmonton 177,115 1977/2004 25.0 12.4 2 9.0 88.7% 611-‐615 71st Avenue SE & 7515 6th Street SE (Glenmore Business Park), Calgary 167,742 1979 20.0 6.5 19 3.9 100.0% 628-‐668 Henderson Drive (Chestemere), Regina 164,204 1975 19.0 9.1 23 2.8 91.1% 7504 30th Street SE, Calgary 138,729 1976 22.0 6.0 2 5.0 100.0% 11445 163rd Street (Alberta Park), Edmonton 130,142 1981 22.0 5.2 7 2.0 100.0% 9603-‐9699 45th Avenue NW, Edmonton 110,924 1975 22.0 6.0 20 1.7 100.0% 603 Park Street, Regina 109,478 1978 19.0 6.8 19 2.4 79.1% 3916 61st Avenue, Calgary 99,978 1976 26.0 5.1 2 1.6 100.0% 7004-‐7042 30th Street SE, Calgary 94,029 1976 18.0 5.3 7 2.1 100.0% 651 Henderson Drive (Henderson Business Centre), Regina 90,232 1982 19.0 5.0 19 2.1 100.0% 26229 Township Road 531, Parkland County 89,242 1968 24.7 6.5 14 2.8 100.0% 7008 5th Street SE (Glenmore Business Park), Calgary 85,961 1975 17.0 3.7 7 3.3 100.0% 11404 Winterburn Rd NW, Edmonton 81,387 2004 23.8 6.3 16 3.1 98.8% 7004 5th Street SE (Glenmore Business Park), Calgary 79,213 1975 20.0 3.4 12 2.7 100.0% 9451 45th Avenue (Southwood Centre), Edmonton 75,172 1998 28.0 4.5 2 3.4 100.0% 4710-‐4760 14th Street NE (McCall Industrial Park), Calgary 72,908 1976 18.0 4.0 19 3.7 91.7% 2777 23rd Avenue NE (Sunridge Business Park), Calgary 67,250 2001 24.0 3.8 3 3.8 100.0% 3510 29th Street NE (ACC Centre), Calgary 65,009 1998 24.0 3.0 7 4.6 100.0% 7111 6th Street SE (Glenmore Business Park), Calgary 64,939 1985 20.0 2.9 4 4.0 100.0% 3401 19th Street, Calgary 63,962 1976 22.0 4.1 6 2.6 100.0% 2150 29th Street NE (Sunridge Business Park), Calgary 59,865 1999 24.0 3.3 7 2.5 100.0% 7710 5th Street SE (Glenmore Business Park), Calgary 59,225 1980 20.0 2.3 23 2.5 100.0% 2175 29th Street NE (Sunridge Business Park), Calgary 58,184 2000 24.0 3.5 3 5.4 100.0% 2256 29th Street NE (Sunridge Business Park), Calgary 58,015 1998 24.0 3.5 5 4.0 100.0% 550 71st Avenue SE (Glenmore Business Park), Calgary 57,744 1982 12.0 2.6 10 3.4 96.5% 1139-‐1165 40th Avenue NE, Calgary 57,416 1974 20.0 2.9 6 4.8 100.0% 2928 Sunridge Way NE (Sunridge Business Park), Calgary 57,243 2003 24.0 4.1 5 3.8 100.0% 2151 32nd Street NE (Sunridge Business Park), Calgary 57,198 1999 24.0 3.4 6 2.9 100.0% 501-‐529 36th Avenue SE, Calgary 57,191 1974 18.0 2.9 6 4.7 100.0% 4504-‐4576 14th Street NE, Calgary 57,007 1976 16.0 4.1 30 3.5 100.0% 4403-‐4435 97th Street North West, Edmonton 57,000 1975 24.0 3.2 6 1.4 100.0% 6812 6th Street SE (Glenmore Business Park), Calgary 56,970 1978 20.0 5.7 6 2.9 100.0% Dream Industrial REIT 2015 First Quarter Report | 35 Total GLA in square feet Year built/ renovated Clear ceiling height (warehouse component) in feet 2121 29th Street NE (Sunridge Business Park), Calgary 56,648 2000 24.0 3.8 3 3.3 100.0% 402 McDonald Street (Imperial Business Centre), Regina 55,788 1984 18.0 2.8 16 2.7 100.0% 2985 23rd Avenue NE (Sunridge Business Park), Calgary 54,065 2000 24.0 3.0 3 4.8 100.0% 4402-‐4434 10th Street NE, Calgary 54,006 1974 16.0 3.1 8 2.2 100.0% 7003 5th Street SE (Glenmore Business Park), Calgary 53,023 1975 20.0 2.7 11 4.4 70.9% 16134 -‐ 114th Avenue NW, Edmonton 48,353 2006 26.8 4.4 8 2.5 90.9% 2886 Sunridge Way NE (Sunridge Business Park), Calgary 44,433 2001 24.0 3.5 3 3.4 100.0% 610 70th Avenue SE (Glenmore Business Park), Calgary 44,254 1985 20.0 3.5 12 3.3 100.0% 1512-‐1514 8th Street, Edmonton 42,670 1980 20.0 10.2 2 4.3 100.0% 535-‐561 36th Avenue SE, Calgary 41,425 1974 16.0 1.9 3 5.2 100.0% 5824 Burbank Road SE, Calgary 39,860 1972 20.0 2.4 4 5.8 100.0% 310 Hoffer Drive (McDonald Business Centre), Regina 37,970 1985 18.0 2.8 8 1.4 85.6% 4001 19th Street, Calgary 37,105 1978 22.0 2.5 6 2.5 100.0% 6810 6th Street SE (Glenmore Business Park), Calgary 31,726 1978 19.0 3.2 3 5.2 100.0% 6804-‐6818 30th Street SE, Calgary 29,998 1976 16.0 1.2 3 1.2 69.9% 7131 6th Street SE (Glenmore Business Park), Calgary 29,002 1982 20.0 1.3 2 1.7 100.0% 6023-‐6039 Centre Street South, Calgary 28,792 1973 15.0 1.5 5 3.9 100.0% 16104 -‐ 114th Avenue NW, Edmonton 28,759 1972 20.0 4.4 7 2.5 85.4% 4502-‐4516 10th Street NE, Calgary 28,641 1974 16.0 1.4 6 2.5 100.0% 3030 Sunridge Way NE (Sunridge Business Park), Calgary 27,001 2000 24.0 2.1 5 3.2 100.0% 6043-‐6055 Centre Street South, Calgary 25,234 1973 15.0 1.3 6 4.0 100.0% 530-‐544 38A Avenue SE, Calgary 23,987 1974 16.0 1.2 7 3.4 100.0% 7007 5th Street SE (Glenmore Business Park), Calgary 23,371 1974 19.0 1.2 3 4.1 100.0% 616 71st Avenue SE (Glenmore Business Park), Calgary 21,894 1985 21.0 1.0 3 1.9 100.0% 1135-‐1149 45th Avenue NE, Calgary 21,552 1974 16.0 1.3 5 2.2 100.0% 6910 6th Street SE (Glenmore Business Park), Calgary 21,268 1978 16.0 2.1 4 3.5 100.0% 4620-‐4640 11th Street NE, Calgary 21,124 1971 16.0 1.4 10 1.8 100.0% 102-‐114 61st Avenue SW, Calgary 18,890 1973 14.0 1.1 4 3.8 100.0% 4001-‐4019 23rd Street NE, Calgary 15,777 1976 16.0 1.1 6 2.8 100.0% 2915-‐2925 58th Avenue SE, Calgary 15,558 1976 16.0 1.0 6 2.3 100.0% 3503-‐3521 62nd Avenue SE, Calgary 13,371 1975 13.0 1.2 8 2.7 100.0% Western Canada Multi-‐tenant 4,129,503 21.1 250.7 505 3.9 97.5% Western Canada 4,825,191 21.9 342.7 518 4.3 97.8% 275 Wellington Street East, Aurora 317,000 1986 27.0 16.3 1 7.0 100.0% 45 Progress Avenue, Toronto 209,754 1965/2000 24.0 10.3 1 5.8 100.0% 290 Humberline Drive, Etobicoke 180,329 1981/2010 20.0 6.9 1 7.8 100.0% 750 Creditstone Road, Vaughan 176,535 1999 24.0 9.0 1 2.8 100.0% 121 Pippin Road, Vaughan 169,500 1999 24.0 8.6 1 2.8 100.0% 700 Ormont Drive, Toronto 123,370 1974 21.0 4.7 1 4.5 100.0% 580 Industrial Road, London 113,595 1972/2002 24.0 12.7 1 1.8 100.0% 441 Chrislea Road, Vaughan 100,626 1998 22.0 4.1 1 3.5 100.0% 2130 South Service Road West, Oakville 98,175 1986/2005 24.0 4.4 1 0.7 100.0% 970 Fraser Drive, Burlington 95,444 1999 28.0 6.9 1 12.8 100.0% 274 Humberline Drive, Etobicoke 80,540 1981 20.0 3.9 1 5.1 100.0% 2226 South Service Road West, Oakville 79,174 1980 22.0 3.5 1 5.8 100.0% 439 Sovereign, London 77,877 1988 22.0 5.6 1 3.6 100.0% 9305 Twin Oaks Drive, Windsor 74,239 1996 28.0 5.2 1 5.4 100.0% 2 Lone Oak Court, Toronto 72,197 2001 24.0 4.4 1 7.3 100.0% 6885-‐6895 Menway Court, Mississauga 66,383 1988 20.0 3.4 1 0.9 100.0% 41 Metropolitan Road, Toronto 59,400 1975/1997 17.0 4.4 1 1.0 100.0% 896 Meyerside Drive, Mississauga 46,774 1986 20.0 2.4 1 1.2 100.0% 880 Rangeview Road, Mississauga 45,600 1977/2005 24.0 3.2 1 0.5 100.0% Property Dream Industrial REIT 2015 First Quarter Report | 36 Total site area in acres No. of tenants Weighted average remaining lease term in years In-‐place and committed occupancy Total GLA in square feet Year built/ renovated Clear ceiling height (warehouse component) in feet 135 Pinebush Road, Cambridge 44,470 2001 60.0 5.6 1 5.3 100.0% 5905 Kennedy Road, Mississauga 38,158 1988 22.0 2.1 1 0.4 100.0% 6045 Kestrel Road, Mississauga 34,879 1986 20.0 1.8 1 1.1 100.0% 2946 Walker Road, Windsor 32,264 1960 22.0 4.0 1 1.8 100.0% 781 Westgate Road, Oakville 29,850 1985 22.0 4.2 1 5.4 100.0% 6520 Gottardo Court, Mississauga 25,932 1987 18.0 1.2 1 6.8 100.0% 750 Barmac Drive, Toronto 23,959 1979 18.0 1.5 1 3.9 100.0% 7420 Pacific Circle, Mississauga 23,777 1987 18.0 1.2 1 4.3 100.0% 1300 Fewster Road, Mississauga 23,500 1969 14.0 1.2 1 1.3 100.0% 5805 Kennedy Road, Mississauga 21,780 1986 18.0 1.0 1 2.3 100.0% 5380 Timberlea Boulevard, Mississauga 19,988 1986 18.0 1.0 1 4.8 100.0% 5462 Timberlea Boulevard, Mississauga 17,708 1977 18.0 1.0 1 5.2 100.0% 5370 Timberlea Boulevard, Mississauga 16,682 1986 18.0 0.8 1 3.3 100.0% 5750 Coopers Avenue, Mississauga 16,366 1987 18.0 0.9 0 5444 Timberlea Boulevard, Mississauga 15,316 1977 18.0 0.9 1 2.8 100.0% 99.4% Property Ontario Single-‐tenant Total site area in acres No. of tenants Weighted average remaining lease term in years In-‐place and committed occupancy -‐ 0.0% 2,571,141 23.5 148.3 33 4.6 6581-‐6601 Kitimat Road, Mississauga 318,363 1986 25.0 16.9 14 3.0 94.8% 2360 Cornwall Road, Oakville 199,736 2004 28.0 10.3 3 5.5 100.0% 45 A & B West Wilmot Street, Richmond Hill 189,128 1986 19.0 8.0 38 2.9 76.1% 255 Wicksteed Avenue, Toronto 177,562 1955 24.0 8.0 4 3.8 94.7% 2140-‐2150 Winston Park Drive, Mississauga 172,331 1987 19.0 7.5 45 2.8 97.6% 5900 Finch Avenue East, Scarborough 166,237 1993 24.0 7.6 4 1.4 100.0% 90 Nolan Court, Markham 124,930 1982 18.0 7.0 26 3.1 96.3% 55 Horner Avenue, Etobicoke 93,300 1988 22.0 6.2 4 2.6 100.0% 4515/4525 Rhodes Drive, Windsor 91,057 1999 22.0 9.0 3 3.4 76.5% 3 & 5 Blair Drive, Brampton 82,232 2001 28.0 6.4 2 2.4 100.0% 1111 Tristar Drive, Mississauga 77,726 1986 22.0 3.7 3 1.8 87.4% 903-‐951 Matheson Boulevard, Mississauga 77,420 1977 18.0 3.8 7 2.4 100.0% 1100 Courtney Park Drive, Mississauga 72,393 1981 22.0 3.4 4 1.7 100.0% 100 Lingard Road, Cambridge 70,154 2003 46.0 5.4 2 3.9 100.0% 5825-‐5895 Kennedy Road, Mississauga 67,836 1988 15.0 3.4 7 5.3 88.4% 6400 Shawson Drive, Mississauga 61,817 1981 22.0 2.9 3 1.9 100.0% 5554 Tomken Road, Mississauga 61,623 1979 18.0 3.2 9 2.6 100.0% 6300 Viscount Road, Mississauga 60,179 1966 16.0 4.3 3 3.4 99.7% 845 Harrington Court, Burlington 55,932 1982 15.0 4.0 9 3.3 98.5% 5716-‐5730 Coopers Avenue, Mississauga 53,668 1987 14.0 3.4 20 2.1 90.7% 855 Matheson Boulevard, Mississauga 46,608 1986 18.0 2.0 12 2.4 94.1% 5448 Timberlea Boulevard, Mississauga 32,025 1977 16.0 1.8 2 4.6 100.0% 5430 Timberlea Boulevard, Mississauga 31,448 1977 17.0 1.8 2 2.0 100.0% 5466 Timberlea Boulevard, Mississauga 28,657 1977 18.0 1.6 2 6.8 100.0% 135 East Beaver Creek, Richmond Hill 28,506 1986 17.0 1.8 2 1.9 100.0% 5420 Timberlea Boulevard, Mississauga 19,816 1977 18.0 1.1 2 4.1 100.0% Ontario Multi-‐tenant 2,460,684 22.1 134.5 232 3.1 94.8% Ontario 5,031,825 22.8 282.8 265 3.9 97.1% 1411, 1421 and 1451 Rue Ampère, Boucherville 457,875 1998/2002 27.0 21.6 1 10.2 100.0% 10001 Metropolitan Boulevard East, Montréal 327,000 2004 40.7 28.5 1 9.2 100.0% 1900 Dickson Street (Molson Distribution Centre), Montréal 225,000 2003 26.0 17.1 1 7.8 100.0% 2350 de la Province, Longueuil 222,485 1967 20.0 11.5 1 0.8 100.0% 1125 50th Avenue, Montréal 210,710 2000 26.0 13.3 1 4.5 100.0% 8000 Avenue Blaise-‐Pascal, Montréal 206,345 1993 23.0 13.8 1 7.0 100.0% 1313 Autoroute Chomedey, Laval 184,493 1999 26.0 8.1 1 10.2 100.0% 650 rue Bergeron, Drummondville 181,000 2007 28.0 10.5 1 2.7 100.0% Dream Industrial REIT 2015 First Quarter Report | 37 Total GLA in square feet Year built/ renovated Clear ceiling height (warehouse component) in feet 1155 Autoroute Chomedey, Laval 115,362 1990/2002 22.0 4.1 0 -‐ 0.0% 2340 St. Laurent Blvd., Ottawa 114,724 1989 24.0 6.2 1 10.1 100.0% 101 Autoroute 440, Laval 68,444 1977 22.0 4.6 1 3.2 100.0% 1805 50e Avenue, Lachine 60,750 1986 19.0 2.3 1 6.2 100.0% 585-‐625 Avenue Meloche, Dorval 54,410 1981 18.0 2.7 0 1421 rue Nobel, Sainte-‐Julie 50,878 1998 22.0 4.3 1 6.6 100.0% 3800 Trans Canada Highway, Pointe-‐Claire 50,000 1966 18.0 3.4 1 0.7 100.0% 3700-‐3720 Autoroute des Laurentides, Laval 49,500 2002 24.0 3.6 1 7.3 100.0% 1870 boulevard Saint-‐Régis, Dollard-‐des-‐Ormeaux 40,231 1984 22.0 1.8 1 6.2 100.0% 29 rue de Varennes, Gatineau 23,959 2006 20.0 3.4 1 5.8 100.0% 361 boul. Montpellier, St. Laurent 19,220 1987 18.0 1.2 1 8.8 100.0% 2,662,386 26.3 162.0 17 7.0 93.6% 2995 boul. le Corbusier, Laval 131,680 1975 29.0 4.7 3 6.6 94.0% 5000 rue Fairway & 1645 50e Avenue, Lachine 106,517 1978 18.0 5.5 4 1.3 68.9% 1700-‐1764 50e Avenue, Lachine 94,569 1989 24.0 4.2 2 2.4 100.0% 1100-‐1154 rue Berlier, Laval 91,843 1975 18.0 4.5 10 3.2 93.2% 9090-‐9100 Blvd. Cavendish, St. Laurent 89,322 1987 18.0 7.5 6 3.8 100.0% 333 Chemin du Tremblay, Boucherville 86,842 1987 18.0 3.8 4 6.7 70.1% 1876-‐1936 32e Avenue, Lachine 84,659 1987 18.0 4.7 5 2.7 100.0% 1500 rue Nobel, Boucherville 82,081 1989 18.0 4.1 4 1.7 46.7% 2000 32e Avenue, Lachine 81,288 1985 18.0 4.8 3 1.3 100.0% 1624-‐1692 50e Avenue, Lachine 79,094 1975 19.0 4.3 7 2.4 81.6% 1151-‐1179 Autoroute 440, Laval 78,938 1975 19.0 3.9 14 4.5 82.6% 10001-‐10091 Renaude-‐Lapointe, Montréal 77,846 1987 18.0 3.7 4 7.1 100.0% 2101 rue Nobel, Sainte-‐Julie 73,411 1992 20.0 4.8 4 3.9 100.0% 1950 32e Avenue, Lachine 71,923 1988 18.0 4.5 8 2.3 93.3% 1825-‐1865 32e Avenue, Lachine 71,616 1986 18.0 4.9 7 3.3 69.7% 4300-‐4400 boul. Bois-‐Franc, St. Laurent 68,575 1987 18.0 3.9 2 5.2 88.4% 4605-‐4645 rue Fairway & 1405-‐1465 46e Avenue, Lachine 60,728 1974 19.0 4.0 7 6.5 100.0% 1010 rue Berlier & 2854 -‐ 2870 Boulevard Industriel, Laval 58,622 1975 19.0 3.1 5 1.8 68.8% 1025-‐1087 Autoroute 440, Laval 56,622 1979 18.0 2.8 12 2.5 100.0% 135 Chemin du Tremblay, Boucherville 49,808 1989 16.0 2.4 9 2.0 100.0% 38 rue de Valcourt, Gatineau 16,297 1985 12.0 1.2 8 0.5 100.0% 1,612,281 19.4 87.3 128 3.7 87.7% 4,274,667 23.7 249.3 145 5.8 91.4% 131 Thornhill Drive (Burnside Business Park), Dartmouth 115,773 1986 18.0 4.7 1 0.7 100.0% 58 Wright Avenue (Burnside Business Park), Dartmouth 43,000 1972 24.0 2.4 1 6.3 100.0% 722 Edinburgh Drive, Moncton 41,200 1975/1990 20.0 8.6 1 1.0 100.0% 50 Garland Avenue (Burnside Business Park), Dartmouth 35,574 2006 10.0 2.5 1 1.4 100.0% 80 Thornhill Drive (Burnside Business Park), Dartmouth 10,090 1984 20.0 1.1 1 4.6 100.0% Eastern Canada Single-‐tenant 245,637 18.3 19.3 5 2.0 100.0% 202 Brownlow Avenue (Burnside Business Park), Dartmouth 212,289 1986 18.0 13.8 56 4.5 94.2% 320-‐340 Wright Avenue (Burnside Business Park), Dartmouth 170,129 2007 24.0 10.6 11 3.3 96.1% 201 Brownlow Avenue (Burnside Business Park), Dartmouth 160,180 1988 16.0 10.7 34 4.1 98.1% 7 Mellor Avenue, Dartmouth 122,490 2007 24.0 7.2 11 5.8 96.4% 10 Morris Drive (Burnside Business Park), Dartmouth 118,785 1979 18.0 7.5 22 2.0 96.2% 71 Thornhill Drive, Dartmouth 100,680 1980 28.0 5.2 2 4.5 89.7% 131-‐135 Ilsley Avenue (Burnside Business Park), Dartmouth 97,879 1984 18.0 6.6 18 2.2 100.0% 121 Ilsley Avenue, Dartmouth 97,018 1983 19.0 8.0 17 2.7 73.7% 75 Akerley Boulevard, Dartmouth 96,228 1982 19.0 7.8 19 2.9 95.6% 222 Edinburgh Drive, Moncton 93,613 1977/1999 22.0 7.7 6 2.0 64.1% 11 Morris Drive (Burnside Business Park), Dartmouth 89,832 1977 18.0 5.0 19 2.8 92.7% Property Québec Single-‐tenant Québec Multi-‐tenant Québec Dream Industrial REIT 2015 First Quarter Report | 38 Total site area in acres No. of tenants Weighted average remaining lease term in years -‐ In-‐place and committed occupancy 0.0% Total GLA in square feet Year built/ renovated Clear ceiling height (warehouse component) in feet 120 Troop Avenue (Burnside Business Park), Dartmouth 87,049 2004 24.0 5.7 6 1.6 100.0% 100 Wright Avenue (Burnside Business Park), Dartmouth 76,127 1979 18.0 4.4 12 2.5 83.4% 100 Ilsley Avenue (Burnside Business Park), Dartmouth 76,052 1984 14.0 6.1 16 3.8 94.5% 55 Akerley Boulevard, Dartmouth 75,306 1975 19.0 5.8 6 2.3 79.8% 51 Raddall Avenue (Burnside Business Park), Dartmouth 70,016 1986 18.0 4.7 11 2.0 100.0% 170 Joseph Zatzman Drive (Burnside Business Park), Dartmouth 65,671 1981 16.0 4.0 10 1.6 88.9% 50 Akerley Boulevard (Burnside Business Park), Dartmouth 62,718 1983 18.0 1.6 12 3.9 93.4% 10 Vidito Drive, Dartmouth 61,988 1980 22.0 2.7 2 4.1 100.0% 101 Thornhill Drive (Burnside Business Park), Dartmouth 61,381 1982 18.0 3.8 8 2.3 93.3% 105 Akerley Boulevard (Burnside Business Park), Dartmouth 57,850 1983 18.0 3.3 7 2.6 100.0% 30-‐58 Mosher Drive (Burnside Business Park), Dartmouth 56,937 1972 18.0 2.6 4 2.2 100.0% 29-‐59 Mosher Drive (Burnside Business Park), Dartmouth 54,367 1974 18.0 3.6 4 5.5 100.0% 50 Troop Avenue (Burnside Business Park), Dartmouth 53,859 2001 24.0 3.6 3 1.4 100.0% 32 Troop Avenue (Burnside Business Park), Dartmouth 47,790 2000 24.0 3.3 4 4.2 100.0% 109 Ilsley Avenue (Burnside Business Park), Dartmouth 44,873 1987 16.0 3.1 14 2.7 92.7% 81 Wright Avenue (Burnside Business Park), Dartmouth 44,366 1986 20.0 3.6 4 3.5 84.7% 95 Akerley Boulevard, Dartmouth 38,027 1980 14.0 2.1 13 2.9 92.4% 30 Simmonds Drive (Burnside Business Park), Dartmouth 37,484 1982 16.0 2.8 10 1.8 77.0% 40 Thornhill Drive (Burnside Business Park), Dartmouth 32,186 1982 16.0 3.8 9 2.4 90.0% 50 Thornhill Drive (Burnside Business Park), Dartmouth 32,065 1983 16.0 3.8 10 1.4 100.0% 60 Thornhill Drive (Burnside Business Park), Dartmouth 32,002 1986 16.0 2.0 7 4.2 100.0% 10 Thornhill Drive, Dartmouth 28,616 1983 15.0 3.4 9 2.5 91.6% 16 Garland Avenue (Burnside Business Park), Dartmouth 10,888 2008 14.0 1.5 4 4.8 100.0% Eastern Canada Multi-‐tenant 2,566,741 19.4 171.4 400 3.2 92.8% Eastern Canada 2,812,378 19.3 190.7 405 3.1 93.4% 16,944,061 22.2 1,065.5 1,333 4.3 95.3% Property Total Dream Industrial REIT 2015 First Quarter Report | 39 Total site area in acres No. of tenants Weighted average remaining lease term in years In-‐place and committed occupancy (1) LARGEST TENANTS BY GLA Tenant Spectra/Premium Industries TC Transcontinental Total area in square feet 642,368 Properties City Province 1411, 1421 and 1451 rue Ampère Boucherville Québec Laval Québec Aurora Ontario Montréal Québec 1313 Autoroute Chomedey 523,345 275 Wellington Street East 8000 Avenue Blaise-‐Pascal Gienow Windows & Doors Inc. 351,306 7140 40th Street SE Calgary Alberta Royal Group Inc. 346,035 750 Creditstone Road Vaughan Ontario Vaughan Ontario 121 Pippin Road The Brick Warehouse LP 327,000 10001 Metropolitan Boulevard East Montréal Québec United Agri Products Canada Inc. 275,335 310 Henderson Drive Regina Saskatchewan Molson Breweries Properties 225,000 1900 Dickson Street (Molson Distribution Centre) Montréal Québec Hasbro Canada Corporation 222,485 2350 de la Province Longueuil Québec Nellson Nutraceutical Canada 210,710 1125 50th Avenue Montréal Québec Array Canada Inc. 209,754 45 Progress Avenue Toronto Ontario McKesson Canada Corporation 181,000 650 rue Bergeron Drummondville Québec Alumicor Limited 180,329 290 Humberline Drive Etobicoke Ontario RockTenn-‐Container Canada/RockTenn-‐Preprint Canada 134,863 7420 Pacific Circle Mississauga Ontario 6581-‐6601 Kitimat Road Mississauga Ontario 700 Ormont Drive North York Ontario Multy Home LP 123,370 DIRTT Environmental Solutions 122,419 7504 30th Street SE Calgary Alberta Helly Hansen Canada Limited 115,773 131 Thornhill Drive (Burnside Business Park) Dartmouth Nova Scotia The Dollco Corporation 114,724 2340 St. Laurent Blvd. Ottawa Ontario Colabor Limited Partnership 113,595 580 Industrial Road London Ontario Clean Harbors Industrial 113,506 15301 100th Street Grand Prairie Alberta 204 26229 Township Road 531A (Parkland County) Edmonton Alberta 6715 85th Avenue Fort St. John British Columbia 120 Pond Street East Brooks Alberta 26229 Township Road 531 Parkland County Alberta 2360 Cornwall Road Oakville Ontario Legendary Logistics Inc. 104,260 Fath PV Tech Inc. 104,248 5900 Finch Avenue East Scarborough Ontario Aquarium Services Warehouse 100,626 441 Chrislea Road Vaughan Ontario Total 4,842,051 (1) Represents all tenants with GLA greater than 100,000 square feet. Dream Industrial REIT 2015 First Quarter Report | 40 Condensed consolidated balance sheets (unaudited) March 31, Note 2015 5 6 8 15 9 10 11 12 9 13 14 $ $ $ $ 1,684,542 $ 43,615 1,728,157 4,590 5,290 1,939 11,819 -‐ 1,739,976 $ 770,766 $ 167,152 2,247 13,258 953,423 140,080 23,659 163,739 1,117,162 577,858 46,732 (1,776) 622,814 1,739,976 $ (in thousands of Canadian dollars) Assets NON-‐CURRENT ASSETS Investment properties Other non-‐current assets CURRENT ASSETS Amounts receivable Prepaid expenses and other assets Cash and cash equivalents Assets held for sale Total assets Liabilities NON-‐CURRENT LIABILITIES Debt Subsidiary redeemable units Deferred Unit Incentive Plan Other non-‐current liabilities CURRENT LIABILITIES Debt Amounts payable and accrued liabilities Total liabilities Equity Unitholders’ equity Retained earnings Accumulated other comprehensive loss Total equity Total liabilities and equity See accompanying notes to the condensed consolidated financial statements. On behalf of the Board of Trustees of Dream Industrial Real Estate Investment Trust: Vincenza Sera Sheldon Wiseman Trustee Trustee Dream Industrial REIT 2015 First Quarter Report | 41 December 31, 2014 1,681,781 41,912 1,723,693 3,624 4,476 78 8,178 10,839 1,742,710 778,059 156,206 2,160 11,545 947,970 143,234 22,855 166,089 1,114,059 576,399 52,774 (522) 628,651 1,742,710 Condensed consolidated statements of net income and comprehensive income (unaudited) (in thousands of Canadian dollars) Investment properties revenue Investment properties operating expenses Net rental income Other revenue Interest and fee income Other expenses General and administrative Interest: Interest expense on debt Subsidiary redeemable units Depreciation and amortization Income before fair value adjustments, income taxes and other items Fair value adjustments and other items Fair value adjustments to investment properties Fair value adjustments to financial instruments Gains (costs) on transactions and other activities Income before income taxes Deferred income taxes Net income for the period Other comprehensive (loss) gain Unrealized (loss) gain on effective interest rate hedge Comprehensive income for the period See accompanying notes to the condensed consolidated financial statements. Dream Industrial REIT 2015 First Quarter Report | 42 Note 16 16 5 17 18 7 9 $ $ $ $ Three months ended March 31, 2015 43,940 (14,237) 29,703 3 3 (2,202) (8,795) (3,246) (10) (14,253) 15,453 911 (9,982) (2,116) (11,187) 4,266 (107) 4,159 (1,254) (1,254) 2,905 $ $ $ $ 2014 40,914 (13,699) 27,215 8 8 (1,959) (8,119) (2,849) (5) (12,932) 14,291 501 (9,336) (1,035) (9,870) 4,421 (310) 4,111 163 163 4,274 Condensed consolidated statements of changes in equity (unaudited) (in thousands of Canadian dollars, except number of units) Attributable to unitholders of the Trust Number Note Balance at January 1, 2015 Net income for the period Distributions paid and payable Distribution Reinvestment Plan REIT Units issued for vested deferred trust units Unit Purchase Plan Issue costs Other comprehensive loss 11 Balance at March 31, 2015 of Units Unitholders’ equity 58,035,125 $ -‐ -‐ 109,846 50,854 1,150 -‐ -‐ 58,196,975 $ 576,399 -‐ -‐ 978 $ Accumulated other Retained comprehensive earnings $ 476 10 (5) -‐ 577,858 52,774 4,159 (10,201) -‐ -‐ -‐ -‐ -‐ 46,732 $ $ loss (522) -‐ -‐ -‐ -‐ -‐ -‐ (1,254) (1,776) $ $ Total 628,651 4,159 (10,201) 978 476 10 (5) (1,254) 622,814 Attributable to unitholders of the Trust Accumulated other (in thousands of Canadian dollars, Number except number of units) Balance at January 1, 2014 Net income for the period Distributions paid and payable Distribution Reinvestment Plan REIT Units issued for vested deferred trust units Unit Purchase Plan Issue costs Other comprehensive income Balance at March 31, 2014 of Units 54,921,726 -‐ -‐ 122,510 18,143 704 -‐ -‐ 55,063,083 Unitholders’ equity Retained comprehensive earnings gain Total $ 546,680 -‐ -‐ 1,109 $ 24,136 4,111 (9,659) -‐ $ -‐ -‐ -‐ -‐ $ 570,816 4,111 (9,659) 1,109 $ 161 6 (6) -‐ 547,950 $ -‐ -‐ -‐ 18,588 $ -‐ -‐ -‐ 163 163 $ 161 6 (6) 163 566,701 See accompanying notes to the condensed consolidated financial statements. Dream Industrial REIT 2015 First Quarter Report | 43 Condensed consolidated statements of cash flows (unaudited) (in thousands of Canadian dollars) Generated from (utilized in) operating activities Net income Non-‐cash items: Depreciation and amortization, net Other adjustments Investment in lease incentives and initial direct leasing costs Interest on subsidiary redeemable units Change in non-‐cash working capital Generated from (utilized in) investing activities Additions to property and equipment Investment in investment properties Net proceeds from disposal of investment properties Deposit on acquisition of investment properties Transaction costs paid Generated from (utilized in) financing activities Mortgage financings, net of financing costs Draw on revolving credit facility, net of financing costs Mortgage principal repayments Mortgage lump sum repayments Repayment of debt and other facilities Distributions paid on Units Interest on subsidiary redeemable units Cash proceeds on issue of Units Issue costs paid Change in cash and cash equivalents Cash and cash equivalents, beginning of period Cash and cash equivalents, end of period See accompanying notes to the condensed consolidated financial statements. Note Dream Industrial REIT 2015 First Quarter Report | 44 21 21 5 16 21 5 15 9 9 9 16 Three months ended March 31, 2015 2014 $ $ $ (268) 9,839 (1,831) 3,246 (334) 14,811 (9) (114) 10,784 (150) (1,001) 9,510 32,760 6,700 (5,888) (17,650) (25,928) (9,213) (3,246) 10 (5) (22,460) 1,861 78 1,939 $ 4,159 4,111 (508) 8,771 (1,457) 2,849 1,865 15,631 (4) (543) -‐ -‐ (169) (716) 55,375 208 (5,297) (41,888) (12,114) (8,542) (2,849) 6 (6) (15,107) (192) 258 66 Notes to the condensed consolidated financial statements (All dollar amounts in thousands of Canadian dollars, except as otherwise noted and for unit or per unit amounts) Note 1 ORGANIZATION Dream Industrial Real Estate Investment Trust (“Dream Industrial REIT”, “Dream Industrial” or the “Trust”) is an open-‐ended investment trust created pursuant to a Declaration of Trust, as amended and restated, under the laws of the Province of Ontario. The condensed consolidated financial statements of Dream Industrial include the accounts of Dream Industrial and its consolidated subsidiaries. Dream Industrial’s portfolio comprises industrial properties located in urban centres across Canada. A subsidiary of Dream Industrial performs the property management function. The Trust’s registered office is 30 Adelaide Street East, Suite 1600, Toronto, Ontario, Canada M5C 3H1. The Trust is listed on the Toronto Stock Exchange under the symbol “DIR.UN”. Dream Industrial’s condensed consolidated financial statements for the three months ended March 31, 2015 were authorized for issuance by the Board of Trustees on May 5, 2015, after which date they may only be amended with the Board of Trustees’ approval. Equity is described in Note 14; however, for simplicity, throughout the Notes, reference is made to the following: • • • “REIT Units”, meaning the REIT Units “Special Trust Units”, meaning units that are exchangeable for REIT Units, including the LP B Units “Units”, meaning REIT Units and Special Trust Units, collectively Subsidiary redeemable units classified as a liability are described in Note 10; however, for simplicity, throughout the Notes, reference is made to “subsidiary redeemable units”, meaning the LP B Units of Dream Industrial LP (“DILP”), formerly known as Dundee Industrial Limited Partnership. At March 31, 2015, Dream Office Real Estate Investment Trust (“Dream Office REIT”), directly and indirectly through its subsidiaries, held 18,551,855 (December 31, 2014 – 18,551,855) subsidiary redeemable units, being all of the subsidiary redeemable units of the Trust. Note 2 SUMMARY OF SIGNIFICANT ACCOUNTING POLICIES Basis of presentation These condensed consolidated financial statements have been prepared in accordance with International Accounting Standard (“IAS”) 34, “Interim Financial Reporting”, as issued by the International Accounting Standards Board (“IASB”). Accordingly, certain information and footnote disclosures normally included in annual consolidated financial statements prepared in accordance with International Financial Reporting Standards (“IFRS”), as issued by the IASB, have been omitted or condensed. The condensed consolidated financial statements have been prepared using the same significant accounting policies and methods as those used in the consolidated financial statements for the year ended December 31, 2014. These condensed consolidated financial statements should be read in conjunction with the Trust’s consolidated financial statements for the year ended December 31, 2014. Dream Industrial REIT 2015 First Quarter Report | 45 Note 3 ACCOUNTING POLICIES SELECTED AND APPLIED FOR SIGNIFICANT TRANSACTIONS AND EVENTS Future changes in accounting standards The following are the accounting policy changes to be implemented by the Trust in future years: Revenue recognition IFRS 15, “Revenue from Contracts with Customers” (“IFRS 15”), provides a comprehensive five-‐step revenue recognition model for all contracts with customers. The IFRS 15 revenue recognition model requires management to exercise significant judgment and make estimates that affect revenue recognition. IFRS 15 is effective for annual periods beginning on or after January 1, 2017, with earlier application permitted. The Trust is currently evaluating the impact of adopting this standard on the consolidated financial statements. Financial instruments The final version of IFRS 9, “Financial Instruments” (“IFRS 9”), was issued by the IASB in July 2014 and will replace IAS 39, “Financial Instruments: Recognition and Measurement” (“IAS 39”). IFRS 9 introduces a model for classification and measurement, a single, forward-‐looking “expected loss” impairment model and a substantially reformed approach to hedge accounting. The new single, principle-‐based approach for determining the classification of financial assets is driven by cash flow characteristics and the business model in which an asset is held. The new model also results in a single impairment model being applied to all financial instruments, which will require more timely recognition of expected credit losses. It also includes changes in respect of an entity’s own credit risk in measuring liabilities elected to be measured at fair value, so that gains caused by the deterioration of an entity’s own credit risk on such liabilities are no longer recognized in profit or loss. IFRS 9 is effective for annual periods beginning on or after January 1, 2018; however, it is available for early adoption. In addition, the own credit changes can be early adopted in isolation without otherwise changing the accounting for financial instruments. The Trust is currently evaluating the impact of adopting this standard on the consolidated financial statements. Presentation of financial statements IAS 1, “Presentation of Financial Statements” (“IAS 1”), was amended by the IASB to clarify guidance on materiality and aggregation, the presentation of subtotals, the structure of financial statements and disclosure of accounting policies. The amendment gives guidance that information within the consolidated balance sheets and statements of comprehensive income should not be aggregated or disaggregated in a manner that obscures useful information, and that disaggregation may be required in the statement of comprehensive income in the form of additional subtotals as they are relevant to understanding the entity’s financial position or performance. The amendments to IAS 1 are effective for periods beginning on or after January 1, 2016. The Trust is currently evaluating the impact of adopting this standard on the consolidated financial statements. Equity method in separate financial statements IAS 27, “Separate Financial Statements” (“IAS 27”), was amended by the IASB to restore the option to use the equity method to account for investments in subsidiaries, joint ventures and associates in an entity’s separate financial statements. An entity can now account for investments at cost, in accordance with IFRS 9 or using the equity method as described in IAS 28. The amendment to IAS 27 is effective for periods beginning on or after January 1, 2016. The Trust is currently evaluating the impact of adopting this standard on the consolidated financial statements. Acquisitions of interests in joint operations IFRS 11, “Joint Arrangements” (“IFRS 11”), has been amended to require the application of IFRS 3 to transactions where an investor obtains an interest in a joint operation that constitutes a business. The amendment to IFRS 11 is effective for periods beginning on or after January 1, 2016. The Trust is currently evaluating the impact of adopting this standard on the consolidated financial statements. Financial instruments – disclosures IFRS 7, “Financial Instruments: Disclosures” (“IFRS 7”), has been amended by the IASB to require additional disclosures on transition from IAS 39 to IFRS 9. The amendment to IFRS 7 is effective for periods beginning on or after January 1, 2018. The Trust is currently evaluating the impact of adopting this standard on the consolidated financial statements. Dream Industrial REIT 2015 First Quarter Report | 46 Note 4 CRITICAL ACCOUNTING JUDGMENTS, ESTIMATES AND ASSUMPTIONS IN APPLYING ACCOUNTING POLICIES Preparing the condensed consolidated financial statements requires management to make judgments, estimates and assumptions that affect the amounts reported. Management bases its judgments and estimates on historical experience and other factors it believes to be reasonable under the circumstances, but which are inherently uncertain and unpredictable, the result of which forms the basis of the carrying values of assets and liabilities. However, uncertainty about these assumptions and estimates could result in outcomes that could require a material adjustment to the carrying value of the affected asset or liability in the future. Management has applied the same methodologies in making critical accounting judgments, estimates and assumptions as disclosed in the Trust’s consolidated financial statements for the year ended December 31, 2014. Note 5 INVESTMENT PROPERTIES Three months ended Balance at beginning of period Additions: Investment property acquisitions Building improvements Lease incentives and initial direct leasing costs Total additions to investment properties Classified as assets held for sale Gains and losses included in net income: (1) Fair value adjustments to investment properties Amortization of lease incentives Total gains included in net income Balance at end of period March 31, 2015 $ $ 1,681,781 -‐ 114 1,831 1,945 -‐ 911 (95) 816 1,684,542 Year ended December 31, 2014 $ $ 1,540,791 133,563 7,650 8,689 149,902 (10,839) 2,137 (210) 1,927 1,681,781 (1) Equal to change in unrealized gain included in net income for the period ended March 31, 2015 and for the year ended December 31, 2014. The Trust’s investment properties exclude straight-‐line rent receivable of $6,936 (December 31, 2014 – $6,363), which is included in other non-‐current assets. The key valuation metrics for investment properties are set out below: Weighted Weighted Range (%) average (%) Range (%) average (%) 6.00–8.25 7.00–9.00 6.25–8.50 6.00–8.25 7.00–9.00 6.25–8.50 Cap rate Discount rate Terminal rate March 31, 2015 6.70 7.64 6.96 December 31, 2014 6.71 7.66 6.97 Investment properties with an aggregate fair value of $129,325 for the three months ended March 31, 2015 (for the year ended December 31, 2014 – $420,723) were valued by qualified external valuation professionals. If the cap rate were to increase by 25 basis points (“bps”), the value of investment properties would decrease by $36,193. If the cap rate were to decrease by 25 bps, the value of investment properties would increase by $92,082. As at March 31, 2015, investment properties with a fair value of $1,417,772 (December 31, 2014 – $1,392,914) are pledged as first-‐ranking and/or second-‐ranking collateral for mortgages. As at March 31, 2015, investment properties with a fair value of $121,561 (December 31, 2014 – $121,751) are pledged as security for the Trust’s revolving credit facility. Dream Industrial REIT 2015 First Quarter Report | 47 Note 6 OTHER NON-‐CURRENT ASSETS March 31, Note Deposits Property and equipment Straight-‐line rent receivable Goodwill Conversion feature on the convertible debentures Total December 31, 2015 15 9 $ $ 353 93 6,936 35,047 1,186 43,615 $ $ 2014 122 94 6,363 35,333 -‐ 41,912 Note 7 DEFERRED INCOME TAXES DIR Industrial Properties Inc., one of the Trust’s subsidiaries, is subject to corporate income taxes. The following table reconciles the Trust’s tax rate to the effective tax rate for the three months ended March 31, 2015 and March 31, 2014. Income before income taxes Income not subject to taxation Income in subsidiary corporation Tax calculated at the Canadian statutory tax rate of 29.9% (2014 – 27.6%) Increase (decrease) resulting from: Adjustment in expected future tax rates Other items Deferred income taxes Three months ended March 31, 2015 $ $ 4,266 (3,942) 324 97 10 -‐ 107 $ $ 2014 4,421 (3,071) 1,350 373 -‐ (63) 310 Note 8 AMOUNTS RECEIVABLE March 31, Trade receivables Less: Provision for impairment of trade receivables Trade receivables, net Other amounts receivable Amounts receivable December 31, 2015 2014 $ 3,365 (520) 2,845 1,745 4,590 $ $ 2,440 (358) 2,082 1,542 3,624 $ The movement in the provision for impairment of trade receivables during the three months ended March 31 is as follows: Three months ended March 31, As at January 1 Provision for impairment of trade receivables As at March 31 2015 2014 $ $ 358 162 520 $ $ 284 108 392 The carrying value of amounts receivable approximates fair value due to their current nature. As at March 31, 2015, trade receivables of approximately $733 (December 31, 2014 – $872) were past due but not considered impaired as the Trust has ongoing relationships with these tenants and the aging of these trade receivables is not indicative of expected default. Dream Industrial REIT 2015 First Quarter Report | 48 The Trust leases industrial properties to tenants under operating leases. Minimum rental commitments on non-‐cancellable tenant operating leases over their remaining term are as follows: 2015 (remainder of year) 2016 to 2019 2020 to 2031 March 31, 2015 $ $ 83,057 303,943 131,043 518,043 Note 9 DEBT March 31, (1) Mortgages (1) Revolving credit facility Convertible debentures Total Less: Current portion Non-‐current debt December 31, 2015 $ $ 763,737 21,434 125,675 910,846 (140,080) 770,766 $ $ 2014 755,194 40,609 125,490 921,293 (143,234) 778,059 (1) Secured by charges on specific investment properties (refer to Note 5). Mortgage financing activities The Trust completed the following financings for the three months ended March 31: New mortgage Three months ended March 31, 2015 Amount $ 33,000 Term to Face interest maturity (years) 7.0 rate (%) 2.63 New mortgage Three months ended March 31, 2014 Amount $ 56,000 Term to Face interest maturity (years) 5.0 rate (%) 3.31 Convertible debentures March 31, 2015 2014 105,356 20,319 125,675 $ $ 105,093 20,397 125,490 5.25% Debentures 6.75% Debentures Total 5.25% Debentures 5.25% Debentures 6.75% Debentures $ $ Original principal Interest March 31, Date issued Maturity date issued rate 2015 December 13, 2012 December 19, 2012 May 15, 2013 December 31, 2019 December 31, 2019 November 30, 2017 $ $ 86,250 25,000 20,125 131,375 Dream Industrial REIT 2015 First Quarter Report | 49 Carrying value 5.25% 5.25% 6.75% December 31, Outstanding principal amount $ $ 86,250 25,000 19,420 130,670 $ $ December 31, 2014 86,250 25,000 19,420 130,670 Revolving credit facility The following table summarizes details of the Trust’s revolving credit facility as at March 31, 2015: Letter of credit (4) Revolving credit facility $ Principal and forwards amount Available (1) (2) (3) agreement outstanding to be drawn Interest rate Borrowing capacity 75,000 $ 2,500 $ 21,700 $ 50,800 Maturity date 3.01% June 30, 2016 (1) Excludes financing costs. (2) Formula-‐based amount available to be drawn as at March 31, 2015. (3) Bankers’ acceptance (“BA”) rate plus 1.75% or the bank’s prime rate plus 0.75%. (4) Nineteen properties are secured as first-‐ranking mortgages on the facility. The following table summarizes the weighted average effective interest rates and maturity for the debts as at March 31, 2015: Weighted average Debt amount (1) effective interest rates March 31, Fixed rate Mortgages(2) Convertible debentures Total fixed rate debt Variable rate Revolving credit facility Total variable rate debt Total debt December 31, 2015 3.47% 6.12% 3.85% 3.01% 3.01% 3.83% Maturity March 31, 2014 dates 3.50% 6.12% 3.87% 3.42% 3.42% 3.85% 2015–2024 $ 2017–2019 2016 $ 2015 December 31, 763,737 $ 125,675 889,412 21,434 21,434 910,846 $ 2014 755,194 125,490 880,684 40,609 40,609 921,293 (1) The effective interest rate method includes the impact of fair value adjustments and financing costs. (2) On February 24, 2014, the Trust entered into a five-‐year interest rate swap agreement to fix the interest rate of a mortgage on a portfolio of eight of its properties located in Halifax. The swap agreement fixed the interest rate on this mortgage at 3.31% for the five-‐year term. The scheduled principal repayments and debt maturities are as follows: Revolving Convertible Mortgages credit facility debentures Total $ 119,095 112,964 106,170 93,405 62,650 264,758 759,042 (2,280) 6,975 $ 4,695 763,737 $ 2015 2016 2017 2018 2019 2020 and thereafter Unamortized financing costs Unamortized fair value adjustments Total $ -‐ 21,700 -‐ -‐ -‐ -‐ 21,700 (266) -‐ $ (266) 21,434 $ -‐ -‐ 19,420 -‐ 111,250 -‐ 130,670 (2,728) (2,267) $ 119,095 134,664 125,590 93,405 173,900 264,758 911,412 (5,274) 4,708 (4,995) 125,675 $ (566) 910,846 Other financial instruments The following table lists the fair value of financial instruments: Fair value of interest rate swap Conversion feature on the convertible debentures Dream Industrial REIT 2015 First Quarter Report | 50 $ March 31, 2015 December 31, 2014 1,776 $ (1,186) 522 3 Interest rate swap On February 24, 2014, the Trust completed the refinancing of maturing mortgages on a portfolio of eight of its properties located in Halifax at a variable interest rate of monthly Canadian Dealer Offered Rate (“CDOR”) plus 1.4% for an initial term of five years. In order to hedge the interest rate risk on the variable interest rate, the Trust also entered into a five-‐year interest rate swap agreement with a Canadian chartered bank for an initial notional value of $56 million, which effectively fixed the interest rate on this mortgage at 3.31% for the five-‐year term. The Trust has applied hedge accounting to this relationship, whereby the change in fair value of the effective portion of the hedging derivative is recognized in accumulated other comprehensive loss in the condensed consolidated statement of changes in equity. Settlement of both the fixed and variable portions of the interest rate swap occurs on a monthly basis. The following table summarizes the details of the interest rate swap that is outstanding at March 31, 2015: Transaction date February 24, 2014 $ Mortgage principal amount (notional) 53,573 Fixed interest rate Maturity date Financial instrument classification 3.31% March 1, 2019 Cash flow hedge $ Fair value 1,776 The Trust has assessed that there is no ineffectiveness in the hedge of its interest rate exposure. The effectiveness of the hedging relationship is reviewed on a quarterly basis. As an effective hedge, unrealized gains or losses on the interest rate swap agreement are recognized in accumulated other comprehensive loss in the condensed consolidated statement of changes in equity. At March 31, 2015, the aggregate fair value of the interest rate swap amounted to a $1,776 financial liability (December 31, 2014 – $522). The associated unrealized gains or losses that are recognized in accumulated other comprehensive loss will be reclassified in the same period during which the interest payments on the hedged item affect net income. Conversion feature on the convertible debentures The movement in the conversion feature on the convertible debentures for the period is as follows: Note Opening balance Fair value adjustment on conversion feature of the convertible debentures Ending balance 17 $ $ March 31, 2015 3 $ (1,189) (1,186) $ December 31, 2014 973 (970) 3 Remeasurement of the conversion feature is included in the fair value adjustments to financial instruments in the condensed consolidated statements of net income and comprehensive income (see Note 17). Note 10 SUBSIDIARY REDEEMABLE UNITS DILP, a subsidiary of Dream Industrial, is authorized to issue an unlimited number of LP B Units. The subsidiary redeemable units, together with the accompanying Special Trust Units, have economic and voting rights equivalent in all material respects to the REIT Units. Generally, each subsidiary redeemable unit entitles the holder to a distribution equal to distributions declared on REIT Units. Subsidiary redeemable units may be surrendered or indirectly exchanged for REIT Units on a one-‐for-‐one basis at the option of the holder, generally at any time, subject to certain restrictions. The Trust has the following subsidiary redeemable units outstanding: Three months ended March 31, 2015 Number of units issued Note Opening balance New issuance of units Remeasurement of carrying value Ending balance 17 and outstanding 18,551,855 -‐ -‐ 18,551,855 $ $ Amount 156,206 -‐ 10,946 167,152 Dream Industrial REIT 2015 First Quarter Report | 51 Year ended December 31, 2014 Number of units issued and outstanding Amount 16,282,096 2,269,759 -‐ 18,551,855 $ $ 144,096 21,949 (9,839) 156,206 During the three months ended March 31, 2015, the Trust recorded $3,246 (March 31, 2014 – $2,849) in distributions on the subsidiary redeemable units, which are included as interest expense in the condensed consolidated statements of net income and comprehensive income (see Note 16). As at March 31, 2015, 18,551,855 (December 31, 2014 – 18,551,855) Special Trust Units were issued and outstanding. Note 11 DEFERRED UNIT INCENTIVE PLAN The Deferred Unit Incentive Plan (“DUIP”) provides for the grant of deferred trust units to trustees, officers and employees as well as affiliates and their service providers, including the asset manager. Deferred trust units are granted at the discretion of the Trustees and earn income deferred trust units based on the payment of distributions. Once issued, each deferred trust unit, and the related distribution of income deferred trust units, vests evenly over a three-‐ or five-‐year period on the anniversary date of the grant. Subject to an election option available for certain participants to defer receipt of REIT Units, such REIT Units will be issued immediately on vesting. As at March 31, 2015, up to a maximum of 1,500,000 (December 31, 2014 – 1,500,000) deferred trust units were issuable under the DUIP. The movement in the DUIP balance was as follows: Note As at January 1, 2015 Compensation expense during the period REIT Units issued for vested deferred trust units Remeasurement of carrying value As at March 31, 2015 17 $ $ 2,160 338 (476) 225 2,247 During the three months ended March 31, 2015, $338 of compensation expense was recorded (March 31, 2014 – $291) and included in general and administrative expenses. For the same period, $225 (March 31, 2014 – $57) was recognized in fair value adjustments to financial instruments representing the remeasurement of the DUIP liability for the period. Outstanding and payable at January 1, 2015 Granted during the period REIT Units issued Cancelled upon termination Fractional units paid in cash Outstanding and payable at March 31, 2015 Vested but not issued at March 31, 2015 Deferred Income deferred trust units trust units Total units 40,142 9,075 (5,522) (786) (29) 42,880 5,108 430,894 137,775 (50,854) (10,786) (29) 507,000 56,962 390,752 128,700 (45,332) (10,000) -‐ 464,120 51,854 On February 17, 2015, 128,700 deferred trust units were granted to senior management and employees of the Trust. Of the units granted, 43,000 units relate to key management personnel. The grant date value of these deferred trust units was $8.95 per unit granted. Note 12 OTHER NON-‐CURRENT LIABILITIES March 31, Tenant security deposits Deferred income tax liabilities Other financial instruments liabilities Total Note 9 Dream Industrial REIT 2015 First Quarter Report | 52 $ $ 2015 11,121 361 1,776 13,258 December 31, 2014 $ $ 10,766 254 525 11,545 Note 13 AMOUNTS PAYABLE AND ACCRUED LIABILITIES March 31, Trade payables Accrued liabilities and other payables Accrued interest Rent received in advance Distributions payable Total $ $ December 31, 2015 2014 3,468 8,882 5,398 2,516 3,395 23,659 $ $ 3,083 10,548 3,655 2,184 3,385 22,855 On March 19, 2015, the Trust announced a cash distribution of $0.05833 per REIT Unit for the month of March 2015. The March 2015 distribution was paid on April 15, 2015, to unitholders on record as at March 31, 2015. Note 14 EQUITY March 31, 2015 Number of Units REIT Units Retained earnings Accumulated other comprehensive loss Total 58,196,975 -‐ -‐ 58,196,975 $ $ December 31, 2014 Amount Number of Units 577,858 46,732 (1,776) 622,814 58,035,125 -‐ -‐ 58,035,125 $ $ Amount 576,399 52,774 (522) 628,651 Dream Industrial REIT Units Dream Industrial is authorized to issue an unlimited number of REIT Units and an unlimited number of Special Trust Units. The Special Trust Units may only be issued to holders of subsidiary redeemable units. REIT Units represent an undivided beneficial interest in Dream Industrial and in distributions made by Dream Industrial. No REIT Unit has preference or priority over any other. Each REIT Unit entitles the holder to one vote at all meetings of unitholders. Normal course issuer bid On December 15, 2014, the Toronto Stock Exchange accepted the Trust’s Notice of Intention to make a normal course issuer bid, which commenced on December 17, 2014 and will remain in effect until the earlier of December 16, 2015 or the date on which the Trust has purchased the maximum number of REIT Units permitted under the bid. Under the bid, the Trust has the ability to purchase for cancellation up to a maximum of 5,688,097 REIT Units (representing 10% of the REIT’s public float of 56,880,965 REIT Units as at December 1, 2014). As at March 31, 2015, no purchases had been made. Note 15 ASSETS HELD FOR SALE AND DISPOSITIONS Assets held for sale As at March 31, 2015, there were no properties classified as held for sale. March 31, 2015 Investment properties Assets held for sale $ $ Dream Industrial REIT 2015 First Quarter Report | 53 -‐ $ -‐ $ December 31, 2014 10,839 10,839 Dispositions During the three months ended March 31, 2015, the following dispositions were completed: 4501–4509 1st Street SE, Calgary 4515–4519 1st Street SE, Calgary 4523–4529 1st Street SE, Calgary 4021 9th Street SE, Calgary Total $ $ Gross (1) proceeds 2,300 $ 1,900 1,700 5,000 10,900 $ Loss on (2) sale (154) $ (229) (59) (521) (963) $ Mortgage discharged -‐ -‐ -‐ 3,277 3,277 Date disposed February 4, 2015 February 4, 2015 February 4, 2015 February 17, 2015 (1) Gross proceeds before transaction costs. (2) Carrying value of assets approximated gross proceeds. The loss on sale arises entirely from the write-‐off of fair value adjustments and costs associated with the debt discharge, transaction costs and the write-‐off of allocated goodwill associated with the cash-‐generating unit. During the three months ended March 31, 2015, the Trust incurred $694 in transaction costs in relation to the dispositions, of which $556 was paid in the quarter. Note 16 INTEREST Interest on debt Interest on debt incurred and charged to comprehensive income is recorded as follows: Interest expense incurred, at contractual rate Amortization of financing costs Amortization of fair value adjustments Interest expense Add/deduct: Amortization of financing costs Amortization of fair value adjustments Change in accrued interest Cash interest paid $ $ Three months ended March 31, 2015 9,168 281 (654) 8,795 (281) 654 (1,743) 7,425 $ $ 2014 8,672 239 (792) 8,119 (239) 792 (1,774) 6,898 Certain debt assumed in connection with acquisitions has been adjusted to fair value using the estimated market interest rate at the time of the acquisition (“fair value adjustment”). This fair value adjustment is amortized to interest expense over the expected remaining term of the debt using the effective interest rate method. Non-‐cash adjustments to interest expense are recorded as a change in non-‐cash working capital in the condensed consolidated statements of cash flows. Interest on subsidiary redeemable units Interest payments charged to comprehensive income consisting of distributions to holders of subsidiary redeemable units are recorded as follows: Paid in cash Less: Interest payable at December 31, 2014 (December 31, 2013) Plus: Interest payable at March 31, 2015 (March 31, 2014) Total The interest payable at March 31, 2015 was paid on April 15, 2015, in cash. Dream Industrial REIT 2015 First Quarter Report | 54 $ $ Three months ended March 31, 2015 3,246 (1,082) 1,082 3,246 $ $ 2014 2,849 (950) 950 2,849 Note 17 FAIR VALUE ADJUSTMENTS TO FINANCIAL INSTRUMENTS Fair value adjustment on conversion feature of the convertible debentures Remeasurement of carrying value of subsidiary redeemable units Remeasurement of carrying value of Deferred Unit Incentive Plan Note Three months ended March 31, 9 $ 10 11 $ 2015 1,189 (10,946) (225) (9,982) 2014 $ $ (324) (8,955) (57) (9,336) Note 18 GAINS (COSTS) ON TRANSACTIONS AND OTHER ACTIVITIES Debt settlement costs Net loss on sale of investment properties Investment in business transformation Internal leasing costs Acquisition costs Total Note Three months ended March 31, 15 20 2015 $ $ -‐ (963) (145) (1,008) -‐ (2,116) 2014 $ (59) -‐ (100) (841) (35) (1,035) $ During the three months ended March 31, 2015, the Trust incurred $145 of business transformation costs related to the process and technology improvements project pursuant to the Shared Services and Cost Sharing Agreement with DREAM Asset Management Corp. (see Note 20). Note 19 SEGMENTED INFORMATION For the three months ended March 31, 2015 and March 31, 2014, the Trust’s investment properties were segmented into geographic components, namely Western Canada, Ontario, Québec and Eastern Canada. The Trust did not allocate interest expense to these segments since leverage is viewed as a corporate function. The decision as to where to incur the debt is largely based on minimizing the cost of debt and is not specifically related to the segments. Similarly, other income, other expenses, fair value adjustments, gains (costs) on transactional and other activities, and income taxes were not allocated to the segment expenses. Three months ended March 31, 2015 Western Ontario Operations Investment properties revenue $ 15,902 $ 11,070 $ Investment properties operating expenses (4,765) (3,635) Net rental income $ 11,137 $ 7,435 $ Québec Eastern 7,984 $ (2,232) 5,752 $ Segment (1) total 8,302 $ 43,258 $ (3,389) (14,021) 4,913 $ 29,237 $ Other Total 43,940 (14,237) 29,703 682 $ (216) 466 $ (1) Includes revenue and expense items such as lease termination fees, straight-‐line rent, bad debt expenses, amortization of tenant inducements, and NOI from sold properties which are included in the net rental income but not monitored at a regional level. Segment Three months ended March 31, 2014 Operations Investment properties revenue $ Investment properties operating expenses Net rental income $ Western Ontario Québec Eastern 13,961 $ (4,615) 9,346 $ 10,760 $ (3,610) 7,150 $ 6,963 $ (1,864) 5,099 $ total 8,243 $ 39,927 $ (3,402) (13,491) 4,841 $ 26,436 $ (1) Other Total 40,914 (13,699) 27,215 987 $ (208) 779 $ (1) Includes revenue and expense items such as lease termination fees, straight-‐line rent, bad debt expenses, amortization of tenant inducements, and NOI from sold properties which are included in the net rental income but not monitored at a regional level. Dream Industrial REIT 2015 First Quarter Report | 55 Certain revenues and expenses are not specifically allocated to segments. The following table reconciles net rental income to net income in the condensed consolidated financial statements: 2015 Net rental income Other revenue Other expenses Fair value adjustments and other items Income before taxes Deferred income taxes Net income for the period $ $ 29,703 3 (14,253) (11,187) 4,266 (107) 4,159 Three months ended March 31, 2014 $ $ 27,215 8 (12,932) (9,870) 4,421 (310) 4,111 Investment properties Three months ended March 31, 2015 Western Investment properties Total capital expenditures and leasing costs Ontario Québec $ 649,375 $ 434,950 $ 327,937 $ 524 $ 423 $ 313 Year ended December 31, 2014 Western Investment properties Total capital expenditures and leasing costs Ontario Québec $ 647,117 $ 435,430 $ 327,396 $ 7,958 $ 3,863 $ 1,497 Eastern $ 272,280 $ 685 Eastern $ 271,838 $ 3,021 Total $ 1,684,542 $ 1,945 Total $ 1,681,781 $ 16,339 Note 20 RELATED PARTY TRANSACTIONS AND ARRANGEMENTS From time to time, Dream Industrial and its subsidiaries enter into transactions with related parties. Dream Industrial, DILP, Dream Industrial Management LP (a wholly owned subsidiary of DILP), Dream Industrial Management Corp. and Dream Office Management Corp., a subsidiary of Dream Office REIT, are parties to an administrative services agreement (the “Services Agreement”) that is in effect until October 4, 2015. Unless terminated by any party to the Services Agreement, the term is automatically renewed for additional one-‐year terms. Effective October 4, 2012, Dream Industrial also has an asset management agreement (the “Asset Management Agreement”) with DREAM Asset Management Corporation (“DAM”), formerly known as Dundee Realty Corporation, a subsidiary of DREAM Unlimited Corp., pursuant to which DAM provides certain asset management services to Dream Industrial and its subsidiaries, which is in effect until October 4, 2022. Shared Services and Cost Sharing Agreement The existing Asset Management Agreement provides the Trust and DAM, from time to time, the opportunity to agree on additional services to be provided to the Trust for which DAM is to be reimbursed for its costs. To formalize and expand this arrangement, the Trust entered into a Shared Services and Cost Sharing Agreement with DAM on December 1, 2013. The agreement is for a one-‐year term and will be automatically renewed for further one-‐year terms unless and until the agreement is terminated in accordance with its terms or by mutual agreement of the parties. Pursuant to the agreement, DAM will be providing additional administrative and support services in order to expand and improve DAM’s service capability in connection with the provision of its asset management services. DAM will receive an annual fee sufficient to reimburse it for all the expenses incurred in providing these additional administrative and support services. Additionally, the Trust will also reimburse DAM in each calendar year for its share of costs incurred in connection with certain business transformation services provided by DAM. The Trust’s future commitment for business transformation costs under the Shared Services and Cost Sharing Agreement is $1,975. These costs relate to process and technology improvements that will be completed during that time. Dream Industrial REIT 2015 First Quarter Report | 56 Related party transactions Fees and cost reimbursements paid and payable to related parties were as follows: Incurred under the Asset Management Agreement: Base annual management fee (included in general and administrative expenses) Expense reimbursements related to financing arrangements (included in debt/ unitholders’ equity) Total incurred under the Asset Management Agreement Incurred under the Shared Services and Cost Sharing Agreement: Investment in business transformation activities Strategic services and other Total incurred under the Shared Services and Cost Sharing Agreement Amounts paid and payable to Dream Office REIT: Costs reimbursed under the Services Agreement Distributions paid to Dream Office REIT on subsidiary redeemable units Amounts paid and payable to Dream Office REIT Three months ended March 31, Note 2015 18 $ $ $ 1,044 $ 67 1,111 $ $ $ $ $ 1,078 $ 3,246 4,324 $ 2014 967 90 1,057 145 99 244 $ 100 54 154 1,390 2,849 4,239 The following table summarizes the outstanding payables to related parties as at: Amounts payable and accrued liabilities to DAM for: Asset Management Agreement Shared Services and Cost Sharing Agreement Cost reimbursements Total payable to DAM Amounts receivable from DAM for: Reimbursement of costs paid by the Trust Total receivable from DAM Amounts payable and accrued liabilities to Dream Office REIT for: Services Agreement Cost reimbursements Distributions on subsidiary redeemable units Total payable to Dream Office REIT Amounts receivable from Dream Office REIT for: Deposits Dream Office REIT received on behalf of the Trust Total receivable from Dream Office REIT March 31, December 31, $ $ $ $ $ $ 2015 2014 $ $ 385 385 $ $ 251 251 2015 (763) (244) (168) (1,175) 88 88 (268) (36) (1,082) (1,386) 67 67 $ $ $ $ $ $ 2014 (730) (181) (59) (970) 26 26 (769) (39) (1,082) (1,890) 35 35 At March 31, 2015, Dream Office REIT’s retained interest in the Trust was 24.2%. Compensation of key management personnel is as follows: (1) Unit-‐based awards granted during the period Total Three months ended March 31, (1) Deferred trust units granted to officers vest over a five-‐year period with one-‐fifth of the deferred trust units vesting each year. Amounts are determined based on the grant date fair value of deferred trust units multiplied by the number of deferred trust units granted in the period. Dream Industrial REIT 2015 First Quarter Report | 57 Note 21 SUPPLEMENTARY CASH FLOW INFORMATION The components of depreciation and amortization, net, under operating activities include: Note Amortization of lease incentives Amortization of financing costs Depreciation of property and equipment Amortization of fair value adjustments Total 5 16 16 Three months ended March 31, 2015 2014 $ $ 95 281 10 (654) (268) $ $ 40 239 5 (792) (508) The components of other adjustments under operating activities include: Note Deferred unit compensation expense Straight-‐line rent adjustment Fair value adjustments to investment properties Fair value adjustments to financial instruments Deferred income taxes Net loss on sale of investment properties Other adjustments to operating activities 11 5 17 7 15 Three months ended March 31, 2015 2014 $ $ 338 (640) (911) 9,982 107 963 9,839 $ $ 291 (665) (501) 9,336 310 -‐ 8,771 The components of the changes in non-‐cash working capital under operating activities include: (Increase) decrease in amounts receivable Increase in prepaid expenses and other assets (Increase) decrease in other non-‐current assets Increase in amounts payable and accrued liabilities Increase in tenant security deposits Change in non-‐cash working capital Three months ended March 31, 2015 2014 $ $ (966) (814) (81) 1,172 355 (334) $ $ 129 (67) 297 1,267 239 1,865 The following amounts were paid on account of interest: Interest Debt Subsidiary redeemable units Total Note 16 16 $ $ Three months ended March 31, 2015 7,425 $ 3,246 10,671 $ 2014 6,898 2,849 9,747 Note 22 COMMITMENTS AND CONTINGENCIES Dream Industrial REIT and its operating subsidiaries are contingently liable under guarantees that are issued in the normal course of business and with respect to litigation and claims that arise from time to time. In the opinion of management, any liability that may arise from such contingencies would not have a material adverse effect on the condensed consolidated financial statements of Dream Industrial. Dream Industrial REIT 2015 First Quarter Report | 58 Purchase and other obligations The Trust has entered into lease agreements that may require tenant improvement costs of approximately $3,481 (March 31, 2014 – $3,303). Pursuant to the Shared Services and Cost Sharing Agreement, the Trust has a commitment to pay $1,975 to DAM over the next five years. Note 23 FAIR VALUE MEASUREMENTS Fair value of financial instruments The following financial instruments are not measured at fair value on the condensed consolidated balance sheet; however, their fair values approximate carrying value: amounts receivable, cash and cash equivalents, subsidiary redeemable units, the Deferred Unit Incentive Plan, tenant security deposits and amounts payable and accrued liabilities. The following table summarizes fair value measurements recognized in the condensed consolidated balance sheet by class of asset or liability and categorized by level according to the significance of the inputs used in making the measurement. Carrying value as at March 31, 2015 Level 1 1,684,542 1,186 1,776 $ -‐ $ -‐ -‐ Recurring measurements Non-‐financial assets Investment properties Financial assets Conversion feature on the convertible debentures Financial liabilities Fair value of interest rate swap $ Fair value as at March 31, 2015 Carrying value as at December 31, 2014 Level 1 $ 1,681,781 3 522 $ -‐ $ -‐ -‐ Recurring measurements Non-‐financial assets Investment properties Financial liabilities Conversion feature on the convertible debentures Fair value of interest rate swap Level 2 Level 3 -‐ $ 1,684,542 -‐ 1,186 -‐ 1,776 Fair value as at December 31, 2014 Level 2 Level 3 -‐ $ 1,681,781 -‐ 3 -‐ 522 Financial instruments carried at amortized cost where carrying value does not approximate fair value are noted below: Carrying value as at March 31, 2015 Fair values disclosed Mortgages Revolving credit facility Convertible debentures $ Level 1 Level 2 $ 763,737 21,434 125,675 Fair value as at March 31, 2015 -‐ -‐ -‐ $ -‐ -‐ -‐ $ Carrying value as at December 31, 2014 Level 1 Level 2 Fair values disclosed Mortgages Revolving credit facility Convertible debentures $ 755,194 40,609 125,490 $ Dream Industrial REIT 2015 First Quarter Report | 59 Level 3 787,398 21,700 135,970 Fair value as at December 31, 2014 -‐ -‐ -‐ $ -‐ -‐ -‐ $ Level 3 770,305 40,928 133,113 All gains and losses recorded in fair value adjustments to financial instruments (Note 17) are changes in unrealized gains and losses relating to the items on the condensed consolidated balance sheet. The conversion feature of the convertible debentures and interest rate swap are measured at fair value. The Trust values financial instruments carried at fair value using quoted market prices, where available. Quoted market prices represent a Level 1 valuation. When quoted market prices are not available, the Trust maximizes the use of observable inputs within valuation models. When all significant inputs are observable, the valuation is classified as Level 2. Valuations that require the significant use of unobservable inputs are considered Level 3. The Trust has determined that the conversion feature on convertible debentures and interest rate swap are valued using Level 3 inputs. The fair value measurement of the interest rate swap was valued by a qualified independent valuation professional based on the present value of the estimated future cash flows determined using yield curve and credit spread. The fair value measurement of the conversion feature of the convertible debentures was valued by a qualified independent valuation consultant. The significant unobservable inputs used in the fair value measurement of the conversion feature as at March 31, 2015 are the following: March 31, 2015 Credit spread 5.25% Debentures 6.75% Debentures 3.175% 4.251% December 31, 2014 Volatility 11.097% 10.491% Credit spread 3.176% 3.741% Volatility 11.294% 9.981% The change in the fair value of the conversion feature of the convertible debentures for the three months ended March 31, 2015 is disclosed in Note 9. Remeasurement of the conversion feature is included in the fair value adjustments to financial instruments line in the condensed consolidated statement of net income and comprehensive income. Note 24 COMPARATIVE CONSOLIDATED FINANCIAL STATEMENTS Certain comparative balances have been reclassified from the consolidated financial statements previously presented to conform to the presentation of the 2015 condensed consolidated financial statements. Dream Industrial REIT 2015 First Quarter Report | 60 Corporate Information HEAD OFFICE AUDITORS Dream Industrial Real Estate Investment Trust State Street Financial Centre 30 Adelaide Street East, Suite 1600 Toronto, Ontario M5C 3H1 Phone: (416) 365-3535 Fax: (416) 365-6565 PricewaterhouseCoopers LLP PwC Tower, 18 York Street, Suite 2600 Toronto, Ontario M5J 0B2 TRANSFER AGENT (for change of address, registration or other unitholder enquiries) Computershare Trust Company of Canada 100 University Avenue, 9th Floor Toronto, Ontario M5J 2Y1 Phone: (514) 982-7555 or 1 800 564-6253 Fax: (416) 263-9394 or 1 888 453-0330 E-mail: [email protected] CORPORATE COUNSEL Osler, Hoskin & Harcourt LLP Box 50, 1 First Canadian Place, Suite 6100 Toronto, Ontario M5X 1B8 INVESTOR RELATIONS Phone: (416) 365-3538 Toll free: 1 877 365-3535 E-mail: [email protected] Website: www.dreamindustrialreit.ca STOCK EXCHANGE LISTING The Toronto Stock Exchange Listing symbols: REIT Units: DIR.UN 5.25% Convertible Debentures: DIR.DB 6.75% Convertible Debentures: DIN.DB DISTRIBUTION REINVESTMENT AND UNIT PURCHASE PLAN The purpose of our Distribution Reinvestment and Unit Purchase Plan (“DRIP”) is to provide unitholders with a convenient way of investing in additional units without incurring transaction costs such as commissions, service charges or brokerage fees. By participating in the Plan, you may invest in additional units in two ways: Distribution reinvestment: Unitholders will have cash distributions from Dream Industrial REIT reinvested in additional units as and when cash distributions are made. If you register in the DRIP you will also receive a “bonus” distribution of units equal to 3% of the amount of your cash distribution reinvested pursuant to the Plan. In other words, for every $1.00 of cash distributions reinvested by you under the Plan, $1.03 worth of units will be purchased. Cash purchase: Unitholders may invest in additional units by making cash purchases. To enrol, contact: Computershare Trust Company of Canada 100 University Avenue, 9th Floor Toronto, Ontario M5J 2Y1 Attention: Dividend Reinvestment Services Or call their Customer Contact Centre at 1 800 564-6253 (toll free) or (514) 982-7555 dream.ca/industrial
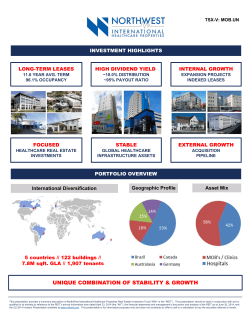


© Copyright 2026