
Impact of Layering of Organic Amendments on Infiltration Rate,
Please purchase PDFcamp Printer on http://www.verypdf.com/ to remove this watermark. Impact of Layering of Organic Amendments on Infiltration Rate, Field Capacity and Moisture Redistribution in a Sandy Loam Soil at Al-Rawakeeb, Omdurman, Sudan BY Ibrahim Rashid Ali Haji Adam B.Sc. (Agric.) Honors Faculty of Agriculture GedarefUniversity ʹͲͲͺ A thesis submitted to the University of Khartoum in partial fulfillment of the requirements for the degree of M.Sc. in Desertification Studies Supervisor Prof. Mukhtar Ahmed Mustafa Desertification and Desert Cultivation Studies Institute ʹͲͳʹ I Please purchase PDFcamp Printer on http://www.verypdf.com/ to remove this watermark. DEDICATION This work is dedicated with love and gratitude to my parents, brothers, sisters, relatives, friends. I Please purchase PDFcamp Printer on http://www.verypdf.com/ to remove this watermark. ACKNOWLEDGEMENTS All the praises are attributed to the sole creator of the whole universe almighty Allah, the most beneficent, the most merciful and the most compassionate, for giving me the strength to carry out this work. I invoke Allah’s blessings and peace for my beloved prophet Muhammad peace be upon him. Foremost, I wish to extend most sincere thanks to my supervisor, Professor Mukhtar Ahmed Mustafa for his timely advice, guidance, valuable suggestions, continued assistance, constructive criticism, comments, discussions and encouragement during the various phases of the work. Besides my supervisor, I would like to thank Professor Mubarak and Dr. ElTegani for their encouragement and insightful comments.I am deeply indebted to Dr. Mariah, Dr. ElsadiqAgabna and the staff of E-rawakeeb station for their help and cooperation.I am grateful to Dr. AbdolwahabDepartment (Dept) Agronomy, University of Khartoum and Dr. El-Tom Elsadiq for their valuable suggestions and help in the statistical analysis. I would like to place on record my sincere thanks to the Islamic Development Bank, which funded my M. Sc. Program. IDB has II Please purchase PDFcamp Printer on http://www.verypdf.com/ to remove this watermark. helped me by extending a helping hand in the form of this scholarship for the two years of my study. I am truly glad for this and would like to thank them from the bottom of my heartespecial thanks go to Mr. Lakdhar Kadkadi who was always so helpful. All support is gratefully acknowledged, including all the staff members, laboratory staff, the staff of the Computer Centre, my fellow lab mates and research students of DADCSI Institute, University of Khartoum for their help and cooperation. Finally, I would like to thank my parents and family members, who have over the years supported and guided me in my endeavors. I would like to thank you for yourpatience, encouragement, profound moral and financial support throughout this work. III Please purchase PDFcamp Printer on http://www.verypdf.com/ to remove this watermark. Ϣϴ˶ Ю ΣЍ ήϟД ϦЙ ϤЄ ΣЍ ήϟ˶ Ϫ͉ ϠϟЮ ϢО δД Α ϿЄ ν έ˴ ΄˸ ϟΎϯϿ ή˴ ΗЙ ϭ`˱ ΓϿ Ϊ˶ ϣΎϿ ϫ˴ ΫД Έ˴ ϓΎ˴ Ϩ˸ ϟ˴ ΰϧ˴ ΎϿ ϬО ϴ˴ ϠϿ ϋ˯ΎЙ Ϥ˸ ϟЄ Ε͉ ΰ˴ ΘЄ ϫЄ ΖЙ ΑϿ έЙ ϭЄ Ζ˴ ΘЙ Βϧ˴ Й ϭ Ϧ˶ ϣ͋ Ϟ˵ ϛΝО ϭ˴ ί^Я ΞϴД ϬЙ Α˳ Ƕ Ȉ ǜ Ǡ dz ơ ƅơ ǩƾ Ǐ ^ Ʋūơ Ƨ ǁ Ȃ LJ } IV Please purchase PDFcamp Printer on http://www.verypdf.com/ to remove this watermark. LIST OF CONTENTS Dedication ..................................................................................................... i Acknowledgment ......................................................................................... ii Verse .............................................................................................................iv List of contents .............................................................................................. v List of Tables ...............................................................................................ix List of Figures .............................................................................................xii English Abstract .........................................................................................xiv Arabic Abstract ..........................................................................................xvi Chapter one: Introduction .............................................................................. 1 Chapter two: Literature Review .................................................................... 4 2.1. Introduction ........................................................................................... 4 2.2. Sandy soils ............................................................................................ 4 2. 3. Properties of sandy soils ...................................................................... 6 2. 3.1. General .............................................................................................. 6 2. 3.2. Available water to plants .................................................................. 7 2.3.3. Infiltration of water ............................................................................. 9 2.3.4 Soil moisture profile during infiltration ........................................... 13 2.4 Amendments for conservation of sandy soils ...................................... 14 V Please purchase PDFcamp Printer on http://www.verypdf.com/ to remove this watermark. 2.4.1 Organic amendments ........................................................................ 14 2.4.2 Animal manures ............................................................................... 17 2.4.2.1 Chicken manure ............................................................................ 18 2.4.2.2 Farm yard manure ......................................................................... 19 2.4.2.3 Dry sewage sludge ........................................................................ 21 2.4.3 Modes of application of organic amendments ................................. 22 2.5 Use and management of sandy soils .................................................... 23 Chapter three: Materials and Methods ........................................................ 25 3.1 Site of the experiment .......................................................................... 25 3.2 Materials .............................................................................................. 26 3.2.1 Soil .................................................................................................... 26 3.2.2 Double- ring Infiltrometer ................................................................. 28 3.2.3 Organic Manures .............................................................................. 28 3.2.4 Water ................................................................................................. 28 3.3 Methods ............................................................................................... 29 3.3.1 Experimental design ......................................................................... 29 3.3.2 Manure application ........................................................................... 30 3.3.3 Field Measurements .......................................................................... 30 3.3.3.1 Determination of Infiltration Rate ................................................. 30 3.3.3.2 Irrigation ....................................................................................... 31 VI Please purchase PDFcamp Printer on http://www.verypdf.com/ to remove this watermark. 3.3.3.3 Measurement of soil moisture content ........................................... 31 3.3.4 Laboratory study ............................................................................... 31 3.3.4.1 Soil sampling to Determine Soil Chemical Properties .................. 31 3.3.4.2 Chemical analysis of soil samples ................................................. 31 3.3.4.3 Water analysis................................................................................. 32 3.5 Statistical analysis................................................................................. 32 Chapter four: Results ................................................................................... 33 4.1 Impact of organic amendments on Infiltration ..................................... 33 4.1.1 Goat yard manure .............................................................................. 33 4.1.2 Chicken manure ................................................................................. 35 4.1.3 Dry sewage sludge ............................................................................ 39 4.2 Impact of organic amendments on field capacity ................................ 45 4.2.1 Goat yard manure .............................................................................. 45 4.2.1 Chicken manure ................................................................................ 47 4.2.1 Dry sewage sludge ............................................................................ 49 4.3 Impact of organic amendments on soil moisture distribution ............. 52 4.3.1 Goat yard manure ............................................................................. 52 4.3.1 Chicken manure ................................................................................ 54 4.3.1 Dry sewage sludge ............................................................................ 54 Chapter Five: General discussion and Conclusions .................................... 58 VII Please purchase PDFcamp Printer on http://www.verypdf.com/ to remove this watermark. 5.1 Impact of organic amendments on infiltration rate ............................. 58 5.2 Impact of organic amendments on field capacity ................................ 61 5.3 Impact of organic amendments on soil moisture temporal distribution……………………………………………………..………. 62 References.................................................................................................... 63 Appendices .................................................................................................. 75 Appendix I Cumulative infiltration (cm) .................................................... 76 Appendix II Parameters of weighted mean field capacity of the soil ......... 79 Appendix III Parameters of soil moisture content for three successive depths 0-15, 15-30 and 30-60 cm……………………… 80 VIII Please purchase PDFcamp Printer on http://www.verypdf.com/ to remove this watermark. LIST OF TABLES Table 3.1 Chemical and physical properties of the soil profile in the experimental site………………………………….. 28 Table 3.2 Chemical Analysis of the Manures 29 Table 3.3 Chemical Analysis of the water………………………… 29 Table 4.1 Parameters of the quadratic relationships between cumulative infiltration (I, cm) and square root of time (vt) as affected by depth of layering (Z) Goat yard manure and time of measurement ………………........ Table 4.2 34 The linear regression lines that passes through origin between cumulative infiltration (I, cm) and time (t, min) as affected by depth (Z) of Goat yard manurelayers and time of measurement (I = i t), where (i) is the infiltration rate (m/min)…………………………..……. Table 4.3 36 Impact of Goat yard manure layers placed at different soil depths (Z) on infiltration rate (mm/min.) as affected by time of measurement………………………….. Table 4.4 38 Effect of layers of Goat yard manure, placed at different soil depths and time of measurement on the infiltration rate (mm/min)…………………………………. Table 4.5 Parameters of the quadratic relationships between cumulative infiltration (I, cm) and square root of time (vt) as affected by depth of layering (Z) chicken manure IX 39 Please purchase PDFcamp Printer on http://www.verypdf.com/ to remove this watermark. and time of measurement………………………………. Table 4.6 40 The linear regression lines that passes through origin between cumulative infiltration (I, cm) and time (t, min) as affected by depth (Z) of Chicken manurelayers and time of measurement (I = it), where (i) is the infiltration rate (m/min)……………………………… Table 4.7 42 Impact of chicken manure layers placed at different soil depths (Z) on infiltration rate (mm/min.) as affected by time of measurement…………………..……………….. Table 4.8 44 Effect of layers of chicken manure, placed at different soil depths and time of measurement on the infiltration rate (mm/min)………………………………………. Table 4.9 45 Parameters of the quadratic relationships between cumulative infiltration (I, cm) and square root of time (vt) as affected by depth of layering (Z) dry sewage sludge and time of measurement………………………. Table 4.10 46 The linear regression lines that passes through origin between cumulative infiltration (I, cm) and time (t, min) as affected by depth (Z) of Dry sewage sludge layers and time of measurement (I = it), where (i) is the infiltration rate (m/min)………………………………. Table 4.11 48 Impact of dry sewage sludge layers placed at different soil depths (Z) on infiltration rate (mm/min.) as affected by time of measurement……………………………… X 50 Please purchase PDFcamp Printer on http://www.verypdf.com/ to remove this watermark. Table 4.12 Effect of layers of dry sewage sludge, placed at different soil depths and time of measurement on the infiltration rate (mm/min)…………………………………………. Table 4.13 51 Effect of layers of Goat yard manure, placed at different soil depths and time of measurement on weighted mean field capacity of the soil………………………………. Table 4.14 51 Effect of layers of chicken manure, placed at different soil depths and time of measurement on weighted mean field capacity of the soil……………………………… Table 4.15 52 Effect of layers of farm yard manure, placed at different soil depths and time of measurement on weighted mean field capacity of the soil………………………………. Table 4.16 52 Effect of layers of Goat yard manure placed at different soil depths on gravimetric soil moisture content (M %) as a function of soil depth (D, cm) during the irrigation cycle after 8 weeks from the commencement of the experiment…………………………………………….. Table 4.17 53 Effect of layers of chicken manure placed at different soil depths on gravimetric soil moisture content (Y) as a function of soil depth (X) during of an irrigation cycle after 8 weeks from the commencement of the experiment……………………………………………. Table 4.18 Effect of layers of dry sewage sludge placed at different soil depths on gravimetric soil moisture content (Y) as a function of soil depth (X) during of an irrigation cycle XI 55 Please purchase PDFcamp Printer on http://www.verypdf.com/ to remove this watermark. after 8 weeks from the commencement of the experiment…………………………………………….. 56 XII Please purchase PDFcamp Printer on http://www.verypdf.com/ to remove this watermark. LIST OF FIGURES Fig.4.1 Cumulative infiltration, measured by the end of the second week after onset of the experiment, as a function of the square of time for a plot in block 3 treated with Goat yard manure layer at 15 cmdepth…………………………… 35 Fig. 4.2 Fig. 4.3 Fig. 4.4 Fig. 4.5 Fig. 4.6 Fig. 4.7 Fig. 4.8 Fig. 4.9 Scaled cumulative infiltration by the end of the second week after onset of the experiment, as a function of time for a plot in block 3 treated with Goat yard manure layer at 15 cmdepth………………………………………………. 37 Cumulative infiltration, measured by the end of the second week after onset of the experiment, as a function of the square of time for a plot in block 3 treated with chicken manure layer at 15 cmdepth……………………………… 41 Scaled cumulative infiltration by the end of the second week after onset of the experiment, as a function of time for a plot in block 3 treated with chicken manure layer at 15 cmdepth……………………………………………….. 43 Cumulative infiltration, measured by the end of the second week after onset of the experiment, as a function of the square of time for a plot in block 3 treated with dry sewage sludge layer at 15 cmdepth……………………………….. 47 Scaled cumulative infiltration by the end of the second week after onset of the experiment, as a function of time for a plot in block 3 treated with dry sewage sludge layer at 15 cmdepth……………………………………………...... 49 Redistribution of gravimetric moisture content at 30 cm after eight weeks of the start of the experiment (GYM)…… 54 Redistribution of gravimetric moisture content at 30 cm after eight weeks of the start of the experiment (CHM)…… 56 Redistribution of gravimetric moisture content at 30 cm after eight weeks of the start of the experiment (DSS)……. 57 XIII Please purchase PDFcamp Printer on http://www.verypdf.com/ to remove this watermark. Impact of Layering of Organic Amendments on Infiltration Rate, Field Capacity and Moisture Redistribution in a Sandy Loam Soil at Al-Rawakeeb, Omdurman, Sudan Ibrahim Rashid Ali Haji Adam Abstract A field experiment was conducted to investigate the impact of three organic amendments: Goat yard manure (GYM), chicken manure (CHM) and dry sewage sludge (DSS) and their layering at different soil depths: 0 (Z0), 15 (Z15) and 30 (Z30) cm on the infiltration rate, field capacity, and moisture redistribution of a sandy loam soil. Each treatment was replicated thrice in a completely randomized block design. The organic amendments were each applied at a rate of 20 ton/fed. The infiltration rates of the soils were measured using a modified double-ring infiltrometer. Cumulative infiltration (I) versus time (t) relationships for all replicates significantly (P < 0.001) fitted a linear regression line that passes through origin, i.e. I = it. The slopes (i) of these linear relationships are the infiltration rates. The main effect of placement of GYM, CHM and DSS for eight weeks was reduction of the initial infiltration rate by 55%, 59% and 49%, respectively. The main impact of layering was significant (P = 0.05) for GYM and DSS but not significant for CHM. Placement of GYM at the surface significantly (P = 0.05) reduced the infiltration rate but placement at Z15 and Z30 had no significant effect. Placement of DSS at Z30 cm gave an infiltration rate, which was significantly lower than its placement at XIV Please purchase PDFcamp Printer on http://www.verypdf.com/ to remove this watermark. the surface or at Z15 depth. Its placement at Z0 had no significant effect. Layering of CHM had no significant effect. Soil moisture content was also determined, gravimetrically, for the following three successive depths: 0-15, 15-30, 30-60 cm, after 2, 4 and 6 days. The analysis of variance, showed a highly significant difference (P = 0.01) in the gravimetric moisture content among treatment means. The weighted-mean moisture content in the top 60 cm conserved in the second day was considered to be the field capacity (WMFC). The main effect of the period of decomposition of the organic amendment was significant showing that GYM, CHM and DSS increased the WMFC by 98%, 68% and 83%, respectively. Placement of GYM on the surface gave significantly higher WMFC than its placement on Z15, but its value was not significant from that of the control or that at Z30. The impact of layering of CHM on WMFC was not significant. Layering of DSS at any depth gave significantly higher WMFC than the control; and its placement at Z30 gave the highest WMFC. For moisture temporal distribution the main effect showed that layering of GYM or DSS did not significantly affect the overall moisture content in the top 30 cm; whereas placement of CHM at Z15 rendered significant higher moisture content in the top 30 cm than at Z30 and Z0. The main effect of time showed that the moisture content at the day prior to irrigation was 9.3% for GYM or CHM and 9.6% for the DSS treatments. XV Please purchase PDFcamp Printer on http://www.verypdf.com/ to remove this watermark. Ŗ ť œ ŵō ƍ ŗ ƒ Ƅ ƀ šƃ Œ ŗ Ŷ Ūƃ Œ ƍ Ŕŧ Ūř ƃ Œ ¾ ť Ŷ Ɔ ƏƄ ŵ ŗ ƒ ƍ ŰŶ ƃ Œ Řœ ƈ ŪšƆ ƃ Œ Řœ ƀ ŕ ű ůŶ ŕ Ŵ Űƍ ŧ ƒ ś ŋ ř ƇŒ ť ƍ Ūƃ Œ Ƈœ Ɔ ŧ ť Ɔ Ŋ Ŕƒ Ƃ Œ ƍ ŧ ƃ œ ŕ ƑƄ Ɔ ŧ ƑƆ ű ŗ ŕ ŧ ř Ƒż ŗ ŕ ƍ űŧ ƃ Œ Ŵ ƒ Ũ ƍ ř Ƈ ŧ Ŋ Şŕ ţ ƓƆ ŷ ŧ Ɣ Ůũ Ƈ Ɣ ƍ Ŕ ũ ŗ ŏ Śŕ ſ Ɔ Ŧƈ Ə Ū ŷŕ ƈ ƅ Ŕ Śŕ ſ Ɔ Ŧƈ Ɠƍ ř Ɣ Ə Ųŷ Śŕ Ɗ Ŭţƈ ř ŝ Ɯŝ ũ Ɣ ŝ ō ś ř ŬŔ ũ ŧ ƅ ř Ɣ Ɔ Ƃ ţ ř ŗ ũ Šś ŚƔ ũ ŠŌ Ɠž ř ſ Ɔ ś Ŧƈ ƀŕ ƈ ŷŌ ƑƆ ŷ Śŕ Ƃ ŗ ų Ɠž ŕ Ǝ Ÿ ŲƏ Ə Žŕ Šƅ Ŕ ƓţŰƅ Ŕ Žũ Űƅ Ŕ Śŕ ſ Ɔ Ŧƈ Ə ƉŠŔ Ə ŧ ƅ Ŕ ř ŗ ũ ś Ƒž ř ŗ Ə ųũ ƅ Ŕ Ŷ Ɣ Ū Ə ś Ə ř Ɣ Ɔ Ƃ ţƅ Ŕ ř Ÿ Ŭƅ Ŕ Ə Ŗũ Ŭś ƅ Ŕ ¿ŧ Ÿ ƈ ƑƆ ŷ Ƈ Ŭ Ə Ɠƍ ř ŗ ũ ś ƅ Ŕ Ƈ ŕ ŴƊ ŗ ř ŗ ũ Šś ƅ Ŕ Śƈ ƈ Ű ƉŔ ŧ ž Ɖų ¿ŧ Ÿ ƈ ŗ Śŕ Ɗ Ŭţƈ ƅ Ŕ Ƌ Ũ ƍ Ɖƈ ¿Ƅ È Śſ Ɣ ŲŔ ƓƆ ƈ ũ Ɠƈ ų ř Ƃ Ɔ ţƅ Ŕ ř Ƃ Ɣ ũ ų Ƈ Ŕ ŧ Ŧś Ŭŕ ŗ Ŗũ Ŭś ƅ Ŕ ¿ŧ Ÿ ƈ ūŕ Ɣ Ɓ Ƈ ś ŚŔ ũ ũ Ƅ ƈ ř ŝ Ɯŝ ŗ ř Ɣ œ Ŕ Ə ŮŸ ƅ Ŕ ř Ɔ ƈ ŕ Ƅ ƅ Ŕ Śŕ ŷŕ ųƂ ƅ Ŕ Ɠƈ Ƅ Ŕ ũ ś ƅ Ŕ Ŗũ Ŭś ƅ Ŕ Śŕ Ɗ ŕ Ɣ ŗ ŚųŷŌ ř ƅ ŧ Ÿ ƈ ƅ Ŕ ř ŠƏ ŧ Ū ƈ ƅ Ŕ I Ɖƈ Ū ƅ Ŕ ŧ Ų t ř Ɣ Ə Ɗ Ÿ ƈ ř Ɣ ųŦ ř Ɓ Ɯŷ P <0.001 ř ſ Ɔ ś Ŧƈ ƅ Ŕ ŚƜƈ ŕ Ÿ ƈ ƅ Ŕ ŚŔ ũ ũ Ƅ ƈ Ŷ Ɣ ƈ Šƅ ¿ŰƗŔ ř ųƂ Ɗ ŗ ũ ƈ ś I = it ƑųŸ Ɣ ŜƔ ţ ř Ɓ ƜŸ ƅ Ŕ Ƌ Ũ ƍ ¿Ɣ ƈ i Ŗũ Ŭś ƅ Ŕ ¿ŧ Ÿ ƈ ř Ɣ Ɗ ŕ ƈ ŝ Ř ŧ ƈ ƅ Žŕ Šƅ Ŕ ƓţŰƅ Ŕ Žũ Űƅ Ŕ Ə ƉŠŔ Ə ŧ ƅ Ŕ Ə Ū ŷŕ ƈ ƅ Ŕ Śŕ ſ Ɔ Ŧƈ ř ž ŕ Ųƙ ūƔ œ ũ ƅ Ŕ ũ Ɣ ŝ ō ś ƅ Ŕ ř ŗ ŬƊ ŗ Ŗũ Ŭś Ɔ ƅ Ɠƅ Ə ƗŔ ¿ŧ Ÿ ƈ ƅ Ŕ űŕ ſ ŦƊ Ŕ Ə ƍ Ŷ Ɣ ŗ ŕ ŬŌ 5Ə 9 Ə Ɠƅ Ŕ Ə ś ƅ Ŕ ƑƆ ŷ Ə ŕ Ɣ Ə Ɗ Ÿ ƈ ř ſ Ɔ ś Ŧƈ ƀŕ ƈ ŷŌ ƑƆ ŷ Śŕ Ƃ ŗ ų Ɠž ř Ɣ Ə ŲŸ ƅ Ŕ Śŕ Ɗ Ŭţƈ ƅ Ŕ Ŷ ŲƏ ƅ ƓŬƔ œ ũ ƅ Ŕ ũ Ɣ ŝ ō ś ƅ Ŕ Ɖŕ Ƅ P= 0.05 Śŕ ſ Ɔ Ŧƈ ƅ ŕ Ɣ Ə Ɗ Ÿ ƈ ūƔ ƅ ƉƄ ƅ Ə Žŕ Šƅ Ŕ ƓţŰƅ Ŕ Žũ Űƅ Ŕ Śŕ ſ Ɔ Ŧƈ Ə Ū ŷŕ ƈ ƅ Ŕ Śŕ ſ Ɔ Ŧƈ ƅ űſ Ŧ Ƒƅ Ŕ Ɛŧ Ō ŢųŬƅ Ŕ ƑƆ ŷ Ū ŷŕ ƈ ƅ Ŕ Śŕ ſ Ɔ Ŧƈ Ŷ ŲƏ ƉŔ ƓŬƔ œ ũ ƅ Ŕ ũ Ɣ ŝ ō ś ƅ Ŕ ũ Ǝ ŴŌ Ə ƉŠŔ Ə ŧ ƅ Ŕ ƒƏ Ɗ Ÿ ƈ P = 0.05 ƀƈ ŷ ŧ Ɗ ŷ ŕ Ǝ Ÿ ŲƏ ƉŌ ũ Ɣ Ż Ŗũ Ŭś ƅ Ŕ ¿ŧ Ÿ ƈ ƅ15 Ə 30 ƌ ƅ ƉƄ Ɣ Ƈ ƅ Ƈ Ŭ Ŗũ Ŭś ¿ŧ Ÿ ƈ Ƈ Ŭ ƀƈ ŷ ŧ Ɗ ŷ Žŕ Šƅ Ŕ ƓţŰƅ Ŕ Žũ Űƅ Ŕ Śŕ ſ Ɔ Ŧƈ Ŷ ŲƏ ƑųŷŌ ƐƏ Ɗ Ÿ ƈ ũ Ɣ ŝ ō ś ŢųŬƅ Ŕ ƑƆ ŷ ŕ Ǝ Ÿ ŲƏ ũ Ɣ ŝ ō ś Ɖŕ Ƅ Ə Ƈ Ŭ ƀƈ ŷ ŧ Ɗ ŷ Ə Ō ŢųŬƅ Ŕ ƑƆ ŷ ŕ Ǝ Ÿ Ų Ə Ɖƈ ŕ Ɣ Ə Ɗ Ÿ ƈ ¿Ɓ Ō ƐƏ Ɗ Ÿ ƈ ũ Ɣ ŝ ō ś ř ſ Ɔ ś Ŧƈ ƀŕ ƈ ŷŌ ƑƆ ŷ Śŕ Ƃ ŗ ų Ɠž ƉŠŔ Ə ŧ ƅ Ŕ Śŕ ſ Ɔ Ŧƈ Ŷ ŲƏ ƅ ƉƄ Ɣ Ƈ ƅ Ə ƐƏ Ɗ Ÿ ƈ ũ Ɣ Ż Ə Ə ř Ɣ ś ƕŔ ř ŝ Ɯŝ ƅ Ŕ ƀŕ ƈ ŷƘƅ ř Ɣ Ɗ Ū Ə ƅ Ŕ ř ŗ ũ ś ƅ Ŕ ř ŗ Ə ųũ ƐƏ ś ţƈ ūŕ Ɣ Ɓ Ƈ ś Śŕ Ɓ Ə ũ ž ƉƔ ŕ ŗ ś ƅ Ŕ ¿Ɣ Ɔ ţś ũ Ǝ ŴŌ ř ŗ ũ Šś ƅ Ŕ ř Ɣ Ŕ ŧ ŗ Ɖƈ Ƈ ŕ Ɣ Ō ř ś Ŭ Ə ř Ÿ ŗ ũ Ō Ə ƉƔ ƈ Ə Ɣ ŧ Ÿ ŗ Ƈ Ŭ ř Ɣ Ə Ɗ Ÿ ƈ P = 0.01 ũ ŗ ś ŷŔ Ə ř ſ Ɔ ś Ŧƈ ƅ Ŕ ŚƜƈ ŕ Ÿ ƈ ƅ Ŕ ƉƔ ŗ ƑƊ Ū Ə ƅ Ŕ ř ŗ ũ ś ƅ Ŕ ř ŗ Ə ųũ ƐƏ ś ţƈ Ɠž XVI Please purchase PDFcamp Printer on http://www.verypdf.com/ to remove this watermark. ř Ÿ ŬƆ ƅ ƓƊ Ū Ə ƅ Ŕ ųŬƏ ś ƈ ƅ Ŕ Ə ƍ ƓƊ ŕ ŝ ƅ Ŕ Ƈ Ə Ɣ ƅ Ŕ Ɠž Ƈ Ŭ »ƅ Ŕ Ɠž ƑƊ Ū Ə ƅ Ŕ ř ŗ ũ ś ƅ Ŕ ř ŗ Ə ųũ ƐƏ ś ţƈ Śŕ ſ Ɔ Ŧƈ ƉŌ ŢŲś Ŕ ŜƔ ţ ŕ Ɣ Ə Ɗ Ÿ ƈ ř Ɣ Ə ŲŸ ƅ Ŕ Śŕ Ɗ Ŭţƈ ƅ Ŕ ¿Ɔ ţś Ř ũ ś ſ ƅ ūƔ œ ũ ƅ Ŕ ũ Ɣ ŝ ō ś ƅ Ŕ Ɖŕ Ƅ ř Ɣ Ɔ Ƃ ţƅ Ŕ ř ŗ ŬƊ ŗ ƑƊ Ū Ə ƅ Ŕ ř ŗ ũ ś ƅ Ŕ ř ŗ Ə ųũ ƐƏ ś ţƈ Śŧ Ŕ Ū Žŕ Šƅ Ŕ ƓţŰƅ Ŕ Žũ Űƅ Ŕ Ə ƉŠŔ Ə ŧ ƅ Ŕ Ə Ū ŷŕ ƈ ƅ Ŕ ŢųŬƅ Ŕ ƑƆ ŷ Ū ŷŕ ƈ ƅ Ŕ Śŕ ſ Ɔ Ŧƈ Śŕ Ƃ ŗ ų Ŷ ŲƏ ƑųŷŌ Ə Ƒƅ Ŕ Ə ś ƅ Ŕ ƑƆ ŷ Ø Ə Ə Ɖŷ ŕ Ɣ Ə Ɗ Ÿ ƈ ř ſ Ɔ ś Ŧƈ ƉƄ ś Ƈ ƅ ƉƄ ƅ Ə Ƈ Ŭ ƀƈ ŷ ƑƆ ŷ ŕ Ǝ Ÿ ŲƏ Ɖƈ ƑƆ ŷŌ ƑƊ Ū Ə ř ŗ Ə ųũ ƐƏ ś ţƈ ƐƏ ś ţƈ ƅ Ŕ ƑƆ ŷ ƉŠŔ Ə ŧ ƅ Ŕ Śŕ ſ Ɔ Ŧƈ Śŕ Ƃ ŗ ų Ŷ ŲƏ ũ Ɣ ŝ ō ś ƉƄ Ɣ Ƈ ƅ Ə ŧ ƍ ŕ Ůƅ Ŕ Ə Ƈ Ŭ ƀƈ Ÿ ƅ Ŕ ƐŌ Ƒž Žŕ Šƅ Ŕ ƓţŰƅ Ŕ Žũ Űƅ Ŕ Śŕ ſ Ɔ Ŧƈ Śŕ Ƃ ŗ ų Ŷ ŲƏ Ɛŧ Ō ŧ Ƃ ƅ Ə ŕ Ɣ Ə Ɗ Ÿ ƈ ƑƊ Ū Ə ƅ Ŕ Ƒŗ Ə ųũ ƅ Ŕ ƑųŷŌ Ƈ Ŭ ƀƈ Ÿ ƅ Ŕ ŧ Ɗ ŷ ŕ Ǝ Ÿ ŲƏ Ɖō ŗ ŕ ƈ Ɔ ŷ ŧ ƍ ŕ Ůƅ Ŕ Ɖƈ ƑƆ ŷŌ ƑƊ Ū Ə ř ŗ Ə ųũ ƐƏ ś ţƈ ƅ ƀƈ ŷ ƑƊ Ū Ə ř ŗ Ə ųũ ƐƏ ś ţƈ ƑƆ ŷŌ Ə Ū ŷŕ ƈ ƅ Ŕ Śŕ ſ Ɔ Ŧƈ Śŕ Ƃ ŗ ų Ŷ ŲƏ ƉŌ ūƔ œ ũ ƅ Ŕ ũ Ɣ ŝ ō ś ƅ Ŕ ũ Ǝ ŴŌ ř ŗ Ə ųũ ƅ Ŕ Ŷ Ɣ Ū Ə ś Ř ŧ ŕ ŷƙ ř ŗ ŬƊ ƅ ŕ ŗ Ƈ Ŭ »ƅ Ŕ Ƒž ƑƆ Ƅ ƅ Ŕ Ƒŗ Ə ųũ ƅ Ŕ ƐƏ ś ţƈ ƅ Ŕ ƑƆ ŷ ƐƏ Ɗ Ÿ ƈ ũ Ɣ ŝ ō ś ŕ Ǝ ƅ ūƔ ƅ Žŕ Šƅ Ŕ ƓţŰƅ Ŕ Žũ Űƅ Ŕ Ƒž ƑƆ ŷŌ ř ŗ Ə ųũ ƐƏ ś ţƈ Ƒƅ Ŕ Ƈ Ŭ ƀƈ Ÿ ƅ Ŕ Ƒž ƉŠŔ Ə ŧ ƅ Ŕ Śŕ ſ Ɔ Ŧƈ ř Ƃ ŗ ų Ŷ ŲƏ Ɛŧ Ō ŕ ƈ Ɗ Ɣ ŗ ŕ Ɣ Ɔ Ÿ ƅ Ŕ ũ Ɣ ŝ ō ś ƅ Ŕ Ɖƈ ŢŲś Ŕ ŧ Ƃ ƅ Ə Ƈ Ŭ ƀƈ ŷ ŧ Ɗ ŷ Ə Ō ŢųŬƅ Ŕ ƑƆ ŷ ŕ Ǝ Ÿ ŲƏ ŗ ř Ɗ ũ ŕ Ƃ ƈ ŕ Ɣ Ɔ Ÿ ƅ Ŕ Ƈ Ŭ »ƅ Ŕ ƒƏ ŕ ŬƔ ƒũ Ɔ ƅ ƀŗ ŕ Ŭƅ Ŕ Ƈ Ə Ɣ ƅ Ŕ Ɠž ŕ Ɣ Ɔ Ÿ ƅ Ŕ Ƈ Ŭ »ƅ Ŕ Ɠž ř ŗ ũ ś ƅ Ŕ ř ŗ Ə ųũ ƐƏ ś ţƈ ƉŌ Ɖƈ Ū Ɔ ƅ ūƔ œ ũ ƅ Ŕ Žŕ Šƅ Ŕ ƓţŰƅ Ŕ Žũ Űƅ Ŕ Śŕ ſ Ɔ Ŧƈ ƅ Øϵ͘ ϲ Ə ƉŠŔ Ə ŧ ƅ Ŕ Ə Ō Ū ŷŕ ƈ ƅ Ŕ Śŕ ſ Ɔ Ŧƈ ƅ ϵ͘ ϯ. XVII Please purchase PDFcamp Printer on http://www.verypdf.com/ to remove this watermark. CHAPTER ONE INTRODUCTION Sandy soils constitute a large proportion of arable lands in the arid and semi-arid zones in the Sudan. Their inherent productive capacity is constrained by some soil physical and chemical properties. The high hydraulic conductivity of these soils promotes internal drainage and consequent loss of irrigation water by deep percolation. Sandy soils usually have some poor physical and chemical properties i.e., low specific surface area, low water retention, high infiltration rate, low organic matter content and low fertility status. The poor physical properties cause inefficient water use, especially in the arid and semiarid regions, where water resources are usually scarce. Furthermore, the high proportion of the macro pores reduces the moisture retention capacity of the soil. The low clay content reduces both the water and nutrient holding capacities of the soil. Thus, the optimum use of such soils is contingent on proper water and soil management. Irrigation water is gradually becoming scarce not only in arid and semiarid regions but also in the regions where rainfall is abundant, therefore it should be designed and managed so that the application rate of water does not exceed the infiltrability of the soil (Bloem and Laker, 1994). Knowledge of the soil infiltration parameters is of utmost importance for optimum performance and management of surface irrigation (Khatri and Smith, 2005). Infiltration of water into the soil is an important indicator of irrigation efficiency, soil water storage capacity and soil erosion (ENVCO, 2009). Please purchase PDFcamp Printer on http://www.verypdf.com/ to remove this watermark. Soil physical and hydrological properties, for example, bulk density, total soil porosity and saturated hydraulic conductivity may change with agricultural management practices (Shipitalo et al., 2000). Many management practices like tillage, mulching, and soil organic and inorganic amendments are carried out to improve soil physical environment. The amount of water retained in the topsoil is affected by the amount of organic matter content, the size, shape and arrangement of mineral particles. Generally, the more the amount of organic matter the soil contains, the more the water it will be able to absorb depending on the soil texture and structure which are known to be modified by organic amendment (Gupta and Gupta, 2008). It is hypothesized that the addition of layers of organic amendments in a sandy soil may reduce deep percolation losses and promotes soil moisture conservation. Layering is expected to shed light on the optimum depth of placement of organic amendments that yield favorable soil moisture distribution. Considerable research has shown the benefits of using organic amendments to improve soil physical (water holding capacity, porosity and bulk density), chemical (pH, electrical conductivity and nutrient content) and biological properties such as soil microbial populations and plant growth (Stemmer et al., 1999; Rahman et al., 2005; Flavel and Murphy, 2006; Tejada and Garcia, 2006). In the past comprehensive research was conducted on the effect of organic amendments, namely manures on the soil physical, chemical, microbiological and overall soil fertility (Baraka et al., 1999; Mubarak et Please purchase PDFcamp Printer on http://www.verypdf.com/ to remove this watermark. al., 2009; Fadul and Mustafa, 2011). However, very limited research was conducted on the impact of layering organic amendments on soil physical properties (Egerzegi, 1964). There is lack of field research on the effect of layering of organic amendment on infiltration rate and soil moisture retention and redistribution. Thus this research was undertaken to investigate the effect of layering of three organic amendments, namely, goat yard manure (GYM), Dry sewage sludge (DS) and chicken manure (CHM), on infiltration rate, field capacity and moisture redistribution on a sandy loam soil. This was meant to shed some light on the possibility of improving the soil physical properties of this sandy soil. The specific objectives are: 1. Estimation of the effect of GYM, DS and CHM manures on the infiltration rate of a sandy loam soil in Al-Rawakeeb Experimental Station. 2. Estimation of the effect of layering of the three organic amendments on the infiltration rate of the studied soil. 3. Investigation on the impact of the amendments and their layering on the field capacity of the studied soil. 4. Investigation on the impact of the amendments and their layering on soil moisture redistribution in the studied soil. Please purchase PDFcamp Printer on http://www.verypdf.com/ to remove this watermark. CHAPTER TWO LITERATURE REVIEW 2.1 Introduction The productivity of sandy soils is mostly limited by their low water holding capacity and excessive deep percolation losses, which reduce the efficiency of water and fertilizer use by plants (Sivapalan, 2006). Improvement of sandy soils is one of the most important tasks facing mankind at present. Reversal of sandy soil fertility depletion is required to increase agricultural production and may be achieved through the use of inorganic and organic inputs (Sanchez and Leakey, 1997). The application of organic amendments to soil is increasing as both an environmentally favorable waste management strategy and a means of improving soil organic matter content in low-fertility soils (Flavel and Murphy, 2006; Tejada et al., 2006, 2007). 2.2 Sandy soils Soil texture is a soil property that indicates the relative proportions of the primary soil particles, namely sand, silt and clay. It is determined for the particle size distribution using the soil texture triangle. There are twelve soil textures. There are four main textures, namely sand, silt, clay and loam. Loam has relatively even mixture of the three primary particles. The remaining eight textures are intergrades of the four main textures. With respect to texture, soils are classified as fine-textured soils and course-textured soils. Sandy soils are course-textured soils and dominated by the sand fraction. They include sand, loamy sand and sandy loam. Please purchase PDFcamp Printer on http://www.verypdf.com/ to remove this watermark. Sand has a gritty feel, excessive internal drainage, low plant available water, easy tillability, low runoff potential, high wind erodibility. Sandy soils are widespread in the tropics and constitute an important economic resource for agriculture despite their inherent low fertility (FAO, 1975). Sandy soils are of wide spread occurrence in the near east and North Africa regions (Kadry, 1973) as well as in other arid and semiarid regions of the world. Considering that one seventh of the earth's surface is covered by deserts distributed among all the continents and that sand soils and sand dunes make up the bulk of this area, one realizes the extent of the natural soil resources that can hardly be utilized. Sandy soils are characterized by less than 18% clay and more than 68% sand in the first 100 cm of the solum. In the World Reference Base (WRB) soil classification system (ISSS Working Group R.B., 1998), sandy soils may occur in the following Reference Soil Groups: Arenosols, Regosols, Leptosols and Fluvisols. These soils have developed in recently deposited sand materials such as alluvium or dunes. They are weakly developed and show poor horizonation. In Sudan, the soils in the area south of the Sahara desert are sandy soils known as gardude and Goz or ‘Qoz’, classified as Arenosols and covers about 28 million hectare. In these semiarid regions of the country (Kordofan and Darfur) the 12 million hectare of Arenosols are more weathered (Ayoub, 1998) and is characterized by low nutrient and organic matter content (Gafaar et al., 2006). The high draining capacity of the sand increases the nutrient leaching at times of heavy rains (Ayoub, 1998). About 60-75% of North Kordofan contains Goz soil (El Tahir, 2004). Please purchase PDFcamp Printer on http://www.verypdf.com/ to remove this watermark. The main sandy soils which were characterized in Central Sudan by Buursinck (1971) based on the USDA system of soil classification were the following: - the typickaplustalf, aquicustifluvent; typiccalciorthids; typicpaleargid and aquicustifluvent. Buursinck (1971) investigated the mineralogic constituents of the sand fraction (500 to 50 micron) and concluded that there is an increasing degree of weathering of soils from Terrace I to IV. The narrow fertile strips along the Nile River north of Khartoum are being encroached by sand dunes in both banks of the river, while very active sand storms “haboob” is active in most of northern Sudan, particularly in the red sea coast. In Sudan, a whole village or town may be surrounded by unstable sand dunes or sheets, e.g. Mora in Kannar area, the Northern State or Neaima in the White Nile State. In Kordofan the Oases are threatened by surrounding sand dunes, e.g. Al Beshiri and AlTaweel. In the Northern State sand encroachment is threatening agricultural production. The river Nile is threatened by encroaching sand on both banks, notably in the Northern State (Mustafa, 2007). 2.3 Properties of sandy soils 2.3.1 General Sandy soils are characterized by low water holding capacity, low fertility status, and excessive internal drainage. In general, sandy soils have higher bulk densities than clay soils, because the sand particles are amenable to close packing. They can easily be compacted by agricultural machinery. Saturated water movement is affected by soil texture according to the following order: sand > loam > clay. However, in the case of unsaturated flow the order is reversed as follows: clay> loam> sand. The water held at Please purchase PDFcamp Printer on http://www.verypdf.com/ to remove this watermark. a given suction in a sandy soil is lower than that in a clay soil. At a given moisture content, the matric suction of a sandy soil is lower than that of a clay soil. The infiltration rate in a sandy soil is much higher than in a clay soil. Because of the higher infiltration rate and excessive drainage of sandy soils, care should be taken, during their irrigation, not to leach plant nutrients away from the root zone. Sandy soils are often considered as soils with physical properties easy to define: weak structure or no structure, poor water retention properties, high permeability, high sensitivity to compaction with many adverse consequences. Sandy soils have weakly developed profiles and a loose consistency (Henry, 2005). They are largely barren ecosystems characterized by frequent drifting sand, poor plant substrates and low biological activity. In genral, sandy soils have high wind erodibility and thus are vulnerable to wind erosion (Mustafa and Medani, 2003). However, they do not have salinization risk and hence relatively poor-quality water may be used for irrigating salt tolerant crops in these soils such as practiced in the Gulf States. 2.3.2 Available water to plants Soil moisture is essential for growing crops in soils. It plays important roles in almost all soil physical, chemical, biological and microbiological processes that operate in the soil and promote crop growth yield. At saturation, all soil pores are filled with water. An important indicator of soil physical fertility is the capacity of soil to store water in an available form to plants. Texture is the predominant factor that determines the ability of a soil to retain water. The amount of plant-available water in Please purchase PDFcamp Printer on http://www.verypdf.com/ to remove this watermark. relation to air-filled porosity at field capacity is often used to assess soil physical fertility (Peverill et al, 1999). Water molecules hold more tightly to the fine particles of a clay soil than to coarser particles of a sandy soil, so clays generally retain more water (Leeper and Uren, 1993). Conversely, sands provide easier passage or transmission of water through the profile. Clay type, organic matter content and soil structure also influence soil water retention (Charman and Murphy, 1998). After heavy rainfall, a sandy soil will be saturated with water and some of it will percolate deeply by internal drainage due to gravitational gradient. In general, after rainfall or irrigation, water will infiltrate into the soil profile and saturate its top layer. After cession of water supply to the soil surface, infitration ceases but water movement continues and distributes the soil moisture from the moist layer to the relatively drier layer beneath it. After this soil moisture redistribution ceases, the soil moisture in the root zone is said to be at field capacity (FC), which is the upper limit of the available water to plants. The moisture content at which the plant permanently wilts is termed the permanent wilting point (PWP); it is the lower limit of available water. Thus, available water (AW) is expressed by the following relationship: AW = FC – PWP For practical purposes, field capacity is approximated by the moisture content retained in the soil at 1/3 bar in fine-textured soils and 1/10 bar for coarse-textured soils. Permanent wilting point is approximated by the moisture content retained at 15 bars for all soils. Pressure plate equipment is used for determining FC and PWP of a soil. Field capacity may be determined in the field. It corresponds to the moisture content retained in the root zone after 1-3 days of free drainage following a period of Please purchase PDFcamp Printer on http://www.verypdf.com/ to remove this watermark. thorough wetting by rainfall or irrigation and coverage of the plot used for measurement. After this period, the downward flow becomes negligible under these conditions. For sandy soils, one day is enough for downward soil moisture redistribution to cease. Soil moisture content is influenced by soil texture, structure and organic matter. In general, course-textured soils, i.e. sandy soils contain low water content, often less than 10 % by weight at FC and about 3% at PWP (Unger, 1979). Rivers and Shipp (1971) found that the field capacity of sandy soils as determined in five foot square plots was 5.6, 7.3 and 7.9% for coarse sand, sand and fine sand respectively, while the corresponding 0.1 bar values were 3.9, 5.8 and 6.4%. In this particular case, the 0.1 bar tension values appreciably underestimated the field capacity of sands. 2.3.3 Infiltration of water The theory of liquid water movement in soils is based on the following Darcy’s Law (Darcy, 1856), which states that the volumetric flux of water through a soil (q, cm/sec) is directly proportional to the driving force (i.e., the hydraulic gradient, ∇ H). The proportionality constant is called the soil hydraulic conductivity (K, cm/sec): q = - K∇ H Where H is the hydraulic head of water and ∇ is a mathemetical operater which means gradient. The negative sign indicates that water moves from points of high to those of low hydraulic heads. Infiltration is the vertical downward movement of rainfall or irrigation water from the surface into the soil profile. Infiltration rate (i) is defined Please purchase PDFcamp Printer on http://www.verypdf.com/ to remove this watermark. as the quantity of water (Q) that percolates into the soil per unit area per unit time (t) under the prevalent soil conditions, i.e. i = Q/At. In c.g.s. units, it is expressed in cm/sec. Cumulative infiltration (I) is defined as the quantity of water that infiltrates in a given time, i.e. Q/A; and it is expressed in centimeters (Hillel, 1980; Lal and Shukla, 2004). Infiltration is important because it controls leaching, runoff, and crop water availability (Franzluebbers, 2002). It is essential indicator concerning the efficiency of irrigation and drainage, optimizing the availability of water for plants, improving the yield of crops and minimizing erosion (ENVCO, 2009). Accurate determination of infiltration rates is essential for reliable prediction of surface runoff, hydraulic conductivity of the surface layer and ground water recharge, and in developing or selecting the most efficient irrigation methods. In general, under shallow head of water, the infiltration rate is initially very high, particularly, if the soil is dry, and then it decreases, gradually with time until it reaches a constant or steady-state rate (ic). This gradual decrease in infiltration rate with time is attributed to the gradual decrease of soil matric suction gradient and gradual deterioration of soil structure, particularly in the case of clay soils. As the wetted zone deepens, the matric suction is reduced gradually until it becomes vanishingly small and the driving force becomes solely gravitational gradient. At this time the infiltration rate becomes constant and equal to soil hydraulic conductivity. Saxton et al. (1986) reported that the main soil and water characteristics affecting infiltration rates are: the initial moisture content, conditions of the soil surface, hydraulic conductivity, texture, structure, porosity, swelling of soil colloids, organic matter, and vegetative cover, duration of Please purchase PDFcamp Printer on http://www.verypdf.com/ to remove this watermark. irrigation or rainfall and viscosity of water. Of these, soil texture is predominant. Environmental factors that control infiltration rates are rainfall rates, soil properties (including texture, pore characteristics, organic matter content and structure), vegetation, land use, depth of soil and initial moisture (Betson, 1964; Dunne and Leopold, 1978). Hillel (1980) summarized the factors that affect the infiltration rate as follows: Time: Infiltration rate is relatively high from the onset of rainfall or irrigation, decreases gradually and finally approaches a constant rate with progress of time. Hydraulic conductivity: Infiltration rate increases with increase of soil hydraulic conductivity. It ranges between 10-2 and l0-3 cm s-l in a sandy soil and between 10-4 and 10-7 cm s-l in a clay soil. Initial moisture content: In the same soil, infiltration rate decreases with increase of the initial moisture content. Soil surface conditions: When a soil is plowed, its initial moisture content increases. In general, when the soil surface is porous and has good granular structure, the initial infiltration rate becomes greater than when the soil is uniform. For the same soil, the change of the soil surface conditions does not change the steady-state infiltration rate. However, the presence of a surface crust reduces both the initial and the steady-state infiltration arte. The presence of impeding layer in the soil profile: The presence of an impeding layer, i.e. a layer, which differs in texture or structure from the overlying layer, may retard water movement during infiltration. Presence of cracks: Cracks in Vertisols increases the initial but not the steady-state infiltration rate. Please purchase PDFcamp Printer on http://www.verypdf.com/ to remove this watermark. The infiltration rate relative to the intensity of rainfall determines the amount of water, which is stored into the soil and how much is lost by surface runoff. As the rainfall intensity is less than the steady-state infiltration rate, rainfall continues to enter into the soil. However, if the rainfall intensity is greater than the steady-state infiltration rate, surface water run-off will be initiated. Different methods are used to measure the infiltration rate. Lili et al. (2008) reviewed the commonly used methods for measuring soil infiltration rate including their principles, application conditions, comparisons, measurement advantages and disadvantages. Infiltration rate may be measured by a single ring (e.g., Vieira et al., 1981), but the results are limited by lateral water flow. This observation prompted the use of a double ring, an inner small ring where the measurements are made and an outer larger ring used as a buffer to check lateral water flow (e.g, Luxmore et al., 1981). Lili et al. (2008) noted that the double- ring infiltrometer can be conveniently applied to the field conditions because of the simple experimental apparatus and straightforward mathematical model. More details on these methods can be found in Lili et al. (2008). Gregory et al. (2005) noted that the double-ring infiltrometer test is a well-recognized and documented technique for directly measuring soil infiltration rates as reported in Bouwer (1986) and ASTM (2003). Mustafa et al. (2012) introduced a modified double ring infiltrometer fitted with a float and a calibrated side manometer, which improved its accuracy and made the periodic measurements much easier and more convenient. As regards the impact of Organic amendments on Infiltration rate, Zaongo et al. (1994) reported that rapid hydraulic conductivity of the Please purchase PDFcamp Printer on http://www.verypdf.com/ to remove this watermark. Sahelian sandy soils is among the constraints that may limit sustainable production of cereals. Mubarak et al., (2009) reported that application of organic residues had significantly decreased hydraulic conductivity (HC) from 9.47 - 10.17cm h-1 (in the control and fertilizer) to an average of 7.59 (23% reduction). They observed that there was a decrease in water movement in sandy soils amended with organic residues. This offers a better chance for crops to absorb water and nutrients instead of being leached down rapidly. Wanas and Omran (2006) stated that the application of banana and cotton composts to sandy soil in Egypt had resulted in a direct decrease in drainable pores (responsible for water loss under gravity) and consequently, in reduction of hydraulic conductivity (main problem) of the soil. 2.3.4 Soil moisture profile during infiltration Five zones were defined by Bodman and Colman (1944) in a uniform soil into which water was entering at the top to a wetting zone at the lower end. The zones in series were described as: (a) a saturation zone at the surface which extended to 1.5 cm in their soil; (b) a transition zone, a rapid decrease of water content extending to a depth of about 5 cm from the surface; (c) the main transmission zone, a region in which only small changes in water content occurred; (d) a wetting zone, a region of fairly rapid change in water content; and (e) the wetting front, a region of very steep gradient in water content which represents the visible limit of water penetration. The movement of water in soils is due primarily to the rate at which water is supplied to the transmission zone. The matrix potential of this zone is close to zero and the pore space is approximately 80% Please purchase PDFcamp Printer on http://www.verypdf.com/ to remove this watermark. saturated so that water movement within is caused primarily by gravity (Marshall, 1959; Kramer, 1983). 2.4 Amendments for conservation of sandy soils 2.4.1 Organic amendments The addition of organic amendments to soil contributes to organic matter and has great potential for influencing the structure and function of the soil food web and possibly inducing nematode suppression (Widmer et al., 2002; Oka, 2009). Soil organic matter is the most important factor in the formation of a good soil structure which helps in increasing soil water intake and water holding capacity and in reducing runoff and soil loss (Kononova, 1961; Williams and Cooke, 1961). Addition of organic matter also serves as a source of nutrients to crops and energy for the life processes of microorganism (Kononova, 1961; Thompson and Troeh, 1973). Organic matters not only increase the water holding capacity of the soil but also the portion of water available for plant growth and improve physical properties of soil (Epstien et al., 1976). Greater organic matter contents have been linked to increased water retention capacity in soils (N’Dayegamiye and Angers, 1990; Tester, 1990; Droogers and Bouma, 1996; Warren and Fonteno, 1993), especially at soil saturation and field capacity water content. This is believed to be caused by enhanced aggregate formation resulting from organic substances. For this reason, organic matter additions can potentially be used to restore the water retention capacity of an eroded soil with diminished plant – available water. Use of inorganic fertilizers is constrained by inadequate supply, high price, unstable prices of agricultural produce (Kayuki and wortmann, Please purchase PDFcamp Printer on http://www.verypdf.com/ to remove this watermark. 2001) and its environmental impact. Organic amendments have been proposed as an effective method to improve physical properties of soils. Kumar et al. (1985) and recently Diana et al. (2008) reported positive effects of organic wastes on soil physical properties (viz. water retention and hydraulic conductivity). Amelioration of these properties is largely based on increasing organic carbon in the soils (Garcia et al., 1992). The influence of organic matter on soil properties depends on amount, type and size of added organic materials (Barzegar et al., 2002). Abdel Rahman et al. (1996) studied the impact of some organic and inorganic soil amendments on cumulative evaporation, moisture distribution, and salt leaching through saline-sodic clay soil columns. Organic amendments were mixed with the top 5 cm in 60-cm soil columns at the rate of 22 ton/ha for farmyard manure and water hyacinth and 44 ton/ha for chicken manure and dry sludge. The results showed that Sand increased soil water penetrability, and markedly reduced soil evaporation by 32% over the control. Chicken manure, gypsum, water hyacinth, farmyard manure, and dry sewage sludge reduced evaporation by 23, 17, 15, 10, and 6%, respectively. The soil moisture distribution was governed by the amount of water conserved. Sand and chicken manure additions increased the amount of water conserved by 72% and 52%, respectively, compared with the control. They mentioned that naturally occurring organic amendments and inorganic compounds can be used as additives to improve the physical conditions of the studied soil. Mubarak et al. (2009) in a glasshouse experiment evaluated the effects of incorporation of agricultural residues (trashes of Cajanus cajan and sugarcane factory byproduct (baggase); recycling of various vegetable market wastes and; application of animal wastes (hoof and wool) on soil Please purchase PDFcamp Printer on http://www.verypdf.com/ to remove this watermark. properties and performance of fodder sorghum (Sorghum bicolor L.) or maize (Zea mays L.). Results showed that almost all sources of organic materials had resulted in significant positive effects on accumulation of plant dry matter and soil physical and chemical characteristics. They suggested that agricultural and animal wastes instead of being dumped, could offer a cheap alternative source of organic matter to increase soil fertility and to recycle organic wastes which in this study proved to have various positive effects on soil attributes and accumulation of plant dry matter weight. These organic amendments are necessary for the sustainable use of nutrient-poor sandy soils. Mubarak et al. (2008) in a greenhouse experiment studied short-term effect of water hyacinth on some properties of a sandy soil and early estabilishment of fodder sorghum (Sorghum bicolor). Results showed that incorporation of water hyacinth residue significantly (P= 0.001) decreased pH (by about 27%) and hydraulic conductivity by (40-46%) Also, cation exchange capacity and organic C were significantly increased by about 23 and 100%, respectively. They stated that organic resources are important for nutrient availability and maintenance of soil organic matter and concluded that application of water hyacinth could be one of the good alternatives for improving quality of arid soils. Leeper (1964) stated that organic matter has the reputation of improving the physical properties of both sandy and clayey soils, the main effect on sandy soils is to increase their ability to hold water, and its effect on clay soils is to improve soil structure. El-Asswad et al. (1993) indicated that olive oil cake significantly increased the ability of two sandy soils to retain water. A study carried out by Mtambanengwe and Mapfumo (2006) on sandy soils in Zimbabwe Please purchase PDFcamp Printer on http://www.verypdf.com/ to remove this watermark. to investigate the effect of organic resource quality on maize yield showed that maize yield increased linearly with total N added in these resources in combination with N fertilizer. They documented improvements in soil physical properties and in maize yield and showed significant correlations between soil organic matter and porosity, water holding capacity and yield. 2.4.2 Animal manures Animal manures and compost have been used since earliest civilizations for improving soil properties. Though, they contain relatively low concentrations of nutrients, and handling them is labor intensive, there had been largely increase in their use over inorganic fertilizer as nutrient sources on many farms (Kannan et al., 2005). Their beneficial effects on soil physical properties and the ease with which they decompose inside the soil are acknowledged over organic fertilizers. Land spreading of animal manures on agricultural lands has been a traditional practice. It is known that the fertility of a soil is directly related to the level of organic matter. Recently, interest has increased in the application of organic wastes for many reasons including supply of nutrients, soil improving and conditioning and energy conservation (Loehr, 1977; Bewick, 1980). Nevertheless, emphasis on pollution control has encouraged the use of manures on farms (Abot and Tucker, 1973). Moreover it was evident that the organic matter, including manure, has a beneficial effect on soil aggregation and hence, it improves tilth and permeability (Magistad and Christiansen, 1944). Bray (1954) concluded that manures increased crop yield, possibly by improving various soil physical changes. Please purchase PDFcamp Printer on http://www.verypdf.com/ to remove this watermark. 2.4.2.1 Chicken manure Traditionally, land application has been the most common way to utilize poultry manure, since it is a viable source of major plant nutrients and can substitute for commercial inorganic fertilizers (Nicholson et al., 1996). Manure also improves soil tilth and reduces the problems associated with soil compaction (Haynes and Naidu, 1998). However, environmental problems such as odor, pathogens and NO3 leaching may arise during and after application of raw manure (Kelleher et al., 2002; Sims and Wolf, 1994). Vast quantities of manures are produced each year from the growing poultry industry around Khartoum, Sudan. The value of this by-product in soil improvement and in crop production is well documented (Hileman, 1967; Gabir, 1984; Mohamed Ahmed, 1988). Manure application is influenced by many factors. These include the type of chicken, age, kind and amount of feed and even climatic conditions during accumulation. Management practices, undoubtly, influence the amount as well as the composition of chicken manure. These practices vary widely between farms. The effect of chicken manure as a nitrogen fertilizer was studied by many investigators. In Sudan the value of chicken manure as a soil amendment and fertilizer is well documented (Karouri, 1977; Yousif, 1980; Nour, 1988). Its value as a source of plant nutrient was tested by Perkins and Parker (1971). They recorded that broiler manure contained 2.27, 1.07 and 1.70 percent of nitrogen, phosphorous and potassium, respectively. In Sudan, Gabir (1984) investigated the effect of farm yard manure, chicken manure, and dry sewage on growth and yield of lucerne, on saline-sodic soil. He found that the application of chicken manure was superior relative to the other amendments. Please purchase PDFcamp Printer on http://www.verypdf.com/ to remove this watermark. Hafeez (1974) in a laboratory investigation studied the effect of admixtures of manures from various domestic animals on soil-physical properties. The results indicated that the admixtures significantly decreased bulk densities of a fine sandy loam soil, and increased the water holding capacities of both sandy and clay soils. Fibrous components of manure from beef cattle and horses dramatically enhanced water flow through standard soils, whereas poultry manure gave little or no response. Admixture of 5% animal manure enhanced water-stable soil aggregates. Dairy and beef cattle manures were more effective than chicken manure in decreasing bulk densities of soils when subjected to compaction. Addition of different rates and types of animal manures did not significantly change the initial standard flow of water through sandy soil. 2.4.2.2 Farm yard manure Williams and Cooke (1961) stated that two important methods to build up organic matter for improving soil structure are addition of farm yard manure (FYM) or sowing arable land to grass. Other methods include the addition of crop residues, poultry and green manures. Singh et al. (1980) in a field experiment studied the effect of FYM on some soil properties. They reported that using FYM for a number of years decreased soil pH, and increased organic carbon content, cation exchange capacity and exchangeable cations. Tsutsuki and Kuwatsuki (1990) showed that application of FYM over a 10- year period resulted in marked increase in soil organic matter in the silt and sand fraction, but had a little effect on the organic matter in the clay fractions. Plowing of FYM into a cultivated soil layer distributes it through the whole soil top layer, and thus it becomes more effective than chemical Please purchase PDFcamp Printer on http://www.verypdf.com/ to remove this watermark. fertilizers applied by hand to the soil surface (Warren and Johnston, 1960). Salter and Haworth (1961) reported that the annual application of FYM to a sandy loam soil for six successive years, increased available water of the top 18 cm by 33 percent. The observations by Khaleel et al. (1981) agreed with the findings by Haynes and Naidu (1998), who noted that since the water holding capacity (WHC) of soils is generally increased by additions of organic waste at both FC and PWP; AW is often not greatly affected. However, they differentiated between different processes affecting WHC after soil organic carbon (SOC) amendments at high PWP versus low FC tensions. An increase in WHC due to SOC amendments at FC was attributed to an increased number of small pores. At PWP, on the other hand, the soil moisture content is determined by surface area and thickness of water films and addition of SOC would increase the specific surface area, resulting in increased WHC at higher tensions. However, Gupta (1977), among other research workers, reported no significant changes in AW after application of sewage sludge to a sandy soil. By comparison, large and positive effects of organic amendments on AW were reported by De Silva et al. (2003), who found that after 16 months of repeated incorporations of both FYM and municipal waste compost (MWC) at 50 ton/ha, AW doubled compared to an amended soil. MWC proved to be better in conserving soil water than FYM for sandy soils; however, over the 16 months of the experiments, they observed a high variability in SOC contents due to the dynamics between addition of amendments, breakdown of organic matter and translocation to deeper depths and accordingly, the positive results on AW became apparent only after 12 months. Please purchase PDFcamp Printer on http://www.verypdf.com/ to remove this watermark. Jiao et al. (2006) reported that application of cattle manure at a rate of 30 ton/ha or greater significantly increased water soluble aggregates of a sandy soil and that means an improvement of the soil structure which might have positive effects on water retention capacity. Fadul and Mustafa (2011) in a field experiment in two successive seaons investigated the effects of irrigation frequency (7, 14 and 21 days) and partially-composted farm yard manure (0, 4.8 and 9.7 ton/fed.) on salt leaching and on wheat (Triticum aestivum L.) growth and productivity on a saline-sodic sandy loam soil. Results showed that weekly irrigation and addition of 9.7 ton/fed of FYM was the superior treatment in both seasons but the effect was not significant in the second season because the soil was relatively ameliorated in the first season. It is recommended that in the higher terrace saline-sodic sandy loam Aridisols, wheat should be irrigated weekly at a rate equivilant to the potential evapotranspiration. Incorporation of composted farm yard manure at the rate of about 10 ton/fed into the plough layer will improve crop performance. 2.4.2.3 Dry sewage sludge Gupta et al. (1977) in a laboratory study investigated the effect of application of sewage sludge on a sandy soil (90% sand). The results showed that soil water retention was increased by incooporation of sewage sludge. They suggested that most of the increase resulted from water observed by organic matter. At any given water content, saturated hydraulic conductivity and soil water diffusivity decreased as the rate of sludge addition increased. Hall and Coker (1979) stated that sewage sludge solids improved soil physical conditions and grass root growth at application rates similar to the agricultural use of FYM. Soil bulk density decreased and soil water Please purchase PDFcamp Printer on http://www.verypdf.com/ to remove this watermark. holding capacity significantly increased by application of dry sewage. The investigation indicated that on a calcareous soil, application of sludge increased lettuce yields by more than 100%. Danneberg et al. (1981) examined the effect of sewage sludge application on physical and biological properties of soils. The results showed that application of sewage sludge alone raised significantly both soil nitrogen and crop yield. Tester (1990) studied the effect of organic amendments on physical and chemical properties of a sandy soil. The results showed that addition of sewage compost to this sandy soil reduced penetration resistance when compared with control and amended soils. Also it reduced the bulk density of the sandy soil and increased soil water retention. Tester (1990) observed that the addition of sewage sludge compost, significantly reduced soil strength. Organic amendments such as manure or sewage-sludge composts add nutrients and increase available water capacity (Tester, 1990; Bauer and Black, 1992). Increases in SOC can be achieved by adding organic matter (as manure, plant residues or sewage sludge) to the soil and positive effects of organic amendments on WHC have been reported by Khaleel et al. (1981) and Haynes and Naidu (1998). 2.4.3 Modes of application of organic amendments There are three modes for application of organic amendments into the soil, namely incorporation into the top soil, mulching and layering. Tillage can be used to incorporate organic amendments into the soil to any required depth (Lenz and Eisenbeis, 2000; Berkelmans et al., 2003). In practice organic amendments are added to the soil surface and then incorporated by plowing under. All organic amendments are applied by Please purchase PDFcamp Printer on http://www.verypdf.com/ to remove this watermark. this method. However, some organic amendments, particularly, crop residues are placed on the top of soil surface as a mulch. Recently some organic amendments were applied as layers at different depths. These did not decompose easily and remained forming a relatively less permeable layer for about 10 years (Egerzegi, 1964). These layers decreased the water movement downwards. Egerzegi (1964) investigated the impact of one or more layers of manure or compost in the soil at least 1 cm thick at depths ranging from 38 to 75 cm. He recommended the use of farmyard manure layers enriched with mineral colloids (clay) or compost (Egerzegi, 1958). A carpet-like layer at a depth of 60 cm can be formed by spreading at least 65 t/ha of farmyard manure, which will ensure a thickness of one centimeter at least, in order to improve the biological, chemical and physical properties of the sand profile (Egerzegi, 1959). 2.5 Use and management of sandy soils There is need to cultivate the widely spread sandy soils to maintain food security for the exponentially increasing population especially in developing countries. This increase in population created interest in utilizing soils of low or marginal productivity, i.e. sandy soils for crop production to match the demand for agricultural products (Cecil, 1990). As stated by Ismail and Ozawa (2006) cultivating sandy soil is a promising solution to overcome the fight against hunger especially in the developing countries. Agricultural development of sandy soils requires their appropriate management. Soil fertility management is a key issue for sustaining agricultural production in these sandy soils. This necessitates increasing the organic matter content of the soil because it can act as a good source of nitrogen, phosphorus and sulphate. Furthermore, crop yield in these soils is limited by low water-holding Please purchase PDFcamp Printer on http://www.verypdf.com/ to remove this watermark. capacity, high permeability, and low cation exchange capacity (CEC). High agronomic production in such soils requires large inputs of irrigation water and fertilizer, much of which is lost by rapid percolation. Due to the improvement of irrigation techniques, sandy lands are no longer considered as poor lands. Yet, the inherited shortcomings of low water-retention capacity have still made them incomparable with conventional good lands. The organic materials can improve the physical properties of sandy soils (Asker et al., 1994) such as soil porosity, infiltration and soil water retention. In addition it can increase the productivity through providing the essential plant nutrients (Fresquez et al., 1990). Please purchase PDFcamp Printer on http://www.verypdf.com/ to remove this watermark. CHAPTER THREE MATERIALS AND METHODS 3.1 Site of the experiment A field experiment was conducted at El-Rawakeeb Desertification Research Station Farm that belongs to the Desertification Research Institute, National Research Center, to determine the impact of layers of three organic amendments on infiltration rate and moisture distribution in a sandy soil. El-Rawakeeb dry land region occupies the area south west Omdurman, some 35-40 km west the River Nile. It lies between latitudes 15° 2`, 15° 36`N and longitudes 32° 0` – 32° 10`E with an altitude of 420 m above mean sea level (El-Hag et al., 1994). Climate According to Walsh (1991), El-Rawakeeb lies in a tropical semi-arid region, which is characterized by a short rainy season (July-October) and high evaporation potential. The relative humidity values are low and thus indicate the general aridity of the area. Air temperature fluctuates and shows a marked rise (47°C) in May and drops in August due to incidence of the rain. The average soil temperature is 40°C (El-Hag et al., 1994) Water resources The water resources are underground water from boreholes and rainfall water. Please purchase PDFcamp Printer on http://www.verypdf.com/ to remove this watermark. 3.2 Materials 3.2.1 Soil In general, El-Rawakeeb soil is sandy, alkaline, and very poor in nitrogen moderate in its bicarbonate and potassium content and rich in its sodium, calcium and chloride contents. According to soil taxonomy (USDA, 1975) the soil was classified as mixed, koalintic, isohyper thermic, gypsic Typic Camborthid (El-Hag et al., 1994). The strong windstorms resulted in sand dune formation that are scattered all over the west part of the project. A soil profile was dug in the experimental area and described as follows: Location: El-Rawakeeb (West Omdurman) Soil Climate: Aridic Topography: Flat Land form: Plain Slop: 0.3-0.7% Land use: Agriculture Wind erosion (strong). Soil depth (cm) Description 0 – 15 Yellowish red 5YR 5/8, none mottles, sand, massive structure, no rocks, nil calcareous, no roots, HCL reaction is zero, abrupt smooth boundary. Please purchase PDFcamp Printer on http://www.verypdf.com/ to remove this watermark. 15 – 40 Yellowish red 5YR 5/8, none mottles, sand, massive structure, none rocks, nil calcareous, no roots, HCL reaction is slight, abrupt smooth boundary. 40 – 53 Yellowish red 5YR 5/8, none mottles, sandy loam, week medium sub angular blocky structure, non-sticky and slightly plastic, slightly hard in dry and very friable in moist, none rocks, nil calcareous, no roots, HCL reaction is slight, gradual wavy boundary. 53 – 92 Clark Yellowish brown 10YR 3/4, none mottles, sandy clay loam, week fine sub angular blocky structure, non-sticky and slightly plastic, slightly hard in dry and very friable in moist, none rocks, nil calcareous, no roots, HCL reaction is slight, gradual wavy boundary. 92 – 166 Clark Yellowish brown 10YR 3/4, none mottles, sandy clay loam, moderate medium sub angular blocky structure, non-sticky and slightly plastic, very hard in dry and firm in moist, none rocks, nil calcareous, no roots, HCL reaction is slight, gradual wavy boundary. 166 – 200 Yellowish brown 10YR 5/8, none mottles, massive structure, strongly calcareous, no roots, HCL reaction is strong. The soil physical and chemical characteristics of the different horizons are presented in Table 3.1. It is evident that the soil is a sandy loam soil, non-saline non-sodic and has very low organic matter. Please purchase PDFcamp Printer on http://www.verypdf.com/ to remove this watermark. Table 3.1 Chemical and physical properties of the soil profile in the experimental site pH ECe dSm-1 Ca+Mg meq/l Na meq/l SAR meq/l O.M % Clay % 0-15 7.10 0.40 1.60 1.60 1.80 0.43 25.90 3.90 70.15 15-40 6.90 0.40 0.80 1.40 2.20 0.01 21.2 3.90 74.91 40-53 6.60 2.20 6.00 2.54 1.40 0.43 16.4 3.90 79.68 53-92 6.00 1.20 3.60 1.86 1.40 0.01 37.9 3.90 58.25 92-166 6.90 0.50 1.10 1.41 1.90 0.27 37.85 13.43 48.72 166-200 7.30 0.40 1.00 1.04 1.50 0.01 37.85 3.90 Soil depth (cm) Silt % Sand % 58.25 3.2.2 Double- ring Infiltrometer A modified double-ring infiltrometer with a tank fitted with a float to maintain a constant head of water and a side manometer to give the centimeters of infiltrated water (Mustafa et al., 2012). The inside diameter of the outer and inner rings were 60 and 30 cm, respectively. 3.2.3 Organic Manures The goat yard manure was collected from animal production research Centre (Kuku), dry sewage sludge was collected from Soba and the Poultry waste from Silet Scheme. The properties of the organic manures are reported in Table 3.2 3.2.4 Water The quality of the tap water used is presented in Table 3.3 Please purchase PDFcamp Printer on http://www.verypdf.com/ to remove this watermark. Table 3.2 Chemical Analysis of the Manures Manure Chicken Manure Goat yard manure Dry Sewage pH 7.50 8.52 8.27 ECe dSm-1 3.13 2.54 2.44 Na+ meq/l Ca++ + Mg++ (meq/l) 2.20 3.10 0.20 0.32 0.72 0.90 SAR Ash % 5.50 5.17 0.30 O.C % 84.00 41.98 69.60 34.77 9.70 4.83 Table 3.3 Chemical Analysis of the water Water parameter Value pH 9.15 ECe (dS/m-1) 2.58 Na+ (meq/l) 2.30 Ca++ Mg++ (meq/l) 4.40 SAR 1.55 3.3 Methods 3.3.1 Experimental design The treatments consisted of three organic amendments, namely Goat yard manure (GYM), Chicken manure (CHM) and dry sewage sludge (DS), each was applied at 20 ton/fed. (1Fed. = 0.42 ha), and packed in 1 m x 1 m plots placed as a layer in three depths. The depths were: Surface, 15 cm and 30 cm. The experimental plots including a control were arranged in a randomized complete block design with 3 replicates. The site consisted of three blocks (19 m x 1 m), each having ten plots, leaving Please purchase PDFcamp Printer on http://www.verypdf.com/ to remove this watermark. 1 m space as a buffer. One plot in each block was left as a control and three plots for each organic amendment. 3.3.2 Manure application The soil of the plots was removed before manure application at the depths: 0, 15 and 30 cm. Nine Plots were dug 15 cm and other 9 plots were dug 30 cm. The soils were then packed to cover the manure layers. 3.3.3 Field Measurements 3.3.3.1 Determination of Infiltration Rate The infiltration tests were carried out using the modified double-ring infiltrometer. The soil surface remained undisturbed as the rings were partially driven into the soil, ensuring good contact between the walls of the ring and soil. The water tank was filled with water to the zero level in the manometer. The manometer (graduated plastic tube) adjunct to the side of the tank was used to monitor the amount of infiltrated water in centimeter. The initial time was recorded with a stop watch and recorded again after one centimeter of water infiltrated in the soil. This procedure was followed until the infiltration rate remained constant. The cumulative infiltration (I) was plotted as a function of the square root (t) of time for the ten treatments, and the constant rate of infiltration was scaled off (Michael, 1978; Raghunath, 2008; Reddy 2006). A quadratic relationship significantly fitted the relationship between I and √t. A scaled I was obtained using this quadratic relation for different times. A linear relationship passing through origin for I versus t gave the best fit for the data of all treatments. The slope of these linear plots gave the infiltration rate. Water of the same quality used for the weekly irrigations was used in the infiltrometer study. Please purchase PDFcamp Printer on http://www.verypdf.com/ to remove this watermark. 3.3.3.2 Irrigation After the end of the first infiltration test, each plot was irrigated weekly with 20 liters of waters. The total time of irrigation was 8 weeks. 3.3.3.3 Measurement of soil moisture content After each weekly irrigation soil moisture content was determined, gravimetrically, for the following three successive depths: 0-15, 15-30, 30-60 cm, after 2, 4 and 6 days. In each case soil samples were collected by an auger from these successive depths and placed in labeled Aluminum containers, weighed (Wm) and then dried in an oven at 105°C till a constant weight and the oven-dry weight (Wd) was then obtained. The percentage moisture content of the sample was calculated as follows: Moisture content (%) = Wm − Wd x100 Wd 3.3.4 Laboratory study 3.3.4.1 Soil sampling to Determine Soil Chemical Properties Soil Samples were taken from the soil horizons in the experimental site to determine its chemical and physical properties. 3.3.4.2 Chemical analysis of soil samples The following properties were determined in the soil samples according to the standard procedure of U.S salinity laboratory staff (USSL, 1954). Laboratory analytical methods were explained subsequently with each determination: Soil reaction (pH) was determined using pH-meter. Please purchase PDFcamp Printer on http://www.verypdf.com/ to remove this watermark. Electrical Conductivity of the saturation extract (ECe) of the soil samples was measured using ECe-meter. Calcium (Ca??) and Magnesium (Mg??) were determined by titration against EDTA according to a method described by Cheng and Bray (1951). Sodium (Na?) was determined by using flame photometer method. Sodium Adsorption Ratio (SAR) is calculated as follows from knowledge of the concentrations of soluble Ca??, Mg?? and Na+ in the soil saturation extract (USSL, 1954). SAR =Na?/ v ((Ca?? + Mg??)/2). 3.3.4.3 Water analysis: Water sample collected from the boreholes of study area were used to determine cations (Na, Ca and Mg), pH, EC and SAR according to (USSL, 1954). 3.5 Statistical analysis The data were analyzed using the statistical package SAS. Statistical analysis was carried out using (PROC GLM) general linear model procedures of SAS (SAS Institute, 2002). Please purchase PDFcamp Printer on http://www.verypdf.com/ to remove this watermark. CHAPTER FOUR RESULTS 4.1 Impact of organic amendments on Infiltration 4.1.1 Goat yard manure The cumulative infiltration values (I), for each replicate measurement, were plotted as function of the square root of time (√t) immediately after placement of the Goat yard manure (GYM) layers in the profile (initial) and then after 2, 4, 6 and 8 weeks, remembering that by the end of each week the plots were irrigated. The curves obtained for all treatments significantly (P <0.001) fitted a quadratic relationship (Table 4.1). Fig. 4.1 is an example of I versus √t relationship. These quadratic relationships were then used to calculate I for a series of times (t); and (I) was then plotted against (t). This was prompted by the fact that the total time of infiltration measurements varied among treatments. These I versus t relationships for all replicates significantly (p < 0.001) fitted a linear regression line that passes through origin: I = it (Table 4.2). Fig 4.2 is an example of I versus t of the scaled data. The slopes (i) of these linear relationships are the infiltration rates. Table 4.3 shows that the mean initial infiltration rate (IRi) for the control and all other treatments was higher than that measured after 8 weeks. It was 5.7, 3.1, 6.0, and 5.6 mm/min for the control (C), and for placement of GYM at the surface (Z0), at 15 cm (Z15) and at 30 cm (Z30), respectively. After eight weeks, IRi was 2.7 for C, and 2.0 for Z0, 2.5 for Z15 and 1.7 mm/min for Z30. It is evident that placement of GYM at the surface reduced IRi, but its placement in lower depths did not affect IRi. Please purchase PDFcamp Printer on http://www.verypdf.com/ to remove this watermark. Table 4.1 Parameters of the quadratic relationships between cumulative infiltration (I, cm) and square root of time (√t) as affected by depth of layering (Z) Goat yard manure and time of measurement (I = a (√t)2 + b) Block number Time B1 (week) A B2 r2 B A B B3 r2 A r2 B Control Initial 0.369 0.26 0.9980 0.712 -0.01 0.9980 0.607 -0.05 0.9990 2nd 0.503 -0.81 0.9950 0.624 -1.02 0.9940 0.488 -0.58 0.9930 4th 0.334 -0.47 0.9950 0.364 -0.32 0.9910 0.037 0.22 0.9970 6th 0.369 -0.53 0.9950 0.586 -0.66 0.9980 0.679 -0.83 0.9940 8th 0.354 -0.76 0.9910 0.328 -0.40 0.9920 0.388 -0.59 0.9960 Z = 0 cm Initial 0.280 0.39 0.9992 0.319 0.204 0.9994 0.332 -0.64 0.9906 2nd 0.375 -0.71 0.9934 0.559 -0.99 0.9967 0.641 -1.62 0.9951 4th 0.202 0.07 0.9989 0.267 0.46 0.9930 0.507 -1.15 0.9953 6 th 0.394 -1.22 0.9833 0.573 -0.73 0.9970 0.652 -0.85 0.9969 8th 0.199 -0.30 0.9997 0.379 -0.68 0.9949 0.332 -0.88 0.9892 Z = 15 cm Initial 0.556 0.07 0.9994 0.488 0.64 0.9998 0.654 -0.20 0.9978 2nd 0.469 -0.93 0.9933 0.319 -0.49 0.9973 0.239 0.08 0.9980 4th 0.118 1.90 0.9777 0.301 -0.84 0.9942 0.101 1.29 0.9925 6th 0.451 -0.49 0.9981 0.405 -0.77 0.9895 0.450 -0.67 0.9979 8th 0.314 -0.57 0.9929 0.296 -0.44 0.9930 0.325 -1.12 0.9887 Z = 30 cm Initial 0.561 -0.76 0.9953 0.644 -0.04 0.9997 0.655 -0.17 0.9994 2 nd 0.206 -0.25 0.9962 0.355 -0.63 0.9970 0.222 -0.24 0.9953 4th 0.216 0.77 0.9734 0.234 -0.18 0.9955 0.176 0.22 0.9868 6th 0.204 -0.05 0.9996 0.508 -0.57 0.9971 0.339 -0.22 0.9961 8th 0.170 -0.48 0.9936 0.267 -0.27 0.9967 0.323 -1.13 0.9888 Please purchase PDFcamp Printer on http://www.verypdf.com/ to remove this watermark. Cumulative infiltration (cm) 16 2 y = 0.2387x + 0.0747x 14 2 r = 0.998 12 10 8 6 4 2 0 0.00 2.00 4.00 6.00 8.00 10.00 Square root of time (min) Fig.4.1 Cumulative infiltration, measured by the end of the second week after onset of the experiment, as a function of the square of time for a plot in block 3 treated with Goat yard manure layer at 15 cm- depth Relative decomposition of GYM after eight weeks reduced IRi of C, Z0, Z15 and Z30 by 53, 35, 58 and 70%, respectively. During the early stages of decomposition the impact of GYM layering did not follow a consistent trend. Thus, it was decided to investigate the impact of placement of FYM layers on infiltration rate after eight weeks of placement. Table 4.4 shows after 8 weeks of placement of layers of GYM in the soil; the infiltration rate was, significantly, reduced by 55%. The main effect also shows placement of GYM at Z0, significantly, reduced IR; placement of GYM at Z15 and Z30 had no significant effect on IR. 4.1.2 Chicken manure The cumulative infiltration values (I), for each replicate measurement, were plotted as function of the square root of time (√t) immediately after placement of the chicken manure (CHM) layers in the profile (initial) and Please purchase PDFcamp Printer on http://www.verypdf.com/ to remove this watermark. Table 4.2 The linear regression lines that passes through origin between cumulative infiltration (I, cm) and time (t, min) as affected by depth (Z) of Goat yard manure layers and time of measurement (I = it), where (i) is the infiltration rate (m/min) Time (Week) B1 i r 2 Initial 2nd 4th 6th 8th 4.2 3.6 2.7 3.0 2.6 0.9974 0.9809 0.9908 0.9915 0.9806 Initial 2nd 4th 6th 8th 3.5 2.7 2.1 2.2 1.5 0.9935 0.9812 0.9995 0.9387 0.9836 Initial 2nd 4th 6th 8th 5.7 3.1 3.8 3.5 3.4 0.9999 0.9706 0.8737 0.9885 0.9861 Initial 2nd 4th 6th 8th 4.2 1.7 3.8 2.0 1.1 0.9840 0.9954 0.9516 0.9997 0.9659 Block number B2 I R2 Control 7.1 1.0000 4.5 0.9819 3.2 0.9974 4.6 0.9893 2.7 0.9932 Z = 0 cm 3.5 0.9982 3.9 0.9750 3.5 0.9903 4.2 0.9815 2.6 0.9724 Z = 15 cm 6.4 0.9900 2.5 0.9896 2.0 0.9728 2.7 0.9716 2.3 0.9892 Z = 30 cm 6.4 1.0000 2.6 0.9814 2.0 0.9971 4.0 0.9900 2.3 0.9956 B3 I r2 5.9 3.9 0.6 5.2 2.9 0.9999 0.9915 0.9667 0.9882 0.9843 2.3 3.6 3.2 4.8 2.0 0.9766 0.9325 0.9588 0.9827 0.9561 6.0 2.5 1.9 3.4 1.8 0.9988 0.9996 0.9560 0.9848 0.9329 6.1 1.8 2.1 3.0 1.8 0.9993 0.9944 0.9969 0.9981 0.9346 Scaled cumulative infiltration (cm) Please purchase PDFcamp Printer on http://www.verypdf.com/ to remove this watermark. 16.00 y = 0.2508x r2 = 0.9996 14.00 12.00 10.00 8.00 6.00 4.00 2.00 0.00 0 10 20 30 40 50 60 70 Time (min) Fig. 4.2 Scaled cumulative infiltration by the end of the second week after onset of the experiment, as a function of time for a plot in block 3 treated with Goat yard manure layer at 15 cm- depth then after 2, 4, 6 and 8 weeks, remembering that by the end of each week the plots were irrigated. The curves obtained for all treatments significantly (P <0.001) fitted a quadratic relationship (Table 4.5). Fig. 4.3 is an example of I versus √t relationship. These quadratic relationships were then used to calculate I for a series of times (t); and (I) was then plotted against (t). This was prompted by the fact that the total time of infiltration measurements varied among treatments. These I versus t relationships for all replicates significantly (p < 0.001) fitted a linear regression line that passes through origin: I = it (Table 4.6). Fig 4.4 is an example of I versus t of the scaled data. The slopes (i) of these linear relationships are the infiltration rates. Table 4.7 shows that the mean initial infiltration rate (IRi) for the control and all other treatments was higher than that measured after 8 weeks. Please purchase PDFcamp Printer on http://www.verypdf.com/ to remove this watermark. Table 4.3 Impact of Goat yard manure layers placed at different soil depths (Z) on infiltration rate (mm/min.) as affected by time of measurement Time (Week) B1 Initial 2nd 4th 6th 8th Mean 4.2 3.6 2.7 3 2.6 3.2 Initial 2nd 4th 6th 8th Mean 3.5 2.7 2.1 2.2 1.5 2.4 Initial 2nd 4th 6th 8th Mean 5.7 3.1 3.8 3.5 3.4 3.9 Initial 2nd 4th 6th 8th Mean 4.2 1.7 3.8 2.0 1.1 3.2 Block number B2 Control 7.1 4.5 3.2 4.6 2.7 4.4 Z = 0 cm 3.5 3.9 3.5 4.2 2.6 3.5 Z = 15 cm 6.4 2.5 2.0 2.7 2.3 3.2 Z = 30 cm 6.4 2.6 2.0 4.0 2.3 4.3 B3 Mean 5.9 3.9 0.6 5.2 2.9 3.7 5.7 4.0 2.2 4.3 2.7 3.8 2.3 3.6 3.2 4.8 2.0 3.2 3.1 3.4 2.9 3.7 2.0 3.0 6.0 2.5 1.9 3.4 1.8 3.1 6.0 2.7 2.6 3.2 2.5 3.4 6.1 1.8 2.1 3.0 1.8 3.8 5.6 2.0 2.6 3.0 1.7 3.8 Please purchase PDFcamp Printer on http://www.verypdf.com/ to remove this watermark. Table 4.4 Effect of layers of Goat yard manure, placed at different soil depths and time of measurement on the infiltration rate (mm/min) Time Control Surface 15 cm 30 cm Mean Goat yard manure Initial 5.7 3.1 6.0 5.6 5.1 a 8 weeks 2.7 2.0 2.5 1.7 2.3 b Mean 4.2 a 2.6 b 4.3 a 3.7 a Means followed by the same letter in the same row or column are not significantly different at the 5 % level by Duncan Multiple Range Test It was 5.7, 6.2, 5.5, and 6.0 mm/min for the control (C), and for placement of CHM at the surface (Z0), at 15 cm (Z15) and at 30 cm (Z30), respectively. After eight weeks, IRi was 2.7 for C, and 3.1 for Z0, 1.6 for Z15 and 2.1 mm/min for Z30. It is evident that, neither placement of CHM at the surface nor placement in lower depths has effect on IRi. Relative decomposition of CHM after eight weeks reduced IRi of C, Z0, Z15 and Z30 by 53, 50, 71 and 65%, respectively. During the early stages of decomposition the impact of CHM layering did not follow a consistent trend. Thus, it was decided to investigate the impact of placement of CHM layers on infiltration rate after eight weeks of placement. Table 4.8 shows after 8 weeks of placement of layers of CHM in the soil; the infiltration rate was, significantly, reduced by 59%. 4.1.3 Dry sewage sludge The cumulative infiltration values (I), for each replicate measurement, were plotted as function of the square root of time (√t) immediately after Please purchase PDFcamp Printer on http://www.verypdf.com/ to remove this watermark. Table 4.5 Parameters of the quadratic relationships between cumulative infiltration (I cm) and square root of time (√t) as affected by depth of layering (Z) chicken manure and time of measurement (I = a (√t) 2 + b) Block number Time (week) B1 A B2 2 B r A B3 2 B r A r2 B Control Initial 0.369 0.26 0.9980 0.712 -0.01 0.9980 0.607 -0.05 0.9990 2nd 0.503 -0.81 0.9950 0.624 -1.02 0.9940 0.488 -0.58 0.9930 4th 0.334 -0.47 0.9950 0.364 -0.32 0.9910 0.037 0.22 0.9970 6th 8th 0.369 0.354 -0.53 0.9950 -0.76 0.9910 0.679 0.388 Initial 0.56 -0.23 0.998 0.557 0.00 0.9990 0.586 -0.66 0.9980 0.328 -0.40 0.9920 Z = 0 cm 0.739 0.14 0.9990 nd 0.424 -0.56 0.9953 0.752 -1.05 0.9985 0.410 -0.02 0.9865 4 th 0.721 -1.00 0.9949 0.612 -1.22 0.9925 0.638 -1.19 0.9962 6th 0.969 -0.82 0.9988 0.640 -0.87 0.9963 0.525 -0.54 0.9971 8 0.392 -0.87 0.9954 0.481 -0.25 Z = 15 cm 0.9956 0.420 -1.18 0.9936 Initial 0.377 -0.11 0.9983 0.533 0.96 0.9972 0.601 -0.33 0.9987 2nd 0.241 -0.60 0.9939 0.314 -0.25 0.9931 0.440 -0.71 0.9973 4 0.170 -0.29 0.9960 0.073 1.52 0.9694 0.110 0.28 0.9904 6th 0.206 -0.14 0.9957 0.340 -0.39 0.9965 0.449 -0.84 0.9969 8 0.199 -0.65 0.9913 0.298 -0.53 Z = 30 cm 0.9944 0.278 -0.94 0.9796 Initial 0.788 -0.51 0.9989 0.711 -0.21 0.9989 0.506 -0.10 0.9987 2 0.443 -0.62 0.9976 0.409 -0.71 0.9957 0.307 -0.42 0.9937 4th 0.064 2.29 0.9689 0.275 -0.54 0.9987 0.061 0.29 0.9966 0.600 -1.18 0.9979 0.414 -0.86 0.9936 0.479 -0.90 0.9968 0.332 -0.49 0.9959 0.320 -0.65 0.9942 0.293 -0.78 0.9920 2 th th th nd th 6 8 th -0.83 0.9940 -0.59 0.9960 Please purchase PDFcamp Printer on http://www.verypdf.com/ to remove this watermark. Cumulative infiltration (cm) Chart Title 20 18 16 y = 0.4956x 2 - 1.2639x + 1.2599 14 R2 = 0.9984 12 10 8 6 4 2 0 0.00 1.00 2.00 3.00 4.00 5.00 6.00 7.00 8.00 Time (cm) Fig. 4.3 Cumulative infiltration, measured by the end of the second week after onset of the experiment, as a function of the square of time for a plot in block 3 treated with chicken manure layer at 15 cm- depth placement of the dry sewage sludge (DSS) layers in the profile (initial) and then after 2, 4, 6 and 8 weeks, remembering that by the end of each week the plots were irrigated. The curves obtained for all treatments significantly (P <0.001) fitted a quadratic relationship (Table 4.9). Fig. 4.5 is an example of I versus √t relationship. These quadratic relationships were then used to calculate I for a series of times (t); and (I) was then plotted against (t). This was prompted by the fact that the total time of infiltration measurements varied among treatments. These I versus t relationships for all replicates significantly (p < 0.001) fitted a linear regression line that passes through origin: I = it (Table 4.10). Fig 4.6 is an example of I versus t of the scaled data. The slopes (i) of these linear relationships are the infiltration rates. Please purchase PDFcamp Printer on http://www.verypdf.com/ to remove this watermark. Table 4.6 The linear regression lines that passes through origin between cumulative infiltration (I, cm) and time (t, min) as affected by depth (Z) of Chicken manure layers and time of measurement (I = it), where (i) is the infiltration rate (m/min) Time (Week) B1 A r2 Initial 2nd 4th 6th 8th 4.2 3.6 2.7 3.0 2.6 0.9974 0.9809 0.9908 0.9915 0.9806 Initial 2nd 4th 6th 8th 5.6 3.3 5.3 7.8 2.5 1.0000 0.9889 0.9837 0.9920 0.9609 Initial 2nd 4th 6th 8th 3.6 1.7 1.3 1.9 1.2 0.9995 0.9806 0.9889 0.9982 0.9494 Initial 2nd 4th 6th 8th 6.6 3.3 3.7 4.0 2.4 0.9945 0.9860 0.8114 0.9660 0.9820 Block number B2 A r2 Control 7.1 1.0000 4.5 0.9819 3.2 0.9974 4.6 0.9893 2.7 0.9932 Z = 0 cm 7.8 0.9990 5.6 0.9833 4.0 0.9682 4.6 0.9804 4.3 0.9980 Z = 15 cm 7.5 0.9836 2.7 0.9963 2.7 0.8264 2.7 0.9917 2.2 0.9835 Z = 30 cm 6.6 0.9990 3.0 0.9816 2.0 0.9833 2.7 0.9650 2.1 0.9700 B3 A r2 5.9 3.9 0.6 5.2 2.9 0.9999 0.9915 0.9667 0.9882 0.9843 5.1 4.1 4.3 4.2 2.5 0.9980 1.0000 0.9722 0.9926 0.9446 5.3 3.3 1.5 3.1 1.5 0.9970 0.9833 0.9856 0.9746 0.9358 4.8 2.4 0.9 3.2 1.8 0.9990 0.9890 0.9758 0.9690 0.9560 Please purchase PDFcamp Printer on http://www.verypdf.com/ to remove this watermark. Chart Title Scaled cumulative infiltration (cm) 20.00 15.00 y = 0.3246x R2 = 0.9833 10.00 5.00 0.00 0 10 20 30 40 50 60 -5.00 Time (min) Fig. 4.4 Scaled cumulative infiltration by the end of the second week after onset of the experiment, as a function of time for a plot in block 3 treated with chicken manure layer at 15 cm- depth Table 4.12 shows that the mean initial infiltration rate (IRi) for the control and all other treatments was higher than that measured after 8 weeks. It was 5.7, 6.5, 5.0, and 3.9 mm/min for the control (C), and for placement of DSS at the surface (Z0), at 15 cm (Z15) and at 30 cm (Z30), respectively. After eight weeks, IRi was 2.7 for C, and 3.4 for Z0, 2.6 for Z15 and 2.2 mm/min for Z30. It is evident that placement of DSS at 15 cm (Z15) and 30 cm (Z30) reduced IRi, but its placement at the surface (Z0) did not affect IRi. Relative decomposition of DSS after eight weeks reduced IRi of C, Z0, Z15 and Z30 by 53, 48, 48 and 44%, respectively. During the early stages of decomposition the impact of DSS layering did not follow a consistent trend. Thus, it was decided to investigate the impact of placement of DSS layers on infiltration rate after eight weeks of placement. Please purchase PDFcamp Printer on http://www.verypdf.com/ to remove this watermark. Table 4.7 Impact of chicken manure layers placed at different soil depths (Z) on infiltration rate (mm/min.) as affected by time of measurement Time (Week) B1 Initial 2nd 4th 6th 8th Mean 4.2 3.6 2.7 3 2.6 3.2 Initial 2nd 4th 6th 8th Mean 5.6 3.3 5.3 7.8 2.5 4.9 Initial 2nd 4th 6th 8th Mean 3.6 1.7 1.3 1.9 1.2 3.6 Initial 2nd 4th 6th 8th Mean 6.6 3.3 3.7 4.0 2.4 6.6 Block number B2 Control 7.1 4.5 3.2 4.6 2.7 4.4 Z = 0 cm 7.8 5.6 4.0 4.6 4.3 5.2 Z = 15 cm 7.5 2.7 2.7 2.7 2.2 7.5 Z = 30 cm 6.6 3.0 2.0 2.7 2.1 6.6 B3 Mean 5.9 3.9 0.6 5.2 2.9 3.7 5.7 4.0 2.2 4.3 2.7 3.8 5.1 4.1 4.3 4.2 2.5 4.0 6.2 4.3 4.5 5.6 3.1 4.7 5.3 3.3 1.5 3.1 1.5 5.3 5.5 2.6 1.8 2.6 1.6 5.4 4.8 2.4 0.9 3.2 1.8 4.8 6.0 2.9 2.2 3.3 2.1 6.0 Please purchase PDFcamp Printer on http://www.verypdf.com/ to remove this watermark. Table 4.8 Effect of layers of chicken manure, placed at different soil depths and time of measurement on the infiltration rate (mm/min) Time Control Surface 15 cm 30 cm Mean Chicken manure Initial 5.7 6.2 5.5 6.0 5.9a 8 weeks 2.7 3.1 1.6 2.1 2.4b Mean 4.2a 4.7a 3.5a 4.1a Means followed by the same letter in the same row or column are not significantly different at the 5 % level by Duncan Multiple Range Test Table 4.12 shows after 8 weeks of placement of layers of DSS in the soil; the infiltration rate was, significantly, reduced by 49%. The main effect also shows placement of DSS in lower depths at Z30 and Z15, significantly, reduced IR; placement of DSS at Z0 had no significant effect on IR. 4.2 Impact of organic amendments on field capacity 4.2.1 Goat yard manure Table 4.13 shows that placement of GYM on the surface gave significantly higher weighted-mean moisture content in the top 0-60 cm depth than at 15 cm (Z15), but it was not significantly different from the values obtained for the control and Z30. The increase was 34%. Furthermore, the weighted-mean moisture content in the top 0-60 cm Please purchase PDFcamp Printer on http://www.verypdf.com/ to remove this watermark. depth, after eight weeks of placement of GYM, was significantly higher than the initial value. GYM increased the weighted-mean moisture content by 98%. It is evident that the main effect of layering was not as high as the impact of the period allowed for decomposition. Table 4.9 Parameters of the quadratic relationships between cumulative infiltration (I, cm) and square root of time (√t) as affected by depth of layering (Z) dry sewage sludge and time of measurement (I = a (√t)2 + b) Time (week) Initial 2nd 4th 6th 8th Initial 2nd 4th 6th 8th B1 A 0.369 0.503 0.334 0.369 0.354 0.388 0.321 0.306 0.324 0.346 B r2 0.26 -0.81 -0.47 -0.53 -0.76 0.9980 0.9950 0.9950 0.9950 0.9910 0.46 -0.22 -0.37 -0.24 -0.77 0.9990 0.9940 0.9940 0.9980 0.9970 Initial 2nd 4th 6th 8th 0.471 0.274 0.102 0.176 0.328 0.07 -0.22 0.43 0.13 -0.68 0.9970 0.9960 0.9970 0.9990 0.9800 Initial 2nd 4th 6th 8th 0.157 0.090 0.082 0.106 0.153 0.39 0.03 0.12 -0.02 -0.32 0.9990 0.9950 0.9970 0.9990 0.9910 Block number B2 B3 A B r2 A B r2 Control 0.712 -0.01 0.9980 0.607 -0.05 0.9990 0.624 -1.02 0.9940 0.488 -0.58 0.9930 0.364 -0.32 0.9910 0.037 0.22 0.9970 0.586 -0.66 0.9980 0.679 -0.83 0.9940 0.328 -0.40 0.9920 0.388 -0.59 0.9960 Z = 0 cm 0.793 -0.49 0.9970 0.707 0.28 0.9970 0.505 -0.34 0.9980 0.508 -0.19 0.9980 0.367 -0.52 0.9970 0.236 0.74 0.9980 0.524 -0.87 0.9980 0.640 -0.84 0.9970 0.464 -0.72 0.9960 0.604 -0.99 0.9970 Z = 15 cm 0.560 -0.23 0.9980 0.488 0.14 0.9980 0.466 -0.66 0.9960 0.391 -0.18 0.9970 0.413 -0.62 0.9930 0.257 -0.15 0.9970 0.561 -0.83 0.9960 0.680 -0.95 0.9950 0.289 -0.33 0.9960 0.375 -0.64 0.9830 Z = 30 cm 0.426 -0.10 0.9980 0.607 -0.25 0.9980 0.292 -0.31 0.9910 1.369 -2.32 0.9980 0.127 0.29 0.9950 0.237 0.44 0.9870 0.283 -0.43 0.9960 0.297 -0.03 0.9990 0.253 -0.16 0.9850 0.448 -1.02 0.9940 Please purchase PDFcamp Printer on http://www.verypdf.com/ to remove this watermark. Cumulative infiltration (cm) 14 12 y = 0.3359x 2 - 0.1795x R2 = 0.997 10 8 6 4 2 0 0.00 1.00 2.00 3.00 4.00 5.00 6.00 7.00 Square root of time (min) Fig. 4.5 Cumulative infiltration, measured by the end of the second week after onset of the experiment, as a function of the square of time for a plot in block 3 treated with dry sewage sludge layer at 15 cm- depth 4.2.1 Chicken manure Table 4.14 shows that placement of CHM on different depths (Z0, Z15 and Z30) were not significantly different for weighted-mean moisture content in the top 0-60 cm depth. But, the weighted-mean moisture content in the top 0-60 cm depth, after eight weeks of placement of CHM, was significantly higher than the initial value. CHM increased the weightedmean moisture content by 68%. It is evident that the main effect of layering was not as high as the impact of the period allowed for decomposition. Please purchase PDFcamp Printer on http://www.verypdf.com/ to remove this watermark. Table 4.10 The linear regression lines that passes through origin between cumulative infiltration (I, cm) and time (t, min) as affected by depth (Z) of Dry sewage sludge layers and time of measurement (I = it), where (i) is the infiltration rate (m/min) Time (Week) B1 A r 2 Initial 2nd 4th 6th 8th 4.2 3.6 2.7 3 2.6 0.9974 0.9809 0.9908 0.9915 0.9806 Initial 2nd 4th 6th 8th 4.9 2.9 2.5 2.9 2.4 0.9920 0.9980 0.9930 0.9970 0.9740 Initial 2nd 4th 6th 8th 4.8 2.5 1.7 4.3 2.5 0.9990 0.9980 0.9720 0.9880 0.9860 Initial 2nd 4th 6th 8th 2.1 0.9 1.0 1.0 1.1 0.9880 0.9990 0.9960 0.9990 0.9780 Block number B2 A r2 Control 7.1 1.0000 4.5 0.9819 3.2 0.9974 4.6 0.9893 2.7 0.9932 Z = 0 cm 6.8 4.4 2.9 3.7 3.5 Z = 15 cm 5.1 3.7 3.2 4.2 2.4 Z = 30 cm 4.1 2.5 1.7 2.2 2.3 B3 A r2 5.9 3.9 0.6 5.2 2.9 0.9999 0.9915 0.9667 0.9882 0.9843 0.9950 0.9970 0.9900 0.9770 0.9850 7.8 4.7 3.7 4.8 4.3 0.9980 0.9990 0.9730 0.9830 0.9770 0.9980 0.9900 0.9870 0.9840 0.9920 5.2 3.6 2.3 4.9 2.8 0.9990 0.9980 0.9980 0.9790 0.9850 0.9990 0.9950 0.9910 0.9870 0.9980 5.5 8.4 3.1 2.9 3.1 0.9980 0.9500 0.9920 0.9990 0.9730 Please purchase PDFcamp Printer on http://www.verypdf.com/ to remove this watermark. Scaled cumulative infiltration (cm) 18.00 16.00 y = 0.3585x R2 = 0.9988 14.00 12.00 10.00 8.00 6.00 4.00 2.00 0.00 0 5 10 15 20 25 30 35 40 45 Time (min) Fig. 4.6 Scaled cumulative infiltration by the end of the second week after onset of the experiment, as a function of time for a plot in block 3 treated with dry sewage sludge layer at 15 cm- depth 4.2.1 Dry sewage sludge Table 4.15 shows that placement of DSS at 30 cm (Z30) gave significantly higher weighted-mean moisture content in the top 0-60 cm depth than at 15 cm and the control, but it was not significantly different from the values obtained for Z15. The increase was 25% over the control and 13% over DSS at 15 cm. Furthermore, the weighted-mean moisture content in the top 0-60 cm depth, after eight weeks of placement of DSS, was significantly higher than the initial value. DSS increased the weightedmean moisture content by 83%. It is evident that the main effect of layering was not as high as the impact of the period allowed for decomposition. Please purchase PDFcamp Printer on http://www.verypdf.com/ to remove this watermark. Table 4.11 Impact of dry sewage sludge layers placed at different soil depths (Z) on infiltration rate (mm/min.) as affected by time of measurement Time (Week) B1 Initial 2nd 4th 6th 8th Mean 4.2 3.6 2.7 3 2.6 3.2 Initial 2nd 4th 6th 8th Mean 4.9 2.9 2.5 2.9 2.4 3.1 Initial 2nd 4th 6th 8th Mean 4.8 2.5 1.7 4.3 2.5 3.2 Initial 2nd 4th 6th 8th Mean 2.1 0.9 1 1 1.1 1.2 Block number B2 Control 7.1 4.5 3.2 4.6 2.7 4.4 Z = 0 cm 6.8 4.4 2.9 3.7 3.5 4.3 Z = 15 cm 5.1 3.7 3.2 4.2 2.4 3.7 Z = 30 cm 4.1 2.5 1.7 2.2 2.3 2.6 B3 Mean 5.9 3.9 0.6 5.2 2.9 3.7 5.7 4.0 2.2 4.3 2.7 3.8 7.8 4.7 3.7 4.8 4.3 5.1 6.5 4.0 3.0 3.8 3.4 4.1 5.2 3.6 2.3 4.9 2.8 3.8 5.0 3.3 2.4 4.5 2.6 3.5 5.5 8.4 3.1 2.9 3.1 4.6 3.9 3.9 1.9 2.0 2.2 2.8 Please purchase PDFcamp Printer on http://www.verypdf.com/ to remove this watermark. Table 4.12 Effect of layers of dry sewage sludge, placed at different soil depths and time of measurement on the infiltration rate (mm/min) Time Control Surface 15 cm 30 cm Mean Dry sewage sludge Initial 5.7 6.5 5.0 3.9 5.3a 8 weeks 2.7 3.4 2.6 2.2 2.7b 4.2ab 5.0a 3.8bc 3.1c Mean Means followed by the same letter in the same row or column are not significantly different at the 5 % level by Duncan Multiple Range Test Table 4.13 Effect of layers of Goat yard manure, placed at different soil depths and time of measurement on weighted mean field capacity of the soil Time Control Surface 15 cm 30 cm Mean Goat yard manure Initial 5.5 6.9 5.4 4.9 5.7b 8 weeks 11.1 12.7 9.3 12.1 11.3a Mean 8.3ab 9.8a 7.3b 8.5ab Means followed by the same letter in the same row or column are not significantly different at the 5 % level by Duncan Multiple Range Test Please purchase PDFcamp Printer on http://www.verypdf.com/ to remove this watermark. Table 4.14 Effect of layers of chicken manure, placed at different soil depths and time of measurement on weighted mean field capacity of the soil Time Control Surface 15 cm 30 cm Mean Chicken manure Initial 5.5 7.2 5.9 9.1 6.9b 8 weeks 11.1 12.2 12.6 10.5 11.6a Mean 8.3a 9.7a 9.3a 9.8a Means followed by the same letter in the same row or column are not significantly different at the 5 % level by Duncan Multiple Range Test Table 4.15 Effect of layers of farm yard manure, placed at different soil depths and time of measurement on weighted mean field capacity of the soil Time Control Surface 15 cm 30 cm Mean Dry sewage sludge Initial 5.5 6.8 6.1 7.8 6.6b 8 weeks 11.1 12.0 12.3 13.0 12.1a Mean 8.3c 9.4ab 9.2bc 10.4a Means followed by the same letter in the same row or column are not significantly different at the 5 % level by Duncan Multiple Range Test 4.3 Impact of organic amendments on soil moisture distribution 4.3.1 Goat yard manure Table 4.16 shows the soil moisture distribution within the drying cycle after eight weeks of the commencement of the experiment. For each replicate treatment only three measurements were made after 2, 4 and 6 days, because the plots were irrigated every week. The moisture content Please purchase PDFcamp Printer on http://www.verypdf.com/ to remove this watermark. redistribution versus soil depth gave highly significant quadratic relationships. Fig. 4.7 shows the impact of treatments on the redistribution of the soil moisture content at 30 cm in the drying cycle after eight weeks. Table 4.16 Effect of layers of Goat yard manure placed at different soil depths on gravimetric soil moisture content (M %) as a function of soil depth (D, cm) during the irrigation cycle after 8 weeks from the commencement of the experiment (M% =aD2+bD+c) Days after irrigation A B C R2 Control 2 -0.0025 0.1631 9.12 4 -0.0041 0.2627 5.46 6 0.0012 0.0360 7.26 GYM 0 2 0.0002 0.0462 11.4 4 -0.0049 0.3276 5.52 6 -0.0024 0.1778 6.70 GYM 15 2 -0.0100 0.4671 7.86 4 0.0011 0.1147 5.68 6 0.0002 0.1529 4.34 GYM 30 2 -0.0051 0.2729 9.74 4 -0.0020 0.1538 7.36 6 -0.0014 0.0960 7.26 *M30= calculated gravimetric moisture content at 30 cm M30* 1 1 1 11.8 9.7 9.4 1 1 1 12.6 10.9 9.9 1 1 1 12.9 10.1 9.1 1 1 1 13.3 10.2 8.9 Moisture content (g/g %) Please purchase PDFcamp Printer on http://www.verypdf.com/ to remove this watermark. 14 Z30 13 Z15 Z0 c 12 11 10 9 8 0 2 4 6 8 Time (days) Fig. 4.7 Redistribution of gravimetric moisture content at 30 cm after eight weeks of the start of the experiment (GYM) 4.3.1 Chicken manure Table 4.17 shows the soil moisture distribution within the drying cycle after eight weeks of the commencement of the experiment. For each replicate treatment only three measurements were made after 2, 4 and 6 days, because the plots were irrigated every week. The moisture content redistribution versus soil depth gave highly significant quadratic relationships. Fig. 4.8 shows the impact of treatments on the redistribution of the soil moisture content at 30 cm in the drying cycle after eight weeks. 4.3.1 Dry sewage sludge Table 4.18 shows the soil moisture distribution within the drying cycle after eight weeks of the commencement of the experiment. For each replicate treatment only three measurements were made after 2, 4 and 6 days, because the plots were irrigated every week. The moisture content Please purchase PDFcamp Printer on http://www.verypdf.com/ to remove this watermark. redistribution versus soil depth gave highly significant quadratic relationships. Table 4.17 Effect of layers of chicken manure placed at different soil depths on gravimetric soil moisture content (Y) as a function of soil depth (X) during of an irrigation cycle after 8 weeks from the commencement of the experiment (Y=aX2+bX+c) Days after irrigation A B C R2 Control 2 -0.0025 0.1631 9.12 4 -0.0041 0.2627 5.46 6 0.0012 0.0360 7.26 CHM 0 2 0.0002 0.0902 9.31 4 0.0049 0.1603 8.43 6 -0.0009 0.0911 6.73 CHM 15 2 0.0017 - 0.032 11.65 4 -0.0019 0.2581 4.97 6 -0.0072 0.524 2.67 CHM 30 2 -0.0016 0.0191 11.71 4 0.0003 0.0212 7.76 6 -0.0008 0.0887 5.45 *M30= calculated gravimetric moisture content at 30 cm M30* 1 1 1 11.8 9.7 9.4 1 1 1 12.2 8.0 8.6 1 1 1 12.2 11.0 11.9 1 1 1 10.8 8.7 7.4 Please purchase PDFcamp Printer on http://www.verypdf.com/ to remove this watermark. Moisture content (g/g %) 14 12 Z15 C Z0 Z30 10 8 6 4 2 0 0 1 2 3 4 5 6 7 Tim e (days) Fig. 4.8 Redistribution of gravimetric moisture content at 30 cm after eight weeks of the start of the experiment (CHM) Table 4.18 Effect of layers of dry sewage sludge placed at different soil depths on gravimetric soil moisture content (Y) as a function of soil depth (X) during of an irrigation cycle after 8 weeks from the commencement of the experiment (Y=aX2+bX+c) Days after irrigation A B 2 4 6 -0.0025 -0.0041 0.0012 2 4 6 0.0032 0.0007 -0.0046 2 4 6 -0.0014 0.0062 0.0025 2 4 6 -0.0003 0.0005 0.0027 R2 C Control 0.1631 0.2627 0.0360 DSS 0 -0.0604 0.057 0.3031 DSS 15 0.1332 -0.1744 0.0114 DSS 30 0.0422 0.0258 -0.0729 9.12 5.46 7.26 1 1 1 11.8 9.7 9.4 10.07 7.33 5.95 1 1 1 11.1 9.6 10.9 9.88 9.03 6.04 1 1 1 12.6 9.4 8.6 12.03 9.65 9.29 1 1 1 13.0 10.9 9.5 *M30= calculated gravimetric moisture content at 30 cm M30* Please purchase PDFcamp Printer on http://www.verypdf.com/ to remove this watermark. Fig. 4.9 shows the impact of treatments on the redistribution of the soil moisture content at 30 cm in the drying cycle after eight weeks. Moisture content (g/g %) 14 Z30 Z15 C 12 Z30 10 8 6 4 2 0 0 2 4 6 8 Tim e (days) Fig. 4.9 Redistribution of gravimetric moisture content at 30 cm after eight weeks of the start of the experiment (DSS) Please purchase PDFcamp Printer on http://www.verypdf.com/ to remove this watermark. CHAPTER FIVE GENERAL DISCUSSION AND CONCLUSIONS 5.1 Impact of organic amendments on infiltration rate Cumulative infiltration (I) versus square root of time (√t), for each replicate measurement, showed a significantly (P = 0.001) positive quadratic relationship for the three organic amendments and the four times of measurements. In spite of the variation of the total time of measurements among the various treatments, the fit was significantly (r2 = 0.983-0.999) consistent showing that treatments did not vary the nature of the process. The coefficients of determinations indicate that at least 98% of the variation of I is due to √t. These quadratic equations were used for scaling of cumulative infiltration using one series of times ranging between zero and one hour, i.e. within the average range of times of infiltration measurements for all treatments. For all treatments' replicates I versus t showed a highly significant (P = 0.001) linear regression relationship that passed through the origin, in which case the slope gave the infiltration rate. This linear regression line does not indicate the presence of a constant rate stage characteristic of the infiltration rate versus time relationship, under shallow ponding, of medium to fine–textured soils. In general, these soils depict an initial high infiltration rate, especially if the soil is dry and then it decreases exponentially with time till it reaches a constant rate referred to as the steady-state rate. This behavior is attributed to the gradual decrease of the water potential gradient and soil hydraulic conductivity due to decrease of the pore sizes by soil dispersion, clay migration and swelling that reduce the proportion of macro-pores in the soil (Hillel, 1980). However, in the Please purchase PDFcamp Printer on http://www.verypdf.com/ to remove this watermark. case of sandy soils this gradual decline in the infiltration rate is least (Brady and Weil, 2008), because the soil is relatively stable and not liable to physical deterioration and the water potential gradient does not decrease markedly with progress of time. Thus, I versus t relationships did not depict a steady-state rate because the soil is coarse-textured and the total times of measurements were not large enough. Excepting few cases, the infiltration rate decreased with progress of time of measurement of infiltration. However for all treatments, infiltration rate was highest at the beginning (initial) and lowest after eight weeks from the commencement of the experiment. The inconsistency in the trend appeared in the mid periods and was attributed to the relatively incomplete decomposition of the organic amendments. Thus, it was decided to investigate the impact of time of measurement and organic amendments on infiltration rate after eight weeks in comparison to the initial measurement; the data was subjected to statistical analysis (ANOVA). Considering the main effect of time, ANOVA showed that the infiltration rate after eight weeks was significantly lower than the initial infiltration rate measured immediately on the start of the experiment. In general, placement of goat yard manure, chicken manure and dry sewage for eight weeks reduced the initial infiltration rate by 55, 59 and 49, respectively. This significant effect may be attributed to decomposition of the organic amendments that reduced the relative proportion of the macro-pores of the treated layers and also due to increase of moisture content in the soil profile. Previous studies showed that the initial infiltration rate decresed with increase in the initial moisture content (Hillel, 1980; Lili et al., Please purchase PDFcamp Printer on http://www.verypdf.com/ to remove this watermark. 2008). So with progress of time the soil moisture content increased, particularly in the treated layers. As regards the impact of layering, placement of each of the three organic amendments at any depth reduced the infiltration rate. For goat yard manure (GYM) the decreases were 35, 58 and 70% for Z0, Z15 and Z30, respectively. For chicken manure (CHM) the decreases in the infiltration rate caused by layering in the same sequence were 50, 71 and 65%, respectively. For dry sewage (DS) the decreases in the same sequence were 48, 48 and 44%, respectively. After eight weeks even the control plots reduced the infiltration rate by 53%. However, in view of the high variation in the replicate measurements of the infiltration rate these results will not be relied upon because the interaction between time of measurement and organic amendments was not significant. Ibrahim and Mustafa (2001) found that the coefficient of variation of infiltration rate measurements made on a Vertisol soil series at every 5-m interval along S-N and W-E transects, each 500 m long and intersecting in the middle ranged between 31-36%. They found that the number of measurements required for estimating infiltration rate within 10% of the correct value at the 5% probability level was 50. Nielsen et al. (1973) found that the CV of hydraulic conductivity measurement made at 30 cm depth was 110%. However, considering the main effects, the impact of layering was significant (P = 0.05) for goat yard manure and dry sewage but not significant for chicken manure. The main effect showed that placement of GYM at the surface significantly (P = 0.05) reduced the infiltration rate but placement at Z15 and Z30 had no significant effect. In general, surface layers control infiltration rates, so it seems that decomposition of GYM Please purchase PDFcamp Printer on http://www.verypdf.com/ to remove this watermark. reduced the macro-pores and significantly reduced the infiltration rate. Previous studies showed that the presence of a surface layer of low permeability, e.g. a crust markedly reduces the initial and steady-state infiltration rates. Layering of CHM had no significant effect. This may be attributed to its nature, which is coarser in texture in comparison to the other two manures. Placement of dry sewage at 30 cm gave an infiltration rate, which was significantly lower than its placement at the surface or 15 cm depth. Its placement at the surface had no significant effect. However, after eight weeks the infiltration rate of the control decreased by 53%. 5.2 Impact of organic amendments on field capacity Placement of organic amendment at the three depths for eight weeks increased the weighted mean field capacity (WMFC) of the top 60 cm soil depth. The main effect of the period of decomposition of the organic amendment was significant showing that GYM, CHM and DS increased the WMFC by 98, 68 and 83%, respectively. Placement of GYM on the surface gave significantly higher WMFC than its placement on Z15, but its value was not significant from that of the control or that at Z30. The impact of layering of CHM on WMFC was not significant. Layering of DS at any depth gave significantly higher WMFC than the control; and its placement at Z30 gave the highest WMFC. The increase in WMFC by layering of the organic amendments may be due to increase in adsorption capacity and decrease in mean pore-radius of the soil. Similar increase in water retention of sandy soils has earlier been reported by the addition of F.Y.M. (Bouyoucos, 1939; Das et al., 1966; Kumar et al., 1984) and sewage sludge (Gupta et al., 1977). Please purchase PDFcamp Printer on http://www.verypdf.com/ to remove this watermark. 5.3 Impact of organic amendments on soil moisture temporal distribution The general pattern of the temporal variation of the soil moisture distribution, in the top 30 cm, within an irrigation cycle was not affected by layering of organic amendment in the soil profile. As expected the soil moisture was highest in the day following irrigation and then it decreased according to a highly significant quadratic relationship with progress of time. The main effect showed that layering of GYM or DSS did not significantly affect the overall moisture content in the top 30 cm; whereas placement of CHM at 15 cm rendered significant higher moisture content in the top 30 cm than at 30 cm and surface application. The main effect of time showed that the moisture content at the day prior to irrigation was 9.3% for GYM or CHM and 9.6% for the DSS treatments. Please purchase PDFcamp Printer on http://www.verypdf.com/ to remove this watermark. REFERENCES Abdel Rahman, H.A., Dahab, M.H. and Mustafa, M.A. (1996). Impact of soil amendments on intermittent evaporation moisture distribution, and salt redistribution in saline-sodic clay soil columns. Journal of Soil Science. 161: 1-10. Abot, T.L., and Tucker, T.C. (1973). Persistence of manure phosphorous in calcareous soils. Soil Sci. Soc. Am. Proc. 37: 60-63. Asker, F.A., Marei, S. and El-Zaher, H. (1994). Sewage Sludge as natural conditioner for newly reclaimed soils. I. Effect on soil moisture retention characteristics and pore-size distribution. Egypt J. Soil Sci., 34: 67-77 ASTM (2003). D3385-03 standard test method for infiltration rate of soils in field using double-ring infiltrometer, Annual Book of ASTM Standards 04.08., Amer. Soc. Testing Materials, West Conshohocken, PA. Ayoub, A.T. (1998). Extent, severity and causative factors of land degradation in the Sudan. Journal of Arid Environments 38: 397409. Baraka, A.H.A., Hago, T.E.D.Sh.M. and Mustafa, M.A. (1999). Effects of irrigation regime and farm yard manure on yield and water use of lucerne (Medicago sativa L.) on a salt-affected clay soil. U. K. J. Agric. Sci. 7: 1-15. Barzegar, A.R., Yousefi, A. and Daryashenas, A. (2002). The effect of addition of different amounts and types of organic materials on soil physical properties and yield of wheat. Plant and Soil. 247: 295-301. Bauer, A. and Black, A.L. (1992). Organic carbon effects on available water capacity of three soils textural groups. Soil Sci. Soc. Am. J. 56: 248-254. Berkelmans, R., Ferris, H., Tenuta, M., Van Bruggen, A.H.C. (2003). Effects of long- term crop management on nematode trophic Please purchase PDFcamp Printer on http://www.verypdf.com/ to remove this watermark. levels other than plant feeders disappear after 1 year of disruptive soil management. Appl. Soil Ecol. 23: 223-235. Betson, R. (1964). What is watershed runoff? Journal of Geophysical Research. 69(8): 1541-1552. Bewick, M.W.M. (1980). Handbook of Organic Waste Conversion. New York Van No strand Reinhold. Bloem, A.A. and Laker, M.C. (1994). Criteria for adaptation of the design and management of center-pivot irrigation systems to the infiltrability of soils, Water SA, 20 (2): 127-132 Bodman, G.B. and Colman, E.A. (1944). Moisture and energy conditions during downward entry of water into soils. Soil Sci. Soc. Am. Proc. 8: 116-122. Bouwer, H. (1986). Intake rate: Cylinder Infiltrometer, In: Klute, (Ed), methods of soil analysis, A. ASA Monograph 9, ASA. Madison, W., 825-843 Bouyoucos, G.J. (1939). Effect of organic matter on the water holding capacity and wilting point of mineral soils. Soil Sci. 47: 377-83. Brady, N.C. and Weil, R.R. (2008). Nature and Properties of Soils. Courier/Kendallville, Pearson, Prentice Hall,pp964. Bray, R.H. (1954). A nutrient mobility concept of soil plant relationships. Soil Sci. 78: 9-22. Buursinck, J. (1971). Soils of Central Sudan. Utrecht N.V. Cecil, F.T. (1990). Organic Amendment Effects on Physical and Chemical Properties of a sandy soil. Soil Sci. Soc. Am. J. 54: 827-831. Charman, P.E.V. and Murphy, B.W. (1998). Soils, their properties and management (5th edn). Oxford University Press, Melbourne. Cheng, D.L. and Bray, R.H. (1951). Determination of Ca and Mg in soil and plant material. Soil Sci. 72: 449-459. Please purchase PDFcamp Printer on http://www.verypdf.com/ to remove this watermark. Danneberg, O.H., Storchschnabel, G. and Ullah, S.M. (1981). The analysis of nitrogen and humus in connection with a field test for the fertilization with straw and sewage sludge: In the influence of sewage sludge application on physical and biological properties of soils (Eds.) Catroux G,L, Hermite, P: and Suess, E, U.S.A. pp. 11-24. Darcy, H. (1856). "Les Fontaines Publique de la Ville de Dijon." Dalmont, Paris. Das, B., Panda, D. and Biswas, T.D. (1966). Effect of fertilizers and manures on some of the physical properties of alluvial sandy calcareous soil. Indian J. Agron. 11: 80-3. De Silva, S.H.S.A. and Cook, H.F. (2003). Soil physical conditions and physiological performance of cowpea following organic matter amelioration of any substrates. Communications in Soil Science and Plant Analysis 34: 1039-1058. Diana, G., Beni, C. and Marconi, S. (2008). Organic and Mineral Fertilization: Effects on Physical Characteristics and Boron Dynamic in an Agricultural Soil. Commun Soil Sci. Plant Anal. 39: 1332–1351. Droogers, P. and Bouma, J. (1996). Biodynamic vs. conventional farming effects on soil structure expressed by stimulated potential productivity. Soil Sci. Soc. Am. J. 60: 1554–1558. Dunne, T. and Leopold, L. (1978). Water in Environmental Planning, Freeman, San Francisco. Egerzegi, S. (1958). Creation and permanent maintenance of a deep fertile layer in loose sandy soil. Acta Agronomica, Academiae Scientiarum Hungaricae 7: 333-364. Egerzegi, S. (1959). Economical and lasting utilization of organic fertilizers in sand soils. Acta Agronomica, Academiae Scientiarum Hungaricae 9: 319-340. Egerzegi, S. (1964). Plant physiological principles of efficient sand amelioration. Agrokémia és Talajtan 13: 209-214. Please purchase PDFcamp Printer on http://www.verypdf.com/ to remove this watermark. El Tahir, B.A., Madibo, G.M., El Wakeel, A.S. and El Hag, F.M.A. (2004). Influence of Acacia senegal, Acacia seyal and Acacia tortilis on some properties of sandy soil in North Kordofan State, Sudan. U. of K. J. Agric. Sci., 12 (1): 127-141. El-Asswad, R.M, Said, A.O. and Mornag, M.T. (1993). Effect of olive oil cake on water holding capacity of sandy soils in Libya. J. Arid Environ. 24: 409-413. El-Hag, M., El.Hiraka, A., El-Hadi, S. and Saud, S. (1994). Characterization of El-Rawakeeb Soil. Annual Scientific Research published by Environment and National Resources Research Institute, Khartoum, Sudan. ENVCO (2009). Double Ring Infiltrometer Kit, http://www.envcoglobal.com/catalog/product/infiltrometer/doubl e-ring-infiltrometer-kit.html, accessed on 31/08/2011 Epstein, E., Taylor, J.M. and Channey, R.L. (1976). Effect of sewage sludge compost applied to soil on some physical and chemical properties. Journal of Environmental Quality 5: 422-426 Fadul, E.M. and Mustafa, M.A. (2011). The impact of irrigation frequency and farmyard manure on wheat productivity on saline soil in dongola and the northern state. Sudan. J. Des. Res. 3(1): 73-87. FAO (1975). Sandy Soils (Report of the FAO/UNDP seminar on reclamation and management of sandy soils in the Near east and North Africa, held in Nicosia, 3-8 December 1973). FAO Soils Bulletin 25. FAO, Rome, Italy, 245 pp. Flavel, T.C. and Murphy, D.V. (2006). Carbon and Nitrogen Mineralization rates after application of organic amendments to soil. J. Environ. Qual. 35: 183-193. Franzluebbers, A.J. (2002). Water infiltration and soil structure related to organic matter and its stratification with depth. Soil Til. Res. 66: 197-205. Please purchase PDFcamp Printer on http://www.verypdf.com/ to remove this watermark. Fresquez, P.R., Francis, R.E. and Dennis, G.L. (1990). Sewage sludge effects on soil and plant quality in a degraded semi-arid grass land. J. Environ. Qual. 19: 324-329. Gabir, A.M. (1984). The Effects of Irrigation Frequencies and Some Soil Amendments on Lucern Grown in a Saline-Sodic Clay Soil South of Khartoum Area. M.Sc. Thesis. U. of K., Shambat, Sudan. Gafaar, A.M., Salih, A.A., Luukkanen, O., Elfadl, M.A. and Kaarakka, V. (2006). Improving the traditional Acacia senegal-crop system in Sudan: the effect of tree density on water use, gum production and crop yields. Agroforestry Systems 66: 1-11. Garcia, C., Hernandez, T., Costa, F. and Ayuso, M. (1992). Evaluation of the Maturity of Municipal waste Compost using Simple Parameters. Common Soil Sci. Plant Anal. 23: 1501-1512. Gregory, J.H., Dukes, M.D., Miller, G.L. and Jones, P.H. (2005). Analysis of double-ring infiltration techniques and development of a simple automatic water delivery system, Applied Turf grass Science, doi: 10. 1094/ATS-2005-0531-01-MG. Gupta, B.L. and Gupta, A. (2008). Water Resources Systems and Management. Delhi-110006: Standard Publishers Distributers. Available at www.standardpublishers.com Gupta, S.C., Dowdy, R.H. and Larson, W.E. (1977). Hydraulic and thermal properties of a sandy soil as influenced by incorporation of sewage sludge. Soil Sci. Soc. Amer. J. 41: 601-605. Hafeez, A.A.R. (1974). Comparative changes in soil physical properties influenced by mixtures of manures from various domestic animals. Soil Sci. 118: 53-59. Hall, J.E. and Coker, E.G. (1979). Some effects of sewage sludge on soil physical conditions and plant growth : In the influence of sewage sludge application on physical and biological properties of soils. (Eds.) Catroux G,L, Hermite, D, and Suess, T, U.S.A. pp. 43-61. Haynes, R.J. and Naidu, R. (1998). Influence of lime, fertilizer and manure applications on soil organic matter content and soil Please purchase PDFcamp Printer on http://www.verypdf.com/ to remove this watermark. physical conditions: a review. Nutrient Cycling in Agroecosystems 51: 123-137. Henry, C. (2005). Compost use in forest land restoration.University of Washington, EPA: NO: EPA 832-R-05-004. Hileman, L.H. (1967). The fertilizer value of broiler litter. Univ. of Arkansas Agr. Exp. Sta. Report. Series. 158. Hillel, D. (1980). Applications of Soil Physics. Academic Press. New York, U.S.A. Ibrahim, A.A. and Mustafa, M.A. (2001). Spatial variation of infiltration rate and related soil properties in a central Gezira clay soil. University of Khartoum Journal of Agricultural Science 9(2): 168-182. ISSS Working Group R.B. (1998). World Reference Base for Soil Resources: Introduction (eds. J.A. Deckers, F.O. Nachtergaele & O.C. Spaargaren), First Ed. International Society of Soil Science (ISSS). ISRICFAO- ISSS-Acco. Leuven. Jiao, Y., Whalen, J.K. and Hendershot, W.H. (2006). No-tillage and manure applications increase aggregation and improve nutrient retention in a sandy-loam soil. Geoderma 134: 24-33. Kadry, L.T. (1973). Classification and distribution of sandy soils in the Near East region and their agricultural potentialities. FAO/UNDP Seminar on reclamation and management of sandy soils in the Near East and North Africa. FAO Rome. Kannan, P., Sarvanan, A., Krishnakumar, S. and Natrajan, S.K. (2005). Biological properties of soil as influenced by different organic manure. Res. J. Agric. Biol. Sci. 1: 181-183. Karouri, M.O.H. (1977). Ann. Report Soba Research Division, Ministry of Agric. Sudan. Kayuki, K.C. and Wortmann, C.S. (2001). Plant materials for soil fertility management in subhumid tropical areas. Agronomy Journal 93: 929- 935. Please purchase PDFcamp Printer on http://www.verypdf.com/ to remove this watermark. Kelleher, B.P., Leahy, J.J., Henihan, A.M., O’Dwyer, T.F., Sutton, D. and Leahy, M.J. (2002). Advances in poultry litter disposal technology – a review. Bioresource Technology. 83: 27-36. Khaleel, R., Reddy, K.R. and Overcrash, M.R. (1981). Changes in soil physics properties due to organic waste additions: A review. Journal of Environmental Quality 10: 133-141. Khatri, K.L. and Smith, R.J. (2005). Evaluation of methods for determining infiltration parameters from irrigation advance data, Irrigation and Drainage. 54: 467-482. Kononova, M.M. (1961). Soil organic matter. Pergamon Press, Oxford, UK. Kramer, P.J. (1983). Water Relations of Plants. Academic Press, Inc. California. 16 pp. Kumar, S., Malik, R.S. and Dahiya, I.S. (1985). Influence of Different Organic Wastes upon Water Retention, Transmission and Contact Characteristics of a Sandy Soil. Aust. J. Soil Res. 23: 131-6. Kumar, S., Malik, R.S., and Dahiya, I.S. (1984). Water retention, transmission and contact characteristics of Ludas sand as influenced by farmyard manure. Aust. J. Soil Res. 22: 253-9. Lal, R. and Shukla, M.K. (2004). Principles of Soil Physics. Marcel Dekker, New York, 716 pp. (Text Book). Leeper, G.W.(1964). Introduction to soil science Fourth edition, Chapter 14 page 188. London and new york: Cambridge University Press. Leeper, G.W and Uren, N.C. (1993). Soil science, an introduction (5th edn) Melbourne University Press, Melbourne. Lenz, R. and Eisenbeis, G. (2000). Short-term effects of different tillage in a sustain- able farming system on nematode community structure. Biol. Fertil. Soils 31: 237–244. Lili, M., Bralts, V.F., Yinghua, P., Han, L. and Tingwu, L. (2008). Methods for measuring soil infiltration: State of the art, Int J Agric and Biol Eng. 1(1): 22-30. Please purchase PDFcamp Printer on http://www.verypdf.com/ to remove this watermark. Loehr, R.C. (ed.) (1977). Land as a waste management alternative. Ann. Arbor, Sci. Pub. Inc. Luxmore, R.J., Spalding, B.P. and Munro, I.M. (1981). Areal variation and chemical modification of weathered shale infiltration characteristics. Soil Science Society American Journal 45: 687691. Magistad, O.C. and Christiansen, J.E. (1944). Saline soils, their nature and management. U.S. Dept. of Agric. Curricular 707. Marshall, T.J. (1959). Relations between water and soil. Commonwealth Bur. Soils, Commonwealth Agr. Bur., Farnham Royal, Tech Comun. 50: 70-74. Michael, A.M. (1978). Irrigation, Theory and Practice. Vikas Press Pvt. Ltd., New Delhi. Mohamed-Ahmed, B.A. (1988). Effect of Fertilization and Irrigation on Wheat (Triticum aestivum) Growth on Salt Affected Soils. M.Sc. Thesis, U. of K., Shambat, Sudan. Mtambanengwe, F. and Mapfumo, P. (2006). Effects of Organic Resource Quality on Soil Profile N Dynamics and Maize Yields on Sandy Soils in Zimbabwe. Plant and Soil 281: 173-191. Mubarak, A.R., Fattoma, A.M.R. and Afiah, S.A. (2008). Use of water hyacinth (Eichhornia crassipes) in amelioration of a sandy soil. Arab Universities Journal of Agricultural Sciences 16: 213-224. Mubarak, A.R., Omaima, E.R., Amal, A.A. and Nemat, E.H. (2009). Short-term studies on use of organic amendments for amelioration of a sandy soil. African Journal of Agricultural Research 4(7): 621-627. Mustafa, M.A. and Medani, G.H. (2003). Wind erodibility of soils from Khartoum State. U. of K. Agric. Sci. 11(2): 149-163. Mustafa, M.A. (2007). Desertification processes. Published by UNESCO Chair of Desertification Studies, Sudan, Khartoum University press.pp31-46. Please purchase PDFcamp Printer on http://www.verypdf.com/ to remove this watermark. Mustafa, M.A., Mahjoub, M.O. and Elbassir, O.I. (2012). Note on a double-ring infiltrometer with a water tank fitted with a float and a side manometer. Sudan Journal of Desertification Research 4(1): 143-148. N’Dayegamiye, A., and Angers, D.A. (1990). Effects of long term cattle manure application on physical and biological properties of a Neubois silty loam cropped to corn. Can. J. Soil Sci. 70: 259– 262. Nicholson, F.A., Chambers, B.J. and Smith, K.A. (1996). Nutrient composition of poultry manures in England and Wales. Bioresource Technology. 58: 279-284. Nielsen, D.R., Biggar, J.W. and Erh, K.T. (1973). Spatial variability of field-measured soil-water properties. Hilgardia 42: 215-259. Nour, F.M.H. (1988). The Effects of Different Nitrogen Sources and Soil Type on Growth and Yield of Wheat (Triticum aestivum). M.Sc. Thesis, U. of K., Shambat, Sudan. Oka, Y. (2009). Mechanisms of nematode suppression by organic amendments – a review. Appl. Soil Ecol. 44: 101–115. Perkins, H.F. and Parker, N.B. (1971). Chemical composition of broiler and hen manures. Georgia Agric. Exp. Sta. Res. Bull. 90. Peverill, K.I., Sparrow, L.A. and Reuter, D.J. (1999). 'Soil Analysis. An Interpretation Manual.' (CSIRO Publishing: Collingwood.) Raghunath, H.M. (2008). Hydrology Principles, Analysis and Design. 2nd Edn., New Age International Publishers, New Delhi, pp: 7083. Rahman, M.A., Chikushi, J., Saifizzaman, M. and Lauren, J.G. (2005). Rice straw mulching and nitrogen response of no-till wheat following rice in Bangladesh. Field Crops Res. 91: 71-81. Reddy, P.J.R. (2006). A Textbook of Hydrology. Laxmi Publications, New Delhi, pp: 250-267. Please purchase PDFcamp Printer on http://www.verypdf.com/ to remove this watermark. Rivers, E.D. and Shipp, R.B. (1971). Available water capacity of sandy and gravelly North Dakota soils. Soil Sci. 113: 74-80. Saleh, M.I. and Kiyoshi, O. (2006). Improvement of crop yield, soil moisture distribution and water use efficiency in sandy soils by clay application. Tenth International Water Technology Conference, (IWTC10), Alexandria, Egypt. Salter, P.J. and Haworth, F. (1961). The available water capacity of a sandy loam soil, the effect of the farm yard manure and difference primary cultivation. J. Soil Sci. 12: 335-342. Sanchez, P.A and Leakey, R.B.B. (1997). Land use transformation in Africa. Three determinants for balancing food security with natural resource utilization. Eur. J. Agron. 7: 15-23. SAS Institute. (2002). SAS User’s Guide: Statistics, SAS Institute Inc., Cary, NC, USA. Saxton, K.E., Saxton, W.L., Rosenberger, J.S. and Papendick, R.I. (1986). Estimating generalized soil water characteristics from texture. Soil Sci. Soc. Amer. J. 50: 1031-1036. Shipitalo, M.J., Dick, W.A. and Edwards, W.M. (2000). Conservation tillage and macro pore factors that affect water movement and the fate of chemicals. Soil Tillage Res. 53: 167:183. Sims, J.T. and Wolf, D.C. (1994). Poultry waste management: agricultural and environmental issues. Advances in Agronomy 52: 1-83. Singh, L., Verma, R.N.S. and Lohia, S.S. (1980). Effect of continuous application of FYM and chemical fertilizer on some soil properties. J. Ind. Soc. Soil Sci. 28: 170-172. Sivapalan, S. (2006). Benefits of treating a sandy soil with a cross-linked type polyacrylamide. Australian Journal of Experimental Agriculture. 46(4): 579-584. Stemmer, M., Lutzow, M., Kandeler, E., Pichlmayer, F. and Gerzabek, M.H. (1999). The effect of maize straw placement on Please purchase PDFcamp Printer on http://www.verypdf.com/ to remove this watermark. mineralization of C and N in soil particle size fraction. Eur. J. Soil Sci. 50: 73-85. Tejada, M., Hernández, M.T. and García, C. (2006). Application of two organic amendments on soil restoration: effects on the soil biological properties. Journal of Environmental Quality 35: 10101017. Tejada, M., Hernández, M.T. and García, C. (2007). Application of two organic wastes in a soil polluted by lead: Effects on the soil enzymatic activities. J. Environ. Qual. 36: 216-225. Tester, C.F. (1990). Organic amendments effect on physical and chemical properties of a sandy soil. J. Soil Sci. Amer. 54: 827-831. Thompson, L.M. and Troeh, F.R. (1973). Soils and Soil Fertility. New York: McGraw-Hill. 323 pp. Tsutsuki, K. and Kuwatsuki, S. (1990). Characterization of soil organic matter in particle size fractions obtained from different types of soils. Transactions 14th international congress of Soil sci., Kyoto, Japan. Unger, P.W. (1979). Effects of deep tillage and profile modification on soil properties, root growth and crop yield in the United States and Canada. Geoderma. 22: 275-295. USDA (1975). Soil taxonomy: a basic system of soil classification for making and interpreting soil surveys, Agricultural Handbook 436, Soil Conservation Service, USDA., Washington, D.C. USSL (United States Salinity Laboratory Staff) (1954). Diagnosis and improvement of saline and alkali soils. USDA handbook, 60, pp.160. Conference on Environment and Desertification, Rio de Janeiro. Vieira, S.R., Nielsen, D.R. and Bigger, J.W. (1981). Spatial variability of field measured infiltration rate. Soil Science Society American Journal 45: 1040-1048. Please purchase PDFcamp Printer on http://www.verypdf.com/ to remove this watermark. Walsh, D.J. (1991). Cited be: El-Tigani, M.Sc. (1993). Sudan national (case study) on drought and desertification. Intergovernment and Negotiation Committee for international conference to combat desertification (INCD) Khartoum, Sudan. Wanas, Sh.A., Omran, W.M. (2006). Advantages of Applying Various Compost Types to Different Layers of sandy soil: In: Hydrophysical properties. J. Applied Sci. Res. 2: 1298-1303. Warren, R.G. and Johnston, A.E. (1960). Report of Roth Amsted Experimental Station pp. 45-48. Cited in J. Soil Sci. 92:30. Warren, S.L. and Fonteno, W.C. (1993). Changes in physical and chemical properties of a loamy sand soil when amended with composted poultry litter. J. Environ. Hortic. 11: 186–190. Widmer, T.L., Mitkowski, N.A. and Abawi, G.S. (2002). Soil organic matter and the man- agement of plant-parasitic nematodes. J. Nematol. 24: 289–295. Williams, R.J.B. and Cooke, G.W. (1961). Some effects of FYM and grass residues on soil structure. Soil sci. 92: 30-38. Yousif, H.Y. (1980). Effect of manures and nitrogen on some vegetable production at Soba Research Station, Sudan. Ann. Reports of the Gezira Res. Corpor. 1980-1981 Zaongo, C.G.L., Wendt, C.W. and Hossner, L.R. (1994). Constraints of Sahelian Sandy Soils and Management Implications for Sustainable Rainfed Crop Production. J. Sust. Agric. 4: 47-78. Please purchase PDFcamp Printer on http://www.verypdf.com/ to remove this watermark. APPENDICES Please purchase PDFcamp Printer on http://www.verypdf.com/ to remove this watermark. Appendix I Cumulative infiltration (cm) Table 1 Impact of Goat yard manure layers placed at different soil depths (Z) on cumulative infiltration (cm) after one hour from onset of experiment as affected by time of measurement Time (Week) B1 Initial 2nd 4th 6th 8th Mean 24.1 23.9 16.4 18.1 15.4 19.6 Initial 2nd 4th 6th 8th Mean 19.8 17.1 12.7 14.2 9.6 14.7 Initial 2nd 4th 6th 8th Mean 33.9 21.0 21.8 23.3 14.4 22.9 Initial 2nd 4th 6th 8th Mean 27.8 10.5 18.9 11.9 6.5 15.1 Block number B2 Control 42.7 29.6 19.4 30.1 16.6 27.7 Z=0 20.7 25.9 19.6 28.8 17.5 22.5 Z = 15 cm 34.3 15.3 11.6 18.3 14.4 18.8 Z = 30 cm 38.4 16.4 12.7 26.1 13.9 21.5 B3 Mean 36 24.8 3.9 34.3 18.7 23.5 34.3 26.1 13.2 27.5 16.9 23.6 14.9 26.0 21.5 32.5 13.1 21.6 18.5 23.0 17.9 25.2 13.4 19.6 37.7 14.9 16.1 21.9 10.8 20.3 35.3 17.1 16.5 21.2 13.2 20.7 38.0 11.4 12.2 18.6 10.6 18.2 34.7 12.8 14.6 18.9 10.3 18.3 Please purchase PDFcamp Printer on http://www.verypdf.com/ to remove this watermark. Table 2 Impact of chicken manure layers placed at different soil depths (Z) on cumulative infiltration (cm) after one hour from onset of experiment as affected by time of measurement Time (Week) B1 Initial 2nd 4th 6th 8th Mean 24.1 23.9 16.4 18.1 15.4 19.6 Initial 2nd 4th 6th 8th Mean 33.5 21.1 35.6 51.8 16.8 31.8 Initial 2nd 4th 6th 8th Mean 21.8 9.8 8.0 11.3 6.9 11.6 Initial 2nd 4th 6th 8th Mean 43.3 21.8 21.6 26.9 16.1 25.9 Block number B2 Control 42.7 29.6 19.4 30.1 16.6 27.7 Z=0 45.4 37.0 27.3 31.7 27.0 33.7 Z = 15 cm 39.5 16.9 16.2 17.4 13.8 20.8 Z = 30 cm 41.1 19.1 12.4 18.2 14.2 21.0 B3 Mean 36 24.8 3.9 34.3 18.7 23.5 34.3 26.1 13.2 27.5 16.9 23.6 31.9 24.5 29.1 27.3 16.1 25.8 36.9 27.5 30.7 37.0 20.0 30.4 33.6 20.9 8.7 20.4 9.4 18.6 31.6 15.9 11.0 16.4 10.0 17.0 29.6 15.2 5.9 21.8 11.6 16.8 38.0 18.7 13.3 22.3 14.0 21.3 Please purchase PDFcamp Printer on http://www.verypdf.com/ to remove this watermark. Table 3 Impact of dry sewage sludge layers placed at different soil depths (Z) on cumulative infiltration (cm) after one hour from onset of experiment as affected by time of measurement Time (Week) B1 Initial 2nd 4th 6th 8th Mean 24.1 23.9 16.4 18.1 15.4 19.6 Initial 2nd 4th 6th 8th Mean 26.9 17.5 15.5 17.6 14.8 18.5 Initial 2nd 4th 6th 8th Mean 28.8 14.7 9.4 11.6 14.4 15.8 Initial 2nd 4th 6th 8th 12.5 5.7 5.9 6.2 6.7 Block number B2 Control 42.7 29.6 19.4 30.1 16.6 27.7 Z=0 43.9 27.7 18 24.7 22.3 27.3 Z = 15 cm 31.9 22.9 20.0 27.2 14.8 23.4 Z = 30 cm 24.8 15.1 9.9 13.7 13.9 B3 Mean 36 24.8 3.9 34.3 18.7 23.5 34.3 26.1 13.2 27.5 16.9 23.6 44.6 29.1 19.9 31.9 28.6 30.8 38.5 24.8 17.8 24.8 21.9 25.6 30.4 22.1 14.2 33.5 17.5 23.5 30.4 19.9 14.6 24.1 15.6 20.9 34.5 64.2 17.6 17.6 19.0 23.9 28.3 11.1 12.5 13.2 Please purchase PDFcamp Printer on http://www.verypdf.com/ to remove this watermark. Appendix II Table 4 Time Initial 8 weeks Surface Initial 8 weeks ϭϱ Đ ŵ Initial 8 weeks ϯϬ Đ ŵ Initial 8 weeks Surface Initial 8 weeks ϭϱ Đ ŵ Initial 8 weeks ϯϬ Đ ŵ Initial 8 weeks Surface Initial 8 weeks ϭϱ Đ ŵ Initial 8 weeks ϯϬ Đ ŵ Initial 8 weeks Effect of layering of Goat yard manure, chicken manure and dry sewage sludge and time of measurement on weighted mean field capacity of the soil ů ŽĐ Ŭ ϭ 5.3 10.9 ů ŽĐ Ŭ Ϯ ů ŽĐ Ŭ ϯ Control 6.1 5.1 10.0 12.3 Goat yard manure 7.2 13.7 7.1 13.3 6.4 11.1 5.4 9.0 5.1 7.0 5.6 11.9 6.0 11.1 4.8 3.8 12.4 12.7 Chicken manure 5.7 10.4 6.4 12.0 9.4 14.3 8.0 10.8 5.0 15.4 4.6 11.7 14.6 9.8 5.2 7.6 8.7 12.9 Dry sewage sludge 5.9 12.0 5.9 11.2 8.7 12.7 5.9 12.1 6.6 12.5 5.8 12.2 8.4 13.3 7.3 13.1 7.8 12.5 Mean Please purchase PDFcamp Printer on http://www.verypdf.com/ to remove this watermark. Appendix III Parameters of soil moisture content for three successive depths Moisture content (Initial) Treatment GzDΛϬĐ ŵ GzDΛϭϱĐ ŵ GzDΛϯϬĐ ŵ ,DΛϬĐ ŵ ,DΛϭϱĐ ŵ ,DΛϯϬĐ ŵ ^ ^ ΛϬĐ ŵ ^ ^ ΛϭϱĐ ŵ ^ ^ ΛϯϬĐ ŵ CONTROL Depth 0-15 15-30 30-60 0-15 15-30 30-60 0-15 15-30 30-60 0-15 15-30 30-60 0-15 15-30 30-60 0-15 15-30 30-60 0-15 15-30 30-60 0-15 15-30 30-60 0-15 15-30 30-60 0-15 15-30 30-60 Block 1 2day ϭϬ͘ Ϯ ϵ͘ ϳ ϰ͘ ϱ ϲ͘ ϳ ϴ͘ Ϭ ϯ͘ ϱ ϵ͘ ϳ ϴ͘ ϴ Ϯ͘ ϳ ϭϭ͘ ϲ ϱ͘ ϵ Ϯ͘ ϲ ϭϬ͘ ϱ ϵ͘ ϳ ϱ͘ ϵ ϲ͘ Ϭ ϭϴ͘ ϰ ϭϳ͘ Ϭ ϴ͘ ϱ ϵ͘ Ϭ ϯ͘ Ϭ ϴ͘ Ϯ ϴ͘ ϭ ϯ͘ ϳ ϭϮ͘ Ϯ ϭϬ͘ Ϭ ϱ͘ ϲ ϲ͘ ϳ ϲ͘ ϵ ϯ͘ ϴ Block 2 4day 6day ϲ͘ ϲ ϵ͘ ϯ ϱ͘ ϰ ϰ͘ ϴ ϲ͘ ϴ ϰ͘ ϴ ϳ͘ ϴ ϴ͘ ϱ ϯ͘ ϱ ϳ͘ ϯ ϱ͘ ϲ ϯ͘ ϵ ϳ͘ ϱ ϳ͘ ϱ ϯ͘ Ϯ ϱ͘ ϱ ϲ͘ ϴ ϯ͘ Ϭ ϳ͘ Ϭ ϵ͘ ϵ ϰ͘ ϱ ϱ͘ ϭ ϴ͘ ϳ ϯ͘ ϰ ϵ͘ ϯ ϳ͘ ϲ Ϯ͘ ϱ ϱ͘ ϴ ϱ͘ ϳ ϯ͘ Ϭ 2day 4day 6day ϵ͘ ϳ ϵ͘ ϭ ϵ͘ ϱ ϵ͘ ϵ ϰ͘ ϱ ϱ͘ ϴ ϲ͘ ϲ ϱ͘ ϯ ϴ͘ ϭ ϴ͘ ϵ Ϯ͘ ϴ ϱ͘ ϵ ϳ͘ ϯ ϲ͘ ϳ ϱ͘ ϰ ϳ͘ ϯ ϯ͘ Ϯ ϯ͘ ϯ ϲ͘ ϲ ϴ͘ ϱ ϳ͘ ϰ ϲ͘ ϭ ϱ͘ ϴ ϰ͘ ϳ ϳ͘ ϯ ϱ͘ ϵ ϱ͘ ϲ ϭ͘ ϵ ϯ͘ ϲ ϯ͘ Ϯ ϲ͘ ϰ ϱ͘ ϴ ϲ͘ ϰ ϲ͘ ϲ ϰ͘ Ϭ ϰ͘ ϱ ϱ͘ ϴ ϱ͘ Ϯ ϲ͘ Ϯ ϲ͘ Ϭ ϱ͘ ϳ ϰ͘ Ϭ ϳ͘ ϭ ϱ͘ ϳ ϳ͘ ϯ ϭϰ͘ Ϯ ϲ͘ Ϭ ϰ͘ Ϭ ϵ͘ Ϭ ϳ͘ ϰ ϵ͘ ϱ ϲ͘ ϲ ϱ͘ ϯ ϳ͘ ϳ ϳ͘ ϲ ϱ͘ ϰ ϵ͘ ϱ ϲ͘ ϯ ϯ͘ ϲ ϰ͘ ϱ Block 3 2day ϲ͘ ϰ ϲ͘ ϱ ϲ͘ ϯ ϲ͘ ϰ ϳ͘ ϳ ϰ͘ Ϯ ϳ͘ ϰ ϯ͘ ϴ Ϯ͘ Ϭ ϴ͘ ϳ ϳ͘ ϵ ϭϬ͘ ϰ ϱ͘ ϲ ϰ͘ ϲ ϰ͘ Ϭ ϴ͘ ϲ ϭϬ͘ ϭ ϱ͘ ϵ ϱ͘ ϰ ϲ͘ ϱ ϭϭ͘ ϰ ϲ͘ ϵ ϳ͘ ϰ ϰ͘ ϱ ϲ͘ ϯ ϳ͘ ϯ ϴ͘ ϴ ϱ͘ ϰ ϲ͘ ϲ ϰ͘ Ϯ 4day 6day ϱ͘ Ϭ ϲ͘ ϴ ϱ͘ ϰ ϰ͘ ϳ ϳ͘ ϱ ϳ͘ ϴ ϲ͘ ϰ ϴ͘ Ϭ ϯ͘ ϴ ϲ͘ Ϭ ϴ͘ Ϭ ϳ͘ ϵ ϯ͘ ϯ ϰ͘ ϴ Ϯ͘ ϯ ϳ͘ ϭ ϲ͘ ϲ ϰ͘ ϳ ϯ͘ ϱ ϱ͘ ϱ ϵ͘ ϭ ϰ͘ ϲ ϳ͘ ϵ ϲ͘ ϵ ϱ͘ ϲ ϲ͘ ϴ ϵ͘ ϱ ϯ͘ ϵ ϳ͘ Ϯ ϱ͘ Ϯ Please purchase PDFcamp Printer on http://www.verypdf.com/ to remove this watermark. Moisture content week 2 Treatment GzDΛϬĐ ŵ GzDΛϭϱĐ ŵ GzDΛϯϬĐ ŵ ,DΛϬĐ ŵ ,DΛϭϱĐ ŵ ,DΛϯϬĐ ŵ ^ ^ ΛϬĐ ŵ ^ ^ ΛϭϱĐ ŵ ^ ^ ΛϯϬĐ ŵ CONTROL Depth 0-15 15-30 30-60 0-15 15-30 30-60 0-15 15-30 30-60 0-15 15-30 30-60 0-15 15-30 30-60 0-15 15-30 30-60 0-15 15-30 30-60 0-15 15-30 30-60 0-15 15-30 30-60 0-15 15-30 30-60 Block 1 2day ϵ͘ ϯ ϵ͘ ϱ ϱ͘ ϱ ϴ͘ Ϭ ϭϬ͘ Ϯ ϳ͘ ϰ ϭϬ͘ ϰ ϵ͘ ϳ ϲ͘ Ϯ ϭϭ͘ ϭ ϳ͘ ϵ ϱ͘ ϱ ϭϬ͘ Ϭ ϭϬ͘ Ϯ ϰ͘ ϭ ϴ͘ ϯ ϵ͘ ϭ ϱ͘ ϱ ϴ͘ ϯ ϭϭ͘ Ϯ ϴ͘ Ϯ ϭϬ͘ ϲ ϭϬ͘ ϴ ϲ͘ ϰ ϭϭ͘ ϰ ϭϬ͘ ϳ ϲ͘ ϱ ϯ͘ ϳ ϳ͘ ϰ ϵ͘ ϰ 4day ϱ͘ Ϯ ϵ͘ ϲ ϱ͘ Ϭ ϰ͘ ϴ ϱ͘ ϭ ϱ͘ ϭ ϳ͘ ϵ ϵ͘ Ϯ ϭ͘ ϱ ϲ͘ ϯ ϲ͘ Ϭ ϱ͘ ϵ ϲ͘ ϰ ϳ͘ ϳ ϭ͘ ϲ ϯ͘ ϴ ϲ͘ ϯ ϯ͘ ϲ ϳ͘ Ϯ ϵ͘ ϲ ϰ͘ ϵ ϱ͘ ϵ ϴ͘ Ϭ ϯ͘ ϳ ϴ͘ ϵ ϳ͘ ϵ ϴ͘ ϵ ϱ͘ Ϯ ϱ͘ ϰ ϯ͘ ϯ Block 2 6day ϴ͘ ϭ ϭϭ͘ ϴ ϳ͘ ϵ ϱ͘ ϳ ϲ͘ ϭ ϰ͘ Ϯ ϲ͘ ϱ ϴ͘ ϵ ϱ͘ ϴ ϲ͘ ϴ ϳ͘ ϴ ϴ͘ ϰ ϲ͘ ϳ ϵ͘ ϳ ϰ͘ ϯ ϱ͘ ϱ ϳ͘ Ϭ ϱ͘ ϴ ϳ͘ Ϯ ϭϮ͘ ϲ ϲ͘ ϰ ϲ͘ ϲ ϭϭ͘ ϭ ϲ͘ Ϭ ϴ͘ ϲ ϭϬ͘ ϴ ϰ͘ ϱ ϰ͘ ϲ ϳ͘ ϴ ϱ͘ ϳ 2day ϵ͘ ϯ ϵ͘ ϳ ϭϬ͘ ϰ ϴ͘ ϯ ϭϮ͘ ϱ ϲ͘ Ϭ ϭϭ͘ Ϭ ϭϭ͘ ϲ ϲ͘ ϭ ϴ͘ ϵ ϭϭ͘ ϰ ϲ͘ ϵ ϴ͘ ϲ ϭϬ͘ Ϭ ϲ͘ Ϯ ϴ͘ ϱ ϭϬ͘ ϭ ϱ͘ ϲ ϴ͘ ϴ ϭϬ͘ ϳ ϰ͘ ϴ ϵ͘ ϵ ϭϭ͘ Ϯ ϲ͘ Ϭ ϭϬ͘ ϭ ϭϬ͘ ϱ ϲ͘ ϴ ϳ͘ ϱ ϵ͘ ϳ ϱ͘ ϭ 4day ϴ͘ Ϭ ϳ͘ ϱ ϳ͘ ϲ ϱ͘ Ϯ ϴ͘ ϯ ϯ͘ ϵ ϳ͘ ϭ ϴ͘ Ϯ ϯ͘ ϲ ϲ͘ ϱ ϳ͘ ϴ ϱ͘ Ϯ ϲ͘ ϯ ϵ͘ ϳ ϰ͘ ϲ ϱ͘ ϭ ϱ͘ ϴ ϯ͘ ϲ ϲ͘ Ϯ ϳ͘ Ϯ ϰ͘ ϳ ϲ͘ Ϯ ϴ͘ Ϭ ϱ͘ ϲ ϳ͘ ϱ ϳ͘ ϵ ϭϱ͘ ϵ ϱ͘ ϯ ϳ͘ Ϭ ϰ͘ ϱ Block 3 6day ϭϭ͘ Ϯ ϭϬ͘ ϳ ϭϮ͘ Ϯ ϳ͘ ϰ ϭϬ͘ ϲ ϲ͘ Ϭ ϲ͘ Ϭ ϭϭ͘ ϰ ϲ͘ Ϯ ϲ͘ ϵ ϲ͘ ϵ ϵ͘ ϲ ϱ͘ ϳ ϴ͘ ϴ ϯ͘ ϲ ϱ͘ ϴ ϲ͘ ϰ ϯ͘ ϴ ϲ͘ ϱ ϳ͘ ϱ ϲ͘ ϱ ϲ͘ ϴ ϵ͘ ϱ ϵ͘ ϱ ϲ͘ Ϯ ϭϬ͘ ϱ ϵ͘ ϭ ϱ͘ ϯ ϲ͘ ϰ ϳ͘ ϯ 2day ϴ͘ ϳ ϵ͘ ϲ ϭϬ͘ Ϯ ϴ͘ ϲ ϵ͘ Ϭ ϵ͘ ϲ ϴ͘ ϲ ϭϬ͘ ϯ ϯ͘ ϵ ϵ͘ Ϭ ϵ͘ ϵ ϱ͘ Ϯ ϳ͘ ϴ ϴ͘ ϱ ϲ͘ ϵ ϵ͘ Ϯ ϭϬ͘ ϯ ϯ͘ ϴ ϳ͘ Ϭ ϭϬ͘ ϭ ϵ͘ ϱ ϴ͘ ϭ ϭϭ͘ ϭ ϴ͘ ϲ ϳ͘ ϲ ϵ͘ Ϯ ϴ͘ ϱ ϴ͘ ϭ ϵ͘ Ϭ ϲ͘ ϴ 4day ϳ͘ ϱ ϳ͘ Ϭ ϰ͘ Ϭ ϰ͘ ϵ ϵ͘ ϰ ϱ͘ ϰ ϱ͘ ϵ ϲ͘ ϵ ϯ͘ ϴ ϲ͘ ϯ ϵ͘ Ϯ ϵ͘ ϰ ϲ͘ ϱ ϴ͘ ϵ ϰ͘ ϱ ϴ͘ ϭ ϭϭ͘ ϵ ϱ͘ Ϯ ϰ͘ ϰ ϲ͘ ϵ ϱ͘ ϰ ϱ͘ ϱ ϲ͘ ϰ ϱ͘ ϭ ϱ͘ ϱ ϳ͘ Ϯ ϵ͘ ϳ ϰ͘ ϰ ϲ͘ ϲ ϱ͘ Ϭ 6day ϰ͘ ϴ Ϯ͘ Ϯ ϲ͘ ϳ ϯ͘ ϲ ϳ͘ ϱ ϳ͘ ϵ ϲ͘ ϱ ϴ͘ ϭ ϲ͘ ϭ ϱ͘ Ϭ ϲ͘ ϭ ϵ͘ ϴ ϱ͘ ϭ ϱ͘ ϳ ϴ͘ ϲ ϲ͘ ϴ ϳ͘ ϴ ϲ͘ Ϭ ϯ͘ ϵ ϲ͘ Ϯ ϵ͘ ϲ ϭϲ͘ ϵ ϱ͘ ϰ ϳ͘ ϳ ϱ͘ ϲ ϲ͘ ϳ ϭϬ͘ ϳ ϱ͘ Ϭ ϳ͘ Ϭ ϵ͘ Ϯ Please purchase PDFcamp Printer on http://www.verypdf.com/ to remove this watermark. Moisture content week 4 Treatment GzDΛϬĐ ŵ GzDΛϭϱĐ ŵ GzDΛϯϬĐ ŵ ,DΛϬĐ ŵ ,DΛϭϱĐ ŵ ,DΛϯϬĐ ŵ ^ ^ ΛϬĐ ŵ ^ ^ ΛϭϱĐ ŵ ^ ^ ΛϯϬĐ ŵ CONTROL Depth 0-15 15-30 30-60 0-15 15-30 30-60 0-15 15-30 30-60 0-15 15-30 30-60 0-15 15-30 30-60 0-15 15-30 30-60 0-15 15-30 30-60 0-15 15-30 30-60 0-15 15-30 30-60 0-15 15-30 30-60 Block 1 2day ϵ͘ ϲ ϭϮ͘ Ϯ ϵ͘ ϯ ϲ͘ ϰ ϴ͘ ϱ ϲ͘ ϱ ϲ͘ ϯ ϭ͘ ϭ ϴ͘ ϵ ϵ͘ Ϯ ϴ͘ Ϯ ϭϬ͘ Ϭ ϭϬ͘ Ϭ ϭϯ͘ Ϯ ϭϬ͘ ϰ ϳ͘ ϲ ϴ͘ ϲ ϴ͘ Ϯ ϴ͘ ϱ ϭϬ͘ ϵ ϭϳ͘ ϴ ϵ͘ ϭ ϭϭ͘ Ϭ ϭϬ͘ ϲ ϭϰ͘ ϳ ϭϯ͘ Ϯ ϳ͘ ϰ Ϯ͘ ϵ ϯ͘ ϰ ϲ͘ ϱ 4day ϲ͘ ϱ ϭϬ͘ ϰ ϭϭ͘ ϰ ϱ͘ Ϭ ϳ͘ ϰ ϱ͘ ϯ ϳ͘ ϵ ϵ͘ ϲ ϴ͘ Ϯ ϲ͘ ϯ ϳ͘ ϰ ϳ͘ ϲ ϲ͘ Ϭ ϵ͘ ϲ ϰ͘ ϱ ϰ͘ ϰ ϲ͘ ϳ ϵ͘ Ϭ ϴ͘ ϱ ϭϬ͘ ϰ ϳ͘ Ϭ ϭϭ͘ Ϯ ϵ͘ ϭ ϴ͘ ϰ ϭϬ͘ ϵ ϭϮ͘ ϯ ϱ͘ ϵ ϰ͘ ϳ ϯ͘ Ϯ ϱ͘ ϵ Block 2 6day ϵ͘ Ϯ ϭϬ͘ Ϭ ϵ͘ Ϭ ϰ͘ ϭ ϲ͘ ϴ ϴ͘ ϯ ϴ͘ ϭ ϭϬ͘ ϳ ϴ͘ ϯ ϭϰ͘ ϰ ϳ͘ Ϭ ϳ͘ ϴ ϴ͘ ϱ ϵ͘ Ϭ ϭϬ͘ ϯ ϲ͘ ϰ ϳ͘ ϴ ϳ͘ Ϭ ϲ͘ ϰ ϴ͘ ϰ ϵ͘ ϱ ϵ͘ ϯ ϭϯ͘ ϳ ϵ͘ ϰ ϰ͘ ϴ ϭϭ͘ Ϯ ϴ͘ ϭ ϱ͘ ϯ ϯ͘ ϳ ϴ͘ ϰ 2day ϭϬ͘ ϵ ϭϭ͘ ϲ ϭϬ͘ ϭ ϲ͘ ϱ ϭϬ͘ Ϭ ϭϬ͘ ϭ ϵ͘ ϯ ϭϬ͘ ϳ ϴ͘ ϵ ϳ͘ ϯ ϴ͘ ϰ ϳ͘ ϰ ϳ͘ ϵ ϵ͘ ϭ ϵ͘ ϰ ϴ͘ ϱ ϴ͘ Ϯ ϴ͘ ϰ ϲ͘ Ϯ ϭϬ͘ Ϯ ϲ͘ ϴ ϭϭ͘ ϱ ϭϬ͘ ϰ ϭϬ͘ Ϯ ϭϬ͘ ϳ ϰ͘ Ϭ ϭϬ͘ ϱ ϳ͘ ϰ ϵ͘ ϵ ϲ͘ ϲ 4day ϭϭ͘ ϭ ϭϮ͘ Ϯ ϭϮ͘ ϴ ϴ͘ Ϯ ϭϮ͘ Ϯ ϲ͘ ϵ ϳ͘ Ϯ ϵ͘ ϰ ϲ͘ ϲ ϲ͘ ϵ ϴ͘ ϳ ϵ͘ ϳ ϳ͘ Ϭ ϭϭ͘ Ϭ ϳ͘ ϰ ϱ͘ ϵ ϲ͘ ϳ ϰ͘ ϯ ϲ͘ ϱ ϵ͘ ϵ ϳ͘ ϰ ϳ͘ Ϯ ϵ͘ ϲ ϵ͘ Ϯ ϭϬ͘ ϵ ϭϬ͘ Ϯ ϭϭ͘ ϳ ϳ͘ ϯ ϴ͘ ϭ ϳ͘ ϵ Block 3 6day ϭϮ͘ ϵ ϭϭ͘ Ϭ ϭϮ͘ ϭ ϲ͘ ϭ ϭϭ͘ ϭ ϴ͘ ϯ ϳ͘ ϯ ϭϮ͘ ϭ ϱ͘ ϯ ϲ͘ ϲ ϭϬ͘ Ϭ ϭϬ͘ ϳ ϲ͘ ϲ ϭϬ͘ ϳ ϳ͘ ϳ ϱ͘ ϭ ϳ͘ ϭ ϱ͘ ϴ ϲ͘ ϱ ϵ͘ ϭ ϴ͘ ϭ ϳ͘ ϳ ϭϭ͘ ϯ ϳ͘ ϳ ϵ͘ ϳ ϭϭ͘ ϴ ϭϭ͘ ϯ ϱ͘ ϲ ϵ͘ ϰ ϴ͘ ϳ 2day ϭϬ͘ ϱ ϵ͘ ϴ ϳ͘ ϳ ϴ͘ Ϭ ϵ͘ ϱ ϵ͘ Ϯ ϵ͘ ϯ ϭϭ͘ Ϯ ϲ͘ ϰ ϭϯ͘ ϰ ϭϰ͘ ϱ ϵ͘ ϭ ϳ͘ ϯ ϵ͘ ϳ ϭϬ͘ ϳ ϵ͘ ϯ ϭϮ͘ ϴ ϵ͘ ϴ ϲ͘ ϲ ϱ͘ Ϯ ϭϬ͘ ϴ ϴ͘ ϭ ϭϬ͘ ϵ ϭϭ͘ ϴ ϵ͘ ϱ ϵ͘ ϳ ϭϯ͘ ϲ ϴ͘ ϰ ϵ͘ ϵ ϭϭ͘ ϰ 4day ϳ͘ ϯ ϵ͘ ϳ ϳ͘ ϴ ϱ͘ ϲ ϭϬ͘ ϱ ϵ͘ ϴ ϴ͘ ϯ ϵ͘ ϳ ϲ͘ ϱ ϴ͘ Ϯ ϭϬ͘ Ϯ ϭϬ͘ ϳ ϲ͘ ϴ ϴ͘ ϳ ϭϬ͘ ϯ ϴ͘ ϳ ϭϬ͘ ϱ ϳ͘ ϳ ϲ͘ ϯ ϵ͘ Ϯ ϭϬ͘ ϳ ϳ͘ Ϭ ϵ͘ ϲ ϵ͘ ϱ ϳ͘ Ϭ ϵ͘ ϴ ϭϮ͘ ϭ ϴ͘ ϰ ϴ͘ ϰ ϵ͘ ϰ 6day ϲ͘ ϲ ϭϮ͘ Ϯ ϳ͘ ϲ ϱ͘ ϰ ϳ͘ ϲ ϵ͘ ϳ ϭϬ͘ Ϯ ϭϭ͘ ϰ ϵ͘ Ϭ ϲ͘ ϵ ϭϬ͘ ϵ ϭϬ͘ ϲ ϴ͘ ϰ ϴ͘ ϳ ϭϬ͘ ϴ ϴ͘ ϯ ϳ͘ Ϭ ϵ͘ ϵ ϳ͘ ϰ ϭϬ͘ Ϯ ϵ͘ ϳ ϴ͘ ϲ ϵ͘ ϵ ϵ͘ ϯ ϳ͘ ϯ ϴ͘ ϯ ϭϮ͘ ϭ ϰ͘ ϵ ϳ͘ ϳ ϭϬ͘ ϳ Please purchase PDFcamp Printer on http://www.verypdf.com/ to remove this watermark. Moisture content week 6 Treatment GzDΛϬĐ ŵ GzDΛϭϱĐ ŵ GzDΛϯϬĐ ŵ ,DΛϬĐ ŵ ,DΛϭϱĐ ŵ ,DΛϯϬĐ ŵ ^ ^ ΛϬĐ ŵ ^ ^ ΛϭϱĐ ŵ ^ ^ ΛϯϬĐ ŵ CONTROL Depth 0-15 15-30 30-60 0-15 15-30 30-60 0-15 15-30 30-60 0-15 15-30 30-60 0-15 15-30 30-60 0-15 15-30 30-60 0-15 15-30 30-60 0-15 15-30 30-60 0-15 15-30 30-60 0-15 15-30 30-60 Block 1 2day ϭϬ͘ ϳ ϭϭ͘ Ϯ ϵ͘ ϰ ϴ͘ ϵ ϴ͘ ϯ ϲ͘ ϵ ϭϭ͘ ϰ ϭϬ͘ ϯ ϴ͘ ϳ ϵ͘ ϯ ϴ͘ ϴ ϵ͘ ϭ ϭϭ͘ Ϭ ϭϮ͘ ϭ ϴ͘ Ϭ ϭϬ͘ Ϭ ϳ͘ ϰ ϲ͘ Ϯ ϭϬ͘ ϵ ϭϭ͘ ϭ ϵ͘ ϱ ϭϰ͘ ϱ ϭϭ͘ ϰ ϴ͘ ϴ ϭϭ͘ Ϭ ϭϮ͘ Ϯ ϴ͘ ϯ ϵ͘ ϴ ϭϬ͘ Ϭ ϲ͘ ϱ 4day ϴ͘ ϵ ϵ͘ ϵ ϵ͘ ϴ ϲ͘ Ϯ ϲ͘ ϴ ϰ͘ ϰ ϲ͘ Ϭ ϲ͘ ϳ ϭϬ͘ ϱ ϲ͘ ϲ ϳ͘ Ϭ ϰ͘ ϯ ϳ͘ ϱ ϴ͘ ϳ ϳ͘ ϳ ϱ͘ ϴ ϲ͘ ϰ ϱ͘ ϵ ϲ͘ ϳ ϳ͘ ϱ ϵ͘ ϴ ϳ͘ ϭ ϳ͘ ϴ ϳ͘ ϳ ϳ͘ ϵ ϭϬ͘ ϲ ϭϬ͘ ϲ ϲ͘ ϳ ϳ͘ ϭ ϲ͘ ϲ Block 2 6day ϱ͘ Ϯ ϱ͘ ϰ ϭϬ͘ ϳ ϰ͘ ϰ ϱ͘ ϵ ϲ͘ ϲ ϲ͘ ϵ ϳ͘ ϵ ϳ͘ ϳ ϲ͘ ϱ ϲ͘ Ϯ ϳ͘ Ϭ ϲ͘ ϵ ϭϭ͘ Ϭ ϴ͘ ϯ ϱ͘ ϭ ϱ͘ ϵ ϳ͘ ϰ ϲ͘ ϰ ϳ͘ ϯ ϭϬ͘ ϳ ϲ͘ ϭ ϳ͘ ϲ ϴ͘ ϳ ϳ͘ ϭ ϵ͘ ϯ ϵ͘ ϲ ϲ͘ ϯ ϲ͘ ϳ ϳ͘ Ϭ 2day ϭϬ͘ ϲ ϭϭ͘ Ϯ ϭϬ͘ ϵ ϭϬ͘ ϰ ϭϭ͘ ϵ ϵ͘ ϵ ϲ͘ ϰ ϭϬ͘ ϰ ϭϬ͘ ϰ ϴ͘ ϯ ϭϮ͘ ϭ ϳ͘ ϱ ϭϭ͘ ϵ ϭϮ͘ ϭ ϭϬ͘ ϲ ϵ͘ Ϭ ϴ͘ ϱ ϳ͘ ϭ ϵ͘ ϴ ϵ͘ ϱ ϳ͘ ϵ ϵ͘ ϴ ϭϭ͘ ϭ ϭϬ͘ ϴ ϭϭ͘ ϯ ϭϭ͘ ϭ ϭϬ͘ ϱ ϭϭ͘ ϯ ϵ͘ ϯ ϲ͘ ϲ 4day ϴ͘ Ϭ ϴ͘ ϯ ϭϬ͘ ϭ ϲ͘ ϰ ϴ͘ ϰ ϳ͘ ϳ ϴ͘ ϯ ϭϬ͘ ϱ ϲ͘ ϲ ϰ͘ ϴ ϲ͘ ϱ ϴ͘ ϵ ϱ͘ ϲ ϵ͘ ϱ ϳ͘ ϴ ϰ͘ ϱ ϲ͘ ϯ ϰ͘ ϵ ϲ͘ Ϭ ϱ͘ ϵ ϵ͘ ϳ ϱ͘ ϴ ϲ͘ Ϯ ϵ͘ ϰ ϱ͘ ϱ ϵ͘ ϭ ϭϯ͘ ϰ ϲ͘ ϱ ϳ͘ ϰ ϳ͘ ϵ Block 3 6day ϲ͘ ϭ ϵ͘ ϴ ϵ͘ ϵ ϱ͘ ϳ ϴ͘ ϯ ϴ͘ ϰ ϲ͘ Ϭ ϳ͘ Ϭ ϵ͘ ϴ ϳ͘ Ϯ ϳ͘ ϰ ϳ͘ ϭ ϱ͘ ϭ ϲ͘ ϲ ϵ͘ ϴ ϰ͘ ϴ ϱ͘ ϳ ϲ͘ ϴ ϱ͘ Ϭ ϱ͘ ϴ ϭϮ͘ Ϭ ϱ͘ ϵ ϳ͘ ϱ ϭϯ͘ ϭ ϲ͘ ϯ ϴ͘ ϲ ϭϮ͘ ϰ ϲ͘ Ϭ ϳ͘ Ϭ ϳ͘ ϭ 2day ϳ͘ ϲ ϴ͘ ϲ ϴ͘ ϲ ϲ͘ ϴ ϵ͘ Ϭ ϭϮ͘ ϰ ϭϬ͘ Ϭ ϭϮ͘ Ϭ ϭϭ͘ ϱ ϴ͘ ϴ ϭϬ͘ ϰ ϭϯ͘ ϳ ϳ͘ ϱ ϭϬ͘ ϳ ϭϰ͘ ϵ ϭϭ͘ ϵ ϭϬ͘ ϵ ϳ͘ ϴ ϳ͘ Ϭ ϭϬ͘ ϳ ϭϭ͘ ϰ ϵ͘ ϳ ϵ͘ Ϯ ϭϭ͘ ϱ ϵ͘ Ϭ ϵ͘ ϰ ϭϬ͘ ϳ ϴ͘ ϵ ϵ͘ ϳ ϵ͘ ϳ 4day ϵ͘ Ϭ ϲ͘ Ϯ ϲ͘ ϯ ϱ͘ Ϭ ϲ͘ ϳ ϭϮ͘ ϲ ϴ͘ ϯ ϴ͘ Ϯ ϴ͘ ϱ ϴ͘ ϯ ϴ͘ ϱ ϭϬ͘ Ϭ ϱ͘ Ϯ ϳ͘ ϯ ϭϭ͘ ϰ ϳ͘ ϴ ϳ͘ Ϯ ϳ͘ ϯ ϰ͘ ϭ ϱ͘ Ϯ ϭϮ͘ ϭ ϲ͘ ϴ ϴ͘ ϱ ϭϯ͘ ϳ ϲ͘ ϴ ϳ͘ ϯ ϭϭ͘ ϭ ϱ͘ ϭ ϳ͘ ϱ ϴ͘ ϱ 6day ϰ͘ ϵ ϳ͘ Ϭ ϲ͘ Ϯ ϰ͘ ϲ ϳ͘ ϯ ϵ͘ ϲ ϴ͘ ϱ ϳ͘ ϳ ϵ͘ ϴ ϯ͘ ϰ ϵ͘ Ϭ ϭϭ͘ ϲ ϰ͘ ϲ ϳ͘ ϱ ϭϮ͘ ϵ ϳ͘ ϱ ϴ͘ Ϭ ϱ͘ ϳ ϯ͘ ϵ ϳ͘ ϰ ϵ͘ Ϭ ϱ͘ ϰ ϭϮ͘ ϵ ϴ͘ ϵ ϴ͘ ϱ ϳ͘ ϭ ϭϮ͘ ϱ ϱ͘ ϱ ϳ͘ ϰ ϴ͘ ϴ Please purchase PDFcamp Printer on http://www.verypdf.com/ to remove this watermark. Moisture content week 8 Treatment GzDΛϬĐ ŵ GzDΛϭϱĐ ŵ GzDΛϯϬĐ ŵ ,DΛϬĐ ŵ ,DΛϭϱĐ ŵ ,DΛϯϬĐ ŵ ^ ^ ΛϬĐ ŵ ^ ^ ΛϭϱĐ ŵ ^ ^ ΛϯϬĐ ŵ CONTROL Depth 0-15 15-30 30-60 0-15 15-30 30-60 0-15 15-30 30-60 0-15 15-30 30-60 0-15 15-30 30-60 0-15 15-30 30-60 0-15 15-30 30-60 0-15 15-30 30-60 0-15 15-30 30-60 0-15 15-30 30-60 Block 1 2day ϭϯ͘ Ϯ ϭϰ͘ ϭ ϭϯ͘ ϴ ϭϭ͘ ϭ ϭϬ͘ ϳ ϳ͘ ϭ ϭϮ͘ ϱ ϭϯ͘ ϯ ϵ͘ ϯ ϭϭ͘ Ϯ ϭϬ͘ Ϯ ϭϬ͘ ϭ ϭϮ͘ ϯ ϭϬ͘ ϳ ϭϬ͘ ϭ ϭϭ͘ ϱ ϭϭ͘ ϯ ϴ͘ Ϯ ϭϭ͘ ϭ ϭϮ͘ ϲ ϭϮ͘ Ϯ ϭϮ͘ ϱ ϭϱ͘ ϯ ϭϬ͘ Ϯ ϭϭ͘ ϳ ϭϰ͘ Ϯ ϭϯ͘ ϲ ϭϭ͘ ϯ ϭϭ͘ ϰ ϭϬ͘ ϱ 4day ϳ͘ Ϯ ϭϯ͘ ϰ ϵ͘ ϵ ϲ͘ ϯ ϳ͘ ϰ ϳ͘ ϲ ϭϬ͘ ϭ ϭϬ͘ ϴ ϵ͘ ϯ ϴ͘ ϵ ϳ͘ Ϯ ϴ͘ ϱ ϴ͘ ϯ ϭϯ͘ Ϭ ϵ͘ ϲ ϲ͘ ϵ ϳ͘ Ϯ ϴ͘ ϭ ϵ͘ ϱ ϭϭ͘ ϱ ϭϬ͘ ϭ ϵ͘ ϴ ϵ͘ ϯ ϭϬ͘ ϰ ϭϮ͘ ϭ ϭϯ͘ Ϭ ϴ͘ ϲ ϳ͘ ϴ ϵ͘ ϱ ϴ͘ ϭ Block 2 6day ϳ͘ ϯ ϭϮ͘ ϰ ϵ͘ ϵ ϰ͘ ϴ ϱ͘ ϴ ϳ͘ ϳ ϳ͘ ϱ ϴ͘ ϯ ϱ͘ ϱ ϵ͘ ϰ ϳ͘ ϭ ϳ͘ ϳ ϲ͘ ϴ ϭϬ͘ ϳ ϭϭ͘ ϰ ϱ͘ ϵ ϲ͘ ϵ ϯ͘ Ϭ ϵ͘ ϰ ϭϬ͘ ϱ ϭϬ͘ ϭ ϳ͘ Ϭ ϵ͘ ϳ ϵ͘ Ϭ ϭϮ͘ Ϯ ϭϬ͘ ϰ ϭϬ͘ Ϯ ϲ͘ ϲ ϳ͘ Ϯ ϳ͘ ϵ 2day ϭϯ͘ ϲ ϭϯ͘ ϭ ϭϯ͘ ϯ ϭϭ͘ ϳ ϭϮ͘ ϲ ϭ͘ ϴ ϭϭ͘ ϱ ϭϰ͘ Ϭ ϭϮ͘ Ϭ ϵ͘ ϱ ϭϭ͘ ϵ ϭϯ͘ Ϯ ϭϭ͘ ϳ ϭϮ͘ ϳ ϭϴ͘ ϱ ϵ͘ ϲ ϵ͘ ϲ ϳ͘ ϳ ϵ͘ ϱ ϭϬ͘ ϯ ϭϮ͘ ϰ ϭϬ͘ ϭ ϭϭ͘ ϭ ϭϰ͘ ϰ ϭϰ͘ ϱ ϭϮ͘ ϰ ϭϮ͘ ϴ ϴ͘ ϴ ϭϮ͘ ϭ ϵ͘ ϲ 4day ϴ͘ ϯ ϭϬ͘ ϲ ϭϮ͘ Ϭ ϴ͘ Ϭ ϭϭ͘ ϲ ϭϰ͘ ϭ ϳ͘ Ϯ ϵ͘ Ϭ ϭϬ͘ ϴ ϳ͘ ϵ ϴ͘ ϱ ϴ͘ ϰ ϱ͘ ϵ ϴ͘ ϯ ϭϭ͘ ϵ ϳ͘ ϱ ϳ͘ ϲ ϲ͘ ϱ ϳ͘ ϵ ϵ͘ ϭ ϵ͘ ϵ ϳ͘ ϭ ϳ͘ ϭ ϭϯ͘ ϳ ϭϬ͘ ϯ ϭϬ͘ ϲ ϭϯ͘ Ϯ ϳ͘ ϭ ϵ͘ ϳ ϵ͘ ϲ Block 3 6day ϳ͘ ϲ ϵ͘ ϱ ϭϬ͘ Ϭ ϲ͘ ϯ ϭϬ͘ ϰ ϭϮ͘ ϵ ϳ͘ Ϭ ϴ͘ ϵ ϴ͘ ϳ ϲ͘ ϭ ϵ͘ ϱ ϴ͘ Ϯ ϲ͘ ϯ ϵ͘ ϴ ϭϮ͘ ϯ ϱ͘ ϴ ϳ͘ Ϯ ϳ͘ ϴ ϳ͘ ϯ ϵ͘ ϴ ϵ͘ ϴ ϲ͘ Ϭ ϲ͘ ϭ ϭϮ͘ Ϯ ϴ͘ Ϯ ϵ͘ ϳ ϭϬ͘ ϲ ϲ͘ ϱ ϴ͘ ϲ ϭϲ͘ Ϯ 2day ϳ͘ ϯ ϵ͘ ϰ ϭϯ͘ ϳ ϵ͘ ϱ ϭϲ͘ ϳ ϭϬ͘ ϳ ϭϬ͘ ϱ ϭϮ͘ ϲ ϭϯ͘ ϵ ϵ͘ ϯ ϭϮ͘ Ϯ ϭϳ͘ ϵ ϭϬ͘ ϱ ϭϭ͘ ϵ ϭϮ͘ ϭ ϭϰ͘ Ϯ ϭϯ͘ ϭ ϭϮ͘ ϭ ϴ͘ ϴ ϴ͘ ϭ ϭϲ͘ ϵ ϵ͘ ϴ ϭϬ͘ ϭ ϭϰ͘ ϱ ϭϬ͘ ϴ ϭϭ͘ ϵ ϭϯ͘ ϲ ϭϬ͘ ϰ ϭϭ͘ ϭ ϭϯ͘ ϴ 4day ϳ͘ ϳ ϳ͘ Ϯ ϴ͘ ϵ ϱ͘ ϰ ϳ͘ ϰ ϭϳ͘ Ϯ ϳ͘ ϵ ϵ͘ ϳ ϭϬ͘ ϲ ϱ͘ ϳ ϲ͘ Ϯ ϭϲ͘ ϱ ϲ͘ Ϯ ϴ͘ ϭ ϭϲ͘ ϱ ϵ͘ ϰ ϭϬ͘ ϯ ϭϯ͘ ϭ ϲ͘ Ϭ ϲ͘ ϯ ϭϯ͘ ϵ ϳ͘ ϯ ϴ͘ ϯ ϭϳ͘ Ϭ ϳ͘ Ϯ ϳ͘ ϴ ϭϯ͘ ϱ ϲ͘ ϲ ϴ͘ ϴ ϵ͘ ϰ 6day ϴ͘ ϴ ϲ͘ ϱ ϵ͘ ϴ ϱ͘ ϯ ϳ͘ ϲ ϭϰ͘ ϲ ϵ͘ Ϯ ϴ͘ ϵ ϭϬ͘ Ϯ ϲ͘ ϲ ϴ͘ ϰ ϭϭ͘ Ϯ ϱ͘ ϱ ϭϮ͘ Ϭ ϭϭ͘ ϱ ϲ͘ ϱ ϳ͘ Ϭ ϭϮ͘ ϲ ϳ͘ Ϯ ϭϭ͘ Ϭ ϭϬ͘ ϴ ϱ͘ ϴ ϲ͘ ϵ ϭϯ͘ ϳ ϲ͘ ϯ ϳ͘ Ϭ ϭϯ͘ ϴ ϵ͘ ϲ ϭϬ͘ ϰ ϭϬ͘ Ϭ Please purchase PDFcamp Printer on http://www.verypdf.com/ to remove this watermark.


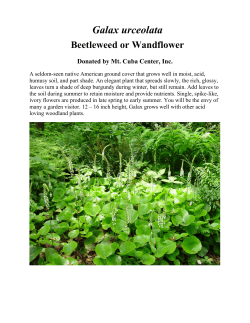
© Copyright 2026