
San Francisco`s Chinatown: Resilience in the Face of
San Francisco’s Chinatown Resilience in the Face of Poverty and Homelessness An Analysis with Recommendations 1 This study was undertaken at The Elfenworks Foundation, “In Harmony With Hope” Lead Author: Blair Vorsatz was the lead researcher and writer for this paper, during his time as an intern at The Elfenworks Foundation. A graduate of Georgetown and currently pursuing graduate studies at Harvard, Blair is also currently serving as an intern on the National Security & International Policy Team for the Center for American Progress in Washington, D.C. Co-‐Author: Lauren Speeth, DBA DMin, is the CEO of The Elfenworks Foundation and the creator of multimedia content – including books, articles, music, and short films – focusing on social entrepreneurship and domestic poverty and inequality. Contributing Writer: Katherine Kam is a writer and editor in the San Francisco Bay Area who brings insight, analysis, and strong storytelling to complex issues. During her career in journalism, she has written about health and mental health, medicine, travel, cross-‐cultural issues, and many other topics. Cover, Design, and Layout: Michael Dalling, The Elfenworks Foundation Photography Credit: Lauren Speeth Acknowledgements: Special Thanks to Kenneth Tam, Executive Director, who shepherded the project, and Marian Brown Sprague, Editor. The Elfenworks Foundation 20 Park Road Suite D Burlingame CA 94010 Media Contact [email protected] Elfenworks advises readers “never underestimate your ripple.” Find out more, at www.elfenworks.org/ripple 2 Abstract San Francisco’s Chinatown is arguably the city’s most socio-‐economically disadvantaged neighborhood, an island of concentrated poverty in an ethnic immigrant enclave. It is home to more than 15,000 inhabitants, largely foreign-‐born Chinese immigrants who are as a whole slightly older than the San Francisco average. Chinatown’s poverty rate is almost three times the San Francisco norm, its unemployment rate is over two times the norm, and the majority of its households do not have any English-‐speaking adults. Although the size of Chinatown’s homeless population is not entirely known, the point-‐in-‐time homeless count data suggests that the maximum possible homeless rate is 1.60%. How is it possible that Chinatown’s residents endure the city’s worst socio-‐economic disadvantage and yet show a reported homeless rate that appears to be close to zero? Chinatown families seem to be coping with an approximate “socio-‐economic homeless” status by prioritizing very cheap, cramped shelter. Single Room Occupancies, or SROs, allow residents to have shelter by night, but are so small that their occupants often choose to stay outside during the day. This is termed de jure homelessness. While not ideal, this coping strategy seems to be the best of poor choices, providing certain advantages over splitting up a family and the dangers associated with other forms of “shelters,” and especially over de facto homelessness. One of these advantages is the environment of shared cultural identity: cultural comfort and a sense of community. Chinatown’s story is the American story: an older generation of immigrants sacrifices its own personal comforts, investing instead in their children’s futures. They settle together, in response to a variety of pressures. In so doing, the older generation may retain language and customs, placing itself at a disadvantage as compared to other impoverished groups that have no language or cultural barriers to self-‐advocacy. The calculated self-‐sacrifice of SRO residency and local employment, while onerous for parents, may provide (or be expected to provide) a strong platform from which the next generation can ascend socio-‐economically. In this paper, we examine the current state of the community in San Francisco’s Chinatown, with a specific focus on its residents’ use of the SRO as a coping mechanism for extreme poverty. Gaining a Sense of the SRO Single Room Occupancy hotels, or “residential hotels,” have been a mainstay in major cities for centuries. In San Francisco, SROs were once the most prevalent type of housing. The epidemic of homelessness we face now can be traced, in part, to the destruction of many of these units in recent years. Much of this homelessness came under the guise of “blight removal,” through redevelopment agencies, without affordable replacement. SROs are small: a single unit averages 8' x 10' inclusive.i An SRO of this size would be roughly equivalent to living in a large walk-‐in closet or a gardening storage shed.ii Imagine standing on an HP VantagePoint touch screen whiteboard substitute, stretched flat on the ground,iii or moving in with a few other people in a space only a touch larger than the average office worker’s 75-‐square-‐foot office space in 2011.iv So, what does it mean when a family resides in such a space? The family would share communal toilets and showers with other residents. Limited or non-‐existent communal kitchen facilities would impair a family’s ability to economize with healthy, home-‐cooked meals. And because there is not enough space to stay comfortably inside during the day, families would be given the stigma-‐bearing label of “de jure homeless.” It is easy to see how an argument could be made that SROs are sub-‐optimal. But if you had the choice of being warm and safe, indoors, or being truly homeless, which would you choose? 3 Hidden Chinatown San Francisco’s Chinatown comprises the 20-‐square-‐block area lying between Kearny, Grant, Stockton, and Powell Streets. vi With a population of 15,000, Chinatown is the most densely populated urban area west of Manhattan.vii As a whole, its residents are Chinese immigrants who speak limited English, and who either live in poverty or very close to it. Many residents work as unskilled laborers for low wages, and almost all rent their housing. Chinatown’s residents are older and have a lower degree of educational attainment than the San Francisco average. Some residents have lived in Chinatown since migrating to the USA, but not all. Some have chosen to move back and live out their remaining years, and, in a final act of self-‐sacrifice, to divest their assets to their children. Cantonese is the dominant Chinese dialect of the area, making San Francisco’s Chinatown a preferred first destination for immigrants from southern China.viii Chinatown is also one of San Francisco’s most famous tourist attractions. Every year, roughly 2 million visitors stroll through Chinatown to visit the lively restaurants, tea houses, curio shops, and Asian grocery and fish markets. But few are aware of the families that live in the SROs above the storefronts in one of the city’s poorest and densest neighborhoods. Since many Chinatown residents are newcomers, they speak little or no English. Often, they find work in Chinatown restaurants, where labor laws are frequently ignored, according to the Chinese Progressive Association (CPA), a nonprofit group that advocates on behalf of Chinatown residents. Many workers are subjected to wage theft, including lack of overtime pay. In San Francisco, the minimum wage in 2014 was $10.74, but many workers in Chinatown earned only $5 to $6 per hour. Some workers have also complained that their bosses take their tips. According to the CPA, Chinatown workers are also exploited in other industries, such as retail and construction. Given such meager wages, Chinatown workers must often live in SROs if they want to remain in the area, although some move to less expensive areas outside the city, such as Concord or Pinole. Moving out of the SROs can be difficult, though, and families might stay for years or even decades. Some of the SRO buildings are about 100 years old and in poor condition. Landlords are often slow to make repairs, according to the residents of one building, who complained that they have sometimes lacked electricity or running water for two days. Other residents have complained of slow repairs to broken locks on outside doors, which makes it easier for trespassers to enter and rob or burglarize. Many SROs exist quietly, with no obvious signs outside of the buildings to mark them as residential hotels. On Stockton Street, one of Chinatown’s main arteries, one SRO does identify itself as a hotel, its name featured on a sign above the sidewalk. A walk up the front stairs leads to a long hallway lined with tiny, individual rooms. The rooms are often stuffy, so residents frequently leave their doors open for ventilation. In one room with the door wide open, a young mother stands, cradling her toddler in her arms. Behind the two, a clutter of belongings fills up almost the entire space: a bunk bed, table, clothes, dishes, and other personal items. The space is so crowded that the room has only about four square feet of clear space near the doorway in which to move—literally no place for the youngster to crawl. The room also offers no privacy. Along the room’s back wall, a large window opens up, but not to the outside world. Instead, it reveals a small communal kitchen with one stove, enabling families to look into the young mother’s room whenever they cook. 4 v All of the residents on the floor share one toilet and shower. Raising children in an SRO is extremely difficult, given the lack of space for youngsters to play and study, as well as the minimal and often unsanitary kitchen and bath facilities. Without laundry rooms, residents must also hand-‐wash and hang laundry. For elderly residents, the lack of elevators within the buildings poses significant problems, especially if they have trouble with mobility or carrying heavy items. While residents can rely on one another for some help, such as hand-‐me-‐down clothing or advice on cooking, tensions can also erupt over noise or spending too much time in the bath area while other residents are waiting. Residents establish routines to adapt to the hardships. They try to stagger their cooking times. They look for ways to escape the confines to walk or exercise or socialize. The SROs are so crowded that mothers must take their children outside to play. Chinatown’s local park, Portsmouth Square, is often called Chinatown’s “living room” because it offers parents, children and the elderly some relief from their cramped quarters. On any given day, old men gather there to talk and play board games, while nearby, children frolic on the playground. Chinatown’s History of Discrimination San Francisco’s Chinatown has been around for almost as long as San Francisco itself, and so has racial discrimination. The area was incorporated in 1847, and the first Chinese immigrants arrived the following year.ix This influx of Chinese was so significant that San Francisco is known as “Old Gold Mountain” (旧金山:jiùjīnshān) in Chinese. As with other waves of immigrants – the Irish, the Mexicans, and so on – mostly males came to this country to work, where they were both exploited and resented. Many became contract laborers and were willing to work harder and at lower wages than the locals, exerting significant downward pressure on wages and putting many resident laborers out of work; this created a socio-‐economic basis for ethnic antagonism, leading to resentment, discrimination, and segregation. Anti-‐miscegenation laws criminalized interracial marriage, and as early as 1852, Governor John Bigler of California demanded Chinese exclusion on the grounds that the Chinese were “nonassimilable.”x In 1854, the California Supreme Court, in Hall v. People, ruled that Chinese testimony against whites was inadmissible in a court of law because "the same rule which would admit them to testify, would admit them to all the equal rights of citizenship, and [then] we might see them at the polls, in the jury box, upon the bench, and in our legislative halls."xi In the years that followed, anti-‐Chinese sentiments intensified, driving them out of jobs deemed more desirable by the Caucasian majority. In the late 1870s, fears of the “yellow peril” added fuel to the rallying cry of the Workingman’s Party: “the Chinese must go!”xii Subsequent laws and ordinances only formalized the segregation and discrimination of the Chinese, effectively codifying racism. The Chinese Exclusion Act, passed in 1882 and repeatedly extended, was designed to exclude Chinese immigrants and deny naturalization and democratic rights to those already in the US.xiii Chinese immigrants were effectively cut off from China “like orphans,” yet disenfranchised from the Euro-‐American mainstream; some oriented their lives towards an eventual return to China,xiv and others worked to create a sense of home in the diaspora, maintaining an emphasis on customs, festivals, language, culture, and, of course, success.xv All of this only reinforced their “nonassimilable” status, as many simply stopped trying to integrate with American society. Chinese seclusion was intensified by further de jure oppression, most notably the Anti-‐Miscegenation Law (1906), the Immigration Act (1907), the Alien Land Laws (1913) and the Alien Act (1924).xvi This medley of laws prohibited interracial Chinese marriages, excluded illiterate Chinese from entering the US, kept Chinese from owning land, and prevented many immigrants’ families, still living in China, from joining them in the 5 US. California Attorney General Ulysses Webb explained the motivation for this legal restriction: “race undesirability.”xvii This discrimination and de facto second-‐class citizen classification was not lost on the Chinese. Were it not for the San Francisco fire of 1906, which wiped out all “official” records, the Chinese population would not be what it is today. As Gim Chang, a Chinese resident of San Francisco in the early 20th century, wrote of the time: "I myself rarely left Chinatown, only when I had to buy American things downtown. The area around Union Square was a dangerous place for us, you see, especially at nighttime before the quake [1906]. Chinese were often attacked by thugs there and all of us had to have a police whistle with us all the time."xviii While the 1940s marked a turning point in the treatment of the Chinese, improvements had largely halted by the late 1960’s. The Magnuson Act of 1943 repealed the Exclusion Act of 1882, allowing 105 immigrants per year, and legislation in 1946, 1953, and 1961 expanded the annual allowed inflow of Chinese.xix In 1963, President Kennedy called the quota system “intolerable,” and took up immigration reform. With the Civil Rights Act of 1964 and the Immigration and Nationality Act of 1965, immigration restrictions were ended and Chinese Americans, as well as many other minorities, were returned many of their basic rights. The new wave of immigrants who subsequently entered San Francisco, and the greater Bay Area, included many wealthy Chinese who were escaping political instability or repression. The influx of wealthier Chinese effectively bifurcated San Francisco’s Chinese population into two distinct socio-‐economic classes: the poor working class in the original Stockton Chinatown and the richer middle class of professionals and small business owners who resided in other districts (largely the Clement, Irving, and Noriega Street areas). As Ronald Skeldon describes it, “flight of capital” from China brought many affluent, well-‐educated, professionally successful Hong Kong immigrants to San Francisco.xx The attribution of the “model minority” stereotype to this segment of the local Chinese population has helped to obscure the socio-‐economic disadvantage of those who still live in the original Chinatown, those at the very margins who rely on Chinatown’s availability of high-‐density SRO housing, and who find comfort in its cultural familiarities. Consequently, the Chinese were conferred few affirmative action-‐type advantages following this wave of immigration, leaving many of the poor Chinese immigrants without (or with disproportionately little) government assistance. Chinatown’s Linguistic Situation The neighborhood is predominantly Chinese, with 84% of the residents being Asian.xxi Seventy-‐five percent of residents are foreign born, and 84% of Asian-‐language speaking households live in “linguistic isolation,” meaning that no one over the age of 14 speaks English.xxii If an immigrant works two jobs, and is raising children, there aren’t a lot of hours left in the day to learn English. And, “without a good command of English, they cannot move out of the ethnic economy.”xxiii So long as residents live, work, and purchase entirely within Chinatown, the lack of English proficiency may never be felt as a disadvantage. In fact, it can be a source of advantage to shops within the area. On the downside, linguistic and cultural isolation can hinder self-‐advocacy efforts, leaving residents with a sense of powerlessness within the greater society. Haines (2001) alludes to the “vicious circle” of social isolation that results from reliance on the enclave community. In Chinatown, there are fewer opportunities for interaction with larger society, but because there are sources of information – television and news – in Chinese, that isolation isn’t complete. What is lacking is the ability to communicate – to bridge the divide between Chinatown and wider society as a whole. Meanwhile, as the older generation remains socially, linguistically, and professionally incapable of leaving Chinatown, it would appear logical to place “their hope…with their children.”xxiv 6 Chinatown’s Socio-‐Economic Situation As shown in Figure 1, below, San Francisco’s Chinatown population is at a socio-‐economic disadvantage when compared with San Francisco as a whole. Although the city enjoys one of the higher average incomes in the nation, Chinatown itself offers a median household income of only $17,630, 70% below the San Francisco average and yielding a poverty rate of 31%. And the majority of households meet the legal definition of poverty, or else are on the verge of doing so.xxv This can be better seen in Figure 2, which shows that Chinatown’s median family income is only 22% above the federal poverty line and 61% below the Self Sufficiency Standard for a one adult, two-‐child family, a standard established by the Insight Center for Community Economic Development in 2008.xxvi Up to 25% of Chinatown’s households may even live in extreme poverty.xxvii The unemployment rate in Chinatown is 15%. While there exist some other groups who have higher unemployment rates, such as young adult African-‐American males who lack a high school diploma, it is still three times higher than the rest of the city as a whole. With 60% of its residents lacking a high school diploma, a rate four times the San Francisco average, those jobs that can be had are often unskilled, low-‐ wage jobs.xxviii A large senior citizen population (39% of Chinatown residents are over the age of 60) likely exacerbates the economic burdens placed on many households.xxix Figure 1: Summary of Chinatown Residents’ Socio-‐Economic State (% of Total Residents Unless Otherwise Noted) Data Sourced from: “San Francisco Neighborhoods: Socio-‐Economic Profiles” Figure 2: Chinatown’s Median Family Income Compared to Income Standards for SF Families Data Sourced from: Dan Kelly’s “Demographic and Poverty Trends in San Francisco” A neighborhood comparison is displayed below in Figure 3.xxx Compared to the other San Francisco neighborhoods, Chinatown has the largest percentage of ethnic Asians and foreign-‐born residents (immigrants). Its residents have the lowest educational attainment, the largest language barrier, and the lowest median household income. Chinatown boasts San Francisco’s highest poverty rate and the second-‐ highest unemployment rate. It appears to be an overwhelmingly poor neighborhood, as shown by its third-‐lowest share of single family housing and lowest rate of vehicles per capita, both of which are proxies for neighborhood wealth. At the same time, the San Francisco Bay area is one of the least affordable locations in the country to rent or buy a home. High demand for any housing within 7 Chinatown, including SRO housing, continues to place upward pressures on all rents. The combination of low income and high rent makes the neighborhood one of the most expensive, in the experience of its residents. When these statistics are taken in context, one could argue that Chinatown’s residents are the city’s most socio-‐economically disadvantaged group. How that disadvantage is experienced, given that San Francisco is one of America’s most wealthy communities, and given the conditions from which some have fled to America, has not been the subject of much scientific inquiry. Figure 3: San Francisco Neighborhood Comparison Chinatown data in red; San Francisco data in blue; neighborhood most greatly disadvantaged in each category is bolded Data Sourced from: “San Francisco Neighborhoods: Socio-‐Economic Profiles” Chinatown has the largest share of residents in service occupations and the smallest share in managerial/professional occupations. This is often a telling statistic. In the mindset of most Americans, occupation is a source of personal pride, and also serves as a proxy for socio-‐economic well-‐being. But what of the mindset of Chinatown residents, many of whom may take pride in self-‐sacrifice in menial jobs in order to foster the next generation? As far as we can tell, this has not been a subject of much scientific inquiry. 8 The Question of Homelessness Unfortunately, we could find no comprehensive information on San Francisco Chinatown’s homeless population; this area is largely an academic vacuum. Failing that, we must begin our analysis on a larger scale with citywide data and moving progressively smaller, later analyzing district data and even the very limited Chinatown data. City-‐Level Homeless Estimates San Francisco’s city-‐level data clearly highlights the low relative ethnic homeless rate of Asians and Pacific Islanders. In 2013, of the 7,350 homeless persons reported in San Francisco, only 5% (368 people) were labeled as being Asian or Pacific Islander.xxxi Given that 34% of the city’s total population (273,780 people) was Asian or Pacific Islander, this ethnic group has an unbelievably low homeless rate, at only 0.13%.xxxii As shown below in Table 4, the next lowest ethnic homeless rate is almost four times greater, and the largest is over 26 times greater. Figure 4: San Francisco’s Homeless by Ethnicity Data Sourced from: San Francisco Planning Department’s “San Francisco Neighborhoods” and “Homeless Point-‐In-‐Time Count & Survey” What is most shocking about the low homeless rate of the Asian/Pacific Islander ethnicity, which is 63% Chinese, is that they have achieved this disproportionately low homeless rate despite consistently having the lowest per capita income across neighborhoods; as shown below in Figure 5, the Asian/Pacific Islander ethnicity has the lowest per capita income in eight out of eleven (73%) of San Francisco’s districtsxxxiii. Figure 5: Per Capita Income by Ethnicity and Supervisorial District Data Sourced from: Dan Kelly’s “Demographic and Poverty Trends in San Francisco” District-‐Level Homeless Estimates Re-‐examining the homeless numbers on the district level, which does not categorize the data by ethnicity, we find that the district that encompasses Chinatown has a very small homeless count. District 3 consists of Chinatown, Nob Hill, Telegraph Hill, Manilatown, and the Financial District. As shown below in Figure 9 6, as of 2013, District 3 had only 393 of the city’s 7,350 homeless persons (5.35%); in contrast, it included about 70,000 people (8.7% of city’s population), of which about 34,000 were Asian/Pacific Islander.xxxiv On the surface, this would also seem to suggest that Chinatown has a small reported homeless rate. Figure 6: Homeless Persons by District Data Sourced from: “Homeless Point-‐In-‐Time Count & Survey” Neighborhood-‐Level Homeless Estimates Chinatown’s residents appear to be economically disadvantaged relative to those in the other sub-‐areas of District 3 (as shown below in Figure 7), which suggests that the majority of District 3’s homeless residents live in Chinatown. However, that would seem extreme given that Chinatown only accounts for about 21% of District 3’s population.xxxv Figure 7: Comparing Socio-‐Economic Disadvantage for District 3 Neighborhoods Data Sourced from: Dan Kelly’s “Demographic and Poverty Trends in San Francisco” and “Homeless Point-‐In-‐Time Count & Survey” Furthermore, the age profile of District 3’s homeless population is largely at odds with the age profile of San Francisco’s Asian/Pacific Islander homeless population (shown below in Figure 8). District 3 has 190 homeless adults and 203 homeless youth; in contrast, the entire San Francisco Asian/Pacific Islander homeless population consists of 322 adults and 37 youth.xxxvi Consequently, if all of the homeless Asian/Pacific Islanders lived in Chinatown (which seems unlikely), they could not account for more than 237 people. This creates a maximum implied Chinatown homeless rate of 1.60%. For comparison, San Francisco has a homeless rate of 0.91%, which is supported by a median household income three times higher than Chinatown’s, renting costs that consume 36% less of household income than in Chinatown, a 10 poverty rate that is 64% lower than Chinatown’s, and an unemployment rate that is 53% lower than Chinatown’s. Even in the scenario that the Asian/Pacific Islander homeless population were concentrated in Chinatown, the number of homeless would seem to be unexpectedly low.xxxvii Figure 8: Homeless Adults & Youth by Ethnicity Data Sourced from: “Homeless Point-‐In-‐Time Count & Survey” Given that this 1.60% homeless rate is a maximum, it may be helpful to calculate a more realistic rate. While the data available for the neighborhoods in District 3 only accounts for about 66% of the District 3 population, dividing up the 393 District 3 homeless persons among the four neighborhoods based on neighborhood poverty may be a useful exercise. As shown below in Figure 9, it would produce a homeless rate for Chinatown of 1.36%. Unfortunately, inconsistent districting makes it impossible to account for all of District 3’s population. This source of uncertainty introduces the potential for error. Figure 9: Attempting to Estimate Homeless Rates for District 3 Neighborhoods with Limited Data Data Sourced from: “San Francisco Neighborhoods” and “Homeless Point-‐In-‐Time Count & Survey” Data Inadequacies The relevant data is fragmented and provided by several separate organizations; the Local Homeless Coordinating Boardxxxviii arranges for point-‐in-‐time homeless counts, the Human Rights Commission8 pieces together data from “a range of sources” to create a citywide demographic report, and the San Francisco Planning Department relies primarily on the 2005-‐09 American Community Survey to create its socio-‐economic neighborhood profiles. These three local government groups have produced a body of data that, when taken together, is both conflicting and incomplete. In addition, 2010 redistricting has made it even more difficult to compare districts and neighborhoods. However, the largest inadequacy of them all may be the methodology of the point-‐in-‐time homeless counts. As Culhane et al. (1994) highlighted, point-‐in-‐time estimates fail to account for the turnover among the homeless; while on any day 0.1% of the population of New York City is homeless, 1% of the population experiences homelessness over the course of a year, with even larger fractions over longer periods.xxxix In addition, HUD’s definition of homelessness is also relatively vague.xl 11 Furthermore, the point-‐in-‐time count methodology may simply be ineffective. While HUD claims these counts “include a complete enumeration of all unsheltered and sheltered homeless persons,” this only requires counting the number of homeless persons occupying “emergency shelters, transitional housing, domestic violence shelters, and institutional housing.”xli Those conducting the count are largely community volunteers and staff from various city departments, having received minimal instruction and directions. The count itself consists of a “visual count” between the hours of 8 PM and midnight on a single day every two years (last conducted January 25, 2013).xlii As Paul Boden, director of the Western Regional Advocacy Project, highlights: “the [homeless] head count…is hit-‐or-‐miss. Point-‐in-‐time counts are a minimum number. They undercount hidden homeless populations.”xliii To illustrate, HUD reported in 2011 that there were 636,017 homeless persons in the country, while the Department of Education simultaneously reported 1,065,794 homeless children enrolled in schools across the country.xliv The San Francisco homeless count (sheltered and unsheltered) found that youth (age 18 and under) make up only 1% of the homeless population; if HUD’s aggregate homeless estimate is little more than half of the youth figure, then the San Francisco point-‐in-‐time estimate may be greatly under-‐counting the true number of homeless. The San Francisco Local Homeless Coordinating Board’s report even admits its difficulty with the counts: “For a variety of reasons, homeless persons generally do not want to be seen, and make concerted efforts to avoid detection.”xlv One of the reasons for missed opportunities appears to be of particular relevance to the Chinatown homeless population: “Homeless families with children often seek opportunities to stay on private property, rather than sleep on the streets, in vehicles, or makeshift shelters.”xlvi Also, as Ed Jew, the only Chinese American on then-‐Mayor Gavin Newsom’s committee to end chronic homelessness, said: “Because of cultural sensitivities, Chinese homeless often do not admit their situation and refuse to go to homeless shelters. As a result, the official estimate of Asian homelessness is probably low.”xlvii Legal Homelessness In December 2001, the Board of Supervisors and the mayor expanded the definition of homelessness to include families with children that live in Single Room Occupancies (SROs), as recommended by the SRO Task Force.xlviii With 592 of the 910 San Francisco Unified School District (SFUSD) students living in SROs residing in the Greater Chinatown area, it would seem reasonable to infer that there are at least 592 legally homeless families as well.xlix A 2005 SRO Families United Association investigation supports this, as it “documented 400 families” living in SROs in Chinatown, making it a point to emphasize the incompleteness of its investigation.l A 2001 SRO Task Force study documented 279 SRO families in Chinatown, and while not quite as large as the 2005 figure (and four years earlier), it similarly adds credibility to the notion that there are a significant number of families living in SROs in Chinatown and that the 2005 figure was not an anomaly.li Armed with an expanded definition of homelessness, we can ask yet another question: does Chinatown now have a large, yet uncounted “legally homeless” population, making use of SROs to avoid actual homelessness? It may. The 2013 point-‐in-‐time homeless count registered only 30 sheltered homeless adults and no sheltered homeless youth in all of District 3. If none of the previously identified SRO families have been recognized as homeless in the counts, and using the SFUSD students as proxies for homeless families, we might be interested to recalculate, extrapolating a likely “legally homeless” rate for Chinatown. Since 134 of the 145 Greater Chinatown SROs lie within approximately 0.1 miles of the post-‐2010 re-‐districted Chinatown, it appears reasonable to also calculate homeless populations and rates under the assumption that all of the SFUSD students are de facto Chinatown residents.lii Although family size cannot be assumed (but it seems reasonable to assume that children under 18 do not live alone in SROs), we can calculate homeless populations for both two-‐person and three-‐person families, in hopes that the two figures may 12 provide for a realistic range, and that the true average family size may lie somewhere in the middle. Our result, which may be low if family sizes are larger than expected, point to a “legal homelessness” rate of 8.1 – 12.2%, or about twice as high as the recalculated homeless rates for District 6 (which includes the Tenderloin and South of Market) and about eight times as high as the recalculated homeless rates for the aggregate San Francisco area.liii In such a case, the HUD Point-‐In-‐Time Homeless Counts would be underestimating the District 3 “legally homeless” population by 301-‐452%, while underestimating the District 6 “legally homeless” population by only 20-‐30% and the San Francisco “legally homeless” population in general by only 25-‐37%.liv Figure 10: Calculating the “Legal Homelessness” Rates with SRO Inference Data Sourced from: Rhorer’s “Fiscal and Policy Implications” The most narrow homeless count was for District 3 (Greater Chinatown and some of the surrounding area), which found only 393 homeless persons. The "poorly housed" estimate assumes that the 592 SFUSD students living in SROs do not live alone, and calculates total "poorly housed" persons for two-‐ person families (the student plus one adult) and three-‐person families (the student plus two adults). While a crude estimate, it is at least a bit more tangible. Thus, our District 3 estimate’s disaggregation includes 393 persons from the point-‐in-‐time homeless count, and either 1184 "poorly housed" persons if each SFUSD student only lives with one adult (two-‐person families) or 1776 "poorly housed" persons if each SFUSD student lives with two adults (three-‐person families). For District 6, the disaggregation includes 3257 persons from the homeless count, and either 650 "poorly housed" with two-‐person families or 975 "poorly housed" with three-‐person families. For San Francisco, the disaggregation includes 7350 persons from the homeless count, and either 1820 "poorly housed" with two-‐person families or 2730 "poorly housed" with three-‐person families. Additional parameters suggest that even these newer, higher estimates may be missing the mark. As shown below in Figure 11, Chinatown has 3226 family households, only 874 of which have children. With an average family household size of 3.2 people, it would seem likely that the majority of these households, if they resided in SROs, would be legally homeless. It may even be reasonable to expect that many of these family households are residing in SROs; this presumption is supported by the large number of occupied SRO units in proximity of Chinatown and the low incomes of most Chinatown households. Figure 11: Additional Parameters to Consider for Estimating Chinatown SRO Families Data Sourced from: “San Francisco Neighborhoods” (7), Rhorer’s “Fiscal and Policy Implications” (16), “Chinatown Livability Score” (9) Total Households 6720 13 Occupied SRO Units Households SRO Rent as % <0.1 Miles From of $15,000 Family Households Average Family Median SRO with Income Chinatown <$15,000 Income Households with Children Household Size Rent % # % # % # 3024 48% 3226 13% 874 3.2 $318 38% 2554 25.4% Households with Income $15,000 $24,999 % # 17% 1142 SRO Rent as Households with SRO Rent as % of $24,999 Income $25,000 % of $49,999 Income -$49,999 Income % # 15.3% 24% 1613 7.6% Better Counts, More Services? The underestimation of de jure, or legally homeless populations in the Chinatown/Greater Chinatown area appears disproportionately large relative to that of other areas. Whenever there exist adequate funds and services to effectively uplift the poor when they are identified, then the population is well served by a more accurate count. The San Francisco Department of Human Services (SFDHS) serves almost 100,000 San Franciscans each year, with the overriding goal of “help[ing] people become socially and economically linked to the resources most members of the community enjoy.”lv SFDHS provides income assistance, employment preparation/placement, and protective services, acting primarily through several main programs and initiatives: California Work Opportunity and Responsibility to Kids (CalWORKS), Care Not Cash, Cash Assistance Programs for Immigrants (CAPI), Childcare, County Adult Assistance Program (CAAP), Family and Children Services (FCS), Food Stamps, Housing and Homeless Division, In-‐Home Supportive Services (IHSS), Medi-‐Cal, and Workforce Development Division.21 There are 201 San Francisco community-‐based projects funded by DHS, and while the locations of the agencies simply correspond to their main offices, and not their service provision, examining the distribution of funding appears to highlight the fact that inadequate attention is given to the Chinatown population.lvi While 2006 data is a bit outdated, there is not a more recent comparably comprehensive analysis of SFDHS’s funding allocation. However, the area allocations have likely remained approximately constant, as a re-‐distribution would likely entail many organizations moving their offices. As shown in Figure 12, the fund allocation to organizations located in the 94108 zip code (which makes up 61% of Chinatown’s population) is disproportionately small relative to the local population, especially in light of their above-‐average socio-‐economic disadvantage. Even re-‐ examining the fund allocation by district in Figure 13 (District 3 entails all of Chinatown as well as Nob Hill, Telegraph Hill, Manilatown, and the Financial District), it still appears that Chinatown is relatively underserved.lvii Figure 12: SFDHS Fund Allocation by Zip Code (2006) Data Sourced from: Human Rights Commission’s “San Francisco Demographic Report” 14 Figure 13: SFDHS Fund Allocation by District (2006) Data Sourced from: Human Rights Commission’s “SF Demographic Report,” and SF Planning Department’s “San Francisco Neighborhoods” * Adds up to >100% because Zip 91445 is counted in both District 2 and District 5 Part of this problem, the seemingly low provision of social services to Chinatown residents, may stem from a lack of awareness or misinformation about the services available, which could suggest to the local government that there is limited need. SRO tenants, who, according to Fribourg (2009), have “historically [been] an “invisible” population, may not be taking full advantage of services for which they are eligible.”lviii Only 63% of San Francisco’s SRO residents are registered for at least one of the ten human service programs available to SRO residents (Figure 14).lix Given that 45.6% of all SRO residents in San Francisco are ethnically Asian/Pacific Islander and that there are 3024 occupied SRO units (out of a total 14,545; 21%) within 0.1 miles of Chinatown, this information would seem to have significant bearing on the Chinatown population.lx Figure 14: Number of Social Service Programs SF’s SRO Residents Participate In Data Sourced from: Rhorer’s “Fiscal and Policy Implications” 40.0% 37.0% 36.0% 30.0% 20.2% 20.0% 10.0% 0.0% 0 1 2 6.3% 3 0.6% 0.0% 4 5 As shown in Figure 15, program usage does not appear predictable or consistent, which reinforces the idea that many SRO residents may not have explicitly selected not to participate in the programs. They may be uninformed or misinformed, or they may wish to avoid the stigma of being labeled as homeless.lxi As further illustration, while all 5,7858 SSI recipients living in SROs are also income-‐eligible for IHSS, only 1,802 individuals (31.1%) receive it.lxii Similarly, there are 704 school-‐age children living in SROs who receive free/reduced-‐price lunches, yet there are only 323 Food Stamps recipients in SROs under the age of 19.lxiii Even though some of the children may not be eligible (eg., due to immigration status), it is likely that more than 46% are eligible. 15 Figure 15: SRO Residents Participation in Social Service Programs Data Sourced from: Rhorer’s “Fiscal and Policy Implications” Total Number of % of Participants Only SRO Participants Registered for this Program Program Name Adult Protective Services (APS) C ounty Adult Assistance Program (C AAP) C alWORKs C ash Assistance Program for Immigrants (C API) 576 34.0% 1495 7.6% 159 0.0% 67 0.0% 2426 18.7% 5 0.0% In-Home Supportive Services (IHSS) 2374 11.2% Medi-C al 4356 50.9% 840 31.0% Food Stamps Foster C are Office on the Aging (OOA) Of course, there are also those who do not want government assistance, and others who cannot prove that they are eligible. The 2013 Point-‐In-‐Time Homeless Count survey found that 30% of those who did not receive government assistance did not want it, 11% did not have identification, and 4% had immigration-‐related issues (Figure 16); it would seem reasonable to extrapolate these results to the SRO population, given that SRO residency may be only marginally better than homelessness. Brownrigg (2006) adds that there are also others who are simply not attached to any city services; such “off-‐the-‐ grid” groups include undocumented immigrants, people who have timed out on aid, and those with criminal histories or mental health issues.lxiv She also finds that, according to several interviewees, “not all SRO residents are willing to accept services,” citing reasons that include immigration status concerns, fear of the government, and uncertainty about how the system works. Figure 16: Homeless Persons’ Reasons for Not Receiving Government Assistance Supplemental Security Income (SSI) 5758 54.7% Data Sourced from: Rhorer’s “Fiscal and Policy Implications” Chinatown’s Residents: Coping With Extreme Poverty While San Francisco’s Chinatown residents appear disproportionately poor, their penury may be dynamic, not static; as Rose Pak, general consultant to the Chinese Chamber of Commerce, explains: “One wave in, one wave out. [Chinatown] will always be a haven and orientation point of newcomers, because of the language and the availability of community social services.”lxv It may be useful to look at Chinatown as having two “populations,” one that is older and stable, another that is transitioning through, using Chinatown as a stepping-‐stone. The role that Chinatown plays as entry point and stepping stone may obfuscate the progress that Chinese immigrants are making; if they are able to socio-‐economically 16 progress enough to exit Chinatown and a new family of immigrants moves in to take their place, then it will appear as though nothing has changed. About 75% of San Francisco’s 283,000 immigrants (212,250) have arrived since 1980, and 22% (62,260) have arrived in the last 10 years.lxvi The Chinese have increased from a 19% share of immigrants to a 28% share as of 2010, currently accounting for 79,240 of all San Francisco immigrants.lxvii Given that Chinatown is typically the first stop for Chinese immigrants, it would seem reasonable to assume that there has been some degree of turnover, which the Chinese Progressive Association (2005) noted as being “frequent” in Chinatown SROs.lxviii However, being able to transcend the destitution of Chinatown may take significant time, and as the process unfolds, the poorest still appear to rely on a pattern of mechanical coping and progress. Coping Mechanism: SRO Residency If the utility of SRO residency did not outweigh the costs, then the population, whatever its size, would not have opted for it. Inexpensive SROs and cultural comfort enable Chinatown’s poorest to make ends meet, to stay off the street, and to fully function in a community that uses their native tongue. However, the accompanying social and linguistic isolation from the wider society deters the older generations from leaving the neighborhood. It is impossible for an outsider to judge whether members of the older generation are happy there. Western standards for wealth may or may not be a good measure for a predominately Asian immigrant population. The cramped, often unsanitary conditions may, in fact, be better than the conditions that the immigrants have left behind. And the personal self-‐sacrifice that empowers a future generation may provide a sense of dignity and worth of its own. Perhaps the older generation hopes that, by providing their children with an education and the stability of a sheltered home, their children may have the opportunity for upward socio-‐economic mobility. Living in Chinatown’s SROs may be one part of calculated self-‐sacrifice. Parents may hope that by sending their children to college, their own hard work will be rewarded with familial success. This can be termed “delayed gratification”– the hope that their children will succeed – and this appears to be the “driving force in their work.” While the National Housing Institute (2006) highlights that concentrated poverty impedes rather than promotes upward socio-‐economic mobility,lxix so does actual homelessness. And many Chinatown residents clearly prefer SRO residency over life on the streets or in shelters. The fact that substantially more Asian/Pacific Islanders (proxy for Chinatown’s residents) choose to live in SROs than any other type of affordable housing (Figure 17) raises questions for future research, including the reasons for this housing preference. Figure 17: Affordable Housing Type by Ethnicity Data Sourced from: Rhorer’s “Fiscal and Policy Implications” Ethnicity Public Housing African American 41.6% Asian/ Pacific Islander 26.8% White 18.6% Latino 10.6% Native American 0.5% Other 1.9% Section 8 31.8% 30.0% 28.1% 9.1% 0.7% 0.3% SRO Hotel 18.2% 45.6% 23.7% 6.5% 0.6% 5.5% The Section 8 Housing Choice Voucher Program requires that households pay 30% of their income towards rent; however, Chinatown’s median SRO rent is only 21.6% of median household income.lxx While public housing may be more affordable, charging only 10% of household monthly income, there are only three public housing buildings in proximity of Chinatown, for a total of 520 units.lxxi Due to Chinatown’s large population of immigrants and the prevalence of linguistic isolation, the cultural 17 comforts of Chinatown likely deter many from leaving the area in search of alternative housing. With 4404 occupied units proximal to Chinatown (Figure 18), it would seem likely that a very substantive portion of Chinatown’s 14,450 residents live in SROs. Children and seniors are very common in Chinatown’s SROs, and with more than 80% of surveyed Chinatown SRO owners reporting an average stay of over a year, it would seem that these SROs largely serve as permanent family households (Figure 20). Figure 18: Comparing the SROs of Different San Francisco Neighborhoods Neighborhood Chinatown Tenderloin SOMA Mission Other Overall Mean Rent ($) 380 724 517 538 881 589 Data Sourced from: Rhorer’s “Fiscal and Policy Implications” Median Rent ($) 318 600 540 600 699 512 Number of Number of Occupied Residential Units Residential Units 5464 4404 8616 6064 2522 1860 1764 1246 1647 971 20013 14545 Figure 19: Rent as a Percent of Household Income Data Sourced from: Area Vibes’ “Chinatown Livability Score” 18 Occupancy Rate 80.6% 70.4% 73.8% 70.6% 59.0% 72.7% Figure 20: Survey Responses from SRO Owners 32/133 Chinatown SROs, 49/309 Non-‐Chinatown SROs Data Sourced from: Rhorer’s “Fiscal and Policy Implications” C haracteristic % of C hinatown SROs % of NonC hinatown SROs Families with C hildren 45.5% 18.4% Seniors Residents with Physical Disabilities Residents with Mental Health Needs Residents that would Benefit from English C lasses Residents that would Benefit from C hildcare 97.0% 80.0% 18.2% 28.6% 18.2% 34.7% 21.2% 6.1% 30.3% 8.2% Unwanted Vacancies Average Vacancy Rate of 0-10% Average Length of Stay of 1 Year or More 27.3% 44.9% 90.9% 44.9% 81.8% 32.7% SRO and Crowding With 75% of Chinatown residents being foreign-‐born and 66% of households in linguistic isolation, the cultural provisions of Chinatown may be a necessity to many; the subsequent demand for affordable housing within and proximal to Chinatown has made SROs a very attractive option, producing overcrowding by U.S. standards. Both HUD and the San Francisco Planning Department define “overcrowding” as more than one occupant per room and “severe overcrowding” as more than 1.5 occupants per room.lxxii As shown in Figure 21, 27% of Asian households were “overcrowded” as of 2000; with more than half of Chinatown’s housing stock in SROs and an average household size of 2.1, it would seem reasonable to expect that there are many foreign-‐born households living in SROs in Chinatown. The Citywide Families in SROs Collaborative performed a study of San Francisco’s SROs in 2001, finding that 62% of SRO families (279 families), averaging 3.4 people each, reside in Chinatown. The average SRO family has lived in their 10 x 10 room for more than four years, and after rent and food costs, has $290 left per month to make ends meet.lxxiii With the average market rate one-‐bedroom apartment in the Chinatown/North Beach area going for about $1600 per month, over 300% more expensive than the average Chinatown SRO rent, upward mobility is not an option for many.lxxiv The result is that most of the housing demand is directed towards SROs and other forms of affordable housing; the subsequent supply shortage and excess demand create the the overcrowding problem. 19 Figure 21: “Overcrowded” Households by Household Ethnicity (2000) Data Sourced from: San Francisco Planning Commission’s “San Francisco General Plan” No. of % of Household Ethnicity Households Households White 9452 5% African American 2495 11% American Indian / Alaska Native 168 13% Asian 21452 27% Native Hawaiian / Pacific Islander 358 40% Other Race 5046 39% Two or More Races 1950 17% Hispanic / Latino 9472 30% All households 40921 The supply/demand imbalance of Chinatown SROs appears to have necessitated the choice of SRO for those wishing to remain within the community borders. The demand for housing and the potential for gentrification (and higher rents) may make residents feel that any complaints would be futile; as one resident said: “It’s no use.”lxxv SROs make up about half of Chinatown’s housing stock, and there are simply few alternatives. Chinatown SROs have limited or no vacancy, District 8 Housing waitlists are long (and the rent is likely more expensive), and public housing options are too limited. The Chinese Progressive Association (2005) found that language barriers, inadequate public transportation, and low incomes have forced many Chinatown immigrants to “put up with Chinatown’s poor housing conditions.”lxxvi A 2005 survey of Chinatown SRO tenants highlights the prevalence of housing, health, and fire code violations; 87% of tenants surveyed reported one code violation and 62% reported multiple code violations.lxxvii Despite this, only 28% of tenants had complained to their landlord about a problem, and only 11% complained to a government agency or community organization about their housing problems.lxxviii Four of the five most reported problems were violations of the Health Code: Insect and Rodent Infestation, Unsanitary Conditions, Noise Disturbances, and Second Hand Smoke Exposure.lxxix Health repercussions have been significant; in a study of families living in Chinatown SROs, 79% reported breathing and respiratory problems, which are the result of a combination of heavy smoking and overcrowding.lxxx If SROs are a necessity, can they be made safer and cleaner? At present, the only advocates for SROs are busy fighting against gentrification. For the time being, it would appear that the work of improving conditions within SROs will remain of secondary importance. SRO as Coping Mechanism The median SRO rent ($318/month) is 38% below that of the aggregate SRO profile ($512/month), and yet the share of households that pay 30% or more of income as rent is larger than that of San Francisco as a whole (Figure 19). These relatively cheap rents may be influenced by widespread long-‐term stay discounts (Figure 18). The bottom line is clear: the residents of Chinatown’s SROs would have difficulty supporting much higher rents elsewhere. In a perfect world, our poorer neighbors would be identified and provided access to affordable housing and jobs that pay a living wage. However, the world is far from perfect, and labeling SRO residents as “homeless,” despite the fact that they have predictable and tangible shelter, could lead to a casual attitude about the value that the SROs actually provide. There is a very big difference between having predictable shelter in an SRO and living with the uncertainty of homelessness. The value of the SRO as a coping mechanism is real, and while SRO residency is certainly not the best-‐case solution for homelessness, it is certainly more desirable than living on the streets or in other shelters. If policy makers fail to recognize the distinction between SRO housing and homelessness, there exists the very real threat of harm. In a city 20 12% with limited land, pressures for development abound. If SROs are seen as having no value, then it would follow that their absence should cause no harm. A developer who follows such logic could argue for replacing them with condominiums for the privileged few. Coping Mechanism: Acceptance of Hardship As Rev. Norman Fong, an advocate for Chinese tenants, explains: “Now, as back then [when his father suffered through the anti-‐Chinese laws of decades past], the Chinese believe if you just put up with it [difficulties, oppression, poor working/living conditions, etc.], you will win. Don’t cause trouble, and you will persevere.”lxxxi This view seems to resonate with those enduring Chinatown’s socio-‐economic hardships; one SRO resident discussed her family during an interview, explaining that they “try to make the best of it.”32 According to Lisa Moy, project coordinator for the SRO Families United Collaborative: “A lot of people coming from overseas don’t know that they have rights, don’t know that it is not right for them to live in such [poor] conditions…Instead, they believe that they are lucky to have a roof over their head.”32 Consequently, a combination of planned toleration and legal ignorance may allow Chinatown’s residents to endure these hardships, but it may also facilitate their continuation. Chinatown’s working conditions are harsh by U.S. standards. In the experience of its residents, however, they may be on par or superior to those they left behind. With little alternative, workers will accept what they can get. A 2010 survey of 433 Chinatown restaurant workers found that 95% received less than a living wage, 50% were earning less than minimum wage, and 31% never even received full payment.lxxxii Dick Lee Pastry, a San Francisco Chinatown restaurant, is a perfect case study for such labor exploitation. The restaurant paid $525,000 in back wages and penalties in 2013 after forcing employees to work 11-‐14 hour days, six days a week, often for no more than $1,100 a month; this amounted to less than $4 an hour, only about 40% of the city’s $9.92 hourly minimum wage at the time of the case’s filing.lxxxiii The 2010 survey also found that only 3% of the 433 Chinatown restaurant workers received health insurance from their employer, 25% reported a significant level of psychological stress, and 95% of the surveyed workers did not speak English well.lxxxiv The survey also found that work-‐related injury rates were high, with 48% of workers reporting work-‐related burns, 40% reporting cuts, and 17% reporting falls in the previous year; this may have even been the fault of the restaurants, as “observations documented a high frequency of occupational hazards, a lack of protective safety equipment…[and] a substantial lack of compliance with local and state employee labor law notification requirements.” lxxxv Yet despite such terrible pay, working conditions, and general employer unconcern, the multi-‐faceted issue of poor working conditions went largely unnoticed to those outside Chinatown prior to the 2010 study, which was externally spearheaded by the Chinese Progressive Association (CPA) and the Labor Occupational Health Program. Because the severity of worker exploitation was externally discovered, not internally revealed, the Chinatown restaurant workers’ plight could have continued unnoticed for quite some time if the study had not been performed. One worker explains the lack of complaints as stemming from workers’ fear of losing their jobs: “If you want to complain, I’ll just fire you!”lxxxvi Dr. Ling-‐Chi Wang, professor emeritus at UC Berkeley and founder of Chinese for Affirmative Action, elaborates: “Most of the residents are not in Chinatown by choice but [out of] necessity. It’s a transition from China. They come to work, eventually save money and move, or so they hope.”lxxxvii As Shaw San Lui of the Chinese Progressive Association said: “This is the first time it is coming into public light how bad [workers’ rights abuses are].”lxxxviii Only following the report’s release has the issue been “put…on the front burner for the Board [of Supervisors].”lxxxix This endurance of hardship essentially equates to toleration, and appears to be taken as such. It is possible that a similar lack of resistance to exposing poor housing conditions may allow Chinatown SROs to remain of poor quality; from 1998-‐2002, there were a total of 208 cases of housing discrimination complaints filed by renters in San Francisco, yet none were by Asians.xc 21 If anything, the quiet acceptance and endurance of such hardship may only serve to reinforce the “model minority” stereotype of Asian Americans. As Chang (1993) explains: “Asian Americans are portrayed as hardworking, intelligent, and successful,” which allows society to “justify ignoring the unique discrimination faced by Asian Americans…[and] permits the general public, government officials, and the judiciary to ignore or marginalize the contemporary needs of Asian Americans.”37 As the Japanese Americans Citizen League (2008) was quick to point out, more Asian Americans are enrolled in community colleges than in public or private universities, and national SAT scores, which are highest for the Asian ethnic group, are not high across the board, but rather, correlated with the income and education level of the student’s family.xci Chang (1993) and JACL (2008) both highlight the dangers of the “model minority” stereotype; the stereotype suggests that a racial minority may be naturally more equipped for success, which could disincentivize targeted outreach or social spending.xciixciii The lumping together of Asians into one group can be misleading, in itself, and all this taken together helps to hide the severity of the hardship endured by many in Chinatown. Education: Hoping for the Next Generation’s Success Chinatown’s immigrants, often socio-‐economically disadvantaged and immobile, appear to have accepted lives of enduring hardship; yet while they may have given up hope for themselves, they have not given up hope for their children. As PBS’s Susan Han candidly explains: “The Chinese value education as a stepping stone to success, and [their] children…are under a lot of pressure to excel in school.”xciv Huang (2012) argues that this belief has Confucian roots: “Education is associated with a person’s class. In old Chinese society (770 BC – 1910’s), success [was] defined by class, [and] scholars [were of the] highest class.”xcv The broader push for Asian or Chinese immigrant children to excel in school is complemented by the children’s reciprocal desire to excel and succeed. Higher educational attainment seems to result from such parental prodding. Kao (1995) and Zhou (2000) support this view, arguing that Asian immigrant parents assume a strong role in their children’s education by encouraging high aspirations and promoting academic achievement.xcvixcvii xcviii Louie (2004) conducts interviews with second-‐generation Chinese (American-‐born children of Chinese immigrants), noting three general themes: 1) Chinese culture’s emphasis on education has led to a prevalence of immigrant optimism (the belief that education, especially in the US, can contribute to upward mobility). The belief that higher educational achievement is needed to offset potential discrimination (immigrant pessimism) also appears to incentivize educational achievement; 2) Despite similar parental expectations for children’s educations across socio-‐economic classes, middle-‐class children often receive more direct parental involvement than working-‐class children, who often feel that they must rely on their own abilities; 3) Children of all classes feel a similar sense of reciprocal duty to their parents, which is only augmented by their perception of their parents’ sacrifice, as migration often costs them their language fluency, culture, and status.xcix Fuligni (2006) supports the connection between family obligation and education, finding that a stronger sense of familial obligation is linked with a higher value of education.c Fuligni also finds that Chinese immigrants (first, second, and third generations) all place a higher value on family obligation than do European immigrants of any generation, implying that they also place a higher value on education.ci 22 Evidence for a Reliance on Education Second-‐generation immigrants, as a whole, are often an embodiment of an intergenerational transfer of hope, seeking the education that may allow them to realize their parents’ hope for future upward socio-‐ economic mobility. As Cruz (2009) highlights through regression analysis (not controlled for race), first-‐ generation and second-‐generation immigrant youth complete more schooling, on average, than their third-‐generation counterparts (0.91 and 0.71 years more, respectively).cii Often, education is seen as a means for attaining a better life. While poverty and limited English in the household both serve to mitigate this effect to some extent, the optimist theory of immigration appears to have anecdotal support; recent immigrants appear to have greater faith in the use of education to achieve upward mobility than those of more established racial/ethnic minority peers in the second or third generation. Paul, the son of a Chinatown contractor and a seamstress, explained that he “force[s himself] to study [because] it’s something that’s required.”ciii Louie’s (2004) interviews found that some children strive for educational achievement because of their parents’ sacrifice; according to one: “My dad threw [it] all away, came here, started at the bottom of the totem pole, [and] sacrificed almost everything for myself and my brother.civ I think that’s one of the reasons why I feel that I kind of owe a lot to them, [why I] work my butt off in school.”cv Others believe that educational success is needed to overcome racial discrimination: “Being Chinese will never be a plus, it will always be something against you. My father wanted us to be smarter; your acceptance is through merit. You’ll make it in because you have the criteria, not because you’re what they’re looking for.”cvi Local education data suggests that these outlooks, whether filial or pessimistic, have succeeded in motivating Chinatown’s immigrant youth. San Francisco Unified School District’s Asian student population (2011: 37% of the total SFUSD population is Asian, and 25% of the total is Chinesecvii) has consistently had the highest graduation rates and the lowest dropout rates, as shown below in Figure 22. The 2011-‐12 5.4% Asian student dropout rate provides for a sharp contrast with the 60% of Chinatown residents who have had less than a high school education (Figure 1). The Chinatown population’s low educational attainment is likely skewed downward by the significant middle-‐ and old-‐age populations and large proportion of immigrants; 70% of Chinatown residents are older than 35, and 75% are foreign-‐ born.cviii It would seem that Chinatown’s youth are breaking the trend of the older Chinatown residents, as current graduation rates approach 90%, approximately 1.5x the graduation rate of the general Chinatown population. Furthermore, they may even be receiving a higher quality of education than their peers; the percentage of SFUSD children in Chinatown SROs with special education status is not only substantially lower than that of children in SROs in other neighborhoods, but also much lower than that of the overall SFUSD (Figure 23). Consequently, the SFUSD Asian youth are not simply “going through the motions” so that they can graduate, but actually excelling. It would seem that Chinatown’s youth and their parents have the same view of education that Huang (2012) found to hold across most Asian groups: “[Chinese society] believe[s] that educational success leads to a better life, including higher social status, getting a good job, [and having] a better marriage and relationships.”cix 23 Figure 22: San Francisco Unified School District (SFUSD) High School Results By Ethnicity Data Sourced From: California Department of Education’s “Cohort Outcome Summary Report by Race”cx Figure 23: SFUSD SRO Children by Neighborhood with Special Education Status Data Sourced from: Rhorer’s “Fiscal and Policy Implications” The Shortcomings of This “Coping” While some assert that the Chinatown residents’ method of “coping” with poverty may be effective and may even allow for long-‐term familial socio-‐economic transcendence, others point out that SRO utilization and self-‐sacrifice can be counter-‐productive for the adult immigrant resident in the short-‐ term. The Brookings Institute (2010) finds that concentrated poverty results in higher crime rates, underperforming public schools, poor housing and health conditions, and limited access to private services and job opportunities.cxi Rachel Drews (2006) adds both support and expansion, finding that living in concentrated poverty can make it more difficult to achieve upward socio-‐economic mobility because of the “mismatch between where people live and where [good] jobs are available.”cxii This suggests that moving to a less impoverished area can improve opportunities for all generations: job opportunities for the adults, education quality for the children, and living conditions and social service support for the entire family. 24 Gennetian and Sanbonmatsu (2013) examine some of the less-‐obvious problems created by living in concentrated poverty, finding that living in areas of poverty concentration – areas such as Chinatown – has a negative effect on markers of mental and physical health.cxiii Consequently, whether leaving Chinatown would promote advantages or reduce disadvantages, escaping from concentrated poverty is clearly indicative of progress. However, whether or not leaving SROs constitutes such an escape, at present, is still open to debate. 25 Conclusions and Recommendations Who can imagine a San Francisco without a Chinatown? San Francisco is very much enriched by the presence of the cultural heritage that Chinatown offers residents and many visitors. At the same time, San Francisco’s Chinatown, with its predominantly Chinese immigrant population, is arguably the most socio-‐ economically disadvantaged neighborhood in San Francisco. Yet even with high poverty and unemployment, its residents manage one of the lowest rates of measured homelessness. While not ideal by Western standards, one main coping mechanism that has worked to keep true homelessness down is SRO residency. We offer the following suggestions, for whoever might be interested, to assist our neighbors in San Francisco’s Chinatown: 1. Empower the Residents Chinatown’s residents are at a linguistic and cultural disadvantage when compared to other minority groups. Provide adult learners with ESL (English as a Second Language) education, to break down the language barriers, and provide training in civics for self-‐advocacy. Realizing that adult workers have difficulty making time for such classes without mind-‐numbing tradeoffs, provide incentives, such as paying-‐per-‐attendance. Such a combination of training has the potential to help the residents of Chinatown grow comfortable with the greater environment, not only offering them job opportunities outside the boundaries of Chinatown, but also affording them a greater voice within our legal framework. Residents could then more effectively advocate for cleaner, safer SROs, as well as safer, more equitable working conditions. 26 2. Build Bridges Although America provides a wealth of opportunity to immigrants, we have not yet transcended the issue of race. Any efforts that will promote greater understanding between the greater population and the ethnic Chinese community would be useful. Such efforts could include information about the poverty within Chinatown. Few people are aware that Chinatown is one of San Francisco’s poorest neighborhoods, and even fewer know about the terrible working and living conditions that many of the neighborhood’s residents are forced to endure. Dispelling the “model minority” myth, reducing interracial discomfort, and revealing Chinatown for the reality beneath its tourist attraction surface could attract greater support for the needs of Chinatown’s residents. 3. Capture Better Data The analysis in this paper was hindered by limited and conflicting data. We would have found better data in the following areas to be quite useful: 1) Accurate counts of families living in SROs in Chinatown; 2) Clarity in data regarding utilization rates of social services by Chinatown residents relative to residents of other neighborhoods; and 3) Modified point-‐in-‐time homeless counts offering two counts for each district: the truly homeless (de facto) and the legally homeless (de jure). Such a modification would avoid undercounting SROs’ “poorly housed” populations, but in such a way as to mitigate the unintended consequence of conflating SRO life with true homelessness. 4. Perform Scholarly Research Poor residents have to make intelligent decisions with extremely limited resources. They are very aware of their plight, and they are doing the best they can, given the choices available. By researching what they, themselves, feel would be helpful, researchers will be in a better position to make recommendations for change. In addition, sociological studies could shine a light on the Chinatown community, also aiding in mutual understanding. They would also help policy makers in crafting solutions that would really work. Since many other communities of concentrated poverty face similar problems, research on issues affecting Chinatown’s residents may provide greater insight. Questions of concern include: Are there in fact, two communities – one transitioning through, another permanent – in Chinatown? If so, in what way does each community experience socio-‐economic mobility? In what unique ways do Chinatown’s residents cope with deep poverty? What are the motivations and choices of members of the community? In presenting a brief history of Chinatown’s SROs and analyzing the available data, along with a few suggestions, we hope to spark greater interest in – and support of – one of San Francisco’s historic neighborhoods, and the residents who live within its borders. 27 ENDNOTES i This size was suggested by the Central City SRO Collaboration, http://www.ccsro.org/pages/history.htm and accessed September 29, 2013. ii Lowes Online storage shed product #3169189 http://www.lowes.com/pd_147118-‐75128-‐ 60005_0__?productId=3169189 and accessed September 20,2013. iii Hewlett Packard Vantage Point touch screen found online at http://www.geek.com/news/hps-‐massive-‐vantagepoint-‐ touchscreen-‐covers-‐80-‐square-‐feet-‐1458939/ and accessed September 20, 2013. iv According to CNN, http://www.cnn.com/2011/LIVING/02/08/shrinking.american.cubicle/index.html?hpt=C2. Web. 20 September 2013. vi Lee, Stephanie. "SF Chinatown's Stockton Could Get More Elbow Room." SFGate. N.p., 14 Mar. 2012. Web. 18 July 2013. <http://www.sfgate.com/bayarea/article/SF-‐Chinatown-‐s-‐Stockton-‐could-‐get-‐more-‐elbow-‐room-‐3406853.php>. vii Ibid. viii Irwin, Mary Ann. "The Children of Chinatown: Growing Up Chinese American in San Francisco, 1850-‐1920." JSTOR. N.p., Feb. 2011. Web. 18 July 2013. <http://www.jstor.org/stable/10.1525/phr.2011.80.1.140>. ix Wang, Ling-‐Chi. "Chinese Americans." Countries and Their Cultures. Advameg, Inc., 2013. Web. 18 July 2013. <http://www.everyculture.com/multi/Bu-‐Dr/Chinese-‐Americans.html>. x Ibid. xi Ibid. xii "The Story of Chinatown." Chinatown Resource Guide. PBS, n.d. Web. 18 July 2013. Online at http://www.pbs.org/kqed/chinatown/resourceguide/story.html and accessed August 16, 2013. xiii Ibid. xiv Immigrants’ intent to return to China was so culturally ingrained that the Chinese phrase “fallen leaves return to their roots” (落叶归根:luòyè-‐guígēn) was commonly ascribed to those in their community. xv "The Story of Chinatown." Chinatown Resource Guide. PBS, n.d. Web. 18 July 2013. Online at http://www.pbs.org/kqed/chinatown/resourceguide/story.html and accessed August 16, 201 #3 #5 xvi Ibid. xvii Ibid. xviii Occ. xix Occ. xx Skeldon, Ronald. Reluctant Exiles? Migration from Hong Kong and the New Overseas Chinese. Hong Kong: Hong Kong University Press, 1994. Print. xxi "San Francisco Neighborhoods: Socio-‐Economic Profiles." San Francisco Planning Department, May 2011. Web. 18 July 2013. <http://www.sf-‐planning.org/Modules/ShowDocument.aspx?documentid=8501>. xxii Ibid. 28 xxiii Haines, David W., and Carol A. Mortland. Manifest Destinies: Americanizing Immigrants and Internationalizing Americans. Westport, Conn: Praeger, 2001. Print. xxiv Ibid. xxv San Francisco Neighborhoods: Socio-‐Economic Profiles xxvi Kelly, Dan. "Demographic and Poverty Trends in San Francisco." San Francisco Human Services Agency, 18 June 2011. Web. 18 July 2013. xxvii "Chinatown Livability Score." Livability Scores. AreaVibes Inc., 2013. Web. 18 July 2013. <http://www.areavibes.com/san francisco-‐ca/chinatown/livability/>. xxviii "Chinatown Neighborhood (SF) Detailed Profile." Detailed Profiles. City-‐data.com, 2013. Web. 18 July 2013. <http://www.city-‐data.com/neighborhood/Chinatown-‐San-‐Francisco-‐CA.html>. xxix Endnote 7 xxx Endnote 7 xxxi "2013 San Francisco Homeless Point-‐In-‐Time Count & Survey." City and County of San Francisco, 2013. Web. 18 July 2013. <http://www.sfgov3.org/modules/showdocument.aspx?documentid=4818>. xxxii San Francisco Neighborhoods: Socio-‐Economic Profiles. xxxiii Kelly, Dan. xxxiv Ibid, Occ. xxxv Kelly, Dan. xxxvi 2013 San Francisco Homeless Point-‐In Time Count & Survey. xxxvii Ibid, Occ. xxxviii 2013 San Francisco Homeless Point-‐In Time Count & Survey. xxxix Culhane, Dennis P. "The cost of homelessness: A perspective from the United States." european Journal of Homelessness 2.1 (2008): 97-‐114. xl "2011 San Francisco Homeless Point-‐In-‐Time Count & Survey." City and County of San Francisco, 2011. Web. 18 July 2013. <http://www.sfgov3.org/Modules/ShowDocument.aspx?documentid=787>. xli Ibid. xlii 2013 San Francisco Homeless Point-‐In Time Count & Survey. Note: The street count is complemented by a shelter and institution count, which includes homeless in emergency shelters and transitional housing programs, and incorporates persons self-‐identifying as homeless that were staying at other facilities. xliii Boden, Paul. "Homeless Head Counts Help No One." SFGate. San Francisco Chronicle, 5 Feb. 2013. Web. 19 July 2013. <http://www.sfgate.com/opinion/openforum/article/Homeless-‐head-‐counts-‐help-‐no-‐one-‐4254191.php>. xliv Ibid. xlv Ibid. xlvi Ibid. xlvii 20 Hsu, Isabella. "Homeless Chinese: Uncounted and Invisible." World Journal. New America Media, 3 Nov. 2005. Web. 19 July 2013. <http://news.newamericamedia.org/news/view_article.html?article_id=155b1952237dda50555fd34931ff258b>. 29 xlviii Rhorer, Trent. "Fiscal and Policy Implications for Single Room Occupancy Hotels." Department of Aging and Adult Services, 2 Nov. 2009. Web. 18 July 2013. <http://www.sfhsa.org/asset/ReportsDataResources/CollectedSROReports.pdf>. xlix Rhorer, Trent. Note: The “Chinatown” referred to in the Fribourg (2009) paper is based on the pre-‐2010 re-‐districting area, which includes the current Chinatown area, as well as parts of the Financial District, North Beach, and Russian Hill. This “Chinatown” has a total neighborhood population of 41,566, compared with the 14,850 of the post-‐2010 re-‐districting Chinatown. l Miranda, Leticia. "What San Francisco Chinatown Tourists Won’t See." Color Lines. Applied Research Center, 29 Dec. 2009. Web. 19 July 2013. <http://colorlines.com/archives/2009/12/what_san_francisco_chinatown_tourists_wont_see.html>. li "Report on the Census of Families with Children Living in Single Room Occupancy Hotels in San Francisco." The Citywide Families in SROs Collaborative, 23 Oct. 2001. Web. 18 July 2013. <http://www.sfdph.org/dph/files/reports/StudiesData/SROs/FamiliesChildreninSROs.pdf>. lii Rhorer, Trent. liii San Francisco Neighborhoods: Socio-‐Economic Profiles AND ALSO #11. liv #11 lv "San Francisco Demographic Report: December 2006." Human Rights Commission, Dec. 2006. Web. 18 July 2013. <http://www.sf-‐hrc.org/modules/showdocument.aspx?documentid=1792>. lvi Ibid. lvii San Francisco Neighborhoods: Socio-‐Economic Profiles lviii Rhorer, Trent. lix Ibid. lx Ibid. lxi Ibid. lxii Ibid. lxiii Ibid. lxiv Brownrigg, Leslie A. "People Who Live in Hotels: An Exploratory Overview." Survey Methodology (2006): 3. lxv Reynolds, Christopher. "A New Look at Old Chinatown in San Francisco." Travel. The Seattle Times, 13 Apr. 2007. Web. 19 July 2013. <http://seattletimes.com/html/travel/2003663755_webchinatown15.html>. lxvi "San Francisco: 2008-‐2010 Data Profile." University of Southern California, 2011. Web. 22 July 2013. <http://csii.usc.edu/documents/SANFRANCISCO_web.pdf>. lxvii Ibid. lxviii "Substandard Housing Conditions in San Francisco Chinatown." Health Impacts. Chinatown Progressive Association, Aug. 2005. Web. 22 July 2013. <http://www.cpasf.org/sites/default/files/HousingHealthRptFINAL.pdf>. lxix Drew, Rachel. "The Truth About Concentrated Poverty." Shelterforce Online. National Housing Institute, Fall 2006. Web. 22 July 2013. <http://www.nhi.org/online/issues/147/concentratedpoverty.html>. lxx "Programs." San Francisco Housing Authority. San Francisco Housing Authority, 2012. Web. 22 July 2013. <http://sfha.org/Programs.html>. 30 lxxi Ibid. lxxii "San Francisco General Plan." San Francisco Planning Commission, Mar. 2011. Web. 22 July 2013. <http://www.sf-‐ planning.org/ftp/General_Plan/Housing_Element_Part_I_Data_Needs_Assmt_CPC_Adopted.pdf>. lxxiii Report on the Census of Families with Children Living in Single Room Occupancy Hotels in San Francisco. lxxiv Sparks, Theresa. "Rapid Re-‐Housing Program." Statement of Possible Impact. Human Rights Commission Equity Advisory Committee, 2010. Web. 22 July 2013. <http://www.sf-‐hrc.org/modules/showdocument.aspx?documentid=397>. lxxv Hua, Vanessa. "Chinatown: Housing Riddled with Violations." SFGate, 23 Sept. 2005. Web. 22 July 2013. <http://www.sfgate.com/bayarea/article/CHINATOWN-‐Housing-‐riddled-‐with-‐violations-‐2567854.php>. lxxvi Health Impacts. lxxvii Health Impacts. lxxviii Health Impacts. lxxix Ibid. lxxx Ibid. lxxxi Ward, Brant. "Chinatown Family Life -‐ What Tourists Don't See." SFGate. SFGate, 29 Dec. 2009. Web. 22 July 2013. <http://www.sfgate.com/news/article/Chinatown-‐family-‐life-‐what-‐tourists-‐don-‐t-‐see-‐3277393.php>. lxxxii Gaydos, Megan, et al. "Promoting health and safety in San Francisco's Chinatown restaurants: findings and lessons learned from a pilot observational checklist." Public Health Reports 126.Suppl 3 (2011): 62. lxxxiii Cote, John. "SF Restaurant Pays Back Wages, Fines." SFGate. N.p., 13 Feb. 2013. Web. 22 July 2013. <http://www.sfgate.com/crime/article/SF-‐restaurant-‐pays-‐back-‐wages-‐fines-‐4273029.php>. lxxxiv Gaydos, Megan, et al. lxxxv Ibid. lxxxvi Jayaraman, Saru. "Restaurants and Race." Race, Poverty & the Environment 18.1-‐2011. lxxxvii Ibid. lxxxviii Sanchez, Don. "SF Chinatown Restaurant Owners Scrutinized." San Francisco News. ABC7 News, 17 Sept. 2010. Web. 22 July 2013. <http://abclocal.go.com/kgo/story?section=news/local/san_francisco&id=7674899>. lxxxix Ibid. xc San Francisco Demographic Report: December 2006. xci "An Unnoticed Struggle: A Concise History of Asian American Civil Rights Issues." Japanese American Citizens League, 2008. Web. 22 July 2013. <http://www.jacl.org/public_policy/documents/An Unnoticed Struggle.pdf>. xcii Ibid. xciii Chang, Robert. "Legal Implications of the Model Minority Myth." California Law Review, Oct. 1993. Web. 22 July 2013. <http://www.modelminority.com/joomla/index.php?option=com_content&view=article&id=394:legal-‐implications-‐of-‐the-‐ model-‐minority-‐myth-‐&catid=42:law&Itemid=56>. xciv Han, Susan. "China's History and Culture." PBS. PBS, 2013. Web. 22 July 2013. <http://www.pbs.org/kcts/preciouschildren/china/cultural.html>. xcv Huang, Grace. "Confucianism and Chinese Families: Values and Practices in Education." International Journal of Humanities and Social Science, 2012. Web. 22 July 2013. <http://www.ijhssnet.com/journals/Vol_2_No_3_February_2012/2.pdf>. 31 xcvi Kao, G. (1995). Asian Americans as model minorities? A look at their academic performance. American Journal of Education, 103, 121–159. xcvii Kao, G., & Tienda, M. (1995). Optimism and achievement: The educational performance of immigrant youth. Social Science Quarterly, 76(1), 1–19. xcviii Zhou, M. (2000). Social capital in Chinatown: The role of community-‐based organizations and families in the adaptation of the younger generation. In M. Zhou & J. Gatewood (Eds.), Contemporary Asian America: A multidisciplinary reader. New York: New York University Press. xcix Louie, Vivian. "The Role of the Family in the Educational Experiences of Second-‐Generation Chinese American." Harvard Family Research Project, Sept. 2004. Web. 22 July 2013. <http://www.hfrp.org/publications-‐resources/browse-‐our-‐ publications/the-‐role-‐of-‐the-‐family-‐in-‐the-‐educational-‐experiences-‐of-‐second-‐generation-‐chinese-‐americans>. c Fuligni, Andrew. "Family Obligation Among Children In Immigrant Families." The Migration Information Source. UCLA, July 2006. Web. 22 July 2013. <http://www.migrationinformation.org/Feature/display.cfm?ID=410>. ci Ibid. cii Cruz, Vanessa. "Educational Attainment of First and Second Generation Immigrant Youth." Urban Institute, 2008. Web. 22 July 2013. <http://www.urban.org/uisa/upload/UISA-‐Brief-‐5.pdf>. ciii Occ. civ Louie, Vivian. cv Ibid. cvi Louie, Vivian. cvii Tung, Wai Yip. "SFUSD School Assignment by Ethnicity." TungWaiYip, 2013. Web. 22 July 2013. <http://tungwaiyip.info/blog/2011/03/21/sfusd_school_assignment_by_ethnicity>. cviii San Francisco Demographic Report: December 2006. cix Huang, Grace. cx "Cohort Outcome Summary Report by Race." California Department of Education Data Reporting Office, 11 Mar. 2013. Web. 23 July 2013. <http://dq.cde.ca.gov/dataquest/CohortRates/GradRates.aspx?Agg=D> cxi "Concentrated Poverty." Concentrated Poverty. The Brookings Institute, 2013. Web. 23 July 2013. <http://www.brookings.edu/research/topics/concentrated-‐poverty>. cxii Drew, Rachel. cxiii Lisa, Gennetian, and Jens Ludwig. "Why Concentrated Poverty Matters." Pathways, Spring 2013. Web. 23 July 2013. <http://www.nhi.org/online/issues/147/concentratedpoverty.html>. 32


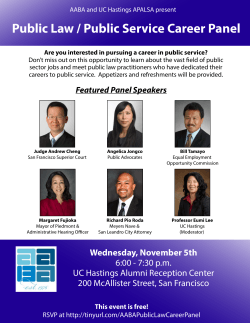


© Copyright 2026