
the role of electrical energy storage in the 2020 all island of ireland
T HE R OLE OF E LECTRICAL E NERGY S TORAGE
IN THE 2020 A LL I SLAND OF I RELAND P OWER
S YSTEM
U NIVERSITY C OLLEGE D UBLIN
S CHOOL
OF
E LECTRICAL , E LECTRONIC
AND
C OMMUNICATIONS E NGINEERING
I RENE D ANTI L OPEZ
Supervision by Dr. Damian Flynn
A PRIL 2015
The thesis is submitted to University College Dublin in part fulfilment of the
requirements for the degree of Master of Electrical Energy Engineering
Abstract
Traditional power systems were designed for the operation of fully dispatchable
generation plant. The large-scale addition of non-dispatchable generation, such
as wind and solar power, has brought about technical and economic challenges,
spurring interest in electrical energy storage (EES) technologies.
The main focus of the study presented is to assess the value of compressed air
energy storage and lithium ion battery energy storage in the 2020 All Island of
Ireland power system. To do so, the impact of installing EES in the island of
Ireland in terms of: system operation, generation costs, electricity prices and
wind curtailment is analysed. Moreover, the value of energy storage is compared
to the that of a new high-voltage direct-current link from the island of Ireland to
France.
Economic analyses are conducted to evaluate the feasibility of the technologies
considered from system and investor perspectives. A review of the potential revenue streams that may arise in 2020, remunerating the services rendered by
electricity storage, is provided for the investor analysis.
The technologies considered are found to bring significant benefits to the operation of the All-Island power system in terms of generation cost and electricity
price reductions. Electrical energy storage was found to be more effective at the
reduction in wind curtailment than the Ireland - France interconnector. Accounting for the capital costs of the assets, indicates the profitability of the different
technologies considered depends on the economic scenario and on the generation portfolio.
ii
Acknowledgements
I would like to thank everyone whose help and support contributed to the development of this thesis, there are some without whom this work would have not
been possible:
Dr. Damian Flynn, for accepting the supervisor role of this project, whose guidance and expertise has been invaluable throughout the project’s development.
Ciara O’Dwyer, for her constant support and advice, who has always found time
to share her expertise and knowledge of modelling and power systems with me.
The Energy Policy Modelling Group at University College Cork, for providing the
base model upon which the project’s test system was built.
Timothée Hinchliffe and Dr. Xian He, from Électricité de France, for their time,
encouragement and insightful ideas.
All the occupants of Room 247 over the course of the last year, for creating a
great working atmosphere.
Finally, I would like to thank my family and friends, whom I value greatly, for
their encouragement and constant support.
C ONTENTS
1 Introduction
1
2 Literature Review
5
3 Electrical Energy Storage
3.1 Applications
10
. . . . . . . . . . . . . . . . . . . . . . . . . . . . . . . .
10
3.2 Technology options . . . . . . . . . . . . . . . . . . . . . . . . . . . .
14
3.2.1 PHS
. . . . . . . . . . . . . . . . . . . . . . . . . . . . . . . . .
16
3.2.2 CAES . . . . . . . . . . . . . . . . . . . . . . . . . . . . . . . . .
17
3.2.3 FES
. . . . . . . . . . . . . . . . . . . . . . . . . . . . . . . . .
18
3.2.4 NaS . . . . . . . . . . . . . . . . . . . . . . . . . . . . . . . . . .
18
3.2.5 Li-ion . . . . . . . . . . . . . . . . . . . . . . . . . . . . . . . . .
19
i
3.2.6 Pb-acid
. . . . . . . . . . . . . . . . . . . . . . . . . . . . . . .
20
3.2.7 Redox flow . . . . . . . . . . . . . . . . . . . . . . . . . . . . . .
20
3.2.8 NiCd . . . . . . . . . . . . . . . . . . . . . . . . . . . . . . . . .
21
3.2.9 Supercapacitors and DCLs . . . . . . . . . . . . . . . . . . . .
22
3.2.10SMES . . . . . . . . . . . . . . . . . . . . . . . . . . . . . . . .
22
3.2.11TES . . . . . . . . . . . . . . . . . . . . . . . . . . . . . . . . . .
23
4 Methodology and Test System
26
4.1 Modelling software . . . . . . . . . . . . . . . . . . . . . . . . . . . . .
26
4.2 Test system . . . . . . . . . . . . . . . . . . . . . . . . . . . . . . . . .
28
4.2.1 Base model: Academic North-West European Electricity Market Model 2020 . . . . . . . . . . . . . . . . . . . . . . . . . . .
28
4.2.2 Modifications and additions made to the base model . . . . .
34
4.3 Test system limitations . . . . . . . . . . . . . . . . . . . . . . . . . .
43
5 Results
45
5.1 Analysis from a system perspective . . . . . . . . . . . . . . . . . . .
5.1.1 System costs, operation and wind curtailment
ii
. . . . . . . .
46
49
5.1.2 Synergies between sources of flexibility . . . . . . . . . . . . .
58
5.1.3 Net present value analysis . . . . . . . . . . . . . . . . . . . .
60
5.2 Analysis from an investor perspective . . . . . . . . . . . . . . . . . .
65
5.2.1 Identified potential revenue streams
. . . . . . . . . . . . . .
65
5.2.2 Net present value analysis . . . . . . . . . . . . . . . . . . . .
70
6 Conclusion and Future Work
79
iii
L IST
OF
F IGURES
3.1 Electricity storage applications throughout the electricity value chain
(Rastler, 2010) . . . . . . . . . . . . . . . . . . . . . . . . . . . . . . .
13
3.2 Applications of energy storage technologies (Rastler, 2010) . . . . .
13
4.1 Generation mix in 2012 and model predictions for 2020 ((CER,
2012),(EirGrid and SONI, 2014a)) . . . . . . . . . . . . . . . . . . . .
30
4.2 Start-up cost interpolation . . . . . . . . . . . . . . . . . . . . . . . .
32
4.3 HVDC Interconnection between the island of Ireland and Great Britain 39
5.1 CAES operation
. . . . . . . . . . . . . . . . . . . . . . . . . . . . . .
51
5.2 CAES generation and POR provision . . . . . . . . . . . . . . . . . .
52
5.3 BES operation . . . . . . . . . . . . . . . . . . . . . . . . . . . . . . .
54
5.4 BES generation and POR provision . . . . . . . . . . . . . . . . . . .
55
iv
5.5 AII-FR interconnector flows and electricity price in the AII . . . . . .
56
5.6 Percentage change in generation from EES and natural gas compared to base case: base wind scenario . . . . . . . . . . . . . . . . .
59
5.7 Break-even capital cost of CAES (Me) from investor perspective . .
74
5.8 Break-even capital cost of BES (Me) from investor perspective . . .
74
v
L IST
OF
T ABLES
3.1 Energy storage applications and descriptions . . . . . . . . . . . . .
12
3.2 EES technologies . . . . . . . . . . . . . . . . . . . . . . . . . . . . . .
14
3.3 Technical operational parameters of EES technologies (IRENA and
IEA-ETSAP, 2012) (Rastler, 2010) (Divya and Ostergaard, 2009) (IRENA
and IEA-ETSAP, 2013) . . . . . . . . . . . . . . . . . . . . . . . . . .
25
4.1 Fuel cost with sample CO2 tax of e30 per GJ . . . . . . . . . . . . .
31
4.2 Operating reserve definitions (EirGrid and SONI, 2014b)
. . . . . .
38
. . . . . . . . . . . . . . . . . . . . . .
41
4.4 Li-ion BES modelling details . . . . . . . . . . . . . . . . . . . . . . .
42
5.1 AII power system scenarios . . . . . . . . . . . . . . . . . . . . . . . .
46
5.2 Results
47
4.3 CAES plant modelling details
. . . . . . . . . . . . . . . . . . . . . . . . . . . . . . . . . . .
vi
5.3 Percentage decrease in generation and reserve provision
. . . . . .
48
5.4 Break-even capital cost (Me) (Base wind) . . . . . . . . . . . . . . . .
62
5.5 DS3 system service and allocated expenditure pot (EirGrid and SONI,
2013)
. . . . . . . . . . . . . . . . . . . . . . . . . . . . . . . . . . . .
67
5.6 PHS annual payments for 1 Me spent on system services (EirGrid
and SONI, 2013) . . . . . . . . . . . . . . . . . . . . . . . . . . . . . .
70
5.7 Calculation of Bother services for CAES and BES scaled from PHS values 77
vii
C HAPTER 1
I NTRODUCTION
Electricity systems are evolving to incorporate more renewable energy in order to
become increasingly de-carbonised. The European Commission Energy Roadmap
for 2050, states that the EU aims to reduce greenhouse gas emissions by 80%
below 1990 levels by 2050. To meet these targets, the Island of Ireland is committed to have 40% of its generation come from renewable energy sources (RES)
by 2020 (DCENR, 2009). In order to maximise the use of wind generation in the
All Island of Ireland (AII), the system non-synchronous penetration ratio (SNSP)1
is expected to increase from 50% to 75% by 2020 (EirGrid and SONI, 2011b). As
a result of the highly variable nature of wind generation, introducing high levels
of wind power on the AII system may increase the imbalances between demand
and generation, leading to issues in the stable operation of the power system.
1
Non-synchronous generation refers to generation sources that do not operate at the system
frequency such as wind generation and HVDC. The SNSP is found as the total non-synchronous
generation divided over the sum of the system demand plus the synchronous generation at any
given time.
1
To compensate for the variability of wind generation, the system flexibility must
be increased; that is, the system’s ability to respond sufficiently fast to changes
in generation and demand. To do so, technologies that are able to ramp up and
down faster than conventional plant are called for.
Electrical energy storage (EES), demand-side management, interconnection and
flexible generation are all sources of flexibility. The interest in EES has recently
increased as a result of speculation regarding growth in the value of the services
it is able to provide as the penetration of variable generation rises. Furthermore,
EES has been shown to reduce wind curtailment (Tuohy and O’Malley, 2011),
deferring investments in renewable energy generation. The EU Renewable Energy
Work program (EU Commission, 2014), identifies the need to develop electricity
storage, if the penetration of renewable energy in power systems is to increase.
Thus, the ambitious European, and in particular Irish, environmental goals, may
rely on the research and development of adequate electricity storage options.
EES differs from other flexibility options in that it can participate in multiple
wholesale markets, and simultaneously provide benefits to different stakeholders along the electrical energy value chain: electric generation and distribution
companies, transmission system operators and the end user. The main challenge
is that most electricity markets are not designed for electricity storage participation; they are not set up in a way that rewards the many benefits that electricity storage can provide. The absence of design and implementation of revenue
streams that remunerate the benefits of EES brought to the different stakeholders, coupled with the high capital costs of energy storage technologies, have
2
acted as barriers, preventing storage from competing economically against other
sources of flexibility.
Nonetheless, interest in EES has gained momentum in the island of Ireland.
Gaelectric, an Irish renewable energy generation company, has been studying
the possibility of developing a compressed air energy storage (CAES) plant in
Northern Ireland (NI). Gaelectric believes that such CAES facility would maximise
the usage of wind energy, reduce the carbon footprint and the overall cost of
electricity in NI (Gaelectric, 2014). Similarly, the energy storage company, AES,
is currently developing a 100 MW battery grid-integrated storage plant at the
Kilroot power station (NI) (AES, 2014).
EirGrid, the Irish transmission system operator, has taken a different approach
to increase the system flexibility, and has been studying the development of an
interconnector between the Republic of Ireland (ROI) and France (EirGrid and
SONI, 2013).
The study presented aims to assess the impact of installing grid-scale CAES, battery energy storage (BES) and an Ireland-France interconnector on the operation
of the AII power system, and to analyse how each technology is operated such
that its benefits to the system are maximised from an economic perspective. The
study analyses the economic viability of the flexibility investments from a system operation point of view, under different economic scenarios. Furthermore,
different revenue streams are considered to assess the cost competitiveness of
electrical energy storage from an investor perspective. Analyses are provided at
different levels of wind generation. Finally, the results obtained are discussed,
3
assessing the appropriateness of the remuneration schemes proposed for EES,
and how these align the interests of the system and of private investors.
A detailed cost-minimisation unit commitment and economic dispatch model is
employed and solved for each half hour period2 in a 2020 AII system model. Running the simulation through a complete year allows to account for the seasonal
dependence of wind generation and system demand.
2
Generation is dispatched on a half-hourly basis in the Irish Single Electricity Market.
4
C HAPTER 2
L ITERATURE R EVIEW
The prominence of studies regarding the participation of electrical energy storage
in power systems has grown in recent years, reflecting the increased interest
in the development of EES. Three branches of research are of relevance to the
project, these study: the drivers for the development of EES, the impact of EES
participation on power systems and the profitability of EES from an investor
point of view.
There exist a confluence of factors that drive the interest in energy storage. At the
forefront, is the growing deployment of renewable generation, as EES may provide sufficient flexibility to balance the variable output from renewable sources.
Moreover, EES can abate the high capital cost of meeting peak loads and postpone investments in grid infrastructure (Rastler, 2010). The International Energy
Agency (IEA) published a study on the role of grid-scale energy storage in the de-
5
carbonisation of power systems (Inage, 2009), in which the percentage of electrical energy storage required in electricity systems is calculated as a function of
the penetration of variable renewable energy sources. The report’s results indicate that for a 25% worldwide wind penetration1 , the capacity of EES installed
must grow by 59 to 175 GW. The European Commission and the International
Electro-technical Commission concur in that EES is pivotal in enabling the development of smart grids and in boosting the growth of renewable energy (EU
Commission, 2013; IEC, 2011).
Sioshansi et al. (2009) conducted a study assessing value of EES on the Pennsylvania, New Jersey and Maryland (PJM) system. It was found that the value
that storage can bring to the PJM power system is dependent on: the fuel cost
of thermal generators, the fuel mix and the system load profile, as well as the
size and efficiency of the storage device implemented. The results indicate that
the recent evolutions in the PJM market, in particular the growth of renewable
energy, have raised the value of EES to the power system from 60$/kW-year in
the early 2000s to 110$/kW-year in 2009.
When it comes to assessing the benefits that EES may bring to power systems, a
number of relevant studies have been published. A unit commitment cost minimisation model was employed to assess the economic value of compressed air
energy storage (CAES) on the German system with significant wind generation
(Swider, 2007), the findings indicate that CAES becomes an economically competitive investment option in Germany from 2017, when a greater variable gen1
The worldwide wind penetration at the end of 2014 was 6.6% (GWEC, 2014).
6
eration capacity is expected to be installed, which brings the need for increased
levels of system flexibility. Similar results were found on a study conducted on
the UK power system (Strbac et al., 2012); significant operational savings can be
brought about by EES in scenarios with significant renewable energy generation.
However, these studies do not compare EES to alternative flexibility investments,
i.e. interconnection, demand-side management or flexible generation. Moreover,
the impact of electrical energy storage is assessed merely from a system perspective, with no analyses provided from an investor point of view.
Studies regarding the impact of EES have been previously carried out on the AII
using cost minimisation unit commitment models. Tuohy and O’Malley (2011)
published research regarding the economics pumped hydro storage (PHS) in systems with very high wind penetration. They found that at levels of installed wind
below 9 GW, the reduction in cost brought about from a PHS facility of at least
500 MW is insufficient to justify the replacement of an existing gas turbine. However, Tuohy and O’Malley do not address the economic viability of smaller scale,
less capital-intensive options, such as CAES or battery energy storage. Research
was conducted by Cleary et al. (2013), regarding the economic viability of a CAES
plant. The findings point to the fact that the addition of CAES to the AII generation portfolio may result in a 9.05% reduction in CO2 emissions and a modest
reduction in wind curtailment. However, the study does not consider the impact
of CAES on the system generation cost, not does it provide means of economic
justification for its development. Another study was conducted by O’Dwyer and
Flynn (2013), assessing the impact of adding CAES or PHS capacity on the 2020
and 2025 AII system, with and without interconnection, at different levels of wind
7
generation. The study found that bulk EES installations can achieve significant
generation cost savings, in particular at high levels of wind generation, which
are reduced by DC interconnection. O’Dwyer and Flynn however do not provide
analysis regarding the economic viability of battery energy storage. Moreover,
their model only accounts for one category of reserve provision.
It must be noted that, as the public knowledge on compressed air energy storage
is relatively poor, the results obtained from the studies in which CAES is considered are highly dependent on the modelling assumptions made; these are stated
and justified in Cleary et al. (2013), however due to their confidential nature,
they are not as openly put forward in the other studies cited.
The studies above offer encouraging results, indicating that substantial benefits
may be drawn from energy storage as the levels of wind penetration grow, however they are limited in that analyses are only provided from a system perspective, without accounting for the interests of other stakeholders. It is of essence
that EES is economically viable to an investor if it is to be further developed.
Suazo-Martinez et al. (2014) published a study, analysing the profitability of
electrical energy storage to a private investor, when considering revenue streams
from participation in energy arbitrage, and from the provision of primary and
secondary reserve in the Chilean Northern Interconnected Power System. The
results obtained indicate that the profitability of electrical energy storage doubles when participating in arbitrage and the reserve markets simultaneously,
and is further boosted by higher levels of renewable energy generation. Although
a direct cost-benefit analysis is not presented in Suazo-Martinez et al. (2014),
8
the results from their work provide grounds to justify the economic evaluation of
electrical energy storage in the island of Ireland, when participating in simultaneous power markets.
Direct economic analyses of BES in the island of Ireland, from system and investor perspectives, were not found in the literature, nor were analyses of the
profitability of CAES from an investor point of view. Considering the intended
CAES and BES developments in Northern Ireland, coupled to EirGrid’s potential development of an Ireland-France interconnector, it is of great relevance to
study the effect of these flexibility options on the operation of the AII power system and to assess their economic viability from the point of view of the different
stakeholders involved.
9
C HAPTER 3
E LECTRICAL E NERGY S TORAGE
3.1
A PPLICATIONS
Energy storage has been used for grid-scale operations for decades; traditionally
employed to carry out arbitrage and to provide operating reserve. Storage became
particularly popular during the 1970’s oil crisis, when the price spread between
base and peak load reached unprecedented levels. During such time, electricity storage was employed to displace base generation to peak demand periods,
reducing the system cost of operation. With the developments in the efficiency
and flexibility of combined and open cycle gas turbines (CCGTs and OCGTs),
today many power systems operate with gas-fired plant on the margin, eroding
the value of electrical energy storage arbitrage. However, the growth in renewable
energy, the rising cost of meeting peak demand periods and the interconnection
10
developments required for grid reliability, have spurred interest and created new
opportunities and applications for electricity storage.
Unlike other sources of flexibility - interconnection, flexible generation and demandside management - electrical energy storage can provide services along the entire
electrical energy value chain, servicing simultaneously: electric generation and
distribution companies, transmission system operators (TSO) and the end customer. Although this project is primarily concerned with electricity storage applications on the generation and TSO levels, Table 3.1 identifies the predominant
EES applications throughout the full electrical value chain for completeness.
Each storage application calls for certain technical requirements. Due to the
currently high capital cost of many EES technologies, applications may be aggregated, increasing system benefits and revenues to EES investors. Figure 3.1
illustrates the suitable technology ratings and time frames for EES applications,
illustrating how services with similar properties may be stacked. Applications on
the customer side require technologies with lower ratings than those on T&D,
TSO and generation levels. The provision of ancillary services, including voltage and reactive power support, call for technologies with high power densities,
whereas those technologies with high energy density are favoured for services
that involve load following, energy arbitrage and adding system capacity. Figure
3.2, matches each specific electrical energy storage technology to the applications presented in Figure 3.1. EES technologies are covered in detail in Section
3.2, throughout which the reader is welcome to refer back to Figures 3.1 and
3.2.
11
Table 3.1: Energy storage applications and descriptions
Stakeholder
Application
Description
System
operator
(100 kW - 1 GW)
Energy arbitrage
Energy arbitrage, in the context of electricity storage, entails unit charging
(purchasing electricity) when electricity
prices are low and discharging (selling
power) at high electricity prices.
Added system capacity
-
Ancillary services
Ancillary services may include frequency
regulation, provision of operating reserve, ramping and black-start capability.
Generation (5 MW 100 MW)
Renewable integration and smoothing
Renewable smoothing involves balancing
the fluctuations in the generation output
from variable generation by time shifting
generation. Distributed and centralised
ancillary services may be provided by
EES, such as voltage support and ramping.
T&D (10 kW - 10
MW)
Investment deferral
Addition of system flexibility may lead
to lower interconnection investment requirements.
T&D support
Distributed EES units with a fast response may be used along the T&D
system to provide voltage and reactive
power support.
Energy
ment
Time shifting of home energy usage in
order to reduce time-of-use costs.
Customer (1 kW 10 kW)
manage-
Reliability
power quality
and
12
EES used to provide backup power for
non-interruptible loads.
Figure 3.1: Electricity storage applications throughout the electricity value
chain (Rastler, 2010)
Figure 3.2: Applications of energy storage technologies (Rastler, 2010)
13
3.2
T ECHNOLOGY
OPTIONS
A variety of EES technologies exist, those that have proven future potential are
displayed in Table 3.2, classified based upon the form of energy that they store.
Table 3.2: EES technologies
Mechanical
Electro-chemical
Electrical
Thermal
Pumped
hydro
storage (PHS)
Sodium-sulphur
batteries (NaS)
Supercapacitors
and double layer
capacitors (DCL)
Thermal
Energy
Storage (TES)
Compressed air energy storage (CAES)
Lithium-ion batteries (Li-ion)
Superconducting
magnetic
energy
storage (SMES)
Flywheel
energy
storage (FES)
Lead acid batteries
(Pb-acid)
Redox-flow batteries / vanadium redox (VBR)
Nickel-cadmium
(NiCd)
The wide variety of technologies in existence can cater for a range of applications and stakeholders. On one end of the spectrum, lie pumped hydro and
compressed air energy storage, with large storage capacities and power output,
used for bulk energy management and grid-scale power provision. On the other
end of the spectrum lie flywheels, supercapacitors and SMES, with small storage
capacities (although specific values are yet to be determined) and relatively low
power outputs, whose compactness and fast response is ideal for end-users and
14
the distribution system, and may play roles such as voltage support or emergency power supply. Batteries lie in between, and may be tailored to the specific
needs of the application.
Table 3.3 presents values of the technical parameters that play a central role
in deciding which technology is employed for a given application, these include:
power output, storage capacity, efficiency, lifetime, response time and capital
and operational expenditures (CAPEX and OPEX). CAPEX and OPEX may be
extremely variable and site-dependent, in particular for PHS and CAES, for which
costs directly depend upon the site’s geographical features.
An individual description of each of the technologies considered is presented,
assessing the benefits and drawbacks of each technology, background and potential for future developments. The values in Table 3.3 will be referred back to
throughout the analysis.
There are new energy storage concepts under development that are not analysed,
owing to their immaturity or low predominance, including: underground PHS,
non-fuel and isothermal CAES, liquid air batteries, iron-chromium flow batteries, liquid metal batteries, lithium-air batteries, zinc-air batteries and hydrogen
energy storage.
15
3.2.1
PHS
Pumped hydro storage is the most widespread and mature storage technology.
According to the EIA, there are approximately 132,000 MW of PHS installed
worldwide, representing over 99% of the capacity of all installed grid energy storage technologies, and 3% of the worldwide electricity generation capacity.
PHS is implemented by operating two water reservoirs at different elevations.
During off-peak demand periods, PHS units pump the water from the lower
reservoir into the upper one. During high demand periods, the water is discharged from the higher reservoir into the lower one, driving a turbine which
generates electricity to be fed into the grid.
The typical efficiency of PHS ranges from 70 to 85%. PHS is the EES technology
that can provide the largest storage capacity, which is only limited by the size of
the unit’s upper reservoir. Furthermore, PHS plant very long lifetimes, low operation and maintenance costs and fast response times. The combination of their
large storage capacity and fast response enables them to provide frequency and
voltage regulation as well as carry out energy arbitrage and contribute significantly to the system capacity. However, the installation of PHS requires certain
geographical features and large capital investments.
16
3.2.2
CAES
The operation of CAES is similar to conventional gas turbines, the main difference is that compression and expansion take place during two different periods.
During off-peak periods, electricity from the grid is used to power the compressor, which drives air into a high pressure storage reservoir. Air can be stored in
either underground caverns or in above-ground vessels. During peak electricity
price periods, air is expanded and used to drive the natural gas plant turbine,
generating electricity that is fed into the grid. It is estimated that CAES uses only
33% of the natural gas that is normally required for a conventional gas-fired generator (EPRI-DOE, 2003) to generate power.
There are currently two CAES units in operation; a 290 MW plant owned by ABB
in Huntorf, Germany, and a 110 MW unit in Macintosh, Alabama, developed by
Alabama Electric Power.
CAES plant have large storage capacities and fast response times, enabling them
to take part in a range of grid services: frequency/voltage regulation, energy arbitrage, renewable energy smoothing and capacity provision. However, the efficiency of conventional (diabatic) CAES plant can be as low as 40%, owing to the
dissipation of the heat generated when the air is compressed. Adiabatic CAES
systems are currently being developed, in which the heat released from the compression process is stored and re-used during expansion, boosting the plant
efficiency.
17
3.2.3
FES
Flywheels work by storing electrical energy from the grid in the form of rotational energy. The speed of the flywheel is raised to increase the rotational energy
stored, and decreased to release stored energy into the grid. Energy is stored in
a spinning rotor, charged and discharged by a generator.
FES devices have a very fast response, smaller than 4 ms in some cases, and
5 to 10 times the power density of BES (Rastler, 2010), making them of great
value for frequency regulation applications. Moreover, they have long lifetimes
and high efficiencies. However, their storage capacity is limited.
FES technologies have been traditionally used to provide back-up power for noninterruptible loads. However, commercial FES plant have been developed in recent years for the provision of grid frequency regulation services. An example is
the plant developed by Beacon Power in Hazel, PA, which has been in commercial
operation since 2014.
3.2.4
NAS
Sodium-sulphur batteries are made up of a molten sulphur positive electrode
and a molten sodium negative electrode, separated by a ceramic electrolyte. To
keep the electrodes in their liquid states, the battery must be maintained at a
temperature of 300 to 350 C.
18
NaS batteries have a high energy density and a fast response time, used for time
shifting of renewable energy and for grid power quality and support. Japan is
a pioneer in NaS technology, where the largest NaS storage plant is found: a
34 MW plant in Rokkasho used for wind integration, which has been in commercial operation since 2008. The main drawback of NaS batteries is their high
temperature requirement; the battery uses its own energy to maintain such temperatures, lowering its performance.
3.2.5
L I - ION
In lithium-ion batteries, the anode is made of graphitic carbon and the cathode
of lithiated metal oxide, separated by an electrolyte of lithium salts.
The production cost of li-ion remains high, and the batteries suffer significantly
from deep discharge. Nevertheless, li-ion is one of the leading emerging battery
technologies as it offers the highest energy density and efficiency of all battery
technologies; ideal candidates for the provision of reserve and for frequency regulation. In the recent years, more and more companies are betting on li-ion BES,
which accounted for 90% share of the proposed BES developments in 2014 (Pennwell, 2015).
19
3.2.6
P B - ACID
Lead-acid batteries consist of a lead oxide positive electrode, a sponge lead negative electrode, separated by a sulphuric acid electrolyte.
Pb-acid batteries are the most mature and well researched battery technology,
and are of relatively low cost. Pb-acid storage applications include renewable
energy power smoothing and emergency back-up power provision. However, the
energy density of Pb-acid batteries is lower than that of other battery technologies
available, and their usable capability decreases at high discharge powers, making them unfit for large-scale storage requirements. There is ongoing research
on advanced lead-acid battery designs, using materials that would improve their
performance.
3.2.7
R EDOX FLOW
Vanadium redox is the most common type of flow battery, where energy is stored
as charged ions in two electrolyte tanks, one for the positive and one for the
negative electrode reactions. Redox batteries require large volumes of electrolyte
liquid for efficient operation and are therefore typically used for large-scale applications.
The main advantages of redox flow batteries are their long life time and capability
to have high number of discharge cycles compared to other BES options. However, the design of flow batteries is complex, which may increase maintenance
20
costs. Moreover flow batteries have a lower energy density than other battery
technologies.
Redox flow batteries can be used for applications including time shifting, reserve
provision and frequency regulation. There are several proposed and operating
grid-connected redox flow batteries around the world. An example is a 275 kW
installation in Hokkaido, Japan, where the battery is used for renewable energy
integration.
3.2.8
NICD
Nickel-cadmium batteries have been in use since the early 1900s; they are a well
proven and established technology. NiCd batteries have relatively high power
and energy densities, however, they are not a popular battery choice due to the
toxicity of cadmium. Nickel-metalhydrate (NiMH) batteries have been later developed to substitute NiCd, however NiMH technology is not as proven as NiCd on
grid-scale. One of the major advantages brought by NiCd batteries, is that their
performance is the best of all BES technologies at low temperatures (down to-50
C).
A successful commercial NiCd installation is found in Fairbanks, Alaska. The
battery provides reactive power and voltage support, operating reserve and frequency regulation. NiCd technology was decided upon primarily due to its adaptability to low temperatures.
21
3.2.9
S UPERCAPACITORS AND DCL S
The principle of operation of supercapacitors is the same of regular capacitors;
energy is stored in the electrical field between the two capacitor plates. The main
difference between superpacitors and regular capacitors lies in the scale of the
technologies; supercapacitors can provide significantly more power and store
more energy.
Supercapacitors have a very high power density, about 10 times of a conventional battery, and can charge and discharge in less than one millisecond. Their
energy storage capacity is limited, and usually have relatively high self-discharge
rates. Supercapacitors are therefore best suited for short term applications that
requiring fast bursts of power. Due to their large power density, supercapacitor
units can be compact yet powerful; well suited to use on the customer side and
on the distribution network. Moreover, supercapacitors have a long lifespan and
require little to no maintenance, as they have no moving components.
Supercapacitors remain a very high cost technology, however there exists a large
development potential as their cost/performance characteristic is improved.
3.2.10
SMES
The main components of superconducting magnetic energy storage units are
a coil made of superconducting material and a refrigeration system. Energy is
stored in the magnetic field in the coil, which is maintained below its supercon22
ducting critical temperature (around 100 K) by the refrigeration system.
The main advantages of SMES are: quick response time (below the millisecond
range), large round-trip efficiency and high power density. Although SMES has
no moving parts, its lifetime, reliability and maintenance costs are determined
by the refrigeration system. Furthermore, the energy demand of the refrigeration
system limits the economically viable period of time for which energy can be
stored in the coil. The applications of SMES in power systems are similar to
those of supercapacitors.
Some SMES units have been commercially deployed, employed for power quality
control of uninterruptible power loads. However, SMES remains too expensive
and too complex to be deployed on a large scale.
3.2.11
TES
Thermal energy from renewable energy, waste heat or surplus energy production
can be stored for later use in industrial and residential applications. Although
the end user of TES is always the customer, such installations may be centrally
managed by utilities.
The most common medium of energy storage for TES is water, however such
facilities have low energy density, limited by the specific heat of water. Phase
change materials (PCM), such as molten salts, can store thermal energy in the
form of the latent heat of the phase change, offering a higher energy storage ca-
23
pacity than water TES. PCM TES is currently used for concentrated solar power
plant. An example is the two-tank PCM TES developed by Andasol in Southern
Spain. Thermo-chemical storage is also a TES possibility, offering higher capacities than PCM and water heat storage, however, at higher costs.
TES has seen modest growths in the last years; high costs are the main barrier
preventing it from further deployment.
24
25
Commercial 0.01 - 10
Commercial > 30
R&D
R&D,
Demo
R&D,
Demo
Redox
flow
NiCd
Supercap.
SMES
TES
0.001 - 10
0.1 - 10
0.1 - 10
> 50
Mature
Commercial 0.1 - 100
Pb-acid
NaS
Commercial 0.01 - 10
FES
Commercial > 10
Commercial 100 - 300
CAES
Li-ion
250
1000
Mature
PHS
-
Typical
power
output
(MW)
Technology Maturity
0.1 - 50
na
na
1 - 10
20 - 50
> 300
4 - 24
< 40
1 - 25
1400
3600
1680
14,000
Typical
storage
capacity
(MWh)
-
-
50 - 90
> 90
90 - 95
70 - 78
70 - 80
75
75 - 90
72 - 78
> 85
40 -60
70 - 85
Efficiency
(%)
20 yrs
20 yrs
106
500
2000
> 16,000
3000
9000
500
4000
200
2000
> 20,000
> 25 yrs
> 25 yrs
Lifetime
(cycles)
-
-
-
-
> sec
< ms
< ms
sec
sec
sec
sec
sec
ms
sec
sec
Response
time
na
700
2000
1500
2500
1500
2100
2000
3100
2000
3500
1500
6000
1800
5000
700
1800
400
2000
1700
2000
CAPEX
($/kW)
-
-
-
-
-
-
-
-
-
-
-
0.1 - 100
> 20,000
> 25,000
400 - 600
> 500
400 - 800
> 1200
< 300
800
2200
10 - 100
15 - 150
OPEX
($/kWh)
Table 3.3: Technical operational parameters of EES technologies (IRENA and IEA-ETSAP,
2012) (Rastler, 2010) (Divya and Ostergaard, 2009) (IRENA and IEA-ETSAP, 2013)
C HAPTER 4
M ETHODOLOGY
AND
T EST S YSTEM
Analyses of the impact of electricity storage on the operation of the future All Island of Ireland electricity system are carried out throughout this project. Therefore, a tool that allows the simulation of the operation of the All-Island electricity
system is required.
4.1
M ODELLING
SOFTWARE
PLEXOS 7.0 R01 is a commercially available power system simulation tool developed by Energy Exemplar, which is used throughout this study.
The objective of the simulations is minimising the cost of operating the system
(⇧), subject to a series of generator (N ) and system constraints, over time (T ).
The cost of operating a generator is dependent on the fuel cost (C), the operating
26
power (P), plus the start-up costs (S), which may be incurred during the operating period. The start-up costs are dependent on the binary variable (u), which
indicates whether the unit is off or on-line at time t.
⇧=
T X
N
X
(Cn Pn (t) + Sn (un (t)))
(4.1)
t=1 n=1
PLEXOS operates over various planning and scheduling horizons. For the purposes of the study, three optimisation horizons are considered: project assessment of system adequacy (PASA), medium-term (MT) schedule and short-term
(ST) schedule. During the PASA planning horizon, the maintenance needs of the
generation plant are calculated, and the planned generator outages scheduled.
The information found during the PASA simulation is fed into the subsequent
simulation phases: MT and ST schedule. The MT schedule horizon is tightly
linked to the ST schedule; run after the PASA simulation to optimise the dispatch
of the available units, while accounting for long-term generation constraints. Finally, the data found in the PASA and the MT horizons is fed into the ST solver.
The ST schedule makes use of mixed-integer programming, finding the least-cost
solution for the given horizon at the specified resolution i.e. 1 year in 30 minute
intervals.
PLEXOS was chosen as the modelling software, as it provides the user with
flexibility to define the operating parameters and constraints. Furthermore, in
Ireland, the Commission for Energy Regulation (CER), EirGrid and many other
market participants make daily use of PLEXOS for modelling and forecasting
27
purposes.
4.2
T EST
SYSTEM
Studies are conducted on the AII 2020 system, as the AII is a world leader in
renewable energy integration, and is expected to have a 40% RES penetration by
2020 (CER, 2012), presenting conditions for electricity storage to bring potential
value to its operation.
The Academic North-West European Electricity Market Model (ANWEEM), developed by the Energy Policy and Modelling group at University College Cork, was
used as a base upon which the test system was built. Some modifications were
made to the UCC model to fit the purposes of the study, these are outlined in
Section 4.2.2. The final test system represents the AII and its interaction with
Great Britain and France, including greater detail in terms of system operation
and constraints than the original UCC model.
4.2.1
B ASE MODEL : A CADEMIC N OR TH -W EST E UROPEAN E LEC TRICITY
4.2.1.1
M ARKET M ODEL 2020
G ENERATION
AND DEMAND
The generator dataset is built on that published by the CER (CER, 2012), which
contains detailed information regarding the technical and operational param28
eters of the AII generation portfolio from 2011 to 2012. The dataset was then
modified by the experts in UCC to account for the changes in generation that
are expected to take place in 2020. The ANWEEM model bases its generation for
2020 on the predictions published in the All-Island Generation Capacity Statement 2012-2021 (EirGrid and SONI, 2011a). As a part of this project, these values were updated to account for the later figures published in EirGrid and SONI
(2014a). From 2014 to 2020, the AII power system is expected to see a decrease
in 1220 MW from thermal plant, mainly distillate and gas-fired units, while wind
generation is expected to grow by 3400 MW.
The All-Island 2020 model is composed of 72 generators, an installed generation capacity of 13,864 MW and a fuel mix as shown in Figure 4.1. Note that
embedded generation refers to distributed generation.
The wind generation profiles are synthetically generated based on EirGrid’s and
SONI’s publicly available historical wind generation data (2009), and scaled according to the National Renewable Energy Action Plan (DCENR, 2009), in which
the contribution required from renewable energy to meet the AII 2020 renewable
energy targets is determined. The test system allows for curtailment of wind generation when either the system non-synchronous penetration ratio1 is exceeded,
or the system can be operated at a lower cost when a percentage of wind is
curtailed (the logic behind such scenario is discussed in the Results Section).
The demand profiles are based on the gross final consumption of electricity from
the EU additional efficiency scenario in DCENR (2009), which predicts that the
1
More information in Section 4.2.2.1
29
Figure 4.1: Generation mix in 2012 and model predictions for 2020 ((CER,
2012),(EirGrid and SONI, 2014a))
gross final consumption of electricity in the island of Ireland will have increased
by 5% from 2009 levels.
The fuel prices are based on the data published in the 2011 World Energy Outlook (IEA, 2011). Added to the fuel cost is the carbon tax. Table 4.1 shows the
price for the fuels under consideration and the carbon tax on each of these fuels.
A carbon tax of e30 per GJ was applied, based on the EU Emissions Trading
Scheme (EU Commission, 2013), and in accordance with previous studies carried out on the 2020 AII power system: Tuohy and O’Malley (2011) and Philips
and Grant (2011).
30
Table 4.1: Fuel cost with sample CO2 tax of e30 per GJ
Fuel
Fuel price (e/GJ)
Carbon tax (e/GJ)
Total (e/GJ)
Hydro
0.00
0.00
0.00
Wind
0.00
0.00
0.00
Biomass
2.00
0.00
2.00
0.00-2.00
0.00
0.00-2.00
Waste
2.00
0.00
2.00
Peat
2.00
3.05
5.05
Coal
2.76
2.81
5.57
Natural gas
7.03
1.68
8.71
13.09
2.21
15.30
Embedded
Distillate
The unit start-up costs are obtained performing a linear interpolation based on
the fuel type and on the size of the plant. The values for the basis of the start-up
calculations are obtained from data published in (CER, 2012), where warm plant
starts are assumed. To illustrate the linear-interpolation process, the example of
the calculation of start-up costs for coal-fired plant is demonstrated. The published CER values relating the plant capacity to its start-up cost are plotted in
orange in Figure 4.2. A linear interpolation is carried out on the start-up cost
data data (grey line). The start-up cost for a coal-fired plant of any capacity is
then calculated as per (4.2), where the slope and the intercept of the interpolated
line are employed.
31
SU cost (eur) = capacity (MW) ⇤ 258.19 (eur/MW) + 2775.9 (eur)
Figure 4.2: Start-up cost interpolation
32
(4.2)
4.2.1.2
E LECTRICITY
STORAGE MODELLING
In Ireland, the Electricity Supply Board (ESB) operates a 292 MW pumped hydro
storage (PHS) facility at Turlough Hill, consisting of four 73 MW units. In the
past, PHS has been a significant contributor to the provision of operating reserve
in the Irish power system (Lalor, 2005). PHS is more flexible than conventional
thermal plant; it is able to ramp up and down its dispatch faster, facilitating a
quick response in case of system contingency.
Each PHS unit can operate in four distinct modes: minimum generation (min
gen), generation (gen), spin and pump. When operating in gen mode, the units
discharge water from the upper reservoir into the lower reservoir, driving a turbine that generates electricity. It is assumed that the range of operation for the
gen mode lies between power outputs of 30 and 73 MW. In reality, the efficiency
of the units is proportional to the power output. However, for the test system, it is
simplified to a constant value of 77% (CER, 2012). PHS is generally operated below its maximum generation limit to provide operating reserve. In min gen mode,
the unit is primarily concerned with the provision of reserve, generating between
0 and 30 MW of power. In pump mode, 73 MW are consumed by each unit to
pump water from the lower reservoir into the upper one. If required for system
stability, the PHS units may be tripped during pump mode, reducing the system
load by 73 MW per unit. During spin mode, the water valve is closed and the
turbine spins in air consuming 1 to 2 MW of power. The units can go from spin
mode to generation at full power almost instantly. Spin mode is not accounted
for in the test system, enabling PHS units to ramp up to full power with no delay,
33
even when previously off-line.
As a part of the project, a constraint on the PHS units was implemented, such
that no unit can operate in gen or min gen mode when the rest of the units are
in pump mode, and vice-versa, reflecting the real operation of the Turlough Hill
units.
4.2.2
M ODIFICATIONS AND ADDITIONS MADE TO THE BASE MODEL
The Academic North-West European Electricity Market Model models the power
systems of all the countries in the European Union. Such magnitude is accompanied by a lack of detail when it comes to representing the systems of individual
countries. Since the main interest for this study is the island of Ireland, some
modifications had to be made to make the model more representative of the AII
power system.
4.2.2.1
S YSTEM
NON - SYNCHRONOUS PENETRATION
The system non-synchronous penetration, or SNSP, is a measure of the nonsynchronous generation (generation decoupled from the system frequency) on
the system at a given time. In the case of the test system used for this project,
non-synchronous generation includes wind generation and HVDC imports. The
SNSP is calculated as:
34
SN SP =
W ind generation (M W ) + HV DC imports (M W )
Demand (M W ) + HV DC exports (M W )
(4.3)
SNSP limits are enforced, since high amounts of non-synchronous generation
may compromise the frequency response and the dynamic stability of the electricity system (EirGrid and SONI, 2010).
Currently the SNSP limit is 50%. However, with the expected developments of the
T&D system, and growth in the generation portfolio that complements variable
generation, the SNSP limit is expected to rise to 75% by 2020 (EirGrid and SONI,
2011b). Thus, in the test system an SNSP limit of 75 % is assumed.
4.2.2.2
T RANSMISSION
CONSTRAINT GROUPS
Transmission constraint groups, or TCGs, are constraints placed on generation
to ensure the secure operation of the All-Island power system, preventing overloading of the transmission network and promoting voltage and dynamic stability.
The TCGs have been implemented on the test system according to the Operational Constraint data published in EirGrid and SONI (2014b). The TCGs are set
according to the Irish Single Electricity Market in 2014, and have been adapted
to the 2020 generation portfolio as a part of the project. The modifications made
to the TCGs are outlined below.
• Hydro Smolt Protocol: the Hydro Smolt protocol is an environmental con35
straint placed on hydro generation dispatch such that it has a minimum
impact on aquatic wildlife. It is put in place during spring and early summer. There is a lack of detailed public information concerning how the protocol impacts the dispatch of hydro generation in Ireland, therefore it was
not included in the model. Furthermore, since the Hydro-Smolt constraint
is limited to particular seasons and hydro generation constitutes a small
portion of the full 2020 generation portfolio, not having the constraint in
the test system is not expected to have a big impact on the modelling results.
• Turlough Hill Generation: there is currently a constraint placed on the PHS
station at Turlough Hill to ensure that it charges at night time and discharges during the day time. The PHS constraint has been purposely not
implemented such that Turlough Hill can maximise its value to the system
by taking advantage of the increased variability of electricity generation,
resulting from the increased wind penetration in 2020.
• Cork Generation: there exists a generation restriction that is placed on the
Aghada, Marina and Whitegate units in the Cork area. The sum of their
output must be less than 1100 MW. The exact limit on the Cork generation
is determined in a week-ahead basis. For the purposes of the model, it is
assumed that this limit is maintained at 1100 MW.
• Ballylumford Generation: There are seasonal limitations on the generation
from Ballylumford due to circuit rating constraints. The public data available does not offer concise information on the nature of these limitations,
36
and therefore they are were not accounted for in the modelling.
The TCGs involving: system stability, voltage stability, replacement reserve, reactive power support and load flow control were implemented directly as per
(EirGrid and SONI, 2014b).
4.2.2.3
O PERATING
RESERVE
The provision of operating reserve brings value to the operation of electricity
storage (O’Dwyer and Flynn, 2013; Suazo-Martinez et al., 2014). Therefore to
provide an accurate analysis of the value of electricity storage, operating reserve
was modelled in the test system.
There exist three categories of operating reserve in the island of Ireland; primary
(0 - 15 s), secondary (15 - 90 s) and tertiary (> 90 s) operating reserve (POR,
SOR and TOR). In the AII, the dominant influence on reserve targets is the loss
of the largest infeed. The data regarding the reserve provision times and power
is shown in Table 4.2. The system POR, SOR and TOR are included in the model
as defined by the Commission of Energy Regulation in (CER, 2012).
There are two sources of reserve, both of which are included in the model, they
are:
• Static reserve: interruptible load, non-synchronous generation and interconnection
37
Table 4.2: Operating reserve definitions (EirGrid and SONI, 2014b)
Delivered by
Maintained until
All Island requirement (%
of largest infeed)
Primary (POR)
5s
15 s
75%
Secondary (SOR)
15 s
90 s
75%
Tertiary 1 (TOR1)
90 s
5 min
100%
Tertiary 2 (TOR2)
5 min
20 min
100%
• Dynamic reserve: reserve from synchronised generating units
4.2.2.4
I NTERACTION
WITH NEIGHBOURING COUNTRIES
The island of Ireland is connected to the Great Britain system via two HVDC
links: the Moyle Interconnector and the East-West Interconnector (EWIC), as
illustrated in Figure 4.3.
The Moyle Interconnector came into full commercial operation in 2002, connecting Ballycronan More in Northen Ireland to the Auchencrosh station in Scotland.
The interconnector is made up of two monopole 250 kV DC cables each with a
rated transmission capacity of 250 MW (Atkinson et al., 2002).
The East-West Interconnector (EWIC) came into operation in September 2012,
connecting the Woodlands substation in the ROI to the Deeside substation in
Wales. The EWIC link has a rated power of 500 MW and is composed of two DC
cables operating at ±200 kV.
38
Figure 4.3: HVDC Interconnection between the island of Ireland and Great
Britain
,
The Moyle and East-West interconnections, as well as the Great Britain (GB) generation, were modelled as specified by the CER (CER, 2012). GB is represented
by a single unit with 12 different heat rates and 12 different variable operation
and maintenance (VO&M) values. Each of the heat rates and VO&M charges is
assigned to a 4 hour period of the day for the summer (March to October) and
winter (October to March) seasons. The maximum power flow in either direction
of the interconnectors is specified as per EirGrid and SONI (2014b). The wheeling
charges, charge per MW power flow through the interconnector, are implemented
39
in the same manner as the VO&M charges; 12 wheeling charge values applied
depending on the season and on the time of the day.
The fuel costs in GB were calculated based on the predictions made by the UK
Department of Energy and Climate Change (DECC, 2013). Based on the DECC
data, a simplified assumption is made that the fuel cost in the GB is 5.4 e/GJ.
When interconnection is modelled in the test system, Ireland becomes a net
importer of electricity. The model results give that net imports meet 2% of the
system load. In 2013, net imports accounted for 8.8% of the load. A possible
explanation for the reduction in electricity imports from GB from 2013 to 2020
is the increase in the SNSP limit and in the installed wind capacity; allowing the
system demand in the AII to be met at a lower cost.
4.2.2.5
CAES
The CAES model is composed of a gas turbine connected to a compressor and an
air storage cavern. The technical operation parameters of the plant are shown in
Table 4.3, these were designed to approximate the intended Gaelectric developments in Larne (Gaelectric, 2014).
Ramp up/down limits are not implemented, reflecting the flexibility of CAES.
Similar to PHS, during compression mode CAES can be tripped from the system,
shedding 100 MW of load.
40
Table 4.3: CAES plant modelling details
4.2.2.6
L I - ION
Parameter
Value
Units
Maximum compression
100
MW
Minimum compression
65
MW
Maximum generation
134
MW
Minimum generation
26
MW
Base heat rate
33
GJ/hr
Incremental heat rate
7
GJ/MWh
Compressor efficiency
80
%
BATTERY
The BES facility is modelled as an idealised pump storage unit with specifications
as shown in Table 4.4, in line with the expected developments by AES (AES,
2014). The capacity of the facility was calculated by assuming an energy density
of 360 W/kg and a power density of 150 Wh/kg as per Rastler (2010).
The li-ion battery’s ability to ramp up/down is assumed to be unconstrained,
reflecting the flexibility of li-ion energy storage.
The central similarities between the BES and CAES models are: the compressor
(charging) power and the charge to discharge efficiencies.
41
Table 4.4: Li-ion BES modelling details
Parameter
Value
Units
Explanation
Maximum power
100
MW
-
Minimum stable level
0
MW
No minimum Pout required
Storage capacity
42
MWh
-
Pump load
100
MW
-
Pump efficiency
80
%
Battery round-trip efficiency
End effects method
recycle
-
Simulates that the battery
must be recharged every day,
enabling the unit to provide
reserve on the following day.
4.2.2.7
AII-FR
INTERCONNECTOR
The All Island of Ireland-France interconnector is modelled as two, 600 km, 250
MW, HVDC cables. To model generation in France, a unit with 12 different heat
rates is implemented, accounting for seasonal price fluctuations and price variations at different times of the day. The heat rates and fuel price of the generation
in France were designed to reflect the lower marginal electricity prices in France
compared to the island of Ireland and Great Britain, the modelled fuel price is
4.2 e/GJ.
42
4.3
T EST
SYSTEM LIMITATIONS
Test system limitations arise as a result of modelling simplifications, these are
identified and explained below.
A deterministic approach is taken, assuming foresight of the system demand and
wind generation, as accurate stochastic modelling of the 2020 AII power system
is a highly intricate task, lying outside the scope of the project. Nonetheless,
Tuohy and O’Malley (2011) assessed the impact of deterministic versus stochastic modelling on the dispatch of electricity storage on the AII system. It was found
that the same dispatch trends are seen with both approaches, however the deterministic modelling provides more conservative results in valuing electrical energy
storage from both system and investor perspectives.
The demand profiles employed for the model are based on 2009 data, indicating
that the All-Island demand is expected to grow by 5% from 2009 to 2020. As
the economic climate in Ireland has gone through significant change in the last
few years, the validity of such data may be questioned. However, the values
were checked against the more recently published system demand predictions
in the 2014 - 2023 All-Island Generation Capacity Statement (EirGrid and SONI,
2014a), in which the predictions for growth in demand in the AII from 2009 to
2020 range from 5.5% in the median growth scenario to 10% in the high growth
scenario. The predicted values in the median growth scenario show only a 0.5%
discrepancy from the values employed for the model.
43
The construction of the AII model involved using inputs from various different
sources including: EirGrid and SONI, the Commission for Energy Regulation
and the Irish Department of Communications, Energy and Natural Resources.
However, it was found that these sources were relatively consistent with each
other, alluding to each other’s work throughout the documents considered.
For verification purposes, the trends from the simulations obtained with the
completed model, in terms of generator dispatch and system costs and prices,
were compared to previous studies carried out on the future AII system with
high levels of wind penetration. The overall system behaviour observed in the
developed model is in accordance with the studies carried out by Tuohy and
O’Malley (2011), O’Dwyer and Flynn (2013) and Cleary et al. (2013).
44
C HAPTER 5
R ESULTS
The analyses carried out aim to assess the impact of installing grid-scale CAES,
battery energy storage and an Ireland-France interconnector on the operation of
the AII power system, and to analyse how each technology is operated such that
its benefits to the system are maximised from an economic perspective. Moreover, the economic viability of the flexibility investments, from a system operation point of view, is analysed under different economic scenarios. Furthermore,
different revenue streams are considered to assess the cost competitiveness of
electrical energy storage from an investor perspective. To do so, eight system scenarios are considered, at two different wind generation levels, illustrated in Table
5.1. Scenario BASE will be referred to as the base case throughout the analysis.
45
Table 5.1: AII power system scenarios
5.1
Scenario
CAES
BES
AII-FR
BASE
No
No
No
CAES
Yes
No
No
BES
No
Yes
No
CAES+BES
Yes
Yes
No
IC
No
No
Yes
CAES+IC
Yes
No
Yes
BES+IC
No
Yes
Yes
CAES+BES+IC
Yes
Yes
Yes
A NALYSIS
FROM A SYSTEM PERSPECTIVE
The results obtained for each scenario considered, regarding the operation and
economics of the AII power system, are displayed in Table 5.2. The scenarios are
run at: Base wind and High wind, with 5900 MW and 6300 MW of installed wind
generation capacity respectively.
To fully understand the effect that the technologies introduced have on the system costs, operation and wind curtailment, it is important to analyse the way
the model carries out the generator dispatch and reserve allocation for each of
the scenarios. The percentage decrease, with respect to BASE, in the generation
output and reserve provision of coal, distillate, natural gas and PHS plant, which
46
High wind
Base wind
Table 5.2: Results
Scenario
Total gen. cost
savings (Me)
Wind curtailed
(%)
Avg.
elec.
price
(e/MWh)
Thermal unit
start-ups
BASE
-
2.53
83.60
3192
CAES
14.82
2.28
82.02
2049
BES
26.88
2.08
79.96
1293
CAES+BES
31.06
1.89
80.4
1113
IC
206.08
3.05
81.55
2728
CAES+IC
217.91
2.72
80.96
1661
BES+IC
221.62
2.42
78.40
1088
CAES+BES+IC
224.01
2.19
78.64
970
BASE
-
3.36
82.72
2412
CAES
6.53
3.18
80.84
1795
BES
8.90
2.95
79.08
1249
CAES+BES
21.93
2.77
78.77
1125
IC
203.55
3.98
80.30
2055
CAES+IC
203.72
3.74
80.01
1698
BES+IC
206.32
3.28
77.33
1092
CAES+BES+IC
209.75
3.11
76.28
1008
Thermal units refer to natural gas, distillate, peat and coal-fired plant.
are the units that show the most significant variations in the way they are operated when interconnection or EES are added to the system, can be found in
47
Table 5.3.
Table 5.3: Percentage decrease in generation and reserve provision
High wind
Base wind
Scenario
% decrease in gen.
% decrease in reserve prov.
Coal
Dist.
NG
PHS
Coal
Dist.
NG
PHS
BASE
-
-
-
-
-
-
-
-
CAES
17.71
47.44
12.04
-9.62
7.51
0.11
10.61
0.73
BES
33.96
95.96
-9.24
-8.44
38.46
6.90
26.51
18.93
CAES+BES
41.32
96.42
4.03
-15.44
35.01
2.09
24.23
20.31
IC
10.77
16.72
12.93
-5.27
-11.39
0.42
-0.29
0.6
CAES+IC
17.05
47.44
12.05
-9.62
7.51
0.11
10.61
-0.73
BES+IC
41.32
96.42
4.03
-15.44
35.01
2.09
24.23
20.32
CAES+BES+IC
41.55
98.84
4.80
-9.67
37.38
1.81
27.07
23.82
BASE
-
-
-
-
-
-
-
-
CAES
21.51
29.87
-3.72
-5.56
19.47
0.28
22.60
-12.04
BES
22.99
98.05
-5.41
-1.06
24.78
4.59
33.56
33.09
CAES+BES
23.02
99.65
-4.86
8.91
25.37
5.16
35.54
38.82
IC
-6.34
-13.24
16.96
-2.91
-30.88
-0.10
7.42
-2.23
CAES+IC
28.24
15.50
9.49
-12.44
10.69
0.13
20.98
-11.96
BES+IC
32.08
100.00
7.04
-6.77
18.58
5.57
29.07
38.78
CAES+BES+IC
31.87
100.00
9.86
0.73
19.80
6.23
30.60
44.93
Dist. = Distillate, NG = Natural Gas, PHS = Pumped Hydro Storage
48
5.1.1
S YSTEM COSTS , OPERATION AND WIND CUR TAILMENT
The findings indicate that, under all scenarios considered, the addition of an
extra unit of flexibility, in the form of BES, CAES or interconnection, will always
bring about a reduction in the system operation costs, compared to the base case
scenario: the generation cost savings shown in Table 5.2 all show positive values.
Moreover, the effects of added flexibility also favour customers by lowering the
average price of electricity.
Both EES and interconnection decrease the number of thermal units started up
throughout 2020, reducing the unit start-up costs incurred, and therefore the
overall cost of generation.
The generation costs savings achieved by the addition of interconnection are significantly larger than those rendered by EES, which can be attributed to the
greater capacity of the interconnector. It is found that the incremental generation costs savings are decreased with the addition of each subsequent flexibility
technology.
EES technologies have a positive impact on wind curtailment, bringing reductions of up to 0.9%, while the addition of interconnection increases the levels of
wind curtailed. In the High wind scenario, more wind is curtailed in all scenarios than in the Base wind scenario, as the SNSP ratio is reached more often.
Greater wind generation capacities installed on the system bring down the average electricity price and the average cost of generation, lowering operational
49
costs saving potential of the flexibility technologies considered. However, when
the system is operated with relaxed TCGs implemented, the operational costs
savings brought about by interconnection and EES are increased, indicating that
in a highly interconnected system, with less transmission constraints, EES and
interconnection become more valuable.
Below, an analysis is provided, relating the way in which the different flexibility
technologies operate, to the effects in terms of costs of generation and wind
curtailment that they have on the system. The generation costs savings are not
compared directly between technologies, rather, a net present value is carried
out in Section 5.1.3.
5.1.1.1
CAES
CAES operates by performing electricity price arbitrage, as illustrated for a sample 12 hour period in Figure 5.1. The unit is in pump mode at times when the
electricity price is low (high generation and low demand), and generates during
periods of high electricity price (low generation and high demand).
The reduction in operational costs savings brought about by CAES is driven by
two factors: the marginal cost of generation of CAES is lower than most thermal plant, as it is only partially powered by fuel. Moreover, CAES has no ramp
up/down limits or minimum up/down times, making it significantly more flexible than conventional plant, and therefore suited for wind power integration.
The unit commitment model takes advantage of the CAES unit’s significantly
50
Figure 5.1: CAES operation
,
lower generation cost and flexibility, displacing more expensive generation plant.
The decrease in dispatch from thermal plant, added to the lower number of unit
start-ups, is what brings about a decrease in the system generation costs.
Furthermore, CAES participates in the provision of operating reserve, displacing
the reserve requirements from thermal units, allowing them to operate more efficiently. To illustrate the way in which CAES contributes to the system operating
reserve, the generation and POR provision are plotted in Figure 5.2 for a sample four day period. The plant contributes reserve when generating, however its
reserve provision is constrained when in compression mode, when it can either
provide the full compression capacity (100 MW) or no reserve.
As seen in Table 5.3, with CAES on the system, distillate-fired units see the
51
Figure 5.2: CAES generation and POR provision
,
largest reduction in generation out of all thermal generation plant, due to their
high cost of generation. Distillate-fired generators are employed as peak-demandmeeting units, however CAES can provide such service at a lower cost.
5.1.1.2
BES
In many ways the effect of BES on the AII system is similar to CAES, however,
there are some fundamental operational differences that must be outlined. The
more apparent difference between the two EES technologies is that BES has
no fuel cost, while CAES relies on natural gas, increasing the generation cost
52
savings brought about by BES compared to CAES. Nonetheless, the operational
parameters of each technology also impact their dispatch.
Figure 5.3 illustrates the charge and discharge profiles of the li-ion battery during a sample 12 hour period. Similar to CAES, it performs electricity price arbitrage. In Figure 5.4, the primary operating reserve provision of BES is plotted for
a four day period. Unlike CAES, the li-ion battery is unconstrained in the provision of operating reserve, as such, it is able to provide reserve to the system at all
times at zero marginal cost, which is exploited by the unit commitment model,
making BES a base reserve provider. Comparing Figures 5.2 and 5.4, it can be
observed that CAES provides more generation, while BES, although dispatched
at peak demand periods, is mostly concerned with the provision of operating
reserve.
Referring back to Table 5.3, it can be seen that BES displaces a significantly
larger reserve capacity from thermal plant and PHS than CAES, reducing the
number of plant started and increasing the operational efficiency of on-line plant,
which translates into overall generation cost savings that can be 12 Me higher
than CAES.
5.1.1.3
AII-FR I NTERCONNECTOR
Figure 5.5 illustrates the operation of the AII-FR interconnector throughout a
sample three day period. When the cost of generation in France is lower than
the cost of generation in the island of Ireland, plus the fee charged per MW flow
53
Figure 5.3: BES operation
,
through the interconnector (the wheeling charge), power is imported from France
to Ireland; the conditions in equation 5.1 are met. The opposite must be true for
power to be exported from Ireland to France (5.2).
Import : Cost of gen.F R < Cost of gen.AII + IC wheeling charge
(5.1)
Export : Cost of gen.F R + IC wheeling charge > Cost of gen.AII
(5.2)
Throughout the 2020 simulation, the AII is importing over 400 MW (out of the
rated 500 MW) of power from the French system 83.5% of the time at base wind
generation, and 81.3% of the time at high wind generation. The power exports
are zero in both wind generation scenarios. The results indicate that AII-FR line
becomes base-load generation to the AII system.
54
Figure 5.4: BES generation and POR provision
,
The fundamental difference between the way EES and interconnection are operated, is that the AII-FR interconnector does not contribute to operating reserve.
From a technical perspective, interconnection is perfectly able to provide system
reserve, however it is more profitable to use the full capacity of the interconnector
for power supply.
The AII-FR HVDC link does not reduce the thermal plant start ups to the same
extent as EES, as its lack of contribution to operating reserve increases the reserve requirements from the system units.
The way that the AII-FR link affects the system dispatch is different in the base
and high wind scenarios. In the base wind scenario, the percentage decrease in
55
Figure 5.5: AII-FR interconnector flows and electricity price in the AII
,
generator dispatch from coal, distillate and natural gas-fired plant is directly proportional to their cost of operation. Distillate-fired plant are most expensive units
to operate, as such, they see the largest reduction in dispatch. Coal-fired units,
the least expensive thermal plant, are favoured in terms of reserve provision. At
base wind, the AII-FR interconnector can provide low-cost system flexibility that
would have otherwise been supplied by natural gas or distillate plant, further
justifying the reduction in their dispatch.
The availability of more wind generation (high wind scenario) allows the system
to further displace thermal plant. As interconnection can provide similar services
to gas turbines in terms of flexibility provision, the overall dispatch of gas-fired
plant is reduced by 16.96% or 2300 GWh, accounting for the greatest part of the
reduction in thermal unit start-ups between the base and high wind IC scenar-
56
ios. The dispatch of coal plant is increased by 6.34% or 250 GWh, compensating
for part of the reduction in on-line gas plant, and making efficient use of the system on-line units. The dispatch from distillate-fired plant is increased by 13.24%,
however, this corresponds to a modest 151 MWh increase per annum. Distillate
plant are more flexible that natural gas-fired units, and are employed to follow
the load during periods of high wind generation variability, when the available
interconnectors are unable to do so.
When EES technologies are installed on the system with the AII-FR link, their
potential to decrease the generation cost savings is lower than when the AIIFR connection is not present, as both technologies compete to provide similar
services.
Wind curtailment is increased when the AII-FR link is added to the system, with
respect to the base case, owing to the fact that the interconnector displaces
the system flexible generators, and as it is operated at almost full load during
all periods, it does not fully compensate for the load-following characteristics of
flexible generation.
Nonetheless, a sensitivity analysis was carried out, reversing the fuel costs of
natural gas and coal. In such scenario, interconnection favours natural gas over
coal plant, and the wind curtailment is 2.4% on the base wind scenario; interconnection spurs a reduction in wind curtailment compared to the base case.
The results obtained indicate that effect on wind curtailment of interconnection
is highly dependent on the fuel mix and fuel prices.
57
5.1.2
S YNERGIES BETWEEN SOURCES OF FLEXIBILITY
Alignments in the operation of the flexibility options considered, and the existing
ones in the system arise. Two categories are identified:
• Synergies between CAES, BES and PHS
• Synergies between BES and flexible natural gas-fired plant
Figure 5.6 illustrates the percentage change in dispatch from PHS, natural gas
(NG) plant, CAES and BES, compared to the base case. For CAES and BES, the
base cases are taken as scenarios CAES and BES respectively. Similar trends are
observed for the high wind scenario and for the system with interconnection.
5.1.2.1
CAES, BES
AND
PHS
Figure 5.6 shows that the dispatch from PHS increases under all scenarios considered with respect to the base case. The Turlough Hill unit cannot provide sufficient capacity on its own to justify displacing thermal plant. Therefore, when
no additional EES is present on the system, it is more profitable to make full use
of the on-line thermal plant, at a lower PHS dispatch. However, when CAES or
BES are installed on the system, the sum of the overall EES capacity lessens the
requirement for on-line thermal plant, leading to an increased dispatch from the
available EES units to compensate for the displaced thermal generators.
58
Figure 5.6: Percentage change in generation from EES and natural gas compared to base case: base wind scenario
,
When the li-ion battery and CAES are both added onto the system, the combined
dispatch from EES is limited by the system transmission constraint groups,
which caps the number of thermal plant that may be turned off-line. The dispatch of BES and PHS is increased while the dispatch of CAES is decreased,
owing to the fact that CAES is the most expensive EES option, as it consumes
natural gas.
5.1.2.2
BES
AND
CCGT S
The li-ion battery, unlike CAES, boosts the dispatch from CCTGs. The reason behind such behaviour draws back to BES operating as a constant reserve provider.
59
When BES is added to the system, it lowers the reserve provision from natural
gas-fired plant by 16% (or 600 GWh) more than CAES. The unit commitment
model takes advantage of the reserve-providing capabilities of BES to increase
the operational efficiency of gas-fired plant, increasing the dispatch of the later
to compensate for the displaced coal and distillate plant, allowing for higher levels of wind generation.
5.1.3
N ET PRESENT VALUE ANALYSIS
The economic evaluation of CAES and BES on the AII system is carried out using
a net present value (NPV) analysis: a standard analysis for the appraisal of longterm projects. The NPV is calculated as shown in (5.3); where t is the lifetime
of the technology, Bt is the yearly cash inflow (equated to the generation cost
savings), i is the interest rate and CO is the capital cost of the investment. A
positive NPV indicates positive returns on the investment.
NP V =
n
X
t=1
Bt
(1 + i)t
CO
(5.3)
Throughout the lifetime of the technologies under consideration, changes in fuel
price, carbon tax, wind penetration and the generation portfolio development will
directly affect the yearly generation cost savings (Bt ) that the asset will bring to
the system. To assess the sensitivity of the EES assets over their operational
lifetimes to the changes in the value of the technology, we consider the cases
60
in which Bt increases or decreases by 2% per annum, and the case when the
value remains constant. A value of 2% is chosen based upon the fact that the
factors affecting the value of the assets are expected to show relatively slow1
changes, owing to the lengthy processes associated with policy and generator
development.
The analysis is carried out for two interest rates (i): 2% and 4%, reflecting the
trends in the Irish interest rate over the last years. The NPV analyses are conducted separately for EES and the AII-FR interconnector.
The cost of building CAES is extremely variable and site specific, a range of
capital investment costs from 200 to 610 Me is examined2 . For the battery, a
capital expenditure (CAPEX) from 180 to 690 Me is considered3 . The ranges in
the CAPEX costs for both technologies are obtained from Akhil et al. (2013). A
lifespan of 20 years is assumed for the EES technologies.
Table 5.4 displays the break-even capital cost for the EES technologies (within
the CAPEX ranges considered) obtained through NPV analysis. N indicates that
the technology is not viable in that scenario within the range of capital costs
considered.
Table 5.2 indicates that, when used in combination, compressed air energy storage and li-ion battery storage can spur generation cost savings of up to 31 Me
1
Due to political instabilities, new technological breakthroughs or new fuel reservoir discoveries, fuel price fluctuations may be significant from one year to another. These phenomena prove
challenging to predict, and are therefore not accounted for in the analysis.
2
The CAES range of CAPEX costs correspond to 1.49 Me/MW to 4.53 Me/MW.
3
The li-ion range of CAPEX costs correspond to 1.84 Me/MW to 6.94 Me/MW.
61
Table 5.4: Break-even capital cost (Me) (Base wind)
Interest rate
i=0.02
i=0.04
Yearly change in
investment value
(%)
2%
0
-2%
2%
0
-2%
CAES
250
210
N
N
N
N
Ba
430
360
305
300
260
200
C (IC)
N
N
N
N
N
N
Ba (IC)
265
210
170
160
N
N
(IC) = Interconnector present, = Not viable within CAPEX range
per annum. Nonetheless, the net present value analysis illustrates that the cost
savings may not justify the high capital expenditure costs of EES in many scenarios.
In Table 5.4, it can be seen that capital costs above 250 Me are never justified
for CAES. The two economically justifiable scenarios for CAES, in terms of generation cost savings, are when the interest rate is low (2%), the value of the CAES
plant shows either an annual growth of 2% or remains constant, and neither the
AII-FR interconnector nor BES are present in the system. Moreover, the justifiable capital investment lies at the lower end of the range of CAPEX considered.
The results therefore indicate that CAES is a risky investment from a system
perspective.
Li-ion battery storage, on the other hand, shows significantly more encouraging
62
results. As seen in Table 5.2, the generation costs savings brought by BES can
be up to 12 Me higher than those spurred by CAES, justifying the installation
of BES in a greater number of scenarios than CAES. When neither CAES not the
AII-FR interconnector are present in the system, installing BES is justified under
all economic cases considered, in the most favourable scenario, a capital cost of
up to 430 Me may be justified. Similar to CAES, there is no economic case for
installing BES when CAES has already been installed in the system.
Overall, the NPV results indicate that BES is, by far, the wiser investment EES
option for the AII system in 2020. However, it must be considered that the lifetime
of batteries is highly dependent on their cycling. In the analyses carried out as a
part of this study, low battery cycling was observed, as the li-ion storage facility
was, for the most part, involved in providing operating reserve. However, previous
studies have shown that the lifetime of batteries can decrease by over 5 years is
they are significantly cycled throughout their lifespan (Rastler, 2010), a factor
that must be accounted for when investing in BES.
A similar NPV analysis is conducted for the AII-FR interconnector investment.
EirGrid estimate that the construction of a new interconnector line from Ireland
to France would cost approximately 650 Me (1.3 Me/MW) (EirGrid and SONI,
2013). To allow for flexibility CAPEX range from 600 to 800 Me is considered,
and an expected lifespan of 35 years. The results indicate that a capital cost of
up to 800 Me can be justified for the construction of an interconnector from
Ireland to France under all scenarios considered.
The cheaper capital cost per MW of interconnection, coupled with its large capac63
ity brings about significantly larger generation costs savings than EES technologies, resulting in very encouraging results for the investment in interconnection
with France. However, some limitations of the NPV analysis carried out must be
acknowledged. It is assumed that the technologies considered are only valued in
terms of generation costs savings from a system perspective. Nonetheless, other
factors such as reduction in wind curtailment may also be decisive in the validity of different investments, particularly if these are of political relevance. It
was found that 37% of the system demand was met by wind generation when
the AII-FR was added to the system, a value below the Irish 2020 renewable energy targets, while 40.5% of the yearly demand was met by wind generation with
battery energy storage on the system, and 41.2% with CAES and BES on the system. Moreover, one of the main drivers for the development of renewable energy
in the island of Ireland, is reducing the island’s dependence on foreign fuel imports. The AII-FR interconnector achieves the opposite, it increases the island’s
dependence on foreign generation, making the AII vulnerable and sensitive to
generation availability and price fluctuations in France. EES on the other hand
boost the utilisation of the Irish wind resource, reducing the island’s dependence
on electricity imports and on foreign fuel.
A paradox arises when evaluating flexibility technologies in high wind scenarios.
Table 5.2 illustrates that the potential for sources of flexibility to bring about
generation costs savings to the system at higher levels of installed wind is decreased. However, it is exactly at higher levels of wind generation that the system
will require the ancillary services provided by EES and interconnection: fast frequency response, ramping and load following. It follows that at higher levels of
64
wind generation, the economic valuation of sources of flexibility must account for
the value of the ancillary services provided by sources of flexibility to the power
system, on top of the generation costs savings. EirGrid and SONI are aware of
such challenge, and are currently developing a new range of system products in
their DS3 program (EirGrid and SONI, 2013), valuing specific ancillary services
that will boost the transition to higher renewable energy penetrations.
5.2
A NALYSIS
FROM AN INVESTOR PERSPECTIVE
The economic value of the investments considered cannot be equally assessed
from an investor and from a system perspective; private investors will unlikely
be remunerated the generation cost savings that their asset brings to the system. The sources of potential income to a private investor are identified, and a
net present value analysis is carried out for the CAES and li-ion energy storage
investments, as interconnection will most probably be state owned and operated.
5.2.1
I DENTIFIED POTENTIAL REVENUE STREAMS
The literature reviewed agrees in that only performing electricity arbitrage does
not provide the maximum value from EES to the system, nor does it make EES
an attractive investment option. Therefore, the economic viability of the CAES
and BES investments for a private investor is evaluated by accounting for several
potential revenue streams that may arise in the 2020 AII power market.
65
The first revenue stream considered is the income from electricity arbitrage, calculated as per (5.4); where the revenues from arbitrage (Barbitrage ) are equal to
the sum through optimisation intervals (t), of the energy provided (Edischarge,t ),
remunerated at the system regional marginal cost (SRM Ct )4 , minus the energy
purchased at the electricity price to charge the storage unit (Echarge,t ). When calculating Barbitrage for CAES, the production fuel costs are subtracted from the
unit’s revenues.
Barbitrage =
T
X
t=1
(Edischarge,t ⇤ SRM Ct + Echarget ⇤ Elec. pricet )
(5.4)
With the increase in non-synchronous generation in the island of Ireland, new
challenges have arisen, requiring change in the composition of the system ancillary services, and in the way that these are remunerated. EirGrid and SONI
(EirGrid and SONI, 2013) propose a new range of system products, the DS3
products, addressing the challenges associated with achieving the government’s
renewable energy targets. Several of the DS3 products have been identified as
potential sources of income for electrical energy storage owners, including the
provision of: primary, secondary and tertiary operating reserve, ramping, fast
post-fault active power, synchronous inertia and dynamic reactive power. The
value of the DS3 system services can be calculated employing a capability based
approach, remuneration per MW installed, or a dispatch-dependent approach,
remuneration per MW contributed to service. EirGrid and SONI have stated their
4
The SRMC is the marginal (incremental) cost of generation; the variable cost associated with
providing the next megawatt of power.
66
preference for the later remuneration technique, which will be the method employed in this study.
Table 5.5 displays the expenditure "pot" allocated to each of the services that
EES may provide, obtained from a total system service available expenditure of
355 Me.
Table 5.5: DS3 system service and allocated expenditure pot (EirGrid and
SONI, 2013)
Product
Allocated expenditure (Me)
POR
39
SOR
24
TOR (1&2)
56
Dynamic reactive power
35
Fast post-fault active power
62
Ramping margin
46
Synchronous inertial response
8
The revenues obtained from the provision of primary, secondary and tertiary
operating reserve are calculated by taking two different approaches:
1. Revenues calculated directly from the PLEXOS simulation results, from
which the system value of reserve provision for each half-hour period is
given. The income from the provision of POR, SOR and TOR (Breserve ) is
found as per equation 5.5, where the sum through all optimisation periods
(t to T ) of the reserve provision (Preserve,t ), is multiplied times the price of
67
reserve.
Breserve =
T
X
t=1
Preserve,t ⇤ reserve pricet
(5.5)
2. Revenues calculated from the DS3 expenditure pots by remunerating the
storage unit a percentage of the reserve pot in proportion with the services
it provides, as shown in equation 5.6.
Breserve = Reserve expenditure ⇤
Reserve provided by storage unit
T otal reserve provided
(5.6)
The purpose of calculating the income from reserve provision services through
both methodologies is to allow comparison between the value that EirGrid and
SONI place on reserve in EirGrid and SONI (2013), and the value of operating
reserve found through the cost minimisation, unit commitment model.
A final revenue stream is considered, Bother services , accounting for:
• Dynamic reactive power: to maintain voltage within its rated operating range
throughout the system, the generation and consumption of reactive power
must be balanced. Dynamic reactive power response is required to balance
the system reactive power in the case of a contingency. In the DS3 document, the dynamic reactive power service is defined as: the capability of a
generator to deliver a reactive response proportionate to the magnitude of the
voltage dip. The reactive power response shall be supplied with a rise time
no greater than 70 ms, a percentage overshoot of no greater than 20%, and a
settling time no greater than 500 ms.
68
• Post-fault active power: to prevent active power imbalances, the post-fault
active power service remunerates units that are able to quickly recover their
power dispatch following a fault in the transmission system: to at least 90%
its pre-fault value within 250 ms of the voltage recovering to at least 85% of
its pre-fault value.
• Ramping margin: the rate of change in output required from a centrally
dispatched unit. Required to manage imbalances between generation and
demand over longer time frames than operating reserve (minutes to hours).
The ramping margin service is defined as: the unit’s ramp up capability
throughout a given horizon.
• Synchronous inertial response (SIR): the system inertia is directly related
to the strength and stability of the power system. At high levels of nonsynchronous generation, the ability of the system synchronous units to
provide inertial response becomes increasingly valued. The SIR product is
expected to be remunerated in proportion to the kinetic energy of a synchronous generation multiplied times the SIR ratio: ratio of kinetic energy
to the lowest sustainable MW output at which the unit can operate at while
providing reactive power control.
EirGrid and SONI (2013) employ a 2020 AII model to calculate the level of remuneration from each of the DS3 services considered. A separate PLEXOS simulation was run for each service, assuming a 200,000 e pot per service. The
dispatch-dependent remuneration of PHS was found as displayed in Table 5.6,
which will serve as the basis for the calculation of Bother services for CAES and BES.
69
Table 5.6: PHS annual payments for 1 Me spent on system services (EirGrid
and SONI, 2013)
Product
Dispatch-dependent payment (e/MW installed)
Dynamic reactive power
26
Fast post-fault active power
6
Ramping margin
77
SIR
5.2.2
132
N ET PRESENT VALUE ANALYSIS
The net present value analysis is calculated as shown in equation 5.7, where
the cash inflow per year, B, is subtracted from the asset annualised capital cost
(ACC). The ACC is found as displayed in equation 5.8, where CO is the capital
cost of the investment, i is the interest rate and N is the lifetime of the investment
in years.
NP V = B
ACC =
1
(5.7)
ACC
CO ⇤ i
(1 + i)
N
(5.8)
An annualisation of net present value analysis is carried out, as the value of
the assets over their lifetimes is directly dependent on the remuneration policies
in place, which are of extremely uncertain nature and challenging to predict.
70
Nonetheless, the break-even capital expenditures calculated, may be compared
to those found from a system perspective when assuming that the value of the
asset remains constant over its lifetime (Table 5.4).
The same values as for Section 5.1.3 are employed regarding the capital costs of
CAES and BES: 200 to 610 Me and 180 to 690 Me respectively. The lifetime of
the technologies is taken to be 20 years, and an interest rate of 4% is selected.
The net present value analysis is carried out for CAES and BES in all possible
scenarios from Table 5.1. To analyse the impact of each revenue stream on the
profitability of EES, Barbitrage , Breserve and Bother services are each subsequently added
to the NPV calculation in the given order; revenues from arbitrage are ensured,
revenues from reserve provision are likely, while income from other DS3 services
is still only a future possibility.
Initially the NPV is calculated accounting solely for the asset revenues obtained
through arbitrage.
N P V = Barbitrage
ACC
(5.9)
The minimum annualised capital cost that must be covered to justify investment
in CAES is 14.72 Me, corresponding to a CAPEX of 200 Me. The maximum
revenue obtained by the CAES unit through arbitrage is 5.48 Me per annum,
9.24 Me below the an annual income that would justify the construction of
the least expensive CAES plant within the CAPEX range. Moreover, the income
71
from arbitrage lessens when either BES or the AII-FR interconnector are on the
system, further deteriorating the economic case for CAES.
Accounting only for the revenue streams from arbitrage, makes BES an even less
attractive investment option than CAES. As seen in Section 5.1.1, the maximum
benefits from a system operation point of view are drawn from BES when it is
primarily involved in the provision of operating reserve. Therefore, due to its low
energy dispatch, the maximum revenue obtained from arbitrage is 1.79 Me, in a
base wind and no-other-flexibility-options-installed scenario, which is 11.45 Me
below the minimum justified ACC: 13.24 Me, corresponding to a 180Me CAPEX.
As seen in Section 5.1, higher levels of wind generation reduce the overall system cost of generation, resulting in lower SRMCs and slightly decreased Barbitrage
values.
The results obtained indicate that, as outlined in the literature, investment in
EES is not profitable when just considering the arbitrage revenue stream. It is
therefore of essence that other EES services are remunerated if storage is to
become an attractive option to investors.
The next step involves accounting for the income stream from the provision of
primary, secondary and tertiary operating reserve (5.10). Two values of Breserve
are considered: the income from reserve obtained from the PLEXOS unit commitment model, and the reserve remuneration according to the DS3 financial
statement. Figures 5.7 and 5.8 show the break-even capital costs for CAES and
BES respectively, for the two reserve remuneration models, at base wind (5900
72
MW) and high wind (6200 MW) generation. Technologies between parentheses
indicate their existence in the system when either CAES or BES is installed i.e.:
CAES (BES,IC) indicates that CAES is included in a system already containing a
li-ion storage facility and an AII-FR interconnector.
N P V = Barbitrage + Breserve
ACC
(5.10)
It is observed that revenues from reserve provision must be accounted for for the
EES technologies considered to become economically viable.
As seen in Section 5.1.1, CAES is less involved in reserve provision than BES,
and therefore its income from reserve services is lower. When basing the reserve
income calculations on the values found through the cost minimisation PLEXOS
model, the sum of Barbitrage and Breserve is not sufficient, in any of the scenarios considered, to justify investment in CAES. However, when the DS3 reserve
income is applied, an economic case for the development of CAES arises in scenarios in which BES is not already present in the system. The highest CAPEX
for CAES (350 Me) is justified at 5900 MW of wind installed, with no other new
flexibility sources on the system. When the AII-FR interconnector is present, the
break-even CAPEX is lowered, as revenues from Barbitrage drop. In high wind generation scenarios, the flexibility of BES is favoured over CAES to provide operating reserve, displacing a larger percentage of the reserve provision and lowering
the break-even CAPEX for CAES.
As illustrated in Figure 5.8, the li-ion unit shows a stronger economic viabil73
Figure 5.7: Break-even capital cost of CAES (Me) from investor perspective
,
Figure 5.8: Break-even capital cost of BES (Me) from investor perspective
,
74
ity than CAES. BES is found to be a feasible investment option in all scenarios
considered, except in the high wind generation scenario, when calculating the reserve income through PLEXOS. As the li-ion unit provides a significant percentage of the overall system reserve, when applying the DS3 remuneration scheme,
the profitability of BES is boosted. Moreover, a greater percentage of the system
reserve is provided by BES at higher levels of wind generation, further increasing the justifiable CAPEX of a new li-ion development. When Breserve is calculated
through PLEXOS, 91% of the BES revenues, on average, are obtained through
the provision of operating reserve, compared to 42% for CAES. However, when
calculated through the DS3 proposal, 97% of the unit’s revenues are obtained
through its reserve services (56% for CAES).
In the PLEXOS cost minimisation model, the average price of operating reserve
drops from 3.3 e/MW in the base wind scenario, to 1.6 e/MW in the high wind
scenario, indicating that a purely cost minimisation-based remuneration of reserve is insufficient to boost wind generation, particularly at high wind levels.
The DS3 system services were developed to reduce wind curtailment, and compensate the technologies that may enable such goal. In Section 5.1, it was found
that BES is unparalleled when it comes to the reduction of wind curtailment,
out of the flexibility options considered. The DS3 financial products strongly incentivise the development of BES, particularly at high levels of wind generation,
fulfilling their purpose.
Finally, an estimate of the revenues that may be obtained through Bother services
is calculated. The PHS revenues, in e/MW installed, published for the provision
75
of the new DS3 products (Table 5.6), are scaled to the capacities of the BES
and CAES plant, and calculated according to the allocated expenditure pot per
service (5.5). Bother services for CAES and BES is estimated as shown in equation
5.11. The results obtained are displayed in Table 5.7.
Bother services = BP HS ⇤ Capacity installed ⇤ Expenditure pot
(5.11)
Note that the calculations provided are by no means precise; they are conducted
to give the reader an idea of the range within which the revenues from the new
DS3 products may lie.
CAES generation is synchronised to the system frequency, and is expected provide services similar to PHS, as identified in Section 3. BES on the other hand
is unable to provide inertial response (revenues from SIR = 0), may provide more
and faster post-fault active power and ramping services, due to is greater dispatch flexibility, and the provision of dynamic reactive power is likely to be lower
than that for CAES and PHS, depending on the control scheme employed.
The approximate revenues from Bother services are given as 0.482 Me/annum for
li-ion energy storage and 0.788 Me/annum for CAES. The estimated income
from Bother services is up to two orders of magnitude lower than the revenues from
Barbitrage and Breserve . In none of the scenarios considered, does the addition of
Bother services into the NPV analyses make or break the case for the development of
EES. Rather, accounting for the extra revenue stream may justify the investment
in EES assets with higher capital costs.
76
Table 5.7: Calculation of Bother services for CAES and BES scaled from PHS
values
Product
Calculated
PHS revenue
(e/MW
installed)
Expenditure
pot (Me)
Approximate
100 MW BES
revenue (Me)
Approximate
134 MW CAES
revenue (Me)
Dynamic reactive power
26
35
0.091
0.142
Fast post-fault
active power
6
62
0.037
0.050
Ramping margin
77
46
0.354
0.475
SIR
132
8
0
0.142
0.482
0.788
Total
The results point to the fact that there is a moderate alignment in the economic
interests of the system and of private investors; both NPV analyses indicate that
battery energy storage is of greater interest to both the system and investors
than CAES. More cases in which the development of EES are justified from an
investor rather than from a system perspective, particularly when the DS3 revenue streams are accounted for, owing to the fact that DS3 values ancillary
services that are not accounted for in the system economic analysis. It was also
found that the DS3 products are effective at achieving the goals for which they
were developed; they encourage the development of the more flexible technologies, particularly at high wind generation levels, allowing for greater levels of
wind integration.
Some final notes on the analysis provided must be made. The model employed
77
for this thesis was developed based on EirGrid and SONI’s predictions of the
generation portfolio and system constraints in 2020, it is therefore assumed that
the 2020 AII model employed in EirGrid and SONI (2013) is in line with the one
used for this project. Nonetheless, some limitations of the methodology must be
acknowledged. The revenue values published for the new services in the DS3
proposal have been met with reservation: separate simulations were run to calculate the remuneration levels obtained from each of the new services proposed,
failing to account for the interaction between these, potentially resulting in their
over valuation. However, it was found that the revenues obtained from the new
DS3 services, Bother services , only make a marginal contribution to the overall EES
income streams. Moreover, the calculation of Bother services should be taken with a
grain of salt; it calculated only to provide the reader with a ballpark value of the
revenues that may obtained through the new DS3 products.
78
C HAPTER 6
C ONCLUSION
AND
F UTURE W ORK
The impact on the operation of the All-Island power system, and economic viability of the intended flexibility developments in the island of Ireland were assessed.
Eight different scenarios were analysed, in which all the possible combinations of
the technologies considered (compressed air energy storage, li-ion battery storage
and Ireland - France interconnection) were studied.
The findings indicate that, the addition of an extra unit of flexibility to the AII
power system, will always spur a reduction in the system operation costs. Moreover, flexibility investments favour the end-user by lowering the average price of
electricity. It was found however, that the incremental generation cost savings
are decreased with the addition of each subsequent flexibility option.
Electrical energy storage technologies were found to bring reductions in the
system wind curtailment, enabling the attainment of the AII renewable energy
79
targets. However, wind curtailment was increased in the system as a result of
installing an AII-FR interconnector. The studies conducted indicate that the increase in wind curtailment brought about by the Ireland - France interconnector
is highly dependent on the system generation portfolio and fuel mix.
Analyses were carried out to assess the profitability, from a system point of view,
of the flexibility options considered. To do so, technologies were valued in terms
of the generation cost savings brought to the power system. CAES was found to
be the riskier investment, with justifiable capital expenditures at the lower end
of the CAES capital cost range, and showing high sensitivity to changes in the
economic climate. The li-ion storage facility presents a much stronger economic
case, indicating that its development could likely be beneficial for the operation
of the AII power system. The cost savings brought about by both storage technologies was not high enough to justify the development of both from a system
perspective.
The construction of interconnection presents the strongest economic argument,
and is justified from a system perspective under all scenarios considered. Nonetheless, the economic analysis carried out only values the generation cost savings
that the assets bring to the system. In reality other factors such as reduction
in wind curtailment, and lowering the dependence on foreign imports may also
be decisive in the validity of different investments, particularly if these are of
political relevance.
Analyses from an investor perspective were then conducted. It was found that
when only accounting for revenues through arbitrage it is never profitable to
80
invest in energy storage for the system under consideration; other services must
be remunerated for electricity storage to become an attractive investment option.
The economic viability of EES, in particular BES, is boosted when the income
from the provision of operating reserve is accounted for.
Out of the flexibility options considered, BES is unparalleled when it comes to
the reduction of wind curtailment. The DS3 financial products strongly incentivise the development of BES, particularly at high levels of wind generation,
successfully fulfilling the purpose for which they are being developed: facilitating
the growth if wind generation in the island of Ireland.
Overall the interests of the system, from a cost minimisation and wind promotion
perspective, and the interests of a private investor align: battery energy storage
is the preferred investment option for both parties, over compressed air energy
storage.
The role of electricity storage on the 2020 All Island of Ireland power system
will depend on the system priorities. From a purely cost minimisation perspective, the most profitable options are either to install both an interconnector from
Ireland to France and a BES unit, or just to install the AII-FR interconnector.
However, the development of the Ireland - France link results in higher levels of
wind curtailment, a higher dependence on foreign imports and a greater exposure of the Irish electricity system to changes in the French power market.
The results found suggest that the development of EES and interconnection has
a significant impact on the dispatch of conventional thermal generation, poten-
81
tially discouraging plant owners from remaining connected to the AII power system. Further studies will analyse how the reduction in available thermal generation may affect the system operation, and whether policy should be put in place
to prevent high-inertia units from leaving the system.
Moreover, further analyses will study the possibilities of counter-trading wind
generation though the AII-FR interconnector and of allocating a certain volume of
its capacity for the provision of operating reserve. Such modifications may abate
the high wind curtailment brought by the development of the interconnector.
At higher penetrations of wind generation, it is likely that wind plant will have to
provide frequency reserve. Such scenario will be assessed to determine the effect
that the provision of frequency reserve from wind generation has on the value of
electrical energy storage.
To further develop the economic valuation of EES from the perspective of private
investors, revenue streams from capacity payments will be considered.
Finally, future work will study the impact on system operation and investor revenues arising from the participation of electrical energy storage in sequential
electricity markets: day ahead, intra-day and balancing market.
82
A CRONYMS
ACC, Annualised Capital Cost, 70
EWIC, East-West Interconnector, 38
AII, All Island of Ireland, 1
FES, Flywheel Energy Storage, 14
ANWEEM, Academic North-West
European Electricity Market
GB, Great Britain, 39
Model, 28
HVDC, High Voltage Direct Current,
1
BES, Battery Energy Storage, 3
IEA, International Energy Agency, 5
CAES, Compressed Energy Storage,
Li-ion, Lithium-ion Battery, 14
14
CCGT, Combined Cycle Gas
MT, Medium-Term, 27
Turbines, 10
NaS, Sodium-Sulphur Battery, 14
DCL, Double Layer Capacitor, 14
NG, Natural Gas, 58
DECC, UK Department of Energy
NiCd, Nickel-cadmium Battery, 14
and Climate Change, 40
NiMH, Nickel-metalhydrate battery,
21
EES, Electrical Energy Storage, 2
ESB, Electricity Supply Board, 33
OCGT, Open Cycle Gas Turbine, 10
83
PASA, Projected Assessment of
Penetration, 1
System Adequacy, 27
SOR, Secondary Operating Reserve,
Pb-acid, Lead-acid Battery, 14
38
PCM, Phase Changing Materials, 14
SRMC, System Regional Marginal
PHS, Pumped Hydro Storage, 14
Cost66
PJM, Pennsylvania, New Jersey and
ST, Short-Term, 27
Maryland, 6
TCG, Transmission Constraint
POR, Primary Operating Reserve, 38
Group, 35
RES, Renewable Energy Source, 1
TES, Thermal Energy Storage, 14
ROI, Republic of Ireland, 3
TOR, Tertiary Operating Reserve, 38
TSO, Transmission System
SIR, Synchronous Inertial
Operator, 11
Response, 69
SMES, Superconducting Magnetic
VO&M, Variable Operation and
Energy Storage, 14
Maintenance, 39
SNSP, System Non-Synchronous
VRB, Vanadium Redox Battery, 14
84
B IBLIOGRAPHY
AES
(2014).
Ireland.
AES
100
MW
grid
energy
storage
in
Northern
http://www.aesenergystorage.com/2014/06/08/
aes-files-100-megawatt-grid-storage-connection-northern-ireland/.
[Online; accessed 14/03/2015].
Akhil, A., Huff, G., Currier, A., Kaun, B., Rastler, D., Chen, S., Cotter, A., Bradshaw, D., and Gauntlett, W. (2013). DOE/EPRI 2013 Electricity Storage
Handbook in Collaboration with NRECA. Technical report, Sandia National
Laboratories.
Atkinson, I., Harvey, C., and Smith, M. (2002). The moyle interconnector. The
Power Engineering Journal.
CER (2012). Public 2011-12 validated sem generator data parameters. http:
//www.allislandproject.org/en/market_decision_documents.aspx.
[Online; accessed 27/01/2015].
Cleary, B., Duffy, A., O’Connor, A., Conlon, M., and Fthenakis, V. (2013). Assessing the economic benefits of compressed air energy storage on the 2020 irish
85
power system. In 48th Universities Power Engineering Conference, Dublin,
Ireland.
DCENR (2009). National Renewable Energy Action Plan: Ireland. Technical report.
DECC (2013).
DECC Fossil Fuel Cost Projections.
https://www.gov.
uk/government/uploads/system/uploads/attachment_data/file/
212521/130718_decc-fossil-fuel-price-projections.pdf.
[Online;
accessed 19/02/2015].
Divya, K. and Ostergaard, J. (2009). Battery energy storage technology for power
systems: an overview. Electric Power Systems Research, 79:511–520.
EirGrid and SONI (2010). All-Island TSO Facilitation of Renewables Studies.
Technical report.
EirGrid and SONI (2011a). All-Island Generation Capacity Statement 2012-2021.
Technical report.
EirGrid and SONI (2011b). Ensuring a Secure, Reliable and Efficient Power System. Technical report.
EirGrid and SONI (2013). Grid 25: Delivering Ireland’s Electricity Future. Technical Report 13.
EirGrid and SONI (2014a). All-Island Generation Capacity Statement 2014-2023.
Technical report.
86
EirGrid and SONI (2014b). Operational Constraints Update: 18th November
2014. Technical report.
EPRI-DOE (2003). Handbook of Energy Storage for Transmission and Distribution Applications. Palo Alto, CA.
EU Commission (2013). The Future Role and Challenges of Energy Storage.
Technical report, DG ENER.
EU Commission (2014). Horizon 2020 Work Programme 2014 - 2015: Secure,
Clean and Efficient Energy. Technical report.
Gaelectric (2014). Larne CAES facility. http://www.gaelectric.ie/index.
php/energy-storage/larne/. [Online; accessed 14/03/2015].
GWEC (2014). Global installed wind power capacity (MW). http://www.gwec.
net/global-figures/graphs/. [Online; accessed 27/03/2015].
IEA (2011). World Energy Outlook 2011. Technical report.
IEC (2011). Electrical Energy Storage Whitepaper. Technical report.
Inage, S. (2009). Prospects for Large-Scale Energy Storage in Decarbonised Power
Grids. Technical report, IEA.
IRENA and IEA-ETSAP (2012). Electricity Storage: Technology Brief. Technical
report.
IRENA and IEA-ETSAP (2013). Thermal Energy Storage: Technology Brief. Technical report.
87
Lalor, G. (2005). Frequency control on an island power system with evolving plant
mix. PhD thesis, University College Dublin.
O’Dwyer, C. and Flynn, D. (2013). Grid-scale energy storage at high wind penetrations. International Workshop on Large-Scale Integration of Wind Power
into Power Systems as well as on Transmission Networks for Offshore Wind
Power Plants.
Pennwell,
ergy
J.
(2015).
storage
Lithium
market.
ion
batteries
dominate
grid
en-
http://www.elp.com/articles/2015/03/
lithium-ion-batteries-dominate-grid-energy-storage-market.
html. [Online; accessed 27/03/2015].
Philips, E. and Grant, P. (2011). The Impact of Wind on Pricing Within the Single
Electricity Market. Technical report, IWEA.
Rastler, D. (2010). Electricity Energy Storage Technology Options: a White Paper
Primer on Applications, Costs and Benefits. Technical report. EPRI.
Sioshansi, R., Denholm, P., Jenkin, T., and Weiss, J. (2009). Estimating the
value of electricity storage in PJM: arbitrage and some welfare effects. Energy
Economics, 31(2):269–277.
Strbac, G., Aunedi, M., Pudijianto, D., Djapic, P., Teng, F., Sturt, A., Jackravut,
D., Sansom, R., Yufit, V., and Brandon, N. (2012). Strategic Assessment of
the Role and Value of Energy Storage Systems in the UK Low Carbon Energy
Future. Technical report, Energy Futures Lab, Imperial College London and
EDF UK R&D Center.
88
Suazo-Martinez, C., Pereira-Bonvallet, E., Palma-Behnke, R., and Zhang, X.
(2014). Impacts of energy storage on short term operation planning under
centralized spot markets. IEEE Transactions on Smart Grid, 5(2):1110–1118.
Swider, D. (2007). Compressed air energy storage in an electricity system with
significant wind power generation. IEEE Transactions on Energy Conversion,
22(1):95–102.
Tuohy, A. and O’Malley, M. (2011). Pumped storage in systems with very high
wind penetration. Energy Policy, 39(4):1965–1974.
89

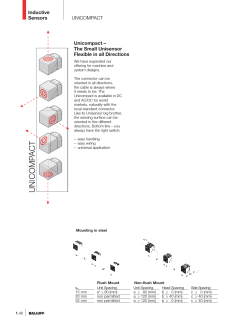


© Copyright 2026