
Chapter 5. Wind Power Siting and Environmental Effects
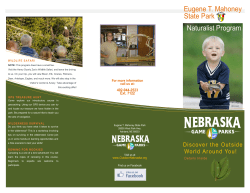
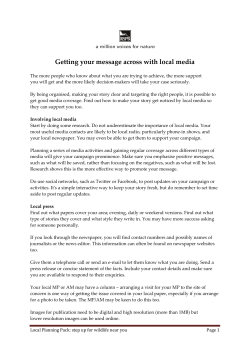
Chapter 5. Wind Power Siting and Environmental Effects The 20% Wind Scenario offers substantial positive environmental impacts in today’s carbonconstrained world. Wind plant siting and approval processes can accommodate increased rates of installation while addressing environmental risks and concerns of local stakeholders. 5.1 5 WIND ENERGY TODAY Wind energy is one of the cleanest and most environmentally neutral energy sources in the world today. Compared to conventional fossil fuel energy sources, wind energy generation does not degrade the quality of our air and water and can make important contributions to reducing climate-change effects and meeting national energy security goals. In addition, it avoids environmental effects from the mining, drilling, and hazardous waste storage associated with using fossil fuels. Wind energy offers many ecosystem benefits, especially as compared to other forms of electricity production. Wind energy production can also, however, negatively affect wildlife habitat and individual species, and measures to mitigate prospective impacts may be required. As with all responsible industrial development, wind power facilities need to adhere to high standards for environmental protection. Wind energy generally enjoys broad public support, but siting wind plants can raise concerns in local communities. Successful project developers typically work closely with communities to address these concerns and avoid or reduce risks to the extent possible. Not all issues can be fully resolved, and not every prospective site is appropriate for development, but engaging with local leaders and the public is imperative. Various agencies and stakeholders must also be involved in reviewing and approving projects. If demand increases and annual installations of wind energy approach 10 gigawatts (GW) and more, the wind energy industry and various government agencies would need to scale up their permitting and review capabilities. To date, hundreds of wind projects have been successfully permitted and sited. Although the wind energy industry must continue to address significant environmental and siting challenges, there is growing market acceptance of wind energy. If challenges are resolved and institutions are adaptive, a 20% Wind Scenario in the United States could be feasible by 2030. As noted by the Intergovernmental Panel on Climate Change (IPCC), under certain conditions, 20% Wind Energy by 2030 105 renewable energy could contribute 30% to 35% of the world’s electricity supply by 2030 (IPCC 2007). This chapter reviews environmental concerns associated with siting wind power facilities, public perceptions about the industry, regulatory frameworks, and potential approaches to addressing remaining challenges. 5.1.1 SITE-SPECIFIC AND CUMULATIVE CONCERNS About 10% to 25% of proposed wind energy projects are not built—or are significantly delayed—because of environmental concerns. Although public support for wind energy is generally strong, this attitude does not always translate into early support for local projects. Site-specific concerns often create tension surrounding new energy facilities of any kind. Although most wind energy installations around the United States pose only minor risks to the local ecology or communities, some uncertainties remain. Further research and knowledge development will enable some of these uncertainties to be mitigated and make risks more manageable. 5 Local stakeholders generally want to know how wind turbines might affect their view of their surroundings and their property values. In addition, they might be concerned about the impact on birds and other wildlife. Weighing these risks and benefits raises questions about the best management approaches and strategies. Wind energy developments usually require permits or approvals from various authorities, such as a county board of supervisors, a public service commission, or another political body (described in more detail in Section 5.5). These entities request information from a project developer—usually in the form of environmental impact studies before construction—to understand potential costs and benefits. The results of these studies guide jurisdictional decisions. A single lead agency might consider the entire life-cycle effects of a wind energy project. This is in contrast to fossil fuel and nuclear projects, in which the life-cycle impacts (e.g., acid rain and nuclear wastes) would be widely dispersed geographically. No single agency considers all impacts. For many government agency officials, the central issue is whether wind energy projects pose risks to the resources or environments they are required to protect. Officials want to know the net cumulative environmental impact (i.e., emissions reductions versus wildlife impacts) of using 20% wind power in the United States, whether positive or negative. Uncertainty can arise from inadequate data, modeling limitations, incomplete scientific understanding of basic processes, and changing societal or management contexts. Complex societal decisions about risk typically involve some level of uncertainty, however, and very few developers make decisions with complete information (Stern and Fineberg 1996). Because a great deal of experience exists to inform decision making in such circumstances, residual uncertainties about environmental risks need not unduly hinder wind energy project development. The wind industry may encounter difficulties entering a competitive energy marketplace if it is subject to requirements that competing energy technologies do not face. Risks associated with wind power facilities are relatively low because few of the significant upstream and downstream life-cycle effects that typically characterize other energy generation technologies are realized. Moreover, the potential risks are not commensurate when comparing wind energy and other sources (such as nuclear and fossil fuels), and comparative impact analyses are not 106 20% Wind Energy by 2030 readily available. These analyses would need to examine the broader context of the potential adverse effects of wind power on human health and safety (minimal), ecology, visibility, and aesthetics in relation to the alternatives. The acceptability of risks will vary among communities and sites, so it is important to understand these differences and build broad public engagement. Developing effective approaches to gaining the public’s acceptance of risks is a necessary first step toward siting wind energy facilities. 5.2 ENVIRONMENTAL BENEFITS 5.2.1 GLOBAL CLIMATE CHANGE AND CARBON REDUCTIONS Publicity related to wind power developments often focuses on wind power’s impact on birds, especially their collisions with turbines. Although this is a valid environmental concern that needs to be addressed, the larger effects of global climate change also pose significant and growing threats to birds and other wildlife species. The IPCC recently concluded that global climate change caused by human activity is likely to seriously affect terrestrial Compared with the current U.S. biological systems, as well as many other natural systems (IPCC average utility fuel mix, a single 2007). A 2004 study in Nature forecast that a mid-range 1.5 MW wind turbine displaces estimate of climate warming could cause 19% to 45% of global 2,700 tons of CO2 per year, or the species to become extinct. Even with minimal temperature equivalent of planting 4 square increases and climate changes, the study forecast that extinction kilometers of forest every year of species would be in the 11% to 34% range (Thomas et al. (AWEA 2007). 2004). The future for birds in a world of global climate change is particularly bleak. A recent article found that 950 to 1,800 terrestrial bird species are imperiled by climate changes and habitat loss. According to the study, species in higher latitudes will experience more effects of climate change, while birds in the tropics will decline from continued deforestation, which exacerbates global climate change and land conversion (Jetz, Wilcove, and Dobson 2007). Wind energy, which holds significant promise for reducing these impacts, can be widely deployed across the United States and around the world to begin reducing greenhouse gas emissions (GHGs) now. Although the effects of wind energy development on wildlife should not be minimized, they must be viewed in the larger context of the broader threats posed by climate change. 5 A primary benefit of using wind-generated electricity is that it can play an important role in reducing the levels of carbon dioxide (CO2) emitted into the atmosphere. Wind-generated electricity is produced without emitting CO2, the GHG that is the major cause of global climate change. Today, CO2 emissions in the United States approach 6 billion metric tons annually, 39% of which are produced when electricity is generated from fossil fuels (see Figure 5-1; EIA 2006). If the United States obtained 20% of its electricity from wind energy, the country could avoid putting 825 million metric tons of CO2 annually into the atmosphere by 2030, or a cumulative total of 7,600 million metric tons by 2030 (see assumptions outlined in Appendices A and B). A relatively straightforward metric used to understand the carbon benefits of wind energy is that a single 1.5 MW wind turbine displaces 2,700 metric tons of CO2 per year compared with the current U.S. average utility fuel mix, or the equivalent of planting 4 square kilometers of forest every year (AWEA 2007). 20% Wind Energy by 2030 107 Figure 5-1. Electricity production is responsible for 39% of CO2 emissions in the United States Source: EIA (2006) The fuel displaced by wind-generated electricity depends on the local grid and the type of generation supply. In most places, natural gas is the primary fuel displaced. Wind energy can displace coal on electric grids with large amounts of coal-fired generation. In the future, wind energy is likely to offset more coal by reducing the need to build new coal plants. Regardless of the actual fuel supplanted, more electricity generated from wind turbines means that other nonrenewable, fossilbased fuels are not being consumed. In New York, for example, a study prepared for the independent system operator (ISO) found that if wind energy provided 10% of the state’s peak electricity demand, 65% of the energy displaced would be from natural gas, followed by coal at 15%, oil at 10%, and electricity imported from out of state at 10% (Piwko et al. 2005). 5 In addition, manufacturing wind turbines and building wind plants together generate only minimal amounts of CO2 emissions. One university study that examined the issue (White and Kulsinski 1998) found that when these emissions are analyzed on a life-cycle basis, wind energy’s CO2 emissions are extremely low—about 1% of those from coal, or 2% of those from natural gas, per unit of electricity generated. In other words, using wind instead of coal reduces CO2 emissions by 99%; using wind instead of gas reduces CO2 emissions by 98%. 5.2.2 IMPROVING HUMAN HEALTH THROUGH REDUCED AIR EMISSIONS Switching to a zero-emissions energy-generation technology like wind power contributes to cleaner and healthier air. Moreover, wind power generation is not a direct source of regulated pollutants such as nitrogen oxides, sulfur dioxide, and mercury. Coal-fired power plants are the largest industrial source of mercury emissions in the United States (NESCAUM 2003). The U.S. Environmental Protection Agency (EPA) (EPA 2007) and the American Medical Association (AMA) note that fetal exposure to methylmercury has been linked to problems with neurological development in children (AMA Council on Scientific Affairs 2004). Furthermore, according the American Lung Association (ALA), almost half of all Americans live in counties where unhealthy levels of smog place them at risk for decreased lung function, respiratory infection, lung inflammation, and aggravation 108 20% Wind Energy by 2030 of respiratory illness. And more than 76.5 million Americans are exposed to unhealthful short-term levels of particle pollution, which has been shown to increase heart attacks, strokes, emergency room visits for asthma and cardiovascular disease, and the risk of death. Some 58.3 million Americans suffer from chronic exposure to particle pollution. Even when levels are low, exposure to these particles can also increase the risk of hospitalization for asthma, damage to the lungs, and the risk of premature death (ALA 2005). 5.2.3 SAVING WATER The nation’s growing communities place greater demands on water supplies and wastewater services, and more electricity is needed to power the expanding water services infrastructure. Future population growth in the United States will heighten competition for water resources. Especially in arid regions, communities are increasingly facing challenges with shortages of water and electric power, resources that are interlinked. 5 Water is a critical resource for thermoelectric power plants, which use vast quantities. These plants were responsible for 48% of all total water withdrawals in 2000, or about 738 billion liters per day (Hutson et al. 2005). Much of the water withdrawn from streams, lakes, or other sources is returned, but about 9%—totaling about 68 billion liters per day—is consumed in the process. Although regulation will require the majority of new generation plants to use recirculating, closed-loop cooling technologies, which will lessen water withdrawals, this evolution will actually lead to an overall increase in water consumption (DOE 2006). Even some renewable technologies place a demand on water resources. For example, most ethanol plants have demonstrated a reduction in water use over the past years, but are still in the range of 13.25 to 22.7 liters of water consumed per 3.79 liters of ethanol produced (IATP 2006). In contrast, wind energy does not require the level of water resources consumed by many other kinds of power generation. As a result, it may offer communities in water-stressed areas the option of Wind energy has the potential to economically meeting growing energy needs without conserve billions of liters of water in the increasing demands on valuable water resources. Wind energy interior West, which faces declining can also provide targeted energy production to serve critical water reservoirs. local water system needs such as irrigation and municipal systems. In a nongovernmental organization report entitled The Last Straw: Water Use by Power Plants in the Arid West, Baum and colleagues (2003) called attention to water quality and supply issues associated with fossil-fuel power plants in the interior West. Faced with water shortages, the eight states in this region are seeing water for power production compete with other uses, such as irrigation, hydropower, and municipal water supplies. Based on this analysis, the authors estimate that significant savings from wind energy are possible, as illustrated in Table 5-1. As the United States seeks to lessen the use of foreign oil for fuel, water use and consumption is high among other energy production methods. Most ethanol plants have demonstrated a reduction in water use in recent years, but are still in the range of 13.25 to 22.7 liters of water consumed per 3.79 liters of ethanol produced (IATP 2006). An issue brief, prepared by the World Resources Institute, stated that coal-to 20% Wind Energy by 2030 109 Table 5-1. Estimated water savings from wind energy in the interior West (Baum et al. 2003) Wind Energy (MW) Water Savings (billion gallons withdrawn) Water Savings (billion gallons consumed) 1,200 3.15 1.89 3,000 7.88 4.73 4,000 10.51 6.31 Adapted from The Wind/Water Nexus: Wind Powering America (DOE 2006) liquid fuel production is a water-intensive process, requiring about 10 gallons of water use for every gallon of coal-to-liquid product (Logan and Venezia 2007). 5 Global climate change is also expected to impact water supplies. Mountains in the western United States will have less snowpack, more winter flooding, and reduced flows in the summer, all of which worsen the already fierce competition for diminished water resources (IPCC 2007). Because of increasing demand for water and decreasing supplies, some tough decisions will be needed about how this valuable resource should be allocated—especially for the West and Great Plains. Although wind energy cannot solve this dilemma, an increased reliance on wind energy would alleviate some of the increased demand in the electricity sector, thereby reducing water withdrawals for the other energy sources. 5.3 POTENTIAL ENVIRONMENTAL IMPACTS 5.3.1 HABITAT DISTURBANCE AND LAND USE Fuel extraction and energy generation affect habitat and land use, regardless of the type of fuel. Traditional electricity generation requires mining for coal or uranium and drilling for natural gas, all of which can destroy habitat for many species and cause irreversible ecological damage. With the global and national infrastructure required to move fuel to generating stations—and the sites needed to store and treat the resulting waste—processing fossil fuel and nuclear energy is also a highly landintensive endeavor. Coal mining is estimated to disturb more than 400,000 hectares 11 of land every year for electricity generation in the United States, and it destroys rapidly disappearing wildlife habitat. In the next 10 years, more than 153,000 hectares of high-quality mature deciduous forest are projected to be lost to coal mining in West Virginia, Tennessee, Kentucky, and Virginia, according to the National Wildlife Federation (Price and Glick 2002). Wind development also requires large areas of land, but the land is used very differently. The 20% Wind Scenario (305 GW) estimates that in the United States, about 50,000 square kilometers (km2) would be required for land-based projects and more than 11,000 km2 would be needed for offshore projects. However, the footprint of land that will actually be disturbed for wind development projects under the 20% Wind Scenario ranges from 2% to 5% of the total amount (representing land needed 11 110 One hectare = 2.47 acres 20% Wind Energy by 2030 for the turbines and related infrastructure). Thus the amount of land to be disturbed by wind development under the 20% Wind Scenario is only 1,000 to 2,500 km2 (100,000 to 250,000 hectares)—an amount of dedicated land that is slightly smaller than Rhode Island. For scale comparisons, available data for existing coal mining activities indicate that about 1,700,000 hectares of land is permitted or covered and about 425,000 hectares of land are disturbed (DOI 2004). An important factor to note is that wind energy projects use the same land area each year; coal and uranium must be mined from successive areas, with the total disturbed area increasing each year. In agricultural areas, land used for wind generation projects has the potential to be compatible with some land uses because only a few hectares are taken out of production, and no mining or drilling is needed to extract the fuel. Although wind energy may be able to coexist with land uses such as farming, ranching, and forestry, wind energy development might not be compatible with land uses such as housing developments, airport approaches, some radar installations, and low-level military flight training routes. Wind turbines are tall structures that require an otherwise undisturbed airspace around them. The need for relatively large areas of undisturbed airspace can also directly or indirectly affect wildlife habitat. 5 In a presentation to the National Wind Collaborative Committee, wildlife biologists describe direct construction impacts that include building wind turbines, service roads, and other infrastructure (such as substations). Estimates of temporary construction impacts range from 0.2 to 1.0 hectare per turbine; estimates of permanent habitat spatial displacement range from 0.3 to 0.4 hectare per turbine (Strickland and Johnson 2006). Indirect impacts can include trees being removed around turbines, edges in a forest being detrimental to some species, and the presence of turbines causing some species or individuals to avoid previously viable habitats. For example, a grassland songbird study on Buffalo Ridge in Minnesota found species displacement of 180 meters (m) to 250 m from the wind turbines (Strickland and Johnson 2006). Indirect habitat impacts on grassland species are a particular concern, especially because extensive wind energy development could take place in grassy regions of the country. Peer-reviewed research has concluded, however, that one species, the Lesser Prairie Chicken, actively avoids electricity infrastructure such as transmission lines and frequent vehicle activity by as much as 0.4 km, and fossil fuel power plants by more than 1 km (Robel et al. 2004). Displacements of already declining local populations are likely, but the magnitude of these effects is uncertain because data specific to wind energy are not yet available. The extent of unknowns surrounding this issue led the National Wind Collaborative Committee (NWCC) Wildlife Workgroup to form the Grassland/Shrub-Steppe Species Collaborative (GS3C), a four-year research program to study the effects of wind turbines on grassland birds (NWCC 2006). Like the Bat and Wind Energy Cooperative (BWEC) discussed later, the GS3C provides a vehicle for public and private funding and for third-party peerreviewed studies. Issues regarding the conservation of sensitive habitats will need to be addressed over time. Strategic planning and siting to conserve and improve potentially high-value habitat can be constructive and beneficial for both wind energy and wildlife. 5.3.2 WILDLIFE RISKS Wildlife—and birds in particular–are threatened by numerous human activities, including effects from climate change. Relative to other human causes of avian mortality, wind energy’s impacts are quite small. Figure 5-2 puts the wind industry’s 20% Wind Energy by 2030 111 Figure 5-2. Anthropogenic causes of bird mortality (per 10,000 avian deaths) 5 Source: Erickson et al. (2002) impacts into context and illustrates that many human (and some feline) activities pose risks to birds. As Figure 5-2 shows, anthropogenic causes of bird fatalities range from 100 million to 1 billion annually. Currently, it is estimated that for every 10,000 birds killed by all human activity, less than one death is caused by wind turbines. In fact, a recent National Research Council (NRC 2007) study concluded that current wind energy generation is responsible for 0.003% of human-caused avian mortality. Even with 20% wind energy, turbines are not expected to be responsible for a significant percentage of avian mortality as long as proper precautions are taken in siting and design. Further comparative analyses are needed to better understand the trade-offs with other energy sources. Avian mortality is also caused, for example, by oil spills, oil platforms built on bird migration routes along the Gulf Coast, acid rain, and mountaintop mining. Wind energy will likely continue to be responsible for a comparatively small fraction of total avian mortality risks, although individual sites can present more-localized risks. Some data relative to specific sites are offered in the list that follows: z 112 The first large-scale commercial wind resource area developed in the world was Altamont Pass in California’s Bay Area in the 1980s. The Altamont Pass development has seen high levels of bird kills, specifically raptors. Although this facility has been problematic, it remains an anomaly relative to other wind energy projects. In January 2007, a number of the parties involved agreed to take steps 20% Wind Energy by 2030 to reduce raptor fatalities and upgrade the project area with newer technology. z An NWCC fact sheet (2004) reviewed the mortality figures from 12 comparable postconstruction monitoring studies and found that the fatality rate averaged 2.3 bird deaths per turbine per year and 3.1 birds per megawatt per year of capacity in the United States (outside California). Fatality rates have ranged from a low of 0.63 per turbine and 1 per megawatt at an agricultural site in Oregon to 10 per turbine and 15 per megawatt at a fragmented mountain forest site in Tennessee (NWCC 2004). This information, which is shown in Table 5-2, will be updated in 2008 to incorporate newly available data. Table 5-2. Estimated avian fatalities per megawatt per year Wind Project and Location Total Fatalities Stateline, OR/WA 2.92 Vansycle, OR 0.95 Combine Hills, OR 2.56 Klondike, OR 0.95 Nine Canyon, WA 2.76 Foote Creek Rim, WY (Phase 1) 2.50 Foote Creek Rim, WY (Phase 2) 1.99 Wisconsin 1.97 Buffalo Ridge, MN (Phase 1) 3.27 Buffalo Ridge, MN (Phase 2) 3.03 Buffalo Ridge, MN (Phase 3) 5.93 Top of Iowa 1.44 Buffalo Mountain, TN Mountaineer, WV 5 11.67 2.69 Source: Data adapted from Strickland and Johnson (2006) z Before 2003, bat kills at wind farms studied were also generally low. The frequency of bat deaths in 2003 at a newly constructed wind farm in West Virginia, though, led researchers to estimate that 1,700 to 2,900 bats had been killed, and that additional bats had probably died a few weeks before and after the six-week research period (Arnett et al. 2005). According to a USGS biologist, bat mortality has also been higher than expected at a number of sites in the United States and Canada (Cryan 2006). Wildlife collisions with wind turbines are a significant concern, particularly if they affect species populations. To date, no site or cumulative impacts on bird or bat populations have been documented in the United States or Europe. But that does not mean that impacts are nonexistent. This is a particular worry with bats because they are relatively long-lived mammals with low reproduction rates, according to a peer 20% Wind Energy by 2030 113 reviewed study (Arnett et al. 2005). BWEC is currently conducting the necessary research to understand the risks to bats. Concerns about uncertain risks to birds and bats can lead permitting agencies and developers to conduct lengthy and costly studies that may or may not answer the wildlife impact questions raised. More research is necessary to more clearly understand the link between preconstruction surveys and postconstruction monitoring results. Well-designed research programs can, however, be costly for many projects and require care in assessing the appropriate levels of analysis. Addressing these uncertainties through additional, focused research would be necessary if the United States is to increase wind development. Although many factors influence decisions to build wind projects, wildlife and environmental concerns can cause site exclusion because of the following: 5 z Concerns about potential wildlife impacts z Costly study requirements z Future risk mitigation requirements z Conflicts with other resources The long term viability of the wind industry will be helped by acknowledging and addressing the challenges raised by these uncertain risks. Collaborative efforts such as BWEC and GS3C offer constructive models for this undertaking. 5.3.3 MANAGING ENVIRONMENTAL RISK AND ADAPTIVE MANAGEMENT PRINCIPLES Dealing with uncertainties associated with siting wind power facilities is a challenge for some institutions because it requires a management structure with high levels of social trust and credibility. As a result, various stakeholders are investigating how adaptive management principles might be applied to assess and manage wildlife and habitat risks at wind power sites. Under these models, developers and operators of the wind site, along with permitting agencies, could adjust the management of the site and the level of required monitoring studies to the potential challenges that arise over the life of the project. Although the term is used often, “adaptive management” is not always well defined. Here adaptive management refers to an evolutionary management approach that purposely seeks to adapt management and decision-making processes to evolving knowledge of the technology or environmental risks in question (Holling 1978; Walters 1986; Lee 1993). “Social learning” is a centerpiece in this approach, with management seeking to enhance its capability to learn from experience and from an expanding body of knowledge. Management solutions are regarded more as experiments than as definitive solutions to the challenges involved. Valuable experience with this approach exists in such areas as watershed planning (Lee 1993; NRC 2004), fisheries (Walters 1986), and forestry (Holling 1978). An adaptive management approach contrasts with the more typical regulatory approaches, which assume that sufficient knowledge exists at the outset to define environmental risks and effects. The basic differences between two decision-making approaches—a linear approach commonly called “command and control,” and the adaptive management approach—are quite apparent in Figure 5-3. In the figure, 114 20% Wind Energy by 2030 Figure 5-3. Linear decision strategy (command and control) and interactive model with adaptive management principles 5 Source: Morgan et al. (2007) Model 1 assumes that sufficient research and assessment can be done before the technology or management system is deployed, allowing an appropriate management system and the needed regulatory requirements to be put in place at the outset. Risk analysis plays a critical role in this process, with the assumption that major risks can be identified and assessed and appropriate mitigation systems instituted. In Model 2, the assumptions address different types of situations—the risks are uncertain and unlikely to be resolved in the near future; the risks can only be partially assessed at the outset; and surprises are likely as experience unfolds. This model emphasizes the importance of flexible, rapid response to new knowledge or events. Accordingly, this risk management approach might well be suited for a technology such as wind energy, where experience and knowledge are still growing and where documented effects are strongly site-specific. Guiding principles and applications for this approach are still evolving, but adaptive management seems particularly well suited for situations of high uncertainties or conflict in the political process. 20% Wind Energy by 2030 115 5.4 PUBLIC PERCEPTION AND ENGAGEMENT Because the environmental benefits of wind energy are significant, public support for expanding wind energy development is widespread. The impacts of wind projects, however, are predominately local and can concern some individuals in the affected communities and landscapes. A primary challenge in achieving 20% of U.S. electricity from wind is to maximize the overall benefits of this form of energy without disrupting or alienating specific communities, especially prospective communities that do not have experience with wind turbines. 5.4.1 5 PUBLIC ATTITUDES Wind energy development receives considerable general support among the U.S. population. Of those polled in a study conducted by Yale University in 2005, more than 87% want expanded wind energy development (Global Strategy Group 2005). Only a minority of the U.S. population appears to oppose wind energy, but that opposition can strengthen when particular sites are proposed. Some evidence indicates that, over time, opposition might decrease and support Selected Public Opinion Surveys might grow. Surveys commissioned in the United Kingdom and Spain have found, for example, that • In April 2002, RBA Research conducted a local support for a wind project increased once it study for the British Wind Energy Association was installed and operating. of people living near a small project in the United Kingdom. It found that 74% of Communities must be consulted about the global participants supported the wind farm—37% impacts of wind, and this must include addressing strongly—and only 8% were opposed. Of their concerns early on. Involving affected those opposed to the project, about 25% communities early is critical to identifying remained opposed after the project was concerns and addressing them proactively. constructed. Sixty percent later supported the Stakeholder concerns must be taken seriously, and wind farm (RBA Research 2002). a long-term commitment to understanding • Although polls show broad statewide support stakeholder interactions must be made. for the Cape Wind offshore project in Massachusetts, some opponents have been very vocal. When asked, however, some opponents say they might support the project if it were part of a broader strategy to combat global climate change. More information on this topic can be found at www.mms.gov/offshore/alternativeenergy. 5.4.2 VISUAL IMPACTS Wind turbines can be highly visible because of their height and locations (e.g., ridgelines and open plains). Reactions to wind turbines are subjective and varied. The best areas for siting wind turbines tend to be those with lower population densities. Although this can minimize the number of people affected, less populated areas may also be prized for tranquility, open space, and expansive vistas. Some people feel that turbines are intrusive; others see them as elegant and interesting. In either case, the visual impacts of wind energy projects may well be a factor in gauging site acceptability. Discourse with communities about the expected impacts is important. Wind project developers can conduct visual simulations from specific vantage points and produce maps of theoretical visibility across an affected community (Pasqualetti 2005). With this information, a developer can make technical adjustments to the project layout to accommodate specific concerns, relocate wind turbines, reduce the tower height, or even propose screening devices (such as trees) to minimize visual impact. All of 116 20% Wind Energy by 2030 these steps can, of course, affect the economic feasibility of a proposed project, so they should be weighed carefully in siting and development decisions. Because almost all commercial-scale wind turbines rise more than 60 m above the ground, proposed wind projects must be reviewed by the Federal Aviation Administration (FAA). In February 2007, the FAA updated an advisory circular (FAA 2007) dealing with obstruction lighting and marking, including new uniform recommendations for lighting wind energy projects. The new FAA suggestions are designed to allow pilots flying too low to be warned of obstructions and minimize intrusion to neighbors. The guidance recommends that wind energy projects should be lit at night, but now the lights can be up to 0.8 km apart and be placed only around the project perimeter, reducing the number of lights needed overall. The guidelines recommend red lights, which are less annoying than white lights to people nearby. No daytime lighting is necessary if the turbines and blades are painted white or off-white. 5.4.3 SOUND 5 All machinery with moving parts make some sound, and wind turbines are no exception, though advances in engineering and insulation ensure that modern turbines are relatively quiet; concerns about sound are primarily associated with older technology, such as the turbines of the 1980s, which were considerably louder. The primary sound is aerodynamic noise from the blades moving through the air— the “whoosh-whoosh” sound heard as the blades pass the tower. Less commonly heard in modern turbines are the mechanical sounds from the generator, yaw drive, and gearbox. When the wind picks up and the wind turbines begin to operate, the sound from a turbine (when standing at or closer than 350 m) is 35 to 45 decibels (dB; see Figure 5-4). This sound is equivalent to a running kitchen refrigerator. Figure 5-4. Decibel levels of various situations Source: BWEA (2007) When proposing a wind energy project, wind developers can conduct studies to predict sound levels in various places, including in nearby buildings or homes. Turbines noise might be more obtrusive if, for example, they are located on a windy ridge or if houses are located downwind in a sheltered valley. Changes can usually 20% Wind Energy by 2030 117 be made to a project if the sound levels at a particular location are deemed too high. In general, standard setbacks from residences and other buildings appear to reasonably ensure that sound levels from a wind project will be low and nonintrusive. 5.4.4 LAND VALUE The primary asset for many families is their home, so property values are a serious concern. Residents can become particularly concerned about possible declines in local property values when wind energy projects are proposed in their community. To ascertain what effects they are likely to experience, they may look to other communities Wind Energy and Home Values with existing wind facilities. 5 In 2003, the Renewable Energy Policy Project (REPP) conducted a study of 24,000 home sales surrounding 11 wind projects in the United States. It compared the average selling price over time of homes near the wind project with a nearby control area that was at least 8 km from the project. No clear evidence of adverse effects on property values was found. In some communities, home values near the facilities rose faster than properties in the control group (Sterzinger, Fredric, and Kostiuk 2003). In April 2006 a Bard College study focused on a 20-turbine wind project in Madison County, New York. Researchers visited each home, measured the distance to the nearest turbine, and ascertained to what degree the home could see the wind facility. This study also concluded that there was no evidence that the facility affected home values in a measurable way, even when concentrating on homes that sold near to the facility or those with a prominent view of the turbines (Hoen 2006). 5.5 Studies of the effects of wind projects on local property values should be done with great care, even though extensive studies have already been conducted on other energy facilities, such as nuclear plants. Because home values are a composite of many factors, isolating the effects of proximity to a wind project is important (though only a part of the full picture). Wind projects also tend to be located in areas of low residential density, which further compounds the difficulties of controlling the impact on property value. To date, two studies (see “Wind Energy and Home Values” sidebar) have examined these issues in the United States. Though neither is definitive and additional work in this area is needed, both studies found little evidence to support the claim that home values are negatively affected by the presence of wind power generation facilities. Individuals with turbines on their properties might actually see an increase in their property values because of the lease payments paid by the wind project owner. Lease payments tend to be $2,000 to $5,000 (US$2006) per turbine per year, either through fixed payments or as a small share of the revenue. SITING/REGULATORY FRAMEWORK Currently, wind energy projects are governed by a complex set of laws. Projects are subject to the input of a diverse set of decision makers and different permitting regulations apply in different parts of the country. Authorities at local, state, and federal levels make siting decisions. These authorities have different responsibilities relative to a project, and there can be inconsistencies among them and even within the same agency. In some places, primary decisions rest with the local jurisdiction, although federal and state requirements may still apply. A wide diversity of requirements means that projects across the country must adhere to different standards, and different information is often required before permits are issued. Differing levels of public involvement also occur in these processes. A dramatic 118 20% Wind Energy by 2030 increase in development is likely to make this situation even more complex for developers and decision makers alike. Increased uniformity of regulatory requirements across regions would greatly facilitate the increased deployment of wind projects necessary to reach the 20% Wind Scenario. 5.5.1 LOCAL Locally-elected officials make siting decisions at the county level. This allows the community to maintain control of local land use decisions, which is especially attractive in states where local authority is highly prized. Responsibilities differ among local bodies, but local commissions are often responsible for property assessments, rural road maintenance, economic development, zoning, and water quality (NACO 2003). Local commissions typically are concerned with protecting the environment, enhancing tax revenue, and preserving the local quality of life. In some cases, local authorities may feel ill-equipped to weigh the highly technical information presented by a wind project developer. They can be easily influenced by proponents or opponents armed with incomplete or inaccurate information. In communities where wind development has a history, decision makers are more comfortable rendering considered permit decisions. 5 Most wind energy projects go through the local conditional use permit process and must spell out the conditions under which a project will operate. For example, a project permit might limit the sound level or require a setback distance from roads, houses, or property lines. Counties can also create ordinances to permit wind energy facilities: In Pike County, Illinois, the County Board created a permitted use ordinance that lays out standard conditions for wind projects; decision makers in Klickitat County, Washington, designated specific areas to encourage and guide wind energy development; and the local authorities in Kern County, California, conducted a county-wide environmental impact review to enable development of the Tehachapi Wind Resource Area. 5.5.2 STATE AND FEDERAL States can control siting decisions either through specific decision-making bodies or by virtue of rules set for projects on state-controlled land. In addition, a state agency—such as a wildlife agency—might establish guidelines for siting wind projects. State guidelines can require maintaining certain sound levels or conducting environmental studies. A few states have an energy siting board, which places the authority to review energy facilities with the state utility commission (i.e., a public service commission). The governor or legislature usually appoints representatives, and because they are more accountable to the public, they tend to be generally more familiar with this sector. The charge of these state commissions or boards often includes supplying reliable electric service at reasonable prices. Concerned individuals or project opponents have legal recourse to raise objections by formally challenging a commission decision. The federal government participates in regulating wind energy projects through several different agencies, depending on the circumstances. Unless there is federal involvement, such as when developers propose a project on federally-managed land or there is a potential effect on areas of federal oversight, wind energy projects are not usually subject to the National Environmental Policy Act (NEPA). An agency 20% Wind Energy by 2030 119 can trigger the provisions of NEPA by undertaking a major federal action, such as allowing construction of a large energy project on or adjacent to federal lands (NEPA 1969). The federal agencies that follow have mandates that may be related to wind energy: z z 5 z z z z 120 The Federal Aviation Administration (FAA) conducts aeronautical studies on all structures taller than 60 m for potential conflicts with navigable airspace and military radar, and ensures proper marking and lighting. Developers are required to submit an application for each individual turbine. From 2004 to 2006, the FAA approved almost 18,000 wind turbine proposals, nearly half in 2006 alone, and issued only eight determinations of hazard (Swancy 2006). The Bureau of Land Management (BLM) manages 105 million hectares of public land, mostly in the western United States. In 2005, the BLM finalized a programmatic environmental impact statement for wind energy development on BLM lands in the West. This statement includes best management practices for wind energy projects, sets standard requirements for projects, and allows for sitespecific studies. As an alternative, wind developers can rely on the previous programmatic NEPA document and provide a development plan without having to do a full environmental impact statement (EIS) at each site, which can save valuable resources and time. The U.S. Army Corps of Engineers (USACE) issues permits for any development that will affect wetlands. Roads, project infrastructure, and foundations at some wind project sites have the potential to affect wetlands. Projects must also comply with the Endangered Species Act if any threatened or endangered species will be adversely affected. The U.S. Fish & Wildlife Service (USFWS) can pursue prosecution for violations of the Migratory Bird Treaty Act, which prohibits the killing or harming of almost all migratory birds. Some migratory birds, however, can be taken under a permit or license. The USFWS also enforces the Bald and Golden Eagle Protection Act, which gives additional protection to eagles. The USFWS exercises prosecutorial discretion under these statutes. To date, no wind energy companies have faced action under either law, but flagrant violations without mitigation could be subject to prosecution. The Minerals Management Service (MMS) oversees permitting for offshore ocean-based wind energy projects proposed for the outer continental shelf (OCS). MMS is developing the rules and issued a programmatic environmental impact statement for all alternative energy development on the OCS. New regulations are expected in 2008. The U.S. Department of Agriculture Forest Service (USFS) manages 78 million hectares of public land in national forests and grasslands. Projects sited on any Forest Service lands are subject to NEPA, and potentially to siting guidelines that the Forest Service is currently developing. 20% Wind Energy by 2030 z z 5.6 The U.S. Department of Defense (DOD) has no formal review process for wind energy projects, although DOD does participate in the FAA studies. Wind energy companies planning a project near an Air Force base, however, generally work with base leadership to address and avoid conflicts. The U.S. Department of Energy (DOE) has taken the lead in creating an interagency project siting team. The team reviews how wind sites affect government assets such as radar installations, and decides how to plan for and mitigate those impacts. ADDRESSING ENVIRONMENTAL AND SITING CHALLENGES In order to install more than 10 GW of wind capacity per year by 2014, the United States will need to have a consistent way to review and approve projects. Examples below reflect what mature energy industries are doing to address concerns about wildlife and energy facility siting issues. The approaches described outline steps that could be adopted for a 20% Wind Scenario. The wind energy industry—in partnership with the government and nongovernmental organizations (NGOs)—will need to address environmental and siting issues. 5.6.1 5 EXPAND PUBLIC-PRIVATE PARTNERSHIPS States, collaboratives, and the National Academy of Sciences (NAS) have identified gaps in the knowledge base about wind energy and its risks. This situation is not surprising for a relatively new energy technology. The knowledge gaps are framed in questions such as: z How can large deployments of wind energy generation contribute to national climate change goals and significantly reduce GHG emissions? z Can bats be deterred from turbines? z How high do night-migrating songbirds fly over ridgelines? Sometimes developers address these questions at specific sites, but broader research is urgently needed on a few of the most significant questions. Several research collaboratives have been formed (see sidebar entitled “Examples of Existing Wind Energy Research Collaboratives”) to ensure that the interests of various stakeholders are represented, that research questions are relevant, and that research results are widely disseminated. Collaboratives can help to avoid relying on industry-driven research, which critics often perceive as biased. Various combinations of technical experts and informed representatives from industry, relevant NGOs, and government agencies currently participate in ongoing collaboratives on wind energy. For example, BWEC is exploring the effectiveness of an acoustic deterrent device to warn bats away from the spinning blades of wind turbines. Although the risk to bats might be greater at some sites than at others, it is not necessarily feasible or appropriate for one company or one project to foot the entire bill for this research. A public–private partnership is often a more effective way to undertake and fund the research needed, and might also lead to more credible results. 20% Wind Energy by 2030 121 Examples of Existing Wind Energy Research Collaboratives Bats and Wind Energy Cooperative (BWEC) After learning in 2003 that thousands of bats had been killed at a West Virginia site, the wind energy industry collaborated with Bat Conservation International, the USFWS, and the National Renewable Energy Laboratory (NREL) to form BWEC. This organization has developed a research program to explore ways to reduce fatalities. Its work currently centers on two areas: (1) understanding and quantifying what makes a site more risky for bats and (2) field-testing deterrent devices to warn bats away from wind turbine blades. National Wind Coordinating Collaborative (NWCC) NWCC is a forum for defining, discussing, and addressing wind–avian interaction issues, with a focus on public policy questions. Supported by funds from DOE, the NWCC Wildlife Workgroup (WWG) serves as an advisory group for national research on wind–avian issues. The group released a report, Studying Wind Energy/Bird Interactions: A Guidance Document, which is the first-ever comprehensive guide to metrics and methods for determining and monitoring potential impacts on birds at existing and proposed wind energy sites. Additionally, the WWG has facilitated six national research meetings. It is subdivided into a number of groups focused on specific tasks, such as development of a “mitigation toolbox.” 5 Grassland/Shrub-Steppe Species Collaborative (GS3C) The GS3C is a voluntary cooperative to identify what impacts, if any, wind energy has on grassland and shrub steppe avian species. Established in 2005 as the Grassland/Shrub Steppe Species Subgroup, the GS3C includes representatives from state and federal agencies, academic institutions, NGOs, and the wind industry. As development levels ramp up, an overarching research consortium that would combine the work of these collaboratives could focus on addressing potential risks and ensuring that the most critical uncertainties are research priorities. As the more focused groups come together in a region, they could examine some of the habitat and biological sensitivity issues to understand which areas are most appropriate for development. With the public–private nature of the consortium, the conversation might shift from where development is inappropriate to where it is most promising. These groups, or a larger institute, could also identify priority conservation areas and work toward enhancing key habitat areas. If the wind energy sector is to increase installations to more than 16 GW of capacity per year after 2018, research consortia could be created to take part in sustainable growth planning. A region, for example, might decide to open to development because new transmission lines are planned. In this case, a collaborative research body could determine what baseline wildlife and habitat studies are needed; organize and fund researchers to begin the work; and determine what mitigation, habitat conservation, or other activities might be appropriate for the area. 5.6.2 EXPAND OUTREACH AND EDUCATION Public acceptance of wind projects may increase if the local community directly shares in the benefits from a new wind energy development. In Europe, for example, tax law allows individuals to invest directly in wind projects. Those individuals 122 20% Wind Energy by 2030 might well view their turbines as a source of income and feel more positive about the siting of turbines nearby. In the United States, examples of direct community impacts include: z z z Community wind: Groups of individuals join together to develop and own a project. Although this can be risky because of the significant complexity and capital required to successfully build a wind project, the rewards are significant. A town or municipality sometimes purchases a turbine to generate power and lower public electricity bills. These groups might develop a smaller project in conjunction with a commercial development to leverage the economies of scale available for turbine purchases, construction, and operations and maintenance. Property tax payments: Wind projects are multimillion-dollar facilities that can make a significant contribution to a community’s tax base. Projects are usually on leased private property, with the project owner paying any related property taxes. 5 Payment in lieu of taxes: In places where property taxes are not required, project owners often contribute to a local community fund in lieu of taxes. In other energy facility siting programs, communities might protect property values. Desired facilities are also sometimes collocated in the community as a form of incentive. Many such options exist and any combination might be part of a siting strategy. Wind energy developers can engage residents in a prospective host community to explain potential impacts, share information about the project, and learn about community concerns. This early involvement gives citizens an opportunity to ask questions and have their concerns addressed. 5.6.3 COORDINATE LAND-USE PLANNING Successfully addressing numerous inconsistencies in permitting and regulation will require government and industry stakeholders to review the policies and procedures currently being implemented across multiple jurisdictions. In the long term, it may be necessary to create a sustainable growth planning effort as new areas of development open. A number of NGOs already have ecoregional plans that may yield a solid baseline of biological data. In 2006, states also completed wildlife action plans that identify high-priority actions needed to preserve and enhance their wildlife resources. Numerous states and federal agencies have developed, or are in the process of developing, siting guidelines for wind power developments. Some states have created siting guidelines in conjunction with implementation of their state renewable portfolio standards (RPS). Other collaborative efforts to develop guidelines are moving forward through wildlife or energy agencies. Development of siting guidelines gives developers and agency officials a clear pathway to what may be required in certain jurisdictions, although time and cost considerations are involved. 20% Wind Energy by 2030 123 5.7 PROSPECTS FOR OFFSHORE WIND ENERGY PROJECTS IN THE UNITED STATES AND INSIGHTS FROM EUROPE Europe’s experience with offshore wind energy projects is instructive for how the United States might address environmental and siting challenges. European developments are supported by ambitious national goals for wind deployment, financial instruments and subsidies, and commitments to reduce GHGs. Direct comparisons and lessons learned would be instructive but need to be applied with appropriate cautions about different public policies. 5 Offshore Wind Plant Siting and Seabed Rights in the United States Various U.S. government agencies are responsible for evaluating and approving the siting, installation, and operation of wind power plants in the ocean. Until recently, offshore siting was notably more complex than land-based siting because of unclear and overlapping legal and jurisdictional authorities. Before the passage of the Energy Policy Act (EPAct) of 2005, the USACE assumed permitting authority over proposed offshore wind energy developments. With EPAct 2005, Congress delegated authority to grant easements, leases, or rights-of-way in coastal waters to the MMS under the DOI. Uncertainty about the extent of potential impacts of offshore wind projects—in addition to the lack of well-designed siting strategies— and the lack of long-term scientific information to fully evaluate the technology can contribute to delays in deployment (Musial and Ram, 2007). A growing awareness of the large potential for electricity contributions from offshore wind energy has led to numerous proposals for siting offshore wind plants in European seas. Currently, 26 projects are installed in the North and the Baltic Seas in eight nations with a combined capacity of more than 1200 MW. A major scientific effort is in progress to support these projects. More than 280 research studies and assessments are examining environmental and human effects from installed offshore wind installations (SenterNovem 2005). Studies have also been conducted on birds, marine ecology, and animal physiology (Gerdes et al. 2005). Others have addressed the planning, construction, operations, maintenance, and decommissioning of turbines. By contrast, the United States does not yet have any commercial-scale offshore wind power sites, and proposals for developing them are still limited. Preliminary environmental analyses relating to offshore installations are restricted to NEPA-related requirements for specific projects in federal waters. (Table 5-3 lists proposed projects and the documentation relating to the permitting and NEPA process.) The state of knowledge and assessment of risks surrounding offshore wind energy are still emerging, which is characteristic of the early stages of any energy technology. To date, Denmark has conducted the most extensive before after-control-impact study in the world. The most recent environmental monitoring program from this study, spanning more than five years, concluded that none of the potential ecological risks appear to have long-term or large-scale impacts (DEA 2006). Denmark intends to do further research, however, to assess the effects over time of multiple projects within the same region. 124 20% Wind Energy by 2030 Table 5-3. Status of offshore wind energy applications in state and federal waters Type of Initiativea Developer Project Location Project Cape Wind Associates Nantucket Sound Project Long Island Power Authority and Florida Power & Light Long Island Sound Project Wind Energy Systems Technologies Project Bluewater Wind LLC November 2001 Status as of June 2007 Received permit approval for the met tower in 2002; USACE issued a draft EIS in November 2004; MMS issued a notice of intent (NOI) to prepare a new EIS in May 2006. Massachusetts issued a final environmental impact report (FEIR); draft environmental impact statement (DEIS) in progress by MMS. 5 Joint application submitted to USACE April 2005; MMS issued an NOI to prepare an EIS in June 2006; project cancelled in October 2007. July 2005 Galveston, TX 50–60 N/A (Texas state waters) Signed lease with Texas General Land Office in 2005. Meteorological tower installed to begin collecting data in 2007. Delaware 70 TBD Won competition May 22, 2007, with Delmarva Power & Light 4 N/A (Massachusetts state waters) Collecting data. Received funding from Massachusetts Technology Collaborative to support permitting and siting analyses. 90–120 N/A (Massachusetts state waters) Applied for state approval with Massachusetts Environmental Affairs, May 2006. Conducting feasibility studies. No current plans Two-year collaborative study with Georgia Institute of Technology (Georgia Tech) concluded that conditions are favorable but current cost and regulatory situation precludes development. Hull Municipal Boston Harbor Announced Patriot Renewables LLC Buzzards Bay, MA Southern Company 130 Federal Application Filed 40 Project Announced Number of Turbines Proposed Off the coast of Savannah, GA 3–5 a In this table, a “Project” is a planned commercial development or demonstration where complete state or federal applications have been submitted to appropriate permitting agencies. “Announced” refers to proposals at the feasibility study and data collection stage, with no commercial plans as yet and no permit applications completed. To date, members of the European wind industry and other stakeholders have largely mitigated risks related to wind energy or decided that the local siting risks are less of a concern than other factors, such as air emissions and the larger global risks of climate change. Precautionary principles apply during the adoption of facility siting and design, as well as risk management principles. Because risks are highly sitespecific, well-planned siting strategies are critical to future offshore wind 20% Wind Energy by 2030 125 developments. Successful strategies in Europe have recognized the need to engage local populations in siting decisions and development planning. This builds community support for wind facilities by addressing local and site-specific concerns, including: z Fish and benthic communities z Undersea sound and marine mammals z Electromagnetic fields and fish behaviors z Human intrusion on seascape environments z Competing commercial and recreational uses of the ocean z Other socioeconomic effects, including tourism and property values. As the United States establishes a regulatory process and siting strategies for offshore wind projects, much can be learned from Europe’s decades of experience with offshore wind. If the United States supports a major increase of offshore wind deployments over the next two decades, it will need to develop an ambitious and well-managed environmental research and siting program and lay the groundwork for collaborative approaches that engage the public and interested stakeholders. 5 5.8 FINDINGS AND CONCLUSIONS To scale up wind energy development responsibly, benefits and risks should be considered in context with other energy options. Remaining uncertainties associated with overall risks, cost-effective opportunities for risk mitigation, strategic siting approaches, enlarged community involvement, and more effective planning and permitting regimes can also be considered. Figure 5-5 outlines activities that may be needed over the near and longer terms. Some of the activities would begin now and continue through 2030; more details are given in the subsections that follow. Given the significant ramp-up of wind installations by 2018 in the 20% Wind Scenario, these actions would need to occur within the next decade, in time to anticipate and plan for siting strategies and potential environmental effects. Figure 5-5. Actions to support 20% wind energy by 2030 126 20% Wind Energy by 2030 Near- and Mid-Term Actions Comparing lifecycle effects of energy generation options: The knowledge base for comparing wind energy with other energy options—according to their climate change implications—is still uneven and incomplete. Such knowledge could prove helpful to wind energy developers; electric utilities; and national, state, and local regulators in evaluating wind energy developments. In fact, EPAct 2005 included authorization language for an NAS study of the comparative risk and benefits of current and prospective electricity supply options; the study has not begun. Researching wildlife and habitat effects: The current research program on wind energy is largely driven by the problems that have arisen at specific sites, such as bird mortality in California and bat mortality in West Virginia. Additional research on wildlife and habitat fragmentation, which takes a collaborative approach and involves interested parties, affected communities, and subject matter experts, would be informative and should be placed within the context of other energy risks. 5 Defining risks: A systematic risk research program that addresses the full range of human, ecological, and socioeconomic effects from wind project siting is needed. Such a study would establish a systematic knowledge base to inform research priorities and decision makers. A comprehensive survey of risk issues that might arise at different sites has yet to be designed and undertaken, although several state agencies—such as the California Energy Commission—are developing these priorities. Along with these risk research programs, the associated cost and time implications must be demarcated. Engaging national leadership: Evolving national and state policies and corporate programs seek to minimize human-caused emissions of greenhouse gases. Wind energy is an important part of the portfolio of energy technologies that can contribute to this goal. Many positive impacts are projected from wind energy comprising a larger share of the U.S. electricity grid, but these data must be quantified and made publicly available. National leadership could facilitate rapid progress toward 20% wind energy. Develop siting strategies: The risks associated with wind energy deployment are heavily site-specific, and public responses will vary among potential sites. Siting strategies are needed to identify sites that are highly favored for wind energy developments, but also to avoid potential ecological risks and minimize community conflict. The American Wind Energy Association (AWEA) is currently developing a siting handbook, which may be valuable as a first step in addressing this need. Further work could continue to enhance collaborative siting processes that engage states, NGOs, host community officials, and various other stakeholders. Addressing public concerns: Building public support is essential if wind energy is to supply 20% of the nation’s electricity by 2030. Although substantial national experience exists with siting different types of energy facilities, that experience has not yet been incorporated into wind siting strategies. The roots of public perceptions of and concerns about wind energy are not well understood. Long-Term Actions Applying adaptive management principles: As with other technologies, wind energy will continue to pose new uncertainties as existing ones are reduced. The knowledge base is certain to evolve as new sites are developed and the scale of wind 20% Wind Energy by 2030 127 development expands in the United States, in Europe, and in other parts of the world. Adaptive management concepts and approaches, which have been applied to the development of numerous other technologies, should also be considered for incorporation into wind energy development. 5.9 REFERENCES AND SUGGESTED FURTHER READING ALA (American Lung Association). 2005. State of the Air 2005. New York: ALA. http://lungaction.org/reports/sota05exec_summ.html. AMA (American Medical Association) Council on Scientific Affairs. 2004. Mercury and Fish Consumption: Medical and Public Health Issues. Report No. A-04. Chicago, IL: AMA. http://www.ama-assn.org/ama/pub/category/ 15842.html. AMA. 2006. “AMA Adopts New Policies on Mercury Pollution, Hormone Compounds and Smoke-Free Meetings.” American Medical Association, November 13. http://www.ama-assn.org/ama/pub/category/17086.html. 5 Arnett, E., W. Erickson, J. Horn, and J. Kerns. 2005. Relationships between Bats and Wind Turbines in Pennsylvania and West Virginia: An Assessment of Fatality Search Protocols, Patterns of Fatality, and Behavioral Interactions with Wind Turbines. Bat and Wind Energy Cooperative. http://www.batcon.org/wind/BWEC2004Reportsummary.pdf. AWEA (American Wind Energy Association). 2007. Wind Energy Basics. Washington, DC: AWEA. http://www.awea.org/newsroom/pdf/Wind_Energy_Basics.pdf. Baum, E., J. Chaisson, B. Miller, J. Nielsen, M. Decker, D. Berry, and C. Putnam. 2003. The Last Straw: Water Use by Power Plants in the Arid West. Boulder, CO and Boston, MA: The Land and Water Fund of the Rockies and Clean Air Task Force. http://www.catf.us/publications/reports/The_Last_Straw.pdf. BLM. “BLM Facts.” U.S. Bureau of Land Management. www.blm.gov/nhp/facts/index.htm. BWEA (British Wind Energy Association). 2007. Noise from Wind Turbines: The Facts. London: BWEA. http://www.britishwindenergy.co.uk/pdf/noise.pdf. Cryan, P. 2006. “Overview of What We Know About the Bat/Wind Interaction as of November of 2004.” Presented at the National Wind Coordinating Collaborative (NWCC) Wildlife Research Meeting VI, November 14, San Antonio, TX. http://www.nationalwind.org/events/wildlife/2006 3/presentations/bats/cryan.pdf. DEA (Danish Energy Authority). 2006. Danish Offshore Wind – Key Environmental Issues. ISBN: 87-7844-625-2. Stockholm, Sweden: DONG Energy. http://www.ens.dk/graphics/Publikationer/Havvindmoeller/danish_offshore_ wind.pdf. DOE (U.S. Department of Energy). 2006. The Wind/Water Nexus. DOE/GO 102006-2218. Golden, CO: National Renewable Energy Laboratory (NREL). http://www.eere.energy.gov/windandhydro/windpoweringamerica/ pdfs/wpa/wpa_factsheet_water.pdf. 128 20% Wind Energy by 2030 DOE. 2007. “Federal Interagency Wind Siting Collaboration.” DOE Office of Energy Efficiency and Renewable Energy, Wind & Hydropower Technologies Program. http://www1.eere.energy.gov/windandhydro/federalwindsiting/about_collab oration.html. DOI (U.S. Department of the Interior). 2004. State and Indian Regulatory Program Permitting: 2004. Washington, DC: DOI Office of Surface Mining. http://www.osmre.gov/progpermit04.htm EIA. 2006. Emissions of Greenhouse Gases in the United States 2005. Washington, DC: Department of Energy. Report No. DOE/EIA-0573. www.eia.doe.gov/oiaf/1605/ggrpt/index.html. EPA (U.S. Environmental Protection Agency). 2007. Mercury: Health Effects. Washington, DC: EPA. http://www.epa.gov/mercury/effects.htm. Erickson, W., G. Johnson, and D. Young. 2002. “Summary of Anthropogenic Causes of Bird Mortality.” Presented at Third International Partners in Flight Conference, March 20–24, Asilomar Conference Grounds, CA.http://www.dialight.com/FAQs/pdf/Bird%20Strike%20Study.pdf. 5 FAA. 2007. (U.S. Department of Transportation, Federal Aviation Administration), Advisory Circular, AC 70/7460-1K, Obstruction Marking and Lighting. Washington, DC. https://oeaaa.faa.gov/oeaaa/external/content/AC70_7460_1K.pdf Flavin, C., and J. Sawin. 2006. American Energy: The Renewable Path to Energy Security. Washington, DC: Worldwatch Institute Center for American Progress. http://www.americanprogress.org/issues/2006/09/ american_energy.html/AmericanEnergy.pdf. GAO (Government Accountability Office). 2005. Wind Power: Impacts on Wildlife and Government Responsibilities for Regulating Development and Protecting Wildlife. Report No. GAO-05-906. Washington, DC: GAO. http://www.gao.gov/new.items/d05906.pdf Gerdes, G., A. Jansen, K. Rehfeldt, and S. Teske. 2005. Offshore Wind: Implementing a New Powerhouse for Europe; Grid Connection, Environmental Impact Assessment & Political Framework. Amsterdam: Greenpeace International. http://www.greenpeace.org/raw/content/international/press/reports/offshore wind-implementing-a.pdf Global Strategy Group. 2005. Survey on American Attitudes on the Environment – Key Findings. New Haven, CT: Yale University School of Forestry & Environmental Studies. http://www.loe.org/images/070316/yalepole.doc Government Accountability Office. 2005. Wind Power: Impacts on Wildlife and Government Responsibilities for Regulating Development and Protecting Wildlife. Report No. GAO-05-906. Washington, DC: Government Accountability Office. www.gao.gov/new.items/d05906.pdf Hoen, B. 2006. Impacts of Windmill Visibility on Property Values in Madison County, New York. Unpublished M.S. thesis. Annandale on Hudson, NY: Bard College, Bard Center for Environmental Policy. http://www.aceny.org/pdfs/misc/effects_windmill_vis_on_prop_values_hoe n2006.pdf. 20% Wind Energy by 2030 129 Holling, C.S. 1978. Adaptive Environmental Assessment and Management. New York: John Wiley & Sons. Hutson, S.S., N. Barber, J. Kenny, K. Linsey, D. Lumia, and M. Maupin. 2005. Estimated Use of Water in the United States in 2000. Circular No. 1268. Reston, VA: U.S. Geological Survey. http://pubs.usgs.gov/circ/2004/circ1268/index.html. IPCC (Intergovernmental Panel on Climate Change). 2007. Climate Change 2007: Impacts, Adaptation and Vulnerability: Contribution of Working Group II Contribution to the Intergovernmental Panel on Climate Change [IPCC] Fourth Assessment Report. Report presented at 8th session of Working Group II of the IPCC, April 2007, Brussels, Belgium. http://www.usgcrp.gov/usgcrp/links/ipcc.htm IATP 2006. Water Use by Ethanol Plants: Potential Challenges. Institute for Agriculture and Trade Policy (IATP). October 2006. http://www.agobservatory.org/library.cfm?refid=89449 5 Jetz, W., D. Wilcove, and A. Dobson. 2007. “Projected Impacts of Climate and Land-Use Change on the Global Diversity of Birds.” PLoS Biology, 5(6): 1211–1219. http://www.pubmedcentral.nih.gov/ picrender.fcgi?artid=1885834&blobtype=pdf. Lee, K.N. 1993. Compass and Gyroscope: Integrating Science and Politics for the Environment. Washington, DC: Island Press. Logan, J. and J. Venezia. 2007. Coal-To-Liquids, Climate Change, and Energy Security. World Resources Institute. http://www.wri.org/climate/topic_content.cfm?cid=3993. Morgan, G., et al. 2007. Best Practice Approaches for Characterizing, Communicating, and Incorporating Scientific Uncertainty in Climate Decision Making, Advance Copy. Washington, DC: The National Academies Press (NAP). Musial, W. and B. Ram. 2007. Large Scale Offshore Wind Deployments: Barriers and Opportunities, NREL, Golden, CO: Draft. NACO (National Association of Counties). 2003. A Brief Overview of County Government. Washington, DC: NACO. http://www.naco.org/ NEPA 1969. The National Environmental Policy Act of 1969, as amended, 42 U.S.C. 4321–4347. http://ceq.eh.doe.gov/nepa/regs/nepa/nepaeqia.htm NESCAUM (Northeast States for Coordinated Air Use Management). 2003. Mercury Emissions from Coal-Fired Power Plants: The Case for Regulatory Action. Boston, MA: NESCAUM.http://bronze.nescaum.org/airtopics/mercury/rpt031104mercury .pdf. NRC (National Research Council). 2004. Endangered and Threatened Fishes in the Klamath River Basin: Causes of Decline and Strategies for Recovery. Washington, DC: NAP. http://books.nap.edu/openbook.php?isbn=0309090970. NRC. 2007. Environmental Impacts of Wind-Energy Projects. Washington, DC: NAP. http://dels.nas.edu/dels/reportDetail.php?link_id=4185 130 20% Wind Energy by 2030 NWCC. 1999. Studying Wind Energy/Bird Interactions: A Guidance Document. Metrics and Methods for Determining Or Monitoring Potential Impacts On Birds At Exisitng and Proposed Wind Energy Sites. Washington, DC: NWCC. NWCC. 2004. Wind Turbine Interactions with Birds and Bats: A Summary of Research Results and Remaining Questions. Washington, DC: NWCC. http://www.nationalwind.org/publications/wildlife/wildlife_factsheet.pdf. NWCC. 2006. “Collaborative Study of the Effects of Wind Power on PrairieChicken Demography and Population Genetics.” Press release from National Wind Coordinating Collaborative, May 9. http://www.nationalwind.org/workgroups/wildlife/060509 press_release.pdf. Pasqueletti, M.J. 2005. “Visual Impacts.” Presented to National Wind Coordinating Collaborative Technical Considerations in Siting Wind Developments: Research Meeting, December 1–2, Washington, DC. http://www.nationalwind.org/events/siting/presentations/pasqualetti visual_impacts.pdf. 5 Piwko, R., B. Xinggang, K. Clark, G. Jordan, N. Miller, and J. Zimberlin. 2005. The Effects of Integrating Wind Power on Transmission System Planning, Reliability and Operations. Schenectady, NY: GE Energy. http://www.nyserda.org/publications/wind_integration_report.pdf. Price, J. and P. Glick. 2002. The Birdwatchers Guide to Global Warming. Reston, VA: National Wildlife Federation. www.abcbirds.org/climatechange/birdwatchersguide.pdf. RBA Research. 2002. Lambrigg Residents Survey. London: BWEA. http://www.bwea.com/ref/lambrigg.html. Regional Greenhouse Gas Initiative. “About RGGI.” Regional Greenhouse Gas Initiative. www.rggi.org/about.htm.SenterNovem. 2005. Concerted Action for Wind Energy Deployment (COD): Principal Findings 2003-2005. Utrecth, Netherlands: SenterNovem . http://www.offshorewindenergy.org/cod/COD-Final_Rept.pdf. Robel, R., Harrington, J., Hagen, C., Pitman, J., and Reker, R.. 2004. Effect of energy development and human activity of the use of sand sagebrush habitat by Lesser Prairie-chickens in southwest Kansas. Transactions of the North American Wildlife and Natural Resources Conference 68. http://kec.kansas.gov/wptf/robertrobel.pdf Stern, P.C., and H.V. Fineberg. 1996. Understanding Risk: Informing Decisions in a Democratic Society. Washington, DC: NAP. http://books.nap.edu/openbook.php?isbn=030905396X. Sterzinger, G., B. Fredric, and D. Kostiuk. 2003. The Effect of Wind Development on Local Property Values: Analytical Report. Washington, DC: Renewable Energy Policy Project (REPP). http://www.repp.org/articles/static/1/binaries/wind_online_final.pdf. Strickland, D., and D. Johnson. 2006. “Overview of What We Know About Avian/Wind Interaction.” Presented at the National Wind Coordinating Collaborative Wildlife Workgroup Research Meeting VI, November 14, San Antonio, TX. http://www.nationalwind.org/events/wildlife/2006 3/presentations/birds/strickland.pdf. 20% Wind Energy by 2030 131 Swancy, H. 2006. “Wind Power and Aviation.” Presented at the AWEA 2006 Fall Symposium, December 6–8, Phoenix, AZ. Thomas, C.D., A. Cameron, R. Green, M. Bakkenes, L. Beaumont, Y. Collingham, B. Erasmus, et al. 2004. Extinction Risk from Climate Change. Nature, 427: 145–148. http://www.gbltrends.com/doc/nature02121.pdf. USDA. “Forest Service: About Us.” U.S. Department of Agriculture Forest Service. www.fs.fed.us/aboutus. USFWS (U.S. Fish & Wildlife Service). Migratory Birds & Habitat Programs. “Migratory Bird Treaty Act.” U.S. Fish & Wildlife Service. http://www.fws.gov/pacific/migratorybirds/mbta.htm. Walters, C.A. 1986. Adaptive Management of Renewable Resources. New York: MacMillan. White, S., and G. Kulsinski. 1998. Net Energy Payback and CO2 Emissions from Wind Generated Electricity in the Midwest. Report No. UWFDM-1092. Madison, WI: Fusion Technology Institute, University of Wisconsin. http://fti.neep.wisc.edu/pdf/fdm1092.pdf. 5 132 20% Wind Energy by 2030


© Copyright 2026