
BIOLOGY AND FISHERY OF SILVERBELLY
BIOLOGY AND FISHERY OF SILVERBELLY LEIOGNATHUS
DUSSUMIERI (VALENCIENNES) FROM GULF OF MANNAR
P. S. B. R. JAMES AND M. BADRUDEEN
Central Marine Fisheries Research Institute, Cochin.
ABSTRACT
•Length-weight relationship of mate and female L. dussumieri was found to
be different. Within femallesi, the SimirMure, maturing, mature and spent-recovering
females differ from one another in the length-weight relationship. Males weigh
comparatively less than females. Among the females, immature, maturing and spentrecovering females weigh more than mature females. This species mainly spawns
during April>-Maiy and November-December, Minimum sfefe of maturity for males
were found to be 78 mm and for females 83 mm. Generally, females predominate
over males in the commercial catches. The counts of mature ova ranged from 805
to 41683 per female. The fecundity-length relationship has; beea studied by three
diffrent formulae and it was found that fecundity is better related; to direct cube
of length.
The most important items of food of the species included polychaetes, copepods, amphiiipods, bivalves, gastropods and foiretmfaifeiiains. No significant variations
in the food of fish from different places in different seasons; have been found. The
feeding habits of this fish also do not change with age. The fish was found to feed1
more Eictively in the month of January, February, April and November at Kilakarai.
The fish attains the length of 99 ram at the; end of first year, 114 mim at the end
of second yeair 128 mm at the end of tihiilrd year, 138 mm at the end of fourth
year and 145 mm. at the end of fifth yeem. The life span of the species was' found
to be five years, the maximum length recorded in the present study was 161 mm.
Good catches are Obtained from deeper waters (20 to 40 metre) of Gulf of
Mannar. The species is mainly landed by drift gillnets and trawl nets, zero, one
year and two year old fish contribute the bulk of the commercial catches. More
intensive fishing i:n deeper waters of Gulf of Mian/mair would augment the aatdhes'
of this species.
INTRODUCTION
The fishes of the family LeAognathidae, popularly called silverbellies contribute to an important fishery in the states of Tamil Nadu, Kerala, Andhra Pradesh and Karmataka. Of these states, Taimil Nadu accounts for the bulk of the
catches of silverbellies. Within Tamil Nadu, the southeast coast comprising
Palk Bay and Gulf of Mannar regions yield very high oaitdhies of silverbellies. In
BIOLOGY AND FISHERY OF SILVERBELLY
155
these regions, the fishery is almost continuous throughout, generally from April
to October along the Palk Bay and November to March along the Gulf of Mannar
coast.
In this area, of the 19 species of silverbellies known to occur in the seas
around India, except Leiognathus blochii, L. elongatus and L. indicus, all the
other 16 species occur in varying proportions throughout the year. Of the 16
species occurring in this area, L. jonesi is the most dominant in Palk Bay
followed by L. brevirostris and S. ruconius. In the Gulf of Mannar, the relative
abundance of various species varies considerably, L, dussumieri being one of the
dominant species. Other species commonly found in the Gulf of Mannar are L.
bindus, Secutor insidiaior, S. ruconius and Gazza minuta.
Published information on various aspects of the sy&tematics, biology and
fishery of 'the silverbellies in Palk Bay and the Gulf of Mannar region includes
the worksi of James (1968, 1969, 1975) on the systematios; Chacko (1949) Arora
(1951) James and Badrudeen (1975) on the biology; Chacko (1944 a, b)
Krishmamurthy (1957), Mahadevan (1958), James and Clement Adolf (1965)
James (1973), Venkataraman and Badrudeen (1974) on the fishery. In addition,
James (1971) reported 'the occurrence of the blue green algae on silverbellies and
James and Badrudeen (1968) dealt with certain abnormalities in the family Leiognathidae. Published information on Leiognathidae from elsewhere along the Indian coast includes the works of Venkataraman (1960), Balan (1963), Satyanarayana Rao (-968) Mahadevan PiUai (1972) on biology; Rani Singh and
Talwar (1978a, 1978b) on systematics and Jayabalan et al (1978) on the occurrence of >a symbiotic biolutninescent bacteria in Leiognathids.
Since no detailed inormation is available on the biology and fishery of
L. dussumieri, a detailed study is made during 1963-67 and results are given in
this paper.
MATERIAL AND METHODS
Material for this study was collected from the commercial fish catches
landed at Kilakarai (drift gill nets—mayavalai—55 to 60 mm mesh size), Mandapam (trawlnets) and Vedalai (drift gillnets—Choodavalai —25 mm mesh size).
These gears are operated at depths ranged from 7 to 40 m. Al the samples were
preserved in formalin for detailed analyses. Standard method employed by various
authors for length-weight relationship OKesteven 1947, Leoren 1951); age and
growth (Petersen 1892, Graham 1929, Menon 1950, 1952), food and feeding
habits (Hynes 1950, Pillay 1953), maturity and spawning (Clark 1934, Hickling
and Ruterberg 1936, Dejong 1940, Prabhu 1956 ) were followed. Details of the
methods used are given under the respective sections.
LENGTH-WEIGHT RELATIONSHIP
A total of 213 females ranging in size from 75 to 149 mm and 105 males
ranging in size from 75 to 129 mm were analysed for length-wieght relationship
156
JAMES AND BADRUDEEN
according to different stages of maturity., immature (Stage I), maturing (Stage
II), mature (Stage III) and spent (Stage IV). The relevant date are given in
Table 1.
TABLE 1.
Statistics of length-weight relationship of L. dussumieri.
Female
N
£X
SX2
SY
SXY
SY2
a
b
b+
r
Immature
Maturing
Mature
24
47.0766
92.3650
24.7336
48.5979
25.8039
—5.9633
3.5655
0.1974
146
293.9454
592.1101
175.4515
3'54.1846
213.9486
—5.0776
3.1I1S9
0.O6O8
0.9662
0.9737
Male
Spent
Immature
recovering
Maturing
Mature
2®
57.5594
118.3672
36J8745
75.9480
49.0920
—5.6675
3.3976
0.1SH5
15
3&7603
63.0945
20.0411
41,1370
26.9009
—4.0611
2.6319
0.3394
17
33.0534
64.2857
16.5058
32.1615
16.2834
—5,9549
3.5621
0.1988
78
154.1132
304.6712
82.6247
163.7471
89.0836
—4.6170
2.8729
0.0102
10
20.2322
40.9520
12.1534
24.6399
14.9227
—4.5657
2.8573
0.0474
0.9645
0.9066
0.9777
0.9561
0.9776
N = Number of specimens.
2JX, £Y = Sums of Log. length (X) and Log. weight (Y)
2X 2 .£Y2,XY = Sum of squares and products.
a, b =. regression coefficients.
b + = Standard error of estimate 'b'
r
= correlation coefficient.
Details of the analyses of covarianee for data on males and females are
shown below:
Source of
variation
Deviation from
average regression
Deviation from
individual regressions
within samples
Difference
Degrees of
freedom
Sum of
squares
315
0.4646
314
1
0.4282
0.0364
Mean
square
F
0.0014
0.0364
26.02
l'he analyses indicated ithat differences between the regression coefficients were
significant at 1% level.
The test of heterogenity was performed for data on tihe three groups of
males viz., Stage I, Stage II amd Stage III. The details are:
BIOLOGY AND FISHERY OF SILVERBELLY
Source of
variation
Deviation from average
regression
Deviation from individual
regressions within samples
Difference
D.F.
S.S.
101
0.1633
99
2
0.1524
0.0109
157
M.S.
0.0015
0.0055
F
3.57
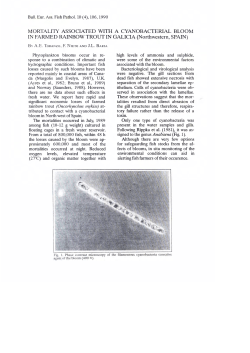
It was found that the difference between the regression coefficients was
not significant at 1% level. Hence data for all the stages of males were pooled
(Fig. 1) and a pooled regression estimate was made for males. The logarithmic
and parabolic equations for males were found to be:
Log W - 2.9591 Log L - 4.7850
W - 0.000016406 L
50
60
70
80
t0
100
110
120
T0TAI LENGTH OF FISH (Him)
FIG. 1. Length-weight relationship of males of L. dussumieri.
158
JAMES AND BADRUDEEN
The differences between the regression coefficients for the various groups
of females viz., immature, maturing, mature and spent were tested and the 'F'
values are given below:
F
Between
Between
Between
Between
Between
Between
stages I, II, III & IV
stages I, II & III
stages I, II & IV
stages II & III
stages III & IV
stages I & II
Fl%
Degrees of
freedom
3.78
4.61
4.61
6.63
7.31
6.63
6.72
6.58
5.54
7.82
11.49
4.19
3:205
2:192
2:179
1:170
1: 39
1:166
The above covariance analyses showed that the regression coefficients of
the immature and maturing groups alone were not significant at 1 % level. Hence,
logarithmic and parabolic equations for lengthnweighit relationship for the various
groups of females are given below. The curves are shown in Fig. 2.
Immature and maturing females:
Log W = 3.1732 Log L - 5.1878
W = 0.0000064893 L 3.1732
Mature females:
Log W = 3.3976 Log L - 5.6675
W = 0.0000021503 L3.3976
Spent females:
Log W = 2.6319 Log L - 4.0611
W = 0.000086876 L 2.6319
Applying 't' test, it was found that the regression coefficients of the
males and females of Stage I and II were significantly different from 3 at 1%
level and the regression coefficients of mature females (Stage HI) and spent
females (Stage IV) were not significant at 1 % level. The results are given below.
Groups
Male
Female
Stages I & II
Female
Stage III
Female
Stage IV
Regression
coefficient
Standard
error of to
b-3
D.F.
t 1%
6.39
103
2.62
0.1732
59.72
168
2.60
0.1815
0.3976
2.19
26
2.78
0.3394
-0.3681
1.08
13
3.01
b
b +
2.9591
0.0064
-0.0409
3.1732
0.0029
3.3976
2.6319
t
BIOLOGY AND FISHERY OF SILVERBELLY
159
40
3i 30
u.
u.
o
oi
£ 20
10
0
SO
10
70 60 90 100 110 120 130 HO
I0TAI IEM6TH OF FISH-fMM)
FIG. 2. Length-weigh* melaiCiioinslhlip of females, of L. dmsumieri.
The results of the analyses of data on lengths-weight (Figs 1&2) show
that the males weigh comparatively less than the females. Among the females,
the immature, maturing and spent females weigh more than the mature females.
This may be due to the accumulation of fat An fish other than the mature fish.
REPRODUCTION
/
Maturity. Maturity of the species was studied by classifying the gonads into
various stages of maturity based on macroscopic and microscopic structure. The
following maturity stages were recognised.
Stage I : Ovaries simai, tramspairenit, occupying a very small portion of
the body cavity. Ova not visible to the naked eye, measure a maximum of 6 oc.
m.d. (one ocular micrometer division = 0.021 mm). Testes similar in appearance
as the ovaries.
Stage II : Ovaries occupy about 1/3 of body cavity, semitransparent.
Granular ova visible to naked ©ye, measure a maximum of 15 oc.m.d. and the
mode of the largest group of ©ggs fails at 11 oc.m.d. Testes semitransparent,
occupy about 1/3 of body cavity.
•
'
160
JAMES AND BADRUDEEN
Sages III : Ovaries occupy about i the body cavity, yellow in colour,
ova measure a maximum of 18 oc.m.d. the mode of the largest group of eggs
falls at 14 ocm.d. Ova opaque with full deposition of yolk. Testes occupy about
i the body cavity, creamy-white in colour.
Stage IV : Ovaries occupy about £ of the body cavity, pale yellow in
colour, ova measure a maximum of 24 oc.m.d. The mode of the largest group of
ova lies at 20 oc.m.d. ova semitransparent. Testes creamy-white and occupy
nearly I of the body cavity.
Stage V : Not recorded in this study.
Stage VI : Not recorded in present study.
Stage VII : Ovaries small, blood-shot, occupy less than 1/3 of the body
cavity, maximum size of ova 18 ocm.d. the mode of the largest group oif ova
falls at 14 oc.m.d. Testes small and occupy less than 1/3 of the body cavity.
Development of ova to maturity: Size distribution, of ova in different stages of
maturity is shown in Fig. 3. Except in stages I and VII, ova smaller than 4 ocm.d.
were not measured, as they are present in all the ovaries, representing the
immature stock. In stage I, the ova measure a maximum of 6 oc.m.d. In stage II,
a small group of ova with a mode at 11 oc.m.d. gets separated from the general
_
w
"
-
"
O
OVA-DIAMETER
O
O
(mm)
FIG. 3. Ova-diameter frequency polygons for various stages of amturity in L. dussumwri
161
BIOLOGY AND FISHERY OF SILVERBELLY
stock. In- this stage, the ova measure a maximum of 15 oc.m.d. In stage III,
the group of ova which got separated from the general stock shows a progress
with a mode at 14 oc.m.d. The maximum-size ova in this stage reaches 16 oc.
m.d. In stage IV, two distinct modes may be seen, the first one at 20 and second
one at 14 oc.m.d. But the two modes are not well separated from each other or
from the general stock. Stage V and VI were not encountered in the present
study. In stage VII (spent), in addition to the general stock of ova, two modes
are seen, one at 14 and another at 5 oc.m.d, The mode in stage IV at 14 oc.m.d.
corresponds to the second mode in stage IV at 14 ocm.d. Therefore, it appears
that release of ova may be at short intervals.
Spawning season: The distribution of maturity stages month-wise is shown in
Figs 4 and 5. The data indicate that at Kilakarai, Mandapam and Vedalai fish
were predominantly in stages I, II, III and VII. Stages IV occurred very rarely
and hence not included in the tables. In view of the rare occurrence of stage
IV and non-occurrence of stages V and VI, the occurrence of stage III is considered as an index of spawning activity, correlated with the occurrence of spent
fish. The mature fish (stage III), occurred in fairly high percentage during the
months of February, March at Kilakarai and January to March at Mandapam.
o
to
(0
(0
20
•o
FEB.65
FEB. 64
jH
<f 57
$126
no
JAN IS
JAN.64
rf'tt
to
40
20
nn
o to
z so
UJ
QC
£T
3
U
UJ
o
z
UJ
<_)
ac
UJ
a.
60
20
$75
80
60
40
20
N0V.I3.
80
60
10
20
OEC.U
0EC.I3
afln.
«^27
-972
OCT.63
MAV.65
A A
fll A
$81
AP».t*
APH.tS
<fl1
<f 17
?7*
BJH
EL
MAR. 85
MAR. 64
llill
<T t
•1^22
(Z3?31
O
<P3»
$1S1
in
I It III VII
I II III VII
MATURITY STAGES
FIG. 4. Month-wise occurrence of males and females of L. dussumieri in various
of maturity, at Kilakarai' (October 1%3 to May 1965).
I
II
III VII
162
JAMES AND BADRUDEEN
Spent fish were in greater peroenitage in April, May, November and December
at Kilakarai and November at Mandapam. Since the mature fish was available
from January to March and spent fish in April, May and November, December,
iOOi—
eo-
1—1
0EC.65
6040-
FEB.67
cTisi
d * 108
9
95
20-
0
60
60
£0
20
0
UI
(9
80
z 60
111
u 40
at
ui 20
a.
ui
u
z
UI
a.
a.
. 3
u
u
o
MR
Q 103
JAN.67
NOV. 65
Cf 71
0*43
9 67
jl
DEC.64
IH.
9
FEB.66
cF "
CT 155
fl-
Q 104
0
60
40
20
0
Q
66
JAN 66
NOV. 64
80
40
d"?5S
•I d
9
c m 9 <•'•
I
II
III VII
I
II
72
III VII
MATURITY STAGES
FIG. 5. Monfch*w!se occurrence of males and females of L. dussumieri in various stages
of maturity at Mandapam (Mulrch li!*64 to February 1%7).
it appears that the fish may spawn in April, May and November, December.
Since data on the occurrence of mature and spent fish are not continuously available for all the months, it has not been possible to precisely fix the total spawning period.
Size at first maturity: For the determination of size at first maturity, frequency of
occurrence of different stages of maturity in various size groups was studied.
Results for males and females from Kilakarai and Mandapam are given in
Table 2 & 3.
Owing to very rare occurrence of fish in stage IV and complete absence of
stages V and VI, fish in stage III were considered as mature for this purpose. In
the case of males from Kilakarai, the smallest mature fish was found in the size
group 88-92 mm, and the spent fish in the size group 98-102 mm. In the case of
males from Mandapam, the smallest mature fish was found in the size group 7882 mm and smallest spent fish in 83-87 mm group. Therefore, it is possible to
conclude that males might be maturing at any size between 78-87 mm.
BIOLOGY AND FISHERY OF SILVERBELLY
TABLE
163
2. Percentage occurrence of females and males of L. dussumieri in different stages of maturity during the period from 1963 to 1965 Kilakarai
(Gulf of Mannar).
Females
Stage of
maturity
I
II
III
VII
Size range
(mm)
58-127
78-147
88-137
88-132
Males
Occurrence
(%)
Size range
(mm)
Occurrence
(%)
2.94-100.0
14.29-100.0
4.35-100.0
5.26- 50.0
58-122
78-132
88-127
98-117
3.23-100.0
12.50-100.0
5.00-100.0
3.23-100.0
In the case of female fish from Kilakarai, the smallest mature fish was
found in the size group 88J92 mm and the spent fish also im the sarnie group.
In the case of female from Mandapaim, the smallest mature fish was found in
the size group 83-87 nun and smallest spent fish in the size group 93-97 mm.
From this data it is possible to conclude that females must be maturing at any
size from 83 to 92 mm. Therefore, the miiniimum size of maturity for male may
be stated to be 78 mm and for female 83 mm.
TABLE
3. Percentage occurrence of females and males of L. diussumiieri in different stages of maturity during the period from 1964 to 1967 from
Mandapam (Gulf of Mannar).
Miale
Female
Stage of
maturity
II
II
III
VII
Size range
(mm)
68-142
73-142
83-137
93-132
Occurrence
(%)
Size range
(mm)
Occurrence
(%)
3.13-100.0
13.33-100.0
3.23-100,0
4.55-100.0
68-107
73-132
83-127
83-117
1.03-100.0
22.22-100.0
0.85-100.0
0.85-35.29
Fecudity: Fecundity estimations were made for 114 fish by the gravimetric method. The linear relationship between ovary weight and fecundity was found to
be:
Fecundity (in thousands) = 1.462 + 0.0131 x Ovary weight (mg)
164
JAMES AND BADRUDEEN
The correlation coefficient 'r' has been found to be 0.86. The means and
standard deviations of ovary weight and fecundity were found to be 617 mg, 9.45
thousands and 484 mg, 7.4 thousands. The scatter diagram and -the fitted line for
ovary weight and fecundity are presented in the Fig. 6.
*0
o
•
2 »
z
5 io
o
UJ
<
Z
.
v ^
yS
*
20
&
NUMBER
•/?"
_•. ,
5
o
** •V
<4
•
,
1000
soo
1500
2000
. , _ *
2S00
1
1000
0VARV WEIGHT (mng)
PIG. 6. Relaitionslhiip between weight of ovary and! iiumiber of mature ova for samples of
L. dussunueri at Maodiapam andl KiakairaJ.
The scatter diagram of fecundity-length data is presented in Fig. 7. The
relationship was studied by using the formulas Y
aXD Y = a + bX3 and
3
Y = bX . The details are given below:
Contants
Formulae
Y = aXb
Y = a + bX3
Y = bX 3
a
0.000183
-2081
Std. error of
b
3.8749
0.01412
0.01193
b+
0.5753
0.0024
0.0066
correliaticn
coefficient
r
0.55
0.50
0.87
The sums, sum of squares and products for the equation Log X = a+b
Log Y (Y = aXb) were: X = 205.4515; 2 X 2 = 406.0728; 2Y = 407.4241;
S Y2 =1606.0655 and % XY = 805.6561.
For the equation, Y = a+bx 3 , the sums of squares etc. Were as foilows;
Sx = 91644684; S (X3)2 = 873586510000CO; § Y = 1077253; SY 2 =
16368371000 and ^ x 3 Y =104266500000.
3
BK)LOGY AND FISHERY OF SILVERBELLY
165
For the formulae Y = bX3 the sums of squares and products are same
as for the formulae Y = a+ bX 3 but me 'Y' intercept 'a' is forced to be zero
and the slope 'b' is obtained by using the formula,
S(X3Y)
2 (X3P
b=
Among the three curves fitted, it is found that fecundity is better related
to direct cube of length.
o
to
.
jo
•
•
•
to
to
FISH LENGTH (mm)
too
•
•
no
12;
FIG. 7. Comparison^ of fecoindity'-liBmgSh regressdioitj lfaeb acoardiiing to different formula for
saiapJes of L. dussumieri from fMaradiaspiajn amdi KiHafcaraS.
Sex ratio: For this study, samples of L. dussumieri collected from trawl catches
at Mandapam, drift gillnet catches at Klakarai and Vedalai and shoreseioe
catches at Vedalai were analysed. In the month-wise data presented in Table
4, females dominated only in, the catches obtained from gillnets and shore seines
Mates showed significant dominance during the months January and February
1966 & 1967. The gear-wise pooled data showed significant dominance of males
in trawl catches at Mandapam and females in gill net catches at Kilakarai and
shoreseine catches at Vedalai.
Season-wise data with ehi-isquaire values are presented in Table 5. The
highly significant dominance of males in trawl catches from January to March
resulted in the dominance of miales for the season 1965-'66. The pooled data for
the period January-March revealed the high significant dominance of males in
trawl catches and females in other gear.
166
JAMES AND BADRUDEEN
TABLE
4. Sex-ratio of L. dussumieri collected from different gears and centres
along Gulf of Mannar.
Month
I Mandopam (Trawl net)
March 64
November
December
Novsmber 65
December
January 66
February
January 67
February
Total
II. Kilakkarai {gillnet)
October 63
November
December
January 64
February
March
April
December
January 65
February
March
April
May
Total
I'll. Vedalai-gillnet
April 66
May
June
Total
IV. Vedalai - shore seine
May 66
November
Febru ry 67
April
Total
*
*
!
Significant at 5%
Significant at 1%
Observed1 No. of
Males
Feraslles
Ratio of female
(male = 1 )
Cthi-sqiiare
value
34
H8
41
43
108
256
155
71
181
39
49
104
67
95
72
87
40
103
1.14
2.72
2.54
1.56
0.88
0.281
0.56
0.56
0.57
907
656
0.72
40.31 **
0.34
14.34
27.37
5.24
0.83
103.22
19.11
8.66
21.42
**
**
**
""
**
**
**
22
27
49
1
15
6
11
6
16
57
35
17
7
31
72
75
6
19
39
61
82
22
126
151
74
14
1.41
2.67
1.53
6.00
1.27
6.50
5.55
13.67
1.3«
2.21
431
4.35
2.00
269
774
2.88
1.33
20.45 **
5.45 **
3.57
0.47 **
24.20 **
34.72 **
65.64 **
0.95
26.02 **
72.34 "»*
35.70 **
2.33
244,51, **
36
13
8
44
15
14
1.22
1.15
1.75
0.80
0.14
1.64
57
73
US
1-97
29
6
75
39
53
17
120
56
1.82
2.83
1.60
1.44
7.02 **
5.26 *
10.38 ='*
3.04
149
246
1.65
23.82 **
TABLE
5. Season-wise sex-ratio (Male : Female) of L. dusssmieri for the years
1963-64 to 1966-67 from the near shore catches (gttlnets & shore
seines) and off shore catches (Trawlnets) from Gulf of Mannar with
Chi-square values (M = Males; F = Females).
1963-64
M
1964-65
1965-66
Chisquare
M
180
24.19
6
:
82
65.64
•-
—
—
59
:
153
41.68
(151
:
299
89.63
--
—
—
(411
88
36.57
86
—
—
—
622
220.54
648
F
F
Chisquare
1966-67
Chisquare
M
—
—
6
162)
0.39
—
—
—
:
159)
111.41
(252
:
126
7.55
39
—
—
36.90
372
M
F
F
Total
Chisquare
M
F
Chisquare
Oct.
Ne?'r shore
oatchss
98
:
:
17
5.26
110
:
279
73.42
—
—
(210
:
315)
21.00
120
10.38
205
:
483
112.33
:
143)
30.08
(697
:
341)
122.10
:
56
3.04
160
:
351
71.39
—
—
—
—
—
336
1,83
1382
: 1769
47.53
Dec.
Oil share
catches
—
last.
Near shore
catches
22
:
64
20.51
108
34
:
39
0.34
—
Apr.
No: Ir shore
catches
11
:
61
34.72
24
:
7 5 :
Mar.
Off shore
catches
:
Jun.
Off shore
catches
Total
—
165
:
—
—
—
344
62.95
197
:
—
: 447
:
168
JAMES AND BADRUDEEN
In Tables 6 and 7 data on the ratio of males to females for each 5 mm
group, for trawl net catches and gillnet catches are presented. The data indicate
that in the size groups 75-95 mm males signifiantly dominated in trawl catches
alone. The femiales dominated in the size groups 95-125 mm in gillnet catches
and in 110-120 and 130 mm groups in trawl catches.
TABLE
6. Chi-square test for L. dussumderi of different size groups from trawl
net catches at Mandapam.
Size group (mm)
70
75
80
85
90
95
100
105
110
115
120
125
130
135
Total
Males
2
17
68
202
179
193
114
76
26
17
6
5
—
—
905
Females
1
3
25
62
82
116
123
86
73
40
24
12
7
1
655
Chi-squiare valu
0.33
9.80
19.88
74.24
36.05
19.19
0.34
0.62
22.31
9.28
10.80
2.88
7.00
1.00
40.06
**
**
**
**
**
**
**
**
**
* Significant at 5%
** . Significant at 1%
The percentage length-frequency distribution in trawlnet catches and
gillnet catches (Fig. 8) showed that there was no selection of sex within the
size ranges obtained in respective gears4 The modal positions of the curve for
males are similar to those in the curve for combined sexes in the respective gears.
This indicates that there is no growth variation between sexes. The percentage
of males in each length group in trawlnet and gillnet catches indicated that the
males decline from 95 mm and 110 mm group in gillnet catches and trawlnet
catches respectively (Fig. 9).
The foregoing analyses shows that generally females predominate over
males in the commercial catches -and during the period January-March males
were significantly in high'er numbers than females. In L. brevirostris also, females
were found to domnate in the itrawl catches obtained from Gulf of Mannar except
during February and March (James and Badrudeen 1975).
BIOLOGY AND FISHERY OF SILVERBELLY
TABLE
7. Chi-square test for L. dUiSsumienii of different size groups from gillnet
catches at Kilakkarai.
Size group (mm)
60
65
70
75
80
85
90
95
100
105
110
115
120
125
130
135
140
145
Total
169
Males
3
4
5
5
7
11
32
40
49
58
30
13
9
2
2
—
—
—
270
Females
1
4
5
4
7
14
45
97
155
162
126
83
44
13
3
1
—
1
765
Chi-square values
1.00
0.00
0.00
0.11
0.00
0.36
2.19
23.72 **
55.08 **
49.16 **
59.08 **
51.04 **
23.11 **
8.07 **
0.20
1.0
1.0
236.74 **
* Significant at 5%
** Significant at 1%
FOOD AND FEEDING HABITS
A total of 478 fish from KMcarai, M'andiapam were examined for the
analyses of gut contents. The gut contents were examined qualitatively and
quantitatively. For qualitative estimation!, points (Volumetric) method as given
by Hynes (1950) was adopted. Each food item in the gut was allotted certain
number of points based on its volume and taking into consideration both the
size of ithe fish and the fullness of the gut. The results are given in Tables 8 and
9. The data indioate that oopepods, polychaetes, amphipods, bivalves, gastropods
and foraminiferian were the dominant items of food. Other items were present
only in minor quantities. Coscinodiscus was recorded only on two occasions.
Sand grains were occasionally present. At all the places the guts contained high
peroenitage of semi-digested matter which could not be separately identified and
attributed to individual groups.
Variation in the food of the fish during different years: For .this purpose, data
from Kilakarai during the years 1963 to 1965 (Table 8) were available for comparison. From the table it may be seen that copepods were more abundant in
1965 compared to 1964. Amphipods were recorded in 1964 only. Gastropods,
170
JAMES AND BADRUDEEN
bivalves and polydiaietes were more abundant in 1965 than in 1964. There were
no significant differences in the relative quantities of other items in both
the years.
<
TRAWL NET
20
fx
15
10
/
5
*
u
z
UI
z> 0
a
•
1
UI
cc
u.
UI
o
GILL NET
20
<
z 15
F%
Ui
u
at
?j|
UI
a. 10
S
50
i%
60
70
80
tO 100
110 120
LENGTH GROUPS IN (TTWTJ)
130
HO
PIG. 8. Petrwmtaige Jenigth^frequeincy distililbutdtoin of males and females of L. dussumieri in
trawlnet and gilneit caliches.
Seasoned occurrences of food items: No significant difference were found between
the months with regard to the major items in gut contents.
Variations in food of fish from different places: The data on gut contents for
different places during the years 1963 to 1967 are given in Tables 8 and
9. The results indicate that the fish has fed upon fee same items at different
places. At Vedalai, amphipods and crustacean remains were absent in the gut
contents. This may perhaps be due to the bigger sizes of fish obtained from the
drift gill nets at this place.
Intensity of feeding: For the study of intensity of feeding, the guts of fishes were
classified into various catgories designated as full, J full, 1 full, i full, little and
BIOLOGY AND FISHERY OF SILVERBELLY
171
empty depending on the degrees of their fullness. The results of the study on the
intensity of feeding of fish from Kilakarai (October to Deoemiber 1963, January
to April 1964 and January to May 1965) and from Mandapam (November
1965 to February 1966) are given in Tables 10 and 11 respectively. Majority
of the fish from Kilakarai from; October to December 1963 had the guts i full
and i full. During the period January to April 1964 majority of the fish had the
75
SO
25
u
<
a.
GILL NET
UJ
50
25
60
70
80
90
100
tlO
120
130
LENGTH GROUPS (TDTTI)
t'lC 9. The percentage of males of L. dussumieri in each length group in tRwlnet wnd
gWlnet catches.
guts i full and i full and from January to May 1965 majority of the fish had
the guts f full, i full and i full. During the period October to December 1963,
intensive feeding was found in November; during the period January to April
1964, fish fed intensively in February and during the period January to May
1965, they fed intensively in January and April. In general, the fish was found
to feed more actively in the months of January, February, April and November
(Table 10). Fishes from Mandapam were found to have the guts i full and i
full from November 1965 to February 1966. No significant differences were
found between the months (Table 11).
TABLE
Food items
Semi digested matter
Copspods
Polyohaetes
Crustacean reroasns
AmpMpods
Nematodes
Grstnapods
BiVailves
FJsh scales
FaramfcMfeirams
Sand grains
Coscinodiscus
Oot.
(20>
51.62
7.07
17.17
—
13.13
1.01
—
—
.._
-—
—
8. Relative importance of food items in the gut contents of L. dussuinieri
from Kilakarai (Gulf of Mannar) durinf the period 1963 to 1965.
(Values expressed to percent. Figues in paratheses indicate number of
fish examined. Samples obtained from Mayavalai only)
1963
Nov.
(40)
Dec.
(30)
Jam.
(10)
Feb.
(20)
1964
Mar.
(7)
48.54
21.17
22.26
0.36
6.57
0.73
52.56
21.79
8.97
7.69
3.85
1.28
46.82
44.17
16.67
25.00
2.50
10.&3
—
—
—
—
0.30
0.36
14.98
19.10
0.75
5.24
2.25
0.37
7.12
0.75
2.62
51.78
16.37
16.07
5.06
9.82
—
0.30
—
&30
—
—
—
—.
1.28
2.56
—
—
—
—
—.
—
—
Apr.
(40)
Dec.
(20)
Fan.
(10)
Feb.
(40)
1965
Mar.
(42)
35.64
19.03
1«.34
31.75
16.35
40.38
5.77
70.50
59.47
50.61
3.96
11.88
5.94
6.05
6.75
14.42
13.50
4.15
8.65
1.04
—
—
0,96
2,88
0.83
12.46
—
—
—
—
—
0.69
—
1.92 •
—•
—
-—
0.99
1.98
4.95
-—
—
5.26
10.26
—
—
3.42
13.42
1.05
0.53
0.53
Apr.
(20)
May.
(11)
45.45
2.02
13.13
45.16
13.13
—
—
0.31
3.07
10.12
1.01
7.07
18.1*
0.61
0.61
—
—
—
—-
12.90
17.20
15.05
—
—
430
5.3*
—
—
—
173
BIOLOGY AND FISHERY OF SILVERBELLY
TABLE
9. Relative importance of food items in the gut contents of L. dussumieri
from Mandapam (Gulf of Mannar) during the period 1964 to 1966.
(Values expressed in percent. Figues in parantheses indicate number
of fish examined. Samples obtained from trawl net only).
1'964
semii-digested matter
Copapodies
Folyohaetes
Crustacean remains
Amphjpodes
Nemait-odes
G:lstirapods
Biwailves
Fish scales
Foramiimiifecans
Sand grains
Coscinodiscus
1965
1966
(42)
Nov.
(10)
Dec.
(20)
Nov.
(10)
Dec.
(20)
Jan,
(30)
Feb.
(36)
49.05
15.51
12.34
1.90
7.91
1.58
0.63
9.17
—
1.90
—
—
46.00
20.00
—
8.00
—
—
8.00
10.00
—
6.00
2.00
—
51.04
3.12
2.08
14.5*
—
5.21'
2.08
6.25
5.21
—
5.2ll
5.21
47.33.
10.72
8,93
8.93
• —
—
8.93
5.36
—
9.83
—
—
46.95
8.96
10.03
5.01
—
—
12,90
7.®8
1.79
6.45
—
—
48.30
13.96
7.55
3.02
0.3S
—
9.06
8.30
0.3i8
8.63
—
0.38
51.89
8.29
6.40
5.69
—
—
12.80
8.53
—
6.40
—
—
Miair.
Feeding habits in relation to age: In order to study the relation between the feeding habits and age of fish, data collected from Kilakarai (1963 to 1965) and
Mandapam (1964 to 1966) were analysed. Data for all the years from each
place were pooled together and tabulated (Tables 12 and 13).
Kilakarai: At this place, semidigested remains, copepods, polychaetes, crustacean
remains and aimphipods have been found to be the most common. They were
found in die gut contents of all the fish ranging in size from 53-132 mm. The
other items, the nematodes, gastropods, bivalves, fish scales, foraminiferams and
Coscinadiscus were mainly restricted to fish of the size range 73 to 117 mm.
Of these items, Coscinodiscus were present in a restricted size range of 93 to
107 mm. From this it appears that while certain items were fed upon by fish of
all sizes certain others appear to be limited to restricted size ranges.
Mandapam: The data from Mandapam show that except Coscinodiscus, all the
other items of food were present in the entire size range of 63 to 132 mm.
Coscinodiscus were present in fish ranging in size from 68 to 97 mm.
Although some differences were found in the data from Kilakarai and
Mandapam in the presence of certain items of food in particular size ranges,
pooled data for both the places indicate that there is no significant change in
the feeding habits of the fish in relation to increase in size (age).
AGE AND GROWTH
i) Length-frequency distribution: For this study samples of fishes were collected
from Kilakarai (December 1963 to 1965), Mandapam (November 1964 to
174
TABLE
JAMES AND BADRUDEEN
10. Percentage occurrence of the guts of L. dussumieri in various degree
of fullness from Kilakarai (Gulf of Mannar) October 1963 to April
1964 and January to May 1965).
1963
Condition
of food Oct
No. of
fishes
20
Ml
i (Full
i Full
i Fuji
Untie
Empty
—
5.00
20.00
15.00
60.00
1964
1965
Nov
Dec
J'ain
Feb
iMar
Apr
Jam
Feb
Mar
Apr
May
34
30
10
20
17
40
10
40
42
20
11
1-1.76
23.53
23.53
17.65
23.53
13.33
3.33
43.33
16.67
23.33
—
— 23.53 5.00
20.00 65.00 29.41 17.50
20.00 35.00 41.18 35.00
50.00
— 5.88 12.50
10.00
—
— 40.00
—
40.00
30.00
—
30.00
10.00
22.50
25.00
22.50
20.00
2,38 5.00 9.09
21.43 50.00 18.18
21.43
— 18.18
26.19 10.00 36.36
28.57 35.00 18.18
1967) and from Vedalai (February 1966 to June 1966). Fish were grouped into
5 mm length groups and the percentage of each group im -the total for each month
has been calculated. The length-frequency curves for the 'three1 places are shown
in Figs. 10 to 12.
Kilakarai: During December 1963 (Fig. 10) four modes were observed at 70.
90, 105 and 120 mm. In January 1964, no distinct mode was found, whereas in
February, three modes were found at 100, 110 and 120 mm. In March only
one distinct mode was found at 100- mm. In April a single mode was present at
95 mm. The length-frequency curves indicate that fish of a wide size range were
available in December when compared to other months.
In December 1964, two modes were seen at 100 and 110 mm. In
January, February and March 1965 only a single mode was present at 150 mm.
In Aprii, a single mode was present at 110 mm. In May, a single mode was
found at 100 mm.
TABLE
11. Percentage occurrence of the guts of L. dussumieri in various degrees
of fullness from Mandapam (Gulf of Mannar) (November 1965 to
February 1966).
1966
1965
No. of fish
Full
i Full
i Full
i Full
little
Empty
Nov.
10
10.00
50.00
10.00
10.00
20.00
Dec.
20
15.00
60.00
15.00
10.00
Jan.
36
2.78
33.33
27.78
22.22
13.89
Feb.
30
20.00
46.67
26.67
3.33
3.33
Q P W O p W Q p U O O U O p U O O W I X W Q P t p
l » o L<i i e ••» b \ ts> H-> •-> '>-• i - In in vo Os OS
*-N>©L«H-'Ol.fe.ul©OOVO-~J*-
I
*fc
!-• w SJ _
W p W M - J ( J * W i ^ W
M ^) » H- » i t U! i - ( J i - Ul
888888888888888
(» (^ w <>i b u oo b\ U
H J I * A S K I » U I M
» -*J S> S) © -J
* « ifi « O -
>-» u> p> © » © p\ ~a ;-fi I
is) ui !•». in Iti U* *©
tJ d\ M ©© --J H- * ^ L/i © 4*-
i—* c*i >-* »-*
\CUiOO — OOlOsPUJ
So
© -J
I—
N- S ) ( J H-
ti(U1Oi©^n©wi.Lfl
88888888
I
u* U» pS
w w b
OS
W W sj
•i
I I
S o
TABLE 13. Percentage occurrence of food items in the guts of L. dussumieri in
various size groups during the period 1964 to 1966 from Mandapatn
(Gulf of Mannar).
Sze
group
in mm
No. of
fish
examined
63-67
68-72
73-77
78-82
83-87
88-92
93-97
98-102
103-107
108^-112
113-117
118-122
123-127
128-132
Semidigested
matter
Copepbds
Crustacean Arnphi- Neraa- Gasto
Polvchates remains
pods
todes
pod;
2
12
15
22
29
1.10
6.59
8.79
12.09
15.93
1.53
8.40
9.16
16.03
19.85
1.18
4.70
4.70
12.94
20.00
31
16
9
6
9
2
2
15.93
8.24
18.32
8.40
4.58
4.58
5.34
1.53
1.53
22.35
8.23
7.06
3.53
9.41
2.36
2.36
6.39
3.30
4.94
1.10
1.10
—
—
—
1
0.55
0.75
1.18
--
—
5.48
10.96
10.96
24.66
15.07
9.59
8.21
2.74
8.22
1.37
2.74
4.17
8.33
12.50
12.50
20.84
8.33
8.33
8.33
8.33
4.17
—
—
17.66
17.66
11.76
11.76
11.76
—
—
11.76
11.76
—
—
4.17
5.88
Bivalvcs
—
1.89
4.25
10.64
12.77
22.35
6.61
10.38
19.15
15.96
6.38
1.06
4.25
1.06
2.13
14.15
17.92
21.70
9.43
4.72
3.77
6.61
0.94
0.94
0.94
F&'h Foramini- Sand Coscinosc.les ferans grains discus
—
—
9.38
12.50
28.13
12.50
21.88
3.12
3.12
6.25
3.12
—
1.16
6.98
11.63
16.28
25.58
19.77
8:14
3.49
—
—
—
—
33.33
—
50.00
—
—
—
4.65
16.67
1.16
1.16
—
—
BIOLOGY AND FISHERY OF SILVERBELLY
177
The length-frequency data indicate that only fish of restricated length
range occurred during the period, with modes at 70, 90, 95, 100, 105, 110 and
120 mm.
Mandapam: The length-frequency curve for November 64 (Fig. 11) shows three
modes at 105, 115 and 125 mm. In December, only one mode was observed at
100 mm. In November '65 two modes were observed at 100 and 110 mm,
APR.es
sss^tssssa:
-iiscsais*.
i
i
i
i
i
t SS55
TOTAL IE1GTM frm)
Sm
a m 0 m
I
•
i
\
(
i
t
TOTAL LENGTH (mm)
PIG. 10. Length-frequency curves
for L. dussumieri from Kiiakanai
(drift gffinet catches) from December 1963 to April 1964, and
December 1964 to May 1965 and
January-February 1966).
RIG. 11. Length-frequency curves
for L. dussumieri from Mamdiapaim (trawl catches)
during
the period! November-December
1964, November 1965 to February 1966 and January-February
1967).
•
i
178
JAMES AND BADRUDEEN
whereas in December, three modes were seen at 100, 110 and 130 mm. In
January '66 the modes were present at 85 and 95 mm. In February only a
single distinct mode was observed at 95 mm. Similarly, in January '67 a single
mode was present at 90 mm and in February at 85 mm. Since continuous daita
were not available, it has not been possible to trace the progression of modes.
However, the length frequency curves indicate that prominent modes were found
at 80, 90, 95,.100, 105, 115 and 125 mm. Addition of small sized fishes mainly
takes place during the period January-February. Fishes captured in NovemberDeoember period are usually larger than those captured in January-February
period.
TOTAL LENGTH ( m m )
FIG. 12. Length-frequency curves for L. dussumieri from VedataM (draft gillnet catches)
from February 1966 to June 1966).
Vedalai: In February '66 (Fig. 12) a single prominant mode was present at
80 mm Whereas in March, April and May the mode was stationary at 85 mm and
in June the mode was present between 85 and 90 mm.
FISHERY AND BIOLOGY OF P. HARDWICKII
179
The length-frequency curves indicate that only fish of restricted length
range were available during the period, with modes at 80 and 85 mm.
Study of bones: A total of 265 of fishes in size range from 66 to 161 mm were
examined for this purpose. Fishes were cooked in water and the cleithrum and
supraoccipital bones were separated. Seasonal marks in the form of transparent
lines interspersed with opaque broad areas or bands have been observed on the
supraoccipital crest and cleiithrum. The number of transparent limes alternating
with opaque bands was found to toe related to the size of the fish. Invariably, the
number of transparent lines on the supraoccipital crest and the cleithrum was
found to be identical. Occasionally, false marks were also noticed. Sometimes
when seasonal marks were clear on one bone the same were not clear on the
other bone of the same fish.
Interpretation of seasonal marks on the bones: The cleithrum and supraoccipital
crest of the 0-year group fishes were fully transparent. Growth of the bones is
indicated by an opaque edge. Completion of growth of a season is indicated by
the formation of a transparent line enclosing an opaque area. In larger fishes the
transparent central area of the bone is therefore followed by a series of broad
opaque areas alternating with marrow transparent lines, the former representing
the period of active growth amd the latter slow growth or cessation of growth.
Therefore, a set of these areas i.e. one opaque and one transparnet area should
present an year's growth. On this basis, in this study, the first transparent area
surrounding the first opaque area has been recognised as the first annulus. Thus
a fish which has completed one year would haw a central transparent area followed by a broad opaque band and a narrow transparent line. The number
of annuli, therefore indicate the age of fish in years. In fish the age determination from otolith reading were based on the assumption that growth rings on
the otolith are laid down annually. There is no absolute proof available that this
is true (Graham 1929). In -the present case, the formation of transparent lines
at the edge of the bones has not been found to be restricted to any particular
time of the year. This may also be related to the fact that the fish has been
found to spawn in April-Miay and in November-December which periods may
also be extended on either side. The range in length and mean length of fish
at each age group arrived at by the study of seasonal marks on a cledthniin and
on suproaccipital crest are given in Table 14. Fish in the 0-year group ranged
in size from 66 to 103 mm, one year group from 78-120 mm, second year group
from 88-145 mm, the third year group from 100-149 mm, fourth year group
from 119-158 mm; and fifth year from 143-148 mm. The mean length at the
end of first year has been found to be 99 mm, at the end of second year 114
mm, at the end of third year 128 mm, at the end of fourth year 138 mm and
at the end of fifth year 145 mm.
Growth rate and life span: While it has not ben possible to trace the progress
of modes in length-frequency curves for the determination of growth rate in
180
JAMES AND BADRUDEEN
view of the discontinuity of the data, some conclusions on the rate of growth
can be drawn from the study of seasonal marks formed on the supraoccipital crest
and cleithrum. From table 14 it is evident that growth rate in first year is
quite rapid, decreasing gradually on the following years. It should be mentioned
here that adequate number of fish were not available to fix the mean size of
fourth year classes precisely.
The maximum size of the fish recorded in the present study was 161
mm. Since average length of five year old fish has been found to be 145 mm
(Table 14), such fish, according to the study of the seasonal marks formed on
the bones should be five years old. Therefore, the life span of the species may
be fixed at five years.
TABLE
Age
group
0
1
2
3
4
5
14. Length range and mean length of L. dussumieri at each age group
No. of
fish
45
90
78
43
6
2
Range in
length (mm)
66-103
78-120
88-145
100-149
119-158
143-148
Mean length
(mm)
85
99
114
128
138
145
Growth
increment per
year (mm)
—
15
14
10
7
FISHERY
Of the 16 species of silverbellies occuring in Palk Bay and the Gulf of
Mannar, L. jonesi contributes to the bulk of the catches. Other species common in this area are L. brevirostris, L. dussumieri, Gazza minuta and Secutor
ruconius. Generally, L. dussumieri has been found to be the dominant in the
Gulf of Mannar, compared to its occurrence in Palk Bay. Within the Gulf of
Mannar, the catches of L. dussumieri are more' .important from deeper water
(20-40 metres) than shallow waters. Larger fishes (120 to 145 mm) are obtained
from deeper waters.
The size range of L. dussumieri from commercial catches was found to
be from 57 to 145 mm with the 93-117 mm size group dominant. Since the drift
gillnets have large mesh (25.60 mm), juveniles of his species were not recorded
from this gear. The trwal catches from deeper waters do not include the juveniles
indicating their absence in that region.
This species is captured in the area both by drift gillnet and trawlnets. Bulk of the catches are landed by trawl nets during the period NovemberMarch. This fish is also known to move in schools occasionally, but it is usually
catpured with other silverbellies. The data on food and feeding habits of this
species indicate that this species prefers a sandy, coral-sandy area rather than
muddy areas.
BIOLOGY AND FISHERY OF SILVERBELLY
181
The life span of the species is estimated to be five years, the maximum
size recorded in the present study being length 161 mm. Since the commercial
catches are dominated by fish 93-117 mm size, the 0-year, one year and two
year old fish mainly support the fishery. Since the species is short lived and
breeds by the time it is one year old and since the present method of exploitation leaves enough brood to replenish the future stocks, it is advisaible to catch
the fish of all sizes for the best utilization of the resource, Sinoe the larger fishes
are known to be found in deeper water, exploitation of this fish in deeper water
in the Gulf of Mannar is likely to increase the catch of this species.
ACKNOWLEDGEMENTS
The authors are thankful to Mr. R. Thiagarajan for help in statistical
analyses of data and to Mr. M. Najumuddin for the preparation of figures.
REFERENCES
ARORA, H. L. 1951. A contribution to the biology of Sivair-bellies. Leiognathus splendens
(Cuv) Scot It Proc. Indo Pacific Fish coun. 1-6.
BALAN, V. 1963. Bioilogy of the Silverbelly Leiognathus bindus (Vail) of the Client coast.
Indian. J. Fish. 10: MO-134.
CHACKO, P. 1. '1944a. The Silverbeillies of Pamban Proc. 31i« Indian Sci. Congr. 86
CHACKO, P. 1.
1944b.
On the Bionomics of the LeiiognatMdae Curr. Sci. 13(8).
CHACKO, P. I. 1949. Food and feeding habits of the Mies, of the Gulf of Manner
Proc. Indian Acad. Sci. 29(3): 83-97.
CLARK, P. N. 1924. Maturity of the Caffifarnfe sardine (Sardine caerulea) determined
by ova-dliameter measurements Fish. Bull. Sacremento 42: 7-49.
DE JONG, J. K. 1940. A prelirnlinairy investigation of the spawning habits of the fishes
of the Java sea. Treubia 17: 307-330.
GRAHAM, M. 1929. Studies of age determination in fish Part II. A survey of literature
Fish. Invest. London Ser., 11(2): 1-50.
HYNES, H. B. N. 1950. The food of fresh water strickle backs (Casterosteus aculeatus
and Pygosteus pungitius) with a review of methods used in studies of the food of
fishes /. Arim Ecol. 19: 36-58.
HICKLING, C. F. AND E. RUTENBERG. 1936. The ovary ;«s an indicator of spawning period
of fishes, ;. Mar. Biol. Ass. U.K.. 21: 311-317.
JAMES, P. S. B. R. AND CLEMENT ADOLF.
1965.
Observat.'on on trawl fishing in the Palk
Bay and Gulf of Mannar in variniity of Maindtapani Indian J. Fish., 12(2). 350-545.
JAMES, P. S. B. R. il9G8. Leiognathus leuciscus (Gumther) and L. smithursti (Ramsay and
Ogilly) Family: I^>i©gmaithMiae; Pisces - Two new records from Indian Sea. J. Mar.
Biol. Ass. India 9(2): 300-302.
JAMES, P. S. B. R. AND M. BADRUDEEN. 1968. On certain anomalies in the fishes of the
family Leitognatihidae /. mar. biol. Ass. India., 10(1): 107-113.
JAMES, P. S. B. R. 1969, A new species of S'lvertoeilly Leiognathidae jonesi sp. nov.
(Family: Leiognaithidae Pisces) from the Indian seas. /. mar. biol. Ass. India, 11(1
and 2): 316-319.
182
JAMES AND BADRUDEEN
JAMES, P. S. B. R. 1971. On the occurrence of blue-green ulgae of fishes of the family
Leiognaitihidae /. mar. biol. Ass. India, 13'(1): 133-135.
JAMES, P. S. B. R. il973. The fishery potential of Silvenbellies Proc. Sym. living Resources
of the Sea around India pp. 439-444 Spl. Publ. Central Marine Fisheries Research
Institute, Cochin.
JAMES, P. S. B. R. AND M. BADRUDEEN. 1975. Bblogy and fishery of Leiognathus hrevirostris (val) from the Pailk Bay and the Gulf of Mannar. Indian J. Mar. Sci.,
4(1): 50-59.
JAMES, P. S. B. R. 1975. A systematic review of the fishes of the family Leiognathidae,
J. mar. biol. Ass. India 17(1): 1318-172.
JAYABALAN, N. K., DHEVENDRAN AND K. RAMAMURTHY.
1978.
Occurrence of symbiotic
Bioiluminescent bacteria in Indian LefogrMthidoe. Ciirr. Sci. 17(47) 648-649.
KESTEVAN, G. L. 1947. On the ponderal index or condition factor as employed in fisheries
biology Ecology 17: 78^80.
KRISHNAMURTHY, B. 1957. Fishery resources of the Raimeswaram Island. Indian J. Fish
4: 229-223.
LE CREN, C, D. 1951. The length-weight reiaitilonsibip and seasonal cycle is gonad weights
and condition of the perch Perca ftuviatilis. J. Anim. Ecol. 20: 20-219.
MAHADEVAN, S. 1958. Report on the 'KaairiaT Leiognathus spp. and Gazza minuta fishery
of Raimeswairaim Island to the Gulf of Manna and Palk Bay. Proc. 4th Indian Sci.
Cong. Part III abstract No>. 91.
MAHADEVAN PILLAI, P. K. 1972. Fecundity and spawning habit of some Silver bellies
Indian. Fish 19: 196-199.
MENON, M. D. 1950. Tse use of bones otiheir than otoliths in determining the age and
growth naite of fisheis. /. Cons. Int. Explor. Mer. 16: 311-335.
MENON, M. D. 1952. The determination of age and! growth of fishes of tropical and
subtropical wateirs. Journ. Bombay. Nat. Hist. Soc., 51: 625^635.
* PETERSEN, C. G. J. 1892. Ftistombiolagiske forhold i Hoibonk Fjord, 1«90-91. Beret.
Dan. Biol. St. 1*90(91), 1: 12M83.
PRABHU, M. S. 1956. Miatuir.toon of initraHOvarian eggs amid spawning periodicities in some
ffeh:s. Indian J. Fish., 3: 59-90.
PILLAY, T. V. R. 1952.
India, 4: 185-200.
A critique of the method of study of food of fishes. /. Tool. Soc.
RIANISINOH AND P. K. TALWAR. 1978a. On the little known ponny fish, Gazza achlamys
Jordan and Starks (pieces: LeJognath&diae) in the Indian waters. Curr. Sci., 23 (47):
930-931.
RANISING AND TALWAK, P. K. 19718b. On a new species of sdlvar belly, Leiognathus indicus
(Pisses: Leaognaithiidae) from the Bay of Bengal. Bull Zool. Stir. India. 1(3) 275-277.
SATYANARAYANA RAO, K. 1968. Reproductive and lipid levels of Leiognathus splendens
(Cuv) /. Mar. Biol. Ass. India 9(2): 302-322.
VENKATARAMAN, G. AND M. BADRUDEEN. 1974. On the diurnal variation in the catches
of silver bellies in the Palk Bay. Indian. J. Fish., 2(1): 254-265.
VENKATARAMAN, G. 1960. Studies on the food and' feeding relationship of the inshore
fishes off Calicut on the Mafcubair Cotast Indian J. Fish., 7: 275-306.
*
Original not referred.


© Copyright 2026