
- UTAR Institutional Repository
INVESTIGATION OF ALTERNATIVE INGREDIENTS FOR THE
REPLACEMENT OF FISH MEAL IN FORMULATION OF FEED FOR
MALAYSIAN MAHSEER FINGERLINGS, TOR TAMBROIDES
By
WAN MEI SZE
A dissertation submitted to the Department of Mechatronics and BioMedical
Engineering,
Lee Kong Chian Faculty of Engineering and Science,
Universiti Tunku Abdul Rahman,
in partial fulfillment of the requirements for the degree of
Master of Science
January 2015
i
DEDICATION
I would like to dedicate this thesis to my family, who has always been
supportive without judgment of what I am doing or have done, and to both my
supervisors who have steered me on the right path throughout these years. I
would have been nothing without these people in my life.
ii
ABSTRACT
INVESTIGATION OF ALTERNATIVE INGREDIENTS FOR THE
REPLACEMENT OF FISH MEAL IN FORMULATION OF FEED FOR
MALAYSIAN MAHSEER FINGERLINGS, TOR TAMBROIDES
Wan Mei Sze
Demand for fish meal (FM) has resulted in dwindling trash fish stocks, which
caused the rising cost of feed. As awareness for the environment increases,
much research has been performed on utilization of alternative protein
sources. This research aims to substitute FM with agriculture by-products in
an attempt to produce a sustainable diet for the growth and nutrition of Tor
tambroides. The alternative protein sources used for diet formulation were
krill, anchovy head and chicken offal (CO), from animal protein origins; soy
waste and palm kernel cake (PKC), from plant protein origins. Nutrient
analysis was conducted on all ingredients and diets; digestibility trials and a
preference test were used to screen for the most preferred alternative protein
sources, which were CO and PKC. Substitution level with CO was set at 33%,
66% and 100%, whereas PKC was at 16.5%, 33% and 50% of the total FM
content in the experimental diets. The amino acid and fatty acid contents of the
muscle and liver samples were determined at the end of the growth studies. A
FM diet was used as the control to determine the performance and efficiency
of the experimental diets in a 6-month growth study using T. tambroides
fingerlings. Specific growth rate (SGR) did not differ between diets although
iii
there were significant differences between the amino acids and fatty acids
content in the muscle samples of fingerlings from the control diet and
experimental diets. The best substitution levels of FM in the diets were found
to be at 100% CO and 33% PKC. All fingerlings had a good relative condition
factor after consuming the experimental diets, proving that fish meal could be
substituted successfully in diets for T. tambroides fingerlings.
iv
ACKNOWLEDGEMENT
I would like to extend my gratitude to Universiti Tunku Abdul Rahman for
providing the research grant (UTARRF 6200/L22) which was utilized in my
research, as well as my supervisors, who were very patient and relentless in
their guidance and quest for knowledge.
My parents who never gave up on me, my relatives who continually impart
words of encouragement, my friend Stephen who listens without complaint,
my laboratory partners Grace and Poh Lin who make life in the lab interesting,
the laboratory officers who are always willing to lend a hand, as well as my
friends who either provided me with accommodation in Kampar, or followed
me to the fish farm every week for feeding and measurements in KL, deserve
my eternal gratitude for putting up with me.
A special shout out goes to my arms, for always being by my side, my legs for
supporting me, my fingers and toes because I can always count on them.
v
APPROVAL SHEET
This
dissertation
entitled
“INVESTIGATION
OF ALTERNATIVE
INGREDIENTS FOR THE REPLACEMENT OF FISH MEAL IN
FORMULATION
OF
FEED
FOR
MALAYSIAN
MAHSEER
FINGERLINGS, TOR TAMBROIDES” was prepared by WAN MEI SZE
and submitted as partial fulfillment of the requirements for the degree of
Master of Science at Universiti Tunku Abdul Rahman.
Approved by:
___________________________
(Dr. Loo Joo Ling)
Date: 19th January 2015
Assistant Professor/Supervisor
Department of Mechatronics and Biomedical Engineering
Lee Kong Chian Faculty of Engineering and Science
Universiti Tunku Abdul Rahman
___________________________
(Dr. Tang Pek Yee)
Date: 19th January 2015
Assistant Professor/Supervisor
Department of Mechatronics and Biomedical Engineering
Lee Kong Chian Faculty of Engineering and Science
Universiti Tunku Abdul Rahman
vi
FACULTY OF ENGINEERING AND SCIENCE
UNIVERSITI TUNKU ABDUL RAHMAN
Date: _19th January 2015_
SUBMISSION OF THESIS
It is hereby certified that _____WAN MEI SZE_____ (ID No:
_10UEM06891 ) has completed this thesis entitled “INVESTIGATION OF
ALTERNATIVE INGREDIENTS FOR THE REPLACEMENT OF FISH
MEAL IN FORMULATION OF FEED FOR MALAYSIAN MAHSEER
FINGERLINGS, TOR TAMBROIDES ” under the supervision of _DR LOO
JOO LING (Supervisor) from the Department of Mechatronics and
BioMedical Engineering, Lee Kong Chian Faculty of Engineering and
Science, and _DR TANG PEK YEE_ (Co-Supervisor) from the Department of
Mechatronics and BioMedical Engineering, Lee Kong Chian Faculty of
Engineering and Science.
I understand that University will upload softcopy of my thesis in pdf format
into UTAR Institutional Repository, which may be made accessible to UTAR
community and public.
Yours truly,
_____________
(Wan Mei Sze)
vii
DECLARATION
I, WAN MEI SZE, hereby declare that the thesis is based on my original work
except for quotations and citations which have been duly acknowledged. I also
declare that it has not been previously or concurrently submitted for any other
degree at UTAR or other institutions.
_______________
(WAN MEI SZE)
Date _19th January 2015_
viii
TABLE OF CONTENTS
Page
DEDICATION
ABSTRACT
ACKNOWLEDGEMENT
APPROVAL SHEET
SUBMISSION SHEET
DECLARATION
LIST OF TABLES
LIST OF FIGURES
LIST OF ABBREVIATIONS
CHAPTER
ii
iii
v
vi
vii
viii
xi
xii
xii
1.0
INTRODUCTION
1
2.0
LITERATURE REVIEW
2.1
Aquaculture in Malaysia
2.2
Tor tambroides
2.3
Conventional Protein Source for Fish Feed
2.4
Alternative Protein Sources
2.4.1 Plant Protein Sources
2.4.1.1 Corn Gluten Meal
2.4.1.2 Soybean Meal
2.4.1.3 Sunflower Meal
2.4.1.4 Palm Kernel Cake
2.4.1.5 Seaweed Meal
2.4.1.6 Kenaf meal
2.4.1.7 Guar Seed Meal
2.4.2 Animal Protein Sources
2.4.2.1 Poultry Byproduct Meal
2.4.2.2 Krill Meal
2.4.2.3 Squid Meal
2.4.2.4 Blood Meal
8
8
10
12
14
15
15
16
18
19
20
22
23
24
24
25
26
27
3.0
MATERIALS AND METHODS
3.1
Preparation of Ingredients
3.2
Nutrient analysis
3.2.1 Crude protein
3.2.2 Crude Lipid
3.2.3 Crude Fiber
3.2.4 Crude Ash
3.2.5 Mineral Content
3.2.6 Amino Acid Analysis
29
29
29
30
31
32
33
33
34
ix
3.3
3.4
3.5
3.2.7 Fatty Acid Analysis
Digestibility Trials
3.3.1 Formulation of Experimental Diets
3.3.2 Feeding of the Fingerlings
Growth studies
3.4.1 Formulation of Experimental Diets
3.4.2 Feeding of the Fingerlings
3.4.3 Sampling Procedure
Statistical Analysis
36
37
37
40
41
41
44
44
46
4.0
RESULTS
4.1
Nutrient Analysis
4.1.1 Proximate Analysis for Individual Ingredients
4.1.2 Proximate Analysis for Digestibility Trial Diets
4.1.3 Proximate Analysis for Growth Study Diets
4.2
Diet Digestibility
4.3
Growth Performance
4.4
Amino Acid Composition
4.5
Fatty Acid Composition
47
47
47
48
49
51
52
54
58
5.0
DISCUSSION
5.1
Digestibility Trials
5.2
Growth Studies
5.3
Amino Acid Analysis
5.4
Fatty Acid Analysis
5.5
Future studies
67
67
71
79
82
85
6.0
CONCLUSION
88
BIBLIOGRAPHY
90
x
LIST OF TABLES
Table
3.1
3.2
3.3
3.4
3.5
4.1
4.2
4.3
4.4
4.5
4.6
4.7
4.8
4.9
4.10
4.11
4.112
Page
Wavelengths (nm) used for detection of the
minerals
Gradient program for amino acid analysis
GC conditions for fatty acid analysis
Composition of experimental diets for digestibility
trials
Composition of experimental diets for growth
studies
Nutrient composition of the individual ingredients
(g/100 g)
Nutrient composition of experimental diets in
digestibility trial (g/100 g)
Nutrient composition of the experimental diets in
growth study (g/100 g)
Mineral content of the experimental diets in growth
study (g/100 g)
Apparent digestibility coefficient values in
percentage and preference for the experimental
diets
Growth and diet utilization efficiency of the
fingerlings
Length-weight relationship and the relative
conditioning factor of the fingerlings
Amino acid analysis of feed samples (g/100 g dry
sample)
Amino acid analysis of muscle samples (g/100 g
dry muscle)
Fatty acid analysis of diet samples (g/100 g lipid
sample)
Fatty acid analysis of muscle samples (g/100 g
lipid sample)
Fatty acid analysis of liver samples (g/100 g lipid
sample)
xi
34
36
37
39
43
48
49
50
51
52
53
54
56
57
61
63
65
LIST OF FIGURES
Page
Figure
1.1
3.1
The reported aquaculture production in Malaysia
from 1950
Measurement of standard length and total length
xii
3
45
LIST OF ABBREVATIONS
AA
Arachidonic acid
ADC
Apparent digestibility coefficient for protein
ADM
Apparent digestibility coefficient for dry matter
ALA
α-linolenic acid
ANOVA
Analysis of variance
ASEAN/US CRMP
Association of Southeast Asian Nations/United States
Coastal Resources Management Project
DHA
Docosahexanoic acid
EPA
Eicosapentanoic acid
FAME
Fatty acid methyl ester
FAO
Food and Agriculture Organization of the United
Nations
FCR
Feed conversion ratio
FMOC-Cl
Fluorenylmethyloxycarbonyl chloride
GC-FID
Gas chromatograph with a flame ionized detector
GLA
γ-linolenic acid
H2SO4
Sulfuric acid
HCl
Hydrochloric acid
HMSO
Her Majesty's Stationery Office
HNO3
Nitric acid
HPLC
High performance liquid chromatography
xiii
IENICA
Interactive European Network for Industrial Crops
and their Applications
LIST OF ABBREVIATIONS (CONT.)
LA
Linoleic acid
MUFA
Monounsaturated fatty acid
n-3 fatty acid
Omega-3 fatty acid
n-6 fatty acid
Omega-6 fatty acid
NaH2PO4
Sodium phosphate
NaOH
Sodium hydroxide
OECD
Organisation
for
Economic
Co-operation
Development
OPA
o-phthaldialdehyde
PER
Protein efficiency ratio
PUFA
Polyunsaturated fatty acid
SEM
Standard error of mean
SFA
Saturated fatty acid
SGR
Specific growth rate
UNEP
United Nations Environment Programme
UPM
Universiti Putra Malaysia
xiv
and
CHAPTER 1
INTRODUCTION
Human and marine life stock both depend on wild stock fish as food.
Lately, investment of modern fishing fleets and processing factories are used
to take advantage of the force behind this division of the food industry, in a
natural reaction to cater for the increasing global requirements for fish and
fishery products. The doubling in increased fish consumption in the
developing countries since the 1970s (Delgado et al., 2003) is contributing to
the collapse of natural fish stocks where it is caused by factors such as illegal
fishing, unfair fishing and over-fishing. Thus, to combat these problems faced
by the fishing industry, many are turning to aquaculture for a more reliable
and steady supply of fish as food.
Aquaculture comprises of a very wide range of farming practices,
many which involve seaweeds, mollusks, crustaceans and fish, where different
environments, systems and resource patterns are being involved and utilized,
thus which offer many farmers an option to be able to diversify and to enhance
food production and generate incomes from different revenues (Hewitt,
Campbell and Gollasch, 2006). One of the fastest growing food production
systems globally is aquaculture, at an average increase of 8.8% per year since
1950 (FAO, 2006a), where world fish food supply steadily increased 3.2% per
year (FAO, 2012) with China being the major contributor at 12.4% (Merino et
al., 2012).
1
FAO (1997) hoped that aquaculture will continue to increase the
contributions to food security and alleviate poverty in many third world and
developing countries. Yields from many capture fisheries have been stagnant
at a total of 85 million tons, yet demand for fish and fishery products still
increases, thus there is much eagerness for aquaculture to increase its
involvement to the global production of aquatic foods (Finegold, 2009).
Capture fisheries and aquaculture, combined, supplied the world with about
154 million tons of food fish in 2011, and out this of total, aquaculture
accounted for 41%. In this 41%, 56.4% of cultured fish consists of freshwater
fish (FAO Fisheries and Aquaculture Department, 2012).
Aquaculture in Malaysia began in the 1980s, starting at a production of
14, 863 tons (Department of Fisheries, 2009). Current schemes in the country
like the Zone Industry Aquaculture High Impact Project as well as the e-Kasih
Program have been launched to increase commercial aquaculture production
by the public. Loans have been offered by established financial institutions
with low interest rates to attract those looking for a boost in the industry (Idris
et al., 2013). Figure 1.1 shows the statistics for aquaculture production in
Malaysia since 1950 (FAO Fishery Statistic, 2008).
2
Figure 1.1: The reported aquaculture production in Malaysia from 1950
(FAO Fishery Statistic, 2008)
Compared to traditional aquaculture systems, intensive and semiintensive aquaculture systems use up to five times more wild fish products
which are fish meal and fish oil based to supply the aquaculture industry, than
is produced in the form of farmed fish (Naylor et al., 2001). Competition is
also raging between aquaculture and the livestock sector for fish meal for
feeds (FAO, 2006a). All these actually add to the burden on the wild stocks,
and even without any new types of feed ingredients, aquaculturists’ demand
for wild fish will still grow as aquaculture continues to boom (Goldburg and
Naylor, 2005). In order to sustain aquaculture, wild trash fish are farmed for
fish meal. It is a cycle where aquaculture is used to reduce stress on wild fish,
yet wild fish are used to feed the growing aquaculture market, where it is
estimated three kilograms of wild caught fish are needed in order to produce
one kilogram of farmed fish for consumption (Food & Water Watch, 2011).
3
Global fish meal usage reached a high of 4.2 million tons in 2005, but
dropped to 3.8 million tons in 2007, and was stable at 3.6 million tons in 2011,
and it is predicted that the usage will further reduce in 2015 due to stricter
regulations and increased prices (Tacon, Hasan and Metian, 2011). Malaysia
produces her own fish meal, estimated at 48, 200 tons in 2007, but only 40%
of this fish meal is generated from fish byproducts, meaning a whopping 60%
are still made up from whole fish (Jackson, 2009). In spite of the reducing
global fish meal demand, the price of fish meal in 2012 hit USD 1, 500/MT
(RM 4, 900), and is expected to remain so until at least 2022 (OECD/FAO,
2013).
The cost of feeds and feeding in aquaculture usually accounts from
between 30% to 60% of the total production cost (Chong, 1992), of which
45% of the total cost is allocated to protein sources, namely fish meal (Asgard
et al., 2007). In 1995, global fish feed demand was only a total of 7.6 million
tons. However, in 2010, the demand for fish feed hit 35.3 million tons, where
a five-fold increase had taken place, and 30% of the feed was used mainly in
carp culturing. This demand is estimated to double in 2020 to an astounding
demand of 70 million tons (Tacon, Hasan and Metian, 2011). The fish feed
production and demand in Malaysia in 2009 was calculated to be at 226, 000
tons, and is expected to rise further in the next decade (Aquaculture Asia
Pacific, 2010).
Fish meal is usually incorporated in fish feed at different levels for
carnivorous fishes. It currently the most essential dietary protein source in
4
most of the industrially produced aquafeeds (Anwahi, Cherian and Al-Janahi,
2008). Fish meal of high quality could contain up to 72% crude protein by
weight. From a nutritional viewpoint, it is the most preferred animal protein
supplement in the diets of farmed animals, and is often the key source of
protein in feeds for fish and shrimp. Typical diets for fish typically contain
from about 32% to 45% total protein by weight (Miles and Chapman, 2006).
Tor tambroides, locally known as the kelah, empurau or Malaysian
mahseer, is economically valuable as game (Lim, 2006), ornamental (AgroBiotechnology Institute Malaysia, 2013), and as food. The kelah is also one of
the relatively expensive freshwater river fish in Malaysia, costing up to USD
100 (RM 330) per kilogram as food fish, both locally and internationally
(Devindran, 2011). The fish is highly prized by anglers, commercial fishermen
and poachers, each whom through relentless hunting is causing the reduction
in T. tambroides population in the wild.
Reduction of natural habitats through soil erosion and dry weather,
coupled with increased fishing pressure is causing the declination of T.
tambroides (Baird & Mean, 2005; Government of Sarawak, 2007).
Deforestation, in the name of development, and consisting of land clearing as
well as timber harvesting activities upriver, has endangered the habitat of these
valuable species (Seet, 2010). Eutrophication from sewage, and siltation
caused by deforestation, has also resulted in the decrease of production and
biodiversity of T. tambroides (Yusoff, 2007). To counter the declining
numbers, T. tambroides is fast gaining popularity as a cultured fish for
5
conservation and food, which leads to the desperate need of a local feed that is
suitable for the fish.
Kaushik et al. (2004), Wang et al. (2006) and Ahmed et al. (2008),
have conducted studies on fish feed for the Nile tilapia, cuneate drum and
European sea bass respectively, to produce a feed from local foodstuff or
waste products that have economical values. Such feed for the Malaysian
mahseer has not yet been extensively studied in the previous years and as a
slow growing fish, there is an urgency to search for the optimal feed to
accelerate growth of the Malaysian mahseer, especially in the commercial
sector, although it has been determined that the mahseer needs a high protein
and carbohydrate diet (UPM, 2013). Malaysia, as the fourth biggest exported
of palm oil, produces ample of waste or byproducts, such as palm kernel cake
that could be utilized as ingredients for the aquaculture feed industry.
Byproducts from the poultry processing plants namely chicken offal is also
viable and available as alternative ingredient for feed in the form of chicken
offal powder.
As awareness for sustainability increases, more demand is being placed
on using natural and locally produced feed consisting of vegetable proteins,
waste products or foods that are available in abundance; in place of the
conventional animal proteins (fish meal) which are dwindling. Alternative
proteins have long been used to supplement aquaculture feed, and much
research is done to determine the best possible fish meal substitutions in an
effort to further reduce the usage of fish meal. Regardless, research on
6
alternative proteins for T. tambroides is relatively scarce; therefore this project
was carried out with several objectives in mind:
•
To investigate the potential of different alternative protein from plant
and animal sources, to replace conventional fish meal for the growth
and nutrition of T. tambroides.
•
To formulate a sustainable diet using the selected alternative protein
sources as fish meal replacement for the growth and nutrition of T.
tambroides
•
To determine the quality and performance of the diets formulated from
alternative protein sources with that from fish meal.
•
To identify the optimum inclusion levels for each type of alternative
proteins and comment on the possibility of usage of an alternative
protein source in diets for T. tambroides in aquaculture.
7
CHAPTER 2
LITERATURE REVIEW
2.1
Aquaculture in Malaysia
Aquaculture in Malaysia is considered to be one of the more
significant sectors in agriculture, although not yet being as established as our
neighboring countries, such as Thailand, Philippines and China. It started off
with the freshwater culturing of the carp species, and progressed with marine
shrimp and blood cockles (Anadara granosa) culture in the peninsula (FAO
Fishery Statistics, 2008). East Malaysia’s aquaculture sector started later, in
the 1990s (Hamdan et al., 2012). The three aquaculture types in Malaysia
currently are the freshwater, brackish water and marine aquaculture, with the
brackish water and marine aquaculture comprising of 74% of the total
aquaculture sector, and freshwater aquaculture at 26% in 2003 (WorldFish
Center, 2006). However, the distribution has changed drastically as in 2012,
where freshwater aquaculture took up the most of the sector at 77%, while the
brackish and marine aquaculture has reduced to 23% (Department of Fisheries
Malaysia, 2012).
Marine aquaculture makes up 23% of seafood production in Malaysia
(Chowdhury and Yahya, 2012), the most popularly cultured species including
the grouper family and Asian sea bass, where the grouper is regularly exported
to countries such as Hong Kong and China (Ransangan et al., 2013). Brackish
water ponds are usually used for culturing of species such as the sea bass,
8
grouper, snapper, sea perch, tiger shrimp and white shrimp through cage
farming, generating up to USD 1, 000, 000 revenue for farmers (ASEAN/US
CRMP, 1991; Idris et al., 2013; Ramzani, Ismail and Abdurofi, 2013).
Freshwater aquaculture is normally conducted in mining pools, earthen ponds
and reservoirs, where the most commonly cultured species include the tilapia,
the carp family, various species of catfish, sultan fish, gourami and the large
freshwater prawn (ASEAN/US CRMP, 1991; Kechik, 1995; FAO, 2007,
Department of Fisheries Malaysia, 2012).
Malaysia has a relatively small aquaculture sector, compared to the
other Southeast Asia countries, but consumption of fish in Malaysia per capita
is estimated to be three times higher than the global average, at 55 kg/year
(FAO, 2006b; FAO, 2008). Feed is widely available for aquaculture; however,
the cost is the restraining factor. With feed costing up to 80% of total costs for
tilapia, or 50% for sea bass and shrimp culture, aquaculture is an expensive
sector to sustain the food demand, yet Malaysians rely heavily on aquaculture
for animal protein (Hishamunda et al., 2009). Efforts by the government to
look for alternative ingredients started more than 10 years ago, to obtain local
ingredients essential in producing quality feed products (Subasinghe et al.,
2002). These efforts have been embarked in The Third National Agricultural
Policy that emphasized development of aquaculture through sustainable
utilization of natural resources (Ng et al., 2013).
Malaysia’s Third National Agricultural Policy identified the tilapia
(Oreochromis niloticus) as the major species for freshwater aquaculture
9
(WorldFish Center, 2006), gaining popularity besides others such as the
different
carp
species
(Cyprinus
carpio,
Ctenopharyngodon
idella,
Aristichthys nobilis and Hypophtalmichthys molitrix) and the barb (Puntios
gonionotus) (Pathansali, 1976). The most popular species for marine
aquaculture is the sea bass (Lates calcarifer) (Kechik, 1995), nevertheless, the
grouper family (Epinephelus fuscoguttatus, Cromileptes altivelis, Epinephelus
malabaricus, Epinephelus coioides and Epinephelus sexfasciatus) is gaining
recognition as the demand from both local and international markets grow
(Othman, 2008). Besides fish, marine shrimp such as the black tiger shrimp
(Penaeus monodon) along with the white shrimp (Litopenaeus vannamei) are
both commonly cultured due to their fast growth, despite L. vannamei being
banned until up to 2005 (Othman, 2008).
2.2
Tor tambroides
T. tambroides is a well known sport fish in Southeast Asia that belongs
to the family Cyprinidae, and this family dominates the rivers found in
Southeast Asia and parts of Asia, including Thailand, Indonesia, India,
Vietnam, Cambodia and et cetera. They prefer the rocky bottom streams that
are clear and swift flowing during the dry season, while seeking shelter in
slack water during the rainy season (Lee, Ling and Adha, 1999). Nevertheless,
the mature mahseers prefer a deeper, slightly slower running and more turbid
water than the juveniles. The distribution of the mahseer has been suggested to
also be dependent on the temperature of the water (Desai, 2003). Spawning
happens uphill of streams, and is generally around July and August.
10
Nonetheless, the females can be induced to spawn, given the appropriate
environmental stimuli such as heavy rains (Kunlapapuk and Kulabtong, 2011).
As poaching is a constant threat to the survival of the mahseer, the
Malaysian government has implemented bans in several states, preventing the
removal of the fish, and harsher still, inhibiting fishing in order to preserve
and conserve the fish. The earliest state to be involved in the fishing ban was
Perak in 1994, followed by Johor, Pahang, Kelantan, Terengganu and Kedah.
The government decided to lift the ban in Terengganu in 2009, although
anglers are still prohibited from keeping the fish, and a catch-and-release
system was enforced by the locals (Leong, 2003; The Star, 2006; Bernama
Media, 2012). In 1992, the Malaysian government realized the appreciation of
the mahseer by the locals in terms of food fish, and has consideration its
potential in aquaculture (Ismail, 1992).
In the wild, T. tambroides is slow-growing and can take up to a year
just to reach 500 to 600 g (Ng, C. K., 2004) and pilot trials in ponds using
captive-bred fish showed that an average weight of 790 g (range 390 g to 1200
g) could be reached by three years of age (Ingram et al., 2007), although some
reported a growth of only 200 g in the first year. Since fish of one to two kg
are usually the ideal serving sizes in restaurants, the T. tambroides may require
a prolonged grow-out period. Reproduction maturity is based on the size and
weight of the mahseer, with males and females weighing 2.5 kg and 3.9 kg,
and measuring 60 cm and 70 cm respectively (Kunlapapuk and Kulabtong,
11
2011). Currently hormonal procedures are relied on to induce spawning, where
the males and females are housed in tanks at a 1:1 ratio (Ingram et al., 2005).
The Malaysian mahseer is an omnivorous creature, feeding on natural
jungle fruits and nuts, insects and their larvae, small fishes and crustaceans,
tadpoles and sometimes even small frogs (Chan, 2009). Their favorite foods
include the local forest fig (ara or Ficus auriculata), and engkabang (Shorea
macrophylla) (Chan, 2009; UPM, 2013). Popular foods used in the fishing of
T. tambroides are usually ripe palm kernels, worms, small prawns and
sometimes slightly rotten and fermented tapioca roots. In captivity, adult
mahseers are usually fed commercial feeds containing high levels of animal
protein, while being supplemented with the local fig and engkabang (Bista et
al., 2002; The Borneo Post, 2011).
2.3
Conventional Protein Source for Fish Feed
The conventional protein source for fish feed is fish meal. Fish meal is
obtained after cooking, pressing, drying and milling fresh raw or trash fish and
fish trimmings. It can be made from practically any type of seafood, but is
most commonly manufactured from wild-caught, but small, marine fishes
which are usually considered not suitable for direct human consumption
(Schipp, 2008). Sugiyama, Staples and Funge-Smith (2004) define trash fish
as the portion of catch that has almost no value based on their small size or
lack of consumer partiality. Juveniles of fish species of commercial interest,
juveniles and adults of lesser known food fish species, species of minor
12
importance and spoilt fishes that are of high value species make up what is
known as trash fish (Edwards, Le and Allan, 2004; Malvas, 2005).
In Malaysia, there is currently no particular sector in the fishing
industry specific for catching trash fish. Currently the west coast of peninsular
Malaysia is the dominant provider of trash fish, as compared to the east coast,
and East Malaysia. Although the contribution of trash fish from the west coast
declined from 85% in 1987 to 60% in 2003, the other coasts of Malaysia have
contributed to increasing amounts of trash fish, the east coast producing an
estimate of 30% from a previous of 5%, and East Malaysia with a rising trend
of 15% from 5% (Che Musa and Nuruddin, 2005). Trash fish capture from
trawlers in the west coast of Peninsular Malaysia consists of up to 65% of the
total catch (Chowdhury and Yahya, 2012).
Fish meal in Malaysia is made up from several different kinds of local
marine fish, such as the scad, mackerel, sardine and tuna, to name a few
(Leadbitter, 2011). In 2012, there was a call to ban the usage of fish meal in
aquaculture feeds, due to the pressure exerted on the marine ecosystem where
trash fish was heavily harvested to feed the fish meal market (Small Scale
Fisheries, 2012), where was calculated more than five kg of wild caught fish
was be needed just to produce one kg of farmed fish (Schipp, 2008). However,
the juvenile species such as the sea bass still require fish meal as part of their
feed (Merican, 2012); therefore the fish meal ban might not be viable, until
more research is conducted.
13
2.4
Alternative Protein Sources
About two decades ago, aquaculture was considered an unimportant
user with an estimate annual 10% usage of fish meal. And as the industry is
growing at an increase of three million tons per year (FAO Fisheries and
Aquaculture Department, 2010), stress made on fish meal as the main
ingredient in fish feed is also increasing. To continue to provide for this rate in
the industry, alternative ingredients are needed to substitute and reduce
pressure on fish meal, while still supplying the nutrients needed for fish
development. Animal waste products, seafood processing waste, and plant
waste products are viewed as ingredients with the most potential as alternative
ingredients (Hardy, 2000).
Non-conventional feed resources, or alternative protein sources, are
recognized for a few factors. Firstly they are non-competitive, whether as a
resource for humans or animals, and since the demand is in a completely
different sector, the cost is reduced, thus contributing to a final lower-costing
feed. Secondly, because they are the recycled material in the form of
byproducts or waste from different agriculture sectors, farms or processing
plants, use of these alternative protein sources serve as a waste management.
These sources are divided into three types, the animal and plant proteins, and
even other waste such as dung. Any alternative protein source could be
salvaged, and reprocessed, into viable feeds, as long as the process required is
practical and economical (Sogbesan and Ugwumba, 2008).
14
There are a few factors that need to be taken into account when using
alternative ingredients. First and foremost, the energy and nutrient content has
to be reasonable to sustain the energy usage. The more fiber in an ingredient,
the more the digestibility of energy and nutrients are lowered. Secondly, there
are anti-nutritional factors that interfere with the digestibility and absorption of
the nutrients. Anti-nutritional factors include trypsin inhibitors, tannins and
lectins. The ingredients have to be processed suitably before usage to prevent
loss of performance. Thirdly, the palability of the ingredients will control the
feed intake. The fish are able to taste and will decide on which type of
ingredients they prefer. All these factors influence the inclusion rate of the
alternative ingredients in the feed. As long as all are in balance with each other,
the alternative ingredient can be used successfully without compromising the
quality of feed (National Pork Board, 2008).
2.4.1 Plant Protein Sources
2.4.1.1 Corn Gluten Meal
Corn gluten meal is a byproduct left over from corn processing, where
it has been often used in animal husbandry, especially in feed for ruminants. It
contains a high percentage of crude protein, a minimum of 60%, as well as a
good digestibility coefficient, making it extremely nutritious in terms of
protein content. The meal contains feasible amino acid content, although there
is a lack of lysine and arginine. Where other plant protein sources usually
contain anti-nutritional factors, corn gluten meal hardly contains any, and with
its low fiber content, causing it to be an ideal alternative for fish meal
replacement (Pereira and Oliva-Teles, 2003).
15
Kaushik et al. (2004) used corn gluten meal to replace up to 50% of
fish meal in European sea bass diets. However, in studies by Dias (1999) and
Gomes, Rema and Kaushik (1995), the results obtained were different from
Kaushik et al. (2004) where there was no change in voluntary feed intake due
to high levels of a single protein source. Sea bream juveniles could only accept
up to 10% substitution of corn gluten meal (Yigit et al., 2012), where any
additional substitution would not have a growth rate comparable to fish meal,
as is the case with the striped catfish (Bicudo et al., 2012).
In contrast, as corn gluten meal contains high levels of carotenoids,
which in turn affects the color of the fish muscles, the usage of corn gluten
meal might not be practical, as any pigmentation of the flesh in supposedly
white fillets would reduce its value on the market (Lovell, 1984). On the other
hand, fish fillets which are valued for its pinkish muscle tone, such as the
salmonids, would benefit from this natural pigmentation, and consumers of
such fish will not be exposed to any artificial coloring (Robaina et al., 1997).
Therefore, to prevent coloration of the flesh, bleaching of the pigments are
usually conducted at its source to reduce the amount of carotenoids in the meal
(Saez, 2013).
2.4.1.2 Soybean Meal
Soybean meal appears to be an appropriate alternative protein source
because of its abundant supply, price and balanced amino acid profile. The
high nutrient content makes it very suitable as a feed ingredient in the
agriculture and aquaculture sectors. The meal itself is naturally clean, free
16
from contaminants such as fungi and bacterium that are harmful to the animals
(Swick et al., 1995). However, soybean meal contains several antinutritional
factors such as trypsin inhibitors, lectins and oligosaccharides that may affect
the digestion or absorption of nutrients (Dersjant-Li, 2002). These factors can
be deactivated, as long as the soybean meal is properly processed prior to
incorporation in the feeds (Deng et al., 2006).
Osborne and Mendel found out heat treatment on soybeans could
improve the growth rate of the animals fed the soybean meal by destroying the
anti-nutritional factors such as the protease inhibitors (Willis, 2003). The two
most commonly used soybean meal available in the market are the normal
soybean meal, and the dehulled soybean meal. Both contain fairly similar
crude protein content; but dehulled soybean meal is lower in fiber, and has a
higher energy content than the normal soybean meal (Cromwell, 1999).
Soybean meal has already been used as a substitute for fish meal in
diets of several crustaceans, and Alvarez et al. (2007) has received good
results when used with the white shrimp. Feedings of the African catfish
(Fafioye et al., 2005) and the rose snapper (Silva-Carrillo et al., 2012) showed
positive effects on growth when fish meal was partially replaced with soybean
meal. Soy meal has also been used as an alternative ingredient in diets for
humpback grouper (Laining et al., 2003), rainbow trout (Barrows, Stone and
Hardy, 2007) and cobia (Zhou et al., 2004). Feeding trials for trout since the
1940s has shown no significance in growth rates when soy meal was used,
while the cost of production was reduced significantly (Hardy, 2003). Locally
17
conducted research on feeding of the sutchi catfish and marble goby show up
to 45% and 10% of dietary fish meal could be substituted with soybean meal
(Phumee et al., 2011; Yong, Ooi and Shapawi, 2013). Except, in a country like
Malaysia which does not produce soybeans, soy meal can be an expensive
commodity (Ng, W. K., 2004).
2.4.1.3 Sunflower Meal
Sunflower meal is a high fiber feed ingredient, is widely used in feeds
for ruminants. The presence of the hull plays a major part in the nutrient
content, where non-dehulled and partially dehulled sunflower meal have a
more inferior nutrient composition as compared to the dehulled sunflower
meal (Harrington et al., 2003). However sunflower seeds contain a large
quantity of phenolic compounds which may complex with proteins, causing
discoloration of the protein isolates and lowering the nutritional content due to
their interaction with the amino acids (Gandhi, Jha and Gupta, 2008).
Despite the lower protein content in sunflower meal as compared to the
other oil seed meals, sunflower meal substitution of the other oil seed meals
have produced positive results. In ruminants such as heifers, steers, and cows,
inclusion of sunflower meal yielded similar results as diets containing soybean
meal, canola meal or other plant protein meals (Harrington et al., 2003). In
fact, broiler chicks and other poultry benefited from sunflower meal diets,
reflected in their growth and flesh (Rad and Keshavarz, 1976; Slavica,
Jovanka and Olivera, 2006). Diets for the Nile tilapia and rainbow trout could
contain up to 67% sunflower meal, in replacement of fish and soybean meal,
18
although full substitution is not recommended due to the lack of methionine
(Fagbenro and Davis, 2000; Hertrampf and Piedad-Pascual, 2000).
2.4.1.4 Palm Kernel Cake
A by-product from the palm oil industry, palm kernel cake contains
14.5% to 19.6% crude protein, 1.75% methionine and 2.68% lysine (Alimon,
2004). It is a high energy source and is a very cost effective ingredient to be
incorporated into ration formulations for various livestock. The ample
availability of palm kernel cake in Malaysia throughout the year is well suited
for agriculture, and in a country which produces and exports up to 2.4 tons of
palm kernel cake in 2010 (Choo, 2011), its high availability and relatively low
price in Malaysia readily makes it one of the best plant protein sources in
feeds.
Palm meal has yet to show potential in aquaculture, due to the limited
research studies utilizing it as an alternative ingredient (Zahari and Alimon,
2004), due lack of essential amino acids and a relatively low protein content
(Ng, 2003). Although palm kernel cake has been successfully used in animal
feed formulations such as cattle (Alimon, 2004; Oluwafemi, 2009), swine
(Adesehinwa, 2007; Boateng et al., 2008) and poultry (Boateng, et al., 2008;
Perez, Gernat and Murillo, 2000), its usage within compound fish feeds is still
uncommon, caused by the non-starch polysaccharides antinutritional factor,
despite its availability of lower cost compared with fish meal.
19
Studies involving the usage of palm kernel cake as protein source
include feeds for catfish (American Palm Oil, 2006) and tilapia (Ng and
Chong, 2002, Iluyemi et al., 2010) at low levels of inclusion. More often than
not, the palm kernel cake is fermented either with bacterium or digested with
feed enzymes before usage to increase the nutritional, especially crude protein
content (Ng, 2003, Iluyemi et al., 2010). Sulfur amino acids are commonly
added to supplement the lack of amino acids in the feed (Ng, 2003).
Bioconversion of palm kernel cake with maggots has also been studied to for
extraction of protein and fat from the cake (Hem et al., 2008).
2.4.1.5 Seaweed Meal
Malaysia is one of the world’s renowned top ten producers of seaweed,
where seaweed is actively cultured and farmed. Production of seaweed in
Malaysia comes from Sabah, the only state involved in seaweed aquaculture,
with Kappaphycus alvarezii and the sea birds’ nest (Eucheuma spinosum)
being the two main species culture, although both species are only part of 10%
and 3% of the global production respectively. Three types of culturing
methods were used, namely the conventional long line method, the improved
long line method and the basket method, whereby the seaweed were
suspended in the water using either lines or baskets (Kaur and Ang, 2009).
In previous years, seaweed usage for both human consumption and
animal feeds were more supplementary, for the mineral contents, or the
polysaccharide properties such as alginate as a binder. Moreover, more focus
is now being placed in the protein content of different seaweeds, the common
20
ones being brown, green and red seaweeds, with the former containing the
least amounts of crude protein (Arasaki and Arasaki, 1983).
The amino acid compositions of the seaweeds are comparable to
several other different foods, such as eggs (ovalbumin) and legumes (soy)
(Fleurence, 1999). Essential amino acids and fatty acids are present in most
seaweeds, and high digestibilities of the proteins were recorded through
enzymatic digestion studies (Fleurence, 1999; MacArtain et al., 2007).
Seaweeds of the green and red varieties have a higher protein content, and are
currently of interest as potential alternative feeds with good nutritional content
and its likeliness to be used in fish feed (Valente et al., 2006). As most
commercial foodstuff are pricey for small time fish farmers, seaweed meal
would be a cost effective way of including the essential amino acids into the
diets of the fish (Swain and Padhi, 2011).
A few types of seaweeds such as the brown seaweed (Enteromorpha
intestinalis, Sargassum muticum), the green seaweed (Ulva rigida), along with
the red seaweed (Gracilaria bursa-pastoris, Gracilaria cornea, Gracilaria
vermiculophylla, Gracilaria verrucosa, Grateloupia filicina, Polysiphonia
sertularioides, Porphyra dioica) are presently being utilized in feed for the
European sea bass, rohu, mrigal, rainbow trout, Nile tilapia, and other finfish
larvae (Valente et al., 2006; Swain and Padhi, 2011; Azad and Teo, 2012;
Pereira et al., 2012). All the above studies have reported the digestibility of the
seaweed in the diets was favorable, where the experimental diets had values
similar to the reference diet made from fish meal.
21
2.4.1.6 Kenaf Meal
Kenaf (Hibiscus cannabinus L) is known as a warm season annual
herbaceous plant and closely related to the cotton and okra plant. The fibrous
stem and stalk are usually used to weave jute and produce sacks or cardboard
products such as paper, biocomposites, fiber boards as well as bioplastics
(IENICA, 2002; Chan et al., 2013). Besides, humans have been consuming its
leaves, which are low in calories but rich in protein, essential oils, calcium,
and phosphorus and have considerable amounts of Vitamin C. On the contrary,
the seeds are rich in essential fatty acids and calories (Adebayo, 2010).
The leaves of the plant have a crude protein content of 30% (Odetola
and Eruvbetine, 2012), and are readily consumed by ruminants. After being
grounded into kenaf meal, the meal exhibits a higher protein digestibility
coefficient (Sethuraiman and Naidu, 2008), theoretically making it a
satisfactory alternative protein source to substitute for fish meal. Yet, despite
the good protein profile, kenaf meal might not be applicable in agriculture and
aquaculture, due to the high crude fiber content.
Rabbits fed diets containing kenaf meal showed decreasing health
conditions (Odetola, Ewuola and Adu, 2012), while broiler chicks could
accept up to 10% supplementation of kenaf (Odetola, 2011). Substitution of
soybean meal with kenaf meal in lactating cows would best be complemented
with a supplement of amino acids (Chantiratikul, 2005). Currently there is no
research on kenaf meal for fishes. Nonetheless, based on findings for the
22
terrestrial animals, it is possible minor supplementation with kenaf meal in
aquaculture feed might be viable, especially with herbivorous fishes.
2.4.1.7 Guar Seed Meal
Guar is a leguminous plant grown in semiarid places in the world, such
as Saudi Arabia and India. This protein-rich meal is an inexpensive byproduct
of the guar gum manufacturing, where the protein content ranges from 30% to
45% and is comparable to the nutrient content of soybean meal (Salehpour and
Qazvinian, 2011). However, guar gum is still detected in the meal, whereby it
is an anti-nutritional factor (Nagpal, Agrawal and Bahtia, 1971), along with a
trypsin inhibitor, although the trypsin inhibitors present were relatively lower
than those in soybean meal (Conner, 2002). Both these factors have an adverse
effect on the growth of broiler chicks, hence enzyme supplementation was
used to combat the effect (Vohra and Kratzer, 1965).
Guar seed meal is often used as ruminant feed due to the high protein
content, and is being suggested as an alternative feed for fishes, such as the
Nile tilapia (Al-Hafedh and Siddiqui, 1998). The Nile tilapia, could accept
feeds containing up to 50% of guar seed meal, without sacrificing the growth
of the fish (Al-Hafedh and Siddiqui, 1998). Despite the positive properties of
guar seed meal, only low levels of the meal could be incorporated into diets
for broiler chicks due to the guar gum, without compromising the growth of
the chicks (Gheisari et al., 2011). On the contrary, 50% incorporation of guar
seed meal in feed for lactating cows improved the milk quality significantly,
23
indicating guar seed meal would be more suited for ruminants, rather than the
other animals (Salehpour and Qazvinian, 2011).
2.4.2 Animal Protein Sources
2.4.2.1 Poultry Byproduct Meal
Poultry byproduct meal is a practical protein source for carnivorous
fishes because of the high protein content and many essential amino acids.
However, poultry byproducts vary between batches and producers, in terms of
quality, and some are usually deficient in one or more essential amino acids.
Marine fish oil is usually used to ensure sufficient amounts of essential amino
acids are included in the diets, and vegetable oil such as canola used to
increase the amounts of n-fatty acids (Subhadra et al., 2006). Chicken offal is
the waste product from slaughtered chickens, and it is made up of the kidneys,
liver, intestines, esophagus and proventricus (Omole et al., 2008).
Several studies have found chicken offal meal to be a viable
replacement of fish meal in poultry (El Boushy et al., 1990; Ravindran, 2010),
swine (Iheukwumere, Ndubisi and Etusiim, 2008; Tibbetts, Seerley and
McCampbell, 1987), ruminants (Lallo and Garcia, 1994; Gonzalez et al, 2007)
and the common carp (Machin, 1999; Zabihi et al., 2011), with different
inclusion levels in their diets. While chicken offal has already been used
widely in chicken feeds, incorporations in fish feeds are still relatively new.
Care must be taken when using chicken offal, proper cleaning and processing
procedures are essential, as bacteria such as the Salmonella sp from chicken
24
can be transmitted from different organisms up the food chain (Budiati et al.,
2013).
2.4.2.2 Krill Meal
Wild fish, usually marine, often consume amphipods, krill and small
crustaceans as part of their natural diet. The name krill is commonly used to
describe crustaceans from the Euphausiacea order, with the Antarctic krill
(Euphausia superba) being the most widely known species. Krill is a high
nutrient low calorie food, rich in n-3 fatty acids and minerals (Tou, Jaczynski
and Chen, 2007). The fishes seem to be able to tolerate the presence of high
levels of fluorine in the exoskeleton, which is detrimental to terrestrial animals.
Unwanted metals such as cadmium and copper could be eliminated by proper
processing of the krill (Moren et al., 2006).
Malaysia has access to the sea, but major krill fisheries are located in
mostly in Japan and Antarctica. Once an unused resource from the ocean, it is
now commercially harvested for bait, supplement oil or as aquaculture feed
(Yoshitomi, Aoki and Oshima, 2007). The popularity of krill meal was based
on the ease of capture and the abundance of each harvest. Overfishing of krill,
for either human or animal usage, has caused the disruption of the ecosystem.
The massive increase of krill usage in aquaculture feed and as bait has caused
krill fishing to be banned all along Alaska and the West Coast of U. S. A.
(Alexander, 2009).
25
Almost all the krill which has been harvested from the sea is used in
the aquaculture sector. One third of the Japanese capture is frozen and used
either directly as feed, or processed into fish meal for further usage, while krill
from the Canadian catch is utilized as an ingredient in the aquaculture feeds.
Krill as additives are used to enhance taste and nutrient content, where it acts
as a stimulus to increase feeding in fish such as the rainbow trout and sea
bream, thus contributing to the growth rate of the fish. Disease resistance was
also found to be increased in salmon consuming krill as part of their diet
(Nicol, Forster and Spence, 2000).
The effect of krill meal has been studied on several fish species like the
rainbow
trout,
salmon
(Salmo
salar)
and
the
yellowtail
(Seriola
quinqueradiata). Partial replacement of fish meal with krill in diets for the
rainbow trout show promise at low levels of inclusion. However, once the
inclusion level reached 30%, the rainbow trout showed a marked decrease in
growth rate (Yoshitomi et al. 2006). Yoshitomi and Nagano (2011) tried full
substitution of krill meal with the yellowtail with negative effects although the
yellowtail fed 15% inclusion level of krill meal had no significant difference
in growth compared to the reference diet. Hansen et al. (2010) found deshelled
krill could influence the growth rate, and could successfully be incorporated as
a single protein source in diets for the salmon.
2.4.2.3 Squid Meal
Squid meal is a high protein content feed ingredient, with crude protein
levels comparable to those found in fish meal and other fish products, and is
26
commonly used in shrimp culturing due to its growth enhancing properties and
as a feed attractant (Cruz-Suarez, Ricque and AQUACOP, 1992; Li et al.,
2009; Mohanta, Subramanian and Korikanthimath, 2013). Its ideal amino acid
profile is similar to fish meal, with the exception of arginine, which is more
frequently found in squid meal (Valverde et al., 2013). Another common
factor between squid meal and fish meal is the price. Squid meal is expensive,
and prices often fluctuate between years (Conklin, 2009).
Crude protein digestibility of squid meal is as good as what has been
obtained for fish meal. In fact, in some instances, squid meal has proven to
have a better crude protein digestibility than fish meal in feedstuff for the mud
crab and spiny lobster (Catacutan, Eusebeo and Teshima, 2003; Rathinam et
al., 2009). Growth of prawns consuming a diet supplemented with squid meal
showed growth improvements of up to 35% of the reference diet (Cruz-Suarez,
Ricque and AQUACOP, 1992). The Japanese flounder could accept up to 36%
fish meal replacement with soybean-squid meal (Kader et al., 2012) while the
blue gourami had optimal growth at 100% substitution (Mohanta,
Subramanian and Korikanthimath, 2013).
2.4.2.4 Blood Meal
Blood meal is a lysine-rich feed ingredient, containing up to 8% lysine
(El-Haroun and Bureau, 2007). Different techniques are used to produce blood
meal, which include disc-dried, spray-dried, rotoplate-dried, steam-tube-dried,
ring-dried and flash-dried (Bureau, Harris and Cho, 1999), and each
processing method results in significantly different apparent digestibility
27
coefficients for crude protein. The studies on the rainbow trout and rohu
fingerlings recorded at least 80% and 70% digestibility for crude protein
respectively (El-Haroun and Bureau, 2007; Hussain et al., 2011).
Despite the good nutritional content of blood meal, inclusions in fish
feeds would best be limited to a supplementation. A maximum of 50% blood
meal inclusion in the diet was recorded for fish such as the Chinook salmon,
rainbow trout, Nile tilapia (Hertrampf and Piedad-Pascual, 2003), juvenile
Palmetto bass (Gallagher and LaDouceur, 1995), mudfish fingerlings (Eyo and
Olatunde, 1999), gilthead sea bream (Nogueira et al., 2012) and largemouth
bass (Tidwell et al., 2005), whereas, in feeds for medium-sized shrimps, the
fish meal portion in the grow-out diets could be fully substituted with blood
meal (Hertrampf and Piedad-Pascual, 2003).
28
CHAPTER 3
MATERIALS AND METHODS
3.1
Preparation of Ingredients
Two different categories of alternative protein sources were used in
this study, i.e. plant protein source, and animal protein source. Plant protein
sources used were soy waste and palm kernel cake, whereas animal protein
sources used were anchovy waste, krill and chicken offal.
Fish meal made from fresh local torpedo scad (Megalaspis cordyla)
was used to formulate a diet as the positive control. Soy waste which was the
soy residue after soy milk extraction was supplied by a local soy milk vendor,
whereas palm kernel cake was provided by a palm oil processing plant.
Anchovy waste was supplied by the local fishermen after the daily processing
of each catch, while krill was purchased from a local market and chicken offal
was obtained from a poultry product processing plant. All ingredients were
sorted and dried before being ground or blended into powder form (FAO,
2004).
3.2
Nutrient Analysis
Nutrient analysis was carried out on all the potential protein sources,
and the experimental diets formulated for the digestibility trial as well as the
growth study.
29
3.2.1 Crude protein
Crude protein was determined using the Kjeldahl method according to
Rhee, in the Handbook of Food Analytical Chemistry (2005). The digestion
block (Kjeldahltherm, Gerhardt, Germany) was pre-heated to 375 °C. A dried
sample weighing 250 mg was placed into a 250 mL Kjeldahl digestion tube. A
pre-mixed Kjeldahl catalyst mixture, made up of copper, was added together
with 1.0 g anti-bumping granules. Digestion of sample was conducted in 10
mL of 16 M H2SO4. The samples were left to digest for two hours, after which
they were cooled slightly before distillation.
Care was taken not to allow the acid solution to bubble and overflow
out from the tube when 100 mL of distilled water was added slowly into the
boiling tube to dilute the acid. A 12 M NaOH solution was added slowly to the
boiling tube to make the solution strongly alkaline. Once the sodium
hydroxide was added completely, the tube was immediately inserted into the
distillation unit. The distillate was collected in a conical flask filled with 25
mL of 0.1 M H2SO4 and marked with a methyl red indicator.
The collected distillate was slowly titrated with 0.5 M NaOH while the
flask was swirled to ensure complete neutralization. Titration was stopped
when the methyl red indicator turned to yellow. The total volume of NaOH
used was noted. Sample blank was prepared in the exact method as described
for the sample. The nitrogen content in each sample was calculated using the
formula below:
30
%N = {[Macid (mLacid) – mLbk (MNaOH) - mLNaOH (MNaOH)] * 1400} / mgsample
mLbk = volume of 0.5 M NaOH needed to titrate 1 mL 0.1 M H2SO4 – volume
of 0.5 M NaOH needed to titrate reagent blank
mLacid = milliliters of H2SO4 used to collect distillate
mLNaOH = milliliters of NaOH used to titrate sample
The nitrogen content from each sample was then multiplied with a
conversion factor, where 6.25 was used for the animal protein source, while
5.71 was used for the plant protein sources to obtain the crude protein content
(Chang, 2003; Rhee, 2005).
3.2.2 Crude Lipid
Crude lipid analysis was conducted according to the method by Bligh
and Dyer (1959). A sample weighing 15 g was mixed with 35 mL of water and
homogenized with 100 mL of methanol in a Waring blender. Chloroform (50
mL) was then added to make a 2:1 methanol:chloroform ratio and the mixture
was homogenized for two minutes. An extra 50 mL of chloroform was added
and mixed for 30 seconds after which 50 mL water was added and thoroughly
combined. The liquid was collected by filtering through a Whatman No. 1
filter paper using a Buchner funnel applied with slight suction.
The solid retentate was pressed with the bottom of a beaker for
maximum solvent recovery and the liquids were retained. The liquids were
then transferred into a separatory funnel and were left to separate into two
31
different layers. The bottom chloroform layer was allowed to flow through an
anhydrous sodium sulfate layer (2.5 cm thick) using a Whatman No. 1 filter
paper in a funnel. The solvent was removed using a rotary evaporator
(Rotovapor R-200, Buchi, Switzerland) under vacuum, at 40 °C. The final
weight of the lipids was obtained from the formula below:
Weight of lipids = (weight of container + extracted lipids) - (weight of
container)
The weight of the lipids in the samples was determined by weight difference:
Lipid content (%) = [weight of lipids extracted (g) / weight of samples (g)] *
100
3.2.3 Crude Fiber
Samples were subjected to fiber analysis based on the procedure
described by Aberoumand and Deokule (2009). Residual sample after crude
lipid extraction weighing 10 g was added with 200 mL of boiling 1.25%
H2SO4. The sample-acid mixture was boiled for 30 minutes, cooled, and then
filtered through a filter paper. The mixture residue was washed trice with 50
mL aliquots of boiling water, after which the washed residue was placed in the
original vessel and further digested, this time through more boiling in 200 mL
of 1.25% NaOH for an additional 30 minutes. The digestate was filtered to
obtain the residue and washed trice with 50 ml aliquots of boiling water and
lastly with 25 mL ethanol. The digested and washed residue was allowed to
32
dry in an oven at 130 ºC and cooled in a desiccator. The residue was placed
into a porcelain crucible, weighed, ashed at 550 ºC for two hours, cooled in a
desiccator and reweighed. Crude fiber content was conveyed as percentage
loss in weight on ignition in the formula below:
Crude fiber (%) = [Loss in weight on ignition (g) / weight of sample (g)] x 100
3.2.4 Ash
Dry ashing was conducted based on the protocol recommended in
Food Analysis, 3rd Edition, by Harbers and Nielsen (2003). A sample of 10 g
was weighed in a tarred crucible. The crucible was placed in a cooled muffle
furnace (Lindberg/Blue M, Thermo Scientific, USA) and was ignited
overnight at 550 °C. After the temperature was allowed to drop, the crucible
was transferred quickly to a desiccator and allowed to cool to room
temperature prior to weighing. Percentage of ash is calculated using the
formula below:
Ash (%) = mass of ash (g)/mass of dry sample (g) * 100
3.2.5 Mineral Content
The calcium, phosphorus and potassium in the samples were extracted
using the ultrasound assisted extraction method by Costas et al. (2010). A
dried sample weighing 100 mg was placed in a 15 mL centrifuge tube. The
extraction solution used was 5 mL 1% HNO3. The suspension was sonicated
(FB15061, Fisher Scientific, USA) at room temperature (27 °C) for five
33
minutes. In order to obtain the extracted minerals, the suspension was then
centrifuged at 4000 rpm for ten minutes. A volume of 4 mL supernatant was
filtered and transferred to a volumetric flask, made up to 10 mL, and stored in
polypropylene centrifuge tubes prior to inductive coupled plasma with optical
emission spectrometry (ICP-OES) analysis.
ICP (Optima 7000 DV, PerkinElmer, USA) instrumental parameters
set based on recommendations by Besecker and Duffy (2000) were used to
determine the mineral content of the samples. Five standards of different
concentration (20, 40, 60, 80, 100 mg/L) were prepared from a commercial
stock solution for calcium, phosphorus and potassium, while ultrapure water
was used as the blank. A calibration curve of 99.9% was obtained before
sample analysis was started. The wavelengths used (Besecker and Duffy, 2000;
PerkinElmer Inc, 2010) for each element are as in Table 3.1:
Table 3.1: Wavelengths (nm) used for detection of the minerals
Element
Wavelength
Calcium
317.933
Phosphorus
178.221
Potassium
766.49
3.2.6 Amino Acid Analysis
The amino acid composition in the experimental diets and muscle
samples of the fingerlings after being fed the experimental diets was
determined using a high performance liquid chromatography (HPLC) method.
Frozen filleted muscle samples were freeze dried under vacuum
(FreeZone 2.5, Labconco, USA) for 24 hours. Freeze-dried samples weighing
34
30 mg were placed in microwave assisted hydrolysis digestion vessels (Kroll,
Rawel and Krock, 1998). Four mL of 6 N HCl containing 1% of phenol was
added to each vessel and the vessels were capped and positioned according to
the microwave digestion system (Speedwave four, Berghof, Germany). After
digestion was completed, the digestate was allowed to cool and made up to 50
mL volume with MiliQ water. The solution was then filtered and stored at 20 °C until analysis.
Amino acid analysis was carried out using a 4.6 mm x 150 mm x 3.5
µm reverse phase Zorbax Eclipse Plus C18 column (Agilent Technologies,
USA) with an Agilent 1100 (USA) HPLC system. Solution buffers and
solvents were prepared according to Henderson et al. (2000). Mobile phase A
used was 40 mM sodium phosphate buffer (NaH2PO4) (pH 7.8). Mobile phase
B used was a mixture of acetonitrile:methanol:water at 45:45:10 v/v ratio.
The samples were derived with reagents from Agilent Technologies
(USA) at the following volumes: 50 µL borate buffer (0.4 M, pH 10.2), 10 µL
sample,
10
µL
o-phthaldialdehyde
(OPA)
reagent,
10
µL
fluorenylmethyloxycarbonyl chloride (FMOC-Cl) reagent and 640 µL
deionized water. The mixture was vortexed and allowed to stand for 2 minutes
for complete derivatization of the amino acids. Injection was facilitated by an
Agilent 1100 (USA) autosampler, and eluted at 2.0 mL/min through the
column using a gradient program by manipulating the percentage of mobile
phase B (Henderson et al., 2000) (Table 3.2). Detection was at 338 nm using a
diode array detector (Agilent 1100, USA) and amino acid composition was
35
calculated using a standard curve and represented as % total amino acid
(National Institute of Health Science, 2002).
Table 3.2: Gradient program for amino acid analysis
Time (minutes)
Mobile phase B (%)
0
0
1.9
0
18.1
57
18.6
100
22.3
100
23.2
0
26
0
3.2.7 Fatty Acid Analysis
Fatty acid analysis was performed to determine the fatty acid
composition in the experimental diets, muscle and liver samples of the
fingerlings after being fed the experimental diets. A gas chromatograph (GC)
with a flame ionized detector (FID) was used for the analysis.
Lipids were extracted using the method in 3.2.2. Fatty acid methyl
esters (FAMEs) were converted using the protocol from Sigma-Aldrich (1997).
Lipid samples weighing 20 mg were placed in a reaction vessel and 2 mL of
10% methanolic H2SO4 (Sigma-Aldrich) was added. The mixture was heated
at 60 °C for 30 minutes, vortexing every 15 minutes to ensure proper heating.
The mixture was cooled to room temperature and 1mL saturated sodium
bicarbonate solution was added to neutralize the reagent. In order to extract
the esters, 1 mL hexane was added to the mixture, vortexed, and centrifuged to
allow the phases to separate. The upper hexane layer was carefully transferred
to an airtight vessel for storage prior to analysis.
36
Fatty acid analysis was conducted using a 30 m x 0.25 mm x 0.25 µm
BP20 (SGE, Australia) column with a GC (Clarus 500, PerkinElmer, USA)
system. Chromatographic conditions for the GC used were modified from
Canadian Life Science (2012), as shown in Table 3.3.
Table 3.3: GC conditions for fatty acid analysis
Component
Condition
Injector
Temperature: 250 °C
Carrier gas
Helium gas
Flow rate: 0.5 mL/min
Detector
Temperature: 250 °C
Oven
Initial temperature: 50 °C, hold for 2 minutes
Ramp: 4 °C/minute
Final temperature: 250 °C, hold for 15 minutes
Split ratio
30:1
Flame ignition
Hydrogen gas
Flow rate: 45 mL/min
Purified air
Flow rate: 450 mL/min
FAMEs were analyzed using the FID of the GC system. A 37 FAME
mix standard (Supelco, USA) was used for calibration and peak identification
purposes. Tricosanoic acid (C23:0 fatty acid) was used as the internal standard.
Results were calculated using the areas of the internal standard and expressed
as % total fatty acids (Hribar et al., 2013).
3.3
Digestibility Trials
3.3.1 Formulation of Experimental Diets
A prototype experimental diet was formulated based on various
research studies reported by Fontainhas-Fernandes et al. (1999), Maina et al.
(2002), Tibbetts, Milley and Lall (2006), Ng, Abdullah and de Silva (2008)
and Misieng, Kamarudin and Musa (2011).
37
The basal diet was made up of spirulina, casein, flour mix, yeast,
lecithin, multivitamins and minerals and palm carotene oil, while the protein
portion was manipulated to contain the different alternative protein sources.
Fish meal was substituted at 100% inclusion level by the alternative animal
protein sources, whereas the alternative plant protein sources substituted fish
meal at 50% inclusion level. Lecithin at 1% inclusion level was used as an
emulsifier and binder in the diet. This was based on the results obtained from
the nutrient analysis of the individual ingredients, where the plant protein
sources had relatively low crude protein content, coupled with other factors
such as high crude fiber content as well as antinutritional factors. Chromium
oxide was incorporated at 1% dietary inclusion as an inert internal marker
(Table 3.4).
38
Table 3.4: Composition of experimental diets for digestibility trials
Diet
FMD
SWD
PKCD
COD
AWD
KRD
Fish meal
50.0
25.0
25.0
Soy waste
25.0
Pam
kernel 25.0
cake
Chicken offal
50.0
Anchovy waste 50.0
Krill
50.0
Spirulina
6.0
6.0
6.0
6.0
6.0
6.0
Casein
10.0
10.0
10.0
10.0
10.0
10.0
Flour mix
25.0
25.0
25.0
25.0
25.0
25.0
Yeast
2.0
2.0
2.0
2.0
2.0
2.0
Lecithin
1.0
1.0
1.0
1.0
1.0
1.0
Multivitamins
2.0
2.0
2.0
2.0
2.0
2.0
and minerals*
Chromic oxide 1.0
1.0
1.0
1.0
1.0
1.0
Palm carotene 3.0
3.0
3.0
3.0
3.0
3.0
oil
*
Multivitamins and minerals: Vitamin A, 5000 iu; Vitamin D, 400 iu;
Thiamine HCI (B1), 3.5 mg; Riboflavin (B2), 2.5 mg; Pyidoxine HCI (B6),
2.5 mg; Cyanocobalamine (B12), 0.005 mg; Ascorbic acid (C), 50 mg;
Nicotinamide, 25 mg; Calcium Pantothenate, 4 mg; Calcium, 25 mg; Copper,
0.75 mg; Iron, 5 mg; Iodine, 0.05 mg; Magnesium, 0.5 mg; Manganese, 0.5
mg; Phosphorus, 20 mg; Zinc, 2 mg; Folic acid, 0.5 mg.
The basal ingredients were placed in a mixer and small amounts of
water were added to form a smooth paste. The protein samples (fish meal,
anchovy waste, krill, chicken offal, palm kernel cake or soy meal) were added
slowly to the paste and the paste was stirred continuously until a soft dough
was formed. The dough was kneaded to ensure homogenous mixing and put
through an extruder (Ch-888, Taiwan) where the pellets extruded were of 2*2*
2 mm. The pellets were put in a convection oven and the temperature was set
to 105 °C. The pellets were dried for 3 hours before being stored until used.
39
3.3.2 Feeding of Fingerlings
A total of six experimental diets were formulated, with the fish meal
diet as the control. Thirty T. tambroides fingerlings obtained from a local
hatchery, weighing 5.5 ± 0.3 g and measuring 4.7 ± 0.3 cm were used for each
diet formula, totaling to 180 fingerlings. The fingerlings were allowed to adapt
to their surroundings for two weeks followed by four days to acclimatize
towards the new diets and fed twice a day to apparent satiation.
Fecal collection was modified slightly based on a review of the Guelph
system (Bureau and Cho, 1999). The tanks were cleaned after the second
feeding to ensure that there was no food contamination. The faeces were
allowed to settle at the bottle of the tank until the following day where they
were siphoned out into bottles before centrifuging. The supernatant was
discarded and the faeces were freeze-dried, ground and stored for digestibility
analysis. Both diets and faeces were analyzed for crude protein content
according to the methods described in sections 3.2.1. Chromium content in the
diets and faeces were analyzed using the protocol in section 3.2.5, with
wavelength of 267.716 nm.
The digestibility index was expressed as apparent digestibility
coefficient for dry matter (ADM) and protein (ADC), and was calculated
based on the following formulae (Martins, Valente and Lall, 2009):
ADM = 100 – (100 * (% Cr2O3 in diet / % Cr2O3 in faeces))
40
ADC = 100 – (100 * (% Cr2O3 in diet / % Cr2O3 in faeces) * (% protein in
faeces / % protein in diet))
A preference test was conducted simultaneously as the digestibility
trial. The fingerlings were presented with a no-choice possible test (Stallings,
2010) where they were fed designated diets and the preference of each diet
was based on the amount of food consumed over a period of time. The
fingerlings were fed a measured amount of the experimental diets twice daily,
and the remaining uneaten food collected and weighed to determine how much
feed was consumed. Ratings were reported as +, ++, +++ and ++++ for 4.1-5.0
g, 5.1-6.0 g, 6.1-7.0 g and 7.1-8.0 g of the experimental diet consumed
respectively.
3.4
Growth Studies
3.4.1 Formulation of Experimental Diets
After the digestibility trials, chicken offal from the animal protein
category and palm kernel cake from the plant protein category were selected
as the alternative protein sources as fish meal replacements in growth studies.
Seven isoproteic diets containing 42% crude protein were formulated (Table
3.5), with the reference diet containing 100% fish meal (FMG) as the main
protein source which was used as the positive control and six alternative
protein based diets. Three diets containing chicken offal at increasing
replacement levels of fish meal at 33.3% (1CO), 66.7% (2CO) and 100%
(3CO), and three diets from palm kernel cake as fish meal replacement at
41
16.5% (1PKC), 33.0% (2PKC) and 50% (3PKC) were evaluated in the growth
studies.
42
Table 3.5: Composition of experimental diets for growth studies
43
Diet
FMG
1CO
2CO
3CO
1PKC
2PKC
3PKC
Fish meal
50.0
33.5
17.0
41.8
33.5
25.0
Pam kernel cake
8.2
16.5
25.0
Chicken offal
16.5
33.0
50.0
Casein
8.0
9.0
13.0
17.0
11.0
16.0
21.0
Flour mix
30.0
28.0
23.0
17.0
27.0
20.0
13.0
Spirulina
2.0
3.0
4.0
6.0
2.0
4.0
6.0
Yeast
2.0
2.0
2.0
2.0
2.0
2.0
2.0
Lecithin
2.0
2.0
2.0
2.0
2.0
2.0
2.0
Multivitamins and minerals*
3.0
3.0
3.0
3.0
3.0
3.0
3.0
Palm carotene oil
3.0
3.0
3.0
3.0
3.0
3.0
3.0
*
Multivitamins and minerals: Vitamin A, 5000 [Type a quote from the document or the summary of an interesting point. You can position the text box
anywhere in the document. Use the Drawing Tools tab to change the formatting of the pull quote text box.]
iu; Vitamin D, 400 iu; Thiamine HCI (B1), 3.5 mg; Riboflavin (B2), 2.5 mg; Pyidoxine HCI (B6), 2.5 mg; Cyanocobalamine (B12), 0.005 mg;
Ascorbic acid (C), 50 mg; Nicotinamide, 25 mg; Calcium Pantothenate, 4 mg; Calcium, 25 mg; Copper, 0.75 mg; Iron, 5 mg; Iodine, 0.05 mg;
Magnesium, 0.5 mg; Manganese, 0.5 mg; Phosphorus, 20 mg; Zinc, 2 mg; Folic acid, 0.5 mg.
43
3.4.2 Feeding of Fingerlings
Feeding trials were performed to evaluate the potential for growth and
the nutrient utilization of the T. tambroides fingerlings fed the diets containing
increasing levels of chicken offal and palm kernel cake. A total of seven
experimental diets were studied whereby 210 fingerlings were used. For each
diet, 30 homogenous fingerlings were randomly assigned to a cement tank
with dimensions of 60*90*180 cm. The initial body weight of the fingerlings
was 17.2 ± 0.6 g, the standard length measuring 8.6 ± 0.5 cm and the total
length measuring 10.8 ± 0.7 cm. The growth studies were conducted over a
period of six months, and the fingerlings were fed the diets twice a day to
apparent satiation. Prior to the experiment, the fingerlings were allowed 14
days to adapt to their new rearing conditions followed by four days to
acclimatize towards the new diets
3.4.3 Sampling Procedure
Fingerlings were randomly selected and measured at the beginning of
every week for the first two months, and fortnightly for the following four
months. The fingerlings were sedated with the use of NIKA Transmore® Fish
Stabilizer that contains α-methylquinoline as the active ingredient. The
standard length, total length and weight gain were used as indicators for
growth. Figure 3.1 shows the diagram which the measurement of length was
based on.
44
Figure 3.1: Measurement of standard length and total length
Diet performance was reviewed based on the data obtained through the
specific growth rate (SGR), the feed conversion ratio (FCR) and the protein
efficiency ratio (PER) (Shapawi, Ng and Mustafa, 2007; Wang et al., 2006).
The formulae used were:
SGR (%) = 100 * ((ln FBW − ln IBW) / x days)
FCR = diet consumed/weight gain
PER = weight gain/protein intake
Where IBW = initial body weight and FBW = final body weight
Length-Weight (L-W) relationship and the relative condition factor (K) were
determined based on the cube law and using the formula by Froese (2006):
W = a Lb
K = W/a Lb
Where W = body weight, L = total length in cm, coefficient a = intercept of
the regression and b = the regression coefficient.
45
At the end of the growth studies, fish from each tank were sacrificed.
Each fish sample was filleted, with bones removed before labeling and stored
at -80 °C for further body composition analysis. Similarly, the liver was
removed, labeled and stored under the same conditions. For control and
experimental diets, muscle and liver samples were prepared for fatty acid
analysis, whereas only the diets and muscle samples were used in the amino
acid analysis. Both analyses were conducted to determine the effect of the
experimental diets on the body composition of the fingerlings.
3.5
Statistical Analysis
All data collected from nutrient analysis, digestibility trials and growth
studies were expressed as mean and standard error mean (SEM) and used to
determine the efficacy of the alternative protein source on the growth of the
fingerlings. SEM was used as a guide to determine the precision of the
estimated mean as well as the standard deviation. Standard length, total length
and weight of the fingerlings were analyzed using Levene’s test (P>0.05) to
ensure homogeneity of variance between the fingerlings at the start of the
growth study. Data were analyzed using one way analysis of variance
(ANOVA) and treatment means were evaluated using Duncan’s multiple
range tests (to provide additional information on the differences between
means) through SPSS Statistics 11.5 package (IBM, USA) where the
significance was tested at 95% confidence level and significant differences
were considered when P was less than 0.05.
46
CHAPTER 4
RESULTS
4.1
Nutrient Analysis
4.1.1 Proximate Analysis for Individual Ingredients
Nutrient proximate analysis was conducted on each ingredient prior to
diet formulation to determine the nutrient composition. The animal proteins
sources contained the highest levels of crude protein, while the plant protein
sources had crude protein levels which were less than half the amount of the
animal proteins. Crude fat levels varied among ingredients due the different
lipid content in each protein source. Crude fiber levels were the highest in
plant protein sources which is attributed to the plant cell wall structures,
whereas these structures were absent in the animal protein sources. Mineral
levels (ash, calcium, phosphorus and potassium) obtained from the animal
protein sources were higher when compared with the plant protein sources, as
the animal sources were prepared from whole carcasses, bones and offal which
contributed to the mineral content. Table 4.1 compiles the nutrient contents of
each ingredient.
47
Table 4.1: Nutrient composition of the individual ingredients* (g/100 g)
Proximate FM
SW
PKC
CO
AW
KR
SEM¥
§
analysis
Crude
69.82f 21.57b 16.95a 49.46c 56.53d 57.34e 4.71
protein
Crude fat
6.23b
1.47a
6.78bc 10.35e 8.46d
7.50c
0.67
a
c
c
a
a
b
Crude fiber 0.13
9.27
10.14 0.33
0.69
1.89
1.02
Ash
11.36c 3.24a
5.56b
25.25d 32.27f 31.71e 2.90
12.56b 64.60e 61.74d 14.89c 2.31a
1.63a
6.45
NFE#
e
a
b
f
d
Calcium
22.09
4.05
6.17
48.99
21.94
21.50c 3.56
Phosphorus 14.83e 2.20a
5.14b
24.50f 13.63d 11.10c 1.74
Potassium 8.98e
9.36f
6.49c
4.63a
8.56d
6.33b
0.41
*FM (fish meal), SW (soy waste), PKC (palm kernel cake), CO (chicken
offal), AW (anchovy waste), KR (krill)
§
Values are means for triplicate analysis. Mean values within any single row
with different superscripts are noted to be significantly different (P ≤ 0.05)
¥
Standard error of mean
#
Nitrogen free extract
4.1.2 Proximate Analysis for Digestibility Trial Diets
Crude protein content of all the digestibility trial experimental diets
ranged from 32% to 43%, where only the protein portion of the diets was
substituted, without any modification to the basal diet composition. Crude
protein levels differed significantly (P=0.00) among all the diets, with the fish
meal-based diet contained the most crude protein. Although soy waste and
palm kernel cake individually have low crude protein content, only 50% of the
protein portion in the experimental diets was replaced to compensate for
differences in protein composition of the animal and plant protein sources.
The shell and bones from the krill and anchovy led to high levels of
ash in both the krill and anchovy waste diets, while the soy waste diet
contained the lowest ash content. The plant-based diets had the highest
amounts of crude fiber, due to the plant materials used. There was no
significant differences (P=0.05) between the nitrogen free extract for anchovy
48
waste, krill and fish meal diets while crude fat amounts in all the diets varied
among each other. Table 4.2 shows the nutritional composition of the
experimental diets used in the digestibility trials.
Table 4.2: Nutrient composition of the experimental diets in digestibility
trial (g/100 g)
Diet*
Proximate analysis§
Crude protein Crude fat
Crude fiber Ash
NFE
e
a
a
c
10.35
0.35
11.93
35.06a
FMD
42.31
a
a
c
b
SWD
32.73
10.85
3.10
10.45
42.87c
PKCD
32.12a
10.67a
3.13c
9.34a
44.74c
b
c
a
d
COD
35.80
16.70
0.52
13.80
33.18b
AWD
37.90c
16.34c
1.54b
15.61e
28.74a
d
b
b
f
KRD
39.13
12.70
1.35
18.13
28.77a
SEM¥
0.87
0.64
0.27
0.73
1.53
*Diets formulated from fish meal (FMD), soy waste (SWD), palm kernel cake
(PKCD), chicken offal (COD), anchovy waste (AWD), krill (KRD)
§
Values are means for triplicate analysis. Mean values within any single
column with different superscripts are noted to be significantly different
(P ≤ 0.05)
¥
Standard error of mean
4.1.3 Proximate Analysis for Growth Study Diets
All the experimental diets were formulated to contain an estimation of
42% crude protein, as demonstrated by the relatively similar crude protein
level (P=0.12). Crude fat content of the all formulated diets were high, due to
the addition of palm carotene oil in the diet. When the substitution level of fish
meal with chicken offal increased, the crude fat content in the chicken offal
diets also increased, since chicken offal contained more crude fat than fish
meal. A similar trend was observed in the diets containing palm kernel cake,
where the levels of crude fat show a proportional increase with the
incorporation of fish meal.
49
Table 4.3 shows that crude fiber content increased as the inclusion
level of the alternative protein increased due to both chicken offal and palm
kernel cake contained more crude fiber than fish meal. As 3PKC contained the
most plant protein, it was expected the crude fiber levels were the highest of
all the experimental diets. Ash content in all experimental diets was inversely
proportional to the substitution level in the chicken offal diet, while the
opposite trend was observed in the palm kernel cake diet.
Table 4.3: Nutrient composition of the experimental diets in growth study
(g/100 g)
Diet*
Proximate analysis§
Crude
Crude fat
Crude fiber Ash
NFE
protein
FMG
42.13a
10.01a
0.35ab
6.38b
37.87d
a
d
a
a
1CO
41.90
13.20
0.12
5.80
37.78d
a
e
ab
e
2CO
42.67
15.52
0.40
8.63
31.60b
3CO
41.83a
16.30f
0.52bc
12.80f
27.14a
a
ab
c
b
1PKC
41.93
10.33
0.70
6.44
38.70d
a
bc
d
c
2PKC
42.67
10.64
2.07
7.21
34.41c
a
c
e
d
3PKC
42.50
10.96
3.10
7.90
32.53b
SEM¥
0.12
0.57
0.23
0.57
0.88
*Replacement levels of fish meal at 0% (FMG), 33.3% (1CO), 66.7% (2CO)
and 100% (3CO), 16.5% (1PKC), 33.0% (2PKC) and 50% (3PKC)
§
Values are means for triplicate analysis. Mean values within any single
column with different superscripts are noted to be significantly different
(P ≤ 0.05)
¥
Standard error of mean
The mineral content of potassium ranged from 2 to 5 g/kg for the
experimental diets. The calcium and phosphorus contents in chicken offalbased diets increased proportionally with the inclusion of chicken offal,
whereas the opposing trend was noted in the potassium content. As for the
palm kernel cake-based diets, calcium levels decreased as the inclusion
increased, though potassium levels increased and phosphorus levels remained
constant (Table 4.4).
50
Table 4.4: Mineral content of the experimental diets in growth study
(g/100 g)
Diet
Proximate analysis*
Calcium
Phosphorus
Potassium
d
b
7.83
5.17
4.64g
FMG
10.45e
6.08c
4.35f
1CO
f
d
12.44
6.61
3.72d
2CO
12.72g
6.84e
3.10b
3CO
c
a
5.67
3.69
2.98a
1PKC
5.48b
3.65a
3.45c
2PKC
5.34a
3.64a
4.08e
3PKC
§
0.68
0.30
0.13
SEM
*Values are means for triplicate analysis. Mean values within any single
column with different superscripts are noted to be significantly different
(P ≤ 0.05)
§
Standard error of mean
4.2
Diet Digestibility
The apparent digestibility values and the preference for the
experimental diets are summarized in Table 4.5. There were significant
differences (P=0.00) between the diets based on the estimations of apparent
digestibility coefficient for dry matter (ADM) and protein (ADC). The highest
values of ADM and ADC of protein were observed for control (fish meal) diet.
As the apparent digestibility values were affected by the nature of the diet, it
was noted the substitute animal protein sources had slightly reduced ADM
when compared to the fish meal diet, but it was significantly reduced (P=0.00)
for plant-based diets. The palm kernel cake diet had a higher ADC level and
was the most preferred diet in the plant protein category; although chicken
offal was not the most digestible animal protein source, the fingerlings
preferred the chicken offal diet over the other animal protein sources, with the
exception of the fish meal diet.
51
Table 4.5: Apparent digestibility coefficient values in percentage and
preference for the experimental diets
Diet
Apparent digestibility coefficient*
Preference
ADM
ADC
FMD
92.28e
98.78f
++++
b
SWD
66.90
86.23a
+
a
b
PKCD
65.11
87.42
+++
COD
82.12c
89.77c
+++
93.39d
++
AWD
85.09d
KRD
83.70c
96.12e
+
§
SEM
2.40
1.11
*Values are means for triplicate analysis. Mean values within any single
column with different superscripts are noted to be significantly different
(P ≤ 0.05)
§
Standard error of mean
4.3
Growth Performance
Based on the results of the preference test, chicken offal and palm
kernel cake were selected as the best alternative animal and plant protein to
substitute fish meal at different inclusion levels. Levene’s test was used to
verify the assumptions of equality of variance, whereby all the fingerlings at
the start of the study were homogenous in weight (P=0.884), total length
(P=0.270) and standard length (P=0.216).
There was no mortality of the fingerlings reported throughout the
whole six-month period for growth studies. As shown in Table 4.6, there was
no significant difference in weight gain (P=0.10) and standard length gain
(P=0.173) percentage respectively between fingerlings fed the fish meal diet
or the experimental alternative protein diets, except for fingerlings consuming
the 3CO diet. Significant differences (P=0.00) were observed for total length
gain. There was also no significant difference (P=0.84) in the specific growth
rate (SGR) between the groups, although 3CO achieved the highest SGR when
compared with the others, including the control group. Feed conversion ratio
52
(FCR) was similar among diets, where there were no significant differences
(P=0.28). Protein efficiency ratio (PER) of the experimental diets indicated
that the protein utilization of the experimental diets were comparable to the
fish meal diet, with 1CO as the exception.
Table 4.6: Growth and diet utilization efficiency of the fingerlings
Diet
Parameters*
Weight
Standard Total
SGR (%) FCR
PER
gain (%) length
length
gain (%) gain (%)
a
133.91b
114.19g
0.44a
2.58ab
0.92b
FMG
221.88
1CO
219.28a
131.61ab 112.16f
0.43a
2.90b
0.82a
a
a
b
a
ab
2CO
224.34
129.13
110.32
0.44
2.63
0.89b
b
ab
c
a
a
3CO
230.46
129.46
110.51
0.46
2.52
0.95b
a
ab
e
a
ab
1PKC 220.96
131.21
111.94
0.43
2.61
0.91b
2PKC 222.87a
129.75ab 110.74d
0.44a
2.54ab
0.92b
a
a
a
a
ab
3PKC 220.49
128.59
109.75
0.43
2.59
0.91b
§
SEM
0.96
0.58
0.31
0.01
0.04
0.01
*Values are means for triplicate analysis. Mean values within any single
column with different superscripts are noted to be significantly different
(P ≤ 0.05)
§
Standard error of mean
Based on the formulae W = a Lb and K = W/a Lb, a length-weight relationship
as well as the relative condition factor was determined (Table 4.7). No
significant differences (P=0.233) were found for the relative condition factor
between fingerlings from different diets, although it ranged from 1.07 to 1.14.
Equations for the length-weight relationship were calculated by applying the
Log function to the formula W = a Lb.
53
Table 4.7: Length-weight relationship and the relative conditioning factor
of the fingerlings
Diet
Equation
Parameters*
r
Regression
a
b
K
FMG Log W = -0.28 +1.45 log L
0.52d
1.45c
1.12c
0.96
f
a
d
1CO Log W = -0.20 + 1.39 Log L 0.63
1.39
1.13
0.97
2CO Log W = -0.30 + 1.49 Log L 0.50c
1.49d
1.07a
0.97
1.53f
1.12c
0.96
3CO Log W = -0.37 + 1.53 Log L 0.43b
1PKC Log W = -0.51 + 1.51 Log L 0.31a
1.51e
1.10b
0.97
2PKC Log W = -0.36 + 1.63 Log L 0.44b
1.63g
1.13d
0.95
3PKC Log W = -0.25 + 1.43 Log L 0.56e
1.43b
1.14e
0.94
SEM§ 0.02
0.02
0.01
*Values are means for triplicate analysis. Mean values within any single
column with different superscripts are noted to be significantly different
(P ≤ 0.05)
§
Standard error of mean
4.4 Amino Acid Composition
Tryptophan was not measured in this study, as it was degraded by the
acid during hydrolysis. Asparagine and glutamine formed complexes with
aspartic acid and glutamic acid respectively and were detected as such after
being hydrolyzed.
The 3PKC diet contained the least amounts of the essential amino
acids, and the most non-essential amino acids. Essential amino acid content in
all experimental diets was constant to the incorporation of the substitute
proteins and each inclusion level. Aspartic acid and glutamic acid were highest
in all the experimental diets, with the 3CO diets containing the highest for
both. Lysine content in the diets ranged from 3.36-3.93% of the total amino
acids (Table 4.8).
Essential amino acid in muscle samples (Table 4.9) increased with the
inclusion of chicken offal and palm kernel cake in the experimental diets,
54
while the non-essential amino acid content decreased. There was no direct
relation of the amino acids in the diet samples and the muscle samples.
Nevertheless, the amino acid trend line in the muscle samples was similar to
the trend line from the diet samples. Total essential amino acids in the muscle
samples were not found to be directly affected by the total essential amino
acids in dietary samples. Table 4.9 shows the amino acid content obtained
from the fingerling muscle samples.
55
56
Table 4.8: Amino acid analysis of diet samples (% total amino acids)
Amino acid*
Diet sample
FMG
1CO
2CO
3CO
1PKC
2PKC
3PKC
SEM§
c
bc
ab
a
c
bc
bc
Threonine
5.63
5.31
5.15
4.86
5.60
5.31
5.40
0.07
ab
bc
cd
d
a
ab
bc
Valine
6.50
6.83
7.16
7.28
6.39
6.61
6.83
0.07
Isoleucine
5.20c
5.28c
4.64b
4.25a
4.90bc
5.03c
4.97bc
0.08
Leucine
8.67c
8.95cd
9.45d
9.50d
6.60b
6.43b
5.63a
0.34
Phenylalanine
3.57d
4.59e
5.78e
5.86e
2.57c
2.32b
2.04a
0.34
a
a
a
a
a
b
b
Lysine
3.47
3.42
3.44
3.43
3.36
3.88
3.93
0.05
Histidine
2.40a
2.31a
2.25a
2.21a
2.18a
2.33a
2.31a
0.03
Arginine
5.18b
5.26b
5.27b
5.33b
5.14b
4.78a
4.77a
0.06
Methionine
3.45cd
3.10bc
2.76ab
2.73a
3.62d
3.59d
3.79d
0.10
ab
ab
ab
b
a
ab
ab
Aspartic acid
10.40
11.26
11.67
11.85
10.20
10.36
10.46
0.20
Glutamic acid
15.02a
17.17b
18.01b
18.79b
14.71a
14.86a
15.31a
0.39
Serine
3.35ab
3.28a
3.55bc
3.61c
4.49d
4.85e
4.75e
0.14
Glycine
8.69b
8.33b
7.33a
7.35a
8.79b
8.51b
8.37b
0.16
c
ab
a
a
c
bc
c
Alanine
10.33
8.05
7.54
7.02
9.72
9.44
9.54
0.29
Tyrosine
2.44b
2.37b
2.02a
1.86a
3.95c
3.84c
3.97c
0.19
Cysteine
1.86a
1.94ab
2.16bc
2.38c
1.82a
1.74a
1.72a
0.06
Proline
3.84c
2.55b
1.82a
1.69a
5.96d
6.`1de
6.21e
0.42
*Values are means for triplicate analysis. Mean values within any single row with different superscripts are noted to be significantly different (P ≤ 0.05)
§
Standard error of means
56
57
Table 4.9: Amino acid analysis of muscle samples (% total amino acids)
Amino acid*
Muscle sample§
FMF
1COF
2COF
3COF
1PKCF
2PKCF
3PKCF
SEM¥
a
a
a
a
a
a
a
Threonine
4.17
3.93
3.94
3.92
3.73
3.94
3.86
0.15
a
a
a
a
a
a
a
Valine
4.07
3.55
3.21
3.14
3.22
3.03
3.15
0.16
Isoleucine
3.96ab
3.72ab
3.73ab
3.80ab
2.57a
3.30ab
4.23b
0.18
Leucine
8.48a
10.54b
10.57b
10.65b
8.37a
8.22a
8.13a
0.28
Phenylalanine
3.79b
3.54ab
3.59ab
3.62ab
3.48ab
3.40a
3.27a
0.05
Lysine
3.99a
3.90a
4.20ab
4.46b
4.16ab
4.11ab
3.97a
0.05
a
ab
bc
c
e
de
d
Histidine
1.93
2.10
2.22
2.35
2.83
2.72
2.60
0.07
Arginine
5.32c
4.96a
4.96a
4.94a
5.18bc
5.05ab
5.03ab
0.04
Methionine
2.66c
2.49bc
2.56bc
2.60c
2.56bc
2.39b
2.21a
0.04
Aspartic acid
11.76ab
11.59a
11.67a
11.83ab
12.75abc
13.44bc
13.83c
0.25
a
a
a
a
b
ab
ab
Glutamic acid
15.63
15.31
13.46
15.55
17.71
16.98
16.73
0.25
Serine
7.89b
7.98b
7.91b
7.86b
7.56ab
7.27a
7.12a
0.09
Glycine
9.32bc
9.51c
9.36bc
9.28bc
8.54abc
8.28ab
8.05a
0.17
Alanine
11.33a
11.42a
11.37a
11.25a
12.05a
12.80a
12.74a
0.22
a
ab
ab
ab
ab
ab
b
Tyrosine
3.23
3.29
3.32
3.34
3.54
3.60
3.63
0.05
Cysteine
1.46b
0.53a
0.49a
0.46a
0.97b
0.84b
0.81b
0.08
Proline
1.01c
1.64e
1.44d
0.95bc
0.78ab
0.63a
0.64a
0.08
*Values are means for triplicate analysis. Mean values within any single row with different superscripts are noted to be significantly different (P ≤ 0.05)
§
Muscle samples of fingerlings consuming replacement levels of fish meal at 0% (FMF), 33.3% (1COF), 66.7% (2COF) and 100% (3COF),
16.5% (1PKCF), 33.0% (2PKCF) and 50% (3PKCF)
¥
Standard error of means
57
4.5
Fatty Acid Composition
The 3PKC diet contained the highest amounts of total saturated fatty
acids (SFA). SFAs in the experimental diets increased as more palm kernel
cake was used in each diet, as well as in relation to the inclusion of chicken
offal. Despite the monounsaturated fatty acid (MUFA) in the palm kernel cake
diets increasing with the incorporation of the alternative proteins,
polyunsaturated fatty acid (PUFA) decreased proportionally with the
substitution of fish meal in all the experimental diets. Both n-3 and n-6 fatty
acids decreased too with the addition of the experimental proteins.
Total unsaturated fatty acids decreased with the inclusion of fish meal
in both the chicken offal and palm kernel cake experimental diets. The 1CO
diet had the highest unsaturated fatty acids content. Palmitic acid and stearic
acid were the two most abundant SFA while n-9 oleic acid was the major
contributor in MUFA. Essential fatty acids (n-3 and n-6) precursors i.e. αlinolenic acid (ALA) and linoleic acid (LA) were detected in varying amounts
in all diets. Eicosapentanoic acid (EPA), docosahexanoic acid (DHA), γlinolenic acid (GLA) and arachidonic acid (AA) were present in every diet
(Table 4.10).
Similar to those observed in the diet samples, SFA content in
fingerling muscle samples was predominantly palmitic acid and stearic acid,
and oleic acid was the main MUFA, and both palmitic and oleic acid were
fairly constant throughout the groups. MUFA levels in the muscle ranged from
43.6-46.8% of total fatty acids, irrespective of the experimental diet groups, as
58
with SFA levels at 29.6-33.5% of total fatty acids (Table 4.11). Both muscle
MUFA and PUFA seemed to be affected by the dietary unsaturated fatty acids,
where they were both influenced by the increase or decrease of MUFA and
PUFA in the diet samples. Although the levels of n-6 in the diets were low,
results of muscle and liver samples show much higher n-6 content as
compared to the diets.
In the liver samples, MUFA levels increased proportionally to the
inclusions of the substitute proteins and were composed of mainly oleic acid at
an average of 93%. Increasing amounts of oleic acid in the liver were observed
as the incorporation of chicken offal and palm kernel cake in the diet increased.
PUFA levels, in contrast, decreased proportionally to the substitution of fish
meal in the experimental diets. AA was high in the liver of fingerlings
consuming the animal protein diets, while there were lower amounts present in
those from the experimental diets containing palm kernel cake. Liver LA
decreased as substitution levels of chicken offal increased, though, the reverse
was recorded for the palm kernel cake diet (Table 4.12).
Inclusion of chicken offal in the experimental diets increased the SFA
and MUFA content of the dietary samples, whereas the levels for PUFA, n-3
and n-6 decreased with the incorporation of chicken offal. Likewise, SFA,
MUFA and PUFA in the muscle samples from fingerlings consuming the
chicken offal diet increased. SFA content in the liver samples, in contrast,
were not affected by the dietary fatty acids, while the rest of the fatty acids
seemed to be influenced.
59
Meanwhile, the palm kernel cake-based diets showed increase in SFA
and MUFA, while PUFA decreased with the level of substitution of fish meal.
n-3 and n-6 content decreased and were fairly constant in the fingerling
muscle samples respectively, despite no obvious reflections in the diet samples.
As the dietary MUFA and PUFA respectively increased and decreased, the
MUFA content in the liver samples showed a similar trend, although PUFA
levels were similar through out the experimental diets utilizing palm kernel
cake as the substitute protein.
60
61
Table 4.10: Fatty acid analysis of diet samples (% total fatty acids)
Fatty acid*
FMG
1CO
2CO
3CO
C12
0.03a
0.04a
0.07a
0.11a
b
c
a
C14
1.11
1.27
0.78
1.50d
c
a
b
C16
26.56
21.14
23.92
24.76b
C18
6.29g
2.45b
2.15a
3.38c
b
b
b
C20
0.20
0.21
0.20
0.19b
d
a
b
C24
0.18
0.08
0.12
0.22e
c
c
c
C16:1
2.75
2.80
2.64
2.96d
C18:1n9
36.51ab
47.92c
48.10c
48.12c
b
ab
ab
C18:2n6
4.01
3.86
3.80
3.57a
b
c
e
C18:3n3
0.24
0.38
0.47
0.58f
d
cd
a
C18:3n6
0.44
0.40
0.24
0.33bc
C20:2n6
2.02d
0.26a
0.26a
0.33a
e
c
C20:3n6
2.13
0.79
0.50b
0.12a
e
d
c
C20:4n6
0.33
0.21
0.19
0.17b
c
b
b
C20:5n3
4.14
2.40
2.56
2.48b
C22:1n6
0.55d
0.29a
0.31ab
0.42c
f
g
e
C22:5n3
5.22
5.88
4.44
1.87a
d
f
e
C22:6n3
6.68
8.96
8.50
8.10e
c
c
d
C24:1
0.61
0.66
0.74
0.81d
SFA
34.37c
25.19a
27.24a
30.16b
a
b
b
MUFA
39.87
51.67
51.80
52.31b
e
d
cd
PUFA
25.76
23.14
20.96
17.53ab
c
c
c
n-3
16.28
17.62
15.97
13.01b
n-6
9.48d
5.81ab
5.30a
4.94a
61
Diet
1PKC
3.44b
2.36e
28.91d
5.88f
0.15a
0.19d
2.04b
35.46a
3.52a
0.22a
0.35bc
2.41e
1.84d
0.19c
3.91c
0.47cd
2.34b
5.93c
0.39b
40.93d
37.89a
21.18cd
12.40b
8.78d
2PKC
4.63c
2.79f
29.15d
4.87ez
0.18ab
0.16c
1.94b
36.64ab
3.83ab
0.38c
0.32b
1.85c
1.69d
0.14a
2.56b
0.42c
3.16c
5.22b
0.31ab
41.78d
38.65a
19.57bc
11.32ab
8.25cs
3PKC
6.24d
2.99g
30.05d
4.26d
0.25c
0.11b
1.52a
37.49b
4.07b
0.45d
0.28ab
1.17b
0.93c
0.13a
1.80a
0.39bc
3.79d
3.79a
0.29a
43.90e
39.30a
16.80a
9.83a
6.97bc
SEM§
0.55
0.18
0.69
0.33
0.01
0.01
0.11
1.30
0.06
0.03
0.02
0.19
0.16
0.01
0.18
0.02
0.31
0.39
0.05
1.57
1.46
0.68
0.62
0.39
*Values are means for triplicate analysis. Mean values within any single row with different superscripts are noted to be significantly different
(P ≤ 0.05)
§
Standard error of mean
62
62
63
Table 4.11: Fatty acid analysis of muscle samples (% total fatty acids)
Fatty acid*
Muscle sample§
FMF
1COF
2COF
3COF
1PKCF
C12
1.17bc
1.13b
1.30d
1.25cd
0.51a
b
a
d
c
C14
1.71
1.61
2.14
2.01
2.84e
C16
21.08b
19.17a
21.22b
22.57cd
23.70d
f
e
bc
a
C18
7.99
7.38
5.96
4.79
6.25d
bc
ab
c
d
C20
0.18
0.15
0.21
0.27
0.18bc
d
d
b
a
C24
0.14
0.15
0.08
0.06
0.10c
C16:1
2.90d
2.09b
3.22e
3.57f
1.49a
a
a
a
a
C18:1n9
41.14
42.94
42.79
42.82
41.65a
c
b
a
a
C18:2n6
3.53
2.96
2.45
2.24
3.41c
b
a
d
e
C18:3n3
0.69
0.62
0.89
1.17
0.77c
C18:3n6
0.88e
1.06e
0.74cd
0.66b
0.33a
b
a
c
d
C20:1
0.22
0.15
0.28
0.35
0.16a
a
c
d
e
C20:2n6
1.22
1.62
1.71
1.85
1.47b
c
b
ab
a
C20:3n3
0.91
0.34
0.30
0.23
0.28ab
d
cd
b
a
C20:3n6
0.68
0.63
0.57
0.46
0.57b
C20:4n6
2.61a
3.56c
3.13b
2.79a
3.33bc
b
e
d
c
C20:5n3
3.76
8.39
6.20
5.91
3.15a
e
a
b
c
C22:1n6
4.56
1.42
2.07
2.93
4.56e
a
ab
d
cd
C22:5n3
1.19
1.25
1.84
1.63
2.42e
C22:6n3
2.89b
3.23c
2.81b
2.39a
2.51a
d
b
s
a
C24:1
0.56
0.15
0.08
0.05
0.32c
ab
a
ab
ab
SFA
32.27
29.59
30.92
30.95
33.58b
ab
ab
ab
b
MUFA
44.82
45.33
46.37
46.79
43.62a
ab
c
b
ab
ab
PUFA
18.35
23.66
20.64
19.33
18.24
63
2PKCF
1,55e
3.50f
21.42bc
6.08cd
0.13a
0.07ab
2.11b
42.26a
3.60c
0.90d
0.79d
0.15a
1.44b
0.26ab
0.68d
2.84a
3.75b
4.11d
1.57cd
2.45a
0.34c
32.75b
44.86ab
ab
18.28
3PKCF
2.11f
2.76e
22.09bc
5.85b
0.15ab
0.08b
2.32c
42.13a
3.60c
0.96e
0.71bc
0.21b
1.28a
0.23a
0.58bc
2.78a
3.26a
4.66e
11.49bc
2.41a
0.34c
33.04b
45.00ab
a
17.30
SEM¥
0.10
0.14
0.32
0.22
0.01
0.01
0.15
0.23
0.12
0.04
0.05
0.02
0.05
0.05
0.02
0.08
0.41
0.28
0.09
0.07
0.04
0.40
0.35
0.52
64
Table 4.11 (continued)
Fatty acid
Muscle sample
FMF
1COF
2COF
3COF
1PKCF
2PKCF
3PKCF
SEM
n-3
9.43a
13.83c
12.04b
11.33b
9.13a
8.93a
8.35a
0.44
b
a
a
a
b
b
b
n-6
13.48
11.25
10.67
10.93
13.67
13.46
13.61
0.34
*Values are means for triplicate analysis. Mean values within any single row with different superscripts are noted to be significantly different
(P ≤ 0.05)
§
Muscle samples of fingerlings consuming replacement levels of fish meal at 0% (FMF), 33.3% (1COF), 66.7% (2COF) and 100% (3COF),
16.5% (1PKCF), 33.0% (2PKCF) and 50% (3PKCF)
¥
Standard error of means
64
65
Table 4.11: Fatty acid analysis of liver samples (% total fatty acids)
Fatty acid*
Liver sample§
FMF
1COF
2COF
3COF
1PKCF
C12
0.07a
1.06d
1.07d
1.17e
0.49b
e
d
b
c
C14
2.02
1.93
1.61
1.78
1.64b
C16
30.69d
24.50b
22.27a
21.69a
21.68a
e
c
a
a
C18
10.29
8.88
7.01
6.84
9.30d
a
c
ab
a
C20
0.28
0.33
0.29
0.28
0.33c
c
a
b
a
C24
0.22
0.16
0.19
0.15
0.18b
C16:1
1.78c
2.04d
2.11de
2.24e
1.34a
a
b
c
d
C18:1n9
30.45
33.96
41.00
43.8
39.31c
bc
bc
ab
a
C18:2n6
1.18
1.20
1.04
0.76
1.00ab
b
e
c
a
C18:3n3
0.89
1.25
0.97
0.66
0.97c
C18:3n6
0.21b
0.69c
0.66c
0.65c
0.10a
b
f
d
g
C20:1
0.39
0.75
0.63
0.95
0.35a
e
d
e
e
C20:2n6
3.57
2.50
2.68
3.57
1.81a
a
c
c
c
C20:3n3
0.01
0.93
0.94
0,92
0.07b
g
d
b
a
C20:3n6
1.52
0.79
0.61
0.37
1.02f
C20:4n6
0.01a
2.72b
2.68b
2.64b
0.03a
c
e
d
a
C20:5n3
5.18
6.16
5.47
3.53
4.94c
d
bc
b
c
C22:1n6
6.16
4.75
4.63
4.95
10.45f
e
e
bc
a
C22:5n3
2.83
2.69
1.65
1.24
2.33d
C22:6n3
1.79c
2.56f
2.34ef
2.03cd
2.08de
b
a
a
a
C24:1
0.48
0.15
0.16
0.19
0.58c
c
b
a
a
SFA
43.57
36.86
32.44
31.91
33.62a
a
b
c
d
MUFA
33.10
36.90
43.90
46.76
41.58c
PUFA
17.17c
21.49d
19.03cd
16.38bc
14.35ab
65
2PKCF
0.86c
1.49a
26.14c
7.39b
0.32bc
0.21c
1.57b
41.00c
1.39cd
1.09d
0.07a
0.54c
2.36c
0.02ab
0.86e
0.02a
4.38b
7.07e
1.51b
1.21b
0.50b
36.41b
43.61c
12.91a
3PKCF
1.63f
1.41a
25.88c
9.16d
0.34c
0.32d
1.35a
40.78c
1.60d
1l55e
0.08a
0.70e
2.24b
0.04ab
0.71c
0.02a
4.53b
4.30a
1.90c
0.89a
0.57c
38.74b
43.40c
13.56a
SEM¥
0.10
0.05
0.69
0.28
0.01
0.01
0.08
0.98
0.07
0.06
0.06
0.04
0.14
0.10
0.08
0.30
0.18
0.45
0.13
0.13
0.05
0.89
1.01
0.69
66
Table 4.12 (continued)
Fatty acid
Liver sample
FMF
1COF
2COF
3COF
1PKCF
2PKCF
3PKCF
SEM
n-3
10.69b
13.59c
11.37b
8.38a
10.39b
8.21a
8.91a
0.42
bc
bc
b
bc
c
b
a
n-6
12.64
12.65
12.29
12.95
14.41
11.77
8.95
0.39
*Values are means for triplicate analysis. Mean values within any single row with different superscripts are noted to be significantly different
(P ≤ 0.05)
§
Liver samples of fingerlings consuming replacement levels of fish meal at 0% (FMF), 33.3% (1COF), 66.7% (2COF) and 100% (3COF), 16.5%
(1PKCF), 33.0% (2PKCF) and 50% (3PKCF)
¥
Standard error of means
66
CHAPTER 5
DISCUSSION
5.1
Digestibility Trials
Digestibility testing plays a role in determining whether the food
source is suitable for a certain subject. It helps in the analysis of feed quality,
which facilitates in deciding which feed to be used for maximum nutrient
absorption, and ultimately the growth rate of the subject (Reuss, 2001).
Nutrient digestibility is usually reported as the apparent digestibility. The
difference of a specific nutrient in the faeces and feed is used to calculate the
percentage of intake of the nutrient. This method is a simpler way of assessing
the digestibility, as it only takes into account the amount of fecal nutrients
(Pagan, 1997).
To quantify digestibility of nutrients in a certain ingredient, the
digestibility coefficient is used. The particular nutrient is often included in a
basal diet at a certain percentage where calculations of the digestibility are
then conducted through nutrient measurements in the diet and faeces
(Guillaume and Choubert, 2001). The apparent digestibility coefficients for
dry matter (ADM) and protein (ADC) are influenced by the type of raw
ingredients used, as suggested by Gul, Salim and Rabbani (2007). Substitution
of fish meal in the diets lowered both the ADM and ADC for all experimental
diets. Plant proteins generally contain higher crude fiber and nitrogen free
extract, and are expected to yield lower ADM when compared to alternative
67
protein sources from animal origins (Sugiura et al., 1998). As the digestibility
coefficient is an indicator of how much nutrients are absorbed by the subject, a
higher digestibility coefficient is preferable for any type of feed. Due to this
reason, the plant protein-based alternative ingredients were partially
substituted whereas the animal protein sources were fully substituted.
The control fish meal diet in this study showed a higher ADM level at
92%, compared to that of 87% in juvenile cobia when Peruvian fish meal was
used in feeds (Zhou et al., 2004), and 71% when used in feeds for the
humpback grouper (Shapawi, Ng and Mustafa, 2007). Soy ADM levels
reported for the barramundi was at 56%, while the silver perch could digest
dry matter better at 73%, according to Smith et al. (2001). Little information is
available on the ADM of palm kernel cake for fish; a maximum of 50%
digestibility
was
obtained
for
the
red
tilapia
when Trichoderma
longibrachiatum fermented palm kernel cake was used (Iluyemi et al., 2010).
The ADM levels for soy waste and palm kernel cake fed to T. tambroides
fingerlings were recorded at 67% and 65% respectively. If based on the
reported values for other species, these levels were proven to be acceptable.
ADM results for anchovy-based diets ranged between 89% to 91% for
the Senegalese sole and Nile tilapia, (Koprucu and Ozdemir, 2005; Dias et al.,
2010), whereas the Atlantic salmon and halibut could digest krill dry matter at
a high of 96% (Suontama et al., 2007). Both results were higher than what was
obtained for the T. tambroides fingerlings, and could be due to the source of
the proteins where anchovy and krill are both found in marine environments.
68
As stated by Tibbetts, Milley and Lall (2006) as well as Koprucu and Ozdemir
(2005), variance in ADM is often dependent on the source of ingredients,
whereby sources used in the diets have different digestibility values on
different species. As nutrient composition of individual ingredients such as
crude fiber and ash will affect the ADM (Koprucu and Ozdemir, 2005;
National Pork Board, 2008), lower ADM for anchovy and krill could be due to
the higher crude fiber and ash content as compared to fish meal. Anchovy
waste which was supplied by the local fishermen (Chapter 3.1) contained the
bones, head and offal while krill is naturally high in minerals. Dry matter
digestibility for poultry meal when fed to the juvenile silver perch was 86%
(Allan et al., 2000), and the experimental CO diet did not differ much at 82%
ADM levels for the T. tambroides fingerlings.
Current results of the soy waste ADC levels were within the range of
soy meal ADC acquired by researchers for the Nile tilapia, Atlantic cod,
rainbow trout and rohu ranged from 84% to 92% (Koprucu and Ozdemir, 2005;
Tibbetts, Milley and Lall, 2006; Barrows, Stone and Hardy, 2007; Noreen and
Salim, 2008), even though the soy waste which was used in the present study
was the by-product of soy bean processing, containing less protein than soy
meal, which is the leftover after oil extraction. Although without any
additional information on the ADC for palm kernel cake in fish, it can be
deduced that the protein digestibility of the palm kernel cake is still acceptable,
as the 87% ADC obtained was within the range for soy meal ADC, and there
are values lower in other well-known plant proteins for other species such as
wheat meal for Senegalese sole (Dias et al., 2010), cottonseed meal for
69
rainbow trout (Cheng and Hardy, 2002), corn meal in Nile tilapia (Ribeiro et
al., 2011) and seaweed meal in trout and Nile tilapia (Pereira et al., 2012).
The chicken offal, anchovy waste and krill diets showed protein ADC
levels which were similar to other researches at 89%, 93% and 96%
respectively. Maina et al. (2002) and Koprucu and Ozdemir (2005) reported
protein ADC levels of 90% for anchovy in diets. Shapawi, Ng and Mustafa
(2007) obtained protein ADC levels between 86% and 90% while Gaylord,
Barrows and Rawles (2008) reported values of 88% for the digestibility of
protein from chicken by-products.
Tibbetts, Milley and Lall (2006)
demonstrated results of 96% protein ADC levels for krill. The high ADC
value obtained for fish meal is usually attributed to the more balanced amino
acid profile (Asad et al., 2005)
Decrease in preference for the experimental diets when compared with
the fish meal diet could be attributed to the palability of the diet that affects
feed intake, where the fish meal diet is the most palatable due to the fish meal
content (Miles and Chapman, 2006). In the wild, diets of T. tambroides also
include fruits like palm, fig, and engkabang. Since palm kernels make up part
of the natural diet for T. tambroides (Geoffrey, 2006), the preference for palm
kernel cake substituted diet over the soy waste diet was obvious. On the other
hand, despite the higher protein digestibility of anchovy waste and krill, the T.
tambroides fingerlings preferred the chicken offal diet over the former two. As
fishes are able to differentiate physicochemical and nutritional properties of a
diet (de la Higuera, 2008), it was assumed the chicken offal diet contains
70
nutrients which are more suited to the diets of T. tambroides, and was
therefore chosen for the growth study.
Formulation of fish diets require careful nutrient compositions using
ingredients at a specific inclusion rate, based on the availability of nutrients
and energy in each. Diets are usually formulated based on nutrient figures
obtained from literature. During occasions where literature cannot be found
for a certain species, information from closely related species is utilized
(Maina et al., 2002). As T. tambroides is still a relatively new species in
aquaculture, results from other freshwater fish such as the carp and tilapia are
often used as guidelines.
5.2
Growth Studies
The growth of an animal is described as a change in the animal, be it
through size (weight and length), tissues, internal chemical compositions or
even reproductive abilities. Many factors are involved to achieve maximum
growth potential. Dietary input with sufficient, high quality digestible
nutrients and environmental input especially through oxygen and water are
vital to drive the growth rate (Bureau et al., 2000). The growth rate of any
animal is receptive to environmental changes and measurements of the growth
rate are often used to gauge the growth performance (Elliott and Hurley, 1995).
In this study, isoproteic diets were employed at 42% crude protein
level. Ng, Abdullah, de Silva (2008) conducted a pioneer research on T.
tambroides fingerlings weighing 21 g, where the dietary crude protein content
71
needed for optimal growth was at 48%, which is higher than the current
research. However, in another study by Misieng, Kamarudin and Musa (2011),
T. tambroides fingerlings of estimated 5 g in weight could achieve a favorable
growth rate after consuming feed with only 40% crude protein content.
Therefore based on those results, 42% crude protein used in this study would
be sufficient for the growth of the fingerlings.
T. putitora fry of an initial weight of 0.4 g had optimal growth when
consuming diets with a minimum crude protein content of 45% (Sawhney and
Gandotra, 2010), while bigger fingerlings at 1 g could survive on diets
containing slightly less protein at 40% (Hossain et al., 2002). Islam (2002)
recorded excellent growth results in T. putitora fingerlings weighing at least of
10 g being fed supplementary feeds with 30% crude protein, while optimal
crude protein content for the pond-reared fingerlings of the same species was
noted at 45% (Islam and Tanaka, 2004).
Even as Ng and Andin (2011) reported crude lipid levels for the T.
tambroides were optimal at 5%, and any higher levels would not affect the
growth performance in any way, Ramezani-Fard et al. (2011) proved that diets
containing up to 20% crude dietary lipid made up mainly of oleic acid would
be beneficial for T. tambroides over a certain period. Bazaz and Keshavanath
(1993), on the other hand, stated optimal lipid content of 11% in feeds for T.
khudree had a noteworthy effect on the fish and optimal growth could be
achieved. Moreover, there are claims that induction of protein sparing could
be reached when there is an increase of dietary lipid in the feed. For example,
72
Bazaz and Keshavanath (1993) observed protein sparring in T. khudree with
the inclusion of sardine oil in their diets, where the growth was derived from
the dietary lipids. In a study by Ng, Abdullah and de Silva (2008), the growth
rate of T. tambroides was not affected; nevertheless, the increased lipid
content provided extra energy which was stored in the form of body fat,
particularly in the visceral cavity of the fish. But, this is not always applicable,
as at least one study reported that such fish suffered from an adverse effect,
such as a decreased growth performance (Chatzifotis et al., 2010).
In the present study, all the experimental diets had significantly
different (P=0.000) crude lipid content. Despite this, based on observations of
the growth rate for all the diets, fingerlings fed the control diet had a similar
growth rate as the other fingerlings on the experimental diets. Thus, it could be
speculated that the crude lipid content in the diets did not influence the growth
of the T. tambroides fingerlings, and the growth would most probably be
credited to the crude protein content in the feeds.
Calcium, potassium and phosphorus play important roles in the
development of the fish. Limiting calcium and phosphorus would affect the
skeletal growth while potassium is essential physiologically (Davis and Gatlin,
1996). The more readily available minerals are calcium and potassium, which
are often present in water, and easily absorbed, thus reducing the need for
supplementation, however other minerals such as phosphorus, magnesium,
iron and selenium should be found as part of the dietary requirements in the
feed.
73
From the results in Table 4.4, all the experimental diets, including the
control fish meal diet, contained 5.34-12.72 g/100 g and 2.98-4.64 g/100 g
total mineral content of dietary calcium and potassium respectively, of which
the minimum requirement for each was 0.5 g and 0.1-0.3 g/100 g dry feed as
documented by Chow and Schell (1978) for warm water fishes. Ye et al.
(2006) reported dietary calcium content of more than 0.33 g/100 g has no
significant effect on the growth performance of the fish, which can also be
seen in this study from the growth of the T. tambroides fingerlings.
Phosphorus content in plant material is often lower than from animal sources
(Koumi et al., 2011), which explains the lower phosphorus level in the palm
kernel cake-based diets when compared to the fish meal and chicken offal
diets.
Growth is usually measured over a period of time, and the growth rate
is represented in a sigmoid curve. Aquaculturists are often striving to achieve
the maximum growth rate of fish, and this has led to the formulation of
measurements such as the absolute growth rate, thermal unit growth
coefficient and the specific growth rate (SGR). The absolute growth rate is
used as a day-by-day measurement of the growth, whereas the SGR expresses
the growth over a certain period of time, and is the more popularly used
formula (Kjorsvik, Pittman and Pavlov, 2004; Strand, Magnhagen and Alanara,
2011). Protein efficiency ratio (PER) is an evaluation of the protein quality in
the diet which contributes to growth of the fish rather than the overall diet.
Assumptions formed when using this ratio were that weight gain of the fish
74
was contributed by the muscle formation, and all protein consumed from the
diet was used in muscle tissue synthesis (Hepher, 1988).
The gibel carp has an SGR of at least 2.3% when the alternative
protein sources obtained from animals such as poultry by-product meal as well
as meat and bone meal were used in the diet (Hu et al., 2008). Studies by
Wang et al. (2006) on the cuneate drum feed substitution yielded SGR of
1.7%. Significant levels of substitution of animal-rendered proteins could
replace fish meal in the diets for the rainbow trout, although the growth rate
was not stated and thus it could not be compared with other reported studies
(El-Haroun, Azevedo and Bureau, 2009). Despite the numerous positive
reviews on animal protein substitution, fish meal diets replaced by alternative
proteins were found to be unsuccessful for the growth of mirror carp
fingerlings (Emre, Sevgili and Diler, 2003).
There is not much current data on studies of the SGR for palm kernel
cake substitution for fish. Nevertheless, the control diet and the experimental
diets showed no significant difference between groups for the SGR of the
fingerlings and PER of the diets. This indicated that SGR was not affected by
the level of inclusion of chicken offal and palm kernal cake (Table 4.6).
However, the highest SGR and PER were demonstrated by fingerlings fed
3CO and 2PKC diets. In fact, it was found that experimental diets with
alternative proteins could perform as well as the control diet, suggesting a
possible replacement of the fish meal diet with the experimental diets.
75
Despite having comparable crude protein content in their diets for the
fingerlings, T. tambroides fingerlings in this experiment had a slightly higher
SGR than those reported by Misieng, Kamarudin and Musa (2011) when using
fingerlings of similar size. Several factors which could influence these results
include the feeding time, temperature, nutritional utilization and method
(Sanchez-Muros et al., 2003), types of protein sources use (Stankovic, Dulic
and Markovic, 2011) and even possibly, the lunar cycle (Haroon and Pittman,
1997). The method of feeding was affected by the feeding time, where, in the
wild, the fishes could feed at will, according to their natural feeding rhythm.
As the fingerlings in this study were fed at specific periods of time, the most
possible explanation for this SGR variance between the current study and the
results reported by Misieng, Kamarudin and Musa (2011) could be due the
type of protein used in the studies.
The mahseer family is known for its slow growth by anglers, and is
further established by the results of several studies on the different Tor species.
The T. douronensis studied by Ingram et al. (2005) had an SGR of 0.71%. The
chocolate mahseer yearlings recorded a maximum SGR of 0.82%, while the
adults were slightly slower at 0.6% (Laskar, Das and Tyagi, 2009). Golden
mahseer hatchlings fed diets without any added supplements have a growth
rate of 0.41% (Mohan, Bhanja and Basade, 2009). Fingerlings of a different
age have a different growth rate (Ingram et al., 2005), where T. tor has a
reduced growth as it matures (Desai, 2003) agreeing with the reduction of
SGR for T. tambroides from a high of 6.44% to a low of 0.09% (Ingram et al.,
2005). Fingerlings in this research had an SGR of between 0.43% and 0.46%,
76
and were considered to be acceptable based on comparisons with the other Tor
species.
The length-weight relationship and the relative condition factor
indicate the well-being of the fingerlings. Fulton (1902) stated the condition
factor is an indicator of the welfare of a population whereby a factor of more
than one would show how healthy a population is in relation to the growth.
The condition factor obtained from the growth study was similar to other
studies on the carp species such as Scardinius erythrophtalmus, Carassius
auratus gibelio, Tinca tinc, and Hemiculter leucisculus wherein Moradinasab
et al. (2012) obtained a value 1.0. The Labeobarbus batesii had a factor range
of 1.0 to 1.3 due to the slightly different seasons in the country (Tomedi et al.,
2014). A relative condition factor range of 0.98 to 1.09 was noted in Tor tor
by Saini, Ojha, and Gupta (2014).
The growth coefficient ‘b’ in this study was less than three, which
indicated a negative allometric growth, in which the fingerlings were growing
in length, but not yet putting on enough weight (Nehemia, Maganira and
Rumisha, 2012), despite the positive relative condition factor obtained.
Pioneer studies in Pakistan on Tor macrolepis showed a result of 3.14 for the
‘b’ value for T. macrolepis, however the researchers admit it is not indicative
of the whole Tor species, especially those in different ecosystems (Chatta and
Ayub, 2010). In fact, the use the cube law itself has faced opposition in the
past due to the lack of attention to the form of the fishes, in which different
77
stages of life would produce variations that would possibly affect the body
(Ricker, 1958).
Chicken offal has been studied as part of the animal rendered proteins
substituting for fish meal in a range of fish species, where different inclusion
levels yielded different results in different species. Usman et al. (2006)
realized the humpback grouper juveniles could accept feed containing up to
47% chicken offal, whereas the Nile tilapia and common carp would only
consume feed containing a maximum of 20% chicken offal without any
detrimental effect on the growth or full body composition (Belal, Al-Owaifeir
and Al-Dosari, 1995; Ufodike, Adijetu and Ofor, 2003). Zhou et al (2011)
substituted up to 60% of fish meal in diets for the juvenile cobia while Rawles
et al. (2006) was more successful with the hybrid striped bass at 70% fish
meal substitution with poultry by-products. This current research shows the T.
tambroides fingerlings were able to accept full substitution of fish meal with
chicken offal (3CO diet) without compromising the growth performance.
In Malaysia, where palm kernel cake is a commodity, extensive usage
of palm kernel cake in ruminant feed, especially cattle, can be found, with up
to 50% of daily feed comprising of palm kernel cake (Osman, 1986; Osman
and Hisamuddin, 1999). Palm kernel cake contains high levels of crude fiber,
and while ruminants can easily accept the fiber, palm kernel cake is usually
included in diets for non-ruminants such as pigs (Adesihinwa, 2007) and hens
(Adrizal et al., 2011) to contribute to the bulk of the feed, and at the same time
78
supply certain amounts of crude protein, energy, vitamins and minerals
(Alimon, 2004).
Even though the usage of palm kernel cake is widespread in land
animal diets, in the aquaculture sector, palm kernel cake has yet to gain
popularity, as there are several limitations which contribute to the low
acceptance of palm kernel cake. Still, up to 20% could successfully be
substituted into feeds for the hybrid catfish (Ng and Chen, 2002) and in red
tilapia diets, up to only 10% inclusion level was used (Iluyemi et al., 2010)
although Zahari and Alimon (2004) suggested dietary palm kernel cake
inclusion could reach up to 20% for freshwater fish. There was no significant
difference in fingerling SGR between the palm kernel based diets and the
control diet, implying fish meal could be partially substituted with palm kernel
cake at 33% substitution level (2PKC diet), yet contribute to the same growth
rate as the control diet.
5.3
Amino Acid Analysis
Glutamic acid and aspartic acid were the two most commonly found
amino acids, and according to Zuraini et al. (2006) glutamic acid is more
abundant than aspartic acid. Animal protein sources generally contain low
cysteine levels and due to partial substitution of fish meal in the palm kernel
cake-based experimental diets, the palm kernel cake diets did not contain as
much cycteine as expected. Thus, resulting in lesser amounts in both diets and
muscle samples of all the experimental diets (Adeyeye, 2009). Although there
was no specific association of amino acids in the experimental diets and
79
muscle samples, the trend of the amino acids in the diets was similar to that in
the muscle samples.
Lysine is an essential amino acid in diets for the growth of freshwater
fish. According to Halver and Hardy (2002), the most favorable lysine levels
for most fish species lie between 4%-5% of total protein content, which is
estimated to be 1.6-2.0 g/100 g feed, based on a 40% crude protein diet. As a
positive control, the fish meal-based diet is assumed to contain the optimal
protein source. However, the chicken offal-based and palm kernel cake-based
diets were not found to be lacking in lysine. Nevertheless, despite the slight
variations in lysine content of all the experimental diets, muscle lysine
contents were comparable to those obtained from the control diet group. The
same observation was demonstrated by Yuan et al (2011) on the Chinese
sucker (Myxocyprinus asiaticus) and Rawles et al. (2013) in his study of the
hybrid striped bass.
Though herbivorous and omnivorous fish are believed to require less
dietary lysine in contrast to carnivorous fishes (Zhou et al., 2007), the
different carp species have increased requirements at 2.1 g/100 g for the grass
carp (Wang et al., 2005), 1.9 g/100 g for the juvenile Jian carp, and 2.3 g/100
g for the Indian major carp (Ahmed and Khan, 2004). Although the dietary
lysine content differed between the experimental diets, growth rate of the
fingerlings consuming all the diets had no significant differences among the
groups. Lower weight gain resulting in diminished growth would be an
indicator of deficiency in lysine. Nevertheless, the chicken offal-based diet
80
performed just as well as the control diet in the growth of the fingerlings, even
though the control diet contained more lysine than the experimental chicken
offal diets. Also, it was noted the total essential amino acid content decreased
with increased of palm kernel cake inclusion level (1PKC>2PKC>3PKC).
Despite this, an excess in dietary lysine might not be as favorable as it might
seem, since excess lysine may produce an opposite effect on the growth or
health of the fish, as in the case of the Indian major carp (Cirrhinus mrigala)
(Ahmed and Khan, 2004), the Nile tilapia (Furuya et al., 2012) and the
Atlantic salmon (Berge, Sveier and Lied, 1998).
Despite the similar crude protein contents of the control and
experimental diets in the study, amino acid compositions in dried muscle
samples varied from diets to diet. As in the case of the rainbow trout and the
common carp, crude protein studies conducted on these two fishes have shown
varied muscle amino acid compositions even though they consumed equal
dietary crude protein contents (Harlioglu, 2011; Yuangsoi and Masumoto,
2012). A study on the jundia catfish has also proven the lack of relationship
between dietary crude protein content and the muscle amino acids content
(Meyer and Fracalossi, 2005). Results from this study agreed with the data
obtained for these freshwater fishes, especially the carp, as the T. tambroides
is part of the Cyprinid family.
In contrast, essential amino acid content in the muscles is affected by
the essential amino acid content in the diet. The results obtained from this
study correspond with those from the study on the Nile tilapia (El-Saidy and
81
Gaber, 1998) as well as salmonids (Lall and Anderson, 2005). Despite the fact
that there was no obvious interaction between crude protein content in feed
and the amino acid profile of the muscles, the quality of the protein source
seem to play a part (Lall and Anderson, 2005) where fingerlings that
consumed the palm kernel cake-based diets had lower essential amino acid
contents even though the diets were partially substituted with fish meal.
5.4
Fatty Acid Analysis
Presence of both palmitic acid, as the dominant SFA, and oleic acid, as
the main MUFA, obtained from the GC analysis were consistent with studies
by others on the Nile tilapia (Teoh, Turchini and Ng, 2011), sea bass (Bhouri
et al., 2010), beluga (Ovissipour and Rasco, 2011) and common carp
(Stancheva and Merdzhanova, 2011), although values recorded in this study
were slightly higher than the rest. Oleic acid is the most abundant fatty acid in
the muscles of T. tambroides fingerlings (Ng and Andin, 2011), and despite
the variation of oleic acid content in the experimental diets, results showed
somewhat little differences between groups, indicating the fingerlings being
able to retain oleic acid selectively (Ramezani-Fard et al., 2011).
Regost et al. (2003) reported lipid content in fish muscle tissue is
affected by the dietary lipids and fatty acids. Based on the results obtained
from this study, the dietary MUFA levels had an impact on the MUFA levels
in the muscles of fingerlings. Freshwater fishes from warmer climates
generally contain more SFA and MUFA (Dey et al., 1993) while marine fishes
are richer in PUFA (Vlieg and Body, 1988). This is based on the fact that both
82
utilizes different food sources, where the marine food source is made up of
PUFA-rich plankton while freshwater fishes like the T. tambroides consume
the vegetation around their habitats, which include fallen jungle fruits, such as
wild figs, as well as small insects and worms (Jabeen and Chaudhry, 2011).
High crude lipid content in the diets has long been suspected to cause
fatty liver disease in fish (Ramezani-Fard and Kamarudin, 2013). Several
studies have been conducted on the juveniles of grass carp, tilapia, as well as
the red drum where it was discovered that more than 5% dietary crude lipid
levels would cause lipid deposition in the liver. It is this deposition which is
detrimental to the health and increased the mortality rate of the juvenile red
drum, although for the juvenile grass carp and juvenile tilapia, only the health
was affected (Du et al., 2005; Gan et al., 2009; Jiang et al., 2010), whereby
the mesenteric fat index and lipid deposition in the liver increased in the
juvenile grass carp (Du et al., 2005) and the juvenile tilapia had a thin body
but tumefaction of the abdomen (Gan et al., 2009). Both were regarded as
symptoms of mild fatty liver disease. However, there were no significant
differences the hepatosomatic index for T. tambroides fingerlings fed diets
containing up to 19% dietary lipid (Ng and Andin, 2011).
Kamarudin et al (2012) proved the usage of palm oil was beneficial to
the growth of T. tambroides fingerlings, although the long term effect on the
development of the fingerlings have not yet been determined (Ramezani-Fard
and Kamarudin, 2013). Ng and Wang (2011) have also established increased
deposition of fatty acids from palm oil in the gonads and eggs of the female
83
Nile tilapia. As the fingerlings used in this study were not matured sexually,
analysis was not conducted on the gonads. Histopathological studies were not
performed on the liver of the fingerlings, and although the diets had increased
crude lipid content due to the addition of palm carotene oil, it cannot be
verified whether the T. tambroides fingerlings were suffering from fatty liver
disease, as there were no changes in health or mortality rates throughout the
six-month growth study. Still, detection of superoxide dismutase activity in the
liver cells indicated potential oxidative stress of the experimental diets on the
liver (Ong, unpublished data).
Although a minimum PUFA/SFA ratio was set at 0.45 by Her
Majesty's Stationery Office (HMSO) (1997), and an optimal ratio of between
1.0 and 1.5 suggested by Kang et al. (2005), too high PUFA/SFA ratios
contributed to increased liver cholesterol in human test subjects (Chang and
Huang, 1998). As the PUFA/SFA ratio of the muscle samples in this study
ranged from 0.52 to 0.79, the flesh of the fish would be able to fulfill the
PUFA/SFA ratio requirements when consumed.
EPA levels detected in fingerling muscle samples were higher than
other works, whereas DHA levels were lower when compared to similar
studies with freshwater fishes (Ramezani-Fard et al., 2011; Teoh, Turchini and
Ng, 2011). There is speculation of n-3 de novo synthesis in T. tambroides
muscles, by enzymes such as elongase and desaturase (Ramezani-Fard et al.,
2011), rather than being obtained from dietary sources. Therefore, the
fingerlings could synthesize EPA from the dietary ALA, where EPA was the
84
main contributor for n-3 fatty acids, and deposited in the muscles of
fingerlings from all diets. Fish having difficulty synthesizing DHA could be
due to the low activity of the said enzymes (Navaro et al., 2012) which is
partially results from higher than optimal water temperatures (Farkas, 1984).
n-6:n-3 ratios in fish muscles have been studied to improve on the
benefits of fish to the human consumer. A range of optimal n-6:n-3 ratios have
been recommended by Stancheva et al. (2012) to be between 0.2 and 1.5. As
with the PUFA/SFA ratio, too high n-6:n-3 ratios have been proven to be
detrimental for health, where it could lead to increased inflammatory response
in the tissues, and increased incidents of blood thrombosis (Lenas and
Nathanailides, 2011). All muscle n-6:n-3 ratios of fingerlings in this study
varied between 0.81 and 1.62, thus making it suitable for human consumption.
5.5
Further Studies
The pellets in this study were produced using a meat extruder, causing
the pellets to be slightly crumbly and not as compact as those produced using a
pelletizer. As a good feed conversion ratio and uniform nutrient distribution
within every fish is obtained through properly pelleted feeds, a poor quality
pellet often results in fine waste production, which dirties the water, in turn
affecting the oxygen quality and the filtering processes. Although pelleting
technology may help to a certain extent, it is what the pellet contains, such as
various binders and emulsifiers, certain protein or fat content, and functional
addictives that will optimize the pellet quality (Gehring, Jaczynski and Moritz,
2009).
85
During the pelleting process, different attractants such as glycine
betaine, trimethylglycine, pheromones and free amino acids (Moore, 2008;
Ajiboye, Yakubu and Adams, 2012) could be added in order to facilitate the
feeding of T. tambroides by increasing consumption volume and reducing
wastage. Usage of attractants would enable the inclusion of alternative protein
sources, and lessen the reliance on fish meal. Since T. tambroides has a keen
sense of smell (Ogale, 2002) and often feeds on jungle fruits, it would be
useful to examine the fruit extracts in attractants for the culturing of the T.
tambroides.
The growth rate in the aquaculture sector is something which is always
focused on. To induce a better growth rate, supplementations are often utilized.
Supplementations are always being researched, to increase the nutrient content
of feed, to increase the health benefits and thus improve on the growth rate of
the fish. Additives commonly used include probiotics (Fuller, 1992). While
feed additives provide benefits in terms of growth, certain additives affect the
different species differently, and it should be noted the additives, particularly
antibiotics, must not harm the environment, especially when the unconsumed
feed is left to deteriorate and the additives dispersed into the water body
(Ajiboye, Yakubu and Adams, 2012).
Supplementation in terms of enhancing the amino acid content in the T.
tambroides muscles should be studied if T. tambroides were to be cultured as a
food fish. Even so, care should be taken to ensure proper amino acid
supplementation is included in the diets, as free amino acids are not as
86
effective as protein-bound amino acids in terms of absorption and availability
(Higuera et al., 1998; Lemme, 2010). Yet, if amino acid supplementation in
feed is conducted correctly, the cost of feed production could be reduced by
cutting down on the crude protein content, thus reducing the need for fish meal
in feeds too (Gaylord and Barrows, 2009).
As the idea of alternative protein sources in feeds for T. tambroides are
still relatively novel, more in-depth research could be conducted on how the
alternative ingredients affect the microflora of the fish, especially within the
digestive tract. Since the microflora generally indicates the overall health of an
organism, it would be helpful to monitor any changes in the microflora as it
would be practical in determining the physical conditions of the fish (Uddin
and Al-Harbi, 2012). It is important to remember some fish can be
asymptomatic, yet continue to be a carrier for certain pathogens (Austin, 2006).
87
CHAPTER 6
CONCLUSIONS
During the digestibility trials, all six experimental diets (FM, SW, PKC,
CO, AW and KR) were accepted by the T. tambroides fingerlings. The fish
meal-based had the highest ADM and ADC values, since fish meal is the most
favorable protein source for fish. This was followed by the animal protein
substitutes chicken offal, anchovy waste and krill, and finally by the plant
protein substitutes palm kernel cake and soy waste.
Based on the preference test, chicken offal and palm kernel cake were
selected for subsequent experimental diets for the growth study, although
chicken offal had the lowest ADC level within the animal protein category,
while palm kernel cake gave a higher ADC level compared to soy waste. The
preference test based on the amount of feed consumed during the feeding time
was considered significant as the fingerlings would willingly consume the diet.
In the growth studies, three experimental diets were formulated for
chicken offal and palm kernel cake respectively, making a total of six
experimental diets, and one control diet which was the fish meal diet. Both
chicken offal and palm kernel cake could be possible substitutes for the fish
meal diet, as these groups had no significant difference in the specific growth
rate.
88
Length-weight relationship and the relative condition factor of the
fingerlings indicate a good correlation between the weight and the length of
the fingerlings consuming the experimental diets, as well as the relative
condition factor shows an overall well-being of the fingerlings. This verifies
the experimental diets were good substitutes for the fish meal diet, and
potentially be developed in a more commercial scale.
The optimal inclusion level for chicken offal was at 100% substitution
of fish meal in the diet (3CO). At this degree of substitution, crude protein
levels were maintained at a sufficient level, and at the same time still obtaining
a similar growth rate while utilizing the least amounts of fish meal. However,
in order to maintain suffice crude protein levels in the diet, palm kernel cake
can only be substituted at 33% of dietary protein, and the remaining 67%
made up with fish meal (2PKC).
Benefits from the experimental diets include a reduced dependency on
fish meal, wherein it has been proven the experimental diets have a
comparable nutrient content to the fish meal diet. Fingerlings were healthy and
there was no mortality observed in any diet. The ingredients for the
experimental diets were easily obtained locally, and are more affordable as
compared to fish meal.
89
BIBLIOGRAPHY
Aberoumand, A. and Deokule, S. S., 2009. Proximate and mineral
composition of wild coco (Eulophia ochreata L.) tubers in Iran. Asian Journal
of Food and Agro-Industry, 2, pp. 203-209.
Adebayo, A. O., 2010. Effect of processing methods on chemical and
consumer acceptability of kenaf and corchorus vegetables. Journal of
American Science, 6(2), pp. 165-170.
Adesehinwa, A. O., 2007. Utilization of palm kernel cake as a replacement for
maize in diets of growing pigs: Effects on performance, serum metabolites,
nutrient digestibility and cost of feed conversion. Bulgarian Journal of
Agricultural Science, 13, pp. 593-600.
Adeyeye, E. I., 2009. Amino acid composition of three species of Nigerian
fish: Clarias anguillaris, Oreochromis niloticus and Cynoglossus senegalensis.
Food Chemistry, 113, pp. 43-46.
Adrizal, A., Yusrizal, Y., Fakhri, S., Haris, W., Ali, E. and Angel, C. R., 2011.
Feeding native laying hens diets containing palm kernel meal with or without
enzyme supplementations: 1. Feed conversion ratio and egg production.
Journal of Applied Poultry Research, 20, pp. 40-49.
Agro-Biotechnology Institute Malaysia, 2013. Empurau project –
Development of sustainable Malaysian mahseer/empurau/kelah aquaculture.
Paper presented at the BioBorneo 2013. Sabah, Malaysia, February 2013.
Ahmed, I. and Khan M. A., 2004. Dietary lysine requirement of fingerling
Indian major carp, Cirrhinus mrigala (Hamilton). Aquaculture, 235, pp. 499511.
Ahmed, M., Aliyu-Paiko, M., Norulaini, A. N., Hashim, R. and Ahmad, A.,
2008. Use of micro-filtered recovered POME sludge as fish feed ingredient for
Nile tilapia (Oreochromis niloticus). Paper presented at the International
Conference on Environmental Research and Technology. Penang, Malaysia,
May 2008.
Ajiboye, O. O., Yakubu, A. F. and Adams, T. E., 2012. A perspective on the
ingestion and nutritional effects of feed additives in farmed fish species. World
Journal of Fish and Marine Sciences, 4(1), pp. 87-101.
Al-Hafedh, Y. S. and Siddiqui, A. Q., 1998. Evaluation of guar seed as a
protein source in Nile tilapia, Oreochromis niloticus (L.), practical diets.
Aquaculture Research, 29(10), pp. 703-708.
Alexander, K., 2009. Local push to ban krill fishing embraced by federal
regulators. Santa Cruz Sentinel, 15 July.
90
Alimon, A. R., 2004. The nutritive value of palm kernel cake for animal feed.
In: Oil Palm Developments 40. Selangor, Malaysia: Universiti Putra Malaysia.
pp. 12-14.
Allan, G.L., Parkinson, S., Booth, M.A., Stone, D.A.J., Rowland, S.J., Frances,
J. and Warner-Smith, R., 2000. Replacement of fish meal in diets for
Australian silver perch, Bidyanus bidyanus: I. Digestibility of alternative
ingredients. Aquaculture, 186, pp. 293-310.
Alvarez, J.S., Hernandez-Llamas, A., Galindo J., Fraga, L., GarcÃa, T.,
Villarreal, H., 2007. Substitution of fishmeal with soybean meal in practical
diets for juvenile white shrimp Litopenaeus schmitti (Perez-Farfante &
Kensley 1997). Aquaculture Research, 38(7), pp. 689- 695.
American Palm Oil, 2006. Palm Kernel Cake as Animal Feed. Washington D.
C., USA: American Palm Oil Council.
Anwahi, A., Cherian, T. and Al-Janahi, A., 2008. Fish meal production from
trash fish. [online] Available at: <http://www.uae.gov.ae/uaeagricent/
FISHERIES/fishmeal_en.stm> [Accessed 9 March 2010].
Aquaculture Asia Pacific, 2010. Managing costs and improving feed
performance. Aquaculture Asia Pacific Magazine, 6(1), pp. 12-15.
Arasaki, A. and Arasaki, T., 1983. Low calories, high nutrition. Japan: Japan
Publications.
Asad, F., Salim, M., Shahzad, H. and Noreen, U., 2005. Estimation of
apparent digestibility coefficient of guar, canola and meat meal for Labeo
rohita. International Journal of Agriculture & Biology, 7, pp. 816-819.
ASEAN/US CRMP, 1991. Fisheries and aquaculture. In: The Coastal
Environmental Profile of South Johore, Malaysia. Manila, Phillipines:
WorldFish, pp. 30-37.
Asgard, T., Berge, G.M., Morkore, T. and Refstie, S., 2007. Flexibility in the
use of feed ingredients turns the salmon industry sustainable. Paper presented
at the USDA National Organic Program, Organic Aquaculture Symposium.
Washington D. C., USA, November 2007.
Austin, B., 2006. The bacterial microflora of fish, revised. The Scientific
World JOURNAL, 6, pp. 931-945.
Azad, S. A and Teo, Z. X., 2012. Suitability of seaweed meal incorporated
with Rhodovulum sp. bacterium as feed supplement for finfish larvae. Borneo
Science, 30, pp. 57-63.
91
Baird, I. G. and Mean, M., 2005. Sesan River fisheries monitoring in
Ratanakiri province, northeast Cambodia: Before and after the construction of
the Yali Falls dam in the Central Highlands of Viet Nam. Cambodia: 3S
Rivers Protection Network (3SPN).
Barrows, F. T., Stone, D. and Hardy, R. W., 2007. The effects of extrusion
conditions on the nutritional value of soybean meal for rainbow trout
(Oncorhynchus mykiss). Aquaculture, 265, pp. 244-252.
Bazaz, M.M. and Keshavanath, P., 1993. Effect of feeding different levels of
sardine oil on growth, muscle composition and digestive enzyme of mahseer,
Tor khudree. Aquaculture, 115, pp. 111-119.
Belal, I. E. H., Al-Owaifeir, A. and Al-Dosari, M., 1995. Replacing fish meal
with chicken offal silage in commercial Oreochromis niloticus (L.) feed.
Aquculture Research, 26, pp. 855-858.
Berge, G. E., Sveier, H. and Lied, E., 1998. Nutrition of Atlantic salmon
(Salmo salar); The requirement and metabolic effect of lysine. Comparative
Biochemistry and Physiology Part A: Molecular & Integrative Physiology,
120(3), pp. 477-485.
Bernama Media, 2012. 'Tembeling river has potential to be biggest freshwater
fish producer in Pahang. Bernama Media, 9 August.
Besecker, K. D. and Duffy, M. L., 2000. Animal feed analysis using ICP-OES
and Microwave Digestion. Connecticut, USA: PerkinElmer, Inc.
Bhouri, A. M., Bouhlel, I., Chouba, L., Hammami, M., El Cafsi, M. and
Chaouch, A., 2010. Total lipid content, fatty acid and mineral compositions of
muscles and liver in wild and farmed sea bass (Dicentrarchus labrax). African
Journal of Food Science, 4(8), pp. 522-530.
Bicudo, A. J. A., Borghesi, R., Dairiki, J. K., Sado, R. Y. and Cyrino, J. E. P.,
2012. Performance of juveniles of Pseudoplatystoma fasciatum fed graded
levels of corn gluten meal. Pesquisa Agropecuária Brasileira, 6, pp. 838-845.
Bista, J., Pradhan, B. R., Rai, A. K., Shrestha, R. K. and Gurung, T. B., 2002.
Nutrition, feed and feeding of gold mahseer (Tor putitora) for domestication
and production in Nepal. Bangladesh: FAO Fisheries Technical Paper.
Bligh, E. G. and Dyer, W. J., 1959. A rapid method of total lipid extraction
and purification. Canadian Journal of Biochemistry and Physiology, 37, pp.
911-917.
Boateng, M., Okai, D. B., Baah, J. and Donkoh, A., 2008. Palm kernel cake
extraction and utilisation in pig and poultry diets in Ghana. Livestock Research
for Rural Development, 20, Article #99.
92
Budiati, T., Rusul, G., Abdullah, W. N. W., Arip, Y. M., Ahmad, R. and
Thong, K. L., 2013. Prevalence, antibiotic resistance and plasmid profiling of
salmonella in catfish (Clarias gariepinus) and tilapia (Tilapia mossambica)
obtained from wet markets and ponds in Malaysia. Aquaculture, 372-375, pp.
127-132.
Bureau, D. P. and Cho. C. Y., 1999. Measuring digestibility in fish. Ontario,
Canada: UG/OMNR Fish Nutrition Research Laboratory.
Bureau, D. P., Harris, A. M. and Cho, C. Y., 1999. Apparent digestibility of
rendered animal protein ingredients for rainbow trout (Oncorhynchus mykiss).
Aquaculture, 180, pp. 345–358.
Bureau, B.P., Azevedo, P.A., Tapia - Salazar, M. and Cuzon, G., 2000. Pattern
and cost of growth and nutrient deposition in fish and shrimp: Potential
implications and applications. In: L. E. Cruz-Suarez, D. Ricque-Marie, M.
Tapia-Salazar, M. A. Olvera-Novoa, and R. y Civera-Cerecedo, eds. Avances
en Nutricion Acuicola V. Memorias del V Simposium Internacional de
Nutricion Acuicola. Yucatan, Mexico, pp. 111-140.
Canadian Life Science, 2012. SGE BPX70 FAME analysis. In:
Chromatography Essentials, Columns and Supplies. Canada: Canadian Life
Science Inc, pp. 324.
Catacutan, M. R., Eusebio, P. S. and Teshima, S., 2003. Apparent digestibility
of selected feedstuffs by mud crab, Scylla serrate. Aquaculture, 216, pp. 253261.
Chan, A. L., 2009 All for the King. The Star, 31 October.
Chan, K. W., Khong, N. M. H., Iqbal, S., Mansor, S. M. and Ismail, M., 2013.
Defatted kenaf seed meal (DKSM): Prospective edible flour from agricultural
waste with high antioxidant activity. LWT - Food Science and Technology, 53,
pp. 308-313.
Chang, N. W. and Huang, P. C., 1998. Effects of the ratio of polyunsaturated
and monounsaturated fatty acid to saturated fatty acid on rat plasma and liver
lipid concentrations. Lipids, 33, pp. 481-487.
Chang, S. K. C., 2003. Protein Analysis. In: S S. Nielsen, ed. Food Analysis.
New York: Kluwer Academic, pp. 136.
Chantiratikul, A., 2005. Effects of kenaf (Hibiscus Cannabinus) as a
substitative feed on lactating dairy cattle. PhD. Universiti Putra Malaysia.
Chatta, A. M. and Ayub, M., 2010. Growth performance of hatchery reared
golden mahseer (Tor macrolepis) at Sialkot, Pakistan. Biologia (Pakistan),
56(1&2), pp. 1-8.
93
Chatzifotis, S., Panagiotidou, M., Papaioannou, N., Pavlidis, M., Nengas, I.
and Mylonas, C., 2010. Effect of dietary lipid levels on growth, feed
utilization, body composition and serum metabolites of meagre (Argyrosomus
regius) juveniles. Aquaculture, 307, pp. 65-70.
Che Musa, C. U. and Nuruddin, A. A., 2005. Trash fish production and
national fish feed requirement in Malaysia’. Paper presented at the Regional
Workshop on Low Value and ‘Trash Fish’ in the Asia-Pacific Region. Hanoi,
Vietnam, June 2005.
Cheng, Z. J. and Hardy R. W., 2002. Apparent digestibility coefficients and
nutritional value of cottonseed meal for rainbow trout (Oncorhynchus mykiss).
Aquaculture, 212(1-4), pp.361-372.
Chong C. K., 1992. Economics of on-farm aquaculture feed preparation and
use. Paper presented at the FAO/AADCP Regional expert consultation on
Farm-made Aquafeeds. Bangkok, Thailand, December 1992.
Choo, Y. M., 2011. Overview of Malaysian oil palm industry 2010. Kuala
Lumpur, Malaysia: Malaysian Palm Oil Board.
Chow, K. W. and Schell, W. R., 1978. The Minerals. Paper presented at the
FAO/UNDP Training Course in Fish Feed Technology, Washington D. C.,
USA, October 1978.
Chowdhury, M. A. and Yahya, K., 2012. Sustainable seafood production:
Malaysian status and comparison with the world. Paper presented at the
International Conference Aquaculture Indonesia (ICAI). Semarang, Indonesia,
November 2012.
Conklin, D. E., 2009. Use of Soybean Meal in the Diets of Marine Shrimp.
Missouri, USA: United Soybean Board and American Soybean Association.
Conner, S. R., 2002. Characterization of guar meal for use in poultry rations.
PhD. Texas A&M University.
Costas, M., Lavilla, I., Gil, S., Pena, F., de la Calle, I., Cabaleiro, N. and
Bendicho, 2010. Evaluation of ultrasound-assisted extraction as sample pretreatment for quantitative determination of rare earth elements in marine
biological tissues by inductively coupled plasma-mass spectrometry. Analytica
Chimica Acta 679, pp. 49-55.
Cromwell, G. L., 1999. Soybean meal-The gold standard. The Farmer’s Pride,
11(20).
Cruz-Suárez, L. E., Ricquea, D. and AQUACOP, 1992. Effect of squid meal
on growth of Penaeus monodon juveniles reared in pond pens and tanks.
Aquaculture, 106(3-4), pp. 293-299.
94
Davis, D. A. and Gaitlin, D. M., 1996. Dietary mineral requirements of fish
and marine crustateans. Reviews in Fisheries Science, 4(1), pp. 75-99.
de la Higuera, M., 2008. Effects of nutritional factors and feed characteristics
on feed intake. In D., Houlihan, T., Boujard, and M., Jobling, eds. Food Intake
in Fish. Oxford, UK: Blackwell Science Ltd, pp. 250-268.
Delgado, C. L., Wada, N., Rosegrant, M. W., Meijer, S. and Ahmed, M., 2003.
The future of fish: Issues and trends to 2020. Penang, Malaysia: WorldFish
Center.
Deng, J., Mai K., Ai Q., Zhang W., Wang X., Xu W. and Liufu Z., 2006.
Effects of replacing fish meal with soy protein concentrate on feed intake and
growth of juvenile Japanese flounder, Paralichthys olivaceus. Aquaculture,
258(1-4), pp. 503-513.
Department of Fisheries, 2009. Fishing. [online] Available at:
<statistics.gov.my/ccount12/click.php?id=1670> [Accessed 23 November
2010].
Department of Fisheries Malaysia, 2012. Annual Fisheries Statistics 2012.
[online] Available at: <http://www.dof.gov.my/en/perangkaan-perikanantahunan-2012> [Accessed 21 July 2014]
Dersjant-Li, Y., 2002. The use of soy protein in aquafeeds. In: L. E. CruzSuárez, D. Ricque-Marie, M. Tapia-Salazar, M. G. Gaxiola-Cortés and N.
Simoes, eds. Avances en Nutrición Acuícola VI. Memorias del VI Simposium
Internacional de Nutrición Acuícola. Cancun, Mexico: pp. 541-558.
Desai, V. R., 2003. Synopsis of biological data on the Tor mahseer, Tor tor
(Hamilton, 1822). Rome, Italy: Food and Agricultural Organization.
Devindran, V., 2011. Good returns in empurau, kelah rearing industry. The
Star, 20 July.
Dey, I., Buda, C., Wiik, H., Halver, J. E. and Farkas, T., 1993. Molecular and
structural composition of phospholipid membranes in livers of marine and
freshwater fish in relation to temperature. Proceedings of the National
Academy of Sciences of the United States of America, 90, pp. 7498-7502.
Dias, J., 1999. Deposition in rainbow trout (Oncorhynchus mykiss) and
European seabass (Dicentrarchus labrax L.): Nutritional regulation of hepatic
lipogenesis. PhD. University of Porto and University of Bordeaux 1.
Dias, J., Yufera, M., Valente, L. M. and Rema, P., 2010. Feed transit and
apparent protein, phosphorus and energy digestibility of practical feed
ingredients by Senegalese sole (Solea senegalensis). Aquaculture, 302, pp. 9499.
95
Du, Z. Y., Liu, Y. J., Tian, L. X., Wang, J. T., Wang, Y. and Liang G. Y.,
2005. Effect of dietary lipid level on growth, feed utilization and body
composition by juvenile grass carp (Ctenopharyngodon idella). Aquaculture
Nutrition 11, 139–146.
Edwards, P., Le, A. T. and Allan, G.L., 2004. A survey of marine trash fish
and fish meal as aquaculture feed ingredients in Vietnam. Australia:
Australian Centre for International Agricultural Research.
El Boushy, A. R., Van der Poel, A. F. and Walraven, O. E., 1990. Feather
meal-A biological waste: Its processing and utilization as a feedstuff for
poultry. Biological Wastes, 32, pp. 39-74.
El-Haroun, E. R. and Bureau, D. P., 2007. Comparison of the bioavailability
of lysine in blood meals of various origins to that of L-lysine HCL for rainbow
trout (Oncorhynchus mykiss). Aquaculture, 262, pp. 402–409.
El-Haroun, E. R., Azevedo, P. A. and Bureau, D. P., 2009. High dietary
incorporation levels of rendered animal protein ingredients on performance of
rainbow trout Oncorhynchus mykiss (Walbaum, 1972). Aquaculture, 209, pp.
269-274.
El-Saidy, D. M. S. D. and Gaber, M. M. A., 1998. Amino acid requirements
and body composition of Nile tilapia Oreochromis niloticus. Annals of
Agricultural Science, Moshtohor, 36(1), pp. 163-174
Elliott, J. M. and Hurley, M. A., 1995. The functional relationship between
body size and growth rate in fish. Functional Ecology, 9(4), pp. 625-627.
Emre, Y., Sevgili, H. and Diler, I., 2003. Replacing fish meal with poultry byproduct meal in practical diets for mirror carp (Cyprinus carpio) fingerlings.
Turkish Journal of Fisheries and Aquatic Sciences, 3, pp. 81-85.
Eyo, A.A. and Olatunde, A.A., 1999. The effect of replacement of soyabean
meal with blood meal on the growth of mudfish Clarias anguillaris (L)
fingerlings. Paper presented at the 13th Annual Conference of the Fisheries
Society of Nigeria (FISON). New Bussa, Nigeria, November1999.
Fafioye, O. O.,Fagade, S. O.,Adebisi, A. A., Oni, J. and Omoyinmi, J. A. K.,
2005. Effects of dietary soybeans (Glycine max (L.) Merr.) on growth and
body composition of African catfish (Clarias gariepinus, Burchell) fingerlings.
Turkish Journal of Fisheries and Aquatic Sciences, 5, pp. 11-15.
Fagbenro, O. A. and Davis, S. J., 2000. Use of oilseed meals as fish meal
replacer in tilapia diets. In K. Fitzsimmons and J. C. Filho, eds. Proceedings of
Fifth Internation Symposium on Tilapia in Aquaculture. Rio de Janeiro, Brazil:
pp. 145-153.
FAO, 1997. FAO Technical Guidelines for Responsible Fisheries Aquaculture
Development – 5. Rome, Italy: Food and Agricultural Organization.
96
FAO, 2004. Assessing Quality and Safety of Animal Feeds. Rome, Italy: Food
and Agricultural Organization.
FAO, 2006a. State of World Fisheries & Aquaculture 2006. Rome, Italy: Food
and Agricultural Organization.
FAO, 2006b. Food Balance Sheets 2003. Rome, Italy: Food and Agricultural
Organization.
FAO, 2007. Assessment of freshwater fish seed resources for sustainable
aquaculture. Rome, Italy: Food and Agricultural Organization.
FAO, 2008. FishStat. Rome, Italy: Food and Agricultural Organization.
FAO, 2012. The State of World Fisheries & Aquaculture 2006. Rome, Italy:
Food and Agricultural Organization.
FAO Fisheries and Aquaculture Department, 2010. The State of World
Fisheries and Aquaculture 2010. Rome, Italy: Food and Agricultural
Organization.
FAO Fisheries and Aquaculture Department, 2012. The state of world fisheries
and aquaculture 2012. Rome, Italy: Food and Agricultural Organization.
FAO Fishery Statistics, 2008. Reported aquaculture production in Malaysia
(from 1950). [online] Available at: <http://www.fao.org/fishery/countrysector/
naso_malaysia/en#tcNA0064> [Accessed 23 November 2010].
Farkas, T., 1984. Adaptation of fatty acid composition to temperature. A study
on carp (Cyprinus carpio L.) liver slices. Comparative Biochemistry and
Physiology Part B: Biochemistry and Molecular Biology, 79(4), pp. 531-535.
Finegold, C., 2009. The importance of fisheries and aquaculture to
development. In: P. Wramner, M. Cullberg, and H. Ackefors, eds. Fish,
sustainability and development. Stockholm: The Royal Swedish Academy of
Agriculture and Forestry, pp. 353-364.
Fleurence, J., 1999. Seaweed proteins: Biochemical, nutritional aspects and
potential uses. Trends in Food Science & Technology, 10, pp. 25-28.
Fontainhas-Fernandes, A., Gomes, E., Reis-Henriques, M. A. and Coimbra, J.,
1999. Replacement of fish meal by plant proteins in the diet of Nile tilapia:
digestibility and growth performance. Aquaculture International, 7, pp. 57-67.
Food & Water Watch, 2011. Fishy Farms: The Government’s Push for
Factory Farming in Our Oceans. Washington D.C., USA: Food & Water
Watch.
97
Froese, R., 2006. Cube law, condition factor and length-weight relationships:
History, meta-analysis and recommendations. Journal of Applied Ichthyology,
22(4), pp. 241-253.
Fuller. R., 1992. History and development of probiotics. In: R. Fuller, ed.
Probiotics: the Scientific Basis. London: Chapman and Hall, pp. 1-18.
Furuya, W. M., Graciano, T. S., Vidal, L. V. O., Xavier, T. O., Gongora, L. D.,
Righetti, J. S., Rossetto, V. and Furuya, B., 2012. Digestible lysine
requirement of Nile tilapia fingerlings fed arginine-to-lysine-balanced diets.
Brazilian Journal of Animal Science, 41(3), pp. 485-490.
Gallagher, M. L. and LaDouceur M., 1995. The use of blood meal and poultry
products as partial replacements for fish meal in diets for juvenile Palmetto
bass (Morone saxatilis x M. chrysops). Journal of Applied Aquaculture, 5(3),
pp. 57-66.
Gan, H., Li, J. M., Feng, G. P., Gong Z. L., Huang, K., Li, J. L., 2009. Effects
of different lipid levels on growth and haematological biochemistry in juvenile
tilapia (Oreochromis niloticus × Oreochromis aureus). Journal of Shanghai
Ocean University 18(1), 35-41.
Gandhi, A. P., Jha, K. and Gupta, V., 2008. Technical paper studies on the
production of defatted sunflower meal with low polyphenol and phytate
contents and its nutritional profile. ASEAN Food Journal, (14), pp. 97-100.
Gaylord, T. G. and Barrows, F. T., 2009. Multiple amino acid
supplementations to reduce dietary protein in plant-based rainbow trout,
Oncorhynchus mykiss, feeds. Aquaculture, 287, pp. 180-184.
Gaylord, T. G., Barrows, F. T. and Rawles, S. D., 2008. Apparent digestibility
of gross nutrients from feedstuffs in extruded feeds for rainbow trout,
Oncorhynchus mykiss. Journal of the World Aquaculture Society, 39, pp. 827834.
Gehring, C. K., Jaczynski, J. and Moritz, J. S., 2009. Improvement of pellet
quality with proteins recovered from whole fish using isoelectric
solubilization-precipitation. Journal of Applied Poulty Research, 18, pp. 418431.
Geoffrey, A., 2006. Bite, fish!. The Star, August
Gheisari, A. A., Zavareh, M. S., Toghyani, M., Bahadoran, R. and Toghyani,
M., 2011. Application of incremental program, an effective way to optimize
dietary inclusion rate of guar meal in broiler chicks. Livestock Science, 140, pp.
117-123.
Goldburg, R. and Naylor, R., 2005. Future seascapes, fishing and fish farming.
Frontiers in Ecology and the Environment, 3(1), pp. 21-28.
98
Gomes, E. F., Rema, P. and Kaushik, S. J., 1995. Replacement of fish-meal by
plant-proteins in the diet of rainbow trout (Oncorhynchus mykiss)-digestibility
and growth performance. Aquaculture, 130, pp. 177-186.
Gonzalez, J. J., Hernandez, J. R., Ibarra, O. O., Gomez, J. J. and Fuentes, V.
O., 2007. Poultry by-product meal as a feed supplement in mid-laction dairy
cows. Jounal of Animal and Veterinary Advances, 6, pp. 139-141.
Government of Sarawak, 2007. Guidelines for genetic management and
conservation (Artificial Propagation of empurau, Tor tambroides and semah,
T. douronensis, two species of commercial and conservation value to Sarawak,
Malaysia). Sarawak, Malaysia: Government Printing Office.
Guillaume, J. and Choubert, G., 2001. Digestibility of nutrients. In J.
Guillaume, R. Metailler, S. Kaushik, and P. Bergot, eds. Nutrition and
Feeding of Fish and Crustaceans. Cornwall, UK: Praxis Publishing Ltd, pp.
45-49.
Gul, Y., Salim, M. and Rabbani, B., 2007. Evaluation of apparent digestibility
coefficients of different dietary protein levels with and without fish meal for
Labeo rohita. Pakistan Veterinary Journal, 27, pp. 121-125.
Halver, J. E and Hardy, R. W., 2002. Fish Nutrition. California, USA:
Academic Press.
Hamdan, R., Kari, F., Othman, A. and Sams, S. M., 2012. Climate change,
socio-economic and production linkages in East Malaysia aquaculture sector.
Paper presented at the 2012 International Conference on Future Environment
and Energy. Singapore, February 2012.
Hansen, J. O., Penn, M., Overland, M., Shearer, K. D., Krogdahl, A., Mydland,
L. T. and Storebakken, T., 2010. High inclusion of partially deshelled and
whole krill meals in diets for Atlantic salmon (Salmo salar). Aquaculture, 310,
pp. 164-172.
Harbers, L. H. and Nielsen, S. S., 2003. Ash analysis. In S. S. Nielsen, ed.
Food Analysis. New York: Kluwer Academic, pp. 105-108.
Hardy, R. W., 2000. New developments in aquatic feed ingredients, and
potential of enzyme supplements. In L. E. Cruz-Suarez, D. Ricque-Marie, M.
Tapia-Salazar, M. A. Olvera-Novoa, and R. y Civera-Cerecedo, eds. Avances
en Nutricion Acuicola V.Memorias del V Simposium Internacional de
Nutricion Acuicola. Yucatan, Mexico: pp. 216-226.
Hardy, R. W., 2003. Use of soybean meals in diets of salmon and trout.
Chesterfield, USA: American Soybean Association.
99
Harlioglu, A. G., 2011. Effect of solvent extracted soybean meal and full-fat
soya on the protein and amino acid digestibility and body amino acid
composition in rainbow trout (Oncorhynchus mykiss). Iranian Journal of
Fisheries Sciences 11(3), pp. 504-517.
Haroon, A. K. Y. and Pittman, K. A., 1997. Diel feeding pattern and ratio of
two sizes of silver barb, Puntius gonionotus Bleeker, in a nursery pond and
ricefield. Aquaculture Research, 28, pp. 847-858.
Harrington, T., Gannon, N., Chang, A. and Johnson, R., 2003. The use of
sunflower meal in livestock diets. Paper presented at the 14th Biennial
Sunflower Conference. Queensland, Australia, June 2003.
Hem, S., Toure, S., Sagbla, C. and Legendre, M., 2008. Bioconversion of palm
kernel meal for aquaculture: Experiences from the forest region (Republic of
Guinea). African Journal of Biotechnology, 7(8), pp. 1192-1198.
Henderson, J. W., Ricker, R. D., Bidlingmeyer, B. A. and Woodward, C.,
2000. Rapid, accurate, sensitive and reproducible HPLC analysis of amino
acids. California, USA: Agilent Technologies.
Hepher, B., 1988. Evaluation criteria. In: Nutrition of Pond Fishes. Cambridge,
England: Cambridge University Press, pp. 179-180.
Hertrampf, J. W. and Piedad-Pascual, F., 2000. Sunflower meal. In Handbook
on Ingredients for Aquaculture Feeds. Dordrecht, Netherlands: Kluwer
Academic Publishers, pp. 493-496.
Hertrampf, J. W. and Piedad-Pascual, F., 2003. Blood products. In: Handbook
on Ingredients for Aquaculture Feeds. Dordrecht, Netherlands: Kluwer
Academic Publishers, pp. 69-79.
Hewitt, C.L., Campbell, M.L. and Gollasch, S., 2006. Alien Species in
Aquaculture. Considerations for responsible use. Cambridge, England: IUCN.
Higuera, M., Garzon, A., Hidalgo, M. C., Peragon, J., Cardenete, G. and
Lupianez, J. A., 1998. Influence of temperature and dietary-protein
supplementation either with free or coated lysine on the fractional proteinturnover rates in the white muscle of carp. Fish Physiology and Biochemistry,
18, pp. 85-95.
Hishamunda, N., Ridler, N. B., Bueno, P. and Yap, W. G., 2009. Commercial
aquaculture in Southeast Asia: Some policy lessons. Food Policy, 34(1), pp.
102-107.
HMSO, 1994. Nutritional aspects of cardiovascular disease. London, England:
HMSO.
100
Hossain, M. A., Hasan, N., Azad Shah, A. K. and Hussain, M. G., 2002.
Optimum dietary protein requirement of mahseer, Tor putitora (Hamilton)
fingerlings. Asian Fisheries Science, 15, pp. 203-214.
Hribar, J., Vidrih, R., Znidarcic, D., Demsar, L. and Sinkovic, L., 2013.
Influence of variety on some qualitative aspects in the forced chicory plants
(Cichorium intybus L.) grown in peat. IPCBEE, 53, pp. 11-15.
Hu, M., Wang Y., Wang Q., Zhao M., Xiong B., Qian X., Zhao Y., and Luo Z.,
2008. Replacement of fish meal by rendered animal protein ingredients with
lysine and methionine supplementation to practical diets for gibel carp,
Carassius auratus gibelio. Aquaculture, 275, pp. 260-265.
Hussain, S. M., Afzal, M., Salim, M., Javid, A., Khichi, T. A. A., Hussain, M.
and Raza, S. A., 2011. Apparent digestibility of fish meal, blood meal and
meat meal for Labeo rohita fingerlings. The Journal of Animal and Plant
Sciences, 21(4), pp. 807-811.
Idris, K., Shaffril, H. A. M., D’Silva, J. L. and Man, N., 2013. Identifying
problems among seabass brackish-water cage entrepreneurs in Malaysia.
Asian Social Science, 9(9), pp. 249-256.
IENICA, 2002. Kenaf. [online] Available at: <http://www.ienica.net/crops/
kenaf.pdf> [Accessed 21 July 2010].
Iheukwumere, F. C., Ndubisi, E. C. and Etusiim, P. E., 2008. The use of
different sources of protein on the growth and reproduction of pigs. Pakistan
Journal of Nutrition, 7, pp. 590-593.
Iluyemi, F. B., Hanafi, M. M., Radziah, O. and Kamarudin, M. S., 2010.
Nutritional evaluation of fermented palm kernel cake using red tilapia. African
Journal of Biotechnology, 9, pp. 502-507.
Ingram, B., Sungan, S., Gooley, G., Sim, S. Y., Tinggi, D. and De Silva, S. S.,
2005. Induced spawning, larval development and rearing of two indigenous
Malaysian mahseer, Tor tambroides and T. douronensis. Aquaculture
Research, 36, pp. 1001-1014.
Ingram, B., Sungan, S., Tinggi, D., Sim, S. Y., De Silva, S. S., 2007. Breeding
performance of Malaysian mahseer, Tor tambroides and T. douronensis
broodfish in captivity. Aquaculture Research, 38, pp. 809-818.
Islam, M. S., 2002. Evaluation of supplementary feeds for semi-intensive pond
culture of mahseer, Tor putitora (Hamilton). Aquaculture, 212, pp. 263-276.
Islam, M.S. and Tanaka, M., 2004. Optimiztion of dietary protein requirement
for pond reared mahseer, Tor putitora Hamilton (Cyprinformes: Cyprinidae),
Aquaculture Research, 35, pp. 1270-1276.
101
Ismail, M. Z., 1992. Background paper on marine and freshwater fisheries.
Kuala Lumpur, Malaysia: Economic Planning Unit.
Jabeen, F. and Chaudhry, A., 2011. Chemical compositions and fatty acid
profiles of three freshwater fish species. Food Chemistry, 125, pp. 991-996.
Jackson, A., 2009. The continuing demand for sustainable fishmeal and fish
oil in aquaculture diets. International Aquafeed, 12(5), pp. 32-36.
Jiang, B. G., Feng, J., Pan, Y. Y., Luo, B. and Pang, W., 2010. Fatty liver
disease in juvenile Sciaenops ocellatus caused by dietary lipid and protein
levels. The Israeli Journal of Aquaculture - Bamidgeh 62(4), 260-265
Kader, M. A., Koshio, S., Ishikawa, M., Yokoyama, S. Bulbul, M., Nguyen, B.
T., Gao, J. and Asda Laining, A., 2012. Can fermented soybean meal and
squid by-product blend be used as fishmeal replacements for Japanese
flounder (Paralichthys olivaceus). Aquaculture Research, 43(10), pp. 1427–
1438.
Kamarudin, M. S., Ramezani-Fard, E., Saad, C. R. and Harmin, S. A., 2012.
Effects of dietary fish oil replacement by various vegetable oils on growth
performance, body composition and fatty acid profile of juvenile Malaysian
mahseer, Tor tambroides. Aquaculture Nutrition, 18(5), pp. 532-543.
Kang, M. J., Shin, M. S., Park, J. N. and Lee, S. S., 2005. The effects of
polyunsaturated:saturated fatty acids ratios and peroxidisability index values
of dietary fats on serum lipid profiles and hepatic enzyme activities in rats.
British Journal of Nutrition, 94, pp. 526-532.
Kaur, C. R. and Ang, M., 2009. Seaweed culture and utilisation in Malaysia:
status, challenges and economic potential. Paper presented at the Seminar on
Developing the Seaweed Aquaculture Sector in Malaysia. Kuala Lumpur,
Malaysia, October 2009.
Kaushik, S. J., Covas, D., Dutto G. and Blanc, D., 2004. Almost total
replacement of fish meal by plant protein sources in the diet of a marine
teleost, the European seabass, Dicentrarchus labrax. Aquaculture, 230, pp.
391-404.
Kechik, I. A., 1995. Aquaculture in Malaysia. In: T. U. Bagarinao and E. C. C.
Flores, eds. Towards Sustainable Aquaculture in Southeast Asia and Japan.
Iloilo, Philippines: SEAFDEC Aquaculture Department, pp. 125-135.
Kjorsvik, E., Pittman, K. and Pavlov, D., 2004. How can we express larval
growth. In: E. Moksness, E. Kjorsvik, and Y. Olsen, eds. Culture of ColdWater Marine Fish. Bath, England: Blackwell Publishing Ltd, pp. 261.
Koprucu, K. and Ozdemir, Y., 2005. Apparent digestibility of selected feed
ingredients for Nile tilapia (Oreochromis niloticus). Aquaculture, 250, pp.
308-316.
102
Koumi, A. R., Koffi, K. M., Atse, B. C. and Kouame, L. P., 2011. Growth,
feed efficiency and carcass mineral composition of Heterobranchus longifilis,
Oreochromis niloticus and Sarotherodon melanotheron juveniles fed different
dietary levels of soybean meal-based diets. African Journal of Biotechnology,
10, pp. 14990-14998.
Kroll, J., Rawel, H. and Krock, R., 1998. Microwave digestion of proteins.
Zeitschrift fur Lebensmittel-Untersuchung und-Forschung, 207, pp. 202-206.
Kunlapapuk, S. and Kulabtong, S., 2011. Breeding, nursing and biology of
Thai mahseer (Tor tamboides) in Malaysia: An overview. Journal of
Agricultural Science and Technology A, 1, pp. 1214-1216.
Laining, A., Rachmansyah, Ahmad, T. and Williams, K., 2003. Apparent
digestibility of selected feed ingredients for humpback grouper, Cromileptes
altivelis. Aquaculture, 218, pp. 529–538.
Lall, S. P. and Anderson, S., 2005. Amino acid nutrition of salmonids: Dietary
requirements and bioavailability. In: D. Montero, B. Basurco I. Nengas, M.
Alexis, and M. Izquierdo, eds. Mediterranean fish nutrition. Zaragoza:
CIHEAM, pp. 73-90.
Lallo, C. H. and Garcia, G. W., 1994. Poultry by-product meal as a substitute
for soybean meal in the diets of growing hair sheep lambs fed whole chopped
sugarcane. Small Ruminant Research, 14, pp. 107-114.
Laskar, B. A., Das, D. N. and Tyagi, B. C., 2009. Growth performance of the
chocolate mahseer Neolissocheilus hexagonolepis (Mc Clelland) in pond
system in Arunachal Pradesh. Indian Journal of Fisheries, 56, pp. 55-59.
Leadbitter, D., 2011. Trash, treasure or fisheries disaster? The so called
‘trashfish’ issue in Asia. Paper presented at the 9th Seafood Summit.
Vancouver, Canada, February 2011.
Lee, N., Ling, T. Y. & Adha, K., 1999. Freshwater fishes from Bario, Kelabit
highlands Sarawak. ASEAN Review Of Biodiversity And Environmental
Conservation, 4, pp. 1-6.
Lemme, A., 2010. Availability and effectiveness of free amino acids in
aquaculture. In: L. E. Cruz-Suarez, D. Ricque-Marie, M. Tapia-Salazar, M. G.
Nieto-López, D. A. Villarreal-Cavazos, and J. Gamboa-Delgado, eds. Avances
en Nutrición Acuícola X. Memorias del Décimo Simposium Internacional de
Nutrición Acuícola. Monterrey, Mexico, pp. 264-275.
Lenas, D. S. and Nathanailides, C., 2011. High content of n-6 fatty acids in the
flesh of farmed fish sea bass Dicentrarchus labrax L. and gilthead sea bream
Sparus aurata L.: Implications for the human health. International Aquatic
Research, 3, pp. 181-187.
103
Leong, S. H., 2003. Endau-Rompin national park: Into the wilds. The Star, 4
January.
Li, H., Mai, K., Ai, Q., Zhang, C. and Zhang, L., 2009. Effects of dietary squid
viscera meal on growth and cadmium accumulation in tissues of large yellow
croaker, Pseudosciaena crocea R. Frontiers of Agriculture in China, 3(1), pp.
78-83.
Lim, J., 2006. Kelah sanctuary opens its doors to curious tourist. New Straits
Times, 10 September.
Lovell, T., 1984. The yellow fat problem in fish flesh/ Aquaculture
Management, 10, pp. 39-40.
MacArtain, P., Gill, C. I. R., Brooks, M., Campbell, R. and Rowland, I. R.,
2007 Nutritional value of edible seaweeds. International Life Sciences
Institute, 1, pp. 535-543.
Machin, D. H., 1999. The potential use of tropical silage for livestock
production with special reference to smallholders. [online] Available at:
<http://www.fao.org/ag/AGP/AGPC/gp/SILAGE/PDF/Paper5.pdf> [Accessed
10 December 2011].
Maina, J. G., Beames, R. M., Higgs, D., Mbugua, P. N., Iwama, G., & Kisia, S.
M., 2002. Digestibility and feeding value of some feed ingredients fed to
Oreochromis Niloticus (L.). Aquaculture Research, 33, pp. 853-862.
Malvas, S. A., 2005. A review on trash fish production and fish feed
requirements of the Philippines. Paper presented at the Regional Workshop on
Low Value and ‘Trash Fish’ in the Asia-Pacific Region. Hanoi, Vietnam, June
2005.
Martins, D. A., Valente, L. M. and Lall, S. P., 2009. Apparent digestibility of
lipid and fatty acids in fish oil, poultry fat and vegetable oil diets by Atlantic
halibut, Hippoglossus hippoglossus L. Aquaculture, 294, pp. 132-137.
Merican, Z., 2012. Aquafeeds in Asia: Changing focus in 2011. Aqua Culture
Asia Pacific, 8(1), pp. 11-16.
Merino, G., Barange, M., Blanchard, J. L., Harle, J., Holmes, R., Allen, I.,
Allison, E. H., Badjeck, M. C., Dulvy, N. K., Holt, J., Jennings, S., Mullon, C.
and Rodwell, L. D., 2012. Can marine fisheries and aquaculture meet fish
demand from a growing human population in a changing climate?. Global
Environmental Change, 22(4), pp. 795–806.
Meyer, G. and Fracalossi, D. M., 2005. Estimation of jundia (Rhamdia quelen)
dietary amino acid requirements based on muscle amino acid composition.
Scientia Agricola 62(4), 401-405.
104
Miles, R. D. and Chapman, F. A., 2006. The benefits of fish meal in
aquaculture diets. FA122, pp. 1-7.
Misieng, J. D., Kamarudin, M. S. and Musa, M., 2011. Optimum dietary
protein requirement of Malaysian mahseer (Tor tambroides) fingerling.
Pakistan Journal of Biological Sciences, 14, pp. 232-235.
Mohan, M., Bhanja, S. K. and Basade, Y., 2009. Performance of chitin
incorporated diet on the indigenous Kumaon Himalayan fishes: Snow trout,
Schizothorax richardsonii (Gray) and golden mahseer, Tor putitora
(Hamilton). Indian Journal of Fisheries, 56, pp. 135-137.
Mohanta, K. N., Subramanian, S. and Korikanthimath, V. S., 2013. Evaluation
of different animal protein sources in formulating the diets for blue gourami,
Trichogaster trichopterus fingerlings. Journal of Aquaculture Research and
Development, 4(2), pp. 1-7.
Moore, A., 2008. Fish, shrimp respond to pheromone-based feeding attractants.
Global Aquaculture Advocate, 11(6), pp. 58-59.
Moradinasab, G., Daliri, M., Ghorbani, R., Paighambaril, S. Y. and Davoodi,
R., 2012. Length-weight and length-length relationships, relative condition
factor and Fulton’s condition factor of five Cyprinid species in Anzali wetland,
southwest of the Caspian Sea. Caspian Journal of Environmental Science,
10(1), pp. 25-31.
Moren, M., Suontama, J., Hemre, G.I., Karlsen, O., Olsen, R.E., Mundheim, H.
and Julshamn, K., 2006. Element concentrations in meals from krill and
amphipods, -Possible alternative protein sources in complete diets for farmed
fish. Aquaculture, 261, pp. 174-181.
Nagpal, M. L., Agrawal, O. P. and Bhatia, I. S., 1971. Chemical and biological
examination of guar meal (Cyamopsis tetragonoloba L.). Indian Journal of
Animal Science, 41, pp. 283-293.
National Pork Board, 2008. Alternative feed ingredients in swine diets. Iowa,
USA: National Pork Board.
Navarro, R. D., Navarro, F. K. S. P., Filho, O. P. R, Ferreira, W. M., Pereira,
M. M. and Filho, J. T. S, 2012. Quality of polyunsaturated fatty acids in Nile
tilapias (Oreochromis niloticus) fed with vitamin E supplementation. Food
Chemistry, 134, pp. 215-218.
Naylor, R. L., Goldburg, R. J., Primavera, J., Kautsky, N., Beveridge, M. C.
M., Clay, J., Folke, C., Lubchenco, J., Mooney, H. and Troell, M., 2001.
Effects of aquaculture on world fish supplies. Issues in Ecology, Winter(8), pp.
1-12.
105
Nehemia, A., Maganira, J. D. and Rumisha, C., 2012. Length-weight
relationship and condition factor of tilapia species grown in marine and fresh
water ponds. Agriculture and Biology Journal of North America, 3(3), pp.
117-124.
Ng, W. K., 2003. The potential use of palm kernel meal in aquaculture feeds.
Aquaculture Asia, 8(1), pp. 38-39.
Ng, C. K., 2004. King of the Rivers: Mahseer in Malaysia and the region.
Kuala Lumpur, Malaysia: Inter Sea Fishery (M) SDN BHD.
Ng, W. K., 2004. Palm oil as a novel dietary lipid source in aquaculture feeds.
In: Palm Oil Developments 41. Selangor, Malaysia: Universiti Putra Malaysia,
pp. 19-21.
Ng, W. K. and Andin, V. C., 2011. The Malaysian mahseer, Tor tambroides
(Bleeker), requires low dietary lipid levels with a preference for lipid sources
with high omega-6 and low omega-3 polyunsaturated fatty acids. Aquaculture,
322-323, pp. 82-90.
Ng, W. K. and Chong, K. K., 2002. The nutritive value of palm kernel meal
and the effect of enzyme supplementation in practical diets for red hybrid
tilapia (Oreochromis sp.). Asian Fisheries Science, 10, pp. 167-176.
Ng, W. K. and Chen, M. L., 2002. Replacement of soybean meal with palm
kernel meal in practical diets for hybrid Asian-African catfish, Clarias
macrocephalus x C. gariepinus. Journal of Applied Aquaculture, 12, pp. 67-76.
Ng, C. K. and Wang, Y., 2011. Inclusion of crude palm oil in the broodstock
diets of female Nile tilapia, Oreochromis niloticus, resulted in enhanced
reproductive performance compared to broodfish fed diets with added fish oil
or linseed oil. Aquaculture, 314 (1-4), pp. 122-131.
Ng, W. K., Abdullah, N. and de Silva, S. S., 2008. The dietary protein
requirement of the Malaysian mahseer, Tor tambroides (Bleeker), and the lack
of protein-sparing action by dietary lipid. Aquaculture, 284, pp. 201-206.
Ng, W. K., Teh, S. W., Chowdhury, K. M. A. and Bureau, D. P., 2013. Onfarm feeding and feed management in tilapia aquaculture in Malaysia. In M. R.
Hasan and M.B. New, eds. On-farm feeding and feed management in
aquaculture. Rome, Italy: FAO Fisheries and Aquaculture, pp. 407-431.
Nicol, S., Forster, I and Spence, J., 2000. Products derived from krill. In: I.
Everson, ed. International Encyclopaedia of Agricultural Science and
Technology. Cornwall, England: Blackwell Science Ltd, pp. 262-270.
Nogueira, N., Cordeiro, N., Andrade, C. and Aires, T., 2012. Inclusion of low
levels of blood and feathermeal in practical diets for gilthead seabream
(Sparus aurata). Turkish Journal of Fisheries and Aquatic Sciences, 12, pp.
641-650.
106
Noreen, U. and Salim, M., 2008. Determination of nutrient digestibility and
amino acid availability of various feed ingredients for Labeo rohita.
International Journal of Agriculture & Biology, 10, pp. 551-555.
Odetola, M. O., 2011. Protein quality and utilization of whole kenaf (Hibiscus
cannabinus L.) seed meal as replacement for soyabean meal in broiler diets.
MAg. University of Agriculture Abeokuta.
Odetola, O. M. and Eruvbetine, D., 2012. Nutritional evaluation of whole
kenaf (Hibiscus Cannabinus L.) seed meal in rats. Journal of Advanced
Laboratory Research in Biology, 3(3), pp. 152-157.
Odetola, M. O., Ewuola, E. O. and Adu, O. A., 2012. Haematology, serum
biochemistry and organ histopathology of rabbits fed graded levels of whole
kenaf (Hibiscus canabinus) seed meal. International Journal of Agricultural
Research, 7, pp. 86-92.
OECD/FAO, 2013. OECD-FAO
Publishing, pp. 193.
Agricultural
Outlook 2013. OECD
Ogale, S. N., 2002. Mahseer breeding and conservation and possibilities of
commercial culture. The Indian experience. In T. Petr, and A. B. Swar, eds.
Cold water fisheries in the trans-Himalayan countries. Rome, Italy: Food and
Agricultural Organization, pp. 193-212.
Oluwafemi, R., 2009. Palm kernel cake (PKC) utilization in monogastric
animal feeding - implications for sustainable livestock development. The
Internet Journal of Veterinary Medicine, 6(2), doi: 10.5580/888.
Omole, A.J., Iji, O.T., Soetan, A. & Makanjuola, B.A., 2008. Nutritional value
of chicken offal as replacement for local fish meal in growing snails. Journal
of Central European Agriculture, 9, pp. 393-397.
Osman, A., 1986. End uses and marketing of palm kernel cakes. In: Workshop
on Palm Kernel Products. Selangor, Malaysia: Palm Oil Research Institute of
Malaysia.
Osman, A. and Hisamuddin, M. A., 1999. Oil palm and palm oil products as
livestock feed. Selangor, Malaysia: Palm Oil Research Institute of Malaysia.
Othman, M. F., 2008. Malaysia. In: A. Lovatelli, M. J. Phillips, J. R. Arthur,
and K. Yamamoto, eds. FAO/NACA Regional Workshop on the Future of
Mariculture: A Regional Approach for Responsible Development in the AsiaPacific Region. Rome, Italy: Food and Agricultural Organization, pp. 207-224.
Ovissipour, M. and Rasco, B., 2011. Fatty acid and amino acid profiles of
domestic and wild beluga (Huso huso) roe and impact on fertilization ratio.
Journal
of
Aquaculture
Research
and
Development, 2(133),
doi:10.4172/2155-9546.1000113
107
Pagan, J. D., 1997. Digestibility in Horses. Kentucky, USA: Kentucky Equine
Research, Inc.
Pathansali, D., 1976. National Plan for Development of Aquaculture in
Malaysia. Rome, Italy: Food and Agricultural Organization.
Pereira, R., Valente, L. M. P., Sousa-Pinto, I. and Rema, P., 2012. Apparent
nutrient digestibility of seaweeds by rainbow trout (Oncorhynchus mykiss) and
Nile tilapia (Oreochromis niloticus). Algal Research, 1, pp. 77-82.
Pereira, T. G. and Oliva-Teles, A., 2003. Evaluation of corn gluten meal as a
protein source in diets for gilthead sea bream. Aquaculture Research, 34, pp.
1111-1117.
Perez, J. F., Gernat, A. G. and Murillo, J. G., 2000. The effect of different
levels of palm kernel meal in layer diets. Poultry Science, 79, pp. 77-79.
PerkinElmer Inc., 2010. Optima 7000 DV ICP-OES. Massachusetts, USA:
PerkinElmer, Inc.
Phumee, P., Wei, W. Y., Ramachandran, S. and Hashim, R., 2011. Evaluation
of soybean meal in the formulated diets for juvenile Pangasianodon
hypophthalmus (Sauvage, 1878). Aquaculture Nutrition, 17(2), pp. 214-222.
Rad, F. H. and Keshavarz, K., 1976. Evaluation of the nutritional value of
sunflower meal and the possibility of substitution of sunflower meal for
soybean meal in poultry diets. Poultry Science, 55(5), pp. 1757-1765.
Ramezani-Fard, E., Kamarudin, M. S., Saad, C. R. and Harmin, S. A., 2011.
Changes over time in muscle fatty acid composition of Malaysian mahseer,
Tor tambroides, fed different dietary lipid percentage. African Journal of
Biotechnology, 10, pp. 18256-18265.
Ramezani-Fard, E. and Kamarudin, M. S., 2013. Effects of vegetable oil
source and dietary vegetable-fish oil ratio on the histological alterations of
liver and intestine of juvenile Malaysian mahseer, Tor tambroides. Asian
Journal of Animal and Veterinary Advances 8, 309-316.
Ramzani, S. R., Ismail, M. M. and Abdurofi, I., 2013. Comparative study of
brackishwater species in Peninsular Malaysia. Annals of Biological Research,
4(8), pp. 145-151.
Ransangan, J., Manin, B. O., Lal, T. M. M., Lu, K. C., Sade A. and Azila A.,
2013. Betanodavirus infection in marine fish aquaculture in Malaysia.
Research Journal of Animal, Veterinary and Fishery Science, 1(7), pp. 10-15.
Rathinam, A. M. M., Kandasami, D., Kizhakudan, J. K., Leslie, V. A. and
Gandhi, A. D., 2009. Effect of dietary protein on the growth of spiny lobster
Panulirus homarus (Linnaeus). Journal of the Marine Biological Association
of India, 51(1), pp. 114-117.
108
Ravindran, V., 2010. Poultry feed availability and nutrition in developing
countries - Alternative feedstuffs for use in poultry feed formulations. Rome,
Italy: Food and Agricultural Organization.
Rawles, S. D., Fuller, S. A., Beck, B. H., Gaylord, T. G., Barrows, F. T. and
McEntire, M. E., 2013. Lysine optimization of a commercial fishmeal-free
diet for hybrid striped bass (Morone chrysops x M. saxatilis). Aquaculture,
396-399, pp. 89-101.
Rawles, S. D., Riche, M., Gaylord, T. G., Webb, J., Freeman, D. W. and Davis,
M., 2006. Evaluation of poultry by-product meal in commercial diets for
hybrid striped bass (Morone chrysops x M. saxatilis) in recirculated tank
production. Aquculture, 259, pp. 377-389.
Regost, C., Arzel, J., Robin, J., Rosenlund, G. and Kaushik, S. J., 2003. Total
replacement of fish oil by soybean or linseed oil with a return to fish oil in
turbot (Psetta maxima) growth performance, flesh fatty acid profile, and lipid
metabolism. Aquaculture, 217, pp. 465-482.
Reuss, S., 2001. Enhanced Forage Evaluation: NDF Digestibility. Wisconsin,
USA: Wisconsin Team Forage.
Rhee, K. C., 2005. Nitrogen determination using the Kjeldahl method. In: R. E.
Wrolstad, T. E., Acree, E. A. Decker, M. H., Penner, D. S. Reid, S. J.
Schwartz, C. F. Shoemaker, D. Smith, and P. Sporns, eds. Handbook of Food
Analytical Chemistry. New Jersey, USA: John Wiley & Sons, Inc., pp. 105107.
Ribeiro, F. B., Lanna, E. A. T., Bomfim, M. A. D., Donzele, J. L., Quadros, M.
and Cunha, P. S. L., 2011. True and apparent digestibility of protein and
amino acids of feed in Nile tilapia. Revista Brasileira de Zootecnia, 40(5), pp.
939-946.
Ricker, W. E., 1958. Methods of estimating vital statistics of fish populations.
Indiana University Publication: Science Series, 15, pp. 105.
Robaina, L., Moyano, F. J., Izquierdo, M. S., Socorro, J., Vergara, J. M. and
Montero, D., 1997. Corn gluten meal and bone meals as protein sources in
diets for gilthead seabream (Sparus aurata): Nutritional and histological
implications. Aquaculture, 157, pp. 347-359.
Saez, P. J., 2013. Pigment reduction in corn gluten meal and its effects on
muscle pigmentation of rainbow trout (Oncorhynchus mykiss). PhD.
University of Guelph.
Saini, V. P., Ojha, M. L. and Gupta, M. C., 2014. Selected morpho
physiographic features of Tor Maheer (Tor tor) from Rana Pratap Sagar
reservoir, Rajasthan (India). International Journal of Fisheries and Aquatic
Studies, 1(6), pp. 168-172.
109
Salehpour, M. and Qazvinian, K., 2011. Effects of feeding different levels of
guar meal on performance and blood metabolites in Holstein lactating cows.
Lucrari stiintifice. Seria Zootehnie - Universitatea de Stiinte Agricole si
Medicina Veterinara Ion Ionescu de la Brad, 55, pp. 196-200.
Sanchez-Muros, M.J., Corchete, V., Suarez, M.D., Cardenete, G., GomezMilan, E. and de la Higuera, M., 2003. Effect of feeding method and protein
source on Sparus aurata feeding patterns. Aquaculture, 224, pp. 89-103.
Sawhney, S. and Gandotra, R., 2010. Growth response and feed conversion
efficiency of Tor putitora (Ham.) fry at varying dietary protein levels.
Pakistan Journal of Nutrition, 9, pp. 86-90.
Schipp, G., 2008. Is the Use of Fishmeal and Fish Oil in Aquaculture Diet s
Sustainable?. Australia: Northern Territory Government.
Seet, C. H., 2010. The Mighty Kelah. New Straits Times, 5 September.
Sethuraiman, G. and Naidu, S., 2008. Kenaf production. In: International
Encyclopaedia of Agricultural Science and Technology. New Delhi, India:
Mittal Publications, pp. 181-190.
Shapawi, R., Ng, W. K. and Mustafa, S., 2007. Replacement of fish meal with
poultry by-product meal in diets formulated for the humpback grouper,
Cromileptes altivelis. Aquaculture, 273, pp. 118-126.
Sigma Aldrich, 1997. Methanolic H2SO4 (10% v/v). USA: Sigma-Aldrich Co.
Silva-Carrillo, Y., Hernandez, C., Hardy, R. W., Gonzalez-Rodriguez, B. and
Castillo-Vargasmachuca, S., 2012. The effect of substituting fish meal with
soybean meal on growth, feed efficiency, body composition and blood
chemistry in juvenile spotted rose snapper Lutjanus guttatus (Steindachner,
1869). Aquaculture, 364-365, pp. 180-185
Slavica, S., Jovanka, L. and Olivera, D., 2006. Enhancing nutritional quality of
sunflower meal in broiler feeding. Archiva Zootechnica, 9, pp. 65-72.
Small Scale Fisheries, 2012. Malaysia. Paper presented at Malaysia VGSSF
Workshop. Kuala Lumpur, Malaysia, November 2012.
Smith, D. M., Allan, G. L., Williams, K. C. and Barlow, C. G., 2001. Fishmeal
replacement research for shrimp feeds in Australia. In: C. L. Browdy and D. E.
Jory, eds. The New Wave, Aquaculture 2001. Los Angeles, USA: The World
Aquaculture Society, pp. 96-102.
Sogbesan, A. O., and Ugwumba A. A. A., 2008. Nutritional values of some
non-conventional animal protein feedstuffs used as fishmeal supplement in
aquaculturepPractices in Nigeria. Turkish Journal of Fisheries and Aquatic
Sciences, 8(1), pp. 159-164.
110
Stallings, C. D., 2010. Experimental test of preference by a predatory fish for
prey at different densities. Journal of Experimental Marine Biology and
Ecology, 389, pp. 1-5.
Stancheva, M. and Merdzhanova, A., 2011. Fatty acid composition of
common carp, rainbow trout and grey mullet fish species. Agricultural Science
and Technology, 3, pp. 285-289.
Stancheva, M., Galunska, B., Dobreva, A. D. and Merdzhanova, A., 2012.
Retinol, alpha-tocopherol and fatty acid content in Bulgarian black sea fish
species. Grasas y Aceites, 63(2), pp. 152-157.
Stankovic, M. B., Dulic, Z. P. and Markovic, Z. Z., 2011. Protein sources and
their significance in carp (Cyprinus carpio L.) Nutrition. Journal of
Agricultural Sciences, 56(1), pp. 75-86.
Strand, A. Magnhagen, C. and Alanara, A., 2011. Growth and energy
expenditures of Eurasian perch, Perca fluviatilis (Linnaeus) in different
temperatures and of different body sizes. Aquaculture Research &
Development, 2(3), pp. 1-8.
Subasinghe, R. P., Curry, D., McGladdery, S. E. and Bartley, D., 2002. Recent
technological innovations in aquaculture. In: Review of the State of World
Aquaculture (Draft Copy). Rome, Italy: Food and Agricultural Organization,
pp. 85-102.
Subhadraa, B., Lochmanna, R., Rawles, S. and Chen, R., 2006. Effect of fishmeal replacement with poultry by-product meal on the growth, tissue
composition and hematological parameters of largemouth bass (Micropterus
salmoides) fed diets containing different lipids. Aquaculture, 260, pp. 221-231.
Sugiura, S.H., Dong, F.M., Rathbone, C.K. and Hardy, R.W., 1998. Apparent
protein digestibility and mineral availabilities in various feed ingredients for
salmonid feeds. Aquaculture, 159, pp. 177-202.
Sugiyama, S., Staples, D. and Funge-Smith, S., 2004. Status and potential of
fisheries and aquaculture in Asia and the Pacific. Bangkok, Thailand: FAO
Regional Office for Asia and the Pacific.
Suontama, J., Karlsen, A., Moren, M., Hemre, G. I., Melle, W., Langmyhr, E.,
Mundheim, H., Ring, E. and Olsen, R. E., 2007. Growth, feed conversion and
chemical composition of Atlantic salmon (Salmo salar L.) and Atlantic halibut
(Hippoglossus hippoglossus L.) fed diets supplemented with krill or
amphipods. Aquaculture Nutrition, 13, pp. 241-255.
Swain, P. K. and Padhi, S. B., 2011. Utilization of seaweeds as fish feed in
aquaculture. Biohelica, 2, pp. 35-46.
Swick, R. A., Akiyama, D. M., Boonyaratpalin, M. and Creswell, D. C., 1995.
Use of soybean meal and synthetic methionine in shrimp feed. American
Soybean Association.
111
Tacon, A.G.J., Hasan, M.R. and Metian, M., 2011. Demand and supply of feed
ingredients for farmed fish and crustaceans: trends and prospects. Rome, Italy:
FAO Fisheries and Aquaculture.
Teoh, C. Y., Turchini, G. M. and Ng W. K., 2011. Genetically improved
farmed Nile tilapia and red hybrid tilapia showed differences in fatty acid
metabolism when fed diets with added fish oil or a vegetable oil blend
Aquaculture, 312, pp. 126-136.
The Borneo Post, 2011. ‘Tubai’ the culprit for depleting population of
empurau-Jabu. The Borneo Post, 21 July.
The Star, 2006. Poachers fly in for the Kelah. The Star, 5 September.
Tibbetts, G. W., Seerley, R. W. and McCampbell, H. C., 1987. Poultry offal
ensiled with Lactobacillus acidophilus for growing and finishing swine diets.
Journal of Animal Science, 64, pp. 182-190.
Tibbetts, S. M., Milley, J. E. and Lall, S. P., 2006. Apparent protein and
energy digestibility of common and alternative feed ingredients by Atlantic
cod, Gadus morhua (Linnaeus, 1758). Aquaculture, 261, pp. 1314-1327.
Tidwell, J. H., Coyle, S. D., Bright, L. A. and Yasharian, D., 2005. Evaluation
of plant and animal source proteins for replacement of fish meal in practical
diets for the largemouth bass Micropterus salmoides. Journal of the World
Aquaculture Society, 36(4), pp. 454-463.
Tomedi, M. T. E., Tiogue, C. T., Efole, T. E., Kenfack, M. and Tchoumboue,
J., 2014. Population Structure, condition factor, length-weight and length-age
relationships of Labeobarbus batesii (Boulenger, 1903) in Mbo flood plain in
western region of Cameroon. International Journal of Aquaculture, 4(19), pp.
113-117.
Tou, J. C, Jaczynski, J. and Chen, Y. C., 2007. Krill for human consumption:
Nutritional value and potential health benefits. International Life Sciences
Institute, 65(2), pp. 63-77.
Uddin, N. and Al-Harbi, A. H., 2012. Bacterial flora of polycultured common
carp (Cyprinus carpio) and African catfish (Clarias gariepinus). International
Aquatic Research, 4(10), doi: 10.1186/2008-6970-4-10.
Ufodike, E. B. C., Adijetu, A. S. and Ofor, C. O., 2003. Digestibility of
protein in common carp (Cyprinus Carpio) fed chicken gut and duckweed
diets. Journal of Aquatic Sciences, 18, pp. 25-28.
UPM, 2013. Researchers Search for Best Feed for the 'King' of the Rivers.
[online]
Available
at:
<http://www.upm.edu.my/berita/details/
ikankelahbi?LANG=en> (Accessed 29 July 2013).
112
Usman, B., Rachmansyah, Lante, S., Kamaruddin, M. S. and Ahmad, T., 2006.
Replacement of fish meal with poultry offal meal in diets for humpback
grouper (Cromileptes altivelis) grow-out. Indonesian Aquaculture Journal, 1,
pp. 45-52.
Valente, L. M. P, Gouveia, A., Rema, .P, Matos, J., Gomes, E. F., Pinto, I. S.,
2006. Evaluation of three seaweeds Gracilaria bursa-pastoris, Ulva rigida
and Gracilaria cornea as dietary ingredients in European sea bass
(Dicentrarchus labrax) juveniles. Aquaculture, 252, pp. 85-91.
Valverde, C. J., Martínez-Llorens, S., Vidal, T. A., Jover, M., Rodríguez, C.,
Estefanell, J., Gairín, J. I., Domingues, P. M., Rodríguez, C. J. and García, G.
B., 2013. Amino acids composition and protein quality evaluation of marine
species and meals for feed formulations in cephalopods. Aquaculture
International, 21(2), pp. 413-433.
Vlieg, P. and Body, D. B., 1988. Lipid contents and fatty acid composition of
some New Zealand freshwater finfish and marine finfish, shellfish and roes.
New Zealand Journal of Marine and Freshwater Research, 22, pp. 151-162.
Vohra, P. and Kratzer, F.H., 1965. Improvement of guar meal by enzymes.
Poultry Science, 43, pp. 1201-1205.
Wang, S., Liu, Y. J., Tian, L. X., Xie, M. Q., Yang, H. J., Wang, Y. and Liang,
G. Y., 2005. Quantitative dietary lysine requirement of juvenile grass carp
Ctenopharyngodon idella. Aquaculture, 249, pp. 419-429.
Wang, Y., Guo, J. L., Bureau, D. P. and Cui, Z. H., 2006. Replacement of fish
meal by rendered animal protein ingredients in feeds for cuneate drum (Nibea
miichthioides). Aquaculture, 252, pp. 476-483.
Willis, S., 2003. The use of soybean meal and full-fat soybean meal by the
animal feed industry. Paper presented at the 12th Australian Soybean
Conference, Toowoomba, Australia, March 2003.
WorldFish Center, 2006. Fisheries in Malaysia. Penang, Malaysia: WorldFish
Center.
Ye, C. X., Liu, Y. J., Tian, L. X., Mai, K. S., Du, Z. Y., Yang, H. J. and Niu, J.,
2006. Effect of dietary calcium and phosphorus on growth, feed efficiency,
mineral content and body composition of juvenile grouper, Epinephelus
coioides. Aquaculture, 255, pp. 263-271.
Yigit, M., Bulut, M., Ergün, S., Guroy, D., Karga, M., Kesbic, O. S., Yilmaz,
S., Acar, U. and Guroy, B., 2012. Utilization of corn gluten meal as a protein
source in diets for gilthead seabream (Sparus aurata L.) juveniles. Journal of
Fisheries Sciences, 6(1), pp. 63-73.
113
Yong, A. S. K., Ooi, S. Y. and Shapawi, R., 2013. The utilization of soybean
meal in formulated diet for marble goby, Oxyeleotris marmoratus. Journal of
Agricultural Science, 5(11), pp. 139-149.
Yoshitomi, B., Aoki, M., Oshima, S. and Hata, K., 2006. Evaluation of krill
(Euphausia superba) meal as a partial replacement for fish meal in rainbow
trout (Oncorhynchus mykiss) diets. Aquaculture, 261, pp. 440-446.
Yoshitomi, B., Aoki, M. and Oshima, S., 2007. Effect of total replacemet of
dietary fish meal by low fluoride krill (Euphausia superba) meal on growth
performance of rainbow trout (Oncorhynchus mykiss) in fresh water.
Aquaculture, 266, pp. 219-225.
Yoshitomi, B. and Nagano, I., 2011. Effect of dietary fluoride derived from
Antarctic krill (Euphausia superba) meal on growth of yellowtail (Seriola
quinqueradiata). Chemosphere, 86, pp. 891-897.
Yuan, Y. C., Gong, S. Y., Yang, H. J., Lin, Y. C., Yu, D. H. and Luo, Z., 2011.
Effects of supplementation of crystalline or coated lysine and/or methionine
on growth performance and feed utilization of the Chinese sucker,
Myxocyprinus asiaticus. Aquaculture, 316(), pp. 31-36.
Yuangsoi, B. and Masumoto, T., 2012. Replacing moringa leaf (Moringa
oleifera) partially by protein replacement in soybean meal of fancy carp
(Cyprinus carpio). Songklanakarin Journal of Science and Technology 34(5),
479-485.
Yusoff, F. M., 2007. Tasik Kenyir: Thermal Stratification and Its Implications
on Sustainable Management of the Reservoir. Paper presented at the
Colloquium on Lakes and Reservoir Management: Status and Issues. Putrajaya,
Malaysia, Agust 2007.
Zabihi, A., Faramarzi, M., Lashkarbolouki, M., Kiaalvandi, S. and Iranshahi,
F., 2011. Effects of chicken slaughter wastes on growth and feeding
parameters and body composition of Common carp (Cyprinus carpio). Journal
of Research in Biology, 1, pp. 122-128.
Zahari, M. W. and Alimon, A. R., 2004. Use of palm kernel cake and oil palm
by-products in compound feed. In: Oil Palm Developments 40. Selangor,
Malaysia: Universiti Putra Malaysia, pp. 5-9.
Zhou, Q. C., Tan, B. P., Mai, K. S. and Liu, Y. J., 2004. Apparent digestibility
of selected feed ingredients for juvenile cobia, Rachycentron canadum.
Aquaculture, 241, pp. 441-451.
Zhou, Q. C., Wu, Z. H., Chi, S. Y. and Yang, Q. H., 2007. Dietary lysine
requirement of juvenile cobia (Rachycentron canadum). Aquaculture, 273, pp.
634-640.
114
Zhou, Q. C., Zhao, J., Li, P., Wang, H. L. and Wang, L. G., 2011. Evaluation
of poultry by-product meal in commercial diets for juvenile cobia
(Rachycentron canadum). Aquculture, 322-323, pp. 122-127.
Zuraini, A., Somchit, M. N., Solihah, M. H., Goh, Y. M., Arifah, A. K.,
Zakaria, M. S., Somchite, N., Rajionc, M. A., Zakaria, Z. A. and Mat Jais, A.
M., 2006. Fatty acid and amino acid composition of three local Malaysian
Channa spp. fish. Food Chemistry, 97, pp. 674-678.
115
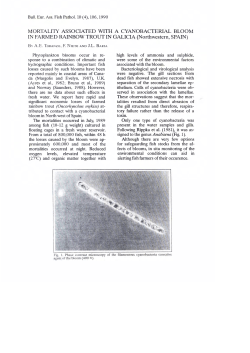


© Copyright 2026