
Institut f¨ ur Tierern¨ ahrung des Friedrich-Loeffler-Institutes Braunschweig ur Tierwissenschaften
Institut für Tierernährung des Friedrich-Loeffler-Institutes Braunschweig
Institut für Tierwissenschaften
Abteilung Tierernährung der Rheinischen Friedrich-Wilhelms-Universität Bonn
Effects of folic acid and pantothenic acid supplementation to
two rations on rumen fermentation, duodenal nutrient flow
and serum and milk variables of dairy cows
Inaugural-Dissertation
zur
Erlangung des Grades
Doktor der Agrarwissenschaften
(Dr. agr.)
der
Hohen Landwirtschaftlichen Fakultät
der
Rheinischen Friedrich-Wilhelms-Universität
zu Bonn
vorgelegt im September 2009
von Dipl.-Ing. agr. Veronika Ragaller
aus Bonn
Referent: Prof. Dr. Karl-Heinz Südekum
Koreferent: Prof. Dr. Dr. Helga Sauerwein
Koreferent: Prof. Dr. Gerhard Flachowsky
Tag der mündlichen Prüfung: 14.12.2009
Diese Dissertation ist auf dem Hochschulschriftenserver der ULB Bonn
http://hss.ulb.uni-bonn.de/diss online elektronisch publiziert.
Erscheinungsjahr: 2010
Effects of folic acid and pantothenic acid supplementation to two rations
on rumen fermentation, duodenal nutrient flow and serum and milk
variables of dairy cows
The aim of the present experiments was to investigate the influences of a daily supplementation of 1 g folic acid (FA), respectively pantothenic acid (PA) on ruminal
fermentation, as well as on serum and milk variables. German Holstein cows with one
cannula in the dorsal sac of the rumen and another in the proximal duodenum received
a ration with a forage to concentrate ratio (F:C) of 34:66 (high concentrate, HC) in the
first part of each experiment and in the second part of 66:34 (high forage, HF). Each
ration was fed with and without FA or PA supplementation. Thereby, the influences
of the ration composition on the synthesis and/or degradation of folates, FA and PA
due to ruminal microorganisms were to be investigated. The number of lactating and
dry cows was in the first part of the FA experiment four and two, and in the second
part four and four. In the first part of the PA experiment it was six and two and in
the second part five and four. Regardless of the dietary F:C ratio, both vitamins had
rather minor effects on ruminal fermentation as well as on the serum and milk variables. However, irrespective of the ration the FA supplementation increased the serum
5-methyl-tetrahydrofolate concentration. The PA supplementation only increased the
duodenal PA flow during the feeding of the HF ration. Irrespective of the ration, the
serum and milk PA concentrations as well as the milk PA yields were not influenced
by the PA supplementation. However, feeding the HC ration always resulted in higher
PA amounts in all considered fluids compared to the HF ration. This was the same for
the folate amounts in the serum. Thus, the results of the present experiments show
that a 1 g FA supplementation increases the 5-methyl-tetrahyrofolate concentration
in the serum, but no positive effects for the dairy cows were detectable, while a 1 g
PA supplementation neither increases the PA concentrations in the serum or in the
milk. However, the apparent disappearance between mouth and duodenum for PA was
between 88 and 97%.
Effekte einer Folsäure- und Pantothensäure-Supplementierung zu zwei
Rationen auf die ruminale Fermentation, den duodenalen Nährstofffluss
und Serum- und Milchvariablen von Milchkühen
Die durchgeführten Versuche hatten zum Ziel, den Einfluss einer Zulage von 1 g Folsäure (FA) bzw. Pantothensäure (PA) je Tag auf die ruminale Fermentation sowie auf
Serum- und Milchvariablen von Milchkühen zu untersuchen. Deutsche Holstein Kühe
mit je einer Fistel im dorsalen Pansensack sowie im proximalen Duodenum erhielten
im ersten Abschnitt jedes Versuches eine Ration mit einem Grundfutter-KraftfutterVerhältnis (GF:KF) von 34:66 (high concentrate, HC) und im zweiten Abschnitt von
66:34 (high forage, HF) jeweils mit und ohne Vitaminzulage. Damit sollten mögliche
Einflüsse der Rationszusammensetzung auf die Synthese und/oder den Abbau von Folaten, FA und PA durch die Pansenmikroorganismen getestet werden. Die Anzahl
an laktierenden bzw. trockenstehenden Kühen betrug im ersten Abschnitt des FAVersuchs vier und zwei, im zweiten Abschnitt vier und vier; im ersten Abschnitt des
PA-Versuchs sechs und zwei und im zweiten Abschnitt fünf und vier. Unabhängig vom
GF:KF Verhältnis hatten beide Vitamine einen nur geringen Einfluss auf die ruminale Fermentation sowie auf die Serum- und Milchvariablen. Die FA-Zulage steigerte
bei beiden Rationen die 5-Methyl-Tetrahydrofolat-Konzentration im Serum. Die PAGabe erhöhte den duodenalen PA-Fluss lediglich bei Fütterung der HF-Ration. Ein
Einfluss der PA-Gabe auf die PA-Konzentrationen in Serum und Milch, sowie die MilchPA-Menge wurde bei keiner Ration nachgewiesen. Die Fütterung der HC-Ration resultierte im Vergleich zur HF-Ration allerdings immer in höheren PA-Mengen in den
untersuchten Flüssigkeiten. Analog traf dies für die Folatmengen im Serum zu. Zusammenfassend zeigen die Ergebnisse der durchgeführten Versuche, dass die Zulage von 1
g FA die 5-Methyl-Tetrahydrofolat-Konzentration im Serum steigert. Ein positiver Effekt für die Kuh war allerdings nicht nachweisbar. Die Zulage von 1 g PA zeigte weder
gesteigerte PA-Konzentrationen im Serum noch in der Milch. Die scheinbaren Verluste
an PA zwischen Maul und Duodenum betrugen allerdings 88 bis 97 %.
i
CONTENTS
Contents
1 Introduction
1
2 Scope of the thesis
3
3 Folic acid
4
3.1
Folic acid in ruminant nutrition: a review
. . . . . . . . . . . . . . . .
4
3.2
Effects of a folic acid supplementation on dairy cows . . . . . . . . . .
26
4 Pantothenic acid
51
4.1
Pantothenic acid in ruminant nutrition: a review . . . . . . . . . . . . .
51
4.2
Effects of a pantothenic acid supplementation on dairy cows . . . . . .
67
5 General Discussion
93
6 Summary
97
7 Zusammenfassung
100
8 Appendix
103
9 References
106
ABBREVIATIONS
Abbreviations
ACP . . . . . . . . . . .
ADF . . . . . . . . . . .
AICAR . . . . . . . .
AS . . . . . . . . . . . . .
Ash . . . . . . . . . . . .
BW . . . . . . . . . . . .
CF . . . . . . . . . . . . .
CoA. . . . . . . . . . . .
CP . . . . . . . . . . . . .
d...............
DHF . . . . . . . . . . .
DIM . . . . . . . . . . .
DM . . . . . . . . . . . .
DMF . . . . . . . . . . .
DNA . . . . . . . . . . .
dTMP . . . . . . . . .
dUMP . . . . . . . . .
EE . . . . . . . . . . . . .
EP . . . . . . . . . . . . .
FA . . . . . . . . . . . . .
FAICAR . . . . . . .
F:C . . . . . . . . . . . .
FCM . . . . . . . . . . .
FGAR . . . . . . . . .
FOM . . . . . . . . . . .
GAR . . . . . . . . . . .
GF:KF . . . . . . . .
HC . . . . . . . . . . . . .
HC+FA . . . . . . . .
HC+PA . . . . . . . .
HF . . . . . . . . . . . . .
HF+FA . . . . . . . .
HF+PA . . . . . . . .
i.m. . . . . . . . . . . . .
LFL . . . . . . . . . . . .
LSmeans . . . . . . .
m ..............
ME . . . . . . . . . . . .
MP . . . . . . . . . . . .
NAD . . . . . . . . . . .
NAN . . . . . . . . . . .
NDF . . . . . . . . . . .
NEFA . . . . . . . . . .
NEL . . . . . . . . . . .
NFC . . . . . . . . . . .
Acyl-carrier-protein
Acid detergent fibre
Aminoimidazolecarboxamide ribonucleotide
Apparent synthesis
Crude ash
Body weight
Crude fibre
Coenzyme A
Crude protein
Day
Dihydrofolate
Days in milk
Dry matter
Dry matter flow
Deoxyribonucleic acid
Deoxythymidylate
Deoxyuridylate
Ether extract
Endogenous crude protein
Folic acid
Formylaminoimidazolecarboxamide ribonucleotide
Forage to concentrate ratio
Fat corrected milk
Formylglycinamide ribonucleotide
Ruminally fermented organic matter
Glycinamide ribonucleotide
Grundfutter-Kraftfutter-Verhältnis
High concentrate, 34% forage and 66% concentrate on DM basis
High concentrate with folic acid
High concentrate with pantothenic acid
High forage, 66% forage and 34% concentrate on DM basis
High forage with folic acid
High forage with pantothenic acid
Intramuscular
Bayerische Landesanstalt für Landwirtschaft
Least squares means
Multiparous
Metabolisable energy
Microbial crude protein
Nicotinamide adenine dinucleotide
Non-ammonia-N
Neutral detergent fibre
Non-esterified fatty acids
Net energy lactation
Non-fibre carbohydrates
ii
ABBREVIATIONS
OM . . . . . . . . . . .
OMI . . . . . . . . . . .
p...............
PA . . . . . . . . . . . . .
RDP . . . . . . . . . . .
SAM . . . . . . . . . . .
SCFA . . . . . . . . . .
SD . . . . . . . . . . . . .
SE . . . . . . . . . . . . .
SEM . . . . . . . . . . .
ß -HBA . . . . . . . . .
THF . . . . . . . . . . .
uCP. . . . . . . . . . . .
UDP . . . . . . . . . . .
Organic matter
Organic matter intake
Primiparous
Pantothenic acid
Ruminal degraded protein
S-adenosylmethionine
Short chain fatty acids
Standard deviation
Standard error
Standard error of means
beta-hydroxybutyrate
Tetrahydrofolate
Utilisable crude protein
Ruminally undegraded protein
iii
iv
LIST OF TABLES
List of Tables
1
Folate content of several feeds given in the literature
2
Folate content of ruminal material and body weight of steers and cows
11
3
Folate intake, duodenal flow, ileal flow, apparent synthesis and body
weight of steers and cows . . . . . . . . . . . . . . . . . . . . . . . . . .
15
Average serum folate concentrations of cows with and without dietary
supplementation of folic acid . . . . . . . . . . . . . . . . . . . . . . . .
16
Influence of oral folic acid supplementation on milk production and composition . . . . . . . . . . . . . . . . . . . . . . . . . . . . . . . . . . .
22
6
Folic acid experimental design (cows/group) . . . . . . . . . . . . . . .
28
7
Composition of concentrate . . . . . . . . . . . . . . . . . . . . . . . .
29
8
Arithmetic means of nutrient composition and metabolisable energy of
the rations . . . . . . . . . . . . . . . . . . . . . . . . . . . . . . . . . .
35
Intakes of nutrients by lactating and dry cows fed high concentrate or
high forage diets . . . . . . . . . . . . . . . . . . . . . . . . . . . . . .
36
Influence of folic acid supplementation on ruminal variables averaged
over sampling times . . . . . . . . . . . . . . . . . . . . . . . . . . . . .
37
Influence of folic acid supplementation on nutrient flow at the duodenum,
ruminally fermented organic matter and apparent ruminal digestibility
39
Nitrogen flow at the duodenum and efficiency of microbial protein synthesis . . . . . . . . . . . . . . . . . . . . . . . . . . . . . . . . . . . .
40
Effects of dietary supplements of folic acid to dairy cows on serum concentrations of glucose, NEFA, ß-HBS, urea and B-vitamins averaged over
sampling times . . . . . . . . . . . . . . . . . . . . . . . . . . . . . . .
42
Effects of dietary supplements of folic acid to dairy cows on milk production and composition . . . . . . . . . . . . . . . . . . . . . . . . . .
45
15
Summary of pantothenic acid concentrations of several feeds . . . . . .
54
16
Survey of microorganisms which synthesise, require or do not need pantothenic acid . . . . . . . . . . . . . . . . . . . . . . . . . . . . . . . .
56
17
Pantothenic acid concentrations of ruminal material
. . . . . . . . . .
58
18
Pantothenic acid concentrations in whole blood and plasma of ruminants
and women . . . . . . . . . . . . . . . . . . . . . . . . . . . . . . . . .
60
Milk pantothenic acid concentrations without pantothenic acid supplementation . . . . . . . . . . . . . . . . . . . . . . . . . . . . . . . . . .
63
20
Pantothenic acid experimental design (cows/group) . . . . . . . . . . .
69
21
Arithmetic means of nutrient composition, metabolisable energy and
pantothenic acid contents of the rations . . . . . . . . . . . . . . . . . .
75
Intakes of nutrients and pantothenic acid by lactating and dry cows fed
high concentrate or high forage diets . . . . . . . . . . . . . . . . . . .
76
Influence of pantothenic acid supplementation on ruminal variables averaged over sampling times . . . . . . . . . . . . . . . . . . . . . . . . .
76
4
5
9
10
11
12
13
14
19
22
23
. . . . . . . . . .
9
LIST OF TABLES
24
25
26
27
28
v
Influence of pantothenic acid supplementation on nutrient flow at the
duodenum, ruminally fermented organic matter and apparent ruminal
digestibility . . . . . . . . . . . . . . . . . . . . . . . . . . . . . . . . .
78
Nitrogen and pantothenic acid flow at the duodenum, efficiency of microbial protein synthesis and apparent pantothenic acid synthesis . . .
79
Effects of dietary supplements of pantothenic acid to dairy cows on serum
variables averaged over sampling times . . . . . . . . . . . . . . . . . .
83
Effects of dietary supplements of pantothenic acid to dairy cows on milk
production and composition . . . . . . . . . . . . . . . . . . . . . . . .
84
Calculated daily requirements for folic acid and pantothenic acid and
duodenal flow and apparent synthesis of pantothenic acid . . . . . . . .
94
A1
Individual cows used in the folic acid experiment . . . . . . . . . . . . . 104
A2
Arithmetic means of nutrient composition and metabolisable energy of
the forage . . . . . . . . . . . . . . . . . . . . . . . . . . . . . . . . . . 105
A3
Individual cows used in the pantothenic acid experiment . . . . . . . . 105
LIST OF FIGURES
vi
List of Figures
1
Serum folate concentration of dairy cows fed different daily folic acid
supplements . . . . . . . . . . . . . . . . . . . . . . . . . . . . . . . . .
18
Serum glucose (A) and urea (B) concentrations for the high concentrate
feeding groups with and without folic acid supplementation at different
time points after feeding . . . . . . . . . . . . . . . . . . . . . . . . . .
43
Serum 5-methyl-THF concentrations for the high concentrate feeding
groups (A) and the high forage feeding groups (B) with and without
folic acid supplementation at different time points after feeding . . . . .
43
4
Central position of coenzyme A in intermediary metabolism . . . . . .
53
5
Relation between pantothenic acid flow to the duodenum and (A) microbial protein synthesis and (B) organic matter intake . . . . . . . . .
81
2
3
A1
Chemical structur of folic acid . . . . . . . . . . . . . . . . . . . . . . . 103
A2
Reactions of the coenzyme tetrahydrofolate . . . . . . . . . . . . . . . . 103
A3
Chemical structur of pantothenic acid . . . . . . . . . . . . . . . . . . . 104
1 Introduction
1
1
Introduction
B-vitamins are a heterogeneous group of substances with important coenzyme functions (Schweigert 2000). Thiamin (B1 ), riboflavin (B2 ), pyridoxine (B6 ), cobalamin
(B12 ), niacin, biotin, folic acid (FA) and pantothenic acid (PA) belong to the group
of B-vitamins, whereas this classification is purely historical, as these substances have
different chemical structures and metabolic roles (Girard and Matte 2006).
The physiologically active form of FA is tetrahydrofolate (THF), which is the central
coenzyme for the C1 -metabolism (Michal 1999). Thus, THF participates amongst
others in purines and pyrimidines synthesis, as well as in the formation of the primary
methylating agent S-adenosylmethionine (Bailey and Gregory 1999).
Pantothenic acid is a component of the important acyl group carrier coenzyme A (CoA)
and acyl-carrier-protein (ACP). Coenzyme A and ACP are available in every cell and
are involved in more than 100 reactions e.g. fatty acid synthesis and degradation,
pyruvate oxidation and glycerine synthesis (Michal 1999).
It is well established that the microorganisms in the rumen can synthesise B-vitamins
(Bechdel et al. 1928). Thus, ruminants have two sources of FA and PA: feed and
ruminal synthesis. The Society of Nutrition Physiology could not advise a general
supplementation of B-vitamins (Gesellschaft für Ernährungsphysiologie 2001). In the
latest edition of Nutrient Requirements of Dairy Cattle the National Research Council (2001) presented first proposals for B-vitamin requirements for tissue and milk.
However, it must be considered that the B-vitamin requirements for tissue were extrapolated from requirements of lactating sows. Comparing the proposed requirements
(computed for a cow with 650 kg body weight (BW) and 35 kg fat-corrected milk)
with their ruminal synthesis (calculated from the estimated intake and duodenal flow
of each vitamin) it becomes apparent that FA and PA seem to be the sole B-vitamins
where the estimated requirements are not met by ruminal synthesis. Therefore supplementations of FA and PA may be beneficial for high-producing dairy cows, whereas,
it must be considered that only two studies are available observing the duodenal FA
flow in dairy cows (Santschi et al. 2005a; Schwab et al. 2006), and the duodenal flow of
PA has only been measured once with growing steers (Zinn et al. 1987). Furthermore,
1 Introduction
2
studies on the impact of FA and PA on ruminal metabolism, blood and milk variables
are rare. For dairy cows the influence of an FA supplementation on blood and milk
concentrations of FA has been measured in four studies, while PA influence on blood
and milk PA concentrations were tested only once. Additionally, the influence of PA on
the performance of dairy cows has been tested once and an increase in milk production
was established (Bonomi 2000). For FA the influences on performance vary, as studies
with and without an effect can be found (Girard and Matte 1998; Girard et al. 2005;
Graulet et al. 2007). So far, no studies are available that consider the influences of these
vitamins on ruminal metabolism, duodenal nutrient flows, blood and milk variables, as
well as the vitamin concentrations in these matrices simultaneously. Results of such a
simultaneous survey would be very helpful for a better understanding of the influence
of FA and PA on dairy cows.
As B-vitamins are synthesised and degraded by ruminal microorganisms, the composition of the ration may also have an effect on the availability of FA and PA at the
duodenum. For FA, the influence of different forage to concentrate (F:C) ratios on
duodenal FA flow has been measured once, by Schwab et al. (2006). They established
that the ration with the highest concentrate and non-fibre-carbohydrate (NFC) content resulted in the highest duodenal flows of FA, while the ration with the lowest
content of concentrates and NFC led to the lowest flow of FA. However, the effects of
varying F:C ratios on supplemented FA have not been proven. So far, an influence of
the dietary composition on the duodenal flow of PA has not been observed. Besides
FA, the duodenal flows of B1 , B6 , B12 and niacin are also influenced by the F:C ratio
of the diet (Schwab et al. 2006), thus it is conceivable that the duodenal flow of PA is
also influenced.
Therefore, the objective of the present studies was to contribute to a better understanding of FA and PA metabolism in the rumen and the whole animal as will be described
in detail in the following sections.
2 Scope of the thesis
2
3
Scope of the thesis
Deduced from the mentioned gaps of knowledge in the introduction, the scope of this
thesis was to establish on the one hand the influence of an FA supplementation and
on the other hand the influence of a PA supplementation on selected variables in dairy
cows. A further focus was put on the impact of different F:C ratios of the diets on each
vitamin. Thus, this thesis is based on the following questions:
1. What influence has an FA or PA supplementation on ruminal metabolism and
duodenal nutrient flow with two rations varying in the F:C ratio?
2. What influence has the supplementation of FA respectively PA in the two diets
on blood and milk variables?
3. Has the supplementation of FA and PA and the different F:C ratios an influence
on the duodenal flow, blood and milk concentration of the respective vitamin?
The influences of an FA supplementation are examined in Chapter 3, while PA is
handled in Chapter 4.
Each Chapter starts with a review of current literature, followed by the results of the
studies on the impact of an FA respectively a PA supplementation to two diets differing
in F:C ratio on ruminal fermentation, nutrient flow at the duodenum, blood and milk
variables of dairy cows. Therefore double fistulated dairy cows were either fed with a
diet consisting of 34% forage and 66% concentrate or 66% forage and 34% concentrate.
The FA and PA experiment were implemented at the same time; thus, each cow either
received 1 g FA, or 1 g PA or no supplementation daily.
4
3 Folic acid
3
3.1
Folic acid
Folic acid in ruminant nutrition: a
review
Published in the British Journal of Nutrition1
1
Ragaller, V.; Hüther, L.; Lebzien, P. (2009): Folic acid in ruminant nutrition: a review. British
Journal of Nutrition 101, 153 – 164
3.1
Folic acid in ruminant nutrition: a review
5
Introduction
In general, it is assumed that B-vitamin requirements for ruminants can be met by
microbial synthesis in the rumen, even when the animals are fed a diet providing very
small amounts of those vitamins. This hypothesis was already established in 1928 by
Bechdel et al.. However, since that time average milk and milk component yields have
increased drastically (already by about 33% in the last 15 years in the USA), whereas
the increase of average dry matter (DM) intake was considerably lower (only about
15%; Weiss and Ferreira 2006). Furthermore, feeding strategies changed to support the
increase in milk production and milk component yields. Changes in diet composition
(from less forage towards more concentrate) influence the microbial population in the
rumen, so it is a moot point whether the B-vitamin requirements of dairy cows are still
being met.
Folic acid is very important during lactation and for deoxyribonucleic acid (DNA)
synthesis of fetal and placental tissue during pregnancy (McNulty et al. 1993), therefore
a suboptimal supply should be avoided. In agricultural practice in dairy cows, gestation
and lactation are concomitant during several months per year, so the avoidance of
progressive folate deficiency must be a priority.
Up to now the folate content of feed is rarely analysed and values on microbial folate
synthesis are scarce. So it is very difficult to estimate a cow’s actual supply with
folates (National Research Council 2001). The National Research Council (2001) tried
to estimate requirement values of folates for cows, but they had to extrapolate the
cows’ requirements from data of sows and average vitamin contents found in cows’
milk. They estimated a daily folate requirement of 33 mg/d for tissue and 2 mg/d
for milk for a dairy cow with a BW of 650 kg and a milk production of 35 kg fatcorrected (4%) milk per day. However, final evidence in the form of studies on cows’
requirements is still lacking, as the number of appropriate studies is limited. Therefore
this review will present current knowledge of folate metabolism and the influence of FA
supplementation on ruminal variables, folate absorption and performance, especially
for dairy cows. Areas on which future research should focus will be highlighted.
3.1
Folic acid in ruminant nutrition: a review
6
Chemical structure
The vitamin FA (chemical name pteroylglutamic acid) consists of three parts: a pteridine nucleus, para-aminobenzoic acid and glutamic acid (Girard 1998; see Appendix
Figure A1). The name FA is deduced from folium, the Latin word for leaf, because
native forms of FA were originally isolated from spinach leaves (Mitchell et al. 1944). In
chemistry the name FA is only used for the synthetic form. It is a stable compound and
the basal structure of a wide family of vitamin coenzymes (Lucock 2000). In nature,
more than 100 compounds, with the basal structure of FA, feature a common vitamin
activity. These pteroylglutamate forms of FA are generally called folates (Bender 1992;
Girard 1998; Finglas et al. 2003). Native folates vary in three chemical characteristics
from FA: first, in the level of reduction of the pteridine nucleus (dihydrofolate or THF);
second, in the character of the onecarbon substituent linked to the N atoms N-5 and
N-10 (for example, formyl, formimino, methyl, methylene or methenyl residues); third,
in the chain length of the glutamyl residues which can be linked to the γ-carboxyl
group of the glutamate via peptide linkages (Wagner 1984; Girard 1998).
Absorption and biochemical functions
There are several excellent reviews on absorption and biochemical functions of folates
(Selhub et al. 1983; Bässler 1997; Scott 1999; Wright et al. 2007). Derived from studies
with non-ruminant animals, two mechanisms of folate absorption from the intestinal
tract seem to exist: an active saturable process and a non-saturable passive process. In
fact, the relative importance of passive absorption changes according to folate supply,
increasing with the amounts of folates available (Selhub et al. 1983; Bässler et al. 2002).
However, folates are perhaps degraded, converted and synthesised in the forestomachs
of ruminants (Zinn et al. 1987), and even absorbed on a small scale (Rérat et al. 1958).
Unfortunately the forms and the availability of the forms present in rumen contents
and duodenal digesta are unknown.
In bovine blood, mainly 5-methyl-THF is found (Anonymous 1992). Cells take up this
compound and demethylate it to THF. To retain THF in cells it must be converted
by folylpolyglutamate synthase to polyglutamate THF, the coenzymic form of folates
(Bässler 1997). Polyglutamate THF is involved in several biochemical pathways in
3.1
Folic acid in ruminant nutrition: a review
7
mammals (Choi and Mason 2000; see Figure A2 in the Appendix). Mainly, folates are
donors and acceptors of one-carbon units (Bender 1992; Benevenga 2004). Thus they
are involved in the remethylation of homocysteine to methionine, as an essential part
of the methylation cycle. This reaction is also vitamin B12 dependent, as the catalysing
enzyme methionine synthase needs vitamin B12 (Scott 1999). Furthermore, the transfer
of one carbon units involves folates in the synthesis of purines and pyrimidines and
thereby in DNA synthesis and cell proliferation (Bässler 1997). Tetrahydrofolate is
regenerated after these catalytic reactions (Bässler 1997). However, folate disappears
through urinary excretion and through bile, although a very effective reabsorption by
the enterohepatic cycle exists (Bässler et al. 2002). Up to now only one study reported
on the urinary excretion of folates in dairy cows (nine animals) after intramuscular
(i.m.) injection of 0.3 mg FA per kg BW (Girard and Matte 1995). The authors found
an excretion of the injected dose of 35.1% after 8 h and 44.2% after 48 h.
A deficit of folates can lead to a decrease in S-adenosylmethionine levels and to an
abnormal DNA precursor metabolism resulting in faulty DNA synthesis and a decrease
in nicotinamide adenine dinucleotide (NAD; James et al. 1994), as a decrease in NAD
levels is consistent with an increase in DNA repair activity (James et al. 1989). An
indirect lack of folates can be caused by a vitamin B12 deficit. This results in an
accumulation of 5-methyl-THF called a methyl-trap, as 5-methyl-THF cannot be regenerated to THF (Bässler et al. 2002). If so, cells are unable to conjugate absorbed
folate monoglutamates, resulting in a decreased intracellular folate polyglutamate level.
Additionally, intracellular folate accumulation declines as only polyglutamates can be
retained in cells (Scott and Weir 1976).
As folates influence DNA synthesis and the methionine cycle, they are involved in the
metabolic pathways of reproduction and milk protein synthesis; therefore they are very
important especially in gestating and lactating cows. An additional special situation for
cows is that they have a very high demand for methyl groups in early lactation. Concurrently some precursors for methylated compounds (for example, serine and glycine) are
also needed for gluconeogenesis, as the amounts of glucose reaching the small intestine
through the digestive system are generally low. So, coincident demand for precursors
of methylated compounds leads to competition between different metabolic pathways,
3.1
Folic acid in ruminant nutrition: a review
8
for example, gluconeogenesis, lecithin synthesis, DNA synthesis and remethylation of
methionine (Brüsemeister and Südekum 2006; Girard and Matte 2006).
Sources and stability of folates
The following section gives a survey of approximate folate concentrations in some feeds
and foods. Different folate contents are given in the literature for the same feedstuffs
(Table 1) and for most feeds they are not analysed at all, so only few data are available.
It must be considered that as compilations were used in Table 1, the number of samples
analysed is not known. Additionally, it must be pointed out that the native folate
concentrations in feeds vary due to influences of climate, species, vegetation stage,
habitat and fertiliser (Albers et al. 2002). Furthermore, most naturally occurring folates
are chemically relatively unstable. Thus folates exhibit a significant loss of activity
during harvesting, storage and processing, but measured folate concentrations are also
highly influenced by the method used for sample preparation (Gregory 1989). The
synthetic form, FA, is more resistant to chemical oxidation (Scott 1999).
The figures generally show very low folate contents in feedstuffs. However, quantities
are not the only decisive factor; the folates in the feed must also be available for absorption (Wagner 1984). The so-called bioavailability describes the proportion of an
orally administered dose which is available in plasma after absorption (van den Berg
1993). It is difficult to consider the bioavailability of native folates because unknown
numbers and amounts of folate metabolites exist in every plant species or feedstuff.
For ruminants the assessment of folate bioavailability is more difficult as their microorganisms in the rumen synthesise, but also degrade, ingested folates. The synthesis and
degradation of folates in the rumen is crucial for the amount absorbed from the small
intestine of ruminants. Up until now the number of studies on rumen folate synthesis
and degradation has been very low; therefore for ruminants no values of folate bioavailability from feedstuffs are available. Furthermore the bioavailability of native folates is
influenced by different physico-chemical properties and certain feed constituents. For
example, polyglutamyl folates have a lower bioavailability than monoglutamyl folates,
as polyglutamyl folates must be hydrolysed to monoglutamates before absorption (Seyoum and Selhub 1998). Additionally, the actual amount available for each individual
3.1
9
Folic acid in ruminant nutrition: a review
animal varies depending on differences in intestinal pH or general living conditions
(Wagner 1984).
Table 1: Folate content of several feeds given in the literature
Feed
Lucerne meal
Range of folate
References
content (mg/kg DM)
1.65 - 5.55
Anonymous (1996), National Research Council
(1998)
Lucerne hay
2.60 - 3.40
Anonymous (1996), Schwab et al. (2006)
Barley, whole grain
0.07 - 0.68
Anonymous (1996), National Research Council
(1998), Souci et al. (2000), LfL (2004)
Maize, whole grain
0.03 - 0.45
Anonymous (1996), National Research Council
(1998), Souci et al. (2000), LfL (2004)
Maize silage
0.48
Schwab et al. (2006)
Grass hay
0.52
Schwab et al. (2006)
Oats, whole grain
0.04 - 0.58
Anonymous (1996), National Research Council
(1998), Souci et al. (2000), LfL (2004)
Peas
0.17 - 0.66
Anonymous (1996), National Research Council
(1998), Souci et al. (2000), LfL (2004)
Rapeseed meal, solvent
extracted
Rye, whole grain
0.22 - 2.40
Anonymous (1996), LfL (2004)
0.17 - 0.81
Anonymous (1996), National Research Council
(1998), Souci et al. (2000)
Soybean meal, solvent
extracted
0.50 - 4.18
Anonymous (1996), National Research Council
(1998), LfL (2004), Schwab et al. (2006)
Wheat, whole grain
0.10 - 0.56
Anonymous (1996), National Research Council
(1998), Souci et al. (2000), LfL (2004)
Whey powder
0.01 - 0.97
Anonymous (1996), National Research Council
(1998), Souci et al. (2000)
DM, dry matter; LFL, Bayerische Landesanstalt für Landwirtschaft
Microbial synthesis, degradation and absorption of folates in the gastrointestinal tract of ruminants
It is well known that the microbial activity and the ruminal population are influenced
by the level of concentrate in the diet and the type of feed (Hungate 1966). As some
bacterial species are able to synthesise folates, and some others need them (Wolin and
Miller 1988), different amounts of folates can be synthesised and used in the rumen
depending on the feed composition. For steers, Hayes et al. (1966) and Girard et al.
(1994) described a relationship between the proportion of concentrates in the diet and
the amount of folates in the rumen. High-concentrate diets resulted in an increase of
3.1
Folic acid in ruminant nutrition: a review
10
folates (Table 2). The authors hypothesised that this increase is due to an enhanced
microbial activity in the rumen, caused by rapidly degradable carbohydrates. But it
must also be considered that concentrations are not necessarily representative of the
total amount synthesised in the rumen, as digesta passage and rumen volume could
vary between treatments, for example, due to fibre differing greatly in amount and
length. Santschi et al. (2005b) could not corroborate this hypothesis for cows, because
they found no difference in the amount of folates in the liquid fraction of ruminal
content between the high-forage (58% forage) and low-forage (37% forage) diets (Table
2). However, the F:C ratio of the two diets used in the study of Santschi et al. (2005b)
was not as extreme as in the studies with the steers (Hayes et al. 1966; Girard et al.
1994) and additionally Santschi et al. (2005b) used diets with more ingredients than
Girard et al. (1994) and Hayes et al. (1966; Table 2). Furthermore the steers had a
BW of 340 kg (Hayes et al. 1966) and 352 (SE 27) kg (Girard et al. 1994), whereas
primiparous and multiparous cows weighed 582 (SE 17) kg and 692 (SE 17) kg (Santschi
et al. 2005b), respectively, which resulted in a different DM intake between cows and
steers (Table 2). It should be noted that in all three studies folate concentrations in
ruminal fluid were very different. One reason for this could possibly be the different
diet composition used in the three studies (Table 2). Additionally, Hayes et al. (1966),
who found the highest values, used a different sample preparation method from Girard
et al. (1994) and Santschi et al. (2005b). The higher values found by Hayes et al.
(1966) in the supernatant fraction could result from bacterial content, as the samples
were centrifuged after freezing and thawing, which could have destroyed bacterial cells.
Contrary to this, Girard et al. (1994) and Santschi et al. (2005b) centrifuged their
samples before freezing. Furthermore, Hayes et al. (1966) used a microbiological assay
(Streptococcus faecalis) to analyse folate concentration in ruminal samples. In contrast,
Girard et al. (1994) and Santschi et al. (2005b) analysed their samples by radioassay.
Animals(n)
BW (kg)
6.3 kg flaked maize1 + 1.1 kg soybean meal with minerals1,2
6.6 kg ground maize1 + 1.1 kg soybean meal with minerals1,2
7.5 kg ground maize1 + 1.8 kg long lucerne hay1 + 0.7 kg soybean
meal with minerals1,2
7.5 kg flaked maize1 + 1.8 kg ground lucerne hay1 + 0.7 kg soybean
meal with minerals1,2
7.4 kg ground maize1 + 1.7 kg ground lucerne hay1 + 0.7 kg soybean
meal with minerals1,2
8
8
8
Mean SE
340
340
340
DM intake (kg/d)
Mean
SE
Folates in
Solid fraction
Liquid fraction
(mg/kg DM)
(ng/mL)
Mean
SE
Mean
SE
186a
180a
83b
8
340
91b
8
340
144c
70% rolled barley + 30% timothy hay2
+ 2 mg folic acid per kg BW2
30% rolled barley + 70% timothy hay2
+ 2 mg folic acid per kg BW2
8
352
27
8
352
27
58% forage (hay silage, maize silage) + 42% concentrate
(cracked maize, soybean meal, protein supplement, minerals)
37% forage (hay silage, maize silage) + 63% concentrate
(cracked maize, soybean meal, protein supplement, minerals)
84
85
84
85
5824
6925
5824
6925
17
17
17
17
8.09
7.88
7.67
8.09
0.64
1.35
1.11
0.77
24.5a,4
29.4b,5
24.5a,4
29.4b,5
1.0
1.0
1.0
1.0
0.81a
5.84c,3
0.66b
5.84c,3
0.03
0.01
53.0a
613.5c,3
40.9b
613.5c,3
3.8
4.18a,4
3.52a,5
4.05a,4
3.60a,5
0.32
0.32
0.32
0.32
References
Hayes et al. (1966)
Girard et al. (1994)
3.0
Santschi et al. (2005b)
Folic acid in ruminant nutrition: a review
Diet
3.1
Table 2: Folate content of ruminal material and body weight (BW; at the beginning of the trial) of steers and cows (mean values
with their standard errors)
a,b,c
1
2
3
4
5
Mean values within a trial with unlike superscript letters were significantly different (P ≤ 0.05).
In these studies no DM values of feed were given; therefore fresh matter values are presented here.
This study was conducted with steers.
In this study values of the solid and liquid fraction of the ruminal content were given as area under the curve; concentrations presented here are calculated
on this basis.
Data from primiparous cows.
Data from multiparous cows.
11
3.1
Folic acid in ruminant nutrition: a review
12
An in vitro study by Hall et al. (1955) showed that the degradation of fibrous materials
by rumen microorganisms increases (42%) with supplementation of FA (100 mg/20 mL
medium). So it seems that cellulolytic microorganisms require folates, which would endorse the findings of Hayes et al. (1966) and Girard et al. (1994), who found decreased
folate concentrations with high-forage diets. Studies on folate requirements of microorganisms are rare. Some strains of Ruminococcus flavefaciens, a cellulolytic rod, seem
to require either FA, THF or p -aminobenzoic acid (which is a part of FA; Ayers 1958;
Bryant and Robinson 1961; Scott and Dehority 1965; Slyter and Weaver 1977). Also
two strains of Ruminococcus albus require FA (Bryant and Robinson 1961). Furthermore Hayes et al. (1966) observed that the level of folates in the ruminal fluid correlated
negatively with pH. This corroborates the previous findings, because R. flavefaciens is
sensitive to acid (Miyazaki et al. 1992) and ruminal pH increases with diets rich in fibre.
Since these studies were conducted, feeding strategies, genetics and keeping conditions
have changed, and it would be interesting to see if similar and if possible even more
detailed results relating to species of microorganisms could be obtained today.
Consequent to FA supplementation to steers, Girard et al. (1994) observed an increase
in folate concentration in the solid and liquid fractions of the rumen contents compared
with a supplement-free diet (P = 0.0001 for both fractions; Table 2). However, different from supplement-free diets, the F:C ratio had no influence on the ruminal folate
concentration. Furthermore, they observed that neither FA supplementation nor the
nature of the diet made a difference to the quantity of protein synthesised per unit
of microbial mass (Girard et al. 1994). Chiquette et al. (1993) analysed the effect of
FA supplementation on digestibility and ruminal fermentation in growing steers. They
noticed a trend (P = 0.08) of pH to decline 4 to 8 h after feeding a diet consisting
of 70% rolled barley, 30% timothy hay and a supplementation of 2 mg FA per kg
BW as compared with the unsupplemented diet. The results showed that the concentration of ruminal acetate and butyrate did not change due to FA supplementation,
whereas ruminal propionate concentrations increased (P ≤ 0.05) after feeding, and
the acetate:propionate ratio was numerically higher during the 24 h of observation due
to FA supplementation. The apparent digestibility of DM, fibre fractions and crude
protein (CP) was not influenced by the addition of FA (Chiquette et al. 1993). So it
3.1
Folic acid in ruminant nutrition: a review
13
seems that FA has no major influence on digestibility and ruminal fermentation, but
until today these processes have only been tested once (with eight steers), comparing few different diet compositions, so it is difficult to extrapolate these data to other
experimental conditions.
Santschi et al. (2005a) and Schwab et al. (2006) determined the daily apparent ruminal
folate synthesis for lactating cows without supplementation of FA, whereas Zinn et al.
(1987) provided data for growing steers (Table 3). On average, Schwab et al. (2006)
calculated 16.2 mg daily apparent folate synthesis and Santschi et al. (2005a) 20.0 mg.
Strikingly opposing these results, Zinn et al. (1987) on average calculated a negative
daily apparent ruminal folate synthesis of 20.1 mg for growing steers (194 kg BW).
These results could be due to the fact that growing male animals which were used in
their experiment had a much lower organic matter (OM) intake (3.44 kg OM/d) than
the adult female animals of Santschi et al. (2005a; 18.4 kg OM/d; calculated from DM
intake and ash content of the diet) and Schwab et al. (2006; 18.7 kg OM/d) and due to
the differences in the ruminal passage rate. Additionally, the negative values of Zinn
et al. (1987) could also result from a dietary effect, as Zinn et al. (1987) fed a diet
with a very high concentration of maize grain, in contrast to diets used in the studies
of Santschi et al. (2005a) and Schwab et al. (2006; Table 3).
It must be pointed out that disappearance rates, expressed as the amount of folates
appearing at the duodenum relative to the quantity given, were very high in all experiments with dietary supplements of FA (about 97%; Zinn et al. 1987; Santschi et al.
2005a). Therefore it is arguable whether unprotected FA can be supplemented effectively. However, one has to keep in mind that disappearance could either be caused
by degradation or absorption (Zinn et al. 1987). Indeed, a net flux across the rumen
wall was only found if high amounts of FA were present in the rumen. So it seems that
the rumen wall is able to absorb FA. However, the efficiency is very low, so net flux
across the rumen wall into the blood circulation can be neglected (Girard et al. 2001;
Girard and Remond 2003). On the other hand, folates are absorbed at the proximal
intestine (Girard and Remond 2003), and therefore they could already be absorbed at
the proximal duodenum before the cannula, hence ruminal disappearance of FA could
be overestimated (Santschi et al. 2005a).
3.1
Folic acid in ruminant nutrition: a review
14
Table 3 gives a survey of the amount of folates found in the duodenum. The apparent
intestinal disappearance (between duodenal and ileal cannula) seems to be very low
(Santschi et al. 2005a). Without supplementation of FA, the duodenal flow of folates
is lower than the ileal flow, and it rose above the ileal flow only by supplementation
of FA (Table 3). So it seems that there is no apparent intestinal disappearance of
folates without supplementation of FA and with supplementation the apparent intestinal disappearance approximates 4% (Santschi et al. 2005a). Santschi et al. (2005a)
hypothesised that the apparent intestinal absorption of folates is underestimated, as
folates are extensively recycled by the enterohepatic cycle and then released between
the duodenal and ileal cannula - thus explaining the higher values of folates in the ileal
flow.
Generally, Girard et al. (2001) reason that for dairy cows, folate absorption in the
gastrointestinal tract is an active saturable process. With dietary supplements of 2.6 g
FA/d this process was already saturated, as higher supplementations could not effectively increase the amount of folate reaching the blood circulation. Due to the
destruction of folates by microorganisms, and the low importance of passive absorption, they deduced the minor efficiency of folate absorption in ruminants (< 5%; Girard
et al. 2001) versus humans (10 to 46%; Zettner et al. 1981). In general it should be
considered that at present no studies are available comparing the amount of folates
in the ruminal content and the amount in the duodenum, hence no statement can be
made on the coherence between the amount of folates in the ruminal content and the
amount of folates in the digesta at the duodenum.
35% lucerne hay + 10% Sudan grass + 45% maize +
6% molasses + 4% fat
Without folic acid supplementation
+ 10 mg of folic acid per d
+ 100 mg folic acid per d
44% grass-legume silage + 15% maize silage + 34%
high-moisture maize + 5% protein supplement + 2%
minerals
Without folic acid supplementation
+ 2600 mg folic acid per d
35% forage4 + 65% concentrate with soybean
hulls, beet pulp, soybean meal (30% NFC)
35% forage4 + 65% concentrate with maize, barley,
soybean hulls, beet pulp, soybean meal (40% NFC)
60% forage4 + 40% concentrate with soybean hulls,
beet pulp, soybean meal (30% NFC)
60% forage4 + 40% concentrate with maize, barley,
soybean hulls, beet pulp, soybean meal (40% NFC)
Animals (n)
Folate intake
(mg/d)
Mean
SE
Duodenal flow
(mg/d)
Mean
SE
Ileal flow
(mg/d)
Mean SE
AS1
(mg/d)
Mean
SE
References
Zinn et al. (1987)
3 s.
3 s.
3 s.
194
194
194
1.2
11.2
101.2
0.3
0.3
0.3
1.12
1.22
3.82
-0.13
-103
-97.43
0.3
0.3
0.3
Santschi et al. (2005a)
4 m.
4 m.
4 p. and 4 m.
574 p.
651 m.
4 p. and 4 m. 574 p.
651 m.
4 p. and 4 m. 574 p.
651 m.
4 p. and 4 m. 574 p.
651 m.
7.0
2607
59
67
59
67
59
67
59
67
27.0
106.0
2.0
2.0
40.0
102.0
3.0
16.0
203
-25013
13.7
0.95
28.96,7
2.45
15.26,7
2.05
12.2
0.95
32.46,7
2.45
20.26,7
2.05
12.4
0.95
25.46,7
2.45
13.06,7
2.05
12.6
0.95
29.06,7
2.45
16.46,7
2.05
Schwab et al. (2006)
Folic acid in ruminant nutrition: a review
Diet
Body weight
(kg)
Mean SE
3.1
Table 3: Folate intake, duodenal flow, ileal flow, apparent synthesis (AS) and body weight (at the beginning of the trial) of steers
and cows (mean values with their standard errors)
NFC, non-fibre carbohydrates; s., steers; m., multiparous cows; p., primiparous cows
Apparent synthesis = duodenal flow minus intake.
2
Values did not differ significantly.
3
In Zinn et al. (1987) and Santschi et al. (2005a) apparent ruminal synthesis was not calculated by the authors, but daily intake and duodenal flows
were given. Furthermore, Santschi et al. (2005a) declare no levels of significance at all, therefore it was not possible to characterise significance in these
studies.
4
Forage = 50% maize silage, 33% lucerne hay, 17% grass hay.
5
SEM, not SE, was used.
6
Significant effects of NFC (P ≤ 0.05).
7
Significant effects of forage (P ≤ 0.05).
1
15
3.1
16
Folic acid in ruminant nutrition: a review
Folate concentrations in blood, milk and liver
Blood
Table 4 shows serum folate concentrations in different feeding studies with cows. Without supplementation of FA serum folate levels varied between 13.6 and 23.3 ng/mL.
In plasma Santschi et al. (2005b) found significantly (P = 0.005) lower folate concentration for primiparous cows (12.7 (SE 1.6) ng/mL) compared with multiparous cows
(18.4 (SE 1.6) ng/mL). These observations were not affected by the composition of the
diet (58 or 37% forage).
Table 4: Average serum folate concentrations (ng/mL) of cows with and without
dietary supplementation of folic acid (mean values with their standard errors)
Supplementation
Number of cows
None
None
14
56
None
None
8 p. and 12 m.
8 p. and 12 m.
None
2 mg/kg BW
4 mg/kg BW
10 p. and 11 m.
12 p. and 19 m.
10 p. and 11 m.
None
3 mg/kg BW
6 mg/kg BW
18
16
16
Primiparous
Mean SE
14.51,4
14.33,4
0.7
0.8
Multiparous
Mean SE
13.61 1.0
23.33 0.6
17.21,4
16.83,4
Primiparous +
multiparous
Mean
SE
0.7
0.8
Girard et al.
(1995)2
16.7
25.35
35.55
15.86
20.65,6
23.05,6
1.6
1.7
1.7
References
Girard et al.
(1989)2
1.4
1.4
1.4
Girard and Matte
(1998)
Girard et al.
(2005)
p., Primiparous cows; m., multiparous cows; BW, body weight
Concentration determined in serum from cows before parturition.
2
Girard et al. (1989) and Girard et al. (1995) declare no levels of significance between cows before parturition and after parturition; therefore it was not possible to characterise significance
in these studies.
3
Concentration determined in serum from cows after parturition.
4
Significant effect (P ≤ 0.05) between primiparous and multiparous cows.
5
Significant differences (P ≤ 0.05) between control and folate groups.
6
Concentrations determined in serum from cows 18 weeks after calving.
1
Without supplementation, serum and plasma folate concentrations increase after parturition, as the maternal-fetal complex no longer requires folates (Figure 1). However,
starting on the day of parturition, the cow requires folates for milk production, but
it seems that this demand is lower than that for the maternal-fetal complex (Girard
and Matte 1999; Graulet et al. 2007). From mating (about two months after previous
parturition) to parturition Girard et al. (1989) found a decrease of total serum folates
of 40%, indicating that the maternal-fetal complex has an increasing demand for folate.
Also, Girard and Matte (1995) discovered a higher demand for folates in the tissues
3.1
Folic acid in ruminant nutrition: a review
17
of lactating and gestating cows than in lactating non-gestating cows. Serum clearance
was significantly slower (P = 0.04) in non-gestating cows after an intravenous injection
of 50 mg FA. However, in another study, Girard and Matte (1999) could not find a
difference in serum folate concentrations between gestating and non-gestating cows.
Oral supplementation (Table 4) or i.m. injection of FA significantly increased serum
folate concentrations (Girard et al. 1989; Girard et al. 1992; Girard et al. 1994; Girard
et al. 1995; Girard and Matte 1998; Girard and Matte 1999; Girard et al. 2001; Girard
et al. 2005). Actually, oral doses higher than 0.5 mg FA/kg BW are required to
produce a noticeable effect in serum folate concentration, as concluded from a doseresponse study with heifers (150 kg BW; Girard et al. 1992). However, the heifers used
in the present study were very young and therefore full ruminal function may not have
been developed. Comparable investigations have not been carried out again and in all
further studies supplementations higher than 0.5 mg FA/kg BW were used.
As shown in Figure 1, FA supplementation increased serum folate concentrations in
cows from four weeks before calving until calving. The increase intensified with higher
dietary supplementation (Girard and Matte 1999). Unfortunately no further measurements were performed between the initial sampling time four weeks before calving
and at the time of calving, so it is not evident if serum folate levels had already increased before calving due to dietary supplementation. After calving, supplemented
cows had decreasing serum folate concentrations. The more FA was added to the diet,
the sharper the decline, reaching a plateau value sixteen weeks after parturition (Girard and Matte 1999). As well as the influence of FA supplementation, Girard and
Matte (1999; P = 0.0001) and Girard et al. (2005; P = 0.02) showed a significant time
effect, as the gain in serum folate concentration due to dietary supplementation was
greater in the first eight weeks of lactation than later in lactation (Figure 1). It seems
that increasing serum folate concentrations during early lactation could result from a
decreased ability of the cells to retain and use folates (Girard et al. 2005). A reason for
this may be generally lower serum vitamin B12 levels (181 pg/mL) at early lactation
compared with 252 pg/mL in the later lactation (Girard et al. 2005); therefore folates
can get into the methyl-trap mentioned above.
3.1
18
Folic acid in ruminant nutrition: a review
Serum folates (ng/mL)
100
80
60
40
20
0
-4
0
4
8
12
16
20
24
28
32
36
40
Time after parturition (weeks)
Unsupplemented
2 mg folic acid\kg body weight
4 mg folic acid\kg body weight
Figure 1: Serum folate concentration of dairy cows fed different daily folic acid supplements (according to Girard and Matte (1999), modified)
Three studies are available dealing with an influence of FA supplementation on packed
cell volume and haemoglobin concentrations in blood. In one study with an oral supplementation of 4 mg FA/kg BW an increase (P ≤ 0.05) in packed cell volume and
haemoglobin in primiparous cows was found sixteen weeks after parturition compared
with non-supplemented primiparous cows (Girard and Matte 1999). Oral supplementation of FA had no effect on these variables in multiparous cows (Girard and Matte
1999; Girard et al. 2005). These effects could be explained by generally lower vitamin
B12 levels in primiparous compared with multiparous cows, as folates and vitamin B12
are both required for DNA synthesis (as described in the ’Absorption and biochemical
functions’ section; Girard and Matte 1999). Hence a lack of each individual vitamin or
of both vitamins together can delay the maturation of blood cells (Bills et al. 1992).
Folic acid supplemented to primiparous cows, which have low vitamin B12 levels, may
decrease the deficit in DNA synthesis that results in higher packed cell volume and
blood haemoglobin values. However, it must be pointed out that changes of packed
cell volume and blood haemoglobin due to FA supplementation are smaller than natural changes taking place during lactation (Girard and Matte 1999; Girard et al. 1995).
No effects on these parameters were found in either primiparous or multiparous cows
with i.m. injections of 160 mg FA once per week (Girard et al. 1995).
3.1
Folic acid in ruminant nutrition: a review
19
Up to now Graulet et al. (2007) are the only authors studying the influence of FA on
plasma concentrations of amino acids and glucose. Between week three before calving
and week eight after calving, supplementation of FA significantly increased plasma concentrations of alanine, glycine, serine, threonine and total sulfur amino acids. Concurrently, plasma concentrations of glucose and aspartate significantly decreased (Graulet
et al. 2007). As aspartate is one of the main N-donors during purine biosynthesis,
a decrease in plasma aspartate levels due to FA supplementation could be based on
an increased DNA formation. A higher availability of glycine and serine could induce
an increase in 1-C-donors for synthesis of methyl-THF (Graulet et al. 2007). So far
these are the only explanations for the observed effects. Therefore it would be interesting to conduct further studies on the influence of FA supplementation on plasma
concentrations of amino acids and glucose.
As the few available studies show increasing folate concentrations in serum and plasma,
it is important to study the influence of FA supplementation on blood variables and
thus on whole-animal metabolism.
Milk
Supplementation of FA does not influence feed intake (Graulet et al. 2007; Girard
and Matte 1998; Girard et al. 2005). However, the effects of FA supplementation on
milk production of cows vary (Table 5). For gestating primiparous and multiparous
cows, Girard et al. (1995) found a non-significant increase in milk production of 14%
in the last part of lactation due to an i.m. injection of 160 mg FA once per week.
However, they could not find an effect on milk production immediately after calving.
In contrast, Girard and Matte (1998) found an increased milk production of 6% during
the first 100 days of lactation (P = 0.06) for multiparous cows receiving 4 mg FA/kg
BW and a 10% increase from day 100 to day 200 (P = 0.05). For primiparous cows,
however, milk production decreased in the first 100 days of lactation (P ≤ 0.08) with a
supplementation of 2 and 4 mg FA/kg BW; in the following lactation no effect could be
noticed. Graulet et al. (2007) only studied the first 56 days of lactation; during this time
cows fed a supplement of 2.6 g FA/d showed a significant (P = 0.01) increase in milk
production (Table 5). The effects on multiparous cows could result from folate body
3.1
Folic acid in ruminant nutrition: a review
20
stores depleted by several lactations and gestations. The effects on primiparous cows
were explained by their generally lower vitamin B12 levels compared with multiparous
cows (Girard et al. 1995; Girard and Matte 1998). Graulet et al. (2007) established
the hypothesis that higher milk production during FA supplementation results from an
improved synthesis of purines and pyrimidines which are necessary for DNA replication.
This hypothesis could be supported by the decreased plasma aspartate levels mentioned
earlier. These different hypotheses and observations make clear that more studies are
necessary to find an explanation for the effects and to discover under which conditions
the effects can be reproduced, as Girard et al. (2005) could not find any effect on the
milk production of multiparous cows by either supplementing 3 or 6 mg FA/kg BW
(Table 5).
Folate occurs in cows’ milk mainly as 5-methyl-THF, whereas approximately half of it
exists as mono- and the other as polyglutamates (Wigertz and Jägerstad 1995). Almost all folate in cows’ milk is bound to specific folate-binding proteins. Generally, the
highest milk folate concentrations are found in the colostrum. Starting at parturition,
folate concentrations in milk decrease until four weeks after parturition when folate
concentrations reach a plateau which is stable until the end of lactation (Girard et al.
1995). All studies with different levels of oral FA supplementations showed significantly
increased milk folate concentrations (Girard and Matte 1998; Girard and Matte 1999;
Girard et al. 2005; Graulet et al. 2007; Table 5). In humans the transfer of folates
into milk is controlled by an active-transport mechanism in the mammary glands. The
transfer is linked to the secretion of folate-binding proteins. Once the binding capacity
is saturated no further folates can be transferred into the milk (Kirksey 1986). The
same seems to be true for cows, as supplementations higher than 3 mg/kg BW could
not increase milk folate concentrations while serum folate concentration increased (Girard and Matte 1998; Girard and Matte 1999; Girard et al. 2005; Tables 4 and 5).
As observed for serum, the response of milk concentrations of folates to oral supplementation of FA was greater during the first eight weeks after calving then later in
lactation (Girard and Matte 1999). However, i.m. injection of FA could not influence
milk folate concentrations during the first part of lactation (Girard et al. 1989; Girard
et al. 1995). Furthermore, in contrast to the results after an oral supplementation of
3.1
Folic acid in ruminant nutrition: a review
21
FA, i.m. injection of FA tended to increase the folate content only in the colostrum
and during progressed lactation (Girard et al. 1995).
At present, only four studies are available dealing with milk components. In these four
studies an influence of FA on milk protein and casein was detected for multiparous cows.
It seems that i.m. injections and oral supplementations of FA increase milk protein and
casein concentrations or yields (Girard et al. 1995; Girard and Matte 1998; Girard et al.
2005; Graulet et al. 2007). The authors explained these effects by depleted folate body
stores and generally higher folate requirements because of higher milk production and
heavier calves of multiparous cows. Additionally, they hypothesised that the effects on
milk protein, similar to the effect on milk production, arise from either an increased
synthesis of purines and pyrimidines for DNA synthesis, from an increased secretory
capacity of the cells, or from amino acid interconversion which perhaps results in a
greater supply of essential amino acids.
It becomes apparent that more studies on supplementation of FA are needed to examine
the influence on milk production and milk components and its causes.
22% grass legume silage + 15% maize silage
+ 18% barley + 18% high-moisture maize +
10% soybeans + 15% distillers dried grains +
3% minerals + 1 kg grass legume hay per d
Without folic acid supplementation
+ 2 mg folic acid/kg BW daily
+ 4 mg folic acid/kg BW daily
20% grass silage + 20% maize silage + 13%
high-moisture maize + 19% barley + 6%
wheat + 2% soybean hulls + 4% soybean meal
+ 4% protected soybean meal + 4% extruded
soybeans + 8% minerals
Without folic acid supplementation
+ 3 mg folic acid/kg BW daily
+ 6 mg folic acid/kg BW daily
7% grass hay + 27% legume-grass silage +
18% maize silage + 32% cracked maize + 9%
soybean meal + 4% maize, wheat, rapeseed
products + 3% minerals
Without folic acid supplementation
+ 2600 mg folic acid/d
Milk
(kg/d)
Mean SE
Folate
content
(ng/mL milk)
Mean
SE
Protein
(g/kg)
Mean SE
Fat
(g/kg)
Mean SE
Lactose
(g/kg)
Mean SE
References
Girard and Matte
(1998)
11 m.
10 p.
9 m.
12 p.
11 m.
10 p.
6821,2
5721,4
6821,2
5721,4
6821,2
5721,4
126
6
126
6
126
6
27.42,3
27.13,4
28.32,3
25.33,4
29.62,3
25.53,4
1.6
0.7
1.3
0.8
0.6
0.9
37.92
42.54
56.12,5
46.04,5
48.22,5
46.64,5
38.12
37.54
37.72
38.74
38.02
37.14
3.6
3.6
3.6
3.6
3.6
3.6
0.11
0.11
0.11
0.11
0.11
0.11
43.02
43.84
42.42
43.34
43.02
43.34
0.04
0.04
0.04
0.04
0.04
0.04
Girard et al. (2005)
9
8
8
6941
6941
6941
11
11
11
36.2
33.7
33.9
1.6
1.6
1.6
39.3
54.65
43.15
3.7
3.7
3.7
31.9
33.0
32.4
0.8
0.8
0.8
32.7
35.1
35.5
1.8
1.8
1.8
48.3
46.5
46.5
0.7
0.7
0.7
Graulet
(2007)
6
5
7356
7556
25
27
39.57
41.85,7
1.3
1.6
45.67
71.75,7
6.2
6.8
30.37
29.57
0.6
0.7
35.97
39.27
1.4
1.6
45.17
43.57
et
Folic acid in ruminant nutrition: a review
Feed ration
Number
of cows
BW
(kg)
Mean SE
3.1
Table 5: Influence of oral folic acid supplementation on milk production and composition (mean values and standard errors)
al.
1.2
1.0
BW, body weight; m., multiparous cows; p., primiparous cows
BW measured at the beginning of the trial, 1 month before calving.
2
Data from multiparous cows.
3
This value was calculated and shows the average daily milk production for the whole lactation period.
4
Data from primiparous cows.
5
Significant effect between control and folate groups.
6
BW measured at the beginning of the trial, 3 weeks before calving.
7
This value is the mean from data determined in the first 8 weeks of lactation.
1
22
3.1
Folic acid in ruminant nutrition: a review
23
Liver
After a single supplementation of 2.6 g FA Girard et al. (2001) could not find a significant increase in the amount of folates taken up by the liver during a 24 h period
(calculated from folate flow through portal-drained viscera and total splanchnic tissue). Before the supplementation approximately 50% of the portal blood folates were
extracted by the liver; after supplementation only approximately 30% were extracted
(calculated from averaged net flux per h). Graulet et al. (2007) studied the concentration of folates in liver biopsies. Cows receiving a daily supplementation of 2.6 g
FA had significantly (P = 0.0001) increased liver folate concentrations of 2.56 mg/g
DNA compared with control cows with 1.50 mg/g DNA during the first eight weeks of
lactation. The results of these two studies led to the assumption that FA supplementation increases the liver folate concentration but decreases the percentage of extraction
from arterial blood into the liver. Lower percentages of extraction reflect that more
folates are available for post-splanchnic tissues, as for example the mammary glands.
This fact was confirmed by the results of Girard et al. (2001) who found 71% of folates
from arterial blood in post-splanchnic tissues after supplementation of 2.6 g FA and
only 50% without supplementation. Beside the increase in liver folate concentration
Graulet et al. (2007) found higher values of total lipids, triacylglycerol and cholesterol
in the liver during the first two weeks of lactation following a daily supplementation of
2.6 g FA. They explained these higher values with an increased mobilisation of body
reserves during the first weeks of lactation which is necessary to meet the requirements
for the above-mentioned increases in milk production and milk protein yield. Another
explanation for an increase in triacylglycerol could be an inhibition of the ß-oxidation
of fatty acids in the liver, caused by a lack of vitamin B12 , as cows receiving FA and
vitamin B12 had no increase in triacylglycerol (Graulet et al. 2007). If it can be proven
that FA supplementations increase lipid values in the liver during the first weeks of
lactation, a time when the risk of fatty liver is high, supplementation of FA during this
time would be questionable. Therefore further studies with a higher number of animals
are needed, as up to now only twentyfour multiparous cows have been tested.
3.1
Folic acid in ruminant nutrition: a review
24
Future research directions
For ruminants future research should focus on the determination of the demand for
folates. Up until now only requirement values for tissue and milk have been estimated,
but they were derived from swine experiments and folate concentrations in cows’ milk.
Therefore it is necessary to examine the influence of different amounts of FA supplementation under different feeding regimens on rumen variables (for example: pH, volatile
fatty acids, microbial population, degradation and synthesis of folates by microorganisms) and available quantity and forms of folates for absorption at the intestinal tract.
Additionally, understanding of mechanisms and sites of folate absorption in ruminants
is insufficient; some authors mentioned a possible absorption of folates before the duodenal cannula (Zinn et al. 1987; Santschi et al. 2005a), for example, at the beginning
of the duodenum or in the abomasum. Furthermore, knowledge on the passage of folates from the intestine to blood and their following distribution to tissues and milk is
important. The influences of an oral FA supplementation on amino acids and glucose
concentrations in blood were tested only once and significant differences were found,
but so far no explanations exist (Graulet et al. 2007). The present review shows that
very often controversial results exist, for example, the influence of FA supplementation
on milk production or the influence of feed ration on FA availability in the rumen,
therefore surveys should be conducted to reassess the variability of previous studies.
Also, maximum and minimum daily intake limits are neither available for FA, nor for
any other B-vitamin (Anonymous 2005). Indeed, no toxic reactions appeared in any
of the experiments mentioned above. As the present review shows, there are many
unanswered questions regarding the effects of folates for cows. Therefore the following
list points out desirable research areas concerning folates:
1. Studies with different feeding regimens, with and without FA supplementation,
should be conducted to assess the influence of the diet on folate degradation,
synthesis and absorption in the rumen and the duodenum on the one hand and
the influence on digestibility and ruminal fermentation on the other hand.
2. In vitro studies with ruminal microorganisms would be helpful to characterise
their folate requirements and synthesis.
3.1
Folic acid in ruminant nutrition: a review
25
3. Research on the mechanism and the sites of folate absorption in ruminants is
necessary.
4. Experiments on the interactions of physiological stage and folate metabolism in
dairy cows are essential.
5. Surveys should be conducted to explain the available effects of FA supplementation on concentrations of amino acids and glucose in blood.
6. Studies to ascertain the whole flow of folates through the body and implications
of FA supplementation on the whole organism of dairy cows are crucial.
7. Further studies should focus on the effects of FA supplementation on liver metabolism and milk.
8. Further determinations of folate concentrations in feedstuffs are required to calculate the folate intake.
3.2
Effects of a folic acid supplementation on dairy cows
3.2
26
Effects of a folic acid supplementation
on dairy cows
3.2
Effects of a folic acid supplementation on dairy cows
27
Introduction
Folic acid belongs to the B-vitamin group and the biologically active forms are folates.
Folates are essential for the transfer of one-carbon units from donor molecules into
biosynthetic pathways leading to methionine, purine and pyrimidines. Furthermore,
they facilitate the interconversion of serine and glycine and play a role in histidine
catabolism (Lucock 2000). Rumen microorganisms can synthesise B-vitamins (Bechdel
et al. 1928), but it is doubtful if this synthesis always meets the requirements of dairy
cows, today (National Research Council 2001). As reviewed by Ragaller et al. (2009;
Chapter 3.1) only a few studies have investigated the effects of FA supplementation
on rumen metabolism and on blood and milk variables. Most of supplemented FA
disappeared between the mouth and the duodenum (Zinn et al. 1987; Santschi et al.
2005a), nevertheless in some studies dietary FA increased milk production (Girard
and Matte 1998; Graulet et al. 2007). However, no studies looking simultaneously
at the effects of an FA supplementation on ruminal fermentation, duodenal flow of
nutrients and blood and milk variables have been conducted. Furthermore, it has been
reported (Hayes et al. 1966; Girard et al. 1994; Schwab et al. 2006) that high versus
low concentrate diets favour ruminal folate concentrations in ruminal content/fluid and
duodenal folate flow. Therefore the present experiment was conducted to investigate
the influence of FA supplementations on ruminal fermentation variables and nutrient
flow at the duodenum, as well as on blood and milk variables and on blood folate
concentrations at dietary F:C rations of (dry matter basis) 34:66 in the first part and
66:34 in the second part.
Experimental methods
Treatments, experimental design and animals
The study was conducted at the experimental station of the Friedrich-Loeffler-Institute
in Brunswick with a total of thirteen German Holstein multiparous dairy cows equipped
with large rubber cannulas in the dorsal sac of the rumen (inner diameter 10 cm)
and simple T-shaped cannulas at the proximal duodenum, close to the pylorus (inner
diameter 2 cm). At the beginning of the first part of the experiment the cows had a
mean BW of 619 (standard deviation (SD) 26) kg and 610 (SD 91) kg at the beginning
3.2
Effects of a folic acid supplementation on dairy cows
28
of the second part. Due to the limited animal numbers, both dry and lactating cows
had to be used. In the first part five cows were in lactation (186 (SD 144) days in milk
(DIM) at the beginning), while two were dried off. In the second part four cows were
in lactation (165 (SD 57) DIM at the beginning) and four were dried off. Lactation
numbers ranged from two to five over the whole experiment. Cows were housed in a
tethered-stall with neck straps and individual troughs. They had free access to water
and a salt block containing sodium chloride. The lactating cows were milked at 05:00
and 16:00 h. In the first part of the experiment the cows received a diet consisting
of 34% forage and 66% concentrate (high concentrate, HC) on DM basis. In the
second part the diet consisted of 66% forage and 34% concentrate (high forage, HF).
Not ruminally protected FA (a powder with 95% FA, Adisseo, Commentry, France)
was supplemented at 1 g/(d x cow) (diets HC+FA and HF+FA). The experimental
design (Table 6) is unbalanced because of different calving dates. Table A1 in the
Appendix shows the individual cows used in the different groups.
Table 6: Folic acid experimental design
(cows/group)
Group
Control
FA
HC
Lactating Dry
5
2
5
2
HF
Lactating Dry
4
4
4
4
HC, high concentrate: 34% forage and 66% concentrate
on dry matter basis; HF, high forage: 66% forage and
34% concentrate on dry matter basis; FA, folic acid
The forage consisted of 60% maize silage and 40% grass silage on DM basis. The
composition of the concentrate is shown in Table 7. To comply with the envisaged
F:C ratio and the maize/grass silage ratio, the DM of maize silage and grass silage was
determined twice a week. As maize and grass were ensiled in large bunker silos, all the
cows and bulls of the Friedrich-Loeffler-Institute Brunswick experimental station were
fed from the same silos. Therefore, the silos were changed several times during the
experiment. Forage was offered twice daily in two equal portions at 05:30 and 15:30 h;
the pelleted concentrate was evenly distributed over four feeding times per day: at
05:30, 07:30, 15:30 and 17:30 h. The FA supplement was mixed with 100 g of mineral
and vitamin mix (Table 7) and two equal portions were manually scattered by hand on
3.2
Effects of a folic acid supplementation on dairy cows
29
top of the concentrate at 05:30 and 15:30 h. The control animals also received 100 g
of mineral and vitamin mix but without FA.
Table 7: Composition of concentrate
Component
Proportion (%)
Wheat grain
25.0
Maize grain
25.0
Soybean meal, solvent-extracted
17.0
Sugar beet pulp, dried
15.0
Pea grain
15.0
1
Mineral and vitamin mix
2.0
Feed lime
0.7
Urea
0.3
1
Composition per kg of mix: 175 g Ca, 100 g Na, 50 g P, 30 g
Mg, 1 g Fe, 1.3 g Cu, 6 g Zn, 4 g Mn, 0.05 g I, 0.05 g Se, 0.03 g
Co, 1,000,000 IU vitamin A, 100,000 IU vitamin D3 and 4 g
vitamin E
To ensure constant ration composition and to avoid refusals the amounts of feed were individually adjusted every day. A standardised digestibility trial with four adult wether
sheep (Gesellschaft für Ernährungsphysiologie 1991; 96.6 (SD 8.6) kg BW; n = 4) was
conducted to calculate the metabolisable energy (ME) concentration of the different
types of forage.
Sample collection
Treatments and experiments were conducted according to the European Community
regulations concerning the protection of experimental animals and the guidelines of the
Regional Council of Brunswick, Lower Saxony, Germany (File Number 33.11.42502-04057/07). After two weeks of adaptation to the respective diets, two weeks of sample
collection followed. During the first sampling week samples of milk, blood and ruminal
fluid were taken. Milk yields were recorded daily. Milk samples were collected on
the first and the fourth day of consecutive morning and evening milking. From each
milking 50 mL were conserved with bronopol and kept at 8◦ C until analysis of the
milk ingredients. Aliquots of additional 800 mL milk were pooled per day and were
freeze-dried afterwards (Christ Epsilon 1-15; Christ, Osterode, Germany) and stored
at -18◦ C for fatty acid and folate analyses. Blood samples were taken from a vena
jugularis externa on the third day of the first sampling week. Due to animal welfare
3.2
Effects of a folic acid supplementation on dairy cows
30
the frequency of blood samples was kept to a minimum. Folic acid supplementation
seems to result in a folate peak 3 to 4 h after feeding (Girard et al. 1992), thus blood
samples were taken just before, and three and six hours after, the first morning feed.
Until centrifugation blood samples were kept at 15◦ C. One hour after sampling, the
serum was separated by centrifugation at 2123 x g for 30 min at 15◦ C and kept frozen at
-80◦ C until analysis. Samples of ruminal fluid (approximately 100 mL) were withdrawn
from the ventral sac through the rumen cannula using a hand-operated vacuum pump
on the second day of the first week of the sampling period. Samples were taken just
before first morning feed and 30, 60, 90, 120, 180 and 360 min after the beginning of
feeding.
During the second sampling week, duodenal digesta was collected over five consecutive
days in two-hourly intervals. At each sampling, four samples of approximately 100 mL
were taken through the duodenal cannula from each cow. Immediately afterwards
the pH-values were measured with a glass electrode (digital pH measurement device,
pH525, WTW, Weilheim, Germany) and the sample with the lowest pH (Rohr et al.
1984) was added to the daily pooled sample from each cow and stored at -18◦ C. For the
calculation of the daily digesta flow, Cr2 O3 as a flow marker was mixed with wheat flour
(ratio 1:4) and 50 g were distributed into the rumen every 12 h, beginning 10 days before
the duodenal digesta sampling period, whereas on day 1 before, and then during, the
sampling period, 25 g were administered every 6 h. In a comparison of measurements
of duodenal flow in dairy cows, the spot-sampling procedure has shown only small
differences in flow as compared to the total collection. During the duodenal digesta
sampling week, samples of concentrate and forage as well as possibly occurring feed
refusals were collected daily and pooled on a weekly basis. Feed samples, refusals and
daily duodenal digesta samples were freeze-dried and ground through a 1-mm screen
for analysis. Faeces of wethers were dried at 60◦ C and also ground through a 1-mm
screen for analysis.
Analyses
In the feedstuffs and the refusals of the dairy cows, as well as in the faeces of the
wethers DM, crude ash (Ash), CP, ether extract (EE), crude fibre (CF) and starch
3.2
Effects of a folic acid supplementation on dairy cows
31
were analysed according to the methods of the Verband Deutscher Landwirtschaftlicher
Untersuchungs- und Forschungsanstalten (VDLUFA, 1993) . The method of van Soest
et al. (1991) was used to analyse acid (ADF) and neutral detergent fibre (NDF), which
were expressed without residual ash. Folate in the forages, the concentrates and the
mineral and vitamin mix was determined using a microbiological assay (Enterococcus
hirae; Difco 1998a; LUFA Speyer, Germany). After feed, duodenal digesta and milk
had already been analysed a closer inspection of the analytical method indicated that
Enterococcus hirae was not an appropriate species to quantify folates in feed, duodenal
digesta and milk. Therefore these variables are not shown and discussed. Immediately
after the ruminal fluid collection, the pH of each sample was measured with a glass
electrode (pH525, WTW, Weilheim, Germany). Afterwards, the ruminal fluid was
centrifuged (30074 x g). In the supernatant NH3 − N was analysed according to DIN
38406-E5-2 (1998). To measure the short chain fatty acids (SCFA) a part of the
centrifuged ruminal fluid was acidified with sulphuric acid and centrifuged (18400 x g)
again. The supernatant was frozen at -18◦ C. Before the measurement of SCFA with a
gas chromatograph (Hewlett Packard 5580, Avondale, PA, USA) equipped with a flame
ionization detector (Geissler et al. 1976) the thawed supernatant was again centrifuged
(18400 x g). Nitrogen concentration in freshly thawed duodenal digesta was measured
according to the Kjeldahl method; further analyses were carried out with freeze-dried
and ground duodenal digesta. The DM and ash contents were analysed in the daily
pooled samples by the same methods mentioned above for feedstuffs. The proportion
of microbial-N of non-ammonia-N (NAN) in the duodenal digesta was estimated by
using near infrared spectra according to Lebzien and Paul (1997). Cr2 O3 was measured
by atomic absorption spectrophotometry (Williams et al. 1962) and used to calculate
duodenal DM flow. The daily duodenal DM flow was then used as a measure for the
preparation of one pooled sample per cow per week. Pooled samples were analysed for
NDF and ADF applying the same methods as for the feedstuffs.
Serum samples were analysed for glucose, non-esterified-fatty-acids (NEFA), betahydroxybutyrate (ß-HBA) and urea by the laboratory of the Cattle Clinic Hanover
(University of Veterinary Medicine, Germany). The glucose content was detected using
hexokinase (A11A00116, ABX Diagnostics, Montpellier, France), an enzymatic colour
3.2
Effects of a folic acid supplementation on dairy cows
32
test was applied to analyse the NEFA content (99475409, Wako Chemicals, Neuss,
Germany) and an enzymatic UV-test was run to assess ß -HBA (RB 1008, Randox
Laboratories, Krefeld, Germany) and urea (A11A00075, ABX Diagnostics, Montpellier,
France).
Serum samples were analysed for FA, 5-methyl-THF, THF, thiamin, riboflavin, pyridoxal-5’-phosphate, pyridoxic acid, pyridoxal, pyridoxine, pyridoxamine, PA, nicotinamide and nicotinic acid by high performance liquid chromatography (W. Bigalke,
unpublished method). In the following essential details of the method are given. Sample preparation included protein precipitation with ethanol and fat extraction with
n-hexan. After centrifugation (20800 x g) the supernatant was evaporated under a
nitrogen stream and the residue was dissolved in the aqueous mobile phase A, filtrated and injected into a HPLC system (Shimadzu, Kyoto, Japan). B-vitamins were
separated using a reversed phase C18 -column with mobile phase A containing sodium 1hexanesulfonate monohydrate and phosphoric acid in ultra-pure water. Mobile phase B
consisted of acetonitrile. Quantifications of B-vitamins were performed simultaneously
using a multi wavelength detector and a spectrofluorometric detector.
Milk samples were analysed for fat, protein, lactose and urea using an infrared milk
analyser (Milkoscan FT 6000 combined with a Fossomatic 5000, Foss Electric, Hillerød,
Denmark). The analysis of milk fat composition was carried out in freeze-dried samples after extraction with chloroform/methanol (2:1, v/v ) and transesterification with
trimethylsulfoniumhydroxide. A gas chromatograph (Hewlett Packard 6890, Palo Alto,
CA, USA) equipped with a flame ionization detector and a capillary column (Zebron
7HG-G009-11) was used for the separation of the fatty acids from butyric acid (C4:0 )
to linolenic acid (C18:3 ).
Calculations and statistics
The ME in feedstuffs was calculated according to equation number 1.1.2 of the Society
of Nutrition Physiology (Gesellschaft für Ernährungsphysiologie 2001). Concentrate
digestibility was taken from the tabular values for each ingredient (Universität Hohenheim – Dokumentationsstelle, 1997) whereas the ME concentration of forages was
3.2
Effects of a folic acid supplementation on dairy cows
33
estimated from the standardised digestibility trial with the adult wether sheep (Gesellschaft für Ernährungsphysiologie 1991).
For the calculation of the daily duodenal DM flow (DMF) the following equation was
used:
DM F (kg/d) =
chromium application (mg/d)
/1000
duodenal chromium concentration (mg/g DM )
The daily duodenal flows of OM and OM constituents were estimated by the multiplication of their respective concentrations in duodenal digesta with DMF. The daily
duodenal flow of NAN was calculated assuming a mean ammonia-N proportion of total
N with N-balanced rations of 4.9% (Riemeier 2004). The utilisable CP (uCP) at the
duodenum was estimated following Lebzien and Voigt (1999):
uCP (g/d) = (N AN f low at the duodenum (g/d)) · 6.25 − endogenous CP (EP)(g/d)
where EP (g/d) = (3.6 · kg DM F ) · 6.25 (Brandt and Rohr 1981)
Ruminally fermented OM (FOM), ruminally degraded CP, undegraded feed CP (UDP)
and ruminal N balance (RNB) were calculated with the following equations:
F OM (kg/d) = OM intake(kg/d)−(duodenalOM f low (kg/d)−microbialOM (kg/d))
where microbial OM (kg/d) = 11.8 · microbial N (kg/d) (Schafft 1983)
Ruminally degraded CP (g/d) = CP intake (g/d) − U DP (g/d)
U DP (g/d) = 6.25 · (g N AN at the duodenum (g/d) − g microbial N (g/d)) − EP (g/d)
RN B (g/d) = (CP (g/d) − uCP (g/d))/6.25
Fat corrected milk was estimated as follows:
F at corrected milk (kg/d) = ((% milk f at · 0.15) + 0.4) · kg milk yield
(Helfferich and Gütte 1972)
The SAS software package (Version 9.1.3., procedure mixed, SAS Institute Inc., Cary,
NC, USA) was used to analyse the data. For statistical analysis of rumen and serum
variables supplemental FA was considered as a fixed effect. To consider the withinsubject factor over all sample times a repeated statement was used. A random statement for the individual cow effect was introduced to consider that a cow had to be used
over several periods for different treatments. The OM intake was considered as a fixed
regressive component. The restricted maximum likelihood method was used to evaluate
3.2
Effects of a folic acid supplementation on dairy cows
34
the variances. Degrees of freedom were calculated by the Kenward-Roger-method. To
test the differences between the least squares means (LSmeans) the ”PDIFF” option
was applied, using a Tukey-Kramer test for post-hoc analysis. Vitamin concentrations
in the serum were analysed using the same model, but without the fixed regressive
component OM intake.
For the duodenal and milk variables the model was set up with FA, OM intake and a
random statement for the individual cow effect as previously mentioned. Furthermore,
for the milk variables the stage of lactation was treated as a fixed effect and additionally
implemented in the model. Differences were considered to be significant at (P ≤ 0.05),
and a trend was discussed at (P = 0.10). For ruminal, duodenal and milk variables
significant levels of the analyses of variances are shown. Significant levels of TukeyKramer-Test are only used for blood variables, as, for ruminal variables, no effects were
found between controls and their respective treatments at the single measurement times
(Tukey-Kramer-test). If not mentioned otherwise, results are reported as LSmeans with
standard errors (SE).
Results
Because of the scope of this study, the effects of OM intake will not be shown and
discussed in the following and the influences of time after feeding and the interaction
of FA and time after feeding are only shown and discussed if they were significant.
Intake and chemical composition of feedstuffs
Table 8 shows the arithmetical means of the nutrient composition of the rations. In the
Appendix (Table A2) the nutrition composition of the forage is shown. The average
nutrient intake per cow (lactating and dry) and day are shown in Table 9. The intended
ratio of F:C was achieved over the whole experiment. The two different rations (HC
and HF) were neither isonitrogenous nor isocaloric, because the OM intake and the
feedstuffs used should have been identical as far as possible.
3.2
35
Effects of a folic acid supplementation on dairy cows
Table 8: Arithmetic means of nutrient composition (g/kg
DM) and metabolisable energy (MJ/kg DM) of the rations
(arithmetic means with their standard deviation)
OM
CP
EE
CF
ADF
NDF
Starch
ME
HC (n = 3)
Mean
SD
936
1.4
185
9.5
26
3.3
115
3.8
132
3.0
275
14.8
372
44.7
12.1
0.0
HF (n = 4)
Mean
SD
931
3.4
142
4.5
32
1.8
166
7.4
185
2.0
369
20.6
292
12.1
11.3
0.1
HC, high concentrate: 34% forage and 66% concentrate on dry matter
basis; HF, high forage: 66% forage and 34% concentrate on dry matter
basis; SD, standard deviation; OM, organic matter; CP, crude protein;
EE, ether extract; CF, crude fibre; ADF, acid detergent fibre; NDF,
neutral detergent fibre; ME, metabolisable energy
Rumen fermentation variables
As no significant effects or trends at the single measurement times (Tukey-Kramertest) between the HC and the HC+FA or the HF and HF+FA rations were found for
the ruminal variables only the LSmeans over the whole sampling time are presented
in Table 10. In general, the influences of FA on the ruminal fermentation variables
were negligible for both rations (Table 10). During the HC feeding regime the FA
reduced the molar percentage of isovaleric acid by about 0.3 percentage units (a slight
but significant change) and tended to lower the molar percentage of isobutyric acid.
In contrast, the FA significantly increased the molar percentage of isovaleric acid for
the HF ration by about 0.2 percentage units and trends were found for the molar
percentages of butyric and valeric acid.
Intake
DM
OM
N
NDF
ADF
Starch
Dry
(n = 2)
Mean SD
8.81 2.63
8.18 2.47
0.27 0.08
2.35 0.70
1.13 0.34
3.16 0.96
HC+FA
Lactating
Dry
(n = 5)
(n = 2)
Mean SD
Mean SD
14.26 2.19
8.51 3.25
13.24 2.05
7.86 3.04
0.41 0.07
0.24 0.09
3.92 0.51
2.47 0.95
1.95 0.28
1.19 0.46
5.11 0.65
3.53 1.36
HF
Lactating
(n = 4)
Mean SD
13.51 2.60
12.49 2.44
0.31 0.05
4.92 0.87
2.48 0.49
3.94 0.76
Dry
(n = 4)
Mean SD
7.25 1.82
6.65 1.67
0.17 0.04
2.24 0.19
1.33 0.34
2.12 0.49
HF+FA
Lactating
Dry
(n = 4)
(n = 4)
Mean SD
Mean SD
14.48 1.64
7.67 1.20
13.39 1.49
7.07 1.12
0.32 0.04
0.17 0.03
5.17 0.57
2.73 0.47
2.68 0.31
1.41 0.22
4.23 0.43
2.25 0.39
HC, high concentrate: 34% forage and 66% concentrate on dry matter basis; FA, folic acid; HF, high forage: 66% forage and 34%
concentrate on dry matter basis; SD, standard deviation; DM, dry matter; OM, organic matter; NDF, neutral detergent fibre; ADF,
acid detergent fibre
Effects of a folic acid supplementation on dairy cows
HC
Lactating
(n = 5)
Mean SD
14.17 2.05
13.21 1.92
0.44 0.06
3.79 0.55
1.82 0.27
5.10 0.74
3.2
Table 9: Intakes of nutrients (kg/day) by lactating and dry cows fed high concentrate or high forage diets (arithmetic
means with their standard deviation)
36
60.6
19.3
1.0
15.3
1.9
2.4
97.2
= 7)
SE
0.09
0.93
0.84
0.89
0.08
0.28
0.11
0.19
4.36
HC
FA (n = 7)
LSmeans SE
6.33
0.09
9.18
0.93
60.3
19.4
0.9
14.8
1.6
2.4
95.9
0.84
0.89
0.08
0.28
0.11
0.19
4.36
P
FA
0.949
0.194
0.567
0.949
0.052
0.240
0.009
0.777
0.713
Control (n
LSmeans
6.37
9.69
63.3
18.7
0.9
14.2
1.7
1.3
109.0
= 8)
SE
0.03
0.32
0.82
0.30
0.03
0.66
0.09
0.09
5.02
HF
FA (n = 8)
LSmeans SE
6.39
0.03
9.80
0.32
62.5
18.2
0.9
15.0
1.9
1.5
104.6
0.82
0.30
0.03
0.66
0.09
0.09
5.02
P
FA
0.482
0.738
0.378
0.153
0.376
0.097
0.037
0.058
0.459
HC, high concentrate: 34% forage and 66% concentrate on dry matter basis; HF, high forage: 66% forage and
34% concentrate on dry matter basis; FA, folic acid; SE, standard error; SCFA, short chain fatty acids
1
Sampling time: just before and 30, 60, 90, 120, 180, 360 minutes after the first feeding in the morning.
Effects of a folic acid supplementation on dairy cows
pH
NH3 (mmol/L)
SCFA (mol %):
Acetic acid
Propionic acid
Isobutyric acid
Butyric acid
Isovaleric acid
Valeric acid
SCFA (mmol/L)
Control (n
LSmeans
6.33
10.20
3.2
Table 10: Influence of folic acid supplementation on ruminal variables averaged over sampling
times1 (LSmeans with their standard error)
37
3.2
Effects of a folic acid supplementation on dairy cows
38
Nutrient flow at the duodenum
Apart from FOM no other variable presented in Table 11 was influenced by FA during
the HC feeding regime. The amount of FOM was significantly reduced (-5%) but
the proportion of FOM to OM intake only tended to be reduced (P = 0.060) in the
HC+FA diet compared to the control. With the HF ration only ADF was significantly
influenced. Folic acid decreased the ADF flow to the duodenum (-0.08 kg/d) and thus
increased the apparent ruminal digestibility of ADF (0.043 kg/kg intake).
As shown in Table 12, with HF feeding the FA had no influence on ruminal CP turnover.
However, in the HC ration the FA decreased the flow of microbial CP (MP) at the
duodenum (-10%) and MP synthesis (g/MJ ME; -11%), whereas for MP synthesis
per kg of FOM only a numerical decrease (-7%) could be observed as FOM was also
reduced (Table 11). Furthermore, uCP tended to be reduced (P = 0.087). As uCP
was calculated from MP and UDP, and UDP was not influenced (Table 12), the effect
on uCP is totally attributed to the reduced MP synthesis mentioned previously.
Duodenal flow (kg/d):
OM
7.03
0.15
FOM
7.14
0.12
NDF
1.88
0.12
ADF
1.00
0.06
FOM of OM intake (%)
61.5
1.27
Apparent ruminal digestibility (kg/kg intake):
OM
0.409
0.0148
NDF
0.452
0.0365
ADF
0.395
0.0404
FA (n = 7)
LSmeans
SE
P
FA
Control (n = 8)
LSmeans
SE
HF
FA (n = 8)
LSmeans
SE
P
FA
7.13
6.81
2.06
1.08
59.2
0.15
0.12
0.12
0.06
1.27
0.599
0.050
0.168
0.281
0.060
6.44
5.97
2.20
1.12
56.4
0.16
0.13
0.07
0.03
1.19
6.27
6.11
2.10
1.04
57.9
0.16
0.13
0.07
0.03
1.19
0.463
0.377
0.374
0.018
0.290
0.407
0.430
0.393
0.0148
0.0365
0.0404
0.882
0.475
0.949
0.398
0.483
0.476
0.0149
0.0181
0.0183
0.419
0.504
0.519
0.0149
0.0181
0.0183
0.342
0.423
0.030
HC, high concentrate: 34% forage and 66% concentrate on dry matter basis; HF, high forage: 66% forage and 34% concentrate
on dry matter basis; FA, folic acid; SE, standard error; OM, organic matter; NDF, neutral detergent fibre; ADF, acid detergent
fibre
Effects of a folic acid supplementation on dairy cows
HC
Control (n = 7)
LSmeans
SE
3.2
Table 11: Influence of folic acid supplementation on nutrient flow at the duodenum, ruminally fermented
organic matter (FOM) and apparent ruminal digestibility (LSmeans with their standard error)
39
= 7)
SE
50.8
8.07
0.33
12.6
12.0
73.5
0.03
34.0
1.33
HC
FA (n = 7)
LSmeans SE
1166
50.8
168
8.07
7.6
0.33
320
12.6
304
12.0
1704
73.5
0.67
0.03
538
34.0
23.1
1.33
P
FA
0.024
0.119
0.003
0.105
0.105
0.087
0.884
0.698
0.197
Control (n
LSmeans
926
159
7.2
256
243
1341
0.76
415
24.7
= 8)
SE
42.7
7.70
0.28
11.4
10.8
65.1
0.04
28.2
1.52
HF
FA (n = 8)
LSmeans SE
913
42.7
149
7.70
7.0
0.28
254
11.4
241
10.8
1335
65.1
0.77
0.04
422
28.2
25.5
1.52
P
FA
0.833
0.370
0.631
0.892
0.892
0.947
0.848
0.856
0.651
HC, high concentrate: 34% forage and 66% concentrate on dry matter basis; HF, high forage: 66% forage and 34%
concentrate on dry matter basis; FA, folic acid; SE, standard error; MP, microbial crude protein; FOM, fermented organic
matter; ME, metabolisable energy; NAN, non-ammonia-nitrogen; uCP, utilisable crude protein; RDP, ruminally degraded
protein; UDP, ruminally undegraded feed protein; CP, crude protein
Effects of a folic acid supplementation on dairy cows
Control (n
LSmeans
MP (g/d)
1289
MP per FOM (g/kg)
180
MP per ME (g/MJ)
8.5
N (g/d)
341
NAN (g/d)
325
uCP (g/d)
1837
MP per RDP (g/g)
0.68
UDP (g/d)
548
UDP per CP intake (%)
21.9
3.2
Table 12: Nitrogen flow at the duodenum and efficiency of microbial protein synthesis (LSmeans with
their standard error)
40
3.2
Effects of a folic acid supplementation on dairy cows
41
Serum variables
The FA supplementation to the HF ration had no influence on the measured blood
variables (Table 13). During the HC feeding regime supplementary FA significantly
decreased the serum glucose and urea concentrations (Table 13). The post-hoc analysis
for serum glucose concentrations showed a significant difference before (P = 0.003) and
360 min (P = 0.002) after feeding (Figure 2A), while serum urea concentrations were
only significantly lowered at 360 min (P = 0.014) after feeding (Figure 2B). But the
lower urea concentrations seem to result from the lower N intake of the HC+FA group
compared to the HC group (Table 9).
In all serum samples only 5-methyl-THF and no FA or THF could be detected. Figures 3A and B shows the 5-methyl-THF concentrations in serum. For both rations
significant influences of FA (for HC: P = 0.018; for HF: P < 0.001), time after feeding
(for HC: P = 0.009; for HF: P = 0.038) and also an interaction of FA and time after
feeding (for HC: P = 0.004; for HF: P = 0.008) were found. Post-hoc analysis only
showed a significant difference 180 min after feeding for both rations (Figures 3A and
B). For the HF ration a trend for increased 5-methyl-THF concentrations at 360 min
after feeding (P = 0.078) was also observed.
Table 13 also shows the effects of FA supplementation on the other measured B-vitamins
in serum. With the HF ration the FA had no influence on the other B-vitamins measured, while with the HC ration the FA lowered the serum riboflavin level (P < 0.001)
from 15 (SE 0.75) ng/mL to 10 (SE 0.75) ng/mL (Table 13). The values of nicotinic
acid, pyridoxine, pyridoxamine and thiamin were below the detection limit (W. Bigalke,
unpublished data).
= 7)
SE
0.09
29.6
0.09
0.35
0.75
0.53
0.81
0.36
27.3
31.8
HC
FA (n = 7)
LSmeans SE
3.09
0.09
110.7
29.6
0.73
0.09
4.47
0.35
10.02
0.75
4.59
0.54
5.76
0.81
3.65
0.36
322.1
27.3
120.7
31.8
P
FA
0.000
0.472
0.647
0.009
<0.001
0.121
0.836
0.068
0.941
0.439
Control (n
LSmeans
3.26
80.4
0.78
3.53
8.00
4.14
6.39
4.31
347.8
82.7
= 8)
SE
0.07
7.1
0.10
0.12
0.31
0.50
0.72
0.35
26.1
10.2
HF
FA (n = 8)
LSmeans SE
3.27
0.07
78.8
7.1
0.93
0.10
3.51
0.12
7.91
0.31
3.35
0.50
6.33
0.72
4.17
0.35
369.4
26.1
73.2
10.2
HC, high concentrate: 34% forage and 66% concentrate on dry matter basis; HF, high forage: 66% forage and
34% concentrate on dry matter basis; FA, folic acid; SE, standard error; ß -HBA, beta-hydroxybutyrate
1
Sampling time: just before and 180 and 360 minutes after the first feeding in the morning.
P
FA
0.898
0.814
0.180
0.832
0.674
0.154
0.794
0.626
0.249
0.367
Effects of a folic acid supplementation on dairy cows
Control (n
LSmeans
Glucose (mmol/L)
3.54
NEFA (µmol/L)
100.9
ß -HBA (mmol/L)
0.68
Urea (mmol/L)
5.41
Riboflavin
14.84
Pyridoxal-5’-phosphate
5.62
Pyridoxic acid
5.71
Pyridoxal
3.25
Nicotinamide
318.6
Pantothenic acid
84.1
3.2
Table 13: Effects of dietary supplements of folic acid to dairy cows on serum concentrations of
glucose, NEFA, ß-HBS, urea and B-vitamins (ng/mL) averaged over sampling times1 (LSmeans
with their standard error)
42
43
Effects of a folic acid supplementation on dairy cows
Glucose (mmol/L)..
5
A
4
*
*
3
2
1
0
0
180
Urea (mmol/L)..
3.2
B
7
6
5
4
3
2
1
0
*
360
0
Time after first feeding (min)
180
360
Time after first feeding (min)
Control Group (n = 7)
FA Group (n = 7)
Figure 2: Serum glucose (A) and urea (B) concentrations for the high concentrate
(34% forage and 66% concentrate on dry matter basis) feeding groups with and without folic
acid supplementation at different time points after feeding *P ≤ 0.05
A
B
5-methyl-THF (ng/mL) ..
5-methyl-THF (ng/mL)...
50
*
40
30
20
10
50
*
40
30
20
10
0
0
0
180
360
Time after first feeding (min)
Control Group
0
180
360
Time after first feeding (min)
FA Group
Figure 3: Serum 5-methyl-THF concentrations for the high concentrate (34% forage
and 66% concentrate on dry matter basis) feeding groups (n = 7; A) and the high forage (66%
forage and 34% concentrate on dry matter basis) feeding groups (n = 8; B) with and without
folic acid supplementation at different time points after feeding *P ≤ 0.05
Milk composition
No significant effects of dietary supplements of FA were observed for milk production,
milk content of fat, protein and lactose as well as for yields of milk fat, protein and
lactose neither at HC nor at HF ration (Table 14). Only in the HF feeding regime
FA supplementation tended to reduce the fat content (P = 0.097; Table 14). Urea
concentrations tended to be reduced in the HC+FA group in contrast to the HC group
(P = 0.056; Table 14). In the HC feeding regime, except for C18:3 , the FA did not
3.2
Effects of a folic acid supplementation on dairy cows
44
influence the milk fatty acid composition (in the percentage of total fatty acids). C18:3
however, was significantly decreased (P = 0.017; Table 14).
Milk (kg/d)
FCM (kg/d)
Milk composition (%):
Fat
Protein
Lactose
Yield (g/d):
Fat
Protein
Lactose
Urea (mmol/L)
Fatty acids (weight % of
C4:0
C6:0
C8:0
C10:0
C12:0
C14:0
C14:1
C16:0
C16:1
C18:0
C18:1
C18:2
C18:3
2.83
2.97
4.56
731
752
1177
4.37
total fatty
6.7
4.1
1.9
3.9
6.5
12.0
1.7
29.4
2.4
3.9
22.9
3.9
0.8
HC
FA (n = 5)
LSmeans SE
26.2
1.16
21.6
1.23
P
FA
0.722
0.738
Control (n
LSmeans
19.5
19.7
= 4)
SE
0.66
0.72
HF
FA (n = 4)
LSmeans SE
21.2
0.60
21.0
0.66
P
FA
0.133
0.260
0.19
0.09
0.06
2.95
3.06
4.59
0.19
0.09
0.06
0.683
0.476
0.709
4.06
3.11
4.83
0.04
0.06
0.05
3.93
3.03
4.82
0.04
0.06
0.05
0.097
0.181
0.885
57.7
45.5
61.1
0.32
acids):
0.16
0.29
0.22
0.54
0.75
0.73
0.31
1.26
0.43
0.34
1.39
0.23
0.05
746
792
1194
3.36
57.8
45.6
61.3
0.33
0.834
0.549
0.678
0.056
793
614
946
2.43
30.5
24.4
40.9
0.38
835
643
1021
2.00
27.9
22.4
37.4
0.32
0.372
0.431
0.248
0.379
6.7
4.0
1.9
3.8
6.2
11.9
2.1
28.7
2.4
3.9
24.0
3.9
0.6
0.16
0.29
0.22
0.54
0.75
0.73
0.31
1.27
0.43
0.34
1.39
0.23
0.05
0.878
0.668
0.491
0.561
0.435
0.817
0.401
0.531
0.812
0.868
0.385
0.921
0.017
7.0
4.5
2.0
3.8
5.8
12.2
1.6
35.4
2.1
4.9
17.9
2.3
0.6
0.23
0.06
0.05
0.10
0.32
0.39
0.18
0.88
0.15
0.47
0.73
0.07
0.04
7.2
4.5
2.0
3.9
5.2
12.0
1.4
33.8
2.0
5.5
19.5
2.4
0.6
0.20
0.05
0.04
0.09
0.27
0.33
0.17
0.80
0.13
0.40
0.62
0.07
0.03
0.531
0.322
0.746
0.627
0.192
0.672
0.326
0.268
0.477
0.374
0.157
0.141
0.882
Effects of a folic acid supplementation on dairy cows
Control (n = 5)
LSmeans
SE
25.8
1.15
21.3
1.23
3.2
Table 14: Effects of dietary supplements of folic acid to dairy cows on milk production and composition (LSmeans with their standard error)
HC, high concentrate: 34% forage and 66% concentrate on dry matter basis; HF, high forage: 66% forage and 34%
concentrate on dry matter basis; FA, folic acid; SE, standard error; FCM, fat corrected milk
45
3.2
Effects of a folic acid supplementation on dairy cows
46
Discussion
Rumen variables
The influence of FA on rumen variables has been reported once using eight steers at
two different F:C ratios (70:30 and 30:70; Chiquette et al. 1993). In accordance to the
present study Chiquette et al. (1993) found no influences of FA supplementation on
pH values in ruminal fluids in both diets. They also found no effects of FA on acetic,
propionic and butyric acids concentrations from 1 to 23 h after feeding. Furthermore,
the ratio of acetic acid to propionic acid was also not affected. In the present study
concentrations of acetic, propionic and butyric acid, as well as the ratio of acetic to
propionic acid were also not influenced by FA supplementation (data not shown).
Duodenum
Effects of FA on apparent ruminal digestibility differed at the varying F:C ratios (Table 11). The FA supplementation to the HC diet lowered the amount of FOM and
tended to reduce the percentage of FOM to OM intake. To our knowledge FOM has
not been considered before, and an explanation for the reduction cannot be given.
Contrary to that the FA enhanced the apparent ruminal digestibility of ADF with the
HF diet. Feeding a blend of B-vitamins at a F:C ratio of 45:55, Zinn et al. (1987)
could not find an influence on the apparent ruminal digestion of OM and ADF. Chiquette et al. (1993) fed F:C ratios of 70:30 and 30:70 and found no effect of FA on
the total tract digestibility of DM, NDF and ADF. By contrast, for lambs (BW not
given) supplemented with FA at 4.5 mg/(d x animal) Barth et al. (1960) showed a
decreased total tract digestibility of DM and OM. In a later work of this research team
no influence on total tract OM digestibility could be observed with the same amount
of supplemented FA (McLaren et al. 1965). In both studies dietary F:C ratios were
not specified. However, some previous in vitro studies show either increasing effects of
FA on cellulose digestion or a demand for FA or THF by cellulolytic microorganisms
(Hall et al. 1955; Ayers 1958; Bryant and Robinson 1961; Slyter and Weaver 1977).
Therefore, the supplementation of FA possibly leads to an increased growth of these
microorganisms which would lead to an increase in the apparent ruminal digestibility
of ADF. The effect on apparent ruminal digestibility of fibre may not exist in the HC
3.2
Effects of a folic acid supplementation on dairy cows
47
ration, as feeding high amounts of concentrate affect the general conditions for cellulolytic microorganisms and thus, the degradation of cellulose and therefore, not FA
could be the first limiting factors for the growth of these microorganisms.
The reason for the reduced efficiency of MP synthesis (g/MJ ME) at HC+FA ration
was partly at least, the decreased amount of FOM (Tables 11 and 12) because less
energy for MP synthesis was available. The ruminal N balance was always positive
(not shown); hence an adequate supply of microorganisms with N was achieved for the
control and the treatment group with the result that N deficiency could not be the
reason for the decreased MP synthesis in the HC+FA group. The supply with uCP
met the requirements of the animals for all rations, apart from the HC+FA group here the uCP supply was slightly insufficient. Girard et al. (1994) found no influence
of 2 mg FA per kg BW on the production of microbial mass and MP, as well as on
the quantity of protein per unit of microbial mass at F:C ratios of 70:30 and 30:70 for
steers. For a feeding regime with an F:C ratio of 45:55 and a supplementation of a
blend of B-vitamins (with FA), Zinn et al. (1987) could also not find an influence on
net microbial synthesis. Additionally, in vitro no effects of FA on MP synthesis and
the efficiency of MP synthesis could be observed at three different F:C ratios of 67:33,
50:50 and 33:67 (Völker 2008).
Serum variables
Up to now, Graulet et al. (2007) are the sole authors studying the influence of dietary
FA supplementation on plasma concentrations of glucose and NEFA in cows. According
to our results (Table 13) they found no effects on NEFA and decreased plasma glucose
concentrations between three weeks before and eight weeks after calving due to dietary
FA supplementations of 2.6 g/d. No explanations were given for the lowered glucose
levels; but cows fed FA supplementation produced 2.3 kg more milk per day compared
to control cows while DM intakes were similar in both groups, which maybe an explanation for decreased glucose concentrations. For humans and rats no (Solini et al. 2006;
Mao et al. 2008) or increasing (Prusiewicz-Witaszek and Maciejewska 1994) effects of
FA on blood glucose were found. The increase in blood glucose was attributed to a
decrease in blood insulin concentration (Prusiewicz-Witaszek and Maciejewska 1994).
3.2
Effects of a folic acid supplementation on dairy cows
48
Insulin was also decreased in the study of Solini et al. (2006) in overweight humans, but
without any effect on glucose. Thus, the results are contradictory. Furthermore, glucose metabolism differs between monogastric organisms and ruminants. Consequently,
it would be interesting to consider if FA also has an influence on blood insulin levels
in cows and if this provides an explanation for the effect on glucose. The lower urea
concentrations of the HC+FOL group seem to result from the lower N intake of this
group compared to the HC group (Table 13).
The influence of an FA supplementation on the levels of the other B-vitamins is not
well established. Similar to our results, the level of pyridoxal-5’-phosphate in serum of
dairy cows (fed with a F:C of 37:63) was not influenced by supplementations of 2 or
4 mg FA per kg BW (Girard and Matte 1999). For riboflavin no further studies are
available and at present no explanation can be given.
Milk composition
Generally, the results on milk composition of the present study should not be overinterpreted as this was not the main focus of this study. Three studies are available
concerning the influence of oral FA supplementation on milk components. Consistent
with our results (Table 14), Girard and Matte (1998) and Girard et al. (2005) could
not find an influence of 2 and 4 mg FA per kg BW or of 3 and 6 mg FA per kg BW
on milk composition (%) of milk fat, protein and lactose (Table 5). However, Girard
and Matte (1998) found that supplementary FA slightly increased the total quantity
of milk casein produced by multiparous cows, but supplementation had no effect on
the quantity of the other nitrogenous fractions. Girard et al. (2005) could not find any
effect on yields of milk components (kg/d). Additionally, Graulet et al. (2007) observed
no effect of 2.6 g FA/d on milk composition, whereas yield (g/d) of milk fat showed a
trend to greater values and yield of milk protein was significantly greater during the
first 56 days of lactation. As milk production was also increased, Graulet et al. (2007)
hypothesised that the essential role of FA for the synthesis of purines and pyrimidines
for DNA synthesis could be a reason for the increased protein values.
Consistence with the above mentioned results for urea in serum, reduced milk urea
concentrations (-33%) seem to result from the lower N intake of the HC+FA group
3.2
Effects of a folic acid supplementation on dairy cows
49
compared to the control (Tables 9 and 14). Girard et al. (2005) and Graulet et al.
(2007) could not find an influence of dietary FA supplementations on milk urea N
concentrations. However, for multiparous cows during the first 100 days of lactation
Girard and Matte (1998) found decreased milk non-protein-N values due to FA. They
hypothesised that this reduction resulted from an improved N utilisation in the rumen
and amino acid catabolism in cow tissues. The improved N utilisation in the rumen
did not become obvious from the results of the present study (Table 12). The lowered
C18:3 in milk of the HC+FA group compared to HC group (Table 14) could result from
a slightly negative energy balance in the HC group (-0.77 MJ NEL/d) compared to a
positive energy balance in the HC+FA group (3.80 MJ NEL/d).
Furthermore, from the results of the present study it is difficult to decide if influences
on metabolism result from changes on the ruminal level (Tables 10, 11 and 12) or are
a consequence of the increased 5-methyl-THF concentrations in blood (Figures 3A and
B), as the influences of FA on ruminal fermentation, as well as on metabolism were
rather minor.
Folate content in serum
In all the serum samples only 5-methyl-THF was found, whereas FA and THF were
not detectable. Admittedly, in bovine blood mainly 5-methyl-THF is available (Anonymous 1992). In the present study, as well as in literature, FA supplementation higher
than 0.5 mg/kg BW always resulted in increased serum folate concentrations (Girard
et al. 1992; Girard et al. 1994; Girard and Matte 1998; Girard and Matte 1999; Girard
et al. 2001; Girard et al. 2005). Similar to our results, Girard et al. (1992; 1994; 2001)
found an influence of the time after FA supplementation on blood folate concentrations as the peak was reached 3 to 6 h afterwards. In the present study preprandial
serum concentrations of 5-methyl-THF did not differ significantly in control and FAsupplemented animals, whereas Girard et al. (1994) found higher preprandial serum
folate concentrations after supplementations of approximately 0.7 g/d over five weeks
in steers fed diets with a F:C ratio of 70:30 or 30:70. In the current study serum 5methyl-THF concentrations of the HC and HF group varied (Figure 3). In contrast to
our results, Santschi et al. (2005b; F:C ratio 37:63 or 58:42) and Girard et al. (1994;
3.2
Effects of a folic acid supplementation on dairy cows
50
F:C ratio 70:30 or 30:70) found no effect of the F:C ratio on plasma folate concentrations in primiparous (12 or 14 ng/mL) and multiparous (18 to 19 ng/mL) cows, as well
as on serum folate concentrations in steers (both 19 ng/mL). Comparing the serum
5-methyl-THF concentrations of the present study with the serum folate concentrations in the previously mentioned literature it is conspicuous that the 5-methyl-THF
concentrations in the HC group are on average relatively high (23 ng/mL), while the
5-methyl-THF concentrations of the HF group (13 ng/mL) are rather low. However,
it should be noted that in the HC group two cows were nonlactating while in the HF
group four cows were nonlactating. This may also be a reason for the huge difference
between HC and HF groups, as Girard et al. (1989) observed the highest serum folate
concentrations in early lactation and the lowest values at calving.
Conclusion
Results from the present experiment suggest that – regardless of dietary F:C ratio – FA
generally had no, or only minor, effects on rumen fermentation and on blood and milk
variables. In the serum the supplementation of FA leads to increased 5-methyl-THF
concentrations. From the present study the question as to whether or not dairy cows
have an advantage from FA supplementation cannot be answered. Therefore studies
with a higher number of animals, at different stages of lactation and gestation would
be helpful. It would also be interesting to test ruminal protected FA. Furthermore,
studies that differentiate between the FA requirements of the ruminal microorganisms
and the host are necessary.
51
4 Pantothenic acid
4
4.1
Pantothenic acid
Pantothenic acid in ruminant
nutrition: a review
Accepted for puplication by The Journal of Animal Physiology and Animal Nutrition
4.1
Pantothenic acid in ruminant nutrition: a review
52
Introduction
Pantothenic acid was discovered by Williams et al. (1933). Due to its incorporation
into CoA and ACP, PA has considerable metabolic importance (Ball 2006). Ruminants
have two sources of PA: on the one hand fodder, and on the other hand, ruminal PA
synthesis by microorganisms (Bechdel et al. 1928). The National Research Council
(2001) made a comparison between ruminal synthesis and daily proposed requirements
of a 650 kg cow producing 35 kg of 4% fat-corrected milk. However, tissue requirements were extrapolated from lactating sows as no values were available for ruminants.
The calculated ruminal synthesis of 38 mg/d does not cover the proposed daily PA
requirements of 304 mg/d for tissue and 121 mg/d for milk production. Because PA
is ubiquitous in feedstuffs (Gesellschaft für Ernährungsphysiologie 2001), requirements
may be met by PA intake via feed provided that feed-bound PA is not degraded in the
rumen. As the small intestine is the major site of PA absorption in ruminants (Rérat
et al. 1958), the duodenal flow of PA can be a measure to investigate whether PA intake via feed and ruminal PA synthesis together might meet the proposed requirements.
The aim of this review is to give an outline of the current findings on PA synthesis
in the rumen, the PA flow to the duodenum, as well as the PA concentrations in the
blood and milk of dairy cows. However, due to the scarcity of studies on ruminants,
cross-references to studies with non-ruminant animals and humans are, in some cases,
unavoidable.
Chemical structure and biochemical functions
The vitamin PA (see Appendix Figure A3) consists of ß -alanin and pantoic acid
(Bässler et al. 2002). Already from its name, which is derived from the Greek word
pantos, meaning ”everywhere”, it can be deduced that PA is ubiquitous and occurs in
nearly every feedstuff (Williams et al. 1933). In nature, the only occurring vitamer of
PA is the D-isomer. Except for serum and milk, free PA is rare. Nevertheless, as a part
of CoA, PA is available in every living cell (Bender 1992; Pietrzik et al. 2008). As a
part of CoA and ACP, the biological activity of PA is closely related to those particular
compounds. Bound in CoA, PA is essential for many reactions involved in the release
of energy from carbohydrates, fatty acids and amino acids (Figure 4). In carbohydrate
4.1
53
Pantothenic acid in ruminant nutrition: a review
metabolism, acetyl-CoA essentially supplies the tricarboxylic acid cycle with acetyl
groups. Furthermore, acetyl-CoA is necessary for the acetylation of amino sugars and
choline to form mucopolysaccarides and acetylcholine. Succinyl-CoA is important for
the biosynthesis of haemoglobin and cytochromes as a precursor of porphyrin (Ball
2006). Additionally, ACP-bound PA is essentially involved in the biosynthesis of fatty
acids (Ball 2006).
Carbohydrates
Fatty acids
Citric
acid
cycle
Energy
Pyruvate
Amino acids
Acetyl-CoA
Steroids
Acetylation
Choline
Sulfonamides
Amino sugars
Proteins
Figure 4: Central position of coenzyme A in intermediary metabolism (Biesalski 1997)
Sources and bioavailability of pantothenic acid
Table 15 shows that PA concentrations vary largely between and within feedstuffs.
Values in Table 15 arise from compilations, thus methods of analysis and numbers
of samples are unknown. Different analytical methods may result in varying values
for PA concentrations, such that a comparison of feedstuffs analysed with different
methods is difficult to achieve (Roth-Maier and Kirchgessner 1979). Furthermore,
native PA concentrations are influenced by climate, species, vegetation stage, habitat
and fertiliser (Albers et al. 2002).
4.1
54
Pantothenic acid in ruminant nutrition: a review
Table 15: Summary of pantothenic acid concentrations of several feeds
Feed
Range of PA References
(mg/kg DM)
20.7 - 42.0 Roth-Maier and Kirchgessner (1979), Anonymous
(1996), National Research Council (1998)
Lucerne meal
Lucerne hay
20.1
Anonymous (1996)
Barley, whole grain
3.9 - 11.6
Roth-Maier and Kirchgessner (1979), Anonymous
(1996), National Research Council (1998), Souci et al.
(2000), LfL (2004)
Maize, whole grain
5.7 - 9.1
Roth-Maier and Kirchgessner (1979), Anonymous
(1996), National Research Council (1998), Souci et al.
(2000), LfL (2004)
Oats, whole grain
8.0 - 19.0
Roth-Maier and Kirchgessner (1979), Anonymous
(1996), National Research Council (1998), Souci et al.
(2000), LfL (2004)
Peas
2.2 - 31.1
Anonymous (1996), National Research
(1998), Souci et al. (2000), LfL (2004)
9.0 - 10.8
Roth-Maier and Kirchgessner (1979), Anonymous
(1996), LfL (2004)
Rye, whole grain
1.7 - 17.4
Anonymous (1996), National
(1998), Souci et al. (2000)
Soybean meal, solvent extracted
14.4 - 18.6
Roth-Maier and Kirchgessner (1979), Anonymous
(1996), National Research Council (1998), LfL (2004)
Wheat, whole grain
1.4 - 17.5
Roth-Maier and Kirchgessner (1979), Anonymous
(1996), National Research Council (1998), Souci et al.
(2000), LfL (2004)
Whey powder
5.3 - 123.8
Roth-Maier and Kirchgessner (1979), Anonymous
(1996), National Research Council (1998), Souci et al.
(2000)
Rapeseed meal,
extracted
solvent
Research
Council
Council
PA, pantothenic acid; DM, dry matter; LFL, Bayerische Landesanstalt für Landwirtschaft
At present, no studies are available simultaneously examining the PA intake, amount
of PA at the duodenum and PA content in blood. Thus an estimation of the apparent
bioavailability (proportion of PA intake and PA which is available in plasma after
absorption) of PA for ruminants is not possible. A determination of the absolute
bioavailability (proportion of orally administered PA which is available in plasma after
absorption) of PA in ruminants is extremely difficult as PA is both degraded and
synthesised in the rumen. Therefore, studies on the distribution of PA with isotoplabeled PA are necessary. So far, no dietary factors are known that affect PA availability
(Roth-Maier et al. 2000). For dairy cows it must be considered that, based on a
ruminal synthesis of only 38 mg/d, the cow has to ingest nearly 400 mg PA to meet
4.1
Pantothenic acid in ruminant nutrition: a review
55
the proposed PA requirements of 425 mg/d (National Research Council 2001), which
is almost impossible in view of the data presented in Table 15. However, the National
Research Council (2001) requirements are only first proposals, thus it is questionable
whether they are correct.
Microbial synthesis and degradation and absorption of PA in the gastrointestinal tract of ruminants
It is worth noting that most studies on PA in ruminants were published decades ago
and very few recent findings are available. The ability of microorganisms in the rumen
to synthesise PA has long been known (Bechdel et al. 1928; McElroy and Goss 1941).
However, is it difficult to measure the total amount of synthesised PA in the rumen,
as the rumen is a dynamic system in which synthesis, degradation, passage along the
digestive tract, and possibly absorption happen simultaneously (Kon and Porter 1954).
The apparent synthesis of PA (difference between duodenal flow and intake) has only
been measured in growing steers and even without supplementation it was negative
(-13.5 mg/d; Zinn et al. 1987), indicating that no net synthesis of PA occurred. But
growing steers had a low DM intake; hence apparent synthesis in mature animals may
be different. Additionally, the major dietary ingredient was maize grain, and as PA
synthesis varies with ration composition it would be interesting to evaluate whether
other types of diet will lead to positive apparent ruminal synthesis. Table 16 gives
a survey of microorganisms (in vitro) which synthesise, require or do not need PA.
But no studies investigated which microorganisms degrade PA. It should be conducted
that the cited studies in Table 16 are older than 48 years, however, more current
studies are not available. However, in a field study with ruminally protected and
unprotected PA supplementations, ruminal degradation of PA was obvious (Bonomi
2000). Furthermore, Porter (1961) reported that the addition of PA led to a reduced
PA in vitro synthesis of Escherichia coli, whereas the PA synthesis of Streptococcus
bovis was not influenced. He also found that 100 mL ruminal liquid contained 100 µg
PA, which was distributed among the protozoal (10%), bacterial (50%) and supernatant
(40%) fractions of ruminal fluid.
4.1
56
Pantothenic acid in ruminant nutrition: a review
Table 16: Survey of microorganisms which synthesise, require or do not need
pantothenic acid
Microorganisms
Escherichia coli 1
Streptococcus bovis 1,2
Streptococcus faecalis 2
Streptococcus liquefaciens 2
8 unclassified strains of Streptococcus 2
Lactobacillus casei 2
Lactobacillus fermenti 2
Lactobacillus acidophilus 2
Lactobacillus plantarum 2
1
2
Synthesise
X
X
Pantothenic acid
Require
No need of
X
X
X
X
X
X
X
X
Porter (1961)
Ford et al. (1958)
The ruminal synthesis of PA is influenced by composition of the diet. With an increasing content of rapidly degradable carbohydrates (starch and sugar), more PA is
synthesised, indicating a shift in microbial population from species which consume to
species which synthesise PA (Lardinois et al. 1944; Hollis et al. 1954; Hayes et al. 1966;
Table 17). It should be considered that the animal numbers (1 to 8) in these studies
were rather small and furthermore, studies were older than 40 years. Lardinois et al.
(1944) reported a further increase in PA synthesis when urea was added to a diet high
in rapidly degradable carbohydrates. Agrawala et al. (1953) found that a purified ration decreased the PA synthesis by about 50% compared to a regular ration (Table 17)
and hypothesised that PA synthesis may have been lowered due to a sensitivity to pH
changes and/or some lack of essential nutrients and/or rapid utilisation and removal
of PA from the rumen. But for this study, calves were used and drastic changes of
ration may have a greater impact on this ruminal population in those than in more
mature animals. In vitro, a correlation (r = 0.82) between PA concentration and substrate digestibility was found, which indicates that synthesis of PA was related to total
microbial activity (Hayes et al. 1967). Finlayson and Seeley (1983) endorsed this hypothesis for wethers as they established a correlation (r = 0.94) between the amount
of PA reaching the small intestine and the quantity of microbial DM produced in the
rumen, suggesting that most of the PA is associated with the microbial fraction at this
4.1
Pantothenic acid in ruminant nutrition: a review
57
site. The same authors also found that the amount of free PA decreased between the
mouth and the proximal duodenum, while the amount of CoA-bound PA increased.
Only Zinn et al. (1987) reported on the influence of PA supplementations on duodenal
PA flow. Growing steers (194 kg BW) were fed on a mixed diet (45:55, F:C on DM
basis) and PA was supplemented at 0 (PA intake, 24.5 mg/d), 200 and 2000 mg/d,
resulting in duodenal PA flows of 11.0, 15.3 and 452.8 mg/d. Compared to the control
only 2000 mg PA led to a significant increased duodenal PA flow. Nevertheless, nearly
80% of the supplementation disappeared between the mouth and the duodenum. But
it is a debatable point whether disappearance results from degradation or absorption
of PA. Previously, ruminal absorption has only been tested in the washed rumen of
sheep and it seems that it can be ignored (Rérat et al. 1958), but it has never been
tested with PA-supplemented cows. Studies on the site of PA absorption in the small
intestine do not exist. Perhaps PA can be absorbed at the proximal duodenum and
therefore maybe before the duodenal cannula which would lead to an overestimation
of ruminal disappearance. But at least in rats and chickens, the major site for PA
absorption seems to be the jejunum (Fenstermacher and Rose 1986). The PA absorption
from the intestinal lumen is effected by an active Na+ -dependent carrier mechanism
(Fenstermacher and Rose 1986). But the dietary PA concentration showed no influence
on the activity of the transporter (Stein and Diamond 1989).
The apparent small intestinal disappearance (between the duodenal and ileal cannulas)
of PA has only been measured in wethers. For total PA the apparent small intestinal
disappearance was about 50%, however CoA-bound PA disappeared by about 92%
while the content of free PA increased fourfold (Finlayson and Seeley 1983). They
hypothesised that the disappearance of CoA-bound PA reflects enzymic hydrolysis to
yield free PA, most of which is then absorbed by passive diffusion but leaving a residuum
of free PA at the terminal ileum larger than that entering the duodenum. Roth-Maier
et al. (2000) observed that PA failed to undergo substantial enterohepatic circulation,
thus no PA is secreted back into the small intestine.
4.1
Table 17: Pantothenic acid concentrations of ruminal material (mean values)
Number and
animal
species
hay1
1 cow
hay + 1.82 kg maize molasses1
1 cow
hay + 1.82 kg maize molasses + 0.2 kg urea1
1 cow
hay1
1 cow
hay + 0.91 kg maize molasses + 0.91 kg starch1
1 cow
hay + 0.91 kg maize molasses + 0.91 kg starch + 0.2 kg urea1
1 cow
hay + 0.91 kg maize molasses + 0.91 kg starch + 0.09 kg casein1
1 cow
hay + 0.91 kg maize molasses + 0.91 kg starch + 0.09 kg casein + 0.2 kg 1 cow
5.45 kg timothy
4.54 kg timothy
4.54 kg timothy
4.54 kg timothy
4.54 kg timothy
4.54 kg timothy
4.54 kg timothy
4.54 kg timothy
urea1
42% cornstarch + 25% glucose + 20% cellophane + 4% lard + 5% minerals + 4% urea2
before feeding
6 h after feeding
60% brome-timothy hay + 40% grain mixture2
before feeding
6 h after feeding
100% prairie hay2
53% maize + 45% prairie hay + 2% urea2
45% prairie hay + 40% maize + 15% soybean meal2
45% sorghum silage + 44% maize + 11% soybean meal2
53% maize + 45% lucerne hay + 2% soybean meal2
90% maize + 10% soybean meal2
44% maize cobs + 25% maize + 20% maize gluten meal + 7% maize syrup + 3% maize
oil + 1% CaHPO4 2
42% maize cobs + 23% maize + 19% maize gluten meal + 6% maize syrup + 6% lucerne
ash + 3% maize oil + 1% CaHPO4 2
6.3 kg flaked maize + 1.1 kg soybean meal with minerals1
6.6 kg ground maize + 1.1 kg soybean meal with minerals1
6.9 kg flaked maize + 1.8 kg long lucerne hay + 0.7 kg soybean meal with minerals1
7.5 kg ground maize + 1.8 kg long lucerne hay + 0.7 kg soybean meal with minerals1
7.5 kg flaked maize + 1.8 kg ground lucerne hay + 0.7 kg soybean meal with minerals1
7.4 kg ground maize + 1.7 kg ground lucerne hay + 0.7 kg soybean meal with minerals1
6 calves
6 calves
1 calve
1 calve
2
2
2
2
2
2
2
lambs
lambs
lambs
lambs
lambs
lambs
lambs
BW
(kg)
DM
intake
(kg/d)
181
254
32
41
2 lambs
8
8
8
8
8
8
steers
steers
steers
steers
steers
steers
340
340
340
340
340
340
PA in
Total ruminal content Liquid fraction
(mg/kg DM)
(µg/mL)
3.4
3.9
12.0
5.8
5.7
17.9
18.2
16.3
3.2
3.2
10.3
16.3
3.2
3.2
28.0
27.0
0.6
0.8
0.8
0.8
0.8
0.8
0.7
8.3
14.3
17.5
16.4
22.6
30.1
16.4
0.8
18.7
References
Lardinois
et al. (1944)
Agrawala et al.
(1953)
Hollis et al.
(1954)
2.4a
3.5b
0.7c
0.8c
1.2c
1.1c
Pantothenic acid in ruminant nutrition: a review
Diet
Hayes et al.
(1966)
DM, dry matter; PA, pantothenic acid
Mean values within a trial with unlike superscript letters were significantly different (P ≤ 0.05).
1
In these studies no DM values of feed were given; therefore fresh matter values are presented here.
2
On DM-basis.
a,b,c
58
4.1
Pantothenic acid in ruminant nutrition: a review
59
Pantothenic acid concentrations in blood, milk and urine
Blood
In serum PA mainly occurs in the free form, whereas in erythrocytes the predominant
form of PA is CoA (Pietrzik et al. 2008). Table 18 summarizes published information on blood PA concentrations. For the ease of comparison, also two human studies
were listed in Table 18. At present, only two studies are available considering the PA
content in the blood of dairy cows. However, differences between the reported values are immense, although cows in both studies (Dubeski and Owens 1993; Bonomi
2000) had a similar milk production and the same analytical method for PA (an indirect enzyme-linked immunosorbent assay) was used. Perhaps a miscalculation in the
study of Dubeski and Owens (1993) caused the differences between the PA values. The
PA concentrations determined by Roth-Maier and Kirchgessner (1973) and Ray et al.
(1947) in the whole blood of calves and sheep correspond to plasma values of Bonomi
(2000). As has been shown for humans (Table 18), whole blood normally has a higher
PA concentration than plasma, as it also contains the CoA-bound PA of the erythrocytes (Song et al. 1985). Values for calves were lower, possibly because they have no
fully developed rumen and therefore less microbial synthesis of PA is possible.
The effects of a PA supplementation on blood PA concentrations vary. For dairy cows,
daily supplementations of 100 and 200 mg/cow increased plasma PA concentrations but
50 mg/cow did not. Daily supplementations of 50, 100 and 200 mg rumen-protected
PA per cow always resulted in increased plasma PA concentrations compared to the
unsupplemented control and in comparison with unprotected supplements (Table 18;
Bonomi 2000). Roth-Maier and Kirchgessner (1973) studied the effects of 17, 21,
25 and 45 mg PA per kg milk replacer on the performance of male veal calves, with
17 mg PA/kg milk replacer representing the native PA concentration. Only the highest
supplementation level (45 mg/kg milk replacer) increased the whole blood PA content.
Roth-Maier and Kirchgessner (1973) further concluded that the PA content of 17 mg per
kg milk replacer already met the PA requirements of male veal calves as supplemented
amounts did not improve weight gains and feed conversion.
4.1
60
Pantothenic acid in ruminant nutrition: a review
Table 18: Pantothenic acid concentrations in whole blood and plasma of ruminants
and women (mean values)
Species (n)
Preruminants:
Male veal calf (11)
80 kg
80 kg
80 kg
80 kg
110 kg
110 kg
110 kg
110 kg
140 kg
140 kg
140 kg
140 kg
Supplementation
Pantothenic acid
Blood (mg/L)
None1
43
83
283
None1
43
83
283
None1
43
83
283
0.267a
0.264a
0.288a
0.355b
0.265a
0.260a
0.290a
0.304b
0.273a
0.281a
0.260a
0.346b
±
±
±
±
±
±
±
±
±
±
±
±
0.0292
0.0272
0.0272
0.0292
0.0192
0.0162
0.0242
0.0192
0.0262
0.0262
0.0242
0.0232
Blood fraction
Whole
Whole
Whole
Whole
Whole
Whole
Whole
Whole
Whole
Whole
Whole
Whole
blood
blood
blood
blood
blood
blood
blood
blood
blood
blood
blood
blood
Suckling calf (31)
Ruminants:
Feedlot steer (16)
Dairy cow (14)
None4
0.00003
± 0.0000042
Plasma
None4
None4
0.00003
0.00002
± 0.0000042
± 0.0000042
Plasma
Plasma
Dairy cow (15)
1. Farm
2. Farm
3. Farm
1. Farm
2. Farm
3. Farm
1. Farm
2. Farm
3. Farm
None4
None4
None4
506
1006
2006
50 protected6
100 protected6
200 protected6
0.856a
0.907a
0.877a
0.912a
1.154b
1.252b
1.203b
1.331c
1.586c
0.1035
0.0735
0.1145
0.0865
0.0855
0.1365
0.0925
0.0885
0.1535
Plasma
Plasma
Plasma
Plasma
Plasma
Plasma
Plasma
Plasma
Plasma
Sheep (10)
Women:
4-5th month of pregnancy (6)
4-5th month of pregnancy (7)
7-8th month of pregnancy (6)
7-8th month of pregnancy (7)
End of pregnancy (6)
End of pregnancy (7)
nonpregnant + nonlactating (5)
4-5th month of pregnancy (6)
4-5th month of pregnancy (7)
7-8th month of pregnancy (6)
7-8th month of pregnancy (7)
End (6)
End (7)
nonpregnant + nonlactating (5)
pregnant or
lactating (26)
nonpregnant +
nonlactating (26)
References
Roth-Maier
and
Kirchgessner
(1973)
Dubeski and
Owens (1993)
Bonomi (2000)
±
±
±
±
±
±
±
±
±
None
0.418 ± 0.0705
None4
606
None4
606
None4
606
None4
None4
606
None4
606
None4
606
None4
0.517
0.566
0.510
0.497
0.558
0.881
0.848
0.100
0.097
0.112
0.243
0.097
0.254
0.118
None10
None10
None11
None11
0.433a
0.108
0.526b
0.111
0.432-0.6017,8
0.454-0.6787,8
0.384-0.6367,8
0.406-0.5887,8
0.432-0.6847,8
0.629-1.1337,8
0.562-1.1347,8
0.073-0.1278,9
0.065-0.1298,9
0.066-0.1578,9
0.182-0.3038,9
0.062-0.1328,9
0.062-0.1328,9
0.064-0.1728,9
±
±
±
±
0.0105
0.0035
0.0125
0.0045
Whole blood
Ray et al. (1947)
Whole
Whole
Whole
Whole
Whole
Whole
Whole
Whole
Whole
Whole
Whole
Whole
Whole
Whole
Ishiguro (1962)
blood
blood
blood
blood
blood
blood
blood
blood
blood
blood
blood
blood
blood
blood
Whole blood
Plasma
Whole blood
Plasma
Song et al.
(1985)
PA, pantothenic acid
Mean values within a trial with unlike superscript letters were significantly different (P ≤ 0.05).
1
The natural PA content of the milk replacer was 17 mg/kg.
2
Standard error
3
mg PA supplementation per kg milk replacer; for the total PA content of the milk replacer the
natural PA content has to be added.
4
PA intake from natural diet was not specified.
5
Standard deviation
6
PA supplementation (mg/d)
7
Bound PA
8
95% confidence interval
9
Free PA
10
PA intake from natural diet was 5.3 mg/d for pregnant and 5.9 mg/d for lactating women.
11
PA intake from natural diet was 4.8 mg/d.
a,b,c
4.1
Pantothenic acid in ruminant nutrition: a review
61
For humans, Ishiguro (1962) observed the influence of 60 mg PA per day on the content
of bound and free PA in the whole blood of pregnant women. Around the 4th to 5th
month of pregnancy PA supplementation did not increase the blood PA content. However, at the 7th to 8th month and at the end of pregnancy the level of free PA increased,
while the bound PA only increased at the end of pregnancy due to PA supplementation
(Table 18). Compared to non-pregnant women, pregnant women (without PA supplementation) had decreased blood levels of bound PA, but the level of free PA did not
differ (Ishiguro 1962; Song et al. 1985).
For ruminants only one field study exists on the influence of PA supplementation on
blood variables (Bonomi 2000). It seems that the effects are dose-dependent as supplementations of 50 and 100 mg per cow per day had no influence on either the blood
concentrations of glucose, acetic acid, total cholesterol, triglyceride, NEFA, urea N, total protein, albumin, glutamic-oxaloacetic transaminase and γ-glutamyl transferase, or
the amino acid profile in plasma (Bonomi 2000). However, supplementations of 200 mg
PA per day, as well as supplementations of 50, 100 and 200 mg ruminally protected
PA per cow per day increased the glucose content (each by about 5%, 10%, 10% and
12%), decreased the acetic acid concentration (-14%, -15%, -21%, -31%), increased the
content of methionine (29%, 50%, 42%, 64%), lysine (12%, 16%, 16%, 22%), isoleucine
(25%, 38%, 54%, 57%) and glutatmate (6%, 8%, 8%, 11%) and reduced the content
of phenylalanine (-9%, -11%, -15%, -18%), glycine (-15%, -29%, -22%, -33%) and histidine (-14%, -27%, -15%, -31%; Bonomi 2000). From this field study Bonomi (2000)
hypothesised that the reduction of acetic acid resulted from a higher utilisation of
this acid for lipid synthesis in the udder, as the milk fat content was also increased.
Furthermore, PA might have caused an improved energy utilisation that led to the
increase of glucogenic amino acids, which, in the unsupplemented diets were needed
for protein synthesis (Bonomi 2000). In contrast to cows, rats fed diets with graded
levels of PA supplementation (0.16 to 1600 mg/kg diet) had differences in the levels of
triglycerides and free fatty acids in serum, and both values decreased with increasing
PA levels (Wittwer et al. 1990). However, prior to PA supplementation, these rats had
a mild PA deficiency, thus lipid alterations were rather due to the previous deficiency,
as a PA deficiency elevates triglyceride and free fatty acid levels. The mechanism for
4.1
Pantothenic acid in ruminant nutrition: a review
62
this elevation is unclear, both CoA or phosphopantetheine may become limiting in an
enzyme-circulating pathway, thus elevating circulating lipids (Wittwer et al. 1990). A
further study with PA-deficient rats showed that the gluconeogenic capacity is reduced
during PA deficiency, as blood glucose and liver glycogen were reduced concurrently
(Srinivasan and Belavady 1976). This seems to result from a reduced activity of hexosediphophatase, which controls the rates of glycolysis and gluconeogenesis (Srinivasan
and Belavady 1976). This could also be an explanation of the increased glucose concentrations found by Bonomi (2000). If PA is able to enhance gluconeogenesis and thus,
blood glucose levels, it would be very interesting for high-yielding dairy cows, because
gluconeogenesis is essential for them as nearly all sources of glucose are fermented in
the rumen. However, a 700 kg cow with a milk production of 50 L/d requires approximately 3.5 kg glucose daily (Flachowsky et al. 2004). Thus, further studies are
warranted.
Milk
Eighty-five to 90% of PA in the human milk occurs in a free form (Song et al. 1984); for
cow’s milk, no such data is available. Generally, the PA milk concentration is considerably higher than that of the other B-vitamins (Kirchgessner et al. 1965). Literature up
to 1965 on PA concentrations in the milk of dairy cows was reviewed and summarized by
Kirchgessner et al. (1965). The average PA content in the milk was about 3 mg/L. Since
then, only two further studies on milk PA concentrations were published (Kirchgessner
et al. 1991a; Kirchgessner et al. 1991b; Table 19). In a compilation by Souci et al.
(2000) an average PA content for raw milk of 3.5 mg/L was stated with a range of 2.8 to
4.2 mg/L. At the onset of lactation the lowest milk PA concentrations are found. During
the first days of lactation milk PA concentrations increase and peak by about 4 mg/L
between the 4th to 14th day. Afterwards concentrations decrease slightly (Lawrence
et al. 1946; Pearson and Darnell 1946; Gregory et al. 1958). With supplementations
of 0.5, 2 and 16 g PA per cow per day, Marsh et al. (1947) could not increase the
PA content in the milk of dairy cows, whereas supplementing 2 g PA to the diet of
goats increased the PA concentration of their milk - a supplementation of 0.25 g had
no effect. An explanation for this difference between cows and goats was not given.
4.1
63
Pantothenic acid in ruminant nutrition: a review
Thus, up to now, for dairy cows the milk PA content could not be increased due to PA
supplementation, however this fact was only tested once, with two cows, more than 60
years ago.
Table 19: Milk pantothenic acid concentrations without pantothenic acid
supplementation (means with their standard deviation)
Milk PA (mg/L)
Lactation week
Mean
SE
Dairy cows (70) 3.66
0.31
n.s.
Species (n)
References
Holmes et al. (1944)
Dairy cows (32) 2.24
Dairy cows (32) 3.67
Ewes (14)
2.62
Ewes (14)
3.66
0.87
0.57
0.71
0.79
Colostrum
Milk
Colostrum
Milk
Pearson and
Darnell (1946)
Dairy
Dairy
Dairy
Dairy
Dairy
Dairy
Dairy
cows
cows
cows
cows
cows
cows
cows
(8)
(8)
(8)
(8)
(18)
(18)
(18)
3.67
3.79
3.99
3.84
3.49
3.22
3.03
0.65
0.73
1.18
2.12
0.46
0.52
0.73
6 - 10
10 - 14
14 - 18
18 - 22
10 - 28
13 - 31
16 - 34
Kirchgessner
et al. (1991a)
Dairy
Dairy
Dairy
Dairy
cows
cows
cows
cows
(16)
(16)
(16)
(16)
5.01
4.07
2.98
3.23
0.93
1.12
0.99
1.38
∼7
∼ 11
∼ 15
∼ 19
Kirchgessner
et al. (1991b)
PA, pantothenic acid; n.s., not specified
Kirchgessner et al. (1991a; 1991b) reported that neither a prolonged release of bovine
growth hormone nor an excess of energy or protein had an influence on PA concentrations in milk. Furthermore, no relationship existed between the PA content in milk and
milk fat, total solids, milk-solids-not-fat, caloric value, milk yield and the age of the cow
(Lawrence et al. 1946). One field study on the influence of ruminally unprotected and
protected supplementations of 50, 100 and 200 mg per cow per day on milk parameters
exists (Bonomi 2000). Supplementations of 50 and 100 mg of ruminally unprotected
PA showed no influences. The other supplementations showed dose-dependent effects,
however the slightest influences were always observed with the ruminally unprotected
supplementation: milk production should be increased between 4 to 10%, milk fat and
milk protein content both between 4 to 9%, whereas no influence on milk lactose content and fatty acid composition was established. From this field study Bonomi (2000)
4.1
Pantothenic acid in ruminant nutrition: a review
64
assumed that these effects resulted from changes of the haemogram, as PA supplementations increased glucose concentration and some glucogenic amino acids, while acetic
acid and some ketogenic amino acids were decreased. The author concluded that the
reduced acetic acid concentrations might arise from a better utilisation of this acid for
milk lipid synthesis, resulting in an increased lipogenesis. Additionally, the increase in
glucogenic amino acids could result from a more efficient energy utilisation, redirecting
more amino acids towards protein synthesis. Thus, it seems very interesting to study
the influence of PA on milk composition further.
Urine
As for serum and milk, PA in urine occurs mainly in the free form (established for
humans; Shigeta and Shichiri 1966). Two previous studies are available considering
the excretion of PA via urine in ruminants. Teeri et al. (1951) reported that for heifers
fed a 100% roughage ration, PA excretion via urine (between 75 and 83 mg PA per
day) always exceeded the intake (by about 17 to 38%). When adding molasses to the
ration (amount not specified) the excretion of PA via urine increased significantly (85
to 118 mg PA per day, 134 to 145% of intake). The authors hypothesised that the
microorganisms which synthesise PA are favourably affected by the higher amount of
rapidly fermentable or degradable carbohydrates in the molasses ration, which was supported by studies of Hayes et al. (1966) and Hollis et al. (1954). For goats, Marsh et al.
(1947) found an increased amount of PA in the urine following a PA supplementation of
2 mg/d. Thus, it seems that the PA content in the urine of ruminants is influenced by
ration composition and PA intake. Similarly, the urine PA excretions of humans also
correlated positively with PA intake (Fox and Linkswiler 1961; Fox et al. 1964; Song
et al. 1985). Furthermore, a positive relationship was detected between PA concentrations in the milk and urine of humans (Song et al. 1984). Experiments with humans
and rats showed that the urinary excretion of PA is reduced during a PA deficiency
(Fox and Linkswiler 1961; Pietrzik et al. 1975). No PA could be detected in the urine
of rats fed a diet without any PA for a year (Pietrzik et al. 1975). However, without
antagonists, a PA-free situation is not possible in ruminants due to the synthesis of PA
by microorganisms.
4.1
Pantothenic acid in ruminant nutrition: a review
65
Conclusion and future research
The importance of PA becomes obvious when considering the variety of metabolic reactions where CoA and ACP are involved. It is therefore surprising that it is still unclear
if the PA requirements of dairy cows are being met by intake and/or ruminal synthesis. Furthermore, current studies are hardly available in the literature. Duodenal flow
was hitherto only measured in growing steers, thus for dairy cows, which have much
higher intakes and duodenal flows of DM and nutrients, the situation may be different. Furthermore, the sole study using dairy cows on the influence of supplementing
PA on blood variables, milk production and ingredients, showed vast effects as blood
glucose concentrations, milk production and additionally milk fat and protein contents
increased (Bonomi 2000). However, this study was implemented under normal working
farm conditions and thus the performance was not scientifically-based alone. Due to
these facts it is essential to focus future research on the demand for PA. Therefore, it is
absolutely necessary to test the influence of different rations on duodenal PA flow, as
well as on PA concentrations in blood and milk. Considering these points, the following
future research objectives are summarized:
1. Simultaneous determination of duodenal PA flow and PA concentrations in blood
and milk at different feeding regimes with and without supplementations of PA.
2. Influence of PA supplementation on ruminal fermentation and ruminal PA synthesis at different rations.
3. Effects of varying ration composition on ruminal PA synthesis. Thus, in vitro
studies would be helpful to establish which bacteria and possibly protozoa need
PA and which degrade it.
4. Influence of PA supplementation on duodenal flows of other nutrients.
5. Mechanisms and sites of PA absorption in ruminants.
6. Course of blood PA concentrations during lactation.
7. Transport mechanisms of PA in mammary glands.
4.1
Pantothenic acid in ruminant nutrition: a review
66
8. Surveys to test whether gestating and lactating, gestating and non-lactating, nongestating and lactating, and non-gestating and non-lactating cows have different
PA concentrations in blood and – if applicable – in milk.
9. Effects of ruminally protected PA.
10. PA analyses of feedstuffs.
4.2
Effects of a pantothenic acid supplementation on dairy cows
4.2
Effects of a pantothenic acid
supplementation on dairy cows
67
4.2
Effects of a pantothenic acid supplementation on dairy cows
68
Introduction
Pantothenic acid belongs to the group of B-vitamins and due to its incorporation into
CoA and ACP it is essential for many metabolic reactions (Pietrzik et al. 2008). In
general, it was assumed that for cows no supplementation of PA is necessary as PA
is ubiquitous and can be synthesised by microorganisms in the rumen (Bechdel et al.
1928; Gesellschaft für Ernährungsphysiologie 2001; National Research Council 2001).
Therefore only few studies considering the influence of PA on ruminants exist. The
National Research Council (2001) proposed first PA requirements for tissue (304 mg/d)
and milk synthesis (121 mg/d) of a 650 kg cow producing 35 kg of 4% fat-corrected milk
per day of 425 mg/d, whereby, tissue values had to be extrapolated from lactating sows.
This projection showed that the ruminal synthesis of PA (38 mg/d) is more than 10
times lower then the proposed requirements for tissue and milk. Additionally, about
80% of supplemented dietary PA seem to disappear between mouth and duodenum
(Zinn et al. 1987). Nevertheless, Bonomi (2000) observed an increase in milk production
due to a daily supplementation of 200 mg PA. Between 1944 and 1966 Lardinois et al.
(1944), Hollis et al. (1954) and Hayes et al. (1966) established that, by increasing the
concentrate proportion of the diet, PA synthesis in the rumen also increases. More
recent investigations on this topic are missing. Therefore, the aim of this study was
to determine the influence of a PA supplementation to two diets differing in F:C ratio
on ruminal fermentation, nutrient flow at the duodenum as well as on blood and milk
variables of dairy cows. Furthermore, the duodenal PA flows and PA concentrations in
blood and milk were emphasised in this study.
Experimental methods
Treatments, experimental design and animals
Experiments were conducted in observance to the European Community regulations
concerning the protection of experimental animals and the guidelines of the Regional
Council of Brunswick, Lower Saxony, Germany (File Number 33.11.42502-04-057/07).
A total of fifteen German Holstein dairy cows were equipped with large rubber cannulas
in the dorsal sac of the rumen (inner diameter 10 cm) and T-shaped cannulas in the
proximal duodenum close to the pylorus (inner diameter 2 cm). The study was divided
4.2
Effects of a pantothenic acid supplementation on dairy cows
69
into two parts. In the first part eight cows received a HC diet which had a F:C ratio of
34:66 on DM basis. In the second part nine cows were fed a HF diet which had a F:C of
66:34 on DM basis. Each cow received a not ruminally protected PA supplementation
(a powder with 98% D-calcium pantothenate, Adisseo, Commentry, France) of 1 g/d
(diets HC+PA and HF+PA). The experimental design is shown in Table 20; it
is unbalanced due to different calving dates. Table A3 in the Appendix shows the
individual cows used in the different groups.
Table 20: Pantothenic acid experimental design
(cows/group)
Group
Control
PA
HC
Lactating Dry
6
2
6
2
HF
Lactating Dry
5
4
5
4
HC, high concentrate: 34% forage and 66% concentrate on
dry matter basis; HF, high forage: 66% forage and 34% concentrate on dry matter basis; PA, pantothenic acid
The composition of the concentrate was the same as in the FA experiment (Table 7).
The forage was composed of 60% maize silage and 40% grass silage (on DM basis). The
DM content of the silages was determined twice a week to maintain the appropriate
F:C ratio and the maize to grass silage ratio. All the cows and bulls of the experimental
station of the Friedrich-Loeffler-Institut Brunswick were fed from the same large bunker
silos of grass and maize silages. Thus, the silos were changed several times during
the experiment. At 05:30 h and 15:30 h forage was offered in two equal portions,
the pelleted concentrate was given at 05:30 h, 07:30 h, 15:30 h and 17:30 h. The PA
supplement was mixed into an additional 100 g of mineral and vitamin mix (the same as
used for concentrate in Table 7) and one half was top dressed on the concentrate by hand
at 05:30 h and the other half at 15:30 h. The control animals received 100 g of mineral
and vitamin mix without PA. To ensure constant ration composition the amounts
of feed were individually adjusted and avoiding refusals if possible. A standardised
digestibility trial with adult wether sheep (96.6 (SD 8.6) kg BW; n = 4; Gesellschaft
für Ernährungsphysiologie 1991) was conducted to estimate the ME concentrations of
the forages. The cows had free access to water and a salt block containing sodium
chloride. They were housed in a tethered-stall with neck straps and individual troughs.
4.2
Effects of a pantothenic acid supplementation on dairy cows
70
At the beginning of the first and the second part of the experiment the cows had mean
BW of 617 (SD 24) kg and 604 (SD 87) kg, respectively. Due to animal numbers, both
dry and lactating cows had to be used. In the first part (HC) six cows were in lactation
(172 (SD 115) DIM at the beginning), while two were dried off. In the second part
(HF) five cows were in lactation (188 (SD 66) DIM at the beginning) and four were
dried off. Over the whole experiment lactation numbers ranged from two to five. The
lactating cows were milked at 05:00 h and 16:00 h.
Sample collection
Every period consisted of two weeks of adaptation to the respective diets, followed by
two weeks of sample collection. Milk, blood and ruminal fluid samples were collected in
the first sample week. Milk samples were taken on two days of consecutive morning and
evening milking. For the analysis of milk composition 50 mL of each milking sample
were conserved with bronopol and stored at 8◦ C until they were analysed. Aliquots
of additional 800 mL were pooled per day according to the milk yield, freeze-dried
afterwards (Christ Epsilon 1-15; Christ, Osterode, Germany) and stored at -18◦ C for
fatty acid and PA analyses. Milk yields were recorded daily. The frequency of blood
samples was kept to a minimum due to animal welfare. Therefore, on one day blood
samples were collected from a vena jugularis externa just before, three and six hours
after, first morning feed to characterise the influence of feeding on blood PA levels.
Until centrifugation blood samples were kept at 15◦ C. One hour after sampling the
samples were centrifuged at 2123 x g for 30 min at 15◦ C and the separated serum was
kept at -80◦ C. On another day just before and 30, 60, 90, 120, 180 and 360 min after
the first feeding in the morning approximately 100 mL of ruminal fluid were withdrawn
from the ventral sac through the rumen fistula using a hand-operated vacuum pump.
For duodenal digesta collection four samples of approximately 100 mL duodenal digesta were taken through the duodenal cannula every two hours for five consecutive
days in the second sampling week. Directly after sample collection, the pH values were
measured with a glass electrode (digital pH measurement device, pH525, WTW, Weilheim, Germany). For each cow the sample with the lowest pH was added to the daily
pooled sample and stored at -18◦ C as described by Rohr et al. (1984). Cr2 O3 mixed
4.2
Effects of a pantothenic acid supplementation on dairy cows
71
with wheat flour was used as a flow marker for the calculation of the daily digesta flow.
Every 12 h 50 g of the marker was given into the rumen, beginning ten days before
the duodenal sampling period, and 25 g every 6 h one day before, and then during,
the sampling period. In a comparison of measurements of duodenal flow in dairy cows
(Rohr et al. 1984), the spot-sampling procedure used has shown only small differences
in flow as compared to the total collection. Samples of forage, concentrate and feed
refusals, if occurring, were collected daily during the duodenal sampling week, pooled
on a weekly basis, freeze-dried and ground through a 1-mm screen for analysis. Daily
duodenal digesta samples were also freeze-dried and ground (1 mm). Faeces of wethers
were dried at 60◦ C and also ground through a 1-mm screen for analysis.
Analyses
DM, Ash, CP, EE, CF and starch were analysed in the feedstuffs and refusals, as
well as in the faeces of the wethers according to the methods of the Verband Deutscher
Landwirtschaftlicher Untersuchungs- und Forschungsanstalten (VDLUFA, 1993) . Acid
and neutral detergent fibre were determined after the method of van Soest et al. (1991)
and expressed without residual ash. The LUFA Speyer (Germany) analysed the PA
content of forages, concentrate and mineral and vitamin mix using a microbiological
assay (Lactobacillus plantarum; Difco 1998b). Immediately after withdrawal of the
ruminal fluid the pH-value was measured (pH525, WTW, Weilheim, Germany). In
the ruminal fluid NH3 − N was analysed according to DIN 38406-E5-2 (1998). Short
chain fatty acids were determined using a gas chromatograph (Hewlett Packard 5580,
Avondale, PA, USA) equipped with a flame ionization detector as described by Geissler
et al. (1976). Freshly thawed duodenal digesta was used to quantify the nitrogen
concentration according to the Kjeldahl method. Freeze-dried and ground duodenal
digesta was used for the following analyses. For every day of the sampling week the DM
and ash contents were determined by the same methods mentioned above for feedstuffs.
According to Lebzien and Paul (1997) near infrared spectra was used to estimate the
proportion of microbial-N of NAN in the duodenal digesta. Cr2 O3 was analysed in the
marker and duodenal digesta by atomic absorption spectrophotometry as described
by Williams et al. (1962) and was used to calculate the duodenal DM flow. The daily
4.2
Effects of a pantothenic acid supplementation on dairy cows
72
duodenal DM flow was then used as a measure for the preparation of one pooled sample
per cow per week in which concentrations of NDF, ADF and PA were determined by
the methods named above for the feedstuffs.
Serum samples were analysed for glucose using Hexokinase (A11A00116, ABX Diagnostics, Montpellier, France), NEFA via enzymatic colour test (99475409, Wako Chemicals,
Neuss, Germany), ß -HBA by an enzymatic UV-test (RB 1008, Randox Laboratories,
Krefeld, Germany) and urea also by an enzymatic UV-test (A11A00075, ABX Diagnostics, Montpellier, France) by the laboratory of the Cattle Clinic Hanover (University
of Veterinary Medicine, Germany). In serum PA, FA, 5-methyl-THF, THF, thiamin,
riboflavin, pyridoxal-5’-phosphate, pyridoxic acid, pyridoxal, pyridoxine, pyridoxamine, nicotinamide and nicotinic acid concentrations were determined via high performance liquid chromatography (W. Bigalke, unpublished method). Sample preparation
included protein precipitation with ethanol and fat extraction with n-hexan. After
centrifugation (20800 x g) the supernatant was evaporated under a nitrogen stream
and the residue was dissolved in the aqueous mobile phase A, filtrated and injected
into a high performance liquid chromatography system (Shimadzu, Kyoto, Japan).
B-vitamins were separated using a reversed phase C18 -column with mobile phase A
containing sodium 1-hexanesulfonate monohydrate and phosphoric acid in ultrapure
water. Mobile phase B consisted of acetonitrile. Quantifications of B-vitamins were
performed simultaneously using a multi wavelength detector and a spectrofluorometric
detector.
Fat, protein, lactose and urea were determined in the milk samples using the infrared
milk analyser (Milkoscan FT 6000 combined with a Fossomatic 5000, Foss Electric,
Hillerød, Denmark). The analysis of milk fat composition was carried out in freeze-dried
samples after extraction with chloroform/methanol (2:1, v/v ) and transesterification
with trimethylsulfoniumhydroxide. A gas chromatograph (Hewlett Packard 6890, Palo
Alto, CA, USA) equipped with a flame ionization detector and a capillary column
(model Zebron 7HG-G009-11) was used for the separation of the fatty acids from butyric
acid (C4:0 ) to linolenic acid (C18:3 ). The milk PA concentrations were determined by
the same methods used for the detection of PA in the feedstuffs and duodenal digesta.
4.2
Effects of a pantothenic acid supplementation on dairy cows
73
Calculations and statistics
According to the equation number 1.1.2 of the Society of Nutrition Physiology (Gesellschaft für Ernährungsphysiologie 2001) the ME was calculated. Forage digestibility
was obtained from the aforementioned wether balance trial, while the tabular values
were used for concentrate (Universität Hohenheim – Dokumentationsstelle, 1997) .
The calculation of the daily duodenal DMF was done as follows:
DM F (kg/d) =
chromium application (mg/d)
/1000
duodenal chromium concentration (mg/g DM )
The daily duodenal flow of OM and OM constituents was estimated by the multiplication of DMF with their respective concentrations in duodenal digesta. Subtracting the
PA intake from the amount arriving at the duodenum, the apparent PA synthesis in
the reticulo-rumen was calculated. Assuming a mean ammonia-N proportion of total
N with N-balanced rations of 4.9% (Riemeier 2004), the daily duodenal flow of NAN
was calculated. According to Lebzien and Voigt (1999) the uCP at the duodenum was
estimated as follows:
uCP (g/d) = (N AN f low at the duodenum (g/d)) · 6.25 − EP (g/d)
where EP (g/d) = (3.6 · kg DM F ) · 6.25 (Brandt and Rohr 1981)
The following equations were used for the calculation of FOM, ruminally degraded CP
and UDP:
F OM (kg/d) = OM intake(kg/d)−(duodenalOM f low (kg/d)−microbialOM (kg/d))
where microbial OM (kg/d) = 11.8 · microbial N (kg/d) (Schafft 1983)
Ruminally degraded CP (g/d) = CP intake (g/d) − U DP (g/d)
U DP (g/d) = 6.25 · (N AN at the duodenum (g/d) − microbial N (g/d)) − EP (g/d)
RN B (g/d) = (CP (g/d) − uCP (g/d))/6.25
Fat corrected milk was estimated to be:
F at corrected milk (kg/d) = ((% milk f at · 0.15) + 0.4) · kg milk yield
(Helfferich and Gütte 1972).
The data was analysed using the SAS software package (Version 9.1.3., procedure
mixed, SAS Institute Inc., Cary, NC, USA). For statistical analysis of the rumen and
serum variables the following model was used. Pantothenic acid supplement was con-
4.2
Effects of a pantothenic acid supplementation on dairy cows
74
sidered as a fixed effect and a repeated statement for the within-subject factor over all
sampling times was used. The OM intake was treated as a fixed regressive component.
Furthermore, the fact that a cow had to be used over several periods for different treatments was taken into account by using the random statement for the individual cow
effect. To evaluate the variances the restricted maximum likelihood method was applied and degrees of freedom were calculated according to the Kenward-Roger-method.
To test the differences between the LSmeans the ”PDIFF” option was used and the
Tukey-Kramer test was applied for post-hoc analysis. A modified model was used for
the analysis of the duodenal and milk variables as it was set up with PA, OM intake
and the random statement for the individual cow effect as previously mentioned. For
the variables of milk production and composition, the fixed effect lactation stage was
additionally implemented in the model. The duodenal PA flow and milk PA concentrations were analysed with the same model, apart from the fixed regressive component
OM intake. Differences were considered to be significant at P ≤ 0.05, and a trend was
discussed at P < 0.10. For all variables significant levels of the analyses of variances
are shown as post-hoc analyses (Tukey-Kramer-Test) showed no significant effects or
trends. If not mentioned otherwise, all values presented are LSmeans with SE.
Results
Due to the scope of this study, the effects of the OM intake will not be shown and
discussed and influences of time after feeding and interactions of PA and time after
feeding are shown and discussed only when they were significant.
Feeding
Over the whole experiment the proposed ratio of F:C was achieved. The two different
rations (HC and HF) were neither isonitrogenous nor isocaloric, because the OM intake
and feedstuffs used should have been identical as far as possible. Table 21 shows the
mean nutrient composition of the two rations. Native PA content of HC and HF rations
differed only slightly (HC = 19.1 mg/kg DM and HF = 17.9 mg/kg DM). The nutrition
composition of the forage is shown in the Appendix (Table A2). The mean PA and
nutrient intake per cow per day is shown in Table 22. It must be considered that with
4.2
Effects of a pantothenic acid supplementation on dairy cows
75
the HC ration the PA group had a 10% greater OM intake than the control, as the OM
intake of two cows in the control group randomly decreased.
Table 21: Arithmetic means (with standard deviation) of nutrient composition (g/kg DM), metabolisable energy (MJ/kg DM)
and pantothenic acid contents (mg/kg DM) of the rations
OM
CP
EE
CF
ADF
NDF
Starch
ME
Pantothenic acid1
HC (n = 3)
Mean
SD
936
1.4
185
9.5
26
3.3
115
3.8
132
3.0
275
14.8
372
44.7
12.1
0.0
19.1
1.0
HF (n = 4)
Mean
SD
931
3.4
142
4.5
32
1.8
166
7.4
185
2.0
369
20.6
292
12.1
11.3
0.1
17.9
1.0
DM, dry matter; HC, high concentrate: 34% forage and 66% concentrate
on dry matter basis; HF, high forage: 66% forage and 34% concentrate on
dry matter basis; SD, standard deviation; OM, organic matter; CP, crude
protein; EE, ether extract; CF, crude fibre; ADF, acid detergent fibre;
NDF, neutral detergent fibre; ME, metabolisable energy
1
without supplementation
Rumen fermentation variables
No effects for the ruminal variables occurred at the single measurement times (TukeyKramer-test) between the control groups and their respective treatments. Therefore
only the LSmeans over the whole sampling time are presented in Table 23. The ammonia concentrations and the pH values were not influenced by PA in either ration. The
PA supplementation to the HC ration significantly increased the molar percentage of
acetic acid by about 1.2 percentage units, whereas valeric acid tended to be lowered by
about 0.3 percentage untis. Additionally, the total concentration of SCFA significantly
decreased due to PA (Table 23). During the feeding of the HF ration the PA supplementation significantly decreased the molar proportion of propionic acid (P = 0.003).
HC
(n = 6)
SD
2.00
1.88
0.06
0.54
0.26
0.72
38.3
Dry (n
Mean
8.81
8.18
0.27
2.35
1.13
3.16
168
= 2)
SD
2.63
2.47
0.08
0.70
0.34
0.96
50.2
Lactating
Mean
15.82
14.70
0.45
4.49
2.19
6.14
1302
HC+PA
(n = 6)
Dry (n
SD
Mean
1.07
8.48
0.99
7.84
0.03
0.24
0.48
2.24
0.18
1.14
1.05
2.74
20.4
1162
= 2)
SD
2.13
2.00
0.06
0.57
0.29
0.70
40.7
Lactating
Mean
13.33
12.32
0.30
4.83
2.45
3.89
250
HF
(n = 5)
SD
2.37
2.22
0.05
0.81
0.45
0.69
35.8
Dry (n
Mean
7.25
6.65
0.17
2.60
1.33
2.12
136
= 4)
SD
1.82
1.67
0.04
0.63
0.34
0.49
43.8
Lactating
Mean
13.83
12.79
0.31
4.95
2.55
4.06
1251
HF+PA
(n = 5)
Dry (n
SD
Mean
1.1
7.08
1.04
6.49
0.03
0.16
0.40
2.56
0.21
1.29
0.34
2.02
24.2
1156
= 4)
SD
1.32
1.24
0.03
0.37
0.26
0.42
62.3
HC, high concentrate: 34% forage and 66% concentrate on dry matter basis; PA, pantothenic acid; HF, high forage: 66% forage and 34% concentrate on
dry matter basis; SD, standard deviation; DM, dry matter; OM, organic matter; NDF, neutral detergent fibre; ADF, acid detergent fibre
Table 23: Influence of pantothenic acid supplementation on ruminal variables averaged over
sampling times1 (LSmeans with their standard error)
pH
NH3 (mmol/L)
SCFA (mol %):
Acetic acid
Propionic acid
Isobutyric acid
Butyric acid
Isovaleric acid
Valeric acid
SCFA (mmol/L)
Control (n
LSmeans
6.31
10.22
60.9
19.0
1.0
15.1
1.8
2.3
95.7
= 8)
SE
0.08
0.89
0.84
0.84
0.08
0.46
0.20
0.23
3.71
HC
PA (n = 8)
LSmeans SE
6.39
0.08
10.03
0.89
62.1
18.4
1.0
14.7
1.8
1.9
90.1
0.87
0.84
0.08
0.46
0.20
0.23
3.71
P
PA
0.226
0.697
0.042
0.146
0.053
0.176
0.744
0.072
0.031
Control (n
LSmeans
6.43
9.70
63.5
18.3
1.0
14.1
1.8
1.4
108.7
= 9)
SE
0.05
0.32
0.99
0.58
0.04
0.52
0.20
0.07
3.70
HF
PA (n = 9)
LSmeans SE
6.44
0.05
10.23
0.32
63.9
17.4
1.0
14.2
2.1
1.4
106.9
0.99
0.58
0.04
0.52
0.20
0.07
3.70
P
PA
0.864
0.131
Effects of a pantothenic acid supplementation on dairy cows
Lactating
Intake
Mean
DM
13.84
OM
12.90
N
0.43
NDF
3.70
ADF
1.78
Starch 4.99
PA
264
4.2
Table 22: Intakes of nutrients (kg/day) and pantothenic acid (mg/day) by lactating and dry cows fed high concentrate or high forage
diets (arithmetic means with their standard deviation)
0.676
0.003
0.795
0.843
0.190
0.838
0.701
76
HC, high concentrate: 34% forage and 66% concentrate on dry matter basis; HF, high forage: 66% forage and
34% concentrate on dry matter basis; PA, pantothenic acid; SE, standard error; SCFA, short chain fatty acids
1
Sampling time: just before and 30, 60, 90, 120, 180, 360 minutes after the first feeding in the morning.
4.2
Effects of a pantothenic acid supplementation on dairy cows
77
Nutrient flow at the duodenum
The nutrient flows at the duodenum are shown in Tables 24 and 25. For their interpretation it must be considered that for the HC ration the PA group had a 10% greater
OM intake than the control (Table 22) due to a randomly decreased OM intake of two
cows in the HC group. As the OM intake was a co-variable in the statistical model,
the LSmeans for the amount of OM arriving at the duodenum (Table 24) did not differ
between HC and HC+PA as the values were adjusted according to the different OM
intake. The apparent ruminal digestibility of OM and amount of FOM show that PA
had no influence on the ruminal digestibility of OM. Despite the adjustment according
to the OM intake a significantly increased (P = 0.024) NDF flow at the duodenum
was found in the HC+PA group compared to the control. This effect is attributed to
a slightly increased NDF content in the HC+PA ration compared to the HC ration
at constant apparent ruminal digestibility of NDF. In contrast to NDF, the apparent
ruminal digestibility of ADF tended to be increased (P = 0.070) by PA. Therefore, in
spite of the fact, that ADF in the HC+PA ration was slightly higher, the amount of
ADF at the duodenum was the same as compared to the control (HC). Furthermore, at
HC ration PA significantly decreased the efficiency of MP synthesis (Table 25), either
expressed per kg FOM (-11%) or per MJ ME (-14%), while the absolute flow (g/d)
of MP at the duodenum only tended to be decreased (P = 0.062; -12%). The RNB
of both groups was positive (not shown); hence in each group an adequate N supply
of microorganisms was achieved. Thus, the decreased MP synthesis in the HC+PA
group could not be caused by an N deficiency. With the HF diet PA supplementation
significantly increased the amount (kg/d) of FOM by 4% and the proportion of FOM
of OM intake (5%; Table 24). The PA supplementation had no influence on ruminal
CP metabolism when cows consumed the HF diet (Table 25).
Duodenal flow (kg/d):
OM
7.48
0.19
FOM
7.40
0.20
NDF
1.96
0.10
ADF
1.05
0.06
FOM of OM intake (%)
60.5
1.70
Apparent ruminal digestibility (kg/kg intake):
OM
0.400
0.0195
NDF
0.454
0.0292
ADF
0.398
0.0359
HC
PA (n = 8)
LSmeans
SE
P
PA
Control (n = 9)
LSmeans
SE
HF
PA (n = 9)
LSmeans
SE
P
PA
7.42
7.24
2.11
1.06
59.9
0.19
0.20
0.10
0.06
1.70
0.555
0.433
0.024
0.771
0.707
6.43
5.70
2.16
1.09
55.3
0.17
0.13
0.06
0.03
1.38
6.26
5.94
2.15
1.08
58.2
0.17
0.13
0.06
0.03
1.38
0.221
0.001
0.900
0.681
0.013
0.412
0.452
0.444
0.0195
0.0292
0.0359
0.270
0.931
0.070
0.386
0.475
0.479
0.0169
0.0219
0.0173
0.410
0.485
0.489
0.0169
0.0219
0.0173
0.181
0.606
0.511
HC, high concentrate: 34% forage and 66% concentrate on dry matter basis; HF, high forage: 66% forage and 34% concentrate on dry
matter basis; PA, pantothenic acid; SE, standard error; OM, organic matter; NDF, neutral detergent fibre; ADF, acid detergent fibre
Effects of a pantothenic acid supplementation on dairy cows
Control (n = 8)
LSmeans
SE
4.2
Table 24: Influence of pantothenic acid supplementation on nutrient flow at the duodenum, ruminally fermented
organic matter (FOM) and apparent ruminal digestibility (LSmeans with their standard error)
78
HC
PA (n = 8)
LSmeans SE
1198
69.9
165
8.04
7.5
0.39
327
15.2
311
14.5
1740
90.8
0.66
0.04
543
27.8
22.8
1.07
169.7
28.58
-1097.3 24.16
P
PA
0.062
0.013
0.029
0.131
0.131
0.137
0.497
0.384
0.674
0.207
< 0.001
Control (n = 9)
LSmeans SE
915
44.0
165
9.44
7.3
0.36
252
9.8
239
9.3
1316
55.8
0.77
0.05
400
22.5
24.4
1.60
79.3
26.52
-120.8 24.58
HF
PA (n = 9)
LSmeans SE
949
44.0
158
9.44
7.5
0.36
259
9.8
246
9.3
1367
55.8
0.83
0.05
418
22.5
26.0
1.60
198.5
26.52
-1005.3 24.58
P
PA
0.590
0.562
0.730
0.603
0.603
0.526
0.396
0.487
0.433
0.014
< 0.001
HC, high concentrate: 34% forage and 66% concentrate on dry matter basis; HF, high forage: 66% forage and 34%
concentrate on dry matter basis; PA, pantothenic acid; SE, standard error; MP, microbial crude protein; FOM, fermented
organic matter; ME, metabolisable energy; NAN, non-ammonia-nitrogen; uCP, utilisable crude protein; RDP, ruminally
degraded protein; UDP, ruminally undegraded feed protein; CP, crude protein; AS, apparent synthesis
Effects of a pantothenic acid supplementation on dairy cows
Control (n = 8)
LSmeans SE
MP (g/d)
1367
68.9
MP per FOM (g/kg)
186
8.04
MP per ME (g/MJ)
8.7
0.39
N (g/d)
362
15.2
NAN (g/d)
344
14.5
uCP (g/d)
1946
90.8
MP per RDP (g/g)
0.69
0.04
UDP (g/d)
578
27.8
UDP per CP intake (%)
22.1
1.07
PA (mg/d)
141.3
28.58
AS of PA (mg/d)
-98.8
24.16
4.2
Table 25: Nitrogen and pantothenic acid flow at the duodenum, efficiency of microbial protein synthesis
and apparent pantothenic acid synthesis (LSmeans with their standard error)
79
4.2
Effects of a pantothenic acid supplementation on dairy cows
80
It was only during the feeding of the HF ration that the PA supplementation could
significantly increase the duodenal PA flow (Table 25). In all groups the apparent
synthesis of PA was negative, leading to the conclusion that no net PA synthesis took
place in the rumen (Table 25). In the HC and HF group 59% and 39% of the ingested
PA arrived at the duodenum while with PA supplementation only 13% in HC+PA
group and 16% in the HF+PA group could reach the duodenum. Across all groups
significant relationships between the duodenal PA flow and MP synthesis (r = 0.48;
P = 0.010) or OM intake (r = 0.50; P = 0.003) were found (Figures 5A and B).
4.2
81
Effects of a pantothenic acid supplementation on dairy cows
PA flow to the duodenum (mg/d)
400
A
350
300
250
200
150
100
50
0
200 400 600 800 1000 1200 1400 1600 1800
Microbial protein synthesis (g/d)
PA flow to the duodenum (mg/d)
y = 73.0 (SE = 57.54; P = 0.225) + 0.10 (SE = 0.05; P = 0.061) * x; r2 = 0.23 (P = 0.061)
y = 32.8 (SE = 44.04; P = 0.462) + 0.10 (SE = 0.04; P = 0.010) * x; r2 = 0.20 (P = 0.010)
y = -6.4 (SE = 55.40; P = 0.910) + 0.11 (SE = 0.05; P = 0.044) * x; r2 = 0.26 (P = 0.044)
400
B
350
300
250
200
150
100
50
0
2
4
6
8
10
12
OMI (kg/d)
14
16
18
y = 12.1 (SE = 57.12; P = 0.835) + 14.6 (SE = 4.67; P = 0.007) * x; r2 = 0.41 (P = 0.007)
y = 0.6 (SE = 48.09; P = 0.990) + 12.9 (SE = 4.06; P = 0.003) * x; r2 = 0.25 (P = 0.003)
y = 17.7 (SE = 68.48; P = 0.800) + 8.4 (SE = 5.98; P = 0.181) * x; r2 = 0.12 (P = 0.181)
HC (34% forage and 66% concentrate on DM basis)
HF (66% forage and 34% concentrate on DM basis)
HC+PA
HF+PA
Regression equation of supplemented groups
Regression equation of all groups
Regression equation of control groups
Figure 5: Relation between pantothenic acid (PA) flow to the duodenum and (A)
microbial protein synthesis and (B) organic matter intake (OMI)
4.2
Effects of a pantothenic acid supplementation on dairy cows
82
Serum variables
For the serum variables no significant effects or trends were found at the single measurement times (Tukey-Kramer-Test), thus only the LSmeans over all sampling times
are presented in Table 26. Generally, it must be considered that the blood samples
were only taken at three time points and thus, are not representative for a whole day.
The PA supplementation lowered the serum glucose level when the HC ration was fed,
whereas, the PA supplement had no influence on serum variables when cows consumed
the HF ration. Furthermore, the serum PA concentrations were not influenced by the
PA supplementation for either ration (Table 26) and the serum PA concentrations did
not correlate with the duodenal flows of PA. Additionally, no influence of PA on other
B-vitamins was observed during the feeding of the HF ration (not shown), whereas
supplementing PA to the HC ration resulted in significantly lowered serum riboflavin
levels (from 14 to 11 ng/mL). The values of nicotinic acid, pyridoxine, pyridoxamine
and thiamin were below the detection limit (W. Bigalke unpublished data).
Milk composition
Apart from few modifications of milk fatty acid composition, i.e. C18:3 significantly and
C8:0 tendentially decreased, whereas C18:0 tendentially increased, none of the other milk
variables were influenced by supplementing PA to the HC ration (Table 27). During
the HF feeding regime the milk protein concentrations were decreased (P = 0.026) in
cows fed supplementary PA, whereas the milk lactose concentrations were increased
(P = 0.021; Table 27). Furthermore, C6:0 in milk fat significantly increased and C14:0
tended to decrease (Table 27). For both rations the supplementation of PA could
not increase the milk PA concentrations and yields (Table 27). Due to a higher milk
production nearly 78% of PA intake was excreted into the milk with the HC ration,
compared to only 44% with the HF ration. With supplementation only 15% of PA with
the HC ration and 7% with the HF ration arrived in milk. Furthermore, the milk PA
yields did not correlate with the serum PA concentrations and the duodenal PA flows.
The ratios between the milk and serum PA concentrations were relatively similar in all
groups and ranged from 63.9 in the HF group to 68.8 in the HC+PA group.
HC (n = 8)
PA
LSmeans
3.01
116.3
1.14
4.75
0.096
SE
0.08
51.6
0.24
0.30
0.017
P
PA
0.003
0.486
0.510
0.117
0.986
Control
LSmeans SE
3.35
0.07
87.0
17.0
0.71
0.06
3.41
0.11
0.072
0.008
HF (n = 9)
PA
LSmeans
3.41
99.3
0.69
3.53
0.067
SE
0.07
17.0
0.06
0.11
0.008
P
PA
0.341
0.153
0.653
0.225
0.627
HC, high concentrate: 34% forage and 66% concentrate on dry matter basis; HF, high forage: 66% forage and
34% concentrate on dry matter basis; PA, pantothenic acid; SE, standard error; ß -HBA, beta-hydroxybutyrate
1
Sampling time: just before and 180 and 360 minutes after the first feeding in the morning.
Effects of a pantothenic acid supplementation on dairy cows
Control
LSmeans SE
Glucose (mmol/L)
3.43
0.08
NEFA (µmol/L)
152.0
51.6
ß -HBA (mmol/L)
0.93
0.24
Urea (mmol/L)
5.22
0.30
PA (mg/L)
0.096
0.017
4.2
Table 26: Effects of dietary supplements of pantothenic acid to dairy cows on serum variables
averaged over sampling times1 (LSmeans with their standard error)
83
Milk (kg/d)
FCM (kg/d)
Milk composition (%):
Fat
2.84
Protein
3.02
Lactose
4.56
Yield (g/d):
Fat
779
Protein
783
Lactose
1201
Urea (mmol/L)
4.22
Fatty acids (weight % of total fatty acids):
C4:0
6.6
C6:0
4.1
C8:0
2.0
C10:0
4.0
C12:0
6.5
C14:0
12.0
C14:1
1.8
C16:0
29.9
C16:1
2.5
C18:0
3.7
C18:1
22.6
C18:2
3.9
C18:3
0.8
PA concentration (mg/L)
6.4
Total PA (mg/d)
186.3
HC (n = 6)
PA
LSmeans SE
26.7
1.24
22.9
1.49
P
PA
0.842
0.739
Control
LSmeans SE
18.7
0.66
18.6
0.80
HF (n = 5)
PA
LSmeans SE
20.3
0.72
20.1
0.87
P
PA
0.159
0.250
0.21
0.06
0.07
3.09
2.95
4.57
0.20
0.06
0.06
0.192
0.454
0.888
4.92
3.11
4.73
0.09
0.04
0.11
3.94
2.96
4.88
0.10
0.04
0.11
0.922
0.026
0.021
75.9
21.2
62.5
0.39
828
778
1217
3.80
74.2
20.4
55.2
0.36
0.302
0.782
0.839
0.357
741
579
892
2.41
61.3
32.3
52.8
0.28
750
580
932
2.26
72.3
35.3
61.5
0.31
0.909
0.997
0.657
0.745
0.25
0.31
0.19
0.48
0.66
0.65
0.29
1.32
0.45
0.41
1.48
0.19
0.04
0.68
29.96
6.7
4.0
1.8
3.7
6.2
12.3
1.9
29.9
2.4
4.1
23.1
3.5
0.5
6.6
188.4
0.22
0.29
0.19
0.47
0.62
0.62
0.26
1.20
0.43
0.41
1.36
0.18
0.04
0.68
29.96
0.777
0.682
0.059
0.341
0.611
0.618
0.816
0.992
0.850
0.056
0.794
0.120
< 0.001
0.784
0.939
7.2
4.4
1.9
3.8
5.5
12.3
1.5
34.8
2.0
5.1
18.4
2.4
0.6
4.6
88.4
0.22
0.09
0.04
0.15
0.38
0.17
0.38
0.63
0.22
0.41
0.85
0.07
0.03
0.43
8.14
7.4
4.5
2.0
3.9
5.3
11.7
1.6
33.7
1.8
5.4
20.2
2.4
0.6
4.5
85.2
0.23
0.09
0.05
0.18
0.41
0.19
0.44
0.75
0.24
0.44
0.95
0.09
0.03
0.43
8.14
0.267
0.022
0.681
0.850
0.747
0.055
0.893
0.273
0.464
0.695
0.130
0.956
0.344
0.742
0.783
84
HC, high concentrate: 34% forage and 66% concentrate on dry matter basis; HF, high forage: 66% forage and 34% concentrate
on dry matter basis; PA, pantothenic acid; SE, standard error; FCM, fat corrected milk
Effects of a pantothenic acid supplementation on dairy cows
Control
LSmeans SE
26.3
1.44
22.6
1.53
4.2
Table 27: Effects of dietary supplements of pantothenic acid to dairy cows on milk production and composition
(LSmeans with their standard error)
4.2
Effects of a pantothenic acid supplementation on dairy cows
85
Discussion
Studies on the influence of PA on rumen fermentation, duodenal nutrient flow and blood
and milk variables are scarce. In many cases, the cited studies are quite old and must
therefore be critically considered as analytical methods, feeding regimes and animal
performance have continuously developed over the last fifty years (Flachowsky et al.
2002). Furthermore, studies are cited that used blends of B-vitamins. Those blends
always included PA, but it must be taken into account that it cannot be ascertained
which B-vitamin or B-vitamin interaction caused an effect.
Rumen
Supplementing a blend of B-vitamins (with PA) and vitamin E to male lambs fed on
a diet of 61% maizecobs and 39% concentrate and minerals (fibre content, not further
specified, of the diet was 28%) had, in accordance with the current study (Table 23),
no influence on rumen ammonia or pH, and, moreover no effects on molar percentage
and total concentration of SCFA were observed (Perry and Hillier 1969). In an in
vitro study with a rumen simulation technique and three different rations (F:C ratios:
67:33, 50:50, 33:67) an even lower molar percentage for acetic acid were observed over
all rations (Völker 2008). In this study (Völker 2008), the PA supplementation also
led to an increase in the number of protozoa. Defaunation results in the decreased
molar proportion of acetic acid and an increase of propionic acid (Eugène et al. 2004),
thus an increase of protozoa might lead to the opposite effects which would explain the
increased molar percentage of acetic acid in the HC+PA group and the decreased molar
percentage of propionic acid in HF+PA group (Table 23). Eugène et al. (2004) also
showed that defaunation reduces the ruminal concentration of SCFA. However, Santra
et al. (2007) found increased concentrations of total SCFA after defaunation. Thus,
it would be interesting to consider whether PA may also influence protozoa stains in
vivo.
4.2
Effects of a pantothenic acid supplementation on dairy cows
86
Duodenum
Due to the increased FOM (Table 24), more energy for MP synthesis should have
been available in the rumen of the HF+PA fed animals compared to the control. But,
no effects of PA on the N flow at the duodenum or the efficiency of MP synthesis
were observed. However, with the HC ration, where no effect was observed of PA
on FOM, PA tended to decrease the flow of MP at the duodenum and decreased the
efficiency of MP synthesis (Table 25). Therefore, the higher availability of energy in
the rumen with the HF+PA ration may mask a decreasing effect of PA on the MP
synthesis. Perhaps this decrease can be explained by an increase of protozoa numbers
due to the PA supplementation as in defaunated animals the efficiency of MP synthesis
increases (Eugène et al. 2004). No other studies have investigated the influence of a
PA supplementation on the nutrient flow at the duodenum, FOM and the efficiency of
MP synthesis. Feeding a B-vitamin blend, including PA, Zinn et al. (1987; F:C ratio
45:55) studied the influence on the apparent ruminal digestibility of OM, ADF and
N, whereas Perry and Hillier (1969; diet of 61% maize cobs and 39% concentrate and
minerals) and Majee et al. (2003; F:C ratio 56:44) considered the influence of PA on
the apparent total tract digestion of DM, OM, NDF, CF and CP. These authors could
not find any effects.
Serum variables
Studies on the effect of dietary PA supplementation on blood and milk variables of
dairy cows are also scarce. To our knowledge only one study by Bonomi (2000) exists;
however, this study was conducted on commercial dairy farms and thus, factors potentially affecting response variables were not well controlled. Contrary to our feeding
regime, Bonomi (2000) fed no fixed F:C ratio. The cows received 28 kg of forage (fresh
matter, consisted of 20 kg maize silage and 7-8 kg lucerne hay; average DM intake
13.8 kg). The amounts of concentrate depended on the milk yield, but were not given.
Therefore, this study cannot be reproduced and it is difficult to evaluate the quality of
the data. During the first 150 days of lactation Bonomi (2000) found increased plasma
glucose concentrations due to PA supplementations of 200 mg/(d x cow), whereas
50 and 100 mg/(d x cow) showed no effect. In this study also ruminally protected
4.2
Effects of a pantothenic acid supplementation on dairy cows
87
PA in supplementations of 50, 100 and 200 mg/(d x cow) was tested and always resulted in increased plasma glucose concentrations. The results of the current study
are different from those of Bonomi (2000), as no influence or decreasing glucose levels
were observed; moreover PA supplementation was higher (Table 26). In general it is
astounding that such small amounts of PA affected the blood glucose level, as this level
is regulated homoeostatically (Stangassinger 2000). However, Wright (1942) reported
that PA participates in glucose utilisation, as a supplementation of glucose to fasting
rabbits resulted in lower blood PA values. Additionally, Voelkel (1956) noticed an increased glucose utilisation after intramuscular PA injection. This could possibly be an
explanation for the decrease of the glucose concentration after supplementing the HC
ration with PA. Otherwise, for rats it was established that PA increases the intestinal
absorption of glucose by a local action at the brush border of the intestinal cells (Huan
and Hung 1972). For ruminants, this fact is questionable, as most of ingested carbohydrates are degraded by ruminal microorganisms and only small amounts of glucose will
normally be absorbed from the small intestine. As gluconeogenesis is very important
in ruminants (a 700 kg cow with 50 L milk/d requires 3.5 kg glucose daily; Flachowsky
et al. 2004), it is interesting that in PA deficient rats the gluconeogenic capacity was
reduced (Srinivasan and Belavady 1976). Although, without antagonists a PA deficit
will not occur in ruminants, additional PA may increase the gluconeogenic capacity.
In agreement to our results (Table 26), a supplementation of a B-vitamin blend with
PA (Majee et al. 2003) could not alter the plasma levels of glucose, NEFA and ß-HBA
in dairy cows.
In the present study the PA supplementation lowered the blood riboflavin level of
the HC+PA group. However, until today, no interactions between riboflavin and PA
are known. To explain the observed decrease it has to be established whether PA
already affects the duodenal flows of these vitamins and therefore already influences
the microorganisms that synthesise or degrade riboflavin or whether the systemic effects
of PA are responsible for the effects on this vitamin.
4.2
Effects of a pantothenic acid supplementation on dairy cows
88
Milk composition
Only Bonomi (2000) studied the influence of 50, 100 and 200 mg unprotected or ruminally protected PA per cow per day on milk composition and found enormous effects
with supplementations of 200 mg unprotected and 50, 100 and 200 mg protected PA
(milk fat content increased by about 4.4 - 8.5%; milk protein content increased by
about 4.2 - 8.5%). These effects could not be confirmed by the results of the present
study as no influences on milk fat for both rations and a decrease of milk protein for
the HF ration due to PA were observed (Tables 27).
Majee et al. (2003) supplemented two levels of a B-vitamin blend (with PA) to a mixed
F:C (56:44) diet and, in accord with the results of the current study with the HF
ration, observed an increase in the percentage of lactose and additionally in the yield
of lactose when the B-vitamin blend was supplemented at the lower level. However,
the higher level of the B-vitamin blend could not change the milk composition or milk
component yields. Feeding a ruminally protected blend of B-vitamins at a F:C ratio
of 37:63 resulted in increased milk fat yield and greater true protein concentration and
yield (Sacadura et al. 2008). For similarly fed mid-lactating cows only the yield of
true protein increased and the milk fat percentage decreased. Sacadura et al. (2008)
concluded that cows in the early stage of lactation may be more responsive to Bvitamin supplementation due to decreased DM intake relative to milk production and
that B-vitamins facilitate an increased efficiency of metabolic functions.
In the current study only a few effects on fatty acid composition in milk were observed
(Table 27). May be one explanation for the changes of fatty acids composition during
the HC ration could be that PA increased the stepwise saturation of C18:3 to C18:0 ,
however the processes involved are unknown. Such influences were not found with the
HF ration, thus saturation may have occurred in the rumen, as with the HC ration no
supplemented PA reached the duodenum. The increase in C6:0 with the HF ration due
to PA only accounted for 0.1 percentage untis which would have no relevance. Bonomi
(2000) could not find any variations in the milk fatty acid composition when PA was
supplemented rumen-protected or unprotected.
From the results of the present study it is difficult to decide if influences on metabolism
result from changes at the ruminal level, as the influences on both were rather minor,
4.2
Effects of a pantothenic acid supplementation on dairy cows
89
which may be due to the fact that between 88 to 97% of the supplemented PA disappeared between mouth and duodenum. Therefore, scientifically based studies with
ruminally proteceted PA would be interesing. Thus, in future studies it would be
helpful to use rumen-unprotected and rumen-protected, as well as a unsupplemented
control, to define the site of action.
Pantothenic acid content in duodenal digesta, serum and milk
Until today duodenal PA flows were only measured in growing steers and wethers.
When compared with the results of the present study (79 to 141 mg/d; Table 25; 39 to
59% of PA intake) duodenal PA flows of growing steers (11 mg/d; 45% of PA intake;
Zinn et al. 1987) and wethers (11 to 40 mg/d; 66 to 424% of PA intake; Finlayson and
Seeley 1983) were rather low without PA supplementation, but in relation to PA intake
the highest values were found for the wethers. The differences between these studies
may result from varying OM and PA intakes and different rations, as well as from
general differences between cows, growing steers and wethers. Furthermore, differences
possibly arise from varying rates of MP synthesis, because in the present study a
correlation between duodenal PA flows and MP synthesis, and in the study of Finlayson
and Seeley (1983) between duodenal PA flow and production of microbial DM, was
found. Similar to the present study (Table 25), the apparent synthesis (calculated
from duodenal folate flows and folate intakes) in the study of Zinn et al. (1987) was
always negative, which means that the PA intake was always higher than the duodenal
PA flow. For the study of Finlayson and Seeley (1983) positive and negative apparent
syntheses were calculated, but positive apparent syntheses were mainly observed with
very low PA intakes (0 to 20 mg/d). Zinn et al. (1987) also investigated the effect of 200
and 2000 mg supplemented PA on duodenal PA flows. Supplementations of 2000 mg
PA/day increased the duodenal PA flows, as 22% of the supplementation reached the
duodenum, while 200 mg did not, as only 3% of the supplementation reached the
duodenum. In the present study the influence of PA depended on the rations as,
only with the HF ration, was an increase observed (12% of supplementation reached
the duodenum), while with the HC ration no increase occurred (only 3% of the PA
supplementation arrived at the duodenum; Table 25). However, the control group with
4.2
Effects of a pantothenic acid supplementation on dairy cows
90
the HF ration had even lower duodenal PA flows than the control group with the HC
ration, which probably results from the fact that more PA is synthesised in the rumen
with the increasing content of readily available carbohydrates in the diet (Lardinois
et al. 1944; Hollis et al. 1954; Hayes et al. 1966; Table 17). Generally, in the study of
Zinn et al. (1987) and in the present study substantial amounts of supplemented PA
disappear before the duodenal cannula. Disappearance could be caused by degradation
or absorption. Until today, ruminal absorption has only been demonstrated for free
PA in a washed rumen refilled with a high concentrated B-vitamin solution (105 mg
B1 , 85 mg B2 , 983 mg nicotinic acid, 200 mg calcium-pantothenate, 10.4 mg B12 ; Rérat
et al. 1958). Thus, it is not clarified whether absorption is also possible in normal
ruminal environments. From studies with rats and rabbits it was established that the
main absorption area in the small intestine for PA is the jejunum (Fenstermacher and
Rose 1986; Prasad et al. 1999). If this were the same for ruminants an absorption in the
proximal duodenum before the duodenal cannula could be ignored, therefore studies
with a post ruminal infusion of PA or with ruminal-protected and unprotected PA are
needed.
In literature to date, the plasma PA levels for dairy cows differed enormously from
0.00002 mg/L (Dubeski and Owens 1993) to 0.856 to 0.907 mg/L (Bonomi 2000) even
though the same analytical method was used (an indirect ELISA assay; Table 18). The
serum levels found in the present study differed from these values (0.067 to 0.096 mg/L).
It becomes apparent that further studies are required to characterise the blood PA
levels of dairy cows. Therefore, analyses of the same blood fraction using the same
method would be helpful. From the results of the present study it seems that the PA
surplus that arrived at the duodenum due to PA supplementation was not absorbed as
serum PA concentrations and milk PA yields were not influenced (Tables 25, 26 and
27). Regardless of PA supplementation, cows fed with the HC ration had considerably
higher serum PA levels (about 27%) than cows fed with the HF ration. This may also
result from the aforementioned enhanced ruminal PA synthesis during the feeding of
high-concentrate diets. In contrast to the present study, after the supplementation of
100 or 200 mg unprotected or 50, 100 or 200 mg rumen-protected PA per cow and
day, Bonomi (2000) found an increase in the plasma PA levels (Table 18). In growing
4.2
Effects of a pantothenic acid supplementation on dairy cows
91
male veal calves 45 mg PA per kg milk replacer resulted in enhanced PA levels of total
blood compared to 17 mg PA, which presenting the native PA concentrations of the
milk replacer. Whereas no effects were found with concentrations of 21 and 25 mg PA
per kg milk replacer (Roth-Maier and Kirchgessner 1973; Table 18).
According to a review by Kirchgessner et al. (1965) and two more recent studies by
the same group (Kirchgessner et al. 1991a; 1991b) milk PA concentrations range from
1.7 to 5.5 mg/L, which is similar to the PA values of the present study (4.5 to 6.6 mg
PA/L). One previous study (Marsh et al. 1947) tested the influence of a B-vitamin
mix, consisted of PA, thiamin, riboflavin and nicotinic acid, on milk PA concentrations
in dairy cows and goats. Daily supplementations of each vitamin of 0.5, 2 and even
16 g could not increase milk PA concentrations in dairy cows (Marsh et al. 1947). In
goats, daily supplementations of 0.25 g of each vitamin could not increase the milk
PA concentrations either; however, 2 g of each vitamin led to an increase. As already
reported for duodenal PA flows and serum PA concentrations, milk PA concentrations
and yields were higher in both the HC groups than in the HF groups (Table 27) which
may also result from the already mentioned increased ruminal PA synthesis with highconcentrate diets.
Conclusion
Regardless of dietary F:C ratio the PA supplementation had only some minor influences on ruminal fermentation. Also the effects on blood and milk variables were only
marginal. Apart from the duodenal PA flow with the HF ration, 1 g PA/d could neither
increase duodenal PA flow with the HC ration, nor the PA concentrations in blood and
milk, as well as milk PA yields with both rations. Thus, from the results of the present
experiment a PA supplementation in an unprotected form makes no sense. In the
present study, the proposed requirements of the National Research Council (2001) for
PA (425 mg/d) could not be achieved at the duodenum, as duodenal PA flows ranged
from only 80 to 200 mg/d with the different rations. Thus, it is necessary to study the
influence of rumen-protected PA on duodenal PA flows as well as on blood and milk
PA concentrations as it seems that dietary PA is extensively degraded in the rumen.
However, it is also questionable whether the estimated requirements are correct. For a
4.2
Effects of a pantothenic acid supplementation on dairy cows
92
better understanding of blood and milk PA concentrations, the absorption of PA from
the intestinal tract and the mechanism of PA secretion into the milk must be examined
for dairy cows. In this context, it would be interesting to establish whether absorption
of PA before the duodenal cannula or in the colon is possible, therefore it would be
helpful to use rumen-protected PA.
5 General Discussion
5
93
General Discussion
Under consideration of the first proposals for requirements given by National Research
Council (2001), it seems that the FA and PA requirements of dairy cows cannot be met
by ruminal synthesis (Table 28). However, the proposed requirements for tissue based
on lactating sow (175 kg) requirements (National Research Council 1998) adjusted to
650 kg lactating cow weight and the so called milk requirements based to milk folate
concentrations adjusted to 35 kg milk production (National Research Council 2001).
Studies dealing with the impact of an FA or a PA supplementation on ruminants are
scarce and in the available studies only the influences on parts of the metabolism were
observed (Chapters 3.1 and 4.1). Additionally, the amount of FA and PA synthesised
and degraded in the rumen is influenced by the composition of the ration (Hayes et al.
1966; Schwab et al. 2006). Therefore, the aim of the present study was to investigate
the effects of FA or PA supplementation to two different rations on ruminal metabolism,
duodenal nutrient flow, as well as on several blood and milk variables of dairy cows.
The focus was thereby set on the duodenal flows of FA and PA and their concentrations
in blood and milk. Unfortunately after feed, duodenal digesta and milk had already
been analysed a closer inspection of the analytical method indicated that Enterococcus
hirae was not an appropriate species to quantify folates in feed, duodenal digesta and
milk. Therefore these variables are not shown and discussed. Accordingly, the cows
were fed either with a diet consisting of a 34:66 (high concentrate, HC) or 66:34 (high
forage, HF) F:C ratio on DM base. Furthermore, the cows received either 1 g FA or
1 g PA per day or no supplementation.
Regardless of the dietary F:C ratio, the application of each vitamin led to only minor
influences on ruminal fermentation, as well as on blood and milk variables (Chapters 3.2
and 4.2). In current literature, the influence of FA and PA on ruminal fermentation
and on the metabolism of ruminants has not been studied in detail. The few available studies on FA supplementation accorded with the results of the present study as
similarly only minor or no influences were observed (Chiquette et al. 1993; Girard and
Matte 1998; Girard et al. 2005; Graulet et al. 2007). The effects of PA on ruminal
fermentation have not been studied before and its influences on blood and milk variables only once, in a field study. However, in that study vast effects on metabolism
94
5 General Discussion
and performance were observed (Bonomi 2000) which could not be confirmed by other
authors and in the present study.
As previously mentioned, the basis for this thesis were the proposed FA and PA requirements of the National Research Council (2001), as it seems from this proposal that
these two B-vitamins are the only B-vitamins where the proposed requirements do not
seem to be met by ruminal synthesis. Based on the first proposals for requirements
given by National Research Council (2001) Table 28 shows the extrapolated requirements for the cows in the current study. In the current study the apparent ruminal
synthesis was always negative for PA (Table 28), which illustrates that the apparent
ruminal synthesis is not the right variable to assess whether the requirements are met.
For this purpose duodenal flows are more suitable.
Table 28: Calculated daily requirements for folic acid and pantothenic acid
and duodenal flow and apparent synthesis of pantothenic acid (mg/d)
National Research Council (2001)
(650 kg cow, 35 kg FCM)
Present experiment:
HC (619 kg cow, 21 kg FCM)
HC+FA (619 kg cow, 22 kg FCM)
HF (610 kg cow, 20 kg FCM)
HF+FA (610 kg cow, 21 kg FCM)
HC (617 kg cow, 23 kg FCM)
HC+PA (617 kg cow, 23 kg FCM)
HF (604 kg cow, 19 kg FCM)
HF+PA (604 kg cow, 20 kg FCM)
Daily estimated requirement1 Duodenal Ruminal
Vitamin Tissue2 Milk Total
flow3
synthesis3
FA
33
2
35
7
PA
304
121 425
38
FA
FA
FA
FA
PA
PA
PA
PA
31
31
31
31
289
289
282
282
1
1
1
1
80
80
66
69
32
32
32
32
369
369
348
351
170
194
77
275
-94
-1108
-181
-977
FCM, 4% fat-corrected milk; FA, folic acid; PA, pantothenic acid; HC, high concentrate:
34% forage and 66% concentrate on dry matter basis; HF, high forage: 66% forage and
34% concentrate on dry matter basis
1
National Research Council (2001) requirements were based on several sources, while requirements for our study were calculated by dividing the NRC values with the respective
weight and milk yield and multiplying this with our cow weights and FCM yields.
2
Extrapolated from lactating sows.
3
LSmeans are given; for our experiment, apparent ruminal synthesis were calculated by
subtracting intake from duodenal flow.
In accordance with the assumption of the National Research Council (2001), in the
current study duodenal flows of PA did not meet the proposed requirements in the
control groups (Table 28). On the basis of the measured PA amounts in the milk
(Chapter 4.2, Table 27) the so called PA requirements of the National Research Council
(2001) seem to be too low, as the PA amounts found in the milk during the present
5 General Discussion
95
study (Chapter 4.2, Table 27) were even higher than the proposed requirements (Table
28). Thus the total PA requirements would even increase, which would, on the basis
of duodenal PA flows, result in an immense deficiency of PA for dairy cows. Based on
the aforementioned facts such a shortage does not seem to be realistic for dairy cows,
therefore it is questionable whether duodenal PA flows are the right value to measure
the supply of PA on the one hand and on the other hand tissue PA requirements are
probably overestimated. Thus, an evaluation of the PA requirements is necessary. The
proposed tissue requirements of both vitamins cannot be furhter verified by the results
of the present study; however studies to evaluate the tissue requirements of all Bvitamins are imperative as they are based on data from lactating sows. In the present
study beneficial effects on the cows due to FA supplementations as found by Girard and
Matte (1998) and Girard et al. (2005) were not obvious, but the set-up of this study was
not ideal for the investigation of some blood and performance variables, as the focus was
put on processes in the rumen and the amount of folates and PA in several bodily fluids.
As already established by Santschi et al. (2005a) and Zinn et al. (1987) disappearance
between mouth and duodenum might be very high for both vitamins (Chapter 4.2).
Therefore, studies with supplementations of ruminally protected FA and PA would be
interesting on the one hand, but on the other hand studies on the absorption of both
vitamins before the duodenal cannula are also required. However, from the results of the
present study it becomes questionable whether supplementations of ruminally protected
FA and PA have an impact on dairy cows, as in the current study the increased 5methyl-THF concentrations in serum had no substantial influence on metabolism and
the additional PA which arrived at the duodenum after PA supplementation to the HF
diet did not seem to be absorbed. In literature, no studies on the influence of different
rations on the PA amount in duodenum, blood and milk are available. From the results
of the present study (Chapter 4.2) it can be concluded that more PA arrives in the
duodenal digesta, blood and milk with high concentrate diets compared to high forage
diets. In the current literature the effects of ration on duodenal folate flows have been
proved (Schwab et al. 2006). However, the influences on blood folate concentrations
are unconfirmed (Girard et al. 1994; Santschi et al. 2005b).
5 General Discussion
96
Summarising the results of the present study and to give answers to the pervious
questions (Chapter 2) the following conclusions can be drawn:
• Both vitamins have no or only minor influences on the ruminal metabolism and
duodenal nutrient flow, as well as on blood and milk variables.
• It is possible to increase the amounts of folates in the serum by 1 g FA supplementation. However, no beneficial effects on dairy cows are obvious. Therefore,
studies with a higher number of non-fistulated cows are recommended.
• The amounts of PA in blood and milk can not be increased by 1 g PA supplementation and the duodenal PA flows only increased during the high forage
ration.
• Feeding high concentrate diets results in increased folate concentrations in serum
and increased PA amounts in all measured fluids.
• The disappearance of PA between the mouth and duodenum seems to be considerable, thus it must be resolved if an absorption in the rumen is possible,
otherwise the application of ruminal protected PA becomes advisable.
6 Summary
6
97
Summary
Microorganisms in the rumen can synthesise B-vitamins. However, based on the first
proposed requirements (National Research Council 2001), folic acid (FA) and pantothenic acid (PA) seem to be the only B-vitamins for which the ruminal synthesis
cannot meet the proposed requirements. Due to the fact that some microorganisms
synthesise FA, respectively PA, while others require them it seems that the duodenal
flow of each vitamin depends on ration composition.
Therefore, the present experiments investigated the influence of FA and PA on several
variables of ruminal fermentation, blood and milk, with a focus on folate and PA
amounts reaching the duodenum and milk, as well as the folate and PA concentrations
in the blood. These aspects were observed during the feeding of two different rations.
To evaluate the influence of FA, respectively PA, German Holstein cows equipped with
cannulas in the dorsal sac of the rumen and the proximal duodenum were used. In
the first part of the FA-experiment two dry and five lactating cows (186 (standard
deviation (SD) 144) days in milk (DIM) at the beginning) received a diet with 34%
forage and 66% concentrate (high concentrate, HC), while in the second part a forage
to concentrate ratio of 66:34 was fed (high forage, HF) to four dry and four lactating
cows (165 (SD 57) DIM at the beginning). Furthermore, each cow received 0 or 1 g
FA daily. For the examination of the PA influence the same experimental set-up was
applied, but the cows received 0 or 1 g PA daily. In the first part of this experiment six
cows were in lactation (172 (SD 115) DIM at the beginning) and two were dry, while
in the second part five cows lactated (188 (SD 66) DIM at the beginning) and four
were dry. Samples of ruminal fluid were withdrawn before and six times after the first
morning feeding. Duodenal digesta was colleted over five days in two-hourly intervals.
Cr2 O3 was used as flow marker for duodenal nutrient flow. Blood samples were taken
from a vena jugularis externa just before as well as three and six hours after the first
feeding in the morning. Milk samples were obtained on two days of each period. Milk
yields were ascertained daily.
Generally, minor influences of both vitamins on ruminal fermentation and on blood
and milk variables were observed. During the feeding of the HC ration FA reduced
6 Summary
98
the amount of ruminal fermented organic matter. Thus, less energy was available
for ruminal microorganisms which resulted in a reduced microbial protein flow at the
duodenum. Feeding the HF rations, FA supplementation only increased the apparent
ruminal digestibility of acid detergent fibre. With the HF ration FA had no influence
on the serum levels of glucose, non-esterified fatty acids, beta-hydroxybutyrate, urea,
thiamin, riboflavin, pyridoxal-5’-phosphate, pyridoxic acid, pyridoxal, pyridoxine, pyridoxamine, PA, nicotinamide and nicotinic acid. Whereas, supplementing FA to the
HC ration lowered the serum glucose and riboflavin levels. Regardless of the dietary
forage to concentrate ratio, no effects of FA on milk composition (fat, protein, lactose)
were observed. After feed, duodenal digesta and milk had already been analysed a
closer inspection of the analytical method indicated that Enterococcus hirae was not
an appropriate species to quantify folates in feed, duodenal digesta and milk. Therefore
these variables are not shown and discussed. The FA supplementation increased the
5-methyl-tetrahyrofolate concentrations in serum.
The PA supplementation slightly increased the molar proportion of acetic acid and
lowered the total concentration of short chain fatty acid, as well as the efficiency of
the microbial protein synthesis during the feeding of the HC ration. With the HF
ration, the PA supplementation reduced the molar proportion of propionic acid and the
duodenal starch flow, while the amount of ruminal fermented organic matter increased.
Due to the PA supplementation none of the measured blood variables were influenced
during the feeding of HF ration, but with the HC ration the glucose and riboflavin
levels decreased. Independent of ration, the influences of PA on milk variables were
negligible. The PA supplementation only enhanced the duodenal PA flow during the
feeding of the HF ration, while with the feeding of the HC ration no increase was
observed. Furthermore, the PA supplementation did not influence the serum and milk
PA concentrations, or the milk PA yields, regardless of the ration. Apart from the
increased duodenal PA flows achieved by supplementing PA to the HF ration, PA
amounts or concentrations were always higher in the HC fed animals.
It can be concluded from the results of both experiments that 1 g of each vitamin had
only minor influences on ruminal fermentation and metabolism of dairy cows. Furthermore, based on the duondenal flows of PA, the proposed PA requirements were not
6 Summary
99
met. The PA supplementation in fact only increased duodenal PA flows during the
feeding of the HF ration. However, this increase had no effect on the serum or milk
PA concentrations. Thus, regarding the results of the present experiment it becomes
apparent that the PA supplementations have no influence on the cows. Either PA supplementations were degraded in the rumen or, if PA had been absorbed between mouth
and duodenum no influence on the measured variables were observed. By supplementing FA no effects beneficial to the cows in the present experiment became apparent.
Therefore, further research is necessary to evaluate the first proposed requirements, as
until now they are based on lactating sows and it seems that they are overestimated.
Due to the high disappearance rates of PA between mouth and duodenum studies with
ruminally protected PA supplementations would be interesting. Furthermore, to prove
the influence of each vitamin on performance, studies with a higher number of animals
and a more homogeneous stage of lactation are required.
7 Zusammenfassung
7
100
Zusammenfassung
Mikroorganismen im Pansen synthetisieren B-Vitamine. Ausgehend von den ersten
Bedarfsvorschlägen (National Research Council 2001) scheinen Folsäure (folic acid, FA)
und Pantothensäure (pantothenic acid, PA) dabei die einzigen B-Vitamine zu sein, bei
denen die ruminale Synthese den geschätzten Bedarf nicht decken kann. In diesem
Zusammenhang muss berücksichtigt werden, dass der Duodenalfluss der betreffenden
Vitamine allerdings auch von der Rationszusammensetzung beeinflusst werden könnte.
Während bestimmte Mikrooganismen FA bzw. PA synthetisieren, benötigen andere sie
für ihren eigenen Stoffwechsel.
Die vorliegenden Untersuchungen hatten zum Ziel, den Einfluss von FA und PA auf verschiedene Fermentations-, Blut- und Milchvariablen zu ermitteln, wobei der Fokus auf
die am Duodenum und in der Milch ankommenden Folat- bzw. PA-Mengen, sowie deren
Konzentrationen im Blut lag. Getestet wurden die FA-Einflüsse an doppelt fistulierten
Kühen der Rasse Deutsche Holstein mit jeweils einer Fistel im dorsalen Pansensack und
einer weiteren im proximalen Duodenum. Im ersten Abschnitt der FA-Studie erhielten
zwei trockenstehende und fünf laktierende Kühe (186 (Standardabweichung (SD) 144)
Laktationstage zu Beginn) eine Ration bestehend aus 34 % Grundfutter und 66 %
Kraftfutter (high concentrate, HC), während im zweiten Abschnitt ein GrundfutterKraftfutter Verhältnis von 66:34 (high forage, HF) an vier trockenstehende und vier
laktierende Kühe (165 (SD 57) Laktationstage zu Beginn) gefüttert wurde. Jede Kuh
bekam darüberhinaus entweder 0 oder 1 g FA täglich. Die Untersuchung des Einflusses
von PA erfolgte mit demselben Versuchsaufbau, wobei die Tiere entweder 0 oder 1 g
PA täglich als Zulage erhielten. Im ersten Abschnitt der PA-Studie waren sechs Kühe
(172 (SD 115) Laktationstage zu Beginn) laktierend und zwei trockenstehend, während
im zweiten Abschnitt fünf laktierten (188 (SD 66) Laktationstage zu Beginn) und vier
trockenstanden. Die Pansensaftentnahme erfolgte direkt vor der ersten Morgenfütterung sowie zu sechs Zeitpunkten danach. Duodenalchymus wurde über fünf Tage
in zweistündigen Intervallen gesammelt. Zur Bestimmung des duodenalen Nährstoffflusses wurde als Flussmarker Cr2 O3 verwendet. Die Blutprobennahme erfolgte aus
einer vena jugularis externa direkt vor sowie drei und sechs Stunden nach der ersten
7 Zusammenfassung
101
Morgenfütterung. An zwei Tagen je Periode wurden Milchproben genommen. Die
Bestimmung der Milchmenge erfolgte täglich.
Insgesamt zeigten beide Vitamine einen nur geringen Einfluss auf die ruminale Fermentation sowie auf die Blut- und Milchvariablen. Die FA-Supplementierung zur HCRation reduzierte die Menge an ruminal fermentierter organischer Substanz. Dadurch
stand den Mikroorganismen im Pansen weniger Energie zur Verfügung, was zu einem
verringerten mikrobiellen Proteinfluss am Duodenum führte. Demgegenüber steigerte
die FA-Supplementierung zur HF-Ration die scheinbare ruminale Verdaulichkeit der
Säure-Detergenzienfaser. Desweiteren hatte bei Einsatz der HF-Ration FA keinen Einfluss auf die Serumkonzentrationen von Glukose, nicht veresterten Fettsäuren, betaHydroxybutyrat, Harnstoff, Thiamin, Riboflavin, Pyridoxal-5’-Phosphat, Pyridoxinsäure, Pyridoxal, Pyridoxamin, PA, Nicotinamid und Nicotinsäure. Die FA-Supplementierung zur HC-Ration führte hingegen zu einer geringeren Glukose- und Riboflavinkonzentration im Serum. Unabhängig vom Grundfutter-Kraftfutter-Verhältnis konnte
kein Einfluss der FA-Zulage auf die Milchzusammensetzung (Fett, Protein, Laktose)
nachgewiesen werden. Im Anschluss an die Analyse des Futter, des Duodenalchymus
sowie der Milch, zeigte eine genauere Betrachtung das die Spezies Enterococcus hirae
nicht geeignet ist die Folategehalte im Futter sowie im Duodenalchymus und in der
Milch zu bestimmen. Daher werden diese Variablen nicht gezeigt und diskutiert. Die
FA-Gabe steigerte die 5-Methyl-Tetrahydrofolat-Konzentration im Serum.
Die PA-Supplementierung steigerte während der Fütterung der HC-Ration geringfügig
den molaren Anteil der Essigsäure, wobei die Gesamtkonzentration der kurzkettigen
Fettsäuren sowie die Effizienz der mikrobiellen Proteinsynthese reduziert wurden. Bei
Einsatz der HF-Ration verringerte die PA-Gabe den molaren Anteil der Propionsäure
sowie den duodenalen Stärkefluss, während die Menge an ruminal fermentierter organischer Substanz stieg. Die PA-Supplemetierung zur HF-Ration konnte keine der
gemessenen Blutvariablen beeinflussen. Demgegenüber reduzierte die PA-Gabe zur
HC-Ration sowohl die Glukose- als auch die Riboflavinkonzentration. Unabhängig von
der Rationsgestaltung war der Einfluss von PA auf die Milchvariablen vernachlässigbar. Lediglich beim Einsatz der HF-Ration steigerte die PA-Zulage den duodenalen
PA-Fluss, wohingegen bei Fütterung der HC-Ration kein Anstieg festgestellt wurde.
7 Zusammenfassung
102
Desweiteren zeigte die PA-Supplementierung bei beiden Rationen keinen Effekt auf die
PA-Konzentrationen in Serum und Milch wie auch auf die mit der Milch täglich ausgeschiedenen PA-Mengen. Abgesehen vom gesteigerten Duodenalfluss an PA während
der HF-Fütterung zeigte sich, dass die PA-Mengen und Konzentrationen während der
Fütterung der HC-Ration vergleichsweise höher waren als während der HF-Fütterung.
Aus den vorliegenden Untersuchungen kann insgesamt geschlossen werden, dass beide
Vitamine einen eher geringen Einfluss auf die ruminal Fermentation sowie den Metabolismus der Milchkuh hatten. Basierend auf den duodenalen Flüssen von PA deckte die
PA-Supplementierung nicht den geschätzten Bedarf der Milchkuh. Eine Steigerung des
duondenalen PA-Flusses lag lediglich bei rauhfutterreicher Fütterung (HF) vor. Diese
Steigerung wirkte sich aber nicht auf die Serum- und Milch-PA-Konzentrationen aus.
Somit deuten die Ergebnisse dieser Studie darauf hin, dass die PA-Supplementierung
keinen Einfluss auf die Kuh hat. Entweder wird die PA-Zulage im Pansen abgebaut oder, sollte die PA-Gabe zwischen Maul und Duodenum absorbiert worden sein,
konnten die hier erfassten Variablen keinen Einfluss desselben belegen. Durch die Supplementierung von Folsäure waren anhand der Ergebnisse dieser Studie keine Vorteile
für die Kuh ersichtlich. Weitere Studien zur Abschätzung des Bedarfs beider Vitamine
sind erforderlich, da die Abschätzungen auf Daten laktierender Sauen basieren und
eine Überschätzung vorzuliegen scheint. Aufgrund der hohen Verlustrate von PA zwischen Maul und Duodenum wären somit Studien mit geschützter PA interessant. Zur
Überprüfung des Einflusses von FA und PA auf die Leistung von Milchkühen könnten
zudem Studien mit einer größeren Tierzahl sowie einem einheitlichem Laktationsstadium hilfreich sein.
103
8 Appendix
8
Appendix
COOH
O
5
N
N
H 2N
N
COOH
N
H
OH
10
N
H
N
p-Amino-benzoic
acid
Pteridin
Glutamic acid
Folic acid
Figure A1: Chemical structur of folic acid
10-Formyl-THF
NH3
Formiate
ATP
5,10-Methenyl-THF
5-Formimino-THF
Glutamate
Glycine
Formiminoglutamate
5,10-Methylene-THF
-
Vit B6
Serine
5-Methyl-THF
Tetrahydrofolate
SAM
Vit B12
Methionine
dTMP
NADP+
Homocysteine
d-UMP
NADPH
+ H+
FGAR
GAR
THF = Tetrahydrofolate
FAICAR
AICAR
DHF = Dihydrofolate
GAR = Glycinamide ribonucleotide
FGAR = Formylglycinamide ribonucleotide
AICAR = Aminoimidazolecarboxamide ribonucleotide
FAICAR = Formylaminoimidazolecaboxamide ribonucleotide
CO2
SAM = S-adenosylmethionine
dUMP = Deoxyuridylate
dTMP = Deoxythymidylate
Figure A2: Reactions of the coenzyme tetrahydrofolate (according to Bässler et al.
2002, modified)
104
8 Appendix
H
OH
N
O
CH3
OH
O H3C
OH
ß-Alanin
Pantoic acid
Pantothenic acid
Figure A3: Chemical structur of pantothenic acid
Table A1: Individual cows used in the folic acid experiment
Group
Control
FA
HC
Lactating Dry
Elli
Rogate
Elsa
Fichte
Emma
Urte
Wolke
HF
Lactating Dry
Inka
Lotte
Stella
Wolke
Fichte
Elschen
Paula
Emma
Elli
Elsa
Emma
Urte
Wolke
Inka
Stella
Fichte
Paula
Rogate
Fichte
Lotte
Wolke
Elschen
Emma
HC, high concentrate: 34% forage and 66% concentrate on dry matter basis; HF, high forage: 66% forage and 34% concentrate on dry
matter basis; FA, folic acid
105
8 Appendix
Table A2: Arithmetic means of nutrient composition (g/kg DM) and metabolisable energy
(MJ/kg DM) of the forage (arithmetic means
with their ranges)
Forage1
Mean
926
130
33
221
242
459
206
10.4
OM
CP
EE
CF
ADF
NDF
Starch
ME
(n = 7)
Range
921 - 931
110 - 175
30 - 38
209 - 234
232 - 250
435 - 497
121 - 383
10.3 - 10.6
OM, organic matter; CP, crude protein; EE, ether extract; CF, crude fibre; ADF, acid detergent fibre; NDF,
neutral detergent fibre; ME, metabolisable energy
1
Forage consists of 60% maize silage and 40% grass
silage on dry matter basis
Table A3: Individual cows used in the pantothenic acid
experiment
Group
Control
PA
HC
Lactating Dry
Elli
Rogate
Elsa
Fichte
Emma
Urte
Wolke
Ambra
HF
Lactating Dry
Inka
Lotte
Stella
Wolke
Fichte
Elschen
Paula
Emma
Reike
Elli
Elsa
Emma
Urte
Wolke
Ambra
Inka
Stella
Fichte
Paula
Reike
Rogate
Fichte
Lotte
Wolke
Elschen
Emma
HC, high concentrate: 34% forage and 66% concentrate on dry matter basis; HF, high forage: 66% forage and 34% concentrate on dry
matter basis; PA, pantothenic acid
9 References
9
106
References
Agrawala, I. P.; Huffman, C. F.; Luecke, R. W.; Duncan, C. W. (1953): A
quantitative study of rumen synthesis in the bovine on natural and purified rations.
3. Riboflavin, pantothenic acid and niacin. Journal of Nutrition 49, 631 – 638
Albers, N.; Gotterbarm, G.; Heimbeck, W.; Keller, T.; Seehawer, J.; Tran,
T. D. (2002): Vitamins in animal Nutrition, Arbeitsgemeinschaft für Wirkstoffe in
der Tierernährung. Bonn: Agrimedia
Anonymous (1992): Interspecies differences in folate metabolsim. Nutrition Reviews
50, 116 – 118
Anonymous (1996): Novus Raw Material Compendium. 2nd edn. Brussels: Novus
International
Anonymous (2005): Anlage 3 Zusatzstoffliste. Verordnung (EG) Nr. 1831/2003 des
Europäischen Parlaments und des Rates vom 22. September 2003 über Zusatzstoffe
zur Verwendung in der Tierernährung. Amtblatt der Europäischen Union L 268/29,
2005
Ayers, W. A. (1958): Nutrition and physiology of Ruminococcus flavefaciens. Journal
of Bacteriology 76, 504 – 509
Bailey, L. B.; Gregory, J. F. (1999): Folate metabolism and requirements. Journal
of Nutrition 129, 779 – 782
Ball, G. F. M. (2006): Pantothenic acid. In: Ball, G. F. M. (Ed.): Vitamins in
Foods: Analysis, Bioavailability and Stability. Boca Raton, FL: CRC Press, 211 –
219
Barth, K. M.; Anderson, G. C.; McLaren, G. A.; Welch, J. A. (1960): Urea
nitrogen utilization in lambs as influenced by folic acid and vitamin B12 . Proceedings
of the West Virginia Academy of Science 32, 134
Bässler, K. H. (1997): Enzymatic effects of folic acid and vitamin B12 . International
Journal of Vitamin and Nutrition Research 67, 385 – 388
107
9 References
Bässler, K. H.; Golly, I.; Loew, D.; Pietrzik, K. (2002): Vitamin-Lexikon für
Ärzte, Apotheker und Ernährungswissenschaftler. 3rd edn. München and Jena:
Urban and Fischer
Bechdel, S. I.; Honeywell, H. E.; Dutcher, R. A.; Knutsen, M. H. (1928):
Synthesis of vitamin B in the rumen of the cow. Journal of Biological Chemistry
80, 231 – 238
Bender, D. A. (1992): Folic acid and other pterins and vitamin B12 . In: Bender,
D. A. (Ed.): Nutritional Biochemistry of the Vitamins. Cambridge: Cambridge
University Press, 269 – 317
Benevenga, N. J. (2004): The Encyclopedia of Farm Animal Nutrition. Wallingford,
Oxon: CABI Publishing
Berg, H. van d. (1993): General aspects of bioavailability of vitamins. In: Schlemmer, U. (Ed.): Proceedings Bioavailability 93; Nutritional, Chemical and Food Processing Implications of Nutrient Availability. Karlsruhe: Bundesforschungsanstalt
für Ernährung, 267 – 278
Biesalski, H. K. (1997): Vitamine Bausteine des Lebens. München: H.C. Beck’sche
Verlagsbuchhandlung
Bills, N. D.; Koury, M. J.; Clifford, A. J.; Dessypris, E. N. (1992): Ineffective
hematopoiesis in folate-deficient mice. Blood 79, 2273 – 2280
Bonomi, A. (2000): Dairy cattle ration integration with rumen-protected pantothenic
acid. Effects on milk production and reproductive efficiency. Rivista di Scienza
dell’Alimentazione 29, 321 – 338
Brandt, M.; Rohr, K. (1981): Beiträge zur Quantifizierung der N-Umsetzung in
den Vormägen von Milchkühen. 1. Bestimmung des Mikrobenstickstoffs im Duodenalchymus mit Hilfe von
15
N. Zeitschrift für Tierphysiologie, Tierernährung und
Futtermittelkunde 46, 39 – 59
Brüsemeister, F.; Südekum, K. H. (2006): Rumen-protected choline for dairy cows:
the in situ evaluation of a commercial source and literature evaluation of effects on
108
9 References
performance and interactions between methionine and choline metabolism. Animal
Research 55, 93 – 104
Bryant, M. P.; Robinson, I. M. (1961): Some nutritional requirements of genus
Ruminococcus. Journal of Applied Microbiology 9, 91 – 95
Chiquette, J.; Girard, C. L.; Matte, J. J. (1993): Effect of diet and folic acid
addition on digestibility and ruminal fermentation in growing steers. Journal of
Animal Science 71, 2793 – 2798
Choi, S. W.; Mason, J. B. (2000): Folate and carcinogenesis: an integrated scheme.
Journal of Nutrition 130, 129 – 132
Difco (1998a): Bacto folic acid assay medium. In: Difco Laboratories (Ed.):
Difco manual. Sparks, Maryland: Division of Becton Dickinson and Company, 200
– 201
Difco (1998b): Bacto pantothenate assay medium. In: Difco Laboratories (Ed.):
Difco manual. Sparks, Maryland: Division of Becton Dickinson and Company, 378
– 379
DIN 38406-E5-2 (1998): Deutsche Einheitsverfahren zur Wasser-, Abwasser- und
Schlammuntersuchung. 40. Lieferung. Wien: Weinheim und Beuth Verlag
Dubeski, P.; Owens, F. (1993): Plasma levels of water soluble vitamins in various
classes of cattle. In: Bender, D. A. (Ed.): Animal Science Research Report,
Oklahoma State University, 249 – 255
Eugène, M.; Archimède, H.; Sauvant, D. (2004):
Quantitative meta-analysis
on the effects of defaunation of the rumen on growth, intake and digestion in
ruminants. Livestock Production Science 85, 81 – 97
Fenstermacher, D. K.; Rose, R. C. (1986): Absorption of pantothenic acid in rat
and chick intestine. American Journal of Physiology 250, G155 – G160
Finglas, P. M.; Wright, A. J. A.; A., Wolfe C.; J., Hart D.; Wright, D. M.;
Dainty, J. R. (2003): Is there more to folates than neural-tube defects? Proceedings of the Nutrition Society 62, 591 – 598
109
9 References
Finlayson, H. J.; Seeley, R. C. (1983): The synthesis and absorption of pantothenic
acid in the gastrointestinaltract of the adult sheep. Journal of the Science of Food
and Agriculture 34, 427 – 432
Flachowsky, G.; Lebzien, P.; Meyer, U. (2002):
Vorteile und Grenzen hoher
Milchleistungen aus der Sicht der Tierernährung. Züchtungskunde 74, 85 – 103
Flachowsky, G.; Lebzien, P.; Meyer, U. (2004): Contribution to the energetic
feed evaluation for high performing dairy cows. Übersichten zur Tierernährung 32,
23 – 56
Ford, J. E.; Perry, K. D.; Briggs, C. A. E. (1958): Nutrition of lactic acid bacteria
isolated from the rumen. Journal of General Microbiology 18, 273 – 284
Fox, H. M.; Linkswiler, H. E. L. L. (1961): Pantothenic acid excretion on three
levels of intake. Journal of Nutrition 75, 451 – 454
Fox, H. M.; Chen, C. S. L.; Lee, S. (1964): Response to alterations in pantothenic
acid content of diet. Federation Proceedings 23, 243
Geissler, C.; Hoffmann, M.; Hickel, B. (1976): Gas chromatographic estimation
of volatile fatty acids. Archives of Animal Nutrition 26, 123 – 129
Gesellschaft für Ernährungsphysiologie (1991): Leitlinien für die Bestimmung der Verdaulichkeit von Rohnährstoffen an Wiederkäuern. Journal of Animal
Physiology and Animal Nutrition 65, 229 – 234
Gesellschaft für Ernährungsphysiologie (2001):
sorgung mit Vitaminen.
In:
Empfehlungen zur Ver-
Aussschuß für Bedarfsnormen der
Gesellschaft für Ernährungsphysiologie (Ed.):
Empfehlungen zur
Energie- und Nährstoffversorgung der Milchkühe und Aufzuchtrinder.
Frank-
furt/Main: DLG Verlag, 105 – 127
Girard, C. L.; Matte, J. J.; Tremblay, G. F. (1989): Serum folates in gestating
and lactating dairy cows. Journal of Dairy Science 72, 3240 – 3246
110
9 References
Girard, C. L.; Matte, J. J.; Levesque, J. (1992): Responses of serum folates of
preruminant and ruminant calves to a dietary supplement of folic acid. Journal of
Animal Science 70, 2847 – 2851
Girard, C. L.; Chiquette, J.; Matte, J. J. (1994): Concentrations of folates in
ruminal content of steers - responses to a dietary supplement of folic acid in relation
with the nature of the diet. Journal of Animal Science 72, 1023 – 1028
Girard, C. L.; Matte, J. J. (1995):
Serum clearance and urinary excretion of
pteroylmonoglutamic acid in gestating and lactating dairy cows. British Journal
of Nutrition 74, 857 – 865
Girard, C. L.; Matte, J. J.; Tremblay, G. F. (1995): Gestation and lactation of
dairy cows - a role for folic acid. Journal of Dairy Science 78, 404 – 411
Girard, C. L. (1998): B-complex vitamins for dairy cows: a new approach. Canadian
Journal of Animal Science 78, 71 – 90
Girard, C. L.; Matte, J. J. (1998): Dietary supplements of folic acid during lactation:
effects on the performance of dairy cows. Journal of Dairy Science 81, 1412 – 1419
Girard, C. L.; Matte, J. J. (1999): Changes in serum concentrations of folates,
pyridoxal, pyridoxal-5-phosphate and vitamin B12 during lactation of dairy cows
fed dietary supplements of folic acid. Canadian Journal of Animal Science 79, 107
– 113
Girard, C. L.; Lapierre, H.; Desrochers, A.; Benchaar, C.; Matte, J. J.; Remond, D. (2001): Net flux of folates and vitamin B12 through the gastrointestinal
tract and the liver of lactating dairy cows. British Journal of Nutrition 86, 707 –
715
Girard, C. L.; Remond, D. (2003): Net flux of folates and vitamin B12 through the
gastrointestinal tract of sheep. Canadian Journal of Animal Science 83, 273 – 278
Girard, C. L.; Lapierre, H.; Matte, J. J.; Lobley, G. E. (2005):
Effects of
dietary supplements of folic acid and rumen-protected methionine on lactational
111
9 References
performance and folate metabolism of dairy cows. Journal of Dairy Science 88,
660 – 670
Girard, C. L.; Matte, J. J. (2006): Impact of B-vitamin supply on major metabolic
pathways of lactating dairy cows. Canadian Journal of Animal Science 86, 213 –
220
Graulet, B.; Matte, J.; Desrochers, A.; Doepel, L.; Palin, M.; Girard, C.
(2007): Effects of dietary supplements of folic acid and vitamin B12 on metabolism
of dairy cows in early lactation. Journal of Dairy Science 90, 3442 – 3455
Gregory, M. E.; Ford, J. E.; Kon, S. K. (1958): The B vitamin content of milk in
relation to breed of cow and stage of lactation. Journal of Dairy Research 25, 447
– 456
Gregory, J. I. (1989): Chemical and nutritional aspects of folate research: analytical
procedures, methods of folate synthesis, stability, and bioavailability of dietary
folates. Advances in Food and Nutrition Research 33, 1 – 101
Hall, G.; Cheng, E. W.; Burroughs, W. (1955): B-vitamins stimulatory to cellulose digestion by washed suspensions of rumen microorganisms. Proceedings of the
Iowa Academy of Science 62, 273 – 278
Hayes, B. W.; Mitchell, G. E.; Little, C. O.; Bradley, N. W. (1966): Concentrations of B-vitamins in ruminal fluid of steers fed different levels and physical
forms of hay and grain. Journal of Animal Science 25, 539 – 542
Hayes, B. W.; Mitchell, G. E.; Little, C. O. (1967):
Factors affecting con-
centrations of B-vitamins in ruminal fluid in vitro. Internationale Zeitschrift für
Vitaminforschung 37, 348 – 353
Helfferich, B.; Gütte, J. O. (1972): Tierernährung in Stichworten. Kiel: Verlag
Ferdinant Hirt
Hollis, L.; Chappel, C.; Macvicar, R.; Whitehair, C. (1954): Effect of ration
on vitamin synthesis in rumen of sheep. Journal of Animal Science 13, 732 – 738
9 References
112
Holmes, A.; Jones, C.; Wertz, A. W.; Esselen, K.; McKey, B. V. (1944): The
ratio of ascorbic, nicotinic, and pantothenic acids, riboflavin and thiamin in late
summer milk. Journal of Dairy Science 27, 849 – 855
Huan, P. H.; Hung, L. V. (1972): Use of double Thiry-Vella loop in study of effects of
pantothenic acid on intestinal absorption of glucose. British Journal of Nutrition
28, 405 – 408
Hungate, R. E. (1966): Variations in the rumen. In: Hungate, R. E. (Ed.): The
Rumen and its Microbes. New York: Academic Press Inc., 376 – 418
Ishiguro, K. (1962): Blood pantothenic acid content of pregnant women. Tohoku
Journal of Experimental Medicine 78, 7 – 10
James, S. J.; Yin, L.; Swendseid, M. E. (1989): DNA strand break accumulation,
thymidylate synthesis and NAD levels in lymphocytes from methyl donor-deficient
rats. Journal of Nutrition 119, 661 – 664
James, S. J.; Miller, B. J.; McGarrity, L. J.; Morris, S. M. (1994): The effect of
folic acid and/or methionine deficiency on deoxyribonucleotide pools and cell-cycle
distribution in mitogen-stimulated rat lymphocytes. Cell Proliferation 27, 395 –
406
Kirchgessner, M.; Friesecke, H.; Koch, G. (1965): Fütterung und Milchzusammensetzung. München: Bayrischer Landwirtschaftsverlag
Kirchgessner, M.; Paulicks, B. R.; Kreuzer, M.; Roth-Maier, D. A. (1991a):
Überhöhte Energie- oder Proteinversorgung von Milchkühen und die Ausscheidung
verschiedener B-Vitamine (Thiamin, Vitamin B12 , Pantothensäure) mit der Milch.
Journal of Animal Physiology and Animal Nutrition 65, 219 – 226
Kirchgessner, M.; Paulicks, B. R.; Roth-Maier, D. A. (1991b): Zur Konzentration und Ausscheidung verschiedener B-Vitamine (Thiamin, Vitamin B6 und
Pantothensäure) in der Kuhmilch bei Applikation von bovinem Wachstumshormon
(bGH). Journal of Animal Physiology and Animal Nutrition 65, 267 – 272
9 References
113
Kirksey, A. (1986): Effects of vitamin supplementation on vitamin levels in human
milk: vitamin B6 , vitamin C and folacin. Human lactation. 2. Maternal and environmental factors. In: Hamosh, M. (Ed.); Goldman, A. (Ed.): Proceedings of an
International Workshop on Maternal Environmental Factors in Human Lactation,
Plenum, 339 – 348
Kon, S. K.; Porter, J. W. G. (1954): The intestinal synthesis of vitamins in the
ruminant. Vitamins and Hormones – Advances in Research and Applications 12,
53 – 68
Lardinois, C. C.; Mills, R. C.; Elvehjem, C. A.; Hart, E. B. (1944): Rumen
synthesis of the vitamin B complex as influenced by ration composition. Journal
of Dairy Science 27, 579 – 583
Lawrence, J. M.; Herrington, B.; Maynard, L. (1946): The nicotinic acid, biotin,
and pantothenic acid content of cows’ milk. Journal of Nutrition 32, 73 – 91
Lebzien, P.; Paul, C. (1997): Use of near-infrared reflectance spectroscopy for the
estimation of the microbial portion of non-ammonia-nitrogen in the duodenum of
dairy cows. Animal Feed Science and Technology 68, 225 – 233
Lebzien, P.; Voigt, J. (1999): Calculation of utilizable crude protein at the duodenum
of cattle by two different approaches. Archives of Animal Nutrition 52, 363 – 369
LfL (2004): Gruber Tabelle zur Fütterung der Milchkühe, Zuchtrinder, Mastrinder,
Schafe, Ziegen. Freising: Bayerische Landesanstalt für Landwirtschaft
Lucock, M. (2000): Folic acid: nutritional biochemistry, molecular biology, and role
in disease processes. Molecular Genetics and Metabolism 71, 121 – 138
Majee, D. N.; Schwab, E. C.; Bertics, S. J.; Seymour, W. M.; Shaver, R. D.
(2003): Lactation performance by dairy cows fed supplemental biotin and a Bvitamin blend. Journal of Dairy Science 86, 2106 – 2112
Mao, G. Y.; Hong, X. M.; Xing, H. X. (2008): Efficacy of folic acid and enalapril
combined therapy on reduction of blood pressure and plasma glucose: a multicenter,
114
9 References
randomized, double-blind, parallel-controlled, clinical trial. Nutrition 24, 1088 –
1096
Marsh, D. C.; Pearson, P. B.; Rupel, I. W. (1947): The effect of feeding certain
synthetic vitamins of the B-complex on their content in milk and urine. Journal of
Dairy Science 30, 867 – 875
McElroy, L.; Goss, H. A. R. O. (1941): A quantitative study of vitamins in the rumen content of sheep and cows fed vitamin-low diets. IV. Pantothenic acid. Journal
of Nutrition 21, 405 – 409
McLaren, G. A.; Anderson, G. C.; Barth, K. M. (1965): Influence of folic acid
vitamin B12 and creatine on nitrogen utilization by lambs fed high levels of nonprotein nitrogen. Journal of Animal Science 24, 329 – 332
McNulty, H.; McPartlin, J. M.; Weir, D. G.; Scott, J. M. (1993):
Folate
catabolism is increased during pregnancy in rats. Journal of Nutrition 123, 1089 –
1093
Michal, G. (1999): Biochemical pathways: An atlas of biochemistry and molecular
biology. Heidelberg: Spektrum Akademischer Verlag
Mitchell, H. K.; Snell, E. E.; Williams, R. J. (1944): Folic acid. I. Concentration
from spinach. Journal of the American Chemical Society 66, 267 – 268
Miyazaki, K.; Hino, T.; Itabashi, H. (1992): Effects of extracellular pH on the intracellular pH and membrane-potential of cellulolytic ruminal bacteria, Ruminococcus
albus, Ruminococcus flavefaciens, and Fibrobacter succinogenes. Journal of General
and Applied Microbiology 38, 567 – 573
National Research Council (1998): Composition of feed ingredients. In: Nutrient
Requirements of Swine. 10th revised edn., Washington, DC: National Academy of
Sciences, 130 – 131
National Research Council (2001):
Vitamins. In: Nutrient Requirements of
Dairy Cattle. 7th revised edn., Washington DC: National Academy Press, 162 –
177
115
9 References
Pearson, P.; Darnell, A. (1946):
The thiamine, riboflavin, nicotinic acid and
pantothenic acid content of colostrum and milk of the cow and ewe. Journal of
Nutrition 31, 51 – 57
Perry, T. W.; Hillier, R. J. (1969): Effect of supplementing predominantly roughage
rations with oats grass, trace minerals, or B-vitamins on nutrient utilization. Journal of Dairy Science 52, 1786 – 1791
Pietrzik, K.; Hesse, C.; Schulzezurwiesch, E.; Hötzel, D. (1975): Pantothenic
acid excretion in urine as quantitative reference for required levels. International
Journal for Vitamin and Nutrition Research 45, 153 – 162
Pietrzik, K.; Golly, I.; Loew, D. (2008): Pantothensäure. In: Pietrzik, K. (Ed.);
Golly, I. (Ed.); Loew, D. (Ed.): Handbuch Vitamine - Für Prophylaxe, Beratung
und Therapie. München: Elsevier, 165 – 174
Porter, J. W. G. (1961): Vitamin synthesis in the rumen. In: Lewis, D. (Ed.):
Digestive physiology and nutrition of the ruminant. London: Butterworths, 226 –
233
Prasad, P. D.; Wang, H. P.; Huang, W.; Fei, Y. J.; Leibach, F. H.; Devoe,
L. D.; Ganapathy, V. (1999): Molecular and functional characterization of the
intestinal Na+ -dependent multivitamin transporter. Archives of Biochemistry and
Biophysics 366, 95 – 106
Prusiewicz-Witaszek, U.; Maciejewska, M. (1994): Effect of various amounts of
folic acid added to rat food on food intake and some parameters of carbohydrate
metabolism. Archivum Veterinarium Polonicum 34, 261 – 266
Ragaller, V.; Hüther, L.; Lebzien, P. (2009): Folic acid in ruminant nutrition: a
review. British Journal of Nutrition 101, 153 – 164
Ray, S. N.; Weir, W. C.; Pope, A. L.; Phillips, P. H. (1947):
Studies on the
concentration of some B vitamins in the blood of normal and cobalt deficient sheep.
Journal of Nutrition 34, 595 – 599
9 References
116
Riemeier, A. (2004): Einfluß der ruminalen Stickstoffbilanz (RNB) auf die Pansenfermentation, mikrobielle Proteinsynthese, Menge des am Dünndarm anflutenden nutzbaren Proteins (nXP) sowie die Stickstoffausscheidung, Tierärztlichen
Hochschule Hannover, Diss. med. vet.
Rohr, K.; Brandt, M.; Lebzien, P.; Schafft, H. (1984): Measurement of duodenal flow in dairy cows by either total collection or spot sampling, using a special
cannula. Canadian Journal of Animal Science 64, 116 – 117
Roth-Maier, D. A.; Kirchgessner, M. (1973): Untersuchungen zum Pantothensäurebedarf von Mastkälbern. Zeitschrift für Tierphysiologie, Tierernährung und
Futtermittelkunde 31, 293 – 297
Roth-Maier, D. A.; Kirchgessner, M. (1979): Pantothenic acid supply of market
pigs and broilers by practical rations. Zeitschrift für Tierphysiologie, Tierernährung
und Futtermittelkunde 41, 275 – 279
Roth-Maier, D. A.; Wauer, A.; Stangl, G. I.; Kirchgessner, M. (2000): Precaecal digestibility of niacin and pantothenic acid from different foods. International
Journal for Vitamin and Nutrition Research 70, 8 – 13
Rérat, A.; Molle, J.; Bars, H. le (1958): Mise en évidence chez le Mouton de
la perméabilité du rumen aux vitamines B et conditions de leur absorption à ce
niveau. Comptes Rendus Hebdomadaires des Seances de l’Academie des Sciences
246, 2051 – 2054
Sacadura, F. C.; Robinson, P. H.; Evans, E.; Lordelo, M. (2008): Effect of
a ruminally protected B-vitamin supplement on milk yield and composition of
lactating dairy cows. Animal Feed Science and Technology 144, 111 – 124
Santra, A.; Karim, S. A.; Chaturvedi, O. H. (2007): Rumen enzyme profile and
fermentation characteristics in sheep as affected by treatment with sodium lauryl
sulfate as defaunating agent and presence of ciliate protozoa. Small Ruminant
Research 67, 126 – 137
9 References
117
Santschi, D. E.; Berthiaume, R.; Matte, J. J.; Mustafa, A. F.; Girard, C. L.
(2005a): Fate of supplementary B-vitamins in the gastrointestinal tract of dairy
cows. Journal of Dairy Science 88, 2043 – 2054
Santschi, D. E.; Chiquette, J.; Berthiaume, R.; Martineau, R.; Matte, J. J.;
Mustafa, A. F.; Girard, C. L. (2005b): Effects of the forage to concentrate ratio
on B-vitamin concentrations in different ruminal fractions of dairy cows. Canadian
Journal of Animal Science 85, 389 – 399
Schafft, H. (1983): Untersuchungen zur Quantifizierung des Abbaus von Futterprotein in den Vormägen von Milchkühen, Universität Göttingen, Diss. agr.
Schwab, E. C.; Schwab, C. G.; Shaver, R. D.; Girard, C. L.; Putnam, D. E.;
Whitehouse, N. L. (2006): Dietary forage and nonfiber carbohydrate contents
influence B-vitamin intake, duodenal flow, and apparent ruminal synthesis in lactating dairy cows. Journal of Dairy Science 89, 174 – 187
Schweigert, F. J. (2000): Vitamine. In: Engelhardt, W. v. (Ed.); Breves, G.
(Ed.): Physiologie der Haustiere. Stuttgart: Enke im Hippokrates Verlag, 594 –
605
Scott, H. W.; Dehority, B. A. (1965): Vitamin requirements of several cellulolytic
rumen bacteria. Journal of Bacteriology 89, 1169 – 1175
Scott, J. M.; Weir, D. G. (1976): Folate composition, synthesis and function in
natural materials. Clinics in Haematology 5, 547 – 568
Scott, J. M. (1999): Folate and vitamin B12 . Proceedings of the Nutrition Society 58,
441 – 448
Selhub, J.; Dhar, G. J.; Rosenberg, I. H. (1983): Gastrointestinal absorption of
folates and antifolates. Pharmacology and Therapeutics 20, 397 – 418
Seyoum, E.; Selhub, J. (1998): Properties of food folates determined by stability
and susceptibility to intestinal pteroylpolyglutamate hydrolase action. Journal of
Nutrition 128, 1956 – 1960
118
9 References
Shigeta, Y.; Shichiri, M. (1966): Urinary excretion of pantothenic acid and pantethine in human subjects. Journal of Vitaminology 12, 186 – 191
Slyter, L. L.; Weaver, J. M. (1977): Tetrahydrofolate and other growth requirements of certain strains of Ruminococcus flavefaciens. Applied and Environmental
Microbiology 33, 363 – 369
Soest, P. J. van; Robertson, J. B.; Lewis, B. A. (1991):
Methods for dietary
fiber, neutral detergent fiber, and nonstarch polysaccharides in relation to animal
nutrition. Journal of Dairy Science 74 (10), 3583 – 3597
Solini, A.; Santini, E.; Ferrannini, E. (2006):
Effect of short-term folic acid
supplementation on insulin sensitivity and inflammatory markers in overweight
subjects. International Journal of Obesity 30, 1197 – 1202
Song, W. O.; Chan, G. M.; Wyse, B. W.; Hansen, R. G. (1984): Effect of pantothenic acid status on the content of the vitamin in human milk. American Journal
of Clinical Nutrition 40, 317 – 324
Song, W. O.; Wyse, B. W.; Hansen, R. G. (1985):
Pantothenic acid status of
pregnant and lactating women. Journal of the American Dietetic Association 85,
192 – 198
Souci, S.; Fachmann, W.; Kraut, H. (2000):
Food Composition and Nutrition
Tables. 6th. edn. Stuttgart: Medpharm Scientific Publishers
Srinivasan, V.; Belavady, B. (1976): Alterations in gluconeogenesis in experimental
pantothenic acid deficiency. Indian Journal of Biochemistry and Biophysics 13, 387
– 389
Stangassinger, M. (2000): Stoffwechselregulation. In: Engelhardt, W. v. (Ed.);
Breves, G. (Ed.): Physiologie der Haustiere. Stuttgart: Enke im Hippokrates
Verlag, 453 – 466
Stein, E. D.; Diamond, J. M. (1989): Do dietary levels of pantothenic acid regulate
its intestinal uptake in mice. Journal of Nutrition 119, 1973 – 1983
119
9 References
Teeri, A. E.; Josselyn, D.; Colovos, N. F.; Keener, H. A. (1951): Effects of
method of preservation of roughage and of cane or wood molasses on vitamin
excretion by cows. Journal of Dairy Science 34, 299 – 302
Universität Hohenheim - Dokumentationsstelle (Ed.) (1997): DLG Futterwerttabellen Wiederkäuer. 7 edn. Frankfurt/Main: DLG-Verlag
Verband
Deutscher
Landwirtschaftlicher
Untersuchungs-
Forschungsanstalten (VDLUFA) (Ed.) (1993):
und
Handbuch der Land-
wirtschaftlichen Versuchs- und Untersuchungsmethodik (VDLUFA-Methodenbuch),
Bd. III Die chemische Untersuchung von Futtermitteln. Darmstadt: VDLUFAVerlag
Voelkel, A. (1956): Über die Wirkung von insulinsynergistischen Substanzen und
von Pantothensäure im Insulinschock. Naturwissenschaften 43, 208
Völker, D. (2008): Einfluss von zugelegten B-Vitaminen in Kombination mit unterschiedlichen Grundfutter-/Konzentratverhältnissen auf die Fermentation und
die Vitaminkonzentration in der Pansensimulation Rusitec, Universität Göttingen,
Diss. agr.
Wagner, C. (1984): Folic acid. In: Olson, R. E. (Ed.); Broquist, H. P. (Ed.);
Chichester, C. O. (Ed.); Darby, W. J. (Ed.); Kolbye, A. C. (Ed.); Stalvey,
R. M. (Ed.): Present Knowledge in Nutrition, The Nutrition Foundation, Inc., 332
– 346
Weiss, W.; Ferreira, G. (2006): Water soluble vitamins for dairy cattle. In: Proceedings of the 2006 Tri-State Dairy Nutrition Conference, 51 – 63
Wigertz, K.; Jägerstad, M. (1995):
Comparison of a HPLC and radioprotein-
binding assay for the determination of folates in milk and blood samples. Food
Chemistry 54, 429 – 436
Williams, R. J.; Lyman, C. M.; Goodyear, G. H.; Truesdail, J. H.; Holaday, D.
(1933): ”Pantothenic acid”, a growth determinant of universal biological occurrence.
Journal of the American Chemical Society 55, 2912 – 2927
9 References
120
Williams, C. H.; David, D. J.; Iismaa, O. (1962): The determination of chomic oxide
in faeces samples by atomic absorbtion spectrophotometry. Journal of Agricultural
Science 59, 381 – 385
Wittwer, C. T.; Beck, S.; Peterson, M.; Davidson, R.; Wilson, D. E.; Hansen,
R. G. (1990): Mild pantothenate deficiency in rats elevates serum triglyceride and
free fatty acid levels. Journal of Nutrition 120, 719 – 725
Wolin, M. J.; Miller, T. L. (1988): Microbe-microbe interactions. In: Hobson,
P. N. (Ed.): The Rumen Microbial Ecosystem. London and New York: Elsevier
Applied Science, 343 – 359
Wright, L. D. (1942): The effect of glucose administration on the level of blood
pantothenic acid. Journal of Biological Chemistry 142, 445 – 446
Wright, A. J. A.; Dainty, J. R.; Finglas, P. M. (2007): Folic acid metabolism in
human subjects revisited: potential implications for proposed mandatory folic acid
fortification in the UK. British Journal of Nutrition 98, 667 – 675
Zettner, A.; Boss, G. R.; Seegmiller, J. E. (1981): A long-term study of the
absorption of large oral doses of folic acid. Annals of Clinical and Laboratory
Science 11, 516 – 524
Zinn, R. A.; Owens, F. N.; L., Stuart R.; Dunbar, J. R.; Norman, B. B. (1987):
B-vitamin supplementation of diets for feedlot calves. Journal of Animal Science
65, 267 – 277
DANKSAGUNG
121
Danksagung
Hiermit möchte ich mich bei allen bedanken, die mir in vielfältiger Weise sowohl bei
der Durchführung der Versuche sowie dem Erstellen dieser Arbeit geholfen haben.
Ganz herzlich danke ich Herrn Prof. Dr. K.-H. Südekum für die hervorragende Betreuung, die angenehme und wertvolle wissenschaftliche Begleitung sowie das entgegengebrachte Vertrauen.
Herrn Prof. Dr. G. Flachowsky danke ich für die Möglichkeit, meine Arbeit am Institut
für Tierernährung des Friedrich-Loeffler-Institutes durchführen zu können sowie für die
jederzeit gewährte Unterstützung.
Besonderer Dank gilt Herrn Dr. P. Lebzien für die stetige Hilfe, die geduldige Beantwortung aller Fragen sowie die sehr interessanten und anregenden Diskussionen durch
die ich sehr viel gelernt habe.
Frau Prof. Dr. Dr. H. Sauerwein danke ich für die Übernahme des Zweitgutachtens.
Ich danke Frau Dr. L. Hüther für die wertvolle Unterstützung.
Gedankt sei auch der Deutschen Forschungsgemeinschaft (DFG-Projekt FL 190/6 - 1)
für die finanzielle Unterstützung dieser Arbeit.
Weiterhin bedanke ich mich bei allen Mitarbeitern, Doktoranden und Diplomanden des
Instituts für Tierernährung des FLI für die stetige Hilfsbereitschaft und tatkräftige Unterstützung während der Probennahmen sowie -aufbereitung und -analysen. Besonders
erwähnen möchte ich hier all diejenigen, die Nachtschichten übernommen haben.
Besonders danke ich meiner Mitdoktorandin Inka Niehoff, die mir immer mit fachlicher
Hilfe und freundschaftlicher Unterstützung, besonders bei der statistischen Auswertung
zur Seite stand. Ebenso bedanke ich mich herzlichst bei Wiebke Bigalke deren stetiger
Einsatz die Vitaminanalyse in meinen Serumproben ermöglichte. Dirk Rohweder danke
ich für alle Rettungen wenn ich mal wieder auf Kriegsfuß mit meinem PC stand. Bei
allen Doktoranden und Diplomanden möchte ich mich für die schöne Zeit im Institut
bedanken.
DANKSAGUNG
122
Von Herzen danke ich meinen Eltern und Geschwistern deren liebevolle Unterstützung
mir die nötige Zuversicht und Kraft gab. Besonders meinem Bruder Max danke ich für
seine unermüdliche Hilfe bei den Korrekturen.
Meinem Freund Christof Ebbeskotte gilt der größte Dank! Während der gesamten
Zeit hat er mich durch seine Liebe und den Glauben an mich auf dem richtigen Weg
gehalten, auch wenn dieser im Dunkeln lag – ihm sei diese Arbeit gewidmet.


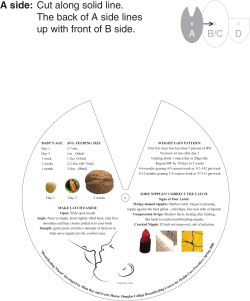


![” ⊙ Prohibited Substances [1] Anabolic-Androgenic Steroids](http://cdn1.abcdocz.com/store/data/000006330_2-6488874179c020189ebf4ca4aba01440-250x500.png)
© Copyright 2026