
fruit consumption in relation to health and nutritional status of
FRUIT CONSUMPTION IN RELATION TO HEALTH AND NUTRITIONAL STATUS OF CHILDREN BELOW 5 YEARS AND THEIR MOTHERS/CAREGIVERS IN FARMING HOUSEHOLDS OF WESTERN KENYA MARYAM IMBUMI FRUIT CONSUMPTION IN RELATION TO HEALTH AND NUTRITIONAL STATUS OF CHILDREN BELOW 5 YEARS AND THEIR MOTHERS/CAREGIVERS IN FARMING HOUSEHOLDS OF WESTERN KENYA by Maryam Imbumi (BSc Biology, BSc Honours Nutrition) Dissertation submitted in fulfillment of the requirements for the M Nutrition in the Faculty of Health Sciences, Department of Nutrition and Dietetics, University of the Free State SUPERVISOR: PROF CM WALSH CO-SUPERVISOR: DR. KATJA KEHLENBECK 2014 BLOEMFONTEIN DECLARATION OF INDEPENDENT WORK DECLARATION WITH REGARD TO INDEPENDENT WORK I, Maryam Imbumi, identity number A1234412 and student number 2011159163, do hereby declare that this research project, submitted to the University of the Free State for the degree M Nutrition: “Fruit consumption in relation to health and nutritional status of children below 5 years and their mothers/caregivers in farming households of western Kenya”, is my own independent work, and has not been submitted before to any institution by myself or any other person in fulfillment of the requirements for the attainment of any qualification. I further cede copyright of this research in favour of the University of the Free State. SIGNATURE OF STUDENT DATE 9th December 2014 ACKNOWLEDGEMENTS This study would not have been possible without the support of the following persons: First and foremost, my supervisor, Prof CM Walsh, for her continuous advice, assistance, and encouragement; My co-supervisor, Dr. K Kehlenbeck for developing the whole idea, design and field work for the study; Me Nel of the Department of Biostatistics, University of the Free State, for the valuable input regarding the statistical analysis of the data; The World Agroforestry Centre (ICRAF) for the financial support through the project “Agriculture for Nutrition and Health” in the execution of the study; The respondents for taking part in the study; My family and friends for their prayers and moral support, especially Rev. J. Maina, my dad W. Imbumi and my Mum L. Imbumi and my niece J. Ombonya who always believed in me; My Heavenly Father, The Almighty God, without His love this study would not have been possible. i TABLE OF CONTENTS ACKNOWLEDGEMENTS LIST OF ABBREVIATIONS LIST OF TABLES LIST OF FIGURES LIST OF APPENDICES SUMMARY OPSOMMING PAGES I VI VIII XIII XIV XV XIX CHAPTER 1 1 INTRODUCTION 1.1. PROBLEM IDENTIFICATION 1.1.1 Undernutrition in Kenya 1.1.2 Disease burden in Kenya 1.1.3 Socio-demographic and agricultural situation in Kenya 1.1.4 Food security in Kenya 1.1.5 Micronutrient deficiencies 1.1.6 Importance of fruit in the diet 1 1 2 3 3 5 6 7 1.2 RATIONALE AND MOTIVATION 1.2.1 Aim 1.2.2 Objectives 9 10 10 1.3 11 STRUCTURE OF THE DISSERTATION CHAPTER 2 12 LITERATURE REVIEW 2.1 INTRODUCTION 12 12 2.2. FRUIT CONSUMPTION 2.2.1 Barriers to fruit consumption 2.2.2 Recommendations for fruit consumption 2.2.3 Fruit consumption in Kenya 2.2.4 Importance of fruit consumption 2.2.4.1 Impact of socio-eeconomic factors on fruit consumption 2.2.4.2 Importance of fruit consumption on food security and dietary diversity 2.2.4.3 Importance of fruit consumption for promoting health and combatting disease 2.2.4.4 Benefits of fruit consumption on growth and weight status 14 14 15 17 18 18 19 22 26 ii CHAPTER 3 28 METHODOLOGY 3.1 INTRODUCTION 28 28 3.2 STUDY DESIGN 3.2.1 Sample selection 3.2.1.1 Population 3.2.1.2 Busia County 3.2.1.3 Kakamega County 3.2.1.4 Sample 28 28 28 29 32 35 3.3 MEASUREMENTS 39 3.3.1 Variables and operational definitions 39 3.3.1.1 Socio-demographic and household information 39 3.3.1.2 Nutritional status 40 i) Household food security information 40 ii) Household dietary diversity 40 iii) Fruit intake information 41 iv) Anthropometric measurements 41 a) Adults 42 b) Children 43 3.3.1.3 Health information 45 3.3.2 Techniques 46 3.3.2.1 Socio-demographic and household information 46 3.3.2.2 Nutritional status 46 i) Household food security information 46 ii) Household dietary diversity 46 iii) Fruit intake data 48 iv) Anthropometric information 49 (a) Adult measurements 49 (b) Measurements in children 50 3.3.2.3 Reported health information 52 3.3.3 Pre-testing/piloting of questionnaires 53 3.3.4 Data collection process 53 3.3.5 The role of the researcher 55 3.3.6 Validity and reliability 55 3.3.6.1 Questionnaires related to reported health, socio-economic status and household food security 56 3.3.6.2 Dietary diversity 56 3.3.6.3 Fruit intake data assessed using QFFQ 56 3.3.6.4 Anthropometry 57 3.4 STATISTICAL ANALYSIS 57 iii 3.5 ETHICAL ASPECTS 58 CHAPTER 4 59 RESULTS 4.1 INTRODUCTION 4.1.1 Fruit Intake data 59 59 59 4.2 SOCIO-DEMOGRAPHIC INFORMATION 4.2.1 Location 4.2.2 Language of respondents and ethnic composition of households 4.2.3 Employment status of respondents and husband/partner 4.2.4 Household characteristics 4.2.5 Water, sanitation and fuel for the household 4.2.6 Household appliances 4.2.7 Size of agricultural land 4.2.8 Mean number of rooms, room density, phones and people permanently living and contributing to income 4.2.9 Income and marital status 61 61 61 62 63 64 65 66 4.3 4.3.1 4.3.2 4.3.3 4.3.4 4.3.5 4.3.6 4.3.7 4.3.8 4.3.9 4.3.10 HOUSEHOLD FOOD SECURITY AND FOOD PROCUREMENT INFORMATION Money spent on food and source of income Growing of crops by the household Growing of vegetables by the household Growing of fruits by the household Livestock ownership by the household Seasonality of foods Food preservation Food availability in the household Hunger status in households Coping mechanisms for hunger 70 70 71 73 74 76 77 79 80 82 84 4.4 4.4.1 4.4.2 4.4.3 4.4.4 4.4.5 4.4.6 4.4.7 4.5 HOUSEHOLD DIETARY DIVERSITY Consumption of cereals, white roots, tubers, legumes, nuts and seeds Consumption of vegetables and fruits Consumption of animal proteins, eggs and seafood Consumption of oils/fats, sweets, spices, condiments and beverages Median number of food groups consumed Household dietary diversity score (dds) Source from which food was obtained ANTHROPOMETRIC INFORMATION 86 86 87 87 88 89 89 90 91 67 68 iv 4.5.1 Median anthropometric indicators of mothers and children 4.5.2 Anthropometric status of mothers 4.5.3 Anthropometric status of children 4.6 4.6.1 4.6.2 4.6.3 4.6.4 HEALTH INFORMATION Marital status and care for orphans History of smoking, snuffing and alcohol consumption Duration of sleeping and depression HIV/AIDS 91 93 95 99 99 99 100 101 CHAPTER 5 103 DISCUSSION 5.1 INTRODUCTION 5.2 LIMITATIONS OF THE STUDY 5.3 SOCIO-DEMOGRAPHIC STATUS 5.4 FOOD SECURITY AND FOOD PROCUREMENT 5.5 HOUSEHOLD DIETARY DIVERSITY 103 103 103 104 106 111 5.6 ANTHROPOMETRY 5.6.1 Anthropometric status of mothers 5.6.2 Anthropometric status of children 5.6.2.1 Stunting 5.6.2.2 Underweight 115 115 117 117 118 5.7 HEALTH 119 CHAPTER 6 121 CONCLUSIONS AND RECOMMENDATIONS 6.1 CONCLUSIONS 121 121 6.1.1 6.1.2 6.1.3 6.1.4 Socio-demographic status Food security and procurement Household dietary diversity Anthropometry 121 122 123 124 6.2 6.2.1 6.2.2 6.2.3 RECOMMENDATIONS Fruit Consumption Agricultural and other Interventions Future research 125 125 126 128 REFERENCE LIST 130 v LIST OF ABBREVIATIONS AEZ Agro-ecological zone AIDS Acquired Immune Deficiency Syndrome BMI Body mass index CDC Centers for Disease Control and Prevention CI Confidence interval DD Dietary diversity DDS Dietary diversity score FAO Food and Agriculture Organization GPS Geographical Positioning system HDD Household dietary diversity HAZ Height-for-age z-core ICRAF World Agroforestry Centre KDHS Kenya Demographic Health Survey KIHBS Kenya Integrated Household Budget Survey KNBS Kenya National Bureau of Standards LM1 Humid Lower Midland LM2 Sub-humid Lower Midland LM3 Semi-humid Lower Midland LM4 Transitional Lower Midland MRC Medical Research Council MUAC Mid-upper-arm-circumference NCAPD National Coordinating Agency for Population Development NFCS National Food Consumption Survey vi QFFQ Quantified food frequency questionnaire SD Standard deviation SES Social economic status THUSA Transition in Health during Urbanisation of South Africans UNICEF United Nations Children’s Fund UFS University of the Free State UH-1 Upper Highland zone one USAID United States Agency for International Development USDA United States Department of Agriculture WAZ Weight-for-age-z-score WC Waist circumference WHZ Weight-for-height z-score WFP World Food Programme WHO World Health Organization vii LIST OF TABLES CHAPTER 3 Table 3.1: Table 3.2) PAGES METHODOLOGY Age distribution of children <10 years in Kenya the year 2005-2006 (KIHBS, 2006:12 28 Table 3.2: Age distribution of Population in Kenya the year 2005-2006 (KIHBS, 2006:13 Table 3.3) 29 Table 3.3: Percentage Distribution of Children (<5 years) by Gender in Kenya the year 20052006 (KIHBS, 2006:112 Table 6.5) 29 Table 3.4: Body Mass Index Categories 42 Table 3.5: Country/ethnic-specific values for waist circumference (Alberti et al., 2006:476 Table 6) 42 Table 3.6: Cut-off points for wasting, underweight and stunting in children (WHO, 2012:online) 44 Table 3.7: Aggregation of food groups from the questionnaire to create Household Dietary Diversity Score (HDDS) 48 Table 3.8: Data collection process 54 CHAPTER 4 RESULTS Table 4.1 Percentage of participants with recommended fruit intakes of <400 g and ≥400 g daily 30 days preceding the survey for 96 children and their mothers in Busia and Kakamega Counties, Western Kenya, in 2013 59 Table 4.2: Fruit intake data for mothers and children 30 days preceding the survey in 96 children and their mothers in Busia and Kakamega Counties, Western Kenya, in 2013 60 Table 4.3: Comparing percentage fruit intakes 30 days preceding survey below and above median in 96 mothers/children of Busia and Kakamega Counties, Western Kenya, in 2013 60 viii Table 4.4 Percentage of households with fruit intakes of <median and ≥median of 1 fruit per day distributed in 4 AEZ (locations) of Busia and Kakamega Counties, Western Kenya, in 2013 61 Table 4.5 Percentage of language and ethnic composition of 96 participants with fruit intakes of <median and ≥median of 1 fruit per day from Busia and Kakamega Counties, Western Kenya, in 2013 62 Table 4.6 Percentage of employment status of 96 respondents and husband/partner with fruit intakes of <median and ≥median of 1 fruit per day from Busia and Kakamega Counties, Western Kenya, in 2013 63 Table 4.7 Percentage of household characteristics of 96 respondents with fruit intakes of <median and ≥median of 1 fruit per day from Busia and Kakamega Counties, Western Kenya, in 2013 64 Table 4.8 Percentage of source of water, type of toilet and fuel used by 96 households with fruit intakes of <median and ≥median of 1 fruit per day from Busia and Kakamega Counties, Western Kenya, in 2013 65 Table 4.9 Percentage of appliances in 96 households with fruit intakes of <median and ≥median of 1 fruit per day from Busia and Kakamega Counties, Western Kenya, in 2013 66 Table 4.10 Median for size of agricultural land (acres) and time spend with farming (hours) in 96 households with fruit intakes of <median and ≥median of 1 fruit per day from Busia and Kakamega Counties, Western Kenya, in 2013 67 Table 4.11 Median of number of rooms, room density, phones and people permanently living and contributing to income in 96 households with fruit intakes of <median and ≥median of 1 fruit per day from Busia and Kakamega Counties, Western Kenya, in 2013 68 Table 4.12 Percentage of monthly household income and marital status for 96 mothers with fruit intakes of <median and ≥median of 1 fruit per day from Busia and Kakamega Counties, Western Kenya, in 2013 69 Table 4.13 Percentage of money spent on food weekly and main source of income for 96 households with fruit intakes of <median and ≥median of 1 fruit per day from Busia and Kakamega Counties, Western Kenya, in 2013 71 Table 4.14 Percentage of crops produced by 96 households with fruit intakes of <median and ≥median of 1 fruit per day from Busia and Kakamega Counties, Western Kenya, in 2013 72 ix Table 4.15 Median percentage of agricultural yields sold annually by 96 households with fruit intakes of <median and ≥median of 1 fruit per day from Busia and Kakamega Counties, Western Kenya, in 2013 72 Table 4.16 Percentage of traditional vegetables produced by 96 households with fruit intakes of <median and ≥median of 1 fruit per day from Busia and Kakamega Counties, Western Kenya, in 2013 73 Table 4.17 Percentage of other vegetables produced by 96 households with fruit intakes of <median and ≥median of 1 fruit per day from Busia and Kakamega Counties, Western Kenya, in 2013 74 Table 4.18 Percentage of fruits produced by 96 households with fruit intakes of <median and ≥median of 1 fruit per day from Busia and Kakamega Counties, Western Kenya, in 2013 75 Table 4.19 Percentage of other common fruits produced by 96 households with fruit intakes of <median and ≥median of 1 fruit per day from Busia and Kakamega Counties, Western Kenya, in 2013 76 Table 4.20 Median number of livestock owned by 96 households with fruit intakes of <median and ≥median of 1 fruit per day from Busia and Kakamega Counties, Western Kenya, in 2013 77 Table 4.21 Percentages of participants who produce different foods to last till next season in 96 households with fruit intakes of <median and ≥median of 1 fruit per day from Busia and Kakamega Counties, Western Kenya, in 2013 78 Table 4.22 Percentage of participants who keep food for future use and food preservations methods by 96 households with fruit intakes of <median and ≥median of 1 fruit per day from Busia and Kakamega Counties, Western Kenya, in 2013 79 Table 4.23 Proportion of reasons given for producing food, participants views on fruit and vegetable availability, form of transport used to access fruits and vegetables on markets and participants who are served first in 96 households with fruit intakes of <median and ≥median of 1 fruit per day from Busia and Kakamega Counties, Western Kenya, in 2013 81 Table 4.24 Proportion of circumstances of hunger status of the 96 households with fruit intakes of <median and ≥median of 1 fruit per day from Busia and Kakamega Counties, Western Kenya, in 2013 83 Table 4.25 Percentages of coping mechanisms by 96 households with fruit intakes of <median and ≥median of 1 fruit per day from Busia and Kakamega Counties, Western Kenya, in 2013 85 x Table 4.26 Percentage of cereals, roots and tubers, legumes, nuts and seeds consumed the day preceding the survey in 96 households with fruit intakes of <median and ≥median of 1 fruit per day in Busia and Kakamega Counties, Western Kenya, in 2013 86 Table 4.27 Percentage of vegetables and fruits consumed the day preceding the survey in 96 households with fruit intakes of <median and ≥median of 1 fruit per day in Busia and Kakamega Counties, Western Kenya, in 2013 87 Table 4.28 Percentage of animal proteins, eggs and sea foods consumed the day preceding the survey in 96 households with fruit intakes of <median and ≥median of 1 fruit per day in Busia and Kakamega Counties, Western Kenya, in 2013 88 Table 4.29 Percentage of oils/fats used, sweets, spices, condiments and beverages consumed the day preceding the survey in 96 households with fruit intakes of <median and ≥median of 1 fruit per day in Busia and Kakamega Counties, Western Kenya, in 2013 88 Table 4.30 Median number of food groups consumed the day preceding the survey in 96 households with fruit intakes of <median and ≥median of 1 fruit per day in Busia and Kakamega Counties, Western Kenya, in 2013 89 Table 4.31 Proportion of participants in dietary diversity score (DDS) categories from food groups consumed the day preceding the survey in 96 households with fruit intakes of <median and ≥median of 1 fruit per day in Busia and Kakamega Counties, Western Kenya, in 2013 89 Table 4.32 Proportion of primary sources for obtaining cereals, fruits and vegetables by 96 households with fruit intakes of <median and ≥median of 1 fruit per day in Busia and Kakamega Counties, Western Kenya, in 2013 91 Table 4.33 Median anthropometric measurements of 96 mothers and 96 children with fruit intakes of <median and ≥median of 1 fruit per day in Busia and Kakamega Counties, Western Kenya, in 2013 93 Table 4.34 Proportion of categories of BMI and waist circumference in 96 mothers with fruit intakes of <median and ≥median of 1 fruit per day in Busia and Kakamega Counties, Western Kenya, in 2013 94 Table 4.35 Proportion of BMI group by waist circumference group in 96 mothers with fruit intakes of <median and ≥median of 1 fruit per day in Busia and Kakamega Counties, Western Kenya, in 2013 95 Table 4.36 Proportion of gender and presence of oedema in 96 children of 96 mothers with fruit intakes of <median and ≥median of 1 fruit per day in Busia and Kakamega Counties, Western Kenya, in 2013 95 xi Table 4.37 Median WHO z-scores of 96 children of 96 mothers with fruit intakes of <median and ≥median of 1 fruit per day in Busia and Kakamega Counties, Western Kenya, in 2013 96 Table 4.38 Proportion of categorical anthropometric indicators in 96 children of 96 mothers with fruit intakes of <median and ≥median of 1 fruit per day in Busia and Kakamega Counties, Western Kenya, in 2013 97 Table 4.39 Proportion of gender in 96 stunted and underweight children of 96 mothers with fruit intakes of <median and ≥median of 1 fruit per day in Busia and Kakamega Counties, Western Kenya, in 2013 98 Table 4.40 Proportion of MUAC categories in 96 children of 96 mothers with fruit intakes of <median and ≥median of 1 fruit per day in Busia and Kakamega Counties, Western Kenya, in 2013 98 Table 4.41 Proportion of marriage categories and care for orphans and other children in 96 mothers with fruit intakes of <median and ≥median of 1 fruit per day in Busia and Kakamega Counties, Western Kenya, in 2013 99 Table 4.42 Proportion of history of smoking, snuffing, alcohol use categories, use of traditional beer and symptoms of fatigue in 96 households with fruit intakes of <median and ≥median of 1 fruit per day in Busia and Kakamega Counties, Western Kenya, in 2013 100 Table 4.43 Median number of sleeping hours in 96 mothers with fruit intakes of <median and ≥median of 1 fruit per day in Busia and Kakamega Counties, Western Kenya, in 2013 100 Table 4.44 Percentage of sleep categories, taking naps day time and feelings of depression in 96 households with fruit intakes of <median and ≥median of 1 fruit per day in Busia and Kakamega Counties, Western Kenya, in 2013 101 Table 4.45 Percentage of respondents who identified people living with HIV/AIDS in 96 households with fruit intakes of <median and ≥median of 1 fruit per day in Busia and Kakamega Counties, Western Kenya, in 2013 102 xii LIST OF FIGURES CHAPTER 3 METHODOLOGY PAGES Figure 3.1: Map 1; Location, Administrative Areas and Population Densities (map includes part of newly created Teso District) (NCAPD, 2005b:4) 31 Figure 3.2: Map 2; Location, Administrative Areas and Population Densities (NCAPD, 2005:4) 34 Figure 3.3: Map of Busia County with 45 households in 4 AEZ sampled (LM1, LM2, LM3 and LM4) 37 Figure 3.4: Map of Kakamega County with the 51 households from 2 AEZ sampled (LM1 and LM2) 38 xiii LIST OF APPENDICES PAGES APPENDIX A: Informed Consent APPENDIX B: Information Document APPENDIX C: Kenya – Research Clearance and Authorization APPENDIX D: Socio-Demographic and Household Questionnaire APPENDIX E: Household Food Security and Food Procurement Questionnaire APPENDIX F: Household Dietary Diversity Questionnaire APPENDIX G: Quantified Food Frequency Questionnaire APPENDIX H: Anthropometric Measurement APPENDIX I: Health Questionnaire APPENDIX J: Commonly Consumed Fruits in Western Kenya and their Nutrient Composition 149 151 154 157 163 170 175 199 201 204 xiv Summary Malnutrition is a global problem that affects especially children below 5 years, manifesting as underweight, stunting and wasting. Factors that contribute to malnutrition include food insecurity, poor dietary diversity and illness. At a more basic level, socio-demographic factors are closely associated with malnutrition. Fruits and products made from indigenous fruits constitute one of the cheapest yet richest sources of food, on which the poor (especially women and children) depend. Fruits are nutrientdense and may play an important role in addressing deficiencies related to malnutrition. However, the value of fruits in addressing malnutrition by contributing to food security and dietary diversity remains largely undetermined in Kenya. The objective of the present study was to determine socio-economic status, nutritional status (anthropometry, food security, dietary diversity), and associations between these factors in children under 5 years and their mothers with different levels of fruit consumption in selected farm households of Western Kenya. Data was collected in rural Busia and Kakamega districts between March to June 2013 after approval from all relevant parties had been obtained. Of the 96 households sampled, 45 were from Busia and 52 from Kakamega. All children 6-59 months old and their mothers were eligible to participate. Anthropometric measurements of mother and child were taken at the household. Thereafter, questionnaires related to the following were completed: socio-demography; household food security and procurement; household dietary diversity; and reported health. Descriptive statistics, that include frequencies and percentages for categorical data and means and medians for continuous data were calculated and compared for groups with fruit consumption above the median of one fruit per day and with fruit consumption below the xv median of one fruit per day. Associations between variables were calculated using two-by-two tables and described by means of 95% confidence intervals. All children and the majority of mothers took in less than the recommended 400 g of fruit and vegetables per day. Most mothers that consumed less than the median of one fruit per day, also had children with a low fruit consumption. On the other hand, mothers that had fruit consumption higher than 1 fruit per day, also had children with a higher fruit consumption. As far as socio-demographic indicators are concerned, no significant differences between the two groups were identified. Most of the participants were from humid lower midland (LM1) and semi-humid lower midland (LM2) and most spoke Luhya. A large percentage of participants lived in traditional mud houses (give percentages of two groups) and used pit latrines. Both groups had high room density (median of 4-5 persons per room), poor water supply (less than 7% had a communal tap), lack of household appliances (less than 10% had a working refrigerator or stove) and low income. A large percentage of all mothers were unemployed (68.8% of those with a lower fruit intake and 75% of those with a higher fruit intake). Both groups used open fire for cooking most of the time. There was a tendency for households with a lower fruit intake to be more likely to have wages and salaries from formal employment as their main source of income than households with a higher fruit intake (95%CI for percentage difference [ -2.7% ; 27.3% ]). On the other hand, there was a tendency for households with a higher fruit intake to have crop production and livestock sales as their main source of income when compared to households with a lower fruit intake (95%CI for percentage difference [ -36.4% ; 0.8% ]). As far as household food security and food procurement indicators are concerned, significantly more households with a higher fruit intake grew sweet potato (95% CI of [-38.2% ; -5.1% ]) and African nightshades (95% CI of [-38.3% ; -0.2% ]) than those with a lower fruit intake. Mothers with a higher fruit intake were more likely to grow mangoes, avocados, jackfruit and lemons than those with a lower fruit intake, but the differences did not reach statistical significance. xvi There was a tendency for more households in the group with a higher fruit intake to produce enough food to last till the next season compared to the group with a lower fruit intake (95% CI [-31.4%; 3.4%]), while those with a lower fruit intake were less likely to have enough land to produce food that could last till next season (95% CI). A significantly higher percentage of respondents with a higher fruit intake reported that fruits were easily available from local farmers and shops than in the group with a lower fruit intake (95% CI of [ -45.5% ; -10.0% ]). A significantly higher percentage of mothers with a lower fruit intake reported eating less than should be eaten because there was not enough money for food than mothers with a higher fruit intake (95% CI of [1.6% ; 31.3%]). As far as household dietary diversity is concerned, both groups consumed cereals, white roots and tubers on the day preceding the interview. Fewer than half of households consumed fruits on the day preceding the interview (60% in the case of households with mothers that consumed less than the median of 1 fruit per day). In addition, very few households consumed meat, eggs or milk on the day preceding the interview. On the other hand, a high percentage of all participants consumed sweets, oils, fats, and beverages (more in the group with a lower fruit intake). Consumption of these less healthy foods contributed to the fact that most households had a Dietary Diversity Score that fell in the high category (≥ 6 food groups from a possible 12 food groups), despite not eating adequate amounts of healthier food groups. In both groups the median number of food groups consumed was 7 (ranging from 3 to 10). Although there was a tendency to obtain fruits through purchasing, rather than through own production, gathering, hunting and fishing in the group with a lower fruit intake, the difference between the two groups was not statistically significant (95%CI for percentage difference [ -9.2% ; 29.0% ]). As far as anthropometric indicators are concerned, median body mass index (BMI) of mothers in both groups fell within the normal range of 18.5 – 25 kg/m2 (21.2 kg/m2 for mothers with a lower fruit intake and 22.4 kg/m2 for mothers with a higher fruit intake). Mothers with higher fruit xvii consumption were, however, more likely to have a higher BMI (still within the normal range) and waist circumference and were less likely to have stunted children. A significantly higher percentage of children in the group of mothers with a lower fruit intake were stunted (31.3%) compared to children of mothers with a higher fruit intake (8.3%) (95% CI for percentage difference [7.0%; 37.9%]). As far as weight-for-age is concerned, 8.3% of children of mothers with a lower fruit intake were underweight, compared to 4.2% in the group of children with mothers that had a higher fruit intake (difference not statistically significant). Despite having similar levels of socio-demography, households that were involved in food crop production and livestock sales, were less likely to suffer from food insecurity. Higher fruit consumption was associated with growing foods such as sweet potatoes and African nightshade and with a lower likelihood of experiencing hunger. Mothers with higher fruit consumption (although still inadequate in terms of international guidelines), were more likely to have a higher BMI (within the normal range) and normal waist circumference and were less likely to have stunted children. Programmes that focus on improving food production at the household level can make a meaningful contribution to addressing indicators of malnutrition (especially stunting) and food security. xviii Opsomming Wanvoeding is ‘n probleem wat veral in kinders jonger as 5 jaar voorkom, en manifesteer as ondermassa, groei-inkorting en uittering. Faktore wat bydra tot wanvoeding sluit swak voedselsekuriteit, beperkte dieetverskeidenheid en siekte in. Op ‘n meer basiese vlak, hou sosiodemografiese faktore met wanvoeding verband. Vrugte en produkte wat van inheemse vrugte gemaak word, is een van die goedkoopste, dog voedingsryke bronne van voedsel, waarop persone met beperkte bronne (veral vroue en kinders) staatmaak. Vrugte speel ‘n belangrike rol in die aanspreek van gebreke wat met wanvoeding verband hou. Ten spyte daarvan, is die waarde van vrugte in die stryd teen wanvoeding en in die bydra tot voedselsekuriteit en dieetverskeidenheid grootliks onbekend in Kenia. Die doel van die huidige studie was om sosio-ekonomiese status, voedingstatus (antropometrie, voedselsekuriteit en dieetverskeidenheid), en verbande tussen hierdie faktore in kinders jonger as 5 en hul moeders met verskillende vlakke van vrugteinname in plaashuishoudings in WesKenia te bepaal. Data is tussen Maart en Junie 2013 in die distrikte van Busia en Kakamega ingesamel, nadat goedkeuring van alle betrokke partye verkry is. Van die 96 huishoudings wat ingesluit is, was 45 van Busia en 52 van Kakamega. Alle kinders tussen 6-59 maande en hul moeders kon aan die studie deelneem. Antropometriese metings van moeder en kind is by die huis geneem, waarna vraelyste oor sosio-demografiese faktore, huishoudelike voedselsekuriteit, dieetverskeidenheid en gesondheid voltooi is. Beskrywende statistiek wat insluit frekwensies en persentasies vir kategoriese data en mediane vir kontinue data is bereken en vergelyk tussen groepe met vrugte inname bo die mediaan van een vrug per dag en met vrugte inname onder die mediaan van een vrug per dag. Verbande xix tussen veranderlikes is bereken deur middel van twee-by-twee tabelle en vergelyk deur middel van 95% vertrouensintervalle (VI). Alle kinders en die meerderheid moeders het minder as die aanbevole 400 g vrugte en groente per dag ingeneem. Die meeste moeders wat minder as die mediaan van een vrug per dag ingeneem het, het ook kinders gehad met ‘n laer vrugteinname. Aan die ander kant, het moeders met ‘n hoër vrugteinname ook kinders met ‘n hoër inname gehad. Wat sosio-ekonomiese indikatore aanbetref, is daar geen betekenisvolle verskille tussen die twee groepe gevind nie. Meeste deelnemers is van die humid lower midland (LM1) en semi-humid lower midland (LM2) and meeste het Luhya gepraat. ‘n Groot persentasie deelnemers het in tradisionele modderhutte geleef met pit toilette. Beide groepe het hoë kamerdigtheid (mediaan van 4-5 persone per kamer), swak watervoorsiening (minder as 7% het ‘n gemeenskaplike kraan), gebrek aan huishoudelike geriewe (minder as 10% het ‘n werkende yskas of stoof) en lae inkomste gehad. ‘n Groot persentasie van moeders het nie gewerk nie (68.8% met laer vrugte inname en 75% met hoër vrugteinname). Beide groepe het hul voedsel hoofsaaklik op ‘n oop vuur voorberei. Daar was ‘n neiging vir huishoudings met ‘n laer vrugte inname om ‘n salaris inkomste te ontvang (95% VI vir persentasieverskil [ -2.7% ; 27.3% ]), terwyl daar ook ‘n neiging was vir huishoudings met ‘n hoër vrugte inname om eerder van opbrengste van oes en lewendehawe te leef (95% VI vir persentasieverskil [ -36.4% ; 0.8% ]). Wat voedselsekuriteit aanbetref, is daar betekenisvol meer huishoudings met ‘n hoër vrugte inname wat patats (95% VI vir persentasieverskil [-38.2% ; -5.1% ]) en Africa nightshade (95% VI vir persentasieverskil [-38.3% ; -0.2% ]) gekweek het as die met ‘n laer vrugte inname. Moeders met ‘n hoër vrugte inname was ook meer geneig om mango’s, avokado’s, jack fruit en suurlemoen te kweek, maar die verskille tussen die twee groepe was nie statisties betekenisvol nie. xx In vergelyking met die groep met ‘n laer vrugte inname, was die groep met ‘n hoër vrugte inname meer geneig om genoeg voedsel te produseer om tot die volgende seisoen te hou (95% VI [31.4%; 3.4%]), terwyl die met ‘n laer vrugte inname minder geneig was om grond tot hul beskikking te hê om voedsel te voorsien tot die volgende seisoen (95% VI [-4.7%; 39.4%]). ‘n Betekenisvolle hoër persentasie deelnemers met ‘n hoër vrugte inname het genoem dat vrugte maklik beskikbaar was by boere en winkels in die area as deelnemers met ‘n laer inname (95% VI [ -45.5% ; -10.0% ]). ‘n Betekenisvolle laer persentasie van moeders met ‘n lae inname van vrugte het genoem dat hul soms minder eet omdat daar nie genoeg geld beskikbaar was as moeders met ‘n hoër inname (95% VI [1.6% ; 31.3%]). Wat huishoudelike voedsel verskeidenheid aanbetref, het albei groepe die vorige dag grane, wortelgroente en knolgroente geëet. Minder as helfte van huishoudings het die vorige dag vrugte geëet (60% in die geval van moeders met ‘n vrugte inname van minder as die mediaan van een vrug per dag). Verder het baie min huishoudings die vorige dag vleis, eiers of melk ingeneem. Hier teenoor het ‘n hoë persentasie van alle huishoudings lekkers, olie, vette en drankies ingeneem (meer in die groep met ‘n laer vrugte inname). Inname van hierdie ongesonde voedsels het bygedra tot die feit dat die Dieetverskeidenheidtelling in die hoë kategorie geval het (≥ 6 voedselgroepe uit ‘n moontlike 12 voedselgroepe), ten spyte daarvan dat hul inname van gesonder voedsels laag was. In beide groepe was die mediaan hoeveelheid voedselgroepe wat ingeneem is 7 (reikwydte tussen 3 en 10). Alhoewel die groep met ‘n laer vrugte inname meer geneig was om vrugte aan te koop as om dit te kweek of in die veld te versamel, was die verskil tussen die twee groepe nie betekenisvol verskillend nie (95% VI vir persentasieverskil [ -9.2% ; 29.0% ]). Wat antropometrie aanbetref, was die mediaan liggaamsmassa indeks (LMI) van moeders in beide groepe binne die normale reikwydte van 18.5 – 25 kg/m2 (21.2 kg/m2 vir moeders met ‘n laer vrugte inname en 22.4 kg/m2 vir moeders met ‘n hoër vrugte inname). Moeders met hoër vrugte inname se LMI en middelomtrek was betekenisvol hoër as die LMI en middelomtrek van xxi moeders met ‘n laer vrugte inname (steeds binne die normale reikwydte). Hulle was ook minder geneig om kinders met groei-inkorting te hê. ‘n Betekenisvolle hoër persentasie kinders van moeders met ‘n laer vrugte inname was groeiingekort (31.3%) in vergelyking met kinders van moeders met ‘n hoër vrugte inname (8.3%) (95% VI [7.0%; 37.9%]). Wat massa-vir-ouderdom aanbetref, was 8.3% van kinders van moeders met ‘n laer vrugte inname ondermassa, teenoor 4.2% in die groep met ‘n hoër inname (verskil egter nie betekenisvol nie). Ten spyte dat vlakke van sosio-demografie nie betekenisvol verskil het nie, was huishoudings wat betrokke was by voedselproduksie minder geneig om swak voedselsekuriteit te hê. Hoër vrugte inname het verband gehou met kweek van voedsels soos patats en Africa nightshade en ‘n kleiner kans om honger te ervaar. Moeders met ʼn hoër vrugte inname (alhoewel dit steeds onvoldoende was in terme van internasionale riglyne), het hoër LMI en middelomtrek gehad en was minder geneig om kinders met groei-inkorting te hê. Programme wat fokus op voedselproduksie op huishoudelike vlak kan ‘n betekenisvolle bydra lewer tot die aanspreek van wanvoeding (veral groei-inkorting) en swak voedselsekuriteit. xxii CHAPTER 1 INTRODUCTION 1.1 PROBLEM IDENTIFICATION Malnutrition is a global problem that affects especially children below 5 years. In 2007, 9.2 million children in the world died before age five. Africa and Asia together accounted for 92% of these deaths. Half of the world’s under-five deaths (4.7 million, 51%) occurred in Africa, which remains the most difficult place in the world for a child to survive until age five (UNICEF, 2009a:22). Poor nutritional status manifests as malnutrition. A child or adult can be classified as malnourished by being either undernourished or overnourished (UNICEF et al., 2010:61). Globally, more than one third of child deaths are attributable to undernutrition (UNICEF, 2012). The prevalence of undernutrition is high in Eastern, Middle, and Western Africa, with an estimated 111 million deaths in children younger than 5 years in the region (Khan et al., 2010:1412). The level of child and maternal undernutrition remains unacceptable throughout the world, with ninety percent of the developing world’s chronically undernourished (stunted) children living in Asia and Africa (UNICEF, 2009b:10). Stunting reflects chronic nutritional deficiency, with long term impacts on human capital and risk for developing chronic diseases in adulthood. Detrimental, and often undetected until severe, undernutrition undermines the survival, growth and development of children and women, and it diminishes the strength and capacity of nations (UNICEF, 2009b:10). Broadly speaking, undernutrition can be classified as underweight, stunting and wasting. In 2011, UNICEF reported that there were an estimated 127 million underweight children in the developing world (weight-for-age <-2SD from the reference median), which translates into 22% of children in developing countries. At that time, 9% of children in the developing world were also severely underweight (weight-for-age <-3 SD from the reference median) (UNICEF, 2011). 1 The percentage of children under five years old suffering from underweight (moderate and severe) in Eastern and Southern Africa was 21%, and the prevalence of underweight was more common in rural than in urban areas and similar among boys and girls (UNICEF, 2011). The percentage of children under five years old with a low height-for-age and thus suffering from stunting (moderate and severe) in Africa was forty percent and in Eastern and Southern Africa it was 44% (UNICEF, 2011). As far as wasting (low weight-for-height) is concerned, the percentage of children under five who were wasted (moderate and severe) in Africa was 9% and in Eastern and Southern Africa it was 8% (UNICEF, 2011). 1.1.1 Undernutrition in Kenya According to the 2009 Kenya Demographic and Health Survey (KDHS), in Kenya nutritional status is generally poor, and malnutrition places children at an increased risk of morbidity and mortality. The KDHS, undertaken between 2008 and 2009, showed that nationally, 16% of children under five were underweight (weight-for-age below -2SD from the reference median) and 4% severely underweight (weight-for-age below -3SD). In Western Kenya, the percentage of children who were underweight (below -2SD) was 12% while 4% of children were severely underweight (below-3SD). As far as stunting is concerned, 35% of children under five were stunted (heightfor-age below -2SD from the reference median), while the proportion of severely stunted children was 14% (height-for-age below -3SD from the reference median) (Kenya National Bureau of Standards (KNBS, 2010:142). In Western province, 15% of children were severely stunted (below -3SD) while 34% were stunted (below -2SD). Measures of weight-for-height revealed that, overall, 7% of children were wasted (below -2SD from the reference median) and 2% were severely wasted (below -3SD). In Western province, 2% of children were wasted while 1% was severely wasted. Under-five mortality, often related to undernutrition, is high in Kenya. According to the 2009 KDHS report, the under-five mortality rate was 74 deaths per 1000 births during the previous 2 five-years. This implies that at least 1 in every 14 children born in Kenya during that period died before reaching their fifth birthday (KNBS, 2010:103). 1.1.2 Disease burden in Kenya From the above it is clear that the health and nutrition situation in Kenya is challenging. This is further exacerbated by the significant HIV/AIDS and malaria burden (KNBS, 2010:159-174). Results from the 2009 KDHS indicated that 6.3% of Kenyan adults age 15-49 were infected with HIV at that time. HIV prevalence was higher for women than men at all ages except for the 3539 age group (KNBS, 2010:214). Urban respondents were slightly more likely to have HIV than their rural counterparts (7% and 6%). Malaria is the leading cause of morbidity and mortality in Kenya (KNBS, 2010:161). In 2010 only 24% of the population was malaria-free (WHO, 2011:133). Although malaria affects people of all age groups, children under five years of age and pregnant women living in malaria endemic regions are most vulnerable (KNBS, 2010:161). 1.1.3 Socio-demographic and agricultural situation in Kenya An estimated 8·8 million people in east Africa were reported to be hungry in 2010 (Loewenberg, 2011:17). A that time emergency appeals throughout the region had only received 51% of the US$1·293 billion in requested funding for Djibouti, Kenya, Ethiopia, and Somalia, according to the United Nations (UN) (Loewenberg, 2011:17). Globally, the world food price spikes forced more than 44 million people into extreme poverty (Loewenberg, 2011:17). The Kenyan economy is predominantly agricultural with a strong industrial base. However, a graph for rainfall in the Horn of Africa over the past twenty years shows a clear and steady decline (Loewenberg, 2011:17). The agricultural sector directly contributed 22 and 23% of the gross domestic product (GDP) in 2007 and 2008 respectively according to the Kenya National Beaureau of Standards (KNBS, 2010:161). Coffee, tea, and horticulture (flowers, fruits, and vegetables) are the main agricultural export commodities; in 2008, these three commodities jointly accounted 3 for 45% of the total export earnings (KNBS, 2010). But even during famine periods the prices of such stable foods rise. During the year 2011, the price of maize increased by more than 200% from the month of October. In Somalia the price of the staple food sorghum went up to 240% (Loewenberg, 2011:17). After remarkable growth, which averaged 6% in the period 2004-2007 and peaked at 7.1% in 2007, real GDP growth slowed to 1.7% in 2008. The slowdown resulted from both domestic and external shocks, including post-election violence, high food and fuel prices, drought, and the global financial crisis. These influences had a negative impact on key sectors of the economy, including tourism, manufacturing, transport, and agriculture (KNBS, 2010:2). Wealth is concentrated in the urban areas, with 79% of the urban population falling in the highest wealth quintile. In contrast, those in rural areas are poorer, with one quarter in the lowest wealth quintile and only six percent in the highest quintile (KNBS, 2010:26). Nairobi province, which is entirely urban, has 96% of its population in the highest quintile, while western Kenya has 5.2% of its population in the highest quintile (KNBS, 2010:26). About twice as many women and men in rural areas have no education at all compared with those in urban areas (Gewa & Yandell 2011). In western Kenya 1.6% of females have more than secondary education, and 14.2% have completed primary education (KNBS, 2010:16). More than three in five working women (62%) are self-employed. Thirty percent are employed by a non-family member, and nine percent are employed by a family member. Those working in agricultural jobs are more likely to be selfemployed or employed by a family member than women working in non-agricultural jobs (KNBS, 2010:41). Sixty-two percent of working women are employed all year; another 32% have seasonal jobs and six percent work only occasionally. Women who are engaged in nonagricultural work (seventy percent) are more assured of continuity in employment than those engaged in agricultural activities, whose employment is more likely to consist of seasonal work (KNBS, 2010:42). Western Kenya province has a population of about 4334282 people that includes 904075 households. Kakamega County is one of the most populated counties with a population size of 1660651 that includes 800989 males and 859662 female. Busia is one of the least populated 4 counties with a total of 488075 people that include 232075 male and 256000 females. In western Kenya 271971 children are attending pre-primary school (Kenya Census 2009, 2010:23). 1.1.4 Food security in Kenya Food security status describes the extent to which families have access to the quantity of food needed to live a healthy, active lifestyle (Grutzmacher et al., 2011:455). Household food security, often influenced by factors such as poverty, drought and other emergencies, plays an important role in determining the state of child and maternal nutrition in many countries (UNICEF, 2009a:13). About 3.7 million people in Kenya are in need of food assistance (USAID, 2011:1). Although pastural (livestock keeping) conditions in northwestern Kenya are average and migration options are available, the severe resource‐based conflict and limited humanitarian response have led to rapid deterioration in food security conditions, with acute malnutrition rates of 37% in some localized areas (USAID, 2011:2). Stocks of locally produced staples (maize, sorghum, millet) are improving in Kenya following harvests. Stocks are, however, low in pastural areas of Kenya due to relatively poor market infrastructure (USAID, 2011:2). The prices of locally produced staples (maize and beans) showed a declining month‐on‐month (July‐to‐August 2011) trend in key markets in Kenya but were still significantly above their five‐year averages (USAID, 2011:2). During the year 2011, severe drought periods were experienced in northern Kenya, southern Somalia, and southeastern Ethiopia, that resulted in chronic malnutrition. This has been brought on by climate change, deepening poverty, diversion of maize to ethanol, and increasing oil and food prices (Loewenberg, 2011:17). The response to emergency appeals throughout the region was slow, at a time when the impact had significance on children and pregnant women (Loewenberg, 2011:17). In the recent past, the conditions in refugee camps for people fleeing Somalia were very serious. The Dadaab refugee camp on the Somali and Kenya border is already the largest concentration 5 of refugees in the world and consists of three camps in one. Due to drought, the number of refugees was still increasing in 2011 (Loewenberg, 2011). The available literature on the existence of socioeconomic differences affecting fruit and vegetable consumption among children, adolescents, and adults has several practice implications. In particular, there is good evidence that persons of low socio-economic status are likely to require additional assistance to enable them to better meet health recommendations regarding consumption of fruits and vegetables (Ball & Crawford 2010:200). Children from lowincome, food-insufficient households and minority children are at increased risk for inadequate fruit and vegetable consumption which may be attributable to limited access to fruits and vegetables (Miller et al., 2011:396). Additionally, mothers can influence their children’s eating behavior in several ways. Firstly, mothers serve as important role models for their children and they can significantly influence food acceptance patterns. Watching a model (e.g., mother) eat an initially disliked or new food item can increase food variety in children. Secondly, mothers often decide which food items are made available to their children in their home; easy access to fruits and vegetables may provide children with more opportunities to try new food items on repeat occasions (Miller et al., 2011:398). Additionally, parents who engage in physical activity with their children have been shown to have a positive impact on their child’s fruit and vegetable intake (Andaya et al., 2010:312). 1.1.5 Micronutrient deficiencies Micronutrient deficiencies – especially vitamin A, zinc, iodine, and iron deficiencies – are a major public health problem globally, with low-income countries in Africa and Asia carrying the highest burden of disease (Wedner et al., 2008:526). These contribute significantly to high rates of morbidity and mortality among infants, children, and mothers in developing countries (Khan et al., 2010:1409). Micronutrient deficiencies have also been described as hidden malnutrition (Wedner et al., 2008:526) and are recognized as important contributors to the global burden of disease, especially in the developing world (Khan et al., 2010:1411). Micronutrient malnutrition, 6 caused by deficiencies in vitamins and minerals, can manifest itself through such conditions as fatigue, pallor associated with anaemia (iron deficiency), reduced learning ability (mainly iron and iodine deficiency), goitre (iodine deficiency), reduced immunity, and night blindness (severe vitamin A deficiency) (UNICEF, 2009b:15). 1.1.6 Importance of fruit in the diet Historically, fruit trees were the earliest source of food known to mankind and wild harvesting of indigenous fruit trees predated hunting and settled agriculture (Akinnifesi et al., 2008:Xiii). In Western Kenya, both exotic and indigenous fruits are grown on farms by farmers for consumption when in season. Some fruits grow in the wild and some are cultivated on farms. Children often pick wild fruits during the day while playing and consume them more frequently than adults. Fruits and products made from indigenous fruits constitute one of the cheapest yet richest sources of food, on which the poor (especially women and children) depend. Fruits and products from indigenous trees are particularly important during periods of hunger (Kwesiga et al., 2000:289). Fresh fruits are often processed in order to preserve the product and to obtain intermediate products which can be transformed into other by-products. Transformation of fresh fruits into a dried form is advantageous because in this way they can be stored for more than 18 months and thus enhance food security in times of hunger (Akinnifesi et al., 2008:290291). Thus, indigenous fruits may help women in most rural households to secure food for their families, either directly or indirectly when they are sold (Kwesiga et al., 2000:289). Fruits can be eaten raw or processed into various nutritious products, such as juices, jams/jellies, dried fruit/powder, yoghurt and porridge (Saka et al., 2008:291). Fruits are rich in vitamins A, C and E and may play an important role in addressing deficiencies of these nutrients (560 000 Africa children annually die of vitamin A deficiency alone). Both indigenous and exotic fruits are consumed in western Kenya. Some of the commonly consumed fruits in western Kenya include mangoes (Mangifera indica), guava (Psidium guajava), loquats (Eriobotrya japonica), wild berries (Rubus apetalus and Rubus pinnatus), Lantana camara, 7 pawpaws (Carica papaya), java plum (Syzygium cordata), avocado (Persea Americana) and banana (Musa X paradisiacal) amongst others. Wild fruits contain high level of nutrients which are important to infants and children, pregnant and lactating women, the elderly, HIV-infected people and indigenous societies. The consumption of these fruits can help to combat malnutrition resulting from major deficiencies of vitamin A and C and folate, as well as certain minerals (Thiong’o et al., 2002:295). Fruits are excellent sources of antioxidant vitamins (Wootton-Beard et al., 2011:3140), as well as of other vitamins, minerals, and other bioactive compounds such as flavonoids, and phytochemicals (O’Neil et al., 2011:674; Cardoso et al., 2011:411). Fruit juices provide, in varying amounts depending on the juice, vitamin C, potassium, thiamin, folate, vitamin B6, and magnesium as well as numerous phytochemicals (O’Neil et al., 2011:674). As many phytochemicals are colorful, a color code approach has been proposed to encourage dietary diversity. Red foods (e.g., tomatoes) are rich in lycopene, yellow-green vegetables (e.g., corn and leafy greens) are rich in lutein and zeaxanthin, red-purple foods (e.g., grapes and berries) are rich in anthocyanins, orange foods (e.g., carrots and mangos) are rich in betacarotene, orange-yellow foods (e.g., oranges and lemons) are rich in citrus flavonoids, green foods (e.g., broccoli and Brussels sprouts) are rich in glucosinolates, and white-green foods (e.g., onions and garlic) are good sources of allyl sulfides. Eating at least 1 serving from each of these color groups ensures a good spectrum of phytochemicals are consumed (Jamison, 2003:384). Most fruits and vegetables are available almost year-round in a wide variety and contribute taste, texture, color, flavour and ease of use. They can be fresh, cooked, hot or cold, canned, pickled, frozen or dried (Vicente et al., 2009:58, Whitney & Rolfes 2008:52). Fruits and vegetables are consumed at all times, and due to their convenient size; they are an excellent between-meal snack (Vicente et al., 2009:58, Whitney & Rolfes 2008:52). Bliault (2012) collected data on the importance of fruit trees (both indigenous fruit trees and exotic fruit trees) in this study area (Busia). The current study follows this study by Bliault (2012) that collected quantitative data on on-farm fruit tree diversity to establish baseline data for the current study and other further research. The study by Bliault (2012) aimed at determining on8 farm fruit tree species richness, abundance and diversity in Busia County, western Kenya. Data was also collected to help understand the contribution of fruit to family nutrition. The current study follows the study by Bliault (2012) to establish the relationship between the on-farm fruit tree diversity in the study area and the dietary diversity and nutritional status of children below 5 years and their mothers/caregivers in this area. 1.2 RATIONALE AND MOTIVATION In Kenya a high prevalence of malnutrition (stunting, wasting, and underweight), micronutrient deficiencies, high under-five and maternal morbidity and mortality rates, HIV/AIDS and malaria burden as well as the decline in the economy (low GDP growth level), are considered serious challenges to individual and national development. The World Agroforesty Centre (ICRAF) has made great efforts to promote trees on farms as fruit trees are known to improve dietary diversity (Saka et al., 2008:289). For more than a decade ICRAF has collaborated with its regional partners on local knowledge systems, nutritional value, product development and the processing of indigenous fruits from Africa (Saka et al., 2008:289). The burden of micronutrient deficiencies in Kenya needs to be addressed using sustainable foodbased interventions besides national supplementation programs. It is probable that micronutrient deficiencies in Kenya can be addressed by improved fruit consumption. In view of the advantages of adequate fruit consumption on health and nutritional status, the current study will describe and compare the health and nutritional status of pre-school children and mothers/ caregivers with different levels of fruit consumption. A quantified food frequency questionnaire covering the previous 30 days was used to collect fruit and vegetable intake data from all the 96 mothers and their children. The results of the food frequency questionnaire showed that very few mothers and children consumed the recommended 400g or more of fruit and vegetables per day and for this reason the median fruit 9 consumption of one fruit portion per day was used as a cut-off point to compare the sociodemographic, household food security and food procurement, household dietary diversity, anthropometric measures and health status (explained in more detail in chapter 4 under section 4.1.1). The food frequency questionnaire was administered with the sole purpose of determining quantitative fruit and vegetable intake and thus no other results related to this questionnaire are reported. 1.2.1 Aim The main aim of this study was to better understand fruit consumption in relation to the health and nutritional status of pre-school children and their mothers/caregivers in selected farm households of Western Kenya. 1.2.2 Objectives Objectives necessary to achieve the main aim In order to achieve the main aim, the following were determined in children (5 years and younger) and mothers/caregivers: Socio-economic status Nutritional status: Household food security information Household dietary diversity Fruit intake Anthropometry 10 Reported health status (medical history) -To determine differences in the above factors in mothers/caregivers with different levels of fruit consumption; and -To determine associations between anthropometric variables of children under 5 years and their mothers/caregivers with different levels of fruit consumption. 1.3 STRUCTURE OF THE DISSERTATION The first chapter of the dissertation includes the problem statement and motivation for the study and outlines the main aim and objectives of the study. In Chapter 2 a literature review related to the importance of fruit consumption as affected by socio-economic status, food security and dietary diversity, in growth and health is given. The methodology applied in the study is discussed in Chapter 3. The results are reported in Chapter 4. The results are discussed in Chapter 5, followed by conclusions and recommendations in Chapter 6. 11 CHAPTER 2 LITERATURE REVIEW 2.1 INTRODUCTION Nutritional status is influenced by three broad factors: food, health and care. Optimal nutritional status results when children have access to affordable, diverse, nutrient-rich food; appropriate maternal and child-care practices; adequate health services; and a healthy environment including safe water, sanitation and good hygiene practices. These factors directly influence nutrient intake and the presence of disease (UNICEF, 2013). Maternal and child malnutrition, encompassing both undernutrition and overweight, are global problems with important consequences for survival, incidence of acute and chronic diseases, healthy development, and the economic productivity of individuals and societies (Black et al., 2013). Children with severe acute malnutrition (SAM) are nine times more likely to die than children who are well-nourished. Children who are wasted are at a higher risk for linear growth retardation and stunting (UNICEF, 2013). To achieve balance in life, one must make choices. In making a choice, one considers how that choice may affect general lifestyle and eating habits in order to balance life. In a study by Paisley, (2001:205), cultural values of achieving balance in life were reported to shape fruit and vegetable intakes of participants and the study highlighted the importance of choice in achieving this balance. Today, too many children are consuming high energy diets while at the same time consuming inadequate micronutrients (USDA, 2010:2). Feeding habits in infants and children below 5 years are important for growth and development of the child. During this period, children have higher micronutrient requirements (Valmórbida & Vitolo, 2014). Interventions to increase consumption of fruits in children below 5 years have been suggested to be a good strategy to reduce disease burden associated with insufficient consumption of micronutrients (Wolfenden et al., 2012). 12 In Kenya, vitamin A deficiency in children 6 to 59 months old is 84.4% while the prevalence of anemia is 69%. The prevalence of anemia in women is 55.5% (Micronutrient Initiative, nd:online). The recipes and land cultural beliefs related to foods that are common in most communities are the result of interactions over the years between people and the agroecological zones (DeClerck, 2013:23). The linkage between agricultural biodiversity, human nutrition and health is important (Heywood, 2013:35). Use of agricultural biodiversity has provided nutrition and health benefits (Heywood, 2013:36) hence healthy human nutrition is best achieved by considering agriculture that is biodiverse, providing a varied food supply, and that may be ecologically sustainable (Heywood, 2013:36). The review by Heywood (2013:37), highlighted that, to achieve agricultural biodiversity and nutrition there is need to consider nutrition and health and sustainable agriculture by small-scale farmers, the evaluation and use of local foods, traditional recipes, traditional methods of food preparation, nutrition education, research on better methods of food processing and storage, value chain analysis and marketing. Agricultural biodiversity includes types of plants, animals, microorganisms involved in food and agriculture (Heywood, 2013:37). A majority of farmers in the developing world are local farmers who depend on small-scale cultivation of staples and traditional agriculture, such as home gardens, domesticated species and gathering fruits, fibres, medicinal plants and others from the wild (Heywood, 2013:41). Home gardens or kitchen gardens, have a potential to improve household food security and to alleviate micronutrient deficiencies (Heywood, 2013:42). Adequate human nutrition involves regular intake of a wide range of nutrients, some of which must be consumed regularly and even in small quantities (Heywood, 2013:42). Traditional food systems that are characterized by rich agricultural biodiversity are important in meeting nutritional needs of hundreds of millions of people across the world (Heywood, 2013:55). Local communities depend on local crops and wild biodiversity but during drought they mix local crops with plants and animals gathered from the wild in order to add variety and flavor to their diets and for adequate micronutrient intake (Heywood, 2013:55). Biodiversity also relates human diets and diversity of livestock and livestock systems (Hoffmann & Baumung 2013:69). 13 Animal source foods (ASF) include meat, milk and eggs, and provide high quality sources of essential nutrients for optimal protein, energy and micronutrient intake such as iron, zinc and vitamin B12 (Hoffmann & Baumung 2013:69). High rates of undernutrition and micronutrient deficiency among the rural poor suggest that, even though they keep livestock, they consume very little ASF (Hoffmann & Baumung 2013:69). Globally, cattle, sheep, chickens, goats and pigs are largely domesticated (Hoffmann & Baumung 2013:69). However, demands for animal products continue to increase hence need for increased sustainable livestock production and lowering environmental foot print (Hoffmann & Baumung 2013:82). Farmers need to be educated on importance of sustainable diet and the role of animal genetic diversity (Hoffmann & Baumung 2013:82). 2.2 FRUIT CONSUMPTION Fruit and vegetable consumption is influenced by a variety of factors that include cultural, physical and social environmental interactions. Interventions to improve fruit and vegetable consumption in children should therefore focus on changing negative attitudes, knowledge and skills, beliefs and norms in the community. A study by Haire-Joshu et al. (2004:36:313) suggested that eating adequate amounts of vegetables in childhood is associated with higher exposure to, preference for, and intake of both fruits and vegetables in adulthood. Adults who estimated that they ate plenty of vegetables in childhood may have been in a food environment that allowed for repeated access and exposure to fruit and vegetables, yielding positive fruit and vegetable intake patterns into adulthood. 2.2.1 Barriers to fruit consumption According to Kehlenbeck et al. (2013), a variety of factors constrain fruit consumption and production in Africa. These include lack of consumer awareness on the health benefits of regular 14 fruit consumption, change of consumer preferences and loss of the traditional nutrition systems based on local agricultural biodiversity, which leads to erosion of both plant genetic resources and the related traditional knowledge. Another factor constraining fruit consumption includes degradation of natural vegetation used for collecting indigenous fruits in the past and lack of sufficient tree domestication techniques and their dissemination, especially of vegetative tree propagation methods. Lack of fruit processing facilities, which leads to high post-harvest losses and poorly organized fruit marketing pathways along the value chain are other additional factors that constrain fruit consumption. Environmental factors influence food availability, marketing, and promotion (Pollard & Rowley 2010:205) and include accessibility to food sources. Environmental effects of climate change can result in changes to natural systems that can impact on nutrition and diet-related health. These include food-producing systems that can affect food production and nutritional quality; sources of the food supply; reduced food production and affordability, leading to dietary imbalances and poor nutrition. These are just some of the challenges to increased consumption of fruit and vegetables (Pollard & Rowley 2010:217). A study by Unusan (2006:388) showed a significant influence of fruit and vegetable restraint on eating behaviour under stress and indicated that increased stress was strongly associated with barriers to fruit and vegetable intake. These authors thus hypothesized that stress and fruit and vegetable intake are mutually related. Eating less than five portions of fruit and vegetable could exacerbate symptoms of stress, and on the other hand, symptoms of stress could make it difficult to sustain a healthy dietary pattern (Unusan, 2006:388). 2.2.2 Recommendations for fruit consumption The World Cancer Research Fund and the American Institute for Cancer Research (AICR) have set an intake of 400 g/day, or five servings per day of vegetables and fruits as the lowest range recommended for consumption (Duyn & Pivonka 2000). In an effort to reduce cancer risk, the recommendation is as high as 10 servings of vegetables and fruit daily (Duyn & Pivonka 2000). The food guide pyramid encourages up to 9 servings of fruits and vegetables daily for general 15 good health (Duyn & Pivonka 2000). The WHO recommendation of 400 g/day or at least five servings of vegetables and fruit a day, starting from childhood, has been shown to be able to prevent the development of chronic diseases such as cardiovascular disease, overweight and obesity (Delgado-Noguera et al., 2011). Epidemiologic data show that the consumption of fruits and vegetables is very often insufficient in both adults and children. In a study conducted by Valmórbida and Vitolo (2014), among children below 5 years in Brazil who were treated in healthcare centres, the majority ate less than one serving of fruits and vegetables per day. The same study by Valmórbida and Vitolo, (2014), showed that more than half of children from households with low socio-economic status (SES) consumed less than one serving of vegetables and less than one serving of fruit every day. In light of the fact that the recommendation for fruit intake is three daily servings, this intake (240 g/day for vegetables and 180 g/day for fruit) was considered to be very low. In most developing countries (including Africa), fruit and vegetable consumption in children below 5 years, has been reported to be less than 300 g per day (Wolfenden et al., 2012). If infants and children are introduced to adequate fruit consumption they are likely to persist with this habit in adulthood, thus reducing their risk of developing lifestyle related diseases. In 2002, fruit consumption in Sub Saharan Africa was reported to be as low as 36 g per person in Eastern Africa and about 90 g in Western Africa (Kehlenbeck et al., 2013). According to USDA (2010:34), individuals should meet fruit and vegetable recommendations as part of a healthy eating pattern while staying within their energy needs. Recommendations include increasing vegetable and fruit intake; eating a variety of vegetables, especially dark-green and red and orange vegetables and beans and peas; and choosing foods that provide more potassium, dietary fiber, calcium, and vitamin D, which are nutrients of concern. These foods include vegetables, fruits, whole grains, and milk and milk products. Distinct types of fruit and vegetables differ widely in their nutrient content and, in recognition of this, national and international agencies recommend fruit and vegetable consumption from diverse groups (Crujeiras et al., 2010:360). In addition, preparation and storage conditions affect 16 the nutrient content of fruit and vegetables and need to be considered (Crujeiras et al., 2010:360). In terms of fruit juice consumption, the American Academy of Pediatrics (AAP), has advised against fruit juice introduction into the diets of infants younger than six months of age and limiting 100% fruit juice consumption to 4 to 6 oz/day (approximately 1 serving) for children aged 1 to 6 years (Rampersaud et al., 2003). 2.2.3 Fruit consumption in Kenya Fruit markets in SSA are estimated to grow substantially due to economic and human population growth and increasing urbanization rates, e.g. by 5.7 per cent per year in Kenya (Kehlenbeck et al., 2013:260). In their review Kehlenbeck et al. (2013:260) mentioned that in Kenya, about 400 indigenous fruit tree species occur which are said to contribute much to livelihoods of rural communities, particularly during the frequent periods of food shortage. However, detailed studies on diversity of indigenous fruit trees (IFTs) and their consumption in Kenya are scarce (Kehlenbeck et al., 2013:260). One of the studies in the drylands of Mwingi District, Eastern Kenya, reviewed by Kehlenbeck et al. (2013:261), reported that a total of 57 indigenous species were mentioned as being consumed by the respondents, 36 of these species were found on the 104 surveyed farms while 21 species were exclusively collected from the wild. However, mean daily consumption of indigenous fruits was only 19 g per person, being a little higher for children (about 23 g) than adults. Adults viewed many indigenous fruits as food for children and consumed only fruits from certain, higher valued species such as baobab, tamarind, Berchemia discolor or Lannea alata. When exotic fruits (which were available only on market days) were included in the calculations, the mean daily consumption of fruits increased from 19 g to 28 g per person. This is far below the recommended daily intake of two to three servings per person. 17 Unripe fruits are suitable for producing mango pickles and chutneys, but in Kenya, this is done only on a very small scale mainly for the limited number of people with Indian origin. Ripe fruits are either eaten fresh or processed to jam, juice, dried mangoes and canned fruits. In Kenya, mangoes are usually consumed fresh (Kehlenbeck et al., 2012:19). The study by Bliault (2012) that preceded the present study included an interview of the household head or his/her representative and a fruit tree inventory on each of the farms in the survey procedure. First, respondents were interviewed using a structured questionnaire to collect basic socio-economic data and data on fruit trees and their uses. Secondly an individual interview of one selected member of each household was carried out using a semi-structured questionnaire to gather data on individual fruit consumption and nutritional awareness. Finally, a field survey of each farm, conducted preferably with the household head, counted all fruit tree species and individuals, at the same time documenting additional data. Further general data was collected from the respondent on each fruit tree species (Bliault, 2012). Households were interviewed and all fruit tree on-farm were logged in a tree inventory. Mean species richness was 36 (including 21 indigenous species), mean species richness per farm was 6.7. 2.2.4 Importance of fruit consumption 2.2.4.1 Impact of socio-economic factors on fruit consumption Socioeconomic status plays an important role in fruit and vegetable intake. Researchers are now seeking to assess the importance of socio-economic factors such as food prices and food availability on food intake and consequently on weight outcomes of individuals (Powell & Bao 2009). Cheaper foods with high energy content are known to contribute to obesity in both children and adults. Studies have shown that when the prices of fruits and vegetables are higher than the prices of fast food such as French fries (chips) and other cheap energy-dense cereal based diets commonly fed to children, consumption of fruit and vegetables decreases (Powell & Bao 2009). On the other hand, lower fruit and vegetable (but not other foods) prices predicted 18 a lower risk of obesity in younger children who ate more fruits and vegetables (Powell & Bao 2009). In a study by Haire-Joshu (2004:309-314) amongst African American women, higher income was associated with higher fruit and vegetable intake, exposure, and preference. The American study by Powell and Bao (2009), among children between 6-17 years of age, living in the same household as their mothers, found that a ten percent increase in the price of fruits and vegetables was associated with a 0.7% increase in child BMI. This association was strongest in children from low versus high socioeconomic status. Children who had increased access to supermarkets as well as those with mothers who worked (and were thus less likely to be involved in directly caring for their children), were more likely to have a higher BMI. In a study by Valmórbida and Vitolo (2014), low paternal education was associated with lower consumption of fruits and vegetables, possibly due to the fact that low parental education is associated with lower understanding of health and nutritional needs (Valmórbida and Vitolo 2014). Powell and Bao (2009), found a significant association between higher maternal education and lower BMI of children (lower prevalence of child obesity). In their study, children of more highly educated mothers had a lower BMI, possibly due to higher consumption of fruits and vegetables, compared to those children whose mother did not attend high school. 2.2.4.2 Importance of fruit consumption on food security and dietary diversity According to Galhena et al. (2013:1), a majority of hungry and malnourished people live in developing countries under low socio-economic conditions. Globally, home gardens have been documented as an important supplemental source contributing to food and nutritional security and livelihoods (Galhena et al., 2013:2). Home gardens are classified as mixed kitchen, backyard, compound or homestead garden (Galhena et al., 2013:2) and maintain a high agrobiodiversity of fruits, vegetables, herbs, medicines, yams and spices that help to increase the number of food groups consumed by the household hence high dietary diversity. The nutritional value of foods is the result of complex interactions between crops and their environment, for example, the 19 production of many fruits such as apples and pears is dependent on a host of bees and other insects to pollinate flowers hence fruit development (DeClerck, 2013:21) hence importance of biodiversity from all ecosystems and agricultural biodiversity. Human livelihoods are dependent on agricultural land uses, for production of healthy foods, clean water and other ecosystem services (DeClerck, 2013:27). Fruit intake can contribute to reducing hunger. Fruits have a high fiber content and thus increased consumption may increase satiety and reduce hunger. Fiber provides bulk to the diet and includes celluloses, hemicelluloses, and pectin, which are not extensively digested because of the lack of enzymes capable of hydrolyzing such substances (Crujeiras et al., 2010:362). Fruits also often have a low glycemic index (GI) that may results in a slower increase in blood glucose after consumption resulting in sustained levels of energy. It is important to ensure availability of fruits and vegetables at home. There is an association between fruit and vegetable availability at home and its consumption, as well as in influencing taste preferences in children (Neumark-Sztainer et al., 2003). Dietary diversity is defined as the variety of foods in a diet over a given period of time (Ruel, 2002). National dietary guidelines consistently recognize and promote the importance of diverse diets (Berti & Jones 2013:187). When a significant percentage of a population obtains energy from consumption of meat, dairy products, and fruits and vegetables instead of consumption of cereals and other root crops, this implies that the country is relatively more food secure (Food Security Poverty Nut Policy, 2014:120). Increased intake of whole grains, vegetables, and fruits diversifies diets (USDA, 2010:16). Dietary diversity is therefore a qualitative measure of food consumption that reflects household’s access to a variety of foods and is a proxy for nutrient adequacy of the individual’s diet (FAO, 2011:1). Dietary diversity is scored based on the food groups consumed by a household or an individual (FAO, 2011:1). FAO, (2011), has grouped all food that is eaten into 16 food groups that include cereals such as maize and millets; white roots and tubers that include yams and cassava; vitamin A rich vegetables and tubers that include carrots and sweet potato; dark green leafy vegetables that include traditional leafy vegetables such as African nightshades and spinach; other vegetables (tomato and eggplant); vitamin A rich 20 fruits (ripe mango, papaya); other fruits (tamarind and baobab fruit); organ meat (liver, kidney); flesh meats (pork, game meat); eggs (from duck, chicken); fish and seafood (crab, squids, prone); legumes, nuts and seeds (dried peas, sesame); milk and milk products (yoghurt, milk); oils and fats (butter, oils); sweets (honey, cakes); and spices, condiments and beverages (salt, black pepper, tea) (FAO, 2011:8). There is lack of diversity in the developing world where diets consist mainly of starchy staples with less access to nutrient-rich sources of food such as animal proteins, fruits and vegetables (Fanzo & Hunter, 2013). Sub-Saharan Africa continues to be overburdened by nutritional and diet related health problems, most of which can be traced to insufficient dietary intakes of micronutrients (vitamin A, iron and zinc in particular), and in the recent past, increases in the consumption of cheap, energy-dense staple foods. This diet is associated with increased prevalence of obesity and other diet-related chronic diseases (Mendez et al, 2005). Individuals with diets with a very low diversity (usually the very poor, very food insecure), consume diets that include large amounts of staple foods, which in most settings are starchy cereals, roots or tubers that are of relatively low nutrient density. When slightly higher levels of diversity are found in less poor households, this is often due to the addition of a few fruits and vegetables, and these contribute nutrients that were not present or that were present in low concentrations in the staple food. Dietary health gains may be achieved by increasing the total consumption of fruits and vegetables (Jamison, 2003:4). Higher levels of diversity are associated with higher consumption of fruits and vegetables, and nutrient-dense animal-source foods (e.g. meat, eggs, milk), increasing the likelihood that nutrient requirements will be met (Berti & Jones 2013:189). Fruit and vegetables can be consumed fresh, canned, or as juice (Crujeiras et al., 2010:361). Over recent years the diet in sub-Saharan Africa has changed only marginally with cereals, starch roots, and pulses (the low-cost food) still comprising seventy percent of the region’s energy consumption, while the share of meat and dairy products (higher cost food) continues to be very low (Food Security Poverty Nut Policy, 2014:119). 21 Diets of adults and children containing a greater number of different foods or food groups are associated with greater energy and nutrient intakes as well as more adequate nutrient intakes. Furthermore, it is positively associated with adult and child nutritional status, birth weight and other health outcomes, including better cognitive function, improved haemoglobin concentrations, a reduced incidence of cancer and decreased mortality (Berti & Jones, 2013:188). 2.2.4.3 Importance of fruit consumption for promoting health and combatting disease Food production and vegetable and fruit consumption per capita in Africa has been declining in recent decades and this has complicated the nutrition problem in Africa with increased incidences of obesity, diabetes, cardiovascular disease, high blood pressure and cancer (Bisseleua & Niang, 2013:113). Fruits and vegetables contribute important nutrients to the human body. Fruits and vegetables are relatively low in energy, but are good sources of many important nutrients, including potassium, vitamin C, folate, fiber, and numerous phytochemicals (CDC, 2011:3; Wolf & Elmadfa 2010:165; Crujeiras et al., 2010:361), which have beneficial health effects. Other compounds with beneficial effects on health include polyphenols and tannins. Polyphenols and tannins have antioxidant, anti-inflammatory, anticancer, and cardio-protective properties and are found in berries, grapes, pomegranates, and fruit skin (Crujeiras et al., 2010:370). Fruits such as baobab pulp and crossberries can make a significant contribution to the vitamin C and iron requirements of children. In addition to micronutrients, fruits such as tamarind (Tamarindus indica) and baobab contribute much to energy supply due to their sugar content (Kehlenbeck et al, 2013). Free radicals and related species are mainly derived from oxygen (reactive oxygen species/ROS) and nitrogen (reactive nitrogen species/RNS), and are generated in the body by various endogenous systems, exposure to different physicochemical conditions or pathophysiological 22 states (Devasagayam, 2004:1). A high intake of foods rich in natural antioxidants increases the antioxidant capacity of the plasma (Hassimotto, 2009:394). Free radicals can adversely alter lipids, proteins and DNA and have been implicated in aging and a number of human diseases such as cancer and heart disease (Devasagayam et al., 2004:1). Antioxidants’ are substances that neutralize free radicals or their actions (Devasagayam et al., 2004:1, Whitney & Rolfes, 2013:360). The body’s natural defenses and repair system try to control the destruction caused by free radicals but these systems are not a hundred percent effective. To some extent dietary antioxidants defend the body against oxidative stress (Whitney & Rolfes, 2013:360). Vitamins that have antioxidant properties include vitamin E, beta-carotene, and vitamin C (Whitney & Rolfes, 2013:361). Vitamin E and beta-carotene defend cell membranes and lipoproteins by stopping the free radical chain reaction (Miyashita & Hosokawa, 2014:330; Whitney & Rolfes, 2013:361). Vitamin C protects tissues such as the skin and blood against free radical attacks (Whitney & Rolfes, 2013:361). Other micronutrient-derived antioxidants include flavonoids and related polyphenols, α-lipoic acid and glutathione (Devasagayam et al., 2004:1). Vitamin C is readily found in fruits and vegetables (Hassimotto et al., 2009:396), while flavonoids and carotenoids are also commonly found in fruits and vegetables. Nutrients and phytochemicals with antioxidant activity minimizes damage and prevent disease through limiting free radical formation, destroying free radicals or their precursors, stimulating antioxidant enzymes activity, repairing oxidative damage, stimulating repair enzyme activity and supporting a healthy immune system (Whitney & Rolfes, 2013:361). Epidemiological research has identified a strong link between increased fruit and vegetable consumption and decreased risk of developing chronic diseases that include cancer, heart disease and stroke (Duyn & Pivonka, 2000). These chronic diseases are associated with insufficient consumption of fruits and vegetables (Wolfenden et al., 2012). The World Cancer Research Fund and the American Institute for Cancer Research (AICR) has estimated that diets high in vegetables and fruits (more than 400 g/day) could prevent at least twenty percent of all cancers (Duyn & Pivonka, 2000). Antioxidants in vegetables and fruits are likely to protect against cancers, 23 cardiovascular disease and stroke (Duyn & Pivonka, 2000). There is emerging evidence on the positive role of fruit and vegetable consumption in reducing risks of cataracts, diverticulosis, cataracts and chronic obstructive pulmonary disease (COPD) and hypertension (Duyn & Pivonka, 2000). In the review by Duyn and Pivonka (2000), it was reported that, a diet rich in fruits and vegetables may delay cataracts, prevent asthma and bronchitis, COPD in children, and treat hypertension. Fruits and vegetables in general help to reduce the risks of gastric, esophageal and lung cancer (Whitney & Rolfes, 2013:363). Beta-carotene decreases the risk of colorectal cancer. Other carotenoids such as beta-cryptoxanthin decrease the risk for lung cancer, while lycopene and Vitamin E decrease the risk for prostate cancer (Whitney & Rolfes, 2013:363). The review by Duyn and Pivonka (2000), showed that fiber, found mostly in fruits and vegetables, can help control high serum cholesterol levels and protects against diverticulosis. Folic acid, found mostly in green leafy vegetables and some citrus fruits, may protect against heart disease, hypertension and cancer. In this review, Duyn and Pivonka (2000) reported that potassium is found in a variety of vegetables and fruits and is known to help in the control of hypertension. Carotenoids belong to the tetraterpene family that is principally found in plant foods (such as fruits and vegetables), algae, photosynthetic bacteria, and animals. These are the most important pigments in determining the various colors of plants and animals. Several carotenoids such as β-carotene and β-cryptoxanthin are well known as provitamin A carotenoids (Miyashita & Hosokawa, 2014:330). Carotenoids are present in fruits such as tangerine, orange, yellow fruits, grapefruit, watermelon and vegetables such as carrot, tomatoes, pumpkin, spinach, kale, chard, turnip, beet, broccoli and romaine lettuce (Crujeiras et al., 2010:369). Fructo-oligosaccharides from fruits are important for bone protection, immunomodulation, anticancer properties and improvement of gastrointestinal conditions. The vitamin tocopherol is found in kiwi fruit and green leafy vegetables, spinach, carrot and avocado and is responsible for antioxidant, anticancer and cardio-protective effects (Crujeiras et al., 2010:370). Vitamin C from fruits is essential for absorbing iron. Indigenous fruits contribute to the vitamin and mineral supply of local communities, e.g. baobab (Adansonia digitata) for vitamin C, marula 24 (Sclerocarya birrea) for betacarotene and white crossberries (Grewia tenax) for iron (Kehlenbeck et al., 2013). A high proportion of women of reproductive age consume diets that are low in fruit and vegetables and as a result adequate intakes of essential nutrients such as folate, vitamin C and β-carotene cannot be guaranteed. This can have an adverse effect on the health and development of their unborn children (Wolf and Elmadfa 2010:168). Folate is a water-soluble B vitamin present in legumes, leafy green vegetables (such as spinach and turnip greens) and some fruits (such as citrus fruits and juices) (De-regil et al., 2010:3). Insufficient folate and folic acid intake is associated with a number of birth defects that may also relate to genetic and environmental factors functioning before conception or during early pregnancy (De-Regil, 2010:3). Neural tube defects, which include anencephaly, spina bifida and encephalocoele, are congenital malformations that arise during the structural development of the neural tube, a process that is completed within 28 days after conception (De-Regil, 2010:3). Folic acid is also cardio-protective (decreasing homocystein levels) and is found in most fruits (Crujeiras et al., 2010: 2010:369). The interaction between undernutrition and infection creates a potentially lethal cycle of worsening illness and deteriorating nutritional status (UNICEF, 2013). Such infections include gastro-intestinal tract infections, respiratory tract infections, and urinary tract infections amongst others. Fruits have beneficial effects of preventing these infections. Cranberry juice has been proposed to prevent urinary tract infections (Blasa et al., 2010). A review by Wolfenden et al. (2012), reported that fruit and vegetable consumption in childhood may be beneficial in reducing the risks associated with micronutrient deficiencies and respiratory tract infections. As far as minerals are concerned, potassium has cardio-protective functions and is found in fruits in general, especially banana, plums, orange as well as in vegetables in general, especially legumes, tomato, artichoke acorn squash and spinach (Crujeiras et al., 2010:370). 25 2.2.4.4 Benefits of fruit consumption on growth and weight status Body weight status can be categorized as underweight, healthy weight, overweight, or obese. Body mass index (BMI) is a useful tool that can be used to estimate an individual’s body weight status. BMI is a measure of weight in kilograms (kg) relative to height in meters (m) squared. The terms overweight and obese describe ranges of weight that are greater than that considered healthy for a given height, while underweight describes a weight that is lower than that considered healthy for a given height (USDA, 2010:9). Child undernutrition is assessed by measuring height and weight and screening for clinical manifestations and biochemical markers. Indicators based on weight, height and age can be compared to international standards and are most commonly used to assess the nutritional status of a population. Stunting (inadequate length/height for age) is an indicator of chronic undernutrition; wasting (inadequate weight for height) is an indicator of acute undernutrition; and underweight (inadequate weight for age) is an indicator that includes elements of stunting and wasting (UNICEF, 2013). There is evidence that shorter maternal stature is a risk factor for mortality in offspring, underweight, and stunting (Özaltin et al., 2010). Over 1 billion people are overweight and obese in both the developed and developing world (Fanzo et al., 2013). Adequate consumption of fruit and vegetables in mothers is of utmost importance, for the health of the mothers themselves as well as the growth, development and health of their children. Fruit intake in mothers can shape the food preferences and thus the fruit and vegetable consumption patterns of their children (Wolf & Elmadfa, 2010:161, with important implications for growth and well-being; Özaltin et al., 2010). There are also 171 million children under five years of age who are stunted (Fanzo & Hunter 2013). Mothers should be encouraged to eat plentiful amounts, as well as a variety, of fruit and vegetables during pregnancy and lactation, not only to guarantee satisfactory nutrient intake levels (for example that of folate), but also with regards to the early introduction of these foods to their infants (Wolf & Elmadfa, 2010:166). 26 As far as consumption of fruit juice is concerned, Rampersaud et al. (2003) have reported that children who consume 100% fruit juices achieve recommended intakes of essential nutrients such as vitamin C, folate and magnesium more easily. A study by Newby et al. (2004:1090) found a lack of association between fruit juice consumption and weight change. The study did not show an association between beverage consumption and changes in weight or BMI in the population of low-income preschool children. Overall, current scientific evidence does not support a positive association between fruit juice consumption and obesity, indicating that fruit juice can still be recommended to children in reasonable amounts because it is an important source of nutrients and energy (Newby et al., 2004:1092). It is, however, important to monitor intake of fruit juice in children and adolescents, especially those who are overweight or obese (USDA, 2010:16). Scientific evidence supporting the unique health benefits derived from eating fruits and vegetables is growing rapidly (Duyn & Pivonka, 2000). Fruits and vegetables have properties that are advantageous in weight loss (Rodriguez-Rodriguez et al., 2010:441-3). In overweight persons, weight loss lowers the risk of developing many chronic diseases (USDA, 2010). Moderate evidence in adults and limited evidence in children and adolescents suggests that increased intake of vegetables and/or fruit may protect against weight gain (USDA, 2010:16). In contrast, a study by Rieth et al. (2012) among adolescent boys and girls 12 to 19 years-old living in southern Brazil showed that overweight was associated with increased intake of five servings a day of fruits and vegetables combined. It is possible that the high intake of fruits was in the form of fruit juice, which may be associated with weight gain (other than the intake of fresh fruits). Fresh fruits and vegetables contain large quantities of water; their weight and volume is therefore high while their energy content is low. A review by DeClerck (2013) showed that obesity was associated with a significant decrease in the level of diversity. 27 CHAPTER 3 METHODOLOGY 3.1 INTRODUCTION The main focus of this study was to compare the health and nutritional status of pre-school children and their mothers/caregivers in Western Kenya with different levels of fruit consumption. 3.2 STUDY DESIGN A descriptive, cross-sectional study design was adopted. 3.2.1 Sample selection The population and sample are discussed in the following section. 3.2.1.1 Population Tables 3.1, 3.2 and 3.3 indicate recent estimates of the under 5 years population by region, age and gender according to the Kenya Integrated Household Budget Survey (KIHBS) 2005-2006. Table 3.1: Age distribution of children <10 years in Kenya the year 2005-2006 (KIHBS, 2006:12 Table 3.2) Age (years) Total % of children in the population Total Count 0-4 14.6 5 177 183 5-9 14.5 5 149 903 28 Table 3.2: Age distribution of Population in Kenya the year 2005-2006 (KIHBS, 2006:13 Table 3.3) Kenya Rural Urban Age group Total Count Gender Ratio Overall 35 514 542 97.1 0-4 5 177 183 101.5 5-9 5 149 903 100.7 Overall 28 363 345 96.6 0-4 4 158 429 101.6 5-9 4 305 158 102 Overall 7 151 197 99.3 0-4 1 018 754 101 5-9 844 745 94.3 Table 3.3: Percentage Distribution of Children (<5 years) by Gender in Kenya the year 20052006 (KIHBS, 2006:112 Table 6.5) Region / Gender / Age Male Female Total Count Kenya 50 50 5 136 214 Rural 50.1 49.9 4 129 900 Urban 49.5 50.5 1 006 314 0 - 5 Months 46.2 53.8 678 290 6 - 11 months 51.5 48.5 403 477 12 - 23 months 51.5 48.5 1 006 733 24 - 35 months 50.1 49.9 1 061 387 36 - 47 months 51.2 48.8 1 040 786 48 - 59 months 48.9 51.1 945 542 Busia 51.7 48.3 84 385 Kakamega 48.9 51.1 108 702 3.2.1.2 Busia County Busia County is home to the Luhya ethnic group of people in rural parts and mixed groups of people who have migrated from other regions. Busia District is one of the counties in Western 29 Province covering an area of 1261.3 sq km. About 137 km2 of Lake Victoria water surface is in the county. The district borders Bungoma district to the northeast, Teso district to the North. Siaya district to the southeast, Bondo District to the south and the Republic of Uganda to the west (NCAPD, 2005b:3) (see Figure 3.1). Busia County has four agro-ecological zones (AEZ) that include, lower medium (LM) 1-4 with the wetter LM1 in the centre of the county (Linne et al., 2013:11) the average farm size here is 0.5 ha (International Livestock Research Centre:Online). The district has six administrative divisions namely Budalangi, Butula, Funyula, Matayos and Township. Township division has the highest population density of 1133 while Budalangi Division has the lowest density of 174 (NCAPD, 2005b:3). The smallest administrative division is Township, which covers an area of 22.2 km² while the largest division is Budalang’i with an area of 306.5 km² (NCAPD, 2005b:3). During 2009 Kenya census, Busia County was found to be one of the least populated counties in Western Kenya with a total of 488 075 people. The recent KIHBS, 2005-2006 indicated that Busia district had a total of 84 385 children below 5 years (KIHBS, 2006:112 Table 6.5). The district has in total twenty-six health facilities of which one is a government hospital, four are private, 1 is a mission hospital and 21 are health centres/dispensaries (NCAPD, 2005b:8). The greatest challenge for the health sector in the district include inaccessibility by the majority of the people due to high costs, inadequate or poorly equipped health facilities, staff shortage and lack of maintenance of the health facilities. The average distance to a health facility is 4 kilometers. The doctor patient ratio stands at 1: 41 200. The most prevalent diseases include malaria; respiratory transmitted Infections (RTI), and diarrhea (NCAPD, 2005b:9). In Busia county, 23.4% children below 5 years are stunted (height-for-age) and 13.8% are underweight (weight-for-age) during the year 2012 (Ministry of Health, online). 30 Figure 3.1: Map 1; Location, Administrative Areas and Population Densities (map includes part of newly created Teso District) (NCAPD, 2005b:4) 31 3.2.1.3 Kakamega County Kakamega County is in Western Province. It borders Butere, Mumias and Bungoma counties to the West, Nandi District to the East, Vihiga District to the South and Lugari District to the North. 0 0 The District lies between longitudes 34 32” and 35 57’30”east of the prime meridian and 0 0 latitudes 0 07’30” North and North 0 15” of the equator. There are seven administrative 2 divisions with 27 locations and 97 sub-locations covering a total area of 1 394.8km (NCAPD, 2005:3). Agro - ecological zones (AEZ) in Kakamega county range from Upper Highland zone one (UH1) to Lower Midland zone four (LM4) (Mudavadi et al., 2001:3). Kakamega district covers a total land area of 916 square kilometres of which 879 sq. Km. is arable land and 37 sq. Km. is covered by Kakamega Forest (Mudavadi et al., 2001:12). The District has about 100,760 farm families with an average family size of 8 persons per household and a mean farm size of 0.8 hectares (1.5 acres) (Mudavadi et al., 2001:12). There are three local authorities in the district, namely Kakamega Municipal Council, Kakamega County Council and Malava Town Council. The three local authorities have 37 electoral wards. Kakamega country council has 13 wards, Kakamega Municipal Council has 13 wards, and Malava Town Council has four wards. There are four constituencies in the district namely, Ikolomani, Shunyalu, Malava and Lurambi (NCAPD, 2005:3). During the 2009 Kenya census, Kakamega County was one of the most populated counties in Western Kenya with a population size of 1 660 65. The recent available KIHBS, 2005-2006, estimates of percentage distribution of children (under 5 years) by gender indicated that Kakamega district had a total of 108 702 children below 5 years (KIHBS, 2006:112 Table 6.5). Kakamega County is the home of the Luhya ethnic group, (UNEP, 2008:11), a group that is present throughout western Kenya and across the border into Uganda (Maurice, 2006:65). The urban area of Kakamega has different ethnic groups who have migrated there (Figure 3.2). Kakamega district has a total of 55 health facilities of which 12 are hospitals, 15 health centres, 20 dispensaries and 8 clinics (NCAPD, 2005:8). The greatest challenge facing the health sector in 32 the district include inaccessibility by the majority of the people to medical services due to high costs, inadequate or poorly equipped health facilities, staff shortage and lack of maintenance of the health facilities. The average distance to a health facility is 10 kilometers in rural areas and 500 m in urban areas. The doctor: patient ratio stands at 1: 14 246. The most prevalent diseases in the district are malaria, skin diseases, diarrhea and respiratory tract infections (RTI) (NCAPD, 2005:8). In Kakamega county, 23.4% of children below 5 years were reported to be stunted (height-for-age) while 10.2% were underweight (weight-for-age) during the year 2012 (Ministry of Health, online). 33 Figure 3.2: Map 2; Location, Administrative Areas and Population Densities (NCAPD, 2005:4) 34 Kakamega District is an agricultural district with 62% of the population involved in agricultural activities. The food crops grown include maize, beans, millet etc., while the cash crops are tobacco, coffee, sugarcane and cotton among others (NCAPD, 2005:10). 3.2.1.4 Sample Busia and Kakamega are both rural environments. This study sampled a total of 96 households that had been previously selected from different agro-ecological zones from Busia (Figure 3.3) and Kakamega (Figure 3.4). These were the project areas in western Kenya already identified by ICRAF for assessing fruit consumption. This study was a follow-up to another study by Bliault (2012) and therefore the same sample was included, thus for the current study this is a sample of convenience. The study by Bliault (2012) determined on-farm fruit tree species richness, abundance and diversity in Busia County, Western Kenya. Data was also collected to help understand the contribution of fruit to family nutrition. Bliault (2012) sampled 60 household survey points in Busia County from four agro-ecological zones, selected through randomly generated global positioning system (GPS) points (Figure 3.3). However, the researcher simply randomly selected 45 survey points (from the 60) and included in the present study. An additional 51 farms were sampled from Kakamega County in two agro-ecological zones selected for the present study through randomly generated GPS points (Figure 3.4). However, the fruit trees have not been surveyed in this area. Farms were selected using randomly generated GPS points generated by the World Agroforestry Centre (ICRAF), Nairobi, Kenya. The household closest to the given GPS location was surveyed, as determined by GPS receiver. Only one mother/caregiver with the youngest child (below 5 years) in the household was selected for the interview. Before conducting the survey a letter of consent (Appendix A) and the information document (Appendix B), was given to the mothers/caregiver to seek consent from the mother/caregiver and their child to participate in the study. The Kenya – research clearance and authorization document was also presented to the mother to show that the research was permitted (Appendix C). 35 Figure 3.3 below shows map of Busia County showing the 60 household survey points from Busia and the 45 more randomly selected survey points for this study. Figure 3.4 below shows map of Kakamega County showing the 50 household survey points from Kakamega and the 51 more randomly selected survey points for this study. 36 Figure 3.3: Map of Busia County with 45 households in 4 AEZ sampled (LM1, LM2, LM3 and LM4) 37 Figure 3.4: Map of Kakamega County with the 51 households from 2 AEZ sampled (LM1 and LM2) 38 The children between 6 months (because children are ideally exclusively breastfed until the age of 6 months when weaning should start) and 5 years and their mothers or caregivers from the 96 selected households were included in the sample. Inclusion criteria for child and mother to be involved in the study: From the 96 previously selected households: All children 6-59 months All mothers / caregivers present that had signed the informed consent form (appendix A) and received the information document (appendix B). 3.3 MEASUREMENTS All the data from questionnaires and measurements was collected during the same season, at the beginning of the year from February to June 2013. The previous study on agro-biodiversity was also undertaken during the same months of the year (January to April 2012). 3.3.1 Variables and operational definitions This section describes operational definitions that were used when collecting information on socio-demographics, nutritional status (household food security information, household dietary diversity, and anthropometry), and health status (medical history) of mother. 3.3.1.1 Socio-demographic and household information (Appendix D) For the purpose of this study socio-demographic information of the household included, household location, general information on age, gender, language, type of dwelling, household size, employment status and income. Household density was calculated using a cut-off in literature of 2.5 and higher than 2.5 indicating high density that indicates low socioeconomic status. Other information that was collected included water and sanitation, cooking facilities and household income, source of energy and food storage facilities. 39 3.3.1.2 Nutritional status i) Household food security information (Appendix E) For the purpose of this study information on household food security referred to total money spent on food on a weekly basis, main source of income, growing of fruits and vegetables and other crops, keeping livestock, challenges faced during food producing, accessibility to markets and household values related to serving food. A hunger scale that included food shortages and hunger coping mechanisms used by each family was also included. ii) Household dietary diversity (Appendix F) Dietary diversity is a qualitative measure of food consumption that reflects household access to a variety of foods, (such as cereals, white roots and tubers, legumes nuts and seeds, spices condiments and beverages, milk and milk products, meats, eggs, fish and fish products, vitamin A rich vegetables and fruits, sugar and sweets, oils and fats), and is also a proxy for nutrient adequacy of the diet of individuals (FAO, 2011:5). The intake of foods eaten by household members at home (excluding foods purchased and eaten outside the home) (FAO, 2011:7) was included. The household dietary diversity score (HDDS) is meant to reflect, in a snapshot form, the economic ability of a household to access a variety of foods (FAO, 2011:5). There are no established cut-off points in terms of number of food groups to indicate adequate or inadequate dietary diversity for the HDDS. Because of this it is recommended to use the mean score or distribution of scores for analytical purposes (FAO, 2011:26). For the purpose of this study, a dietary diversity score of < 3 food groups was considered low, a dietary diversity score of 4-5 was considered medium and a dietary diversity score >6 food groups was considered high (FAO, 2011:29). 40 iii) Fruit intake information (Appendix G) For the purpose of this study, fruit intake information was determined with a quantitative food frequency questionnaire (QFFQ). The Dietary Assessment and Education Kit (DAEK) developed by the Chronic Diseases of Lifestyle (CDL) Unit of the Medical Research Council (Steyn & Senekal 2004) was used by the student researcher for collection of fruit intake data. The QFFQ from the DAEK and instructions for the interviewer/recorder of dietary intake data was used. The quantities of fruit intake recorded on the questionnaire was converted to gram weights using the Food Quantities Manual developed by the researcher in a previous study, and processed by using the Food Finder 3 programme from the Medical Research Council (Foodfinder3, 2002). For the purpose of this study, the QFFQ of the DAEK were adapted to include fruits commonly eaten in Kenya. For this purpose, the findings of focus group discussion used in a previous study that was conducted to gather information on names of commonly consumed fruits in Western Kenya (Butere, Mumias) and Migori district by Imbumi, (unpublished) was used. The focus groups were also used to generate information about dietary practices, fruit and other food preferences and preparation methods and an overall food list that was used to modify the existing QFFQ. The three communities (Migori, Butere and Mumias) were engaged in estimating the usual fruit quantities consumed by mothers and children below 5 years. For the current study, the food quantity manual developed from the previous study were used during interviews to estimate the amount of fruits (portion sizes) consumed by children and mothers/caregivers one month preceding the survey. Where necessary, a digital kitchen scale was used to weigh some fruits found in the household that were not included in the food quantity manual. iv) Anthropometric measurements (appendix H) Anthropometry is used to describe nutritional status and this can be useful for problem analysis and for evaluation (Cogill, 2003:70, Whitney & Rolfes 2013). For the purpose of this study, undernutrition was considered to be malnutrition, whereas overnutrition was referred to as either overweight or obesity. Anthropometric variables for adults included: height; weight; body41 mass-index; and waist circumference. Anthropometric variables for children included: height/length; weight; and mid-upper-arm-circumference. a) Adults Body mass index (BMI) Body mass index (BMI) is based on a weight-to-height ratio (Cogill, 2003:72, Whitney & Rolfes 2013:E-7). The BMI calculated as body mass in kilograms divided by the height in meters squared (NHLBI, 1998:xiv; Cogill, 2003:72) and is categorized as follows. Table 3.4: Body Mass Index Categories BMI (kg/m2) < 18.5 Classification Underweight 18.5–24.9 25.0–29.9 >30.0 Normal weight Overweight Obese Waist circumference The waist circumference is recommended to determine abdominal fat. For Sub-Saharan Africans European data for measuring central obesity is used (Alberti et al., 2006:476). A waist circumference of ≥ 94 cm in men, and ≥ 80 cm in women is used (Alberti et al., 2006:476) to indicate increased risk for chronic diseases of lifestyle as indicated in Table 3.5. Table 3.5: Country/ethnic-specific values for waist circumference (Alberti et al., 2006:476 Table 6) Country/ethnic group Europids Sub – Saharan Africans Male Female Waist circumference (as a measure of central obesity) ≥ 94 cm ≥ 80 cm Use European data until more specific data are available 42 b) Children For children, weight, height/length and mid-upper-arm-circumference were measured. References are used to standardise a child’s measurement by comparing the child’s measurement with the median or average measure for children at the same age and gender (Cogill, 2003:39, WHO, 2008a). Taking age and gender into consideration, differences in measurements can be expressed in a number of ways such as standard deviation units, or Z-scores; percentage of the median or percentiles (WHO, 2008a). Height and weight For height/length and weight measurements, the Z-score or standard deviation unit (SD) is defined as the difference between the value for an individual and the median value of the reference population for the same age or height/weight, divided by the standard deviation of the reference population (Cogill, 2003:40, WHO, 2008a). Growth indicators are used to assess growth considering a child’s age and measurements together and include: length/height-for-age weight-for-age weight-for-length/height (WHO, 2008a:1). The WHO Global Database on Child Growth and Malnutrition uses a Z-score cut-off point of <-2 SD to classify low weight-for-age, low height-for-age and low weight-for-height as moderate undernutrition, and <-3 SD to define severe undernutrition. The cut-off point of >+2 SD classifies high weight-for-height as overweight in children (WHO, 2012:online). The weight and height/length was used to generate Z-scores that were compared to the WHO reference population and for measuring stunting, underweight and wasting in both boys and girls. Height-for-age Z-scores (HAZ) below −2 SD are associated with stunted growth, which in turn reflects chronic malnutrition. Weight-for-age (WAZ) scores below −2 SD are associated with 43 low body mass, reflecting acute malnutrition (Abubakar et al., 2008). A child is usually identified as underweight or wasted if the Z-score for, respectively, weight-for-age or weight-for-height is below the same threshold as above (below −2 SD) (Tarozzi, 2008:457-458). WAZ, HAZ and WHZ were classified as severe malnutrition (< -3 SD), moderate malnutrition (< -2 SD and > -3 SD) and mild malnutrition (< -1 SD and > -2 SD), normal (+1 SD) and overweight (>2 SD). The applied criteria for Z-scores < -2 SD includes: Table 3.6: Cut-off points for wasting, underweight and stunting in children (WHO, 2012:online) Measurements Standard deviation Type of malnutrition Weight-for-height <-2 SD Wasting Acute, severe malnutrition Weight-for-age <-2 SD Underweight Acute malnutrition Height-for-age <-2 SD Stunting Chronic malnutrition Z-score = (observed values)-(median reference values) Standard deviation of the reference population (Cogill, 2003, p.40-42: Abubakar et al., 2008: Tarozzi, 2008:457-458: WHO, 2012:online). Mid-upper-arm-circumference The mid-upper-arm-circumference was also used for measuring wasting and malnutrition in boys and girls. A cut-off of 11.0 cm is used for screening severely malnourished children. Those children with MUAC below 12.5cm, with or without edema are classified as moderately and severely malnourished (Cogill, 2003:41, WHO & UNICEF, 2009). 44 3.3.1.3 Health information (Appendix I) In this study, health information of mothers included marital status and care for orphans, history of smoking, snuffing and alcohol consumption, duration of sleeping and depression, and HIV related information. 45 3.3.2 Techniques In this section techniques related to determining socio-demographic information of the mother/caretaker, nutritional status and the health status (medical history) of mother and child will be described. Questionnaires listed in Appendix D to I were administered by the researcher, in the language of choice. 3.3.2.1 Socio-demographic and household information A questionnaire completed in a structured interview was completed in each household. 3.3.2.2 Nutritional status i) Household Food Security information Information on household food security was obtained through a questionnaire completed in a structured interview with each mother. All the interviews were performed by the student researcher. ii) Household dietary diversity This study assessed the foods consumed at a household level (FAO, 2011:5). The person who was responsible for meal preparation for the household the previous day was interviewed to obtain information on food intake of the household. The respondent freely recalled what was eaten by household members the previous day, mentioning all the foods (meals and snacks) eaten the previous day, during the day and night, starting with the first food/drink consumed the previous morning. These items were recorded in the spaces provided at the top of the questionnaire under breakfast, snack, lunch, snack, dinner, and snack. After the respondent had recalled all the foods and beverages consumed, the corresponding foods in the list under the appropriate food group were underlined. If the food was found not listed in any group, it was written in the margin and discussed with the supervisor. According to the FAO (2011:21) guidelines, the researcher had to probe for snacks eaten between main meals, special foods given 46 to children or lactating/pregnant women and for added foods such as sugar in tea, oil in mixed dishes or fried foods (FAO, 2011:21). If a mixed dish was eaten, the researcher had to ask about and underline all the ingredients of the dish. Once the recall was finished, the researcher had to probe for food groups where no food was underlined. For food groups that were not previously indicated, letter “0” was written in the right hand column of the questionnaire when it was certain that no foods in that group were eaten (FAO, 2011:22). Dietary diversity involved scoring diversity by a simple count of food groups that a household or an individual had consumed over the preceding 24 hours. All items that required household resources to obtain, such as condiments, sugar and sugary foods, and beverages, were included in the score (FAO, 2011:23). Food groups were aggregated from the questionnaire (FAO, 2011:Table 3), and Dietary Diversity Scores (DDS) were calculated by summing the number of food groups consumed in the household over the 24-hour recall period and classifying them as high (more than 6); medium (4-5) and low (3 or less) (FAO, 2011:25). In order to calculate the household dietary diversity score we included a total of 12 food groups according to FAO, 2011 as elaborated in table 3.7 below. The table below thus shows the food groups that were aggregated while calculating the household dietary diversity score. 47 Table 3.7: Aggregation of food groups from the questionnaire to create Household Dietary Diversity Score (HDDS) Question number(s) 1 2 3,4,5 Food group Cereals White tubers and roots Vegetables1 6,7 Fruits2 8,9 Meat3 10 Eggs 11 14 Fish and other seafood Legumes, nuts and seeds Milk and milk products Oils and fats 15 Sweets 16 Spices, condiments and beverages 12 13 Aggregated food groups 1 The vegetable food group is a combination of vitamin A rich vegetables and tubers, dark green leafy vegetables and other vegetables. 2 The fruit group is a combination of vitamin A rich fruits and other fruits. 3 The meat group is a combination of organ meat and flesh meat. Adopted from FAO, 2011 iii) Fruit intake data A QFFQ was completed for all children and mothers/caregivers to determine fruit intake information, 30 days preceding the study. Mothers were interviewed about their own fruit intake and other foods as well as the fruit intake of their children. All the interviews were conducted in Luhya and Swahili languages. The QFFQ consisted of a predetermined food list (that includes fruits), it included portion sizes, plus a frequency response option for respondents to report how often (for example, per day, week or month) each fruit was eaten. The questionnaire also provided an opportunity for respondents to report on other fruits, vegetables or other foods not on the list; and also about preparation (Burke et al., 2006). All fruit intake data on the QFFQ was summarized on a form to reflect total daily fruit intake. Median intake of fruit was used to classify fruit intake into two categories for statistical analysis. 48 This fruit intake information was entered into the MRC Foodfinder III. The MRC Foodfinder III contains meal items and their meal codes, their descriptions, and numbers of food groups, and nutrients per 100 grams of food. The weights of fruits were assigned based on relative consumption of each fruit, determined from fruit intake survey (Whitney & Rolfes 2013). iv) Anthropometric information All anthropometric measurements were taken in a private room in the household. (a) Adult measurements In adults, weight, height, and waist circumference was measured. Weight The participant wore minimal clothing (Truswell, 2007:431). Each participant stood still in the center of the digital Seca scale platform facing the recorder, hands at side, and looking straight ahead (USDA, 2012:online, NHANES, 2004:3-20). The weight was recorded when the participant was properly positioned and the digital readout was stable to the nearest 0.1kg. Height A Seca 217 stable stadiometer for mobile height measurement was used to measure height of adults. For adults, the participant stood straight with buttocks, shoulders and back of the head touching the wall, with heels flat and together, shoulders relaxed, and arms hanging down. The head was erect and looked straight forward, the lower border of the orbit in line with the external auditory meatus (the Frankfurt plane). Height was measured to the nearest 0.1cm (SECA, 2012:online). Waist Circumference To measure waist circumference, a bony landmark was first located and marked, and the lateral border of the ilium determined. The pants and underclothing of the participant were lowered slightly, and the measurer stood behind and to the right of the subject, and palpated the hip area 49 to locate the right ilium. A horizontal line was drawn just above the uppermost lateral border of the right ilium and then a cross the line to indicate the mid-axillary line of the body. Standing on the participant’s right side, the researcher placed the measuring tape around the trunk in a horizontal plane at the level marked on the right side of the trunk. The researcher held the zero end below the measurement value ensuring that the tape was parallel to the floor and that the tape was snug, but that it did not compress the skin. The measurement was then made at the end of a normal expiration and recorded to the nearest 0.1 cm (USDA, 2012:online, NHANES, 2004:3-29). (b) Measurements in children Height for children 24 months and older A stadiometer was used to measure children who could stand erect. The child stood erect without shoes, with heels together. The child’s line of sight was to be horizontal, with the heels, buttocks, shoulders, and head touching the wall (Whitney & Rolfes 2008:E6, Whitney & Rolfes 2013:E-1) and also the head in the Frankfort plane. The head and heels were against the stadiometer. The participant was asked to take a deep breath and was held while positioning the headboard. If the participant was unable to stand with the head and heels against stadiometer, the trunk was aligned vertically above the waist, and the arms and shoulders were relaxed (NHANES, 2004:3-45). The researcher carefully checked the height measurement; and recorded it immediately in centimeters to the nearest 0.5cm (Whitney & Rolfes 2008:E6; Whitney & Rolfes 2013:E-1). A Seca 217 stable stadiometer for mobile height measurement was used to measure height of adults and children who could stand easily. The mobile stadiometer seca 217 is stable and has a graduation length of 1mm. The spacer (head stop) provided extra stability and ensured precise measurement results. The stadiometer was suitable for mobile use and examination of children or patients at home (SECA, 2012:online). 50 Length for infants and children 0-23 months For children and infants younger than three years the researcher laid the barefoot infant on a measuring board that had a fixed headboard and a movable footboard attached at the right angles to the surface (Whitney & Rolfes 2008:E6, Whitney & Rolfes 2013:E-1). Two people were needed to obtain an accurate measurement: the field assistant held the infant’s head against the headboard, and the student researcher kept the legs of the child straight and did the measuring (Whitney & Rolfes 2008:E6, Whitney & Rolfes 2013:E-1). A Seca 417 light stable measuring board for infants was used. It had a measuring range of 10100 cm and a graduation length of 1mm. It had a removable foot stop securely guided along the rails (SECA, 2012:online). Length was measured to the nearest 0.5cm. Weight in children Beam balance and electronic scales are the most accurate types of scales for measuring weight (Cogill, 2003:32; Truswell, 2007:432, Fig. 29.1; Whitney & Rolfes 2013:E-1). The electronic scale was placed to stand on a level, hard surface and checked with a known weight regularly. Participants were weighed to the nearest 0.1 kg, wearing minimal clothing (Truswell, 2007:431). The Seca mother/child electronic scale required the mother and child to be weighed simultaneously and was used to determine the weight of children that could not stand on their own yet. The clothing on the child was minimal (Cogill, 2003:32; Whitney & Rolfes 2013:E-1). The mother was asked to stand on the scale and the weight recorded with the reading of one decimal point (e.g. 65.1 kgs). The child was passed to a person nearby and then a second reading recorded with just the mother (e.g. 58.3 kgs). The difference (e.g. 7.2 kgs) was the weight of the child (Cogill, 2003:32, SECA, 2012:online). A Seca floor scale with mother child weighing function was used (SECA, 2012:online). 51 Mid-upper-arm-circumference (MUAC) MUAC is the circumference of the right upper arm measured in centimeters. The measurement point is between the tip of the shoulder and the elbow (Cogill, 2003:73, NHANES, 2004:3-45; WHO & UNICEF 2009). The participants right arm was positioned to ensure it was flexed 900 at the elbow with the palm facing up. The acromium was located by following the scapula out to the arm until it made a sharp turn to the front of the body. A line was drawn on the bone before it turned to the front (NHANES, 2004:3-45). Arm circumference was measured with the participant standing upright, shoulders relaxed, and the right arm hanging loosely. It was important to be certain that the muscle of the arm was not flexed or tightened, which could have yielded a larger and inaccurate reading. The researcher stood facing the participant’s right side and the UNICEF MUAC measuring tape placed around the upper arm at the crossed point (+), perpendicular to the long axis of the upper arm. The measuring tape was held gently on the skin’s surface. The two ends of the overlapping tape were pulled together so that the zero end was held below the measurement value and the measurement was taken on the lateral aspect of the arm. Care was taken not to compress the skin and the underlying subcutaneous tissue. The arm circumference measurement was recorded to the nearest 0.1cm (NHANES, 2004:3-27). When taking the circumference measurements, the measurer stayed in one place and moved the participant around, rather than moving around the subject (NHANES, 2004:3-44). 3.3.2.3 Reported health information The health section in the questionnaire was completed adults in each household using a questionnaire completed in a structured interview with each mother. All the interviews were performed by the researcher. 52 3.3.3 Pre-testing/piloting of questionnaires Questionnaires on reported health, anthropometry, socio-economic status, and household food security developed by the University of the Free State for the Assuring Health for All in the Free State (AHA FS) study adapted for this study were pre-tested. Household dietary diversity questionnaire used to assess the foods consumed at a household level according to the guidelines of FAO (2011:21-22) was also pre-tested. The quantified food frequency questionnaire (QFFQ) was adopted from the South African Medical Research Council (MRC) guide on the use of the dietary assessment and education kit (DAEK) (Steyn & Senekal 2004) and was pre-tested. All the above questionnaires were pre-tested in Bungoma County that is adjacent to Busia County. The researcher randomly selected five households and administered questionnaires and took anthropometric measurements. The results from this pilot study were used to adjust the questionnaires where necessary. These data was excluded from the main study. All information obtained during the pilot study was entered onto Excel spread sheets and sent to the Department of Biostatistics (together with the original questionnaires) to ensure that the correct procedure had been followed and that data transfer had been done accurately. During the pre-test survey, some fruits such as jackfruits, African leafy vegetables and cash crops such as sugarcane growing in the study area were added to the food security and procurement questionnaire. The monthly income and money spend on food per week, was also adjusted according to the income brackets of the study population. 3.3.4 Data collection process All the data was collected by the researcher (Table 3.8) with the aid of two fieldworker assistants who only assisted in carrying equipment, holding children in position etc. (none of which required specific training). 53 Table 3.8: Data collection process 1. Steps that were followed Ethics approval was obtained from the Ethics Committee of the Faculty of Health Sciences UFS in South Africa. Permission to perform the study was also obtained from the Ministry of Higher Education, Science and Technology in Kenya; National Council for Science and Technology; the local area chiefs in Kakamega and Busia county; the community leaders of Kakamega and Busia; and community members who were involved in the study. 2. Recruiting project participants in both Kakamega and Busia. Forty five farms were surveyed in three agro-ecological zones (LM2 Sub-humid Lower Midland, LM3 Semi-humid Lower Midland, and LM4 Transitional Lower Midland), selected through randomly generated global positioning system (GPS) points. In Kakamega County, Western Kenya, 45 farms were surveyed in two agro-ecological zones (LM1 Humid Lower Midland and LM2 Sub-humid lower midland), selected through randomly generated GPS points. 3. Piloting of the socio-economic, food security, dietary assessment, anthropometry and health questionnaires. The questionnaires were pre-tested prior to the study by the researcher in Bungoma town that is adjacent to Busia and corrections made where necessary. Results from pilot surveys were copied onto Excel files and sent to Biostatistics. 4. In each household, consent was sought from the mother/caregiver of the child to undertake interviews and measurements. The purpose of the interviews was explained to the mother/caregiver by the researcher. After consent had been obtained, the researcher proceeded with administering interviews in Luhya local language starting with the socio-economic questionnaire, household dietary diversity questionnaire, household food security questionnaire and then health questionnaire. Swahili and English were also used where necessary. Before taking anthropometric measurements, the purpose of the measurements were explained to the mother/caregiver in Swahili. 5. Daily fruit intake data recorded for 30 days was summarized and entered into MRC FoodFinder3 nutrient database. This was only done to categorize fruit consumption. 6. Anthropometry data of children and adults was entered into Excel files by the researcher and sent to the Department of Biostatistics, University of the Free State for statistical analysis. 7. Socio-economic data, baseline food security and health data was entered into an excel file and sent to the Department of Biostatistics, UFS for analysis. 54 3.3.5 The role of the researcher Under the guidance of Prof CM Walsh of the Department of Nutrition and Dietetics, and Dr Katja Kehlenbeck of the World Agroforestry Centre, Kenya, the researcher compiled or adapted the questionnaires from existing questionnaires. Questionnaires on socio-economic status, household food security, household dietary diversity, anthropometry measurements and health information used were compiled by the University of the Free State for the Assuring Health for All in the Free State (AHA FS) study and were adapted for the current study. The QFFQ used was obtained from the dietary assessment and education kit (MRC DAEK) initially developed by the South African Medical Research Council (Steyn & Senekal 2004) and adapted for use in Kenya. The food list on the QFFQ that include fruits, vegetables and other foods were written in the local language as verified during focus group discussions. The researcher collected all the information (performed interviews, measured anthropometric measurements). The researcher was assisted by one field worker from Busia County and another one from Kakamega County to do translations where necessary during the interviews (Luhya was the local language of the researcher) and to carry equipment to households. The field assistants were all elites attending college from the study area. The researcher coded all questionnaires and typed into Excel files. 3.3.6 Validity and reliability Reliability is defined as the degree to which a method yields similar results on two different occasions. Validity is the determination of how well a method measures what it is intended to measure (Carithers et al., 2009). Factors affecting validity include respondent characteristics, questionnaire design and quantification, quality control, and the adequacy of the reference data (Carithers et al., 2009). All the collected data was entered into Excel files by the student researcher. All the questionnaires and the Excel files were taken to the research methods group (RMG) at the World Agroforestry Centre. RMG verified the data entered into Excel files from the questionnaires by developing a data entry database. 55 3.3.6.1 Questionnaires related to reported health, socio-economic status and household food security The reported health, socio-economic status, and household food security questionnaires developed by the University of the Free State for the Assuring Health for All in the Free State (AHA FS) study were adapted for this study. 3.3.6.2 Dietary diversity The FAO household dietary diversity tool was used to assess dietary diversity in the sample population by the researcher who is a qualified nutritionist. This tool is considered the most valid means of determining information related to dietary diversity. 3.3.6.3 Fruit intake data assessed using QFFQ To date there is no `gold standard' for directly assessing the validity of a dietary method. To overcome this limitation, investigators determine the relative validity or calibrate the method by comparison with another method judged to be similar or with other methods involving different errors (Jackson et al., 2001). A QFFQ was used to collect information related to fruit intake. The dietary assessment and education kit (MRC DAEK) initially developed by the South African Medical Research Council (Steyn & Senekal, 2004) has been adapted for use in Kenya. They are culture-sensitive, with a food list written in Luhya local language and include fruits and other foods commonly consumed by the Luhya people. To ensure reliability, the fruit intake data was also entered into the MRC FoodFinder III programme to assess intake. 56 3.3.6.4 Anthropometry To ensure reliability of collected anthropometry data, three readings of all anthropometric measurements for infants, children and adults were collected. The two field assistants helped in handling infants and children to ensure that the process runs smoothly. All measurements were taken in accordance with recommended methods as described in the literature (NHANES, 2004; WHO, 2008b; NHANES, 2004; Truswell, 2007; Whitney & Rolfes 2008; USDA, 2012; Whitney & Rolfes 2013). All equipment was calibrated and of good quality. When using the Seca scale to weigh the participant, the student researcher ensured the scale was on a zero reading before the participant stepped on it. After measuring one participant, time was allowed (about 5 minutes) before using the scale to measure the next participant. Before using the stadiometer, the researcher ensured that all the parts of the stadiometer were well fitted, the numbers on the ruler followed each other correctly and was placed on a flat surface. 3.4 STATISTICAL ANALYSIS Descriptive statistics, namely frequencies and percentages for categorical data and means and medians for continuous data was calculated and compared for groups with high fruit consumption and with low fruit consumption. Fruit consumption was categorized into two categories according to the median intake of fruits (determined using the information obtained from a quantified food frequency questionnaire (QFFQ) (Appendix G) – other results related to the QFFQ are not reported in this dissertation). Associations between variables were calculated using two-by-two tables and described by means of 95% confidence intervals or statistical tests. Statistical analysis was performed by the Department of Biostatistics at the University of the Free State using SAS statistical analysis program. 57 3.5 ETHICAL ASPECTS Written informed consent was obtained from each participant in their language of choice. Where applicable, assent was obtained from children. Mothers/caretakers signed the consent on behalf of their children. The study was explained to each participant before signing the form. Each participant received a copy of the information document, upon signing of the consent form. The forms were available in English and Swahili. All information was treated confidentially and participants’ privacy was respected. Illiterate persons made a cross in the presence of a witness on the consent form. Approval for this research was sought from the Ethics Committee of the Faculty of Health Sciences, UFS. The local area chiefs informed the community members of this study through local area chiefs’ gatherings, and meetings. Participants were informed that it was not compulsory to participate. Also, if community members refused to participate, there was no discrimination against them in terms of healthcare or in any other way. One mother refused completely to participate in the study while others about 5 had travelled or changed their physical address hence replaced with the household just nearby still from the study location used by Bliault, (2012). Participants were also allowed to withdraw from the study at any time without any discrimination. 58 CHAPTER 4 RESULTS 4.1 INTRODUCTION This chapter aims to relate fruit consumption to health and nutritional status of mothers and children below 5 years. Results on fruit intake, socio-economic status, household food security information, household dietary diversity, anthropometry and health information are presented. For all variables, the results of the group of mothers with fruit intake below the median of one fruit per day (107 g per day) were compared with the group of mothers with an intake above the median of one or more fruit per day. Associations between anthropometric variables of children under 5 years and their mothers/caregivers with different levels of fruit consumption are also presented. 4.1.1 Fruit intake data All children and 92.7% of mothers took in less than the recommended 400 g of fruit and vegetables per day (Table 4.1). Since no child or mother consumed recommended 400 g it was decided to use median fruit consumption per day as a cut-off point to compare the sociodemographic, household food security and food procurement, household dietary diversity, anthropometric measures and health status. Table 4.1 Percentage of participants with recommended fruit intakes of <400 g and ≥400 g daily 30 days preceding the survey for 96 children and their mothers in Busia and Kakamega Counties, Western Kenya, in 2013 Fruit and vegetable intake (grams/day) of mothers N % <400 g 89 92.7 ≥400 g 7 7.3 96 100 Fruit and vegetable intake (grams/day) of children <400 g 59 Table 4.2 shows that all 96 mothers and children consumed fruits daily. For mothers, the median intake was 107.0 g/day, with a minimum of 1.4 g/day and a maximum of 518 g/day. For children, median intake was 70 g/day, with a minimum of 1.8 g/day, and a maximum of 373.8 g/day. For mothers, the median time per month for the period preceding the study that fruit was eaten was 25.5 times with a minimum intake of 1 time per month and a maximum intake of 85 times a month. For mothers the median number of fruit servings per day (for the period preceding the study) was 0.9 with a minimum of 0.03, and a maximum of 2.8. For children, median fruit intake per month was the same as for mothers at 25.5 times per month. A median of 0.9 servings of fruit were eaten per day. Table 4.2: Fruit intake data for mothers and children 30 days preceding the survey in 96 children and their mothers in Busia and Kakamega Counties, Western Kenya, in 2013 Variable Minimum Median Maximum Mother fruits (g/day) (n=96) 1.4 107.0 518.0 Child fruits (g/day) (n=96) 1.8 70.0 373.8 Mother Sum of times/month (n=96) 1.0 25.5 85.0 Mother number of fruit servings per day (n=96) 0.0 0.9 2.8 Child Sum of times/month (n=96) 1.0 25.5 85.0 Child Number of fruit servings per day (n=96) 0.0 0.9 2.8 Most mothers that consumed less than the median of 1 fruit per day, also had children with a low fruit consumption (95.8%). On the other hand, 95.8% of mothers that had a fruit consumption higher than 1 fruit per day, also had children with a higher fruit consumption (Table 4.3). Table 4.3: Comparing percentage fruit intakes 30 days preceding survey below and above median in 96 mothers/children of Busia and Kakamega Counties, Western Kenya, in 2013 Fruit intake of mothers (n=96) <median (n=48) Fruit intake of children (n=96) >median (n=48) N % N % <median (n=48) 46 95.8 2 4.2 >median (n=48) 2 4.2 46 95.8 60 4.2 SOCIO-DEMOGRAPHIC INFORMATION The following section provides results related to socio-economic status of families. 4.2.1 Location The results in Table 4.4 show that all the 4 agro-ecological zones were surveyed in the study location. Most of the participants were from humid lower midland (LM1) (n=38) and semi-humid lower midland (LM2) (n=37). In the humid lower midland (LM1), 20 (41.7%) households were surveyed from the group with mothers that had a fruit intake of less than the median of 1 fruit per day, while 18 (38.3%) households were surveyed from the group of mothers with a daily fruit intake of one or more fruits per day. In the semi-humid lower midland (LM2), 17 (35.4%) households were surveyed from the group of mothers with a fruit intake of less than the median of I fruit per day, while 20 (42.6%) households were surveyed from the group of mothers with a daily fruit intake of more than or equal to one fruit per day. Table 4.4 Percentage of households with fruit intakes of <median and ≥median of 1 fruit per day distributed in 4 AEZ (locations) of Busia and Kakamega Counties, Western Kenya, in 2013 Group of mothers with intake of <median of 1 fruit per day (n=48) Group of mothers with intake of ≥median of 1 fruit per day (n=47) Location N % N % Humid Lower Midland 1 (LM1) (n=38) 20 41.7 18 38.3 Sub-humid Lower Midland 2 (LM2) (n=37) 17 35.4 20 42.6 Semi-humid Lower Midland 3 (LM3) (n=8) 5 10.4 3 6.4 Transitional Lower Midland 4 (LM4) (n=12) 6 12.5 6 12.8 95%CI for the percentage difference [ -25.7% ; 12.1% ] 4.2.2 Language of respondents and ethnic composition of households Table 4.5 shows the language and ethnic composition of households. More than 90% of mothers in both groups spoke Luhya. Ethnic composition of the household included Luhya, Luo and 61 Kalenjin. From the group of mothers with a fruit intake of less than the median of I fruit per day, 48 (100%) were of Luhya origin Luhya, while 45 (93.8%) households the group of mothers with a daily fruit intake of one or more fruits per day were Luhya. Table 4.5 Percentage of language and ethnic composition of 96 participants with fruit intakes of <median and ≥median of 1 fruit per day from Busia and Kakamega Counties, Western Kenya, in 2013 Group of mothers with intake of <median of 1 fruit per day (n=48) Group of mothers with intake of ≥median of 1 fruit per day (n=48) Variable Category N % N % First language of respondent (n=96) Luhya (n=90) 46 95.8 44 91.7 Luo (n=4) 0 0.0 4 8.3 Other (n=2) 2 4.2 0 0.0 Luhya (n=93) 48 100.0 45 93.8 Luo (n=2) 0 0.0 2 4.2 Other (n=1) 0 0.0 1 2.1 Ethnic composition of the household (n=96) 95% Confidence interval for the percentage difference [ -2.2% ; 16.8% ] 4.2.3 Employment status of respondents and husband/partner Table 4.6 shows the employment status of the respondents and that of their husband/partner. In the group of mothers with a fruit intake of less than the median of I fruit per day, 3 (6.3%) were housewives by choice, while 33 (68.8%) were unemployed. Similarly, in the group of mothers with a daily fruit intake of one or more fruits per day, 2 (4.2%) respondents were housewives by choice, while 36 (75%) were unemployed. In the group of mothers with a fruit intake of less than the median of I fruit per day, 10 (20.8%) husbands/partners of respondents were unemployed, while 14 (29.2%) husbands/partners had other (part-time, piece job etc.) employment. This was very similar to the employment status of the partners of mothers with a daily fruit intake of one or more fruits per day. In the group of mothers with a fruit intake of less than the median of I fruit per day, 18.8% of the respondents’ husbands/partners were full time wage earner (received a salary), while fewer 62 husbands/partners of mothers with a daily fruit intake of one or more fruits per day (8.3%) were full time wage earners (received a salary). Table 4.6 Percentage of employment status of 96 respondents and husband/partner with fruit intakes of <median and ≥median of 1 fruit per day from Busia and Kakamega Counties, Western Kenya, in 2013 Group of mothers with intake of <median of 1 fruit per day (n=48) N % Group of mothers with intake of ≥median of 1 fruit per day (n=48) N % Variable Category Employment status of respondent (n=96) Housewife by choice (n=5) 3 6.3 2 4.2 Unemployed (n=69) 33 68.8 36 75 Self-employed (n=16) 10 20.8 6 12.5 Full time wage earner (receive a salary) (n=3) Other, (Part-time, piece job etc. (n=3) 1 2.1 2 4.2 1 2.1 2 4.2 Unemployed (n=21) 10 20.8 11 22.9 Self-employed (n=25) 11 22.9 14 29.2 Full time wage earner (receive a salary) (n=13) Other (Part-time, Piece job etc.) (n=27) 9 18.8 4 8.3 14 29.2 13 27.1 Not applicable e.g. dead (n=10) 4 8.3 6 12.5 Husband/Partner’s employment status (n=96) 4.2.4 Household characteristics Table 4.7 shows the characteristics of the respondents’ households. As far as type of dwelling is concerned, 4 (8.3%), respondents with a lower fruit intake had brick, concrete houses, while 44 (91.7%) had traditional mud houses, while 9 (18.8%) of respondents with a higher fruit intake had brick, concrete houses and 39 (81.3%) respondents had traditional mud houses. In both the group of mothers with a lower fruit intake and the group with a higher fruit intake most (95.8%) had no bathroom in the house. In the group of mothers with a fruit intake of less than the median of I fruit per day, 35 (72.9%) had no kitchen/ cooking area inside the house. In the group with a higher fruit intake, even fewer 63 had a kitchen/ cooking area inside the house (66.7%). In the group with a lower fruit intake, 95.8% had electricity, while in the group of mothers with a daily fruit intake of one or more fruits per day, all had electricity. Table 4.7 Percentage of household characteristics of 96 respondents with fruit intakes of <median and ≥median of 1 fruit per day from Busia and Kakamega Counties, Western Kenya, in 2013 Variable Category Type of dwelling (n=96) Brick, concrete (n=13) Traditional mud (n=83) Group of mothers with intake of <median of 1 fruit per day (n=48) N % Group of mothers with intake of ≥median of 1 fruit per day (n=48) N % 4 8.3 9 18.8 44 91.7 39 81.3 Respondent has bathroom in the house (n=96) Yes (n=4) 2 4.2 2 4.2 No (n=92) 46 95.8 46 95.8 Respondent has bathroom outside (n=96) Yes (n=78) 38 79.2 40 83.3 No (n=18) 10 20.8 8 16.7 Respondent has kitchen/ cooking area inside the house (n=96) Yes (n=29) 13 27.1 16 33.3 No (n=67) 35 72.9 32 66.7 Household has electricity (n=96) Yes (n=2) 2 4.2 0 0 No (n=94) 46 95.8 48 100 4.2.5 Water, sanitation and fuel for the household Table 4.8 reports on water, sanitation and fuel for the household. Fewer mothers with a lower fruit intake obtained water from a borehole or well (31.9%) than mothers with a higher fruit intake (45.8%). Similarly, more mothers with a lower fruit intake obtained water from sources such as shallow wells and rainwater (44.7%), compared to mothers with a higher fruit intake (33.3%). More than 90% of all mothers reported using pit latrines. As far as type of fuel used for 64 cooking most of the time was concerned, about 90% in both groups used open fire for cooking most of the time. None of the percentage differences between the two groups were, however, statistically significant. Table 4.8 Percentage of source of water, type of toilet and fuel used by 96 households with fruit intakes of <median and ≥median of 1 fruit per day from Busia and Kakamega Counties, Western Kenya, in 2013 Group of mothers with intake of <median of 1 fruit per day (n=48) N % Group of mothers with intake of ≥median of 1 fruit per day (n=48) N % 95% Confidence interval for the percentage difference Variable Category Main source of drinking water (n=95) Communal tap (n=6) 3 6.4 3 6.3 River, dam (n=15) 8 17.0 7 14.6 Borehole, well (n=37) 15 31.9 22 45.8 [ -32.5% ; 4.8% ] Others (n=37) 21 44.7 16 33.3 [ -8.8% ; 28.6% ] Type of toilet owned by household (n=96) Pit (n=94) 48 100.0 46 95.8 Other (n=2) 0 0.0 2 4.2 Fuel used for cooking most of the time (n=96) Gas (n=1) 1 2.1 0 0.0 Wood, coal (n=8) 3 6.3 5 10.4 Open fire (n=87) 44 91.7 43 89.6 [ -16.6% ; 7.9% ] 4.2.6 Household appliances Nearly all homes in the group of mothers with a lower fruit intake did not have a working refrigerator and/or freezer while in the group with a higher fruit intake, none had a working refrigerator and/or freezer (Table 4.9). In the group with a lower fruit intake, nearly all homes did not have a working stove (gas, coal or electric) or hot plate and 77.1% had no working television. However, 62.5% had a working radio, and 85.4% had working mobile phones. In the group with a higher fruit intake, none of the households had a working stove (gas, coal or electric) or hot plate, and 83.3% did not have a working television. However, 79.2% had a working radio, and 89.6% had working mobile phones. 65 In both the group of mothers with a lower fruit intake and the group with a higher fruit intake none had a working microwave and about 60% did not have a working primus or paraffin stove. Table 4.9 Percentage of appliances in 96 households with fruit intakes of <median and ≥median of 1 fruit per day from Busia and Kakamega Counties, Western Kenya, in 2013 Group of mothers with intake of <median of 1 fruit per day (n=48) N % Group of mothers with intake of ≥median of 1 fruit per day (n=48) N % Variable Category Home has a working refrigerator and/or freezer (n=96) Yes (n=1) 1 2.1 0 0 No (n=95) 47 97.9 48 100 Home has a working stove (gas, coal or electric) or hot plate(n=96) Yes (n=1) 1 2.1 0 0 No (n=95) 47 97.9 48 100 Home has a working primus or paraffin stove (n=96) Yes (n=37) 18 37.5 19 39.6 No (n=59) 30 62.5 29 60.4 Home has a working microwave (n=96) No (n=96) 48 100 48 100 Home has a working radio (n=96) Yes (n=68) 30 62.5 38 79.2 No (n=28) 18 37.5 10 20.8 Yes (n=19) 11 22.9 8 16.7 No (n=77) 37 77.1 40 83.3 Yes (n=84) 41 85.4 43 89.6 No (n=12) 7 14.6 5 10.4 Home has a working television (n=96) Home has working mobile phones (n=96) 4.2.7 Size of agricultural land Table 4.10 relates to size of agricultural land. In the group with a lower fruit intake, the median size of total agricultural land was 1.25 acres (0.51 hectare), with a maximum of 3.24 hectare (ha). In the group with a higher fruit intake, the median was 0.81 ha with a maximum of 4.9 (ha). Both the groups had a minimum of 0.05 (ha) of total agricultural land. 66 In the group with a lower fruit intake, and median size of agricultural land under crop production (ha) was 0.41 (ha) with a minimum of 0 ha, and a maximum of 2.43 ha. This was very similar to the group with a higher fruit intake. Mothers in the group with a lower fruit intake spent a median of 4 hours per day farming, with a maximum of 8 hours. Mothers with a higher fruit intake spent a median of 3 hours per day farming, with a maximum of 7 hours. None of the differences between groups were statistically significant. Table 4.10 Median for size of agricultural land (acres) and time spend with farming (hours) in 96 households with fruit intakes of <median and ≥median of 1 fruit per day from Busia and Kakamega Counties, Western Kenya, in 2013 Variable Groups Minimum Median Maximum Total agricultural land (acres) (n=96) < median (n=48) 0.13 1.25 8.00 ≥ median (n=48) 0.03 2.00 12.00 Size of agricultural land under crop production (acres) (n=96) < median (n=48) 0.00 1.00 6.00 ≥ median (n=48) 0.00 1.00 6.00 Size of agricultural land under pasture production (acres) (n=96) < median (n=48) 0.03 0.25 4.00 ≥ median (n=48) 0.03 0.25 1.50 Time spend with farming per day (hours) (n=96) < median (n=48) 0.00 4.00 8.00 ≥ median (n=48) 0.00 3.00 7.00 95% confidence interval for the median difference [ -0.75 ; 0.25 ] [ -0.5 ; 0.12 ] [ -0.1 ; 0 ] [0;1] There were no statistically significant differences between groups regarding continuous variables in the socio-economic questionnaire. 4.2.8 Mean number of rooms, room density, phones and people permanently living and contributing to income Table 4.11 shows the mean number of rooms, room density, phones and people permanently living and contributing to income of the household. In the group with a lower fruit intake, the 67 median room density was 5 persons, with a minimum of 1.5, and a maximum of 11. This was almost similar to the group with a higher fruit intake. In the group with a lower fruit intake a median of 6 persons lived in the house permanently, with a minimum of 3, and a maximum of 11. This was very similar to the group with a higher fruit intake. None of the differences between groups were statistically significant. Table 4.11 Median of number of rooms, room density, phones and people permanently living and contributing to income in 96 households with fruit intakes of <median and ≥median of 1 fruit per day from Busia and Kakamega Counties, Western Kenya, in 2013 Minimum Median Maximum Total number of rooms in house (n=96) < median (n=48) 1 2 10 ≥ median (n=48) 1 2 6 Room density (n=72) < median (n=39) 1.5 5 11 ≥ median (n=33) 1 4 11 < median (n=48) 0 1 5 ≥ median (n=48) 0 1 4 Number of mobile phones present (n=84) < median (n=41) 1 1 5 ≥ median (n=43) 1 1 3 People living permanently in the house (n=96) < median (n=48) 3 6 11 ≥ median (n=48) 3 5.5 11 Number of people contributing to the total income (n=96) < median (n=48) 1 2 3 ≥ median (n=48) 1 2 3 Number of bedrooms (n=96) 95%confidence interval for the median difference [0;1] [ -0.5 ; 1.5 ] [0;0] [0;0] [0;1] [0;0] 4.2.9 Income and marital status In the group of respondents with a lower fruit intake, 54.2% earned Kenya shillings (KES) 10005000 per month, while 35.4% earned KES 5001-10000 per month. Similarly, in the group of respondents with a higher fruit intake, 60.4% earned KES 1000-5000 per month while 33.3% earned income of KES 5001-10000 per month (Table 4.12). 68 In the group with a lower fruit intake, 62.5% of respondents reported a lower income during the past six months. This was almost similar to the group with a higher fruit intake. In the group with a lower fruit intake 70.8% of respondents were monogamously married, while in the group with a higher fruit intake, 79.2% were monogamously married. In the group with a lower fruit intake 10.4% of respondents were polygamous married, while in the group with a higher fruit intake, 4.2% were polygamous married. In both groups 8.3% were widowed and 6.3% were single. Table 4.12 Percentage of monthly household income and marital status for 96 mothers with fruit intakes of <median and ≥median of 1 fruit per day from Busia and Kakamega Counties, Western Kenya, in 2013 Group of mothers with intake of <median of 1 fruit per day (n=48) N % Group of mothers with intake of ≥median of 1 fruit per day (n=48) N % Variable Category Household income per month (n=96) None (n=2) 1 2.1 1 2.1 KES 1000-5000 (n=55) 26 54.2 29 60.4 KES 5001-10000 (n=33) 17 35.4 16 33.3 KES 10001-30000 (n=5) 3 6.3 2 4.2 Don’t know (n=1) 1 2.1 0 0 The income is more or less than it was the past six months (n=96) More (n=18) 10 20.8 8 16.7 Less (n=59) 30 62.5 29 60.4 The same (n=19) 8 16.7 11 22.9 Marital status (n=96) Single (n=6) 3 6.3 3 6.3 Monogamously married (n=72) 34 70.8 38 79.2 Polygamous married (n=7) 5 10.4 2 4.2 Widowed (n=8) 4 8.3 4 8.3 Separated/divorced (n=3) 2 4.2 1 2.1 69 4.3 HOUSEHOLD FOOD SECURITY AND FOOD PROCUREMENT INFORMATION The results below are related to food security and food procurement. 4.3.1 Money spent on food and source of income Table 4.13 below shows results pertaining to money spent on food weekly by households and their source of income. The percentage of households that spent more than KES 1300 weekly was similar in the group of mothers with a lower fruit intake (78.7%) and the group of mothers with a higher fruit intake (74.5%). In the group of mothers with a lower fruit intake, 22.9% reported that wages and salaries were their main source of income, compared to only 10.4% of mothers in the group with higher fruit consumption. On the other hand, fewer mothers in the low fruit consumption group reported that crop production and livestock sales were their main source of income (31.3%) compared to mothers with higher fruit consumption (50.0%). There was a tendency for households in the group of mothers with a lower fruit intake to be more likely to have wages and salaries from formal employment as their main source of income than the households in the group of mothers with a higher fruit intake but the difference was not significant (95%CI for percentage difference [ -2.7% ; 27.3% ]). There was also a tendency for households in the group of mothers with a higher fruit intake to have crop production and livestock sales as their main source of income when compared to households in the group of mothers with a lower fruit intake but again, the difference was not significant (95%CI for percentage difference [ -36.4% ; 0.8% ]). 70 Table 4.13 Percentage of money spent on food weekly and main source of income for 96 households with fruit intakes of <median and ≥median of 1 fruit per day from Busia and Kakamega Counties, Western Kenya, in 2013 Group of mothers with intake of <median of 1 fruit per day (n=47) N % Group of mothers with intake of ≥median of 1 fruit per day (n=47) N % Variable Category Money spend on food by household weekly (n=94) KES 500- 600 (n=1) 1 2.1 0 0 KES 601-700 (n=6) 2 4.3 4 8.5 KES 701-800 (n=5) 4 8.5 1 2.1 KES 801-900 (n=1) 0 0.0 1 2.1 KES 1001-1100 (n=7) 3 6.4 4 8.5 KES 1101-1200 (n=1) 0 0.0 1 2.1 Over KES 1300 (n=72) 37 78.7 35 74.5 Don’t know (n=1) 0 0.0 1 2.1 (n=48) Main source of income (n=96) 95% confidence interval for the percentage difference (n=48) Wages and salaries from formal employment (n=16) 11 22.9 5 10.4 Self-employment (including home enterprises) (n=29) Casual employment (agricultural or nonagricultural) (n=12) Crop production and livestock sales (n=39) 15 31.3 14 29.2 7 14.6 5 10.4 15 31.3 24 50.0 [ -2.7% ; 27.3% ] [ -36.4% ; 0.8% ] 4.3.2 Growing of crops by the household Most respondent reported growing crops. In the group with a higher fruit intake all respondents grew crops while in the group with a lower fruit intake slightly fewer respondents (95.8%) grew crops. More than 95% of all mothers in both groups grew maize. In the group with a lower fruit intake, fewer respondents farmed sorghum (26.1%), and cassava (56.5%) than in the group with a higher fruit intake, where 37.5% farmed sorghum and 70.8% grew cassava. More households in the group of mothers with a higher fruit intake (87.5%) grow significantly more sweet potato than those households in the group of mothers with a lower fruit intake (65.2%), with a 95% confidence interval of [-38.2% ; -5.1% ]. For all other variables, there was no significant difference between the two groups. 71 Table 4.14 Percentage of crops produced by 96 households with fruit intakes of <median and ≥median of 1 fruit per day from Busia and Kakamega Counties, Western Kenya, in 2013 Group of mothers with intake of <median of 1 fruit per day (n=48) N % Variable Category Growing crops (n=96) Yes (n=94) 46 No (n=2) 2 Group of mothers with intake of ≥median of 1 fruit per day (n=48) N % 95.8 48 4.2 0 (n=48) Yes (n=91) 45 97.8 46 95.8 No (n=3) 1 2.2 2 4.2 (n=46) Grow sorghum (n=94) (n=48) Yes (n=30) 12 26.1 18 37.5 No (n=64) 34 73.9 30 62.5 (n=46) Grow millet (n=94) Yes (n=13) 7 15.2 6 12.5 No (n=81) 39 84.8 42 87.5 (n=48) Yes (n=72) 30 65.2 42 87.5 No (n=22) 16 34.8 6 12.5 (n=46) Grow cassava (n=94) Yes (n=60) 26 No (n=34) 20 [ -38.2% ; -5.1% ]* (n=48) 56.5 34 43.5 14 (n=34) Grow other crops (n=70) [ -29.0% ; 7.3% ] (n=48) (n=46) Grow sweet potato (n=94) 100.0 0.0 (n=46) Grow maize (n=94) 95% confidence interval for the percentage difference 70.8 [ -32.3% ; 5.0% ] 29.2 (n=36) Yes (n=26) 14 41.2 12 33.3 No (n=44) 20 58.8 24 66.7 [ -14.2% ; 29.0% ] In the group with a lower fruit intake, the median yield sold annually was 11%, while no yield was sold by the group with the higher fruit intake. Table 4.15 Median percentage of agricultural yields sold annually by 96 households with fruit intakes of <median and ≥median of 1 fruit per day from Busia and Kakamega Counties, Western Kenya, in 2013 Minimum Median Maximum 95% Confidence interval for the median difference < median (n=44) 0 11 90 [ 0 ; 10 ] ≥ median (n=45) 0 0 90 The difference in the median percentage of annual agricultural yield sold was not significantly different between the two groups (95% CI for the median difference [0; 10]). 72 4.3.3 Growing of vegetables by the household More than 95% of mothers in both groups grew vegetables. More mothers in the group with a lower fruit intake grew leafy amaranth (70.2%) than in the group with a higher fruit intake (58.7%). On the other hand, fewer mothers in the group with a lower fruit intake than in the group with the higher fruit intake grew jute mallow (61.7% versus 78.3). Significantly more households in the group of mothers with a higher fruit intake (54.4%) grew African nightshades than those households in the group of mothers with a lower fruit intake (34.0%), with a 95% confidence interval of [-38.3% ; -0.2% ]. For all other variables, there was no significant difference between the two groups. Table 4.16 Percentage of traditional vegetables produced by 96 households with fruit intakes of <median and ≥median of 1 fruit per day from Busia and Kakamega Counties, Western Kenya, in 2013 Group of mothers with intake of <median of 1 fruit per day (n=48) Group of mothers with intake ≥median of 1 fruit per day (n=48) Variable Category N % N % Grow vegetables (n=96) Yes (n=93) 47 97.9 46 95.8 No (n=3) 1 2.1 2 4.2 (n=47) Grow leafy Amaranth (n=93) Yes (n=60) 33 No (n=33) 14 (n=46) 70.2 27 29.8 19 (n=47) Grow spider plant (n=93) 14 29.8 16 34.8 No (n=63) 33 70.2 30 65.2 Yes (n=41) 16 34.0 25 54.4 No (n=52) 31 66.0 21 45.7 [ -38.3% ; -0.2% ]* (n=46) Yes (n=51) 25 53.2 26 56.5 No (n=42) 22 46.8 20 43.5 (n=46) Yes (n=65) 29 61.7 36 78.3 No (n=28) 18 38.3 10 21.7 (n=47) Grow Ethiopian kale (n=93) [ -23.2% ; 13.7% ] (n=46) (n=47) Grow jute mallow (n=93) [ -7.7% ; 29.7% ] 41.3 Yes (n=30) (n=47) Grow Crotalaria (n=93) 58.7 (n=46) (n=47) Grow African nightshades (n=93) 95% confidence interval for the percentage difference [ -33.7% ; 2.1% ] (n=46) Yes (n=17) 9 19.2 8 17.4 No (n=76) 38 80.9 38 82.6 73 Table 4.17 below shows other types of vegetables grown by the respondents. More than 80% of mothers in both groups grew cowpea leaves. On the other hand, fewer mothers in the group with a lower fruit intake than in the group with the higher fruit intake grew pumpkin (76.6% versus 80.4%), and beans (74.5% versus 82.6%). In all of these variables, there was no significant difference between the two groups. Table 4.17 Percentage of other vegetables produced by 96 households with fruit intakes of <median and ≥median of 1 fruit per day from Busia and Kakamega Counties, Western Kenya, in 2013 Variable Grow cowpea leaves (n=93) Category Group of mothers with intake of <median of 1 fruit per day (n=48) N % Group of mothers with intake ≥median of 1 fruit per day (n=48) N % (n=47) (n=46) Yes (n=80) 39 83.0 41 89.1 No (n=13) 8 17.0 5 10.9 (n=47) Grow kales (n=93) (n=46) Yes (n=46) 23 48.9 23 50.0 No (n=47) 24 51.1 23 50.0 (n=47) Grow pumpkin (n=93) (n=46) Yes (n=73) 36 76.6 37 80.4 No (n=20) 11 23.4 9 19.6 (n=47) Grow beans (n=93) (n=46) Yes (n=73) 35 74.5 38 82.6 No (n=20) 12 25.5 8 17.4 Yes (n=1) 1 2.1 0 0.0 No (n=92) 46 97.9 46 100.0 No (n=4) 2 100.0 2 100.0 (n=47) Grow cabbages (n=93) Grow other vegetables (n=4) (n=46) 4.3.4 Growing of fruits by the household More than 90% of mothers in both groups had their own fruit trees. There was a tendency for more households in the group with a higher fruit intake to grow mangoes (77.3%), avocados (88.4%) jackfruit (34.9%) and lemons (18.6%) than households in the group with a lower fruit intake that grew mangoes (63.0%) avocados (71.7%) jackfruit (23.9%), and lemons (10.9%). None 74 of the differences were, however, statistically significant. Similarly, more households in the group with a lower fruit intake grew pawpaws (45.7%), compared to the households with a higher fruit intake (34.9%), though the difference was not statistically significant. Table 4.18 Percentage of fruits produced by 96 households with fruit intakes of <median and ≥median of 1 fruit per day from Busia and Kakamega Counties, Western Kenya, in 2013 Group of mothers with intake of <median of 1 fruit per day (n=48) N % Group of mothers with intake ≥median of 1 fruit per day (n=48) N % Variable Category Has own fruit trees (n=96) Yes (n=90) 46 95.8 44 91.7 No (n=6) 2 4.2 4 8.3 (n=46) Grow mangoes (n=90) (n=44) Yes (n=63) 29 63.0 34 77.3 No (n=27) 17 37.0 10 22.7 (n=46) Grow avocados (n=89) Yes (n=71) 33 No (n=18) 13 71.7 38 28.3 5 11 23.9 10 23.3 No (n=68) 35 76.1 33 76.7 (n=43) Yes (n=22) 8 17.4 14 32.6 No (n=67) 38 82.6 29 67.4 Yes (n=36) 21 45.7 15 34.9 No (n=53) 25 54.4 28 65.1 Yes (n=26) 11 23.9 15 34.9 No (n=63) 35 76.1 28 65.1 [ -29.0% ; 7.8% ] (n=43) Yes (n=7) 4 8.7 3 7.0 No (n=82) 42 91.3 40 93.0 (n=46) Grow lemons (n=89) [ -9.4% ; 29.6% ] (n=43) (n=46) Grow oranges (n=89) [ -32.2% ; 2.8% ] (n=43) (n=46) Grow jackfruit (n=89) [ -32.4% ; 0.2% ] 11.6 Yes (n=21) (n=46) Grow pawpaws (n=89) 88.4 (n=43) (n=46) Grow java plum (n=89) [ -31.7% ; 4.7% ] (n=43) (n=46) Grow loquats (n=89) 95% confidence interval for the percentage difference (n=43) Yes (n=13) 5 10.9 8 18.6 No (n=76) 41 89.1 35 81.4 [ -23.0% ; 7.3% ] 75 Table 4.19 below shows common fruits consumed in the area such as guavas and sweet bananas and special fruits used in porridge such as tamarind. In the group of households with a lower fruit intake, 76.1% grew guava and 71.7% sweet bananas. This was similar to the group with a higher fruit intake. Table 4.19 Percentage of other common fruits produced by 96 households with fruit intakes of <median and ≥median of 1 fruit per day from Busia and Kakamega Counties, Western Kenya, in 2013 Variable Grow guava (n=89) Category Group of mothers with intake of <median of 1 fruit per day (n=48) N % Group of mothers with intake ≥median of 1 fruit per day (n=48) N % (n=46) (n=43) Yes (n=68) 35 76.1 33 76.7 No (n=21) 11 23.9 10 23.3 Yes (n=64) 33 71.7 31 70.5 No (n=26) 13 28.3 13 29.6 (n=46) Grow sweet bananas (n=90) (n=44) (n=46) Grow tamarind (n=89) (n=43) Yes (n=14) 8 17.4 6 14.0 No (n=75) 38 82.6 37 86.1 (n=0) Grow other fruits (n=2) (n=2) Yes (n=1) 0 . 1 50.0 No (n=1) 0 . 1 50.0 4.3.5 Livestock ownership by the household In the group with a lower fruit intake, the median number of dairy cattle and goats owned was 2. This was similar to the group of respondents with a higher fruit intake. In both groups the median number of chickens owned was 5. 76 Table 4.20 Median number of livestock owned by 96 households with fruit intakes of <median and ≥median of 1 fruit per day from Busia and Kakamega Counties, Western Kenya, in 2013 Variable Beef cattle (n=95) Dairy cattle (n=95) Sheep (n=95) Goats (n=95) Pigs (n=95) Donkey (n=95) Chicken (n=95) Ducks/turkey (n=92) Other livestock (n=3) Mother fruit intake per day group < median (n=48) Minimum Median Maximum 1 2 4 ≥ median (n=47) 1 2 5 < median (n=48) 1 2 5 ≥ median (n=47) 1 2 8 < median (n=48) 2 2 6 ≥ median (n=47) 1 2 10 < median (n=48) 2 2 3 ≥ median (n=47) 1 2 7 < median (n=48) 1 2 3 ≥ median (n=47) 1 2 5 < median (n=48) 2 2 2 ≥ median (n=47) 2 2 2 < median (n=48) 1 5 30 ≥ median (n=47) 1 5 20 < median (n=46) 2 2 5 ≥ median (n=46) 1 2 6 < median (n=2) 1 1 1 ≥ median (n=1) 2 2 2 95% Confidence interval for the median difference [0;0] [0;0] [0;0] [0;0] [0;0] [0;0] [ -2 ; 1 ] [0;0] Kruskal-Wallis test p-value = 0.16 4.3.6 Seasonality of foods There was a tendency for more households in the group with a higher fruit intake (35.4%) to produce enough food to last till the next season compared to the group with a lower fruit intake (20.8%) but the difference was not statistically significant. All households in the group with a lower fruit intake and 94.1% in the group with a higher fruit intake produced crops to last till next season (Table 4.21). 77 The group with a higher fruit intake was more likely to produce vegetables to last till the next season (41.2%) compared to the group with a lower fruit intake (20%) but again the difference was not statistically significant. Almost 12 percent (11.8%) of households with a higher fruit intake produced fruits to last till next season, while none of the households in the group with lower fruit intake produced fruits to last till next season. There was a tendency for more households in the group with a lower fruit intake to not have enough land to produce food that could last till next season (68.4%), than the households with a higher fruit intake (50%) but the difference was not statistically significant. Table 4.21 Percentages of participants who produce different foods to last till next season in 96 households with fruit intakes of <median and ≥median of 1 fruit per day from Busia and Kakamega Counties, Western Kenya, in 2013 Mother fruit intake per day group Group of mothers with intake of <median of 1 fruit per day (n=48) Group of mothers with intake of ≥median of 1 fruit per day (n=48) Variable Category N % N % Produce enough food to last till next season (n=96) Yes (n=27) 10 20.8 17 35.4 No (n=69) 38 79.2 31 64.6 Crops last till next season (n=27) Yes (n=26) 10 100.0 16 94.1 No (n=1) 0 0.0 1 5.9 (n=10) Yes (n=9) 2 20.0 7 41.2 No (n=18) 8 80.0 10 58.8 Yes (n=2) 0 No (n=25) 10 0.0 2 100.0 15 11.8 88.2 (n=17) Yes (n=1) 1 10.0 0 0.0 No (n=26) 9 90.0 17 100.0 (n=38) Reason for not lasting till next season (n=68) [ -48.1% ; 15.5% ] (n=17) (n=10) Other crops lasting till next season (n=27) [ -22.3% ; 27.0% ] (n=17) (n=10) Fruits last till next season (n=27) [ -31.4% ; 3.4% ] (n=17) (n=10) Vegetables last till next season (n=27) 95% confidence interval for the percentage difference (n=30) Not enough land (n=41) 26 68.4 15 50.0 [ -4.7% ; 39.4% ] Not enough money to buy seeds and other equipment (n=14) Other reasons (n=13) 5 13.2 9 30.0 [ -36.2% ; 2.6% ] 7 18.4 6 20.0 78 4.3.7 Food preservation Table 4.22 indicates the food preservation methods that were used by households. Households in the group with a higher fruit intake were more likely to keep food for future use (66.7%) than the group with a lower fruit intake (50%). Sun drying was a common method of food preservation. More than 90% of households in both groups preserved food by sun drying. None of the households preserved food through smoking (above fireplace), canning or freezing. The percentage of respondents that used pesticides in both groups was similar at about 46% (Table 4.22). Table 4.22 Percentage of participants who keep food for future use and food preservations methods by 96 households with fruit intakes of <median and ≥median of 1 fruit per day from Busia and Kakamega Counties, Western Kenya, in 2013 Group of mothers with intake of <median of 1 fruit per day (n=48) N % Group of mothers with intake of ≥median of 1 fruit per day (n=48) N % Variable Category Keep food for future use (n=96) Yes (n=56) 24 50.0 32 66.7 No (n=40) 24 50.0 16 33.3 (n=24) Sun drying (n=56) No (n=3) 1 4.2 2 6.3 Yes (n=53) 23 95.8 30 93.8 No (n=56) 24 (n=32) 100.0 32 (n=24) Fermenting (n=56) No (n=51) 21 87.5 30 93.8 Yes (n=5) 3 12.5 2 6.3 No (n=56) 24 No (n=56) 100.0 24 32 100.0 (n=32) 100.0 32 (n=24) other methods (n=56) [ -9.9% ; 25.3% ] (n=32) (n=24) Freezing (n=56) 100.0 (n=32) (n=24) Canning (n=56) [ -34.6% ; 3.0% ] (n=32) (n=24) Smoking (above fireplace) (n=56) 95% confidence interval for the percentage difference 100.0 (n=32) No (n=30) 13 54.2 17 53.1 Yes (n=26) 11 45.8 15 46.9 79 4.3.8 Food availability in the household In the group with a lower fruit intake all households produced food for consumption by family members, while in the group with a higher fruit intake nearly all households (97.9%) produced food for consumption by family members. None of the respondents reported producing food in order to exchange for clothes and household equipment or for any other reason (Table 4.23). A significantly higher percentage of respondents with a higher fruit intake reported that fruits were easily available from local farmers and shops (79.2%) than in the group with a lower fruit intake (50%) with a 95% confidence interval of [ -45.5% ; -10.0% ]. The percentage of households that reported that vegetables were easily available from local farmers and shops was higher (93.8%) in the group with a higher fruit intake than in the group with a lower fruit intake (87.5%). More than 90% of mothers in both groups walked on foot to access food. More respondents in the group with a lower fruit intake reported that children in the family are served first (58.3%) compared to respondents with a higher fruit intake (47.9%) (Table 4.23). 80 Table 4.23 Proportion of reasons given for producing food, participants views on fruit and vegetable availability, form of transport used to access fruits and vegetables on markets and participants who are served first in 96 households with fruit intakes of <median and ≥median of 1 fruit per day from Busia and Kakamega Counties, Western Kenya, in 2013 Group of mothers with intake of <median of 1 fruit per day (n=48) N % Group of mothers with intake of ≥median of 1 fruit per day (n=48) N % Produce food for consumption by family members (n=96) No (n=1) 1 2.1 0 0.0 Yes (n=95) 47 97.9 48 100.0 Produce food to sell (n=96) No (n=96) 47 97.9 45 93.8 Yes (n=4) 1 2.1 3 6.3 Produce food to exchange for clothes and household equipment (n=96) No (n=96) 48 100.0 48 100.0 Produce food for other reasons (n=96) No (n=96) 48 100.0 48 100.0 Fruits are easily available from local farmers and shops (n=96) Yes (n=62) 24 50.0 38 79.2 No (n=34) 24 50.0 10 20.8 Vegetables are easily available from local farmers and shops (n=96) Yes (n=87) 42 87.5 45 93.8 No (n=9) 6 12.5 3 6.3 Form of transport mainly used to buy food (n=96) Foot (n=88) 44 91.7 44 91.7 Bicycle (n=4) 0 0.0 4 8.3 Public transport e.g. van (n=2) 2 4.2 0 0.0 Other forms of transport (n=2) 2 4.2 0 0.0 Father/men in family (n=33) 15 31.3 18 37.5 Served first when meals are served (n=96) 95% confidence interval for the percentage difference [ -10.9% ; 5.5% ] [ -14.9% ; 5.6% ] [ -45.5% ; -10.0% ]* [ -19.1% ; 6.2% ] [ -3.8% ; 14.0% ] [ -24.4% ; 12.4% ] Mother/women in family (n=4) 2 4.2 2 4.2 Children (n=51) 28 58.3 23 47.9 [ -9.2% ; 29.0% ] All eat at the same time (n=8) 3 6.3 5 10.4 [ -16.6% ; 7.9% ] 81 4.3.9 Hunger status in households In the group with a lower fruit intake more respondents reported ever running out of money to buy food (89.6%) compared to the group of respondents with a higher fruit intake (83.3%). More or less the same percentage of mothers in both groups reported relying on a limited number of foods to feed their children (87.5% in lower fruit intake group and 85.4% in the higher fruit intake group). More mothers in the group with a lower fruit intake reported cutting the size of meals or skipping meals because there is not enough food in the house (83.3%) than in group of mothers with a higher fruit intake (70.8%). A significantly higher percentage of mothers from the group with a lower fruit intake reported eating less than should be eaten because there is not enough money for food (91.7%) than the group of mothers with a higher fruit intake (75%), with a 95% confidence interval of [1.6% ; 31.3%]. Similarly more mothers in the group with a lower fruit intake reported that children ever eat less than should be eaten because there is not enough money for food (87.6%) compared to the group of mothers with a higher fruit intake (79.2%). In the group with a lower fruit intake, 91.5% reported that children ever say they are hungry because there is not enough food in house. This was similar to the group with a higher fruit intake. More children said they were hungry because of shortage of food in the group with a lower fruit intake (72.1%) than in the group with a higher fruit intake (67.4%), but the difference was not statistically significant. Slightly more mothers reported cutting the size of children’s meals or skipping meals because there was not enough money to buy food, in the group with a lower fruit intake (70.8%), than in the group with a higher fruit intake 66.7%. In addition, more mothers in the group with a lower fruit intake reported that children went to bed hungry because there was not enough money to buy food, (70.8%) compared to the group of mothers with a higher fruit intake (64.6%). 82 Table 4.24 Proportion of circumstances of hunger status of the 96 households with fruit intakes of <median and ≥median of 1 fruit per day from Busia and Kakamega Counties, Western Kenya, in 2013 Group of mothers with intake of <median of 1 fruit per day (n=48) N % Group of mothers with intake of ≥median of 1 fruit per day (n=48) N % 95% confidence interval for the percentage difference Variable Category Household ever run out of money to buy food (n=96) Yes (n=83) 43 89.6 40 83.3 No (n=13) 5 10.4 8 16.7 Rely on limited number of foods to feed children (n=96) Yes (n=83) 42 87.5 41 85.4 No (n=13) 6 12.5 7 14.6 Cut size of meals/skip because there is no enough food in house (n=96) Yes (n=74) 40 83.3 34 70.8 No (n=22) 8 16.7 14 29.2 Ever eat less than should be because there is not enough money for food(n=96) Yes (n=80) 44 91.7 36 75.0 No (n=16) 4 8.3 12 25.0 Children ever eat less than should be because there is not enough money for food (n=96) Yes (n=80) 42 87.5 38 79.2 No (n=16) 6 12.5 10 20.8 Children ever say they are hungry because there is not enough food in house (n=95) Yes (n=86) 43 91.5 43 89.6 No (n=9) 4 8.5 5 10.4 Children said they were hungry for wanting to eat all the time (n=86) No (n=59) 31 72.1 28 65.1 yes (n=27) 12 27.9 15 34.9 Children claim hungry because of shortage of food (n=86) No (n=26) 12 27.9 14 32.6 yes (n=60) 31 72.1 29 67.4 [ -14.4% ; 23.3% ] Cut size of children’s meals/skip because there is not enough money to buy food (n=96) Yes (n=66) 34 70.8 32 66.7 [ -14.1% ; 22.0% ] No (n=30) 14 29.2 16 33.3 Children go to bed hungry because there is not enough money to buy food (n=96) Yes (n=31) 14 29.2 17 35.4 No (n=65) 34 70.8 31 64.6 [ -7.9% ; 20.4% ] [ -4.4% ; 28.6% ] [ 1.6% ; 31.3% ]* [ -6.9% ; 23.3% ] [ -10.9% ; 14.7% ] [ -25.6% ; 12.4% ] [ -24.1% ; 12.2% ] 83 4.3.10 Coping mechanisms for hunger Table 4.25 below shows that none of the respondents reported asking family/relatives/neighbours for help (money/food), moving elsewhere because of food insecurity, or depending on charity/welfare to cope with hunger. In the group of mothers with a higher fruit intake, 83.3% reported that their family experienced periods of food shortage. This was similar to the group with a lower fruit intake. There was a tendency for more households in the group with a lower fruit intake to sell assets in order to cope for hunger (18.0%), than the households with a higher fruit intake (7.5%) but the difference was not statistically significant. However, more mothers in the group with a higher fruit intake reported working for payment in kind in order to cope with hunger (52.5%), compared to the group with a lower fruit intake (46.2%). 84 Table 4.25 Percentages of coping mechanisms by 96 households with fruit intakes of <median and ≥median of 1 fruit per day from Busia and Kakamega Counties, Western Kenya, in 2013 Group of mothers with intake of <median of 1 fruit per day (n=48) N % Variable Category Family experienced periods of food shortage (n=96) Yes (n=79) 39 No (n=17) 9 Group of mothers with intake ≥median of 1 fruit per day (n=48) N % 81.3 40 18.8 8 (n=39) 83.3 16.7 No (n=69) 34 87.2 35 87.5 Yes (n=10) 5 12.8 5 12.5 Asked family/relatives/neighbours for help (money/food) (n=79) Family members went to live elsewhere (n=79) No (n=79) 39 100.0 40 100.0 No (n=79) 39 100.0 40 100.0 (n=39) (n=40) No (n=69) 32 82.1 37 92.5 Yes (n=10) 7 18.0 3 7.5 (n=39) Worked for payment in kind (n=79) [ -13.4% ; 17.5% ] (n=40) found other/additional sources of income (n=79) sold assets (n=79) 95%CI for the percentage difference [ -4.8% ; 26.0% ] (n=40) No (n=40) 21 53.9 19 47.5 Yes (n=39) 18 46.2 21 52.5 Depended on charity/welfare (n=79) No (n=79) 39 100.0 40 100.0 Borrowed money/food (n=79) No (n=54) 25 64.1 29 72.5 Yes (n=25) 14 35.9 11 27.5 Increased production of food (n=79) No (n=75) 38 97.4 37 Yes (n=4) 1 2.6 3 Could not do anything (n=79) No (n=79) 39 100.0 40 Other survival mechanisms (n=79) No (n=75) Yes (n=4) 37 2 94.9 5.1 38 2 (n=39) [ -27.0% ; 15.1% ] (n=40) (n=40) [ -11.8% ; 27.8% ] (n=40) (n=40) 92.5 7.5 [ -17.5% ; 6.5% ] 100.0 (n=40) 95.0 5.0 85 4.4 HOUSEHOLD DIETARY DIVERSITY The results below are related to household dietary diversity. 4.4.1 Consumption of cereals, white roots, tubers, legumes, nuts and seeds The table 4.26 below shows food consumption the day preceding the interview. None of the respondents reported eating more or less than usual on the day preceding the interview. In both the group of mothers with a lower fruit intake and the group with a higher fruit intake, all respondents consumed cereals on the day preceding the interview. In the group with a lower fruit intake 83.3% consumed dark green leafy vegetables while slightly more (87.5%) consumed other vegetables. In the group with a higher fruit intake, even fewer (68.8%) respondents consumed dark green leafy vegetables but slightly more (93.8%) consumed other vegetables. More than 90% of households in both groups did not consume white roots and tubers on the day preceding the interview. Between 66.7% and 68.8% of mothers in both groups did not consume legumes, nuts and seeds. Table 4.26 Percentage of cereals, roots and tubers, legumes, nuts and seeds consumed the day preceding the survey in 96 households with fruit intakes of <median and ≥median of 1 fruit per day in Busia and Kakamega Counties, Western Kenya, in 2013 Mother fruit consumption per day group Group of mothers with intake of <median of 1 fruit per day (n=48) N % Group of mothers with intake of ≥median of 1 fruit per day (n=48) N % Ate more/less yesterday in a celebration (n=96) No (n=96) 48 100.0 48 100.0 Consumed cereals (n=96) Yes (n=96) 48 100.0 48 100.0 Consumed white roots and tubers (n=96) Yes (n=6) 4 8.3 2 4.2 No (n=90) 44 91.7 46 95.8 Consumed legumes, nuts and seeds (n=96) Yes (n=31) 16 33.3 15 31.3 No (n=65) 32 66.7 33 68.8 95% CI for the percentage difference [ -6.9% ; 15.8% ] 86 4.4.2 Consumption of vegetables and fruits The table 4.27 below shows consumptions of vegetables and fruits on the day preceding the interview. Almost all respondents consumed vegetables and tubers. There was a tendency for families from the group of mothers with a higher fruit intake to consume more fruits (50.0%) than those families from the group of mothers with a lower fruit intake (39.6%), but the difference was not statistically significant. Table 4.27 Percentage of vegetables and fruits consumed the day preceding the survey in 96 households with fruit intakes of <median and ≥median of 1 fruit per day in Busia and Kakamega Counties, Western Kenya, in 2013 Group of mothers with intake of <median of 1 fruit per day (n=48) Group of mothers with intake of ≥median of 1 fruit per day (n=48) Variable Category N % N % Consumed vegetables and tubers (n=96) Yes (n=95) 47 97.9 48 100.0 No (n=1) 1 2.1 0 0.0 Consumed fruits (n=96) Yes (n=43) 19 39.6 24 50.0 No (n=53) 29 60.4 24 50.0 95% confidence interval for the percentage difference [ -10.9% ; 5.5% ] [ -28.9% ; 9.2% ] 4.4.3 Consumption of animal proteins, eggs and seafood The table 4.28 below shows consumption of animal proteins, eggs and seafood the day preceding the interview. In the group of mothers with a lower fruit intake, 68.8% of respondents consumed milk and milk products and 41.7% consumed fish and seafood. In the group of mothers with a higher fruit intake, 58.3% of respondents consumed milk and milk products, while 60.4% consumed fish and seafood. In the group with a lower fruit intake, 16.7% of the respondents consumed meat on the day preceding the interview, and 14.6% from the group with a higher fruit intake consumed meat. This difference was however, not statistically significant. In both groups a very small percentage consumed eggs. 87 Table 4.28 Percentage of animal proteins, eggs and sea foods consumed the day preceding the survey in 96 households with fruit intakes of <median and ≥median of 1 fruit per day in Busia and Kakamega Counties, Western Kenya, in 2013 Group of mothers with intake of <median of 1 fruit per day (n=48) Group of mothers with intake of ≥median of 1 fruit per day (n=48) Variable Group N % N % Consumed meat (n=96) Yes (n=15) 8 16.7 7 14.6 No (n=81) 40 83.3 41 85.4 Yes (n=61) 33 68.8 28 58.3 No (n=35) 15 31.3 20 41.7 Yes (n=9) 4 8.3 5 10.4 No (n=87) 44 91.7 43 89.6 Yes (n=49) 20 41.7 29 60.4 No (n=47) 28 58.3 19 39.6 Consumed milk and milk products (n=96) Consumed eggs (n=96) Consumed fish and seafood (n=96) 95% confidence interval for the percentage difference [ -12.8% ; 16.9% ] 4.4.4 Consumption of oils/fats, sweets, spices, condiments and beverages The table 4.29 below shows consumption of oils/fats, sweets, spices, condiments and beverages on the day preceding the interview. In the group of mothers with a lower fruit intake, 89.6% consumed sweets. In the group of mothers with a higher fruit intake, 91.7% consumed sweets. In both groups all respondents used spices, condiments and consumed beverages. The majority of all respondents also reported using oils and fats in food (95.8%). Table 4.29 Percentage of oils/fats used, sweets, spices, condiments and beverages consumed the day preceding the survey in 96 households with fruit intakes of <median and ≥median of 1 fruit per day in Busia and Kakamega Counties, Western Kenya, in 2013 Group of mothers with intake of <median of 1 fruit per day (n=48) N % Group of mothers with intake of ≥median of 1 fruit per day (n=48) N % Variable Category Used oils and fats in food (n=96) Yes (n=92) 46 95.8 46 95.8 No (n=4) 2 4.2 2 4.2 Yes (n=87) 43 89.6 44 91.7 No (n=9) 5 10.4 4 8.3 Yes (n=96) 48 100 48 100 Consumed sweets (n=96) Used spices, condiments and consumed beverages (n=96) 88 4.4.5 Median number of food groups consumed The table 4.30 below indicates the median number of food groups consumed on the day preceding the interview. In both groups the median number of food groups consumed was 7 (ranging from 3 to 10). Table 4.30 Median number of food groups consumed the day preceding the survey in 96 households with fruit intakes of <median and ≥median of 1 fruit per day in Busia and Kakamega Counties, Western Kenya, in 2013 Minimum Median Maximum Group of mothers with intake of <median of 1 fruit per day (n=48) 4 7 10 Group of mothers with intake ≥median of 1 fruit per day (n=48) 3 7 9 95% Confidence interval for the median difference [ -1 ; 0 ] 4.4.6 Household dietary diversity score (DDS) The table 4.31 below indicates the household dietary diversity score (DDS). Most of the respondents had a high DDS (≥ 6 food groups from a possible 12 food groups). There was a tendency for more households (93.8%) from a group of mothers with a higher fruit intake to have a higher dietary diversity score than those households from the group with lower fruit intake (85.4%) though not statistically significant. Table 4.31 Proportion of participants in dietary diversity score (DDS) categories from food groups consumed the day preceding the survey in 96 households with fruit intakes of <median and ≥median of 1 fruit per day in Busia and Kakamega Counties, Western Kenya, in 2013 Mother fruit consumption per day group Dietary diversity score (DDS) (n=96) Low DDS (≤ 3 food groups) (n=1) Medium DDS (4 and 5 food groups) (n=5) High DDS (≥ 6 food groups) (n=90) Group of mothers with intake of <median of 1 fruit per day (n=48) Group of mothers with intake of ≥median of 1 fruit per day (n=48) N % N % 0 0 1 2.1 7 14.6 2 4.2 41 85.4 45 93.8 95% confidence interval for the percentage difference [ -21.6% ; 4.5% ] 89 4.4.7 Source from which food was obtained As far as the source from which food was primarily obtained is concerned (Table 4.32), a higher percentage of respondents from the group with a higher fruit intake reported obtaining their cereals from own production, gathering, hunting and fishing (66.7%) while only a few (33.3%) obtained these through purchasing. In contrast, fewer respondents from the group with a lower fruit intake obtained their cereals from own production, gathering, hunting and fishing (41.7%) but more respondents obtained them through purchasing (58.3%). In the group with a lower fruit intake there was a tendency of more respondents (58.3%) to obtain fruits through purchasing compared to the group with higher fruit consumption (47.9%, but the difference was not significant (95%CI for percentage difference [ -9.2% ; 29.0% ]). In the group with a lower fruit intake, 39.6% of the respondents obtained fruits from own production, gathering, hunting and fishing while in the group with a higher fruit intake there was a tendency of more households 52.1% to obtain fruits from own production, gathering, and hunting but the difference was not significant (95%CI for percentage difference [ -9.2% ; 29.0% ]). In the group with a lower fruit intake, 62.5% and in the group with higher fruit consumption 64.6% of respondents obtained vegetables from own production, gathering, hunting and fishing. 90 Table 4.32 Proportion of primary sources for obtaining cereals, fruits and vegetables by 96 households with fruit intakes of <median and ≥median of 1 fruit per day in Busia and Kakamega Counties, Western Kenya, in 2013 Group of mothers with intake of <median of 1 fruit per day (n=48) N % Group of mothers with intake of ≥median of 1 fruit per day (n=48) N % 95% CI for the percentage difference Type of food Source Primary source for obtaining cereals for household (n=96) Own production, gathering, hunting, fishing (n=52) Purchased (n=44) 20 41.7 32 66.7 28 58.3 16 33.3 Primary source for obtaining fruits for household (n=96) Own production, gathering, hunting, fishing(n=44) Purchased (n=51) 19 39.6 25 52.1 [ -30.9% ; 7.2% ] 28 58.3 23 47.9 [ -9.2% ; 29.0% ] Borrowed, bartered, exchange for labour, gift from friends or relatives (n=1) 1 2.1 0 0.0 Own production, gathering, hunting, fishing (n=61) Purchased (n=35) 30 62.5 31 64.6 18 37.5 17 35.4 Primary source for obtaining vegetables for household (n=96) 4.5 ANTHROPOMETRIC INFORMATION The results below are related to anthropometric measurements of mothers/caregivers and their children. 4.5.1 Median anthropometric indicators of mothers and children The table 4.33 below shows the median anthropometric measurements of mothers and children in the two groups. In the group of mothers with a lower fruit intake, the median height of mothers was 1.6 m (ranging from 1.5 m to 1.8 m) while in the group with a higher fruit intake, the median height was the same at 1.6 m (ranging from 1.5 m to 1.7 m). 91 In the group with a lower fruit intake, the median weight of mothers was 55 kg (ranging from 39.2 kg to 76.8 kg). In this group, the median BMI of the mothers was 21.2 kg/m2 with a minimum of 17.7 kg/m2 and a maximum of 30.7 kg/m2. In the group of mothers with a higher fruit intake, median weight was higher at 59.2 kg (ranging from 48.8 kg to 83 kg). In this group, the median BMI of the mother was 22.4 kg/m2, with a minimum of 18.8 kg/m2 and a maximum of 31.8 kg/m2. Although median BMI of mothers in both groups fell within the normal range of 18.5-24.9 kg/m2, BMI of mothers with a higher fruit consumption was significantly higher than that of mothers with a lower fruit consumption (95%CI for median difference [-2.44 ; -0.30 ]). Similarly the median waist circumference of mothers with a lower fruit intake was 76.6 cm (ranging from 68 cm to of 102 cm) which was also significantly lower than the median 80 cm waist circumference of mothers with a higher fruit intake (ranging from 70.8 cm to 103.5 cm) with a 95%CI of [ -7.87 ; -1.5 ]. Table 4.33 below shows that in the group of mothers with a lower fruit intake, the median MUAC of their children was 14.6 cm (ranging from 11.8 cm to 17.7 cm) while in the group with a higher fruit intake, the median MUAC of children was slightly higher at 15.1 cm (ranging from 12.5 cm to 17.4 cm). The difference was not statistically significant. 92 Table 4.33 Median anthropometric measurements of 96 mothers and 96 children with fruit intakes of <median and ≥median of 1 fruit per day in Busia and Kakamega Counties, Western Kenya, in 2013 Variable Mother weight (kg) (n=96) Mother height (cm) (n=96) Mother waist (cm) (n=84) Mother BMI (kg/m2) (n=96) Mother age (years) (n=94) Child weight (kg) (n=96) Child height (cm) (n=96) Child MUAC (cm) (n=96) Child age (years) (n=96) Mother fruit consumption per day group <median (n=48) Minimum 39.2 Median 55.5 Maximum 76.8 ≥median (n=48) 48.8 59.2 83.0 <median (n=48) 1.5 1.6 1.8 ≥median (n=48) 1.5 1.6 1.7 <median (n=45) 68.0 76.6 102.0 ≥median (n=39) 70.8 80.0 103.5 <median (n=48) 17.7 21.2 30.7 ≥median (n=48) 18.8 22.4 31.8 <median (n=48) 19.0 28.0 81.0 ≥median (n=46) 18.0 32.0 55.0 <median (n=48) 6.6 11.7 19.5 ≥median (n=48) 8.0 12.7 21.5 <median (n=48) 66.0 84.5 108.3 ≥median (n=48) 71.1 88.6 116.3 <median (n=48) 11.8 14.6 17.7 ≥median (n=48) 12.5 15.1 17.4 <median (n=48) 0.8 2.5 4.8 ≥median (n=48) 0.6 2.9 4.8 95% Confidence interval for the median difference [ -7.87 ; -1.5 ]* [ -2.44 ; -0.30 ]* [ -6 ; 2 ] [ -0.77 ; 0.20 ] [ -0.67 ; 0.25 ] 4.5.2 Anthropometric status of mothers Table 4.34 shows the categorical BMI and waist circumference results of mothers in the two groups. Most respondents had a BMI that fell in the normal BMI category 18.5 – 25 kg/m2 (72.9% 93 of mothers with lower fruit intake and 75% of mothers with higher fruit intake). None of the mothers with a higher fruit intake had a BMI of <18.5 kg/m2. In the group of mothers with a lower fruit intake, 12.5% had a BMI of <18.5 kg/m2, which was significantly higher than that of mothers in the group with a higher fruit intake (95% CI for percentage difference [2.5%; 24.7%]). A large percentage of mothers had a waist circumference of <80 cm (71.1% of mothers with lower fruit intake and 46.2% of mothers with higher fruit intake). In the group of mothers with a lower fruit intake only 28.9% had a waist circumference ≥80 cm. In the group of mothers with a higher fruit intake, this percentage was higher at 53.9%, a difference that was significant (95% CI for percentage difference [-43.3%; -3.9%]). Table 4.34 Proportion of categories of BMI and waist circumference in 96 mothers with fruit intakes of <median and ≥median of 1 fruit per day in Busia and Kakamega Counties, Western Kenya, in 2013 Mother fruit consumption per day group Group of mothers with intake of <median of 1 fruit per day Group of mothers with intake of ≥median of 1 fruit per day Variable Category N % N % Mother BMI group (kg/m2) (n=96) <18.5 (n=6) 6 12.5 0 0 18.5 – 25 (n=71) 35 72.9 36 75.0 25 - 30 (n=17) 6 12.5 11 22.9 ≥30 (n=2) 1 2.1 1 2.1 <80 (n=50) 32 71.1 18 46.2 ≥80 (n=34) 13 28.9 21 53.9 Mother waist group (cm) (n=84) 95% Confidence interval for the median percentage difference [2.5%; 24.7%]* [-43.3%; -3.9%]* Frequency Missing for mother waist = 12 Table 4.35 compares the BMI and waist-circumference of mothers in the two groups. In the group of mothers with a lower fruit intake, all mothers with a BMI of <18.5 kg/m2 had a waist circumference <80 cm. In the group of mothers with a lower fruit intake, a higher percentage of mothers with a BMI within the normal range of 18.5 – 25 kg/m2 had a waist circumference <80 cm (78.8%) than in the group of mothers with a higher fruit intake, where 62.1% with a normal BMI had a waist circumference <80 cm. 94 Table 4.35 Proportion of BMI group by waist circumference group in 96 mothers with fruit intakes of <median and ≥median of 1 fruit per day in Busia and Kakamega Counties, Western Kenya, in 2013 Waist circumference BMI <18.5 18.5 – 25 25 - 30 ≥30 N % N % N % N % Mothers with intake of <median of 1 fruit per day (n=45) <80 (n=32) 6 100 26 78.8 0 0 0 0 ≥80 (n=13) 0 0 7 21.2 5 100 1 100 Mothers with intake of ≥median of 1 fruit per day (n=39) <80 (n=18) 0 . 18 62.1 0 0 0 0 ≥80 (n=21) 0 . 11 37.9 9 100 1 100 4.5.3 Anthropometric status of children Of the 96 children included in the study, 56 were boys and 40 girls. In the group with a lower fruit intake most children were girls (54.2%) while in the group with a higher fruit intake most of the children were boys (70.8%). None of the children presented with oedema. Table 4.36 Proportion of gender and presence of oedema in 96 children of 96 mothers with fruit intakes of <median and ≥median of 1 fruit per day in Busia and Kakamega Counties, Western Kenya, in 2013 Group of mothers with intake of <median of 1 fruit per day (n=48) N % Group of mothers with intake of ≥median of 1 fruit per day (n=48) N % Variable Category Child gender (n=96) Male (n=56) 22 45.8 34 70.8 Female (n=40) 26 54.2 14 29.2 No (n=96) 48 100 48 100 Child oedema (n=96) Table 4.37 below shows the median height-for-age z-score, weight-for-age z-score and weightfor-height z-score of children. In the group of mothers with a lower fruit intake, the median zscore for height-for-age was -1.6 (ranging from -5.5 to 0.9). In the group with a higher fruit intake, the median height-for-age was -1.4 (ranging from -3.4 to 1.8). 95 In the group with a lower fruit intake the median weight-for-age z-score was -0.6 (ranging from 4.1 to 1.4), while in the group with a higher fruit intake, it was -0.4 (ranging from -2.7 to 1.4). In both groups, the median weight-for-height z-score was 0.2. None of the differences in z-scores of children in the two groups were significantly different. Table 4.37 Median WHO z-scores of 96 children of 96 mothers with fruit intakes of <median and ≥median of 1 fruit per day in Busia and Kakamega Counties, Western Kenya, in 2013 Variable Height-for-age z-score (n=96) Weight-for-age z-score (n=96) Weight-for-Height z-score (n=96) Mother fruit intake per day group <median (n=48) Minimum Median Maximum -5.5 -1.6 0.9 ≥median (n=48) -3.4 -1.4 1.8 <median (n=48) -4.1 -0.6 1.4 ≥median (n=48) -2.7 -0.4 1.4 <median (n=48) -2.1 0.2 2.5 ≥median (n=48) -2.8 0.2 2.7 95% CI for median difference [ -0.7 ; 0.1 ] [ -0.5 ; 0.3 ] [ -0.4 ; 0.4 ] Table 4.38 below shows the categorical results for height-for-age and weight-for-age of children of mothers in the two different groups of fruit intake. A significantly higher percentage of children in the group of mothers with a lower fruit intake had a height-for-age <-2 standard deviations from the WHO median (31.3% were thus stunted) than children of mothers with a higher fruit intake (8.3%) with a 95% CI of [7.0% ; 37.9% ]. As far as weight-for-age is concerned, 8.3% of children of mothers with a lower fruit intake had a weight-for-age <-2 standard deviations from the reference WHO median and were thus underweight, compared to only 4.2% in the group of children with mothers that had a higher fruit intake. This difference was, however, not statistically significant. 96 Table 4.38 Proportion of categorical anthropometric indicators in 96 children of 96 mothers with fruit intakes of <median and ≥median of 1 fruit per day in Busia and Kakamega Counties, Western Kenya, in 2013 Variable Height-for-age (n=96) Weight-for-age (n=96) z-score category <-2 (n=19) Group of mothers with intake of <median of 1 fruit per day (n=48) N % Group of mothers with intake of ≥median of 1 fruit per day (n=48) N % 15 31.3 4 8.3 >= -2 (n=77) 33 68.8 44 91.7 <-2 (n=6) 4 8.3 2 4.2 >= -2 (n=90) 44 91.7 46 95.8 95% confidence interval for the percentage difference [ 7.0% ; 37.9% ]* [ -6.9% ; 15.8% ] Table 4.39 below shows the gender of children with stunting (HA) and underweight (WA). In the group of mothers with a lower fruit intake, 31.8% boys and 30.8% girls had a height-for-age <-2 standard deviations from the WHO median (thus stunted). This difference was not statistically different with a 95% CI of [-23.6% ; 26.3%]. For those children of mothers with a higher fruit intake 11.8% boys and no girls were stunted, with a 95% CI of [-10.9%; 26.6%]. This difference was, however, not statistically significant. In the group of mothers with a lower fruit intake 9.1% boys and 7.7% girls had a weight-for-age <-2 standard deviations from the reference WHO median (thus underweight). This difference was not statistically different with a 95% CI of [ -16.3%; 20.9%]. In the group of mother with a higher fruit intake, who were underweight 5.9% of girls and no boys were underweight. The 95% CI of [-16.1% ; 19.1%] indicates that this difference was not statistically significant. 97 Table 4.39 Proportion of gender in 96 stunted and underweight children of 96 mothers with fruit intakes of <median and ≥median of 1 fruit per day in Busia and Kakamega Counties, Western Kenya, in 2013 Gender Category N % N % <median <-2 (n=15) 7 31.8 8 30.8 [ -23.6% ; 26.3% ] ≥median <-2 (n=4) 4 11.8 0 0.0 [ -10.9% ; 26.6% ] <median > -2 (n=33) 15 68.2 18 69.2 ≥median > -2 (n=44) 30 88.2 14 100.0 <median <-2 (n=4) 2 9.1 2 7.7 [ -16.3% ; 20.9% ] ≥median <-2 (n=2) 2 5.9 0 0.0 [ -16.1% ; 19.1% ] <median > -2 (n=44) 20 90.9 24 92.3 ≥median > -2 (n=46) 32 94.1 14 100.0 Variable Male 95% confidence interval for the median percentage difference Female Stunted (HA) (n=96) Underweight (WA) (n=96) In the group of mothers with a lower fruit intake, 6.3% of children had a MUAC of 11 - <12.5 cm while in the group with a higher fruit intake no child had a MUAC of 11 - <12.5 cm, a percentage difference that was not statistically significant. Table 4.40 Proportion of MUAC categories in 96 children of 96 mothers with fruit intakes of <median and ≥median of 1 fruit per day in Busia and Kakamega Counties, Western Kenya, in 2013 Group of mothers with intake of <median of 1 fruit per day N % Child MUAC group (cm) 11 - <12.5 (n=3) ≥12.5 (n=93) Group of mothers with intake ≥median of 1 fruit per day N % 3 6.3 0 0.0 45 93.8 48 100.0 95% confidence interval for the percentage difference [ -2.2% ; 16.8% ] 98 4.6 HEALTH INFORMATION The results below are related to health of respondents. 4.6.1 Marital status and care for orphans In both of the groups of mothers with higher and lower fruit intake, more than 80% were married. A few households in both of the groups with lower (37.5%) and higher (39.6%) fruit intake cared for orphans or other children (that were not their own) in their household. Table 4.41 Proportion of marriage categories and care for orphans and other children in 96 mothers with fruit intakes of <median and ≥median of 1 fruit per day in Busia and Kakamega Counties, Western Kenya, in 2013 Group of mothers with intake of <median of 1 fruit per day (n=48) N % Group of mothers with intake of ≥median of 1 fruit per day (n=48) N % Variable Category Marital status (n=96) Child (n=1) 0 0.0 1 2.1 Never married (n=2) 2 4.2 0 0.0 Currently married/Traditional marriage (n=81) Widowed (n=8) 40 83.3 41 85.4 4 8.3 4 8.3 Separated (n=4) 2 4.2 2 4.2 Yes (n=37) 18 37.5 19 39.6 No (n=59) 30 62.5 29 60.4 Care for orphans or any other children in their household (n=96) 4.6.2 History of smoking, snuffing and alcohol consumption In both groups, none of the respondents smoked or used snuff. In the group with a lower fruit intake 81.3% reported never using spirits before while in the group with a higher fruit intake it was 93.8%. Very few respondents in both groups had ever used wine and beer. 99 Table 4.42 Proportion of history of smoking, snuffing, alcohol use categories, use of traditional beer and symptoms of fatigue in 96 households with fruit intakes of <median and ≥median of 1 fruit per day in Busia and Kakamega Counties, Western Kenya, in 2013 Group of mothers with intake of <median of 1 fruit per day (n=48) N % Group of mothers with intake of ≥median of 1 fruit per day (n=48) N % Variable Category History of smoking (n=48) Never smoked (n=48) 48 100 48 100 History of snuffing (n=48) Never used snuff (n=48) 48 100 48 100 History of alcohol use (n=96) Never used spirits (rum, whisky, gin, vodka etc.) (n=84) Used wine (n=5) 39 81.3 45 93.8 4 8.3 1 2.1 Used beer (n=7) 5 10.4 2 4.2 (n=2) Homemade beer (n=3) Yes (n=3) 2 Feel tired on Monday after heavy wine consumption during weekends (n=1) No (n=1) 1 (n=1) 100 1 100 0 (n=1) 100 (n=0) . 4.6.3 Duration of sleeping and depression In both the group with lower and higher fruit intake the median duration of sleeping was 9 hours per day. Table 4.43 Median number of sleeping hours in 96 mothers with fruit intakes of <median and ≥median of 1 fruit per day in Busia and Kakamega Counties, Western Kenya, in 2013 Variable Groups Minimum Median Maximum Sleep (n=96) < median (n=48) 6 9 12 ≥ median (n=48) 7 9 12 95% Confidence interval for the median difference [ -0.5 ; 0 ] 100 In both groups of mothers, very few slept for less than 8 hours per day (8.3% of mothers with lower fruit intake and 14.6% of mothers with a higher fruit intake). About a third of mothers in both the groups reported taking naps during the day. In both the group with a lower fruit intake and a higher fruit intake, more than 60% of mothers reported feeling sad, blue or depressed for two weeks in a row during the past 12 months. Table 4.44 Percentage of sleep categories, taking naps day time and feelings of depression in 96 households with fruit intakes of <median and ≥median of 1 fruit per day in Busia and Kakamega Counties, Western Kenya, in 2013 Group of mothers with intake of <median of 1 fruit per day (n=48) N % Group of mothers with intake of ≥median of 1 fruit per day (n=48) N % Variable Category Sleep group (n=96) <8 hours (n=11) 4 8.3 7 14.6 ≥8 hours (n=85) 44 91.7 41 85.4 (n=48) Take naps during the day (n=94) Yes (n=31) 15 No (n=63) 33 [ -19.8% ; 7.2% ] (n=46) 31.3 16 68.8 30 (n=48) During past 12 months felt sad, blue or depressed for two weeks in a row (n=96) 95% CI for the percentage difference 34.8 65.2 (n=48) Yes (n=62) 31 64.6 31 64.6 No (n=34) 17 35.4 17 35.4 4.6.4 HIV/AIDS In the group of mothers with a lower fruit intake, 68.1% knew people who have HIV/AIDS, while in the group with higher fruit intake 72.3% did. None of the mothers in the study reported having children that were HIV infected. In the group of mothers with a lower fruit intake, almost 60% reported having family members who live with HIV/AIDS (59.4%). In the group of mothers with higher fruit intake this was higher at 73.5% though the difference was not statistically significant. 101 About the same percentage of respondents from the group with a lower fruit intake (59.4%) and from the group with a higher fruit intake (61.8%), knew people in the community who are living with HIV/AIDS. Table 4.45 Percentage of respondents who identified people living with HIV/AIDS in 96 households with fruit intakes of <median and ≥median of 1 fruit per day in Busia and Kakamega Counties, Western Kenya, in 2013 Willing to answer HIV/AIDS related questions (n=96) Yes (n=94) No (n=2) Group of mothers with intake of <median of 1 fruit per day (n=32) N % Group of mothers with intake of ≥median of 1 fruit per day (n=34) N % (n=48) (n=48) 47 97.9 47 97.9 1 2.1 1 2.1 (n=47) Know people who have HIV/AIDS (n=94) Children (n=66) (n=47) Yes (n=66) No (n=28) 32 68.1 34 72.3 15 31.9 13 27.7 No (n=66) 32 100.0 34 100.0 (n=32) Grandchildren (n=66) (n=34) No (n=65) 31 96.9 34 100.0 Yes (n=1) 1 3.1 0 0.0 (n=32) Spouse (n=66) (n=34) No (n=65) 32 100.0 33 97.1 Yes (n=1) 0 0.0 1 2.9 (n=32) Family members (n=66) (n=34) No (n=22) 13 40.6 9 26.5 Yes (n=44) 19 59.4 25 73.5 (n=32) Friends (n=66) [ -35.0% ; 8.3%] (n=34) No (n=65) 32 100.0 33 97.1 Yes (n=1) 0 0.0 1 2.9 (n=32) People in the community (n=66) 95% confidence interval for the percentage difference (n=34) No (n=40) 19 59.4 21 61.8 Yes (n=26) 13 40.6 13 38.2 102 CHAPTER 5 DISCUSSION 5.1 INTRODUCTION In this chapter the results pertaining to socio-demographic and household data, household food security and food procurement data, household dietary diversity data, anthropometric status, as well as health background of the study population will be discussed. Where possible, results obtained in the current study will be compared to other relevant literature, and possible reasons for findings will be given. The current study was the first of its kind to determine how fruit intake of children below 5 years and their mothers/caregivers may be associated with nutritional status and other background factors in Kenya, making it difficult to compare results with other similar studies undertaken in Kenya. For this reason, results are compared to that of similar studies in other developing countries. In general, fruit consumption of both mothers and children in the current study was found to be low. This has been confirmed by a number of other studies in Kenya (Wolfenden et al, 2012; Kehlenbeck et al., (2013:261). 5.2 LIMITATIONS OF THE STUDY The limitations of this study included the relatively small number of subjects participating in the study. Although this may be considered to be a limitation, all four agro-ecological zones of Busia and Kakamega districts were included, thus increasing the chances of including a representative sample. Accessibility to the study areas was often difficult due to lack of reliable transport and rainy weather. When this was the case, a motorbike was used to reach the households of study participants, even in difficult terrains. 103 In some cases, those participants who were randomly selected to participate did not give consent to participate in the research and had to be excluded. In such cases they were replaced by other participants (that were also randomly selected). It is possible however, that refusal to participate could have introduced a certain degree of bias into the study and this is acknowledged. 5.3 SOCIO-DEMOGRAPHIC STATUS All the four agro-ecological zones in the study location were surveyed. In a study by Bliault, (2012) determining on-farm fruit tree species richness, abundance and diversity in Busia, participants were also randomly selected from the same four agro-ecological zones, making comparisons between these two studies ideal. In the current study, a higher percentage of mothers with a lower fruit intake (41.7%) compared to a higher fruit intake (38.3%) were surveyed from the humid lower midland (LM1) = area. This area is in closer proximity to urban and peri-urban centres, indicating that slightly more households from the group of mothers with a lower fruit intake had access to these centres than those from a group with a higher fruit intake. Such peri-urban centres include Kakamega and Busia towns as shown on the Busia and Kakamega maps. This may have had an influence on ability to purchase foods. LM1 is also the wettest zone (Bliault, 2012). In the semi-humid lower midland (LM2), 35.4% households were surveyed from the group of mothers with a fruit intake of less than the median of I fruit per day, while 42.6% households were surveyed from the group of mothers with a daily fruit intake of more than or equal to one fruit per day. LM1 and LM2, have high agricultural potential due to regular long rains (Bliault, 2012). Many households from the group of mothers with a higher fruit intake reside in an area of regular long rains suitable for growing crops and fruits. As expected, more than 90% of mothers in both the groups spoke Luhya, since both Busia and Kakamega district of western Kenya are home to the Luhya people (NCAPD, 2005, NCAPD, 2005b). 104 A large percentage of all mothers were unemployed. More than 90% of households in both groups were of low socioeconomic status, with mostly unemployed mothers living in contemporary environments of Western Kenya. Low household socioeconomic status is often associated with limited access to resources that directly influence household nutritional status such as food and healthcare (Gewa et al, 2012). In the group of mothers with a fruit intake of less than the median of one fruit per day, 18.8% of husbands/partners were full-time wage earners (received a salary), while fewer husbands/partners of mothers with a daily fruit intake of one or more fruits per day (8.3%) were full-time wage earners (received a salary). The study by Bliault (2012) conducted amongst farming households of Busia, found that respondents from the humid lower midland had a greater proximity to Busia town that provided them with secondary sources of income. Almost half of the mothers with a higher fruit intake obtained water from a borehole or well (45.8%), as well as 31.9% in the group with a lower fruit intake. More mothers in both groups therefore used protected water. Water and sanitation are critically important factors in ensuring good health (Loewenberg, 2014). According to Loewenberg (2014:1025), globally 783 million people do not have clean water and 2.5 billion lack hygienic sanitation. More mothers from both groups also obtained water from sources such as shallow wells and rainwater. From the group with a lower fruit intake 44.7% of households, and 33.3% from the group with a higher fruit intake obtained water from shallow wells and rainwater. Such water sources can easily be contaminated by human activities. In Wajir, 60% of shallow wells are contaminated by human faeces during the rainy season causing waterborne diseases such as cholera in Kenya (Loewenberg, 2014). In the present study, more than 90% of all mothers reported using pit latrines. If shallow, pit latrines can also cause water contamination during the rainy season. Waterborne diseases from contaminated water, cause diarrhea which may worsen loss of nutrients and weight loss in children. In this study, more than 90% of households in both groups had a room density of higher than 2.5 indicating a low socioeconomic status. High room density is also associated with poverty, which may impact on low fruit consumption. The study by Martin et al. (2013), determined unstable 105 housing as one of the underlying causes of poverty and food insecurity. Monteiro et al. (2010:465) reported that households with low socio-economic status are more likely to experience weight loss due to limited access to healthcare and poor housing conditions. Polygamous marriages ranged from 4.2%-10.4% of respondents, which was similar to the KDHS, (2009:104), that reported that 13% of currently married women live in polygamous unions. None of the differences in socio-demographic variables were statistically significant between the group with a lower fruit intake and a higher fruit intake, indicating that the two groups were comparable in this respect. Differences in socio-demographic factors were thus not primarily responsible for differences in fruit intake. 5.4 FOOD SECURITY AND FOOD PROCUREMENT The world’s greatest challenge is to secure adequate food that is healthy and sustainable (Fanzo & Hunter, 2013). Food system-based approaches that address problems of food availability and diet quality through local production and agricultural biodiversity as related to nutrition have been under-researched (Fanzo et al., 2013:ii). Nature provides variety of food species though underutilized and disregarded by modern food production systems (Fanzo et al., 2013:iv). Biodiversity includes the variety of plants, terrestrial animals and marine and other aquatic resources (species diversity), along with the variety of genes contained in all individual organisms (genetic diversity), and the variety of habitats and biological communities (ecosystem diversity) and is important for humanity, providing food, fibre, fodder, fuel, and medicine in addition to other ecosystem services and it provides the basic resources farmers need to adapt to variable conditions in marginal environments and the resources required to increase productivity in more favourable settings (Fanzo & Hunter, 2013:36). A total of 300,000 plant species, 10,000 have been used for human food since the origin of agriculture and from these, only 150–200 species have been commercially cultivated of which only four – rice, wheat, maize and potato – supply fifty percent of the world’s energy needs, while thirty crops provide 90% of the world’s caloric intake (Fanzo & Hunter, 2013:36). 106 Eco-nutrition, eco-agriculture, and ecosystem services all feature elements of managing genetic, species, and landscape diversity (DeClerck, 2013:27). Agricultural landscapes, that occupy 38% of terrestrial landscapes, provide abundant food sources (DeClerck, 2013:29). Agricultural biodiversity includes under-exploited species that contribute to food security, health, income generation, and ecosystem services such as traditional vegetables (Fanzo & Hunter, 2013:37). There is a need to integrate nutrition and human health, agriculture and food production, environmental health, and economic development in order to reduce malnutrition, increase agricultural productivity, protect the environment, and promote economic development hence eco-nutrition (DeClerck, 2013:18). A classic example of eco-nutrition in subsistence systems is the indigenous ‘American three-sisters’ polyculture where farmers simultaneously sow maize, beans and squash not only in the same field, but in the same planting hole (DeClerck, 2013:24). DeClerck (2013:25-26) in his previous research while working with subsistence farmers of Western Kenya, found that farmers who had greater in-field crop nutritional diversity, where the unit of measure was not species diversity but the nutritional diversity of the crops, were less likely to suffer anaemia than farmers with lower field-based nutritional diversity. A study undertaken by Ekesa, (2009), reviewed the ancient agricultural biodiversity of Kenya. The study reported on agricultural biodiversity of Kenyans and how this has been affected through such factors as commercialization and globalization, rapid population growth and increased agricultural production with limited breeding practice. This study also highlighted efforts on conservation of agricultural biodiversity by the Kenyan government due to the rampant food insecurity in this nation (Ekesa, 2009:209). In the present study, the percentage of households that spent more than KES 1300 weekly was similar in the group of mothers with a lower fruit intake (78.7%) and the group of mothers with a higher fruit intake (74.5%). This implies that both groups were similar in this respect. There was a tendency for households in the group of mothers with a lower fruit intake to be more likely to have wages and salaries from formal employment as their main source of income than the households in the group of mothers with a higher fruit intake but the difference was not significant (95%CI for percentage difference [ -2.7% ; 27.3% ]). This finding may be explained by 107 the fact that respondents from the group with the lower fruit intake were more likely to be involved in formal employment from the accessible urban and peri-urban centres of the humid lower midland (LM1) agro-ecological zone (AEZ). Many respondents from the group with a lower fruit intake also prefer to stay in LM1-AEZ (41.7%). There was also a tendency for households in the group of mothers with a higher fruit intake to have crop production and livestock sales as their main source of income when compared to households in the group of mothers with a lower fruit intake but again, the difference was not significant (95%CI for percentage difference [ -36.4% ; 0.8% ]). This may be explained by the fact that, many respondents from the group with a higher fruit intake resided in sub-humid lower midland (LM-2) and humid lower midland (LM1) AEZ, that experience regular long rains from March to May and a second rainy season from October to December (Bliault, 2012) have a high agricultural production potential and hence prefer crop and livestock farming. Significantly more households in the group of mothers with a higher fruit intake grew sweet potato (87.5%) than households in the group of mothers with a lower fruit intake (65.2%). In households that grow vegetables, sweet potato (Ipomoea batatas) are one of the important crops that are grown. These are commonly consumed both during famine and in periods when food is available on the farms. Those households that grow sweet potato are more likely to be food secure, especially during famine. Sweet potato is one of the predominant crops in the study region (Bliault, 2012). Growing a range of local crops supplemented by wild-harvested species helps provide such diversity in the diet, especially of poor rural families, and complements nutrition from staples such as maize, rice and cassava (Heywood, 2013:43). The review by Heywood (2013:43) reported the micronutrient superiority of some underutilized cultivars and wild varieties, than commonly consumed foods according to previous research that confirmed that beta-carotene content may differ by a factor of 60 between sweet potato cultivars and the pro-vitamin A carotenoid of banana cultivars. Significantly more households in the group of mothers with a higher fruit intake grew African nightshade (54.4%) than households with a lower fruit intake (34.0%). As with sweet potato, 108 households with a higher fruit intake were more likely to grow other vegetables as well, since they are more likely to be involved in agricultural production. The habit of consuming wild food plants that include traditional leafy vegetables and wild fruits is still common, in rural western Kenya. African nightshades is one of the important traditional vegetable that grows on the farm during wet and dry seasons. This vegetable adapts well to the local environmental conditions, does not require much input such as expensive pesticides to grow and is available for consumption during most seasons. Traditional vegetables and other local foods, are genetically diverse, hence such local varieties may be more resilient to weather-related events or to attacks by pests or diseases (Schutter, 2013:xxii). Consumption of traditional wild leafy vegetables is important as a source of micronutrients (Heywood, 2013:44). African traditional leafy vegetables are believed to be medicinal with health benefits such as protecting against gastro-intestinal helminthes infestations and development of young children (Bisseleua & Niang 2013:112). The households with a higher fruit intake were more likely to have this vegetable available during times of hunger and poor food security. Abukutsa (2010) has reported that African nightshades is an important vegetable in western Kenya and it is widely grown in Kakamega. A significantly higher percentage of respondents with a higher fruit intake reported that fruits were easily available from local farmers and shops (79.2%) than in the group with a lower fruit intake (50%). When fruits are easily available to households, their consumption increases. Households with lower fruit consumption may find it more difficult to obtain fruits and vegetables. In a study by Chukwuone and Okeke (2012) among savanna and rainforest ecosystems in Cross Rivers and Enugu states of southern Nigeria, consumption of non-wood forest products that included fruits decreased with the distance to the source of collection. There was a tendency for more households in the group with a higher fruit intake to grow such exotic fruit trees as mangoes (77.3%), avocados (88.4%) jackfruit (34.9%) and lemons (18.6%) than households in the group with a lower fruit intake that grew mangoes (63.0%) avocados (71.7%) jackfruit (23.9%), and lemons (10.9%). None of the differences were, however, statistically significant. Once again, this may be due to the fact that many respondents from the group with a higher fruit intake resided in sub-humid lower midland (LM-2) and humid lower 109 midland (LM1) AEZ. Both of these areas experience regular long rains and are suitable for agricultural production suitable for growing those fruit trees. Bliault, (2012) also reported that more than 66% of households in these areas grew the exotic fruit trees such as Mangifera indica (mango) and Persea americana (avocado) amongst others. Bliault, (2012:10) also reported that no indigenous fruit tree species was ranked within the top 5 most abundant species in LM1 and LM2. During months of severe famine that include mainly the month of March to June some of the exotic fruit trees such as avocado, lemon (Citrus limon), jack fruit (Artocarpus heterophyllus), and others like java plum (Syzygium cuminii), usually survive environmental stress and are available for consumption. A significantly higher percentage of mothers from the group with a lower fruit intake reported eating less than should be eaten because there was not enough money for food (91.7%) than the group of mothers with a higher fruit intake (75%). Since differences in socio-demographic status were not significant (section 5.3), the reason for this finding seems to be more likely to be related to differences in agricultural practices (e.g. significant differences in production of sweet potato and African nightshades). Kenya has been faced with repeated cycles of famine and drought resulting in insufficient food production both at the household level and nationally that caused many families to consume less food than they required (Masibo et al, 2012). The global increase in food prices has also impacted on food insecurity in the country (Masibo et al, 2012). Bliault, (2012) also reported that during the month of December and March, households mainly rely on their own agricultural produce. These are actually periods of famine and may extend till June, and those households who did not harvest and keep food for future use tend to suffer more. During hunger periods, 2.6% of households with a lower fruit intake and 7.5% of those with a higher fruit intake increased production of food in order to cope with hunger. Traditionally, issues related to hunger have been the domain of nutrition, crop production, the domain of agronomy, and environmental conservation and the domain of ecology (DeClerck, 2013:21). Farmers with a higher fruit intake may have cultivated home gardens for growing fruits and vegetables hence the increased consumption of fruits. In the review by Bharucha and Pretty (2010), home gardens were considered as a refuge for wild species and in periods of drought 110 when the wild species suffer, the domesticated species of fruits and vegetables in the home gardens provide considerable additional value to farm households. Increased production of food thus increases fruit and vegetables consumption and diversifies diets. In the present study, households also increased food productions for consumption and perhaps for sale in order to obtain an income. In the group of women with a lower fruit intake, 35.9% borrowed money or food while 18.0% sold assets to cope with hunger. In the group of women with a higher fruit intake, most households (52.5%) worked for payment in kind in order to cope with hunger. This is a common practice to cope with hunger. Bharucha and Pretty (2010) also reported that a minority of households in some communities resolve to sell forest products such as wild fruits, during emergency periods in order to cope with hunger in times of financial need. Some households however, sold stored crops, borrowed cash or engaged in wage labour in order to cope during emergency periods (Bharucha & Pretty, 2010). Global trends indicate that people are more likely to depend solely on store-bought and cultivated foods instead of underutilized wild foods such as fruits and traditional vegetables, a practice that may impact negatively on ability to cope during periods of hunger when money to purchase food is not available. By domesticating and maintaining a variety of species and genetic diversity within each species, farmers and herders contribute to the sustainability of our food systems (Schutter, 2013:XX). Even though a lot of food is being produced globally, access to enough food that is affordable and nutritious for all populations has been more challenging (Fanzo & Hunter, 2013:35). 5.5 HOUSEHOLD DIETARY DIVERSITY Food variety is measured by the number of types of foods consumed by the household (Bernstein et al., 2002), whereas dietary diversity is measured by different types of food groups (such as cereals, legumes nuts and seeds, spices condiments and beverages, milk and milk products, and vitamin A rich vegetables and fruits), commonly consumed in a household (Kant et al., 1993). When many food groups are consumed every day by the household, the likelihood of nutrition needs being met are increased (Labadarios et al., 2011). Food access, food availability, food 111 utilization and stable food supplies in turn lead to food security (Chukwuone & Okeke, 2012) while food security determines household dietary diversity [Food and Agriculture Organisation (FAO), 2011; Hoddinot and Yohannes, 2012; Chukwuone and Okeke, 2012; Oldewage-Theron and Kruger, 2011). Recent studies have reported an association between food variety and adequate nutrient intake (Hatløy et al., 1998; Torheim et al., 2003; Torheim et al., 2004, Acham et al., 2012). Dietary diversification is one of the strategies advocated internationally to improve micronutrient intake and to address undernutrition (Acham et al., 2012). Inadequate dietary diversity among marginalized groups of individuals of developing countries leads to numerous problems associated with nutrient deficiencies (Ruel, 2002). High energy diets commonly consumed by households that eat large amounts of staple foods such as maize and rice, do not necessarily include animal proteins (such as milk and milk products, and eggs) or fruits and vegetables (Kennedy, 2009; Ruel, 2002). These diets that consist mainly of staples foods often result in inadequate dietary intake and micronutrient malnutrition (Chukwuone & Okeke, 2012). Animal products are excellent sources of high quality protein and fat and are an important source of vitamins and minerals such as zinc, iron and selenium as well as calcium and phosphorus (Heywood, 2013). Fish and fish products provide a major source of nutrition for developing countries, and play an important role in the diets, livelihoods, and income of many poor population groups who suffer from vitamin and mineral deficiencies (Heywood, 2013:47). Fish is usually cited as an important source of nutrients and for wild and farmed fish alike often valued for its long-chained omega-3 fatty acids (Halwart, 2013:88). In the present study there was a worrying trend of low consumption and diversity of fruits in especially the group with low fruit intake. Low consumption of these fruits can lead to low micronutrient intake (vitamin A and C and folate) and consequently hidden hunger (Thiong’o et al., 2002). Insufficient micronutrient intake is especially associated with low intake of vitamin Cor carotene-rich vegetable groups (Charlton et al., 2001). In the current study, there was a tendency for families from the group of mothers with a higher fruit intake to consume more fruits (50.0%) than those families from the group of mothers with a lower fruit intake (39.6%), even though the difference was not statistically significant. 112 Almost all respondents consumed vegetables and tubers. A study in Kenya by Onyango et al. (2011) assessed nutrient intake of HIV-infected patients and found that only 23.8% of HIVinfected adults consumed vegetables, which was much lower than found in the present study. The reason for the lower intake in those subjects may be related to the effect of HIV/AIDS on food accessibility and production. In both groups less than 20% of all mothers consumed meat on the day preceding the interview. Results from the Transition in Health during Urbanisation of South Africans (THUSA) study conducted in South Africa, showed that, there was an increased consumption of animal-derived protein in households with the highest income levels. In the current study, both groups had a relatively low socio-economic status, and this may be the reason for low intake of meat and eggs. In the present study the majority of respondents consumed sugar and sweets and used oils and fats in food. All respondents used spices, condiments and consumed beverages the day preceding the study. These results are similar to what was reported in the study done in Kenya by Onyango et al. (2011), who reported that fats and oils were one of the most commonly consumed food groups. These food groups contributed to household dietary diversity, even though they are not considered to be the healthiest choices. In the present study, most households had a high DDS (≥ 6 food groups from a possible 12 food groups), due to the high consumption of these foods. Although these unhealthy food groups were likely to contribute to dietary diversity, there was a tendency for more households from a group of mothers with a higher fruit intake to have a higher dietary diversity score (93.8%) than those households from the group with lower fruit intake (85.4%). Households with a higher fruit intake may thus have had a high dietary diversity score because of agricultural production and livestock keeping which can contribute to a more diversified diet. In a study by Fujita et al. (2012) among women in a rural community of northern Kenya, those women who had a greater dietary diversity achieved an improved intake of vitamin A or pro-vitamin A carotenoids. It is thus important to diversify diets with fruits and vegetables and other food items from other food groups daily. A study by Ekesa et al. (2008), sought to determine the relationship between agricultural biodiversity and dietary diversity of meals 113 consumed by preschool children from 144 rural households of Matungu division of western Kenya. In this study about 97.1% of the households gathered guavas due to the season and that guava trees were commonly found in this region. Exotic fruits that included pineapples, oranges, bananas, mangoes and pawpaws were also consumed, but in smaller amounts than guavas. In that study, this practice had a major impact on improving dietary diversity (Ekesa et al., 2008:396). The study by Steyn et al. (2012) undertaken to compare the diet and weight status of South African and rural Kenyan women, found that Kenyan women had a better dietary diversity and food variety intake compared to South African women, a difference that was associated with access to agricultural land. A study by Steyn et al. (2012) reported that Kenyan women unlike South African women had access to agricultural land and surrounding natural environments with high agro-biodiversity to gather wild fruits and vegetables. In the group of mothers in the current study with a lower fruit intake, there was a tendency for more respondents to obtain fruits through purchasing (58.3%) compared to the group with higher fruit consumption (47.9%). In the group with a lower fruit intake, 39.6% of the respondents obtained fruits from own production, gathering and hunting while in the group with a higher fruit intake this was higher at 52.1% (the CI indicates that the difference was close to significant). As mentioned earlier, households with a higher fruit intake relied more on growing exotic vitamin A rich fruits such as mangoes and pawpaw and collecting other traditional fruits such as tamarind (Tamarindus indica) from the wild (Appendix J). Bharucha and Pretty (2010), reported that wild food species form a significant portion of the total food supply for households from agricultural production, hunting, gathering and even foraging. In a study by Chukwuone and Okeke (2012), those communities who had access to forests where non-wood forest products such as fruits were collected also had a higher consumption of fruits. In the present study, the mothers with a higher fruit intake most probably had an increased consumption of fruits due to improved access to agriculture and the wild nearby. Hunter-gatherer farmers depend on local wild species of plants and animals for food (Heywood, 2013:35). Wild plants and animals in the diets of surviving hunter-gatherers provide more protein and adequate intake of other nutrients (Heywood, 2013:40). 114 Farming and herding practices that maintain and enhance diversity of species and genetic variability within species are very important to farmers (Schutter, 2013). In local communities, plants and animals including fish from the forest and the wild contribute variety and taste to otherwise poor rural diets (Halwart, 2013). Cultivated species may be complemented by harvested wild species that can be of particular significance for indigenous communities and for poor and marginalized communities especially in times of shortage of main staples (Halwart, 2013:91). Promoting the use of biodiversity within food production systems, providing local solutions for diversifying diets may lead to effectively and sustainably improving nutritional status of mothers of children under 5 (Fanzo & Hunter 2013). 5.6 ANTHROPOMETRY 5.6.1 Anthropometric status of mothers The majority of mothers had a BMI in the normal weight category of 18.5 – 25kg/m2 (72.9% of mothers with lower fruit intake and 75% of mothers with higher fruit intake). According to the 2009 KDHS those women who had normal BMI were 63% nationally and 72% in western Kenya. In the 2003 KDHS 64% women countrywide and 72% in western Kenya, had a normal BMI. The current findings in both groups are comparable to both the 2003 and 2009 KDHS surveys for western Kenya. In the group of mothers with a lower fruit intake, the median BMI of the mothers was 21.2 kg/m2. In the group of mothers with a higher fruit intake, the median BMI was 22.4 kg/m 2. Although both fell within the normal range, the BMI of mothers with higher fruit consumption was significantly higher than that of mothers with a lower fruit consumption. This median is, however lower than that reported in other studies. In a study by Mbochi et al. (2012), among adult women in Nairobi, the mean BMI fell within the overweight category at 27.9 kg/m 2. In that study, significant difference in BMI were also reported for women in the lower socio-economic category 115 compared to women that were more well-off. A study by Steyn et al. (2012) found that 27.4% of the South African women had a BMI of ≥30 kg/m2 compared to 14.2% for Kenyan. In the current study, BMI and abdominal obesity increased with age for both women. None of the mothers with a higher fruit intake had a BMI of <18.5 kg/m2. In the group of mothers with a lower fruit intake, 12.5% had a BMI of <18.5, which was significantly higher than mothers in the group with a higher fruit intake. The 2009 KDHS showed that at national level, 12% of women and in western province, 10% were considered to be thin (BMI <18.5 kg/m2). The results in the present study for mothers with a lower fruit intake are similar to the findings reported in the 2009 KDHS. Low BMI demonstrates the presence of acute undernutrition among mothers and inadequate maternal nutritional status (Gewa et al, 2012). A study by Masibo et al. (2012) demonstrated that children whose mothers were thin (<18.5kg/m2) had a higher likelihood of also being undernourished. The median waist circumference of mothers with a lower fruit intake was 76.6 cm which was also significantly lower than the median 80 cm waist circumference of mothers with a higher fruit intake. This median waist circumference is lower than that reported in other studies. A study by Mbochi et al. (2012) showed that the mean waist circumference of women in the more urbanized Nairobi was much higher at 86.9 cm. In the group of mothers with a lower fruit intake only 28.9% had a waist circumference ≥80 cm. In the group of mothers with a higher fruit intake, this percentage was higher at 53.9%, a difference that was significant. As with BMI, fruit intake seems to be associated with a higher weight and thus also a higher waist circumference (but still below 88 cm that is associated with an increased risk of developing chronic diseases of lifestyle). A review by DeClerck (2013) showed that obesity was associated with a significant decrease in the level of diversity. 116 5.6.2 Anthropometric status of children 5.6.2.1 Stunting Globally and currently 868 million people are undernourished and 195 million children under five years of age are stunted (Fanzo et al., 2013:ii). A significantly higher percentage of children in the group of mothers with a lower fruit intake had a height-for-age <-2 standard deviations from the WHO median (31.3% were stunted) than children of mothers with a higher fruit intake (only 8.3% were stunted). In the 2009 KDHS 35% of children under five in Kenya were stunted (heightfor-age <-2 standard deviations from the WHO median) nationwide. In Western province, 34% of children were stunted, which is very similar to the 31.3% from the group with a lower fruit intake in the current study. This result is also similar to that reported in Wajir (30%), in recent years (Loewenberg, (2014). The study by Masibo et al. (2012), showed a slow decline of chronic undernutrition by 4.6% from 1993 to 2009. The 1999 to 2004 Kenya Ministry of Health strategic plan aimed to reduce childhood undernutrition by 30%. Despite the improvement that has been seen, this goal is far from being achieved (Masibo et al., 2012). High levels of stunting and underweight imply slow progress in improving nutritional status of children in Kenya (Masibo et al., 2012). Malnutrition has been shown to be higher among households with a lower socioeconomic status (Gewa et al, 2012), such as those included in the current study. Our findings on lower prevalence of stunting in children of mothers with higher fruit intake may be associated with increased fruit consumption. In the group with a lower fruit intake, 31.8% boys and 30.8% girls had a height-for-age <-2 standard deviations from the WHO median and were thus stunted. For those children of mothers with a higher fruit intake only 11.8% boys and no girls were stunted. The report from the KDHS, 2008-2009, showed that in Kenya, a higher proportion of male children under five years were stunted (37%), compared to 33% of female children. The results of the current study were more or less similar. Regardless of the socio-economic background of children under five, healthy household dietary habits such as healthy food consumptions that include fruits and vegetables may prevent stunting 117 in children. However, Lee et al. (2012) have reported that lower economic levels were associated with a higher prevalence of child stunting and that higher economic status in turn is associated with a higher prevalence of maternal overweight. 5.6.2.2 Underweight As far as weight-for-age is concerned, 8.3% of children of mothers with a lower fruit intake had a weight-for-age <-2 standard deviations from the reference WHO median and were thus underweight, compared to only 4.2% in the group of children with mothers that had a higher fruit intake. Unlike with the stunting, this difference was, however, not statistically significant. The 2009 KDHS report, showed that 16% of children under five were underweight (<-2 standard deviations from the reference WHO median). In Western Kenya, the percentage of children who were underweight was 12% as reported in the 2009 KDHS. The occurrence of underweight the current study was lower than what was reported in the 2009 KDHS for western Kenya. Underweight seems to have reduced for over a decade now from 20% in 2003 to 8% in the current study. It is important to note that a smaller number of children were included in the current study and that this may be the reason for this difference. Less than 10% of children of mothers with a lower fruit intake had a weight-for-age <-2 standard deviations from the reference WHO median and were thus underweight (9.1% boys and 7.7% girls). The children in the group of mother with a higher fruit intake, who were underweight were 5.9% girls and no boys. Similar to the results of the current study, the 2009 KDHS report showed that nationwide, female children were slightly less likely to be underweight than male children. In the group of mothers with a lower fruit intake, only 6.3% of children had a MUAC of 11 - <12.5 cm while in the group with a higher fruit intake no child had a low MUAC. This result shows a low prevalence of acute wasting. In a study by Berkley et al. (2005) amongst a cohort of hospitalized Kenyan children, prevalence of acute wasting was much higher at 21.6% (≤11 cm) and 9.3% (≤11.6 – 12.5 cm). Another study by Mogeni et al. (2011) among hospitalized children in Kenya reported 54% severe wasting (MUAC <11.5 cm). It is expected that hospitalized children 118 will be more wasted. The KDHS did not include MUAC as an indicator, making it difficult to compare results. 5.7 HEALTH In the group with a lower fruit intake 4.2% of respondents were never married, while in the group with a higher fruit intake, none was never married. A study conducted by KDHS, (2009:104), reported that, about 3 in 10 women age 15-49 had never been married, 5% of women age 45-49 had never been married. Our result is similar to the one reported by KDHS, 2009. In both of the groups of mothers with higher and lower fruit intake, more than 80% were married. KDHS, (2009:104), reported that 58% of women age 45-49 were either married or living together with a man. Our result was higher than reported in KDHS, 2009 perhaps due to sample size. In this region marriage is respected also for equal distribution of resources such as agricultural land and livestock. The spouse assists in income generation and care for the minors. In both groups 8.3% were widowed and 4.2% were separated. KDHS, (2009:104), reported that, 11% of women were divorced, separated, or widowed. Our result is almost similar to the one reported by KDHS, 2009. In both groups, none of the respondents smoked or used snuff and very few respondents in both groups had ever used wine and beer. According to KDHS, 2009, less than 2% of women said they used tobacco of any kind, and less than 1% said they smoked cigarettes (KDHS, 2009:70). Our results are similar to that reported in KDHS, 2009. In both the group with a lower fruit intake and a higher fruit intake, more than 60% of mothers reported feeling sad, blue or depressed for two weeks in a row during the past 12 months, possibly due to their low socio-economic status. Almost 40% of all households reported caring for orphans or other children (that are not their own). In both groups more than half of mothers reported having family members who live with HIV/AIDS. Care for people with HIV/AIDS requires adequate dietary intake that is diversified. In 119 our study, almost all respondents were willing to answer HIV/AIDS related questions. This means that they all were aware of HIV/AIDS. KDHS, 2009, also reported that 99% of women were aware of HIV/AIDS in western Kenya. KDHS, 2009 reported that 90.1% of overall women and 89.2% in western Kenya were willing to care for family members with the HIV virus in the respondent’s home. KDHS, 2009 reported that 54.2% of overall women and 58.2% in western Kenya would not want to keep secret that a family member got infected with the HIV virus. 120 CHAPTER 6 CONCLUSIONS AND RECOMMENDATIONS In this chapter the conclusions and recommendations related to the study are discussed. 6.1 CONCLUSIONS The overall aim of this study was to describe fruit consumption in relation to the health and nutritional status of pre-school children and their mothers/caregivers in selected farm households of Western Kenya. Most mothers that consumed less than the median of 1 fruit per day, also had children with a low fruit consumption. On the other hand, mothers that had fruit consumption higher than 1 fruit per day, also had children with a higher fruit consumption. All children and the majority of mothers took in less than the recommended 400 g of fruit and vegetables per day. 6.1.1 Socio-demographic status In this study, lower socio-economic status was confirmed in both groups as evidenced by high levels of unemployment (about 70% were unemployed), high room density (median of 4-5 persons per room), poor water supply (less than 7% had a communal tap), lack of household appliances (less than 10% had a working refrigerator or stove) and low income. No significant differences in socio-demographic variables occurred between the two groups, indicating that differences in other parameters could not be ascribed to socio-demographic differences. 121 6.1.2 Food security and procurement Despite no significant socio-demographic differences between groups, significant differences did, however, occur between the two groups as far as agricultural practices (that included growing of crops such as sweet potato, African leafy vegetables, and fruit availability) were concerned. There was a tendency for households in the group with a lower fruit intake to be more likely to have wages and salaries from formal employment as their main source of income, while the groups with a higher fruit intake was more likely to rely on agricultural practices such as crop production and livestock sales. Significantly more households in the group with a higher fruit intake grew sweet potato and African nightshades than those with a lower fruit intake. A significantly higher percentage of respondents with a higher fruit intake also reported that fruits were easily available from local farmers and shops than in the group with a lower fruit intake. There was a tendency for more households in the group with a higher fruit intake to grow mangoes, avocados, jackfruit and lemons than households in the group with a lower fruit intake, explaining the higher fruit consumption that was evident in this group. When considering the hunger scale, a significantly higher percentage of mothers from the group with a lower fruit intake reported eating less than should be eaten because there was not enough money for food than the group of mothers with a higher fruit intake. Despite having similar levels of sociodemography, households that were more likely to be involved in food and crop production, were thus less likely to suffer from food insecurity. Agricultural biodiversity is thus important for food and nutritional security, as a safeguard against hunger, a source of nutrients for improved quality dietary diversity and strengthening local food systems and environmental sustainability (Fanzo et al., 2013:ii). Biodiversity underpins ecosystem functioning and is essential to many aspects of our health and well-being, including nutrition (Souza-Dias, 2013). It is therefore the foundation of for future 122 research and advancements in food production through improved yields and nutritional quality and provides options for adaptation to climate change (Souza-Dias, 2013). It also clear that agriculture is and will continue to be part of the solution in improving the health and nutrition of all populations regardless of age, during their lifespan (Fanzo J & Hunter D. 2013). 6.1.3 Household dietary diversity In the present study there was a concerning trend of low consumption and diversity of fruits in especially the group with low fruit intake, which may be associated with low micronutrient intake. As expected, the results of the current study showed that there was a tendency for families with a higher fruit intake to consume more fruits than those families with a lower fruit intake (although the difference did not reach statistical significance). Increased fruit consumption increases household dietary diversity. Although both groups consumed cereals, white roots and tubers, fewer than half of households consumed fruits on the day preceding the interview (60% in the case of households with mothers that consumed less than the median of 1 fruit per day). In addition, very few households consumed meat, eggs or milk on the day preceding the interview. On the other hand a high percentage of all participants consumed sweets, oils, fats, and beverages. On the day preceding the survey (more in the group with a lower fruit intake) Consumption of these less healthy foods meant that most households had a high DDS (≥ 6 food groups from a possible 12 food groups). Local biodiversity should be recognized as a significant contribution to a sustainable agriculture– food–nutrition and for improving agricultural productivity and agronomic practices, nutritional enhancement of crops, industrial fortification, vitamin supplementation and other nutrition– agriculture interventions (Heywood, 2013:55). 123 6.1.4 Anthropometry As far as anthropometric measurements of mothers and children were concerned, it can be concluded that these factors may be related to fruit intake, and that mothers with a higher fruit consumption (although still inadequate in terms of international guidelines), were more likely to produce fruits and vegetables for consumption, thus impacting on household food security. In terms of anthropometric indicators, mothers with higher fruit consumption were more likely to have a higher BMI (within the normal range) and waist circumference themselves and were less likely to have stunted children. The majority of mothers had a median BMI in the normal weight category of 18.5 – 25kg/m2. None of the mothers with a higher fruit intake had a BMI of <18.5 kg/m2. As with BMI, the median waist circumference of mothers with a lower fruit intake was 76.6 cm which was also significantly lower than the median 80 cm waist circumference of mothers with a higher fruit intake. A significantly higher percentage of children in the group of mothers with a lower fruit intake were stunted (31.3%) compared to children of mothers with a higher fruit intake (8.3%). Regardless of the socio-economic background of children under five, more healthy household dietary habits such as fruits and vegetables may impact on stunting in children. As far as weight-for-age is concerned, 8.3% of children of mothers with a lower fruit intake were underweight, compared to 4.2% in the group of children with mothers that had a higher fruit intake (difference not statistically significant). 124 6.2 RECOMMENDATIONS Recommendations related to fruit consumption and research is made in the following section. 6.2.1 Fruit consumption The results of the current study support the recommendation of Ekesa et al. (2009:209) who have noted that the Kenyan nation and particularly western Kenya, has the potential to enhance agricultural biodiversity and food security through increased agricultural and livestock production with the objective of improving the nutritional status of Kenyans (Ekesa, 2009:209). There is also need to invest in fertilizer and irrigation practices to farmers who are cultivating fruits in the country (Loewenberg, 2011). However, there is a need to educate consumers about adequate quantity of fruit and vegetables to be consumed daily. This includes adequate portion sizes (numbers of servings) and how to estimate the size of servings (Dixon et al., 2004:36:248). There is also a need to educate consumers on the proportion of fruit and vegetables relative to other foods that should be consumed at a given meal (Dixon et al., 2004:36:248). Finally, families need to be informed on the potential to improve fruit intake by giving fruit to children as a snack between meals (Dixon et al., 2004:36:248). In addition, mothers should be made aware of the importance of their own fruit and vegetable consumption since it is directly related to the fruit consumption of their children (Wolf & Elmadfa 2010:168). Ling and Horwath (2001;263) have recommended that fruit and vegetable intake should be encouraged at a young age by emphasizing messages on the benefits associated with health (Perez-Rodrigo & Aranceta, 2003, Knai et al., 2006). In adults, public health policies that include promoting availability of fruits and vegetables at affordable prices may help to reduce barriers of fruit consumption. In this regard, tailored nutrition messages that emphasizes the benefits of eating fruits can motivate them to continue consuming fruits and vegetables (Paisley & Skrzypczyk 2005:77). 125 6.2.2 Agricultural and other interventions To increase adequate dietary intake and achieve a greater dietary diversity for households in low socio-economic incomes, policies that will accelerate agricultural productivity and improve distribution of resources may be necessary (Food Security Poverty and Nutrition Policy Analysis, 2014). In order to increase fruits and vegetable consumption among children and adults there is need to create accessibility to quality and affordable stores that sell fruits and vegetables (CDC, 2013:2). Schools, child care, and early child education programs that include child care centers, day care homes, and preschool are important places to teach healthy eating behaviors by including fruits and vegetables during meals and activities (CDC, 2013:6). Successful schoolbased interventions have been reported to successfully increase fruit consumption in children and young adults (French & Stables 2003:608). Fruit and vegetable gardening activities at schools can encourage consumption of these foods and make them more affordable (CDC, 2013:6). In addition, farmers who supply fruits may be trained on processing, handling, packaging and storage of both dried and fresh fruits to ensure optimal quality (Perez-Rodrigo & Aranceta, 2003; Knai et al., 2006). Youth may have a role to play in the promotion of fruits and vegetables intervention efforts (French & Stables 2003:594). Youth can that symbolize healthy habits related to fruits consumptions and can again influence the fruit consumption patterns of their parents and other members of the community (French & Stables 2003:608). Households need to be educated on importance of establishing home gardens besides their houses. Home gardens that include fruits and vegetables, plantation crops, spices, herbs among others, as well as livestock can serve as supplementary sources of food and income for household and may supply as variety of food groups to the household (Galhena et al., 2013:2). Home gardens may contain a high agro-biodiversity at the same time occupying a small area of agricultural land (Galhena et al., 2013). Galhena et al. (2013:4) in their review reported that households were able to obtain fifty percent of fruits, vegetables, tubers and yams from their 126 home gardens. These households were able to access a variety of fresh and nutritious foods supplementing staple-based diet. Galhena et al. (2013:4) reported that availability of vitamin A rich fruits and vegetables can be increased through home gardening. Among marginalized groups of people home-gardens helped to increase fruit and vegetable that were otherwise unfordable (Galhena et al., 2013:5). From their review, Galhena et al. (2013:4) reported that, home gardens also provided year-round supply of fruits and vegetables to households. Those households that had well maintained home gardens could exchange vegetables and other foods for fruits within the neighbourhood. Some households were able to sell excess produce that include fruits, vegetables and livestock products to the neighbouring households in order to purchase other foods. Farmers, particularly small-scale rural farmers living in the most remote areas and those on the most marginal soil, should be encouraged to identify innovative solutions, working with experts in developing any advancement on agricultural biodiversity and nutrition (Schutter, 2013:xxii). Farmers’ seed systems also need to be supported (Schutter, 2013:xxii). Farmers in the rural areas of Kenya, rely on traditional farmers’ seed systems in order to grow their crops. There is therefore need at local level, to support local community with seed banks and seed fairs, and the adaptation of seed regulations in order to allow for an improved distribution of farmers’ varieties (Schutter, 2013:xxii). To meet the challenge of achieving food security and healthy nutrition, there is need to focus on ecologically sustainable intensification of farming systems that will also contribute to improved diets (Souza-Dias, 2013:xxiv). Most interventions aim to impact to 90% of the global population burdened by stunting and that largely address inadequate dietary intake (Fanzo & Hunter, 2013). Nutrition interventions should not only focus on providing caloric requirements, or vitamin A enrichment because human body cannot subsist on carbohydrates alone, thus there is a need not only for high-energy foodstuffs, but also an essential need for those ingredients that provide vitamins and nutrients essential for human health (DeClerck, 2013:30). As is the rule the greater the diversity of species an individual consumes, the more likely the individual will cover all nutritional bases including complementarity effects (DeClerck, 2013:30). 127 Providing sustainable diets can only be achieved with a combination of sustainable improvement of livestock production and a combination of policy approaches integrating sustainable diets, accompanied by raising awareness for the value of biodiversity (Hoffmann & Baumung 2013:82). Farmers may be encouraged to grow a wider variety of crops, including fish, often reviving traditional species and varieties or breeds with high nutritive values (Halwart, 2013:88). There is also need to promote increased agricultural production and consumption, improved processing, landrace improvement and sustainable management of the genetic resources (Bisseleua & Niang 2013:114) and enhancing ecosystem function by restoring and maintaining soil productivity, improving crop diversification and the diversification of farming systems; developing living gene banks to conserve genetic diversity; improving land productivity and land use diversity; providing high quality agricultural inputs, improving irrigation systems, training farmers and strengthening farmer cooperatives (Bisseleua & Niang 2013:114). 6.2.3 Future Research Further research related to both fruit consumption in children under 5 and mothers/caregivers and their nutritional and health status are recommended in larger groups. Fruit consumption in Kenya is largely unknown. In view of the major implications of the factors affecting fruit consumption in the study, a better understanding of how fruit consumption is related to prevention of malnutrition is thus necessary. The current study could be extended to develop an intervention on fruit consumption and to investigate the effect of interventions on nutritional status and health of children and their mothers/caregivers. An assessment of micronutrient status besides dietary intake is recommended. More research in Kenya needs to be done to better understand the role of value chains, biodiversity, and ecosystem services on nutritional and dietary outcomes, and the best ways to measure agriculture’s impact on nutrition and dietary outcomes (Fanzo & Hunter, 2013:35). 128 The study was the first in Kenya to investigate fruit consumption in relation to nutritional and health status among children below 5 years and their mothers/caregivers and can be used as a reference for further investigation. 129 REFERENCE LIST Abubakar A, Van de Vijver F, Van Baar A, Mbonani L, Kalu R, Newton C & Holding P. 2008. Socioeconomic status, anthropometric status, and psychomotor development of Kenyan children from resource-limited settings: a path-analytic study. Early Human Development, 84:613-21. Abukutsa MOO. 2010. African indigenous vegetables in Kenya: Strategic repositioning in the horticultural sector. Nairobi. JKUAT Publisher: 64. Acham H, Oldewage-Theron WH & Egal AA. 2012. Dietary diversity, micronutrient intake and their variation among black women in informal settlements in South Africa: A cross-sectional study. International Journal of Nutrition and Metabolism, 4(2):24-39. Akinnifesi FK, Leakey RRB, Ajayi OC, Sileshi G, Tchoundjeu Z, Matakala P & Kwesiga FR. 2008. Indigenous Fruits trees in the tropics: domestication, utilization and commercialization, CAB International: 289-309. Alberti KGMM, Zimmet P & Shaw J. 2006. Metabolic syndrome - a new world-wide definition. A Consensus Statement from the International Diabetes Federation. Journal of the British Diabetic Association, 23(5): 469–80. Allen LB, de Benoist B, Dary O & Hurrell R, editors. 2006. Guidelines for food fortification with micronutrients. World Health Organisation, Geneva. Andaya A, Arredondo EM, Alcaraz JE, Lindsay SP & Elder JP. 2010. The Association between family meals, TV viewing during meals, and fruit, vegetables, soda, and chips intake among Latino children. Journal of Nutrition Education and Behavior, 43:308-315. Ball K & Crawford D. 2010. ‘Socioeconomic inequalities in fruit and vegetable intakes’, in RR Watson & VR Preedy (editors), Bioactive foods in promoting health: fruits and vegetables, Elsevier Inc: 195-203. 130 Berkley J, Mwangi I, Griffiths K, Ahmed I, Mithwani S, English M, Newton C, & Maitland K. 2005. Assessment of severe malnutrition among hospitalized children in rural Kenya; comparison of weight for height and mid upper arm circumference. Journal of American Medical Association, 294(5):591-597. Bernstein MA, Tucker KL, Ryan ND, O’Neill EF, Clements KM, Nelson ME, Evans WJ & Singh MA. 2002. Higher dietary variety is associated with better nutritional status in frail elderly people. Journal of the American Dietetic Association, 102:1096-1104. Berti PR & Jones AD. 2013. ‘Biodiversity’s contribution to dietary diversity: magnitude, meaning and measurement’, in J Fanzo, D Hunter, T Borelli & F Mattei (editors), Diversifying food and diets: using agricultural biodiversity to improve nutrition and health, Routledge 2 Park Square, Milton Park, Abingdon, Oxon, OX14 4RN: 186-206. Bharucha Z & Pretty J. 2010. The roles and values of wild foods in agricultural systems. Philosophical transactions of the Royal Society, 365:2913–2926. Bisseleua HBD & Niang AI. 2013. ‘Delivery mechanisms for mobilizing agricultural biodiversity for improved food and nutrition security’, in J Fanzo, D Hunter, T Borelli & F Mattei (editors), Diversifying food and diets: using agricultural biodiversity to improve nutrition and health, Routledge 2 Park Square, Milton Park, Abingdon, Oxon, OX14 4RN: 111-121. Black RE. 2013. Maternal and child undernutrition and overweight in low-income and middleincome countries. Lancet, 382(9890):427–51. Blasa M, Gennari L, Angelino D & Ninfali P. 2010. ‘Fruit and Vegetable Antioxidants in Health’, in RR Watson & VR Preedy (Editors), Bioactive Foods in Promoting Health: Fruits and Vegetables, Elsevier Inc: 37-58. Bliault RJ. 2012. On-farm fruit tree diversity in Busia County, Western Kenya: Implications for prioritizing research on indigenous fruit tree species conservation and improving household nutrition, MSc dissertation, Royal Agricultural College. 131 Braitstein P, Ayaya S, Nyandiko WM, Kamanda A, Koech J, Gisore P, Atwoli L, Vreeman RC, Duefield C & Ayuku DO. 2013. Nutritional Status of Orphaned and Separated Children and Adolescents Living in Community and Institutional Environments in Uasin Gishu County, Kenya. PLoS ONE, 8(7). Cardoso PC, Tomazini APB, Stringheta PC, Ribeiro SMR & Pinheiro-Sant’Ana HM. 2011. Vitamin C and carotenoids in organic and conventional fruits grown in Brazil. Food Chemistry, 126:411416. Carithers TC, Talegawkar SA, Rowser ML, Henry OR, Dubbert PM, Bogle ML, Taylor HA Jr, Tucker & KL. 2009. Validity and calibration of food frequency questionnaires used with African-American adults in the Jackson Heart Study. Journal of the American Dietetic Association, 109(7):1184-1193. Centre for Disease Control and Prevention (CDC). 2011. Strategies to prevent obesity and other chronic diseases: the CDC guide to strategies to increase the consumption of fruits and vegetables. Atlanta: National Center for Chronic Disease Prevention and Health Promotion, Division of Nutrition, Physical Activity, and Obesity: 3 Centre for Disease Control and Prevention (CDC). Defining Overweight and Obesity. [Online]. Available at: http://www.cdc.gov/obesity/adult/defining.html (Accessed: 4th June 2012). Centre for Disease Control and Prevention (CDC). 2013. State indicator report on fruits and vegetables. Atlanta: National Center for Chronic Disease Prevention and Health Promotion, Division of Nutrition, Physical Activity, and Obesity: 16 Charlton KE, Bourne LT, Steyn K & Laubscher JA. 2001. Poor nutritional status in older black South Africans. Asia Pacific Journal of Clinical Nutrition, 10(1):31-38. Chukwuone NA & Okeke CA. 2012. Can non-wood forest products be used in promoting household food security?: Evidence from savannah and rain forest regions of Southern Nigeria. Forest Policy and Economics, 25:1–9. 132 Cogill B. 2003. Anthropometric indicators measurement guide. Food and nutrition technical assistance project, Academy for education development. Revised ed. Washington: D.C. Crujeiras AB, Goyenechea & Martinez EJA. 2010. ‘Fruit, vegetables, and legumes consumption: Role in preventing and treating obesity’, in RR Watson & VR Preedy (editors), Bioactive foods in promoting health: Fruit and vegetables, Elsevier Inc: 359–380. DeClerck F. 2013. ‘Harnessing biodiversity from diets to landscapes’, in J Fanzo, D Hunter, T Borelli & F Mattei (editors), Diversifying food and diets: using agricultural biodiversity to improve nutrition and health, Routledge 2 Park Square, Milton Park, Abingdon, Oxon, OX14 4RN: 17-34. Delgado-noguera M, Tort S, Martínez-Zapata MJ & Bonfill X. 2011. Primary school interventions to promote fruit and vegetable consumption: A systematic review and metaanalysis. Journal of Preventive Medicine, 53:3–9. De-Regil LM, Fernández-Gaxiola AC, Dowswell T & Peña-Rosas JP. 2010. Effects and safety of periconceptional folate supplementation for preventing birth defects (Review). Cochrane Database of Systematic Reviews 2010, (10). Devasagayam, TPA, Tilak JC, Boloor KK, Sane KS, Ghaskadbi SS & Lele RD. 2004. Free radicals and antioxidants in human health: current status and future prospects. The Journal of the Association of Physicians of India, 52:794–804. Dianne Neumark-Sztainer D, Wall M, Perry C & Story M. 2003. Correlates of fruit and vegetable intake among adolescents Findings from Project EAT. Journal of Preventive Medicine, 37:198– 208. Dixon H, Mullins R & Wakefield M. 2004. Encouraging the consumption of fruit and vegetables by older Australians: An experiential study. Journal of Nutrition Education and Behaviour, 36(5):245-249. 133 Duyn MAS & Pivonka E. 2000. Overview of the health benefits of fruit and vegetable consumption for the dietetics professional: selected literature. Journal of the American dietetic association, 100:1511-1521. Ekesa BN, Walingo MK & Abukutsa-Onyango MO. 2008. ‘Influence of agricultural biodiversity on dietary diversity of preschool children in Matungu Division, Western Kenya’, African Journal of Food, Agriculture, Nutrition and Development, 8(4), [Online]. Available at: http://www.ajol.info/index.php/ajfand/article/view/19200 (Accessed: 5 June 2014). Ekesa BN. 2009. Agricultural biodiversity for food and nutrient security: The Kenyan perspective. International Journal of Biodiversity and Conservation, 1(7):208-214. Fanzo J & Hunter D. 2013. ‘Agricultural biodiversity, diverse diets and improving nutrition’ in J Fanzo, D Hunter, T Borelli & F Mattei (editors), Diversifying food and diets: using agricultural biodiversity to improve nutrition and health, Routledge 2 Park Square, Milton Park, Abingdon, Oxon, OX14 4RN: 1-13. Fanzo J, Hunter D, Borelli T & Mattei F. 2013. Diversifying food and diets: using agricultural biodiversity to improve nutrition and health, Routledge 2 Park Square, Milton Park, Abingdon, Oxon, OX14 4RN:401. Food and Agriculture Organisation of the United Nations (FAO). 2011. Guidelines for measuring household and individual dietary diversity, Rome, Viale delle Terme di Caracalla: Nutrition and Consumer Protection Division, Food and Agricultural Organisation of the United Nations. Food and Agriculture Organisation/World Health Organisation (FAO/WHO). 2002. Human vitamin and mineral requirements, Rome: Food and Nutrition Division, FAO. Food and Agriculture Organisation/ World Health Organisation/ United Nations University (FAO/ WHO/ UNU). 1985. Energy and protein requirements, WHO Technical Report Series No. 724. WHO, Geneva. 134 Food and Agriculture Organisation/ World Health Organisation/ United Nations University (FAO/ WHO/ UNU). 2004. Human energy requirements, Report of a joint FAO/ WHO/ UNU Expert Consultation. Food and Nutrition Technical Report Series 1. United Nations University, World Health Oraganisation and Food and Agriculture Organisation, Rome. FoodFinder3. 2002. Dietary Analysis Software, Parow Valley, Cape Town: Medical Research Council. Available from http://foodfinder.mrc.ac.za (Accessed 30/10/2012). Food Security Poverty and Nutrition Policy Analysis, 2014. ‘Changes in Food Consumption Patterns : Its Importance to Food Security — Application of one-way ANOVA’, 2nd edition in Elsevier Inc: 117-138. French SA & Stables G. 2003. Environmental interventions to promote vegetable and fruit consumption among youth in school settings. Journal of Preventive Medicine, 37:593–610. Fujita M, Lo YJ & Baranski JR. 2012. Dietary diversity score is a useful indicator of Vitamin A Status of adult women in Northern Kenya. American Journal of Human Biology, 24:829–834 Galhena DH, Freed R & Maredia KM. 2013. Home gardens: a promising approach to enhance household food security and wellbeing. Journal of Agriculture and Food Security, 2(8):1-13 Gewa CA & Yandell N. 2011. Undernutrition among Kenyan children: contribution of child, maternal and household factors. Public Health Nutrition, 15(6):1029–1038. Gewa CA, Oguttu M & Yandell NS. 2012. Maternal nutrition in rural Kenya: health and sociodemographic determinants and its association with child nutrition. Maternal and Child Nutrition, 8:275–286. Grutzmacher S & Gross S. 2011. Household food security and fruit and vegetable intake among low-income fourth-graders. Journal of Nutrition Education and Behavior, 43:455-463. 135 Haire-Joshu D, Kreuter MK, Holt CH & Steger-Maym K. 2004. Estimates of fruit and vegetable intake in childhood and adult dietary behaviors of African American women. Journal of Nutrition Education and Behavior, 36(6):309-314. Halwart M. 2013. ‘Valuing aquatic biodiversity in agricultural landscapes’, in J Fanzo, D Hunter, T Borelli & F Mattei (editors), Diversifying food and diets: using agricultural biodiversity to improve nutrition and health, Routledge 2 Park Square, Milton Park, Abingdon, Oxon, OX14 4RN: 88-108. Hassimotto NMA, Genovese MI & Lajolo FM. 2009. Antioxidant capacity of Brazilian fruit, vegetables and commercially-frozen fruit pulps. Journal of Food Composition and Analysis, 22:394–396. Hatløy A, Torheim LE & Oshaug A. 1998. Food variety: a good indicator of nutritional adequacy of the diet? A case study from an urban area in Mali, West Africa. European Journal of Clinical Nutrition, 52:891–898. Heywood VH. 2013. ‘Overview of agricultural biodiversity and its contribution to nutrition and health’, in J Fanzo, D Hunter, T Borelli & F Mattei (editors), Diversifying food and diets: using agricultural biodiversity to improve nutrition and health, Routledge 2 Park Square, Milton Park, Abingdon, Oxon, OX14 4RN: 35-67. Hoddinott J & Yohannes Y. 2002. Dietary diversity as a food security indicator. Washington, DC: FCND Discussion Paper No 136. Hoffmann I & Baumung R. 2013. ‘The role of livestock and livestock diversity in sustainable diets’, in J Fanzo, D Hunter, T Borelli & F Mattei (editors), Diversifying food and diets: using agricultural biodiversity to improve nutrition and health, Routledge 2 Park Square, Milton Park, Abingdon, Oxon, OX14 4RN: 68-87. International Livestock Research Centre (ILRI). 2012. ILRI news [online]. Available from: http://www.ilri.org/ilrinews/index.php/archives/tag/busia. Accessed: 30 June 2014. 136 Jackson M, walker S, Cade J, Forrester T, Cruickshank JK & Wilks R. 2001. Reproducibility and validity of a quantitative food-frequency questionnaire among Jamaicans of African origin. Public Health Nutrition, 4(5):971-980. Jamison JR. 2003. Dietary diversity: case study of fruit and vegetable consumption by chiropractic patients. Journal of Manipulative and Physiological Therapeutics, 26(6):383-9. Jounghee L, Houser RF, Must A, Fulladolsa PP & Bermudez OI. 2012. Socioeconomic disparities and the familial coexistence of child stunting and maternal overweight in Guatemala. Economics and Human Biology, 10(3):232–241. Kant AK, Schatzkin A, Harris TB, Ziegler RG & Block G. 1993. Dietary diversity and subsequent mortality in the First National Health and Nutrition Examination Survey Epidemiologic Followup Study. American Journal of Clinical Nutrition, 57:434-440. Kehlenbeck K, Asaah E & Jamnadass R. 2013. ‘Diversity of indigenous fruit trees and their contribution to nutrition and livelihoods in sub-Saharan Africa: examples from Kenya and Cameroon’, in J Fanzo, D Hunter, T Borelli & F Mattei (editors), Diversifying Food and Diets: Using Agricultural Biodiversity to Improve Nutrition and Health, New York: Earthscan Routledge: 257-269. Kennedy GL. 2009. Evaluation of dietary diversity scores for assessment of micronutrient intake and food security in developing countries. Wageningen: University of Wageningen. Kenya. Kenya Census 2009. 2010. 2009 population and housing census results. Nairobi: Ministry of State for Planning, National Development and Vision 2030. [online]. Available from: http://www.devolutionplanning.go.ke/index.php?option=com_content&view=article&id=25 2:launch-of-the-2009-population-and-housing-census-results-at-the-kicc-on-31st-august2010&catid=80:latestnewsarchive&Itemid=145. Accessed: 5 June 2014. 137 Kenya. Kenya Integrated Household Budget Survey (KIHBS). 2005/06. Revised edition. Basic Report: 1-316 [online]. Available from: http://kenya.socrata.com/api/assets/BD46451B3158-4698-8E38-6703631AB578. Accessed: 5 June 2014. Kenya. Kenya National Bureau of Statistics (KNBS) and ICF Macro. 2010. Kenya demographic and health survey 2008-09:1-455. Calverton, Maryland: KNBS and ICF Macro. Kenya. Ministry of Health. Busia County: Health at a Glance. [Online]. Available from: http://www.healthpolicyproject.com/pubs/291/County%20posterfactsheet__Busia_FINAL_A3.pdf. Accessed: 30 June 2014. Kenya. Ministry of Health. Kakamega County: Health at a Glance. [Online]. Available from: http://www.healthpolicyproject.com/pubs/291/County%20posterfactsheet__kakamega_FINAL_A3.pdf. Accessed: 30 June 2014. Kenya. National Coordinating Agency for Population Development (NCAPD). 2005a. Kakamega district strategic plan 2005-2010 for implementation of the national population policy for sustainable development. Nairobi: Ministry of Planning and National Development [online]. Available from: http://www.ncapd-ke.org/images/stories/districts/Kakamega.pdf. Accessed: 30 June 2014. Kenya. National Coordinating Agency for Population Development (NCAPD). 2005b. Busia district strategic plan 2005-2010 for implementation of the national population policy for sustainable development. Nairobi: Ministry of Planning and National Development [online]. Available from: http://www.ncapd-ke.org/images/stories/districts/Busia.pdf. Accessed: 30 June 2014. Khan Y & Bhutta Z. 2010. Nutritional deficiencies in the developing world: current status and opportunities for intervention. Pediatric Clinics of North America, 57:1409-41. 138 Kloeblen-Tarver AS. 2001. Fruit juice consumption not related to growth among pre-schoolaged children enrolled in the WIC program. Journal of the American Dietetic Association, 101(9):996 Knai C, Pomerleau J, Lock K, McKeeM. 2006. Getting children to eat more fruit and vegetables: A systematic review. Preventive Medicine, 42(2):85–95. Kruger HS, Venter CS & Vorster HH. 2001. Obesity in African women in the North West Province, South Africa is associated with an increased risk of non-communicable diseases: the THUSA study. British Journal of Nutrition, 86(6):733–740. Kwesiga F, Akinnifesi F, Ramadhani T, Kadzere I, & Saka, J. (2000). ‘Domestication of indigenous fruit trees of the Miombo in Southern Africa’, in EM Shumba, Lusepani E, & Hangula R (editors), The Domestication and Commercialisation of Indigenous Fruit Trees in the SADC Region. Proceedings of a SADC Tree Seed Centre Technical Meeting held in Windhoek, Namibia, 13–15 March 2000. SADC Tree Seed Centre Network/SADC/FAO/CIDA Strategy Workshop, Windhoek, Namibia: 8–24. Labadarios D, Steyn NP & Nel J. 2011. How diverse is the diet of adult South Africans? Nutrition Journal, 10:33. Lee J, Houser FR, Must A, Fulladolsa PP & Bermudez OI. 2012. Socioeconomic disparities and the familial coexistence of child stunting and maternal overweight in guatemala. Economics and Human Biology, 10(3):232–241. Ling AMC & Horwath C. 2001. Perceived benefits and barriers of increased fruit and vegetable consumption:validation of a decisional balance scale. Journal of Nutrition Education, 33(5):257-265. Linne K, Osumba J and Jacobi P. 2013. Climate risk and vulnerability profiles for Homa Bay and Busia counties, Kenya. Nairobi: Adaptation to Climate Change and Insurance (ACCI) [online]. Available from: http://www.acci.co.ke/accio/wp/wp- 139 content/uploads/2013/04/ACCI_Homa-Bay-and-Busia-Risk-Profile_1-13.pdf. Accessed: 30 June 2014. Loewenberg S. 2011. Global food crisis takes heavy toll on east Africa: Spiralling food prices, widespread drought, and insufficient action by international donors, have left populations in the Horn of Africa on the brink of famine. World Report; the lancet, 383 Loewenberg S. 2014. Breaking the cycle: drought and hunger in Kenya; Aid to Kenya responds to the country’s recurrent food crises but it fails to address the underlying infrastructure problems that could prevent such emergencies. Special Report; the lancet, 383 Magnusson MB, Sjöberg A, Kjellgren KI & Lissner L. 2011. Childhood obesity and prevention in different socio-economic contexts. Preventive Medicine, 53:402–407 Martin KS, Wu R, Wolff W, Colantonio AG & Grady J. 2013. A Novel Food Pantry Program Food Security, Self-Sufficiency, and Diet-Quality Outcomes. American Journal of Preventive Medicine, 45(5):569–575. Masibo PK, Makoka D. 2012. Trends and determinants of undernutrition among young Kenyan children: Kenya Demographic and Health Survey; 1993, 1998, 2003 and 2008–2009. Public Health Nutrition, 15(9):1715–1727. Maurice S. 2006. Self-organization and cross-scale interactions in integrated development and conservation projects: a comparative study of honey care Africa’s beekeeping projects in Kakamega district and Kwale district, Kenya. MSc dissertation. University of Manitoba: Natural Resource Institute, [online]. Available at: https://umanitoba.ca/institutes/natural_resources/canadaresearchchair/thesis/Stephane%2 0Maurice%20thesis.pdf (Accessed: 30 March 2013) Mbochi RW, Kuria E, Kimiywe J, Ochola S & Steyn NP. 2012. Predictors of overweight and obesity in adult women in Nairobi Province, Kenya. BioMed Central Public Health, 12:823. 140 Mendez MA, Monteiro CA & Popkin BM. 2005. Overweight exceeds underweight among women in most developing countries. American Journal of Clinical Nutrition, 81(3):714–721. Miller P, Moore RH & Kral TVE. 2011. Children’s daily fruit and vegetable intake: associations with maternal intake and child weight status. Journal of Nutrition Education and Behavior, 43(5):396-400. Miyashita K & Hosokawa M. 2014. ‘Carotenoids as a Nutraceutical Therapy for Visceral Obesity’, in RR Watson (editors), Nutrition in the Prevention and Treatment of Abdominal Obesity, Elsevier Inc: 329-340. Mogeni P, Twahir H, Bandika V, Mwalekwa L, Thitiri J, Ngari M, Toromo C, Maitland K & Berkley J. 2011. Diagnostic performance of visible severe wasting for identifying severe acute malnutrition in children admitted to hospital in Kenya. Journal of Bull World Health Organ, 89:900-6. Monteiro CA, Hawkes C & Caballero B. 2010. ‘The Underweight/Overweight Paradox in Developing Societies: Causes and Policy Implications,’ in Elsevier (editors), Obesity Prevention: The Role of Brain and Society on Individual Behavior. Elsevier Inc: 463-469. Mudavadi PO, Otieno K, Wanambacha JW, Odenya JO, Odendo M & Njaro KO. 2011. Smallholder dairy production and marketing in Western Kenya: A review of literature. MOARD/KARI/ILRI. Muga GO & Ouma WO. 2009. Changing Household Composition and Food Security among the Elderly Caretakers in Rural Western Kenya. Journal of Cross-Cultural Gerontology, 24:259– 272. Newby PK, Peterson KE, Berkey CS, Leppert J, Willett WC & Colditz GA. 2004. Beverage consumption is not associated with changes in weight and body mass index among lowincome preschool children in North Dakota. Journal of the American Dietetic Association, 104(7):1086–1094. 141 O’Neil CE, Nicklas T, Rampersaud GC & Fulgoni VL. 2011. One hundred percent orange juice consumption is associated with better diet quality, improved nutrient adequacy, and no increased risk for overweight/obesity in children. Nutrition Research, 31:673-82. Oldewage-Theron W & Kruger R. 2011. Dietary diversity and adequacy of women caregivers in a peri-urban informal settlement in South Africa. Nutrition, 27:420-427. Onyango AC, Walingo MK, Mbagaya G & Kakai R. 2011. Anthropometric and dietary profile of HIV sero-positive patients in Chulaimbo sub-district hospital, Kenya. Journal of Pharmaceutical and Biomedical Sciences, 1(3):34-44. Ozaltin E, Hill K, Subramanian SV. 2010. Association of maternal stature with offspring mortality, underweight, and stunting in low- to middle-income countries. Journal of American Medical Association, 303:1507–1516. Paisley J & Skrzypczyk S. 2005. Qualitative Investigation of differences in benefits and challenges of eating fruits versus vegetables as perceived by Canadian women. Journal of Nutrition Education and Behavior, 37(2):77–82. Paisley J, Sheeshka J & Daly K. 2001. Qualitative investigation of the meanings of eating fruits and vegetables for adult couples. Journal of Nutrition Education, 33(4):199–207. Perez-Rodrigo C, Aranceta J, 2003. Nutrition education in schools: experiences and challenges. European Journal of Clinical Nutrition, 57 (Suppl 1), S82–S85. Pollard CM & Rowley C. 2010. ‘Working with Industry for the Promotion of Fruit and Vegetable Consumption’, in RR Watson & VR Preedy (editors), Bioactive Foods in Promoting Health: Fruits and Vegetables, Elsevier Inc: 205-220. Powell LM & Bao Y. 2009. Food prices, access to food outlets and child weight. Economics and Human Biology, 7:64–72 142 Rampersaud GC, Bailey LB & Kauwell GPA. 2003. Natioanl survery beverage consumption data for children and adolescents indicate the need to encourage a shift toward more nutritive beverages. American Dietetic Association, 103:97–100. Richter M, Erhart M, Vereecken CA, Zambon A, Boyce W, Gabhainn SN. 2009. The role of behavioural factors in explaining socio-economic differences in adolescent health: A multilevel study in 33 countries. Social Science & Medicine, 69:396–403 Rieth MA, Moreira MB, Fuchs FD, Moreira LB & Fuchs SC. 2012. Fruits and vegetables intake and characteristics associated among adolescents from Southern Brazil. Nutrition Journal, 11(95):1-7. Rodriguez-Rodriguez E, Lopez-Sobaler AM & Ortega RM. 2010. Weight loss due to fruit and vegetable use in: Watson, R.R., Preedy, V.R.(eds.) Bioactive Foods in Promoting Health: Fruits and Vegetables, Elsevier Inc p.437–448. Ruel MT. 2002. ‘Is dietary diversity an indicator of food security or dietary quality? A review of measurement issues and research needs’, in FCND discussion paper (editors). Washington, DC: International Food Policy Research Institute. Saka JDK, Kadzere I, Ndabikunze BK, Akinnifesi FK & Tiisekwa BPM. 2008. ‘Product Development: Nutritional Value, Processing and Utilization of Indigenous Fruits from Miombo Ecosystem’, in FK Akinnifesi, RRB Leakey, OC Ajayi, G Sileshi, Z Tchoundjeu, P Matakala & FR Kwesiga (editors), Indigenous Fruits trees in the tropics: domestication, utilization and commercialization, CAB International:289-309. Schutter OD. 2013. ‘The first perspective’, in J Fanzo, D Hunter, T Borelli & F Mattei (editors), Diversifying food and diets: using agricultural biodiversity to improve nutrition and health, Routledge 2 Park Square, Milton Park, Abingdon, Oxon, OX14 4RN: xx-xxiii 143 SECA. Measuring equipment [Online]. Available from: http://www.seca.com/english/uk/home/products/details/seca/product/height_measuring_i nstruments_244/seca_217/ (Accessed: 28 September 2012]. SECA. Measuring equipment [Online]. Available from: http://www.seca.com/english/uk/home/products/details/seca/product/pediatric_measurin g_instruments_249/seca_212/ [Accessed: 28 September 2012]. SECA. Measuring equipment [Online]. Available from: http://www.seca.com/english/uk/home/products/details/seca/product/pediatric_measurin g_instruments_249/seca_417/ [Accessed: 28 September 2012]. Smith IF. 2013. ‘Sustained and integrated promotion of local, traditional food systems for nutrition security’, in J Fanzo, D Hunter, T Borelli & F Mattei (editors), Diversifying food and diets: using agricultural biodiversity to improve nutrition and health, Routledge 2 Park Square, Milton Park, Abingdon, Oxon, OX14 4RN: 122-134. Souza-Dias BF. 2013. ‘The second perspective’, in J Fanzo, D Hunter, T Borelli & F Mattei (editors), Diversifying food and diet: using agricultural biodiversity to improve nutrition and health, Routledge 2 Park Square, Milton Park, Abingdon, Oxon, OX14 4RN: xxiv- xxiv Steyn NP & Senekal M. 2004. A Guide for the use of the Dietary Assessment and Education Kit (DAEK). Parow Valley, Cape Town: South African Medical Research Council. Steyn NP, Nel, JH, Parker W, Ayah R & Mbithe D. 2012. Urbanisation and the nutrition transition: A comparison of diet and weight status of South African and Kenyan women. Scandinavian Journal of Public Health, 40:229–238. Tarozzi A. 2008. Growth reference charts and the nutritional status of Indian children. Economics and Human Biology, 6:455-68. The Micronutrient Initiative. No date. Available: http://www.micronutrient.org/english/view.asp?x=595 (Accessed: 30 June 2014). 144 Thiong’o MK, Kingori S & Jaenicke H. 2002. ‘The taste of the wild: variation in the nutritional quality of the marula fruits and opportunities for domestication’, Acta Horticulturae, 575:237244, in JDK Saka, I Kadzere, BK Ndabikunze, FK Akinnifesi & BPM Tiisekwa. 2008. Product Development: Nutritional Value, Processing and Utilization of Indigenous Fruits from Miombo Ecosystem, in FK Akinnifesi, RRB Leakey, OC Ajayi, G Sileshi, Z Tchoundjeu, P Matakala & FR Kwesiga (editors), Indigenous Fruits Trees in the Tropics: Domestication, Utilization and Commercialization, CAB International, 2008:288-309. Tomedi A, Rohan-Minjares F, Mc Calmont K, Ashton R, Opiyo R, Mwanthi M. 2011. Feasibility and effectiveness of supplementation with locally available foods in prevention of child malnutrition in Kenya. Public Health Nutrition, 15(4):749–756. Torheim LE, Barikmo I, Parr CL, Hatløy A, Ouattara F & Oshaug A. 2003. Validation of food variety as an indicator of diet quality assessed with a food frequency questionnaire for Western Mali. European Journal of Clinical Nutrition, 57:1283–1291. Torheim LE, Ouattara F, Diarra MM, Thiam FD, Barikmo I, Hatløy A & Oshaug A. 2004. Nutrient adequacy and dietary diversity in rural Mali: associations and determinants. European Journal of Clinical Nutrition, 58:594–604. Truswell S. 2007. ‘Assessment of nutritional status and biomarkers’ in JA Mann & S Truswell (editors), Essentials of human nutrition, 3rd edition, New York: Oxford University Press: 429442. United Nations Environmental Program (UNEP). 2008. Indigenous Knowledge in Disaster Management in Africa, Nairobi: United Nations Environmental Program. United Nations Children's Fund (UNICEF). 2009a. The state of the world’s children 2009: maternal and newborn health, New York: UNICEF. United Nations Children's Fund (UNICEF). 2009b. Tracking progress on child and maternal nutrition: a survival and development priority, New York: UNICEF. 145 United Nations Children's Fund (UNICEF). 2011. Levels and trends in child mortality, New York: UNICEF. United Nations Children's Fund (UNICEF) [Online]. Available from: Cut-off points to classify nutritional status at population level. http://www.unicef.org/nutrition/training/3.2/31.html [Accessed 26 September 2012]. United Nations Children's Fund (UNICEF). 2013. Improving child nutrition: The achievable imperative for global progress, New York: UNICEF. UNICEF, WHO, UNESCO, UNFPA, UNDP, UNAIDS, WFP & the World Bank. 2010. Facts for Life, 4th edition. New York: UNICEF. United States Agency for International Development (USAID). 2011. East Africa Food Security Update, Nairobi: USAID. United States. Department of Agriculture (USDA) and Department of Health and Human Services (HHS). 2010. Dietary Guidelines for Americans. 7th Edition, Washington, DC: Government Printing Office: 1-161. United States. Department of Agriculture (USDA) and Food and Nutrition Technical Assistance (FANTA). Anthropometry: Children under 5 [Online]. Available from: http://www.fantaproject.org/downloads/pdfs/Bookmark_Anthro_Feb2011_English.pdf [Accessed 26 September 2012]. United States. National Health and Nutrition Examination Survey (NHANES). 2004. Anthropometry procedures manual [online]. Available from: http://www.cdc.gov/nchs/data/nhanes/nhanes_03_04/BM.pdf. Accessed: 30 June 2014. United States. National Heart, Lung, and Blood Institute (NHLBI). 1998. The clinical guidelines on the identification, evaluation, and treatment of overweight and obesity in adults: The evidence report. New York: National Institutes of Health [online]. Available from: http://www.nhlbi.nih.gov/guidelines/obesity/ob_gdlns.pdf. Accessed: 30 June 2014. 146 United States. National Heart, Lung, and Blood Institute (NHLBI). 2000. The practical guide; identification, evaluation, and treatment of overweight and obesity in adults. New York: National Institutes of Health [online]. Available from: http://www.nhlbi.nih.gov/guidelines/obesity/prctgd_c.pdf. Accessed: 30 June 2014. Unusan, N. 2006. Linkage between stress and fruit and vegetable intake among university students: an empirical analysis on Turkish students. Journal of Nutrition Research, 26:385– 390. Valmórbida JL & Vitolo MR. 2014. Factors associated with low consumption of fruits and vegetables by preschoolers of low socio-economic level. Jornal de Pediatria, 152:8. Vicente AR. 2009. ‘Nutritional quality of fruits and vegetables’, in Elsevier (Editors), Postharvest Handling: A Systems Approach, Elsevier Inc: 57-106. Wedner SH & Ross DA. 2008. ‘Vitamin A Deficiency and Its Prevention’, in Elsevier (editors), Encyclopedia of Public Health, London: Heggenhougen K Elsevier San Diego USA and Oxford UK: 526-532. Weisell RC. 2002. Body mass index as an indicator of obesity. Asia Pacific Journal of Clinical Nutrition, 11 Suppl 8:S681–4… Whitney E & Rolfes S. 2008. Understanding nutrition. 11th edition. Belmont: Thomson Wadsworth: 1184. Whitney E & Rolfes S. 2013. Understanding nutrition. 13th edition. Belmont: Thomson Wadsworth: 928. Wolf A & Elmadfa I. 2010. 'Fruit and vegetable intake of mothers in Europe: Risks/benefits', in RR Watson & VR Preedy (editors), Bioactive Foods in Promoting Health: Fruits and Vegetables, Elsevier Inc: 161-172. 147 Wolf A, Elmadfa I. 2010. ‘Fruit and Vegetable Intake of Mothers in Europe: Risks/Benefits,’ in RR Watson & VR Preedy (editors), Bioactive Foods in Promoting Health: Fruits and Vegetables, Elsevier Inc: 161-172. Wolfenden L, Wyse RJ, Britton BI, Campbell KJ, Hodder RK, Stacey FG, McElduff P & James EL. 2012. Interventions for increasing fruit and vegetable consumption in children aged 5 years and under (Review). The Cochrane Collaboration, (11):60. Wootton-Beard PC & Ryan L. 2011. Improving public health?: The role of antioxidant-rich fruit and vegetable beverages. Journal of Food Research International, 44:3135-3148. World Health Organization (WHO). 2008a. Interpreting Growth Indicators, Geneva: WHO. World Health Organization (WHO). 2008b. Waist circumference and waist-hip ratio: report of a WHO expert consultation, Geneva: WHO. World Health Organization (WHO). 2011. World Malaria Report 2011, Geneva: WHO. World Health Organization (WHO). 2012. The WHO Global Database on Child Growth and Malnutrition. Available from http://www.who.int/childgrowth/en/. (Accessed: 30 June 2014). World Health Organization (WHO) & United Nations Children's Fund (UNICEF). 2009. WHO child growth standards and the identification of severe acute malnutrition in infants and children: A Joint Statement by the World Health Organization and the United Nations, Geneva: WHO. 148 LIST OF APPENDICES Appendix A: Informed Consent 149 150 Appendix B: Information document 151 152 153 Appendix C: Kenya – Research Clearance and Authorization 154 155 156 Appendix D: Socio-demographic and Household Questionnaire Fruit Consumption in relation to the Health and Nutritional Status of children below 5 years and their mothers/caregivers in farming households of Western Kenya SOCIO-DEMOGRAPHIC AND HOUSEHOLD QUESTIONNAIRE (All information in this questionnaire is confidential). Area in Kakamega/Busia:___________________ 1 Location in Kakamega/Busia:___________________ 2 Household number: 3-4 D D M M Y Y Y Y Interview Date: 5-12 How many people live permanently in the house (individual living in the household 5-7 days per week)? 13-14 Encircle the appropriate answer: First language of respondent: 1. Luhya 15 2. Luo 3. Kisii 4. Swahili Ethnic composition of the household: 5. 1. Other, Luhya specify_______________ 2. Luo 16 3. Kisii 4. Swahili 5.Other, specify_______________ 157 Employment status of respondent: 17 1. Housewife by choice 2. Unemployed 3. Self Employed 4. Full time wage earner (receive a salary) 5. Other, specify (part-time, piece job etc.)_________________ 6. Don’t Know Husband/ partner’s employment status: 18 1. Retired by choice 2. Unemployed 3. Self Employed 4. Full time wage earner (receive a salary) 5. Other, specify (part-time, piece job etc.)__________________ 6. Not Applicable e.g. dead Type of dwelling: 19 1. Brick, Concrete 2. Traditional mud 3. Tin 4. Plank, wood 5. Other, specify________________ 158 Total number of rooms in house: _____________________ 20-21 Number of bedrooms: ____________________ 22 Do you have a bathroom in the house? 1=Yes 2=No 23 Do you have a bathroom outside? 1=Yes 2=No 24 Do you have a kitchen or cooking area inside the house? 1=Yes 2=No 25 Does the household electricity? 26 1=Yes 2=No Where do you get drinking water most of the time (only one)? 27 1. Own tap 2. Communal tap 3. River, dam 4. Borehole, well 5. Other, specify _______________ What type of toilet does this household have? 28 1. Flush 2. Pit 3. Bucket, pot 4. VIP 5. Other, specify ________________ What fuel is used for cooking most of the time (only one)? 29 1. Electric 159 2. Gas 3. Parrafin 4. Wood, Coal 5. Sun 6. Open fire Does the home have a working: Refrigerator and/or freezer 30 1. Yes 2. No Stove (Gas, Coal or electric) or Hot Plate 31 1.Yes 2. No Primus or Paraffin Stove 32 1. Yes 2. No Microwave 33 1. Yes 2. No Radio 34 1. Yes 2. No 160 Television 35 1. Yes 2. No Mobile phones 36 1. Yes If yes, how many mobile phones?______________________ 2. No 37-38 What is the total area (in acres1) of the agricultural land that the household has access to (including that borrowed, rented in) for agricultural production?-_______________________Acres . 39-42 Of the above land, what size is under crop production this year ______acres Of the above land, what size is under pasture production/grazing or uncultivated (including homestead area)?______________acres . 43-46 . 47-50 51-52 How much time do you spend with farming? _____________hours 53-54 How many people contribute to the total income? ___________ Household income per month (including wages, rent, sales of vegs, etc. State grants). 55 161 1. None 2. KES 1000 - KES 5000 3. KES 5001 - KES 10000 4. KES 10001 - KES 30000 1. KES 30001 - KES 50000 2. Over KES 50000 3. Don’t know Is this more or less the income that you had over the past six months? 56 1. More 2. Less 3. The same Marital status: 1 57 1. Single 2. Monogamously married 3. Polygamous married 4. Widowed 5. Separated/Divorced 1 hectare = 2.471 acres 1 acre = 0.405 hectares 162 Appendix E: Household Food Security and Food Procurement Questionnaire Fruit Consumption in relation to Health and Nutritional Status of children below 5 years and their mothers/caregivers in farming households of Western Kenya HOUSEHOLD FOOD SECURITY AND FOOD PROCUREMENT QUESTIONNAIRE (All information in this questionnaire is confidential). Area in Kakamega/Busia:_______________ 1 Location in Kakamega/Busia: ________________ 2 Household number: 3-4 D D M M Y Y Y Y Interview Date: 5-12 How much money is spent on food for the household weekly? 13-14 1. KES 500-KES 600 2. KES 601-KES 700 3. KES 701-KES 800 4. KES 801-KES 900 5. KES 901-KES 1000 6. KES 1001-KES 1100 7. KES 1101-KES 1200 8. KES 1201-KES 1300 9. Over KES 1300 10. Don’t know 163 What is your main source of income? 15 1. wages and salaries from formal employment 2. self employment (including home enterprises) 3. casual employment (agricultural or non agricultural) 4. crop production and livestock sales 5. sale of assets 6. land/ flats /equipment rental 7. old age pension or state grant 8. domestic work 9. other: specify _____________________________ FOOD PRODUCTION, PRESERVATION AND AVAILABILITY Do you grow crops? 1=yes 2=no 16 If yes, which crops do you produce? 1. Maize 17 2. Sorghum 18 3. Millet 19 4. Sweet potatoes 20 5. Cassava 21 6. Other: specify _______________________ 22 What % of the annual agricultural yield is sold? _______________ 23-25 Do you grow vegetables? 1=yes 2=no 26 164 If yes, which vegetables do you produce? 1. Cowpea leaves 27 2. Leafy Amaranth 28 3. Spider plant 29 4. African Nightshades 30 5. Crotalaria 31 6. Jute mallow 32 7. Ethiopian kale 33 8. Kales 34 9. Pumpkin 35 10. Beans 36 11. Cabbages 37 12. Other: specify _______________________ 38 Do you have your own fruit trees? 1=yes 2=no 39 If yes, what fruit do you grow? 1. Mangoes 40 2. Avocados 41 3. Guava 42 4. Loquats 43 5. Java plum 44 6. Pawpaw 45 7. Jackfruit 46 8. Sweet banana 47 165 9. Oranges 48 10. Lemons 49 12. Tamarind 50 13. Sugarcane 51 13. Other: specify _______________________ 52 Do you own livestock? 1=yes 2=no 53 If yes, which livestock do you own and how many? 1. Beef cattle, specify how many_________________ 54-55 2. Dairy cattle , specify how many_________________ 56-57 3. Sheep, specify how many_________________ 58-59 4. Goats, specify how many_________________ 60-61 5. Pigs, specify how many_________________ 62-63 6. Donkey, specify how many_________________ 64-65 7. Chickens, specify how many_________________ 66-67 8. Ducks/turkey, specify how many________________ 68-69 9. Other: specify _______________________ 70-71 Do you usually produce enough food to last until the next season? 1=yes 2=no 72 If yes, which food usually lasts until the next harvest? 1=yes 2=no 73 1. crops 74 2. vegetables 75 3. fruits 76 4. other: specify ___________________________ If not, what is the main reason 77 166 1. not enough land 2. not enough money to buy seeds and other equipment 3. other: specify __________________________________ Do you keep food for future use? 1=yes 2=no 78 If yes, which method do you mostly use? 1. sun drying 79 2. smoking (above fireplace) 80 1 3. fermenting 2 4. canning 3 5. freezing 4 6. other: specify_____________________________________ What is your main reason for producing food? 5 1. consumption by family members 6 2. to sell 7 8 3. to exchange for clothes and household equipment 4. other: specify___________________________ Are fruits easily available from the local farmers and shops? 1=yes 2=no 9 Are vegetables easily available from the local farmers and shops? 1= yes 2=no 10 What form of transport do you mainly use to buy food? 11 1. Foot 2. Bicycle 3. Public transport e.g. van 4. Car Who in the family is served first when meals are served? 5. Other _________________ 12 167 1. Father/ men in the family 2. Mother/ women in the family 3. Children 4. All eat at the same time 5. Lives and eats alone HUNGER SCALE Does your household ever run out of money to buy food? 13 1. yes 2. no Do you ever rely on a limited number of foods to feed your children? 14 1. yes 2. no 3. no children in household Do you ever cut the size of meals or skip any because there is not enough food in house? 15 1. yes 2. no Do you ever eat less than you should because there is not enough money for food? 16 1. yes 2. no Do your children ever eat less than you feel they should because there is not enough money for food? 1. yes 2. no 3. no children in household Do your children ever say they are hungry because there is not enough food in the house? 17 18 168 1. yes 2. no If yes, is it because 1. they want to eat all the time 2. shortage of food 19 20 Do you ever cut the size of your children’s meals or do they ever skip meals because there is not enough money to buy food? 1. yes 2. no Do any of your children ever go to bed hungry because there is not enough money to buy food? 1. yes 2. no Has the family ever experienced periods of food shortage? 1. yes 2. no 21 If yes, how did the family cope during this period (please rank starting with the most important option)? 1. Found other/additional sources of income 2. asked family/relatives/ neighbours for help (money/food) 3. family members went to live elsewhere 4. sold assets 5. worked for payment in kind 6. depended on charity/welfare 7. borrowed money/food 8. increased production of food 9. could not do anything 10. other: specify ___________________________ 24 22 23 25 26 27 28 29 30 31 32 33 169 Appendix F: Household Dietary Diversity Questionnaire Fruit Consumption in relation to Health and Nutritional Status of children below 5 years and their mothers/caregivers in farming households of Western Kenya HOUSEHOLD DIETARY DIVERSITY QUESTIONNAIRE (All information in this questionnaire is confidential). Area in Kakamega/Busia:_______________ 1 Location in Kakamega/Busia: ________________ 2 Household number: 3-4 D D M M Y Y Y Y Interview Date: 5-12 Please describe the foods (meals and snacks) that you ate or drank yesterday during the day and night, whether prepared in home and consumed at home or outside the home and purchased or gathered outside and consumed in the home. Start with the first food or drink of the morning. Write down all foods and drinks mentioned. When composite dishes are mentioned, ask for the list of ingredients and portion sizes of foods consumed. When the respondent has finished, probe for meals and snacks not mentioned. 170 Breakfast Snack Lunch Snack Dinner Snack Was yesterday a celebration or feast day where you ate special foods or where you ate more, or less than usual? 13 1. Yes 2. No 171 Dietary diversity questionnaire YES=1 Question number Food group 1 CEREALS 2 3 4 5 6 7 8 9 10 Examples NO=2 maize, rice, wheat, sorghum, millet or any other grains or foods made from these (e.g. bread, noodles, porridge or other grain products) + ugali/porridge (millet, sorghum, maize, cassava) 1 WHITE ROOTS AND TUBERS white potatoes, white yam, cocoyam, white cassava, or other foods made from roots 2 VITAMIN A RICH VEGETABLES AND TUBERS pumpkin, carrot, squash, or sweet potato that are orange inside + other locally available vitamin A rich vegetables (e.g. red sweet pepper) DARK GREEN LEAFY VEGETABLES dark green leafy vegetables, including wild forms + locally available vitamin A rich leaves such as amaranth, spider plant, African nightshades, jute plant, crotalaria, sweet potato leaves, cassava leaves, kale, spinach etc. 4 OTHER VEGETABLES other vegetables (e.g. tomato, onion, eggplant) + other locally available vegetables 5 VITAMIN A RICH FRUITS ripe mango, ripe papaya, ripe avocado, and 100% fruit juice made from these + other locally available vitamin A rich fruits 6 other fruits, including wild fruits (ripe lemon, ripe guava, ripe apples, ripe pineapples, ripe watermelon, ripe banana, ripe loquats, ripe jack fruit, etc.). 7 liver, kidney, heart or other organ meats or bloodbased foods 8 beef, pork, lamb, goat, rabbit, game, chicken, duck, other birds, insects 9 eggs from chicken, duck, guinea fowl or any other egg 10 OTHER FRUIT ORGAN MEAT FLESH MEAT EGGS 3 172 FISH AND SEAFOOD fresh or dried fish or shellfish LEGUMES, NUTS AND SEEDS dried beans, dried peas, lentils, nuts, seeds or foods made from these (e.g. hummus, peanut butter) MILK AND MILK PRODUCTS milk, cheese, yogurt or other milk products 14 OILS AND FATS oil, fats or butter added to food or used for cooking 14 15 SWEETS sugar, honey, sweetened soda or sweetened juice drinks, sugary foods such as chocolates, candies, cookies and cakes 15 11 12 13 16 SPICES, CONDIMENTS, BEVERAGES 11 12 13 spices (black pepper, salt), condiments (soy sauce, hot sauce), coffee, tea, alcoholic beverage 16 od groups) Medium DDS (4 and 5 food groups) 1 17 2 3 FOOD SOURCE 1. Could you please detail the primary source for obtaining cereals for your household_________________________ 18 2. Could you please detail the primary source for obtaining fruits for your household_________________________ 19 3. Could you please detail the primary source for obtaining vegetables for your household_________________________ 20 173 Code; Primary source for obtaining food 1 = own production, gathering, hunting, fishing 2 = purchased 3= borrowed, bartered, exchange for labour, gift from friends or relatives 4= food aid 5= other (Households: include foods eaten by any member of the household, and exclude foods purchased and eaten outside the home) 174 Appendix G: Quantified Food Frequency Questionnaire Fruit Consumption in relation to Health and Nutritional Status of children below 5 years and their mothers/caregivers in farming households of Western Kenya Quantified Food Frequency Questionnaire (All information in this questionnaire is confidential). Area in Kakamega/Busia:___________________ 1 Location in Kakamega/Busia: ________________ 2 Household number: 3-4 D D M M Y Y Y Y Interview Date: 5-12 Steps for the interviewer to follow when interviewing each participant; SECTION 3A Step 1: I want you to think back over the past weeks and month about the foods and drinks you ate/drank. Then I want you to try to remember how much you usually have of each item. Steps 4 and 5 are completed together, for each food item, before moving on to the next item: Ask about how often the item is usually eaten per day/week. This amount should be entered in the appropriate column in the FFQ. For example, if white bread is usually eaten once a day, every day, fill in a ‘1’ in the E column (eaten daily). Items eaten every week (but not every day) should be filled in column F according to the number of days per week eaten..: The next step is to determine the usual portion size of each item. SECTION 3B The interviewer is required to read to the respondent all the foods in the questionnaire to verify if the respondent consumed them. Nutritional Studies on fruits for GRP I in Western Kenya (Kakamega and Busia counties), Maryam Imbumi, Masters project for UFS, S.A 175 1. Did you eat the following varieties of foods items (mention the foods one by one)? 2. What was the source of the food 3. What ingredients did you use or what is the description of the food? 4. What are your usual portion sizes? (Enumerator to weigh where applicable and write the quantity of the food consumed and the number of time food is consumed under the column that corresponds to the yes reply otherwise, skip to the next). Nutritional Studies on fruits for GRP I in Western Kenya (Kakamega and Busia counties), Maryam Imbumi, Masters project for UFS, S.A 176 Quantity and Frequency of consumption C. Item code 1.0 Food groups and items consumed H. Food source and month/ season when food is available Mother or caretaker of the child B. D. Description Amount usually of food item eaten (g) Generic/ amount= g (lts, mls, cups, ladle, Tablespoon, teaspoon, etc =g) E. Eaten every day F. Eaten every week G. Eaten at leastonce a month Times/ day Days/ week Times/ month Index child B. Description of food item D. Amount usually eaten (g) Generic/amount= g (lts, mls, cups, ladle, Tablespoon, teaspoon, etc =g) E. Eaten every day F. Eaten every week G. Eaten at least once a month Times/ day Days/ week Times/ month Cereals & cereal products Uvusuma Ovusuma vwa amatuma obutorotoro Ovusuma vwa amatuma obuumu Ovusuma vwa amatuma vwa hakari Ovusuma vwa amatuma nende uvule Obusuma bwa amatuma + amabere Obusuma bwa mioko + soya + mabere + obule Ovusuma vwa ovure Ovusuma vwa amavere ovusuma vwa ovule + amavere 177 Quantity and Frequency of consumption C. Item code Food groups and items consumed H. Food source and month/ season when food is available Mother or caretaker of the child B. D. Description Amount usually of food item eaten (g) Generic/ amount= g (lts, mls, cups, ladle, Tablespoon, teaspoon, etc =g) E. Eaten every day F. Eaten every week G. Eaten at leastonce a month Times/ day Days/ week Times/ month Index child B. Description of food item D. Amount usually eaten (g) Generic/amount= g (lts, mls, cups, ladle, Tablespoon, teaspoon, etc =g) E. Eaten every day F. Eaten every week G. Eaten at least once a month Times/ day Days/ week Times/ month Ovusuma vwa soya Ovusuma vwa omwoko Ovuchieni amatuma Makhaya Amatuma amateshe Amatuma amasambe Tsimbetetie Itsipopcons Ovusela Ovusela vwa amatuma Ovusela vwa ovule Ovusela vwa amavere 178 Quantity and Frequency of consumption C. Item code Food groups and items consumed H. Food source and month/ season when food is available Mother or caretaker of the child B. D. Description Amount usually of food item eaten (g) Generic/ amount= g (lts, mls, cups, ladle, Tablespoon, teaspoon, etc =g) E. Eaten every day F. Eaten every week G. Eaten at leastonce a month Times/ day Days/ week Times/ month Index child B. Description of food item D. Amount usually eaten (g) Generic/amount= g (lts, mls, cups, ladle, Tablespoon, teaspoon, etc =g) E. Eaten every day F. Eaten every week G. Eaten at least once a month Times/ day Days/ week Times/ month Ovusera vwa soya Ovusela vwa maduma + isoya Ovusela vwa amatuma + ovule Ovusela vwa amatuma + amavere Ovusela vwa ovule + amavele Ovusela vwa amatuma + ovule + amavere Ovusela vwa amatuma + ovule + amavere + soya ovusela vwa ovule + soya Ovusela vwa amavere + emioko Ovusela vwa soya + emioko + ovule + amavere Obusera bwa tsimena + obule + amavere + soya + tsinjugu + amatuma 179 Quantity and Frequency of consumption C. Item code Food groups and items consumed H. Food source and month/ season when food is available Mother or caretaker of the child B. D. Description Amount usually of food item eaten (g) Generic/ amount= g (lts, mls, cups, ladle, Tablespoon, teaspoon, etc =g) E. Eaten every day F. Eaten every week G. Eaten at leastonce a month Times/ day Days/ week Times/ month Index child B. Description of food item D. Amount usually eaten (g) Generic/amount= g (lts, mls, cups, ladle, Tablespoon, teaspoon, etc =g) E. Eaten every day F. Eaten every week G. Eaten at least once a month Times/ day Days/ week Times/ month Amandasi Amandasi ka kawaida Amandasi ka soya Kaimati Tsichapati Ichapati ya kawaida Tsichapati tsya soya Ichapati ya attah Ichapati ya brown Ikeki Omukati kwe lisootsi Ikeki ya kawaida Ikeki ya soya 180 Quantity and Frequency of consumption C. Item code Food groups and items consumed H. Food source and month/ season when food is available Mother or caretaker of the child B. D. Description Amount usually of food item eaten (g) Generic/ amount= g (lts, mls, cups, ladle, Tablespoon, teaspoon, etc =g) E. Eaten every day F. Eaten every week G. Eaten at leastonce a month Times/ day Days/ week Times/ month Index child B. Description of food item D. Amount usually eaten (g) Generic/amount= g (lts, mls, cups, ladle, Tablespoon, teaspoon, etc =g) E. Eaten every day F. Eaten every week G. Eaten at least once a month Times/ day Days/ week Times/ month Ikeki ya maramwa amengu Crisps Tsicrisps za soya Muchele Muchele mulafu Muchele brown Ipilau ye inyama Ipilau bila inyama Ipilau ya soya 2.0 Pulses/legumes & legume products tsimbindi(cow peas) Tsimbindi 181 Quantity and Frequency of consumption C. Item code Food groups and items consumed H. Food source and month/ season when food is available Mother or caretaker of the child B. D. Description Amount usually of food item eaten (g) Generic/ amount= g (lts, mls, cups, ladle, Tablespoon, teaspoon, etc =g) E. Eaten every day F. Eaten every week G. Eaten at leastonce a month Times/ day Days/ week Times/ month Index child B. Description of food item D. Amount usually eaten (g) Generic/amount= g (lts, mls, cups, ladle, Tablespoon, teaspoon, etc =g) E. Eaten every day F. Eaten every week G. Eaten at least once a month Times/ day Days/ week Times/ month Amakanda (kidney beans) Amakanda Shitiani shia amakanda amaswache Eshitiani (roasted beans) Njahi (lablab beans) Tsisoya (Soya beans) Isoya isiire (soya nuts) Tsimbande Tsimbande tsisiire Tsindengu (green grams) Tsindengu Sambusa ye tsindengu Ndengu stew na okara 182 Quantity and Frequency of consumption C. Item code Food groups and items consumed H. Food source and month/ season when food is available Mother or caretaker of the child B. D. Description Amount usually of food item eaten (g) Generic/ amount= g (lts, mls, cups, ladle, Tablespoon, teaspoon, etc =g) E. Eaten every day F. Eaten every week G. Eaten at leastonce a month Times/ day Days/ week Times/ month Index child B. Description of food item D. Amount usually eaten (g) Generic/amount= g (lts, mls, cups, ladle, Tablespoon, teaspoon, etc =g) E. Eaten every day F. Eaten every week G. Eaten at least once a month Times/ day Days/ week Times/ month Mixed cereals and legumes/pulses Amahenjera ke tsimbindi Amahenjera ka amakanda Amahenjera ka amakanda + tsimbindi Amahenjera ka soya Amahenjera ke tsimbande Amahenjera ka amakanda + tsimbande Amahenjera ka amakanda + tsimbande + soya Mixed tubers and legumes Omushenye 3.0 Roots, tubers and plantains Emioko (cassava) 183 Quantity and Frequency of consumption C. Item code Food groups and items consumed H. Food source and month/ season when food is available Mother or caretaker of the child B. D. Description Amount usually of food item eaten (g) Generic/ amount= g (lts, mls, cups, ladle, Tablespoon, teaspoon, etc =g) E. Eaten every day F. Eaten every week G. Eaten at leastonce a month Times/ day Days/ week Times/ month Index child B. Description of food item D. Amount usually eaten (g) Generic/amount= g (lts, mls, cups, ladle, Tablespoon, teaspoon, etc =g) E. Eaten every day F. Eaten every week G. Eaten at least once a month Times/ day Days/ week Times/ month Emioko Emioko imikarange Amabwoni Amabwoni ka kienyeji (sweet potatoes) (orange?) Amabwoni ga waru Iviazi karayi Tsinduma (cocoyam) Amaramwa Amaramwa/amakomia amateshe Amaramwa amaswachi Amaramwa amasambe (roasted green bananas) 184 Quantity and Frequency of consumption C. Item code 4.0 Food groups and items consumed H. Food source and month/ season when food is available Mother or caretaker of the child B. D. Description Amount usually of food item eaten (g) Generic/ amount= g (lts, mls, cups, ladle, Tablespoon, teaspoon, etc =g) E. Eaten every day F. Eaten every week G. Eaten at leastonce a month Times/ day Days/ week Times/ month Index child B. Description of food item D. Amount usually eaten (g) Generic/amount= g (lts, mls, cups, ladle, Tablespoon, teaspoon, etc =g) E. Eaten every day F. Eaten every week G. Eaten at least once a month Times/ day Days/ week Times/ month Vegetables Tsifwa tsia amasafu (leafy vegetables) Lisukuma Kanzila/ Ethiopian kale Ispinachi Lisukuma + spinachi Likavichi Likhubi ribwoga(mboga boiled) Likhubi liomunyu Likhubi lie eshikangulu Amasafu ke emioko 185 Quantity and Frequency of consumption C. Item code Food groups and items consumed H. Food source and month/ season when food is available Mother or caretaker of the child B. D. Description Amount usually of food item eaten (g) Generic/ amount= g (lts, mls, cups, ladle, Tablespoon, teaspoon, etc =g) E. Eaten every day F. Eaten every week G. Eaten at leastonce a month Times/ day Days/ week Times/ month Index child B. Description of food item D. Amount usually eaten (g) Generic/amount= g (lts, mls, cups, ladle, Tablespoon, teaspoon, etc =g) E. Eaten every day F. Eaten every week G. Eaten at least once a month Times/ day Days/ week Times/ month Amasafu ke tsinduma Amasafu ke tsinyanya Amasafu ke ipilipili Amasafu ka amakaanda (magaraba) Amasafu ka amapwoni ka kienyeji (omulabi) Inderema Tsimboka (Mchicha) Tsimboka tsia green tsikhongo Tsimboka tsia green tsinditi Tsimboka tsia red tsikhongo (ododo) Tsimboka tsia red tsinditi Tsimboka tsia amaua 186 Quantity and Frequency of consumption C. Item code Food groups and items consumed H. Food source and month/ season when food is available Mother or caretaker of the child B. D. Description Amount usually of food item eaten (g) Generic/ amount= g (lts, mls, cups, ladle, Tablespoon, teaspoon, etc =g) E. Eaten every day F. Eaten every week G. Eaten at leastonce a month Times/ day Days/ week Times/ month Index child B. Description of food item D. Amount usually eaten (g) Generic/amount= g (lts, mls, cups, ladle, Tablespoon, teaspoon, etc =g) E. Eaten every day F. Eaten every week G. Eaten at least once a month Times/ day Days/ week Times/ month Lisutsa Lisutsa + tsimboka Tsisaka Tsisaka + tsimboka Liseveve Liseveve + tsimboka Liseveve + emiro Omurere Emiroo Emiroo + omurere + likhuvi Ovuova (mushrooms) Amasafu ke shimuka/shisanda Eshirietso 187 Quantity and Frequency of consumption C. Item code Food groups and items consumed H. Food source and month/ season when food is available Mother or caretaker of the child B. D. Description Amount usually of food item eaten (g) Generic/ amount= g (lts, mls, cups, ladle, Tablespoon, teaspoon, etc =g) E. Eaten every day F. Eaten every week G. Eaten at leastonce a month Times/ day Days/ week Times/ month Index child B. Description of food item D. Amount usually eaten (g) Generic/amount= g (lts, mls, cups, ladle, Tablespoon, teaspoon, etc =g) E. Eaten every day F. Eaten every week G. Eaten at least once a month Times/ day Days/ week Times/ month Linyolonyolo Eshinatipa Mchunga Tsifwa tsia moringa Fruit vegetables Tsikaroti Tsibilinganyi Tsinyanya tsikhongo Orunyanya orutiti (cherry tomatoes) Melon indafu (white melon) Eshiundu shie liramwa/ligomia 5.0 Fruits Amapaipai 188 Quantity and Frequency of consumption C. Item code Food groups and items consumed H. Food source and month/ season when food is available Mother or caretaker of the child B. D. Description Amount usually of food item eaten (g) Generic/ amount= g (lts, mls, cups, ladle, Tablespoon, teaspoon, etc =g) E. Eaten every day F. Eaten every week G. Eaten at leastonce a month Times/ day Days/ week Times/ month Index child B. Description of food item D. Amount usually eaten (g) Generic/amount= g (lts, mls, cups, ladle, Tablespoon, teaspoon, etc =g) E. Eaten every day F. Eaten every week G. Eaten at least once a month Times/ day Days/ week Times/ month Amaembe Tsindimu (malimau) Amachungwa Amapera avakado Apples Amananasi Water melon Liramwa / Ligomia liengu Sweet banana Tamarind Vitunda vitanda (passion fruits) Lifenesi/mfenesi 189 Quantity and Frequency of consumption C. Item code Food groups and items consumed H. Food source and month/ season when food is available Mother or caretaker of the child B. D. Description Amount usually of food item eaten (g) Generic/ amount= g (lts, mls, cups, ladle, Tablespoon, teaspoon, etc =g) E. Eaten every day F. Eaten every week G. Eaten at leastonce a month Times/ day Days/ week Times/ month Index child B. Description of food item D. Amount usually eaten (g) Generic/amount= g (lts, mls, cups, ladle, Tablespoon, teaspoon, etc =g) E. Eaten every day F. Eaten every week G. Eaten at least once a month Times/ day Days/ week Times/ month Mzambarau Emizabibu Uvutavate Obuchieni Maparapandi 6.0 Meat and meat products Inyama ye imbusi Inyama ye Ingurue Inyama ye likondi Inyama ye shisungura Inyama ye ingombe Inyama isijire/shango amuru ge ingombe nende evireje 190 Quantity and Frequency of consumption C. Item code Food groups and items consumed H. Food source and month/ season when food is available Mother or caretaker of the child B. D. Description Amount usually of food item eaten (g) Generic/ amount= g (lts, mls, cups, ladle, Tablespoon, teaspoon, etc =g) E. Eaten every day F. Eaten every week G. Eaten at leastonce a month Times/ day Days/ week Times/ month Index child B. Description of food item D. Amount usually eaten (g) Generic/amount= g (lts, mls, cups, ladle, Tablespoon, teaspoon, etc =g) E. Eaten every day F. Eaten every week G. Eaten at least once a month Times/ day Days/ week Times/ month amara (amatumbo) Olulimi lwe ing’ombe (cows tongue) Eshiini (liver) Antelope Meat Birds Ikhanga Ingokho Tsimondo (gizzard) tsisindu lipata /Mbata msinga (duck) Ligulugulu Likhanga (guinea fowl meat?) Pigeon 191 Quantity and Frequency of consumption C. Item code 7.0 Food groups and items consumed H. Food source and month/ season when food is available Mother or caretaker of the child B. D. Description Amount usually of food item eaten (g) Generic/ amount= g (lts, mls, cups, ladle, Tablespoon, teaspoon, etc =g) E. Eaten every day F. Eaten every week G. Eaten at leastonce a month Times/ day Days/ week Times/ month Index child B. Description of food item D. Amount usually eaten (g) Generic/amount= g (lts, mls, cups, ladle, Tablespoon, teaspoon, etc =g) E. Eaten every day F. Eaten every week G. Eaten at least once a month Times/ day Days/ week Times/ month Eggs Amayayi ka kienyeji (boiled/fried?) Amayayi ke igrade 8.0 Fish and sea-food Tsinyeni Eshivambara Ngenge inyomu (dry Tilapia) Ngege fresh (Fresh Tilapia) Kamongo (mud fish) Mbuta fresh Tsimbuta ndititi (Fresh Small Nile Perches) Amafulu 192 Quantity and Frequency of consumption C. Item code Food groups and items consumed H. Food source and month/ season when food is available Mother or caretaker of the child B. D. Description Amount usually of food item eaten (g) Generic/ amount= g (lts, mls, cups, ladle, Tablespoon, teaspoon, etc =g) E. Eaten every day F. Eaten every week G. Eaten at leastonce a month Times/ day Days/ week Times/ month Index child B. Description of food item D. Amount usually eaten (g) Generic/amount= g (lts, mls, cups, ladle, Tablespoon, teaspoon, etc =g) E. Eaten every day F. Eaten every week G. Eaten at least once a month Times/ day Days/ week Times/ month Omena (dagaa) 9.0 Insects Tsiswa Amasaa 10.0 Milk and milk products Amabeere Amabeele ke ing’ombe (fresh milk) Amabeele ke ing’ombe amabou (sour milk) Amabeele ke imbusi (goat milk) Amavere ga soya (homemade soya milk) Soya yoghurt (homemade?) 193 Quantity and Frequency of consumption C. Item code 11.0 Food groups and items consumed H. Food source and month/ season when food is available Mother or caretaker of the child B. D. Description Amount usually of food item eaten (g) Generic/ amount= g (lts, mls, cups, ladle, Tablespoon, teaspoon, etc =g) E. Eaten every day F. Eaten every week G. Eaten at leastonce a month Times/ day Days/ week Times/ month Index child B. Description of food item D. Amount usually eaten (g) Generic/amount= g (lts, mls, cups, ladle, Tablespoon, teaspoon, etc =g) E. Eaten every day F. Eaten every week G. Eaten at least once a month Times/ day Days/ week Times/ month Fats & oils Blueband isinya ye ing’ombe Amafura ke ingurue amafura- kimbo, chipsy, fry mate, cowboy, kasuku etc Amafura ka amatsi- Sunflower, corn oil, elianto, golden fry, fresh fry, rina vegetable oil, etc.) 12.0 Sugars, syrups, sweets, stimulants and beverages Omukhonye Obushi bwe inzushi isukari 194 Quantity and Frequency of consumption C. Item code Food groups and items consumed H. Food source and month/ season when food is available Mother or caretaker of the child B. D. Description Amount usually of food item eaten (g) Generic/ amount= g (lts, mls, cups, ladle, Tablespoon, teaspoon, etc =g) E. Eaten every day F. Eaten every week G. Eaten at leastonce a month Times/ day Days/ week Times/ month Index child B. Description of food item D. Amount usually eaten (g) Generic/amount= g (lts, mls, cups, ladle, Tablespoon, teaspoon, etc =g) E. Eaten every day F. Eaten every week G. Eaten at least once a month Times/ day Days/ week Times/ month Chocolate Jam Chai ya kahawa Chai ya ikoko Istrungi Chai ya soya beverage Ichai ya amabeele ka soya Ichai ya amabeele ke ing’ombe Beverage (maize flour + sour milk) Gulukosi Isoda Ijuisi Fresh mixed fruit juice (which fruits?) 195 Quantity and Frequency of consumption C. Item code Food groups and items consumed H. Food source and month/ season when food is available Mother or caretaker of the child B. D. Description Amount usually of food item eaten (g) Generic/ amount= g (lts, mls, cups, ladle, Tablespoon, teaspoon, etc =g) E. Eaten every day F. Eaten every week G. Eaten at leastonce a month Times/ day Days/ week Times/ month Index child B. Description of food item D. Amount usually eaten (g) Generic/amount= g (lts, mls, cups, ladle, Tablespoon, teaspoon, etc =g) E. Eaten every day F. Eaten every week G. Eaten at least once a month Times/ day Days/ week Times/ month Ijuisi ya kawaida ikwencha Alcohol Chang’aa Busaa beer Confectionary Ebisukuti Sukari nguru Ebiperemende 13.0 Nuts / Seeds Tsinjuku Tsinjuku tsindeshe 196 Quantity and Frequency of consumption C. Item code Food groups and items consumed H. Food source and month/ season when food is available Mother or caretaker of the child B. D. Description Amount usually of food item eaten (g) Generic/ amount= g (lts, mls, cups, ladle, Tablespoon, teaspoon, etc =g) E. Eaten every day F. Eaten every week G. Eaten at leastonce a month Times/ day Days/ week Times/ month Index child B. Description of food item D. Amount usually eaten (g) Generic/amount= g (lts, mls, cups, ladle, Tablespoon, teaspoon, etc =g) E. Eaten every day F. Eaten every week G. Eaten at least once a month Times/ day Days/ week Times/ month Peanut butter (tsinjuku tsiswache) Tsinjuku tsisiire (roasted groundnuts) Simsim 14.0 Spices and condiments Dania Kitunguu ya red, Maji (Kitungu ya Malawi), saumu Pilipili kali, hoho, Pilau masala Roiko, tangawizi, Vinzari Salt Karafuu, Mdalasini, Hiliki Chai Masala 197 Quantity and Frequency of consumption C. Item code Food groups and items consumed H. Food source and month/ season when food is available Mother or caretaker of the child B. D. Description Amount usually of food item eaten (g) Generic/ amount= g (lts, mls, cups, ladle, Tablespoon, teaspoon, etc =g) E. Eaten every day F. Eaten every week G. Eaten at leastonce a month Times/ day Days/ week Times/ month Index child B. Description of food item D. Amount usually eaten (g) Generic/amount= g (lts, mls, cups, ladle, Tablespoon, teaspoon, etc =g) E. Eaten every day F. Eaten every week G. Eaten at least once a month Times/ day Days/ week Times/ month Matawi ya ndimu 1. Is (child’s name) currently being breastfed? 13 1=yes 2=No 2. If YES, how many times is the child breastfed in a day? _____ times/day 14-15 Thank you very much for your time. We shall be consulting with you again in the near future! 198 Appendix H: Anthropometric Measurement Fruit Consumption in relation to Health and Nutritional Status of children below 5 years and their mothers/caretakers in farming households of Western Kenya Anthropometric measurements Area in Kakamega/Busia:_________________ 1 Location in Kakamega/Busia:___________________ 2 Household number: 3-4 D DMMYY Y Y Interview Date: 5-12 MOTHER 1st Reading 2nd Reading 3rd Reading Average Weight (in kg) . . . . 13-36 Height (in cm) . . . . 37-56 Waist circumference (cm) 57-76 . . . . D D MMY Y 199 Date of Birth 1-6 THE INDEX CHILD 6-60 MONTHS (Youngest Child in the age group 6 – 60 months) Measurement 1st Reading Weight (in kg) 2nd Reading . . 3rd Reading . Average . 7-26 Height (in cm) . . . . 27-46 MUAC (in cm) . . . . 47-62 Sex of child 1= male 63 2= female D D MMY Y Date of Birth 64-69 Oedema 1=yes 70 2=no 200 Appendix I: Health Questionnaire Fruit Consumption in relation to Health and Nutritional Status of children below 5 years and their mothers/caregivers in farming households of Western Kenya HEALTH QUESTIONNAIRE (All information in this questionnaire is confidential). Area in Kakamega/Busia:___________________ 1 Location in Kakamega/Busia: ________________ 2 Household number: 3-4 D D M M Y Y Y Y Interview Date: 5-12 Marital status: 13 1. Child 2. Never married 3. Currently married/ Traditional marriage 4. Living with partner 5. Widowed 6. Separated 7. Divorced 8. Other, specify_______________ Which best describes your history of smoking? 14 1. Never smoked 201 2. Currently smoke 3. Formerly smoked If currently, how many cigarettes per day? ________________________ 15-16 If currently, at what age did you start? ________________ 17-18 Which best describes your history of snuffing? 19 1. Never used snuff 2. Currently use snuff 3. Formerly used snuff If currently, how many times per day do you snuff________________________ 20-21 If currently, at what age did you start? ________________ 22-23 Which best describes your history of alcohol use? 24 1. Never used alcohol products 2. Currently use alcohol products 3. Formerly used alcohol products If currently, what form of alcohol do you use regularly (at least once a week)? 1=yes 2=no 1. Spirits (rum, whisky, gin, vodka etc.) 25 2. Wine 26 3. Beer 27 4. Homemade beer 28 At least once a month, do you consume >5 alcoholic drinks per day? 1=yes 2=no 29 At what age did you start using alcohol? ________________ 30-31 On weekends, how many alcohol-containing drinks do you consume?___________________ 32-33 Do you feel tired on Monday after heavy alcohol consumption (more than 5 drinks per day) during the weekend? 1=yes 2=no 34 Usual sleeping habits: What time do you usually go to bed at night?_______________ : 35-39 What time do you usually wake up in the morning?________________ : 40-44 Do you usually take naps during the day? 1=yes 2=no 45 202 During the past 12 months, was there ever a time when you felt sad, blue or depressed for two weeks or more in a row? 1=yes 2=no 46 Are you willing to answer questions related to HIV/AIDS? 1=yes 47 If yes, do you know people who have HIV/AIDS? 2=no 1=yes 2=no 48 If yes, which of these people: 1=yes 2=no 1. Your children 49 2. Your grandchildren 50 3. Your spouse 51 4. Your family members 52 5. Your friends 53 6. People in the community 54 Do you yourself care for orphans/or any other children in your household? 1=yes 2=no 55 203 Appendix J: Commonly consumed Fruits in Western Kenya and their Nutrient Composition Table 2: Nutritional value of seven most commonly consumed fruits in Western Kenya Value per 100 grams edible portion Scientifi c Name: Nutri Mango , raw Guavas, Loquats common, , raw raw Javaplum, (jambol an), raw Papayas , raw Avocados, raw, all commercia l varieties ( 1) Bananas tamar inds, , raw raw jackfrui lemon , raw, t, raw witho ut peel Yellow Plum/ Sea Lemon, fruit flesh, raw Mangifera indica Psidium guajava Eriobotrya japonica Syzygiu m cumini Carica papaya Persea ameri-cana Musa X paradisiaca Tamar i-ndus indica Artocar -pus hetero phylla Citrus limon Ximenia american a Units ent Proxim a-tes Water g 81.71 86.1 86.73 83.13 88.83 73.23 74.91 31.4 73.46 88.98 64.8 Energy kcal 65 51 47 60 39 160 89 239 95 29 132.4 204 Minerals Carbohydrate, by difference g 17 11.88 12.14 15.56 9.81 8.53 22.84 62.5 23.25 9.32 28.5 Calcium Ca mg 10 20 16 19 24 12 5 74 24 26 7.58 Magnesium, Mg mg 9 10 13 15 10 29 27 92 29 8 31.1 Phosphorus, P mg 11 25 27 17 5 52 22 113 21 16 34.2 Potass mg 156 284 266 79 257 485 358 628 448 138 718 Vitamin C, total ascorbic acid mg 27.7 183.5 1 14.3 61.8 10 8.7 3.5 13.7 53 69.7 Folate, total mcg 14 14 14 0 38 58 20 Folate, food mcg 14 14 14 0 38 58 20 Folate, DFE mcg_ DFE 14 14 14 0 38 58 20 14 24 11 - Vitamin B-12 mcg 0 0 0 0 0 0 0 0 0 0 - Vitamin A, IU IU 765 624 1528 3 1094 146 64 30 110 22 - Vitamin A, RAE mcg_ RAE 38 31 76 0 55 7 3 2 5 1 - ium, K Vitamins 205 Others Carotene, beta mcg 445 374 0 0 276 62 26 Carotene, alpha mcg 17 0 0 0 0 24 25 Cryptoxanthin, beta mcg 0 0 0 0 761 28 0 Lycop mcg 0 5204 0 0 0 0 0 mcg 0 0 0 0 75 271 22 ene Lutein + zeaxanthin Adopted from USDA National Nutrient Database for Standard Reference, Release 16-1 (March 2004) 206


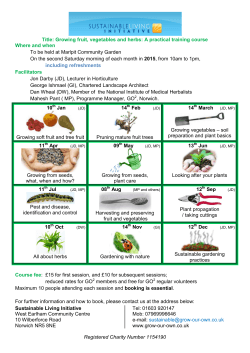

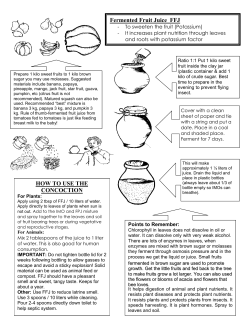


© Copyright 2026