
The Value of Online Medication Rating Systems to
The Value of Online Medication Rating Systems to Older Adults and Their
Association with Self-Reported Outcomes
A Dissertation
Presented for
The Graduate Studies Council
The University of Tennessee
Health Science Center
In Partial Fulfillment
Of the Requirements for the Degree
Doctor of Philosophy
From The University of Tennessee
By
Yazed Sulaiman AlRuthia
May 2015
Copyright © 2015 by Yazed Sulaiman AlRuthia.
All rights reserved.
ii
DEDICATION
This dissertation is dedicated to my parents, Sulaiman Al-Ruthia and Mona AlAmari, who always believed in me and helped me believe more in myself. I also dedicate
this dissertation to my wife, Nuha Al-Jadeed whose encouragement has meant so much to
me during the pursuit of my graduate degree. Without their love, patience, and support
this process would have been harder, longer, and very lonely. Thank you so much for
travelling along this dissertation journey with me.
iii
ACKNOWLEDGEMENTS
First, I would like to thank my research adviser, Dr. Song Hee Hong for his support
and help throughout this dissertation process. I would also like to thank my other
committee members Drs. Carolyn Graff, David Solomon, Mehmet Kocak, and Robert
Nolly. Without their help and support, this dissertation would not have been possible.
Finally, I would like to thank Drs. Donald Morisky and Robert Horne for granting me the
permission to use the Morisky Medication Adherence Scale (MMAS-8) ® and the Beliefs
about Medicine Questionnaire (BMQ) ©, respectively.
iv
ABSTRACT
The Internet is a powerful and very popular vehicle for distributing judgment-free
health information to patients. Multiple studies have examined the role of online health
information as well as physician-rating websites in health care. Studies have examined
the value of online drug information for patients and the value of the online drug
information for patients. However, no study has examined the usefulness or value of
online medication rating websites in facilitating physician-patient communication or
participant-reported outcomes. In this study, the value of online medication rating
websites to older adults in facilitating communication with their physicians using a newly
developed tool was assessed. Additionally, the participant-reported outcomes of quality
of life, satisfaction with physician communication, beliefs about medications, and
medication adherence plus the relationship between the older adults’ actual ratings of
their antihypertensive medications and their self-reported outcomes were examined.
Older adults with poor quality of life were more likely to view the online medication
rating websites more favorably than participants who enjoy good quality of life.
Participants who liked to share health decisions with their physicians were also more
likely to have favorable views of the online websites. In addition, older adults with
hypertension, who highly rated their antihypertensive medication regimens, were more
likely to have good physical quality of life, high satisfaction with physician
communication, positive beliefs about medications, and high medication adherence.
Older adults with poor quality of life were more likely to be unsatisfied with their
antihypertensive medications, have multiple comorbidities, limited health literacy, low
satisfaction with their communication with their physicians, take multiple medications,
and were more likely to view online medication rating websites favorably compared to
their counterparts with good quality of life. Online medication rating websites may play
an important role in enhancing physician-patient communication particularly among this
segment of the patient population.
v
TABLE OF CONTENTS
CHAPTER 1. INTRODUCTION .....................................................................................1
1.1
Background ..........................................................................................................1
1.1.1
Online Health Rating Websites ......................................................................3
1.1.2
Medication Rating Websites ..........................................................................4
1.1.3
Why Geriatric Population? ............................................................................5
1.1.4
Physicians’ Communication and Interpersonal Skills ...................................6
1.1.5
Patients’ Quality of Life.................................................................................7
1.1.6
Patients’ Beliefs about Medications...............................................................9
1.1.7
Medication Adherence .................................................................................10
1.1.8
Why Hypertensive Patients? ........................................................................11
1.2
Study Objectives and Research Questions.........................................................12
1.3
Theoretical Framework ......................................................................................13
CHAPTER 2. LITERATURE REVIEW .......................................................................16
2.1
Physician-Patient Communication .....................................................................16
2.1.1
Theoretical Models of Physician-Patient Relationship ................................17
2.1.2
Physicians’ Consultation Styles ...................................................................18
2.1.3
Communication with Older Adults ..............................................................19
2.1.4
Factors Influencing Physician-Patient Communication...............................20
2.2
Linking Patient-Centered Care to Health Outcomes .........................................23
2.3
Assessing the Physician-Patient Relationship ...................................................25
2.4
Health-Related Quality of Life (HRQoL) ..........................................................26
2.4.1
EuroQol-5D (EQ-5D) ..................................................................................26
2.4.2
Rand-36 (SF-36) ..........................................................................................28
2.4.3
Nottingham Health Profile (NHP) ...............................................................28
2.5
Medication Adherence .......................................................................................29
2.6
Beliefs about Medications .................................................................................32
2.7
The Value and Influence of Media Outlets on Patients’ Health Beliefs and
Behavior .............................................................................................................35
2.7.1
Direct to Consumer Advertisement (DTCA) ...............................................35
2.7.2
Online Search for Health Information .........................................................36
CHAPTER 3. METHODOLOGY ..................................................................................41
3.1
Study Design ......................................................................................................41
3.2
Settings and Subjects .........................................................................................41
3.3
Sampling Plan ....................................................................................................41
3.4
Data Collection ..................................................................................................42
3.5
Participant-Reported Outcome Measures ..........................................................42
3.5.1
Older Adults’ Opinions of the Online Medication Rating Websites ...........42
3.5.2
Patient-Centered Practice Attributes ............................................................43
3.5.3
Health-Related Quality of Life ....................................................................44
3.5.4
Patients’ Beliefs about Medications.............................................................44
3.5.5
Medication Adherence .................................................................................45
vi
Older Adults’ Evaluation of Their Antihypertensive Medication
Regimens ......................................................................................................45
3.6
Participants’ Characteristics ..............................................................................46
3.6.1
Sociodemographics ......................................................................................46
3.6.2
Health Decision Sharing Preference ............................................................46
3.6.3
Health Literacy.............................................................................................47
3.6.4
Medical Conditions ......................................................................................47
3.7
Statistical Analysis .............................................................................................48
3.7.1
Sample Size Estimation ...............................................................................48
3.7.2
Descriptive Statistics ....................................................................................48
3.7.3
Assessing PROMEX Reliability ..................................................................48
3.7.4
Principal Component Analysis ....................................................................49
3.7.5
Path Analysis ...............................................................................................49
3.7.6
Regression Analysis .....................................................................................51
3.7.7
The Association between Participants’ Rating of Their Antihypertensive
Medication Regimens and Participant-Reported Outcomes (PROs) ...........52
3.8
Consideration of Human Subjects .....................................................................54
3.5.6
CHAPTER 4. RESULTS .................................................................................................55
4.1
4.2
Study Sample Characteristics ............................................................................55
Item Analysis and Reliability of Patient Reviews of Medication
Experiences (PROMEX)....................................................................................55
4.3
Patient Reviews of Medication Experiences (PROMEX) .................................61
4.4
The Health-Related Quality of Life (HRQoL) ..................................................68
4.4.1
The SF-12v2 Physical Component Summary (PCS-12)..............................68
4.4.2
The SF-12v2 Mental Component Summary (MCS-12)...............................68
4.5
Satisfaction with Physician Communication and Interpersonal Treatment .......73
4.5.1
The Primary Care Assessment Survey-Communication Scale (PCASCommunication) ..........................................................................................73
4.5.2
The PCAS-Interpersonal Treatment Scale ...................................................73
4.6
The General Domains of Beliefs about Medicines Questionnaire (BMQ) ........78
4.6.1
BMQ-Overuse Scale ....................................................................................78
4.6.2
BMQ-Harm Scale ........................................................................................78
4.7
The Hypertensive Study Sample Characteristics ...............................................83
4.8
Medication Adherence Levels among the Hypertensive Sample ......................83
4.9
Participant Rating of Antihypertensive Medication Regimens .........................89
4.10 Pearson Correlation Coefficients between Participant-Reported Outcomes
(PROs) ...............................................................................................................89
4.11 Pearson Correlation Coefficients between the Participant-Specific Ratings
of Antihypertensive Medication Regimens and PROs ....................................101
4.12 Older Adult Participants’ Views of Online Medication Rating Websites and
Their Satisfaction with Physician Communication .........................................101
4.12.1 Path Model for the Association between PROMEX and PCASCommunication ..........................................................................................101
4.12.2 Multiple Linear Regression for the Association between PROMEX and
PCAS-Communication ..............................................................................103
vii
Older Adult Participants’ Satisfaction with Physician Communication and
Overall Rating of Their Antihypertensive Medication Regimens ...................103
4.14 Older Adults’ Views of Online Medication Rating Websites and Their
Quality of Life .................................................................................................108
4.14.1 Path Model for the Association between PROMEX and MCS-12 ............108
4.14.2 Path Model for the Association between PROMEX and PCS-12 .............108
4.14.3 Multiple Linear Regression for the Association between PROMEX and
Both PCS-12 and MCS-12 .........................................................................108
4.15 The Health-Related Quality of Life and the Overall Rating of
Antihypertensive Regimens .............................................................................113
4.15.1 The Association between the MCS-12 and the Overall Rating of
Antihypertensive Regimens .......................................................................113
4.15.2 The Association between the PCS-12 and the Overall Rating of
Antihypertensive Regimens .......................................................................113
4.16 Older Adult Participants’ Views of Online Medication Rating Websites and
Their Beliefs about Medications ......................................................................119
4.16.1 Path Model for the Association between PROMEX and BMQ-Overuse
Scale ...........................................................................................................119
4.16.2 Path Model for the Association between PROMEX and BMQ-Harm
Scale ...........................................................................................................119
4.16.3 Multiple Linear Regression for the Association between PROMEX and
Both BMQ-Overuse and BMQ-Harm ........................................................124
4.17 Beliefs about Medications and the Overall Rating of Antihypertensive
Regimens .........................................................................................................124
4.17.1 The Association between BMQ-Overuse and the Overall Rating of
Antihypertensive Regimens .......................................................................124
4.17.2 The Association between BMQ-Harm and the Overall Rating of
Antihypertensive Regimens .......................................................................124
4.18 Older Adult Participants’ Views of Online Medication Rating Websites and
Adherence to Antihypertensive Medication Regimens ...................................128
4.18.1 Path Model for the Association between PROMEX and Morisky
Medication Adherence Scale (MMAS-8) ..................................................128
4.18.2 Regression Model for the Association between PROMEX and Morisky
Medication Adherence Scale ( MMAS-8) .................................................131
4.19 Medication Adherence and the Overall Rating of Antihypertensive
Regimens .........................................................................................................131
4.20 An Overarching Path Model of the Association between Older Adults’
Views of Online Medication Rating Websites and Participant-Reported
Outcomes .........................................................................................................131
4.13
CHAPTER 5. DISCUSSION ........................................................................................140
5.1
5.2
5.3
5.4
Overview ..........................................................................................................140
Patient Reviews of Medication Experiences (PROMEX) ...............................141
PROMEX and Participant-Reported Outcomes (PROs) .................................141
Participants’ Rating of Their Antihypertensive Medications and ParticipantReported Outcomes (PROs).............................................................................146
viii
5.5
5.6
Limitations .......................................................................................................150
Conclusions ......................................................................................................151
LIST OF REFERENCES ..............................................................................................154
APPENDIX A. QUESTIONNAIRES AND COPYRIGHT PERMISSIONS ...........175
APPENDIX B. INSTITUTIONAL REVIEW BOARD DOCUMENTS ...................190
VITA................................................................................................................................193
ix
LIST OF TABLES
Table 2-1.
Model of treatment decision-making. ..........................................................24
Table 2-2.
Comparison of quality of life instruments. ...................................................27
Table 4-1.
Baseline characteristics of the participants across the senior centers. ..........56
Table 4-2.
Item means, standard deviations, and minimum and maximum scores for
each PROMEX item. ....................................................................................59
Table 4-3.
Pearson correlation coefficients between PROMEX items and p-values. ....60
Table 4-4.
Cronbach coefficient alpha with deleted PROMEX item. ............................62
Table 4-5.
Eigenvalues of the correlation matrix. ..........................................................63
Table 4-6.
Loading of each item of PROMEX on the extracted factor..........................65
Table 4-7.
Patient Reviews of Medication Experiences (PROMEX) scores of
different sociodemographic subgroups (n=298). .........................................66
Table 4-8.
SF-12v2 Physical Component Summary (PCS-12) scores of different
sociodemographic subgroups (n=298). ........................................................69
Table 4-9.
SF-12v2 Mental Component Summary (MCS-12) scores of different
sociodemographic subgroups (n=298). ........................................................71
Table 4-10. Primary Care Assessment Survey (PCAS-Communication) scale
(n=300). ........................................................................................................74
Table 4-11. Primary Care Assessment Survey (PCAS-Interpersonal Treatment) scale
(n=300). ........................................................................................................76
Table 4-12. Beliefs about Medicines Questionnaire-Overuse (BMQ-Overuse) scale
scores of different sociodemographic subgroups (n=297). ..........................79
Table 4-13. Beliefs about Medicines Questionnaire-Harm (BMQ-Harm) scale scores
of different sociodemographic subgroups (n=298). .....................................81
Table 4-14. Baseline characteristics of the hypertensive participants (n=218). ...............84
Table 4-15. Morisky Medication Adherence Scale (MMAS-8) levels among the
hypertensive sample (n=218). ......................................................................86
Table 4-16. Morisky Medication Adherence Scale (MMAS-8) levels across the
hypertensive subgroups. ...............................................................................87
x
Table 4-17. Participants’ evaluations of their antihypertensive medications (n=193). ....90
Table 4-18. Pearson correlation coefficients between the participants’ rated
antihypertensive medication use aspects and their p-values (n=193). .........91
Table 4-19. Antihypertensive medication rating (medication-specific) (n=148). ............92
Table 4-20. Pearson correlation coefficients between the participant-reported
outcomes (PROs) and their p-values (n=298). ...........................................100
Table 4-21. Pearson correlation coefficients between the participant-specific rating
of antihypertensive medication regimens and participant-reported
outcomes (PROs) variables. .......................................................................102
Table 4-22. Path analysis: Standardized direct, indirect, and total effects of the
variables evaluated on PROMEX and PCAS-Communication (n=286). ...105
Table 4-23. Multiple linear regression: The association between PROMEX and
PCAS-Communication (n=286). ................................................................106
Table 4-24. Multiple linear regression: The association between hypertensive
participants’ PCAS-Communication scale scores and overall ratings of
their antihypertensive medication regimens (n=193). ................................107
Table 4-25. Path analysis: Standardized direct, indirect, and total effects of the
variables evaluated on PROMEX and MCS-12 (n=286). ..........................110
Table 4-26. Path analysis: Standardized direct, indirect, and total effects of the
variables evaluated on PROMEX and PCS-12 (n=286). ...........................112
Table 4-27. Multiple linear regression: The association between PROMEX and
HRQoL (MCS-12) (n=286). .......................................................................114
Table 4-28. Multiple linear regression: The association between PROMEX and
HRQoL (PCS-12) (n=286). ........................................................................115
Table 4-29. Multiple linear regression: The association between PROMEX and
HRQoL (PCS-12 and MCS-12) (n=286). ..................................................116
Table 4-30. Multiple linear regression: The association between hypertensive
participants’ MCS-12 scores and overall ratings of their
antihypertensive medication regimens (n=193). ........................................117
Table 4-31. Multiple linear regression: The association between hypertensive
participants’ PCS-12 scores and overall ratings of their antihypertensive
medication regimens (n=193).....................................................................118
xi
Table 4-32. Path analysis: Standardized direct, indirect, and total effects of the
variables evaluated on PROMEX and BMQ-Overuse (n=286). ................121
Table 4-33. Path analysis: Standardized direct, indirect, and total effects of the
variables evaluated on PROMEX and BMQ-Harm (n=286). ....................123
Table 4-34. Multiple linear regression: The association between PROMEX and
BMQ-Overuse and BMQ-Harm (n=286). ..................................................125
Table 4-35. Multiple linear regression: The association between hypertensive
participants’ overall ratings of their antihypertensive medication
regimens and BMQ-Overuse (n=193). .......................................................126
Table 4-36. Multiple linear regression: The association between hypertensive
participants’ overall ratings of their antihypertensive medication
regimens and BMQ-Harm (n=193). ...........................................................127
Table 4-37. Path analysis: Standardized direct, indirect, and total effects of the
variables evaluated on PROMEX and MMAS-8 (n=286). ........................130
Table 4-38. Multiple linear regression: The association between participants’
medication adherence (MMAS-8 Score) and PROMEX (n=286)..............132
Table 4-39. Multiple linear regression: The association between overall ratings of
antihypertensive medication regimens and MMAS-8 score (n=193). ........133
Table 4-40. Standardized direct, indirect, and total effects of the variables evaluated
on PROMEX, PCS-12, MCS-12, BMQ-Harm and BMQ-Overuse, and
PCAS-Communication scales (n=286). .....................................................136
xii
LIST OF FIGURES
Figure 1-1. The potential effect of online reviews of medications on physicianpatient communication. ................................................................................14
Figure 1-2. Factors that may influence patient views of online medication reviews. .....15
Figure 2-1. Factors influencing physician-patient communication. ................................21
Figure 2-2. Factors influencing medication adherence....................................................30
Figure 2-3. Depiction of the self-regulation behavioral model. ......................................33
Figure 2-4.
Staged model of trust. ..................................................................................38
Figure 4-1. Scree plot of the possible number of factors that can be extracted from
the 6-items PROMEX questionnaire. ...........................................................64
Figure 4-2. Antihypertensive medication ratings. ...........................................................93
Figure 4-3. Rating of antihypertensive medications’ effectiveness.................................94
Figure 4-4. Rating of antihypertensive medications’ ease of use. ...................................95
Figure 4-5. Rating of antihypertensive medications’ cost. ..............................................96
Figure 4-6. Rating of antihypertensive medications’ food interactions. .........................97
Figure 4-7. Rating of antihypertensive medications’ side effects. ..................................98
Figure 4-8. Overall rating of antihypertensive medications. ...........................................99
Figure 4-9. Path analysis: Association between PROMEX and PCASCommunication. .........................................................................................104
Figure 4-10. Path analysis: The association between PROMEX and MCS-12. ..............109
Figure 4-11. Path analysis: The association between PROMEX and PCS-12. ...............111
Figure 4-12. Path analysis: The association between PROMEX and BMQ-Overuse. ....120
Figure 4-13. Path analysis: The association between PROMEX and BMQ-Harm. ........122
Figure 4-14. Path analysis: The association between PROMEX and MMAS-8
(adherence). ................................................................................................129
Figure 4-15. Path analysis: The association between PROMEX and PROs. ..................134
xiii
LIST OF ABBREVIATIONS
BMQ
CAD
CHF
COPD
EQ-5D
EQ-VAS
HRQoL
HTN
IBS
MCS-12
MI
MMAS-8
NHP
PCAS
PCS-12
PROs
PROMs
PROMEX
QoL
RX
SF-12
SF-36
Beliefs about Medicines Questionnaire
Coronary Artery Disease
Congestive Heart Failure
Chronic Obstructive Pulmonary Disease
EuroQol Five Dimensions Questionnaire
EuroQol Visual Analogue Scale
Health-Related Quality of Life
Hypertension
Irritable Bowel Syndrome
The 12-Item Mental Component Summary of the Short Form
Health Survey
Myocardial Infarction
The 8-Item Morisky Medication Adherence Scale
Nottingham Health Profile
Primary Care Assessment Survey
The 12-Item Physical Component Summary of the Short Form
Health Survey
Participant-Reported Outcomes
Patient-Reported Outcome Measures
Patient Reviews of Medication Experiences
Quality of Life
Prescription Medication
The 12-Item Short Form Health Survey
The 36-Item Short Form Health Survey
xiv
CHAPTER 1.
1.1
INTRODUCTION
Background
As people age they become more prone to diseases in general and to the chronic
health conditions (i.e., diabetes, hypertension, and osteoporosis) in particular. Thus,
chronic diseases are more prevalent among this segment of the population. Further, an
ever-greater proportion of this population survives with multiple health conditions.
Hence, older adults take a greater number of prescription medications than any other
segments of the population. This makes them more susceptible to adverse drug events
given their diminished physiological reserve (Wasson, 2008). In addition, many studies
have shown a correlation between increasing age and higher adverse drug events (ADEs)
rate. Besides the frailty of the elderly, which makes them more predisposed to the side
effects of the medications, they are usually on multiple prescription medications. Taking
multiple medications increases the likelihood of developing adverse drug reactions or
interactions since the toxicity of any medication can be potentiated by another medication
in the patient’s medication list (i.e., by inhibiting or inducing its metabolism). Therefore,
effective communication between the physicians and their patients can address some of
these issues by changing or removing certain medications from their medication lists, and
by adopting a holistic approach in managing the elderly patients’ health conditions rather
than treating each condition separate from the other (Routledge, O'Mahony, &
Woodhouse, 2004).
Generally speaking, patients want their physicians to inform them about their health
conditions, the treatment options, as well as the safety profile and cost of each medication
if pharmacological options were chosen (Nair et al., 2002). The patients’ desire to learn
about their health conditions, and the available treatment options, suggests they want to
participate in the prescribing decision with their physicians. Involving the patients in the
prescribing decision-making process after providing them with needed information about
treatment options could result in improved patient treatment experience and satisfaction.
It also may result in improved treatment outcomes (Bond, Blenkinsopp, & Raynor, 2012).
This partnership between patients and their physicians regarding the prescribing decision
is even more important among the elderly. Since the elderly are mostly excluded from the
randomized clinical trials that investigate the benefits of preventive medications. These
medications are usually prescribed to treat different chronic diseases, such as
hypercholesterolemia and hypertension, that are prevalent among the elderly population
(Garattini & Chalmers, 2009; Wasson, 2008). Thus, they fail to address important aspects
of drug use from the patients’ perspective (i.e., side effects, drug-food interactions,
medication costs, drug-drug interactions).
Many patients seek information about different drugs that they are taking or will
probably be taking in the future from multiple sources including the Internet. Further,
studies that assessed the quality of medication prescribing among the ambulatory elderly
patients, have indicated many of the prescribed medications were considered
inappropriate (Goulding, 2004; Schmader, Hanlon, Weinberger, & Landsman, 1994).
1
Although medication prescribing appropriateness was assessed among the elderly in
several studies, the patients’ perspective regarding their medications was not taken into
account (Goulding, 2004; Spinewine et al., 2007). Exploring elderly patients’ opinions
about their prescription medications can be useful to explain the variation in the
medication utilization and adherence among this important segment of the population.
This can be attained by asking the patients’ about their level of satisfaction with regard to
important aspects of medication use (i.e., effectiveness, side effects, ease of use, cost, and
drug interactions), and substantiates the need to engage the elderly patients in prescribing
decisions.
Today, many federal and private health institutions provide online educational
information about different medical conditions and their treatments (i.e., Centers for
Disease Control and Prevention, MedlinePlus, Mayoclinic®). However, the information
presented on these websites about the different treatments whether invasive (i.e., surgery)
or non-invasive (i.e., pharmacological) are merely the same information provided in the
medications’ leaflets in layman’s terms. In an era of empowered consumers, many
websites provide the feedback of consumers about different products and services.
Hence, patients in multiple online websites evaluate medications and services provided
by medical professionals. This gives the patients who are looking for physicians in
special practice areas, or are likely to be on a certain medication, the opportunity to view
the evaluations and the overall ratings by other patients who had already seen those
physicians or are/were on that medication. The factors that influence the patients’
opinions of the content and value of these websites have not been investigated. Although
patients with higher socioeconomic status might have a favorable opinion of these
websites, other factors might also influence patient perception. For instance, patients’
quality of life (QOL), a subjective and overarching concept involving multiple
dimensions of the patient’s life could potentially influence the opinion and value of such
websites. Further, in an era of patient-centered care that entails effective communication
between the physicians and their clients (patients), it is worthwhile to examine the
significance of the relationship between patients’ satisfaction with their physicians’
communication style and their opinion of such website. Websites browsing may
encourage and facilitate the patients’ engagement in effective dialogs with their
physicians. Patients’ beliefs about medications could also affect the value of such
websites to patients, since it was found to influence patients’ adherence to their
medications (Horne & Weinman, 1999).
This study examined the relationship between the older adults’ views of online
medication rating websites (i.e., Askapatient.com®, Drugs.com®) and:
1. Important aspects of patient-centered care (i.e. attentive listening, quality
of conversation, respect, and friendliness).
2. Older adults’ quality of life from both the physical and mental
perspectives.
3. Older adults’ beliefs about medications in general.
4. Older adults’ adherence to antihypertensive medications.
2
1.1.1 Online Health Rating Websites
The implementation of public reporting systems in the United States (U.S.) in the
1980s was mainly driven by the need to improve the quality of care provided by
healthcare organizations. These systems generate reports that compare the quality of care
provided by different healthcare practitioners. The New York State Cardiac Surgery
Reporting System (CSRS), Nursing Home Compare, and the German Kinikfuhrer RheinRuhr are examples of such systems (Emmert, Meier, Pisch, & Sander, 2013; Mukamel &
Mushlin, 1998; Mukamel, Weimer, Zwanziger, Gorthy, & Mushlin, 2004; Stevenson,
2006). These systems play a very important role in informing the patients, physicians,
and health policy makers about the quality of care of multiple health institutions and
healthcare providers. Further, these reports intend to encourage patients to participate in
their own care by making informed choices about their healthcare providers, health plans
and services (Faber, Bosch, Wollersheim, Leatherman, & Grol, 2009).
Based on the Public Reporting theory, it is generally assumed that patients make an
effort to learn about a product, such as a medication, before buying it. This applies to
patients who usually search for healthcare services with good quality such as health
insurance plans, physicians, and medications (Emmert, Sander, & Pisch, 2013). The
advent of the Internet provides a great opportunity for health activists and non-profit
consumer protection organizations to design and create information rich websites. These
websites contain a wealth of information about a variety of products including healthcare
services that customers can utilize to make informed choices (Chen & Xie, 2008; Longo
et al., 1997). Nonetheless, these websites along with the public reports provide quality of
care evaluation and comparisons across different health institutions and physicians based
on clinical and scientific criteria and not from patients’ perspective (Emmert, Sander, et
al., 2013).
Websites that evaluate physicians and services from patients’ perspective are
ubiquitous in the Internet. Physicians’ rating websites (i.e., RateMDs®, Healthgrades®)
are examples that have gained popularity among patients who look for physicians with
positive feedbacks from patients. These websites convey important information to both
physicians and patients alike. Patients can easily search for specific physicians near their
residence with the highest rating. Further, physicians can read patients’ reviews and
comments about their practices, and try to improve the quality of provided care (Tara
Lagu , Hannon, Rothberg, & Lindenauer, 2010). However, critics of such websites list
several limitations. First, they do not include all practicing physicians in their databases;
merely including 30% of them at best (Emmert, Maryschok, Eisenreich, & Schöffski,
2009). Secondly, most physician rating websites rely only on few patient reviews with
few physicians rated by more than five patients (Mostaghimi, Crotty, & Landon, 2010).
Thirdly, only a few use validated criteria to evaluate physicians (Reimann & Strech,
2010). Fourth, male physicians, those with board certifications and certain subspecialties
(i.e., primary care, obstetrics and gynecology) are more likely to be rated than other
specialties such as general surgery (Black, Thompson, Saliba, Dawson, & Paradise Black,
2009) and physicians with malpractice claims are likely to be evaluated and rated
negatively (Segal, 2009). Fifth, most contain positive reviews of the listed physicians and
3
rarely contain negative feedbacks of the rated physicians (Kadry, Chu, Kadry, Gammas,
& Macario, 2011). This raises the question of the validity of such reviews since they are
provided by anonymous people and the possibility of fraud cannot be excluded (i.e., some
physicians can write positive reviews of themselves). Sixth, many physicians question the
ability of patients to make sound judgment of their physicians’ quality of care. Most
patients according to some physicians are not knowledgeable about the clinical skills
needed to evaluate the quality of the provided care (Emmert, Sander, Esslinger,
Maryschok, & Schöffski, 2012). Taken together, this limits the usefulness of such
websites (Emmert, Sander, et al., 2013). However, proponents see in such websites that
evaluate not only physicians, but also other healthcare services and products (i.e.,
psychologists, prescription medications, over-the-counter medications and herbal
products) an opportunity to understand patients’ views and preferences. Further, their
availability may offer a channel for patients to express their opinions in an anonymous
and confidential way about the quality of the received care (Trigg, 2011).
Although these websites have several shortcomings and limitations, they can be
addressed by taking measures to improve their content and value. For example, a
minimum number of ratings/reviews for any physician or product should be determined.
Further, the reviews should cover several aspects of care (i.e., satisfaction with the
overall care, description of the physicians’ communication style). In addition, websites
should run security checks to protect reviewers’ privacy. Finally, validated quality
standards should be followed and word filters should be applied to prevent vulgar words
or defamation from being posted (Emmert, Sander, et al., 2013; Segal, 2009).
1.1.2 Medication Rating Websites
Medication rating websites are newly emerged online websites, which have not been
researched or reported in the literature before. The information presented on these
websites are variable and contingent upon the sponsors as well as the affiliations. For
example, the National Library of Medicine provides a useful website
(www.ncbi.nlm.nih.gov/pubmedhealth/) about different medications in terms of their
routes of administration, dosage forms, indications, brand names, side effects, as well as
warnings about drug-drug and drug-food interactions. Further, the major chain
pharmacies in the United States (U.S.) like Walgreens® (www.walgreens.com) and
CVS® (es.cvs.com/drug/overview) provide useful and valid online information about
multiple prescription and over-the-counter (OTC) medications to patients with respect to
several aspects of medication use (i.e., indications, dosages, dosage forms, side effects,
and food and drug interactions). Some health insurance plan websites, such as Cigna®
(www.cigna.com), also offer valid information about different prescription medications
to their enrollees. Although, providing valid and detailed information in layman’s terms
to patients about different medications, they lack, with few exceptions, patient reviews of
the medications. Therefore, several independent websites have recently emerged on the
Internet offering patients the opportunity to rate their medications as well as to view the
opinions of other patients about different medications.
4
Most of these rely heavily on commercial advertisements, and vary in their content
and layout. This can be ascribable to the website administrators or authors, as some are
operated by healthcare practitioners or by professional editorial staff, while consumerreporting agencies manage others. The WebMD® (www.webmd.com) and Drugs.com®
(www.drugs.com) are well-known examples of the professionally operated websites that
include updated scientific information in both layman’s and medical terms about the
medications and the health conditions they are prescribed for. Also included are reviews
and comparisons of different medications prescribed for similar health conditions by
patients in terms of their effectiveness, side effects and patients’ satisfaction. Patients can
rate their medications on a scale from one to five where one means dissatisfied and five
means highly satisfied. Further, they include the prices as well as coupons and patient
assistance programs for prescription medications that patients can refer to in case they are
needed. In addition, some websites include support groups, where patients can ask
questions related to a particular medication that will be answered by a medical expert. On
the other hand, websites like DrugRatingZ® (www.drugratingz.com) and AskaPatient®
(www.askapatient.com) are operated by consumer reporting agencies that merely include
patients’ reviews and ratings of different prescription medications with regard to their
effectiveness, convenience, side effects, and overall value. The main mission of these
websites is to convey to physicians, pharmaceutical industry, and other patients the
opinions of the websites users. However, these websites have limitations similar to the
physicians rating websites. As with the physicians rating websites, these do not include
important information about the reviewers such as sociodemographics, health conditions,
number of medications, and prescriber specialties. These issues need to be addressed to
improve their value to patients. Overall, medication-rating websites may empower
patients to become more engaged in their health care.
1.1.3 Why Geriatric Population?
The growth of the older adult population in the U.S. over the next 50 years is
expected to have a tremendous impact on the health care system. The number of older
adults is projected to reach 55 million by 2020 as baby boomers age (McGinnis, March
2006). According to the Administration on Aging (AoA), the older population (≥65
years) represented 12.9% in 2009, and is expected to reach 19% in 2030 (Administration
on Aging). In addition, more than 90% of older adults have at least one chronic medical
condition, and 77% have multiple chronic conditions. Chronic diseases such hypertension
and diabetes account for 75% of the total U.S. health care expenditure (Schwartz, 2011).
The average number of office visits for older adults in 2012 according to the AoA is 7.1;
which is twice that for adults between 45 and 65 years of age (U.S. Administration on
Aging (AOA), 2012). Further, although seniors (≥65 years) do not represent more than
13% of the US population; they consume approximately 34% of the total number of
prescriptions per year (Control, 2004). This makes their utilization of the healthcare
services higher than any other segments of the population. However, older adults are
underrepresented in clinical trials and observational studies as well as in the clinical
practice guidelines since they are mostly presented with multiple comorbidities that entail
different treatment guidelines (Boult C, 2010; Boyd et al., 2005; Konrat et al., 2012;
5
Lugtenberg, Burgers, Clancy, Westert, & Schneider, 2011). The current elderly
population is more diverse than a decade ago and is likely to be even more diverse in the
next decades. It is projected that older adults of the minority population will increase by
217% by 2030 compared with 81% for Caucasian population (Administration on Aging,
2013).
The fact that many older adults are heterogeneous with regard to socio-demographics,
medical conditions, severity of illness, personal experiences and preferences, and their
quality of life demands flexible approaches in caring for this segment of the population.
In addition, since many of the older adults with multiple comorbidities are on multiple
medications to keep their chronic illnesses under control, they face “preference sensitive”
decisions when their physicians decide to put them on a different medication or add
another one. This comes as a result of their increased awareness of the adverse events as
well as the possible drug interactions when a new medication is introduced in their
medication lists (American Geriatrics Society Expert Panel on the Care of Older Adults
with Multimorbidity, 2012). Further, the challenging task that faces almost every patient
in general and particularly the elderly, is the adherence to their prescription medications.
Medication adherence is more challenging for older adults compared to the younger
populations due to their tendency to forget as well as their long medications lists (E. J.
MacLaughlin et al., 2005). Thus, empowering elderly patients should be one of the
utmost priorities of any physicians in general, and the primary care providers in particular
since they are the gatekeepers in any successful health care system (American Geriatrics
Society: American Geriatrics Society Expert Panel on the Care of Older Adults with
Multimorbidity, 2012). The patients’ empowerment would hopefully make the elderly
patients feel that they are involved in their own care since their participation is pivotal in
the success of any disease management plan (Schwartz, 2011).
1.1.4 Physicians’ Communication and Interpersonal Skills
As the practice of medicine evolved over time, physicians felt that the success of any
disease management plan depends on the patients themselves. Thus, a new principle in
health care known as patient autonomy and patient-centered clinical practice was ushered
in (Chin, 2002; Rodriguez-Osorio & Dominguez-Cherit, 2008). This necessitates that the
current and future physicians be equipped with new skills that enable them to address the
needs of the patients in general and the elderly in particular since elderly patients are
usually presenting with multiple health conditions. Hence, many physicians have started
adopting a patient centered practice model instead of the traditional paternalistic practice
model that prevailed for decades (R. Baker, 1999; American Geriatrics Society Expert
Panel on the Care of Older Adults with Multimorbidity, 2012). This model takes into
consideration the patients’ experiences and insights that are believed to be relevant in the
medical decision-making process (Charles, Gafni, & Whelan, 1997). Understanding the
patients’ needs and concerns will likely have a positive impact on both the clinical
outcomes as well as on the participant-reported outcomes (PROs) (Falkum & Førde,
2001; Roumie et al., 2011).
6
Elderly patients are not different from any other segment of the patient population in
their desire to be involved in their own care. However, elderly patients are heterogeneous
in their medical and personal characteristics. Further, their definition of involvement is
different from the younger patient population who tend to participate more in the decision
making process (Coulter, Parsons, & Askham, 2008). The elderly patients’ definition is
more centered on “receiving information”, “patient-centered approach”, and “caring
relationship” (Bastiaens, Van Royen, Pavlic, Raposo, & Baker, 2007). Therefore,
physicians need to have effective communication techniques in order to initiate
constructive dialogs with their patients that enable them to elicit the patients’ concerns
and needs. Skills like attentive listening, speaking slowly, providing simplified medical
information, being empathic, and making informed decision based on patients’ needs and
preferences are all important attributes of effective communication that physicians should
possess (Duffy, Gordon, Whelan, Cole-Kelly, & Frankel, 2004; Travaline, Ruchinskas, &
D'Alonzo, 2005). Effective communication and interpersonal treatment are integral in
any therapeutic treatment plan, since it does not only address the physical aspect of the
disease, but also addresses the psychological aspect of it (Travaline et al., 2005). Further,
evidence suggests that effective patient-physician communication is correlated with
improved patient health outcomes, lower health-related costs, reduction in the number of
emergency department visits, improvement in the quality of life, medication adherence,
and higher patient satisfaction (Stewart, 1995; Travaline et al., 2005).
However, in the real world many physicians are ineffective communicators, putting
more pressure on patients to initiate constructive dialogs with their physicians that will
ultimately serve both providers and patients. Thus, patients’ empowerment tools such as
educational television (TV) programs, public awareness programs, online patients’
educational websites (i.e., Medline®), and even TV and online drugs ads may encourage
patients to discuss with their physicians the signs and symptoms of certain medical
conditions they may have as well as exploring possible treatment options (Jacob, 2002;
Van Woerkum, 2003). The advent of the Internet has revolutionized the provision of
health information to the public. Today, patients can surf it and find hundreds if not
thousands of health education websites that provide a wealth of information about almost
any known disease. However, little is known about the value of such websites to patients
in general and to elderly patients in particular in improving the patient-physician
communication. Such websites may empower elderly patients who usually play a passive
role when communicating with their physicians.
1.1.5 Patients’ Quality of Life
Patients’ health-related quality of life (HRQoL) is one of the patient-reported
outcome measures (PROMs). Unlike the clinician-reported outcomes (ClinROs) that
measure the effectiveness of the treatment (i.e. Hb1Ac, BP), the PROMs are mostly selfcompleted questionnaires, which can be completed by the patients themselves or by
others on their behalf in structured interviews (Meadows, 2011). Quality of life (Qol) is a
subjective multidimensional concept that involves several domains of life and assesses
the impact of a treatment intervention, health conditions or employment status on the
7
individual’s life from their perspective. The physical, material, social, productive,
emotional and civic well-being are the main domains of life that fall under the quality of
life umbrella (Felce, 1997). This concept can also be concisely defined as “the
satisfaction of an individual’s values, goals and needs through the actualization of their
abilities or lifestyle” (Emerson, 1985, p. 282). Hence, personal satisfaction, life
conditions, and quality of life are inseparably intertwined concepts (Felce & Perry, 1995).
The quality of life is variably defined across and within different groups of the
population. For instance, the elderly people describe their quality of life differently
compared to younger individuals. Multiple factors lead to this variation in the elderly’s
definition of this subjective concept. As people age, they face several physical and
emotional limitations making their life experience very different. Further, due to the
subjectivity of the quality of life concept, elderly people differ in their opinions of their
quality of life even if their health and socioeconomic status are similar. Thus, some
elderly people describe their lives as full of joy and happiness, whereas others feel their
lives are depressing and miserable. The variability in describing quality of life among the
elderly can be ascribable to the way elderly people interpret their losses, personality type,
sets of belief, stress coping strategies, strength of family and social networks, economic
status, health conditions, and functional ability (Wilhelmson, Andersson, Waern, &
Allebeck, 2005; Xavier, Ferraz, Marc, Escosteguy, & Moriguchi, 2003).
Besides the subjective and objective factors considered as determinants of the
individual’s quality of life, other factors might also shape a person’s perception of their
quality of life. In an era of high technology, the Internet transformed many parts of our
lives including the way we communicate with each other (i.e. Email, Facebook®, and
Twitter®). The U.S. is one of the top countries in the world in terms of the number of the
subscribers to Internet services, with a percentage over 70% (Stats, 2012). This was
found to have a significant impact on quality of life (Albarran & Goff, 2000; Cairncross,
2001; DiMaggio, Hargittai, Neuman, & Robinson, 2001). People with weak social ties
and poor communication skills as well as the elderly can expand their acquaintances and
gain a wealth of knowledge through online connection. Further, the use of online forums,
counseling, and news can enhance self-sufficiency, psychological empowerment, and
rehabilitation (Leung, 2010). Also, Internet use among older adults is associated with
lower perceived life stress, improved psychological well-being, self-confidence, and
higher personal satisfaction with social relations including family members and friends
(Leung, 2010; Liang, 2011).
Today, many patients turn to the Internet to share their illness experiences with their
illnesses with other patients through self-created personal blogs. Others use certain
websites that facilitate communication with other patients who have the same health
conditions. Such websites help reduce the feeling of depression and loneliness among
patients in general and those with serious health conditions in particular (Klemm et al.,
2003). However, little is known about the recently developed websites that ask patients to
evaluate and rate their physicians or their treatment regimens and whether they have any
impact on their personal quality of life.
8
Finally, although several studies have investigated the effects of the Internet on the
people’s quality of life, studies that examined the effect of the Internet services on the
quality of life are rare (Liang, 2011).
1.1.6 Patients’ Beliefs about Medications
People vary in their beliefs about medications. Some have negative views of
medications in general regardless of their origin. However, others have positive views of
alternative medicine (i.e. medications from natural origins) and not of western medicine
(i.e. prescription medications). Their views and beliefs about medications are influenced
by multiple factors such as age, gender, race, cultural background, and experience with
taking prescribed medications (Horne et al., 2004). For instance, Asians are more likely
to believe in herbal medicine effectiveness in treating most of the common diseases
compared to people from European descent.
The importance of the patients’ beliefs about medications stems from the fact that the
success of any disease management plan depends largely on the level of patients’
adherence to their treatment regimens. Medications’ adherence is significantly associated
with medication beliefs. Thus, patients with negative views about medications were more
likely to report low adherence levels to their medication regimens compared to those with
positive views (Gatti, Jacobson, Gazmararian, Schmotzer, & Kripalani, 2009). Further,
research has shown that medication beliefs are more powerful predictors of patientreported medication adherence than clinical and sociodemographic factors (Horne &
Weinman, 1999). Medication beliefs affect patients’ adherence to medications prescribed
for many acute and chronic illnesses. Asthmatic, the renally compromised, oncology, and
cardiac patients are some of patient subpopulations in which medication beliefs were
found to affect patient adherence to prescribed medication regimens (Conn, Halterman,
Lynch, & Cabana, 2007; Horne & Weinman, 1999). Patients tend to be more adherent to
their prescribed medication regimens when the perceived necessity of these medications
exceeds their perceived harmfulness (Aikens, Nease, Nau, Klinkman, & Schwenk, 2005).
Further, those with multiple comorbidities and functional limitations are more likely to
believe that the benefits of taking medications to manage their health conditions outweigh
their risks (Schüz et al., 2011). Older adults are more likely to have chronic health
conditions as well as more physical limitations than their younger counterparts are.
Therefore, older age was significantly associated with positive beliefs about medications
(Aikens, Nease, & Klinkman, 2008).
Another important factor that influences patients’ beliefs about medications is the
physicians’ communication style. Patients who were satisfied about their physician’s
communication style held positive views about their own medication regimens and were
more likely to be seen by their physicians for a follow-up visit (Bultman & Svarstad,
2000). Although age, culture, health conditions, and physicians’ communication style
have shown to impact patients’ beliefs about medications, the impact of other important
factors on medication beliefs have not been investigated yet. For example, in an era
where patients can access an immense amount of health information with the click of a
9
mouse, no one knows if the information encountered online would change their beliefs
about medications. Further, it is also unknown if the online-posted reviews and ratings of
medications by patients would influence the physician-patient communication style of
those who browsed such websites.
1.1.7 Medication Adherence
The prescribing of medications is the most common and effective healthcare
intervention. However, even though most of the prescription medications are effective in
managing many health conditions, 30-50% of these medications are not taken as
recommended (Banning, 2009). Medication adherence is a complex and interesting
psycho-behavioral issue which has been defined as “the extent to which the patients’
behavior matches agreed recommendations for the prescriber” (Horne, 2005, p.27).
Multiple factors can influence patient adherence. Patients’ cultural background, social
support, medical status, age, gender, and beliefs about illnesses and medications are some
of these factors that might influence patient’s adherence to prescription medications
(Banning, 2009; Horne & Weinman, 1999). Health and medication beliefs are considered
one of the strongest predictors of medication adherence among patients in general and
those on chronic or multiple medications in particular (Phatak & Thomas, 2006).
Therefore, understanding patients’ beliefs about health and medications is of paramount
significance to address medication non-adherence. Further, low patients’ satisfaction with
their treatment has a negative impact on their adherence to prescription medications
(Sa’ed, Al-Jabi, Sweileh, & Morisky, 2013). In addition, low patients’ health-related
quality of life is another barrier to achieving high medication adherence (Holt, Muntner,
Joyce, Webber, & Krousel-Wood, 2010).
Although medication non-adherence is prevalent among multiple patient populations,
it is an increasing problem among older adults. This can mainly be attributable to
multiple comorbidities that elderly patients usually suffer from as well as the complexity
of their medication regimens. Further, the declining cognitive abilities, dexterity
problems, poor physician-patient communication, and high risk of adverse drug events
are additional factors that can lead to non-adherence and are common among elderly
patients (Macías-Núñez et al., 2008). Thus, the elderly patients are at higher risk of
adverse drug events, medication mismanagement, and poor health outcomes. This is
particularly true in older adults with chronic health conditions such as hypertension and
diabetes that require long-term management (Banning, 2009). For example, it was
estimated that 10% of the unplanned admissions among older adults were related to
adverse drug events (Pearson, Skelly, Wileman, & Masud, 2002). Therefore, managing
poor medication adherence among the elderly patients requires good communication
between the patients and their physicians. Physicians need to form a therapeutic alliance
with their patients whereby patients can share their concerns and beliefs about
medications as well as their treatment preferences (Pound et al., 2005). Unfortunately,
physicians tend to spend less time with the elderly patients despite the fact that they
require additional time for giving and receiving information (Radecki, Kane, Solomon,
Mendenhall, & Beck, 1988). Hence, older adults should be empowered to start
10
constructive conversations with their physicians where they can express their needs and
concerns about the prescription medications as well as their preferences.
Education is power and a key approach in tackling the issue of non-adherence among
patients. Thus, providing patients with information about their health conditions and the
pros and cons of different available treatment options may improve their medications
adherence. It also facilitates partnerships with their physicians in managing their health
conditions (Banning, 2009). Nonetheless, given the short visit length, long medication
lists, and the need to educate and follow up with elderly patients; new and creative ways
of communication between physicians and patients should be developed. In an era of high
technology, the Internet has become one of the new avenues that physicians use to
communicate with their patients. Physician’s communication with their patients through
secure websites can help physicians understand patients’ beliefs and adherence barriers.
Further, physicians can use these websites to assess the patients’ progress and update
their treatment regimens accordingly. Such online interventions had a positive impact on
patients’ medication adherence levels (Linn, Vervloet, van Dijk, Smit, & Van Weert,
2011). However, the use of Internet is not limited to the communication between
physicians and their patients. Many health websites are competing in providing healthrelated information about multiple health services and medications in layman’s term
(Jenkins & Dunn, 2004). These websites differ in their content, design, and affiliations.
Some of these websites provide patients reviews of medical devices, physicians, and
medications (Emmert, Sander, et al., 2013).
Online health information seeking was seen to help patients initiate constructive
dialogs with their physicians, and improve their satisfaction with provided care (Bylund
et al., 2007; Jacob, 2002). However, it is unknown whether the websites that provide
patients’ reviews of medications will enhance patient-physician communication, and
eventually improve patients’ medication adherence levels.
1.1.8 Why Hypertensive Patients?
As people age, they become more susceptible to chronic diseases such as
hypertension and diabetes (Abrass, 1990). Essential hypertension is an asymptomatic
chronic medical condition that is highly prevalent among the older adults especially
among women and minorities. According to the latest report published by the Centers for
Disease Control and Prevention, the prevalence of hypertension among older adults who
are between 65 to 74 years of age approximates 65%, and among those over 75 years
approximates 75% (Hamilton, 2003; Health, United States, 2012: With Special Feature
on Emergency Care). It has been estimated that hypertensive patients are two times more
likely to develop coronary artery diseases, three times more likely to have
cerebrovascular diseases, and 3.5 times more likely to have heart failure at some point in
their life when compared to the non-hypertensive population; and the likelihood of
developing such serious illnesses increases with age (Kannel, 2003). Further, it is
estimated that more than 60% of the older adults with hypertension had an incident of
myocardial infarction, stroke, and/or heart failure (Lloyd-Jones et al., 2009). According
11
to one study, the death rate attributable to hypertension among older adults (≥60 years) is
735 cases per 100,000 people (Mensah, Mendis, Greenland, & MacKay, 2004). Further,
hypertension often represents a management dilemma to cardiovascular specialists
because of the multiple physiological and behavioral factors that eventually determine the
success of any treatment plan (Lionakis, Mendrinos, Sanidas, Favatas, & Georgopoulou,
2012).
Although hypertension is considered a significant risk factor for cardiovascular
diseases, the good news is that it is a modifiable risk factor. Patients who adhere to their
antihypertensive medication regimens, which include both the pharmacological and the
non-pharmacological measures, are likely to bring their blood pressure under control.
Therefore, their risk of developing serious diseases such as myocardial infarction or
stroke in the future will eventually be diminished (Sacco et al., 1997). To reach that goal,
both patient and physician need to have a collaborative agreement where each one of
them understands his/her roles and responsibilities. This agreement should also respect
each party’s expectations and values. Unfortunately, some evidence indicates that
healthcare professionals treat their elderly patients in a condescending and impatient
manner (Harwood, 2007; Nussbaum & Coupland, 2004). Further, physicians seem to
spend less time , provide less information, and often fail to stress the importance of the
non-pharmacological preventive measures (Greene & Adelman, 2001; Harwood, 2007).
Finally, physicians should adopt effective communication strategies to build a
constructive collaborative agreement with their hypertensive patients in order to achieve
the desirable treatment outcomes and prevent future complications.
1.2
Study Objectives and Research Questions
The value and usefulness given to online patients’ ratings of medication websites by
older adults about the process of patient-physician communication (i.e., facilitating the
communication, discussing the content of these websites with their physicians, asking
their physicians to prescribe the top rated medications) can be associated with multiple
factors. Thus, the following were studied:
1. Are the online medication reviews viewed more favorably by those who
are satisfied with their communication with physicians and will the older
adults’ rating of their own treatment regimen influence their satisfaction
with communication with physicians?
2. Do older adults with high quality of life scores have favorable views of the
online medication reviews in comparison to those with lower quality of
life scores and will the rating of their treatment regimens influence their
quality of life?
3. Do older adults with positive beliefs about medications find the online
medication reviews useful in comparison to those with negative beliefs
and will the rating of their treatment regimens influence their medication
beliefs?
12
4. Do older adults’ adherence to their antihypertensive treatment regimen
influence their views of the online medication reviews and do older adults’
rating of their antihypertensive medication regimens influence their
medication adherence and their views of the online reviews of
medications?
1.3
Theoretical Framework
In order to understand how the online medication reviews can affect certain indicators
of health outcomes, such as the quality of life and medication adherence, the Donabedian
model was used to evaluate how these factors are interrelated. The Donabedian model is
a conceptual model proposed by Avedis Donabedian, a physician and health care services
researcher at the University of Michigan, in 1966. The purpose of this model was to
provide a framework to assess the quality of health care services and relate that to the
ultimate outcomes such survival, blood pressure reduction, and A1C improvement
(Donabedian, 1966). According to the Donabedian model, the measurement of the health
care quality should be based on three main components: Structure, Process, and
Outcomes. Each of these components has a direct influence on the next one starting from
the Structure, then the Process, and finally Outcomes (Donabedian, 2005). To apply this
model to the study, physician education and training to communicate effectively and
address the needs and concerns of the elderly patients represents a Structure component.
Whereas, the appropriateness of the diagnosis and prescribing as well as the
communication style and interpersonal aspect of the relationship between the physicians
and their patients which can be influenced by their medical, cultural, and religious beliefs
are Process components. Finally, patient’s satisfaction with care, quality of life, and
medication adherence considered indicators of health status are Outcome components, as
is, patient beliefs about medications since effective communication can influence patient
beliefs about medications and eventually affect patient adherence. However, to know the
value of the online patients’ medications reviews in facilitating patient-physician
communication as well as its relationship with health status indicators; it is believed that
the online patients’ medication reviews can be considered as an intervention directed
towards the Process component (i.e. facilitating the patient-physician
communication)(Friedman et al., 2008) (Figure 1-1). Although, the online reviews of
medications can influence patient-physician communication and indirectly affect
outcomes (i.e. satisfaction with physicians, quality of life, beliefs about medications, and
medication adherence), the same outcomes can also influence patients’ opinions of such
online websites (Figure 1-2).
13
Figure 1-1. The potential effect of online reviews of medications on physicianpatient communication.
Source: Donabedian A, Evaluating the Quality of Medical Care. Milbank Quarterly 2005
December; 83(4): 691-729.
14
Figure 1-2.
Factors that may influence patient views of online medication reviews.
15
CHAPTER 2.
2.1
LITERATURE REVIEW
Physician-Patient Communication
There is a belief that effective communication is both essential and lacking among
physicians (Stein, 2006). A review of physician-patient communication by Persaud
showed only 5% of the clinical consultations provided by physicians to patients were
considered to be friendly or social (Persaud, 2005). Some argue that the deterioration in
the physician-patient relationship or encounter probably came after the infiltration of
corporate interests in the U.S. healthcare system, which resulted in diminished trust
between the physicians and patients (Laugesen & Rice, 2003). Furthermore, the main
reason patients sue their physicians for malpractice is not because of their negligence, but
for the lack of respect and ineffective communication from the physicians’ side
(Levinson, Roter, Mullooly, Dull, & Frankel, 1997). The quality of physicians’
communication skills has been found to be a positive predictor of patient adherence with
medical advice (Robins & Wolf, 1988). Hence, there seems to be a consensus among
physicians and policy makers alike to adopt a patient-centered approach where patients
are involved in their own care as partners with their physicians and not solely as receivers
of care. Bensing (Bensing, 2000) and Mead, Bower, and Hann (Mead, Bower, & Hann,
2002) summarized the basic elements of patient-centered practice as follows:
x
x
x
x
Attending to patients’ psychological and physical needs,
Encouraging patients to disclose their concerns,
Conveying a sense of partnership during the consultation sessions, and
Actively facilitating the involvement of patients in the decision making
process.
Thus, the provision of patient-centered care requires collaboration between all
personal, professional, and organizational levels in healthcare. This can only be achieved
through education and training of physicians that show friendliness and empathy in their
conversations with patients and create a supportive environment and system that rewards
those physicians who foster and provide patient-centered care for patients (Epstein &
Street, 2007; Epstein, Fiscella, Lesser, & Stange, 2010; Epstein & Street, 2011). Hence,
structural changes need to be implemented in the healthcare system to strengthen the
relationship between physicians and patients, and promote the communication between
them in order to make the physician-patient encounter an enjoyable and informative
experience that eventually leads to a constructive partnership between patients and
physicians (Epstein & Street, 2011).
To build that partnership both patients and physicians need to agree on the goals and
tasks of the treatment plan and act upon them. By doing so, they form what is currently
known as a “Working Alliance.” This term has been studied extensively in the last few
decades and it encompasses a wide array of cognitive and emotional factors that need to
be included in this partnership (Boylan & Fontanella, 2009). A good therapeutic working
alliance consists of the following (Bordin, 1979):
16
x
x
x
Agreement on goals,
Assignment of tasks, and
Development of an effective bond between the physicians their patients.
This working alliance between the physicians and patients cannot succeed without a
genuine effort made by the physicians to involve the patients in this partnership.
Engaging patients in their own care is not by any means an easy task and only those with
a good communication style and interpersonal skills can succeed (Brennan, Rivera-Tovar,
Martin, Hepworth, & Makoul, 2010). A sense of connection and mutual understanding
has to exist between the physicians and patients in order to have an effective and
meaningful communication. Otherwise, the physician-patient communication will merely
be an exchange of medical information divorced from the context and complexities of the
patient’s life.
Empathy is regarded by most researchers in the domain of patient-centered care
research as one of the most important interpersonal skills that healthcare professionals
need to learn to effectively communicate with their patients (Boylan & Fontanella, 2009).
It has been variously defined by researchers in the field of psychotherapy; however, what
is common between these definitions is that they all capture the importance of deep
listening and objective understanding of patients’ experiences (Davis, 1994). Empathy in
the physician’s communication with their patients was found to have a positive impact on
overall patient care (Kim, Kaplowitz, & Johnston, 2004; Larson & Yao, 2005). Whereas,
an indifferent physician-patient relationship was found as one of the factors behind poor
medication adherence (Osterberg & Blaschke, 2005). There are other verbal behaviors
known to promote the physician-patient relationship especially among the elderly.
Physicians’ friendliness, attentive listening, and encouraging patients to ask questions are
very important attributes of effective communication (Beck, Daughtridge, & Sloane,
2002; Zachariae et al., 2003).
2.1.1 Theoretical Models of Physician-Patient Relationship
Parsons (1951); a sociologist, provided a description of the physician-patient
relationship. His description was later called “Parsons’ model of sick role and physician’s
role,” whereby sick people are in need of care that is provided to them by specialized
personnel. The specialized personnel are in most cases physicians, and because patients
need that care they must cooperate with their physicians and forgo some of unhealthy
activities, they were used to in order to recover quickly. According to Parsons’ model,
patients regardless of their medical conditions, gender, age, ethnicity, and culture, are
expected to assume the sick role. Parsons also believed physicians should apply their
clinical skills and knowledge for the benefit and welfare of patients and the whole
community and not for their narrow financial interests (Parsons, 1951). However, this
model has received a number of criticisms. The model assumes that the patients will
voluntarily accept the sick role without any objections and will fully cooperate with their
physicians. Further, it assumes a consistent physician-patient relationship whereby
patients from different backgrounds and lifestyles will be treated the same. In addition, it
puts most of the blame on patients who play the sick role for their illnesses. In reality,
17
physicians’ counseling and advice along with their treatment plan are highly important.
Parsons’ model may fit acute illnesses (i.e. measles, appendicitis, malaria); however, it
does not fit chronic medical conditions such as hypertension, hypercholesterolemia, and
diabetes where patients’ participation in the treatment decision is very important (Jeffery,
1979; Macintyre, 1994; Morgan, 2003). Existing models that describe this relationship
fall into one of the following (Charles et al., 1997; Clarke, Hall, & Rosencrance, 2004;
Emanuel & Emanuel, 2000; Morgan, 2003):
x
x
x
x
The Paternalistic (Parsonian) Model: A model in which physicians have
the upper hand over patients when it comes to the decision making process
regarding the treatment plan. Many consider this relationship similar to
one between a parent and child.
The Engineering (Informative or Consumerist) Model: In this model
patients assume the active role, whereby physicians are hired by patients
to relay the medical facts and information requested by the patient and
then implement the treatment decision made by patients after explaining
the variety of treatment options.
Interpretive Model: A contractual model in which both patients and
physicians forge an agreement whereby physicians work with patients as
partners in the decision making process concerning their health and
treatment plan provided that their moral integrity is kept intact. The
principles of autonomy, fidelity, veracity, do no harm, and justice should
form the basic elements in this contractual relationship. Physicians try to
understand patients’ values and behavior and come up with individualized
treatment plans that fit patients’ values and beliefs. This model assumes
that patients usually are not clear about what would be the best diagnostic
tests and/or treatment options for them. For this reason, discussions
between physicians and patients will help patients decide which test or
treatment would fit them best.
Deliberative Model: Instead of trying to understand the patients’ values
and beliefs in order to devise an individualized treatment plan, physicians
explain to patients the different diagnostic and treatment options; try to
persuade the patients about the best options, and finally leave the decision
to patients.
When it comes to clinical reality, none of these models will work all the time
regardless of the medical condition, its urgency, and patients’ backgrounds.
2.1.2 Physicians’ Consultation Styles
x
Physician-Centered Consultation: Represents the paternalistic
(Parsonian) model whereby physicians have the upper hand in their
relationships with their patients. According to this consultation style,
patients should obey and cooperate with physicians in order to reach the
desirable outcome. It focuses on the physical aspects of the disease and
18
x
ignores the feelings and emotions of the patients (Mishler, 1984; Morgan,
2003).
Patient-Centered Consultation: Physicians adopt a less controlling style
and encourage patients to participate in the consultation. Physicians spend
more time listening to patients and paying attention to the patients’
feelings and emotions. This consultation approach can represent either the
interpretive or the deliberative contractual (collaborative) models
(Mishler, 1984; Morgan, 2003).The basic characteristics of this
consultation style can be summarized in the following (Mead & Bower,
2000):
x
x
x
x
x
Biopsychosocial Perspective: Physicians are willing to become
involved in all the difficulties patients are going through and not
just their medical condition.
Patient-as-a-Person: Physicians want to listen and understand
patients’ medical conditions from the patients’ own perspective
and use open-ended interview questions.
Sharing Power and Responsibility: Patients are treated as a
partner in this contractual or collaborative relationship with
physicians; hence, they are encouraged to participate in the
consultation.
Therapeutic Alliance: Patients should be involved in the
treatment decisions.
Physician-as-a-Person: Physicians are human beings and not
machines so they should recognize and respond to patients’ cues.
2.1.3 Communication with Older Adults
Older adults mostly desire more information about their medical conditions and
medications from their physicians, however, research has shown that they receive less
information than younger patients (Beisecker, 1988). This can be partly due to the fact
that older patients tend to communicate less effectively when they sense that physicians
are rushed or uninterested (Robinson, White, & Houchins, 2006). This becomes more
complicated when it is known that the average consultation time is around six minutes
with the actual length of time between 2 to 20 minutes. This can potentially lead to less
attention paid to the psychosocial aspects of patients’ disease and more attention to its
physical nature. Eventually more medications are prescribed and fewer psychological
problems are identified (Daschle, Domenici, Frist, & Rivlin, 2013; Morgan, 2003).
Older patients revere their physicians and want to spend quality time with them to
understand their health conditions better and verbalize their concerns. Hence they need an
attentive physician who makes them feel they are important (Robinson et al., 2006).
However, one of the most common complaints patients have about physicians is that they
do not listen and frequently interrupt them (Meryn, 1998). Physicians sometimes avoid
listening to patients not just because of the time constraints, but also because they do not
19
want to distress themselves by listening to patients’ concerns and do nothing about them
(Ekdahl, Hellström, Andersson, & Friedrichsen, 2012; Ha & Longnecker, 2010). Older
patients’ non-adherence to physicians’ advice and prescribed treatment can be greatly
reduced by attentively listening and reducing the amount of distractions (Dreher, 2001).
Besides the attentive listening, older patients appreciate the medical advice and
information conveyed to them by physicians. Given the natural aging process that may
involve sensory loss, decline of memory, and impaired hearing, physicians need to
simplify their language by avoiding medical jargon and by talking slowly and loudly
(Howard, Jacobson, & Kripalani, 2013; Robinson et al., 2006).
2.1.4 Factors Influencing Physician-Patient Communication
Factors that can influence physician-patient communication are numerous, but little
has been published about the potential factors that can be summarized into four domains:
patient communication style, sociodemographic factors, health-related factors, and
physician communication style (Morgan, 2003; Street Jr, Gordon, & Haidet, 2007; Strull,
Lo, & Charles, 1984) (Figure 2-1). Each of these domains has the potential to shape the
communication between physicians and patients.
2.1.4.1 Patient Communication Style
This domain covers how much information patients want to receive from and discuss
with physicians about their medical conditions, their willingness to share and express
their concerns and feelings, and their decision-making preference. Patients with negative
beliefs about healthcare (i.e., distrust in modern medicine or fear of the healthcare
system) have a different communication style than those with positive beliefs (Ha &
Longnecker, 2010). For example, patients with positive views of healthcare tend to be
more inquisitive and open (i.e., ask questions, assertive about getting answers, and
express their fears and concerns to their physicians) than those with negative views of
healthcare. Therefore, patients with positive are more likely to receive supportive,
informative, and accommodating care (Ha & Longnecker, 2010; Street Jr et al., 2007).
Further, patients’ preference towards the decision making process (i.e., whether they like
their physicians to make the decision on their behalf, have a shared decision, or make the
decision themselves) is another important factor that influences patients’ communication
style. Patients’ preferences are dependent on factors that fall under the other domains
such as health literacy, education, and age (Schneider et al., 2006).
2.1.4.2 Patient Sociodemographic Factors
Researchers have shown that as patients age, they become less interested in
participating in the health decision-making as well as less inclined to engage in effective
communication with their physicians (Garfield, Smith, Francis, & Chalmers, 2007;
20
Figure 2-1.
Factors influencing physician-patient communication.
Source: Reprinted from Social Science and Medicine, 65(3), Street Jr, Gordon & Haidet,
Physicians' communication and perceptions of patients: is it how they look, how they talk,
or is it just the doctor?/Figure 1, 586-598, 2007 Jan, with permission from Elsevier.
21
Morgan, 2003; Robinson et al., 2006; Schneider et al., 2006). Paradoxically, one study
found that older patients are more likely to be satisfied with the care provided (Carlin,
Christianson, Keenan, & Finch, 2012). Patients of high educational and social status were
more likely to engage in the consultation by asking questions and inquiring about other
treatment options in comparison to patients with a lower socioeconomic status (Garfield
et al., 2007; Morgan, 2003; Schneider et al., 2006). However, highly educated patients
were also found to be less satisfied with care compared to patients with a lower
educational status (Carlin et al., 2012). The association between gender and patients’
preference for involvement in the decision-making process is variable (Garfield et al.,
2007). Females are more interested than males in having a participatory role as well as
more satisfied with the care provided (Arora & McHorney, 2000; Carlin et al., 2012;
Levinson, Kao, Kuby, & Thisted, 2005; Nease Jr, 1995). Other studies show no
significant association between gender and patients’ preference for decision sharing with
physicians (Florin, Ehrenberg, & Ehnfors, 2006; McKinstry, 2000). Race is another
potential factor that can play a major role in patient preference for decision sharing with
physicians (Strull et al., 1984). Whites are more likely to believe in patients’ autonomy
than other minorities (Garfield et al., 2007). The role of patients’ insurance status was not
well described, however, patients enrolled in an HMO (Health Maintenance
Organization) were found to request more information from their physicians than patients
with a different type of insurance coverage (Strull et al., 1984). In another study, insured
patients were more likely to be satisfied with the provided care than those who are
uninsured (Carlin et al., 2012).
2.1.4.3 Patient Health Related Factors
Patient disease severity was negatively associated with the desire to have an active
role in both communication and decision sharing with few exceptions (Garfield et al.,
2007). Patients with acute illnesses have been found to seek more information about their
medical conditions from their physicians, but at the same time preferred a passive role
when it comes to decision making (Wilkinson, Khanji, Cotter, Dunne, & O’keeffe, 2008).
Patients with more chronic illnesses report higher satisfaction with the health care
provided and their physicians’ communication style (Carlin et al., 2012). Further, patients
vary in their preference for the decision sharing based on their medical condition. Patients
with heart failure were found to have a passive role in decision-making process, whereas
older patients with serious mental illness were more likely to be involved in the decisionmaking than their younger counterparts (O'Neal et al., 2008; Rodriguez, Appelt, Switzer,
Sonel, & Arnold, 2008). Furthermore, patients with breast, prostate, colorectal, lung,
gynecological and other cancers had a strong desire to be involved in the decisionmaking process regarding their treatment (Bruera, Sweeney, Calder, Palmer, & BenischTolley, 2001; Tariman, Berry, Cochrane, Doorenbos, & Schepp, 2010).
2.1.4.4 Physicians’ Communication Style
Some physicians adopt a physician-centered approach where they control the
direction of the communication during the physician-patient encounter and decide what
22
treatment they deem appropriate with no patient involvement. This model referred to as
the Parsonian or paternalistic model is widely practiced by many physicians. Others
practice patient-centered care, where they listen attentively and involve patients in
treatment decision. In this model, physicians share the treatment decisions with patients
by explaining different treatment options, and letting the patients decide afterwards what
treatment option would be the best for them (Morgan, 2003; F. A. Stevenson, Barry,
Britten, Barber, & Bradley, 2000) (Table 2-1). However, to understand why physicians
choose to practice physician-centered or patient-centered care, one has to consider several
factors that can influence physicians’ communication style. For instance, physicians’
prior experiences with patients may influence the physician communication style along
with gender, cultural background and medical training (Street Jr et al., 2007; Zandbelt,
Smets, Oort, Godfried, & de Haes, 2006; I Gouni-Berthold MD & Berthold, 2012).
2.2
Linking Patient-Centered Care to Health Outcomes
Patient experience with care is increasingly gaining ground to become an integral
element or even one of the important pillars of the quality of healthcare along with
patient safety and clinical effectiveness (Doyle, Lennox, & Bell, 2013). Patient-centered
care has been defined as “the experience (to the extent the informed, individual patient
desires it) of transparency, individualization, recognition, respect, dignity, and choice in
all matters, without exception, related to one’s person, circumstances, and relationships in
health care” (Berwick, 2009, p.560). Currently, there is a sort of consensus among the
advocates of patient-centered care that a good outcome should be defined based on how
meaningful and valuable this outcome will be to patients themselves, not solely to
physicians or policy makers (Guyatt, Montori, Devereaux, Schünemann, & Bhandari,
2004). Since the provision of patient-centered care encourages patients to participate in
the discussion with physicians and get involved in their own care, it should be expected
to see higher adherence, improved quality of life, and better clinical outcomes across a
wide range of medical conditions (Berwick, 2009; Street Jr, Makoul, Arora, & Epstein,
2009). However, past research shows inconsistent findings about the impact of patientcentered care on health outcomes (Lee & Lin, 2010).
In a randomized control study that was conducted more than two decades ago in a
range of settings in the U.S. and included 252 ulcer, hypertension, diabetes, and breast
cancer patients, physician-patient communication was assessed by both audiotaping as
well as questionnaire administration to see if communication style would influence any
clinical parameters or self-reported health status. A positive association was found
between an effective physician-patient communication and blood pressure control, blood
glucose level, and self-reported health status (Kaplan, Greenfield, & Ware Jr, 1989).
Another study looked at the prevalence as well as the causes and implications for underuse of opioids medications among 191 veterans who received opioid medications for any
pain. Under-users of opioids were identified using structured assessments that included
detailed questions for the participants on how they use their opioid medications on a daily
basis. Those who took less than the prescribed daily dose or reported having a pain that
impaired their ability to function normally were considered under-users. Non-adherence
23
Table 2-1.
Analytical
Stages
Information
Exchange
Model of treatment decision-making.
Flow
Paternalistic
(Intermediate)
One way (largely)
Shared
(Intermediate)
Two way
Direction Doctor → Patient
Doctor ↔ Patient
Type
Medical
Amount
Minimum legally
required
Medical and
Personal
All relevant for
decision-making
Informed
One way
(largely)
Doctor →
Patient
All relevant
for decisionmaking
Deliberation
Doctor alone or
with other doctors
Doctor and patient
(plus potential
others)
Patient (plus
potential
others)
Deciding on
treatment to
implement
Doctors
Doctor and patient
Patient
Source: Reprinted from Sociology as applied to medicine (5th ed., p. 58), Scambler, G.,
& Myfanwy, M., Models of treatment decision-making in a doctor–patient dyad/ Table
4.3, 49-65, 2003, with permission from Elsevier.
24
to the prescribed opioids was not different from the non-adherence to any other
medication regimens and was largely due to poor communication between patients and
physicians (Lewis, Combs, & Trafton, 2010). The provision of patient-centered care was
associated with improved medication adherence among patients with breast cancer (Lee
& Lin, 2010). However, some studies have shown no association between patient
experiences with care and health outcomes. In a large, multicenter, cross sectional study
designed to investigate the relationship between clinical performance and patient
experiences among adult patients (18-64 years) with continuous enrollment in one of five
participating health plans in Massachusetts for at least a year, no association was found
between patient experiences and clinical outcomes such as blood pressure, HbA1c, and
LDL cholesterol level (Odigie & Marshall, 2008). In another cross sectional study
conducted in the United Kingdom, the relationship between older patients’ (≥ 65 years)
assessment of primary care and the control of hypertension as well as vaccination against
influenza was investigated. No significant association between the older patients’
assessment of primary care and the aforementioned quality of care measures was found
(Rao, Clarke, Sanderson, & Hammersley, 2006). All in all, although some studies failed
to show a significant association between patient-centered care and health outcomes, the
preponderance of evidence supports a significant association between them (Doyle et al.,
2013).
2.3
Assessing the Physician-Patient Relationship
The patient-physician relationship or encounter has been assessed using different
methods including qualitatively by audiotaping or videotaping the physician-patient
communication during patient visits. Recordings were analyzed using professional coders
as well as several software systems to find repetitive themes than can be linked to certain
communication styles (Hall, Roter, & Katz, 1988; Levinson et al., 1997). The physicianpatient relationship has also been assessed by both audiotaping patient-physician
encounter and then scoring the encounter using a patient-centered communication score
tool (Oates, Weston, & Jordan, 2000). Today, a myriad of self-administered
questionnaires have been developed and validated across multiple patient populations.
These questionnaires report the fulfillment of patients’ expectations, needs, and wishes
based on past physician-patient encounters. The Patient-Doctor Relationship
Questionnaire [PDRQ-9], Health Care Relationship [HCR] Trust Scale, and Consultation
and Relational Empathy [CARE] measure are a few examples of questionnaires used in
the primary healthcare field (Eveleigh et al., 2012). These instruments address different
important attributes of the physician-patient relationship such as patient-centeredness,
interpersonal communication, cultural sensitivity, and respectfulness. However, some
instruments were found to be more comprehensive in addressing these attributes of
primary care in comparison to other instruments. The Primary Care Assessment Survey
(PCAS) and the Primary Care Assessment Tool (PCAT) are two validated instruments
with good coverage of the primary health care attributes. Both are available in the public
domain (Lévesque et al., 2012).
25
2.4
Health-Related Quality of Life (HRQoL)
In an era of patient-centered outcomes, patients’ quality of life has become a more
important outcome measure than proxy clinical parameters such as blood-pressure
measurements, blood-glucose levels (Carr & Higginson, 2001). The provision of patientcentered care is expected to improve the quality of life by increasing patients’
independence (Poochikian-Sarkissian, Sidani, Ferguson-Pare, & Doran, 2009). However,
there is no consensus on the definition of patients’ quality of life. It has been defined as
“the extent to which hopes and ambitions are matched by experience”(Calman, 1984,
p.124). Further, it has also been defined as the “individuals’ perceptions of their position
in life taken in the context of the culture and value systems where they live and in
relation to their goals, expectations, standards, and concerns” (Orley, Kuyken, & de la
Santé, 1994, p.290). However, some lean towards defining the patients’ quality of life as
the patients’ assessment of their own functioning against what is considered as being
ideal functioning level (Carr & Higginson, 2001; Cella & Tulsky, 1990).
Elderliness is a starkly different and variable experience for each patient. Some
elderly patients view this stage of their life as a relaxing and enjoyable experience;
however, others describe it as a bad experience (Xavier et al., 2003). In a study that
investigated the important items influencing elderly patients perception of the quality of
life, 141 elderly patients were randomly selected, and interviewed in person using an
open-ended interview structure. The study concluded that patients’ social relations,
functional ability and activities are the three most important items that influence elderly
patients’ quality of life as much as their health status (Wilhelmson et al., 2005).
For several generations, the dominant theory in economics and social research that
describes people’s quality of life is utilitarianism. According to this theory, quality of life
involves the satisfaction of individuals’ desires and preferences (Cobb, 2000; Torrance &
Drummond, 2005). There are many quality of life measurement questionnaires, but the
most important fact to ponder is these instruments are only considered proxies or indirect
indicators of quality of life. These instruments can never be treated as direct indicators of
quality of life simply because people cannot observe their happiness or satisfaction
directly. For example, people may report that they desire having something; however,
when they have the means to get it, they get something else (Cobb, 2000). These
instruments vary in their coverage of the quality life attributes (Torrance & Drummond,
2005). The EuroQol-5D, SF-36 & 12, and Nottingham health profile (NHP) are three
commonly used and widely validated questionnaires across multiple medical conditions
and have high reliability coefficient (Cronbach’s Alpha >0.7) (Müller-Nordhorn, Roll, &
Willich, 2004; Torrance & Drummond, 2005) (Table 2-2).
2.4.1 EuroQol-5D (EQ-5D)
The EuroQol-5D is a generic instrument for describing and valuing health, which was
developed by a consortium of investigators in Western Europe. It includes five attributes
of quality of life: mobility, self-care, usual activity, pain discomfort, and
26
Table 2-2.
Comparison of quality of life instruments.
Domain
Pain
Energy or tiredness
Sleep
Physical functioning or
mobility
Daily living activities
Social interactions
Leisure activities
Work
Emotional wellbeing
Dependence or independence
QoL Questionnaires
SF-36 & SFEuroQol (EQ12
5D)
Yes
Yes
Yes
Not Covered
Not Covered
Not Covered
Yes
Yes
Yes
Yes
Yes
Yes
Not Covered
Yes
Yes
Not Covered
Yes
Not Covered
Yes
Not Covered
NHP
Yes
Yes
Yes
Yes
Yes
Yes
Not
Covered
Not
Covered
Yes
Yes
Source: Coons, Rao, Keininger, & Hays, A Comparative Review of Generic Quality-ofLife instruments. Pharmacoeconomics 2000 Jan; 17(1): 13-35.
27
anxiety/depression. Each attribute has three levels: no problems, some problems, and
extreme problems. This instrument is self-administered and respondents can rate their
overall utility of life on a 0-100 hash-marked vertical visual analog scale (EQ-VAS). The
EQ-5D has been widely used among the general population as well as patient samples
and has been translated into more than 130 different languages (Herdman et al., 2011;
Torrance & Drummond, 2005). However, there is evidence that the EQ-5D can suffer
from a ceiling effect especially when it is used among a general population with minor
medical conditions. Thus, there might be issues with its ability to detect small changes in
health (Bharmal & Thomas III, 2006; Herdman et al., 2011; Huang et al., 2008).
2.4.2 Rand-36 (SF-36)
The Short Form Health Survey (SF-36) also known as, Rand-36 is one of the most
widely used health related quality of life (HRQoL) survey instruments. It consists of 36
items that assess eight concepts in health: physical functioning, role limitations caused by
physical health problems, role limitations caused by emotional problems, social
functioning, emotional well-being, energy/fatigue, and general health perception. These
concepts can be categorized into two component summaries (the Physical Component
Summary [PCS-36] & the Mental Component Summary [MCS-36]). Twenty of 36 items
assess the respondent’s health in the past four weeks. The last item assesses the change in
the perceived health in the last 12 months, and every item is scored on a scale from 0-100
(Hays & Morales, 2001). Owing to the length of time the SF-36 takes an individual to
complete, a new and shorter version of the SF-36 was developed. The SF-12 is a succinct
form of the SF-36 designed to assess the general self-reported health as well as the
limitations in everyday activity owing to physical and mental health in the past four
weeks and has the same two component summary scales (Ware Jr, Kosinski, & Keller,
1996). The SF-12 was shown to be more sensitive to subtle changes in health than the
EQ-5D in a relatively healthy population (Johnson & Pickard, 2000).
2.4.3 Nottingham Health Profile (NHP)
The NHP was developed in the 1970s by a group of researchers in the Department of
Community Health at Nottingham University. The instrument was designed to reflect lay
people’s perception of health as opposed to the medical professional assessment of
patient health. It was created based on a pool of more than 2000 statements collected
from in-person interviews that enabled the researchers to identify key concepts.
Researchers reduced the number of statements to 38 for the first part and seven
statements for the second part. Statements require a ‘Yes’ or ‘No’ response. The first part
assesses perceived or subjective health, and statements fall into six domains: sleep,
physical mobility, energy, pain, emotional reactions and social isolation. The first part is
scored using weighted values, which results in scores ranging from 0 to 100 for each
section. The higher the score on any section, the greater the severity of the perceived
problems in that domain (Coons, Rao, Keininger, & Hays, 2000; Hunt, McEwen, &
McKenna, 1985). The second part focuses on the domains of the daily life, which are
28
mostly affected by health: paid employment, jobs around the house, social life, personal
relationships, sex life, hobbies and interests, and holidays (Hunt et al., 1985). The
developers of the NHP have recommended that the second part should no longer be used
(Bowling, 1991; Coons et al., 2000).
2.5
Medication Adherence
According to the World Health Organization, adherence is defined as “the extent to
which a person’s behavior (i.e., taking medications, following a diet, or making healthy
lifestyle changes) corresponds with agreed upon recommendations from a healthcare
provider” (Sabaté, 2003, p.136). However, medication adherence can also be defined as
the degree to which patients’ or their caregivers’ medications administration behavior
coincides with their physicians’ advice with regard to timing, dosage, and frequency of
administration during the prescribed time window (Osterberg & Blaschke, 2005).
Adherence to prescribed medications is difficult for patients in general and particularly
challenging for elderly. Multiple factors influence the elderly patients’ adherence to their
prescribed treatment regimens. Elderly patients’ sociodemographic (age, race, sex, and
education), medical (comorbidities, number of medications, and treatment of adverse
events), psycho-behavioral (beliefs about medicine, understanding of the medical
condition, and satisfaction with treatment), and economic (type of insurance, copayments and coinsurance) characteristics are potential factors that can influence the
elderly patients’ adherence to their prescribed medications (Gellad, Grenard, & Marcum,
2011; MacLaughlin et al., 2005; Sa’ed et al., 2013) (Figure 2-2).
The relationship between each of these factors and medication adherence is far from
being simple and clear. For instance, older adults are often assumed to have lower
adherence to their prescribed medications compared to younger adults. However, this is
not always the case. Some studies have shown that advanced age (≥65 years) is positively
associated with adherence to prescribed drug regimens (Billups, Malone, & Carter,
2000). In addition, the number of medical conditions, the prescribed medications patients
are receiving and their frequency of administration were positively associated with
medication adherence (Billups et al., 2000; MacLaughlin et al., 2005). Furthermore,
patient satisfaction with care may affect their adherence to medications (Dang,
Westbrook, Black, Rodriguez-Barradas, & Giordano, 2013; Krousel-Wood, Muntner,
Islam, Morisky, & Webber, 2009). Another important aspect of medication use, patients’
satisfaction with their treatment regimens, was studied recently in a sample of patients
with hypertension (HTN), and found to have a positive association with patients’
adherence to their treatment regimens. Patients who were overall satisfied with their
prescribed medications’ effectiveness and convenience were more likely to be adherent to
their treatment regimens (Sa’ed et al., 2013). In addition, health related quality of life
(HRQoL) was also associated with medication adherence. Elderly patients with HTN and
poor HRQoL scores have reported low adherence levels to their antihypertensive
medications (Holt et al., 2010).
29
Figure 2-2.
Factors influencing medication adherence.
Source(s): Gellad, Grenard, & Marcum, A Systematic Review of Barriers to Medication
adherence in the Elderly: Looking Beyond Cost and Regimen Complexity. The American
Journal of Geriatric Pharmacotherapy 2011 Feb; 9(1): 11-23.
MacLaughlin et al, Assessing Medication Adherence in the Elderly: which Tools to Use in
Clinical Practice? Drugs Aging 2005; 22(3):231-255.
Sa’ed, Al-Jabi, Sweileh, Morisky, Relationship of treatment satisfaction to medication
adherence: findings from a cross-sectional survey among hypertensive patients in
Palestine. Health and Quality of life Outcomes 2013 Nov; 11(1):191.
30
The importance of medication adherence stems from the fact that poor medication
adherence has been linked to high healthcare costs in comparison to higher levels of
adherence which were associated with lower healthcare costs. This is particularly true
among patients with chronic medical conditions that can lead to untoward consequences
if left uncontrolled (Pittman, Tao, Chen, & Stettin, 2010; Sokol, McGuigan, Verbrugge,
& Epstein, 2005). HTN is one of the well-known preventable causes of cardiovascular
disease morbidity and mortality. The utilization of antihypertensive medications has been
found to reduce the risk of both coronary heart disease (CHD) and stroke by 34% and
21%, respectively (Mazzaglia et al., 2009). Patients with poor adherence to
antihypertensive medications were at higher risk of all-cause mortality, stroke, and acute
myocardial infarction (Esposti et al., 2011). Only 51% of the U.S. hypertensive
population are considered adherent to their prescribed medications (WHO). Achieving an
acceptable level of adherence (>80%) entails an open and honest relationship between
patients and their physicians.
Medication adherence measures can fall into two different categories: direct and
indirect measurements (Fairman & Matheral, 2000; Farmer, 1999). Direct measurement
of medication adherence can be done through directly measuring the drug concentration
in the patients’ blood stream. It can also be done by observing patients and making sure
that they swallow their pills and documenting that afterwards and by healthcare providers
administering the medication to patients intravenously (IV), or intramuscularly (IM) and
documenting the administration. Although direct measurement of adherence is considered
the most reliable method of measuring adherence, this is impractical, uncommon, and
rarely used. The indirect measurement of adherence are more commonly used and
include medication monitoring (electronic monitoring, pills counts), self-report measures
(diaries, surveys, and interviews), and prescription claims data (length of therapy,
treatment gaps, medication possession ratio [MPR], and days of coverage) (Fairman &
Matheral, 2000; MacLaughlin et al., 2005).
Although there are several methods for measuring medication adherence and each
one of them has its own advantages and limitations, no one measure of the
aforementioned methods is perfect (Fairman & Matheral, 2000). The advantage of selfreport measures over other medication adherence methods is that they provide the reason
for non-adherence from patients’ perspective (Fairman & Matheral, 2000; Lavsa,
Holzworth, & Ansani, 2010). Self-report measures and scales have differing attributes
such as the administration time, reliability, specificity and sensitivity, validity, and their
ability to detect barriers to medication adherence. The new and commonly used selfreport medication adherence scale is the 8-item Morisky Medication Adherence Scale
(MMAS-8). This scale was validated across a wide spectrum of clinical conditions with
both high sensitivity (93%) and specificity (53%) towards detecting those with poor
blood pressure control as well as high reliability (α=0.8) (Lavsa et al., 2010; Morisky,
Ang, Krousel-Wood, & Ward, 2008). The original 4-items of the Morisky Medication
Adherence Scale (MMAS-4) is a validated shorter version of the MMAS-8, but has lower
internal consistency reliability (α=0.61), sensitivity (81%), and specificity (44%) in
patients with HTN (Lavsa et al., 2010). Brief Medication Questionnaire (BMQ), Selfefficacy for Appropriate Medication Use Scale (SEAMS), and Medication Adherence
31
Rating Scale (MARS) are widely used questionnaires that assess medication adherence in
multiple patient populations. The BMQ, SEAMS, and MARS have limited
generalizability and lower reliability in comparison with MMAS-8 (Lavsa et al., 2010).
2.6
Beliefs about Medications
The healthcare delivery in the U.S. and other industrialized countries has been
following the biomedical model for a long time. This model assumes that illness is linked
to diseases that results in disturbances in the physiological functions of the body and are
separate from the psychosocial factors that may affect the disease severity and treatment
outcome (Annandale, 1998; Horne, 2000). However, in reality these factors are crucial in
determining the success of any treatment plan, and without considering them it is highly
unlikely that any disease management strategy would result in favorable outcomes
(Ogden, 2012). Hence, it is important to assess and understand people’s beliefs and
attitudes towards disease and medicine.
The self-regulatory model has been proposed as one of the best health behavior
models to explain the relationship between health beliefs and illness behavior (i.e.,
medication taking behavior). According to this theory, the individual reacts to illness both
cognitively and emotionally (Figure 2-3) (Cameron & Leventhal, 2003). Understanding
patients’ beliefs and concerns about their newly diagnosed disease is important.
However, equally important is patients’ beliefs about the medications that treat these
illnesses especially those medications that are used on a chronic basis (e.g.,
antihypertensives, antihyperlipidemics, and antiasthmatics). Some patients believe that
taking medications to treat their medical conditions takes away their sense of control over
their health. This eventually may affect their expectations of their prescribed medications
which are also influenced by their past experiences (Dolovich et al., 2008).
Many of the published studies on health sociology focus on identifying barriers to
healthcare access. However, fewer studies are investigating the patients’ beliefs and
concerns that may affect their compliance with physicians advice and recommendations
(Horne, 2000). In an era of patient-centered care, patients are expected to take an active
role with physicians in the decision making process (Lee & Lin, 2010). Thus, physicians
need to understand patients’ needs and concerns. This understanding can only be
achieved through physicians’ candid and frank conversations with patients. To help
physicians understand these beliefs and concerns, several qualitative and quantitative
studies have been conducted to identify repeated themes and measure the impact of the
cultural background on patients’ beliefs about medications in general (Britten, 1994;
Horne et al., 2004; Lorish, Richards, & Brown, 1990) as well as about disease-specific
medications (Emilsson et al., 2011; Farmer, Kinmonth, & Sutton, 2006; Lennerling &
Forsberg, 2012; Paraskevi, 2012).
32
Figure 2-3.
Depiction of the self-regulation behavioral model.
Source: Cameron & Leventhal, Anxiety, Cognition, and Responses to Health Threats.
The Self-regulation of Health and Illness Behavior. 2003 Jan; 157-183.
33
Patients’ beliefs about medications are dynamically changing and are potentially
formed based on their past experiences, healthcare delivery system, culture, beliefs
(Dolovich et al., 2008; Phatak & Thomas, 2006). These beliefs are considered by some
health sociologists as a hidden determinant of any treatment outcome (Horne, 1999).
They can be classified under “central themes”, such as people’s perceptions about the
inherent nature of the medications, the likelihood of the medications to do any harm or
benefit, their tendency to cause addiction, and their likelihood to be overprescribed by
physicians (Horne, 2000; Horne et al., 2004). The impact of these factors and other
sociodemographic factors such as age on patient views and beliefs about medications are
variable and controversial. For example, men were found in one study to have more
negative beliefs about medications in general compared to women (Horne et al., 2004). In
another study conducted in Sweden, women expressed negative views about medications
and their harmful effects more than men (Isacson & Bingefors, 2002). With regard to age,
older adults were more likely to have positive views about medications than their
younger counterparts were, and those with lower incomes were more likely to think of
medications as something necessary but evil at the same time than those with higher
incomes were. Patients with HTN considered their antihypertensive medications as
necessary, but evil more than patients with other medical conditions. Patients with a
psychiatric diagnosis had more positive views about medications than any other patient
populations (Isacson & Bingefors, 2002). Cultural background was also found to have a
strong association with medication beliefs. For instance, patients of Asian descent have
expressed negative views about medications more than those of European descent (Horne
et al., 2004). Furthermore, in another study among Japanese patients, negative beliefs
about medications were associated with non-adherence to medications (Iihara et al.,
2004). Patients’ educations were also associated with general beliefs about medications;
those with lower levels of education were more likely to perceive medications as harmful
compared to those with higher levels of education (Horne et al., 2004; Horne et al., 1999;
Isacson & Bingefors, 2002).
Health status also influences patient beliefs about medications. Those with chronic
medical conditions such as hypertension and diabetes have stronger feelings regarding
the necessity of medications than those with acute medical conditions (Horne &
Weinman, 1999). Patients who are currently on prescription medications have more
positive beliefs about medications than those who are not (Ramstrom et al., 2006).
Furthermore, believing in herbal/complementary medicine was associated with negative
views about prescription medications in general. In addition, those who use herbal
medicine have higher likelihood to think that physicians overprescribe (Horne et al.,
2004; Isacson & Bingefors, 2002; Mårdby, Åkerlind, & Jörgensen, 2007). Another
important and interesting factor that was found to influence patient beliefs about
medications is the direct to consumer advertisement (DTCA) (Iosifescu, Halm, McGinn,
Siu, & Federman, 2008). Finally, physicians’ communication style was found to have a
positive impact on patients’ beliefs about medications which in turn resulted in better
adherence to drug regimens (Bultman & Svarstad, 2000). Overall, patient beliefs about
medications was shown to influence treatment outcomes in different patient populations.
Patients who had negative views about medications were found to be less likely to adhere
to their treatment regimens (Gatti et al., 2009; Iihara et al., 2004; Mårdby et al., 2007).
34
Patients’ beliefs and concerns about medications were identified qualitatively in
several studies (Britten, 1994;Conrad, 1985; Lorish et al., 1990). However, to measure
medications beliefs quantitatively Horne, Weinman, and Haskins developed the Beliefs
about Medicines Questionnaire (BMQ) based on extensive qualitative research that
identified common themes in medication beliefs (Horne et al., 1999). The BMQ was
tested for psychometric properties and has been found to be valid and reliable across
multiple chronic medical conditions including but not limited to asthma, cancer, diabetes,
and hypertension. The BMQ has two sections (Horne et al., 1999):
x
x
2.7
The BMQ-Specific, which assesses patients’ beliefs about medications,
prescribed for a particular illness from two aspects. The first aspect is the
necessity of use. The second aspect is concerns about the potential side
effects that patients may experience upon the use of these medications.
The BMQ-General, which assesses the personal views about the
medications in general, and has two 4-items scales. The first scale is the
general-overuse scale, which assesses whether patients feel that physicians
put too much trust in medications and hence overprescribe them. The
second scale is the general-harm scale, which assesses patients’ beliefs
about whether they regard medications in general as inherently harmful
with limited usefulness.
The Value and Influence of Media Outlets on Patients’ Health Beliefs and
Behavior
2.7.1 Direct to Consumer Advertisement (DTCA)
Multiple media outlets (i.e., TV, Internet, newspapers) that advertise as well as
educate the public about the signs and symptoms of different medical conditions and the
medications that treat these conditions surround patients today. This phenomenon, called
direct to consumer advertisement (DTCA), has grown rapidly in the last two decades.
DTCA is currently the most noticeable type of health communication that the public
encounters (Donohue, Cevasco, & Rosenthal, 2007; Rosenthal, Berndt, Donohue, Frank,
& Epstein, 2002).
However, the public is split on DTCA between opponents who claim that it does
nothing but harm, and proponents who believe that DTCA has many advantages that
should not be overlooked. According to the proponents, DTCA informs as well as
educates the public of certain medical conditions that they might have without them
knowing about it. This eventually will encourage people to seek help and talk to their
physicians if they think they have one of the symptoms listed in a medication’s
advertisement, which will in turn strengthen the patient-physician relationship by
empowering patients to open up constructive dialogs with physicians. This would reduce
the healthcare costs by people seeking help earlier before it is too late for medications to
work. On the other hand, opponents of DTCA say that it misinforms patients. Opponents
claim that most pharmaceutical companies advocate for the use of their medications by
35
devoting most of their commercial advertisement time to the benefits of taking their
medications and spend far less time on the possible adverse effects. By doing so,
pharmaceutical companies overemphasize the benefits of their medications and
underestimate the potential risks associated with their use. Another issue that critics have
is the hastiness of the pharmaceutical companies to release their commercial
advertisements of their new medications in the media without giving the post-marketing
surveillance an adequate amount of time to check the safety of the medication on a larger
scale, such as with (Vioxx®, Merck) incident. Opponents also believe that DTCA poses a
real threat to (a) public health through inappropriate prescribing by some physicians who
feel pushed sometimes by patients to prescribe a certain medication for them although
they do not need it, and (b) the economy by exacerbating the rate of rising healthcare
costs (Ventola, 2011).
Minorities and Internet savvy people are more likely to be in favor of DTCA, while
people with higher level of education are more likely to oppose DTCA. Overall, DTCA is
more appealing to many individuals with less power and control given the fact that it
directly reaches the public without being channeled through the healthcare system
(Ceccoli & Klotz, 2013).
2.7.2 Online Search for Health Information
When it comes to the information sought by patients online and not directly presented
to them through DTCA, fewer studies have investigated the impact on patient health
behavior. The development of online health education websites is rapid with the potential
to influence the way patients interact with their physicians (Sciamanna, Clark, Diaz, &
Newton, 2003). It has been claimed that 80% of the U.S. adults and 60% of their
European counterparts use the Internet to seek medical advice (Sillence, Briggs, Harris,
& Fishwick, 2007). Internet use for health-related activities assessed by the 2002 Pew
Internet and American Life Project found that 6 out of 10 Americans have access to the
Internet (Sciamanna et al., 2003).
Unlike the DTCAs that are usually presented to the public in a simple language
format (i.e., story structure), several issues face consumers and patients alike when they
search online for information about a medication or a medical device. Patient health
literacy, the complexity of information or medical jargon, the variability of the content
quality, and the potential for commercial interests to influence the content of the online
information are some examples of issues that face patients when they use the Internet to
look for information about a medical condition or a medication (Winker et al., 2000). In a
systematic meta-analysis of health-related websites evaluations, 70% of studies reported
that the quality of websites was an issue (Sillence et al., 2007). Despite these issues,
many patients turn to the Internet to seek information about health and treatment as well
as support. According to the National Cancer Institute’s Health Information National
Trends Survey, 56.5% of the breast cancer patients visited an online website to learn
more about their clinical condition. They also have reported that the Internet represents
their second source of information after their physicians. Online information was also
36
found to have a positive effect on the physician-patient relationship (Shaw et al., 2007).
In another cross-sectional study, patients who do not have Internet access and felt that
their physicians engaged them in the decision making process were more interested in
using the Internet for health-related activities compared to those who felt that their
physicians engaged them less in the decision making process. On the other hand, no
association was found between having interest to use the Internet for health-related
activities and physician-patient relationship among those who have access to the Internet.
This suggests that once people have access to the Internet they no longer view it as filling
in gaps in their communication with physicians, but as a secondary source of information
after their physicians’ advice (Sciamanna et al., 2003). In another national survey, the
access to reliable online health-related websites has been linked to reduced anxiety, a
feeling of self-efficacy, and reduced utilization of ambulatory healthcare services (Ybarra
& Suman, 2006). Evidence also suggests that online health information may in fact
encourage individuals to seek healthcare (Ybarra & Suman, 2006).
Research has shown that most online health information seekers use a general search
engine (i.e., Yahoo®, Google®) rather than MedlinePlus (Health Information from the
National Library of Medicine). They typically spend about half an hour browsing two to
five websites and afterwards do not remember the website’s name from which they
obtained the information. They usually seek information online to enhance their
knowledge of their medical conditions, help them diagnose a medical condition, and
sometimes verify their physician’s diagnosis and medical advice (Ybarra & Suman,
2006). Minorities have greater interest in using the Internet to seek health information as
well as to check the appropriateness of their medical treatment because they feel the
Internet is relatively race neutral (Sciamanna et al., 2003). Adults who are ≥ 65 years of
age have been found to be the least users of the Internet (Jenkins & Dunn, 2004).
Whereas middle-aged adults were more likely to use the Internet for health-related
information, and 41% of the adolescents have reported changing their health behavior as
result of visiting health educating websites (Ybarra & Suman, 2006).
In a qualitative study that aimed to test how patients trust online health-related
information, 15 white postmenopausal women with at least high school degree were
enrolled in a longitudinal study that was conducted between August 2003 and April 2004
in the United Kingdom. All were keen to learn more about this critical period of their life,
and have reported visiting women’s health websites at least once a week. The theoretical
staged model of trust that was proposed for the study was divided into three phases
(Figure 2-4). In the first phase, each participant attended a two-hour session in an
Internet café for four weeks. During each session, the participants were given an hour to
search the Internet for information related to women’s health, followed by a 50-minute
discussion with a facilitator. In the discussion session, participants were asked about their
current online information sources, their search strategies, trusted and mistrusted
websites, their first impressions, and the revisited websites. In the next phase, the
participants were asked to log their online health search behavior in diaries over the
37
Figure 2-4.
Staged model of trust.
Source: Reprinted from Social Science and Medicine, 64(9), Sillence, Briggs, Harris &
Fishwick, How do Patients Evaluate and Make Use of Online Health Information?/Figure
1, 1853-1862, 2007 Feb, with permission from Elsevier.
38
following 6 months. In the final phase, that followed the second phase by one month, the
participants underwent a structured telephone interview to assess the influence of the
online sources on participants’ relationships with their physicians as well as their level of
involvement in the decision-making process. All discussions were recorded and
transcribed, and then extracts of trust and mistrust were coded. Diaries were analyzed
based on the thematic analysis, and the interviews according to the emergent themes. The
participants reported that the design and feel of the website was one of the deciding
factors on whether they accept or reject a website (i.e., websites with pop-up
advertisements were more likely to be rejected). Furthermore, websites that belong to
credible organizations (i.e., reputable healthcare institutions), and reviewed by experts
were more likely be accepted. The participants also reported that websites that address
most of their questions, have relevant answers, and have information written by laypeople
were likely to be revisited. The online search for health-related information increased the
participants’ feelings of social support, and provided them with an opportunity to explore
alternative treatment options. In addition, the online information was found to influence
the patients’ preference for health decision-making without having any negative effect on
their relationship with their physicians (Sillence et al., 2007). In another study, factors
such as convenience and anonymity of getting information through online health websites
were found to be crucial for consumers who browse such websites. In addition, the
readability of the information presented on the health websites is highly important given
the fact that the average American reads at 8th grade level and 20% of the Americans read
at 5th grade level (Jenkins & Dunn, 2004).
Visiting online health-related websites had a positive impact on the patient adherence
to treatment (Kuppersmith, 2002). It also had several potential benefits with regard to the
physician-patient relationship by helping patients to make informed healthcare decisions,
empowering them to collaborate with their physicians, getting them involved in the
decision-making process, using the time with physicians more efficiently, helping them
find online support groups, and hearing about other patient experiences with the same
medical condition or on similar treatment (Wald, Dube, & Anthony, 2007). However,
patient access to online health-related websites can also have potential disadvantages. In
a study that investigated the role of the Internet on the physician-patient relationship,
90% of the people who visit health-related websites frequently felt that they could
manage their own health issues by themselves, and 82% of them stated that the websites
provided more useful information on new medications and alternative treatment options
than their physicians or pharmacists. The lack of attention to details, the personal touch
that once existed in the physician-patient relationship, and the limited period of time
patients see physicians were cited as the main reasons behind the findings (Erdem &
Harrison-Walker, 2006). Access to the websites by patients may also diminish their trust
in their physicians as well as in the healthcare system creating a real challenge to
physicians to regain their patients’ trust back again (Wald et al., 2007). Also, patients
trust in the websites may lead to self-diagnosis, treatment using over-the-counter
medications, result in misdiagnosis, and inappropriate treatment if incorrect information
was relied on (Erdem & Harrison-Walker, 2006). Furthermore, health-educating websites
may exacerbate socioeconomic health disparities due to the fact that some patients do not
have access to the Internet (Wald et al., 2007).
39
The rapid expansion of online medical information, easier access to online health
information by patients, and heightened consumer expectations has changed the role of
the physician drastically. Physicians today must help patients interpret information they
have gathered, guide them to reliable sources of information, and develop a strategy for
finding and integrating new information. (Kuppersmith, 2002). Today, patients can go
online and search for good physicians (i.e., reading people’s reviews and stars ratings) by
browsing multiple physicians’ rating websites. However, the Internet does not only have
physician evaluation websites, it also has several medication and medical device rating
websites. These websites reflect other patient experiences with medications, treatment
approaches, and medical conditions in general. Assessing and understanding the value of
these websites to patients is important.
40
CHAPTER 3.
3.1
METHODOLOGY
Study Design
The primary purpose of the research study was to explore the value of online ratings
of medications to the elderly population and evaluate if older adults’ views regarding
such online websites providing patient feed-backs of their medications varies with their
sociodemographics, quality of life, beliefs about medication, health literacy, preferences
for involvement in decision making, and medication adherence. The study main goal was
to explore the relevance of such online websites to older adults’ care (i.e., facilitating
physician-patient communication, and encouraging patients to take part in the decisionmaking). Further, participants’ views of such online websites (i.e., do they trust the online
ratings of medications) were also considered. Relevant information thought to impact
older adults’ opinions of such websites including their sociodemographics, health
literacy, medication adherence, preference for involvement in health decision-making,
beliefs about medications, and quality of life were collected using validated
questionnaires. Seven senior centers in the State of Tennessee were visited and older
adults (≥60 years of age) were asked to complete Patient Reviews of Medication
Experiences questionnaire that examines the value of online ratings of medication
websites. Alongside PROMEX, participants were also asked to complete other validated
questionnaires that collected information about factors that may affect the elderly
participants’ opinions of such online websites. Permissions to use these questionnaires
were received prior to the beginning of the study (Appendix A).
3.2
Settings and Subjects
Data were collected in Tennessee at senior centers in Memphis and the surrounding
areas of Arlington, Bartlett, Cordova, and Somerville. Older adults visit these senior
centers to socialize with their peers and spend fun time together. Seniors who met the
following criteria (1) being 60 years of age and older and (2) taking prescription
medications were asked to participate in the study. Further, those who reported having
HTN were asked to complete a second part of the PROMEX questionnaire that assessed
the level of adherence to their antihypertensive medications.
3.3
Sampling Plan
A convenience sample of 300 elderly subjects from the senior centers were recruited.
Both the principal and co-investigator chose this method due to time and resource
limitations. However, we tried to make our sample as representative as possible by
recruiting participants from different locations.
41
3.4
Data Collection
The Senior Centers’ coordinators were contacted at least a week prior to the planned
visit and a date and time was set up. Two research assistants visited the following senior
centers:, the Orange Mound Senior Center, McWherter Senior Center in Memphis,
Frayser-Raleigh Senior Center and Bert Ferguson Community Center in Cordova located
in Memphis; the Bartlett Senior Center in Bartlett, the Somerville Senior Center in
Somerville, and the Senior Citizens Center in Arlington. In reserved private rooms in
these Senior Centers, the survey administrators explained to the seniors that their
participation was voluntary and they could withdraw from the study at any time without
penalty. Further, the first page of the survey explained the purpose of the study, the rights
of the participants and asked participants to sign a consent form before starting the
survey.
The survey consists of two parts: all older adults on prescription medications
regardless of their medical conditions should complete the first part; however, the second
part was completed only participants with HTN should since it includes a medication
adherence questionnaire that measures adherence among those participants. Those who
completed the survey received a $20 Kroger gift card as an appreciation for their
participation. Data collection was started in August 2013 and was completed in
December 2013.
3.5
3.5.1
Participant-Reported Outcome Measures
Older Adults’ Opinions of the Online Medication Rating Websites
A validated measure that surveys individuals about the usefulness of online reviews
of medications by patients did not exist. Therefore, a questionnaire was created to address
important aspects of the online medications rating websites that are important to the older
adults. The Patient Reviews of Medication Experience (PROMEX) questionnaire has two
domains:
I.
II.
The value of such websites in general as well as in facilitating patientphysician communication.
The trustworthiness and the influence of online patients reviews of
medications on the participant’s medication preference.
The first proposed domain consists of four questions with a five-point Likert scale, in
which the first question inquires about the usefulness of such websites in general from the
perspective of older adults. Further, to explore the usefulness of the online patients’
medications reviews, the participants were asked about the likelihood they would
mention it to their physicians/prescribers. The third question inquired about the likelihood
such online reviews would facilitate communication with their physicians. The final
question inquired about the probability that physicians would be upset if the participants
brought up the online reviews.
42
The second proposed domain contains three questions with a Likert scale of five
points. The first question in this domain inquired about the trustworthiness of such
websites to participants. To examine how much older adults trust such websites that show
them medications reviews, we asked them about the likelihood they would provide their
own comments and ratings of their prescribed medications. The final question inquired
about the influence of the online patient reviews of medications on the participants’
medication preference. The total number of questions in both domains is seven with
proposed maximum points of 35 and a minimum of seven. The higher the score, the more
likely older adults believe that these online websites are useful in general as well as in
facilitating their communication with physicians.
Since the PROMEX questionnaire was newly created and recently used, it was
validated using Principal Component Analysis and Varimax Rotation methods to test for
its construct validity. To test for reliability, the internal consistency (Cronbach’s Alpha)
method was used.
3.5.2 Patient-Centered Practice Attributes
The Primary Care Assessment Survey (PCAS) is a validated 51-item, self-report
questionnaire which is designed to operationalize the formal definitions of primary care.
The PCAS measures seven domains of primary care through 11 validated summary
Likert-scaled measures which perform consistently well across population subgroups
defined based on age, sex, education, race, household income, and health status. Each
scale ranges from 0 to 100 with higher scores indicating more of the underlying attribute
(Safran et al., 1998).
The Communication and the Interpersonal Treatment are two validated scales within
the Primary Care Assessment Survey (PCAS) (Safran et al., 1998). Both the
Communication and the Interpersonal Treatment summary scales have excellent
reliability with high Cronbach’s Alpha (0.95) (Nunnally, 2010; Safran et al., 1998). In the
communication scale of the PCAS, participants were asked to rate their physicians on six
important aspects of primary care that are aligned with the Institute of Medicine (IOM)
definition of primary care. These aspects are: the thoroughness of the questions being
asked about their symptoms, attention to what they have to say, explanations provided
about their medical conditions and treatment, instructions about symptoms to report and
when to seek help, advice and help in making decisions about their own care, and finally
whether they leave their Physicians’ offices with unanswered questions (Care,
Donaldson, Yordy, & Vanselow, 1994; Safran et al., 1998). The interpersonal treatment
scale addresses another five aspects of primary care that are also aligned with the IOM
definition of primary care; participants were asked to rate their physicians on the amount
of time spent with them, patience with their questions, friendliness and warmth received,
care and concern, and finally the level of showed respect to them (Safran et al., 1998).
Each of the covered items in both the communication and the interpersonal treatment
scales have six possible answers based on the Likert scale. Each one of them is assigned a
43
value (i.e., Very poor=1, Poor=2, Fair=3, Good=4, Very good=5, Excellent=6; or
Always=1, Almost always=2, A lot of the time=3, Some of the time=4, Almost never=5,
Never=6). The Communication scale has six questions with six possible answers for each
question. The highest possible score of 36, the lowest possible score is six, and the
possible raw score range is 30. The interpersonal treatment scale has five questions with
six possible answers. The highest possible score is 30, the lowest possible score is 5, and
the possible raw score range is 25. The higher the scores of both the PCASCommunication and PCAS-interpersonal treatment scales, the higher the satisfaction of
the respondents of both their physicians’ communication and interpersonal treatment.
3.5.3 Health-Related Quality of Life
Participants’ Health-Related Quality of Life (HRQoL) was measured using the Short
Form Health Survey (SF-12v2). The SF-12v2 is a validated generic questionnaire
(Cronbach’s Alpha>0.7), which assesses the general self-reported health as well as
limitations in everyday activity owing to physical and mental health in the past four
weeks(Ware Jr et al., 1996). It has two component summary scales, the Physical
Component Summary (PCS-12) and the Mental Component Summary (MCS-12) with
higher scores (ranges between 0 to 100) indicating better quality of life (Ware Jr et al.,
1996).
3.5.4 Patients’ Beliefs about Medications
The patients’ beliefs about medications were assessed using the Beliefs about
Medicine Questionnaire (BMQ). The BMQ was developed by Horne in the United
Kingdom and has been validated across multiple health conditions (Horne et al., 1999). It
consists of two sections, one general and one specific. The general section contains eight
statements that can be broken down into two themes. The first theme is the “GeneralHarm”, which comprised beliefs about the intrinsic nature of medications and the extent
to which they are perceived as harmful. The second theme is the “General-Overuse”,
which is comprised of beliefs about the way medications are used and in particular,
whether physicians overprescribe them. The second section consists of ten statements that
can be broken down into two themes. The first theme is the “necessity”, which focuses on
the perceived necessity of the medication to maintain and improve the health. The second
theme is the “concerns”, which focuses on the perceived concerns of the potential adverse
effects of the medications. Respondents can indicate their level of agreement with each
statement on a five-point Likert scale (Horne et al., 1999). Since seniors who were taking
prescribed medications were surveyed about their opinions of the online reviews of
medications, and were not focusing on a certain disease, the general BMQ was used.
44
3.5.5 Medication Adherence
Medication adherence was measured using Morisky Medication Adherence Scale
(MMAS-8) among those who reported having hypertension. The MMAS-8 is a validated
self-report questionnaire that consists of eight questions. An alpha reliability of 0.83 was
computed among 1367 patients who were diagnosed with essential HTN by primary care
providers in an outpatient clinic of a large teaching hospital and was significantly
associated with blood pressure control (p<0.05). The underpinning theory of this
questionnaire was that failure to adhere to treatment regimen could stem from several
factors such as forgetfulness and complexity of the treatment regimen. The MMAS-8
questions were phrased in a way to avoid the “yes-saying” bias, which is usually the
patients’ tendency to give positive answers to healthcare providers. The questions address
patient medication taking behavior but not medication adherence determinants; with a
dichotomous response (yes/no) to 7 out of 8 questions and 5-point Likert response for the
last question. The total scale has a range between zero and eight with higher scores
indicating better adherence. A cutpoint of <6 is used to identify patients with poor
adherence to an antihypertensive treatment regimen with 93% sensitivity and 53%
specificity. Each question was given a score of either zero or one. If the participant
answered questions 1, 2, 3, 4, 6, and 7 with “Yes”, a score of zero was assigned to each
response; and if their answers was “No” a score of one will be assigned to their
responses. However, in question five, if participants answered the question with “Yes”, a
score of one was assigned to their response, and zero if their answer was “No”. In
question eight which has 5-point Likert response scale, a score of one was assigned to
participants’ response if they chose “Never”, 0.75 if “Once in a while”, 0.5 if
“Sometimes”, 0.25 if “Usually”, and 0 if “All the time” was selected. The predictive
validity of this scale has been assessed through association with blood pressure readings,
attitude, social support, coping techniques with stress, knowledge about their medical
condition and treatment, and patients’ satisfaction with the provided care (Krousel-Wood
et al., 2009; Morisky, Ang, KrouselǦWood, & Ward, 2008; Morisky & DiMatteo, 2011).
3.5.6 Older Adults’ Evaluation of Their Antihypertensive Medication Regimens
To further understand the value of PROMEX and examine the association between
participants’ evaluations of their own medications and medication adherence as well as
other participant-reported outcomes (PROs) such as the quality of life, a simulation of
PROMEX was created at the end of survey. We asked the participants who reported
taking medications for HTN to rate their medications on a scale from 1 to 5 on five
different medication use aspects (i.e., effectiveness, side effects, ease of use, cost, and
food interactions) and give an overall rating for each medication. Four medication-rating
tables were provided in case the participant was taking more than one medication for
HTN. A specific score was created for each participant by taking the average of each
participant’s antihypertensive medication regimen ratings for every single medication use
aspect as well as the overall rating. Both the overall rating score of the participants’
antihypertensive medication regimens as well as the specific medication use aspects
rating scores were reported.
45
3.6
Participants’ Characteristics
3.6.1 Sociodemographics
Participants were asked to report their age, gender, race, and years of education,
marital status, and the household member(s) they live with via either filling in the blanks
or checking off the answer that best describes their situation. The participants’ age was
categorized into four groups (i.e., 50-60, 61-70, 71-80, and >80 years of age). Further, the
participants’ mean age ± standard deviation was compared across senior centers. Race
was categorized into four groups (i.e., African Americans, Caucasians, Hispanics, and
Others). Marital status was dichotomized into two groups (i.e., married vs. unmarried)1 .
Education was categorized into three groups based on the number of years spent in school
or higher education (i.e., high school or less, college degree, post-graduate degree).
Living status was dichotomized into two groups (i.e., alone vs. not alone)2.
3.6.2 Health Decision Sharing Preference
Patients’ engagement in their own health care has been associated with both lower
health costs and hospital admissions (Hibbard & Greene, 2013). Research shows patients
in general want to be involved in their health care (Bernabeo & Holmboe, 2013).
However, understanding the factors that influence patients’ decision sharing preference is
still elusive (Légaré & Witteman, 2013). Therefore, many like to describe the patients’
preference for involvement in the health care decision making as patient-specific
(Bernabeo & Holmboe, 2013). Thus, a validated question was included that assessed the
participant’s preference for engagement in their health care (Lawler, 1998). Participants
were asked the following question (Lawler, 1998, p.1549; Ray, 1997):
“What do you prefer for involvement in decisions about your health care? Would you
prefer to:
x
x
x
Keep control in your own hands?
Have an equal partnership with the doctor?
Leave it in the doctor’s hands?”
The health care decision sharing preferences across the different senior centers were
compared. However, to know whether the health decision sharing preference had any
impact on participants’ views of PROMEX, they were categorized into two groups. Even
though response options I and III were distinctly different, they share one thing, a health
decision non-sharing preference. Therefore, they were labeled as a healthcare decision
Unmarried includes all those who reported being widowed, divorced, separated, and single.
Not alone includes all participants who reported living with a spouse, friend, community center, family
members…etc.
1
2
46
non-sharing group. The second group includes those who preferred to have an equal
partnership with their physicians.
3.6.3 Health Literacy
Health literacy is variable among different patient populations and has a significant
impact on several health outcomes such as medication adherence (Kripalani, Gatti, &
Jacobson, 2010; Kutner, Greenberg, & Baer, 2005). Therefore, controlling for this
important variable is crucial in understanding the relationship between any two
participant-reported outcome measures. There are several validated questionnaires that
have been widely used to assess patients’ health literacy level such as the Test of
Functional Health Literacy in Adults (TOFHLA) (Parker, Baker, & Williams, 1995).
However, due to the length of the questionnaires, new and shorter versions of the same
health literacy assessment tools have been developed (Baker, Williams, Parker,
Gazmararian, & Nurss, 1999). Further, health literacy screening questions with high Area
under the Receiver Operating Characteristic (AUROC) have been created and validated
to assess patients’ health literacy with only one question (Wallace, Rogers, Roskos,
Holiday, & Weiss, 2006). Thus, the following question was used “How confident are you
filling out medical forms by yourself?” (Extremely, quite a bit, somewhat, a little bit, or
not at all) with an AUROC of 0.79 (95% CI=0.74 to 0.83) when plotted against the Rapid
Estimate of Adult Literacy in Medicine (REALM). The “somewhat” response was
recommended as the optimal cutoff point to identify participants with limited or marginal
health literacy skills (Chew, Bradley, & Boyko, 2004; Wallace et al., 2006, p.874). Thus,
the respondents were dichotomized into two groups: marginal/limited and good health
literacy.
3.6.4 Medical Conditions
Senior participants were asked to identify diseases they had from a list of more than
14 medical conditions prevalent among the U.S. population in general and among the
U.S. elderly population in particular (Ward, 2013). The list included the following:
1. Hypertension.
2. Angina pectoris or coronary artery disease (CAD).
3. Congestive Heart Failure (CHF).
4. Myocardial infarction or heart attack.
5. Stroke.
6. Asthma, emphysema or COPD (Chronic Obstructive Pulmonary Disease).
7. Diabetes.
8. Arthritis or any kind of rheumatism.
9. Chronic back pain or sciatica.
10. Depression.
11. Gastroesophageal Reflux Disease (i.e. chronic heartburn “GERD) or
ulcers.
47
12. Cancer (other than skin cancer).
13. Sexual dysfunction.
14. Irritable bowel syndrome or indigestion.
Further, the participants were asked to write down the number of prescription
medications that they were currently taking. In addition, those who had HTN were asked
to write down the number of years since they were diagnosed with HTN as well as the
number of medications they were taking.
3.7
Statistical Analysis
3.7.1 Sample Size Estimation
The estimated minimum sample size for a medium effect size at a power=0.80 and
α=0.05 for multiple regression analysis and for eight independent variables based on the
Cohen statistical power analysis method is 107 participants (Cohen, 1992). In addition to
the Cohen statistical power analysis method, the GPOWER software was also used to
estimate the minimum sample size using the same criteria and determined 127
participants were needed for twelve explanatory (i.e., independent) variables (Erdfelder,
Faul, & Buchner, 1996). In this research project, 300 seniors have participated and
completed the survey.
3.7.2 Descriptive Statistics
Frequencies and means were reported for sociodemographic and medical history
variables. Means and standard deviations were reported for continuous variables. For
ordinal and nominal variables, percentages were reported. The comparisons between the
groups were made with the use of a two-sided student’s t-test for continuous data and chisquare test for categorical data. Further, one-way analysis of variance (ANOVA) was
used to test the difference in the means between the different categorical variables
(Tabachnick & Fidell, 2001).
3.7.3 Assessing PROMEX Reliability
The reliability of PROMEX was computed using the Cronbach’s alpha (Seibert et al.,
1999). Cronbach’s alpha is a measure of internal consistency that is commonly used in
questionnaires’ reliability validation (Thorndike & Hagen, 1961). A questionnaire with
Cronbach’s alpha of ≥0.7 is considered to be internally consistent (Cronbach, 1951).
48
3.7.4 Principal Component Analysis
Principal Component Analysis was used to identify the underlying factor structure of
the Patient Reviews of Medication Experiences (PROMEX) questionnaire. Although two
factors or domains have been hypothesized to be the underlying construct of PROMEX,
the Principal Component Analysis was conducted to verify the hypothesis (Suhr, 2005).
An eigenvalue greater than or equal to one along with the results of the scree plot were
used to determine the number of possible factors or domains that can be extracted from
PROMEX. Further, varimax rotation was also used to determine the loading of each
variable on each potential factor (Jolliffe, 2005).
3.7.5 Path Analysis
Wanting to examine the association between different participant-reported outcomes
such as quality of life and medication adherence with the participants’ views of
PROMEX, the running of simple linear regression models where potentially more than
one dependent variable can exist was not possible. Therefore, using path analyses in
which multiple dependent variables can coexist is more plausible. As an extension of
multiple regression (Streiner, 2005). Path models have several advantages over multiple
regression. Firstly, it is a powerful technique in which complex models with multiple
dependent variables as well as chains of influence can coexist may be more plausible in
certain research settings like ours (Streiner, 2005). Secondly, the path analysis approach
is more flexible than the ordinary least square method as the structure of the path models
can be modified to increase the model’s fitness (Nazim & Ahmad, 2014). Thirdly, it
enables one to disentangle complex interrelationships among variables and eventually
identify the most significant pathway in predicting the outcome (i.e., dependent) variable
(Lleras, 2005).
3.7.5.1 The Association between the Older Adults’ Views of the Online Reviews of
Medications and Their Satisfaction with Physician Communication
In order to determine whether the association between participant satisfactions with
their physicians’ communication and their views of the online rating of medications, a
path model based on the evidence based predictors of patients’ satisfaction with
physicians’ quality of care was created. The model created represented the evidence
based sociodemographic and health status predictors of the satisfaction with physicians’
communication. Age, education, marital status, health literacy, comorbidities, race, and
gender are significant predictors of patients satisfactions with physicians (Hall & Dornan,
1990; LaVeist & Nuru-Jeter, 2002; Moy & Bartman, 1995; Tucker & Kelley, 2000).
Then, the association of the Primary Care Assessment Survey (PCAS) the
Communication scale and the participant’s views of the online rating of medications
(PROMEX) was looked at.
49
3.7.5.2 The Association between the Older Adults’ Views of the Online Reviews of
Medications and Their Quality of Life
Any path model that tests the Health related Quality of Life (HRQoL) effect on any
outcome variable, should take into consideration the significant predictors of HRQoL.
Therefore, a path model was tested taking into account the sociodemographic factors,
health status, and interpersonal treatment as well as effective healthcare communication
with participants that were significant predictors of HRQoL (Felce, 1997; Low &
Molzahn, 2007; Odigie & Marshall, 2008; Xavier et al., 2003).
3.7.5.3 The Association between the Older Adults’ Views of the Online Reviews of
Medications and Their Beliefs about Medications
In order to examine the influence of participants’ beliefs about medications on their
views of the online reviews of medications, the evidence-based predictors of participants’
beliefs about medications must be accounted for in a path model. Then, the effect of
beliefs about medications on participants’ views of online rating of medications can be
examined in the same model. Physicians’ communication style, participants’ age, culture
or ethnicity, education, gender, and the number of prescription medications the
participants take on a daily basis are considered significant predictors of participants’
beliefs of medications (Bultman & Svarstad, 2000; Horne et al., 2004; Iihara et al., 2004;
Isacson & Bingefors, 2002; Mårdby et al., 2007).
3.7.5.4 The Association between the Older Adults’ Views of the Online Reviews of
Medications and Their Adherence to Antihypertensive Medications
In order to examine the effect of medication adherence on the participants’ views of
online medication reviews (PROMEX), a path model was constructed based on evidencebased predictors of medication adherence. Age, gender, race, beliefs about medications,
health literacy, satisfaction with physicians’ communication, education, the number of
prescription medications, comorbidities, and overall rating of antihypertensive treatment
regimen were included in the model (Gellad et al., 2011; Krousel-Wood et al., 2009;
Morisky et al., 2008; Sa’ed et al., 2013).
3.7.5.5 The Association between the Older Adults’ Views of the Online Reviews of
Medications and Their Satisfaction with Physicians’ Communication, Beliefs
about medications, and Health-Related Quality of Life
The association between participants’ views of online medication rating websites
(PROMEX) and their satisfaction with physicians’ communication, beliefs about
medications, and health-related quality of life was examined in one model in which most
of the evidence-based predictors for each of the included participant-reported outcomes
were controlled for in this overarching model.
50
In this model, race, gender, marital status, and health literacy were specified as direct
predictors of the participants’ satisfaction with their physicians’ communication, which
was measured by the PCAS-Communication scale (Hall & Dornan, 1990; LaVeist &
Nuru-Jeter, 2002; Moy & Bartman, 1995; Tucker & Kelley, 2000). With regard to
participants’ beliefs about medications, which was measured by the BMQ-general, the
number of prescription medications participants reported taking, participants’ satisfaction
with their physicians’ communication, gender, and race were specified as direct
predictors participants’ beliefs about prescription medications (Horne et al., 2004).
Further, the participants’ health-related quality of life scores measured by the PCS-12 and
MCS-12 of the SF-12v2 were included in the model with the number of chronic health
conditions, age, number of prescription medications, health literacy, marital status, and
education specified as direct predictors of these two health-related quality of life scales
(Felce, 1997; Low & Molzahn, 2007; Odigie & Marshall, 2008; Xavier et al., 2003).
Moreover, even though some variables, which were collected in the study, and may
predict certain participant-reported outcomes, such as health literacy and BMQ-general,
were not specified as direct predictors of these outcomes, these variables were controlled
for indirectly since all of the sociodemographic and medical factors that were collected
from the participants in this study were included in this model.
Finally, the PCS-12, MCS-12, and the health decision sharing preference were
specified as direct predictors of the participants’ views of online medication rating
websites, which was measured by PROMEX. These three variables were specified as
direct predictors of PROMEX for several reasons. The health-related quality of life is a
multidimensional concept that is influenced by an array of factors. Therefore, the
specified predictors of both the PCS-12 and MCS-12 in the model captured most of the
variables, and hence the impact of other variables on PROMEX can be indirectly
examined. In addition, the health decision sharing preference was specified as a direct
predictor of PROMEX since it is participant-specific (Bernabeo & Holmboe, 2013).
3.7.6 Regression Analysis
In addition to the path analysis, multiple linear regression analysis was conducted to
assess the relationship between the perceived value of the online patients’ reviews of
medications by older adults and each of the aforementioned participant-reported
outcomes. The dependent variable of interest was the total score of PROMEX. The
independent variables of interest were the scores of the communication domain of the
PCAS, Mental and Physical Component Summaries (MCS & PCS) of the SF-12v2,
Beliefs about Medicines Questionnaire (BMQ) General Overuse and Harm domains, and
Morisky Medication Adherence Scale (MMAS-8). Other independent variables were age,
gender, race (i.e. African Americans, Caucasians, Hispanic, and others), years of
education, number of chronic medical conditions, number of prescription medications,
and health literacy. The model adequacy was checked through diagnostic tools such as
the normality of the residuals.
51
I.
The Regression Model for the Association between the Older Adults’
Views of the Online Reviews of Medications and Their Satisfaction
with Physician Communication:
PROMEX =βº +β1 (PCAS-Communication) +β2 (Age) + β3 (Comorbidities)
+ β4 (Education) + β5 (Race) + β6 (Health Literacy) + β7 (Gender) + β8
(Gender) + β9 (Marital Status) +ε.
II.
The Regression Model for the Association between the Older Adults’
Views of the Online Reviews of Medications and Their Quality of
Life:
PROMEX =βº +β1 (PCS-12) +β2 (MCS-12) + β3 (PCAS-Communication) +
β4 (Age) + β5 (Comorbidities) + β6 (Education) + β7 (Race) + β8 (Health
Literacy) + β9 (Gender) + β10 (Marital Status) +ε.
III.
The Regression Model for the Association between the Older Adults’
Views of the Online Reviews of Medications and Their Beliefs about
Medications:
PROMEX =βº +β1 (BMQ-Overuse) +β2 (BMQ-Harm) + β3 (PCASCommunication) + β4 (Age) + β5 (Number of Prescription Medications) +
β6 (Education) + β7 (Race) + β8 (Gender) + ε.
IV.
The Regression Model for the Association between the Older Adults’
Views of the Online Reviews of Medications and Their Adherence to
Antihypertensive Medications:
PROMEX =βº +β1 (MMAS-8) +β2 (PCAS-Communication) + β3 (BMQOveruse) + β4 (BMQ-Harm) + β5 (Overall Rating of HTN Medications) +
β6 (Age) + β7 (Comorbidities) + β8 (Race) + β9 (Health Literacy) + β10
(Gender) + β11 (Number of Prescription Medications) + β12 (Marital
Status) + ε.
3.7.7 The Association between Participants’ Rating of Their Antihypertensive
Medication Regimens and Participant-Reported Outcomes (PROs)
Since online rating of medications is an evaluation of patients’ medications
experiences, participants who reported having HTN were asked to complete the Morisky
Medication Adherence Scale (MMAS-8) and rate their antihypertensive medications that
reported taking. Multiple linear regression analyses were done to examine the association
between each participant-reported outcome and participants’ evaluation of their
antihypertensive medications. The dependent variables were the scores of the
communication domain of the PCAS, Mental and Physical Component Summaries (MCS
& PCS) of the SF-12v2, Beliefs about Medicines Questionnaire (BMQ) General Overuse
and Harm domains, and Morisky Medication Adherence Scale (MMAS-8). The main
independent variable of interest was the participant-specific overall rating score of the
52
antihypertensive medication regimen. The other independent variables were age, gender,
race (i.e. African Americans, Caucasians, Hispanic, and others), years of education,
number of chronic medical conditions, number of prescription medications, and health
literacy. All statistical analyses were conducted using SAS® 9.4 (SAS Institute, Inc.,
Cary, NC, USA).
I.
The Regression Model for the Association between the Overall Rating
of Antihypertensive Medication Regimen and Satisfaction with
Physician Communication:
PCAS-Communication =βº + β1 (Overall Rating of HTN Medications) + β2
(Age) + β3 (Comorbidities) + β4 (Education) + β5 (Race) + β6 (Health
Literacy) + β7 (Gender) + β8 (Number of Prescription Medications) + β9
(Marital Status) + ε.
II.
The Regression Model for the Association between the Overall Rating
of Antihypertensive Medication Regimen and the Quality of Life:
i. Regression Model for the Association between the Overall Rating of
Antihypertensive Medication Regimen and the PCS-12:
PCS-12 =βº + β1 (Overall Rating of HTN Medications) + β2 (Age) + β3
(Comorbidities) + β4 (Education) + β5 (Race) + β6 (Health Literacy) + β7
(Gender) + β8 (Number of Prescription Medications) + β9 (Marital Status)
+ ε.
ii. Regression Model for the Association between the Overall Rating of
Antihypertensive Medication Regimen and the MCS-12:
MCS-12 =βº + β1 (Overall Rating of HTN Medications) + β2 (Age) + β3
(Comorbidities) + β4 (Education) + β5 (Race) + β6 (Health Literacy) + β7
(Gender) + β8 (Number of Prescription Medications) + β9 (Marital Status)
+ ε.
III.
The Regression Model for the Association between the Overall Rating
of Antihypertensive Medication Regimen and the Beliefs About
Medication:
i. Regression Model for the Association between the Overall Rating of
Antihypertensive Medication Regimen and the BMQ-Overuse:
BMQ-overuse =βº + β1 (Overall Rating of HTN Medications) + β2 (Age) +
β3 (Comorbidities) + β4 (Education) + β5 (Race) + β6 (Health Literacy) +
β7 (Gender) + β8 (Number of Prescription Medications) + β9 (Marital
Status) + ε.
53
ii. Regression Model for the Association between the Overall Rating of
Antihypertensive Medication Regimen and the BMQ-Harm:
BMQ-Harm =βº + β1 (Overall Rating of HTN Medications) + β2 (Age) + β3
(Comorbidities) + β4 (Education) + β5 (Race) + β6 (Health Literacy) + β7
(Gender) + β8 (Number of Prescription Medications) + β9 (Marital Status)
+ ε.
IV.
The Regression Model for the Association between the Overall Rating
of Antihypertensive Medication Regimen and Medication Adherence:
MMAS-8 =βº + β1 (Overall Rating of HTN Medications) + β2 (Age) + β3
(Comorbidities) + β4 (Education) + β5 (Race) + β6 (Health Literacy) + β7
(Gender) + β8 (Number of Prescription Medications) + β9 (Marital Status)
+ ε.
3.8
Consideration of Human Subjects
The study was granted an expedited status by the institutional review board (IRB) at
the University of Tennessee Health Science Center (Appendix B). Although, it was not
necessary for the participants to sign the consent form since no personal identifiers or
access to medical records was asked for, a cover letter was included that served as
consent form as well as an explanation of the research project. All completed surveys
were securely maintained.
54
CHAPTER 4.
4.1
RESULTS
Study Sample Characteristics
Three hundred participants were recruited for the study from seven senior centers in
and around Memphis, Tennessee. Out of those, 298 participants completed the PROMEX
questionnaire. The number of eligible participants who were aged 60 years and over as
well as reported taking one or more prescription medications was 286 participants. The
participant-reported characteristics are listed in Table 4-1. The mean age of the
participants was 72 years. Seventy-seven percent of the participants were female. Sixtythree percent of the participants were married3. Forty-four percent of the participants
were living alone. Forty-five percent of the participants had a high school degree or less,
about 41% had some college degree, and 13% had a post-graduate degree (i.e., master or
PhD). Seventy-two percent of the participants had good health literacy level based on
their response to the question, “How confident are you filling out medical forms by
yourself?” The majority of the participants (i.e., >80%) reported taking at least two
prescription medications daily. The mean number of diseases that each participant had
from the listed 14 comorbidities common among the elderly was three. Almost 76% of
the study participants reported having hypertension. The self-reported race was 55%
Caucasians/white, 40% African Americans/black, 2% Hispanics, and 3% others4. With
regard to the participants’ preference to share the healthcare decision with their
physicians’, 79.1% preferred to share their decision. The participants’ Short Form Health
Questionnaire (SF-12v2) mental and physical component summaries (MCS-12 & PCS12) scores, Primary Care Assessment Survey (PCAS) communication and interpersonal
treatment scales scores, and Beliefs about Medicine Questionnaire general overuse and
harm domains scores are listed in Table 4-2. The mean scores of the PCS-12 and MCS12 of the SF-12v2 were 45.8 and 52.3, respectively. Further, the mean scores for the
PCAS communication and interpersonal treatment scales were 72.8 and 72.6,
respectively. Finally, the mean scores for both the BMQ-overuse and BMQ-Harm for the
study sample were 12.6 and 9.03, respectively.
4.2
Item Analysis and Reliability of Patient Reviews of Medication Experiences
(PROMEX)
An item analysis was performed on the seven questions of Patient Reviews of
Medication Experiences (PROMEX) questionnaire. The initial Cronbach’s alpha was
0.76. Table 4-2 lists item means, standard deviations, and the minimum and maximum
possible score for each item. Further, the inter-item correlation was examined to
determine items that did not correlate well with one another. Table 4-3 shows that item-7
had a poor inter-item correlation (p≥0.05) with items-1, 4, and 5. In addition, item-7 had
a negative inter-item correlation with the other items on the questionnaire. Thus, item-7
3
4
The unmarried comprised of the single, divorced, widowed, separated …etc.
Others were comprised of Asians and Alaska Natives.
55
Table 4-1.
Baseline characteristics of the participants across the senior centers.
Characteristics
Age-yrs.
(Mean ± SD)
Sex
Female
Male
Marital status
Married
Unmarried
Education
≤High school
(1-12 yrs.)
Some college
degree (13-16 yrs.)
Post-graduate
degree (≥17 yrs.)
Race
Caucasians
African Americans
Hispanics
Others
Health literacy
Good
Marginal/limited
Healthcare
decision sharing
Yes
No
FrayserRaleigh
(n=50)
74.98±8.32
OrangeMound
(n=94)
68.25±25
Senior centers
Bartlett
Bert
Ferguson
(n=48)
(n=21)
73.13±7.76 72.81±7.71 74.21±6.96
37(74%)
13(26%)
75(80.7%)
18(19.4%)
15(62.5%)
9(37.5%)
42(87.5%)
6(12.5%)
20(40%)
30(60%)
24(25.8%)
69(74.2%)
16 (66.7%)
8 (33.3%)
23(46%)
42(44.7%)
19(38%)
Arlington
(n=24)
McWherter Somerville
(n=41)
(n=22)
Total
(n=300)
p-Value
73.63±9.71
72.3±8.58
71.95±8.65
0.001*
18(85.7%)
3(14.3%)
27(65.9%)
14(34.2%)
17(77.3%)
5(22.7%)
231(77.3%)
68(22.7%)
0.100
17(35.4%)
31(64.5%)
10(47.6%)
11(52.4%)
15 (36.6%)
26(63.4%)
8(36.4%)
14(63.6%)
189(63.2%)
110(36.8%)
0.017*
13(54.2%)
21(43.8%)
4(19.1%)
15(36.6%)
18(81.8%)
136(45.3%)
0.014*
43(45.7%)
9(37.5%)
18(37.5%)
11(52.4%)
20(48.8%)
4(18.2%)
124(41.3%)
8(16%)
9(9.6%)
2(8.3%)
9(18.8%)
6(28.6%)
6(14.6%)
0(0%)
40(13.3%)
40(80%)
8(16%)
1(2%)
1(2%)
0(0%)
88(93.6%)
2(2.1%)
4(4.3%)
24(100%)
0(0%)
0(0%)
0(0%)
43(91.5%)
0(0%)
1(2.13%)
3(6.4%)
21(100%)
0(0%)
0(0%)
0(0%)
32(78.1%)
6(14.6%)
2(4.9%)
1(2.4%)
4(18.2%)
18(81.8%)
0(0%)
0(0%)
164(54.9%)
120(40.1%)
6(2.01)
9(3.01%)
<0.001*
42(84%)
8(16%)
62(66%)
32(34%)
0(0%)
0(0%)
41(85.5%)
7(14.6%)
14(66.7%)
7(33.3%)
33(80.5%)
8(19.5%)
8(36.4%)
14(63.6%)
200(72.5%)
76(27.5)
0.001*
43(87.8%)
6(12.2%)
74(78.7%)
20(21.3%)
18(75%)
6(25%)
38(80.8%)
9(19.2%)
18(85.7%)
3(14.3%)
29(72.5%)
11(27.5%)
15(68.2%)
7(31.8%)
235(79.1%)
62(20.9%)
0.450
56
Table 4-1.
Continued.
Characteristics
Stroke
HTN
Angina Pectoris
or CAD
CHF
Myocardial
Infarction (MI)
Asthma,
emphysema or
COPD
Diabetes
Arthritis or any
kind of
rheumatism
Chronic back
pain or sciatica
Depression
Chronic heart
burn
Any cancer
(other than skin
cancer)
Sexual
dysfunction
IBS or stomach
ulcer or
indigestion
Senior centers
Arlington
Bartlett
Bert
(n=24)
(n=48)
Ferguson
(n=21)
1(4.2%)
6(12.5%)
1(4.8%)
24(100%) 34(70.8%) 34(70.8%)
4(16.7%)
2(4.2%)
1(4.8%)
FrayserRaleigh
(n=50)
5(10%)
38(76%)
10(20%)
OrangeMound
(n=94)
5(5.4%)
75(80.7%)
10(10.8%)
6(12%)
7(14%)
5(5.4%)
5(5.4%)
0(0%)
1(4.2%)
3(6.3%)
2(4.2%)
5(10%)
13(13.9%)
4(16.7%)
16(32%)
32(64%)
40(43.01%)
48(51.6%)
12(24%)
McWherter Somerville
(n=41)
(n=22)
Total
(n=300)
p-Value
3(7.3%)
28(68.3%)
4(9.8%)
5(22.7%)
13(59.1%)
3(13.6%)
26(8.7%)
226(75.6%)
34(11.4%)
0.181
0.020*
0.238
1(4.8%)
0(0%)
2(4.9%)
3(7.3%)
2(9.1%)
2(9.1%)
19(6.35%)
20(6.7%)
0.547
0.320
6(12.5%)
2(9.5%)
4(10%)
3(13.6%)
37(12.4%)
0.972
2(8.3%)
13(54.2%)
13(27.1%)
25(52.1%)
1(4.8%)
13(61.9%)
11(26.8%)
22(53.7%)
11(50%)
13(59.1%)
94(31.4%)
166(55.5%)
0.001*
0.834
18(19.4%)
7(29.2%)
17(35.4%)
3(14.3%)
4(9.8%)
7(31.8%)
68(22.7%)
0.076
7(14%)
4(8%)
15(16.1%)
12(12.9%)
2(8.3%)
4(16.7%)
12(25%)
7(14.6%)
2(9.5%)
0(0%)
6(14.6%)
5(12.2%)
3(13.6%)
7(31.8%)
47(15.7%)
39(13.04%)
0.550
0.073
9(18%)
8(8.6%)
8(33.3%)
12(25%)
2(9.5%)
4(9.8%)
3(13.6%)
46(15.4%)
0.024*
3(6%)
7(7.5%)
2(8.3%)
1(2.1%)
2(9.5%)
1(2.4%)
2(9.1%)
18(6.02%)
0.721
10(20%)
12(12.9%)
5(20.8%)
10(20.8%)
2(9.5%)
5(12.2%)
3(13.6%)
47(15.7%)
0.712
57
Table 4-1.
Characteristics
Comorbidity
score
Living status
Alone
Not alone
Number of
prescription
medications
0-1
2-4
5-7
≥8
Continued.
FrayserRaleigh
(n=50)
3.3±2.30
OrangeMound
(n=94)
2.94±1.98
Senior centers
Arlington
Bartlett
Bert
(n=24)
(n=48)
Ferguson
(n=21)
3.21±1.56 3.13±2.03
2.09±1.51
25(50%)
25(50%)
39(42.9%)
52 (57.1%)
4(16.7%)
20(83.3%)
26(54.2%)
22(45.8%)
12(24%)
16(32%)
16(32%)
6(12%)
23(24.5%)
43(45.7%)
22(23.4%)
6(6.4%)
0(0%)
14(58.3%)
7(29.2%)
3(12.5%)
5(10.4%)
19(39.6%)
21(43.8%)
3(6.3%)
McWherter Somerville
(n=41)
(n=22)
Total
(n=300)
p-Value
2.47±1.96
3.50±2.87
2.97±2.07
0.162
9(42.9)
12(57.1%)
20(50%)
20(50%)
9(40.9%)
13(59.1%)
132(44.6%)
164(55.4%)
0.098
3(14.3%)
15(71.4%)
3(14.3%)
3(6.3%)
8(19.5%)
20(48.8%)
10(24.39%)
3(7.3%)
4(18.2%)
9(40.9%)
5(22.7%)
4(18.2%)
55(18.3%)
136(45.3%)
84(28%)
25(8.3%)
0.047*
Notes: Unmarried= single, divorced, widowed, and separated. Others = Asians and Alaska Natives. (*)=p-value below 0.05. Not alone
includes all participants who reported living with a spouse, friend, community center, family members…etc.
58
Table 4-2.
Item means, standard deviations, and minimum and maximum
scores for each PROMEX item.
Item
How trustworthy do you find PROMEX?
(Item-1)
How likely is it for you to provide your ratings
and reviews for PROMEX? (Item-2)
Would you ask your doctor to prescribe the
most highly recommended medication from
PROMEX? (Item-3)
How useful do you find PROMEX? (Item-4)
If you came across PROMEX like the example
above how likely, is it for you to mention it to
your doctor? (Item-5)
Do you believe that PROMEX will facilitate
communication with your doctor? (Item-6)
How likely is it for your doctor to get upset if
you mention PROMEX? (Item-7)
59
Mean
3.315
SD
0.932
Min
1.00
Max
5.00
3.161
1.107
1.00
5.00
3.053
1.084
1.00
5.00
3.600
3.553
1.325
1.121
1.00
1.00
5.00
5.00
3.456
1.180
1.00
5.00
3.526
0.992
1.00
5.00
Table 4-3.
Pearson correlation coefficients between PROMEX items
and p-values.
Item
1
2
3
4
5
6
7
1
1.00
0.462
<0.001
0.409
<0.001
0.554
<0.001
0.508
<0.001
0.627
<0.001
−0.089
0.124
2
0.462
<0.001
1.00
0.477
<0.001
0.420
<0.001
0.377
<0.001
0.471
<0.001
−0.138
0.016
3
0.409
<0.001
0.477
<0.001
1.00
0.371
<0.001
0.509
<0.001
0.525
<0.001
−0.126
0.028
4
0.508
<0.001
0.420
<0.001
0.371
<0.001
1.00
0.625
<0.001
0.508
<0.001
−0.113
0.050
60
5
0.508
<0.001
0.377
<0.001
0.509
<0.001
0.371
<0.001
1.00
0.627
<0.001
−0.093
0.106
6
0.627
<0.001
0.471
<0.001
0.525
<0.001
0.508
<0.001
0.627
<0.001
1.00
−0.128
0.026
7
−0.089
0.124
−0.138
0.016
−0.126
0.028
−0.113
0.050
−0.093
0.106
−0.128
0.026
1.00
was considered for removal. Moreover, the item-total statistics were examined to
determine whether removing item-7 would result in an improvement in the Cronbach’s
alpha of the instrument. Table 4-4 shows that item-7 has a low and negative item-total
correlation (i.e., −0.15). Further, the Cronbach’s alpha of the instrument improved from
0.77 to 0.85 when item-7 was deleted. Therefore, item-7 was deleted.
Principal Component Analysis was also performed to determine the number of
constructs or factors that can be extracted from the questionnaire. The Kaiser's MeyerOkin Measure of Sampling Adequacy (KMO) was 0.83, which indicates that the sample
size was large enough to extract a factor or factors from this questionnaire (Cortina,
1993). According to Kaiser-Guttman rule, the number of factors to be extracted should be
equal to the number of factors having an eigenvalue (i.e., variance) greater than one
(Kaiser, 1960). Table 4-5 shows that only one factor has an eigenvalue greater than one.
In addition, the scree plot in Figure 4-1 helps illustrates the rate of change in the
magnitude of the eigenvalues. As can be shown in Figure 4-1, only one factor has an
eigenvalue greater than one, and there was a significant drop in the second factor
eigenvalue to less than one. Therefore, only one factor was extracted. The loading of each
item on the extracted factor is shown in Table 4-6.
The final PROMEX instrument consists of six items after deleting item-7 due to its
lack of inter-item correlation with some of the instrument items, negative and low totalitem correlation. Further, the questionnaire’s Cronbach’s alpha was significantly
improved after deleting item-7 (i.e.,0.85) (Field, 2009). Varimax rotation was not
performed because only one factor was extracted (Hatcher, 2005). This factor was named
the “value of online medication rating websites to older adults”. The minimum possible
score of PROMEX is six and the maximum possible score is 30 after excluding item-7.
The higher the score of PROMEX, the more useful participants believe online medication
rating websites are.
4.3
Patient Reviews of Medication Experiences (PROMEX)
The mean scores of PROMEX for the different sociodemographic groups are listed in
Table 4-7. The overall mean and standard deviation scores of PROMEX for study
participants was 20.14±5.16 and participants from the different age groups did not have
significantly different PROMEX mean scores (p=0.921). Therefore, participants from the
different age groups viewed the online medication rating websites similarly. Likewise,
male and female participants did not have significantly different PROMEX mean scores
(p=0.511). Thus, male and female participants viewed the online medication rating
websites in a similar way. Further, the number of prescription medications that
participants take daily did not influence their views of online medication rating websites.
The study participants with one or no medical condition (i.e., comorbidity score≤1) did
not have a significantly different PROMEX mean score than those with more than one
medical condition (i.e., comorbidity score >1) (p=0.270). Hence, the number of medical
conditions or the comorbidity score for each participant did not influence their views of
61
Table 4-4.
Cronbach coefficient alpha with deleted PROMEX item.
Raw item
Correlation Alpha
with total
0.655
0.725
0.530
0.744
Deleted item
How trustworthy do you find PROMEX? (Item-1)
How likely is it for you to provide your ratings and reviews
for PROMEX? (Item-2)
Would you ask your doctor to prescribe the most highly
recommended medication from PROMEX? (Item-3)
How useful do you find PROMEX? (Item-4)
If you came across PROMEX like the example above how
likely, is it for you to mention it to your doctor? (Item-5)
Do you believe that PROMEX will facilitate communication
with your doctor? (Item-6)
How likely is it for your doctor to get upset if you mention
PROMEX? (Item-7)
62
Standardized item
Correlation
Alpha
with total
0.646
0.707
0.527
0.733
0.559
0.739
0.555
0.727
0.616
0.684
0.724
0.712
0.614
0.671
0.714
0.702
0.695
0.707
0.695
0.696
−0.151
0.853
−0.150
0.856
Table 4-5.
Factor
1
2
3
4
5
6
Eigenvalues of the correlation matrix.
Eigenvalue
3.505
0.725
0.602
0.509
0.376
0.280
Difference
2.779
0.122
0.093
0.132
0.095
63
Proportion
0.584
0.121
0.101
0.084
0.062
0.046
Cumulative
0.584
0.705
0.805
0.890
0.953
1.000
Figure 4-1. Scree plot of the possible number of factors that can be extracted
from the 6-items PROMEX questionnaire.
64
Table 4-6.
Loading of each item of PROMEX on the extracted factor.
Items
Item 6: Do you believe that PROMEX will facilitate communication
with your doctor?
Item 5: If you came across PROMEX like the example above how
likely, is it for you to mention it to your doctor?
Item 1: How trustworthy do you find PROMEX?
Item 4: How useful do you find PROMEX?
Item 3: Would you ask your doctor to prescribe the most highly
recommended medication from PROMEX?
Item 2: How likely is it for you to provide your ratings and reviews for
PROMEX?
65
Factor-1
0.830
0.804
0.783
0.762
0.709
0.685
Table 4-7.
Patient Reviews of Medication Experiences (PROMEX) scores of
different sociodemographic subgroups (n=298).
Characteristics
Age
50-60 yrs.
61-70 yrs.
71-80 yrs.
>80 yrs.
Number of prescription
medications
0-1
2-4
5-7
≥8
Sex
Male
Female
Living status
Alone
Not alone
Marital status
Unmarried
Married
Comorbidity score
≤1
>1
Race
Caucasians
African Americans
Hispanics
Others
Education
≤High school
(1-12 yrs.)
Some college degree
(13-16 yrs.)
Post-graduate degree
(≥17 yrs.)
Health literacy
Marginal/limited
Good
n
PROMEX score
Min Median Mean ±SD
Max
p-Value
25
117
97
54
6
7
7
7
21.0
21.0
21.0
20.5
20.80±5.85
20.12±5.12
20.07±5.03
19.96±5.15
30
30
30
28
0.921
55
136
82
25
7
6
7
9
21.0
21.0
20.0
21.0
19.98±5.73
19.89±5.11
20.39±4.73
21.00±5.61
29
30
30
30
0.744
68
229
7
6
21.0
21.0
20.50±5.46
20.03±5.08
30
30
0.511
131
163
6
7
21.0
21.0
20.09±5.45
20.18±4.97
30
29
0.879
187
110
6
7
21.0
20.0
20.21±5.41
20.02±4.75
30
29
0.759
74
224
7
6
21.0
21.0
19.57±5.72
20.33±4.95
29
30
0.270
163
119
6
9
6
7
9
8
20.0
21.0
22.0
21.0
19.57±4.91
20.87±5.32
19.67±6.00
21.00±6.66
30
30
27
29
0.205
135
7
21.0
20.45±4.66
30
0.617
124
6
20.0
19.82±5.49
30
39
8
21.0
20.08±5.73
29
76
199
9
6
21.0
21.0
20.30±5.18
20.14±5.24
29
30
66
0.813
Table 4-7.
Continued.
Characteristics
Healthcare decision
sharing
No
Yes
Healthcare decision
sharing preference
Keep control in my
own hand
Have an equal
partnership
Leave it in the doctor’s
hands
n
PROMEX score
Min Median Mean ±SD
Max
p-Value
61
234
6
7
20.0
21.0
19.07±5.18
20.36±5.13
30
30
0.080
34
6
20.0
19.38±5.38
30
0.187
234
7
21.0
20.36±5.13
30
27
9
19.5
18.67±4.99
30
Note: (*) =p<0.05.
67
online rating of medication websites. In addition, the PROMEX mean scores were not
significantly different across the different marital and living status groups (p=0.879).
Moreover, PROMEX mean scores were not significantly different between the different
education, health literacy and racial subgroups (p≥0.05). Finally, the PROMEX mean
scores were not significantly different between the different health decision sharing and
preference groups (p=0.08).
4.4
The Health-Related Quality of Life (HRQoL)
4.4.1 The SF-12v2 Physical Component Summary (PCS-12)
The number of the participants who completed the Physical Component Summary
(PCS-12) section of the SF-12v2 survey was 298 participants. The mean scores of the
PCS-12 for the different sociodemographic subgroups are listed in Table 4-8. As the
number of prescription medications a participant took daily increased, the PCS-12 mean
score decreased. Participants who were taking one or more prescription medications had
significantly lower PCS-12 mean scores than participants on one prescription medication
or not on any prescription medications (p<0.001). Therefore, participants who were
taking multiple prescription medications report lower physical health or physical HRQoL
than participants taking only one medication or not taking any prescription medications.
Similarly, participants with more than one medical condition had a significantly lower
PCS-12 mean score than participants with no medical conditions or with only one
medical condition (p<0.001). Hence, participants with multiple comorbidities had lower
physical health or physical HRQoL than those with one or no comorbidities. Participants
with some college or post-graduate degrees had significantly higher PCS-12 mean scores
than those with high school diploma or lower (p=0.011). Thus, participants with higher
educations (i.e., some college or post-graduate degrees) reported better physical health or
physical HRQoL than participants with lower educations (i.e., high school diploma or
lower). The mean scores of the PCS-12 were not significantly different across age, sex,
marital status, living status, racial, health literacy, and health decision sharing preference
subgroups (p≥0.05).
4.4.2 The SF-12v2 Mental Component Summary (MCS-12)
The number of participants who completed the Mental Component Summary (MCS12) section of the SF-12v2 survey was 298 participants. The mean scores of the SF-12v2
Mental Component Summary (MCS-12) for the different sociodemographic subgroups
are listed in Table 4-9. The mean scores of the MCS-12 for the study participants aged
61 years and above were significantly higher than those aged 60 or less years (p=0.001).
Participants whose age was between 71 and 80 years had the highest mental health or
mental HRQoL compared to the other age subgroups. Further, married participants had a
significantly higher MCS-12 mean score compared to the unmarried participants
(p=0.039). In addition, the mean score of the MCS-12 for participants with good health
68
Table 4-8.
SF-12v2 Physical Component Summary (PCS-12) scores of
different sociodemographic subgroups (n=298).
PCS-12 score
Characteristics
n
Min
Median
Mean ±SD
Max
p-Value
50-60 yrs.
25
26
46.3
47.16±9.62
60
0.285
61-70 yrs.
117
24
48.9
46.84±10.3
67
71-80 yrs.
97
22
45.0
45.12±9.47
63
>80 yrs.
54
13
44.3
43.99±11.3
61
Number of prescription
medications
0-1
2-4
55
136
28
13
55.9
46.5
52.04±8.54
45.70±9.44
63
61
5-7
82
22
44.3
44.11±10.4
67
≥8
25
26
38.8
38.47±9.51
53
Male
68
24
44.8
44.73±9.45
63
Female
229
13
47.2
46.19±10.4
67
Alone
131
21
48.9
46.89±9.82
63
Not alone
163
13
44.9
44.9±10.37
67
Unmarried
187
13
47.1
46.24±10.3
67
Married
110
24
46.2
45.20±9.91
61
≤1
74
30
53.8
51.56±7.49
63
>1
Race
Caucasians
224
13
43.8
43.94±10.2
67
163
21
48.0
46.15±10.2
30
African Americans
119
13
45.1
45.40±9.92
30
Hispanics
6
33
46.0
47.14±11.5
27
Others
9
22
44.7
43.17±12.8
29
Age
<0.001*
Sex
0.298
Living status
0.095
Marital status
0.396
Comorbidity score
69
<0.001*
0.781
Table 4-8.
Continued.
PCS-12 score
Characteristics
n
Min
Median
Mean ±SD
Max
p-Value
135
13
43.5
44.18±9.65
61
0.011*
124
21
51.1
47.88±10.2
67
39
24
47.8
45.03±10.7
61
Marginal/limited
76
21
44.2
44.68±9.18
67
Good
199
13
48.9
46.78±10.4
63
No
61
26
45.7
45.46±9.21
61
Yes
234
13
47.2
46.08±10.3
67
Keep control in my own
hand
34
28
49.6
47.25±9.27
59
Have an equal partnership
234
13
47.2
46.08±10.3
67
Leave it in the doctor’s
hands
27
26
43.0
43.21±8.80
61
Education
≤High school
(1-12 yrs.)
Some college degree
(13-16 yrs.)
Post-graduate degree
(≥17 yrs.)
Health literacy
0.121
Healthcare decision
sharing
0.668
Healthcare decision
sharing preference
Note: (*) =p<0.05.
70
0.273
Table 4-9.
SF-12v2 Mental Component Summary (MCS-12) scores of different
sociodemographic subgroups (n=298).
MCS-12 score
Characteristics
n
Min
Median
Mean ±SD
Max
p-Value
50-60 yrs.
25
26
47.5
45.63±9.80
58
0.001*
61-70 yrs.
117
30
55.5
52.05±9.88
68
71-80 yrs.
97
29
58.5
54.99±9.13
72
>80 yrs.
54
33
53.4
52.49±8.46
73
Number of prescription
medications
0-1
2-4
55
136
30
29
54.8
54.4
52.78±8.87
51.69±9.61
72
73
5-7
82
26
55.2
53.07±9.72
69
≥8
25
25
56.7
52.35±12.9
67
Male
68
25
53.0
50.11±11.3
72
Female
229
26
55.8
53.04±9.21
73
Alone
131
25
53.1
51.68±9.64
69
Not alone
163
26
55.8
53.04±9.87
73
Unmarried
187
25
53.0
51.47±9.91
73
Married
110
29
56.8
53.90±9.41
72
≤1
74
30
56.6
52.95±8.98
67
>1
224
25
54.3
52.12±10.1
73
Caucasians
163
25
56.9
53.53±9.13
72
African Americans
119
26
52.4
51.02±10.4
73
Hispanics
6
34
46.5
46.02±9.82
58
Others
9
36
51.7
51.50±11.9
69
Age
0.763
Sex
0.053
Living status
0.235
Marital status
0.039*
Comorbidity score
0.530
Race
71
0.067
Table 4-9.
Continued.
MCS-12 score
Characteristics
n
Min
Median
Mean ±SD
Max
135
26
52.7
51.04±10.5
73
Some college degree
(13-16 yrs.)
124
25
56.2
53.0±9.24
72
Post-graduate degree
(≥17 yrs.)
39
31
55.3
54.64±8.42
68
Marginal/limited
76
26
48.1
48.02±10.5
69
Good
199
25
55.6
53.23±9.13
73
No
61
25
51.8
50.29±11.3
72
Yes
234
29
55.8
52.93±9.28
73
Keep control in my own
hand
34
25
53.9
50.91±11.7
72
Have an equal partnership
234
29
55.8
52.93±9.28
73
Leave it in the doctor’s
hands
27
26
48.1
49.51±11.0
65
Education
≤High school
(1-12 yrs.)
p-Value
0.077
Health literacy
<0.001
Healthcare decision
sharing
0.060
Healthcare decision
sharing preference
Note: (*) =p<0.05.
72
0.147
literacy was significantly higher than the one for participants with limited health literacy
(p<0.001). Finally, the mean scores of the MCS-12 were not significantly different across
the different sex, comorbidities, number of prescription medications, living status,
educations, racial, and health decision sharing preference subgroups (p≥0.05).
4.5
Satisfaction with Physician Communication and Interpersonal Treatment
4.5.1 The Primary Care Assessment Survey-Communication Scale (PCASCommunication)
The number of the study participants who completed the Primary Care Assessment
Survey Communication domain (PCAS-Communication) was 300. The PCASCommunication scale mean scores for the different sociodemographic groups are listed in
Table 4-10. The mean score of the PCAS-Communication for female participants was
significantly higher than the score for male participants (p=0.048). Female participants
were more satisfied with the physician communication than their male counterparts were.
Married participants also had a significantly higher PCAS-Communication mean score
than the unmarried participants (p=0.013). Married participants were more satisfied with
the physician communication compared to the unmarried participants. Further, the mean
score of the PCAS-Communication for Caucasians was significantly higher than the
scores for African Americans, Hispanics, and other racial subgroups (p=0.041). The
Caucasian participants had the highest satisfaction level with the physician
communication among the other racial subgroups. Hispanics had the lowest satisfaction
level with the physician communication among the other racial subgroups. In addition,
participants with good health literacy level had a significantly higher PCASCommunication mean score than participants with limited health literacy (p=0.001).
Finally, the mean scores of PCAS-Communication scores across the different age,
number of prescription medications, living status, comorbidity score, education,
healthcare decision sharing, and healthcare decision sharing preference subgroups were
not significantly different (p≥0.05).
4.5.2 The PCAS-Interpersonal Treatment Scale
The number of the study participants who completed the Primary Care Assessment
Survey Interpersonal Treatment domain (PCAS-Interpersonal Treatment) was 300. The
PCAS-interpersonal treatment scale mean scores for the different sociodemographic
subgroups are listed in Table 4-11. Married participants had a significantly higher PCASinterpersonal treatment mean score than the unmarried participants did (p=0.029).
Therefore, the married participants’ level of satisfaction with the physician interpersonal
treatment was significantly higher than the level of satisfaction for the unmarried.
However, the mean scores of the PCAS-interpersonal treatment did not significantly
differ across the age, education, living status, number of prescription medications, sex,
comorbidities, race, health literacy, healthcare decision sharing, and healthcare decision
73
Table 4-10.
(n=300).
Primary Care Assessment Survey (PCAS-Communication) scale
PCAS-Communication scale score
Characteristics
n
Min
Median
Mean ±SD
Max
p-Value
50-60 yrs.
25
10
68.0
68.53±21.4
100
0.133
61-70 yrs.
117
28
76.7
73.85±16.9
100
71-80 yrs.
98
20
75.0
74.95±16.8
100
>80 yrs.
55
30
66.7
69.33±17.1
100
Number of prescription
medications
0-1
2-4
55
136
10
30
76.7
73.3
73.78±17.7
71.55±16.9
100
100
5-7
84
20
76.7
75.27±17.8
100
≥8
25
40
70.0
69.07±17.6
100
Male
68
30
66.7
69.11±16.5
100
Female
231
10
73.3
73.85±17.6
100
Alone
132
10
70.0
70.93±18.4
100
Not alone
164
28
76.7
74.37±16.5
100
Unmarried
189
10
70.0
70.87±18.2
100
Married
110
30
80.0
76.04±15.6
100
≤1
74
20
75.0
73.53±17.9
100
>1
226
10
73.3
72.55±17.3
100
Caucasians
164
30
76.7
74.59±17.5
100
African Americans
120
10
73.3
71.77±17.3
100
Hispanics
6
43
60.0
60.56±14.9
87
Others
9
37
60.0
62.59±12.3
80
Age
0.295
Sex
0.048*
Living status
0.092
Marital status
0.013*
Comorbidity score
0.676
Race
74
0.041*
Table 4-10.
Continued.
PCAS-Communication scale score
Characteristics
n
Min
Median
Mean ±SD
Max
p-Value
136
28
70.0
71.66±16.2
100
0.346
Some college degree
(13-16 yrs.)
124
20
73.3
72.94±17.9
100
Post-graduate degree
(≥17 yrs.)
40
10
80.0
76.22±19.5
100
Marginal/limited
76
30
66.7
66.77±15.8
97
Good
200
10
76.7
74.97±17.5
100
No
62
36
67.3
70.61±18.4
100
Yes
235
10
73.3
73.41±17.2
100
Keep control in my own
hand
34
36
67.3
67.88±16.9
100
Have an equal partnership
235
10
73.3
73.41±17.2
100
Leave it in the doctor’s
hands
28
70.0
73.93±19.8
100
Education
≤High school
(1-12 yrs.)
Health literacy
0.001*
Healthcare decision
sharing
0.263
Healthcare decision
sharing preference
40
Note: (*) =p<0.05.
75
0.213
Table 4-11. Primary Care Assessment Survey (PCAS-Interpersonal Treatment)
scale (n=300).
PCAS-Interpersonal Treatment scale score
Characteristics
n
Min
Median
Mean ±SD
Max
p-Value
50-60 yrs.
25
40
68.0
71.96±20.3
100
0.618
61-70 yrs.
117
27
76.0
72.84±18.9
100
71-80 yrs.
98
27
76.0
74.31±17.8
100
>80 yrs.
55
35
72.0
70.27±16.3
100
0-1
55
40
76.0
73.36±21.1
100
2-4
136
27
72.0
71.75±17.3
100
5-7
84
27
76.0
74.37±17.7
100
≥8
25
28
68.0
69.60±18.4
100
Male
68
27
74.0
69.35±17.6
100
Female
231
27
76.0
73.68±18.3
100
Alone
132
27
72.0
70.87±18.8
100
Not alone
164
27
76.0
74.37±17.6
100
Unmarried
189
27
72.0
70.95±18.6
100
Married
110
28
80.0
75.69±17.2
100
≤1
74
27
72.0
72.00±19.8
100
>1
226
27
76.0
72.80±17.7
100
No
62
28
72.0
71.77±18.9
100
Yes
235
27
76.0
72.90±18.1
100
Age
Number of prescription
medications
0.605
Sex
0.084
Living status
0.099
Marital status
0.029*
Comorbidity score
0.742
Healthcare decision
sharing
76
0.668
Table 4-11.
Continued.
PCAS-Interpersonal Treatment scale score
Characteristics
n
Min
Median
Mean ±SD
Max
p-Value
136
28
72.0
71.53±17.2
100
0.205
College degree
(13-16 yrs.)
124
27
76.0
72.26±19.6
100
Post-graduate degree
(≥17 yrs.)
40
40
80.0
77.30±16.9
100
Caucasians
164
35
76.0
73.85±18.3
100
African Americans
120
27
75.5
72.57±18.1
100
Hispanics
6
44
60.0
62.67±18.4
88
Others
9
40
60.0
59.22±12.9
76
Marginal/limited
76
28
72.0
69.37±17.4
100
Good
200
27
76.0
74.04±18.4
100
Keep control in my own
hand
34
40
66.0
68.53±19.3
100
Have an equal partnership
235
27
76.0
72.90±18.1
100
Leave it in the doctor’s
hands
28
28
74.0
75.71±18.2
100
Education
≤High school
(1-12 yrs.)
Race
0.059
Health literacy
0.056
Healthcare decision
sharing preference
Note: (*) =p<0.05.
77
0.278
sharing preference subgroups (p≥0.05).
4.6
The General Domains of Beliefs about Medicines Questionnaire (BMQ)
4.6.1 BMQ-Overuse Scale
The number of the participants who completed the Beliefs about Medicine
Questionnaire-Overuse scale was 297. The BMQ-Overuse scale mean scores across the
different sociodemographic subgroups are listed in Table 4-12. Participants who reported
taking zero or only one prescription medication had significantly higher BMQ GeneralOveruse mean scores than other participants who reported taking multiple prescription
medications (p=0.016). As the number of prescription medications participants were
taking increased, their belief that medications are overprescribed or overused decreased.
Female participants had a significantly higher BMQ General-Overuse mean score than
their male counterparts (p=0.009). Hence, female participants’ beliefs about medications
being overused or overprescribed were stronger than their male counterparts. Further, the
mean scores of the BMQ General-Overuse for participants who liked to be involved in
the health decision along with the physicians or have an equal partnership, and those who
liked to keep the health decision in their own hands were significantly higher than the
participants who liked to keep the health decision in the physicians’ hands (p=0.017).
Participants who liked to be involved with physicians’ in the health decision or have an
equal partnership held the strongest beliefs that medications are overprescribed or
overused; however, participants who liked to leave the health decision in the physicians’
hands had the weakest beliefs than medications are overprescribed or overused. Finally,
the mean scores of the BMQ General-Overuse for the different age, education, marital
and living status, comorbidities, race, and health literacy groups were not significantly
different (p≥0.05).
4.6.2 BMQ-Harm Scale
The number of the participants who completed the Beliefs about Medicine
Questionnaire-Harm scale was 298. The BMQ-Harm scale mean scores across the
different sociodemographic subgroups are listed in Table 4-13. The participants who
reported taking zero or one prescription medication had the highest BMQ-Harm mean
score compared to the mean scores of those taking multiple medications (p=0.038). As
the number of prescription medications taken by the participants increased, their belief
that prescription medications are inherently harmful decreased. The Caucasian/white
participants had the lowest BMQ-Harm mean score in comparison to the other racial
groups (p=0.014). Hence, the Caucasian participants’ beliefs that prescription
medications are generally harmful were not as strong as the beliefs of other racial groups.
On the other hand, Asians and Alaska Natives (i.e., Others) held the strongest beliefs that
medications are generally harmful in comparison to other racial groups (p=0.014). The
mean scores of BMQ-Harm across other sociodemographic, comorbidities, health
78
Table 4-12. Beliefs about Medicines Questionnaire-Overuse (BMQ-Overuse)
scale scores of different sociodemographic subgroups (n=297).
BMQ-Overuse score
Characteristics
n
Min
Median
Mean ±SD
Max
50-60 yrs.
25
4
13.0
12.48±3.74
19
61-70 yrs.
116
4
13.0
12.62±2.77
18
71-80 yrs.
98
5
13.0
12.91±3.20
20
>80 yrs.
53
6
12.0
12.23±2.46
18
Number of prescription
medications
0-1
2-4
55
134
4
4
14.0
13.0
13.49±3.65
12.66±2.80
20
20
5-7
83
6
13.0
12.23±2.63
17
≥8
25
4
12.0
11.40±3.21
16
Male
68
4
12.0
11.78±2.96
16
Female
228
4
13.0
12.86±2.96
20
Alone
131
4
13.0
12.81±3.12
20
Not Alone
162
4
13.0
12.43±2.90
20
Unmarried
86
4
13.0
12.80±2.98
20
Married
110
4
12.0
12.28±2.99
20
≤1
74
4
13.0
12.93±3.13
19
>1
223
4
13.0
12.48±2.96
20
Caucasians
162
5
12.5
12.56±2.84
20
African Americans
120
4
13.0
12.65±3.21
19
Hispanics
5
7
12.0
11.60±4.16
16
Others
9
7
13.0
12.56±2.60
18
p-Value
Age
0.592
0.016*
Sex
0.009*
Living status
0.277
Marital status
0.149
Comorbidity score
0.257
Race
79
0.895
Table 4-12.
Continued.
BMQ-Overuse score
Characteristics
n
Min
Median
Mean ±SD
Max
133
4
12.0
12.32±3.19
20
College degree
(13-16 yrs.)
124
4
13.0
12.89±2.95
19
Post-graduate degree
(≥17 yrs.)
40
7
12.5
12.58±2.45
17
Marginal/limited
76
4
13.0
12.79±3.40
20
Good
198
4
13.0
12.48±2.78
18
No
60
4
12.5
11.93±3.80
20
Yes
235
5
13.0
12.76±2.76
20
Keep control in my
own Hand
34
4
13.5
12.65±3.76
20
Have an equal partnership
235
5
13.0
12.76±2.76
20
Leave it in the doctor’s
hands
26
4
10.5
11.0±3.71
17
Education
≤High school
(1-12 yrs.)
p-Value
0.313
Health literacy
0.480
Healthcare decision
sharing
0.118
Healthcare decision
sharing preference
Note: (*) =p<0.05.
80
0.017*
Table 4-13. Beliefs about Medicines Questionnaire-Harm (BMQ-Harm) scale
scores of different sociodemographic subgroups (n=298).
BMQ-Harm score
Characteristics
n
Min
Median
Mean ±SD
Max
50-60 yrs.
25
4
10.0
9.92±3.38
17
61-70 yrs.
115
4
9.0
9.35±2.91
18
71-80 yrs.
98
4
8.0
8.71±2.62
14
>80 yrs.
55
4
8.0
8.45±2.79
18
Number of prescription
medications
0-1
2-4
55
135
4
4
9.0
9.0
9.80±3.00
8.99±2.79
18
17
5-7
84
4
8.5
8.92±2.72
17
≥8
24
4
7.5
7.83±3.06
16
Male
67
4
9.0
8.66±2.36
13
Female
230
4
9.0
9.13±2.99
18
Alone
131
4
9.0
9.02±2.94
17
Not Alone
163
4
9.0
9.03±2.84
18
Unmarried
187
4
9.0
8.98±2.79
17
Married
110
4
9.0
9.09±3.00
18
≤1
74
4
9.0
9.15±2.77
18
>1
224
4
9.0
8.99±2.89
18
Caucasians
164
4
8.0
8.55±2.60
16
African Americans
118
4
9.0
9.53±3.01
18
Hispanics
6
4
9.0
9.17±4.96
13
Others
9
5
11.0
10.44±2.46
18
p-Value
Age
0.062
0.038*
Sex
0.177
Living Status
0.963
Marital Status
0.756
Comorbidity Score
0.673
Race
81
0.014*
Table 4-13.
Continued.
BMQ-Harm score
Characteristics
n
Min
Median
134
4
9.0
9.37±2.74
18
College degree
(13-16 yrs.)
124
4
9.0
8.81±2.93
18
Post-graduate degree
(≥17 yrs.)
40
4
8.0
8.55±2.95
16
Marginal/limited
76
4
9.5
9.51±3.00
17
Good
198
4
8.5
8.90±2.83
18
No
62
4
9.0
9.52±3.43
18
Yes
233
4
9.0
8.89±2.69
18
Keep control in my
own hand
34
4
9.5
9.74±3.49
18
Have an equal partnership
233
4
9.0
8.89±2.69
18
Leave it in the doctor’s
hands
28
4
9.0
9.25±3.40
16
Education
≤High school
(1-12 yrs.)
Mean ±SD
Max
p-Value
0.148
Health literacy
0.115
Healthcare decision
sharing
0.185
Healthcare decision
sharing preference
Note: (*) =p<0.05.
82
0.248
literacy, and health decision sharing preference groups were not significantly different
(p≥0.05).
4.7
The Hypertensive Study Sample Characteristics
The number of participants who reported having hypertension was 226 (75.3%). Out
of this sample, 218 reported taking prescription medications for hypertension. The
sociodemographic characteristics of the hypertensive study sample who reported taking
antihypertensive medications are listed in Table 4-14. The mean age of this sample was
72 years, 76.6% of the study sample were female; 63.8% were unmarried; 54% had either
some college or postgraduate degrees. The self-reported race of the sample was 55%
Caucasians/white, 40% African Americans/black, 2% Hispanics, and 3% Others (i.e.,
Asians and Alaska Natives). Forty-four percent were living alone, while 56% were not.
Finally, more than 90% of the participants were taking more than two prescription
medications.
4.8
Medication Adherence Levels among the Hypertensive Sample
Adherence to antihypertensive medication regimens were categorized into three
distinct categories based on Morisky Medication Adherence Scale (MMAS-8) scores.
High medication adherence level is achieved when the MMAS-8 score is eight. However,
medium and low adherence levels are achieved when the MMAS-8 scores are between
six and less than eight, and less than six, respectively (Krousel-Wood et al., 2009;
Morisky et al., 2008; Morisky & DiMatteo, 2011). The adherence levels to
antihypertensive medication regimens among the hypertensive sample across the seven
senior centers are listed in Table 4-15. The proportion of the sample with high, medium,
and low adherence levels to their antihypertensive medication regime was 49%, 30%, and
21%, respectively. Further, the hypertensive participants were categorized into adherent
and non-adherent based on their MMAS-8 scores. If the MMAS-8 score is eight, then
participant was considered adherent to his/her antihypertensive medication regimen,
however, if the MMAS-8 score is less than eight, then the participant was considered
non-adherent to his/her antihypertensive medication regimen (Wong et al., 2014). The
adherence levels across the different sociodemographic and medical groups are listed in
Table 4-16. The proportion of adherent participants among the hypertensive sample
significantly increased as their age increased (p<0.001). The majority of the participants
aged 71 years and above were adherent to their antihypertensive medication regimens
(i.e., >60%); however, less than 33% of the participants aged 70 years and less were
adherent. In addition, the proportion of adherent participants among the Caucasians was
significantly higher than the non-adherent participants (p=0.021). Further, most of the
Caucasians/white participants were adherent to their antihypertensive medication
regimens (i.e., 58%) in comparison to 40% of the African Americans, 20% of Hispanics,
and 29% of other racial subgroups (i.e., Asians and Alaska Natives). Finally, the
proportions of adherent participants were not significantly different across the remaining
sociodemographic and medical subgroups (p≥0.05).
83
Table 4-14.
Characteristics
Age-yrs.
(Mean ± SD)
Sex
Female
Male
Marital status
Married
Unmarried
Education
≤High school
(1-12 yrs.)
Some college
degree
(13-16 yrs.)
Post-graduate
degree
(≥17 yrs.)
Race
Caucasians
African
Americans
Hispanics
Others
Living status
Alone
Not alone
Baseline characteristics of the hypertensive participants (n=218).
Senior centers
FrayserOrangeArlington
Bartlett
Bert
McWherter Somerville
(n=24)
(n=33)
(n=28)
(n=12)
Raleigh
Mound
Ferguson
(n=36)
(n=71)
(n=14)
76.25±8.35 69.43±8.51 73.13±7.76 72.13±7.32 75.38±7.25 72.96±10.68 70.17±6.59
Total
(n=218)
p-Value
72.25±8.65
0.005*
25(69.4%)
11(30.6%)
56(78.9%)
15(21.1%)
15(62.5%)
9(37.5%)
29(87.9%)
4(12.1%)
13(92.9%)
1(7.1%)
20(71.4%)
8(28.6%)
9(75%)
3(25%)
167(76.6%)
51(23.4%)
0.188
13(36.1%)
23(63.9%)
16(22.5%)
55(77.5%)
16 (66.7%)
8(33.3%)
12(36.4%)
21(63.6%)
7(50%)
7(50%)
10(35.7%)
18(64.3%)
5(41.7%)
7(58.3%)
79(36.2%)
139(63.8%)
0.010*
17(47.2%)
35(49.3%)
13(54.2%)
16(48.5%)
2(14.3%)
9(32.1%)
9(75%)
101(46.3%)
0.075
15(41.7%)
30(42.3%)
9(37.5%)
12(36.4%)
7(50%)
16(57.1%)
3(25%)
92(42.2%)
4(11.1%)
6(8.5%)
2(8.3%)
5(15.2%)
5(35.7%)
3(10.7%)
0(0%)
25(11.5%)
29(80.6%)
5(13.9%)
0(0%)
66(92.9%)
24(100%)
0(0%)
29(87.9%)
0(0%)
14(100%)
0(0%)
21(75%)
6(21.4%)
2(16.7%)
10(83.3%)
119(54.6%)
87(39.9%)
1(2.8%)
1(2.8%)
2(2.8%)
3(4.2%)
0(0%)
0(0%)
1(3%)
3(9.1%)
0(0%)
0(0%)
1(3.6%)
0(0%)
0(0%)
0(0%)
5(2.3%)
7(3.2%)
20(55.6%)
16(44.4%)
31(44.3%)
39(55.7%)
4(16.7%)
20(83.3%)
16(48.5%)
17(51.5%)
6(42.9%)
8(57.1%)
13 (48.1%)
14 (51.9%)
5(41.7%)
7(58.3%)
95(43.98%)
121(56.02%)
84
<0.001*
0.136
Table 4-14.
Continued.
Characteristics
Number of
prescription
medications
0-1
2-4
5-7
≥8
FrayserRaleigh
(n=36)
OrangeMound
(n=71)
4(11.1%)
13(36.1%)
15(41.7%)
4(11.1%)
8(11.3%)
38(53.5%)
20(28.2%)
5(7.0%)
Senior centers
Arlington
Bartlett
Bert
(n=24)
(n=33)
Ferguson
(n=14)
0(0%)
14(58.3%)
7(29.2%)
3(12.5%)
0(0%)
13(39.4%)
17(51.5%)
3(9.1%)
Note: (*) =p<0.05.
85
1(7.1%)
10(71.4%)
3(21.4%)
0(0%)
McWherter Somerville
(n=28)
(n=12)
3(10.7%)
12(42.9%)
10(35.7%)
3(10.7%)
1(8.3%)
4(33.3%)
3(25%)
4(33.3%)
Total
(n=218)
p-Value
17(7.8%)
104(47.7%)
75(34.4%)
22(10.1%)
0.116
Table 4-15.
Adherence
level
High
(MMAS-8
score= 8)
Medium
(MMAS-8
score = 6-<8)
Low
(MMAS-8
score <6)
Morisky Medication Adherence Scale (MMAS-8) levels among the hypertensive sample (n=218).
FrayserRaleigh
(n=36)
21(58.3%)
OrangeMound
(n=71)
28(39.4%)
Senior centers
Bartlett
Bert
(n=33)
Ferguson
(n=14)
10(41.7%) 20(60.6%) 9(64.3%)
10(27.8%)
21(29.6%)
9(37.5%)
10(30.3%)
5(13.9%)
22(31.0%)
5(20.8%)
3(9.1%)
Arlington
(n=24)
Note: (*) =p<0.05.
86
McWherter Somerville
(n=28)
(n=12)
Total
(n=218)
p-Value
12(42.9%)
7(58.3%)
107(49.1%) 0.005*
5(35.7%)
7(25%)
4(33.3%)
66(30.3%)
0(0%)
9(32.14%)
1(8.3%)
45(20.6%)
Table 4-16. Morisky Medication Adherence Scale (MMAS-8) levels across the
hypertensive subgroups.
Characteristics
Non-adherent
(MMAS-8 <8)
(n)
Adherent
(MMAS-8 =8)
(n)
p-Value
<0.001*
Age
50-60 yrs.
13(72.2%)
5(27.8%)
61-70 yrs.
55(66.3%)
28(33.7%)
71-80 yrs.
28(38.4%)
45(61.6%)
>80 yrs.
12(29.3%)
29(70.7%)
0-1
8(47.1%)
9(52.9%)
2-4
55(52.9%)
49(47.1%)
5-7
37(49.3%)
38(50.7%)
≥8
11(50%)
11(50%)
Male
29(56.9%)
22(43.1%)
Female
82(49.1%)
85(50.9%)
Alone
51(53.7%)
44(46.3%)
Not alone
58(47.9%)
63(52.1%)
Unmarried
72(51.8%)
67(48.2%)
Married
39(49.4%)
40(50.6%)
≤1
11(39.3%)
17(60.7%)
>1
100(52.6%)
90(47.4%)
Marginal/limited
29(61.7%)
18(38.3%)
Good
68(46.3%)
79(53.7%)
Number of prescription
medications
0.951
Sex
0.331
Living status
0.401
Marital status
0.729
Comorbidity score
0.187
Health literacy
87
0.065
Table 4-16.
Continued.
Characteristics
Non-adherent
(MMAS-8 <8)
(n)
Adherent
(MMAS-8 =8)
(n)
p-Value
22(50%)
89(51.45%)
22(50%)
84(48.55%)
0.864
53(52.5%)
48(52.2%)
48(47.5%)
44(47.8%)
0.509
10(40%)
15(60%)
Caucasians
50(42.02%)
69(57.9%)
African Americans
52(59.8%)
35(40.2%)
4(80%)
1(20%)
5(71.4%)
2(28.6%)
Keep control in my own hand
12(52.2%)
11(47.8%)
Have an equal partnership
89(51.45%)
84(48.55%)
Leave it in the doctor’s hands
10(47.6%)
11(52.4%)
Dissatisfied
1(100%)
0(0%)
Not satisfied
2(100%)
0(0%)
Somewhat satisfied
9(75%)
3(25%)
Satisfied
35(54.7%)
29(45.3%)
Very satisfied
62(45.3%)
75(54.7%)
Healthcare decision
sharing
No
Yes
Education
≤High school (1-12 yrs.)
College degree (13-16 yrs.)
Post-graduate degree (≥17 yrs.)
Race
Hispanics
Others
0.021*
Healthcare decision sharing
preference
0.941
Satisfaction with the
antihypertensive regimen
Note: (*) =p<0.05.
88
0.100
4.9
Participant Rating of Antihypertensive Medication Regimens
The hypertensive participants were asked to rate their satisfaction with each
antihypertensive medication they reported taking on a 5-point Likert scale (i.e., 1-low to
5-high) in terms of their side effects, effectiveness, ease of use, cost of medication, and
food interactions. Further, participants were asked to provide an overall rating of each
antihypertensive medication. Then, participant-specific satisfaction with the overall
antihypertensive medication regimen was calculated by taking the mean score of each
rated aspect of medication use (i.e., side effects, effectiveness, etc...) for every
hypertensive participant. The number of study participants who rated their
antihypertensive medications was 193 participants. The participant-specific mean scores
of each rated medication use aspect for the antihypertensive medication regimen across
the seven senior centers are listed in Table 4-17.
Table 4-18 presents the correlation matrix of the rated aspects of medication use. All
of the rated medication use aspects for the antihypertensive medication regimens were
positively and significantly correlated with each other (p<0.05). Further, the instrument’s
internal consistency (i.e., Cronbach’s alpha) was measured and found to be adequate (i.e.,
α=0.82). In addition, the medication-specific average rating of the antihypertensive
medications that were rated by ten or more hypertensive participants are listed in
Table 4.19. Ten or more participants rated the following antihypertensive medications:
Atenolol, Amlodipine, Hydrochlorothiazide (HCTZ), Lisinopril, Losartan, Metoprolol,
and Valsartan. All of the rated antihypertensive medications had high rating scores;
however, they slightly differ (Figure 4-2). For example, Losartan had the highest
effectiveness rating among the other rated antihypertensive medications, and Valsartan
had the lowest rating (Figure 4-3). Likewise, Losartan had the highest rating in terms of
medication ease of use, and amlodipine had the lowest rating (Figure 4-4). With regard
to medication cost, Hydrochlorothiazide (HCTZ) had the highest rating, whereas,
Amlodipine had the lowest rating (Figure 4-5). Similarly, HCTZ had the highest rating in
terms of medication food interactions, and Atenolol had the lowest rating (Figure 4-6);
while HCTZ had the highest rating in terms of medication side effects, and Lisinopril had
the lowest rating (Figure 4-7). Finally, Lisinopril had the highest overall rating, whereas,
Valsartan had the lowest rating (Figure 4-8).
4.10
Pearson Correlation Coefficients between Participant-Reported Outcomes
(PROs)
The Pearson correlation coefficients between the Patient Reviews of Medication
Experiences (PROMEX) and the Primacy Care Assessment Survey (PCAS)
communication and interpersonal treatment scales, Beliefs about Medicines
Questionnaire (BMQ) general harm and overuse scales, the Mental and Physical
Component Summaries (MCS-12 and PCS-12) of the Short Form Health Questionnaire
(SF-12v2), and the Morisky Medication Adherence Scale (MMAS-8) for hypertensive
participants are listed in Table 4-20. PROMEX was not associated with any of the
participant-reported outcomes (p≥0.05). The PCAS-Communication and
89
Table 4-17.
Medication
use aspect
Effectiveness
Side effects
Ease of use
Cost
Food
interaction
Overall
Participants’ evaluations of their antihypertensive medications (n=193).
Senior centers
Bartlett
Bert
(n=34)
Ferguson
(n=13)
4.57±0.70 4.38±0.87
4.15±1.42 3.86±1.61
4.57±0.85 4.69±0.63
4.17±1.16 4.26±1.04
4.15±1.39 4.03±1.32
FrayserRaleigh
(n=33)
4.43±0.82
3.43±1.54
4.44±1.06
4.32±1.07
4.09±1.39
OrangeMound
(n=59)
4.15±1.18
2.98±1.65
4.27±1.13
3.82±1.34
3.81±1.48
Arlington
(n=21)
4.49±0.83
4.27±1.01
4.77±0.40 4.59±0.88
4.78±0.41
2.95±1.88
4.84±0.47
4.23±1.20
3.82±1.56
4.69±0.63
McWherter Somerville
(n=26)
(n=7)
Total
(n=193)
p-Value
4.32±0.81
3.01±1.73
4.62±0.92
4.02±1.47
3.69±1.74
4.70±0.67
3.63±1.77
4.75±0.46
3.25±1.98
4.00±1.41
4.40±0.91
3.33±1.67
4.51±0.95
4.04±1.29
3.93±1.47
0.073
0.025*
0.217
0.269
0.880
4.46±0.86
4.71±0.49
4.49±0.86
0.255
Notes: Participants were asked to evaluate each aspect of their antihypertensive medication regimens in a scale from one to five. The
higher the score, the more satisfied the participants are with their medications. (*) =p<0.05.
90
Table 4-18. Pearson correlation coefficients between the participants’ rated antihypertensive medication use aspects and
their p-values (n=193).
Medication use
aspect
Effectiveness
Side effects
Ease of use
Cost of
medication
Food interactions
Overall rating
Effectiveness
1.00
0.251
0.001*
0.589
<0.001*
0.408
<0.001*
0.249
0.001*
0.591
<0.001*
Side
effects
0.251
Ease of
use
0.589
Cost of
medication
0.408
0.001*
1.00
<0.001*
0.290
<0.001*
1.00
<0.001*
0.363
<0.001*
0.460
<0.001*
1.00
0.290
<0.001*
0.363
<0.001*
0.564
<0.001*
0.349
<0.001*
0.460
<0.001*
0.447
<0.001*
0.571
<0.001*
0.514
<0.001*
0.498
<0.001*
Note: (*) =p<0.05.
91
Food
interactions
0.249
Overall
rating
0.591
0.001*
0.564
<0.001*
0.447
<0.001*
0.514
<0.001*
1.00
<0.001*
0.349
<0.001*
0.571
<0.001*
0.498
<0.001*
0.408
<0.001*
1.00
0.408
<0.001*
Total
correlation
0.603
0.405
0.649
0.610
0.575
0.669
Table 4-19.
Antihypertensive medication rating (medication-specific) (n=148).
Effectiveness
Medication
name
Atenolol
Amlodipine
Hydrochlorothiazide
(HCTZ)
Lisinopril
Losartan
Metoprolol
Valsartan
Ease of use
n
Mean± SD
n
Mean± SD
Cost of
medication
n Mean± SD
14
35
14
4.58±0.67
4.31±0.72
4.85±0.29
10
34
12
4.55±0.70
4.41±1.08
4.92±0.29
10
32
12
4.36±0.84
3.91±1.30
4.92±0.29
10
33
12
3.64±1.66
3.88±1.52
4.85±0.39
9
34
12
3.40±1.66
2.94±1.86
4.08±1.15
10
32
12
4.55±0.70
4.50±0.76
4.77±0.39
35
14
26
10
4.56±0.84
5.00±0.00
4.76±0.45
4.11±0.82
28
13
24
10
4.77±0.65
5.00±0.00
4.69±0.87
4.88±0.41
28
13
23
10
4.27±1.12
4.50±1.33
4.32±0.99
4.56±0.76
28
12
22
10
3.93±1.52
4.15±1.68
3.83±1.69
4.14±1.74
29
13
23
10
2.81±1.80
3.86±1.79
3.44±1.78
3.14±1.99
27
13
23
10
4.79±0.40
4.71±1.11
4.44±0.99
4.38±0.82
92
Food
interaction
n Mean± SD
Side effects
Overall
n
Mean± SD
n
Mean± SD
Figure 4-2.
Antihypertensive medication ratings.
93
Figure 4-3.
Rating of antihypertensive medications’ effectiveness.
94
Figure 4-4.
Rating of antihypertensive medications’ ease of use.
95
Figure 4-5.
Rating of antihypertensive medications’ cost.
96
Figure 4-6.
Rating of antihypertensive medications’ food interactions.
97
Figure 4-7.
Rating of antihypertensive medications’ side effects.
98
Figure 4-8.
Overall rating of antihypertensive medications.
99
Table 4-20.
(n=298).
Pearson correlation coefficients between the participant-reported outcomes (PROs) and their p-values
PRO variable
PROMEX
PCASCommunication
PCASInterpersonal
MCS-12
PCS-12
BMQ-Overuse
BMQ-Harm
MMAS-8
PROMEX
1.00
0.048
0.407
0.030
0.604
−0.110
0.055*
−0.106
0.066
−0.080
0.168
−0.042
0.470
−0.066
0.327
PCASCommunication
0.048
0.407
1.00
0.872
<0.001*
0.161
0.005*
0.134
0.020*
−0.164
0.004*
−0.231
<0.001*
0.204
0.002*
PCASInterpersonal
0.030
0.604
0.872
<0.001*
1.00
0.148
0.010*
0.100
0.082
−0.155
0.007*
−0.209
0.001*
0.193
0.004*
Note: (*) =p<0.05.
100
MCS-12
PCS-12
−0.110
0.055
0.161
0.005*
0.148
0.010*
1.00
−0.106
0.066
0.134
0.020*
0.100
0.082
−0.056
0.328
1.00
−0.056
0.328
0.056
0.335
−0.142
0.014*
0.180
0.007*
0.086
0.135
0.041
0.471
0.120
0.076
BMQOveruse
−0.080
0.168
−0.164
0.004*
−0.155
0.007*
0.056
0.335
0.086
0.135
1.00
0.460
<0.001*
−0.108
0.112
BMQHarm
−0.042
0.470
−0.231
<0.001*
−0.209
0.001*
−0.142
0.014*
0.041
0.471
0.460
<0.001
1.00
−0.089
0.190
MMAS-8
−0.066
0.327
0.204
0.002*
0.193
0.004*
0.180
0.007*
0.120
0.076
−0.108
0.112
−0.089
0.190
1.00
PCAS-interpersonal treatment were associated with each other (r=0.872; p<0.001).
Further, the PCAS-Communication was associated with both the MCS-12 (r=0.162;
p=0.005) and PCS-12 (r=0.134; p=0.020) of the SF-12v2. In addition, the PCASCommunication was associated with both the BMQ-overuse (r= −0.164; p=0.004) and
BMQ-Harm (r=−0.231; p<0.001). Moreover, the PCAS-Communication was associated
with MMAS-8 (r=0.204; p=0.002). Likewise, the PCAS-Interpersonal treatment was
associated the MCS-12 (r=0.148; p=0.010) but not with the PCS-12 (p≥0.05). Further, the
PCAS-interpersonal treatment was associated with both the BMQ-overuse (r=−0.155;
p=0.007) and BMQ-Harm (r=−0.209; p=0.001). In addition, the PCAS-interpersonal
treatment was associated with the MMAS-8 (r=0.193; p=0.004). The MCS-12 was
associated with BMQ-Harm (r=−0.142; p=0.014) and with the MMAS-8 (r=0.180;
p=0.007). Finally, the BMQ-overuse and BMQ-Harm were associated with each other
(r=0.460; p<0.001).
4.11
Pearson Correlation Coefficients between the Participant-Specific Ratings of
Antihypertensive Medication Regimens and PROs
The correlation coefficients between participant-specific ratings of antihypertensive
medication regimens and participant-reported outcomes are listed in Table 4-21. The
participant-specific rating of antihypertensive medication regimen effectiveness was
associated with both the PCAS-Communication (r=0.192; p=0.006) and interpersonal
treatment (r=0.189; p=0.007) scales. Further, the participant-specific rating of
antihypertensive medication regimen effectiveness was associated with the PCS-12
(r=0.178; p=0.012). Likewise, the participant-specific antihypertensive medication
regimen ease of use rating was associated with the PCAS-Communication (r=0.157;
p=0.030). The participant-specific antihypertensive medication regimen cost, side effects,
and food interactions ratings were not associated with any of the measured participantreported outcomes (p≥0.05). Finally, the participant-specific overall antihypertensive
medication regimen rating was associated with PCAS-Communication (r=0.280;
p=0.001), PCAS-interpersonal treatment (r=0.223; p=0.002), and the BMQ-Harm
(r=−0.184; p=0.012) scales.
4.12
Older Adult Participants’ Views of Online Medication Rating Websites and
Their Satisfaction with Physician Communication
4.12.1 Path Model for the Association between PROMEX and PCASCommunication
A path model was built to examine the association between participants’ satisfaction
with physician communication and their views of online medication rating websites. The
PCAS-Communication scale was used to assess participant satisfaction with physician
communication, whereas, PROMEX was used to assess participant views of online
medication rating websites. Education, gender, age, health literacy, race, marital status,
and comorbidities were treated as exogenous variables that influence the
101
Table 4-21. Pearson correlation coefficients between the participant-specific rating of antihypertensive medication
regimens and participant-reported outcomes (PROs) variables.
Medication
PROMEX
PCASPCASMCS-12
use aspect
Communication Interpersonal
0.192
0.189
0.096
Effectiveness −0.010
0.887
0.006*
0.007*
0.180
−0.070
−0.073
−0.052
−0.021
Side effects
0.337
0.315
0.475
0.771
0.005
0.157
0.138
0.044
Ease of use
0.944
0.030*
0.055
0.545
0.036
0.108
0.116
−0.059
Cost
0.617
0.139
0.112
0.421
−0.002
0.071
0.096
−0.062
Food
0.975
0.339
0.197
0.408
interaction
−0.089
0.280
0.223
0.134
Overall
0.229
0.001*
0.002*
0.069
Note: (*) =p<0.05.
102
PCS-12
0.178
0.012*
0.085
0.245
0.094
0.195
0.106
0.146
0.074
0.324
0.124
0.095
BMQOveruse
−0.082
0.250
0.036
0.622
−0.073
0.314
−0.075
0.308
0.005
0.946
−0.128
0.082
BMQHarm
−0.133
0.062
−0.052
0.475
−0.122
0.093
−0.129
0.078
−0.092
0.217
−0.184
0.012*
MMAS-8
0.131
0.066
0.024
0.742
0.115
0.111
0.094
0.198
−0.045
0.544
0.107
0.148
participant satisfaction with physician communication (i.e., PCAS-Communication). The
PCAS-Communication was treated as both an endogenous variable in which it is
influenced by the exogenous variables, as well as an exogenous variable in which it
influences participant views of online medication rating websites (i.e., PROMEX). The
results of the path analysis are presented in Figure 4-9 and Table 4-22. Participant views
of online medication rating websites (i.e., PROMEX) were not influenced by participant
satisfaction with physician communication (i.e., PCAS-Communication) (p≥0.05).
Further, their views were not influenced by other exogenous variables (i.e., age, race,
education, etc.) (p≥0.05). However, participant satisfaction with physician
communication (i.e., PCAS-Communication) was positively influenced by marital status
(β=0.119; p=0.049), health literacy (β=0.18; p=0.002), and gender (β=0.123; p=0.038),
and negatively influenced by race (β=−0.14; p=0.019). An analysis of the fit indices
indicated adequate model fit (comparative fit index=1.00, adjusted goodness of fit
index=0.99, root mean square error of approximation= 0.00, and standardized root mean
square residual=0.020).
4.12.2 Multiple Linear Regression for the Association between PROMEX and
PCAS-Communication
In addition to the path analysis, a multiple linear regression analysis was completed to
examine the association between PROMEX and the PCAS-Communication controlling
for the same sociodemographic factors in the path model as well as comorbidities. As
with the path analysis, no significant association was found between PROMEX and
PCAS-Communication (p≥0.05) (Table 4-23).
4.13
Older Adult Participants’ Satisfaction with Physician Communication and
Overall Rating of Their Antihypertensive Medication Regimens
The results of the multiple linear regression analysis that examined the association
between the Primary Care Assessment Survey communication scale (PCASCommunication) and participants’ overall rating of their antihypertensive medication
regimens are listed in Table 4-24. The higher the overall rating of antihypertensive
medication regimen score, the higher the score of the PCAS-Communication (β=5.031;
p=0.005). Hypertensive participants with high overall rating of their antihypertensive
medication regimens were more likely to have high PCAS-Communication score
compared to participants with low overall rating of their antihypertensive medication
regimens controlling for their age, comorbidities, race, education, and gender, marital
status, number of prescription medications, and health literacy level. Health literacy also
influenced the satisfaction with physician communication; participants with good health
literacy level were more likely to have higher PCAS-Communication scores (β=9.965;
p=0.007). Age, comorbidities, race, education, gender, number of prescription
medications, and marital status were not associated with the PCAS-Communication
(p≥0.05).
103
Figure 4-9.
Path analysis: Association between PROMEX and PCAS-Communication.
104
Table 4-22. Path analysis: Standardized direct, indirect, and total effects of the variables evaluated on PROMEX and
PCAS-Communication (n=286).
Outcome variables
R2
Patient Reviews of
Medication Experiences
(PROMEX)
0.002
PCAS-Communication
0.11
Predictor
variables
PCASCommunication
Age
Education
Marital status
Health literacy
Comorbidities
Race
Gender
Age
Education
Marital status
Health literacy
Comorbidities
Race
Gender
Standardized
direct effect (β)
0.045
Standardized
indirect effect (β)
0.00
0.00
0.00
0.00
0.00
0.00
0.00
0.00
−0.04
0.024
0.119
0.181
−0.06
−0.14
0.123
−0.002
0.001
0.005
0.008
−0.002
−0.006
0.005
0.00
0.00
0.00
0.00
0.00
0.00
0.00
Notes: R-Square= 0.01. (*)=p<0.05.
105
Standardized
total effect (β)
0.045
−0.002
0.001
0.005
0.008
−0.002
−0.006
0.005
−0.04
0.024
0.119
0.181
−0.06
−0.14
0.123
p-Value
0.465
0.606
0.727
0.494
0.478
0.546
0.486
0.491
0.466
0.692
0.049*
0.002*
0.283
0.019*
0.038*
Table 4-23. Multiple linear regression: The association between PROMEX and
PCAS-Communication (n=286).
Variable
PCASCommunication
Age
Comorbidity
score
Education
Race
Health literacy
Gender
Marital status
95% Confidence limits
Lower
Upper
−0.01
0.062
Beta (β) estimate
0.023
p-Value
0.230
0.001
0.215
0.973
0.164
−0.08
−0.08
0.084
0.520
−0.02
0.747
−0.06
−0.89
0.083
0.831
0.167
0.937
0.276
0.906
−0.29
−0.31
−1.57
−2.49
−1.31
0.235
1.810
1.458
0.718
1.486
Notes: R-Square= 0.02. (*)=p<0.05.
106
Table 4-24. Multiple linear regression: The association between hypertensive
participants’ PCAS-Communication scale scores and overall ratings of their
antihypertensive medication regimens (n=193).
Variable
Overall rating
of HTN
medications
Age
Comorbidity
score
Education
Race
Health literacy
Gender
Number of
prescription
medications
Marital status
Beta (β) estimate
5.031
p-Value
0.005*
95% Confidence limits
Lower
Upper
1.513
8.550
−0.026
0.318
0.884
0.695
−0.391
−1.290
0.337
1.928
0.582
−1.490
9.965
3.285
−0.662
0.340
0.523
0.007*
0.358
0.343
−0.621
−6.094
2.648
−3.755
−2.039
1.787
3.113
17.282
10.325
0.714
3.012
0.344
−3.263
9.287
Notes: R-Square= 0.17. (*)=p<0.05.
107
4.14
Older Adults’ Views of Online Medication Rating Websites and Their
Quality of Life
4.14.1 Path Model for the Association between PROMEX and MCS-12
The results of the path model that tested the association between participants’ views
of online medication rating websites (i.e., PROMEX) and their mental health quality of
life (MCS-12) are presented in Figure 4-10 and Table 4-25. The participants’ views of
online medication rating websites (i.e., PROMEX) were not influenced by their mental
health quality of life (i.e., MCS-12) (p≥0.05). Further, their views were not influenced by
other exogenous variables (i.e., age, race, education…etc.) (p≥0.05). However, the older
adults’ mental health quality of life (MCS-12) was positively influenced by their age
(β=0.219; p=0.001), education (β=0.144; p=0.014), and health literacy (β=0.243;
p=<0.001), and negatively influenced by their comorbidities (β=−0.178; p=0.001). An
analysis of the fit indices indicated adequate model fit (comparative fit index=1.00,
adjusted goodness of fit index=0.99, root mean square error of approximation= 0.00, and
standardized root mean square residual=0.015).
4.14.2 Path Model for the Association between PROMEX and PCS-12
The results of the path model that tested the association between participants’ views
of online medication rating websites (i.e., PROMEX) and their physical health quality of
life (PCS-12) are presented in Figure 4-11 and Table 4-26. The participants’ views of
online medication rating websites (i.e., PROMEX) were significantly influenced by their
physical health quality of life (i.e., PCS-12) (β=−0.126; p=0.040). Participants with low
PCS-12 scores were more likely to have favorable views of online medication rating
websites. However, their views were not influenced by other exogenous variables (i.e.,
age, race, education…etc.) (p≥0.05). The participants’ physical health quality of life
(PCS-12) was positively influenced by their satisfaction with physician communication
(i.e., PCAS-Communication) (β=0.125; p=0.035). However, it was negatively influenced
by their age (β=−0.120; p=0.048) and comorbidities (β=−0.360; p<0.001). An analysis of
the fit indices indicated adequate model fit (comparative fit index=1.00, adjusted
goodness of fit index=0.99, root mean square error of approximation= 0.00, and
standardized root mean square residual=0.015).
4.14.3 Multiple Linear Regression for the Association between PROMEX and Both
PCS-12 and MCS-12
In addition to the path analyses, we did multiple linear regression analyses to examine
the association between PROMEX and the quality of life scales (i.e., PCS-12 and MCS12) controlling for the same variables in the path analyses. In the first regression model,
we examined the association between the mental quality of life (i.e., MCS-12) and
participants’ views of online medication rating websites (i.e., PROMEX). As with the
108
Figure 4-10. Path analysis: The association between PROMEX and MCS-12.
109
Table 4-25. Path analysis: Standardized direct, indirect, and total effects of the variables evaluated on PROMEX and
MCS-12 (n=286).
Outcome variables
Patient Reviews of
Medication Experiences
(PROMEX)
MCS-12
R2
0.012
0.189
Predictor
variables
MCS-12
PCASInterpersonal
Treatment
Age
Education
Marital status
Health literacy
Comorbidities
Race
Gender
PCASInterpersonal
Treatment
Age
Education
Marital status
Health literacy
Comorbidities
Race
Gender
Standardized
direct effect (β)
−0.111
0.00
Standardized
indirect effect (β)
0.00
−0.01
Standardized
total effect (β)
−0.111
−0.01
p-Value
0.00
0.00
0.00
0.00
0.00
0.00
0.00
0.11
−0.024
−0.016
−0.011
−0.027
0.019
−0.004
−0.012
0.00
−0.024
−0.016
−0.011
0.099
0.019
−0.004
−0.012
0.111
0.107
0.147
0.209
0.099
0.118
0.561
0.194
0.052
0.219
0.144
0.103
0.243
−0.178
0.037
0.108
0.00
0.00
0.00
0.00
0.00
0.00
0.00
0.219
0.144
0.103
0.243
−0.178
0.037
0.108
0.001*
0.014*
0.078
<0.001*
0.001*
0.539
0.060
Notes: R-Square= 0.01. (*)=p<0.05.
110
0.071
0.188
Figure 4-11. Path analysis: The association between PROMEX and PCS-12.
111
Table 4-26. Path analysis: Standardized direct, indirect, and total effects of the variables evaluated on PROMEX and
PCS-12 (n=286).
Outcome variables
Patient Reviews of
Medication Experiences
(PROMEX)
PCS-12
R2
0.016
0.174
Predictor
variables
PCS-12
PCASCommunication
Age
Education
Marital Status
Health Literacy
Comorbidities
Race
Gender
PCASCommunication
Age
Education
Marital Status
Health Literacy
Comorbidities
Race
Gender
Standardized
direct effect (β)
−0.126
0.00
Standardized
indirect effect (β)
0.00
−0.015
Standardized
total effect (β)
−0.126
−0.015
p-Value
0.00
0.00
0.00
0.00
0.00
0.00
0.00
0.125
0.015
−0.001
0.013
−0.001
0.045
0.007
0.002
0.00
0.015
−0.001
0.013
−0.001
0.045
0.007
0.002
0.125
0.156
0.939
0.167
0.977
0.051
0.369
0.786
0.035*
−0.120
0.004
−0.110
0.001
−0.360
−0.061
−0.015
0.00
0.00
0.00
0.00
0.00
0.00
0.00
−0.120
0.004
−0.110
0.001
−0.360
−0.061
−0.015
0.048*
0.939
0.061
0.977
<0.001*
0.317
0.784
Notes: R-Square=0.01. (*)=p<0.05.
112
0.040*
0.142
path analysis, the MCS-12 did not influence PROMEX (p≥0.05) (Table 4-27). In the
second regression model, we examined the association between the physical quality of
life (i.e., PCS-12) and participants’ views of online medication rating websites (i.e.,
PROMEX). Contrary to the path analysis, the PCS-12 did not influence PROMEX
(p≥0.05) (Table 4-28). In the third regression model, we included both the PCS-12 and
the MCS-12 to examine the effects of both HRQoL measures on participants’ views of
online medication rating websites; however, no significant association was found
between either PCS-12 or MCS-12 and PROMEX (p≥0.05) (Table 4-29).
4.15
The Health-Related Quality of Life and the Overall Rating of
Antihypertensive Regimens
4.15.1 The Association between the MCS-12 and the Overall Rating of
Antihypertensive Regimens
The results of the multiple regression analysis that examined the association between
the MCS-12 and the overall rating of antihypertensive medication regimens are presented
in Table 4-30. The participants’ overall rating of antihypertensive medication regimens
did not influence their mental health quality of life (i.e. MCS-12) (p≥0.05). However,
age and health literacy were positively associated the MCS-12, and participants’
comorbidities was negatively associated with MCS-12 (p<0.05).
4.15.2 The Association between the PCS-12 and the Overall Rating of
Antihypertensive Regimens
The results of the multiple regression analysis that examined the association between
the PCS-12 and the overall rating of antihypertensive medication regimens are presented
in Table 4-31. The participants’ overall rating of antihypertensive medication regimens
significantly influenced their physical health quality of life (i.e., PCS-12) (β=2.740;
p=0.005). The higher the overall rating of antihypertensive medication regimens, the
more likely participants will have high PCS-12 scores controlling for their age,
comorbidities, race, education, and gender, marital status, number of prescription
medications, and health literacy level. Further, comorbidities also influenced participants’
physical health quality of life (i.e., PCS-12) (β=−1.202; p=0.008). The more diseases
participants have, the more likely they will have lower PCS-12 scores.
113
Table 4-27. Multiple linear regression: The association between PROMEX and
HRQoL (MCS-12) (n=286).
Variable
MCS-12
PCASCommunication
Age
Comorbidity
score
Education
Race
Health literacy
Gender
Marital status
Beta (β) estimate
−0.057
0.025
p-Value
0.127
0.189
95% Confidence limits
Lower
Upper
−0.130
0.016
−0.012
0.064
0.015
0.170
0.714
0.277
−0.069
−0.138
0.100
0.480
0.003
0.776
0.229
−0.741
0.206
0.980
0.150
0.772
0.366
0.773
−0.262
−0.284
−1.330
−2.358
−1.201
0.269
1.837
1.790
0.874
1.614
Note: R-Square= 0.03.
114
Table 4-28. Multiple linear regression: The association between PROMEX and
HRQoL (PCS-12) (n=286).
Variable
PCS-12
PCASCommunication
Age
Comorbidity
score
Education
Race
Health literacy
Gender
Marital status
Beta (β) estimate
−0.059
0.028
p-Value
0.089
0.157
95% Confidence limits
Lower
Upper
−0.129
0.009
−0.010
0.067
−0.007
0.112
0.861
0.497
−0.090
−0.213
0.076
0.438
−0.027
0.690
−0.058
−0.914
−0.057
0.837
0.200
0.939
0.262
0.935
−0.289
−0.370
−1.571
−2.517
−1.464
0.235
1.751
1.455
0.689
1.349
Note: R-Square=0.03.
115
Table 4-29. Multiple linear regression: The association between PROMEX and
HRQoL (PCS-12 and MCS-12) (n=286).
Variable
PCS-12
MCS-12
PCASCommunication
Age
Comorbidity
score
Education
Race
Health literacy
Gender
Marital status
95% Confidence limits
Lower
Upper
−0.137
0.001
−0.139
0.007
−0.007
0.070
Beta (β) estimate
−0.067
−0.065
0.031
p-Value
0.056
0.079
0.115
0.008
0.047
0.850
0.777
−0.076
−0.284
0.092
0.380
0.009
0.716
0.277
−0.745
0.066
0.944
0.183
0.725
0.361
0.926
−0.255
−0.340
−1.275
−2.353
−1.341
0.274
1.773
1.830
0.862
1.473
Note: R-Square= 0.04.
116
Table 4-30. Multiple linear regression: The association between hypertensive
participants’ MCS-12 scores and overall ratings of their antihypertensive
medication regimens (n=193).
Variable
Overall rating
of HTN
medications
Age
Comorbidity
score
Education
Race
Health literacy
Gender
Number of
prescription
medications
Marital status
Beta (β) estimate
0.410
p-Value
0.636
95% Confidence limits
Lower
Upper
−1.300
2.120
0.329
−1.299
0.001*
0.001*
0.152
−2.082
0.507
−0.515
0.375
1.191
5.230
2.193
0.591
0.210
0.295
0.004*
0.207
0.082
−0.213
−1.051
1.672
−1.228
−0.077
0.965
3.434
8.788
5.616
1.260
1.402
0.365
−1.650
4.454
Notes: R-Square: 0.20. (*)=p<0.05.
117
Table 4-31. Multiple linear regression: The association between hypertensive
participants’ PCS-12 scores and overall ratings of their antihypertensive
medication regimens (n=193).
Variable
Overall rating
of HTN
medications
Age
Comorbidity
score
Education
Race
Health
literacy
Gender
Number of
prescription
medications
Marital status
Beta (β) estimate
2.740
p-Value
0.005*
95% Confidence limits
Lower
Upper
0.809
4.672
−0.071
−1.202
0.481
0.008*
−0.271
−2.087
0.128
−0.318
0.064
−2.123
−3.972
0.848
0.099
0.052
−0.600
−4.655
−7.989
0.730
0.409
0.044
−0.558
−0.540
0.775
0.159
−4.422
−1.296
3.305
0.214
−0.598
0.731
−4.044
2.846
Notes: R-Square=0.15. (*)=p<0.05.
118
4.16
Older Adult Participants’ Views of Online Medication Rating Websites and
Their Beliefs about Medications
4.16.1 Path Model for the Association between PROMEX and BMQ-Overuse Scale
The results of the path analysis that examined the association between participants’
views of online medication rating websites and BMQ-overuse are presented in
Figure 4-12 and Table 4-32. The participants’ views of online medication rating
websites (i.e., PROMEX), were not influenced by the beliefs that medications are
generally overused or overprescribed (i.e., BMQ-overuse) (p≥0.05). Further, PROMEX
was not influenced by the other exogenous variables (i.e., age, gender, education, etc.).
However, BMQ-overuse was negatively influenced by PCAS-Communication
(β=−0.194; p=0.001), and the number of prescription medications taken (β=−0.202;
p=0.001), and positively influenced by gender (β=0.175, p=0.001). Participants who were
satisfied with their physician communication were less likely to believe that medications
are overused or overprescribed. Further, the higher the number of prescription
medications taken by participants, the less likely they believe medications are
overprescribed or overused. On the other hand, women were more likely than men to
believe that medications are overprescribed or overused. An analysis of the fit indices
indicated adequate model fit (comparative fit index=1.00, adjusted goodness of fit
index=0.999, root mean square error of approximation= 0.00, and standardized root mean
square residual=0.017).
4.16.2 Path Model for the Association between PROMEX and BMQ-Harm Scale
The results of the path analysis that examined the association between participants’
views of online medication rating websites and BMQ-Harm are presented in Figure 4-13
and Table 4-33. The participants’ views of online medication rating websites (i.e.,
PROMEX), were not influenced by the beliefs that medications are inherently harmful
(i.e., BMQ-overuse) (p≥0.05). Further, PROMEX was not influenced by the other
exogenous variables (i.e., age, gender, education, etc.). However, the BMQ-Harm was
negatively influenced by the PCAS-Communication (β=−0.221; p<0.001), age
(β=−0.177; p=0.002), education (β=−0.124; p=0.030), and number of prescription
medications taken (β=−0.185; p=0.001). Participants who were satisfied with their
physician communication were less likely to believe that medications are harmful.
Further, the older the participants, the less likely they believe that medications are
harmful. In addition, participants with higher levels of education were less likely to
believe medications are harmful. Moreover, the higher the number of prescription
medications taken by participants, the less likely they believe medications are harmful.
An analysis of the fit indices indicated adequate model fit (comparative fit index=0.993,
adjusted goodness of fit index=0.999, root mean square error of approximation=0.01, and
standardized root mean square residual=0.021).
119
Figure 4-12. Path analysis: The association between PROMEX and BMQ-Overuse.
120
Table 4-32. Path analysis: Standardized direct, indirect, and total effects of the variables evaluated on PROMEX and
BMQ-Overuse (n=286).
Outcome variables
Patient Reviews of
Medication Experiences
(PROMEX)
BMQ-Overuse
R2
Predictor variables
0.005
BMQ-Overuse
PCASCommunication
Age
Education
Number of
prescription
medications
Race
Gender
PCASCommunication
Age
Education
Number of
prescription
medications
Race
Gender
0.111
Standardized
direct effect (β)
−0.070
0.00
Standardized
indirect effect (β)
0.00
0.013
0.00
0.00
0.00
0.002
−0.00
0.014
0.002
−0.00
0.014
0.606
0.426
0.261
0.00
0.00
−0.194
0.004
−0.01
0.00
0.004
−0.01
−0.194
0.447
0.269
0.001*
−0.034
0.063
−0.202
0.00
0.00
0.00
−0.034
0.063
−0.202
0.567
0.282
0.001*
−0.059
0.175
0.00
0.00
−0.059
0.175
0.321
0.001*
Notes: R-Square=0.01. (*)=p<0.05.
121
Standardized
total effect (β)
−0.070
0.013
p-Value
0.236
0.264
Figure 4-13. Path analysis: The association between PROMEX and BMQ-Harm.
122
Table 4-33. Path analysis: Standardized direct, indirect, and total effects of the variables evaluated on PROMEX and
BMQ-Harm (n=286).
Outcome variables
Patient Reviews of
Medication Experiences
(PROMEX)
BMQ-Harm
R2
Predictor variables
0.003
BMQ-Harm
PCASCommunication
Age
Education
Number of
prescription
medications
Race
Gender
PCASCommunication
Age
Education level
Number of
prescription
medications
Race
Gender
0.140
Standardized
direct effect (β)
−0.052
0.00
Standardized
indirect effect (β)
0.00
0.011
Standardized
total effect (β)
−0.052
0.011
p-Value
0.00
0.00
0.00
0.009
0.006
0.009
0.009
0.006
0.009
0.398
0.415
0.395
0.00
0.00
−0.221
−0.001
−0.003
0.00
−0.001
−0.003
−0.221
0.667
0.471
<0.001*
−0.177
−0.124
−0.185
0.00
0.00
0.00
−0.177
−0.124
−0.185
0.002*
0.030*
0.001*
0.028
0.070
0.00
0.00
0.028
0.070
0.623
0.208
Notes: R-Square= 0.01. (*)=p<0.05.
123
0.379
0.391
4.16.3 Multiple Linear Regression for the Association between PROMEX and Both
BMQ-Overuse and BMQ-Harm
In addition to the path analyses, a multiple linear regression analysis was performed
to examine the association between PROMEX and beliefs about medications (i.e., BMQoveruse & BMQ-Harm) controlling for the same variables as in the path analyses. The
results of this multiple linear regression in which both BMQ-overuse and BMQ-Harm
were included are presented in Table 4-34. Neither BMQ-overuse nor BMQ-Harm
influenced PROMEX (i.e., participants’ views of online medication rating websites)
(p≥0.05).
4.17
Beliefs about Medications and the Overall Rating of Antihypertensive
Regimens
4.17.1 The Association between BMQ-Overuse and the Overall Rating of
Antihypertensive Regimens
The results of the regression analysis that examined the association between BMQOveruse and the overall rating of antihypertensive medication are presented in
Table 4-35. The overall rating of antihypertensive medication regimens did not
significantly influence the BMQ-Overuse controlling for age, race, education, and health
literacy, number of prescription medications, comorbidities, gender, and marital status
(p≥0.05). Female participants were more likely to have high BMQ-Overuse score
compared to male participants (β=1.204, p=0.024), controlling for their age, race,
education, and health literacy, number of prescription medications, comorbidities, and
marital status. On the other hand, the number of prescription medication negatively
influenced the BMQ-Overuse score (β=−0.256, p=0.014), controlling for their age, race,
education, and health literacy, comorbidities, overall rating of antihypertensive
medication regimens, gender, and marital status.
4.17.2 The Association between BMQ-Harm and the Overall Rating of
Antihypertensive Regimens
The results of the regression analysis that examined the association between BMQHarm and the overall rating of antihypertensive medication are presented in Table 4-36.
The overall rating of antihypertensive medication regimens significantly influenced the
BMQ-Harm (β=−0.601; p=0.035). The higher overall rating of antihypertensive
medication regimens, the less likely participants believe medications are harmful
controlling for age, race, education, health literacy, number of prescription medications,
comorbidities, gender, and marital status. Further, age (β=−0.077; p=0.009), and
education (β=−0.219; p=0.024), significantly influenced the BMQ-Harm score. The older
the participants, and the lower their level of education the less likely they believe that
medications are harmful controlling for race, health literacy, number of prescription
124
Table 4-34. Multiple linear regression: The association between PROMEX and
BMQ-Overuse and BMQ-Harm (n=286).
Variable
BMQ-Overuse
BMQ-Harm
PCASCommunication
Age
Number of
prescription
medications
Education
Race
Gender
Beta (β) estimate
−0.02
−0.04
0.023
p-Value
0.855
0.707
0.208
95% Confidence Limits
Lower
Upper
−0.26
0.221
−0.30
0.209
−0.01
0.060
−0.01
0.146
0.756
0.227
−0.09
−0.09
0.067
0.385
−0.02
0.856
−0.60
0.834
0.100
0.427
−0.28
−0.16
−2.09
0.230
1.879
0.891
Notes: R-Square= 0.02. (*)=p<0.05.
125
Table 4-35. Multiple linear regression: The association between hypertensive
participants’ overall ratings of their antihypertensive medication regimens and
BMQ-Overuse (n=193).
Variable
Overall rating
of HTN
medications
Age
Comorbidity
score
Education
Race
Health literacy
Gender
Number of
prescription
medications
Marital status
Beta (β) estimate
−0.514
p-Value
0.053
95% Confidence limits
Lower
Upper
−1.036
0.007
−0.005
0.048
0.849
0.688
−0.059
−0.190
0.048
0.287
0.070
−0.050
−0.036
1.204
−0.256
0.434
0.883
0.946
0.024*
0.014*
−0.107
−0.733
−1.121
0.160
−0.461
0.249
0.632
1.048
2.248
−0.052
−0.208
0.659
−1.138
0.722
Notes: R-Square=0.12. (*)=p<0.05.
126
Table 4-36. Multiple linear regression: The association between hypertensive
participants’ overall ratings of their antihypertensive medication regimens and
BMQ-Harm (n=193).
Variable
Overall rating
of HTN
medications
Age
Comorbidity
score
Education
Race
Health literacy
Gender
Number of
prescription
medications
Marital status
Beta (β) estimate
−0.601
p-Value
0.035*
95% Confidence limits
Lower
Upper
−1.161
−0.042
−0.077
−0.041
0.009*
0.747
−0.135
−0.298
−0.019
0.214
−0.219
−0.041
−0.002
0.529
−0.143
0.024*
0.909
0.997
0.354
0.207
−0.411
−0.767
−1.163
−0.598
−0.366
−0.028
0.683
1.158
1.657
0.080
0.246
0.626
−0.752
1.244
Notes: R-Square= 0.13. (*)=p<0.05.
127
medications, comorbidities, gender, and marital status. Further, age (β=−0.077; p=0.009),
and education (β=−0.219; p=0.024), significantly influenced the BMQ-Harm score. The
older the participants, and the lower their level of education the less likely they believe
that medications are harmful controlling for race, health literacy, number of prescription
medications, comorbidities, overall rating of antihypertensive medication regimens,
gender, and marital status.
4.18
Older Adult Participants’ Views of Online Medication Rating Websites and
Adherence to Antihypertensive Medication Regimens
4.18.1 Path Model for the Association between PROMEX and Morisky Medication
Adherence Scale (MMAS-8)
The results of the path analysis that examined the association between participants’
views of online medication rating websites (i.e., PROMEX) and adherence to
antihypertensive medication regimens are presented in Figure 4-14 and Table 4-37. The
Morisky Medication Adherence scale (MMAS-8) (i.e., medication adherence) was not
associated with participants’ views of the online medications rating websites (i.e.,
PROMEX) (p≥0.05). Moreover, none of the other exogenous variables (i.e., age,
education, gender, etc.) were associated with PROMEX (p≥0.05). However, participants’
satisfaction with physician communication (i.e., PCAS-Communication) was positively
associated with medication adherence (β=0.22; p=0.003). Participants with high levels of
satisfaction with physician communication (i.e., high PCAS-Communication score) were
more likely to have high adherence levels to their antihypertensive medication regimens.
Further, age was also positively associated with medication adherence (β=0.26; p=0.001).
Adherence to antihypertensive medication regimens increased as the age of the
participants increased. In addition, the overall rating of regimens were positively
associated with medication adherence (β=0.21; p=0.003). The higher the overall rating of
regimens, the more likely participants will be adherent to the regimens. Education,
gender, age, comorbidities, the number of prescription medications, Beliefs about
Medicine (BMQ) General-Overuse domain, and race were not associated with medication
adherence (p≥0.05). Further, BMQ-Harm was negatively associated with participants’
overall rating of their regimens (β=−0.18; p=0.018). Older adults who did not believe
medications are generally harmful were more likely to give a high overall rating to their
regimens. Health literacy was also positively associated with the overall rating of
regimens (β=0.24; p=0.001). Participants with good health literacy level were more likely
to give high overall rating to their regimens. On the other hand, the number of
prescription medications taken was not associated with the overall rating of
antihypertensive medications (p≥0.05). An analysis of the fit indices indicated adequate
model fit (comparative fit index=0.985, adjusted goodness of fit index=0.995, root mean
square error of approximation=0.02, and standardized root mean square residual=0.035).
128
Figure 4-14. Path analysis: The association between PROMEX and MMAS-8 (adherence).
129
Table 4-37. Path analysis: Standardized direct, indirect, and total effects of the variables evaluated on PROMEX and
MMAS-8 (n=286).
Outcome variables
Patient Reviews of
Medication Experiences
(PROMEX)
Medication adherence
(MMAS-8)
Overall rating of
hypertension (HTN)
medication regimen
R2
Predictor variables
0.018
Medication Adherence
Age
BMQ-Overuse
BMQ-Harm
Race
Overall Rating HTN Meds
Communication
Comorbidities
Gender
Health Literacy
Number of Prescription
Medications
Education
BMQ-Overuse
Gender
Overall Rating of HTN
Meds
Communication
Age
Education
Comorbidities
Race
BMQ-Harm
Health Literacy
Number of Prescription
Medications (RX number)
0.211
0.123
Standardized
direct effect (β)
−0.13
0.00
0.00
0.00
0.00
0.00
0.00
0.00
0.00
0.00
0.00
Standardized
indirect effect (β)
0.00
−0.03
0.002
0.005
0.011
−0.02
−0.03
−0.00
−0.01
−0.006
−0.00
Standardized
total effect (β)
−0.13
−0.03
0.002
0.005
0.011
−0.02
−0.03
−0.00
−0.01
−0.006
−0.00
p-Value
0.00
−0.01
0.100
0.207
0.011
0.00
0.00
0.00
0.011
−0.01
0.100
0.207
0.353
0.835
0.168
0.003*
0.218
0.260
−0.08
−0.006
−0.08
−0.17
0.237
0.142
0.00
0.00
0.00
0.00
0.00
0.00
0.00
0.00
0.218
0.260
−0.08
−0.006
−0.08
−0.17
0.237
0.142
0.003*
0.001*
0.272
0.933
0.275
0.018*
0.001*
0.056
Notes: R-Square=0.01. (*)=p<0.05.
130
0.079
0.118
0.836
0.208
0.355
0.134
0.136
0.933
0.280
0.176
0.241
4.18.2 Regression Model for the Association between PROMEX and Morisky
Medication Adherence Scale ( MMAS-8)
The results of the regression model that examined the association between PROMEX
and MMAS-8 are presented in Table 4-38. Medication adherence to antihypertensive
medication regimens did not influence participants’ views of online medication rating
websites (i.e., PROMEX) (p≥0.05), however, comorbidity score did influence PROMEX
(β=0.492; p=0.045). Hypertensive participants with multiple comorbidities or diseases
were more likely to have favorable views of online medication rating websites controlling
for their medication adherence, satisfaction with physician communication, beliefs about
medications, overall rating of antihypertensive medication regimens, age, education, race,
health literacy, gender, the number of prescription medications, and marital status.
4.19
Medication Adherence and the Overall Rating of Antihypertensive Regimens
The results of the regression model that examined the association between medication
adherence and the overall rating of antihypertensive medication regimens are presented in
Table 4-39. As with path analysis, the overall rating of antihypertensive medication
regimens was positively associated with Morisky Medication Adherence Scale Score
(MMAS-8) (β=0.408; p=0.004). The higher the overall rating of antihypertensive
medication regimens, the higher the adherence level to these medication regimens
controlling for age, comorbidities, education, race, health literacy, gender, number of
prescription medications, and marital status. Further, age was positively associated with
medication adherence to the regimens controlling for the overall rating of these
medication regimens, comorbidities, education, race, health literacy, gender, the number
of prescription medications, and marital status (β=0.049; p=0.001).
4.20 An Overarching Path Model of the Association between Older Adults’ Views
of Online Medication Rating Websites and Participant-Reported Outcomes
The results of the path model that examined the association of participants’ online
medication rating websites (i.e., PROMEX), health-related quality of life (i.e., PCS-12
and MCS-12), and beliefs about medications (i.e., BMQ-Harm and BMQ-Overuse) are
presented in Figure 4-15 and Table 4-40. The healthcare decision sharing preference was
positively associated with PROMEX (β=0.179; p=0.003). Participants who like to have
an equal partnership with their physicians concerning their healthcare were likely to have
favorable views of the online medication rating websites compared to those who like to
either keep their healthcare decision in their own hands or leave it in the doctors’ hands.
Further, both PCS-12 (β=−0.129; p=0.033) and MCS-12 (β=−0.130; p=0.032) of the SF12v2 were negatively associated with PROMEX. Participants with poor physical and
mental HRQoL were more likely to have favorable views of the online medication rating
websites compared to those with good quality of life. In addition, comorbidity score was
positively associated with PROMEX (β=0.059; p=0.007). Participants with multiple
diseases or comorbidities were more likely to view the online medication rating websites
131
Table 4-38. Multiple linear regression: The association between participants’
medication adherence (MMAS-8 Score) and PROMEX (n=286).
Variable
MMAS-8
(adherence)
PCASCommunication
BMQ-Overuse
BMQ-Harm
Overall rating
of HTN
medications
Age
Comorbidity
score
Education
Race
Health literacy
Gender
Number of
prescription
medications
Marital status
Beta (β) estimate
−0.460
p-Value
0.146
95% Confidence limits
Lower
Upper
−1.084
0.163
0.040
0.125
−0.011
0.092
0.078
0.082
−0.425
0.670
0.633
0.446
−0.284
−0.257
−1.529
0.441
0.422
0.677
0.030
0.492
0.608
0.045*
−0.085
0.009
0.146
0.975
−0.069
0.953
0.406
−1.321
−0.020
0.715
0.171
0.720
0.235
0.927
−0.445
−0.416
−1.831
−3.513
−0.454
0.306
2.322
2.644
0.869
0.414
−0.073
0.939
−1.963
1.817
Notes: R-Square= 0.09. (*)=p<0.05.
132
Table 4-39. Multiple linear regression: The association between overall ratings
of antihypertensive medication regimens and MMAS-8 score (n=193).
Variable
Overall rating
of HTN
medications
Age
Comorbidity
score
Education
Race
Health literacy
Gender
Number of
prescription
medications
Marital status
95% Confidence limits
Lower
Upper
0.131
0.684
Beta (β) estimate
0.408
p-Value
0.004*
0.049
0.020
0.001*
0.749
0.020
−0.119
0.078
0.133
−0.053
−0.124
0.478
0.403
−0.010
0.268
0.502
0.102
0.153
0.851
−0.143
−0.503
−0.103
−0.107
−0.113
0.046
0.220
1.047
0.999
0.103
0.269
0.282
−0.235
0.752
Notes: R-Square=0.19. (*)=p<0.05.
133
Figure 4-15. Path analysis: The association between PROMEX and PROs.
Notes: Dashed lines represent the indirect relationships. Continuous lines represent direct
relationships.
134
135
Table 4-40. Standardized direct, indirect, and total effects of the variables evaluated on PROMEX, PCS-12, MCS-12,
BMQ-Harm and BMQ-Overuse, and PCAS-Communication scales (n=286).
Outcome variables
Patient Reviews of
Medication Experiences
(PROMEX)
R2
Predictor variables
0.063
Healthcare decision
sharing
SF-12v2 Physical
Component Summary
(PCS-12)
SF-12v2 Mental
Component Summary
(MCS-12)
PCAS-Communication
Age
Comorbidities
Education
Race
Gender
Health literacy
Marital status
Number of prescription
medications
Standardized
direct effect (β)
0.179
Standardized
indirect effect (β)
0.00
Standardized
total effect (β)
0.179
p-Value
−0.129
0.00
−0.129
0.033*
−0.130
0.00
−0.130
0.032*
0.00
0.00
0.00
0.00
0.00
0.00
0.00
0.00
0.00
−0.02
−0.01
0.059
−0.01
0.003
−0.00
−0.037
−0.01
−0.02
−0.02
−0.01
0.059
−0.01
0.003
−0.00
−0.037
−0.01
−0.02
0.057
0.319
0.007*
0.177
0.168
0.155
0.034*
0.141
0.113
136
0.003*
Table 4-40.
Continued.
Outcome variables
SF-12v2 Mental
Component Summary
(MCS-12)
SF-12v2 Physical
Component Summary
(PCS-12)
PCAS-Communication
R2
0.179
Predictor variables
Marital status
PCAS-Communication
Age
Education
Health literacy
Comorbidities
Gender
Race
0.176
Age
PCAS-Communication
Number of prescription
Medications
Comorbidities
Education
Race
Gender
Health literacy
Marital status
0.1
Race
Gender
Health literacy
Marital status
Standardized
direct effect (β)
0.089
0.068
0.212
0.158
0.259
−0.183
0.00
0.00
−0.076
0.136
−0.159
Standardized
indirect effect (β)
0.00
0.00
0.00
0.00
0.00
0.00
0.008
−0.00
0.00
0.00
0.00
Standardized
total effect (β)
0.089
0.068
0.212
0.158
0.259
−0.183
0.008
−0.00
−0.076
0.136
−0.159
0.124
0.251
0.001*
0.007*
<0.001*
0.001*
0.312
0.319
0.193
0.017*
0.017*
−0.275
−0.007
0.00
0.00
0.00
0.00
−0.123
0.131
0.206
0.135
0.00
0.00
−0.01
0.017
0.028
0.018
0.00
0.00
0.00
0.00
−0.275
−0.007
−0.01
0.017
0.028
0.018
−0.123
0.131
0.206
0.135
<0.001*
0.904
0.125
0.110
0.052
0.104
0.043*
0.030*
0.001*
0.025*
137
p-Value
Table 4-40.
Continued.
Outcome variables
BMQ-Harm
BMQ-Overuse
R2
0.1
0.1
Predictor variables
PCAS-Communication
Race
Number of prescription
medications
Gender
Health literacy
Marital status
PCAS-Communication
Gender
Number of prescription
medications
Race
Health literacy
Marital status
Standardized
direct effect (β)
−0.21
0.136
−0.17
Standardized
indirect effect (β)
0.00
0.00
0.00
Standardized
total effect (β)
−0.21
0.136
−0.17
p-Value
0.00
0.00
0.00
−0.178
0.143
−0.206
−0.02
−0.044
−0.02
0.00
0.00
0.00
−0.02
−0.044
−0.02
−0.178
0.143
−0.206
0.064
0.013*
0.058
0.002*
0.009*
0.001*
0.00
0.00
0.00
0.022
−0.03
−0.02
0.022
−0.03
−0.02
0.095
0.025*
0.074
Notes: (*) =p<0.05
138
0.001*
0.014*
0.003*
favorably compared to the healthy participants. Further, health literacy was negatively
associated with PROMEX (β=−0.037; p=0.034). Participants with good health literacy
were less likely to view the online medication rating websites favorably than those with
limited health literacy. Age, education, and health literacy were positively associated with
the MCS-12, whereas, the comorbidity score was negatively associated with it (p<0.05).
The PCAS-Communication was positively associated with the PCS-12, however, the
number of prescription medication and the comorbidity score were negatively associated
with it (p<0.05). Gender, health literacy, and marital status were positively associated the
PCAS-Communication, whereas, race was negatively associated with it (p<0.05). Race
was positively associated with BMQ-Harm; however, the PCAS-Communication, health
literacy, and the number of prescription medications were negatively associated with it
(p<0.05). Finally, health literacy, number of prescription medications, and the PCASCommunication were negatively associated with BMQ-Overuse; however, gender was
positively associated with it. An analysis of the fit indices indicated adequate model fit
(comparative fit index=0.977, adjusted goodness of fit index=0.994, root mean square
error of approximation=0.03, standardized root mean square residual=0.03).
139
CHAPTER 5.
5.1
DISCUSSION
Overview
The advent of the Internet has revolutionized health care delivery (Campbell & Nolfi,
2005). Today, patients can go online to browse an immense amount of educational
information about a variety of health conditions and treatment options. Further, patients
can go online and read other patients’ feedback about different physicians and health
products to make informed decisions before choosing a certain physician or over-thecounter (OTC) medication (Emmert, Meier, et al., 2013; Faber et al., 2009). Medication
rating websites are a new frontier in the online health-related websites market. Currently,
patients can go online and post their feedback about the medications they are taking for
others to read. These websites ask patients who want to share their medication
experiences with others to rate these medications in terms of their effectiveness, side
effects, cost, etc… The online medication rating websites have the potential as other
online health-related information websites, to empower patients to ask more questions
during their physician office visits, adopt healthy lifestyle habits, follow their physicians’
advice more closely, and improve their health outcomes (Iverson, Howard, & Penney,
2008; Lau, Campbell, Tang, Thompson, & Elliott, 2014). These potential benefits of the
online medication rating websites are needed especially among the U.S. elderly (≥65
years).
According to Pew Internet and American Life Project, six in ten or 59% of U.S.
seniors reported using the Internet in 2013 (i.e. 59%) (Duggan & Smith, 2013). Older
adults are more likely to have chronic diseases (i.e., diabetes and hypertension) than their
younger counterparts (N. C. o. Aging, 2014). Additionally, more than 80% of U.S. older
adults take at least one prescription medication, and about one third take five or more
prescription medications daily (Qato et al., 2008). Further, infirm patients such as elderly
are prone to medication side effects due to their diminished physiological reserve
(Wasson, 2008). Moreover, several studies that examined the appropriateness of
physician prescribing patterns among elderly have found multiple prescribing patterns
that were inconsistent with evidence-based practice (Goulding, 2004; Spinewine et al.,
2007). Therefore, older adults are well poised to evaluate the usefulness of the online
medication rating websites.
The aim of this study was to examine the association between older adults’ views of
the online medication rating websites in terms of facilitating patient-physician
communication and participant-reported outcomes, i.e., and their satisfaction with
physician communication, health-related quality of life, beliefs about medications, and
medication adherence. Further, the association between older adults’ actual overall
rating/evaluation of their antihypertensive medications and each of the aforementioned
participant-reported outcomes was examined. The final sample of this study was 286
participants that examined the association between the value of online medication rating
websites to older adults (i.e., PROMEX) and each of the participant-reported outcomes
with the exception of medication adherence. The sample size for both path and regression
140
analyses that examined the association between PROMEX and medication adherence
among hypertensive participants was 193. Finally, the sample size for the regression
analyses that examined the association between each of the participant-reported outcomes
and the overall rating of antihypertensive medications among the hypertensive
participants was 193.
5.2
Patient Reviews of Medication Experiences (PROMEX)
In order to assess older adults’ views of online medication rating websites, we
developed a self-report questionnaire, Patient Reviews of Medication Experiences
(PROMEX). First, participants were presented with a table that included five commonly
prescribed antihypertensive medications that were rated online by anonymous users.
Then, participants were asked to answer seven questions that explored their views of
online medication rating websites like the example in table. After refining this
instrument, the final questionnaire includes six questions with a Cronbach’s alpha of
0.85. Although we proposed two domains or constructs within this questionnaire, only
one construct was extracted from it. We named this construct the “value of online
medication rating websites to older adults”. Therefore, PROMEX is sufficiently reliable
to measure the value of online medication rating websites in terms of facilitating
physician-patient communication among this surveyed sample of older adults (Field,
2009).
5.3
PROMEX and Participant-Reported Outcomes (PROs)
Participants’ views of online medication rating websites (i.e., PROMEX) were not
influenced by the sociodemographic factors (Table 4-7). Further, PROMEX was not
associated with participants’ health-related quality of life or HRQoL, satisfaction with
physician communication, beliefs about medications, and medication adherence
(Table 4-21). However, in the path analyses that we conducted to determine the causal
effects among the variables of participants’ views of online medication rating websites
(PROMEX), HRQoL (PCS-12 and MCS-12), satisfaction with physician communication
(PCAS-Communication), and beliefs about medications (BMQ-Overuse and BMQHarm) several variables directly or indirectly influenced PROMEX.
The Physical Component Summary (PCS-12) of the SF-12v2 that measured the
physical quality of life of the older adult participants in the past four weeks was
significantly associated with their views of online medication rating websites (PROMEX)
(p<0.05) (Figure 4-11 and Table 4-27). Participants with poor physical HRQoL were
more likely to have favorable views of online medication rating websites than those with
good physical HRQoL (β= −0.13, p=0.040). Further, older adults with poor physical
HRQoL were more likely to be unsatisfied with their physician communication than
those with good physical HRQoL (β= 0.13, p=0.035). Additionally, participants with
poor physical HRQoL were more likely to have multiple comorbidities (i.e., chronic
diseases) than those with good physical HRQoL (β= −0.36, p<0.001). Moreover, older
141
participants were more likely to have poor physical HRQoL (β= −0.12, p=0.048).
Further, participants with poor physical HRQoL were more likely to be on multiple
prescription medications than those with good physical HRQoL (β= −0.16, p=0.017)
(Table 4-40).
Similarly, the Mental Component Summary (MCS-12) of the SF-12v2 that measured
the mental HRQoL of the participants in the past four weeks was significantly associated
with participants’ views of online medication rating websites (PROMEX) (p<0.05)
(Figure 4-15 and Table 4-40). Contrary to the PCS-12, the significant association
between MCS-12 and PROMEX was not detected in the path model the investigated the
association between only MCS-12 and PROMEX, but rather in the overarching path
model that included the entire participant-reported outcome variables. Participants with
poor mental HRQoL were more likely to have favorable views of online medication
rating websites compared to participants with good HRQoL (β= −0.13, p=0.032). Further,
participants with poor mental HRQoL were more likely to have multiple comorbidities
than those with good mental HRQoL (β= −0.18, p=0.001). In addition, participants with
poor mental HRQoL were more likely to have limited health literacy (β= 0.26, p<0.001).
Interestingly, participants who were younger (β=0.21, p=0.001) and participant who had
less education (β= 0.16, p=0.007) were more likely to have poor mental HRQoL.
Therefore, the older adults in this study who had poor physical and mental HRQoL
believed that the online medication rating websites are useful and helpful in facilitating
the communication with their physicians. Further, the fact that the older adults with poor
HRQoL were more likely to have multiple comorbidities, take multiple prescription
medications, have limited health literacy, and lower education is consistent with the
literature (Low & Molzahn, 2007). What is more interesting is that these very factors not
only influenced the participants’ HRQoL they also influenced participants’ views of
online medication rating websites. Elderly participants with multiple comorbidities (i.e.,
chronic diseases) were more likely to view the online medication rating websites more
favorably than their healthier counterparts were. The hypertensive participants’ views of
online medication rating websites were directly influenced by their comorbidity score as
shown in Table 4-39 controlling for sociodemographics, medication adherence, number
of prescription medications, overall rating of antihypertensive medications, satisfaction
with physician communication, and beliefs about medications (β=0.492, p=0.045).
Further, the comorbidity score indirectly influenced the participants’ views of online
medication rating websites (i.e., hypertensive and non-hypertensive) (β=0.059, p=0.007)
(Table 4-40). In addition, participants with limited health literacy were more likely to
have positive views of online medication rating websites than those with good health
literacy (β=−0.037, p=0.034) (Table 4-40). Moreover, participants who liked to share the
health decision with physicians were more likely to view the online medication rating
websites more favorably than those who liked to keep the health decision to themselves
or leave it to their physicians (β=0.179, p=0.003) (Table 4-40).
These findings suggest that older adults with multiple chronic health conditions and
limited health literacy perceive the online medication rating websites more useful in
terms of facilitating the communication with their physicians than their healthier and
142
more educated counterparts. This partly may be explained by the fact that the online
patients’ reviews of medications were written in nonprofessional terms and show the
rating of medications in a simple way (i.e., star ratings) for an average person to
understand. However, well-educated older adults with good health literacy level may
prefer to refer to other traditional sources of information (i.e., books, medical articles,
magazines) should they need to know about a certain medication (Campbell & Nolfi,
2005). Further, older adults with poor physical HRQoL were more likely to be on
multiple medications. Therefore, they are more likely to experience medication side
effects (Borchelt, 1994). This is consistent with the medical literature, in which
medication side effects had negative impact on both the physical and mental aspects of
patients’ quality of life (Bebbington et al., 2009). Hence, the favorable opinion of online
patients’ reviews of medications among older adults with poor physical HRQoL may
stem from the fact that they want to know about other treatment options that have better
safety and efficacy profiles than their current medications. In addition, participants with
poor physical HRQoL were more likely to be unsatisfied with physician communication.
Effective physician-patient communication, in which physicians recognize patients’
needs and concerns, listen attentively, and explain thoroughly in a simplified way the
treatment plan to their patient, is quintessential in any patient-centered care model
(Berwick, 2009). Research has shown that the quality of physician-patient
communication can indirectly predict multiple health outcomes such as medication
adherence and quality of life (Stewart, 1995; Street Jr et al., 2009). Therefore, the older
adult participants in this study with poor physical HRQoL, who were more likely to be
unsatisfied with their physicians’ communication, may have felt that the online patients’
reviews of medication could facilitate their communication with physicians. This is
further substantiated when we know that the average amount of time that physicians
spend with their patients is fifteen minutes ((Belzer, 1999; Morgan, 2003). Further,
research has shown that older adults receive less information from physicians than their
younger counterparts receive during their clinic visits (Beisecker, 1988). Thus, older
adults may want to use the little time they have with their physicians more efficiently,
and the online patients’ reviews of medications may help them achieve this goal. Further,
older adults with multiple comorbidities, who were more likely to have poor quality of
life (i.e., both physical and mental health), were more likely as well to have favorable
views of the online patients’ reviews of medications. This is consistent with the literature
in which the presence of multiple health issues among older adults motivated them to
seek health-related information online (Meloche, 2013).
Most patients like to have a partnership or a therapeutic alliance with physicians to
manage their health conditions (Bernabeo & Holmboe, 2013; Mazur, Hickam, Mazur, &
Mazur, 2005). However, many older adults complain about being marginalized in their
health decision-making process (Gladden, 2000). The majority of participants in this
study expressed their desire to have an equal partnership with their physicians
(Table 4-1). Further, older adults in this study who liked to have an equal partnership
with their physicians were more likely to have favorable views of online patients’
reviews of medications. Therefore, these older adults were more likely to believe that the
online patient reviews of medications will facilitate the communication with their
143
physicians. Hence, the online patients’ reviews of medications could play a patientempowering role like other online health-related information (Meloche, 2013; Suter,
Suter, & Johnston, 2011).
The participants’ satisfaction with physician communication (PCAS-Communication)
was not associated with their views of the online medication rating websites (PROMEX)
(Figure 4-9 and Table 4-23). However, multiple sociodemographic factors influenced
the participants’ satisfaction with their physicians’ communication. Female, married, and
Caucasian non-Hispanic participants with good health literacy were likely to have higher
PCAS-Communication scores (p<0.05) (Table 4-23 and Table 4-40). Therefore, these
participants were more likely to be satisfied with their physician communication. Our
findings are consistent with the literature. Female patients are usually more satisfied with
the provided health care than their male counterparts (Arora & McHorney, 2000; Carlin
et al., 2012). Further, married patients are more likely to be satisfied with medical care
that the unmarried patients (Hall & Dornan, 1990; Xiao & Barber, 2008). In addition,
patients with better education and health literacy are more likely to be satisfied with the
received health care than the patients with less education and limited health literacy (Xiao
& Barber, 2008). Moreover, whites are more likely than minorities (i.e., blacks,
Hispanics, and Asians) to be satisfied with the provided health care (Haviland, Morales,
Reise, & Hays, 2003). Finally, the PCAS-Communication and PCAS-interpersonal
treatment were highly correlated. The participants in this study, who were satisfied with
their physician communication, were also likely to be satisfied with their physician
interpersonal treatment (i.e., amount of time spent, friendliness and warmth received,
patience, care and concern, and respect).
Participants’ general beliefs about medications (BMQ-Overuse and BMQ-Harm)
were not associated with their views of the online medication rating websites (PROMEX)
(Figures 4-12, 4-13 and Tables 4-33, 4-34). However, the BMQ-Overuse and BMQHarm were influenced by several factors. The BMQ-Overuse and BMQ-Harm scores
were significantly lower among participants who take multiple prescription medications
(p<0.05) (Tables 4-13 and 4-14). As the number of prescription medications taken by the
participants increased, their BMQ-Overuse and BMQ-Harm scores decreased. Further,
participants taking multiple prescription medications were less likely to believe that
prescription medications are inherently harmful and overprescribed by physicians
(p<0.05) (Table 4-40). This is consistent with the literature, which shows that patients
who take multiple prescription medications are more likely to have positive beliefs about
medications than patients who do not take any prescription medications (Ramstrom,
2006). Further, participants with good health literacy level were more likely to have a
lower BMQ-Overuse and BMQ-Harm scores than their counterparts with limited health
literacy (p<0.05) (Table 4-40). This is also consistent with the literature; patients with
high literacy level are more likely to have positive beliefs about medications in
comparison to the ones with limited health literacy level (Horne et al., 2004; Isacson &
Bingefors, 2002). Additionally, research has shown that effective physician-patient
communication had a positive impact on patients’ beliefs about medication (Bultman &
Svarstad, 2000). In our study we have found that the higher the satisfaction with
physician communication (i.e., high PCAS-Communication score), the more likely the
144
participants will have positive beliefs about medications (low BMQ-Overuse and BMQHarm scores) (p<0.05) (Table 4-40). The impact of participants’ gender on their beliefs
about medications is controversial. Some studies have indicated that men are more likely
to have negative views about prescription medications in comparison to women (Horne et
al., 2004). However, other studies have shown the opposite (Isacson & Bingefors, 2002).
In this study, we have found that women are more likely to believe that prescription
medications are being overused and overprescribed (i.e., high BMQ-Overuse scores)
(p<0.05) (Tables 4-33 and 4-41). Race is another interesting factor. Research has shown
that Caucasians are more likely to have positive views of prescription medications than
minorities (i.e., blacks, Hispanics, and Asians), who tend to have negative views of
medications (Horne et al., 2004; Iihara et al., 2004). Similarly, Caucasians participants in
this study were less likely to believe that prescription medications are inherently harmful
or poisonous (i.e., high BMQ-Harm score) in comparison to minority participants (i.e.,
African Americans, Hispanics, and Asians) (p<0.05) (Tables 4-34 and 4-41).
Adherence to antihypertensive medication regimens among the study participants
who reported having hypertension was measured using Morisky Medication Adherence
scale (MMAS-8). The number of participants with hypertension who reported low or
medium adherence levels (i.e., MMAS-8 score ≤6) was 111 participants, which
represented 50.9% of the hypertensive subsample (Table 4-16). We examined the
association between the hypertensive participants’ views of online medication rating
websites (i.e., PROMEX) and their adherence to their antihypertensive medications;
however, no significant association was found (p≥0.05) (Figure 4-14 and Table 4-38).
Nonetheless, adherence to antihypertensive medication regimens was associated with
several variables. Participants who were satisfied with their physicians’ communication
(i.e., high PCAS-Communication scores) were more likely to achieve high adherence
levels to their antihypertensive medication regimens (i.e., high MMAS-8 scores) than
their unsatisfied counterparts (i.e., low PCAS-Communication scores). This is consistent
with the findings in the literature that effective physician-patient communication is highly
correlated with better patient adherence (Zolnierek & DiMatteo, 2009). Further,
participant adherence to antihypertensive medication regimens improved with increasing
age (Table 4-17). Older participants were more likely to be adherent to their prescribed
antihypertensive medication regimens (Table 4-38). The role of age as a determinant of
medication adherence is controversial. Some studies have found that medication nonadherence is common among the older adults due to their tendency to forget (KrouselWood et al., 2009). However, our results seem to support the findings of other studies,
which suggest that older adults are more likely to be adherent to their prescribed
medication regimens than their younger counterparts (Billups et al., 2000; Cohen et al.,
2012).
Race is another sociodemographic factor that has shown to affect patient adherence to
prescription medications (Rolnick, Pawloski, Hedblom, Asche, & Bruzek, 2013).
Research has shown that racial differences in medication adherence remains an issue
even after controlling for insurance status (Zhang & Baik, 2014). In our study, race was
not associated with adherence to antihypertensive medications in both the path and
regression analyses; however, the proportion of participants with high level of adherence
145
to antihypertensive medications (i.e., MMAS-8 score=8) was significantly higher among
Caucasians compared to African Americans, Hispanics, and the other racial groups
(Table 4-17). Additionally, participants with good health literacy level and positive
views of medications (i.e., low BMQ-Harm scores) were more likely to have a high
overall rating of their antihypertensive medication regimens. This, in turn was positively
associated with medication adherence (Figure 4-14). Participants with high overall rating
of their antihypertensive medication regimens were more likely to be adherent to these
medication regimens. This supports the findings of other published studies, which found
a positive association between hypertensive patients’ overall satisfaction with their
antihypertensive medications and their medication adherence levels (Bharmal et al.,
2009; Sa’ed et al., 2013). Finally, although researchers have shown significant
association between patient beliefs about medications and medication adherence, this
association was not significant among our participants in our study (Horne & Weinman,
1999).
5.4
Participants’ Rating of Their Antihypertensive Medications and ParticipantReported Outcomes (PROs)
We asked the hypertensive participants to write down the names of their
antihypertensive medications and rate each one of them on a five-point Likert scale (i.e.,
1-low to 5-high) based on their effectiveness, side effects, cost of medication, ease of use,
food interactions, and then provide an overall rating to that medication. Since older adults
with hypertension may take multiple medications to control their hypertension, we
provided space for four different antihypertensive medications. The higher the rating of
the medication, the more likely the participants are satisfied with their antihypertensive
medications. Ten or more hypertensive participants rated the following antihypertensive
medications: Atenolol, Amlodipine, Hydrochlorothiazide (HCTZ), Lisinopril, Losartan,
Valsartan, and Metoprolol. Then, we compared the participants’ ratings of these
medications in terms of their effectiveness, side effects, cost of medication, and ease of
use, food interactions, and overall ratings (Figure 4-2 and Table 4-20). Although there
was not a significant difference in the ratings of these medications given the small sample
size, participants rated them differently. For example, the overall ratings of Amlodipine
and lisinopril were high and comparable to the other antihypertensive medications;
however, their side effect ratings were the lowest compared to the other antihypertensive
medications (Figure 4-7). This could be attributable to the higher likelihood of druginduced throat irritation and cough as well as angioedema particularly among the African
Americans in the case of Lisinopril (Gibbs, Lip, & Beevers, 1999; Naidu, Usha, Rao, &
Shobha, 2000). Further, the incidence of dizziness and ankle edema with Amlodipine is
higher among the elderly hypertensive patients compared to their younger counterparts
(Kloner, Sowers, DiBona, Gaffney, & Marilee, 1996; Naidu et al., 2000). Another
example is with Hydrochlorothiazide (HTCZ), which had the highest cost of medication
rating compared to the other antihypertensive medications that were rated by ten or more
participants (Figure 4-5). This could be explained by the fact that Hydrochlorothiazide as
well as other diuretics had the lowest out-of-pocket expense per Medicare beneficiary
146
with hypertension per year, according to the U.S. Agency for Healthcare Research and
Quality (Townsend et al., 2011).
However, since we are interested in the participant-specific ratings of
antihypertensive medication regimens and not the medication-specific ratings, we have
taken the average rating of each aspect of medication use (i.e., effectiveness, side effects,
cost of medication, ease of use, food interaction, and the overall ratings) for every
participant who reported taking medications for hypertension. The average participantspecific ratings of the antihypertensive medication regimens across the visited senior
centers are listed in Table 4-18. All of the participant-specific aspects of medication use
were positively correlated with each other (p<0.05) (Table 4-19). However, the
correlations between the rated aspect of medication use and the participant-reported
outcomes were not all significant (Table 4-22). The participant-specific effectiveness
rating of the antihypertensive medication regimens was positively correlated with the
PCAS-Communication, PCAS-interpersonal treatment, and with the PCS-12 of the SF12v2 (p<0.05). Further, participant-specific ease of use rating of the antihypertensive
medication regimens was positively correlated with the PCAS-Communication (p<0.05).
Moreover, participant-specific overall rating of the antihypertensive medication regimens
was positively correlated with the PCAS-Communication and PCAS-interpersonal
treatment and was negatively correlated with the BMQ-Harm. The participant-specific
overall rating of the antihypertensive medication regimens total correlation with the other
rated medication use aspects (i.e., effectiveness, side effects, cost of medication, ease of
use, and food interactions) was the highest among them (i.e., r=0.66) (Table 4-19).
Further, since the independent variables in the multivariate regression models should be
strongly related to the dependent variable, and not to each other; we have used the
participant-specific overall rating of the antihypertensive medication regimens to
examine the association between the participant-reported outcomes and the participant’
rating of their antihypertensive medication regimens (Tabachnick & Fidell, 2001).
The relationship between treatment satisfaction and medication adherence among
hypertensive participants has been examined before, and was found to be positive and
significant (Bharmal et al., 2009; Sa’ed et al., 2013). Similarly, the participants’ overall
rating of their antihypertensive medication regimens, which is a proxy of patient
satisfaction with their hypertension treatment, was positively associated with their
medication adherence (p<0.05) (Sa’ed et al., 2013). The higher the overall rating of the
antihypertensive medication regimens, the more likely the participants with hypertension
will be adherent to these medication regimens controlling for their age, gender,
education, race, health literacy, marital status, comorbidities, and number of prescription
medications (Table 4-40). Although the relationship between patient satisfaction with
antihypertensive medication regimens and medication adherence has been studied before
(Bharmal et al., 2009; Sa’ed et al., 2013), our study findings are unique because we have
examined this relationship among older adults. Medication adherence is a complex
psycho-behavioral issue that is influenced by a multitude of factors including age (Gellad
et al., 2011). Further, medication non-adherence among patients with chronic diseases
such as hypertension has been linked to serious consequences (Osterberg & Blaschke,
2005). Therefore, understanding the relationship between treatment satisfaction and
147
medication adherence among older adults could help physicians in identifying strategies
to address this potential barrier to medication adherence.
Patient satisfaction with physician communication had a positive impact on multiple
health outcomes including medication adherence (R. Epstein & Street, 2007; Zolnierek &
DiMatteo, 2009). However, few studies have examined the relationship between
treatment satisfaction and patient satisfaction with physician communication (Beinart et
al., 2003; Bultman & Svarstad, 2000). Therefore, we have examined the relationship
between participant-specific overall ratings of antihypertensive medication regimens and
the participants’ satisfaction with their physicians’ communication. Participants with
hypertension, who highly rated their antihypertensive medication regimens, were more
likely to be satisfied with their physicians’ communication (i.e., high PCASCommunication scores) than participants with low overall rating of their antihypertensive
medication regimens controlling for their age, gender, education, race, health literacy,
marital status, comorbidities, and number of prescription medications (p<0.05)
(Table 4-25). This indicates that physicians who effectively communicate with their
patients (i.e., attentively listen, explain thoroughly, provide help and support) are more
likely to prescribe medications that work for their patients from the patient perspective,
and this eventually affects patients’ satisfaction with their physicians’ communication.
Further, both the participant satisfaction with physician communication (i.e., PCASCommunication) and the participant-specific overall rating of the antihypertensive
medication regimens have significantly affected medication adherence among the older
adults with hypertension in our study (Figure 4-14). Hence, effective physician-patient
communication is a crucial element in any successful treatment plan.
The relationship between treatment satisfaction and quality of life has been examined
in multiple studies. Patient satisfaction with treatment has been linked to quality of life
improvement (H. Chen et al., 2013; Porter et al., 2012; Stull et al., 2014). However, the
relationship between patient satisfaction with antihypertensive medications and the
quality of life among elderly patients has not been examined before. The relationship
between the two component summaries of the SF-12v2 and the participant-specific
overall rating of antihypertensive medication regimens was examined in multiple
regression analyses controlling for age, gender, education, race, health literacy, marital
status, comorbidities, and number of prescription medications. The Mental Component
Summary (MCS-12) of the SF-12v2 was not associated with the participant-specific
overall rating of antihypertensive medication regimens (Table 4-31). However, the
Physical Component Summary (PCS-12) of the SF-12v2 was positively associated with
the participant-specific overall rating of antihypertensive medication regimens (p<0.05).
The higher the participant-specific overall rating of antihypertensive medication
regimens, the more likely participants will have higher PCS-12 scores (Table 4-32).
Thus, participants who provided a high overall rating of their antihypertensive medication
regimens were more likely to have higher physical HRQoL. This indicates that
participants’ satisfaction with their antihypertensive medication regimens does influence
their physical HRQoL. Our results are consistent with the findings in the literature, the
Physical Component Summary (PCS) of the SF-36 was positively correlated with the
Medication Satisfaction Questionnaire (MSQ) that is used to assess patient satisfaction
148
with their medications (Vernon et al., 2010). Participant satisfaction with physician
communication was positively correlated with both the physical HRQoL and the overall
rating of antihypertensive medications (Tables 4-21 and 4-22). Therefore, understanding
the relationship between patients’ satisfaction with their prescription medications and
their quality of life may encourage physicians to engage in patient-centered
communication.
Patient beliefs about medications as well as satisfaction with prescription medications
have been shown to significantly affect medication adherence (Bharmal et al., 2009;
Hugon et al., 2014; Sa’ed et al., 2013). However, the relationship between the patients’
beliefs about medication and the satisfaction with their prescribed medications has not
been examined yet. Therefore, we have examined the association between the general
domain of the Beliefs about Medicines Questionnaire (BMQ) and the participant-specific
overall rating of antihypertensive medication regimens. The general domain of the BMQ
consists of two scales: the BMQ-Overuse and the BMQ-Harm. The BMQ-Overuse
assesses whether the patient believes that prescription medications are overprescribed by
physicians and overused by patients. The higher the score of the BMQ-Overuse, the more
likely patients believe that medications are overprescribed and overused, and vice versa.
On the other hand, the BMQ-Harm assesses whether the patients believe that prescription
medications are inherently harmful. The higher the BMQ-Harm score, the more likely
patients believe that prescription medications are harmful, and vice versa (Horne et al.,
1999).
The BMQ-Overuse was not associated with the participants’ overall rating of their
antihypertensive medication regimens; however, the BMQ-Harm was negatively
associated with the overall rating of antihypertensive medication regimens (Table 4-22).
Further, the BMQ-Harm has negatively influenced the overall rating of antihypertensive
medications, which then positively influenced medication adherence (Figure 4-14).
Hence, older adults who believe that medications are inherently harmful (i.e., high BMQHarm scores) are less likely to be satisfied with their antihypertensive medication
regimens (i.e., low overall rating of their antihypertensive medication regimens).
Moreover, the association between the participants’ overall rating of antihypertensive
medication regimens and their beliefs about medications was examined in multiple
regression analyses controlling for the participants’ age, gender, education, race, health
literacy, marital status, comorbidities, and number of prescription medications. However,
since we wanted to see whether the participants’ beliefs about medication were affected
by their satisfaction with the antihypertensive medications; the beliefs about medication
variables (i.e., BMQ-Harm and BMQ-Overuse) were treated here as dependent variables.
The participant-specific overall rating of the antihypertensive medication regimen did not
significantly influence the BMQ-Overuse (p≥0.05) (Table 4-36). However, the
participant-specific overall rating of the antihypertensive medication regimens did
negatively influence the BMQ-Harm (p<0.05) (Table 4-37). Thus, the participants’
satisfaction with their antihypertensive medication regimens had a positive impact on
their beliefs about medications. Our results should highlight the importance of choosing
the right prescription medication for the elderly patients since their medication
satisfaction influenced both their beliefs about medications as well as their medication
149
adherence. Therefore, effective physician-patient communication should yield positive
beliefs about medications, better medication satisfaction, and ultimately higher
medication adherence.
5.5
Limitations
We have assessed participants views of online medication rating websites using a new
developed instrument (i.e., PROMEX). Although, this instrument had an adequate
internal consistency and high loadings on the construct this tool is intended to assess (i.e.,
value of online medication rating websites to older adults), it has not been validated
across different patient populations. Furthermore, the participants’ satisfaction with
antihypertensive medications was assessed using a newly developed tool that has not
been validated, yet it achieved a high internal consistency reliability (α=0.82). Therefore,
our findings cannot be generalized to other patient populations due to the aforementioned
reasons as well as convenience sampling that were used in this study. Further, the
likelihood of recall bias with respect to the number of prescription medications, name of
antihypertensive medications, and past medical history is high. Additionally, the
administered survey consists of a battery of validated questionnaires that requires a
completion time of at least twenty-five minutes. Hence, it places a significant cognitive
burden on the respondents particularly with this mode of administration in which the
respondents has to read, comprehend, recall, and then answer the requested information
(Bowling, 2005). Further, the willingness of the respondents to disclose some
information, which is believed to be sensitive from their own perspective is a common
limitation in survey research (Bowling, 2005). For instance, many of the respondents
refused to answer the question about their estimated annual income even after explaining
the purpose of this research as well as the anonymity and confidentiality of their
responses. Thus, we have not controlled for older adults’ annual income in our analyses.
The general domain of the Beliefs about Medicines Questionnaire (BMQ) was used to
assess participants’ beliefs about medications. Although, research has confirmed a
significant association between the general domain of the BMQ and medication
adherence in general, the specific domain of the BMQ was not included (Horne &
Weinman, 1999; Sjölander, Eriksson, & Glader, 2013). Among hypertensive participants
in this study, the general domain of the BMQ has failed to show a consistent association
with the medication adherence contrary to the specific domain of the BMQ, which
consistently showed a significant association with medication adherence among this
patient population (Gatti et al., 2009; Rajpura & Nayak, 2014). In addition, health literacy
was assessed using a single screening question (Chew et al., 2004). Although, this single
health literacy-screening question has been validated using both the Test of Functional
Health Literacy in Adults (TOFHLA) and the Rapid Estimate of Adult Literacy in
Medicine (REALM) as reference standards, it is not as accurate as these two standard
tests of health literacy (Wallace et al., 2006).
The utilization of path analyses to examine the relationship between the participants’
views of online medication rating websites (i.e., PROMEX) and the participant-reported
150
outcomes (i.e., participant satisfaction with communication, quality of life, beliefs about
medications, and medication adherence) has several advantages over multiple regressions
analyses. First, path analysis involves a series of multiple regressions rather than one
regression. Second, in multiple regression analysis, the relationship between only one
dependent variable and several independent variables is analyzed; however, no relations
between the independent variables are analyzed. Nevertheless, in path analysis the
relationships between the independent variables are analyzed. Therefore, the path
analysis enables researchers to disentangle complex relationships between multiple
variables (Streiner, 2005). Further, several hypotheses can be tested by examining both
the causal (i.e., direct and indirect effects) on as well as the non-causal effects on the
dependent variables (Lleras, 2005; Nazim & Ahmad). However, the path analysis is not
limitation-free. The path analysis follows the same theoretical assumptions of the
multiple regression analyses. Further, the causality in the hypothesized path model is
recursive (i.e., flows in one direction). Additionally, the path model has to assume that
each measured variable is free of measurement errors. These assumptions are difficult to
meet in social research (Lleras, 2005). Moreover, the path model in this study could not
explain more than 6% at best of the variance in participants’ views of online medication
rating websites (i.e., PROMEX). Furthermore, the sample size was another limitation of
this study. Although, the minimum sample size required for a medium effect size at a
power=0.80 and α=0.05 was satisfied, the sample size was not large enough to detect
small sized effects. The sample size of our study is 286, however, the sample size
required for a power of 0.8 and a small effect size is 757 (J. Cohen, 1992). Finally, this is
a cross-sectional study where causality cannot be ascertained between HRQoL and
participants’ views of online medication rating websites as an example; however, we
clearly can say that there is a significant association between the two that needs to be
further investigated in better-designed studies such as cohort studies.
5.6
Conclusions
In summary, older adults from seven senior centers were surveyed about the
usefulness of the online medication rating websites in facilitating the communication
with their physicians using a newly developed questionnaire. Participants with poor
HRQoL viewed the online medication rating websites more favorably compared to their
counterparts with good HRQoL. Further, participants with multiple chronic conditions
had favorable views of the online medication rating websites. Therefore, participants who
are more likely to take prescription medications favorably viewed the online medication
rating websites. Moreover, older adults with limited health literacy were more likely to
view the online medication rating websites more favorably than older adults with good
health literacy level. Moreover, we have found that participants’ satisfaction with their
antihypertensive medication regimens was associated with positive participant-reported
outcomes (i.e., higher physical HRQoL scores, positive beliefs about medications, higher
satisfaction with physician communication, and better medication adherence).
Older adults’ satisfaction with physician communication was associated with higher
HRQoL, better medication adherence, positive beliefs about medications, and higher
151
overall rating of antihypertensive medication regimens. Thus, participants with poor
HRQoL, who were more likely to view the online medication rating websites more
favorably compared to their counterparts with good of quality of life, were more likely as
well to have a low level of satisfaction with their physicians’ communication. Further,
since older adults with poor HRQoL were more likely to have both lower education and
health literacy, the availability of accessible online health information portrayed in a
visual and easy to understand language such as the online patient reviews of medications
may enhance the physician-patient communication, and result in favorable outcomes.
In addition, many older adults feel that their role is marginal in the decision-making
process. Therefore, many of them expressed their desire to become active partners in the
health decision-making process together with their physicians (Gladden, 2000). In this
study, participants who liked to share their health decision with their physicians, were
more likely to view the online medication rating websites more favorably than their
counterparts, who liked to either keep their health decision in their own hands or leave it
to their physicians. Thus, online patient reviews of medications could play a beneficial
role by empowering older adults to participate actively in decisions related to their health
care.
Nonetheless, some studies have questioned the integrity of the online health
information as they frequently contain inaccurate and sometimes misleading information
(Erdem & Harrison-Walker, 2006). Furthermore, the online health information may strain
the physician-patient relationship especially when patients think that they know more
than their physicians or when they ask for a prescription medication and their physicians
refuse to prescribe it due to valid and clinically sound reasons. Physicians’ concerns
about the harmful effects of the online health information on the relationship with their
patients, stems from the fact that they need to spend more time answering and addressing
patients’ questions and requests especially if the information that the patients encountered
online was incorrect or inaccurate (Anderson, Rainey, & Eysenbach, 2003; Erdem &
Harrison-Walker, 2006). However, most elderly patients like to receive more information
from their physicians. In addition, elderly patients tend to turn to their physicians as the
primary source of health information (Campbell & Nolfi, 2005). Further, research has
shown that each additional minute spent by physicians with their patients during their
visits is associated with an improvement in patient trust (Fiscella et al., 2004). Therefore,
physicians’ concern over the possibility of the online health information to have a
negative impact on the relationship with their patients might be overstated.
Elderly patients are more likely to experience adverse drug events due to their
diminished physiological reserve (Wasson, 2008). Further, elderly patients are
underrepresented in most clinical trials that were conducted for the approvals of many
currently available and widely used drugs (Konrat et al., 2012). Therefore, the creation of
secure online patient portals by well-known health organizations (i.e., Centers for
Medicare and Medicaid Services, academic health institutions, Food and Drug
Administration), where actual patients can share their prescription medication
experiences with others anonymously, may help in monitoring adverse drug reactions
among patients in general and the elderly ones in particular. Moreover, the clinical
152
guidelines that are used in the treatment of elderly patients with multiple comorbidities
have proven ineffective in managing the health conditions of this important segment of
the patient population (Boyd et al., 2005). Besides the potential role of the online patient
reviews of medications in the adverse events reporting and post-marketing surveillance,
they may also help physicians and researchers alike in reviewing the current treatment
guidelines for elderly patients. Therefore, the roles that online medication-rating websites
may play in the future might not be limited to enhancing the physician-patient
communication.
Finally, although the findings of this study suggest that online patient reviews of
medications may positively influence the patient-physician communication particularly
among older adults with poor HRQoL, multiple health conditions, lower educations, and
limited health literacy, the results of this study should be interpreted cautiously due to the
aforementioned limitations. Future research should examine the impact of the online
patient reviews of medications as an intervention on physician-patient communication,
and consequently on other participant-reported outcomes.
153
LIST OF REFERENCES
Abrass, I. B. (1990). The biology and physiology of aging. Western Journal of Medicine,
153(6), 641.
Administration on Aging (AOA), (12/31/2013). Aging Statistics. Retrieved 01/07, 2014,
from
http://www.aoa.gov/AoARoot/%28S%282ch3qw55k1qylo45dbihar2u%29%29/Aging_St
atistics/index.aspx.
Administration on Aging (AOA), (12/31/2013). Diversity. Retrieved 01/08, 2014, from
http://www.aoa.gov/AoA_programs/Tools_Resources/diversity.aspx.
Schwartz, K. (2011). Chronic Disease Self-Management Fact Sheet. from
http://www.ncoa.org/improve-health/center-for-healthy-aging/content-library/CDSMPFact-Sheet.pdf.
Aikens, J. E., Nease, D. E., & Klinkman, M. S. (2008). Explaining patients’ beliefs about
the necessity and harmfulness of antidepressants. The Annals of Family Medicine, 6(1),
23-29.
Aikens, J. E., Nease, D. E., Nau, D. P., Klinkman, M. S., & Schwenk, T. L. (2005).
Adherence to maintenance-phase antidepressant medication as a function of patient
beliefs about medication. The Annals of Family Medicine, 3(1), 23-30.
Albarran, A. B., & Goff, D. H. (2000). Understanding the web: social, political, and
economic dimensions of the Internet: Iowa State University Press.
Annandale, E. (1998). The sociology of health and medicine: a critical introduction:
Polity Press Cambridge.
Arora, N. K., & McHorney, C. A. (2000). Patient preferences for medical decision
making: who really wants to participate? Medical care, 38(3), 335-341.
Baker, D. W., Williams, M. V., Parker, R. M., Gazmararian, J. A., & Nurss, J. (1999).
Development of a brief test to measure functional health literacy. Patient education and
counseling, 38(1), 33-42.
Baker, R. (1999). The American medical ethics revolution: how the AMA's code of ethics
has transformed physicians' relationships to patients, professionals, and society: JHU
Press.
Banning, M. (2009). A review of interventions used to improve adherence to medication
in older people. International Journal of Nursing Studies, 46(11), 1505-1515.
154
Bastiaens, H., Van Royen, P., Pavlic, D. R., Raposo, V., & Baker, R. (2007). Older
people's preferences for involvement in their own care: a qualitative study in primary
health care in 11 European countries. Patient education and counseling, 68(1), 33-42.
Beck, R. S., Daughtridge, R., & Sloane, P. D. (2002). Physician-patient communication
in the primary care office: a systematic review. The Journal of the American Board of
Family Practice, 15(1), 25-38.
Beisecker, A. E. (1988). Aging and the desire for information and input in medical
decisions: Patient consumerism in medical encounters. The Gerontologist, 28(3), 330335.
Belzer, E. J. (1999). Improving patient communication in no time. Fam Pract Manag,
6(5), 23-28.
Bensing, J. (2000). Bridging the gap.: The separate worlds of evidence-based medicine
and patient-centered medicine. Patient education and counseling, 39(1), 17-25.
Bernabeo, E., & Holmboe, E. S. (2013). Patients, providers, and systems need to acquire
a specific set of competencies to achieve truly patient-centered care. Health Affairs,
32(2), 250-258.
Berwick, D. M. (2009). What ‘patient-centered’should mean: confessions of an extremist.
Health Affairs, 28(4), w555-w565.
Bharmal, M., & Thomas III, J. (2006). Comparing the EQ-5D and the SF-6D descriptive
systems to assess their ceiling effects in the US general population. Value in Health, 9(4),
262-271.
Billups, S. J., Malone, D. C., & Carter, B. L. (2000). The Relationship between Drug
Therapy Noncompliance and Patient Characteristics, HealthǦRelated Quality of Life, and
Health Care Costs. Pharmacotherapy: The Journal of Human Pharmacology and Drug
Therapy, 20(8), 941-949.
Black, E. W., Thompson, L. A., Saliba, H., Dawson, K., & Paradise Black, N. M. (2009).
An analysis of healthcare providers' online ratings. Informatics in primary care, 17(4),
249-253.
Bond, C., Blenkinsopp, A., & Raynor, D. K. (2012). Prescribing and partnership with
patients. British journal of clinical pharmacology, 74(4), 581-588.
Bordin, E. S. (1979). The generalizability of the psychoanalytic concept of the working
alliance. Psychotherapy: Theory, Research & Practice, 16(3), 252.
Boult C, W. G. (2010). Comprehensive Primary Care for Older Patients With Multiple
Chronic Conditions. Jama, 304(17), 1936-1943.
155
Bowling, A. (1991). Measuring health: a review of quality of life measurement scales:
Open University Press BuckinghamPhiladelphia.
Boyd, C. M., Darer, J., Boult, C., Fried, L. P., Boult, L., & Wu, A. W. (2005). Clinical
practice guidelines and quality of care for older patients with multiple comorbid diseases.
JAMA: the journal of the American Medical Association, 294(6), 716-724.
Boylan, L. S., & Fontanella, J. A. (2009). Behavioral indices in medical care outcome:
the working alliance, adherence, and related factors. Journal of general internal
medicine, 24(1), 80-85.
Brennan, J., Rivera-Tovar, A., Martin, P., Hepworth, J., & Makoul, G. (2010). Using the
communication assessment tool in family medicine residency programs. Fam Med, 42(8),
567-573.
Britten, N. (1994). Patients' ideas about medicines: a qualitative study in a general
practice population. The British Journal of General Practice, 44(387), 465.
Bruera, E., Sweeney, C., Calder, K., Palmer, L., & Benisch-Tolley, S. (2001). Patient
preferences versus physician perceptions of treatment decisions in cancer care. Journal of
Clinical Oncology, 19(11), 2883-2885.
Bultman, D. C., & Svarstad, B. L. (2000). Effects of physician communication style on
client medication beliefs and adherence with antidepressant treatment. Patient education
and counseling, 40(2), 173-185.
Bylund, C. L., Gueguen, J. A., Sabee, C. M., Imes, R. S., Li, Y., & Sanford, A. A. (2007).
Provider–patient dialogue about Internet health information: an exploration of strategies
to improve the provider–patient relationship. Patient education and counseling, 66(3),
346-352.
Cairncross, F. (2001). The death of distance: How the communications revolution will
change our lives: Harvard Business Press.
Calman, K. (1984). Quality of life in cancer patients--an hypothesis. Journal of medical
ethics, 10(3), 124-127.
Cameron, L., & Leventhal, H. (2003). The self-regulation of health and illness behaviour:
Psychology Press.
Campbell, R. J., & Nolfi, D. A. (2005). Teaching elderly adults to use the Internet to
access health care information: before-after study. Journal of medical Internet research,
7(2).
Donaldson, M. S., Yordy, K. D., & Vanselow, N. A. (1994). Defining primary care: an
interim report: National Academy Press.
156
Carlin, C. S., Christianson, J. B., Keenan, P., & Finch, M. (2012). Chronic illness and
patient satisfaction. Health Serv Res, 47(6), 2250-2272.
Carr, A. J., & Higginson, I. J. (2001). Measuring quality of life: Are quality of life
measures patient centred? BMJ: British Medical Journal, 322(7298), 1357.
Ceccoli, S. J., & Klotz, R. J. (2013). Taking your medicine? Attitudes toward direct-toconsumer advertising (DTCA). The Social Science Journal.
Cella, D. F., & Tulsky, D. (1990). Measuring quality of life today: methodological
aspects. Oncology (Williston Park, NY), 4(5), 29-38; discussion 69.
Charles, C., Gafni, A., & Whelan, T. (1997). Shared decision-making in the medical
encounter: what does it mean?(or it takes at least two to tango). Social science &
medicine, 44(5), 681-692.
Chen, Y., & Xie, J. (2008). Online consumer review: Word-of-mouth as a new element of
marketing communication mix. Management Science, 54(3), 477-491.
Chew, L. D., Bradley, K. A., & Boyko, E. J. (2004). Brief questions to identify patients
with inadequate health literacy. health, 11, 12.
Chin, J. J. (2002). Doctor-patient relationship: from medical paternalism to enhanced
autonomy. Singapore medical journal, 43(3), 152-155.
Clarke, G., Hall, R. T., & Rosencrance, G. (2004). Physician-patient relations: no more
models. American Journal of Bioethics, 4(2), 16-19.
Cobb, C. W. (2000). Measurement tools and the quality of life. Redefining Progress.
Cohen, J. (1992). A power primer. Psychological bulletin, 112(1), 155.
Conn, K. M., Halterman, J. S., Lynch, K., & Cabana, M. D. (2007). The impact of
parents' medication beliefs on asthma management. Pediatrics, 120(3), e521-e526.
Conrad, P. (1985). The meaning of medications: another look at compliance. Social
science & medicine, 20(1), 29-37.
Control, C. f. D. (2004). The state of aging and health in America. Washington: Merck
Institute of Aging and Health.
Coons, S. J., Rao, S., Keininger, D. L., & Hays, R. D. (2000). A comparative review of
generic quality-of-life instruments. Pharmacoeconomics, 17(1), 13-35.
Cortina, J. M. (1993). What is coefficient alpha? An examination of theory and
applications. Journal of applied psychology, 78(1), 98.
157
Coulter, A., Parsons, S., & Askham, J. (2008). Where are the patients in decision-making
about their own care? : World Health Organization Regional Office for Europe.
Cronbach, L. J. (1951). Coefficient alpha and the internal structure of tests.
psychometrika, 16(3), 297-334.
Dang, B. N., Westbrook, R. A., Black, W. C., Rodriguez-Barradas, M. C., & Giordano,
T. P. (2013). Examining the Link between Patient Satisfaction and Adherence to HIV
Care: A Structural Equation Model. PloS one, 8(1), e54729.
Daschle, T., Domenici, P., Frist, W., & Rivlin, A. (2013). Prescription for PatientCentered Care and Cost Containment. New England Journal of Medicine, 369(5), 471474.
Davis, M. H. (1994). Empathy: A social psychological approach: Westview Press.
DiMaggio, P., Hargittai, E., Neuman, W. R., & Robinson, J. P. (2001). Social
implications of the Internet. Annual review of sociology, 307-336.
Dolovich, L., Nair, K., Sellors, C., Lohfeld, L., Lee, A., & Levine, M. (2008). Do
patients’ expectations influence their use of medications? Qualitative study. Canadian
Family Physician, 54(3), 384-393.
Donabedian, A. (1966). Evaluating the quality of medical care. The Milbank memorial
fund quarterly, 166-206.
Donabedian, A. (2005). Evaluating the quality of medical care. Milbank Quarterly, 83(4),
691-729.
Donohue, J. M., Cevasco, M., & Rosenthal, M. B. (2007). A decade of direct-toconsumer advertising of prescription drugs. New England Journal of Medicine, 357(7),
673-681.
Doyle, C., Lennox, L., & Bell, D. (2013). A systematic review of evidence on the links
between patient experience and clinical safety and effectiveness. BMJ open, 3(1).
Dreher, B. B. (2001). Communication skills for working with elders: Springer Publishing
Company.
Duffy, F. D., Gordon, G. H., Whelan, G., Cole-Kelly, K., & Frankel, R. (2004).
Assessing competence in communication and interpersonal skills: the Kalamazoo II
report. Academic Medicine, 79(6), 495-507.
Ekdahl, A. W., Hellström, I., Andersson, L., & Friedrichsen, M. (2012). Too complex
and time-consuming to fit in! Physicians' experiences of elderly patients and their
participation in medical decision making: a grounded theory study. BMJ open, 2(3).
158
Emanuel, E. J., & Emanuel, L. L. (2000). Four models of the physicianpatient
relationship. Readings in health care ethics, 1, 40-49.
Emerson, E. B. (1985). Evaluating the impact of deinstitutionalization on the lives of
mentally retarded people. American Journal of Mental Deficiency.
Emilsson, M., Berndtsson, I., Lötvall, J., Millqvist, E., Lundgren, J., Johansson, A., &
Brink, E. (2011). The influence of personality traits and beliefs about medicines on
adherence to asthma treatment. Prim Care Respir J, 20(2), 141-147.
Emmert, M., Maryschok, M., Eisenreich, S., & Schöffski, O. (2009). [Websites to assess
quality of care--appropriate to identify good physicians?]. Gesundheitswesen
(Bundesverband der Arzte des Offentlichen Gesundheitsdienstes (Germany)), 71(4), e1827.
Emmert, M., Meier, F., Pisch, F., & Sander, U. (2013). Physician choice making and
characteristics associated with using physician-rating websites: cross-sectional study.
Journal of medical Internet research, 15(8).
Emmert, M., Sander, U., Esslinger, A., Maryschok, M., & Schöffski, O. (2012). Public
Reporting in Germany: the Content of Physician Rating Websites*. Methods of
information in medicine, 51(2), 112.
Emmert, M., Sander, U., & Pisch, F. (2013). Eight questions about physician-rating
websites: A systematic review. Journal of medical Internet research, 15(2).
Epstein, R., & Street, R. L. (2007). Patient-centered communication in cancer care:
promoting healing and reducing suffering: National Cancer Institute, US Department of
Health and Human Services, National Institutes of Health.
Epstein, R. M., Fiscella, K., Lesser, C. S., & Stange, K. C. (2010). Why the nation needs
a policy push on patient-centered health care. Health Affairs, 29(8), 1489-1495.
Epstein, R. M., & Street, R. L. (2011). The values and value of patient-centered care. The
Annals of Family Medicine, 9(2), 100-103.
Erdem, S. A., & Harrison-Walker, L. J. (2006). The role of the Internet in physician–
patient relationships: The issue of trust. Business Horizons, 49(5), 387-393.
Erdfelder, E., Faul, F., & Buchner, A. (1996). GPOWER: A general power analysis
program. Behavior research methods, instruments, & computers, 28(1), 1-11.
Esposti, L. D., Saragoni, S., Benemei, S., Batacchi, P., Geppetti, P., Di Bari, M.,
Marchionni, N., Sturani, A., Buda, S., Esposti, E. D. (2011). Adherence to
antihypertensive medications and health outcomes among newly treated hypertensive
patients. Clinicoecon Outcomes Res, 3, 47-54. doi: 10.2147/CEOR.S15619.
159
Eveleigh, R. M., Muskens, E., van Ravesteijn, H., van Dijk, I., van Rijswijk, E., &
Lucassen, P. (2012). An overview of 19 instruments assessing the doctor-patient
relationship: different models or concepts are used. J Clin Epidemiol, 65(1), 10-15.
Faber, M., Bosch, M., Wollersheim, H., Leatherman, S., & Grol, R. (2009). Public
Reporting in Health Care: How Do Consumers Use Quality-of-Care Information?: A
Systematic Review. Medical care, 47(1), 1-8.
Fairman, K., & Matheral, B. (2000). Evaluating medication adherence: which measure is
right for your program? strategies, 2, 4.
Falkum, E., & Førde, R. (2001). Paternalism, patient autonomy, and moral deliberation in
the physician–patient relationship: Attitudes among Norwegian physicians. Social
science & medicine, 52(2), 239-248.
Farmer, A., Kinmonth, A. L., & Sutton, S. (2006). Measuring beliefs about taking
hypoglycaemic medication among people with Type 2 diabetes. Diabetic Medicine,
23(3), 265-270.
Farmer, K. C. (1999). Methods for measuring and monitoring medication regimen
adherence in clinical trials and clinical practice. Clinical therapeutics, 21(6), 1074-1090.
Felce, D. (1997). Defining and applying the concept of quality of life. Journal of
Intellectual Disability Research, 41(2), 126-135.
Felce, D., & Perry, J. (1995). Quality of life: Its definition and measurement. Research in
developmental disabilities, 16(1), 51-74.
Field, A. (2009). Discovering statistics using SPSS: Sage publications.
Florin, J., Ehrenberg, A., & Ehnfors, M. (2006). Patient participation in clinical decisionǦ
making in nursing: a comparative study of nurses’ and patients’ perceptions. Journal of
Clinical Nursing, 15(12), 1498-1508.
Friedman, D. S., Hahn, S. R., Gelb, L., Tan, J., Shah, S. N., Kim, E. E., Zimmerman, T. J,
Quigley, H. A. (2008). Doctor–patient communication, health-related beliefs, and
adherence in glaucoma: results from the glaucoma adherence and persistency study.
Ophthalmology, 115(8), 1320-1327. e1323.
Garattini, S., & Chalmers, I. (2009). Patients and the public deserve big changes in
evaluation of drugs. BMJ: British Medical Journal, 338(7698), 804-806.
Garfield, S., Smith, F., Francis, S.-A., & Chalmers, C. (2007). Can patients’ preferences
for involvement in decision-making regarding the use of medicines be predicted? Patient
education and counseling, 66(3), 361-367.
160
Gatti, M. E., Jacobson, K. L., Gazmararian, J. A., Schmotzer, B., & Kripalani, S. (2009).
Relationships between beliefs about medications and adherence. American Journal of
Health-System Pharmacy, 66(7), 657-664.
Gellad, W. F., Grenard, J. L., & Marcum, Z. A. (2011). A systematic review of barriers to
medication adherence in the elderly: looking beyond cost and regimen complexity. The
American journal of geriatric pharmacotherapy, 9(1), 11-23.
Given, L. M., Ruecker, S., Simpson, H., Sadler, E. B., & Ruskin, A. (2007). Inclusive
interface design for seniors: ImageǦbrowsing for a health information context. Journal of
the American Society for Information Science and Technology, 58(11), 1610-1617.
Goulding, M. R. (2004). Inappropriate medication prescribing for elderly ambulatory care
patients. Arch Intern Med, 164(3), 305.
Greene, M., & Adelman, R. (2001). Building the physician-older patient relationship.
Aging, communication, and health: Linking research and practice for successful aging,
101-120.
Guyatt, G., Montori, V., Devereaux, P., Schünemann, H., & Bhandari, M. (2004).
Patients at the centre: in our practice, and in our use of language. Evidence Based
Medicine, 9(1), 6-7.
Ha, J. F., & Longnecker, N. (2010). Doctor-patient communication: a review. The
Ochsner Journal, 10(1), 38-43.
Hall, J. A., & Dornan, M. C. (1990). Patient sociodemographic characteristics as
predictors of satisfaction with medical care: a meta-analysis. Social science & medicine,
30(7), 811-818.
Hall, J. A., Roter, D. L., & Katz, N. R. (1988). Meta-analysis of correlates of provider
behavior in medical encounters. Medical care, 657-675.
Hamilton, G. A. (2003). Measuring adherence in a hypertension clinical trial. European
Journal of Cardiovascular Nursing, 2(3), 219-228.
Harwood, J. (2007). Understanding communication and aging: Developing knowledge
and awareness: Sage.
Hatcher, L. (2005). A step-by-step approach to using the SAS system for factor analysis
and structural equation modeling: SAS Institute.
Hays, R. D., & Morales, L. S. (2001). The RAND-36 measure of health-related quality of
life. Annals of medicine, 33(5), 350-357.
161
Health, United States, 2012: With Special Feature on Emergency Care. Hyattsville, MD.
2013: U.S. Government Printing Office.
Herdman, M., Gudex, C., Lloyd, A., Janssen, M., Kind, P., Parkin, D., Bonsel, G.,
Badia, X. (2011). Development and preliminary testing of the new five-level version of
EQ-5D (EQ-5D-5L). Quality of Life Research, 20(10), 1727-1736.
Hibbard, J. H., & Greene, J. (2013). What the evidence shows about patient activation:
better health outcomes and care experiences; fewer data on costs. Health Affairs, 32(2),
207-214.
Holt, E. W., Muntner, P., Joyce, C. J., Webber, L., & Krousel-Wood, M. A. (2010).
Health-related quality of life and antihypertensive medication adherence among older
adults. Age and ageing, 39(4), 481-487.
Horne, R. (2000). Assessing perceptions of medication: psychological perspectives. In:
McGavock, H, editor. Handbook of drug research methodology. Newcastle upon Tyne:
United Kingdom Drug Utilisation Research Group, 299-319.
Horne, R. (2005). Concordance, adherence and compliance in medicine taking: Report
for the National Co-ordinating Centre for NHS Service Delivery and Organisation R & D
(NCCSDO): NCCSDO.
Horne, R., Graupner, L. d., Frost, S., Weinman, J., Wright, S. M., & Hankins, M. (2004).
Medicine in a multi-cultural society: the effect of cultural background on beliefs about
medications. Social science & medicine, 59(6), 1307-1313.
Horne, R., & Weinman, J. (1999). Patients' beliefs about prescribed medicines and their
role in adherence to treatment in chronic physical illness. Journal of psychosomatic
research, 47(6), 555-567.
Horne, R., Weinman, J., & Hankins, M. (1999). The beliefs about medicines
questionnaire: the development and evaluation of a new method for assessing the
cognitive representation of medication. Psychology and health, 14(1), 1-24.
Howard, T., Jacobson, K. L., & Kripalani, S. (2013). Doctor Talk: Physicians' Use of
Clear Verbal Communication. Journal of health communication(ahead-of-print), 1-11.
Horne, R. (1999). Patients' beliefs about treatment: the hidden determinant of treatment
outcome? Journal of psychosomatic research, 47(6), 491-495.
Huang, I., Frangakis, C., Atkinson, M. J., Willke, R. J., Leite, W. L., Vogel, W. B., &
Wu, A. W. (2008). Addressing ceiling effects in health status measures: A comparison of
techniques applied to measures for people with HIV disease. Health Serv Res, 43(1p1),
327-339.
162
Hunt, S., McEwen, J., & McKenna, S. (1985). Measuring health status: a new tool for
clinicians and epidemiologists. The Journal of the Royal College of General
Practitioners, 35(273), 185.
I Gouni-Berthold MD, F., & Berthold, H. (2012). Role of physician gender in drug
therapy Sex and Gender Differences in Pharmacology (pp. 183-208): Springer.
Iihara, N., Tsukamoto, T., Morita, S., Miyoshi, C., Takabatake, K., & Kurosaki, Y.
(2004). Beliefs of chronically ill Japanese patients that lead to intentional nonǦadherence
to medication. J Clin Pharm Ther, 29(5), 417-424.
Iosifescu, A., Halm, E. A., McGinn, T., Siu, A. L., & Federman, A. D. (2008). Beliefs
about generic drugs among elderly adults in hospital-based primary care practices.
Patient education and counseling, 73(2), 377-383.
Isacson, D., & Bingefors, K. (2002). Attitudes towards drugs—a survey in the general
population. Pharmacy World and Science, 24(3), 104-110.
Jacob, J. (2002). Consumer access to health care information: its effect on the physicianpatient relationship. Alaska medicine, 44(4), 75.
Jeffery, R. (1979). Normal rubbish: deviant patients in casualty departments. Sociology of
Health & Illness, 1(1), 90-107.
Jenkins, M. L., & Dunn, D. (2004). Enhancing web-based health information for
consumer education. Applied Nursing Research, 17(1), 68-70.
Johnson, J. A., & Pickard, A. S. (2000). Comparison of the EQ-5D and SF-12 health
surveys in a general population survey in Alberta, Canada. Medical care, 38(1), 115-121.
Jolliffe, I. (2005). Principal component analysis: Wiley Online Library.
Kadry, B., Chu, L. F., Kadry, B., Gammas, D., & Macario, A. (2011). Analysis of 4999
online physician ratings indicates that most patients give physicians a favorable rating.
Journal of medical Internet research, 13(4).
Kaiser, H. F. (1960). The application of electronic computers to factor analysis.
Educational and psychological measurement.
Kannel, W. B. (2003). Prevalence and implications of uncontrolled systolic hypertension.
Drugs & aging, 20(4), 277-286.
Kaplan, S. H., Greenfield, S., & Ware Jr, J. E. (1989). Assessing the effects of physicianpatient interactions on the outcomes of chronic disease. Medical care, 27(3), S110.
163
Kim, S. S., Kaplowitz, S., & Johnston, M. V. (2004). The effects of physician empathy
on patient satisfaction and compliance. Evaluation & the Health Professions, 27(3), 237251.
Klemm, P., Bunnell, D., Cullen, M., Soneji, R., Gibbons, P., & Holecek, A. (2003).
Online cancer support groups: a review of the research literature. Computers Informatics
Nursing, 21(3), 136-142.
Konrat, C., Boutron, I., Trinquart, L., Auleley, G.-R., Ricordeau, P., & Ravaud, P.
(2012). Underrepresentation of elderly people in randomised controlled trials. The
example of trials of 4 widely prescribed drugs. PloS one, 7(3), e33559.
Kripalani, S., Gatti, M. E., & Jacobson, T. A. (2010). Association of age, health literacy,
and medication management strategies with cardiovascular medication adherence.
Patient education and counseling, 81(2), 177-181.
Krousel-Wood, M., Islam, T., Webber, L. S., Re, R., Morisky, D. E., & Muntner, P.
(2009). New medication adherence scale versus pharmacy fill rates in hypertensive
seniors. Am J Manag Care, 15(1), 59.
Krousel-Wood, M. A., Muntner, P., Islam, T., Morisky, D. E., & Webber, L. S. (2009).
Barriers to and determinants of medication adherence in hypertension management:
perspective of the cohort study of medication adherence among older adults. Medical
Clinics of North America, 93(3), 753-769.
Kuppersmith, R. B. (2002). The physician–patient relationship and the Internet.
Otolaryngologic Clinics of North America, 35(6), 1143-1147.
Kutner, M. A., Greenberg, E., & Baer, J. (2005). National Assessment of Adult Literacy
(NAAL): A first look at the literacy of America's adults in the 21st Century: National
Center for Education Statistics, US Department of Education, Institute of Education
Sciences.
Larson, E. B., & Yao, X. (2005). Clinical empathy as emotional labor in the patientphysician relationship. JAMA: the journal of the American Medical Association, 293(9),
1100-1106.
Laugesen, M. J., & Rice, T. (2003). Is the doctor in? The evolving role of organized
medicine in health policy. Journal of Health Politics, Policy and Law, 28(2-3), 289-316.
LaVeist, T. A., & Nuru-Jeter, A. (2002). Is doctor-patient race concordance associated
with greater satisfaction with care? Journal of health and social behavior, 296-306.
Lavsa, S. M., Holzworth, A., & Ansani, N. T. (2010). Selection of a validated scale for
measuring medication adherence. Journal of the American Pharmacists Association:
JAPhA, 51(1), 90-94.
164
Lawler, M. K. (1998). Why patients use alternative medicine. Jama, 280(19), 1659-1661.
Lee, Y.-Y., & Lin, J. L. (2010). Do patient autonomy preferences matter? Linking
patient-centered care to patient–physician relationships and health outcomes. Social
science & medicine, 71(10), 1811-1818.
Légaré, F., & Witteman, H. O. (2013). Shared decision making: examining key elements
and barriers to adoption into routine clinical practice. Health Affairs, 32(2), 276-284.
Lennerling, A., & Forsberg, A. (2012). Self-reported non-adherence and beliefs about
medication in a Swedish kidney transplant population. The open nursing journal, 6, 41.
Leung, L. (2010). Effects of Internet connectedness and information literacy on quality of
life. Social indicators research, 98(2), 273-290.
Lévesque, J.-F., Haggerty, J., Beninguissé, G., Burge, F., Gass, D., Beaulieu, M.D.,Pineault, R., Santor, Beaulieu, C. (2012). Mapping the coverage of attributes in
validated instruments that evaluate primary healthcare from the patient perspective. BMC
family practice, 13(1), 20.
Levinson, W., Kao, A., Kuby, A., & Thisted, R. A. (2005). Not all patients want to
participate in decision making. Journal of general internal medicine, 20(6), 531-535.
Levinson, W., Roter, D. L., Mullooly, J. P., Dull, V. T., & Frankel, R. M. (1997).
Physician-patient communication. Jama, 277(7), 553-559.
Lewis, E. T., Combs, A., & Trafton, J. A. (2010). Reasons for underǦuse of prescribed
opioid medications by patients in pain. Pain Medicine, 11(6), 861-871.
Liang, T. (2011). Association between Use of Internet Services and Quality of Life in
Taiwan. Journal of Data Science, 9, 83-92.
Linn, A. J., Vervloet, M., van Dijk, L., Smit, E. G., & Van Weert, J. C. (2011). Effects of
eHealth interventions on medication adherence: a systematic review of the literature.
Journal of medical Internet research, 13(4).
Lionakis, N., Mendrinos, D., Sanidas, E., Favatas, G., & Georgopoulou, M. (2012). WJC.
World, 4(5), 1-000.
Lleras, C. (2005). Path analysis. Encyclopedia of social measurement, 3, 25-30.
Lloyd-Jones, D., Adams, R., Carnethon, M., De Simone, G., Ferguson, T. B., Flegal, K., .
Greenlund, K. (2009). Heart disease and stroke statistics—2009 update a report from the
American Heart Association Statistics Committee and Stroke Statistics Subcommittee.
Circulation, 119(3), 480-486.
165
Longo, D. R., Land, G., Schramm, W., Fraas, J., Hoskins, B., & Howell, V. (1997).
Consumer reports in health care. JAMA: the journal of the American Medical
Association, 278(19), 1579-1584.
Lorish, C. D., Richards, B., & Brown, S. (1990). Perspective of the patient with
rheumatoid arthritis on issues related to missed medication. Arthritis & Rheumatism,
3(2), 78-84.
Low, G., & Molzahn, A. E. (2007). Predictors of quality of life in old age: A crossǦ
validation study. Research in Nursing & Health, 30(2), 141-150.
Lugtenberg, M., Burgers, J. S., Clancy, C., Westert, G. P., & Schneider, E. C. (2011).
Current guidelines have limited applicability to patients with comorbid conditions: a
systematic analysis of evidence-based guidelines. PloS one, 6(10), e25987.
Macías-Núñez, J.-F., Casado, J.-M. R., del Rey, M. d. l. F., Quiroga, G. B.,
Tresguerres, J. A., Ariznavarreta, C., & López-Novoa, J. M. (2008). Biology of the Aging
Process and Its Clinical Consequences The Aging Kidney in Health and Disease (pp. 5591): Springer.
Macintyre, S. (1994). Understanding the social patterning of health: the role of the social
sciences. Journal of Public Health, 16(1), 53-59.
MacLaughlin, E. J., Raehl, C. L., Treadway, A. K., Sterling, T. L., Zoller, D. P., & Bond,
C. A. (2005). Assessing medication adherence in the elderly. Drugs & aging, 22(3), 231255.
Mårdby, A.-C., Åkerlind, I., & Jörgensen, T. (2007). Beliefs about medicines and selfreported adherence among pharmacy clients. Patient education and counseling, 69(1),
158-164.
Mazzaglia, G., Ambrosioni, E., Alacqua, M., Filippi, A., Sessa, E., Immordino, V.,
Cricelli, C. (2009). Adherence to antihypertensive medications and cardiovascular
morbidity among newly diagnosed hypertensive patients. Circulation, 120(16), 15981605.
McKinstry, B. (2000). Do patients wish to be involved in decision making in the
consultation? A cross sectional survey with video vignettes. BMJ, 321(7265), 867-871.
Mead, N., & Bower, P. (2000). Patient-centredness: a conceptual framework and review
of the empirical literature. Social science & medicine, 51(7), 1087-1110.
Mead, N., Bower, P., & Hann, M. (2002). The impact of general practitioners’ patientcentredness on patients’ post-consultation satisfaction and enablement. Social science &
medicine, 55(2), 283-299.
166
Meadows, K. A. (2011). Patient-reported outcome measures: an overview. British journal
of community nursing, 16(3), 146-151.
Mensah, G. A., Mendis, S., Greenland, K., & MacKay, J. (2004). The atlas of heart
disease and stroke: World Health Organization.
Meryn, S. (1998). Improving doctor-patient communication: not an option, but a
necessity. BMJ: British Medical Journal, 316(7149), 1922.
Mishler, E. G. (1984). The discourse of medicine: Dialectics of medical interviews (Vol.
3): Greenwood Publishing Group.
Morgan, M. (2003). The doctor-patient relationship. Sociology as applied to medicine,
49-65.
Morisky, D. E., Ang, A., KrouselǦWood, M., & Ward, H. J. (2008). Predictive validity of
a medication adherence measure in an outpatient setting. The Journal of Clinical
Hypertension, 10(5), 348-354.
Morisky, D. E., & DiMatteo, M. R. (2011). Improving the measurement of self-reported
medication nonadherence: response to authors. J Clin Epidemiol, 64(3), 255.
Mostaghimi, A., Crotty, B. H., & Landon, B. E. (2010). The availability and nature of
physician information on the internet. Journal of general internal medicine, 25(11),
1152-1156.
Moy, E., & Bartman, B. A. (1995). Physician race and care of minority and medically
indigent patients. Jama, 273(19), 1515-1520.
Mukamel, D. B., & Mushlin, A. I. (1998). Quality of care information makes a
difference: an analysis of market share and price changes after publication of the New
York State Cardiac Surgery Mortality Reports. Medical care, 36(7), 945-954.
Mukamel, D. B., Weimer, D. L., Zwanziger, J., Gorthy, S.-F. H., & Mushlin, A. I.
(2004). Quality report cards, selection of cardiac surgeons, and racial disparities: a study
of the publication of the New York State Cardiac Surgery Reports. Journal Information,
41(4).
Müller-Nordhorn, J., Roll, S., & Willich, S. (2004). Comparison of the short form (SF)12 health status instrument with the SF-36 in patients with coronary heart disease. Heart,
90(5), 523-527.
Nair, K., Dolovich, L., Cassels, A., McCormack, J., Levine, M., Gray, J., Mann, K.,
Burns, S. (2002). What patients want to know about their medications. Focus group study
of patient and clinician perspectives. Canadian Family Physician, 48(1), 104-110.
167
Nazim, A., & Ahmad, S.(2014). A Comparison Between Ordinary Least Square (OLS)
And Structural Equation Modeling (SEM) Methods In Estimating The Influencial Factors
Of 8th Grades Student’s Mathematics Achievement In Malaysia.
Nease Jr, R. F. (1995). Patient desire for information and decision making in health care
decisions. Journal of general internal medicine, 10(11), 593-600.
Nunnally, J. C. (2010). Psychometric Theory 3E: Tata McGraw-Hill Education.
Nussbaum, J. F., & Coupland, J. (2004). Handbook of communication and aging
research: Routledge.
O'Neal, E. L., Adams, J. R., McHugo, G. J., Van Citters, A. D., Drake, R. E.,
& Bartels, S. J. (2008). Preferences of older and younger adults with serious mental
illness for involvement in decision-making in medical and psychiatric settings. American
Journal of Geriatric Psych, 16(10), 826-833.
Oates, J., Weston, W. W., & Jordan, J. (2000). The impact of patient-centered care on
outcomes. Fam Pract, 49, 796-804.
Odigie, E. G., & Marshall, R. (2008). Quality monitoring of physicians: linking patients’
experiences of care to clinical quality and outcomes. Journal of general internal
medicine, 23(11), 1784-1790.
Ogden, J. (2012). Health psychology: McGraw-Hill International.
Orley, J., Kuyken, W., & de la Santé, O. M. (1994). Quality of life assessment:
international perspectives: Springer.
Osterberg, L., & Blaschke, T. (2005). Adherence to medication. New England Journal of
Medicine, 353(5), 487-497.
Paraskevi, T. (2012). The Effect of Sociodemographic Features and Beliefs about
Medicines on Adherence to Chronic Kidney Disease Treatment. Journal of Clinical
Research & Bioethics.
Parker, R. M., Baker, D. W., & Williams, M. V. (1995). The test of functional health
literacy in adults. Journal of general internal medicine, 10(10), 537-541.
Parsons, T. (1951). Illness and the role of the physician: A sociological perspective*.
American Journal of orthopsychiatry, 21(3), 452-460.
Patient-centered care for older adults with multiple chronic conditions: a stepwise
approach from the American Geriatrics Society: American Geriatrics Society Expert
Panel on the Care of Older Adults with Multimorbidity. (2012). J Am Geriatr Soc,
60(10), 1957-1968. doi: 10.111/j.1532-5415.201.04187.
168
Pearson, B., Skelly, R., Wileman, D., & Masud, T. (2002). Unplanned readmission to
hospital: a comparison of the views of general practitioners and hospital staff. Age and
ageing, 31(2), 141-143.
Persaud, R. (2005). How to improve communication with patients. BMJ Career Focus,
330(7494), 136-137.
Phatak, H. M., & Thomas, J. (2006). Relationships between beliefs about medications
and nonadherence to prescribed chronic medications. The Annals of pharmacotherapy,
40(10), 1737-1742.
Pittman, D. G., Tao, Z., Chen, W., & Stettin, G. D. (2010). Antihypertensive medication
adherence and subsequent healthcare utilization and costs. Am J Manag Care, 16(8), 568576.
Poochikian-Sarkissian, S., Sidani, S., Ferguson-Pare, M., & Doran, D. (2009). Examining
the relationship between patient-centred care and outcomes. Canadian journal of
neuroscience nursing, 32(4), 14-21.
Pound, P., Britten, N., Morgan, M., Yardley, L., Pope, C., Daker-White, G.,
& Campbell, R. (2005). Resisting medicines: a synthesis of qualitative studies of
medicine taking. Social science & medicine, 61(1), 133-155.
Radecki, S. E., Kane, R. L., Solomon, D. H., Mendenhall, R. C., & Beck, J. C. (1988).
Do physicians spend less time with older patients? Journal of the American Geriatrics
Society, 36(8), 713-718.
Ramstrom, H., Afandi, S., Elofsson, K., Peterssonn, S. (2006). Differences in beliefs
between patients and pharmaceutical specialists regarding medications. Patient
Education & Counseling, 62, 244-249.
Rao, M., Clarke, A., Sanderson, C., & Hammersley, R. (2006). Patients' own assessments
of quality of primary care compared with objective records based measures of technical
quality of care: cross sectional study. BMJ, 333(7557), 19.
Ray, P. (1997). The emerging culture. American Demographics. Retrieved March 10,
2013, from www.demographics.com.
Reimann, S., & Strech, D. (2010). The representation of patient experience and
satisfaction in physician rating sites. A criteria-based analysis of English-and Germanlanguage sites. BMC Health Serv Res, 10(1), 332.
Robins, L. S., & Wolf, F. M. (1988). Confrontation and politeness strategies in physicianpatient interactions. Social science & medicine, 27(3), 217-221.
169
Robinson, T. E., White, G., & Houchins, J. C. (2006). Improving communication with
older patients: tips from the literature. Family practice management, 13(8), 73.
Rodriguez-Osorio, C. A., & Dominguez-Cherit, G. (2008). Medical decision making:
paternalism versus patient-centered (autonomous) care. Curr Opin Crit Care, 14(6), 708713.
Rodriguez, K. L., Appelt, C. J., Switzer, G. E., Sonel, A. F., & Arnold, R. M. (2008).
Veterans' decision-making preferences and perceived involvement in care for chronic
heart failure. Heart & Lung: The Journal of Acute and Critical Care, 37(6), 440-448.
Rosenthal, M. B., Berndt, E. R., Donohue, J. M., Frank, R. G., & Epstein, A. M. (2002).
Promotion of prescription drugs to consumers. New England Journal of Medicine,
346(7), 498-505.
Roumie, C. L., Greevy, R., Wallston, K. A., Elasy, T. A., Kaltenbach, L., Kotter, K.,
Dittus, R. S., Speroff, T. (2011). Patient centered primary care is associated with patient
hypertension medication adherence. Journal of behavioral medicine, 34(4), 244-253.
Routledge, P., O'Mahony, M., & Woodhouse, K. (2004). Adverse drug reactions in
elderly patients. British journal of clinical pharmacology, 57(2), 121-126.
Sa’ed, H., Al-Jabi, S. W., Sweileh, W. M., & Morisky, D. E. (2013). Relationship of
treatment satisfaction to medication adherence: findings from a cross-sectional survey
among hypertensive patients in Palestine. Health and Quality of life Outcomes, 11(1),
191.
Sabaté, E. (2003). Adherence to long-term therapies: evidence for action: World Health
Organization.
Sacco, R. L., Benjamin, E. J., Broderick, J. P., Dyken, M., Easton, J. D., Feinberg, W.
M., Goldstein, L. B., Gorelick, P. B., Howard, G.,.Kittner, S. J. (1997). Risk factors.
Stroke, 28(7), 1507-1517.
Safran, D. G., Kosinski, M., Tarlov, A. R., Rogers, W. H., Taira, D. A., Lieberman, N., &
Ware, J. E. (1998). The Primary Care Assessment Survey: tests of data quality and
measurement performance. Medical care, 36(5), 728-739.
Sandra L. McGinnis, J. M. (March 2006). The Impact of the Aging Population on the
Health Workforce in the United States: Summary of Key Findings. Rensselaer, NY:
University at Albany.
Schmader, K., Hanlon, J. T., Weinberger, M., & Landsman, P. B. (1994).
Appropriateness of medication prescribing in ambulatory elderly patients. Journal of the
American Geriatrics Society.
170
Schneider, A., Körner, T., Mehring, M., Wensing, M., Elwyn, G., & Szecsenyi, J. (2006).
Impact of age, health locus of control and psychological co-morbidity on patients’
preferences for shared decision making in general practice. Patient education and
counseling, 61(2), 292-298.
Schüz, B., Wurm, S., Ziegelmann, J. P., Warner, L. M., Tesch-Römer, C., & Schwarzer,
R. (2011). Changes in functional health, changes in medication beliefs, and medication
adherence. Health Psychology, 30(1), 31.
Sciamanna, C. N., Clark, M. A., Diaz, J. A., & Newton, S. (2003). Filling the gaps in
physician communication: The role of the Internet among primary care patients.
International journal of medical informatics, 72(1), 1-8.
Segal, J. (2009). The role of the Internet in doctor performance rating. Pain Physician,
12(3), 659-664.
Seibert, J. H., Brien, J. S., Maaske, B. L., Kochurka, K., Feldt, K., Fader, L., & Race, K.
E. (1999). Assessing Patient Satisfaction across the Continuum of Ambulatory Care: A
Revalidation and Validation of CareǦSpecific Surveys. The Journal of ambulatory care
management, 22(2), 9-26.
Shaw, B. R., Han, J. Y., Hawkins, R. P., Stewart, J., McTavish, F., & Gustafson, D. H.
(2007). Doctor–patient relationship as motivation and outcome: examining uses of an
interactive cancer communication system. International journal of medical informatics,
76(4), 274-282.
Sillence, E., Briggs, P., Harris, P. R., & Fishwick, L. (2007). How do patients evaluate
and make use of online health information? Social science & medicine, 64(9), 1853-1862.
Sokol, M. C., McGuigan, K. A., Verbrugge, R. R., & Epstein, R. S. (2005). Impact of
medication adherence on hospitalization risk and healthcare cost. Med Care, 43(6), 521530.
Spinewine, A., Schmader, K. E., Barber, N., Hughes, C., Lapane, K. L., Swine, C., &
Hanlon, J. T. (2007). Appropriate prescribing in elderly people: how well can it be
measured and optimised? The Lancet, 370(9582), 173-184.
Stats, I. W. (2012). Internet usage statistics. The Internet big picture: World Internet users
and populations stats.
Stein, K. (2006). Communication is the heart of provider–patient relationship. J Am Diet
Assoc, 106(4), 508-512.
Stevenson, D. G. (2006). Is a public reporting approach appropriate for nursing home
care? Journal of Health Politics, Policy and Law, 31(4), 773-810.
171
Stevenson, F. A., Barry, C. A., Britten, N., Barber, N., & Bradley, C. P. (2000). Doctor–
patient communication about drugs: the evidence for shared decision making. Social
science & medicine, 50(6), 829-840.
Stewart, M. A. (1995). Effective physician-patient communication and health outcomes:
a review. CMAJ: Canadian Medical Association Journal, 152(9), 1423.
Street Jr, R. L., Gordon, H., & Haidet, P. (2007). Physicians’ communication and
perceptions of patients: Is it how they look, how they talk, or is it just the doctor? Social
science & medicine, 65(3), 586-598.
Street Jr, R. L., Makoul, G., Arora, N. K., & Epstein, R. M. (2009). How does
communication heal? Pathways linking clinician–patient communication to health
outcomes. Patient education and counseling, 74(3), 295-301.
Streiner, D. L. (2005). Finding our way: an introduction to path analysis. The Canadian
Journal of Psychiatry/La Revue canadienne de psychiatrie.
Strull, W. M., Lo, B., & Charles, G. (1984). Do patients want to participate in medical
decision making? JAMA: the journal of the American Medical Association, 252(21),
2990-2994.
Suhr, D. D. (2005). Principal component analysis vs. exploratory factor analysis. SUGI
30 Proceedings, 203-230.
Tabachnick, B. G., & Fidell, L. S. (2001). Using multivariate statistics.
Tara Lagu MD, M., Hannon, N. S., Rothberg, M. B., & Lindenauer, P. K. (2010).
Patients’ evaluations of health care providers in the era of social networking: an analysis
of physician-rating websites. Journal of general internal medicine, 25(9), 942-946.
Tariman, J., Berry, D., Cochrane, B., Doorenbos, A., & Schepp, K. (2010). Preferred and
actual participation roles during health care decision making in persons with cancer: a
systematic review. Annals of Oncology, 21(6), 1145-1151.
Thorndike, R. L., & Hagen, E. (1961). Measurement and evaluation in psychology and
education.
Torrance, G. W., & Drummond, M. (2005). Methods for the economic evaluation of
health care programs: Oxford University Press.
Travaline, J. M., Ruchinskas, R., & D'Alonzo, G. E. (2005). Patient-physician
communication: why and how. JAOA: Journal of the American Osteopathic Association,
105(1), 13-18.
172
Trigg, L. (2011). Patients' opinions of health care providers for supporting choice and
quality improvement. Journal of health services research & policy, 16(2), 102-107.
Tucker 3rd, J., & Kelley, V. A. (2000). The influence of patient sociodemographic
characteristics on patient satisfaction. Military medicine, 165(1), 72-76.
U.S. Administration on Aging (AOA). (2012). Retrieved Sptember 15, 2013, from
http://www.aoa.gov/AoARoot/Aging_Statistics/Profile/2011/2.aspx.
Van Woerkum, C. M. (2003). The Internet and primary care physicians: coping with
different expectations. The American journal of clinical nutrition, 77(4), 1016S-1018S.
Ventola, C. L. (2011). Direct-to-consumer pharmaceutical advertising: therapeutic or
toxic? Pharmacy and Therapeutics, 36(10), 669.
Wald, H. S., Dube, C. E., & Anthony, D. C. (2007). Untangling the Web—the impact of
Internet use on health care and the physician–patient relationship. Patient education and
counseling, 68(3), 218-224.
Wallace, L. S., Rogers, E. S., Roskos, S. E., Holiday, D. B., & Weiss, B. D. (2006). Brief
report: screening items to identify patients with limited health literacy skills. Journal of
general internal medicine, 21(8), 874-877.
Ward, B. W. (2013). Prevalence of multiple chronic conditions among US adults:
estimates from the National Health Interview Survey, 2010. Preventing chronic disease,
10.
Ware Jr, J. E., Kosinski, M., & Keller, S. D. (1996). A 12-Item Short-Form Health
Survey: construction of scales and preliminary tests of reliability and validity. Medical
care, 34(3), 220-233.
Wasson, J. H. (2008). Adapting what is known. BMJ, 336(7650), 950-951.
WHO. Failure to take prescribed medicine for chronic diseases is a massive, world-wide
problem. Press Release. Retrieved 27 October, 2013, from
http://www.who.int/mediacentre/news/releases/2003/pr54/en/.
Wilhelmson, K., Andersson, C., Waern, M., & Allebeck, P. (2005). Elderly people's
perspectives on quality of life. Ageing and Society, 25(4), 585-600.
Wilkinson, C., Khanji, M., Cotter, P., Dunne, O., & O’keeffe, S. (2008). Preferences of
acutely ill patients for participation in medical decision-making. Quality and Safety in
Health Care, 17(2), 97-100.
173
Winker, M. A., Flanagin, A., Chi-Lum, B., White, J., Andrews, K., Kennett, R. L., . . .
Musacchio, R. A. (2000). Guidelines for medical and health information sites on the
Internet. JAMA: the journal of the American Medical Association, 283(12), 1600-1606.
Xavier, F. M., Ferraz, M., Marc, N., Escosteguy, N. U., & Moriguchi, E. H. (2003).
Elderly people s definition of quality of life. Revista Brasileira de Psiquiatria, 25(1), 3139.
Ybarra, M. L., & Suman, M. (2006). Help seeking behavior and the Internet: a national
survey. International journal of medical informatics, 75(1), 29-41.
Zachariae, R., Pedersen, C. G., Jensen, A. B., Ehrnrooth, E., Rossen, P., & Von Der
Maase, H. (2003). Association of perceived physician communication style with patient
satisfaction, distress, cancer-related self-efficacy, and perceived control over the disease.
British Journal of Cancer, 88(5), 658-665.
Zandbelt, L. C., Smets, E., Oort, F. J., Godfried, M. H., & de Haes, H. C. (2006).
Determinants of physicians’ patient-centred behaviour in the medical specialist
encounter. Social science & medicine, 63(4), 899-910.
174
APPENDIX A. QUESTIONNAIRES AND COPYRIGHT PERMISSIONS
175
BELIEFS ABOUT MEDICINES QUESTIONNAIRE (BMQ) PERMISSION
176
177
PRIMARY CARE ASSESSMENT SURVEY (PCAS) PERMISSION
178
SHORT FORM HEALTH SURVEY (SF-12V2) PERMISSION
179
MORISKY MEDICATION ADHERENCE SCALE (MMAS-8) PERMISSION
180
181
182
FACTORS INFLUENCING PHYSICIAN-PATIENT COMMUNICATION
(FIGURE 2-1) PERMISSION
183
184
STAGED MODEL OF TRUST (FIGURE 2-4) PERMISSION
185
186
MODEL OF TREATMENT DECISION-MAKING (TABLE 2-1) PERMISSION
187
188
189
APPENDIX B. INSTITUTIONAL REVIEW BOARD DOCUMENTS
190
UT IRB APPROVAL
191
STUDY COVER LETTER (CONSENT FORM)
192
VITA
Yazed Sulaiman AlRuthia was born in Riyadh, Saudi Arabia in 1983. He completed
his bachelor degree in pharmaceutical sciences from King Saud University in Riyadh,
Saudi Arabia, in 2007. After receiving his degree, he worked as a teaching assistant in the
college of pharmacy at King Saud University from year 2007-2008. In fall 2008, he
received a scholarship from the Saudi Arabian ministry of higher education to pursue his
doctor of pharmacy from Massachusetts College of Pharmacy and Health sciences in
Worcester, MA. In May 2011, he completed his doctor of pharmacy degree and joined
the PhD program at the University of Tennessee (Major: Health Outcomes and Policy
Research).
193


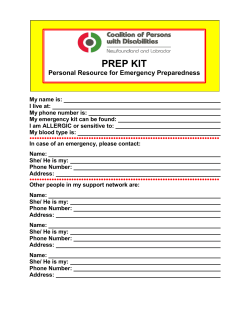


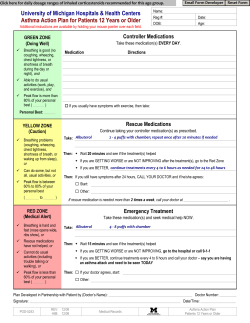


© Copyright 2026