
Annual Results for the Year Ended 31 December 2014
Hong Kong Exchanges and Clearing Limited and The Stock Exchange of Hong Kong Limited take
no responsibility for the contents of this announcement, make no representation as to its accuracy or
completeness and expressly disclaim any liability whatsoever for any loss howsoever arising from or
in reliance upon the whole or any part of the contents of this announcement.
(a joint stock limited company incorporated in the People ’s Republic of China with limited
liability)
(Stock Code: 0386)
Annual Results for the Year Ended 31 December 2014
1.
Important Notice
1.1 The board of directors, the board of supervisors, directors, supervisors and
senior management of China Petroleum & Chemical Corporation (“Sinopec
Corp.”) warrant that there are no false representations, misleading statements
or material omissions in this announcement, and jointly and severally accept
full responsibility for the authenticity, accuracy and completeness of the
information contained in this announcement.
This announcement is a summary of the annual report of Sinopec Corp. for the
year ended 31 December 2014 (the “ Annual Report” ). The entire report can be
downloaded from the websites of The Stock Exchange of Hong Kong Limited
( “ Hong Kong Stock Exchange ” ) (www.hkexnews.hk) and Sinopec Corp.
(www.sinopec.com.cn). Investors should read the Annual Report for more
details.
1.2 The Annual Report has been approved unanimously at the 23rd Meeting
of the Fifth Session of the Board of Directors of Sinopec Corp. Except for
Mr. Wang Zhigang who did not attend the meeting due to official duties, all
directors of Sinopec Corp. attended the 23rd Meeting of the Fifth Session of
the Board of Directors. No Director has any doubt as to, or the inability to
warrant, the authenticity, accuracy and completeness of the Annual Report.
–1–
1.3 The annual financial statements for the year ended 31 December 2014 (the
“ reporting period ” ) of Sinopec Corp. and its subsidiaries (together, the
“Company”) prepared in accordance with the China Accounting Standards for
Business Enterprises (“ASBE”) and International Financial Reporting Standards
(“IFRS”) have been audited by Pricewaterhousecoopers Zhong Tian LLP and
Pricewaterhousecoopers respectively. Both firms have issued standard unqualified
auditor’s reports.
1.4 Mr. Fu Chengyu, Chairman of the Board of directors, Mr. Li Chunguang,
director and president, and Mr. Wang Xinhua, Chief Financial Officer and
Head of the Financial Department warrant the authenticity and completeness
of the financial statements contained in the Annual Report.
2.
Basic Information about Sinopec Corp.
2.1 Basic information of Sinopec Corp.
Stock name
Stock code
Place of listing
SINOPEC CORP SINOPEC CORP SINOPEC CORP SINOPEC CORP
0386
SNP
SNP
600028
Hong Kong
New York
London
Shanghai
Stock Exchange Stock Exchange Stock Exchange Stock Exchange
22 Chaoyangmen North Street, Chaoyang District, Beijing, China
Registered address
and office address
Postcode
100728
Website
www.sinopec.com
E-mail
[email protected]
2.2 Contact persons of Sinopec Corp. and means of communication
Authorised representatives
Name
Address
Tel
Fax
E-mail
Secretary to the
Representative on
Board of Directors Securities Matters
Mr. Li Chunguang Mr. Huang Wensheng Mr. Huang Wensheng Mr. Zheng Baomin
22 Chaoyangmen North Street, Chaoyang District, Beijing, China
86-10-5996 0028
86-10-5996 0028
86-10-5996 0028
86-10-5996 0028
86-10-5996 0386
86-10-5996 0386
86-10-5996 0386
86-10-5996 0386
[email protected]
–2–
3
Principal Financial Data and Indicators
3.1 Financial data and indicators prepared in accordance with the China
Accounting Standards for Business Enterprises ( “ ASBE ” ) for the year
ended 31 December 2014 of the Company
Items
Total assets
Total equity attributable
to shareholders
of the Company
Items
Net cash flow from operating
activities
Operating income
Net profit attributable
to equity shareholders
of the Company
Net profit attributable
to equity shareholders
of the Company after
deducting extraordinary
gain/loss items
Weighted average return
on net assets (%)
Basic earnings per share
(RMB)
Diluted earnings per share
(RMB)
As at
31 December
2014
RMB million
As at
31 December
2013
RMB million
Changes
from the end
of the
last year
%
As at
31 December
2012
RMB million
1,451,368
1,382,916
4.9
1,238,522
594,483
570,346
4.2
513,374
Year ended 31 December
Changes over
the same
period from
the end
2014
2013
of last year
RMB million RMB million
%
2012
RMB million
148,347
2,825,914
151,893
2,880,311
(2.3)
(1.9)
143,462
2,786,045
47,430
67,179
(29.4)
63,496
43,238
66,658
(35.1)
61,922
8.14
12.24
(4.10)
Percentage
points
12.80
0.406
0.579
(29.9)
0.562
0.406
0.543
(25.2)
0.542
–3–
3.2 Principal Financial Data and Indicators Prepared in Accordance with
International Financial Reporting Standards ( “ IFRS ” ) for the year
ended 31 December 2014 of the Company
Items
Turnover and other operating
revenues (RMB million)
Operating profit
(RMB million)
Profit before taxation
(RMB million)
Net profit attributable
to owners of the Company
(RMB million)
Basic earnings per share
(RMB)
Diluted earnings per share
(RMB)
Return on capital
employed (%)
Return on net assets (%)
Net cash generated
from operating activities
per share (RMB)
For the year ended 31 December
2013
2012
2011
2014
2010
2,825,914
2,880,311
2,786,045
2,505,683
1,913,182
73,487
96,785
98,662
105,530
104,974
65,504
95,052
90,642
104,565
103,663
46,466
66,132
63,879
73,225
71,782
0.398
0.570
0.566
0.650
0.637
0.397
0.534
0.545
0.625
0.631
6.05
7.84
8.02
11.63
9.09
12.50
11.49
15.50
12.95
17.11
1.270
1.308
1.262
1.336
1.512
–4–
Items
Non-current assets
(RMB million)
Net current liabilities
(RMB million)
Non-current liabilities
(RMB million)
Non-controlling interests
(RMB million)
Total equity attributable
to owners of the Company
(RMB million)
Net assets per share (RMB)
Adjusted net assets per share
(RMB)
As at 31 December
2013
2012
2014
2011
2010
1,091,224
1,009,906
892,929
794,423
727,642
244,113
198,812
148,358
101,485
76,177
201,534
189,468
196,535
185,594
200,429
52,536
52,823
37,122
35,016
31,432
593,041
5.014
568,803
4.880
510,914
4.527
472,328
4.191
419,604
3.723
4.950
4.841
4.476
4.172
3.722
–5–
3.3 Significant changes of items in the financial statements ( “ ASBE ” )
The table below sets forth reasons for those changes where the fluctuation
was more than 30% during the reporting period, or such changes which
constituted 5% or more of total assets at the balance sheet date or more than
10% of profit before taxation:
Items
At 31 December Increase/(decrease)
2014
2013 Amount Percentage
RMB
RMB
RMB
millions millions millions (%)
Cash at bank and
on hand
Bills receivable
10,100
15,101
(5,001)
13,963
28,771
(14,808)
Accounts receivable
90,831
68,466
22,365
Other receivables
29,251
13,165
16,086
Available-for-sale
financial assets
Intangible assets
868
3,730
(2,862)
78,681
60,263
18,418
6,979
4,141
2,838
Short-term loans
166,688
108,121
58,567
Non-current
liabilities due
within one year
11,890
45,749
(33,859)
Long-term loans
67,426
46,452
20,974
Other non-current
liabilities
11,549
8,187
3,362
Deferred tax assets
–6–
Reasons for change
(33.1) Mainly due to the use of cash to make up
monetary gap
(51.5) Mainly due to the decrease in selling price
of chemical products, resulting in the
decrease of bills receivable, and the increase
in endorsement and discount of bills of
Chemical Sales Company
32.7 Mainly due to the increase of accounts
receivable balance from Unipec and other
subsidiaries’ trade transaction
122.2 Mainly due to the increase in hedging volume
of Unipec
(76.7) Mainly due to the disposal of China Gas
stock
30.6 Please refer to Note 14 to the financial
statements prepared in accordance with ASBE
68.5 Mainly due to the increase of tax losses
carried forward in Yangzi and other
subsidiaries and the losses from hedging
54.2 Please refer to Note 20 to the financial
statements prepared in accordance with ASBE
(74.0) Mainly due to the repayment of RMB 3.5
billion corporate bond, RMB 30 billion
bonds with warrants and HKD 11.7 billion
convertible bonds. And parts of the long-term
debentures reclassified to the non-current
liabilities due within one year
45.2 Please refer to Note 28 to the financial
statements prepared in accordance with ASBE
41.1 Mainly due to the increase of loan principal
under the long-term loan agreement between
Sinopec International Petroleum Exploration
and Production Limited’s (“SIPL”) subsidiary
and the Sinopec Group
Items
At 31 December Increase/(decrease)
2014
2013 Amount Percentage
RMB
RMB
RMB
millions millions millions (%)
Capital reserve
48,703
36,947
11,756
Other comprehensive
income
(7,261)
407
(7,668)
491
1,556
(1,065)
Financial expenses
9,618
6,274
3,344
Impairment losses
6,839
4,044
2,795
(Loss)/Gain from
changes in fair value
(4,151)
2,167
(6,318)
Investment income
8,137
2,510
5,627
Non-operating
income
Income tax expense
4,710
3,481
1,229
17,571
25,605
(8,034)
1,480
4,198
(2,718)
Specific reserve
Minority interests
–7–
Reasons for change
31.8 Mainly due to the partial conversion of
Sinopec CB
(1,884.0) Mainly due to cash flow hedging losses of
Unipec and Sinopec (Hong Kong) Limited
etc., and foreign currency translation
differences of SIPL’s joint venture companies
(68.4) Please refer to Note 35 to the financial
statements prepared in accordance with ASBE
53.3 Mainly due to change of foreign exchange
gain or loss resulting from the fluctuation of
RMB exchange rate
69.1 Please refer to Note 42 to the financial
statements prepared in accordance with ASBE
(291.6) M a i n l y d u e t o f a i r v a l u e c h a n g e s o f
derivatives embedded in RMB 23 billion
convertible bonds of the Company
224.2 Please refer to Note 44 to the financial
statements prepared in accordance with ASBE
35.3 Please refer to Note 45 to the financial
statements prepared in accordance with ASBE
(31.4) Please refer to Note 47 to the financial
statements prepared in accordance with ASBE
(64.7) Mainly due to the decrease in profits of
holding subsidiaries
4.
Changes in Share Capital and Shareholdings of the Principal Shareholders
4.1 Changes in the share capital
Unit: Share
Before change
Increase/(decrease)
Percentage
Items
RMB ordinary shares
Domestically listed foreign shares
Overseas listed foreign shares
Others
Total Shares
*:
New shares
Bonus
Conversion
issued shares issued
from reserve
Numbers
(%)
91,051,875,187
78.11
—
—
—
25,513,438,600
After change
Percentage
Others
Sub-total
Number
(%)
—-
— 1,715,081,853 1,715,081,853* 92,766,957,040
78.43
—
—
—
—
—
—
—
21.89
—
—
—
—
— 25,513,438,600
21.57
—
—
—
—
—
—
—
116,565,313,787
100
—
—
1,715,081,853 1,715,081,853 118,280,395,640
100
During the reporting period, a total number of 84,420,170 units Sinopec CB had been
converted into A shares of Sinopec Corp, resulting in a total increase of 1,715,081,853
shares.
4.2 Number of shareholders and their shareholdings
As at 31 December 2014, the total number of shareholders of Sinopec Corp.
was 695,385 including 688,972 holders of domestic A shares and 6,413
holders of overseas H shares. As at 13 March 2015, the total number of
shareholders of Sinopec Corp. was 851,381. Sinopec Corp. has complied
with requirement for minimum public float under the Rules Governing
the Listing of Securities on the Stock Exchange of Hong Kong Limited
( “ the Hong Kong Listing Rules ” ). From the end of the reporting period to
Redemption Record Date (11 February 2015), a total of 2,790,814,006 A
shares were converted from the RMB 23 billion A share convertible bond of
Sinopec Corp. ( “ Sinopec CB ” ).
–8–
(1) Shareholdings of top ten shareholders
The shareholdings of top ten shareholders as at 31 December 2014 are listed
as below:
Unit: Share
Name of shareholders
China Petrochemical Corporation
HKSCC Nominees Limited2
國泰君安證券股份有限公司
中國證券金融股份有限公司
卡塔爾控股有限責任公司-自有資金
中國建設銀行-鵬華價值優勢股票型
證券投資基金
中國建設銀行股份有限公司-博時裕富
滬深300指數證券投資基金
中國工商銀行-上證50交易型開放式
指數證券投資基金
南方東英資產管理有限公司-南方富時
中國A50ETF
中國銀行股份有限公司-嘉實滬深300
交易型開放式指數證券投資基金
Nature of
Shareholders
Percentage of
shareholdings
%
Total
number of
shares held
State-owned share
H share/A share
A share
A share
A share
72.47 85,720,671,101
21.48 25,402,335,709
0.25
292,891,836
0.23
268,156,856
0.08
89,996,185
A share
0.04
A share
Number of
shares subject
Changes of to pledges or
shareholding1
lock-up
57,722,243
30,154,650
(45,486,499)
(22,699,951)
0
0
Unknown
0
0
0
44,999,949
9,714,546
0
0.04
41,897,694
34,897,694
0
A share
0.03
37,487,694
(15,712,129)
0
A share
0.03
35,516,572
(26,378,536)
0
A share
0.03
30,426,070
751,787
0
Note 1 As compared with the number of shares as at 31 December 2013.
Note 2 Sinopec Century Bright Capital Investment Limited, overseas wholly-owned
subsidiary of China Petrochemical Corporation, holds 553,150,000 H shares,
accounting for 0.47% of the total share capital of Sinopec Corp. which is included in
the total number of the shares held by HKSCC Nominees Limited.
We are not aware of any connected relationship or acting in concert among
or between the above-mentioned shareholders.
–9–
(2) Information disclosed by the shareholders of H shares according to the
Securities and Futures Ordinance ( “ SFO ” )
Approximate
percentage of
Sinopec Corp. ’s
Name of shareholders
Status of shareholders
JPMorgan Chase & Co. Beneficial owner
BlackRock, Inc.
Schroders Plc
Investment manager
Trustee (other than
a bare trustee)
Custodian corporation/approved
lending agent
Interest of corporation
controlled by
the substantial shareholder
Investment manager
Number of shares
interests held or
regarded as held *
issued share
capital
(H Share)
(%)
656,026,310(L)
360,358,429(S)
364,641,100(L)
32,200(L)
2.57(L)
1.41(S)
1.42(L)
0.00(L)
1,357,077,571(L)
5.31(L)
2,020,880,233(L)
7.92(L)
31,124,000(S)
1,528,199,922(L)
0.12(S)
5.99 (L)
*: (L): Long position, (S): Short position
4.3 Changes in the controlling shareholders and the de facto controller
There was no change in the controlling shareholders and the de facto
controller of Sinopec Corp. during 2014.
– 10 –
(1) Controlling shareholder
The controlling shareholder of Sinopec Corp. is China Petrochemical
Corporation. Established in July 1998, China Petrochemical Corporation
is a state-authorised investment organisation and a state-owned
enterprise. Its registered capital is RMB 274,866,534,000, and the legal
representative is Mr. Fu Chengyu. The organisation code of China
Petrochemical Corporation is 10169286-X. Through re-organisation
in 2000, China Petrochemical Corporation injected its principal
petroleum and petrochemical businesses into Sinopec Corp. and retained
certain petrochemical facilities and small-scale refineries. It provides
well-drilling services, well-logging services, downhole operation
services, services in connection with manufacturing and maintenance
of production equipment, engineering construction, utility services
including water and power and social services.
Shares of other listed companies directly held by China
Petrochemical Corporation
Name of
Company
Sinopec Engineering (Group) Co. Ltd
Sinopec Yizheng Chemical Fibre Company Limited
Kingdream Public Limited Company
China Merchants Energy Shipping Co., Ltd
Number
of Shares
(shares)
Percentage
2,907,856,000
9,224,327,662
270,270,000
911,886,426
65.67%
72.01%
67.50%
19.32%
(2) Other than HKSCC Nominees Limited, there was no other legal
person or shareholder holding 10% or more of the total issued share
capital of Sinopec Corp.
(3) Basic information of the de facto controller
China Petrochemical Corporation is the de facto controller of Sinopec
Corp.
– 11 –
(4) Diagram of the equity and controlling relationship between Sinopec
Corp. and its de facto controller
Note: Inclusive of 553,150,000 H shares held by Sinopec Century Bright Capital
Investment Ltd. (overseas wholly-owned subsidiary of China Petrochemical
Corporation) through HKSCC Nominees Limited.
5.
Information on Appointment or Termination of Directors, Supervisors and
Senior Management
In October 2014, Mr. Zhang Jianhua, an Director and Senior Vice President of
Sinopec Corp., was appointed concurrently as Chairman of Sinopec Engineering
(Group) Co.,Ltd..
In October 2014, Mr. Cai Xiyou has tendered his resignation as the director,
member of the Strategy Committee of the Board and Senior Vice President of
Sinopec Corp., due to new working arrangement.
In May 2014, in accordance with Board Resolution of the 17th meeting of the
Fifth Session of the Board of Directors of Sinopec Corp., the Board nominated
and appointed Mr. Chang Zhenyong and Mr. Huang Wensheng as the Vice
President of Sinopec Corp.. In August 2014, Mr. Wang Yongjian has tendered
his resignation as the Vice President of the Sinopec Corp., due to work-related
reasons.
Mr. Ma Weihua, an Independent Non-executive Director of Sinopec Corp., has
been appointed as Independent Director of China World Trade Center Co., Ltd.
since August 2014.
Mr. Jiang Xiaoming, an Independent Non-executive Director of Sinopec Crop.,
was no longer the independent Non-executive Director of Greennland Hong Kong
Holdings Limited since 4 June 2014.
– 12 –
Mr. Andrew Y. Yan, an Independent Non-executive Director of Sinopec Corp.,
has been appointed as Independent Non-executive Director of CPMC Holdings
Limited since March 2014, Independent Non-executive Director of Cogobuy
Group since July 2014, and Independent Director of Beijing BlueFocus Brand
Management Consulting Co, Ltd. since March 2014. And he was no longer
Independent Non-executive Director of China Mengniu Dairy Co. and Fosun
International Ltd., the Independent Director of Giant Network Co. Ltd. and
Director of Acorn International Co., Ltd.
Ms. Bao Guoming, an Independent Non-executive Director of Sinopec Corp., was
no longer External Supervisor of Bank of China and Independent Non-executive
Director of Hebei Chengde Lulu Co., Limited.
In September 2014, Mr. Zhou Shiliang, an Employee ’ s Representative Supervisor
of Sinopec Corp., was appointed as the Secretary of CPC Committee, Board
Director and Vice President of Sinopec Oilfield Service Co. Ltd;
6
Business Review and Prospects
Business Review
In 2014, the global economic recovery remained weak, and China ’ s GDP grew by
7.4%. The Company, focusing on growth quality and efficiency, further deepened
reforms, transformed its growth model and strengthened its management.
Through intensified analysis and forecasting of macroeconomy and market
trends, we actively responded to the significant change of international crude
oil prices while expediting structural adjustments, expanding our markets and
enhancing fine management and cost controls. All of these efforts contributed to
stable operations of the Company.
– 13 –
6.1 Market Review
(1) Crude oil and natural gas
In 2014, international crude oil prices fluctuated at a high level in the
first half of the year and plunged in the second half, with a precipitous
drop in the fourth quarter. The average spot price of Platts Brent for
the year was USD 99.45 per barrel, 8.5% lower than the previous year.
China ’ s demand for natural gas continued to increase in 2014. Chinese
Government made further adjustments to the price of existing supplies of
non-residential natural gas, thus gradually aligning domestic gas prices
with those of alternative energy sources.
– 14 –
(2) Oil products market
In 2014, Chinese government timely adjusted domestic oil product prices
in response to changes in international crude oil prices. In the second
half of 2014, domestic oil product prices experienced 11 consecutive
cuts as international crude prices plummeted. Affected by slowing
economic growth, domestic demand for oil products grew at a lower
rate, with diesel demand decreased despite a continued increase in
gasoline demand. Statistics show that domestic apparent consumption of
oil products (including gasoline, diesel and kerosene) was 269 million
tonnes in 2014, up by 2.0% from the previous year.
(3) Chemicals
In 2014, chemical prices declined continuously. The second half of the
year saw a bigger decrease in feedstock costs than in chemical prices,
thus improving chemical margins. According to the Company ’ s statistics,
domestic apparent consumption of synthetic resin and synthetic fiber
rose by 8.7% and 7.0%, respectively, from the previous year, while
apparent consumption of synthetic rubber fell by 1.9% and that of
ethylene equivalent grew by 4.9%.
– 15 –
6.2 Operations Review
(1) Exploration and production
In 2014, driven by management and technology innovation, we
implemented exploration and development programs efficiently and
made a number of new findings, some of which are commercial
discoveries. With 106.75 billion cubic meters of reserves added to
the Fuling shale gas project, China ’ s first sizable shale gas field
came into being. In 2014, newly added proved oil and gas reserves
amounted to 431 million barrels. In crude oil development, we focused
on improvements to economics through optimal development of new
blocks, further development of mature fields and enhancing recovery
rates continuously. In natural gas development, we accelerated the
capacity construction of major projects, strengthened management of the
Puguang gas field and other mature fields, adjusted marketing strategies,
expanded sales volume and achieved better economic returns. In shale
gas development, the Fuling project ’ s Phase I construction, with capacity
of 5 billion cubic meters per year, progressed smoothly, and daily output
of all producing wells exceeded design targets, laying a good foundation
for future development. In 2014, production of oil & gas rose by 8.4%
to 480.22 million barrels of oil equivalent, among which domestic
crude oil production remained flat, while overseas production increased
significantly as a result of overseas acquisition at the end of 2013.
Natural gas production rose by 8.5% to 716.4 billion cubic feet. Average
unit all-in-cost has been well under control.
Summary of Operations for the Exploration and Production Segment
Oil and gas production (mmboe)
Crude oil production (mmbbls)
China
Overseas
Natural gas production (bcf)
2014
2013
480.22
360.73
310.87
49.86
716.35
442.84
332.54
310.84
21.70
660.18
– 16 –
Change from
2012 2013 to 2014(%)
427.95
328.28
306.60
21.68
598.01
8.44
8.48
0.01
129.77
8.51
Summary of Reserves of Crude Oil and Natural Gas
Reserves of
Crude Oil
(mmbbls)
31 December
2014
Proved Reserves
Proved Developed Reserves
Shengli
Others
Total, China
Overseas
Proved Undeveloped Reserves
Shengli
Others
Total, China
Overseas
3,048
2,782
1,917
548
2,465
317
266
105
130
235
31
Reserves of
Natural Gas
(bcf)
31 December
2014
Proved Reserves
Proved Developed Reserves
Puguang
Others
Total, China
Overseas
Proved Undeveloped Reserves
Total, China
Overseas
– 17 –
6,741
6,011
2,663
3,324
5,987
24
730
728
2
Exploration & Production Activities
As of 31 December
Wells drilling
Total, China
Shengli
Others
Overseas
Total
2014
gross
2013
gross
net
310
63
247
3
313
309
63
246
1
310
267
93
174
2
269
China
Wells drilled
For the year ended
December 31, 2014
Exploratory – Productive
– Dry
Development – Productive
– Dry
For the year ended
December 31, 2013
Exploratory – Productive
– Dry
Development – Productive
– Dry
net
267
93
174
0
267
Oversea
Equityaccounted
Other Subsidiaries investments
Total
Shengli
337
187
3,964
56
141
64
2,027
30
193
123
1,614
26
—
—
6
—
3
—
317
—
350
352
4,513
83
112
96
2,490
39
238
256
2,016
44
—
—
5
—
—
—
2
—
– 18 –
Unit:Square Kilometers
As of 31 December
2014
2013
Acreage with exploration license
China
Acreage with development license
China
Overseas
960,981
960,981
27,921
22,912
5,009
983,680
983,680
26,665
22,563
4,102
(2) Refining
In 2014, the Company adjusted its product mix in response to the market,
increasing production of oil products and high-value-added products
for which demand was strong, such as gasoline (especially high-octane
gasoline) and jet fuel, further decreasing the diesel to gasoline ratio. We
accelerated the quality upgrade of oil products, increasing production
of GB IV automotive diesel, with some regions gasoline and diesel
upgraded to GB V standard. We effectively controlled costs through
improvements in resource allocation, optimising selection of oil to be
processed, as well as inventory management. Through tapping our well
established advantages in specialisation, margins of lubricants, liquefied
petroleum gas (LPG) and asphalt further improved, delivering good
economic returns. In 2014, we processed 235 million tonnes of crude oil,
up by 1.5% from the previous year, and produced 146 million tonnes of
refined oil products, up by 4.2%.
– 19 –
Summary of Operations for the Refining Segment
Unit: million tonnes
Refinery throughput
Gasoline, diesel and
kerosene production
Gasoline
Diesel
Kerosene
Light chemical feedstock
Light products yield (%)
Refinery yield (%)
Change from
2012 2013 to 2014 (%)
2014
2013
235.38
146.23
231.95
140.40
221.31
132.96
1.48
4.15
51.22
74.26
20.75
39.17
76.52
45.56
77.40
17.43
37.97
76.19
40.55
77.39
15.01
36.33
76.75
94.66
94.82
95.15
12.42
(4.06)
19.05
3.16
0.33
percentage
points
(0.16)
percentage
points
Note: Includes 100% of production of joint ventures.
(3) Marketing and distribution
In 2014, the Company initiated business restructuring in the marketing
segment and has launched mixed-ownership reform by introducing
private capital. Sinopec Corp. entered into capital injection agreement
with 25 investors, established a mechanism aiming to transform the
segment into a market orientated business through joint efforts with
private investors. The initiative laid the foundations for further reform
on the operational systems and mechanisms of our marketing business
with the aim of development through innovations.
– 20 –
In 2014, in light of the slower growth of domestic demand for oil
products and the particularly weak demand for diesel, we adjusted
our marketing strategies, enhancing marketing efforts on high-octane
gasoline and jet fuel to increase total sales volume. We expanded our
retail volume by using our network and brand advantages, enhancing
customer service at service stations. At the same time, we further
developed our non-fuel businesses, improved the customer experience
and provided one-stop services through our online fuel-card services and
self-service mobile apps and equipment. Non-fuel business transaction
increased by 28% over 2013 to RMB 17.1 billion. In 2014, total sales
volume of refined oil products was 189 million tonnes, up by 5.1% from
the previous year, with domestic sales rising by 3.4% to 171 million
tonnes and retail rising by 3.6%.
Summary of Operations for Marketing and Distribution Segment
Total sales volume of oil products
(million tonnes)
Total domestic sales volume of
oil products (million tonnes)
Retail sales (million tonnes)
Direct sales & Distribution
(million tonnes)
Annual average throughput
per station (tonne/station)
Change from
2012 2013 to 2014(%)
2014
2013
189.17
179.99
173.15
5.10
170.97
117.84
165.42
113.73
158.99
107.85
3.36
3.61
53.13
51.69
51.14
2.79
3,858
3,707
3,498
4.07
– 21 –
Total number of service
stations under Sinopec
brand
Number of companyoperated stations
31 December
2014
31 December
2013
31 December
2012
Change from
the end of the
previous year
to the end of
the reporting
period (%)
30,551
30,536
30,836
0.05
30,538
30,523
30,823
0.05
(4) Chemicals
In 2014, confronted by severe market conditions that saw prices of
chemicals remaining at anemic levels, the Company cut its feedstock
costs by increasing the light feedstock ratio, adjusted its product mix and
intensified efforts in R&D, production, and sales of new products. Sales
of new polyolefin products and specialty materials accounted for 57.4%
of total sales, and high-value-added rubber accounted for 17.4%. The
synthetic fiber differentiation rate was 76.7%. In addition, we optimised
operations of our manufacturing facilities, adjusted utilisation rates,
and shut down facilities with unsatisfactory marginal costs. Ethylene
output was up by 7.2% from 2013 to 10.7 million tonnes. Meanwhile,
by keeping inventories at low levels and implementing a differentiated
marketing strategy, our full-year chemical sales volume increased by
4.4% to 60.79 million tonnes, with all manufactured chemicals sold.
– 22 –
Summary of Operations for Chemicals Segment
Unit: thousand tonnes
Change from
2014
2013
2012 2013 to 2014 (%)
Ethylene
10,698
9,980
9,452
7.19
Synthetic resin
14,639
13,726
13,343
6.65
939
960
936
(2.19)
and polymer
8,383
9,227
8,950
(9.15)
Synthetic fiber
1,315
1,392
1,339
(5.53)
Synthetic rubber
Synthetic fiber monomer
Note: Includes 100% production of joint ventures.
(5) Research and development
In 2014, the Company fully tapped the functions of research and
development in supporting and leading its business operations, stepping
up its R&D efforts with remarkable results. In upstream, we successfully
completed the well pad drilling test for shale gas development,
achieving substantial improvements in efficiency of construction. We
developed offshore well safety control technologies to enhance the
safety and efficiency of production in offshore oilfields. In refining,
we commercialised technologies for high-aromatics-content catalytic
diesel hydrogenation, countercurrent continuous reforming and diesel
ultra-deep hydrogenation for desulfurizationt. In chemicals, we brought
online a demonstration plant for converting syngas to ethylene glycol,
marking a breakthrough in coal chemical technologies. We successfully
commissioned a demonstration plant for super-imitation-cotton fiber
technologies. We also developed bacteria-resistant polypropylene and
polypropylene for low-temperature packaging. We applied for a total
of 4,968 patents at home and abroad, and 3,011 patents were granted in
2014. During the year, we won one National Patent Gold Award and five
Awards of Excellence, two first-place awards and three second-place
awards for National Science and Technology Advancement, and two
second-place awards for Technology Invention.
– 23 –
(6) Health, safety and environment
In 2014, the Company vigorously implemented its green and low-carbon
development strategy and its Clear Water, Blue Sky environmental
protection plan, advanced its carbon assets management activities, and
officially kicked off the Energy Efficiency Doubling initiative. By
further integrating efforts in energy conservation, emissions control
and carbon reduction, the effectiveness of our energy saving and
environmental protection activities improved continuously. Compared
with last year, energy intensity was down by 0.6%, industrial water
consumption was down by 1.1%, chemical oxygen demand of waste
water discharge was down by 2.5%, NHx emissions were down by 4.2%,
sulfur dioxide emissions were down by 8.1%, NOx emissions were down
by 3.9%, and all hazardous chemicals, discharged water, gas, and solid
waste were properly treated.
In 2014, the Company improved its work safety and accountability
scheme, conducted safety checks, focused on identification and
elimination of potential hazards, stepped up the construction of its
emergency response capabilities and its IT applications for safety
management, standardised worker protection, and safeguarded the
health of its employees. For more detailed information, please refer
to our corporate report, Communication on Progress for Sustainable
Development.
– 24 –
(7) Capital expenditures
In 2014, the Company optimised its asset portfolio and investment
activities. Total capital expenditures were RMB 154.640 billion, down
by 4.2% from the plan made at the beginning of the year. Capital
expenditures for exploration and production segment were RMB 80.196
billion, mainly for exploration and production in Jiyang trough, Sichuan
Basin, Tahe oilfield, and Ordos Basin, liquefied natural gas (LNG)
projects in Shandong and Guangxi, construction of long-distance oil
and gas pipeline projects, and the oversea projects. We added crude oil
capacity of 4.36 million tonnes per year and natural gas capacity of 5.9
billion cubic meters per year. Capital expenditures for refining segment
were RMB 27.957 billion, mainly for refinery revamping and gasoline
and diesel quality upgrading projects by subsidiaries in Shijiazhuang,
Yangtze, Tahe and Jiujiang. We added refining capacity of 9.5 million
tonnes per year, and acquired 37.5% shares of Yanbu Refinery. Capital
expenditures for marketing and distribution segment were RMB 26.989
billion, mainly for developing and renovating service stations and for
building oil product pipelines and oil depots. We added 556 service
stations for the year. Capital expenditures for chemicals segment were
RMB 15.850 billion, mainly for the coal chemical plant at Sinopec Great
Wall Energy and Chemical Industry (Ningxia) Company Ltd. and the
Qilu acrylonitrile project. We added ethylene capacity of 190,000 tonnes
per year and synthetic resin capacity of 600,000 tonnes per year. Capital
expenditures for corporate and others were RMB 3.648 billion, mainly
for R&D facilities and IT application projects.
– 25 –
(8) Oil & gas reserve appraisal principles
We manage our reserves estimation through a two-tier management
system. Our Oil and Natural Gas Reserves Management Committee,
or the RMC, at our headquarters level oversees the overall reserves
estimation process and reviews the reserves estimation of our company.
Each of our Branches has a reserves management committee that
manages the reserves estimation process and reviews the reserves
estimation report at the branches level.
Our RMC is chaired by Mr. Wang Zhigang, one of our senior vice
presidents, and is co-led by our deputy chief geologist and our director
general of our exploration and production segment. Mr. Wang holds
a Ph.D. degree in geology from Geology and Geo-physics Research
Institute of the China Academy of Science and has over 30 years of
experience in oil and gas industry. Our RMC also consists of 31 other
members who are senior management members in charge of exploration
and development activities at production bureau level. A majority of our
RMC members hold doctor ’ s or master ’ s degrees and our RMC members
have an average of 20 years of technical experience in relevant industry
fields, such as geology, engineering and economics.
Our reserves estimation is guided by procedural manuals and technical
guidance. Initial collection and compilation of reserves information
are conducted by different working divisions, including exploration,
development, financial and legal divisions, at production bureau level.
Exploration and development divisions collectively prepare the initial
report on reserves estimation. Together with technical experts, reserves
management committees at subsidiary level then review to ensure the
qualitative and quantitative compliance with technical guidance and
accuracy and reasonableness of the reserves estimation. The RMC
is primarily responsible for the management and coordination of the
reserves estimation process, review and approval of annual changes and
results in reserves estimation and disclosure of our proved reserves. We
also engage outside consultants who assist us to be in compliance with
the U.S. Securities and Exchange Commission rules and regulations. Our
reserves estimation process is further facilitated by a specialised reserves
database which is improved and updated periodically.
– 26 –
6.3 Business Prospects
(1) Market analysis
The 2015 world economy is expected to continue its slow recovery while
China ’ s economy will enter a New Normal state of slower growth. The
international crude oil price is projected to remain anaemic. Domestic
demand for refined oil products is to grow steadily with product mix
further adjusted, quality gradually upgraded. Domestic demand for major
chemicals is to grow step by step.
(2) Operations
In 2015, the Company will focus on improving the quality and efficiency
of growth while deepening reforms, transforming its development model,
and implementing rigorous management programs. We will put more
emphasis on restructuring, resource optimisation, innovation and risk
control. Key measures are as follows:
Exploration and production: In response to low oil prices, the
Company will integrate reserves, production, investment, costs and
earnings and will seek to optimise its exploration activities, lower its
development costs, and increase commercial yields for oil and gas. In
exploration, we will focus on making commercial discoveries, exploiting
reserve potential in frontier areas and other key promising regions, and
improving the success rate of exploration. In development, we will
select projects and production targets based on oil price level. We will
also further develop mature fields and put technologies that significantly
enhance recovery into wide operation. In addition, we will facilitate
development of shale gas to fast-track shale gas projects and expedite
capacity-building projects for natural gas. In 2015, we plan to produce
300 million barrels of crude oil in China, 48 million barrels from our
oversea assets, and 886.3 billion cubic feet of natural gas.
– 27 –
Refining: The Company will optimise crude procurement and resource
allocation to reduce costs, take better advantage of our economies of
scale to control unit costs, and upgrade oil product quality to increase
the supply of clean fuels. We will also strengthen the integration of
production and sales, adjust our product slate and utilisation rates,
and increase the output of higher-value-added products which are well
received by market. In addition, we will seek to unlock the potential
value of specialisation, improve our sales networks, and enhance the
marketing of lubricants, LPG, asphalt and other products. In 2015, we
plan to refine 243 million tonnes of crude oil and produce 152 million
tonnes of oil products.
Marketing and distribution: The Company will proactively explore
to innovate on operational systems and mechanisms with an aim to
transform Sinopec from an oil products supplier into an integrated
services provider. To ensure maximum profits, the Company will
improve its market analysis based on fundamental changes in the market
and operate with low inventory levels to mitigate risks and facilitate
adjustments to its marketing structure. We will expand our retail sales
volume and increase per station pumped volume. We will accelerate the
planning and construction of our oil product pipelines to optimise our
marketing network, carry out differentiated marketing strategies and
increase customer loyalty by providing tailor-made services. We will
also develop our non-fuel businesses on the basis of specialisation and
market orientation to increase both scale and profits of the business. In
2015, we plan to sell 173 million tonnes of oil products in the domestic
market.
Chemicals: The Company will further adjust its feedstock structure,
lower feedstock costs, accelerate improvements in its product mix, and
strengthen the integration of manufacturing, marketing and R&D. We
will increase the production of higher-value-added products which are
well received by markets, enhance the development, production and
promotion of new products, fine-tune facilities operations and utilisation
rates according to profit margins, take advantage of our strengths in
marketing network and improve our sales performance. In 2015, we plan
to produce 10.9 million tonnes of ethylene.
– 28 –
R&D: We will continue to implement the strategies of development
driven by innovations. Areas of focus for R&D include shale oil and
gas exploration and development, oil and gas recovery enhancement
technologies aiming to increase production and reserve, biofuels, heavy
oil refining, clean fuels for quality upgrading, new catalytic materials,
high-performance synthetic chemicals and fine chemicals to promote
restructuring of product mix. In addition, we will develop and apply
technologies that are greener and less carbon-intensive, thus conserving
energy while preserving the environment. We will continue to emphasise
fundamental and forward-looking R&D activities to improve the
Company ’ s innovation for the purpose of supporting and driving its
transformative growth.
Capital expenditures: In 2015, the Company will look to improve
its project portfolio and investment plan based on market conditions.
Our capital expenditure budget for the year is RMB 135.9 billion, of
which exploration and production segment accounts for RMB 68.2
billion, mainly for Fuling shale gas project construction, exploration
and development projects in Shengli oilfield, Sichuan Basin, Tahe
oilfield, Junggar Basin, and Ordos Basin as well as Guangxi and Tianjin
LNG projects; gas pipelines; and overseas projects. Refining segment
accounts for expenditures of RMB 24.0 billion, mainly for revamping
Qilu and Jiujiang refineries, as well as product quality projects such as
gasoline adsorbent desulfurization and diesel hydrogenation. Marketing
and distribution segment accounts for expenditures of RMB 22.6 billion,
mainly for revamping service stations, constructing the product pipeline
networks, optimising the distribution of tank farms, and improving
facilities for service stations and non-fuel businesses to develop
integrated service with an aim to support new businesses. Chemicals
segment accounts for expenditures of RMB15.1 billion, mainly for the
Jinling propylene oxide and LPG utilisation projects and the Hainan PX
phase II project. Corporate and others segment accounts for expenditures
of RMB 6.0 billion, mainly for R&D facilities and IT projects.
– 29 –
In 2015, the Company will proactively adapt to the “ new normal ”
situation of macroeconomy, building up new drivers for development,
continuously improving its overall strength and competitiveness in the
global arena, as well as capabilities to maintan sustainable growth and
striving to achieve remarkable results.
7.
Management Discussion and Analysis
The following discussion and analysis should be read in conjunction with the
Company ’ s audited financial statements in this announcement and the Annual
Report and the accompanying notes. Parts of the following concerned financial
data were abstracted from the company ’ s audited financial statements that have
been prepared according to the IFRS, unless otherwise stated. The prices in the
following discussion do not include value-added tax.
7.1 Consolidated Results of Operations
In 2014, the Company ’ s turnover and other operating revenues were
RMB 2,825.9 billion, decreased by 1.9% compared with that of 2013. The
operating profit was RMB 73.5 billion, representing a year on year decrease
of 24.1%.
– 30 –
The following table sets forth the main revenue and expenses from the
Company ’ s consolidated financial statements:
Years ended 31 December
2014
2013
Change
(RMB million) (RMB million)
(%)
Turnover and other operating revenues
Turnover
Other operating revenues
Operating expenses
Purchased crude oil, products, and
operating supplies and expenses
Selling, general and administrative
expenses
Depreciation, depletion and amortisation
Exploration expenses (including dry holes)
Personnel expenses
Taxes other than income tax
Other operating expense, net
2,825,914
2,781,641
44,273
(2,752,427)
2,880,311
2,833,247
47,064
(2,783,526)
(1.9)
(1.8)
(5.9)
(1.1)
(2,334,399)
(2,371,858)
(1.6)
(68,374)
(90,097)
(10,969)
(57,233)
(191,202)
(153)
(69,928)
(81,265)
(12,573)
(55,353)
(190,672)
(1,877)
(2.2)
10.9
(12.8)
3.4
0.3
(91.8)
73,487
(14,229)
96,785
(4,246)
(24.1)
235.1
6,246
65,504
(17,571)
2,513
95,052
(24,763)
148.5
(31.1)
(29.0)
Profit for the year
47,933
70,289
(31.8)
Attributable to:
Equity shareholders of the Company
Non-controlling interests
46,466
1,467
66,132
4,157
(29.7)
(64.7)
Operating profit
Net finance costs
Investment income and share of profits less
losses from associates
and jointly controlled entities
Profit before taxation
Income tax expense
– 31 –
(1) Turnover and other operating revenues
In 2014, the Company ’ s turnover was RMB 2,781.6 billion, representing a
decrease of 1.8% over 2013. This was mainly attributable to the decline of
crude oil and petrochemical products prices.
The following table sets forth the external sales volume, average realised
prices and respective rates of change of the Company ’ s major products in
2014 and 2013:
Sales volume
(thousand tonnes)
Years ended 31 December Change (%)
2014
2013
Crude oil
Domestic
Oversea
Natural gas (million cubic meters)
Gasoline
Diesel
Kerosene
Basic chemical feedstock
Monomer and polymer for
synthetic fibre
Synthetic resin
Synthetic fibre
Synthetic rubber
Chemical fertiliser
Average realised price
(RMB/tonne, RMB/thousand cubic meters)
Years ended 31 December Change (%)
2014
2013
8,864
8,780
84
16,661
64,083
102,724
21,845
27,277
7,604
7,582
22
15,907
59,482
99,855
20,162
25,838
16.6
15.8
281.8
4.7
7.7
2.9
8.3
5.6
4,008
4,001
4,691
1,589
8,339
6,647
5,710
6,151
4,253
4,252
4,678
1,336
8,498
7,050
6,116
6,870
(5.8)
(5.9)
0.3
18.9
(1.9)
(5.7)
(6.6)
(10.5)
6,479
11,584
1,430
1,205
598
6,856
10,696
1,488
1,346
1,129
(5.5)
8.3
(3.9)
(10.5)
(47.0)
7,223
9,684
9,436
10,554
1,686
8,167
9,631
10,356
12,214
1,698
(11.6)
0.6
(8.9)
(13.6)
(0.7)
Most of crude oil and a portion of natural gas produced by the Company
were internally used for refining and chemical production, with the remaining
sold to other customers. In 2014, the turnover from crude oil, natural gas and
other upstream products sold externally amounted to RMB 69.6 billion, an
increase of 14.3% over 2013. The change was mainly due to the increase in
sales volume of crude oil and increase in sales volume and prices of natural
gas in 2014.
– 32 –
In 2014, petroleum products (mainly consisting of oil products and other
refined petroleum products) sold by Refining Segment and Marketing and
Distribution Segment achieved external sales revenues of RMB 1,633.9
billion, accounting for 58.7% of the Company ’ s turnover and other operating
revenues, representing a decrease of 2.8% over 2013 mainly due to the
decline of various refinery products prices and sales volume decrease of
other refined petroleum products which offset the effect of increase in
gasoline, diesel and kerosene sales volumes. The sales revenue of gasoline,
diesel and kerosene was RMB 1,342.0 billion, representing an increase
of 0.7% over 2013, and accounting for 82.1% of the total sales revenue
of petroleum products. Turnover of other refined petroleum products was
RMB 291.9 billion, representing a decrease of 16.0% compared with 2013,
accounting for 17.9% of the total sales revenue of petroleum products.
The Company ’ s external sales revenue of chemical products was RMB
357.0 billion, representing a decrease of 4.6% over 2013, accounting for
12.8% of the Company ’ s total turnover. This was mainly due to the decline
of chemical product prices which offset the sales volume increase of basic
chemical feedstock and synthetic resin.
(2) Operating expenses
In 2014, the Company ’ s operating expenses were RMB 2,752.4 billion,
decreased by 1.1% compared with 2013. The operating expenses mainly
consisted of the following:
Purchased crude oil, products and operating supplies and expenses were
RMB 2,334.4 billion, representing a decrease of 1.6% over the same period
of 2013, accounting for 84.8% of the total operating expenses, of which:
Crude oil purchasing expenses were RMB 837.4 billion, representing a
decrease of 4.2% over the same period of 2013. Throughput of crude oil
purchased externally in 2014 was 177.29 million tonnes (excluding the
volume processed for third parties), representing a decrease of 0.6% over the
same period of 2013. The average cost of crude oil purchased externally was
RMB 4,724 per tonne, representing a drop of 3.6% against 2013.
The Company ’ s other purchasing expenses were RMB 1,497.0 billion,
remains basically the same with that of 2013.
– 33 –
Selling, general and administrative expenses of the Company totaled RMB
68.4 billion, representing a decrease of 2.2% over 2013.
Depreciation, depletion and amortization expenses of the Company were
RMB 90.1 billion, representing an increase of 10.9% as compared with 2013.
This was mainly due to the increased investment in fixed assets.
Exploration expenses were RMB 11.0 billion, representing a decrease of
12.8% compared with 2013, mainly due to the Company ’ s optimisation of
exploration investment, improvement in exploration success rate as well as
effective reduction in exploration expenses.
Personnel expenses were RMB 57.2 billion, representing an increase of
3.4% over 2013.
Taxes other than income tax were RMB 191.2 billion, representing an
increase of 0.3% compared with 2013. This was mainly due to the increase
of RMB 3.4 billion in consumption tax as a result of increased consumption
tax rate, as well as the RMB 0.6 billion increase in city construction tax and
educational surcharge; meanwhile the special oil income levy decreased by
RMB 3.4 billion as a result of decreased oil price.
Other operating expense (net amount) were RMB 0.2 billion.
(3) Operating profit was RMB 73.5 billion, representing a decrease of 24.1%
compared with 2013.
(4) Net finance costs were RMB 14.2 billion, representing an increase of
235.1% over 2013. Of which: the net interest expense of the Company was
RMB 9.4 billion, representing an increase of RMB 0.4 billion over 2013;
gains from foreign exchange decreased by RMB 2.9 billion as compared
with 2013 due to the RMB appreciation slower than that in 2013; for the
convertible bonds issued by the Company, unrealised loss from fair value
change of the period was RMB 4.6 billion, compared with unrealised gains
of RMB 2 billion in the same period of 2013.
(5) Profit before taxation was RMB 65.5 billion, representing a decrease of
31.1% as compared with 2013.
(6) Tax expense was RMB 17.6 billion, representing a decrease of RMB 7.2
billion as compared with 2013.
– 34 –
(7) Profit attributable to non-controlling interests of the Company was RMB
1.5 billion, representing a decrease of RMB 2.7 billion comparing with 2013.
(8) Profit attributable to equity shareholders of Sinopec Corp. was RMB
46.5 billion, representing a decrease of 29.7% compared with 2013.
7.2 Assets, Liabilities, Equity and Cash Flows
The major funding source of the Company is its operating activities and
short-term and long-term loans. The major use of funds includes operating
expense, capital expenditures, and repayment of the short-term and long-term
debts.
(1) Assets, liabilities and equity
Total assets
Current assets
Non-current assets
Total liabilities
Current liabilities
Non-current liabilities
Total equity attributable to
equity shareholders of
the Company
Share capital
Reserves
Non-controlling interests
Total equity
Unit: RMB million
At 31
December
2014
At 31
December Amount of
2013
Change
1,451,368
360,144
1,091,224
805,791
604,257
201,534
1,382,916
373,010
1,009,906
761,290
571,822
189,468
68,452
(12,866)
81,318
44,501
32,435
12,066
593,041
118,280
474,761
52,536
645,577
568,803
116,565
452,238
52,823
621,626
24,238
1,715
22,523
(287)
23,951
As at 31 December 2014, the Company ’ s total assets were RMB 1,451.4
billion, representing an increase of RMB 68.5 billion compared with that
at the end of last year, of which:
– 35 –
Current assets were RMB 360.1 billion, representing a decrease of RMB
12.9 billion compared with that at the end of 2013. The major changes
came from the amount decrease in inventories by RMB 33.7 billion, bill
receivable by RMB 14.8 billion, and increase in account receivable by
RMB 22.4 billion, prepaid expenses and other current assets by RMB
18.3 billion caused by increased receivables under derivative financial
instruments yet to be due.
Non-current assets were RMB 1,091.2 billion, representing an increase
of RMB 81.3 billion as compared with that at the end of 2013. This
was mainly due to the implementation of planned investment activities;
of which, property, plant and equipment (net) increased by RMB 33.9
billion, construction in progress increased by RMB 17.0 billion, and
long-term prepayments and other assets increased by RMB 19.2 billion
caused by newly added land use right and service station operating
authorisation.
The Company ’ s total liabilities were RMB 805.8 billion, representing an
increase of RMB 44.5 billion compared with that at the end of 2013, of
which:
Current liabilities were RMB 604.3 billion, representing an increase of
RMB 32.4 billion as compared with that at the end of 2013. This was
mainly because short-term loans increased by RMB 14.3 billion, accrued
expenses and other payables increased by RMB 24.5 billion caused
by increase in derivative financial instruments yet to be due, delayed
payment of investment and other advance accounts.
Non-current liabilities were RBM 201.5 billion, representing a increase
of RMB 12.1 billion compared with that at the end of 2013. This was
mainly because of the increase of long-term debts by RMB 5.3 billion,
estimated liabilities by RMB 3.6 billion due to the provision for future
dismantling of oil and gas assets.
Total equity attributable to owners of the company was RMB 593.0
billion, representing an increase of RMB 24.2 billion compared with that
at the end of 2013, which was mainly due to the increase in reserves.
– 36 –
(2) Cash Flow
The following table sets forth the major items in the consolidated cash flow
statements for 2014 and 2013.
Unit: RMB millions
Year ended 31 December
2014
2013
Major items of cash flows
Net cash generated from operating activities
Net cash used in investing activities
Net cash (used in)/generated from financing
activities
(Decrease)/increase of cash and cash equivalents
148,347
(132,633)
(21,421)
(5,707)
151,893
(178,740)
31,519
4,672
In 2014, the net cash generated from operating activities of the company was
RMB 148.3 billion, representing a decrease of RMB 3.6 billion as compared
with 2013. This was mainly attributable to the decrease in profit before
taxation and improvement on working capital.
In 2014, the net cash used in investing activities was RMB 132.6 billion,
representing a decrease of RMB 46.1 billion over 2013. This was mainly
attributable to the stricter control on investment, in which capital expenditure
and exploration expenses decreased by RMB 30.6 billion, oversea
acquisitions, investments in associates and joint ventures decreased by RMB
17.1 billion compared with 2013.
In 2014, the net cash outflow generated from the Company ’ s financing
activities was RMB 21.4 billion, representing a decrease of RMB 52.9 billion
against 2013. The year on year cash decrease mainly caused by proceeds
from issuing shares , contributions to subsidiaries from non-controlling
interests and interest bearing debt financing, which negatively affected cash
from financing activities by RMB 19.4 billion, RMB 8.6 billion and RMB
23.5 billion respectively.
– 37 –
(3) Contingent Liabilities
Please refer to “ Material guarantee contracts and their performances ” in the
“ Significant Events ” section of the Annual Report.
(4) Capital Expenditures
Please refer to “ Capital Expenditures ” in the “ Business Review and
Prospects ” section of the Annual Report.
(5) Research & development expenses and expenditures on environmental
protection
Research & development expenses refer to the expenses recognised as
expenditures when they occur. In 2014, the expenditure for research &
development was RMB 5.62 billion.
– 38 –
(6) Measurement of fair values of derivatives and relevant system
Items relevant to measurement of fair values
Items
Financial assets
1. Derivative financial assets
2. Available-for-sale financial assets
3. Cash flow hedging
Subtotal of financial assets
Financial liabilities
Totals
Unit: RMB million
Profits and
losses from Accumulated
variation of fair variation of fair Impairment loss
Beginning values in the values recorded provision of the
of the year current year
as equity current year End of the year
87
1,964
4,577
6,628
(3,172)
3,456
– 39 –
—
376
—
—
(1,658)
—
376
(4,611)
(4,235)
(1,658)
(5,458)
(7,116)
—
—
—
—
—
—
1,222
183
11,400
12,805
(22,278)
(9,473)
Information concerning financial assets and liabilities held in foreign
currencies;
Unit: RMB million
Profits and
losses from Accumulated
variation of fair variation of fair Impairment loss
Beginning
values of the values recorded provision of the
of the year
current year
into equity
current year End of the year
Items
Financial assets*
1. Derivative financial assets
2. Loans and receivables
3. Available-for-sale financial assets
4. Held-to-maturity investments
5. Cash flow hedging
Subtotal of financial assets
Financial liabilities*
*:
87
53,362
82
—
4,577
58,108
(211,817)
—
—
376
—
—
—
—
74
—
—
376
84
74
(5,458)
—
—
—
—
—
—
—
1,222
95,583
152
—
11,400
108,357
(302,453)
The financial assets and liabilities held by the Company in foreign currencies were
mostly those held by its overseas subsidies, which were recognised in their functional
currencies.
– 40 –
7.3 Analysis of financial statements prepared under ASBE
(1) Under ASBE, the operating income and operating profit or loss by
reportable segments were as follows:
Year ended 31 December
2014
2013
RMB million RMB million
Operating income
Exploration and Production Segment
Refining Segment
Marketing and Distribution Segment
Chemicals Segment
Corporate and Others
Elimination of inter-segment sales
227,597
1,273,095
1,476,606
427,485
1,310,236
(1,889,105)
242,107
1,311,269
1,502,414
437,587
1,359,109
(1,927,175)
Consolidated operating income
2,825,914
2,880,311
46,309
(1,982)
29,753
(2,164)
(2,982)
2,179
54,476
9,745
35,633
631
(3,686)
1,251
(5,632)
(1,597)
65,481
96,453
47,430
67,179
Operating profit/(loss)
Exploration and Production Segment
Refining Segment
Marketing and Distribution Segment
Chemicals Segment
Corporate and Others
Elimination of inter-segment sales
Financial expenses, investment income and loss
from changes in fair value
Consolidated operating profit
Net profit attributable to equity shareholders of
the Company
– 41 –
Operating profit: In 2014, the operating profit of the Company was
RMB 65.5 billion, representing a decrease of RMB 31.0 billion as
compared with 2013. This was mainly because of sharp drop of crude
oil price, along with the weakness of petrochemical market resulted in
decline in prices of company ’ s major products.
Net profit: In 2014, the net profit attributable to the equity shareholders
of the Company was RMB 47.4 billion, representing a decrease of RMB
19.7 billion or 29.4% comparing with 2013.
(2) Financial data prepared under ASBE
Total assets
Long-term liabilities
Shareholders’ equity
As at 31
December of
2014
RMB million
As at 31
December of
2013
RMB million
1,451,368
200,016
647,095
1,382,916
187,834
623,260
Change
68,452
12,182
23,835
Total assets: at the end of 2014, the Company ’ s total assets were RMB
1,451.4 billion, representing an increase of RMB 68.5 billion compared
with that at the end of 2013. This was mainly due to: a) inventory
decreased by RMB 33.7 billion because of the decrease in crude oil
and refined oil product prices; b) bills receivable decreased by RMB
14.8 billion; c) accounts receivable increased by RMB 22.4 billion; d)
other account receivable (net) increased by RMB 16.1 billion caused
by increased receivables under derivative financial instruments yet to
be due; e) implementation of planned investment activities; of which,
property, plant and equipment (net) increased by RMB 33.9 billion,
intangible assets increased by RMB 18.4 billion, construction in progress
increased by RMB 17.0 billion, and long-term equity investments
increased by RMB 5.3 billion.
– 42 –
Long-term liabilities: at the end of 2014, the Company ’ s long-term
liabilities were RMB 200.0 billion, representing an increase of RMB
12.2 billion compared with that at the end of 2013. This was mainly
attributable to: a) long-term borrowings increased by RMB 21.0 billion;
b) Provisions increased by RMB 3.6 billion due to the provision for
future dismantling costs of oil and gas properties; c) debentures payable
decreased by RMB 15.6 billion.
Shareholders ’ equity: at the end of 2014, the shareholders ’ equity of
Sinopec Corp. was RMB 647.1 billion, representing an increase of RMB
23.8 billion as compared with that at the end of 2013. This was mainly
attributable to: a) capital reserves increased by RMB 11.8 billion due
to partial execution of convertible bonds issued in 2011; b) retained
earnings increased by RMB 16.2 billion; c) other comprehensive income
attributable to shareholders of the Company and minority interests
decreased by RMB 9.3 billion.
(3) The results of the principal operations by segments
Increase/
Increase/
(decrease) of Increase of (decrease) of
operation
operation gross profit
Operation Operation Gross profit income on a
cost on a margin on a
income
cost
margin year-on-year year-on-year year-on-year
(RMB millions) (RMB millions)
(%)*
basis (%)
basis (%)
basis (%)
Segment
Exploration and Production
Refining
Marketing and Distribution
Chemicals
Corporate and Others
Elimination of intersegment sales
227,597
1,273,095
1,476,606
427,485
1,310,236
115,575
1,100,853
1,391,258
409,477
1,303,137
35.2
1.3
5.6
4.0
0.5
(6.0)
(2.9)
(1.7)
(2.3)
(3.6)
(0.1)
(2.5)
(1.6)
(2.1)
(3.7)
(2.4)
(1.0)
(0.1)
(0.2)
0.1
(1,889,105)
(1,891,283)
N/A
N/A
N/A
N/A
Total
2,825,914
2,429,017
7.3
(1.9)
(1.1)
(0.8)
*:
Gross profit margin = (operation income – operation cost, tax and surcharges)/
operation income.
– 43 –
8.
Significant Events
8.1 Restructuring of marketing segment
On February 19, 2014, the 14th meeting of the Fifth Session of the Board considered
and approved the proposal to begin the restructuring of Sinopec Corp.’s marketing
segment. On September 12, 2014, Sinopec Marketing Co., Ltd. (hereinafter referred
to as “Marketing Co.”) entered into a Capital Injection Agreement with 25 domestic
and foreign investors, pursuant to which investors will subscribe for equity interest
in Marketing Co. in cash. As of March 6, 2015, the above-mentioned 25 investors
had made an aggregate capital contribution of RMB 105.044 billion (including
amounts in U.S. dollar equivalent) to Marketing Co. and subscribed for a 29.5849%
shareholding interest in Marketing Co.
For further details, please refer to the announcements published in the China
Securities Journal, the Shanghai Securities News and the Securities Times by
Sinopec Corp. on February 20, 2014, March 26, 2014, April 2, 2014, July 1, 2014,
September 15, 2014, January 6, 2015 and March 7, 2015. For the relevant details,
please also refer to the disclosures made on the website of the Hong Kong Stock
Exchange.
– 44 –
8.2 Material guarantees contracts and the related performance
Unit: RMB million
Major external guarantees (excluding guarantees for the controlled subsidiaries)
Relationship
to the company Name of the guaranteed company Amount
Guarantor
Sinopec Corp.
The Company
itself
Sinopec Great Wall Wholly owned
Energy and Chemical subsidiary
Industry (Ningxia)
SSI
Controlled
subsidiary
Sinopec Corp.
The Company
itself
Yueyang Sinopec Corp.
158
Shell Coal Gasification Corporation
Zhong An United Coal Chemical 10
Company Ltd.
New Bright International
Development Ltd./Sonangol E.P.
Yanbu Aramco Sinopec Refining
Company (YASREF) Limited
Transaction date
(date of signing)
10 December 2003
18 April 2014
31 December 2014
Whether
overdue
or not
Amount of
overdue
guarantee
Counterguaranteed
Period of guarantee
Type
10 December 2003
–10 December 2017
18 April 2014
–17 April 2026
Joint obligations
No
No
—
No
No
Joint obligations
No
No
—
No
No
Joint obligations
No
No
—
Yes
No
30 years from the date Joint obligations
Yanbu project company
requires supply of
hydrogen from Air
Liquedi Arabia LLC.
No
No
—
No
No
5,552
no specific
amount
Whether
completed
or not
Whether
guaranteed
for connected
persons
or not1
Total amount of guarantees provided during the reporting period2
Total amount of guarantees outstanding at the end of the reporting period2 (A)
Guarantees by the Company to controlled subsidiaries
Total amount of guarantee provided to controlled subsidiaries during the reporting period
Total amount of guarantee for controlled subsidiaries outstanding at the end of the reporting period(B)
Total amount of guarantees of the Company(including those provided for controlled subsidiaries)
Total amount of guarantees(A+B)
The portion of the total amount of guarantees to Sinopec Corp.’s net assets
Guarantees provided for shareholders, de facto controller and connected persons(C)
Amount of debt guarantees provided directly or indirectly to the companies with liabilities to assets ratio over 70% (D)
The amount of guarantees in excess of 50% of the net assets(E)
Total amount of the above three grarantee items(C+D+E)
Statement of guarantee undue that might be involved in any joint and several liability
Statement of guarantee status
10
3,221
72
21,488
24,709
4.17%
None
2,137
None
2,137
None
Note 1: As defined in the Listing Rules of the Shanghai Stock Exchange.
2: The amount of guarantees provided during the reporting period and the amount of guarantees
outstanding at the end of the reporting period include the guarantees provided by the controlled
subsidiaries to external parties. The amount of the guarantees provided by these subsidiaries is
derived by multiplying the guarantees provided by Sinopec Corp.’s subsidiaries by the percentage
of shares held by Sinopec Corp. in such subsidiaries.
– 45 –
8.3 Acquisition of the equity in yanbu company
Please refer to item 9.3 under Connected Transactions of this announcement.
8.4 Significant litigation, arbitration or matters drawing negative media
attention relating to Sinopec Corp.
No significant litigation, arbitration or matters drawing negative media attention
relating to Sinopec Corp. occurred in 2014.
8.5 Major projects
(1) Fuling Shale Gas Project
Based on a significant breakthrough in the Fuling shale gas exploration
project, after trial development and appraisal of production capacity, the
Company has set an overall production capacity target of 10 billion cubic
meters for the Fuling shale gas field, with a planned capacity of 5 billion
cubic meters per year for the first phase. In accordance with the guidance
for overall deployment and step-by-step development, we shall continue the
capacity-building project for the first phase in 2015. This project consists
mainly of drilling 117 new wells and constructing shale gas gathering and
transmission facilities. The new production capacity will be 2.5 billion
cubic meters per year.
(2) Yuanba Gas Field Test Production Project
The project consists mainly of the construction of one purification plant
and auxiliary facilities. The natural gas purification capacity of the plant is
1.7 billion cubic meters per year. It was completed and put into operation
in 2014.
(3) Shandong LNG project
The Shandong Liquefied Natural Gas (LNG) project consists mainly of
the construction of one wharf and one terminal designated for LNG with a
loading and unloading capacity of 3 million tonnes per year and auxiliary
transportation pipelines for natural gas. It was completed and put into
operation in 2014.
– 46 –
(4) Guangxi LNG project
The Guangxi LNG project consists mainly of the construction of one
wharf and one terminal designated for LNG with a loading and unloading
capacity of 3 million tonnes per year and auxiliary transportation pipelines
for natural gas. It is expected to be completed and operational in 2015.
(5) Tianjin LNG project
The Tianjin LNG project consists mainly of the construction of one
wharf and one terminal designated for LNG with a loading and unloading
capacity of 3 million tonnes per year and auxiliary transportation pipelines
for natural gas. It is expected to be completed in 2016.
8.6 Issuance and delisting of convertible bonds
Sinopec Corp. issued A share convertible bonds of RMB 23 billion on
February 23, 2011 (bond code: 110015). The par value and issuance price
of Sinopec CB are both RMB 100/bond. Sinopec CB was issued with a term
of six years, with annual coupon rate at 0.5%, 0.7%, 1.0%, 1.3%, 1.8% and
2.0%, respectively. The initial conversion price was RMB 9.73 per share. It
was listed on the Shanghai Stock Exchange on March 7, 2011. For further
details, please refer to the Announcement of Issuance of A Share Convertible
Bonds by Sinopec Corp. and the Announcement of the Listing of A Share
Convertible Bonds by Sinopec Corp. published on the websites of the
Shanghai Stock Exchange and Sinopec Corp. The Company has used all of the
proceeds in the following projects: the Wuhan Ethylene project, the Anqing
Refinery Revamping Project, the Shijiazhuang Refinery Revamping Project,
the Yulin-Jinan Natural Gas Pipeline Project and the Rizhao-Yizheng Crude
Oil Pipeline Project.
– 47 –
As of December 31, 2014, a total of 1,832,955,041 shares had been converted
from Sinopec CB, and the outstanding balance of Sinopec CB was RMB
13,699,897,000. On January 26, 2015, the terms of conditional redemption of
Sinopec CB were triggered. On the 22nd meeting of the Fifth Session of the
board of the Company (the “Board”), the Board reviewed and approved the
proposal for the redemption of Sinopec CB, and decided to exercise the right
of redemption of Sinopec CB. As of the Redemption Record Date (February
11, 2015), a total of 4,623,769,047 A shares had been converted from Sinopec
CB, and the total outstanding value of Sinopec CB registered at the China
Securities Depository and Clearing Corporation Limited Shanghai Branch
was RMB 52,776,000. On February 17, 2015, the total value of redemption
payments and interest accrued that were paid by the Company was RMB
53,348,948.28, and Sinopec CB was delisted from the Shanghai Stock
Exchange.
8.7 Expiration and payment of HKD 11.7 billion H share convertible bonds
HKD 11.7 billion in H share convertible bonds issued by Sinopec Corp. in 2007
expired on April 24, 2014. Sinopec Corp. has paid in full the principal and the
interest accrued.
8.8 Asset reorganization of Yizheng Chemical
Please refer to item 9.3 under Connected Transactions of this announcement.
– 48 –
8.9 Shareholdings and Securities Investments of Sinopec Corp. In Other Listed
Companies, Commercial Banks, Securities Companies, Insurance Companies,
Trust Companies and Futures Companies, etc at the end of reporting period.
(1) Sinopec Corp. did not have any direct shareholdings in other listed
companies (not including the listed subsidiaries consolidated by
Sinopec Corp.)
(2) Direct shareholdings in non-listed financial institutions and companies
contemplated to be listed
No. Entities
Initial
investment
(RMB 10,000)
Number of
shares held
(10,000 shares)
Shareholding
(%)
Book value
Changes in
at the end of
Gain/loss shareholders’
the reporting
during the interests during
period reporting period
the reporting
(RMB 10,000) (RMB 10,000)
period
Accounting item Shares origin
1
Beijing International Trust Co., Ltd.
20,000
—
14.29%
20,000
—
—
Financial assets Investment
available for sale
2
Bank of Zhengzhou Co., Ltd.
1,000
1,000
0.25%
1,000
150
—
Financial assets Debt to
available for sale shares
21,000
—
—
21,000
150
—
—
Total
—
8.10 Shanghai Petrochemical A share option incentive Scheme
At the second meeting of the Eighth Session of the board of directors of Sinopec
Shanghai Petrochemical Company Limited (“Shanghai Petrochemical”), a
listed subsidiary of Sinopec Corp., the resolution relating to the Shanghai
Petrochemical A Share Option Incentive Scheme (Draft) (the “Share Option
Incentive Scheme”) was approved. Pursuant to the requirements of the Listing
Rules of the Hong Kong Stock Exchange, the resolution relating to the Shanghai
Petrochemical A Share Option Incentive Scheme (Draft) was considered
and passed at the 18th meeting of the Fifth Session of the Board and the first
extraordinary general meeting for 2014 of Sinopec Corp.
For further details, please refer to the announcements published in the China
Securities Journal, the Shanghai Securities News and the Securities Times by
Sinopec Corp. on November 8, 2014 and December 24, 2014. For the relevant
details, please also refer to the disclosures made on the website of the Hong
Kong Stock Exchange.
– 49 –
8.11 Increased shareholdings of Sinopec Corp.’s A shares by China Petrochemical
Corporation
On November 5, 2013, Sinopec Corp. was informed by the China Petrochemical
Corporation that China Petrochemical Corporation proposed to increase its
shareholding in Sinopec Corp. through acquisitions of Sinopec Corp.’s shares
on the secondary market in its own name or through other concerting parties
within 12 months commencing on November 5, 2013 (the “Increase Period”).
The aggregate of such acquisitions would not exceed 2% (inclusive of the shares
acquired on November 5, 2013) of the total issued share capital of Sinopec
Corp. (the “Shareholding Increase”). Before the Shareholding Increase, China
Petrochemical Corporation directly and indirectly held 86,089,416,000 shares
of Sinopec Corp., representing approximately 73.855% of the total issued share
capital of Sinopec Corp. at that time. On November 4, 2014, Sinopec Corp. was
informed by China Petrochemical Corporation that the Shareholding Increase
had been completed and the aggregate amount of the increased A shares of
the Company by China Petrochemical Corporation and its concerting parties
represented 0.16% of the total issued share capital of Sinopec Corp. After the
Shareholding Increase, China Petrochemical Corporation directly and indirectly
held approximately 73.867% of the total issued share capital of Sinopec Corp.
During the Increase Period, China Petrochemical Corporation had not reduced
its shareholding in Sinopec Corp. in its own name or through other concerting
parties.
– 50 –
9.
Connected Transactions
9.1 Actual Connected Transactions entered into by the Company during the
Year
Pursuant to the agreements on continuing connected transactions, the aggregate
amount of the connected transactions of the Company during the year was RMB
236.790 billion. Among the expenses, purchases amounted to RMB 138.170
billion including purchases of products and services (procurement, storage,
exploration and development services, and production-related services amounted
to RMB 118.968 billion, representing 4.32% of the total amount of this type
of transaction for 2014. Auxiliary and community services amounted to RMB
6.753 billion, representing 0.25% of the total amount of this type of transaction
for the year. In 2014, housing rent paid by the Company amounted to RMB 497
million, representing 0.02% of the total amount of this type of transaction. The
rent for use of land was RMB 10.531 billion, representing 0.38% of the total
amount of this type of transaction for 2014. Interest expenses amounted to RMB
1.421 billion. In 2014, sales amounted to RMB 98.620 billion, including RMB
98.479 billion for sales of products and services, representing 3.48% of the
total amount of this type of transaction, RMB 6 million for agency commission
income, and RMB 135 million for interest income.
The amounts of the above continuing connected transactions between the
Company and Sinopec Group did not exceed the caps for the continuing
connected transactions approved by the general meeting of shareholders and the
Board.
Principle of pricing for connected transactions:
(a) The government-prescribed price will apply; (b) when there is no
government-prescribed price but there is a government-guidance price, the
government-guidance price will apply; (c) when there is neither a governmentprescribed price nor a government-guidance price, the market price will apply;
or (d) when none of the above is applicable, the price for the provision of the
above products or services is to be agreed upon by the relevant parties, and shall
be the reasonable cost incurred in providing the products or services plus 6% or
less of such cost.
– 51 –
Decision-making procedures:
The major continuing connected transaction agreements were entered into
in the ordinary course of the Company’s business and in accordance with
normal commercial terms that are fair and reasonable to Sinopec Corp. and its
shareholders. The Company, according to internal control procedures, adjusts
the scope and amount of continuing connected transactions and the caps for the
amount exempted from disclosure every three years, and will be announced and
implemented upon the approval of the Board and/or independent shareholders.
For the other connected transactions, the Company, in strict compliance with
domestic and overseas regulatory rules, published the announcement and
implemented the transactions only after submitting the relevant proposals of
connected transactions to the Board and/or the general meeting of shareholders
for consideration according to internal control procedures.
Related party transactions with the Sinopec Group that occurred during the year,
as set out in Note 37 to the financial statements prepared under the IFRS in the
Annual Report, also fall under the definition of connected transactions under
Chapter 14A of the Hong Kong Listing Rules.
The above-mentioned connected transactions between Sinopec Corp. and China
Petrochemical Corporation in 2014 were approved at the 23rd meeting of the
fifth session of the Board and complied with the disclosure requirements under
Chapter 14A of the Hong Kong Listing Rules.
The auditor of Sinopec Corp. was engaged to report on the Company ’ s
continuing connected transactions in accordance with the Hong Kong Standard
on Assurance Engagements 3000, “Assurance Engagement Other Than Audits
or Reviews of Historical Financial Information,” and with reference to Practice
Note 740, “Auditor’s Letter on Continuing Connected Transactions under the
Hong Kong Listing Rules,” issued by the Hong Kong Institute of Certified
Public Accountants. The auditor has issued its unqualified letter containing
its conclusions in respect of the above-mentioned continuing connected
transactions in accordance with Rule 14A.56 of the Hong Kong Listing Rules.
Sinopec Corp. has submitted a copy of the auditor’s letter to the Hong Kong
Stock Exchange.
– 52 –
After reviewing the above-mentioned connected transactions, the independent
non-executive directors of Sinopec Corp. have confirmed the following:
(a) The transactions have been conducted in the ordinary course of the
Company’s business
(b) The transactions have been entered into based on either of the following
terms:
i
normal commercial terms
ii
terms not less favorable than those available from or to independent
third parties, where there is no available comparison to determine
whether such terms are on normal commercial terms.
(c) The transactions were conducted pursuant to the terms of the relevant
agreements, and the terms were fair and reasonable and in the interests of
Sinopec Corp. and its shareholders as a whole.
– 53 –
9.2 Fund provided between connected parties
Unit: RMB millions
Related Parties
Relations
China Petrochemical Corp.
Parent company and
affiliated companies
Associates and joint ventures
Funds to related parties
Funds from related parties
Balance
Balance at
at the
Balance at
the
Balance at
beginning of
Amount the end of beginning of
Amount the end of
the year
incurred
the year
the year
incurred
the year
9,866
5,229
15,095
23,296
4,806
28,102
2,319
(135)
2,184
57
291
348
12,185
5,094
17,279
23,353
5,097
28,450
Fund from Sinopec Corp. to the controlling
shareholder and
its subsidiaries in the reporting period
Balance of fund from Sinopec Corp. to the
controlling shareholder and its subsidiaries
Reason for provision of funds between
related parties
Settlement of funds provided between
related parties
Related undertakings in accordance with
the funds
Impacts on operating results and
financial position
5,229
Other related parties
Total
15,095
As a result of normal business activities
Implemented according to the contract,
without any overdue
None
No material negative impact
– 54 –
9.3 Other Significant Connected Transactions Occurred During this year
On September 12, 2014, Sinopec Corp. entered into the Disposal Agreement
and Share Repurchase Agreement with Sinopec Yizheng Chemical Fiber
Company, Ltd. (“Yizheng Chemical”). Pursuant to the agreements, Sinopec
Corp. has agreed to accept the transfer of all the assets and liabilities owned by
Yizheng Chemical (“Outgoing Business”), the consideration of which is around
RMB 6.491 billion, and the shares of Yizheng Chemical held by Sinopec Corp.
(“Target Shares”) will be repurchased and cancelled by Yizheng Chemical, the
consideration of which is around RMB 6.303 billion. The difference between
the consideration of the Outgoing Business and that of the Target Shares has
been offset by a cash consideration paid by Sinopec Corp. within 20 business
days after the completion date. All the profit and loss arising from or incurred
during the period from June 30, 2014 to the completion date, which shall be
determined by the net asset value according to the final asset appraisal, shall
belong to or be borne by Yizheng Chemical. As of December 31, 2014, the
transfer of the Outgoing Business had been completed in accordance with the
relevant agreements and Yizheng Chemical had repurchased the Target Shares
for cancellation. For further details, please refer to the announcements published
in the China Securities Journal, the Shanghai Securities News and the Securities
Times by Sinopec Corp. on September 13, 2014, December 24, 2014 and
December 31, 2014. For the relevant details, please also refer to the disclosure
made on the website of the Hong Kong Stock Exchange.
– 55 –
On October 30, 2014, Sinopec Overseas Investment Holding, Ltd. (“Overseas
Holding ” ), and Sinopec Chemical Commercial Holding (Hong Kong)
Company, Ltd. (“Chemical Commercial Hong Kong”), two wholly owned
subsidiaries of Sinopec Corp., entered into two agreements with subsidiaries of
China Petrochemical Corp., pursuant to which Overseas Holding and Chemical
Commercial Hong Kong shall acquire 99% and 1% interest in Sinopec
Century Bright Capital Investment (Netherlands) Coöperatief U.A. (“COOP”),
respectively (“Acquisition”). The purpose of the Acquisition was to acquire
37.5% of the interest of the Yanbu Aramco Sinopec Refining Company, Ltd.
(“Yanbu Company”) by way of acquisition of the entire interest in COOP.
According to the related arrangements for the Acquisition and normal business
practices, Sinopec Corp. has assumed from China Petrochemical Corp. the
obligation in relation to the provision of guarantees to the related companies.
As of December 31, 2014, the Acquisition under the agreements had been
completed. For further details, please refer to the announcements published in
the China Securities Journal, the Shanghai Securities News and the Securities
Times by Sinopec Corp. on October 31, 2014 and January 6, 2015. For the
relevant details, please also refer to the disclosure made on the website of the
Hong Kong Stock Exchange.
10. Report of the Board of Directors
10.1 Major Suppliers and Customers
During this reporting period, the total purchases from the top five crude oil suppliers of
the Company accounted for 68.0% of the total purchases of crude oil by the Company, of
which the purchases from the largest supplier accounted for 20.4% of the total purchases
of crude oil by the Company.
The total sales to the five largest customers of the Company accounted for 8% of the total
sales of the Company, of which sales to the largest customer accounted for 3% of the
total sales.
During this reporting period, other than the connected transactions with the controlling
shareholder – China Petrochemical Corporation and its subsidiaries, as disclosed in
“Connected Transaction” of the Annual Report, none of the directors, supervisors of
Sinopec Corp. and their associates or any shareholders holding 5% or more of the share
capital of Sinopec Corp. had any interest in any of the above-mentioned major suppliers
and customers.
– 56 –
10.2 Core Competitiveness
The Company is a large scale vertically integrated energy & petrochemical company
with upstream, mid-stream and downstream operations. The Company ranks first among
all enterprises in China in terms of revenue; It is the second largest supplier of oil and
gas in China; In respect of refining capacity, it ranks first in China and second globally;
Equipped with a well-developed refined oil products sales network, the Company is the
largest supplier of refined oil products in China; and in terms of ethylene production
capacity, the Company takes the first position in China and the 4th in the world, and has
a well-established marketing network for chemical products.
The integrated business structure of the Company carries strong advantages in synergy
among its various business segments, enabling the Company to continuously tap
potentials in attaining an efficient and comprehensive utilisation of its resources, and
endowed the Company strong resistance against risks, as well as remarkable capabilities
in delivering stable profitability.
The Company enjoys a favorable location which is close to the consumer markets. Along
with the steady growth in the Chinese economy, sales volume of both oil products and
chemical products by the Company has been increasing steadily over the years; through
continuous and specialised marketing efforts, its capability in international operations and
market expansion has been further enhanced.
The Company owns a team of professionals and expertise engaged in the production of
oil & gas, operation of refineries and chemical plants, as well as marketing activities. The
Company applies outstanding fine management measures with its remarkable capabilities
in management of operations, and enjoys a favorable operational cost advantage in its
downstream businesses.
The Company has formulated a well-established technology system and mechanism, and
owns competent teams specialised in technology covering a wide range of subjects; the
four platforms for technology advancement is taking shape, which includes exploration
and development of oil & gas, refining, chemicals and commonly applied technology.
With its overall technologies reaching state of the art level in the global arena, and some
of them taking the lead globally, the Company enjoys strong capability for technical
innovations.
– 57 –
The Company always attaches great importance to fulfilling social responsibilities as
an enterprise, and carries out the green & low carbon development strategy to pursue a
sustainable pattern of development. Moreover, the Company enjoys an outstanding brand
name, plays an important role in the economy and is a renowned and reputable company
in China.
10.3 Risk Factors
In the course of its production and operations, Sinopec Corp. will actively take various
measures to circumvent operational risks. However, in practice, it may not be possible to
prevent the occurrence of all risks and uncertainties below.
Risks with regard to the variations from macroeconomic situation: The business
results of the Company are closely related to China’s and global economic situation.
Although, China ’ s economic growth has entered the new normal, and the various
countries have adopted different kinds of macroeconomic policies to eliminate negative
effects caused by lower economic growth, the strength and process of economic recovery
still remains uncertain. The business of the Company may be adversely affected by such
factors as the impact on export due to trade protectionism of some countries, impact on
import which is likely caused by regional trade agreements and etc.
Risks with regard to the cyclical effects from the industry: The majority of the
operational income of the Company comes from the sales of refined oil products and
petrochemical products, and part of the business and their related products are cyclic
and are sensitive to macro-economy, cyclic changes of regional and global economy, the
changes of the production capacity and output, demand of consumers, prices and supply
of the raw materials, as well as prices and supply of the alternative products etc. Although
the Company is an integrated company with the integration of upstream, midstream and
downstream businesses, it can only counteract the adverse influences of periodicity of the
industry to some extent.
– 58 –
Risks from the macroeconomic policies and government regulation: Although the
government of China is gradually liberalising the market entry regulations on petroleum
and petrochemicals sector, the petroleum and petrochemical industries in China are still
subject to entry regulations to a certain degree, which include: issuing licenses in relation
to prospection, exploration and development of crude oil and natural gas , setting the
upper limit for retail prices of gasoline, diesel and other oil products, the imposing of
the special oil income levy, formulation of import and export quotas and procedures,
formulation of safety, quality and environmental protection standards; meanwhile, the
changes in macroeconomic and industry policies such as: the change of crude oil and
refined products import policy, and admit private assets into the oil and gas exploration
and development sector, further improvement in pricing mechanism of refined oil
products, reforming and improvement in pricing mechanism of natural gas, and reforming
in resource tax and environmental tax. Such regulations may have material effect on the
operations and profitability of the Company.
Risks with regard to the changes from environmental legislation requirements: Our
production activities generate waste water, gases and solids. But the Company has built
up the supporting effluent treatment systems to prevent and reduce the pollution to the
environment. And the relevant government authorities may issue and implement much
stricter environmental protection laws and regulations, adopt much stricter environment
protection standards. For this reason, the Company may increase more expenses in
relation to the environment protection accordingly.
Risks from the uncertainties of obtaining additional oil and gas resources: The future
sustainable development of the Company is partly dependent to a certain extent on our
abilities in continuously discovering or acquiring additional oil and natural gas resources.
To obtain additional oil and natural gas resources, the Company faces some inherent
risks associated with exploration and development and/or with acquiring activities, and
the Company has to invest a large amount of money with no guarantee of certainty. The
proved reserves are subject to crude oil and gas prices fluctuation. If the Company fails
to acquire additional resources though further exploration, development and acquisition
or crude oil and gas prices fell sharply, the oil and natural gas reserves and production of
the Company will decline over time which will adversely affect the Company’s financial
situation and operation performance.
– 59 –
Risks with regard to the external purchase of crude oil: A significant amount of
crude oil as need by the Company is satisfied through the external purchases. In recent
years, especially influenced by the mismatch between supply and demand of crude oil,
geopolitics, global economic growth and other factors, the crude oil prices are subject to
a significant fluctuation. Additionally, the supply of crude oil may even be interrupted
due to some extreme major incidents. Although the Company has taken flexible counter
measures, it may not fully avoid risks associated with any significant fluctuation of
international crude oil prices and disruption of supply of crude oil.
Risks with regard to the operation and natural disasters: The process of
petroleum chemical production is exposed to the risks of inflammation, explosion and
environmental pollution and is vulnerable to natural disasters. Such contingencies may
cause serious impacts to the society, major financial losses to the Company and grievous
injuries to people. The Company has always been paying great emphasis on the safety of
production, and has implemented a strict HSE management system as an effort to avoid
such risks as far as possible. Meanwhile, the main assets and inventories of the Company
have been insured. However, such measures may not shield the Company from financial
losses or adverse impact resulting from such contingencies.
Investment risks: Petroleum and chemical sector is a capital intensive industry.
Although the Company adopted a prudent investment strategy and conducted rigorous
feasibility study on each investment project, some certain investment risks may exist in
the sense that expected returns may not be achieved due to major changes in factors such
as market environment, prices of equipment and raw materials, and construction period
during the implementation of the projects.
Currency risks: At present, China implements an administered floating exchange
rate regime based on market supply and demand which is regulated with reference
to a basket of currencies in terms of the exchange rate of RMB. As the Company
purchases a significant portion of crude oil in foreign currency which is based on US
dollar-denominated prices and the company had issued some foreign currency bonds,
fluctuations in the exchange rate of Renminbi against US dollars and certain other foreign
currencies may affect the Company’s purchasing costs of crude oil and the cost of foreign
currency bond redemption.
– 60 –
10.4 Proposals for dividend distribution
At the 23rd meeting of the fifth session of the Board, the Board approved the proposal to
distribute a final cash dividend of RMB0.11 (tax included) per share combining with an
interim distributed dividend of RMB 0.09 (tax included) per share, the total dividend for
the whole year is RMB0.20 (tax included) per share.
The final cash dividend will be distributed on or before 30 June 2015 (Tuesday) to all
shareholders whose names appear on the register of members of Sinopec Corp. on the
record date of 18 June 2015 (Thursday). The H shares register of members of Sinopec
Corp. will be closed from 12 June 2015 (Friday) to 18 June 2015 (Thursday) (both dates
are inclusive). In order to qualify for the final dividend for H shares, the holders of H
shares must lodge all share certificates accompanied by the transfer documents with Hong
Kong Registrars Limited before 4:30 p.m. on 11 June 2015 (Thursday) for registration.
The dividend will be denominated and declared in RMB, and distributed to the domestic
shareholders and investors participating in the Shanghai-Hong Kong Stock Connect
Program in RMB and to the overseas shareholders in Hong Kong Dollar. The exchange
rate for the dividend calculation in Hong Kong Dollar is based on the average benchmark
exchange rate of RMB against Hong Kong Dollar as published by the People’s Bank of
China one week preceding the date of the declaration of such dividend.
In accordance with the Enterprise Income Tax Law of the People’s Republic of China and
its implementation regulations which came into effect on 1 January 2008, Sinopec Corp.
is required to withhold and pay enterprise income tax at the rate of 10% on behalf of the
non-resident enterprise shareholders whose names appear on the register of members for
H Shares of Sinopec Corp. when distributing the cash dividends to them. Any H Shares of
the Sinopec Corp. registered not under the name of an individual shareholder, including
HKSCC Nominees Limited, other nominees, agents or trustees, or other organisations
or groups, shall be deemed as shares held by non-resident enterprise shareholders.
Therefore, on this basis, enterprise income tax shall be withheld from dividends payable
to such shareholders. If holders of H Shares intend to change its shareholder status, please
enquire about the relevant procedures with your agents or trustees. Sinopec Corp. will
strictly comply with the law or the requirements of the relevant government authority and
withhold and pay enterprise income tax on behalf of the relevant shareholders based on the
register of members for H shares of Sinopec Corp. as at the record date.
– 61 –
If the individual holders of the H shares who are Hong Kong or Macau residents or
residents of the countries which had an agreed tax rate of 10% for the cash dividends to
them with China under the relevant tax agreement, Sinopec Corp. should withhold and
pay individual income tax on behalf of the relevant shareholders at a rate of 10%. Should
the individual holders of the H Shares are residents of the countries which had an agreed
tax rate of less than 10% with China under the relevant tax agreement, Sinopec Corp.
shall withhold and pay individual income tax on behalf of the relevant shareholders at a
rate of 10%. In that case, if the relevant individual holders of the H Shares wish to reclaim
the extra amount withheld (the “Extra Amount”) due to the application of 10% tax rate,
Sinopec Corp. can apply for the relevant agreed preferential tax treatment provided that
the relevant shareholders submit the evidence required by the notice of the tax agreement
to the share register of Sinopec Corp. within the timeline set out above. Sinopec Corp.
will assist with the tax refund after the approval of the competent tax authority. Should the
individual holders of the H Shares are residents of the countries which had an agreed tax
rate of over 10% but less than 20% with China under the tax agreement, Sinopec Corp.
shall withhold and pay the individual income tax at the agreed actual rate in accordance
with the relevant tax agreement. In the case that the individual holders of the H Shares are
residents of the countries which had an agreed tax rate of 20% with China, or which has
not entered into any tax agreement with China, or otherwise, Sinopec Corp. shall withhold
and pay the individual income tax at a rate of 20%.
Pursuant to the Notice on the Tax Policies Related to the Pilot Program of the ShanghaiHong Kong Stock Connect (關於滬港股票市場交易互聯互通機制試點有關稅收政策
的通知) (Caishui [2014] No. 81):
For domestic investors investing in the H Shares of Sinopec Corp. through Shanghai-Hong
Kong Stock Connect, the company shall withhold and pay income tax at the rate of 20%
on behalf of individual investors and securities investment funds. The company will not
withhold or pay the income tax of dividends for domestic enterprise investors and those
domestic enterprise investors shall report and pay the relevant tax themselves.
– 62 –
For investors of the Hong Kong Stock Exchange (including enterprises and individuals)
investing in the A Shares of Sinopec Corp. through Shanghai-Hong Kong Stock Connect,
the Company will withhold and pay income taxes at the rate of 10% on behalf of those
investors and will report to the tax authorities for the withholding. For investors who are
tax residents of other countries and whose country of domicile is a country which has
entered into a tax treaty with the PRC stipulating a dividend tax rate of lower than 10%,
those enterprises and individuals may, or may entrust a withholding agent to, apply to
the competent tax authorities for the entitlement of the rate under such tax treaty. Upon
approval by the tax authorities, the paid amount in excess of the tax payable based on the
tax rate according to such tax treaty will be refunded.
11. Report of the Board of Supervisors
During 2014, the Board of Supervisors organised supervisors to attend the trainings
for directors and supervisors of listed companies organised by CSRC and to be present
at the general meeting of shareholders and meeting of the Board, and organised some
supervisors to visit companies such as Sinopec Hainan Petrochemical Co., Ltd., Sinopec
Hainan Petroleum Company, Sinopec Neimongol Petroleum Company and Sinopec
Gansu Petroleum Company for research and inspection. These activities have further
improved their capabilities in performing supervisory duties.
Through process supervision on significant decision-makings as well as supervision
and inspection on the production and operation management conditions, the Board of
Supervisors hold the view that: facing the severe operating situations such as the tumbling
decrease of crude oil price in the second half of the year and the 11 consecutived cuts
of domestic refined oil retail price, Sinopec Corp. actively responded, closely traced
the market, optimised the production and operation and fully exploit the advantages of
resources integration. In addition, Sinopec Corp. actively boosted industrial restructuring
and transformation development, sturdily developed strict management year activities,
and fully exploited potentials from existing asset to obtain a hard-won operation result.
The Board of Supervisors had no objection to the supervised issues during this reporting
period.
– 63 –
Firstly, the Board diligently fulfilled its obligations and exercised its rights under the
PRC Company Law and the Articles of Association, and made scientific decisions on
major issues concerning production and operation, reforms and development, etc.; and
the senior management diligently implemented the resolutions passed by the Board;
continued to deepen the reform, accelerated structure adjustment, intensified strict
management and strived to lower the costs and enhance efficiency. As a result, all works
made remarkable achievements. The Board of Supervisors did not discover any behaviors
of any director or senior management which violated laws, regulations, and the Articles
of Association, or were detrimental to the interests of Sinopec Corp. or its shareholders.
Secondly, the reports prepared by Sinopec Corp. in 2014 complied with the relevant
regulation of domestic and overseas securities regulators, and the annual financial
statement of Sinopec Corp. was prepared in accordance with ASBE and IFRS
respectively, truly and fairly reflecting Sinopec Corp.’s financial status and operation
performance. The dividend distribution plan was made after comprehensively considering
the equity interests of shareholders and the long-term interests of Sinopec Corp. The
information disclosed in the annual report was true, accurate and complete. No violation
of confidential provisions of persons who prepared and reviewed the report was found.
Thirdly, transaction prices for share repurchase and asset sales under Sinopec in 2014
were based on “equality, fairness and justice”. In these transactions, neither insider
trading nor actions detrimental to the interests of Sinopec Corp. or its shareholders
causing losses of assets and benefits of Sinopec Corp. were found.
Fourthly, all connected transactions between Sinopec Corp. and China Petrochemical
Corporation were in compliance with the relevant rules and regulations of listed places.
All the connected transactions were conducted on the basis of “fairness and justice”.
Nothing in these transactions was found to be detrimental to the interests of Sinopec
Corp. or its shareholders.
Fifthly, a detailed description with adequate causes for large gap between actual profit
and budget number in 2014 was made by Sinopec Corp. board of directors. A real,
accurate and complete profit amount was realised by Sinopec Corp. in 2014.
Sixthly, Sinopec Corp. has a sound and effective internal control system. The internal
control evaluation report was comprehensive, true and objective. There was no significant
defect on the internal control system.
– 64 –
Seventhly, Sinopec Corp. actively fulfilled its social responsibilities and promoted
the sustainable development of social economy. Information stated in the sustainable
development report was true, accurate and complete, and in compliance with
requirements made by Shanghai Stock Exchange for listed companies with regard to the
publication of social responsibility report.
In 2015, the Board of Supervisors will continue to follow the principle of diligence and
integrity, earnestly perform the duties of supervision, actively participate in the process
supervision of significant decision makings, increase the strength of inspection and
supervision and protect Sinopec Corp’s. benefit and its shareholders’ interests.
– 65 –
12 Financial Statements
12.1 Auditors’ opinion
Financial Statements □Unaudited √ Audited
Auditors’ opinion
√ Standard unqualified opinion □Not standard opinion
12.2 Financial Statements
12.2.1 Financial statements prepared in accordance with the Accounting Standards for
Business Enterprises
Consolidated and Parent Balance Sheet
Unit:RMB million
Items
At 31 December 2014
At 31 December 2013
Consolidated
Parent Consolidated
Parent
Current assets
Cash at bank and on hand
Bills receivable
Accounts receivable
Other receivables
Prepayments
Inventories
Other current assets
10,100
13,963
90,831
29,251
3,780
188,223
23,996
1,805
176
25,031
201,234
1,962
74,654
19,186
15,101
28,771
68,466
13,165
4,216
221,906
21,385
6,732
2,064
32,620
52,652
5,237
138,882
19,888
Total current assets
360,144
324,048
373,010
258,075
Non-current assets
Available-for-sale financial assets
Long-term equity investments
Fixed assets
Construction in progress
Intangible assets
Goodwill
Long-term deferred expenses
Deferred tax assets
Other non-current assets
868
80,593
703,485
177,667
78,681
6,281
14,158
6,979
22,512
91
189,631
452,361
100,543
8,834
—
2,547
—
2,767
3,730
75,318
669,595
160,630
60,263
6,255
11,961
4,141
18,013
2,844
164,545
533,297
123,059
49,282
—
9,602
—
3,518
Total non-current assets
1,091,224
756,774
1,009,906
886,147
Total assets
1,451,368
1,080,822
1,382,916
1,144,222
– 66 –
Unit:RMB million
Items
Liabilities and shareholders’ equity
At 31 December 2014
At 31 December 2013
Consolidated
Parent Consolidated
Parent
Current liabilities
Short-term loans
Bills payable
Accounts payable
Advances from customers
Employee benefits payable
Taxes payable
Other payables
Short-term debentures payable
Non-current liabilities due
within one year
166,688
4,577
198,366
89,918
839
28,677
103,302
—
57,749
2,933
102,399
3,926
310
19,883
198,144
—
108,121
4,526
202,724
81,079
818
35,888
82,917
10,000
23,215
2,443
152,007
73,909
489
29,291
132,446
10,000
11,890
11,084
45,749
44,379
604,257
396,428
571,822
468,179
Non-current liabilities
Long-term loans
Debentures payable
Provisions
Deferred tax liabilities
Other non-current liabilities
67,426
83,506
29,715
7,820
11,549
55,202
62,221
25,830
600
1,892
46,452
99,138
26,080
7,977
8,187
44,692
77,961
22,729
1,105
1,982
Total non-current liabilities
200,016
145,745
187,834
148,469
Total liabilities
804,273
542,173
759,656
616,648
Total current liabilities
– 67 –
Items
Liabilities and shareholders’ equity
At 31 December 2014
At 31 December 2013
Consolidated
Parent Consolidated
Parent
Shareholders’ equity
Share capital
Capital reserve
Other comprehensive income
Specific reserve
Surplus reserves
Retained earnings
118,280
48,703
(7,261)
491
193,552
240,718
118,280
54,690
(206)
232
193,552
172,101
116,565
36,947
407
1,556
190,337
224,534
116,565
46,121
2,123
1,226
190,337
171,202
Total equity attributable
to shareholders of the Company
Minority interests
594,483
52,612
538,649
—
570,346
52,914
527,574
—
Total shareholders’ equity
647,095
538,649
623,260
527,574
1,451,368
1,080,822
1,382,916
1,144,222
Total liabilities and
shareholders’ equity
– 68 –
Consolidated and Parent Income Statement
Unit:RMB million
Year ended 31 December
2014
2013
Consolidated
Parent Consolidated
Items
Operating income
Less: Operating costs
Sales taxes and surcharges
Selling and distribution expenses
General and administrative
expenses
Financial expenses
Exploration expenses,
including dry holes
Impairment losses
Add: (Loss)/Gain from changes
in fair value
Investment income
Parent
2,825,914
2,429,017
191,202
46,274
1,222,323
972,685
142,840
10,848
2,880,311
2,457,041
190,672
44,359
1,627,613
1,305,891
149,762
34,942
70,500
9,618
46,314
9,144
73,572
6,274
60,553
7,857
10,969
6,839
10,926
2,737
12,573
4,044
12,532
3,693
(4,151)
8,137
(4,605)
13,417
2,167
2,510
2,058
15,216
Operating profit
Add: Non-operating income
Less: Non-operating expenses
65,481
4,710
3,710
35,641
5,092
1,766
96,453
3,481
2,952
69,657
2,801
2,582
Profit before taxation
Less: Income tax expense
66,481
17,571
38,967
6,822
96,982
25,605
69,876
12,541
Net profit
48,910
32,145
71,377
57,335
– 69 –
Year ended 31 December
2014
2013
Consolidated
Parent Consolidated
Items
Attributable to:
Equity shareholders of the Company
Minority interests
Parent
47,430
1,480
32,145
—
67,179
4,198
57,335
—
0.406
0.406
N/A
N/A
0.579
0.543
N/A
N/A
Net profit
48,910
32,145
71,377
57,335
Other comprehensive income
Items that may be reclassified
subsequently to profit or loss (after tax
and reclassification adjustments):
Cash flow hedges
Available-for-sale financial assets
Share of other comprehensive loss
of associates and jointly
controlled entities
Foreign currency translation differences
(4,485)
(1,225)
(657)
(1,309)
604
1,314
—
1,306
(3,042)
(514)
(363)
—
(297)
(689)
(297)
—
Total other comprehensive income
(9,266)
(2,329)
932
1,009
Total comprehensive income
39,644
29,816
72,309
58,344
Attributable to:
Equity shareholders of the Company
Minority interests
39,762
(118)
29,816
—
68,359
3,950
58,344
—
Basic earnings per share
Diluted earnings per share
– 70 –
Consolidated and Parent Cash Flow Statement
Unit:RMB million
Year ended 31 December
2014
2013
Consolidated
Parent Consolidated
Items
Parent
Cash flows from operating activities:
Cash received from sale of goods
and rendering of services
Refund of taxes and levies
Other cash received relating
to operating activities
3,129,123
1,600
1,396,976
1,151
3,214,962
1,747
1,800,264
1,294
44,214
96,326
22,396
38,215
Sub-total of cash inflows
3,174,937
1,494,453
3,239,105
1,839,773
Cash paid for goods and services
Cash paid to and for employees
Payments of taxes and levies
Other cash paid relating
to operating activities
(2,589,649) (1,020,434) (2,691,495) (1,367,598)
(56,396)
(39,024)
(55,731)
(46,489)
(292,259)
(204,807)
(296,896)
(225,218)
Sub-total of cash outflows
(3,026,590) (1,335,246) (3,087,212) (1,690,816)
(88,286)
Net cash flow from operating activities
– 71 –
148,347
(70,981)
159,207
(43,090)
151,893
(51,511)
148,957
Year ended 31 December
2014
2013
Consolidated
Parent Consolidated
Items
Cash flows from investing activities:
Cash received from disposal
of investments
Cash received from returns
on investments
Net cash received from disposal
of fixed assets, intangible assets
and other long-term assets
Other cash received relating
to investing activities
Parent
3,874
15,991
4,198
4,566
2,312
5,899
1,496
14,157
1,020
2,254
1,550
3,093
2,066
214
2,499
127
9,272
24,358
9,743
21,943
(124,381)
(13,855)
(99,968)
(42,226)
(154,946)
(33,487)
(119,371)
(30,092)
(1,137)
—
(50)
—
(2,532)
—
—
—
Sub-total of cash outflows
(141,905)
(142,194)
(188,483)
(149,463)
Net cash flow from investing activities
(132,633)
(117,836)
(178,740)
(127,520)
Sub-total of cash inflows
Cash paid for acquisition of fixed assets,
intangible assets and
other long-term assets
Cash paid for acquisition of investments
Other cash paid relating
to investing activities
Net cash paid for the acquisition
of subsidiaries and other
business entities
– 72 –
Unit:RMB million
Year ended 31 December
2014
2013
Consolidated
Parent Consolidated
Items
Parent
Cash flows from financing activities:
Cash received from capital contributions
Including: Cash received from minority
shareholders’ capital contributions
to subsidiaries
Cash received from borrowings
4,128
—
32,102
19,406
4,120
1,128,447
—
—
250,706
12,696
1,142,890
232,085
Sub-total of cash inflows
1,132,575
250,706
1,174,992
251,491
Cash repayments of borrowings
Cash paid for dividends,
profits distribution or interest
Including: Subsidiaries’ cash payments
for distribution of dividends or profits
to minority shareholders
Other cash paid relating to
financing activities
(1,114,481)
(260,485) (1,105,457)
(236,904)
Sub-total of cash outflows
(1,153,996)
Net cash flow from financing activities
Effects of changes in foreign
exchange rate
Net (decrease)/increase in cash
and cash equivalents
– 73 –
(39,494)
(36,519)
(37,967)
(34,760)
(1,674)
—
(1,346)
—
(21)
—
(49)
—
(297,004) (1,143,473)
(271,664)
(21,421)
(46,298)
31,519
(20,173)
16
—
(82)
—
(5,691)
(4,927)
4,590
1,264
Consolidated Statement of Changes in Equity
Balance at 31 December 2012
Changes in accounting policies
Balance at 1 January 2013
Change for the year
1. Net profit
2. Other comprehensive income
Total comprehensive income
Transactions with owners,
recorded directly
in shareholders’ equity:
3. Appropriations of profits:
– Appropriation for
surplus reserves
– Distributions
to shareholders
– Bonus issues
4. Conversion of the
2011 Convertible Bonds
5. Capitalisation
6. Rights issue of H shares,
(net of issuance cost)
7. Non-tradable shares reform
of subsidiaries
8. Acquisition of minority
interests in subsidiaries
9. Contributions to subsidiaries
from minority interests
10. Distribution to minority
interests
Total transactions with owners,
recorded directly
in shareholders’ equity
11. Net decrease in specific
reserve for the year
12. Government grants
Balance at 31 December 2013
Total
shareholders’
equity
attributable
to equity
shareholders
of the
Company
RMB
million
Share
capital
RMB
million
Other
Capital comprehensive
reserve
income
RMB
RMB
million
million
Specific
reserve
RMB
million
Surplus
reserves
RMB
million
Retained
earnings
RMB
million
Translation
difference
in foreign
currency
statements
RMB
million
86,820
—
86,820
30,574
(846)
29,728
—
(773)
(773)
3,550
—
3,550
184,603
—
184,603
209,446
—
209,446
(1,619)
1,619
—
513,374
—
513,374
37,227
—
37,227
550,601
—
550,601
—
—
—
—
—
1,180
—
—
—
—
67,179
—
—
—
67,179
1,180
4,198
(248)
71,377
932
—
—
1,180
—
—
67,179
—
68,359
3,950
72,309
—
—
—
—
5,734
(5,734)
—
—
—
—
—
17,933
—
—
—
—
—
—
—
—
(28,424)
(17,933)
—
—
(28,424)
—
—
—
(28,424)
—
—
8,967
1
(8,967)
—
—
—
—
—
—
—
—
—
—
1
—
—
—
1
—
2,845
16,561
—
—
—
—
—
19,406
—
19,406
—
(986)
—
—
—
—
—
(986)
986
—
—
(20)
—
—
—
—
—
(20)
(29)
(49)
—
600
—
—
—
—
—
600
12,096
12,696
—
—
—
—
—
—
—
—
(1,261)
(1,261)
29,745
7,189
—
—
5,734
(52,091)
—
(9,423)
11,792
2,369
—
—
—
30
—
—
(1,994)
—
—
—
—
—
—
—
(1,994)
30
(55)
—
(2,049)
30
116,565
36,947
407
1,556
190,337
224,534
—
570,346
52,914
623,260
– 74 –
Total
Minority shareholders’
interests
equity
RMB
RMB
million
million
Balance at 1 January 2014
Change for the year
1. Net profit
2. Other comprehensive income
Total comprehensive income
Transactions with owners,
recorded directly
in shareholders’ equity:
3. Appropriations of profits:
– Appropriation for
surplus reserves
– Distributions
to shareholders
4. Conversion of the
2011 Convertible Bonds
5. Transaction with
minority interests
6. Contributions to subsidiaries
from minority interests
7. Distributions to minority
interests
Total transactions with owners,
recorded directly
in shareholders’ equity
8. Net decrease in specific
reserve for the year
9. Other movement
Balance at 31 December 2014
Specific
reserve
RMB
million
Surplus
reserves
RMB
million
Retained
earnings
RMB
million
Translation
difference
in foreign
currency
statements
RMB
million
Total
shareholders’
equity
attributable
to equity
shareholders
of the
Company
RMB
million
Share
capital
RMB
million
Capital
reserve
RMB
million
Other
comprehensive
income
RMB
million
116,565
36,947
407
1,556
190,337
224,534
—
570,346
52,914
623,260
—
—
—
—
—
(7,668)
—
—
—
—
47,430
—
—
—
47,430
(7,668)
1,480
(1,598)
48,910
(9,266)
—
—
(7,668)
—
—
47,430
—
39,762
(118)
39,644
—
—
—
—
3,215
(3,215)
—
—
—
—
—
—
—
—
—
(28,031)
—
(28,031)
—
(28,031)
1,715
8,477
—
—
—
—
—
10,192
—
10,192
—
3,216
—
—
—
—
—
3,216
(2,877)
339
—
—
—
—
—
—
—
—
4,155
4,155
—
—
—
—
—
—
—
—
(1,545)
(1,545)
1,715
11,693
—
—
3,215
(31,246)
—
(14,623)
(267)
(14,890)
—
—
—
63
—
—
(1,065)
—
—
—
—
—
—
—
(1,065)
63
(28)
111
(1,093)
174
118,280
48,703
(7,261)
491
193,552
240,718
—
594,483
52,612
647,095
– 75 –
Minority
interests
RMB
million
Total
shareholders’
equity
RMB
million
Statement of Changes in Equity
Other
Share capital
Total
Capital comprehensive
Specific
Surplus
Retained shareholders’
reserve
reserve
reserves
earnings
income
equity
RMB million RMB million RMB million RMB million RMB million RMB million RMB million
Balance at 31 December 2012
86,820
39,146
—
3,017
184,603
158,101
471,687
Changes in accounting policies
—
(1,114)
1,114
—
—
—
—
86,820
38,032
1,114
3,017
184,603
158,101
471,687
1. Net profit
—
—
—
—
—
57,335
57,335
2. Other comprehensive income
—
—
1,009
—
—
—
1,009
Total comprehensive income
—
—
1,009
—
—
57,335
58,344
—
—
—
—
5,734
(5,734)
—
—
—
—
—
—
(28,424)
(28,424)
17,933
—
—
—
—
(17,933)
—
—
1
—
—
—
—
1
8,967
(8,967)
—
—
—
—
—
2,845
16,561
—
—
—
—
19,406
29,745
7,595
—
—
5,734
(52,091)
(9,017)
—
—
—
(1,778)
—
—
(1,778)
8. Government grants
—
30
—
—
—
—
30
9. Other movement
—
464
—
(13)
—
7,857
8,308
116,565
46,121
2,123
1,226
190,337
171,202
527,574
Balance at 1 January 2013
Change for the year
Transactions with owners,
recorded directly in
shareholders’ equity:
3. Appropriations of profits:
– Appropriation for
surplus reserves
– Distributions to shareholders
– Bonus issues
4. Conversion of the
2011 Convertible Bonds
5. Capitalisation
6. Rights issue of H shares,
(net of issuance cost)
Total transactions with owners,
recorded directly
in shareholders’ equity
7. Net decrease in specific
reserve for the year
Balance at 31 December 2013
– 76 –
Other
Share capital
Total
Capital comprehensive
Specific
Surplus
Retained shareholders’
reserve
reserve
reserves
earnings
income
equity
RMB million RMB million RMB million RMB million RMB million RMB million RMB million
Balance at 1 January 2014
116,565
46,121
2,123
1,226
190,337
171,202
527,574
1. Net profit
—
—
—
—
—
32,145
32,145
2. Other comprehensive income
—
—
(2,329)
—
—
—
(2,329)
Total comprehensive income
—
—
(2,329)
—
—
32,145
29,816
—
—
—
—
3,215
(3,215)
—
—
—
—
—
—
(28,031)
(28,031)
1,715
8,477
—
—
—
—
10,192
1,715
8,477
—
—
3,215
(31,246)
(17,839)
—
—
—
(994)
—
—
(994)
—
92
—
—
—
—
92
118,280
54,690
(206)
232
193,552
172,101
538,649
Change for the year
Transactions with owners,
recorded directly
in shareholders’ equity:
3. Appropriations of profits:
– Appropriation for
surplus reserves
– Distributions to shareholders
4. Conversion of the 2011
Convertible Bonds
Total transactions with owners,
recorded directly
in shareholders’ equity
5. Net decrease in specific
reserve for the year
6. Other movement
Balance at 31 December 2014
– 77 –
12.2.2 Financial statements prepared under International Financial Reporting Standards
Consolidated Income Statement
Unit: RMB million
Year ended 31 December
2014
2013
Turnover and other operating revenues
Turnover
Other operating revenues
2,781,641
44,273
2,833,247
47,064
2,825,914
2,880,311
Operating expenses
Purchased crude oil, products and operating
supplies and expenses
Selling, general and administrative expenses
Depreciation, depletion and amortisation
Exploration expenses, including dry holes
Personnel expenses
Taxes other than income tax
Other operating expense, net
(2,334,399)
(68,374)
(90,097)
(10,969)
(57,233)
(191,202)
(153)
(2,371,858)
(69,928)
(81,265)
(12,573)
(55,353)
(190,672)
(1,877)
Total operating expenses
(2,752,427)
(2,783,526)
Operating profit
73,487
– 78 –
96,785
Year ended 31 December
2014
2013
Finance costs
Interest expense
Interest income
(Loss)/gain on embedded derivative component
of the convertible bonds
Foreign currency exchange (loss)/gains, net
(11,218)
1,779
(10,602)
1,568
(4,611)
(179)
2,028
2,760
Net finance costs
(14,229)
(4,246)
Investment income
2,616
154
Share of profits less losses from associates
and joint ventures
3,630
2,359
65,504
(17,571)
95,052
(24,763)
Profit for the year
47,933
70,289
Attributable to:
Owners of the Company
Non-controlling interests
46,466
1,467
66,132
4,157
Profit for the year
47,933
70,289
0.398
0.397
0.570
0.534
Profit before taxation
Tax expense
Earnings per share:
Basic
Diluted
– 79 –
Consolidated Statement of Comprehensive Income
Unit: RMB million
Year ended 31 December
2014
2013
Profit for the year
Other comprehensive income:
Items that may be reclassified subsequently
to profit or loss (after tax and
reclassification adjustments):
Cash flow hedges
Available-for-sale securities
Share of other comprehensive loss of associates
and joint ventures
Foreign currency translation differences
47,933
70,289
(4,485)
(1,225)
604
1,314
(3,042)
(514)
(297)
(689)
Total items that may be reclassified
subsequently to profit or loss
(9,266)
932
Total other comprehensive income
(9,266)
932
Total comprehensive income
for the year
38,667
71,221
Attributable to:
Owners of the Company
Non-controlling interests
38,798
(131)
67,312
3,909
Total comprehensive income for the year
38,667
71,221
– 80 –
Balance Sheet
Unit: RMB million
The Group The Company
2014
2014
31 December 31 December
Non-current assets
Property, plant and equipment, net
Construction in progress
Goodwill
Investment in subsidiaries
Interest in associates
Interest in joint ventures
Available-for-sale financial assets
Deferred tax assets
Lease prepayments
Long-term prepayments and
other assets
Total non-current assets
Current assets
Cash and cash equivalents
Time deposits with
financial institutions
Trade accounts receivable
Bills receivable
Inventories
Prepaid expenses and
other current assets
Total current assets
The Group The Company
2013
2013
31 December 31 December
703,485
452,361
669,595
533,297
177,667
6,281
-
32,119
48,474
868
6,979
49,136
100,543
-
164,399
5,453
13,346
91
-
6,930
160,630
6,255
-
28,444
46,874
3,730
4,141
43,270
123,059
-
135,081
9,776
12,072
2,844
-
34,309
66,215
7,218
46,967
28,092
1,091,224
750,341
1,009,906
878,530
9,355
1,804
15,046
6,731
745
90,831
1
25,031
55
68,466
1
32,620
13,963
188,223
176
74,654
28,771
221,906
2,064
138,882
57,027
222,382
38,766
77,777
360,144
324,048
373,010
258,075
– 81 –
The Group The Company
2014
2014
31 December 31 December
The Group The Company
2013
2013
31 December 31 December
Current liabilities
Short-term debts
Loans from Sinopec Group Company
and fellow subsidiaries
Trade accounts payable
Bills payable
Accrued expenses and other payables
Income tax payable
75,183
62,079
109,806
77,523
102,965
198,366
4,577
222,075
1,091
6,750
102,399
2,933
221,715
552
54,064
202,724
4,526
197,606
3,096
71
152,007
2,443
234,507
1,628
Total current liabilities
604,257
396,428
571,822
468,179
Net current liabilities
(244,113)
(72,380)
(198,812)
(210,104)
Total assets less current liabilities
847,111
677,961
811,094
668,426
107,787
75,493
107,234
85,079
43,145
7,820
29,715
13,067
41,930
600
25,830
3,104
38,356
7,977
26,080
9,821
37,574
1,105
22,729
3,257
201,534
146,957
189,468
149,744
645,577
531,004
621,626
518,682
Equity
Share capital
Reserves
118,280
474,761
118,280
412,724
116,565
452,238
116,565
402,117
Total equity attributable to owners
of the Company
Non-controlling interests
593,041
52,536
N/A
N/A
568,803
52,823
N/A
N/A
Total equity
645,577
531,004
621,626
518,682
Non-current liabilities
Long-term debts
Loans from Sinopec Group Company
and fellow subsidiaries
Deferred tax liabilities
Provisions
Other long-term liabilities
Total non-current liabilities
– 82 –
12.2.3 Differences between consolidated financial statements prepared in accordance
with the accounting policies complying with ASBE and IFRS (unaudited)
(1) Effects of major differences between the net profit under ASBE and the
profit for the year under IFRS are analysed as follows:
For year ended 31 December
2014
2013
RMB million
RMB million
Items
Net profit under ASBE
Adjustments:
Government grants
Safety production fund
48,910
71,377
116
(1,093)
119
(1,207)
Profit for the year under IFRS*
47,933
70,289
(2) Effects of major differences between the shareholders’equity under ASBE
and the total equity under IFRS are analysed as follows:
Items
Shareholders’ equity under ASBE
Adjustments:
Government grants
Safety production fund
Total equity under IFRS*
*
2014
31 December
RMB million
2013
31 December
RMB million
647,095
623,260
(1,518)
—
645,577
(1,634)
—
621,626
The figures are extracted from the consolidated financial statements prepared in
accordance with the accounting policies complying with IFRS during the year ended
31 December 2013 and 2014 which have been audited by PricewaterhouseCoopers.
– 83 –
12.3 Provide explanation for any changes in accounting policy, accounting estimate
or recognition policy as compared with for last annual report.
√applicable □inapplicable
In 2014, the MOF promulgated ASBE No. 39 through 41 regarding Fair Value
Measurement, Joint Arrangement and Disclosure of Interests in Other Entities, and
amended ASBE No. 2, No. 9, No. 30, No. 33 and No. 37 regarding Long-Term
Equity Investments, Employee Compensation, Presentation of Financial Statements,
Consolidated Financial Statements and Presentation of Financial Instruments. The
above accounting standards became effective from 1 July 2014 except for No. 37
Presentation of Financial Instruments which shall be implemented for the 2014
annual consolidated financial statements.
The Group has adopted the standards mentioned above for the preparation of
financial statements of 2014. The impacts of these standards on the Group’s financial
statements are as follows:
Contents and reasons of the changes
in accounting policies
Affected financial
statement line items
ASBE No. 2-Long-Term Equity Investments has amended
the scope of long-term equity investments.
The amounts
(RMB million)
31 December 2013
Long-term investments
Available-for-sale financial assets
(1,760)
1,760
Several financial statement line items have been presented,
and the financial information for the comparative period
have been presented in accordance with the above standards.
Capital reserve
Other comprehensive income
Translation differences in foreign
currency statements
2,466
(407)
(2,059)
Certain disclosed information related to the Group’s interest
in other entities has been prepared based on ASBE No.
41-Disclosure of Interests in Other Entities. Except for the
disclosure of structured body that is not included in the
consolidated financial statements, the comparative financial
statement information has been presented accordingly.
Not Applicable
The Group reclassified equity investments accordingly and
the comparative financial information has been adjusted.
– 84 –
Not Applicable
12.4 Details, adjusted amount, reason and impact of material accounting error.
There is no material error in the current report period.
12.5 Notes on the financial statements prepared under IFRS
12.5.1 Turnover
Turnover primarily represents revenue from the sales of crude oil, natural gas,
petroleum and chemical products.
12.5.2 Tax expense
Tax expense in the consolidated income statement represents:
Year ended 31 December
2014
2013
RMB million
RMB million
Current tax
Provision for the year
Adjustment of prior years
Deferred taxation
– 85 –
18,341
1,022
(1,792)
22,741
302
1,720
17,571
24,763
Reconciliation between actual income tax expense and the expected income tax
expense at applicable statutory tax rates is as follows:
Year ended 31 December
2014
2013
RMB million
RMB million
Profit before taxation
Expected PRC income tax expense
at a statutory tax rate of 25%
Tax effect of non-deductible expenses
Tax effect of non-taxable income
Tax effect of preferential tax rate (i)
Effect of difference between income
taxes at foreign operations tax rate
and the PRC statutory tax rate (ii)
Tax effect of utilisation of previously
unrecognised tax losses and
temporary differences
Tax effect of tax losses not recognised
Write-down of deferred tax assets
Adjustment of prior years
Actual income tax expense
65,504
95,052
16,376
717
(1,126)
(1,722)
23,763
805
(1,327)
(1,962)
622
(27)
1,595
114
1,022
17,571
2,171
(575)
660
926
302
24,763
Note:
(i)
The provision for PRC current income tax is based on a statutory income tax rate of 25%
of the assessable income of the Group as determined in accordance with the relevant
income tax rules and regulations of the PRC, except for certain entities of the Group in
western regions in the PRC are taxed at preferential income tax rate of 15% through the
year 2020.
(ii)
It is mainly due to the foreign operation in the Republic of Angola (“Angola”) that is taxed
at 50% of the assessable income as determined in accordance with the relevant income tax
rules and regulations of Angola.
– 86 –
12.5.3 Basic and Diluted Earnings per Share
The calculation of basic earnings per share for the year ended 31 December
2014 is based on the profit attributable to ordinary owners of the Company of
RMB 46,466 million (2013: RMB 66,132 million) and the weighted average
number of shares of 116,822,487,451 (2013: 116,102,910,373) during the year.
The calculation of diluted earnings per share for the year ended 31 December
2014 is based on the profit attributable to ordinary owners of the Company of
RMB 46,600 million (2013: RMB 65,087 million) and the weighted average
number of shares of 117,242,396,710 (2013: 121,858,818,276) calculated as
follows:
(i) Profit attributable to ordinary owners of the Company (diluted)
Year ended 31 December
2014
2013
RMB million
RMB million
Profit attributable to ordinary owners
of the Company
After tax effect of interest expenses
(net of exchange gain) of the
2007 Convertible Bonds
and the 2011 Convertible Bonds
After tax effect of net loss/(gain)
on embedded derivative components
of the 2007 Convertible Bonds
and the 2011 Convertible Bonds
Profit attributable to ordinary owners
of the Company (diluted)
– 87 –
46,466
66,132
133
476
1
46,600
(1,521)
65,087
(ii) Weighted average number of shares (diluted)
Year ended 31 December
2014
2013
Number of
Number of
shares
shares
Weighted average number of shares
at 31 December
Effect of conversion of the
2007 Convertible Bonds
Effect of conversion of the
2011 Convertible Bonds
Weighted average number of
shares (diluted) at 31 December
116,822,487,451
116,102,910,373
419,909,259
1,439,688,889
—
4,316,219,014
117,242,396,710
121,858,818,276
12.5.4 Dividends
Dividends payable to owners of the Company attributable to the year represent:
Year ended 31 December
2014
2013
RMB million
RMB million
Dividends declared and paid during the year
of RMB 0.09 per share
(2013: RMB 0.09 per share)
Dividends declared after the balance sheet
date of RMB 0.11 per share
(2013: RMB 0.15 per share)
10,512
10,491
13,318
17,519
23,830
28,010
Pursuant to the Company’s Articles of Association and a resolution passed at
the Directors’ meeting on 22 August 2014, the directors authorised to declare
the interim dividends for the year ending 31 December 2014 of RMB 0.09
(2013: RMB 0.09) per share totaling RMB 10,512 million (2013: RMB 10,491
million). Dividends were paid on 24 September 2014.
– 88 –
Pursuant to a resolution passed at the director’s meeting on 20 March 2015,
final dividends in respect of the year ended 31 December 2014 of RMB 0.11
(2013: RMB 0.15) per share totaling RMB 13,318 million (2013: RMB 17,519
million) were proposed for shareholders ’ approval at the Annual General
Meeting. Final cash dividend proposed after the balance sheet date has not been
recognised as a liability at the balance sheet date.
Dividends payable to owners of the Company attributable to the previous
financial year, approved during the year represent:
Year ended 31 December
2014
2013
RMB million
RMB million
Final cash dividends in respect
of the previous financial year,
approved and paid during the year
of RMB 0.15 per share
(2013: RMB 0.20 per share)
17,519
17,933
Pursuant to the shareholders’ approval at the Annual General Meeting on 9 May
2014, a final dividend of RMB 0.15 per share totaling RMB 17,519 million in
respect of the year ended 31 December 2013 was declared and paid on 19 June
2014.
Pursuant to the shareholders’ approval at the Annual General Meeting on
29 May 2013, a final dividend of RMB 0.20 per share totaling RMB 17,933
million, and with bonus issues of 2 shares converted from the retained earnings
for every 10 existing shares in respect of the year ended 31 December 2012 was
declared and cash dividends were paid on 25 June 2013.
– 89 –
12.5.5 Trade Accounts Receivable and Bills Receivable
The Group
The Company
2014
2013
2014
2013
31 December 31 December 31 December 31 December
RMB million RMB million RMB million RMB million
Amounts due from third parties
Amounts due from
subsidiaries
Amounts due from Sinopec Group
Company and fellow subsidiaries
Amounts due from associates
and joint ventures
Less: Impairment losses for
bad and doubtful debts
Trade accounts receivable, net
Bills receivable
65,883
50,638
1,494
2,422
—
—
19,917
25,068
20,188
9,311
1,587
2,742
5,290
9,091
2,161
2,766
91,361
69,040
25,159
32,998
(530)
90,831
13,963
(574)
68,466
28,771
(128)
25,031
176
(378)
32,620
2,064
104,794
97,237
25,207
34,684
The ageing analysis of trade accounts and bills receivables (net of impairment
losses for bad and doubtful debts) is as follows:
The Group
The Company
2014
2013
2014
2013
31 December 31 December 31 December 31 December
RMB million RMB million RMB million RMB million
Within one year
Between one and two years
Between two and three years
Over three years
104,019
720
53
2
97,066
112
46
13
22,502
2,665
37
3
34,519
110
44
11
104,794
97,237
25,207
34,684
– 90 –
Impairment losses for bad and doubtful debts are analysed as follows:
The Group
The Company
2014
2013
2014
2013
RMB million RMB million RMB million RMB million
Balance at 1 January
Provision for the year
Written back for the year
Written off for the year
Transferred to subsidiaries
Others
574
44
(15)
(57)
—
378
4
(11)
(11)
(232)
—
546
16
(17)
(113)
—
(16)
699
36
(38)
(123)
—
—
Balance at 31 December
530
574
128
378
(54)
Sales are generally on a cash term. Credit is generally only available for major
customers with well-established trading records. Amounts due from Sinopec
Group Company and fellow subsidiaries are repayable under the same terms.
Trade accounts and bills receivables (net of impairment losses for bad and
doubtful debts) primarily represent receivables that are neither past due nor
impaired. These receivables relate to a wide range of customers for whom there
is no recent history of default.
– 91 –
12.5.6 Trade Accounts and Bills Payables
The Group
The Company
2014
2013
2014
2013
31 December 31 December 31 December 31 December
RMB million RMB million RMB million RMB million
Amounts due to third parties
Amounts due to Sinopec Group
Company and fellow subsidiaries
Amounts due to associates
and joint ventures
Amounts due to subsidiaries
181,519
192,082
44,351
57,309
13,575
8,114
8,345
4,463
3,272
—
2,528
—
393
49,310
775
89,460
Bills payable
198,366
4,577
202,724
4,526
102,399
2,933
152,007
2,443
Trade accounts and bills payables
measured at amortised cost
202,943
207,250
105,332
154,450
The ageing analysis of trade accounts and bills payables are as follows:
The Group
The Company
2014
2013
2014
2013
31 December 31 December 31 December 31 December
RMB million RMB million RMB million RMB million
Within 1 month or on demand
184,697
194,108
73,803
133,374
Between 1 month and 6 months
Over 6 months
13,138
5,108
8,548
4,594
18,821
12,708
12,876
8,200
202,943
207,250
105,332
154,450
– 92 –
12.5.7 Segment Reporting
(1) Information of the Group’s reportable segments is as follows:
2014
RMB million
2013
RMB million
69,550
141,544
60,848
158,618
211,094
219,466
175,534
1,092,244
194,469
1,111,004
1,267,778
1,305,473
1,458,390
5,446
1,486,037
6,330
1,463,836
1,492,367
356,993
62,208
374,097
55,999
419,201
430,096
721,174
587,663
717,796
640,224
1,308,837
1,358,020
(1,889,105)
(1,972,175)
2,781,641
2,833,247
Other operating revenues
Exploration and production
Refining
Marketing and distribution
Chemicals
Corporate and others
16,503
5,317
12,770
8,284
1,399
22,641
5,796
10,047
7,491
1,089
Other operating revenues
44,273
47,064
2,825,914
2,880,311
Turnover
Exploration and production
External sales
Inter-segment sales
Refining
External sales
Inter-segment sales
Marketing and distribution
External sales
Inter-segment sales
Chemicals
External sales
Inter-segment sales
Corporate and others
External sales
Inter-segment sales
Elimination of inter-segment sales
Turnover
Turnover and other
operating revenues
– 93 –
2014
RMB million
2013
RMB million
Result
Operating profit/(loss)
By segment
Exploration and production
Refining
Marketing and distribution
Chemicals
Corporate and others
Elimination
47,057
(1,954)
29,449
(2,181)
(1,063)
2,179
54,793
8,599
35,143
868
(3,412)
794
Total segment operating profit
73,487
96,785
Share of profits/(losses) from associates
and joint ventures
Exploration and production
Refining
Marketing and distribution
Chemicals
Corporate and others
1,117
(871)
963
603
1,818
358
(486)
794
418
1,275
Aggregate share of profits from
associates and joint ventures
3,630
2,359
Investment income
Exploration and production
Refining
Marketing and distribution
Chemicals
Corporate and others
1
17
71
208
2,319
8
11
93
—
Aggregate investment income
2,616
154
Net finance costs
Profit before taxation
– 94 –
42
(14,229)
(4,246)
65,504
95,052
At
31 December
2014
RMB million
At
31 December
2013
RMB million
453,060
297,884
276,298
162,685
147,015
406,237
329,236
273,872
156,373
107,197
1,336,942
1,272,915
80,593
868
6,979
75,318
3,730
4,141
10,100
15,886
15,101
11,711
1,451,368
1,382,916
Liabilities
Segment liabilities
– Exploration and production
– Refining
– Marketing and distribution
– Chemicals
– Corporate and others
100,552
67,327
118,493
27,532
138,930
104,233
69,029
101,564
23,670
129,816
Total segment liabilities
452,834
428,312
75,183
1,091
107,787
109,806
3,096
107,234
146,110
7,820
14,966
92,420
7,977
12,445
805,791
761,290
Assets
Segment assets
– Exploration and production
– Refining
– Marketing and distribution
– Chemicals
– Corporate and others
Total segment assets
Interest in associates and joint ventures
Available-for-sale financial assets
Deferred tax assets
Cash and cash equivalents and time
deposits with financial institutions
Other unallocated assets
Total assets
Short-term debts
Income tax payable
Long-term debts
Loans from Sinopec Group Company
and fellow subsidiaries
Deferred tax liabilities
Other unallocated liabilities
Total liabilities
– 95 –
Segment capital expenditure is the total cost incurred during the year to acquire
segment assets that are expected to be used for more than one year.
Capital expenditure
Exploration and production
Refining
Marketing and distribution
Chemicals
Corporate and others
Depreciation, depletion and amortisation
Exploration and production
Refining
Marketing and distribution
Chemicals
Corporate and others
Impairment losses on long-lived assets
Exploration and production
Refining
Marketing and distribution
Chemicals
Corporate and others
– 96 –
2014
RMB million
2013
RMB million
80,196
27,957
26,989
15,850
3,648
105,311
26,064
29,486
19,189
5,076
154,640
185,126
48,902
15,015
12,491
12,130
1,559
44,126
13,859
11,127
10,757
1,396
90,097
81,265
2,436
29
40
1,106
8
2,523
88
35
—
3,619
2,661
15
The following tables set out information about the geographical information
of the Group’s external sales and the Group’s non-current assets, excluding
financial instruments and deferred tax assets. In presenting information on the
basis of geographical segments, segment revenue is based on the geographical
location of customers, and segment assets are based on the geographical
location of the assets.
Year ended 31 December
2014
2013
RMB million
RMB million
External sales
Mainland China
Others
Non-current assets
Mainland China
Others
12.6 Changes in the scope of consolidation.
□applicable √inapplicable
– 97 –
2,062,775
763,139
2,107,202
773,109
2,825,914
2,880,311
2014
31 December
RMB million
2013
31 December
RMB million
1,003,521
64,589
941,046
51,181
1,068,110
992,227
13. Repurchase, Sales and Redemption of Shares
During this reporting period, Yizheng Chemical repurchased and cancelled its shares
held by Sinopec Corp. pursuant to the Share Repurchase Agreement. Saved as disclosed
above, neither Sinopec Corp. nor any of its subsidiaries repurchased, sold or redeemed
any listed shares of Sinopec Corp. or its subsidiaries. For details of the transaction, please
refer to item 9.3 of the “this announcement”.
14. Mode Code for Securities Transactions by Directors
Each of the directors confirmed that he or she complied with the Model Code for
Securities and Transactions by Directors of Listed Companies as set out in Appendix 10
of the Hong Kong Listing Rules during the year ended 31 December 2014. In addition,
Sinopec Corp. formulated the “Rules Governing Shares Held by Company Directors,
Supervisors and Senior Managers and Changes in Shares” and the “Model Code of
Securities Transactions by Company Employees” to regulate the purchase and sale of
Sinopec Corp.’s securities by Sinopec employees.
15. Compliance with Corporate Governance Code
Based on its actual circumstances, Sinopec Corp. did not establish a Nomination
Committee of the Board according to section A.5 of the Corporate Governance Code and
Corporate Governance Report (“Corporate Governance Code”) as set out in Appendix
14 of the Hong Kong Listing Rules. Sinopec Corp. believed that the nomination and
election of director candidates by all members of the Board would be better suited to its
operations; the Board would perform the duties of the Nomination Committee prescribed
in the Corporate Governance Code.
Saved as disclosed above, Sinopec Corp. complied with all code provisions set out in the
Corporate Governance Code during the reporting period.
– 98 –
16. Review of Annual Results
The annual results for the year ended 31 December 2014 have been reviewed with no
disagreement by the Audit Committee of Sinopec Corp.
This announcement is published in both English and Chinese languages. In the event of any
inconsistency between the two versions, the Chinese version shall prevail.
By Order of the Board
China Petroleum & Chemical Corporation
Fu Chengyu
Chairman
Beijing, China, 20 March 2015
As of the date of this announcement, directors of the Company are: Fu Chengyu *, Wang Tianpu #, Zhang
Yaocang *, Li Chunguang #, Zhang Jianhua #, Wang Zhigang #, Cao Yaofeng *, Dai Houliang #, Liu Yun *, Chen
Xiaojin +, Ma Weihua +, Jiang Xiaoming +, Andrew Y. Yan + , Bao Guoming+.
#
Executive Director
* Non-executive Director
+
Independent Non-executive Director
– 99 –

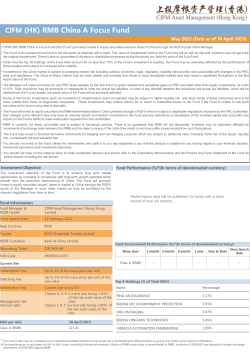


© Copyright 2026