
Interlinking: Performance Assessment of User Evaluation vs
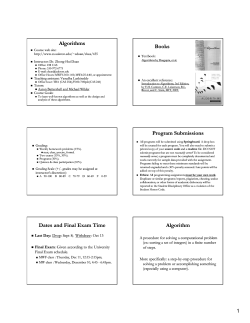
Interlinking: Performance Assessment of User Evaluation
vs. Supervised Learning Approaches
Mofeed Hassan
Jens Lehmann
Department of Computer
Science
AKSW Research Group
University of Leipzig
Department of Computer
Science
AKSW Research Group
University of Leipzig
[email protected]
[email protected]
ABSTRACT
Interlinking knowledge bases are widely recognized as an important, but challenging problem. A significant amount of
research has been undertaken to provide solutions to this
problem with varying degrees of automation and user involvement. In this paper, we present a two-staged experiment for the creation of gold standards that act as benchmarks for several interlinking algorithms. In the first stage
the gold standards are generated through manual validation
process highlighting the role of users. Using the gold standards obtained from this stage, we assess the performance
of human evaluators in addition to supervised interlinking
algorithms. We evaluate our approach on several data interlinking tasks with respect to precision, recall and F-measure.
Additionally we perform a qualitative analysis on the types
of errors made by humans and machines.
Categories and Subject Descriptors
H.4 [LINK Discovery]
General Terms
Data Integration,Enterprise Linked Data
Keywords
Interlinking, Links validation, Gold standard, Manual validation, Performance evaluation
1.
[email protected]
While several benchmarks have been made available to measure the performance of existing link discovery systems for
the Web of Data, several questions pertaining to this task
have remained unanswered so far such as:
INTRODUCTION
1. Costs of an annotation: The first question pertains
to the cost of link discovery. Determining how much
it actually costs (w.r.t. to time) to validate a link
between two knowledge bases, enable users to quantify
how long it will take them to generate clean links from
their knowledge base to other knowledge bases.
2. When should a tool be used : Human annotators are
able to detect links between knowledge bases at a small
scale. On the other hand, machines need a significant
number of examples and clear patterns in the underlying data to be able to detect high-quality links between
knowledge bases. Hence, determining the knowledge
base sizes on which machines should be used for link
discovery is of utmost practical importance.
http://stats.lod2.eu
Copyright is held by the author/owner(s).
WWW2015 Workshop: Linked Data on the Web (LDOW2015).
Department of Computer
Science
AKSW Research Group
University of Leipzig
number of knowledge bases, the links among them are relatively few with more than 500 million 2 in 2011 and they
have very different qualities [8]. Creating high-quality links
across the knowledge bases on the Web of Data thus remains a task of central importance to empower manifold
application on the Web of Data, including federated query
processing and cross-ontology question answering. Many algorithms have been proposed and implemented in different
interlinking tools to address this task [17, 20, 12, 13]. While
these approaches vary w.r.t. several aspects, one of the most
important aspects is the degree of user involvement. In [20,
16] interlinking tools are categorized based on the degree of
automation that regulates the amount of user involvement
at different levels [17]. In general, the most costly aspect of
user involvement in interlinking is the validation of links,
also dubbed manual link validation. This is the process
where a user, i.e. a validator or evaluator, specifies whether
a link generated by an interlinking tool is correct or incorrect. In frameworks which implement active batch learning
to determine links (for example LIMES [9] and SILK [3]),
the results of the link validation process are reused to learn
presumably better link specifications and thus to generate
high-quality links.
Over the last years, the number of knowledge bases published on the Web of Data has grown considerably. According to statistics performed in the beginning of 2015, the
number of published knowledge bases surpassed 3800 providing over than 88 billion triples1 . In spite of the large
1
Axel-Cyrille Ngonga
Ngomo
2
http://lod-cloud.net/state/
3. Performance of machine-learning of small tasks: While
it is well established that machine-learning tools perform well on knowledge bases that contain hundreds
of resources or more, many of the knowledge bases
on the Web of Data are small and pertain to a dedicated domain. Providing guidelines towards when to
use machine-learning algorithms to link these knowledge bases to other knowledge bases can improve the
effectiveness of linking on the Web of Data.
Consequently, we propose an experiment to investigate the
effect of user intervention in dataset interlinking on small
knowledge bases. We study the effort needed for manual
validation using a quantitative approach. Furthermore, we
compare the performance of a human validator and supervised interlinking approaches to find a break-even point where
machine-learning techniques should be used. Note that we
intentionally limit ourselves to small numbers of resources
in our experiments as (1) experiments on large number of
resources have already established that machines perform
well and (2) such experiments would be intractable for human users due to long time and great effort.
The core contributions of the paper are:
• An evaluation of the performance of human evaluators
on the interlinking task.
• A comparison of human and machine performance on
the interlinking task for small knowledge bases.
• A methodology for designing and executing such experiments.
• A gold standard for three small interlinking tasks.
The rest of our paper is organized as follows. In section 2,
a short overview about interlinking approaches is provided.
Section 3 is a description of the experimental approach. The
experiment setup and preparation is described in section
4. In section 5, the results of our experiment are shown.
A discussion about the results in section 6 is followed by
related work summarized in section 7. Finally in section 8
the conclusion and future work are presented.
2. BACKGROUND
2.1 Interlinking Tool
Due to the highly increase of published datasets on the web
and the rising number of interlinks required among them,
many interlinking tools are proposed based on different algorithms. Some surveys provided comparative studies about
these tools showing the major differences among them[20,
16]. Interlinking tools differ in many aspects. Two of these
aspects are (i)domain dependency and (ii) Automation.
By the aspect domain dependency, the interlinking tool is
classified as domain-dependent when it works on interlinking
between two datasets in specific domain. With the Automation perspective, the interlinking tools are categorized into
(a) Automated tools and (b)Semi-automated tools based on
the degree of user’s contribution in the interlinking process.
In the semi-automated tools User intervention is important
for the linking process in different views, such as setting
the link specifications, ontology alignment, providing positive and negative examples for tools based on supervised
learning algorithms and validating the final generated links.
One of the interlinking tools is RKB-CRS[7]. It is a domaindependent tool. It focuses on universities and publications
domains. RKB-CRS is a semi-automated tool where its process depends on providing URIs using a Java program developed by the user. This is performed according to each
dataset to be interlinked. The tool applies string matching
technique to find URIs equivalences that can be represented
as an owl:sameAs relationship.
Another domain-dependent tool is LD-Mapper[15]. It focuses on datasets in the music domain. It provides an approach that depends on string similarity and also considers
the neighbour similarity to the resources.
Knofuss[14] is an automatic and domain-independent tools
that focuses on merging two datasets where each is described
by an ontology. An alignment ontology is also given by the
user in case of ontology heterogeneity. The tool has two
contexts: (i) application context which is provided by the
datasets’ ontology and (ii) object context model that points
out what properties are needed for the matching process.
Matching is performed through string matching and adaptive learning techniques. Knofuss operates on local copies of
the datasets.
An example of a semi-automated tool that works on datasets
local copies is RDF-AI[18]. It consists of five linking phases.
These phases are (i) preprocessing, (ii) matching, (iii) fusion,
(iv) interlinking and (v) post-processing and each phase is
described by a XML file. The input includes the alignment
method and the dataset structure. The utilized matching
techniques are string matching and word relation matching.
RDF-AI provides a merged dataset or an entity correspondence list as an output.
SILK[3] is a semi-automated tool and it is a domain independent. Unlike the aforementioned tools, it works on
the datasets through SPARQL endpoint. The user specifies the linking process parameters using a declarative language dubbed Silk Link Specification Language (Silk-SLS).
Using Silk-SLS allows the user to focus on specific type of resources. It supports the use of different matching techniques
such as string matching, date similarities and numerical similarities. Set operators like MAX, AVG and MIN combines
more than one similarity metric. Links are generated if two
resources similarity exceeds a previously specified threshold.
LIMES[9] is an interlinking tool belonging to the same category as SILK by being semi-automated and domain independent. It works as a framework for multiple interlinking
algorithms either unsupervised or supervised learning algorithms. For the unsupervised algorithm the user provides
linking specifications. The Linking specifications provide
the set classes, properties and metrics to make interlinking. On the other hand, different supervised algorithms are
implemented by applying genetic learning combined with active learning approaches. The target of these algorithms is
finding the best classification of candidate links using the
minimum number of training data. Minimizing the training data is performed through finding the most informative
data reviewed (labelled) by an oracle. Examples of these
algorithms are EAGLE, RAVEN, COALA and EUCLID[11,
12, 13].
RAVEN and EAGLE[10, 11] are two interlinking algorithms
that depend on active learning and genetic programming
methods with supervised algorithms. As the authors stated,
These algorithms implement Time-efficient matching techniques to reduce number of comparisons between instances
pairs. COALA[12] is combined with EAGLE to consider the
intra and inter correlation between learning examples to the
learning algorithm.
the few observational studies about users interactions with
one of the linking process phases. The study focuses on the
cognitive process performed by the users to find mappings.
According to our knowledge there is no such observational
study about the problems face users during validating datasets
interlinks and no quantifying experiment to measure the effort done by the users in validating links and generating gold
standards.
3.
LIMES was used in our work due to different reasons. One
reason is its simplicity. It uses a simple configuration file
to perform interlinking by any of the contained algorithms.
It supports working on SPARQL or dump-files. The implemented algorithms are another strength point in LIMES as
it supported our work with different interlinking algorithm
in the same pool. Three algorithms EAGLE, COALA and
EUCLID are used in our work and dubbed as Genetic Active
Learning (GAL), Genetic Active Learning with Correlation
(GCAL) and Genetic Batch Learning (GBL), respectively.
2.2
Manual Links Validation
Validating the generated links gives two beneficial outputs.
First, it provides positive and negative examples for supervised learning algorithms. Second, it creates gold standards
to be used for tools and reviewers assessments of other similar linking tasks. LATC 3 is one of the efforts in generating
reviewed links samples to achieve the previously mentioned
two benefits.
In [6] the authors stated that there is a need for more work on
generating benchmarks for interlinking algorithms. A summary of different benchmarking approaches is provided with
exposing their strengths and weaknesses. One of these approaches is Ontology Alignment Evaluation Initiative (OAEI).
It provides two tracks for evaluating ontology matching algorithms and instance matching algorithms. This is done
by using common benchmarks in the evaluations. Other
approaches rendered benchmarks are Yatskevich et al.[21],
Alexe et al.[1], and SWING[6]. According to [4] three basic
points form the criticisms of many generated benchmarks.
These points are:
• Using real data
• Benchmarks generation flexibility
• Scalability and correctness
Recently crowdsourcing role has increased in links validations and gold standard generation. Crowdsourcing is a
new trend for users involvement in different publishing and
linking data phases. In[19] an analytical research about interlinking and user intervention is presented. It gave an
analysis about what phases in the interlinking process can
be amenable to crowdsourcing. A general architecture was
proposed to integrate interlinking frameworks with crowdsourcing (Amazon Mechanical Turk-MTurk) to enhance interlinking process including links validation.
In [5] a case-study was introduced to find out the problems
that the users face in ontology matching. This study is one of
3
http://latc-project.eu/
EXPERIMENTAL APPROACH
Based on the motivations explained formerly, we designed a
two-stage experiment. The first stage consists of two steps.
The first step is performing interlinking between different
datasets using the unsupervised learning algorithm. These
datasets represent different domains. In the second step, the
resulting links are manually validated by human validators.
The validators will do this step first individually then in a
group, where unsure decisions about links are reviewed by
all validators. The resulting links are then considered to be
a gold standard for their interlinking tasks. Later, we will
discuss about problems in manual link validation of single
evaluators and groups.
In the second stage, different supervised algorithms are applied on the same interlinking tasks. Using the gold standard generated from the first stage of the experiment as a
benchmark, the performance of the used approaches can be
compared to each other and to humans.
In our evaluation we use real data for generating benchmarks. They are generated from actual data forming three
interlinking tasks in different domains. Size limitation was
forced to ease the validation process. We use this benchmark to evaluate different interlinking algorithms in terms
of precision, recall , and F-Measure as assessment measurements[2].
An additional qualitative analysis is performed to detect the
common problems faced by humans during the links validation process. This analysis focuses on the problems reported
by the validators which affects their judgement quality and
the process difficulty.
4.
EXPERIMENTAL SETUP
In our experiment, we applied linking on six different datasets
using LIMES[9]. These datasets represent three different
linking tasks. Each task corresponds to specific domain that
differs in nature from the other tasks and varies in familiarity to the reviewers. This will affect the reviewers’ decisions
correctness and effort in different ways. These tasks are:
• Task 1 represents the geographic domain. In this domain, the basic informative information are specific
as many locations are described by specific geometry
measures.
In this task, links between the DBpedia and LinkedGeoData datasets needed to be set. Both datasets contain geographic information, for example latitude and
longitude, for locations such as cities, states, and countries. We restricted our linking to be between cities
where their labels started with letter ’A’. The confining of the labels was made for getting a reasonable
number of links for evaluators in the first stage of our
experiment and to simplify calculations in the second
stage. This provides also a random sample of interlinks with the ability to tune the retrieved number of
online instances.
The Label, latitude, and longitude properties are selected to apply similarity metrics on them. Similarity
metrics used are Trigrams and Euclidean in a compound function. The compound function combines
atomic metrics such as Trigrams, Euclidean and Levenstein using metric operators such as MIN or MAX.
Table 2 shows the basic information in this linking task
where ’a’ represents ’rdf:type’ property.
Datasets
Restrictions
Similarity
Properties
Similarity
Metrics
DBpedia
a dbpedia-owl:City
LinkedGeoData
a lgdo:City
rdfs:label
starts with ’A’
rdfs:label
rdfs:label
wgs84:lat
wgs84:long
wgs84:lat
wgs84:long
trigrams
euclidean
Table 1: Link specification for task 1
• Task 2 represents the movies domain. This domain
is very interesting as it has some tricky information
of the movies such as the name of the movie. In a
movie’s series,it can be confusing for the validator to
give a decision as the names of these movies are close
to each other, having the same actors and even the
same director. This needs additional information such
as the movie’s date, which is not always available.
In the second task, we performed linking on DBpedia and LinkedMDB datasets that contain information
concerning movies. Both have large amounts of information on movies like their names, directors, release
date etc. The triples are restricted to represent movies
with release dates beginning from the year 1990. This
provides a reasonable number of links.
The similarity function applied for linking is a compound function of Trigrams metric. This function uses
properties such as label, director and release date. Table 2 shows the basic information in this linking task
where ’a’ represents ’rdf:type’ property.
Datasets
Restrictions
>”1990-01-01”
Similarity
Properties
Similarity
Metrics
DBpedia
a dbpedia-owl:Film
The third task generated links between DBpedia and
Drugbank datasets. We selected drugs with names
starting with letter ’A’. Further a compound similarity
function is used involving the Levenshtein similarity
metric. This function utilizes property label. Table 3
shows the basic information in this linking task where
’a’ represents ’rdf:type’ property.
LinkedMDB
a linkedmdb:film
initial release date
label
label
director
releaseDate
director
initial release date
trigrams
Table 2: Link specification for task 2
• Task 3 represents the drugs domain. Reviewers have
to check chemical and medical information for drugs.
Datasets
Restrictions
DBpedia
a dbpedia-owl:Drug
DrugsBank
a drug:drugs
rdfs:label
starts with ’A’
Similarity
Properties
rdfs:label
rdfs:label
rdfs:label
rdfs:label
rdfs:label
drug:genericName
Similarity
Metrics
levenshtein
Table 3: Link specification for task 3
The aim of the second stage is to investigate whether using machine learning approaches for linking can outperform
humans. Our experiment achieves this aim by using three
different supervised learning algorithms EAGLE, COALA
and EUCLID [11, 12, 13]. The three algorithms are all implemented in the LIMES framework [9]. The interlinking
approaches are given different percentage of positive and
negative examples for each single task. The examples are
provided in an increasing percentages 10%,33% and 50% of
the total examples resulting from the first stage for each
task. As these examples play the role of oracle in the supervised learning approaches, the increasing percentages should
enhance the algorithm performance and converge against a
score either above or somewhat close to single human performance. The three approaches function on the same specifications of the tasks in the first stage and also on the same
datasets.
Links evaluation is done by using an evaluation tool with a
graphical user interface dubbed Evalink(see Figure 1). The
reviewer specifies the endpoints where the source and target links triples are available. It enables the evaluators to
load the links to be reviewed and retrieves their properties
information from the specified endpoints. The reviewer can
check the correlated properties values and give a decision
either ‘Correct‘, ‘Incorrect‘ or ‘Unsure‘. The spanned time
for taking a decision is stored in milliseconds. The source
code is available in ”https://github.com/AKSW/Evalink”.
5.
RESULTS
Based on the previously described specifications, the experiment was carried out in two stages. The first stage aims to
generate a gold standard for each task. A set of five independent reviewers evaluated the links generated such that each
gold standard was provided based on minimum four out of
five agreement on a decision for each link. In order to express the total effort needed by a reviewer to provide a gold
standard, we considered the time for deciding if a link as
correct or incorrect as a measure. This time is measured in
milliseconds. In the experiment, the average times for each
task to be evaluated by the users are as follows: 18773764
milliseconds for task 1; 16628607 milliseconds for task 2; and
user
user
user
user
user
1
2
3
4
5
Correct
496
492
481
487
481
Incorrect
6
10
21
15
21
Total
502
502
502
502
502
Table 6: Users evaluations assessment of total evaluation
Figure 1: Evalink tool to evaluate links
The user selects the task to be evaluated and specifies the proper
endpoints to access the triples. The URIs of the task are loaded
sequentially with displaying their retrieved information. By
selecting a property in source dataset, the corresponding property is
highlighted in the target datasets’ side. By pressing the proper
button the decision of the link is specified either
”Correct”,”Incorrect”, or ”Unsure”.
18777477 milliseconds for task 3, which are shown in table 4
. Overall, approximately 15 hours of evaluation effort have
gone into our experiment per participant.
Average time
Task 1
18773764
Task 2
16628607
Task 3
18777477
Table 4: Average times of the evaluation processes
for each task (in milliseconds)
The second stage of our experiment was performing linking between the specified datasets using different supervised
learning algorithms and assessing their performance against
the generated gold standards in terms of precision, recall
and F-measure. LIMES[9] is an interlinking tool that is also
a framework with different implemented interlinking algorithms with different learning approaches. EAGLE, COALA
and EUCLID are used to provide set of interlinks that are
compared to the gold standard as aforementioned. The resulting comparisons are demonstrated in tables 8,9 and 10
in terms of Precision.
The cost to achieve a specific F-Measure w.r.t. the percentage of the training data is calculated in terms of time. Using
the average times to validate a link in each task, the times
for different percentages are calculated. Figures 2, 3 and 4
plot F-Measure corresponding to afforded costs in minutes
for the three tasks. The figures show the overall supremacy
of GCAL over other approaches and even over the human
performance. GBL has the worst behaviour among the supervised learning approaches. Task 3 was the least costly
one which is self explained by the high F-Measure values
achieved for all algorithms.
A more detailed way to express the provided effort by a user
is the average time for a single link to be evaluated by a
user in a single task. Table 5 shows the performed average
times in each task. It is evident that there are significant
differences between users and that overall the evaluation of
a large number of links is a time consuming process.
1
2
3
4
5
task 2
22974
18821
39363
11329
43811
task 3
10223
20358
9802
34553
44664
GAL
GCAL
GBL
Human
0.8
F − M easure
user
user
user
user
user
task 1
36803
21465
12299
10922
38853
1
0.6
0.4
0.2
Table 5: Average times for evaluating a single link
within a task by each user(in milliseconds)
0
An assessment of the links evaluation performed by users
was achieved. Out of 535 links, 502 links had certain, may be
different, decisions made by each single user. 32 links did not
have enough information to reach a decision and marked as
unsure links. Gold standards are created by giving each link
a final decision using inter-rater agreement. The assessment
was done by comparing each user’s evaluation for each task
to the gold standard. Small number of decisions made by
users were incorrect compared to the gold standard. Details
of the assessment are described in table 6 and table 7.
0
10
20
30
40
50
Cost(M in.)
Figure 2: F-Measure results relative to the learning
cost of each approach in terms of time(Task 1)
6.
DISCUSSION
Our discussion of the experiment is divided into two parts.
The first part concerns the users evaluations results and
Tasks
Measures
User 1
User 2
User 3
User 4
User 5
Precision
0.81
0.83
0.74
0.81
0.82
Task 1
Recall
0.98
1
0.9
0.98
0.99
F-Measure
0.89
0.91
0.81
0.88
0.9
Precision
0.98
0.93
0.97
0.95
0.91
Task 2
Recall
1
0.94
0.98
0.97
0.93
F-Measure
0.99
0.93
0.98
0.96
0.92
Precision
0.97
0.96
0.94
0.93
0.91
Task 3
Recall
0.99
0.98
0.96
0.95
0.93
F-Measure
0.98
0.97
0.95
0.94
0.92
Table 7: Precision, Recall and F-Measure results achieved by every user in each task.
Tasks
percentages
GAL
GCAL
GBL
10%
0.12
0.81
0.04
Task 1
33%
0.32
0.76
0.77
50%
0.8
0.8
0.4
10%
0.63
0.69
0.8
Task 2
33%
0.33
0.27
0.007
50%
0.32
0.056
0.047
10%
0.078
0.88
0.13
Task 3
33%
0.47
0.54
0.29
50%
0.79
0.88
0.29
Table 8: Precision results of supervised learning approaches
Supervised learning approaches include: GAL, GCAL and GBL. For each, its performance
is measured relevant to different percentages of training data 10%, 33% and 50%.
Tasks
percentages
GAL
GCAL
GBL
10%
0.398
0.35
0.24
Task 1
33%
0.35
0.29
0.27
50%
0.35
0.37
0.18
10%
0.28
0.19
0.07
Task 2
33%
0.71
0.82
0.43
50%
0.92
0.85
0.79
10%
0.17
0.23
0.43
Task 3
33%
0.5
0.53
0.74
50%
0.53
0.69
0.98
Table 9: Recalls results of supervised learning approaches.
Supervised learning approaches include: GAL, GCAL and GBL. For each, its performance
is measured relevant to different percentages of training data 10%, 33% and 50%.
Tasks
percentages
GAL
GCAL
GBL
10%
0.4
0.49
0.1
Task 1
33%
0.3
0.43
0.4
50%
0.5
0.5
0.2
10%
0.4
0.31
0.1
Task 2
33%
0.4
0.4
0
50%
0.5
0.1
0.1
10%
0.1
0.37
0.2
Task 3
33%
0.5
0.53
0.4
50%
0.6
0.78
0.5
Table 10: F-Measure results of supervised learning approaches.
Supervised learning approaches include: GAL, GCAL and GBL. For each, its performance
is measured relevant to different percentages of training data 10%, 33% and 50%.
1
0.6
0.4
0.2
0
GAL
GCAL
GBL
Human
0.8
F − M easure
0.8
F − M easure
1
GAL
GCAL
GBL
Human
0.6
0.4
0.2
0
10
20
30
40
50
Cost(M in.)
0
0
10
20
30
40
50
60
Cost(M in.)
Figure 3: F-Measure results relative to the learning
cost of each approach in terms of time(Task 2)
Figure 4: F-Measure results relative to the learning
cost of each approach in terms of time(Task 3)
observations. The second part analyzes the learning algorithm’s performances.
ficulties might rise from unfamiliar domain evaluation to
users. Information concerning the resource was in some
cases either ambiguous and, thus, not allowing for a decision to be made and in other cases too much information was available that confused the users. As an example
from drugs domain a URI <http://wifo5-04.informatik.unimannheim.de/drugbank/resource/drugs/DB00363> had plenty
of information such as secondaryAccessionNumber and predictedWaterSolubility which are non crucial for the decision
making process. Both cases caused significant time delays
for a subset of the judgements which were made. Filtering
the suitable information to avoid unnecessary properties and
providing crucial ones will provide great value to the evaluation process in terms of time and decision correctness. With
missed information, it is important to create a measure of
confidence for the decisions. Building up strategies for information integration with other related datasets to cover
the absent of information can help in this case too. Measuring the time to generate gold standards for each task(table
4and table 6), we find that there were no significant differences among the average times of all tasks. This shows how
links validation is improved by the availability and clarity of
important properties identifying the linking process to the
validators. This indicates that with trivial domain knowledge and appropriate properties to compare, the users perform evaluation with F-Measure above 0.8 (table 7). In these
tables we can see how almost all the user’s perform with reasonable high values of F-Measure in all tasks. The achieved
F-Measure scores range from 0.81 to 0.99. These ratios will
be used in comparison between the user performance and
machine (algorithm) performance.
The user evaluation aims to generate links as a gold standard
to be used as a benchmark for link evaluators and interlinking algorithms. Many observations are recorded while users
perform the evaluations, which enable us to inspect the major factors that influence the evaluation process. These factors include: (i)entity description availability which includes
endpoints availability and the amount of available information,(ii)domain familiarity and (iii)information ambiguity.
Endpoints availability, occasionally, was problematic. As
the evaluation process required querying the endpoints for
the triples information, having the endpoints down and not
working consumed more time. This imposed the need to
cache the appropriate data which creates an overhead. This
overhead was reasonable for these small datasets but it will
increase in case of large datasets. Still having active endpoint is necessary due to the continues information updating.
Once the information are available, the second point concerning their sizes comes in focus. Although the number
of links and the their related information were relatively
small,the manual evaluation was very tedious and exhausting for the users. Supporting the evaluation by using Evalink
tool overcame the unnecessary efforts like loading the links
information and aligning them. It also put the whole evaluation effort on the time of making a decision by the user.
The manual setting of Evalink generated more settings effort
which should be further extended for intelligent properties
mapping.
The help given by Evalink had its effect on the domain familiarity too. With the suitable evaluation tool that maps
the related properties between two datasets, the domain familiarity was not affecting the evaluation. Finding the right
properties and comparing their values diminished the dif-
The results of the second stage are represented in figures
2, 3 and 4. We can see that, in most cases, machine learning algorithms outperform the human in terms of F-Measure
when considering the cost to provide the training set. GAL,
in tasks 1 and 3, has better performance compared to a human up to 50% of the gold standard as training data. On
the other side, in task 2 although it achieved better results
than an average human but for lower costs the F-Measure
is almost stable around 0.4, so increasing the labelling effort
for training data provided no significant improvement. Even
in those cases where it improved with more training data,
its ultimate performance fell short of human performance
in the long run. GCAL and GBL both recorded increasing results with task 1 and task 3 with more training data,
while performing worst in task 2. GAL and GBL perform
learning by using a portion of the data space. If this portion is a good representative of the data distribution, the
performance increases. GCAL considers the correlation between training data examples. It classifies the training data
based on the inter- and intra correlation which is calculated
based on similarities between the training data examples.
We conclude from the results for the three tasks that the
links of task 1 and task 3, which formed the training data,
are good representatives of the datasets for geographic and
drugs data while links of task 2 are randomly distributed and
apparently not good representatives of the movies task. We
can further infer that with small datasets, machine learning
algorithms are outperforming humans in case of well representative training data being available. If that is not the
case, humans perform better in the long run.
7.
CONCLUSION
In our experiment, we emphasized on the factors affecting
the evaluators in their linking evaluations. These factors
include: (i)endpoints availability, (ii) amount of available
information,(iii)domain familiarity and (iv)information ambiguity. We quantitatively determined the human effort required for interlinking in terms of time for different datasets.
The experiment showed how much training data is sufficient
to act as a representative of the interlinked datasets. It
also revealed experimentally that for small datasets, how
much training data, which is a sufficient representative of
the dataset, can affect the machine learning approaches to
the degree that humans exceed its accuracy.
8.
REFERENCES
[1] B. Alexe, W. C. Tan, and Y. Velegrakis. Stbenchmark:
towards a benchmark for mapping systems. PVLDB,
1(1):230–244, 2008.
[2] S. Araujo, J. Hidders, D. Schwabe, and A. P. de Vries.
Serimi - resource description similarity, rdf instance
matching and interlinking. CoRR, abs/1107.1104,
2011.
[3] C. Bizer, J. Volz, G. Kobilarov, and M. Gaedke. Silk a link discovery framework for the web of data. In
18th International World Wide Web Conference, April
2009.
[4] J. Euzenat, M.-E. Rosoiu, and C. T. dos Santos.
Ontology matching benchmarks: Generation, stability,
and discriminability. J. Web Sem., 21:30–48, 2013.
[5] S. Falconer and M.-A. Storey. A cognitive support
framework for ontology mapping. pages 114–127. 2008.
[6] A. Ferrara, S. Montanelli, J. Noessner, and
H. Stuckenschmidt. Benchmarking matching
applications on the semantic web. In ESWC (2), pages
108–122, 2011.
[7] A. Jaffri, H. Glaser, and I. Millard. Managing uri
synonymity to enable consistent reference on the
semantic web. http://eprints.ecs.soton.ac.uk/15614/,
2008.
[8] M. Nentwig, T. Soru, A.-C. N. Ngomo, and E. Rahm.
Linklion: A link repository for the web of data.
[9] A.-C. Ngonga Ngomo and S. Auer. LIMES - a
time-efficient approach for large-scale link discovery on
the web of data. In Proceedings of IJCAI, 2011.
[10] A.-C. Ngonga Ngomo, J. Lehmann, S. Auer, and
K. H¨
offner. RAVEN – active learning of link
specifications. Technical report, 2012.
[11] A.-C. Ngonga Ngomo and K. Lyko. EAGLE: Efficient
active learning of link specifications using genetic
programming. In Proceedings of ESWC, 2012.
[12] A.-C. Ngonga Ngomo, K. Lyko, and V. Christen.
COALA – correlation-aware active learning of link
specifications. In Proceedings of ESWC, 2013.
[13] A. Nikolov, M. D’Aquin, and E. Motta. Unsupervised
learning of data linking configuration. In Proceedings
of ESWC, 2012.
[14] A. Nikolov, V. S. Uren, E. Motta, and A. N. D. Roeck.
Handling instance coreferencing in the knofuss
architecture. In P. Bouquet, H. Halpin, H. Stoermer,
and G. Tummarello, editors, IRSW, volume 422 of
CEUR Workshop Proceedings. CEUR-WS.org, 2008.
[15] Y. Raimond, C. Sutton, and M. Sandler. Automatic
interlinking of music datasets on the semantic web.
2008.
[16] F. Scharffe and J. Euzenat. Melinda: an interlinking
framework for the web of data, 2011.
[17] F. Scharffe, Z. Fan, A. Ferrara, H. Khrouf, and
A. Nikolov. Methods for automated dataset
interlinking. Technical Report 4.1, Datalift, 2011.
[18] F. Scharffe, Y. Liu, and C. Zhou. Rdf-ai: an
architecture for rdf datasets matching, fusion and
interlink. In Proc. IJCAI 2009 workshop on Identity,
reference, and knowledge representation (IR-KR),
Pasadena (CA US), 2009.
[19] E. Simperl, S. W¨
olger, S. Thaler, B. Norton, and
T. B¨
urger. Combining human and computation
intelligence: the case of data interlinking tools.
IJMSO, 7(2):77–92, 2012.
[20] S. Wolger, K. Siorapes, T. B¨
urger, E. Simperl,
S. Thaler, and C. Hofer. A survey on data interlinking
methods. or Interlinking data approaches and tools.
Technical Report MSU-CSE-00-2, Semantic
Technology Insttue (STI), February 2011.
[21] M. Yatskevich, F. Giunchiglia, and P. Avesani. A large
scale dataset for the evaluation of matching systems.
Technical report, DISI, University of Trento, 2006.


© Copyright 2026