
2000 Citrus and Deciduous Fruit and Nut Research Report Editors
2000 Citrus and Deciduous Fruit
and Nut Research Report
Editors:
Glenn Wright and Mike Kilby
Table of Contents
Citrus
1. Insecticide Rotation and Pre-Petal Fall Applications for Citrus Thrips
Management
2. Residual Activity of Insecticides to Citrus Thrips on Lemon Foliage
3. Protective and Yield Enhancement Qualities of Kaolin on Lemons
4. Tank Mixing Success for Citrus Thrips Control is Not Necessary
5. Effect of Temperature and Moisture on Survival of Phytophthora in Citrus
Grove Soil
6. Effect of Foliar Boron Sprays on Yield and Fruit Quality of Navel
Oranges in 1998 and 1999
7. Development of Best Management Practices for Fertigation of Young
Citrus Trees
8. Girdling "Fairchild" Mandarins and "Lisbon" Lemons to Improve Fruit
Size
9. Results of Scion and Rootstock Trials for Citrus in Arizona -- 1999
10. Use of a Slow Release Triazone-Based Nitrogen Fertilizer on Lemon Trees
Fruit and Nuts
11. Evaluation of Temik (aldicarb) for the Control of the Pecan Aphid
Complex for Pecans Grown in Arizona
12. Effect of Powdery Mildew on Pecan Nut Weight and Quality
13. Pecan Variety Study on the Safford Agricultural Center
14. Fungicidal Performance in Managing Septoria Leaf Spot of Pistacho in
Arizona
15. Performance of Mature Pecan Varieties in the Low Desert of Pinal County
1997-1999
16. Population Dynamics of Pecan Aphids and Their Green Lacewing
Predators in Insecticide-Free Pecans
17. Improvement of "Flame Seedless" Grape Coloration at Harvest as
Influenced by Trunk Girdling
This is a part of publication AZ1178: "2000 Citrus and Deciduous Fruit and Nut Research Report,"
College of Agriculture and Life Sciences, The University of Arizona, Tucson, Arizona, 85721.
Any products, services, or organizations that are mentioned, shown, or indirectly implied in this
publication do not imply endorsement by The University of Arizona. The University is an Equal
Opportunity/Affirmative Action Employer.
Insecticide Rotation and Pre-Petal Fall Applications for
Citrus Thrips Management1
David L. Kerns and Tony Tellez
Abstract
Under low citrus thrips pressure and cool temperatures, Alert, Baythroid, Carzol,
Success and Acetamiprid applied at petal fall were all effective control agents.
Mid-season applications of Baythroid and Danitol were also effective but appeared
to be slightly inferior to Success and Alert in residual control. Despite the prolonged
blooming and petal drop period experienced during this trial, plots receiving
pre-petal fall applications of Acetamiprid did not produce higher quality fruit than
treatments where applications began following petal fall. The fact that thrips
densities were low during this period may be the reason. Before pre-petal fall
insecticide applications can be deemed useful and economically justifiable,
evaluations must be made at higher thrips infestation levels.
Introduction
Although citrus thrips, Scirtothrips citri (Moulton), are considered an economically damaging pest of mature citrus only
after petal fall, under certain conditions control may be advisable prior to petal fall. During years with warm
temperatures in January and February, lemons will sometimes bloom early and over an extended period of 3 to 4 weeks.
During this time, although petal fall (>75% petal drop) hasn’t completed, there are many susceptible fruit present, and
due to the presence of honeybees, insecticide use is greatly restricted. Whether of not treating under these conditions is
economically beneficial is questionable, but should be investigated. Furthermore we need to identify efficacious
insecticides that are safe towards bees for use during this window. Acetamiprid may fit this role. Acetamiprid (RhonePoulenc) is considered safe towards honeybees and has demonstrated thrips activity, but only early in the season when
temperatures are moderate. In this study we report the activity of Acetamiprid toward citrus thrips pre-petal fall and at
petal fall. We also report efficacy of a variety of insecticides to citrus thrips in several rotation regimes.
Materials and Methods
Eleven-year old ‘Limoneira 8A Lisbon’ lemon trees grown on the Yuma Mesa were used in these studies. The test was
a randomized complete block design consisting of four replicates. Each plot consisted of three trees in a row spaced
about 30 ft apart. Treatments included eight insecticide regimes and an untreated check (rates and treatments provided
in Tables 1 and 2. Treatments were applied on an as needed basis, when the number of fruit infested with immature
citrus thrips was ≥10%. Applications were made using a backpack air-blast sprayer calibrated to deliver 100 gal/acre.
Percent-infested fruit were estimated by sampling ten fruit per tree for the presence or absence of immature citrus thrips.
Fruit damage was estimated on 19 Aug, by rating the degree of scarring to the rind. Scarring was rated as 1=no
1
The authors wish to thank the Arizona Citrus Research Council for financial support for this project. This is a portion
of the final report for project 99-09 ‘Susceptibility of Lemons to Citrus Thrips Scarring Based on Fruit Size and
Residual Activity of Insecticides for Citrus Thrips Control in Arizona Lemons’.
This is a part of publication az1178: "2000 Citrus and Deciduous Fruit and Nut Research Report," College of
Agriculture and Life Sciences, the University of Arizona, Tucson, Arizona, 85721.
scarring, 2=slight scarring around the stem, 3=significant scarring around the stem, 4=slight scarring on the side of the
fruit and 5=major scarring on the side of the fruit. Fruit with a damage rating of 2, are not considered to be scarred
heavy enough to cause a downgrade in quality. Fruit with a 3 damage rating, are considered slightly scarred and subject
to downgrading to choice, while fruit with damage ratings of 4 or 5 are graded as juice. Differences among insecticide
treatments for thrips infestation and fruit grade were separated using ANOVA and an F protected LSD, P<0.05.
Results and Discussion
Environmental conditions in 1999 were conducive for an extended bloom and petal drop period. Petal drop and fruit set
began in late March but due to cool temperatures in late March and April, petal fall did not occur until mid to late April.
To protect the early fruit set, Acetamiprid was applied on 25 March. However this application did not appear to provide
adequate control based on a 10% infestation threshold, and another treatment was applied on 9 April (Table 1). The
reason for this lack of control is not certain. Although this test received approximately 1 inch of precipitation on 2 April,
this was probably not the reason for the lack on control with Acetamiprid detected on 5 April (11 DAT, Days after
treatment). Acetamiprid is toxic to citrus thrips for only a few days following application and under conditions where
thrips eggs are hatching asynchronously, thrips hatching after the application may not be controlled. A follow-up
application of Acetamiprid on 9 April effectively controlled the thrips (Table 1).
Insecticides scheduled to be sprayed following petal fall were applied on 20 April (Table 1). All the treatments were
highly effective, and did not require another application until 14 May (Table 2). Following this application Success and
Alert provided effective control and did not require any more applications (Table 2). Baythroid appeared slightly
weaker than Success and Alert by 11 DAT, but never exceeded the 10% infestation threshold for the remainder of the
season. The effectiveness of Danitol was similar to Baythroid, but for an unknown reason had one tree in one plot on
which thrips were not controlled. This resulted this treatment exceeding the action threshold and requiring a follow up
application of Success on 26 May (Table 2).
Based on fruit scarring damage ratings, all of the insecticide treatment regimes outperformed the untreated, and
produced equivalent percentages of fancy, choice and juice fruits (Table 2). Under the conditions experienced in this
trial, the advantages of using Acetamiprid pre-petal fall were not apparent. Despite the prolonged blooming and petal
drop period experienced during this trial, plots receiving pre-petal fall applications of Acetamiprid did not produce
higher quality fruit than treatments where applications began following petal fall. The fact that thrips densities were low
during this period may be the reason. Before pre-petal fall insecticide applications can be deemed useful and
economically justifiable, evaluations must be made at higher pre-petal fall thrips infestation levels. Additional, the 10%
infestation threshold used in this study may be to low and may need to be modified for triggering pre-petal fall
applications.
Table 1. Percentage of fruit infested with immature citrus thrips on lemons following applications 1, 2 and 3.
Applications and mean percentage fruit infested with immature citrus thrips (CT)
25 Mar
5 Apr
11 DAT
9 Apr
15 Apr
6 DAT
20 Apr
27 Apr
7 DAT
6 May
16 DAT
13 May
23 DAT
Applications
#1
CT
(79.2°F)c
Applications
#2
CT
(75.7°F)
Application
#3
CT
(85.9°F)
CT
(83.7°F)
CT
(86.5°F)
1.
Untreated
18.83 a
Untreated
15.00 a
Untreated
7.50 a
15.00 a
39.17 a
2.
none
15.00 a
none
12.50 a
Alert
0.83 b
0.83 b
13.33 b
3.
none
13.33 a
none
10.00 a
Success
0.00 b
2.50 b
14.17 b
4.
none
11.66 a
none
10.00 a
Baythroid
0.00 b
2.50 b
25.83 ab
5.
none
13.33 a
none
11.67 a
Alert
0.00 b
4.17 b
15.00 b
6.
none
12.50 a
none
10.00 a
Alert
0.83 b
4.17 b
16.67 b
7.
Acetamiprid
10.00 a
Acetamiprid
0.83 b
Carzol
0.00 b
0.83 b
22.50 b
8.
none
10.00 a
none
8.33 a
Acetamiprid
0.00 b
2.50 b
13.34 b
9.
none
21.67 a
none
16.67 a
Carzol
0.83 b
0.83 b
11.67 b
Treatment
Regimeab
Means in a column followed by the same letter are not significantly different (F protected LSD P < 0.05).
Rates: Acetamiprid (0.1 lbs-ai/ac), Alert (0.3 lbs-ai/ac), Baythroid (6.4 oz/ac), Carzol (1.5 lbs/ac), and Success (6 oz/ac).
b
All treatments were applied with Kinetic non-ionic surfactant at 0.1% v/v, Carzol also included Neutralizer buffer at 0.125 % v/v.
c
Average maximum daily temperature °F, from time of most recent application.
a
Table 2. Percentage of fruit infested with immature citrus thrips on lemons following applications 4 and 5, and fruit grade based on thrips scarring.
Applications and mean percentage fruit infested with immature citrus thrips (CT)
2 June
7 and
18 DAT
10 June
15 and
26 DAT
15 June
20 and
31 DAT
22 June
27 and
38 DAT
Application
#5
CT
(97.9°F)
CT
(94.7°F)
CT
(96.9°F)
CT
(102.7°F)
No.
appl.
Fancy
Choice
Juice
26.65 a
Untreated
22.49 a
17.50 a
17.48 a
5.00 ab
0
43.25 a
52.45 a
4.30 a
2.50 b
3.33 cd
none
0.00 b
4.17 bc
4.17 b
4.17 abc
2
77.50 b
22.50 b
0.00 b
0.00 d
1.67 b
3.33 cd
none
5.84 b
5.00 bc
4.17 b
0.00 c
2
76.67 b
23.33 b
0.00 b
Success
1.67 cd
2.50 b
0.83 d
none
5.83 b
2.50 c
1.67 b
5.83 a
2
76.67 b
23.33 b
0.00 b
5.
Baythroid
7.50 bc
2.50 b
9.18 bc
none
5.00 b
8.33 b
6.67 b
4.17 abc
2
89.17 b
10.83 b
0.00 b
6.
Danitol
10.83 b
5.75 b
13.33 b
Success
4.18 b
5.84 bc
3.33 b
7.50 a
3
76.68 b
22.50 b
0.83 b
7.
Success
2.50 cd
3.33 b
4.18 c
none
3.33 b
3.33 bc
4.17 b
4.17 abc
4
80.83 b
18.33 b
0.83 b
8.
Success
1.67 cd
1.67 b
0.00 d
none
1.67 b
2.50 c
1.67 b
0.00 c
2
79.18 b
19.98 b
0.83 b
9.
Success
0.83 d
2.50 b
4.17 c
none
2.50 b
4.17 bc
3.33 b
0.83 bc
2
77.50 b
20.83 b
1.67 b
14 May
18 May
4 DAT
20 May
6 DAT
25 May
11 DAT
26 May
Application
#4
CT
(93.8°F)
CT
(94.7°F)
CT
(94.2°F)
1.
Untreated
35.84 a
37.50 a
2.
Success
3.34 cd
3.
Alert
4.
Treatment
Regimeab
Means in a column followed by the same letter are not significantly different (F protected LSD P < 0.05).
Rates: Alert (0.3 lbs-ai/ac), Baythroid (6.4 oz/ac), Danitol (21 oz/ac), and Success (6 oz/ac).
b
All treatments were applied with Kinetic non-ionic surfactant at 0.1% v/v.
c
Average maximum daily temperature °F, from time of most recent application.
a
Percent Grade
based on thrips scarring
Residual Activity of Insecticides to Citrus Thrips on Lemon
Foliage 1
David L. Kerns and Tony Tellez
Abstract
The residual activity of insecticides to second instar citrus thrips was measured on
lemon foliage in 1998 and 1999. Dimethoate, Agri-Mek and acetamiprid provided
only knockdown control of thrips, dropping to <70% mortality by 3 days after
treatment (DAT). Baythroid performed slightly better, providing about 95%
mortality 3 DAT during three of the evaluation periods, but by 7 DAT was giving
about 75% mortality. Alert, Carzol, and Success provided the longest residual
activity, lasting 7 to 14 DAT. Residual activity in general appeared to be greater in
the May and June evaluation, relative to the April evaluation. The apparent shorter
residual activity under cooler condition in April 1998 is not understood but maybe
due to a difference in the physiological nature of the leaves earlier in the season.
Introduction
An understanding of the level and length of control offered by insecticides is important for growers and pest control advisors
(PCAs) to understand in order to best utilize these resources. Growers and PCAs often note that there is a great amount
of variability in the residual activity of insecticides. In Arizona, Carzol has been reported to deliver residual control as long
as 4 weeks, or as short as 1 week. In California, Baythroid is thought to offer at least 4 weeks of residual activity, but in
Arizona it appears to offer as little as 1 week. There are several factors, which may greatly influence the residual activity
of insecticides in citrus. New flush and fruit growth, leaf expansion, and temperature and light intensity are important factors
that may affect the residual activity of many insecticides. If growers and PCAs could determine the best timing for
insecticides, they could not only achieve better thrips control, but may also be able to reduce the number of applications.
In Yuma, insecticide residual activity seems to drop as temperatures increase. Short residual insecticides are often just as
effective as long residual insecticides if applied just before the onset of cool temperatures. On the other hand, one application
of a long residual insecticide may provide the same length of control as 2 to 3 applications of a short residual material when
temperatures are high. Thus, proper selection and timing of insecticides an extremely important consideration. The purpose
of this research was to determine the length of residual activity of various insecticides to citrus thrips on the foliage of lemon
trees.
1
The authors wish to thank the Arizona Citrus Research Council for financial support for this project. This is a
portion of the final report for project 99-09 ‘Susceptibility of Lemons to Citrus Thrips Scarring Based on Fruit Size and
Residual Activity of Insecticides for Citrus Thrips Control in Arizona Lemons’.
This is a part of publication az1178: "2000 Citrus and Deciduous Fruit and Nut Research Report," College of
Agriculture and Life Sciences, the University of Arizona, Tucson, Arizona, 85721.
Materials and Methods
This study was conducted in 1998 and repeated in 1999. Five or six year old lemon trees grown at the Yuma Mesa
Agricultural Center were used in this study. The tests were randomized complete block designs consisting of four replicates.
Each plot (30 ft by 150 ft) consisted of five trees in a row spaced 30 ft apart. Prior to the insecticide application, six pieces
of fully expand flush growth were chosen in each plot, and tagged using vinyl tape. Insecticides were applied using a Solo
Backpack Airblast Sprayer calibrated to deliver 90 gal/acre. Insecticides included Alert at 0.30 lbs-ai/acre, Agri-Mek at
12.5 oz/acre, Baythroid at 6.4 oz/acre, Carzol at 1.5 lbs/acre, Dimethoate 4E at 2.0 lbs-ai/acre, Success at 9.0 oz/acre, and
acetamiprid at 0.1 lbs-ai/acre. All products except Agri-Mek contained Kinetic non-ionic spreader at 0.1%v/v. Agri-Mek
included NR-415 citrus spray oil at 1.0 gal/acre. Insecticides were applied on 28 April and 2 June in 1998, and 17 May and
9 June in 1999. Different sets of trees were selected for treatment for each application.
Following application, 4 fully expanded but non-hardened leaves, selected from previously tagged flush, were removed from
each plot at 0, 3, 7, 14, 21 and 28 days after treatment (DAT). These leaves were transported to the laboratory where they
were placed individually into Munger cells. Leaves were oriented so that the bottom surface was exposed. Ten to thirty
second instar citrus thrips were placed into each cell on the bottom of each leaf. The thrips were obtained from a nearby
commercial lemon grove that had not been treated with insecticides. Thrips were collected by aspirating them into soda
straws using hand-held vacuums. The thrips were then anesthetized using carbon dioxide before transferring them into the
Munger cells. Mortality in each Munger cell was assessed 48 hrs after infestation by counting the number of live and dead
thrips under a dissecting microscope. Thrips that could not freely move about were considered dead.
Temperature data was obtained from the AZMET weather database system, from the weather station located at the University
of Arizona Yuma Mesa Station, about 100 yds. from the test site. Daily high and low temperature data are presented in °F
for 28 days following each insecticide application.
The percentage mortality within each Munger cell was corrected for mortality in the untreated check using Abbott’s formula.
Differences among treatments were separated using ANOVA and an F protected LSD, P<0.05.
Results and Discussion
In this study, commercially acceptable mortality is considered to be ³80%. Following the application made on 28 April
1998, there were distinct differences in the residual activity of the insecticides tested (Table 1, Figure 1). All the products
tested caused >90% mortality at 0 DAT except acetamiprid which provided poor activity (73.66%). Dimethoate and
Agri-Mek provided only knockdown control of thrips, dropping to <70% mortality 3 DAT. Baythroid performed slightly
better, providing 95% mortality 3 DAT, but by 7 DAT was giving about 74% mortality. Alert, Carzol, and Success provided
the longest residual activity, lasting 7 days, but began to slip at 14 DAT.
Treatments applied later in the season on 2 June 1998 appeared to provide longer residual activity than the early season
application (Table 2, Figure 2). This is in contrast to the hypothesis that insecticides are shorter lived late in the season when
temperatures are higher. Following the June application, temperatures were similar to the April application the first 7 DAT,
but were roughly 10°F higher later in the trial (Figures 1 and 2). Since temperatures were higher following the June
application, the reason the insecticides provided longer residual activity may be due to a differences in physiological nature
of the leaf tissue. Following the June application, the tagged flush growth hardened more quickly than those following the
April application. Although, residual activity in general was greater in June 1998 (Table 2 and Figure 2), this increase in
residual activity did not necessarily increase the length of commercially acceptable residual activity. Agri-Mek and
Dimethoate still only provided knockdown activity, and Baythroid was still giving 3 days of good activity.
In 1999, all of the insecticides evaluated provided good initial knockdown of the thrips (Tables 3 and 4, and Figures 3 and
4). The reason the activity of acetamiprid was inconsistent, failing to provide adequate initial control in May 1998 (Table
1 and Figure 1), is not clear, but may be a result of experimental error during the May 1998 application. The residual
insecticide activity following the 17 May 1999 and 9 June 1999 were similar (Tables 3 and 4, and Figures 3 and 4). Carzol,
Success and Alert all performed similarly, providing 14 days of commercially acceptable control, while Agri-Mek,
Dimethoate and acetamiprid provided only good initial knockdown of the thrips, but failed to cause adequate thrips
mortality by 3 DAT, dropping to 40 to 70% mortality. The activity of Baythroid was less consistent. At 3 DAT, it was
slightly longer lived than Agri-Mek, Dimethoate and acetamiprid following the 9 June 1999 application, causing ca. 95%
mortality, but caused only 68% mortality following the 17 May 1999 application (Tables 3 and 4, and Figures 3 and 4)
Overall, Carzol, Success and Alert should all be characterized as long residual materials, providing 7 to 14 days of control.
Baythroid is moderate in its residual nature, usually lasting about 3 days, while Dimethoate, Agri-Mek and acetamiprid
should be considered knockdown materials, offering very little residual activity. Growers and PCAs should keep in mind
that these data represent true residual activity and not the length of control as influenced by the speed of thrips re-infestation.
It is entirely possible that a grove treated with a short residual material may not require re-treatment for several weeks or
more, if for whatever reason, the next generation of thrips fails to quickly re-infest the trees. This relationship with speed
of re-infestation also helps explain why growers and PCAs often note that treatments last longer early in the season than later
in the season. Essentially, the thrips populations develop more slowly under the cooler spring temperatures.
Table 1. Residual activity of insecticides to second instar citrus thrips nymphs on lemon foliage, 28 April 19981.
% corrected mortality X days after treatment2
Treatment3
Rate
0 DAT
3 DAT
7 DAT
14 DAT
21 DAT
28 DAT
Dimethoate
2.0 lbs-ai/A
91.82 a
65.97 b
42.53 c
17.05 cde
2.88 cd
0.00 c
Agri-Mek
12.5 oz/A
95.74 a
36.40 c
53.69 c
31.12 cd
19.99 cd
16.21 bc
Baythroid
6.4 oz/A
96.46 a
95.47 a
74.26 b
28.24 cd
20.65 bcd
34.27 ab
Carzol
1.5 lbs/A
100 a
98.97 a
93.22 a
41.16 bc
56.71 a
32.17 b
Alert
0.3 lbs-ai/A
98.41 a
96.35 a
92.73 a
56.83 ab
26.40 bc
39.31 ab
Success
9.0 oz/A
100 a
100 a
92.80 a
70.15 a
45.91 ab
58.08 a
Acetamiprid
0.1 lbs-ai/A
73.56 b
11.96 d
12.26 d
9.24 de
16.10 cd
17.73 bc
0.00 c
0.00 d
0.00 d
0.00 e
0.00 c
0.00 c
Untreated
1
Means in a column followed by the same letter are not significantly different based on a F protected LSD P<0.05.
Percentage mortality within each treatment was corrected for control mortality using Abbott’s formula.
3
All treatments included Kinetic at 0.1%v/v except Agri-Mek which contained NR-415 spray oil at 1.0 gal/A.
2
Table 2. Residual activity of insecticides to second instar citrus thrips nymphs on lemon foliage, 2 June 19981.
% corrected mortality X days after treatment2
Treatment3
Rate
Dimethoate
0 DAT
3 DAT
7 DAT
14 DAT
21 DAT
28 DAT
2.0 lbs-ai/A
99.03 ab
70.54 c
26.96 e
6.83 e
17.53 d
2.23 d
Agri-Mek
12.5 oz/A
95.02 b
59.44 d
42.79 d
39.88 d
10.74 de
11.74 cd
Baythroid
6.4 oz/A
100 a
94.81 a
76.54 bc
60.81 c
39.64 c
29.38 bc
Carzol
1.5 lbs/A
100 a
100 a
97.98 a
91.43 a
78.48 a
59.51 a
Alert
0.3 lbs-ai/A
100 a
100 a
95.71 ab
77.48 b
58.42 b
45.31 ab
Success
9.0 oz/A
100 a
99.49 a
95.79 a
85.62 ab
73.62 ab
56.14 a
Acetamiprid
0.1 lbs-ai/A
98.78 ab
82.73 b
67.94 c
56.75 c
25.04 cd
5.18 d
0.00 c
0.00 e
0.00 f
0.00 e
0.00 e
0.00 d
Untreated
1
Means in a column followed by the same letter are not significantly different based on a F protected LSD P<0.05.
Percentage mortality within each treatment was corrected for control mortality using Abbott’s formula.
3
All treatments included Kinetic at 0.1%v/v except Agri-Mek which contained NR-415 spray oil at 1.0 gal/A.
2
Table 3. Residual activity of insecticides to second instar citrus thrips nymphs on lemon foliage, 17 May 19991.
% corrected mortality X days after treatment2
Treatment3
Rate
Dimethoate
0 DAT
3 DAT
7 DAT
14 DAT
21 DAT
28 DAT
2.0 lbs-ai/A
97.60 ab
40.55 c
52.31 c
30.30 c
6.83 cd
6.73 bc
Agri-Mek
12.5 oz/A
92.44 bc
63.40 b
24.91 d
32.91 c
7.38 cd
3.03 bc
Baythroid
6.4 oz/A
100 a
67.99 b
74.67 b
61.47 b
38.75 b
3.44 bc
Carzol
1.5 lbs/A
100 a
95.15 a
100 a
92.77 a
68.08 a
54.23 a
Alert
0.3 lbs-ai/A
100 a
100 a
98.03 a
93.68 a
78.07 a
58.80 a
Success
9.0 oz/A
100 a
96.15 a
98.19 a
92.51 a
73.62 a
52.46 a
Acetamiprid
0.1 lbs-ai/A
91.10 c
58.99 b
46.20 d
33.02 c
19.60 c
9.01 b
0.00 d
0.00 d
0.00 e
0.00 d
0.00 d
0.00 c
Untreated
1
Means in a column followed by the same letter are not significantly different based on a F protected LSD P<0.05.
Percentage mortality within each treatment was corrected for control mortality using Abbott’s formula.
3
All treatments included Kinetic at 0.1%v/v except Agri-Mek which contained NR-415 spray oil at 1.0 gal/A.
2
Table 4. Residual activity of insecticides to second instar citrus thrips nymphs on lemon foliage, 9 June 19991.
% corrected mortality X days after treatment2
Treatment3
Rate
0 DAT
3 DAT
7 DAT
14 DAT
21 DAT
28 DAT
Dimethoate
2.0 lbs-ai/A
100 a
61.53 b
32.43 c
22.12 c
13.89 c
1.91 c
Agri-Mek
12.5 oz/A
100 a
61.45 b
23.81 c
14.24 cd
17.53 c
9.35 c
Baythroid
6.4 oz/A
100 a
94.66 a
73.85 b
57.19 b
30.86 b
9.81 c
Carzol
1.5 lbs/A
100 a
100 a
100 a
89.80 a
69.97 a
37.38 b
Alert
0.3 lbs-ai/A
100 a
100 a
95.68 a
93.33 a
78.72 a
49.51 a
Success
9.0 oz/A
100 a
100 a
100 a
96.61 a
73.42 a
49.18 ab
Acetamiprid
0.1 lbs-ai/A
93.04 b
65.06 b
38.69 c
31.51 c
21.72 bc
7.63 c
0.00 c
0.00 c
0.00 d
0.00 d
0.00 d
0.00 c
Untreated
1
Means in a column followed by the same letter are not significantly different based on a F protected LSD P<0.05.
Percentage mortality within each treatment was corrected for control mortality using Abbott’s formula.
3
All treatments included Kinetic at 0.1%v/v except Agri-Mek which contained NR-415 spray oil at 1.0 gal/A.
2
Figure 1 Residual mortality of second instar citrus thrips on lemon foliage treated on 28 April,
1998, 0.25-inch diameter fruit.
Figure 2 Residual mortality of second instar citrus thrips on lemon foliage treated on 2 June, 1998,
1.0-inch diameter fruit.
Figure 3 Residual mortality of second instar citrus thrips on lemon foliage treated on 17 May,
1999, 0.5-inch diameter fruit.
Figure 4 Residual mortality of second instar citrus thrips on lemon foliage treated on 9 June, 1999,
1.0-inch diameter fruit.
Protective and Yield Enhancement Qualities
of Kaolin on Lemons1
David L. Kerns and Glenn C. Wright
Abstract
Kaolin (Surround) was highly effective at preventing citrus thrips populations from
reaching damaging levels in Arizona lemons. Applications should be initiated before
thrips become numerous. Applying the material before petal fall may offer
protection of early set fruit, but may not be necessary if thrips densities are low.
However, since kaolin should be applied in advance of thrips populations increase,
determining the benefits of pre-petal fall applications of kaolin is difficult. Kaolin
applied on a maintenance schedule offers continual suppression of thrips
populations, whereas traditional standard insecticides offer temporary population
knockdown. Kaolin did not interfere with photosynthesis or stomatal conductance,
and may possess yield enhancement qualities.
Introduction
Citrus thrips, Scirtothrips citri (Moulton) is currently the most economically damaging insect pest affecting Arizona citrus.
Although the feeding action of citrus thrips can leave citrus leaves highly distorted, it is the scarring of the fruit rind during
petal fall, which is of the most economic concern. Petal fall is defined as the period of time when about 80% of the flower
petals have dropped from the developing fruit. In Arizona, three weeks may pass from the time the when large numbers of
petals begin to shed until 80% of petal fall is completed. During this period the fruit is susceptible to scarring by thrips, and
because honeybees are usually present, applications of broad-spectrum insecticides are risky. Alternative biorational
insecticides are needed to fill the niche between the onset and end of petal fall.
Following petal fall, lemons are susceptible to scarring by thrips until the fruit reaches approximately 1 inch in diameter
(Kerns et al. 1997, Kerns and Tellez 1998). During this period, which typically occurs from late March to early June, citrus
thrips can be extremely numerous and difficult to control. Since citrus thrips populations can increase rapidly, and individual
thrips can scar the fruit in a short period of time, insecticides have been the only practical means of control. Unfortunately
the number of economical and efficacious insecticides available for thrips control is extremely limited in citrus. Label
restriction and revocation actions currently being taken by the EPA through the implementation of FQPA threaten to further
limit our ability to effectively manage thrips. Carzol (formetamate HCL) is currently under review by the EPA, and
dimethoate is scheduled for review within 1-2 years. Under the current situation, without access to these materials, thrips
management would become much more costly and less effective. Therefore, it is imperative that alternative insecticides be
identified.
A number of insecticide alternatives have been investigated for managing citrus thrips over the past five years. The most
promising of these is Kaolin (Surround). Kaolin is non-insecticidal hydrophobic mineral particle film that acts as a physical
barrier protecting plants against certain insects and diseases. Surround was developed by Engelhard Corporation of Iselin,
NJ, in cooperation with Drs. Michael Glenn and Gary Puterka of the USDA/ARS at Kearneysville, WV. Kaolin is sprayed
1 The authors wish to thank the Arizona Citrus Research Council for financial support for this project. This is a portion
of the final report for project 99-09 ‘Susceptibility of Lemons to Citrus Thrips Scarring Based on Fruit Size and
Residual Activity of Insecticides for Citrus Thrips Control in Arizona Lemons’.
This is a part of publication az1178: "2000 Citrus and Deciduous Fruit and Nut Research Report," College of
Agriculture and Life Sciences, the University of Arizona, Tucson, Arizona, 85721.
on as a liquid, which evaporates, leaving a film on the plant or crop surface. Kaolin’s primary mode of action appears to
be repellency, so it is imperative that the material be applied before thrips are numerous. In addition to its action against
insect, in other tree fruits, Kaolin has been shown to protect against sunburn, and decreases heat stress leading to better fruit
retention, size, and yield (Glenn et al. 1999).
In this study we compare the effects of conventional insecticides versus Kaolin on the development of thrips populations on
lemons when applied pre-petal fall and post petal fall. We also report information concerning the effects of Kaolin on
photosynthesis and yield enhancement in lemons.
Materials and Methods
Eleven-year old ‘Limoneira 8A Lisbon’ lemon trees grown on the Yuma Mesa were used in these studies. All small plot
tests were randomized complete block designs consisting of four replicates. Each plot consisted of four trees in a square
spaced 28 ft apart.
Treatments included a commercial standard of formetamate (Carzol) or spinosad (Success) applied post petal fall when
thrips reached or exceeded a threshold of 10% infested fruit (Table 1). These treatments contained a non-ionic surfactant,
Kinetic at 0.1%v/v. Other treatments included kaolin applied beginning at pre-petal fall and post petal fall, and continued
as needed to maintain coverage of new flush and expanding fruit (Table 1). Kaolin was applied with a surfactant designated
MO-3 at 1pt/ 50lbs of kaolin. All applications were applied with a Bean handgun sprayer calibrated to deliver 300 gal/ac.
The protocol for this trial originally also included applications of kaolin applied pre- and post petal fall tank mixed with
formetamate or dimethoate for thrips knockdown. However, the addition of insecticide was never required. For thrips
control analysis, data from these plots were pooled by replicate with the corresponding kaolin alone treatments.
Percent-infested fruit were estimated by sampling ten fruit per tree for the presence or absence of immature citrus thrips.
Applications and evaluation continued until approximately 80% of the fruit on the tree were 1.0 inch or greater in diameter.
Fruit damage was estimated on Aug 19, by rating the degree of scarring to the rind. Scarring was rated as 1=no scarring,
2=slight scarring partially around the stem, 3= scarring encircling the stem, 4=slight scarring on the side of the fruit and
5=major scarring on the side of the fruit. Fruit with a damage rating of 1 or 2, are not considered to be scarred heavy enough
to cause a downgrade in quality. Fruit with a rating of 3 are considered sufficiently scarred to be downgraded to choice and
fruit with a rating of 4 or 5 are considered suitable for juice. Differences among insecticide treatments for thrips infestation
and fruit damage were separated using ANOVA and an F protected LSD, P<0.05.
The same treatments evaluated for thrips control were also evaluated for their impact on leaf gas exchange and yield.
However, for these evaluations, the data from the kaolin / insecticide tank mixes were not pooled with data from the kaolin
alone treatments. Instead, once the fruit had exceed 1 inch in diameter and were no longer susceptible to scarring by thrips,
the treatments originally scheduled to receive insecticides in addition to kaolin received an additional late season (mid July)
application of kaolin (designated kaolin pre-pf+ and kaolin post pf+) (Table 1). This was done to determine if late season
applications of kaolin for heat protection enhance yield beyond those applied only during the thrips susceptibility period.
Leaf gas exchange was measured on July 15, 1999. Six standard control trees and six trees treated with Kaolin post pf were
selected. There were still significant amounts of Kaolin on the treated leaves. Gas exchange measurements were collected
on four leaves per tree, including photosynthesis (A), transpiration (E), and stomatal conductance (gs). Photosynthetically
active radiation (PAR) data was also collected. All measurements were collected when photosynthetically active radiation
(PAR) was above the light saturation point, and at least 800 µmol·m-2·s-1 (Table 2). Gas exchange data were collected using
an ADC-4 infrared gas analyzer (ADC Bioscientific Ltd., Hoddeston, Herts., England). Differences among insecticide
treatments for gas exchange measurements were separated using an independent samples t-test for equality of means
assuming equality of variance (SPSS Inc., Chicago, IL).
Yield data was collected on October 4, 1999. Fruit was harvested from individual trees, then automatically weighed and
optically sized by an automatic fruit sorter/grader (Autoline Inc., Reedley, CA). We attempted to grade the fruit in the field
using the sorter/grader, but found that without first washing the fruit, it was difficult for the sorter to distinguish between the
silvery-white Kaolin residue and the silvery-gray thrips scarring. We hope to refine our optical grading in the future to allow
us to grade in the field.
Results and Discussion
Kaolin pre-pf applications were initiated during bloom prior to full petal fall, and were applied on 3 occasions (Table 1).
Based on visual perception, it appeared that a single 50-lbs/ac application was insufficient to provide adequate coverage.
Thus a second application was applied 7 days later on Apr 1. On Apr 2 the test received approximately 1 inch of
precipitation that washed off much of the kaolin. Thus on Apr 9, a third application was needed. Based on our experiences,
it appears that 75-100 lbs/ac of kaolin should be used for the initial application followed by applications of 50 lbs/ac for
maintenance. Kaolin post pf applications were initiated on Apr 20 following petal fall, and commercial standard insecticide
applications began on May 10, triggered by a 10% infestation threshold (Table 1).
Before petal fall, thrips populations were moderate in all but the plots that received kaolin pre-pf, which were very low (Fig.
1). Populations in all the plots declined in late April and did not reach the action threshold until May 6, which triggered an
application of formetamate in the commercial standard. During this period, thrips populations in all plots treated with kaolin
remained low. Formetamate was effective in lowering the thrips populations to as acceptable level, but required re-treatment
with spinosad on May 28.
On August 19, fruit were visually graded for thrips damage (Fig. 2). Thrips population densities were moderate throughout
the trial (Fig. 1), and 50% of the fruit in the untreated plots was graded as fancy, and there were no significant differences
among treatments in the percentage of juice fruit produced (Fig. 2). Plots receiving kaolin pre-pf produced the highest
percentage of fancy fruit (95%), significantly more than in the commercial standard (83.33%), but not different from the
kaolin post pf plots (91%). Although there were some susceptible fruit present in the kaolin post pf treatments prior to the
initiation of post pf treatments, there were no obvious benefits from applying the kaolin pre-pf. However, thrips densities
were not high throughout the pre-pf period, otherwise the kaolin pre-pf applications may have been justifiable.
Photosynthesis, transpiration and stomatal conductance of leaves treated with Kaolin were not significantly different than
that of leaves of the trees treated with standard post pf insecticides (Table 2). It appears that application of the clay does not
interfere with normal leaf function, either by blocking the incidence of light on the leaf surface, or by congesting the stomata
on the underside of the leaves. Additionally, there were no obvious phytotoxicity problems associated with Kaolin on citrus.
Yield of lemons treated with Kaolin was greater than that of lemons treated with either the standard pf treatment, or the
untreated control. Unfortunately, high variability among the treatments and a small number of replications led to no
significant differences (Table 3). There were no discernable effects of insecticide on fruit size. It is possible, if variability
was reduced, that yield of Kaolin trees might outstrip that of the untreated controls and that of conventionally treated trees.
Such an occurrence might be due to the Kaolin treated fruit being cooled by the applications, leading to reduced water loss
and resultant drop.
Kaolin appears to be an excellent insecticide alternative for citrus thrips management in lemons. Based on these data and
previous experiments, Kaolin should be applied preventable before citrus thrips become numerous, and maintenance
applications must be continued to cover new growth until the fruit reaches 1 inch in diameter. Whether or not kaolin
applications should be initiated during bloom or after petal fall is not certain, but obviously depends on the thrips populations
during this period. Pre-petal fall applications would offer protection of susceptible fruit at a time when insecticides are
avoided because of the inevitable presence of honeybees. But these applications may not be necessary due to the
unpredictable possibility of low thrips populations.
Literature Cited
Kerns, D. L., M. Maurer, D. Langston and T. Tellez. 1997. Developing an action threshold for citrus thrips on lemons
in the low desert areas of Arizona, In College of Agriculture / Arizona Citrus Research Council, 1997 Report,
Series P-109, pp. 54-61.
Kerns, D. L. and T. Tellez. 1998. Susceptibility of lemons to citrus thrips scarring based on fruit size. In College of
Agriculture, 1998 Citrus and Deciduous Fruit and Nut Research Report, Series P-113, pp. 21-24.
Glenn, D. M., G. J. Puterka, T. Vanderzwet, R. E. Byers, and C. Feldhake. 1999. Hydrophobic particle films: a new
paradigm for suppression of arthropod pests and plant diseases. J. Econ. Entomol. 92: 759-771.
Table 1. Treatments, application timing, and rates.
Treatments1
Kaolin pre-pf
Kaolin post pf
Kaolin pre-pf+
Kaolin post pf+
Standard post pf
Mar 25
Apr 1
Apr 92
50 lbs/ac
50 lbs/ac
75 lbs/ac
50 lbs/ac
50 lbs/ac
75 lbs/ac
Date of application
Apr 20
May 10
50 lbs/ac
75 lbs/ac
50 lbs/ac
75 lbs/ac
50 lbs/ac
50 lbs/ac
50 lbs/ac
50 lbs/ac
formetamate
1.5 lbs/ac
May 28
July 153
50 lbs/ac
50 lbs/ac
50 lbs/ac
50 lbs/ac
spinosad
6 oz/ac
50 lbs/ac
50 lbs/ac
1
All applications were applied at 300 gal/ac. All kaolin applications included the surfactant MO-3 at 1 pt/ 50 lbs of
kaolin. All standard treatments included Kinetic at 0.1% v/v. Thrips data from the Kaolin pre-pf and Kaolin pre-pf+
treatments and the Kaolin post pf and Kaolin post pf treatments respectively were pooled for analysis.
2
Rain on Apr 2 removed much of the previously applied kaolin making this application necessary.
3
These applications did not target thrips, but were applied as further protection against heat stress.
Table 2. Leaf gas exchange measurements of trees treated with standard post petal fall insecticides and Kaolin post
petal fall.
Date of application
Treatments
Standard post pf
Kaolin post pf
PAR
(µmol·m-2·s-1)
Photosynthesis
(µmol·m-2·s-1)
Transpiration
(mol·m-2·s-1)
1652
1896
10.07
9.39
1.96
1.94
Stomatal
Conductance
(mol·m-2·s-1)
0.0372
0.0329
0.238
0.816
0.135
Significance1
1
Values greater than 0.05 are considered to be non-significant.
Table 3. Effect of kaolin treatments on yield and size of ‘Limoneira 8A Lisbon’ lemons harvested on Oct 4.1
Yield
Fruit size (%)
Treatments
(Lbs/tree)
63
75
95
115
140
165
200
235
Untreated
64.16 a
0.1 a
0.3 a
4.0 a
29.9 a
32.8 a
13.0 a
18.6 a
1.2 b
Kaolin pre-pf
90.07 a
0.0 a
0.1 a
2.4 b
25.2 a
33.8 a
12.7 a
22.4 a
3.2 a
Kaolin post pf
90.64 a
0.0 a
0.0 a
3.2 ab
27.0 a
33.5 a
13.0 a
20.9 a
2.2 ab
Kaolin pre-pf+
89.92 a
0.0 a
0.1 a
3.0 ab
27.3 a
34.4 a
12.4 a
20.2 a
2.5 ab
Kaolin post pf+
94.83 a
0.0 a
0.1 a
3.3 ab
29.0 a
34.5 a
11.4 a
18.7 a
2.9 ab
Standard post pf
79.44 a
0.0 a
0.2 a
2.9 ab
26.2 a
34.4 a
13.2 a
20.6 a
2.5 ab
1
Means separation by Duncan’s Multiple Range Test, p=0.05. Values within a column that are followed by the same
letter are not significantly different.
Figure 1 Efficacy of pre and post petal fall applications of kaolin to citrus thrips on
lemons.
1
Kaolin pre-pf, 50 lbs/ac (Mar. 25).
Kaolin pre-pf, 50 lbs/ac (Apr. 1), washed off by rain on Apr. 2.
3
Kaolin pre-pf, 75 lbs/ac (Apr. 9).
4
Kaolin pre-pf, 50 lbs/ac; Kaolin post pf, 75 lbs/ac (Apr. 20).
5
Kaolin pre-pf and Kaolin post pf, 50 lbs/ac; Standard post pf – formetamate, 1.5 lbs/ac
(May 10).
6
Kaolin pre-pf and Kaolin post pf, 50 lbs/ac; Standard post pf – Spinosad, 6oz/ac (May
28).
2
Figure 2 Percentage of fruit graded as fancy, choice, or juice due to citrus thrips scarring
following applications of kaolin beginning pre-petal fall, or kaolin or a commercial
standard post petal fall.
Tank Mixing Success for Citrus Thrips Control is Not
Necessary1
David L. Kerns and Tony Tellez
Abstract
A small plot efficacy trial was conducted evaluating thrips control with Dimethoate,
Baythroid, and Success at rates of 4, 6, and 9 oz/ac, and tank mixes of the low and
medium rates of Success with Dimethoate or Baythroid. Based on a 10% fruit
infestation threshold, Dimethoate required three applications while the other
treatments required two applications to achieve season long thrips control.
However, when evaluating the treatments based on a cost effectiveness index, none
of the tank mixes or Success at 9 oz./ac were economically advisable. The most cost
effective treatment was Success at 4 oz/ac, followed by Success at 6 oz/ac,
Dimethoate, and Baythroid.
Introduction
In 1998, Success (spinosad) was registered for use in citrus and has proven be an effective tool for managing citrus
thrips, Scirtothrips citri (Moulton). Success is labeled for use against thrips at rates of 4 to 10 oz of product per acre,
and specifies that lower rates should be used for light infestations and higher rates should be used for heavy infestations.
In Yuma, growers typically use Success at 6 oz per acre, which has been highly effective but costly, averaging a little
over $30.00 per acre per application. Although this cost is similar to other premium citrus thrips control products, using
lower rates of Success maybe more economically sustainable without greatly compromising thrips control. There are
questions as to whether or not tank-mixing Success at lower rates with other insecticides enhances control and/or
reduces thrips management expenses. In this trial we evaluated low, medium and high rates of Success and tank mixes
of Success with Dimethoate or Baythroid for citrus thrips control relative to treatment costs.
Materials and Methods
Eleven year old ‘Limoneira 8A Lisbon’ lemon trees grown on the Yuma Mesa were used in these studies. The test was
a randomized complete block design consisting of four replicates. Each plot consisted of three trees in a row spaced ca.
30 ft apart. Treatments included Success at 4 oz/ac, 6 oz/ac and 9 oz/ac, Dimethoate at 2 lbs-ai/ac, Baythroid
(cyfluthrin) at 6.4 oz/ac, and combinations of Success at 4 or 6 oz/ac with either Dimethoate at 2 lbs-ai/ac or Baythroid
at 6.4 oz/ac. All treatments included Kinetic spreader-sticker at 0.1% v/v. All product costs were estimated using
suggested retail prices from a single distributor: Baythroid = $601.33/gal, Dimethoate 4E = $39.55/gal, and Success =
$662.34/gal. Treatments were applied on an as needed basis, when the number of fruit infested with immature citrus
thrips was ≥10%. Applications were made using a backpack air-blast sprayer calibrated to deliver 100 gal./acre.
Percent-infested fruit were estimated by sampling ten fruit per tree for the presence or absence of immature citrus thrips.
Fruit damage was estimated on 19 Aug, by rating the degree of scarring to the rind. Scarring was rated as 1=no
1
The authors wish to thank the Arizona Citrus Research Council for financial support for this project. This is a portion
of the final report for project 99-09 - ‘Susceptibility of Lemons to Citrus Thrips Scarring Based on Fruit Size and
Residual Activity of Insecticides for Citrus Thrips Control in Arizona Lemons’.
This is a part of publication az1178: "2000 Citrus and Deciduous Fruit and Nut Research Report," College of
Agriculture and Life Sciences, the University of Arizona, Tucson, Arizona, 85721.
scarring, 2=slight scarring around the stem, 3=significant scarring around the stem, 4=slight scarring on the side of the
fruit and 5=major scarring on the side of the fruit. Fruit with a damage rating of 2, are not considered to be scarred
heavy enough to cause a downgrade in quality. Fruit with a 3 damage rating, are considered slightly scarred and subject
to downgrading to choice, while fruit with damage ratings of 4 or 5 are graded as juice. A cost effectiveness index for
each treatment regime was calculated by multiplying the damage rating by the cost ($/acre). The resultant values
provide a relative assessment of the quality of fruit produced in relation to the cost of the treatments. Differences among
insecticide treatments for thrips infestation, fruit grade and the cost effectiveness index were separated using ANOVA
and an F protected LSD, P<0.05.
Results and Discussion
Temperatures during the spring of 1999 were cooler that normal resulting in a significant delay in petal fall. Thus,
applications were not initiated until 20 April. Following the first application, temperatures were moderate and all
treatments provided good initial knockdown of the thrips populations and approximately three weeks of control (Table
1). By 22 days after treatment (DAT), only Dimethoate and Success-L + Dimethoate did not differ from the untreated,
and required retreatment on 14 May based on a 10% fruit infestation threshold. By 18 May, Baythroid, Success-L,
Success-H and Success-M + Dimethoate required an additional application (Table 1). Although, Success-M, Success-L
+ Baythroid and Success-M + Baythroid did not require an additional application until 21 May (based on a 10%
infestation threshold), did not statistically offer better thrips control than the other treatments 28 DAT (Table 2). In late
May and June, temperatures were high but the thrips populations declined during this period probably because of a
reduction in flush growth.
Although there were differences in the length of time before individual insecticide treatments required additional
applications, with the exception of Dimethoate, which required three applications, only two applications were required
to achieve season long thrips control. Since all treatments were applied on an as needed basis, all insecticide treatments
produced equivalent percentages of Fancy and Choice grade fruit, and were all better than the untreated (Table 2). The
fact that Dimethoate required three applications to achieve this result relative to the other treatments renders this
treatment as slightly inferior based on efficacy. However, based on the cost effectiveness index, Dimethoate was
equivalent to Baythroid and Success-M (Table 2). Under the thrips pressure and temperatures experienced in this trial,
Success-L was statistically the most cost effective treatment, while Success-H and all of the tank mixes proved to be too
costly to justify their use.
Table 1. Percentage of fruit infested with immature citrus thrips on lemons following applications 1, 2 and 3.
Applications and mean percentage fruit infested with immature citrus thrips (CT)
20 Apr
27 Apr
7 DAT
6 May
16 DAT
12 May
22 DAT
14 May
18 May
4 or 28 DAT
19 May
20 May
1, 6 or 30 DAT
Application
#1
CT
(85.9°F)c
CT
(83.7°F)
CT
(86.2°F)
Application
#2
CT
(93.8°F)
Application
#3
CT
(97.0°F)
1.
Untreated
5.83 a
13.33 a
29.17 a
Untreated
41.67 a
Untreated
31.67 a
2.
Dimethoate
0.83 b
3.33 b
21.67 ab
Dimethoate
7.50 b
none
12.50 bc
3.
Baythroid
1.67 b
0.83 bc
9.17 bc
none
15.00 b
Baythroid
7.50 cde
4.
Success-L
0.83 b
1.67 bc
6.67 c
none
10.00 b
Success-L
2.50 de
5.
Success-M
0.00 b
0.00 c
9.17 bc
none
7.50 b
none
11.66 bcd
6.
Success-H
0.00 b
0.00 c
7.50 c
none
10.00 b
Success-H
0.00 e
7.
Success-L + Dimeth
0.00 b
1.67 bc
16.67 abc
Success-L + Dimeth.
4.17 b
none
7.50 cde
8.
Success-L + Bay
0.00 b
0.00 c
8.34 bc
none
9.17 b
none
20.83 b
9.
Success-M + Dimeth
0.00 b
0.00 c
9.17 bc
none
10.84 b
Success-M + Dimeth
2.50 de
10.
Success-M + Bay
0.00 b
0.83 bc
8.33 bc
none
6.67 b
none
11.67 bcd
Treatment
Regimeab
Means in a column followed by the same letter are not significantly different (F protected LSD P < 0.05).
Rates: Dimethoate and Dimeth = Dimethoate 4E (2 lbs-ai/ac), Baythroid and Bay = Baythroid 2 (EC) (6.4 oz/ac), Success-L = Success 2SC (4 oz/ac), Success-M
= Success 2SC (6 oz/ac), and Success-H = Success 2SC (9 oz/ac).
b
All treatments were applied with Kinetic non-ionic surfactant at 0.1% v/v.
c
Average maximum daily temperature °F, from time of most recent application.
a
Table 2. Percentage of fruit infested with immature citrus thrips on lemons following application 4, grade , and cost.
Applications and mean percentage fruit infested with immature citrus thrips (CT)
21 May
25 May
4, 6 or
11 DAT
2 June
12, 14 or
19 DAT
10 June
20, 22 and
27 DAT
15 June
25, 27 and
32 DAT
22 June
32, 34 and
39 DAT
Percent Grade
based on thrips scarring
No. of
applications / $/ac
insecticidesd
Cost
Effectiveness
Indexe
Treatment
Regimeab
Application
#4
CT
(93.4°F)
CT
(96.2°F)
CT
(94.4°F)
CT
(96.2°F)
CT
(98.2°F)
Fancy
Choice
Juice
1.
Untreated
23.34 a
17.50 a
8.33 a
12.48 a
5.83 a
62.50 a
33.35 a
4.15 a
0 / 0.00
NA
2.
Dimethoate
3.33 bc
5.00 b
3.33 a
4.16 bcd
1.67 a
85.80 b
14.20 b
0.00 b
3 / 59.34
69.28 d
3.
none
6.65 b
2.50 b
4.17 a
6.66 b
4.17 a
84.18 b
15.82 b
0.00 b
2 / 60.14
71.57 d
4.
none
0.83 c
0.83 b
1.67 a
5.83 bc
2.50 a
90.85 b
8.32 b
0.83 b
2 / 41.40
46.16 e
5.
Success-M
2.50 bc
3.33 b
1.67 a
1.67 cd
0.00 a
93.33 b
6.67 b
0.00 b
2 / 62.10
66.29 d
6.
none
0.83 c
3.33 b
1.67 a
0.00 d
0.83 a
94.18 b
5.82 b
0.00 b
2 / 93.14
99.43 b
7.
none
1.66 bc
4.17 b
8.33 a
3.33 bcd
1.67 a
92.48 b
7.52 b
0.00 b
2 / 80.96
87.84 c
8.
Success-L + Bay
0.00 c
3.33 b
4.17 a
2.50 bcd
0.83 a
93.33 b
6.67 b
0.00 b
2 / 101.54
110.17 a
9.
none
3.33 bc
2.51 b
5.00 a
0.83 d
1.67 a
90.85 b
9.15 b
0.00 b
2 / 101.66
114.37 a
10.
Success-M + Bay
4.17 bc
0.83 b
3.33 a
1.67 cd
4.17 a
86.70 b
13.30 b
0.00 b
2 / 122.24
118.29 a
Means in a column followed by the same letter are not significantly different (F protected LSD P < 0.05).
Rates: Dimethoate and Dimeth = Dimethoate 4E (2 lbs-ai/ac), Baythroid and Bay = Baythroid 2 (EC) (6.4 oz/ac), Success-L = Success 2SC (4 oz/ac), Success-M = Success 2SC (6
oz/ac), and Success-H = Success 2SC (9 oz/ac).
b
All treatments were applied with Kinetic non-ionic surfactant at 0.1% v/v.
c
Average maximum daily temperature °F, from time of most recent application.
d
All product costs were estimated using suggested retail prices from a single distributor: Baythroid = $601.33/gal, Dimethoate 4E = $39.55/gal, and Success = $662.34/gal.
d
Cost effectiveness index = total cost of the treatment regime ($/acre, Table 2) X the damage rating.
a
Effect of Temperature and Moisture on Survival of
Phytophthora in Citrus Grove Soil1
Michael Matheron, Martin Porchas and Michael Maurer
Abstract
Before replanting a citrus grove in Arizona, different preplant cultural activities may
be performed, such as immediate replanting of the new citrus grove, allowing soil
to lay fallow for various lengths of time, or planting the site to alfalfa for one or
more years before the new citrus grove is established. A study was conducted to
compare the effect of these different cultural preplant practices on the survival of
Phytophthora in citrus grove soils. In June, 1998, and July, 1999, a total of 18 soil
samples were collected within mature lemon groves. Each initial bulk sample was
pretested, found to contain Phytophthora parasitica, then thoroughly mixed and
partitioned into 1-liter plastic containers, which were subjected to different
environmental and cultural conditions. The soil in each 1-liter container was tested
for the presence of P. parasitica 1 and 3.5 to 4 months later. All soil samples then
were placed in the greenhouse and a 6-month-old Citrus volkameriana seedling was
planted in soil samples not containing plants. Three 1-liter sub-samples from each
of ten 7-liter volumes of soil incubated outside for three months were also planted
to citrus in the greenhouse. The soil containing plants in the greenhouse was
watered as needed for 3 months, then again tested for the presence of Phytophthora.
Irrigating soil infested with Phytophthora parasitica, whether it was planted to a
host (citrus) of the pathogen, planted to a non-host (alfalfa) of the pathogen, or not
planted at all, did not lower the pathogen to nondetectable levels. Phytophthora
became and remained nondetectable only in the soil samples that were not irrigated
and subjected to mean temperatures of 35 to 37°C (94 to 98°F). On the other hand,
the pathogen was detectable in some soil samples subjected to dryness at lower mean
temperatures of 26 to 30°C (79 to 86°F ) after a citrus seedling subsequently was
grown in the soil for 3 months.
A dry summer fallow period following removal of a citrus grove (including as much
root material as possible) was the only cultural practice among those tested that
reduced the level of Phytophthora to nondetectable levels in all soil samples tested.
1 The authors wish to sincerely thank the Arizona Citrus Research Council for supporting this project. This is the final
report for project 99-05 - Impact of pre-plant soil treatments on levels of Phytophthora in citrus soils.
This is a part of publication az1178: "2000 Citrus and Deciduous Fruit and Nut Research Report," College of
Agriculture and Life Sciences, the University of Arizona, Tucson, Arizona, 85721.
Introduction
Several different methods are used in Arizona to prepare land for replanting of citrus trees. One approach involves the total
removal of old trees including as many roots as possible, followed by replanting without any additional treatment of soil.
An alternative procedure is to treat planting sites with a fumigant such as Vapam before planting trees. Additional practices
include leaving the soil fallow for one or more years or planting the former grove site to alfalfa for 1-3 years before returning
to citrus.
During the life of a citrus grove, the population of pathogens such as Phytophthora and the citrus nematode can increase
dramatically. When a grove is removed and replanted, resident populations of these pathogens potentially could remain in
the soil and attack the new trees, resulting in slow growth, delayed onset of commercial fruit yields, and long-term decrease
in yield and tree growth compared to noninfected trees. Utilization of fallow periods with or without a cover crop or soil
fumigation are potential means of reducing populations of soil pathogens so that newly planted trees can grow without the
detrimental influences of these organisms. Populations of citrus nematodes in soil are known to drop dramatically in the
absence of live citrus roots; however, the fate of Phytophthora after grove removal is not as well documented. The objective
of this research was to examine the survival of Phytophthora in soil subjected to different temperature, moisture and cultural
conditions.
Materials and Methods
1998 study. In June, 1998, an 8-liter volume of soil was collected from a total of eight different sites within a mature lemon
grove on a sandy soil in Yuma or a lemon planting on a heavier soil in Mesa, AZ. Each sample was pretested and found to
contain Phytophthora parasitica, then thoroughly mixed and partitioned into six 1-liter plastic containers. These subsamples were treated as follows for 6 months: 1) soil not irrigated, maintained in the laboratory; 2) soil not irrigated,
maintained outside exposed to full sunlight in a 1-liter container buried in soil so that the level of soil in the container was
the same as that of the surrounding soil; 3) soil not irrigated, maintained in the greenhouse; 4) soil irrigated when treatments
5 and 6 received water, maintained in the greenhouse; 5) soil irrigated every 2-4 days as needed, maintained in the
greenhouse with a 1-year-old C. volkameriana seedling growing in the soil; 6) soil irrigated every 2-4 days as needed,
maintained in the greenhouse with a 1-year-old alfalfa plant growing in the soil. Temperature probes were placed in the soil
at the 10-cm depth in the various locations and soil temperature was recorded hourly.
At 33 (July 22, 1998) and 108 (October 6, 1998) days after the initiation of this study, a 10-gram sample of soil was removed
from each container and tested for the presence of Phytophthora by the following procedure. Each 10-gram
sample of soil was placed in a 0.5-liter container to which was added one unblemished pear fruit and enough water to
submerge the bottom half of the pear in water, then incubated for 48 hr at 25-27°C in the laboratory. Each pear then was
removed from each container and maintained for an additional 5 days in the laboratory. Detection of Phytophthora was
considered positive when one or more firm brown lesions developed on the pear fruit. Confirmation that these lesions were
caused by the pathogen was achieved by plating a small piece of the fruit lesion onto agar medium and identifying the fungus
emerging from the tissue as Phytophthora parasitica.
At six months (December 13, 1998) after the initiation of this study, all soil samples were placed in the greenhouse and a
2-month-old rough lemon seedling was planted in each container. Alfalfa and citrus plants initially planted in some of the
soil samples were removed and replaced with rough lemon seedlings as well. All plants were watered as needed and the
soil in each container again was tested for Phytophthora on March 8, 1999. Soil temperature continued to be monitored
until the study was terminated.
1999 study. The study was repeated in 1999 with the following changes from 1998. In July, 1999, ten 16-liter volumes
of soil were collected within a mature lemon grove on a sandy soil in Yuma. After pretesting to assure the presence of
Phytophthora parasitica, each sample was thoroughly mixed, then distributed into five 1-liter plastic containers and for 4
months was treated as in the 1998 study, with the following changes: (a) the treatment involving nonirrigated soil maintained
in the laboratory was not repeated in 1999; (b) alfalfa was seeded into the appropriate treatment rather than transplanting
a 1-year-old plant; (c) a treatment not present in the 1998 study involved the placement and maintenance of soil outside
exposed to full sunlight in a 7-liter container ( 6 inches in width and length at the top and 16 inches deep) buried in soil so
that the level of soil in the container was the same as that of the surrounding soil.
At 45 (August 19, 1999) and 99 (October 12, 1999) days after the initiation of the study, a 50-gram sample of soil was
removed from each container (except for the 7-liter containers) and tested for the presence of Phytophthora using the
technique described for the 1998 study. At 132 days ( November, 1999) after the initiation of the study, all soil samples in
1-liter containers were placed in the greenhouse and a 6-month-old Citrus volkameriana seedling was planted in all soil
samples not already containing citrus or alfalfa plants. For soil in each 7-liter container, the top liter of soil was removed
and discarded. The 2nd, 4th, and 6th liter volumes of soil to be removed from each 7-liter container were saved and a citrus
seedling was planted in each of these soil samples. Soil samples already containing citrus or alfalfa plants were not
disturbed. Seven months (February 15, 2000) after initiating this study, the soil in each container again was tested for the
presence of Phytophthora.
In both years, soil populations of Phytophthora at the original collection sites were assayed and compared to values for the
soil subjected to the different environmental conditions of these studies. Soil temperatures were monitored as described for
the 1998 study. For the soil within the buried 7-liter containers, soil temperature was recorded at the 10 cm and 30 cm
depth.
Results and Discussion
The objective of this research was to examine the survival of Phytophthora in soil subjected to different temperature,
moisture and cultural conditions, with the hope of finding environmental conditions that would reduce the level of this
pathogen to nondetectable levels. Irrigating soil infested with Phytophthora parasitica, whether it was planted to a host
(citrus) of the pathogen, planted to a non-host (alfalfa) of the pathogen, or not planted at all, did not lower the pathogen to
nondetectable levels (Tables 1 and 3). On the other hand, Phytophthora could not be recovered from soil that was not
irrigated for 3.5 to 4 months. On further examination, when these nonirrigated soil samples were subsequently planted to
citrus and irrigated for 3 months, Phytophthora remained nondetectable only in the soil samples that were not irrigated and
subjected to mean temperatures of 35 to 37°C (94 to 98°F) (Tables 1 to 4).
In comparison, the pathogen was detected in some soil samples subjected to dryness at lower mean temperatures of 26 to
30°C (79 to 86°F ) after a citrus seedling subsequently was grown in the soil for 3 months. The soil samples from which
Phytophthora could not be detected, even after a citrus seedling was subsequently grown in the soil for 3 months, were
subjected to a dry summer fallow treatment by placement in the field in Yuma. These samples did receive some moisture
in the form of rainfall. The following rainfall amounts (in inches) were recorded during this study in 1998: Jul, 0.06; Aug,
0.30; Sep, 1.84; Oct, 0.00; and 1999: Jul, 0.36; Aug, 0.04; Sep, 0.20; Oct, 0.00.
What are the practical implications of this study. First of all, these research findings show that a dry summer fallow period
in Arizona (with mean soil temperatures of 35 to 37°C) following removal of a citrus planting (including as much root
material as possible) appears to be the only cultural practice among those tested that can reduce the population of
Phytophthora parasitica to nondetectable levels and maintain this status for at least 3 months after replanting to citrus.
Secondly, recovery of Phytophthora is still possible in soil subjected to dry fallow at lower temperatures of 26 to 30°C.
Finally, the pathogen can be readily recovered from infested soil at least 9 months after planting to alfalfa, suggesting that
planting of this crop between plantings of citrus may not lead to a rapid decline in populations of Phytophthora parasitica.
Table 1. Detection of Phytophthora parasitica in citrus grove soil after placement in different environmental conditions.
1998 study.
Soil Treatment
Number of soil samples in which P.
From Jun through Dec. 1998*
parasitica was detected **
Jul. 1998
Oct. 1998 Mar. 1999
Soil from the original collection site
8
-8
Soil planted with citrus seedling, maintained in greenhouse, irrigated
4
4
3
Soil planted with alfalfa, maintained in the greenhouse, irrigated
5
4
4
Bare soil, maintained in the greenhouse, irrigated
1
3
3
Bare soil maintained in the greenhouse, not irrigated
0
0
3
Bare soil, maintained in the laboratory, not irrigated
1
0
1
Bare soil, maintained outside, not irrigated
0
0
0
* These treatments were in place from June 19 through December 13, 1998. On this December date, all soil samples
were placed in the greenhouse and a 2-month-old rough lemon seedling was planted in each container. Alfalfa and
citrus seedlings initially planted in some of the soil samples were removed and replaced with rough lemon seedlings
as well. All plants were watered as needed and the soil in each container again was tested for Phytophthora on March
8, 1999.
** Soil samples were tested for the presence of P. parasitica on Jul 22 and Oct 6, 1998 and Mar 8, 1999.
Table 2. Soil temperatures from June 22 to October 6, 1998.
Soil location
In laboratory – Not irrigated
In greenhouse – Not irrigated
Soil outside in full sun – Not irrigated
In greenhouse with citrus seedling – Irrigated
Under citrus tree canopy – Yuma, AZ
Under citrus tree canopy – Mesa, AZ
Soil temperature (°C) at the 4-inch
depth
Minimum
Maximum
Mean
25
27
26
18
42
30
24
49
37
17
42
30
24
33
29
20
31
27
Table 3. Detection of Phytophthora parasitica in citrus grove soil after placement in different environmental conditions.
1999 study.
Number of soil samples in which P.
Soil Treatment
From Jul through Nov. 1998*
parasitica was detected **
Aug. 1999 Oct. 1999 Feb. 2000
Soil from the original collection site
9
7
3
Soil planted with citrus seedling, maintained in greenhouse, irrigated
8
8
4
Soil planted with alfalfa, maintained in the greenhouse, irrigated
9
7
5
Bare soil, maintained in the greenhouse, irrigated
9
10
5
Bare soil maintained in the greenhouse, not irrigated
0
0
1
Bare soil, maintained outside, not irrigated (1-qt container)
--0
Bare soil, maintained outside, not irrigated (top of 7-qt container)
--0
Bare soil, maintained outside, not irrigated (middle of 7-qt container)
--0
Bare soil, maintained outside, not irrigated (bottom of 7-qt container)
--0
* These treatments were in place from July 5 through November 4, 1999. On this November date, all soil samples in 1liter containers were placed in the greenhouse and a 6-month-old Citrus volkameriana seedling was planted in all soil
samples not already containing citrus or alfalfa plants. For soil in each 7-liter container, the top liter of soil was removed
and discarded. The 2nd, 4th, and 6th liter volumes of soil to be removed from each 7-liter container were saved and a
citrus seedling was planted in each of these soil samples. Soil samples already containing citrus or alfalfa plants were
not changed. All plants were watered as needed and the soil in each container again was tested for Phytophthora on
February 15, 2000.
** Soil samples were tested for the presence of P. parasitica on Aug 19 and Oct 12, 1999 and Feb 15, 2000.
Table 4. Soil temperatures from July 5 to October 12, 1999.
Soil location
In greenhouse – Not irrigated
Soil outside in full sun – Not irrigated (10 cm depth)
Soil outside in full sun – Not irrigated (30 cm depth)
In greenhouse with citrus seedling – Irrigated
Under citrus tree canopy – Yuma, AZ
Soil temperature (°C) at the 4-inch
depth
Minimum
Maximum
Mean
18
43
29
23
47
36
28
38
35
18
43
29
23
32
28
Effect of Foliar Boron Sprays on Yield and Fruit Quality of
Navel Oranges in 1998 and 19991
Michael Maurer and James Truman
Abstract
A field study was designed to determine if foliar boron (B) sprays could increase
fruit set and yield of ‘Parent Washington’ navel oranges (Citrus sinensis).
Treatments consisted of two application timings (prebloom and postbloom) and five
application rates 0, 250, 500, 750 and 1000 ppm B as Solubor. Leaf B levels had
a significant response to both application timing and rate in 1998, but there were
no significant differences in 1999. There were no significant difference in fruit
quality or yield in either year.
Introduction
Boron (B) is a micronutrient that is often thought to be toxic to many crops, even at low concentrations in
leaves. However, deficiency of B is equally serious, and may be a problem in Arizona citrus. Certainly, many
symptoms of B deficiency are apparent in Arizona citrus. The effects of B deficiency on vegetative growth of
citrus are well known, and occur when leaf B concentrations are less than 15 ppm. Some of these symptoms
include translucent or water-soaked flecks on leaves and deformation of those leaves, yellowing and
enlargement of the midrib of older leaves, death and abortion of new shoots, dieback of twigs, and gum
formation in the internodes of stem, branches and trunk (Reuther et al., 1968). Many of these symptoms are
seen in Arizona. Furthermore, the supply of B needed for reproductive growth in many crops is more than that
needed for vegetative growth (Mengel and Kirkby, 1982, Marschner, 1986; Hanson, 1991), and the same may
be true in citrus. Boron appears to accumulate in citrus peel to a much greater extent than in the leaves, ranging
in lemon from 1600 to 3500 ug.g-1 (Sinclair, 1984). Concentrations of B also may be higher in flower parts as
well. It is entirely possible that Arizona citrus appearing to have adequate B for vegetative growth may exhibit
deficiency symptoms during flowering, fruit set, and fruit maturation. In citrus, B deficiency leads to low sugar
content, granulation and excessive fruit abortion (Reuther et al., 1968) as well as rind thickening; symptoms
that are seen regularly in fruit grown here in Arizona. Increases in fruit set from B have been reported on
‘Redblush’ grapefruit (Maurer and Davies, 1993) and ‘Hamlin’ oranges, but no response on ‘Lisbon’ lemons
(Karim et al., 1996).
Materials and Methods
A field study was initiated on a block of six-year-old ‘Parent Washington’ navel orange trees (Citrus sinensis
L.) on a ‘Carrizo citrange’ rootstock located at the Cactus Lane, Bard Ranch north of Sun City, AZ. Treatment
were arranged as a 2 (spray timings) X 5 (application rates) factorial experiment with 10 single tree replicates
in a randomized complete block design. Treatment included two application timings of prebloom and post
1The authors would like to thank the Arizona Citrus Research Council for their support of this research. This is the final
report for project 99-03 - Effect of Foliar Boron Sprays on Yield and Fruit Quality of Navel Oranges.
This is a part of publication az1178: "2000 Citrus and Deciduous Fruit and Nut Research Report," College of
Agriculture and Life Sciences, the University of Arizona, Tucson, Arizona, 85721.
bloom and five boron (B) concentrations of 0, 250, 500, 750 and 1000 ppm. Applications were applied
prebloom (11 March 1998 and 22 March 1999) and postbloom (28 May 1998 and 5 May 1999) with a
handgun sprayer calibrated to deliver 200 gpa. Sodium borate (Solubor) was applied at rates of 0, 250, 500,
750 and 1000 ppm B. All treatments were applied with Activator 90 non-ionic surfactant at 0.1% v/v. Fruit
weight, juice weight, percent juice, peel thickness, total soluble solids (TSS), titratable acidity (TA), and
ratio(TSS:TA) were taken prior to harvest on 11 November 1998 and 1 December 1999 . Fruit samples
consisted of 10 fruit/tree from four trees per treatment. Fruit were sectioned equatorially so that the peel
thickness could be measured with a hand caliper and the juice extracted by hand with a Sunkist motor driven
extractor. TSS was determines with a handheld temperature-compensating refractometer and TA by titration of
a 25ml aliquot of juice using 0.3125 N NaOH to a endpoint of pH 8 on an autotitrator. Leaf tissue samples
collected 28 October 1998 and 27 September 1999 and analyzed by a commercial laboratory for leaf B levels.
Yield was determined by weighing and counting fruit that was harvested from each tree. Fruit were harvest on
12 November 1998 and on 21 December 1999.
Results and Discussion
Leaf B levels were significantly different between timing of application and rate of application in 1998 (Table
1). Leaf B levels were significantly higher for postbloom applications (140 ppm B) compared to the prebloom
applications (130 ppm B). In addition, there was a significant rate effect with the 750 and 1000-ppm B rates
significantly higher than the other treatments. However, there was no interaction between application timing
and rate. All leaf B levels were in the high range (100-200 ppm) for citrus (Tucker et al., 1995). The difference
between application timings can be attributed to leaf development stage at the prebloom application. There
were no significant differences in leaf B levels in 1999 (Table 2). Fruit weight, fruit number and average fruit
size taken at harvest was similar for treatments in both years (Table 1 and 2). Likewise, fruit weight, juice
weight, percent juice, peel thickness, total soluble solids, titratable acidity and ratio were similar for all
treatments in 1998 and 1999 (Table 3 and 4).
The results of this experiment indicate that foliar prebloom and postbloom applications have impact on navel
oranges. Although, increases in fruit production to prebloom foliar B sprays have been reported on ‘Hamlin’
oranges (Karin et al., 1996) and high levels of B resulted in an increase in fruit production on ‘Redblush’
grapefruit (Maurer and Davies, 1993) the two years of this study have not produced similar increases in
production. One possible explanation is that the ‘Hamlin’ orange and ‘Redblush’ grapefruit are seeded
cultivars that need pollination to set fruit. Navel oranges are set parthenocarpically and therefore do not need
stimuli of pollination to set fruit. Although previously reported, cooler than normal temperatures in the spring
of 1998 may have contributed to an optimum fruit set (Maurer and Taylor, 1999) this no longer appears to be
the case. The failure of navel oranges to respond to prebloom foliar B sprays is similar to those reported on
‘Lisbon’ lemons (Karim et al., 1996).
Literature Cited
Hanson, E.J. 1991. Movement of boron out of tree fruit leaves. HortScience. 26:271-273.
Karim, M.R., G.C. Wright and K.C. Taylor. 1996. Effect of foliar boron sprays on yield and fruit quality of
citrus. 1996 Citrus Research Report. University of Arizona, College of Agriculture, Tucson, AZ, Series P-105.
Marschner, H. 1986. Mineral nutrition of higher plants. Academic Press, San Diego, CA.
Maurer, M.A. and F.S. Davies. 1993. Use of reclaimed water for irrigation and fertilization of young
‘Redblush’ grapefruit trees. Proc. Fla. Hort. Soc. 106:22-30.
Maurer, M. and K. Taylor. 1999. Effect of foliar boron sprays on yield and fruit quality of navel oranges. 1999
Citrus and Deciduous Fruit and Nut Research Report. University of Arizona, College of Agriculture, Tucson,
AZ, Series P-117.
Mengel, K. and E. A. Kirkby. 1982. Principles of plant nutrition. International Potash Institute. Bern,
Switzerland.
Reuther, W., L.D. Batchelor and H.J. Webber. 1968. The citrus industry - Volume 2. University of California
Division of Agriculture, Oakland, CA.
Sinclair, W.B. The biochemistry and physiology of the lemon and other citrus fruits. University of California,
Division of Agriculture and Natural Resources. Publication No. 3306. Oakland, CA.
Tucker, D.P.H., A.K. Alva, L.K. Jackson and T.A. Wheaton. 1995. Nutrition of Florida Citrus Trees.
University of Florida, SP 169.
Table 1. Prebloom and postbloom boron spray applications effects on leaf B levels, fruit weight, number and
size of navel oranges, 1998.
Treatment
Leaf B level
Fruit weight
Fruit number
Fruit size
Timing
Rate
(ppm dry wt.)
(lb.)
(no.)
(lb.)
Prebloom
0
123
186
505
0.377
Prebloom
250
125
159
426
0.383
Prebloom
500
130
139
374
0.378
Prebloom
750
135
204
564
0.372
Prebloom
1000
140
168
502
0.352
Postbloom
0
128
133
344
0.396
Postbloom
250
133
162
455
0.373
Postbloom
500
140
156
441
0.371
Postbloom
750
140
124
342
0.375
Postbloom
1000
163
150
406
0.383
+
NS
NS
NS
*
NS
NS
NS
NS
NS
NS
NS
Significance
Timing
Rate
Timing*Rate
NS, +, * Nonsignificant or significant at P≤ 0.10 or 0.05, respectively.University of Florida, SP 169.
Table 2. Prebloom and postbloom boron spray applications effects on leaf B levels, fruit weight, number and
size of navel oranges, 1999.
Treatment
Leaf B level
Fruit weight
Fruit number
Fruit size
Timing
Rate
(ppm dry wt.)
(lb.)
(no.)
(lb.)
Prebloom
0
115
198
379
0.53
Prebloom
250
110
182
362
0.50
Prebloom
500
123
182
346
0.53
Prebloom
750
142
237
489
0.49
Prebloom
1000
119
186
392
0.49
Postbloom
0
115
165
311
0.55
Postbloom
250
128
190
372
0.53
Postbloom
500
133
188
373
0.51
Postbloom
750
115
155
304
0.52
Postbloom
1000
135
182
366
0.52
NS
NS
NS
NS
Significance
NS = Nonsignificant
Table 3. Prebloom and postbloom boron spray applications effects on fruit weight, juice, percent juice, peel
thickness, total soluble solids (TSS), titratable acid (TA) and ratio (TSS/TA)of navel oranges, 1998.
Treatment
Fruit
Juice
Percent
Peel
TSS
TA
Ratio
juice
thickness
weight
weight
Timing
Rate
(g)
(g)
(%)
(mm)
(%)
(%)
(TSS:TA)
Prebloom
0
1735
766
44
5.5
9.9
0.77
12.8
Prebloom
250
2010
921
46
5.8
9.7
0.75
13.1
Prebloom
500
1792
823
46
5.4
9.7
0.83
11.8
Prebloom
750
1815
821
45
5.8
9.8
0.76
12.9
Prebloom
1000
1644
742
45
5.2
9.8
0.74
13.4
Postbloom
0
1917
882
46
5.5
9.2
0.83
11.1
Postbloom
250
1875
868
46
5.3
9.6
0.79
12.2
Postbloom
500
1718
788
46
5.3
9.8
0.85
11.6
Postbloom
750
1802
816
45
5.6
9.4
0.78
12.4
Postbloom
1000
1927
890
46
5.5
9.7
0.75
13.0
NS
NS
NS
NS
NS
NS
NS
Significance
NS = Nonsignificant.
Table 4. Prebloom and postbloom boron spray applications effects on fruit weight, juice, percent juice, peel
thickness, total soluble solids (TSS), titratable acid (TA) and ratio (TSS/TA)of navel oranges, 1999.
Treatment
Fruit
Juice
Percent
Peel
TSS
TA
Ratio
weight
weight
juice
thickness
Timing
Rate
(g)
(g)
(%)
(mm)
(%)
(%)
(TSS:TA)
Prebloom
0
2281
1001
44
5.4
9.5
0.57
16.6
Prebloom
250
2345
1053
45
5.3
9.0
0.64
14.1
Prebloom
500
2212
989
45
5.3
9.1
0.65
14.2
Prebloom
750
2197
986
43
5.2
9.2
0.63
14.6
Prebloom
1000
2199
969
44
5.2
9.5
0.58
16.5
Postbloom
0
2230
1029
46
5.0
8.7
0.65
13.4
Postbloom
250
2289
1032
45
5.1
9.3
0.51
18.5
Postbloom
500
2365
1058
45
5.1
8.9
0.57
15.7
Postbloom
750
2348
1071
46
5.1
8.9
0.63
14.3
Postbloom
1000
2286
1009
44
5.6
9.2
0.55
16.9
NS
NS
NS
NS
NS
NS
NS
Significance
NS = Nonsignificant
Development of Best Management Practices for Fertigation
of Young Citrus Trees1
Thomas L. Thompson, Scott A. White, and Michael A. Maurer
Abstract
Microsprinkler irrigation offers excellent flexibility for site-specific management of
water and nitrogen inputs for citrus orchards in the southwestern United States.
Escalating water costs, declining water availability, and increasing regulation of
nitrogen (N) fertilizer use are causing growers to adopt practices to improve water
and N use efficiency. ‘Newhall’ navels on ‘Carrizo’ rootstock were planted in Jan.
1997 and an experiment was initiated. This experiment was continued during 1999.
The objective of the experiment was to develop appropriate management guidelines
for N fertigation of 3-4 year old microsprinkler-irrigated navel orange trees.
Treatments were factorial combinations of three N rates (0.15, 0.30, 0.45 lb N tree-1
yr-1) and three fertigation frequencies (3x/year, monthly, weekly). An untreated
control was included. Trunk diameter was not responsive to N rate or fertigation
frequency. Leaf N in all treatments, even controls, remained above the critical level
(2.5%). However, at each N rate leaf N was highest with the weekly fertigation
frequency. Nitrate analyses of soil samples indicate that nitrate leaching was
highest with the highest N rate and 3x/year fertigation. Frequent fertigation is
recommended because it results in higher leaf N and less nitrate leaching.
Introduction
Citrus production in the southwestern U.S. is highly dependent on inputs of irrigation water and N fertilizer to achieve
optimum fruit yield and quality. Growers realize that these inputs must be carefully managed to ensure optimum profits
and minimal environmental impacts. Microsprinkler irrigation offers growers increased control of irrigation water
applications compared to flood irrigation. In addition to allowing precise control of irrigation water applications,
microsprinkler systems offer the ability to use high frequency fertigation with fluid N materials throughout the 9-month
growing season. This greatly improves the potential for excellent N use efficiency due to decreased leaching losses.
Nitrogen fertilizer requirements for microsprinkler-irrigated citrus may differ from those of citrus receiving flood
irrigation. Some preliminary research on high frequency N fertigation has been done in Florida (Marler and Davies,
1989; Boman, 1996) but little research has been done in the west. Additional research is needed in the desert southwest
to evaluate the effects of fertigation frequency and fluid N application rate on the yield and fruit quality of microsprinkler
irrigated citrus. Further, best management guidelines for optimum fluid N application frequency and rate are needed for
microsprinkler irrigated citrus to augment existing BMPs for more conventional irrigation methods (Doerge et al.,
1991).
Current University of Arizona guidelines recommend applications of 0.25 to 0.75 lb N tree-1 yr-1 to three-year-old citrus
(Doerge et al., 1991). During the first two years of the current experiment, the trees were fertilized with 0.1 to 0.30 lb N
1 The authors would like to thank the Arizona Citrus Research for their partial support of this research. This is the final
report for project 99-04 - Development of Best Management Practices for Fertigation of Young Citrus Trees.
This is a part of publication az1178: "2000 Citrus and Deciduous Fruit and Nut Research Report," College of
Agriculture and Life Sciences, the University of Arizona, Tucson, Arizona, 85721.
tree-1 yr-1. Very little (<25%) of this N was taken up by the trees (Weinert, 2000). Therefore, N rates for young
microsprinkler-irrigated trees may need to be reduced from current rates.
The objective of this experiment was to develop appropriate management guidelines for N fertigation of 3-4 year old
microsprinkler-irrigated navel orange trees.
Materials and Methods
Site Characteristics. Field studies were conducted during the 1999 growing season at the University of Arizona Citrus
Agricultural Center in Waddell. The experiment is conducted on a Gilman loam. Chemical properties of the surface soil
are pH 8.0, Ece 0.7 dS/m, extractable K 702 ppm, exchangeable sodium <1%, and CaCO3 <1%. A uniform block of
‘Newhall’ navel orange trees on ‘Carrizo’ rootstock was used for this experiment. The trees were planted in Jan. 1997.
Cultural Practices. The trees are equipped with a microsprinkler irrigation system and plumbed to separately deliver
the 9 N fertigation frequency x rate treatments listed in Table 1. The experimental design is a randomized complete
block factorial with three N fertigation frequencies and three fluid N rates. There are 2 trees per plot and 5 replicate
plots per treatment. Five replicate unfertilized control plots are also included in the experiment.
Water and N are delivered through a microsprinkler irrigation system with all buried main lines and laterals and one
300o pattern microsprinkler per tree. The microsprinklers are placed on both sides of the trunk so that the spray pattern
covers the entire area within the drip line and water-trunk contact is avoided. The N is supplied as urea-ammonium
nitrate solution (UAN-32) and is injected into the appropriate fertigation lines using an in-line Dosatron injector.
All trees are irrigated uniformly 2 to 3 times per week. Daily readings of tensiometers placed at 12, 18, and 24-inch
depths are used to maintain soil moisture above about 1/3 available moisture depletion, which is the optimum level for
bearing citrus trees. All other cultural practices are done in accordance with accepted commercial standards.
Crop and Soil Measurements. Tree N nutritional status is monitored by late summer leaf tissue analysis (Doerge et al.,
1991) in each year. Soil samples were taken in one-foot increments to depths of 4 feet at the beginning of the study (Jan.
1997) and at the end of the 1997, 1998, and 1999 growing seasons. The soil samples were analyzed for 1M KClextractable NH4 and NO3.
Results and Discussion
Trunk diameter during 1999 was not responsive to either N rate or fertigation frequency (data not shown). Leaf N in all
treatments was above the critical level of 2.5% N, indicating that the trees were not deficient in N (Fig. 1). It is
interesting that even the control trees, which had not received N fertilizer in the previous two-and-a-half years, were
above the critical concentration. However, the trees receiving weekly fertigation had the highest leaf N at each N rate,
suggesting that frequent fertigation increases fertilizer N availability to the trees.
Soil samples analyzed for nitrate suggest important differences between treatments (Fig. 2). When N rate was <0.3 lb N
tree-1 yr-1, little nitrate was leached. On the other hand, application of 0.45 lb N tree-1 appeared to result in substantial
amounts of nitrate leaching. Similarly, nitrate leaching appeared to be minimal with weekly or monthly fertigation, and
higher with fertigation only 3 times per year.
Conclusions
Navel orange tree growth (trunk diameter) was relatively unresponsive to ranges of N rates and fertigation frequencies.
Leaf N remained above critical levels in all treatments, and was increased by weekly fertigation, compared to monthly or
3x yearly fertigation. Nitrate leaching was apparently highest at the highest N rate and with low fertigation frequency.
These results suggest, as did previous research, that N rates for young microsprinkler-irrigated navel oranges can be
reduced significantly from currently recommended rates. This experiment should be continued until trees are bearing
fruit to fully determine the effects of these treatments.
Literature Cited
1.
Boman, B.J. 1996. Fertigation enhances grapefruit yield. Fluid Journal, Fall 1996, p. 10-13.
2.
Doerge, T.A., R.L. Roth, and B.R. Gardner. 1991. Nitrogen fertilizer management in Arizona. University of
Arizona, College of Agriculture, No. 191025.
3.
Marler, T.E. and F.S. Davies. 1989. Microsprinkler irrigation scheduling and pattern effects on growth of
young ‘Hamlin’ orange trees. Proc. Fla. State Hort. Soc. 102:57-60.
4.
Weinert, T.A. 2000. Optimizing nitrogen management for microsprinkler-irrigated citrus in central Arizona.
Ph.D. Dissertation. University of Arizona.
Table 1. Fertigation frequency and N fertilizer application rate treatments for the 1999 growing season.
Treatment
N Fertigation
Frequency
Fertigation
Events per
Season
Cumulative N
Rate
lb/tree
1
3X/year
3
0.15
2
Monthly
9
0.15
3
Weekly
36
0.15
4
3X/year
3
0.3
5
Monthly
9
0.3
6
Weekly
36
0.3
7
3X/year
3
0.45
8
Monthly
9
0.45
9
Weekly
36
0.45
10
None
0
0
Girdling ‘Fairchild’ Mandarins and ‘Lisbon’ Lemons to
Improve Fruit Size
Glenn C. Wright
Yuma Mesa Agriculture Center, University of Arizona
Abstract
‘Fairchild’ mandarins in the Phoenix area and ‘Lisbon’ lemons in Yuma were
girdled beginning in November 1996. November, March and May girdling of
the mandarins led to the greatest yield the first year, while March and May
girdling led to the greatest yield in years 2 and 3. March girdling yield
increases were generally due to greater fruit numbers, while in May, yield
increases were due to greater fruit numbers and fruit size. Returns per acre
suggest that March and or May girdling of mandarins will lead to greater
profits for the grower. Like mandarins, lemon yields were greater following
November, or November and March girdling after one year of the experiment.
However, yields of these trees dropped considerably the second year, and the
trees appear to be in an alternate bearing cycle. No lemon girdling treatment
appears to be better than the untreated trees after three years.
Introduction
It is well recognized that medium to large fruit size is one key to profitable citrus production in Southwest Arizona.
Although extra large sized mandarins are sometimes hard to market due to the potential for granulation, small
sized fruit receive poor prices throughout the season, except when there is a fruit shortage. Prices for medium to
large sized fruit, on the other hand, remain strong during the entire harvest season from October until February.
Los Angeles Terminal Fruit Market FOB prices for 1st grade mandarins of large and mammoth size and above is
seldom below $8.00, while for smaller sizes, the price may drop below $5.00 per box.
For lemons, medium and small size lemons command good prices early in the season, but these prices drop
precipitously during the late fall. Prices for large fruit, on the other hand, remain strong during the desert lemon
harvest season from August until February. Los Angeles Terminal Fruit Market FOB prices for 1st grade lemons
of size 140 and above are seldom below $15.00, while for smaller sizes, the price may drop below $6.00 per box.
Fruit growth of citrus can be subdivided into four phases. Cell division occurs primarily in phase I. This phase
lasts from 1 to 1½ months following anthesis (flowering), and final fruit size is at least partly dependent on the
number of cells produced during this period. Following phase II, a period of cell differentiation, phase III occurs
when those cells begin to enlarge. This phase generally lasts between 2 and 3 months. Final fruit size also depends
upon the magnitude of that enlargement, as cells may increase in volume up to 1000 percent. Phase IV occurs
when the peel begins to color, fruit solids increase and fruit acids decrease.
The author would like to thank Mr. James Truman, Mr. Armando Gonzalez, Mr. Marco Peña, and Mr. Philip Tilt
for their assistance with this project.
This is a part of publication az1178: "2000 Citrus and Deciduous Fruit and Nut Research Report," College of
Agriculture and Life Sciences, the University of Arizona, Tucson, Arizona, 85721.
The three principal factors influencing fruit growth rate are soil moisture, temperature during the growing season
and carbohydrate partitioning to the fruit. The citrus grower can influence soil moisture through proper irrigation,
but it is difficult to affect orchard temperature. Carbohydrate partitioning to the fruit, however, can be altered. It
is commonly accepted that the carbohydrates available to any particular fruit are dependent upon the presence of
carbohydrate sources (leaves), and the number of competitive carbohydrate sinks such as other fruit, rapidly
growing shoots and the roots. Elimination of competitive sinks is one of the primary methods for improving fruit
size. Thinning is practiced in deciduous fruit crops to eliminate competition by other fruits, but is not usually
practiced in citriculture. Pruning to eliminate competitive shoots has not been studied in citrus. The practice of
girdling to temporarily remove the competition from roots, however, is an old horticultural technique that may
hold promise. Temporary removal of the roots as a competitive sink for available carbohydrates may improve fruit
size and returns to the grower without harming the tree.
Effects of girdling on fruit size are mixed. Both Shamel and Pomeroy (1944) and Ghayur and Khan (1962)
reported smaller fruit size of ‘Washington Navel’ orange and mandarin, respectively. Krezdorn (1960) and
Krezdorn et al. (1968), working with ‘Orlando’ tangelo, and Shamel and Pomeroy (1934), working with
‘Washington Navel’ orange reported no change in fruit size. In contrast, Cohen (1984) reports that early summer
(June) girdling tended to increase fruit size (+15%), compared with mid-bloom girdling on ‘Shamouti’ mandarin.
Cohen (1984) also suggests that the number of leaves from which a fruit can draw carbohydrates affects fruit size.
Girdling too early will lead to too many fruits per leaf, thus reducing fruit size. Girdling too late will lead to a
smaller increase in fruit size. Summer girdling should be after ‘June drop’ but as soon as possible after it (phase
III) to achieve the greatest effect. Mataa et al. (1998) reported that July and September improved fruit size, but
November girdling did not. Alternatively, local reports indicate that girdling mandarins in November lead to
greater fruit size, because more fruit is set in the interior of the tree during phase I (H. Ormsby -- personal
communication).
While girdling studies have been conducted on some varieties of mandarins, we have been unable to find any
investigations of the practice on ‘Fairchild’ mandarins or any evidence of a study of the practice on bearing
lemons. Because the studies cited indicate that the effects of girdling vary depending on the citrus variety or
species we feel that additional work on ‘Fairchilds’ and on lemons is necessary.
Therefore, our objective in this study is to determine the effect of girdling time on fruit size, fruit quality and yield
of ‘Fairchild’ mandarins and ‘Lisbon’ lemons.
Materials and Methods
We recognized that girdling has the potential to injure the tree, and followed procedures that minimize that
possibility. Therefore, girdling was done only on healthy trees. Studies show that trees that are improperly
irrigated show more injury than to trees that are properly irrigated (Cohen 1981; Cohen, 1984). Research also
shows that thin girdling (2.5-4 mm cut) is less likely to be injurious than a thicker girdle.
‘Fairchild’ Mandarins – This portion of the research was conducted at the University of Arizona Citrus
Agriculture Center at Waddell, AZ. Ninety-six ‘Fairchild’ mandarin trees on three different rootstocks were
included in this study. Trees were subject to one of 4 treatments, March girdling, May girdling, November
girdling or an untreated control.
A treatment unit in this study was a pair of trees, one on ‘Carrizo rootstock’ and the other on either ‘Rough lemon’
or ‘C. volkameriana’ rootstock. There were four treatment units, eight trees per block, one treatment unit (2 trees)
for each of the four treatments, and 12 blocks (replications) in the experiment. All trees, except the control were
girdled by a spiral, single cut between the 10th and the 30th of the specified month using a 3/16-inch wide doublebladed girdling knife. For the 1997 harvest season, girdling began in November 1996.
Trees were harvested on 12/4/97, 12/17/98 and 12/28/99. For the first two years fruit was weighed and then sized
using a circular, rotating fruit sorting table (GREEFA Machinebouw B.V., Tricht, Netherlands). Fruit was then
graded manually. For both 1997-98 and 1998-99 harvest seasons, fruit quality measurements (juice content, total
solids, total acid, solid to acid ratio were collected on a 15 fruit sample per tree. For 1999, the fruit was passed
through an automated electronic eye sorter (Autoline, Inc., Reedley, CA), which provides weight, color, exterior
quality and size data for each fruit. No interior fruit quality measurements were collected in 1999/2000.
Economic impact was calculated using a weighted average price net return per carton figure from a commercial
Yuma packinghouse. The receipts per acre are gross returns that do not include any pre-harvest costs. Per acre
estimates were based on 109 trees per acre (20 x 20 spacing).
Data was analyzed by analysis of variance, and treatment means separation using the General Linear Model found
in SPSS for Windows (SPSS Inc., Chicago, IL). Experimental design was randomized complete block
‘Lisbon Lemons’ - This portion of the research was conducted at the University of Arizona Yuma Mesa
Agriculture Center at Yuma, AZ. Thirty ‘Limoneira 8A Lisbon’ lemon trees on Citrus volkameriana rootstock
were included in this study. Trees were subject to one of 5 treatments, March girdling, May girdling, November
girdling November and March girdling or an untreated control.
A treatment unit in this study was one tree. There were five treatment units per block, one treatment unit for each
of the five treatments, and 6 blocks (replications) in the experiment. All trees, except the control were girdled by a
spiral, single cut between the 10th and the 30th of the specified month using a 3/16-inch wide double-bladed
girdling knife.
Trees were harvested on 10/24/97, 1/8/98, 11/2/98, 1/14/99, 9/29/99, 11/6/99 and 2/3/00. For the first two years
fruit was weighed and then sized using metal fruit sizing rings commonly used by fruit pickers. Fruit was then
graded manually. For 1999, the fruit was passed through an automated electronic eye sorter (Autoline, Inc.,
Reedley, CA), which provides weight, color, exterior quality and size data for each fruit. No interior fruit quality
measurements were collected.
Data was analyzed by analysis of variance, and treatment means separation using the General Linear Model found
in SPSS for Windows (SPSS Inc., Chicago, IL). Experimental design was randomized complete block.
In both locations, trees were watered and fertilized according to normal horticultural practices common to the
desert southwest.
Results and Discussion
‘Fairchild’ Mandarins – For the 1997-98 harvest season, all treatments led to improved yield, compared to the
control (Table 1). Improved yield ranged from a 49% increase for the May girdled trees, to a 141% increase for
the November girdled trees, to a 217% increase for the March girdled trees.
For the November and March girdled trees, fruit size was generally smaller than for the other treatments. Both
these treatments had greater numbers of small and medium sized fruits, and smaller numbers of jumbo and
mammoth sized fruit. This suggests that these two treatments led to increased fruit set and/or fruit retention,
perhaps through improved carbohydrate allocation to the developing fruitlets. Nonetheless the larger population of
fruit on the tree also led to smaller fruit size. There was no effect of girdling on the percentage of large sized
fruits, but May girdled trees had a greater percentage of mammoth, jumbo and colossal-sized fruits. This suggests
that the May girdling treatment led to improved cellular growth of fruits that survived the post-anthesis drop.
Since we did not actually count fruit numbers, it is difficult to know if the improved yield for the May girdled trees
is also due to improved fruit retention.
Gross receipts per acre were greater for any of the girdling treatments compared to the control. For the November
and the March girdled trees the impact of smaller fruit size was offset by larger yields. This impact was more
pronounced for the March girdled trees. For the May girdled trees, despite a smaller yield than the November and
March treatments, comparatively larger fruit size led to greater returns per acre.
Juice content of control tree fruit was significantly greater than that of the girdle treatments (Table 2). This may be
because the girdling did not inhibit root growth of these trees, thus hydraulic conductivity was greater. Total acid
percentage of the control fruit was also greater than that of the girdled trees fruit, while there was no difference in
the total soluble solid percentage between any of the treatments. Thus, the solid to acid ratio of the control fruits
was less. This result is in contrast with that of Damigella et al. (1970) who found that girdling ‘Clementine’
mandarins had no effect on fruit ripening. There was no effect of the treatments upon peel thickness.
For the 1998-99 harvest season, the March and May treatments led to improved yield, compared to the control,
while the November yield was significantly reduced (Table 3). Yields showed a 35% increase for the March
girdled trees, and a 46% increase for the May girdled trees compared to the control. In contrast to the previous
season, trees girdled in November had 43% less yield than the control. Although tree canopy volume data has not
yet been collected, it appears as though trees girdled in November are smaller than the others. This may account
for the reduced yield of this treatment.
The 1998-99 harvest was characterized by a smaller fruit size in general, compared with the previous season,
especially when one compares the percentage of jumbo and mammoth sized fruit. For the November girdled trees,
fruit size was generally larger than for the other treatments, which is to be expected since the smaller population of
fruit on the tree led to larger fruit size. Ungirdled, May and March girdled trees had generally smaller fruit size
compared with the November treatment. In the case of all treatments, this is most likely due to the larger fruit
number.
Because of the small fruit size for this year, the economic impact of the treatments is not as great as the previous
year. An acre of ungirdled trees would have cost the producer almost $53.00 even before costs of production were
included. Trees girdled in May were barely profitable, while those girdled in November and March returned about
$200.00 per acre before pre-harvest costs.
Unlike the previous season, there was little effect of treatment upon fruit quality in 1998-99 (Table 4).
For the 1999-2000 harvest season, yield of all trees increased regardless of treatment, compared with 1998-99
(Table 5). Like the previous year, the March and May treatments led to improved yield, compared to the control,
while the November yield was reduced compared to the control. Yields showed an 11.5% (non-significant)
increase for the March girdled trees, and a 21% increase for the May girdled trees compared to the control. In
contrast to the previous season, trees girdled in November had only 13% less yield than the control.
Fruit size was much greater in 1999-2000 than in 1998-99. Just as in 1997-98, for the November and March
girdled trees, fruit size was generally smaller than for the other treatments. Both these treatments had greater
numbers of small and medium sized fruits, and smaller numbers of jumbo and mammoth sized fruit. Since the
November trees had both low yield and small fruit size, it is possible that this treatment is harming the trees. The
May treatment had large fruit size and high yield, suggesting again that girdling at this time of the year improves
fruit cell growth.
The economic impact of the treatments for 1999-2000 was varied. Unlike 1997-98 and 1998-99, the November
and March girdling treatment had lower returns than the control treatment because the yields were similar to
control trees, but there was more small fruit. In contrast, the May treatment had higher yields than the control and
had similar to larger fruit size, which led to the greatest return per acre of the four treatments.
The average gross return per acre of the four treatments for the three year period of this study are as follows:
Control - $518.67; November girdling - $498.49; March girdling - $715.53; May girdling - $741.26. Based on the
these figures it is apparent that, for the three years of this study, girdling in March or May is preferable to girdling
in November, or to not girdling at all. Although March girdling led to smaller fruit size than in the control in 2 of
the 3 years of this study, greater yields propelled this treatment to the forefront. May girdling yields were also
always greater than the control trees, but returns in this case were due to larger fruit size.
‘Lisbon Lemons’ – Lemons had a very different response to girdling than did the ‘Fairchild’ mandarins (Table 6).
Like the mandarins, yield of girdled trees was significantly larger than the control trees the first harvest following
treatments. However, the second year, those trees that had large yields the first year had much reduced yield the
next. The third year, yields for those same trees increased. Thus, girdling seems, up to this point, to put the trees
into a mild alternate bearing cycle that is not apparent in the ‘Fairchilds’. Also unlike the mandarins, we saw no
effect of the girdling treatments upon fruit size or exterior fruit quality (data not shown). Thus, girdling appears to
only affect fruit set or fruit retention in lemons.
References
Cohen, A. 1981. Recent developments in girdling of citrus trees. Proc. Intl. Soc. Citriculture. 1:196-199.
Cohen, A. 1984. Citrus fruit enlargement by means of summer girdling. Jour. Hort. Sci. 59:119-125.
Damigella, P., E. Tribulato and G. Continella. 1970. Comparative trials with gibberellic acid, girdling and foliar
fertilizing on clementines (Citrus clementina Hort.). Tecnica Agricola 22:508-525.
Ghayur, A. and M.D. Khan. 1962. Effects of ringing on the growth vigor, yield and chemical composition of
mandarin oranges at Lyallpur, West Pakistan. III. Fruit yield. Agric. Pakistan 13:61-66.
Krezdorn, A.H. 1960. The influence of girdling on the fruiting of ‘Orlando’ tangelos and navel oranges. Proc.
Florida State Hort. Soc. 73:49-52.
Krezdorn, A.H., and W.J. Wiltbank. 1968. Annual girdling of ‘Orlando’ tangelos over an eight-year period. Proc.
Florida State Hort. Soc. 81:29-35.
Mataa, M., S. Tominaga, and I. Kozaki. 1998. The effect of time of girdling on carbohydrates and fruiting in
‘Ponkan’ mandarin (Citrus reticulata Blanco). Scientia Horticulturae 73:203-211.
Shamel, A.D. and C.S. Pomeroy. 1934. Girdling ‘Valencia’ orange trees. California Citrograph 19:176
Mataa, M., S. Tominaga, and I. Kozaki. 1998. The effect of time of girdling on carbohydrates and fruiting in
‘Ponkan’ mandarin (Citrus reticulata Blanco). Scientia Horticulturae 73:203-211.
Shamel, A.D. and C.S. Pomeroy. 1944. Effect of trunk girdling on the performance of ‘Washington’ navel orange
trees. Proc. Amer. Soc. Hort. Sci. 44:80-84.
Table 1. 1997-98 Yield and packout of ‘Fairchild’ mandarins subject to girdling treatments.
Fruit Size (%)
Girdling Time
Yield
Small
Medium
Large
Jumbo
Mammoth
(lbs. per
tree)
Colossal
SuperColossal
Economic Impact
Net
Gross Receipts
Returns
per acre
per cartony
($)
($)
$3.40
$497.81
$1.76
$622.57
$2.16
$1,005.06
$4.07
$886.52
Control
50.4 dz
6.2 b
23.9 b
39.7 a
23.2 b
8.4 b
0.1 b
0.0 a
November
121.5 b
17.8 a
44.6 a
30.2 b
6.8 c
0.8 c
0.0 b
0.0 a
March
159.8 a
14.7 a
41.1 a
32.2 b
11.1 c
1.9 c
0.1 b
0.0 a
May
75.0 c
2.8 b
17.4 b
32.1 b
28.9 a
18.0 a
1.5 a
0.1 a
z
Means separation by Duncan’s Multiple Range Test, α=0.05. Values within the same column with different letters are significantly different.
y
This figure calculated as a weighted average of the returns per carton of first grade fruit less the cost of picking, hauling and packing the fruit. In this case, the
figures are based on a return of $0.79 per 37.5 lb. carton for small, colossal and super-colossal fruit,, $5.87 for medium, $7.18 for large, $8.28 for jumbo, $11.86 for
mammoth fruit, and $3.82 per carton for picking, hauling and packing.
Table 2. 1997-98 Fruit Quality of ‘Fairchild’ mandarins subject to girdling treatments.
Girdling
Juice Content
Total Soluble Solids
Total
TSS:TA
Peel
Time
(%)
(%)
Acid
Thickness
(%)
(mm)
Control
48.3 a
12.8 a
0.92 a
14.2 c
2.6 b
November
43.6 c
12.8 a
0.80 b
16.3 a
2.6 b
March
46.5 ab
13.0 a
0.82 b
16.0 ab
2.9 a
May
46.1 b
12.5 a
0.85 ab
15.0 bc
2.7 b
Z
Means separation by Duncan’s Multiple Range Test, α=0.05. Values within the same column with different
letters are significantly different.
Table 3. 1998-99 Yield and packout of ‘Fairchild’ mandarins subject to girdling treatments.
Fruit Size (%)
Economic Impact
Girdling
Yield
Small
Medium
Large
Jumbo
Mammoth
Colossal
SuperNet Returns per Gross Receipts
Time
(lbs. per
Colossal
cartony
per acre
tree)
($)
($)
z
Control
96.68 b
29.5 a
40.7 a
21.6 c
2.3 b
0.0 b
0.0 a
0.0 a
-$0.19
-$52.91
November
55.18 c
12.0 c
35.9 b
37.2 a
5.8 a
0.4 a
0.0 a
0.0 a
$1.17
$188.25
March
141.69 a
21.1 b
38.1 ab
31.5 b
3.2 b
0.1 b
0.0 a
0.0 a
$0.53
$216.36
May
130.55 a
25.4 b
40.5 a
25.5 c
2.5 b
0.0 b
0.0 a
0.0 a
$1.10
$38.12
Z
Means separation by Duncan’s Multiple Range Test, α=0.05. Values within the same column with different letters are significantly different.
y
This figure calculated as a weighted average of the returns per carton of first grade fruit less the cost of picking, hauling and packing the fruit. In this
case, the figures are based on a return of $1.06 per 37.5 lb. carton for small, colossal and super-colossal fruit, $5.00 for medium, $7.98 for large, $13.65
for jumbo, $18.12 for mammoth fruit, and $4.57 per carton for picking, hauling and packing.
Table 4. 1998-99 Fruit Quality of ‘Fairchild’ mandarins subject to girdling treatments.
Girdling
Juice Content
Total Soluble Solids
Total
TSS:TA
Peel
Time
(%)
(%)
Acid
Thickness
(%)
(mm)
Control
50.2 a
14.7 a
1.47 a
10.0 a
2.7 a
November
50.5 a
14.0 b
1.43 a
10.1 a
2.7 a
March
49.4 a
14.5 ab
1.40 a
10.6 a
2.8 a
May
50.9 a
14.4 ab
1.39 a
10.1 a
2.7 a
Z
Means separation by Duncan’s Multiple Range Test, α=0.05. Values within the same column with different
letters are significantly different.
Table 5. 1999-2000 Yield and packout of ‘Fairchild’ mandarins subject to girdling treatments.
Fruit Size (%)
Economic Impact
Girdling
Yield
Small
Medium
Large
Jumbo
Mammoth
Colossal
SuperNet Returns per Gross Receipts
Time
(lbs. per
Colossal
cartony
per acre
tree)
($)
($)
z
Control
199.0 bc
4.2 b
21.5 b
47.7 a
21.1 a
4.7 a
0.9 a
0.0 a
$1.92
$1,111.13
November
175.7 c
9.5 a
28.0 a
45.1 ab
14.1 b
2.1 b
1.1 a
0.0 a
$1.34
$684.65
March
221.9 ab
8.9 a
31.4 a
40.7 b
13.9 b
4.0 ab
1.2 a
0.0 a
$1.43
$925.18
May
240.2 a
4.5 b
22.9 b
47.2 a
19.9 a
4.5 a
1.0 a
0.0 a
$1.86
$1,299.14
Z
Means separation by Duncan’s Multiple Range Test, α=0.05. Values within the same column with different letters are significantly different.
y
This figure calculated as a weighted average of the returns per carton of first grade fruit less the cost of picking, hauling and packing the fruit. In this case,
the figures are based on a return of $2.00 per 37.5 lb. carton for small, and super-colossal fruit, $5.38 for medium, $6.53 for large, $8.28 for jumbo, $12.21 for
mammoth fruit, $10.85 for colossal fruit and an estimated $4.85 per carton for picking, hauling and packing.
Table 6. Lemon yield, fruit size and packout of lemon trees subject to girdling treatments.
Yield per tree (lb)
Girdling Month
November
March
May
November and March
Control
1997-98
42.12 a
28.77 b
27.48 b
49.57 a
28.80 b
1998-99
45.17 b
153.33 a
153.83 a
54.00 b
155.17 a
1999-2000
84.87 b
92.73 b
72.46 b
132.18 a
98.66 b
Total
172.16 b
274.83 a
253.77 a
235.75 a
282.63 a
Average
57.38 b
91.61 a
84.59 a
78.58 a
94.21 a
Results of Scion and Rootstock Trials for Citrus in Arizona 19991
Glenn C. Wright, and Marco A. Peña
Department of Plant Sciences, U. of A., Yuma Mesa Agriculture Center, Yuma, AZ
Abstract
Five rootstocks, ‘Carrizo’ citrange, Citrus macrophylla, Rough lemon, Swingle
citrumelo and Citrus volkameriana were selected for evaluation using
'Limoneira 8A Lisbon' as the scion. 1999-2000 results indicate that trees on C.
macrophylla and C. volkameriana are superior to those on other rootstocks in
both growth and yield. C. macrophylla is outperforming C. volkameriana.
Rough lemon is intermediate, and ‘Swingle’ and Carrizo’ are performing
poorly. In a similar trial, Four 'Lisbon' lemon selections, 'Frost Nucellar',
'Corona Foothills', 'Limoneira 8A' and 'Prior' were selected for evaluation on
Citrus volkameriana rootstock. 1998-99 results indicate that the 'Limoneira
8A Lisbon' and ‘Corona Foothills Lisbon’ are superior in yield and fruit
earliness. Results from another lemon cultivar trial suggest that ‘Cavers
Lisbon’, Limonero Fino 49’ and “Villafranca’ lemons may be good candidates
for plantings as well. Results from two other lemon scion trials, a navel orange
cultivar trial and a ‘Valencia’ orange trial, and a mandarin trial are presented
as well.
Introduction
There is no disputing the importance of citrus cultivars and rootstocks to desert citrus production. A successful
citrus cultivar must be adaptable to the harsh climate, (where average high temperatures are often greater than
40°C), must be vigorous and must produce high yields of good quality fruit of marketable size. Likewise, the ideal
citrus rootstock must be compatible with the scion, be adaptable to the appropriate soil and climactic factors and
should also improve one or more of the following characteristics: pest and disease resistance, cold tolerance,
harvest date, internal and external fruit quality, yield and post-harvest quality. Ultimately, the value of a rootstock
lies in its ability to improve production and/or quality of the fruit.
Therefore, the first scion and rootstock cultivar trials that we planted in 1993 is revealing the appropriate lemon
scions and rootstocks for the Arizona industry. The lemon scion trial includes ‘Limoneira 8A Lisbon’, ‘Prior
Lisbon’, ‘Frost Nucellar Lisbon’, and ‘Corona Foothills Lisbon’ lemon on C. volkameriana as the rootstock. The
lemon rootstock trial includes rough lemon (C. jambhiri), C. volkameriana, C. macrophylla, ‘Carrizo’ citrange and
‘Swingle’ citrumelo as the rootstocks and ‘Limoneira 8A Lisbon’ lemon as the scion. Data collected from these
trials includes tree growth, mineral nutrition, fruit quality, fruit size and total yield. Previous results from this trial
1
The authors wish to thank the Arizona Citrus Research Council for supporting this research. This is a final
report for project 99-07 – Citrus rootstock and cultivar breeding and evaluation for the Arizona citrus industry –
1999.
This is a part of publication az1178: "2000 Citrus and Deciduous Fruit and Nut Research Report," College of
Agriculture and Life Sciences, the University of Arizona, Tucson, Arizona, 85721.
have been reported in Wright et al. (1999), Wright (1998), Wright (1997), Wright (1996) and Wright (1995).
These trials are hereafter referred to as 1993 Lisbon Lemon Scion Trial and 1993 ‘Lisbon’ Lemon Rootstock Trial.
Two additional rootstock trials, planted in 1995, are now in production. The first of these has ‘Limoneira 8A
Lisbon’ lemon as the scion, and an ‘African’ Shaddock x ‘Rubidoux’ trifoliate orange, ‘C-35 Citrange’, ‘Citremon
1449’, C. taiwanica, C. volkameriana, or “Yuma Citrange’ as the rootstock. This trial is hereafter referred to as
1995 ‘Limoneira 8A’ rootstock trial.
The second trial planted in 1995 has ‘Limonero Fino 49’ lemon as the scion. Fino 49 is the common fall and
winter harvested lemon grown in Spain. Rootstocks in this trial include ‘African’ Shaddock x ‘Rubidoux’ trifoliate
orange, ‘C-35’ Citrange, ‘Carrizo’ Citrange, ‘Citremon 1449’, C. macrophylla, C taiwanica, C. volkameriana,
Rough Lemon (C. jambhiri), or ‘Swingle’ citrumelo. This trial is hereafter referred to as 1995 ‘Limonero Fino 49’
rootstock trial.
We are now also able to collect lemon yield data from the citrus variety block. This trial, established in 1995,
contains ‘Allen Eureka’, ‘Cascade Eureka’, ‘Cook Eureka’, ‘Cavers Lisbon’, ‘Frost Nucellar Lisbon’, ‘Limoneira
8A Lisbon’, ‘Prior Lisbon’, ‘Rosenberger Lisbon’, ‘Limonero Fino 49’ and ‘Villafranca’ all on C. volkameriana
rootstock. This trial is hereafter known as 1995 Lemon Scion Trial.
1999 was the third year that we were able to get data from the navel orange trial. This trial, established in 1995,
contains ‘Lane Late’, ‘Atwood’, ‘Fisher’, ‘Parent Washington’, and ‘Tulegold’ navel orange cultivars on ‘Carrizo’
rootstock.
1999-2000 was the second year that we were able to collect data on a ‘Valencia’ orange trial. This trial,
established in 1996 contains ‘Olinda’, ‘Delta’ and ‘Midknight Valencia’ oranges on ‘Carrizo citrange’, ‘C-35’
Citrange’ or C. volkameriana rootstock.
Finally, 1999-2000 was the first harvest year for our trial of ‘Fallglo’ mandarin, an early ripening recent release
out of the University of Florida.
Materials and Methods
1993 Lemon Rootstock and 1993 Lemon Scion Trials. These trials were established in March 1993 in Block 26 of
the Yuma Mesa Agricultural Center, near Yuma, Arizona. The land was laser leveled and fumigated prior to
planting. Trees were planted on a 10-m x 10-m spacing. Ten replicates of each of the 5 rootstocks were planted,
and 12 replicates of each of the 4 scions were planted, for a total of 98 trees. Experimental design is randomized
complete block.
Irrigation is border flood, and normal cultural practices are used. Growth data, expressed as trunk diameter, was
taken annually through 1997. Measurements were taken about 4 inches above the bud union. These locations are
permanently marked with paint. Trunk diameters were taken annually in March, so as to quantify any differential
growth rates that might have occurred. Leaves are collected annually in August for mineral analysis, however
there have been no significant differences. Fruit diameter data was collected semiweekly in 1999. One fruit of a
representative size per tree was tagged, and was measured until harvest. Replacement fruits of approximately the
same size were selected if a fruit was harvested or if it abscised. Yield data is collected during the fall and winter.
Trees were ring or strip-picked as noted below. About 30 lbs of fruit is sampled from each tree, and fruit packout
data is collected from the sample. For years prior to 1999-2000, fruits were sized by hand and graded by
observation, and reported on a percentage basis. For 1999-2000, the fruit was passed through an automated
electronic eye sorter (Autoline, Inc., Reedley, CA), which provides weight, color, exterior quality and size data for
each fruit. Fruit quality data was collected at each harvest time. These data include °brix, peel thickness,
percentage juice, pH, and total soluble solids to total acid ratio. There was no effect of scion or rootstock on fruit
quality (data not shown).
1995 ‘Limoneira 8A’ Rootstock Trial. These trials were established in June 1995 in Block 26 of the Yuma Mesa
Agricultural Center, near Yuma, Arizona. The land was laser leveled and fumigated prior to planting. Trees were
planted on a 10-m x 10-m spacing. There are five complete blocks containing each of the six rootstocks,
additionally, there are four blocks that lack the ‘African’ Shaddock x ‘Rubidoux’ trifoliate orange, and the ‘Yuma’
Citrange. Yields are expressed as lb. fruit per tree. Yield data is collected during the fall and winter. Trees were
ring or strip-picked as noted below. For 1999-2000, the fruit was passed through an automated electronic eye
sorter (Autoline, Inc., Reedley, CA), which provides weight, color, exterior quality and size data for each fruit.
1995 ‘Limonero Fino 49’ Rootstock Trial. These trials were established in June 1995 in Block 26 of the Yuma
Mesa Agricultural Center, near Yuma, Arizona. The land was laser leveled and fumigated prior to planting.
Trees were planted on a 10-m x 10-m spacing. There are ten complete blocks containing each of the nine
rootstocks. Yields are expressed as lb. fruit per tree. Yield data is collected during the fall and winter. Trees were
ring or strip-picked as noted below. For 1999-2000, the fruit was passed through an automated electronic eye sorter
(Autoline, Inc., Reedley, CA), which provides weight, color, exterior quality and size data for each fruit.
1995 Lemon Scion Trial. These trials were established in March 1995 in Block 17 (Foundation Block) of the
Yuma Mesa Agricultural Center, near Yuma, Arizona. The land was laser leveled and fumigated prior to planting.
Trees were planted on a 10-m x 10-m spacing. Three to five trees of each scion were planted. Yields are
expressed as lb. fruit per tree. Yield data is collected during the fall and winter. Trees were ring or strip-picked as
noted below. For 1999-2000, the fruit was passed through an automated electronic eye sorter (Autoline, Inc.,
Reedley, CA), which provides weight, color, exterior quality and size data for each fruit.
1995 Navel Orange Trial. This trial was established in March 1995 in Block 18 of the Yuma Mesa Agricultural
Center, near Yuma, Arizona. The land was laser leveled and fumigated prior to planting. Trees were planted on a
10-m x 10-m spacing. Twelve trees of each of five scions were planted, for a total of 60 trees. Yields are
expressed as lbs. fruit per tree. Yield data is collected during the fall and winter. For 1999-2000, the fruit was
passed through an automated electronic eye sorter (Autoline, Inc., Reedley, CA), which provides weight, color,
exterior quality and size data for each fruit.
1996 Valencia Orange Trial. This trial was established in June 1996 in Blocks 18 and 26 of the Yuma Mesa
Agricultural Center, near Yuma, Arizona. The land was laser leveled and fumigated prior to planting. Trees were
planted on a 10-m x 10-m spacing. There are ten complete blocks of each of the nine scion-rootstock combinations
possible. Yields are expressed as lbs. fruit per tree. Yield data was first collected during 1998-99. For 1999-2000,
the fruit was passed through an automated electronic eye sorter (Autoline, Inc., Reedley, CA), which provides
weight, color, exterior quality and size data for each fruit. Granulation values are determined by visual inspection
of fruit cut longitudinally and calculated as the average of a 15 or 25 fruit sample.
Fallglo Mandarin Trial. This trial was established in June 1995 in Block 26 of the Yuma Mesa Agricultural
Center, near Yuma, AZ. The land was laser leveled and fumigated prior to planting. Trees were planted on a 10m x 10-m spacing. There are nine blocks of up to of the eleven scion-rootstock combinations. Not all scion
rootstock combinations are bearing fruit yet, and some of the combinations have died. Yields are expressed as lbs.
fruit per tree. Yield data was first collected in November 1999. Each the fruit was passed through an automated
electronic eye sorter (Autoline, Inc., Reedley, CA), which provides weight, color, exterior quality and size data for
each fruit. Fruit quality measurements were taken on a 15 fruit sample per tree. Not all combinations had
sufficient fruit for analysis.
All data was analyzed using SPSS 6.0 for Windows (SPSS Inc., Chicago, Illinois).
Results and Discussion
1993 Lemon Rootstock Trial. Fruit diameter increase from late May 1999 until September 1999 is shown in Figure
1. During 1999, fruit diameter of trees on Rough lemon was usually larger than any other scion-rootstock
combination. Fruit diameter of trees on C. volkameriana, C. macrophylla and ‘Swingle’ was slightly less,
beginning in middle June, a time that was notable for high temperatures. There was no significant difference in
fruit size between any of the four rootstocks mentioned. Trees on ‘Carrizo’ rootstock had the significantly smaller
fruit than the others, and the smallest fruit diameter throughout the season.
Yield of trees on the five rootstocks was quite limited during the 1994-95 season. Nonetheless, significant yield
differences appeared (Table 1), where trees on C. volkameriana rootstock had four to twelve times the yield of any
other scion rootstock combination. From 1995-96 through 1997-98, both C. macrophylla and C. volkameriana
gave the best yield (three to five times more than ‘Carrizo’ or ‘Swingle’). It is notable that 1997-98 was the first
year that trees on C. macrophylla had more yield than those trees of C. volkameriana, although the difference was
not significant. . This trend continued in 1998-99, when trees on C. macrophylla had 16% more yield than trees
on C. volkameriana. Trees on Rough lemon produced intermediate yields, while those on ‘Carrizo’ and ‘Swingle’
produced the least. This is due to the reduced vigor of these two rootstocks.
Yields in 1999-2000 were from 35% to 65% less than the previous year, regardless of rootstock. Nonetheless,
many of the trends from previous years continued. For 1999-2000, trees on C. macrophylla had about 35% more
total yield than those on C. volkameriana, and about 45% more yield than those trees on Rough lemon (Table 2).
This continues the trend first noted in 1997-98. All three rootstocks led to about 30% of the fruit being harvested
early in the first pick. Yield of trees on ‘Swingle’ and ‘Carrizo’ were much less than the other thee; yields were
only 12% to 18% of that of the more vigorous rootstocks. Neither ‘Swingle’ nor ‘Carrizo’ is suitable as a rootstock
for lemons on the Yuma Mesa.
There was no effect of rootstocks on fruit grade (Table 3). Trees on C. volkameriana, and C. macrophylla had the
greatest numbers of fruit of size 75 or more. Fruit size of trees on ‘Swingle’ and ‘Carrizo’ was smaller, while that
of trees on Rough lemon was intermediate.
1993 Lemon Scion Trial. For 1999, fruit of the ‘Frost Nucellar Lisbon trees were smaller than the others (Figure
2). This contrasts with 1998-99 when fruit of ‘Corona Foothills Lisbon’ and ‘Prior Lisbon’ were larger than fruit
on the other two scions tested, and with 1997-98 when fruit of ‘Prior Lisbon’ was smaller than the fruit of the other
three scions beginning in July.
There were no yield differences among the scions tested during the 1994-95-harvest season (Table 4). Yields across
the entire experiment in 1995-96 were light, but ‘Limoneira 8A Lisbon’ trees had 2 to 2.5 times the yield of the
other scion cultivars. This same trend was repeated in 1996-97. For 1997-98, the yield of ‘Limoneira 8A’ was 2
to 3.7 times higher than the other cultivars tested. For the first time in 1998-99, ‘Corona Foothills Lisbon’ was the
second best cultivar, following ‘Limoneira 8A’ ‘Frost Nucellar’ in particular has performed poorly as far as early
fruit sizing. This is surprising because this cultivar was originally planted in Arizona because of its early sizing
capabilities.
For the 1999-2000 harvest, ‘Corona Foothills Lisbon’ had the most fruit harvested in the first ring pick harvest,
about 24% more than ‘Limoneira 8A Lisbon’ (Table 5). ‘Prior and ‘Frost Nucellar’ lagged behind for the first
pick. For the second pick, the yield of ‘Limoneira 8A’ was 35% to 50% more that of any other of the scions tested.
For the third pick, ‘Corona Foothills’ had the greatest yield, although not significantly greater than the others.
There was no significant difference between the scions in the total yield, or in the percent of fruit harvested in the
first pick (data not shown). 1999-2000 was the second year that ‘Corona Foothills’, or any other scion, has
performed as well as ‘Limoneira 8A.
For the scions tested, there was no effect of scion on fruit grade or quality (Data not shown).
1995 ‘Limoneira 8A’ Rootstock Trial. Second year yields of ‘Limoneira 8A Lisbon’ on the six rootstock cultivars
are shown in Table 6. Yields of trees on C. volkameriana were 2 ½ to 6 times greater than yields on any of the
other rootstocks. Trees on the ‘African’ Shaddock x Rubidoux trifoliate hybrid rootstock and the ‘C-35’ citrange
had the smallest percentage of early fruit. These results are similar to those of last year.
1995 Lemon Scion Trial. Yields of the ten cultivars tested are shown in Table 7. Cultivars are grouped according
to type. ‘Eureka’ lemons are shown in normal font, ‘Lisbons’ in bold font, and other types in Italics. For 1997-98,
all the ‘Eureka’ lemons had significantly less yield than the ‘Lisbon’ and other lemons, except the ‘Frost Nucellar’.
‘Villafranca’, ‘Rosenberger Lisbon’ and ‘Cavers Lisbon’ had the highest yields for the first harvest, while
‘Rosenberger’ had the best yield for the second harvest. ‘Limonero Fino 49’, ‘Villafranca’ and ‘Cavers’ had the
greatest percentage of fruit harvested early. For 1998-99, ‘Cascade’ and ‘Cook Eureka’ again performed poorly,
while the ‘Allen Eureka’ was much improved over the previous year, with a yield surpassing all the ‘Lisbon’
lemons except ‘Cavers’. Like the previous year, ‘Cavers Lisbon’, ‘Limonero Fino 49’ and ‘Villafranca’ were
impressive, because of the large overall yield and the large percentage of their fruit harvested early. For 19992000, the ‘Eureka’ lemons again performed poorly. Also, the ‘Limoneira 8A’ and ‘Rosenberger’ Lisbon lemons
performed poorly. For the third year in a row, the ‘Cavers Lisbon’ the ‘Limonero Fino 49’ and the ‘Villafranca’
performed the best, with yields similar to that of the previous years.
1995 Limonero Fino 49’ Rootstock Trial. Second year yields of ‘Limonero Fino 49’ scions on the nine rootstock
cultivars are shown in Table 8. Unlike 1998-99, when yields of trees on C. macrophylla were 2 ½ to 8 times
greater than yields on any of the other rootstocks, trees on C. volkameriana and ‘Citremon 1449’ rootstock were
statistically the equal of C. macrophylla. Since the trees are so young, it is difficult to draw any conclusions from
these data.
1995 Navel Orange Trial. Yields of the five orange cultivars are shown in table 9. In both 1997-98 and 1998-99,
‘Tulegold’ had significantly higher yield per tree than did the other trees, but in 1999-2000, ‘Fisher’ navels had
the highest yield, with ‘Parent Washington’ and ‘Tulegold’ with significantly less. ‘Lane Late’ and ‘Atwood’
cultivars trailed the others. The early cultivar ‘Fisher’ had a much higher granulation content than the other
cultivars (Table 10), although if the fruit from this had been harvested earlier, it is possible that this granulation
would have been less. ‘Lane Late’ had the greatest juice content, because of its low granulation. ‘Tulegold’ had
the highest TSS:TA level, because of its low acid content.
1996 Valencia Orange Trial. As in 1998-99, in 1999-2000 there was no significant effect of either rootstock or
scion upon yields of ‘Valencia’ oranges in 1998-99 (Table 11), although yields were much greater than in the
previous year.
Fallglo Mandarin Trial. ‘Fallglo’ trees on C. volkameriana had the greatest yield in 1999-2000, although high tree
variability insured that there ware no significant differences among any of the rootstocks (Table 12). It was
difficult to spot any clear differences in fruit size or fruit grade between the rootstocks. There were no differences
in fruit quality due to rootstock (Table 13).
Conclusions
It is still apparent that ‘Carrizo’ and ‘Swingle’ are unsuitable as rootstocks for lemon in Arizona. Reduced vigor,
late fruit sizing and ultimate small fruit size are characteristics that cannot be overcome. Differences between C.
volkameriana, C. macrophylla are becoming clear; trees on C. macrophylla have outperformed all others for the
second year in a row in 1999-2000. Whether this represents a long-term phenomenon is still in question. It still
appears as if trees on rough lemon may not be as vigorous as those trees on the other two lemon rootstocks. It
remains to be seen if yield or fruit size will decrease, especially for C. macrophylla, as has occurred on older groves
in Arizona.
For the scions, ‘Limoneira 8A’ still appears to be superior to the others at this point, because of its consistency for
the last five years. Whether it will remain superior will not be known for several years. Given this year’s data, it is
likely that ‘Corona Foothills’ is a superior cultivar as well. ‘Frost Nucellar Lisbon’ continues to be only average, as
does ‘Prior’.
Growers and researchers should continue to watch other lemon cultivars that appear promising for Arizona. These
include ‘Villafranca’ lemon ‘Cavers Lisbon’ lemon, and ‘Limonero Fino 49’ lemon.
Finally, growers should continue to watch the results of our orange and mandarin trials. In particular, ‘Fallglo’
appears to be particularly interesting because of its large size and early maturity.
Literature Cited
Wright, G.C. 1999. Results of scion and rootstock trials for citrus in Arizona – 1998. 1999 Citrus Research
Report. College of Agriculture Series P-117. Tucson, AZ.
Wright, G.C. 1998. Results of scion and rootstock trials for citrus in Arizona – 1997. 1998 Citrus Research
Report. College of Agriculture Series P-113. Tucson, AZ.
Wright, G.C. 1997. Early results for scion and rootstock trials in Arizona. 1997 Citrus Research Report. College
of Agriculture Series P-109. Tucson, AZ.
Wright, G.C. 1996. Cultivar and rootstock research for the Arizona citrus industry. 1996 Citrus Research Report.
College of Agriculture Series P-105. Tucson, AZ.
Wright, G.C. 1995. Cultivar and rootstock research for the Arizona citrus industry. 1995 Citrus Research Report.
College of Agriculture Series P-101. Tucson, AZ.
Table 1. Yields and percentage of fruit harvested early of ‘Limoneira 8A Lisbon’ lemon trees on five different rootstocks.
Yield per tree (lb.).
Rootstockz
1994-95
1995-96
1996-97
‘Carrizo’ Citrange
0.33 by
10.16 c
11.80 c
C. macrophylla
0.11 b
29.70 a
58.25 a
Rough Lemon
0.13 b
19.60 b
40.52 b
‘Swingle’ Citrumelo
0.15 b
11.66 c
11.13 c
C. volkameriana
1.28 a
36.20 a
57.71 a
z
Values are the means of 10 trees.
y
Means separation in columns by Duncan’s Multiple Range Test, 5% level.
1997-98
23.61 c
103.47 a
53.54 b
37.96 bc
84.62 a
1998-99
71.51 c
415.20 a
323.58 b
105.81 c
356.51 b
Table 2. 1999-2000 yields and percentage of fruit harvested early of ‘Limoneira 8A Lisbon’ lemon trees on five different
rootstocks.
Yield per tree (lb.).
Pct. Fruit
Rootstockz
9-22-99
11-18-99
2-3-00
Total Yield
Harvested
Earlyx
‘Carrizo’ Citrange
3.41 c
17.7 c
8.4 c
29.4 c
10.9 b
C. macrophylla
73.5 a
164.5 a
35.2 a
273.2 a
26.5 a
Rough Lemon
53.6 b
107 5 b
26.2 ab
187.3 b
31.3 a
‘Swingle’ Citrumelo
3.77 c
16.5 c
14.3 c
34.5 c
9.2 b
C. volkameriana
64.5 ab
120.8 b
16.0 bc
201.4 b
32.3 a
z
Values are the means of 10 trees.
y
Means separation in columns by Duncan’s Multiple Range Test, 5% level.
X
Fruit harvested on 9/22/99 as a percentage of the total fruit harvested during the season.
Table 3. November 18th, 1999 harvest fruit grade and fruit size, expressed as a percentage, of ‘Limoneira 8A
Lisbon’ lemon trees on five different rootstocks.
Fruit Grade (%)
Fruit Size (%)
Rootstockz
Fancy
Choice
Juice
165
140
115
95
75
‘Carrizo’ Citrange
47.8 a
20.4 a
31.7 a
7.9 ab
32.5 a
C. macrophylla
60.3 a
17.1 a
22.6 a
4.4 c
19.9 c
Rough Lemon
44.7 a
19.4 a
35.8 a
6.6 bc
25.3 bc
‘Swingle’ Citrumelo
43.4 a
18.2 a
38.4 a
8.8 a
31.3 ab
C. volkameriana
50.3 a
19.9 a
29.8 a
5.5 bc
21.1 c
z
Values are the means of 10 trees.
y
Means separation in columns by Duncan’s Multiple Range Test, 5% level.
34.4 c
45.6 a
43.0 ab
37.5 bc
42.3 ab
11.0 b
21.2 a
15.7 ab
11.2 b
21.0 a
0.5 c
2.5 ab
1.6 bc
0.7 c
3.4 a
Table 4. Yields and percentage of fruit harvested early of four ‘Lisbon’ lemon cultivars budded to C. volkameriana rootstock.
Yield per tree (lb.).
Scionz
1994-95
1995-96
1996-97
1997-98
‘Corona Foothills Lisbon’
0.13 ay
4.98 b
11.33 b
‘Frost Nucellar Lisbon’
0.07 a
3.97 b
14.48 b
‘Limoneira 8A Lisbon’
0.13 a
10.56 a
27.71 a
‘Prior Lisbon’
0.00 a
3.90 b
15.19 b
z
Values are the means of 12 trees.
y
Means separation in columns by Duncan’s Multiple Range Test, 5% level.
18.42 b
26.62 b
69.04 a
34.92 b
1998-99
281.15 b
204.96 c
343.35 a
202.10 c
Table 5. 1999-2000 yields of four ‘Lisbon’ lemon cultivars budded to C. volkameriana rootstock.
Yield per tree (lb.).
Scionz
9/22/99
11/18/99
‘Corona Foothills Lisbon’
65.3 a
76.9 ab
‘Frost Nucellar Lisbon’
44.3 b
68.8 ab
‘Limoneira 8A Lisbon’
52.4 ab
105.3 a
‘Prior Lisbon’
50.8 b
57.6 b
z
Values are the means of 12 trees.
y
Means separation in columns by Duncan’s Multiple Range Test, 5% level.
2/3/00
45.3 a
37.8 ab
33.5 ab
26.3 b
Total
Yield
187.5 a
150.8 a
183.6 a
134.8 a
Table 6. Yields and percentage of fruit harvested early during 1998-2000 of ‘Limoneira 8A Lisbon’ lemon trees on six different
rootstocks.
Yield per tree (lb.).
Total 1999Total 1998-99
Fruit
Rootstockz
9-22-99
11-18-99
2-3-00
2000
Yield
Harvested
Harvest
Harvest
Harvest
Yield
(lbs.)
Early (%)
(lbs)
C. volkameriana
18.64 a
76.88 a
19.72 a
24.40 a
121.01 a
65 a
C-35 Citrange
7.21 b
10.13 b
16.87 a
14.78 ab
49.15 b
33 b
Citremon 1449
5.14 b
27.00 b
4.81 a
15.30 ab
47.13 b
54 ab
Yuma Citrange
2.00 b
17.50 b
4.60 a
5.65 b
20.35 b
65 a
C. taiwanica
4.69 b
17.44 b
4.80 a
10.89 b
33.13 b
53 ab
African Shaddock x
2.20 b
9.38 b
2.78 a
11.20 b
23.38 b
30 b
Rubidoux trifoliate.
z
Values are the means of 9 to 15 trees.
y
Means separation in columns by Duncan’s Multiple Range Test, 5% level.
Table 7. Yields and percentage of fruit harvested early of ten lemon cultivars budded to C. volkameriana rootstock.
1997-98
1998-99
1999-2000
Total
Pct. Fruit
Total Yield
Pct. Fruit
Total
Pct. Fruit
Scionz
Yield
Harvested
(lb.)
Harvested
Yield
Harvested
(lb.)
Earlyy
Earlyy
(lb.)
Earlyy
Allen Eureka
39.60 c
56.67 cd
164.55 cd
41.51 e
142.5 bc
62.0 a
Cascade Eureka
44.50 c
57.40 cd
93.40 f
67.00 d
143.33 bc
61.7 a
Cook Eureka
41.36 c
49.53 d
129.21 def
42.66 e
103.90 cd
60.4 a
Cavers Lisbon
101.80 a
71.52 ab
272.32 a
86.78 ab
279.06 a
59.8 a
Frost Nucellar Lisbon
57.05 bc 62.35 bc
123.79 def
85.14 abc
203.12 ab
52.0 a
Limoneira 8A Lisbon
95.04 ab 63.04 bc
152.28 def
71.41 cd
101.00 cd
78.2 a
Prior Lisbon
95.75 ab 66.15 bc
105.04 ef
82.28 abcd
188.43 b
60.0 a
Rosenberger Lisbon
121.97 a
57.52 cd
132.43 def
67.65 d
45.00 d
66.5 a
Limonero Fino 49
94.42 ab 79.72 a
233.88 ab
92.94 a
226.25 ab
51.0 a
Villafranca
124.27 a
71.05 ab
199.79 bc
75.69 bcd
220.31 ab
57.7 a
z
Values are the means of 3 to 5 trees.
y
Fruit harvested on the first harvest date as a percentage of the entire annual yield.
x
Means separation in columns by Duncan’s Multiple Range Test, 5% level.
Table 8. Yields during 1998-2000 of ‘Limonero Fino 49 lemon trees on nine different rootstocks.
Yield per tree (lb.).
Total 1998-99
Total 1999-00
Rootstockz
Yield
Yield
(lbs.)
(lbs.)
C. macrophylla
21.46 a
38.75 a
C-35 citrange
6.26 a
12.43 bc
Swingle Citrumelo
8.70 a
20.57 abc
Carrizo Citrange
8.49 a
7.56 bc
Citremon 1449
5.69 a
23.74 abc
C. volkameriana
4.21 a
28.79 ab
Afr. Shaddock x Rubidoux trifoliate.
5.65 a
4.34 bc
C. taiwanica
3.51 a
2.62 c
Rough Lemon
2.04 a
3.44 c
z
Values are the means of 9 to 15 trees.
y
Means separation in columns by Duncan’s Multiple Range Test, 5% level.
Table 9. Yields and granulation of five navel orange cultivars budded to Carrizo rootstock.
1997-98
1998-99
Yield per
Yield per Weight Granulation
Yield per
y
Scionz
tree (lb.).
tree (lb.). per fruit
(%)
tree (lb.).
01/13/98
02/15/99
(lb.)
12/17/99
1999-2000
Weight Granulation
y
per fruit
(%)
(lb.)
Lane Late
4.40 b
12.44 b 0.58 a
0.00 c
12.03 c
0.65 ab
2.30 c
Atwood
5.14 b
7.09 b 0.52 ab
2.17 c
12.65 c
0.64 ab
3.09 c
Fisher
6.51 b
9.33 b 0.49 b
11.47 a
35.09 a
0.70 a
30.92 a
Parent
7.05 b
8.39 b 0.50 ab
5.17 b
28.32 b
0.62 b
5.16 bc
Washington
Tulegold
11.84 a
32.78 a 0.47 b
1.17 c
24.48 b
0.69 a
9.31 b
z
Yield values are the means of 12 trees.
y
Granulation values are the means of 25 fruit per tree in 1998-99 and 15 fruit per tree in the 1999-2000 season.
x
Means separation in columns by Duncan’s Multiple Range Test, 5% level.
Table 10. 1999-2000 Fruit Quality of five navel orange cultivars budded to Carrizo rootstock.
Scionz
Percent Juice
TSS
(%)
10.06 d
11.00 ab
10.70 c
11.04 a
10.78 bc
TA
(%)
0.59 a
0.59 a
0.54 b
0.59 a
0.49 c
TSS:TA
Peel Thickness
(mm)
4.95 bc
5.86 a
5.19 b
4.52 bc
5.21 b
Lane Late
46.5 a
17.18 d
Atwood
44.2 ab
18.50 c
Fisher
30.2 c
20.08 b
Parent Washington
45.2 ab
18.59 c
Tulegold
41.1 b
22.03 a
z
Yield values are the means of 12 trees.
y
Granulation values are the means of 25 fruit per tree in 1998-99 and 15 fruit per tree in the 1999-2000 season.
x
Means separation in columns by Duncan’s Multiple Range Test, 5% level.
Table 11. Yields of three ‘Valencia’ orange cultivars budded to C-35,
Carrizo and C. volkameriana rootstock.
1998-99
1999-2000
Yield per tree (lb.).
Yield per tree (lb.).
Scion or rootstockz
26 March 1999
6 March 2000
‘Delta’
‘Midknight’
‘Olinda’
0.27 ay
0.23 a
0.42 a
4.65 a
3.80 a
2.56 a
C. volkameriana
0.07 a
4.10 a
C-35
0.27 a
4.56 a
Carrizo
0.58 a
3.01 a
z
Yield values are the means of 30 trees.
y
Means separation in columns by Duncan’s Multiple Range Test,
5% level.
Table 12. 1999 Yield and packout of Fallglo mandarin trees on eleven different rootstocks.
Fruit Size (%)
Rootstockz
Yield per
Small Medium Large J u m b o Mammoth
tree (lb.)
C. volkameriana
9.6 ay
0.0 a 0.0 a
0.0 a
Rough Lemon
8.6 a
0.0 a 0.0 a
3.0 a
Soh Jalia Lemon
7.1 a
---Citremon 1449
6.6 a
0.0 a 0.0 a
2.9 a
Sunki Mandarin x Flying
6.0 a
0.0 a 0.1 a
1.5 a
Dragon Trifoliate Orange
‘Carrizo’ Citrange
4.0 a
0.0 a 0.0 a
0.0 a
Taiwanica Orange
1.7 a
0.7 a 0.0 a
2.8 a
C-35 Citrange
0.4 a
0.0 a 0.0 a
0.0 a
African Shaddock x Rubidoux
0.2 a
0.0 a 0.0 a
0.0 a
Trifoliate Orange
Smooth Flat Seville Orange
0.0 a
---Gou Tou Orange
0.0 a
---z
Values are the means of 2 to 11 trees, harvested on 11-11-99.
y
Means separation in columns by Duncan’s Multiple Range Test, 5% level.
Fruit Grade (%)
Colossal
SuperColossal
Fancy
Choice
9.9 b
10.1 b
-7.1 b
26.8 ab
42.9 ab
-51.3 a
32.6 b
42.5 ab
-34.9 b
30.3 a
1.5 a
-3.9 a
81.8 a
81.8 a
-82.9 a
17.1 b
16.6 b
-17.0 b
1.1 a
1.6 a
-0.0 a
21.3 ab
51.2 a
21.3 b
4.7 a
82.3 a
17.7 b
0.0 a
12.0 b
39.5 a
12.2 b
41.8 ab
50.9 a
67.0 a
46.3 ab
6.2 b
20.8 b
0.0 a
0.0 a
0.0 a
77.6 a
62.9 a
17.0 b
20.5 b
33.8 b
83.0 a
1.9 a
3.3 a
0.0 a
22.1 ab
0.0 b
77.9 a
0.0 a
50.0 ab
50.0 ab
0.0 a
---
---
---
---
---
---
Table 13. 1999-2000 Fruit Quality of Fallglo mandarin trees on six different rootstocks..
Rootstockz
Percent Juice
C. volkameriana
49.1 bcz
Rough Lemon
48.9 bc
Citremon 1449
52.4 ab
Sunki Mandarin x Flying Dragon Trifoliate Orange
55.1 a
‘Carrizo’ Citrange
46.7 c
Taiwanica Orange
54.2 a
z
Means separation in columns by Duncan’s Multiple Range Test, 5% level.
Juice
TSS
(%)
10.7 b
11.03 ab
11.73 a
11.51 ab
10.6 b
10.8 ab
TA
(%)
0.87 a
0.95 a
1.01 a
0.99 a
0.88 a
0.99 a
TSS:TA
12.25 a
11.57 a
11.59 a
11.67 a
11.99 a
10.95 a
Peel Thickness
(mm)
1.84 a
1.98 a
2.01 a
1.82 a
2.42 a
1.66 a
---
Figure 1. Fruit diameter of ‘Limoneira 8A Lisbon’ lemon on five rootstocks.
Figure 2. Fruit diameter of four lemon scions on ‘Citrus volkameriana’ rootstock.
Use of a Slow Release Triazone based Nitrogen Fertilizer on
Lemon Trees1
Glenn C. Wright, and Marco A. Peña
Department of Plant Sciences, U. of A., Yuma Mesa Agriculture Center, Yuma, AZ
Abstract
Trisert CB replaced conventional foliar applied low-biuret urea and liquid urea
ammonium nitrate in a typical N fertilization regime, a urea triazone based N
source. There was no yield decrease, change in fruit size or grade with the use
of the Trisert CB. There were no differences in leaf P, K, Ca, Mg, Cu, Fe, Mn
or Zn concentration. Occasionally, leaf N concentration of trees supplied with
foliar applied Trisert CB was higher than that of the control treatment.
Introduction
Citrus producers in Arizona and California often apply between 1 and 3 lbs. N per mature tree per year, as a nitrogen
solution in the water run or in a low volume irrigation system. Embleton and Jones (1974) found that pound for
pound, foliar applied N was just as effective as soil applied N for producing citrus. Nonetheless, 100% foliar N
application programs are not common because of their perceived cost. However, Embleton et al., (1986) also found
that foliar nitrogen in combination with soil-applied nitrogen can be beneficial for maintaining production and
quality.
Low biuret urea (LBU) sources have been typically applied as the foliar component of a typical N application
program. Application of these N sources will limit leaching into the groundwater. Embleton et al. (1980) estimated
that only 10% of the foliar spray reached the ground, and 75% of that was volatilized as ammonia. Winter foliar
application of LBU sources has also been shown to significantly increase yield as compared to soil applied LBU
(Ali and Lovatt; 1994).
Although many studies have been conducted in the San Joaquin valley on the benefits of a combination foliar and
soil applied N program on oranges, citrus fertilizer programs in the Arizona and California desert face additional
challenges that have not yet been answered through research. Desert citrus acreage is increasingly planted to
lemons, which have a higher N requirement than do oranges. Desert citrus soils are often sandier than those in the
San Joaquin, meaning that the potential for N leaching is higher. High air and soil temperatures lead to
volatilization of soil applied granular N. Conventional foliar N sources cannot be applied when temperatures are
high, since water evaporation occurs and leads to the formation of a crystalline residue. Some conventional N
sources can also lead to leaf burn.
Urea-triazone N sources overcome the difficulties of using conventional foliar N fertilizer. Clapp and Parham
(1991) report that urea-triazone N has slow release N properties, provides leaf burn protection, will not crystallize on
the leaf, and offers more uniform coverage and superior absorption when compared to conventional N sources.
Additionally, Lovatt at the University of California at Riverside reports that urea-triazone foliar applications at 12.5
lbs. N per acre were just as effective as 25 lbs. N per acre conventional LBU applications for navel orange yields.
1
We would like to thank Tessenderlo Kerley, Inc. for partial financial support of this project. We would also like to
thank Scheu Properties, Mr. Mark Mc Broom, and Richard Bagdasarian Inc., for their technical assistance in
completing this work.
This is a part of publication az1178: "2000 Citrus and Deciduous Fruit and Nut Research Report," College of
Agriculture and Life Sciences, the University of Arizona, Tucson, Arizona, 85721.
Therefore, our objectives in this study are to determine if a combination of foliar applied urea-triazone nitrogen
(Trisert CB, Tessenderlo Kerley Inc., Phoenix, AZ) and water-run urea ammonium nitrate can maintain or enhance
lemon leaf nitrogen status, fruit yield, packout and quality as compared to the current production practices of
applying all or part of the nitrogen as UAN solution via the irrigation water and the remainder as conventional LBU
solution.
Materials and Methods
This project was initiated at a citrus grove owned by Scheu properties, near Calipatria, California. Trees included in
the project are mature ‘Limoneira 8A Lisbon’ (Citrus limon Burm.) on Citrus volkameriana rootstock. For 1998,
there were 124 trees per acre. The grower removed 50% of the trees during winter 1999, leaving 62 trees per acre.
Trees were subject to normal grower practices, including regular microsprinkler irrigation, foliar application of both
macro- and micronutrients, and applications of insecticides (chiefly for thrips) as needed.
For this experiment, total annual tree N requirements were met through the application of one of four treatments as
follows:
•
Control – Low biuret urea (46-0-0) applied as a foliar spray in 3 (1999) or 4 (1998) split applications
annually (mid January, early March, early April and early May). For 1998, a total of 1.15 lb. N per tree or
143 lb. N per acre was applied. In 1999, a total of 46 lb. N per acre was applied.
Also, liquid urea ammonium nitrate 32-0-0 was applied through the irrigation system in 24 split
applications. For 1998, a total of 1.47 lb. N per tree or 182 lb. N per acre was applied. For 1999, a total of
124 lb. N per acre was applied. Also, N-furic acid (15-0-0-49S) applied semi-weekly through the irrigation
system in both 1998 and 1999, at a rate of 0.5 lb. N per tree.
Total N applied in this treatment for 1998 was 387 lb. N per acre, and for 1999 was 201 lb. N per acre.
•
Liquid urea ammonium nitrate and N-furic acid applied as in the control treatment.
Also, for 1998, 43 gallons/acre Trisert CB (26-0-0-0.5B) was applied as a foliar spray in 3 split applications
annually (mid January, early March, and early April) for a total of 0.94 lb. N per tree or 116 lb. N per acre.
For 1999, 18 gallons/acre Trisert CB were applied as a foliar spray, providing 49 lb. N per acre.
Total N applied in this treatment in 1998 was 360 lb. N per acre, and in 1999 was 197 lb. N per acre.
•
Low biuret urea and N-furic acid applied as in the control treatment.
Also, for 1998, 51 gallons/acre Trisert CB applied through the irrigation system in 24 split applications for
a total of 1.11 lb. N per tree, or 138 lbs. N per acre. For 1999, 47 gallons per acre Trisert CB was applied
through the system, for a total of 127 lb. N per acre.
Total N applied in this treatment in 1998 was 343 lb. N per acre, and in 1999 was 204 lb. N per acre.
•
For 1998, 51 gallons/acre Trisert CB applied through the irrigation system in 24 split applications for a
total of 1.11 lb. N per tree, or 138 lbs. N per acre. For 1999, 47 gallons per acre Trisert CB was applied
through the system, for a total of 127 lb. N per acre.
Also for 1998, 43 gallons/acre Trisert CB (26-0-0-0.5B) was applied as a foliar spray in 3 split applications
annually (mid January, early March, and early April) for a total of 0.94 lb. N per tree or 116 lb. N per acre.
For 1999, 18 gallons/acre Trisert CB were applied as a foliar spray, providing 49 lb. N per acre.
Also, N-furic acid applied as in the control treatment.
Total N applied in this treatment in 1998 was 316 lb. N per acre, and in 1999 was 207 lbs. N per acre.
All foliar fertilizers were applied using a high-pressure air-blast sprayer in 100 gallons of water per acre in 1998 and
125 gallons of water per acre in 1999.
For this study, the experimental design was randomized complete block, with four blocks. Experimental units are
double rows. Data are reported as cartons per tree, since the orchard had rows of varying length, and since 50% of
the trees were removed in winter 1999.
Fruit were harvested on 13 October 1998 and 18 October 1999. For the 1998 harvest, trees were stripped, and fruit
from the four treatments was kept in separate bins for transport to the packinghouse. There are 960 lbs. of fruit in a
bin. At the packinghouse, fruit from each treatment, within each block were processed separately. Computer
systems at the packinghouse generated a report showing the fruit yield and packout (fruit size and grade) for each of
the four treatments.
For the 1999 harvest, the trees were stripped, and fruit from each treatment were kept in separate bins. From each
bin, a 70 lb. sub-sample was collected. Fruit from the subsample was processed at the experimental site, through an
automatic, portable fruit sorter (Autoline, Inc., Reedley, CA). The fruit sorter provided fruit weight, size, color and
grade information.
Leaf samples for mineral nutrient analysis were taken once a month from February through August. Thirty-two
leaves from each experimental unit were collected, and were dried at 60C for 48 hr and were ground with a Wiley mill.
Samples were digested using a method developed by Parkinson and Allen (1975). Nitrogen and phosphorus were
determined colorimetrically at using a spectrophotometer. Potassium, Ca, Mg, Fe, Cu, Mn and Zn were determined
using atomic absorption spectrophotometry.
Results and Discussion
Application of Trisert CB in combination with foliar LBU, in combination with water-run urea ammonium nitrate,
or without additional N source did not suppress or improve overall yield, fruit size or fruit grade compared to the
control treatment (Tables 1 and 2). While there were occasional differences among fruit sizes or fruit grades, no
discernible trend was evident.
The treatments had a greater effect on leaf nitrogen level (Figure 1). Although there was no continuous trend, for
five of the 14 dates leaf N concentration of the foliar Trisert CB and water-run 32-0-0 treatments was significantly
higher than that of at least one of the other treatments. Likewise, for five of the 14 days, the leaf N concentration of
trees receiving the control treatment was significantly lower that at least one of the other treatments, often within the
deficient range.
Treatments with Trisert CB had little effect on leaf P, K, Ca, Mg, Cu, Fe, Mn and Zn concentrations (data not
shown).
In conclusion, Trisert CB may prove to be an alternative to foliar LBU applications or water-run urea-ammonium
nitrate applications, particularly if point-source nitrate contamination of the ground water is an issue. Our research
shows that for at least 2 years, application of Trisert CB will lead to equivalent lemon yields and packouts compared
with conventional N fertilization regimes.
Literature Cited
Ali, A.G. and C. J. Lovatt. 1994. Winter application of low biuret urea to the foliage of ‘Washington’ navel orange
increased yield. J. Amer. Soc. Hort. Sci. 119:1144-1150.
Clapp, J.G. and T.M. Parham, Jr. 1991. Properties and uses of liquid triazone-based nitrogen fertilizers. Fertilizer
Research 28:229-232.
Embleton, T.W., C. O. Pallares, W.W. Jones, L.L. Summers and M. Matsumara. 1980. Nitrogen fertilizer
management of vigorous lemons and nitrate pollution potential of groundwater. University of California Water
Resource Center. Contribution 182.
Embleton, T.W. and W.W. Jones. 1974. Foliar applied nitrogen for citrus fertilization. J. Environ. Qual. 3:388-392.
Embleton, T.W., M. Matsumara, L.H. Stolzey, D.A. Devitt, W.W. Jones, R. El-Motaium, and L.L. Summers. 1986.
Citrus nitrogen fertilizer management, groundwater pollution, soil salinity and nitrogen balance. Applied Agric. Res.
1:57-64.
Parkinson, J.A. and S.E. Allen. 1975. A wet oxidation procedure for the determination of N and mineral nutrients in
biological materials. Comm. Soil Sci. Plant Anal. 6:1-11.
Table 1. 1998 Yield and Packout of lemons treated with foliar and water-run nitrogen sources.
Fruit Sizex
Fruit Gradew
y
Yield
(%)
(%)
Treatmentz
(Cartons
95
115
140
165
200
235
#1
#2
#3
per tree)
Foliar Low
4.31 a
Biuret Urea
1.2 a 9.8 ab 20.7 ab37.6 a 16.4 c 14.3 ab 49.8 a
18.9 a
29.4 ab
+
Water –run
32-0-0
Foliar Trisert CB
+
3.43 a
0.7 a 10.6 a 21.1 a 37.1 a 16.9 c 13.6 b
48.2 a
18.8 a
31.1 a
Water-run
32-0-0
Foliar Low
1.5 a 9.5 a 19.8 b 30.2 b 23.3 b 15.7 ab 55.0 a
19.1 a
23.9 b
Biuret Urea
4.43 a
+
Water-run
Trisert CB
Foliar Trisert CB
4.29 a
+
0.9 a 8.5 b 18.3 c 30.9 b 25.3 a 16.1 a
49.3 a
21.6 a
27.2 ab
Water-run
Trisert CB
Z
Mean separation by Duncan’s Multiple Range Test, α=0.05
y
Yield expressed as numbers of 37.5 lb. cartons of fruit per tree.
x
Fruit size expressed as the percentage of fruit in each size category as a portion of the total number of fresh-packed
cartons. The size categories are indicative of the number of fruit per carton.
w
Fruit grade expressed as the percentage of fruit in each size category as a portion of the total number of cartons.
Grade categories #1 and #2 are fresh-packed fruit, and #3 are fruit destined for juice. The three values may not
add up to 100% because about 2% of the fruit was discarded.
Table 2. 1999 Yield and Packout of lemons treated with foliar and water-run nitrogen sources.
Fruit Sizex
Fruit Gradew
y
Yield
(%)
(%)
Treatmentz (Carton 63
75
95
115 140 165 200 235
#1
#2
#3
s per
tree)
Foliar Low
Biuret Urea
+
3.80 a 0.5 a 2.4 a 23.4 a40.0 a 20.5 a4.9 a
6.2 a 2.3 a 48.5 a 19.9 ab 31.6 ab
Water –run
32-0-0
Foliar Trisert
CB
+
4.20 a 0.4 a 2.6 a 25.3 a41.1 a 18.7 a4.9 a
6.0 a 1.2 a 49.5 a 20.5 a 30.0 b
Water-run
32-0-0
Foliar Low
Biuret Urea +
4.18 a 0.8 a 3.1 a 24.7 a35.8 b 19.9 a5.5 a
8.1 a 2.0 a 46.6 a 20.0 ab 33.4 ab
Water-run
Trisert CB
Foliar Trisert
CB
+
4.38 a 0.8 a 2.7 a 20.7 a39.1 a 20.4 a6.0 a
8.4 a 2.1 a 47.5 a 17.1 b 35.4 a
Water-run
Trisert CB
Z
Mean separation by Duncan’s Multiple Range Test, α=0.05
y
Yield expressed as numbers of 37.5 lb. cartons of fruit per tree.
x
Fruit size expressed as the percentage of fruit in each size category as a portion of the total number of fresh-packed
cartons. The size categories are indicative of the number of fruit per carton.
w
Fruit grade expressed as the percentage of fruit in each size category as a portion of the total number of cartons.
Grade categories #1 and #2 are fresh-packed fruit, and #3 are fruit destined for juice. The three values may not
add up to 100% because about 2% of the fruit was discarded.
Evaluation of Temik (aldicarb) For the Control of the Pecan Aphid Complex for Pecans
Grown in Arizona
Michael W. Kilby
University of Arizona
Abstract
This experiment was conducted to extend the label for Temik
use in Arizona pecan orchards for aphid control. Spring
application of Temik controlled both yellow and black aphids
throughout the season and significantly increased yield.
The pecan aphid complex (yellow, black margined and black pecan aphid) can cause serious damage to
pecan trees in Arizona. This aphid complex is the major pecan insect pest group in Arizona and if not
controlled can cause significant economic damage by reducing yield and nut quality in any given year.
Each aphid species alone can cause significant damage to foliage resulting in reduced photosynthesis or
leaf abscission depending on year and climatic conditions.
It is of utmost importance that pecan producers have an arsenal of insecticides available to combat
economic populations of these aphids to prevent leaf damage or drop, thus reducing yield and nut quality.
Available insecticides labeled for use in Arizona pecan orchards can be applied foliarly, injected into drip
irrigation systems or injected into soil. The compound has successfully controlled aphid populations
since its initial registration in Arizona is Temik. This compound is injected into soil on two sides of a
tree and has an excellent reputation for effective aphid (the total pecan complex) control. Even though
new insecticides continue to be labeled for pecan aphid control, Temik needs to be retained because of its
history of excellent performance in controlling pecan aphids. Foliar applied insecticides have been
utilized by growers in recent years, however, genetic resistance has developed in the yellow colored
aphids with these compounds becoming less effective over time. Since aphids have an ability to develop
resistance to any given insecticide it is important that effective chemicals be retained for aphid control.
Temik is one compound which continues to have credibility in the pecan industry in Arizona and other
states. In this experiment Temik was evaluated for effective aphid control and yield enhancement in an
Arizona pecan orchard. This experiment was conducted at the request of Rhone Poulenc to support label
continuation for use in Arizona pecan orchards. It is extremely important that Temik to be available for
industry use.
Procedures
Temik was soil applied to a pecan orchard owned by Farmers Investment Company (FICO) located near
Green Valley, Arizona. The FICO pecan orchard is the largest in the world in that it contains 4,600 acres
of pecan trees of various varieties. Temik was applied in single and split applications according to
protocol and according to label.. In addition, a foliar insecticide (Provado) was included as a treatment
with an untreated control. The Provado was applied based on aphid populations considered to be
damaging to leaves and trees as determined by the grower, a field consultant and principal investigator.
The treatments and dates of application are represented in Table 1.
This is a part of publication az1178: "2000 Citrus and Deciduous Fruit and Nut Research Report," College of
Agriculture and Life Sciences, the University of Arizona, Tucson, Arizona, 85721.
Table 1. Treatments, rates and dates of application of Temik and Provado for experiment..
Treatment No.
1
2
3
4
5
Description(Product)
Untreated control
Temik 15 G
Temik 15 G
Temik 15 G
Provado (foliar)
Rates
0
47 lbs/A
33 + 20 lbs/A
20 lbs/A
8 oz/A
Dates of Application
May 28
May 28 & July 31
July 31
Sept. 15
The experiment was a Randomized Complete Block design with 4 replications. The orchard consisted of
rows of trees which were one acre in length. Each row was designated as a single replication. A buffer
row was established between each treatment row. Four trees were selected in each treatment row for data
collection. Trees were selected for uniformity in size and crop load. A total of eighty trees were sampled
and harvested for data collection which included aphid populations, yield and nut quality determinations.
Trunk diameters were measured in order to calculate adjusted yields(yield efficiency) to account for tree
size.
Temik was applied with a commercial applicator using the lock ‘n load method of handling. The
applicator was calibrated to release Temik into the soil in amounts required by making 4-8 passes down
each side of a treatment row. This allowed for equal distribution of the chemical within the treatment
row. Temik was irrigated into the root zone immediately following application. During this growing
season rainfall was frequent resulting in difficulty in entering equipment into the orchard in a timely
fashion. This was somewhat of a problem with the Provado application as only one application could be
made during peak aphid infestation periods. However an application was made based on aphid density
and perceived damage potential.
Aphids were counted at weekly intervals beginning July 15 continuing through November. A compound
leaf on each of four sides of the plot trees were used for counting aphids.
RESULTS
Aphid populations were slow to build up during the 1999 growing season due to frequent rainfall. As a
consequence we began aphid counts on July 15th when populations began to increase and honeydew
began to accumulate on leaves. Figures 1 and 2 indicate the seasonal variation of both yellow and black
aphids during the course of this experiment as related to treatments.
During the latter part of July and into August and the early part of September, Temik applied in the
Spring, Spring/Summer or Summer only (all three application dates) significantly reduced yellow aphid
populations when compared to the control. Provado was not applied until September 15th due to physical
constraints from rainfall frequency. Therefore all three Temik treatments had lower aphid counts than
either Provado or control neither of which had been sprayed. At the September 16th aphid count date the
effectiveness of the Spring applied Temik application date began to fade and eventually lost its
effectiveness in the fall even though aphid counts continued to be lower than the control or Provado
treatments. After spraying Provado, aphid populations declined to a level equal to all Temik treatments.
However by September 30th, two weeks later, aphid levels in the Provado treatment had increased to
damaging levels and populations were significantly higher than the Temik treatments of Spring/Summer
or Summer. Yellow aphid counts from October and November sampling dates indicate that the summer
or Spring/summer application dates significantly reduced aphid populations to a non-damaging level
when compared to the control or Provado treatments. Black aphid populations were almost non existent
in all of the Temik plots but showed extreme damage in both the control and Provado treatments. All
three Temik application dates (treatments) significantly reduced aphid populations below that of control
for the entire growing season.
In addition to determining aphid populations and seasonal distribution, yield and nut quality parameters
were measured. These data are reported in Tables 2 and 3.
Table 2. The effect of Temik on yield and yield efficiency of ‘Wichita’ pecan trees grown in Sahuarita,
AZ in 1999.
___________________________________________________________________________
Treatment
Total
Yield
Kg/Tree
Yield Efficiency
Kg/cm2 trunk area
Control
84.3 a*
0.45 a
Temik – Spring
115.6 b
0.65 b
Temik – Spr./Su
117.4 b
0.54 a b
Temik – Summer
104.9 b
0.52 a b
Provado
91.3 a b
0.41 a
_____________________________________________________________________________
*Means followed by the same letter in a column are not significantly different at the 5% level of
_probability.__________________________________________________________________
Table 3. Effect of Temik and Provado on nut quality attributes of “Wichita” Pecan grown in
Sahuarita, Arizona in 1999.
______________________________________________________________________________
Treatments
Nut Size
%kermel
Nuts/lb
Control
5.9 a*
60.2 a
Temik – Spring
6.1 a
60.3 a
Temik – Spr/Su
6.0 a
61.0 a
Temik – Summer
5.9 a
61.8 a
Provado
5.6 a
60.6 a
______________________________________________________________________________
* means followed by the same letter in a column are not significantly different at the 5% level of
probability._____________________________________________________________________
Total yield per tree and yield efficiency indicate that applications of Temik increased yield over the
control or Provado treatments. In order to equalize yield in relation to tree size yield was adjusted to
trunk area( yield efficiency) and reported as Kg/Cm2. Temik applied in the Spring significantly increased
yield efficiency when compared to the control. In fact yield efficiency was greater for all three Temik
treatments when compared to the control or Provado treatment. This was also true for total yield,
%kernel and nut size even though the nut quality parameters did not differ significantly.
CONCLUSIONS
Temik applied in the Spring, Spring/Summer or Summer significantly reduces both yellow and black
aphid populations below damaging levels in pecan orchards in Arizona. The black pecan aphid is almost
totally eliminated and yellow aphids are significantly reduced to an apparent non economic level of
damage. In fact the data collected from this experiment strongly suggest that applications of Temik will
increase yield regardless of application date. However yield was significantly increased when applied
only in the Spring in this experiment.
Effect of powdery mildew on pecan nut weight and quality
M. Olsen, S. Rasmussen, C. Nischwitz and M. Kilby
Abstract
Powdery mildew of pecan, caused by Microsphaera ulni, results in discoloration
of pecan shucks, but its effects on yield and quality of kernels are not known. In
1999, powdery mildew was observed on pecan shucks by the latter part of June
in a commercial pecan orchard near Sahuarita, Arizona. The fungus continued
to be active throughout the summer. However, results of a field test comparing
diseased and healthy nuts from two varieties of pecans indicate that powdery
mildew did not affect nut weight or quality. Whole nut weights, kernel weights,
color ratings or percentage of discarded nuts were not significant between
paired clusters of nuts that were treated with fungicides and remained disease
free and untreated nuts that were infected with powdery mildew. Although
shucks may have a high percentage of area covered by powdery mildew, results
from this trial indicate that fungicide treatments are not warranted.
Introduction
Powdery mildew of pecan, caused by Microsphaera ulni (also called Microsphaera penicillata) occurs on pecans in
the southeastern and southwestern United States. There is very little information on effects of disease on different
varieties of pecan or on nut quality and yield. Bertrand (1982) reported that powdery mildew is common on nuts in
Georgia, but studies have not shown a consistent relationship between severe powdery mildew and poor kernel
development. Gottwald et al., 1984, found consistent but small effects of powdery mildew on kernel oil, protein,
free fatty acids and moisture content, and negligible effects on net photosynthesis and dark respiration. Large and
Cole, 1964, reported a reduction in number of nuts per pound when mildew was not controlled, but methods of
comparison and statistical analysis were not given.
In the summers of 1998 and 1999, outbreaks of powdery mildew were observed throughout commercial pecan
orchards in Sahuarita and Continental, Arizona. In 1999, the fungus had infected the green shucks of nuts on both
Western and Wichita varieties by late June causing superficial lesions over much of the shuck surfaces. It continued
to produce conidia sporadically throughout the summer. Infections were restricted to the shucks, and no mildew was
found on leaves or other parts of the plant. Initial infections were severe in areas of high humidity and shade, and
many mature nuts appeared almost white during initial disease outbreak. Lesions later turned light brown. Because
of the widespread and sudden occurrence of disease, studies were initiated to determine if the infections affected the
quality of nuts.
Materials and Methods
In June 1999, studies to compare nut quality in infected and non-infected nuts were initiated in two plots of pecans,
one of Wichita variety and one of Western variety. In each plot, 10 pairs of clusters growing close together in the
same environment (amount of shade, height on tree) on each of 10 trees were carefully chosen and marked as
disease free. One cluster of each pair was treated with fungicide to prevent infection, and the other left untreated.
This is a part of publication az1178: "2000 Citrus and Deciduous Fruit and Nut Research Report," College of
Agriculture and Life Sciences, the University of Arizona, Tucson, Arizona, 85721.
Fungicide treated clusters were sprayed every two weeks from June 26 to September 10, 1999 with azoxystrobin
(3.2 oz. a.i./A) in sprays 1-3 and 5-6, and myclobutanil (2.4 oz. a.i./A) in spray 4.
Clusters in the Wichita and Western plots were harvested on October 20 and November 12, respectively, when nuts
were mature, and most shucks were still green and just beginning to open. Clusters contained from one to five nuts
and paired clusters did not always have the same number of nuts. Shucks were rated for percent coverage by
powdery mildew using the method of Nutter in Alfalfa.Pro Software, which is a tutorial for determining the percent
infection of foliar pathogens (Nutter). Pairs of clusters in which the untreated control had no disease symptoms
were not used for data analysis.
After harvest, all clusters were stored at room temperature in paper bags until shucks were dry. All whole nuts and
extracted kernels in each cluster were individually weighed, and the average weight of each cluster determined.
These weights were used to determine percent fill. The kernels were rated for development and color according to
USDA 41 F. R. 39303, 1976. Undeveloped nuts rated as inedible (very dark brown or black wafers and
undeveloped nuts) were not used for color ratings and were considered “discarded”. All edible nuts were rated for
color on a scale of 1-4, with 1 = light or golden, 2 = light amber or light brown, 3 = amber or medium brown, and 4
= dark amber or dark brown, and the average color rating was calculated for each cluster. Significance of treatments
within variety on weights, percent fill, and color were determined using t-Test: Paired Two Sample for Means in
Excel; within variety on percentage of discarded nuts from each tree in each treatment using t-Test: Two-Sample
Assuming Equal Variances; and between varieties (plots) on all measurements, with data combined within varieties,
using ANOVA: Single Factor in Excel.
Results and Discussion
Originally, 100 clusters, 10 clusters on each of 10 trees, were paired in each plot. At harvest, 79 paired clusters
remained in the Wichita variety and 72 in the Western variety. However, only those pairs in which the untreated
clusters were infected with powdery mildew were used for data analysis (56 pairs in Wichita; 57 pairs in Western).
Powdery mildew was never observed on nuts treated with fungicide, and these clusters were considered healthy. In
non-treated clusters, percent coverage of the shucks by powdery mildew lesions ranged from 5 to 80% of each nut.
Whole nut weights, kernel weights and percent fill of diseased and healthy clusters within each variety were not
significant between treatments (Table 1). When all weights were combined within a variety, the nut weight, kernel
weights, and percent fill were significant between varieties (Table 3). Color ratings between kernels from diseased
and healthy nuts within each variety were not significant between treatments (Table 2), but when combined, ratings
within varieties were significant (Table 3). The percentage of kernels rated as inedible and considered “discarded”,
and not rated for color, was not significant between treatments within variety (Table 2) but was significant between
varieties (Table 3).
Results of this study indicate that powdery mildew infection of pecan shucks did not affect nut quality. The weights
of whole nuts, weights of kernels, percent fill, color ratings and percentage of kernels discarded were not significant
between clusters that were infected and those that were healthy. Clusters lost during the season were a result of
mechanical damage either by entire limbs breaking or machinery.
The clusters chosen in this trial were by necessity in the lower canopy of the tree where they could be reached from
the ground and may differ somewhat from those in the upper canopy. However, because powdery mildew infections
are much more severe in shaded areas within the tree canopy (authors, personal observations), this data represents
clusters in an environment with high disease pressure. Absence of any differences in nut quality between infected
and healthy clusters used for these studies should therefore be viewed with confidence. Based on these results,
fungicide applications for control of powdery mildew on shucks are not warranted.
Literature Cited
Bertrand, P.F. 1985. Pecan Nut Disorders. Western Pecan Conf. Proc., January 1985.
USDA. 1976. United States Standards for Grades of Pecans in the Shell, 41 F. R. 39303.
Gottwald, T. R., B. W. Wood and P. F. Bertrand. 1984. Effect of Powdery Mildew on Net Photosynthesis, Dark
Respiration and Kernel Composition of Pecan.
Large, J. R. and J. R. Cole. 1964. Karathane-Controlled Powdery Mildew on the Curtis and Psdst Varieties of Pecan
in Florida and Georgia. Phytopathology 54(9):1174.
Nutter, F. Alfalfa.Pro. Department of Plant Pathology, Iowa State University, Ames, Iowa 50011.
Table 1. Average (std dev) weight of whole nuts, kernels and percent fill of pecans infected
with powdery mildew (non-treated) or healthy (treated) in two pecan varieties.
variety
treatment
nut weight (g)1
kernel weight (g)1
percent fill1
Wichita
infected
5.74 (0.98)
3.49 (0.70)
61 (3)
healthy
5.68 (0.79)
3.47 (0.60)
61 (4)
infected
3.80 (0.69)
1.97 (0.50)
51 (5)
healthy
3.72 (0.77)
1.89 (0.52)
50 (6)
Western
1
Not significant between treatments within variety using t-Test: Paired Two Sample for Means, P = 0.05.
Table 2. Average (std dev) rating per cluster of nut quality based on kernel color and
average (std dev) percent total nuts discarded in two varieties of pecans infected with
powdery mildew (non-treated) or healthy (treated).
variety
Wichita
Western
treatment
kernel color rating1, 3
percent total nuts discarded2, 4
infected
2.76 (0.46)
1.7 (2.2)
healthy
2.67 (0.43)
1.8 (4.1)
infected
3.12 (0.81)
15.9 (16.6)
healthy
3.18 (0.89)
19.0 (17.5)
1
Not significant between treatments within variety using t-Test: Paired Two Sample for Means, P = 0.05.
Not significant between treatments within variety using t-Test: Two Sample Assuming Equal Variances, P = 0.05.
3
Rating of 1-4 with 1 = light or golden, 2 = light amber or light brown, 3 = amber or medium brown, and 4 = dark
amber or dark brown.
4
Inedible and undeveloped nuts not included in color rating.
2
Table 3. Average (std dev) whole nut weight, kernel weight, percent fill, kernel color and
percent nuts discarded of combined treatments within varieties and results of ANOVA
between varieties.
variety
nut weight (g)
kernel weight (g)
percent fill
kernel color
percent nuts
discarded
Wichita
5.71 (0.89)
3.48 (0.66)
61 (4)
2.71 (0.44)
1.7 (3.2)
Western
3.76 (0.73)
1.93 (0.51)
51 (6)
3.15 (0.85)
17.5 (16.7)
ANOVA
p = 0.05
F = 326.6
p = 0.0000
F = 400.3
p = 0.0000
F = 420.1
p = 0.0000
F = 22.2
p = 0.0000
F = 17.3
p = 0.0002
Pecan Variety Study on the Safford Agricultural Center
1999
L.J. Clark and E.W. Carpenter
Abstract
In 1986 a replicated study of eight varieties of pecans was planted on the
Safford Agricultural Center at an elevation of 2954 feet above sea level. The
objective of the study was to determine which varieties would produce best
under the saline conditions found in the Safford valley. WO-3, the highest
overall producer of the study, produced the best yield in 1999, with a yield
over 2600 pounds per acre. This paper also contains kernel percentages and
other nut characteristics found in the study during the 1999 harvest seasons
and a summary of the yields since 1997.
Introduction
Pecans are a small crop in southeastern Arizona being grown on approximately 4500 acres with about 1000 of
those acres in Graham county. Using an average yield of 2000 pounds per acre, a nut turnout of 55% and the 1998
price of $1.25 per pound, they produce $1.375,000 of income for the county, which is equivalent to more than 6%
of the income from all crops in the county in 1998. In addition to the pecans being grown commercially, many
trees are grown in an urban setting for the pleasure of the homeowner. With this income potential and the urban
interest, more emphasis ought to be placed on this crop.
Materials and Methods
In 1986 eight varieties of pecans varying from the Burkett that has been grown in the valley for many years to
currently recommended varieties, such as: Western, Wichita, Barton, and Mohawk and the newer varieties such
as: Cheyenne, Sullivan and WO-3 were planted in four replications in a Pima clay loam variant with a soluble salt
content around 2000 parts per million. The transplants were placed with 25 feet between trees in a row and 25 feet
between rows in a diamond grid. Area per tree was calculated at 0.014 acres. Nitrogen fertilizer was applied each
spring and surface flood irrigation was applied approximately monthly during the summer season. Soil sulfur was
applied twice and gypsum was applied once over the years to reduce the affects of sodium. As the trees reached nut
bearing age irrigations were increased somewhat, but management levels would still not be considered aggressive.
In 1999 ten irrigations were applied with a total of approximately 5 acre feet of water and 100 pounds of nitrogen
was applied to the soil on May 27th. On May 25th and June 11th zinc sulfate and low biuret urea (4 pounds of each
compound dissolved in 100 gallons of water) were applied to the foliage. In December the trees were mechanically
shaken and the nuts picked up from each tree by hand. Nuts were run through a huller and the percent tight nuts
were determined, the good nuts were weighed and per acre yields were calculated. Twenty nuts were taken from
each tree to determine nuts weight and they were measured for size. These nuts were then shelled to determine
kernel percentages and the kernels were inspected for quality.
This was the third year that nuts were harvested for yield on these plots and the second year that management
levels were increased.
This is a part of publication az1178: “2000 Citrus and Deciduous Fruit and Nut Research Report,” College
of Agriculture and Life Sciences, the University of Arizona, Tucson, Arizona, 85721.
Results and Discussion
Table 1 contains yield and other measured or observed characteristics that could affect yield. WO-3 produced the
highest yield by a significant margin over the other varieties in the study. Kernel percentages were 4 percent
higher than those observed in 1998 and 8 percent higher than observed in 1997 (1). This along with the increased
yields are probably a reflection of the improved management. An increase was, however, seen in the percent tights
in 1999 over the previous year. The last column in Table 1 was the diameter of the tree trunks measured below any
forks and generally a couple of feet above the ground. This measurement is related to tree size and the ability to
produce fruit. There was a positive correlation between kernel yield and trunk diameter (r=0.40, P=0.02).
Table 2 provides data on the weight and size of nuts by variety. A decline in nuts per pound over the last three
years indicates that heavier nuts are being produced. From the observed length and width measurements one
could also deduce that the nuts are generally larger. Heavier nuts tend to contain more oil and be better filled. The
fill rating on Table 3 is an indication of how well the kernel is filled. This rating is a combination of how well the
dorsal ridges are filled as well as whether the kernel has air spaces in the center. A rating of 10 would be a plump
nut with narrow dorsal grooves and with no air spaces in the center of the nut. A rating of 5 would be a kernel
with large dorsal grooves and large air spaces in the center of the nut. In some varieties of pecans the dorsal
grooves are narrow and trap packing material on the inside of the shell. The shell fragment retention is a measure
of that characteristic. If one nut half out of one hundred contained a small piece of this packing material, the value
would be 1.0. The size uniformity rating is an indication of how uniform the length of the kernel is. If all kernels
were the same length, the value would be 10. Appearance ratings indicated how uniform the kernels were in color
and plumpness. A value of 10 is the most desirable.
Table 4 contains a yield summary of the varieties over the three years of the study. Some varieties are more
alternate bearing than others. The variety, WO-3, in these three years, has only shown an increase in yield from
year to year. Cheyenne, the number two variety, showed a decided alternate bearing characteristic. Mohawk,
which had produced in the middle of the group, mysteriously, didn’t produce fruit in 1999.
References
1. Clark, L.J. and E.W. Carpenter. 1999. Pecan variety study on the Safford Agricultural Center, 1997-1998.
1999 Citrus and Deciduous Fruit and Nut Research Report, the College of Agriculture, The University of Arizona,
Tucson, AZ. Series P-117, pp. 82-86.
Table 1. Yield components of pecan variety trial harvested 1999 at the Safford Agricultural Center.
Variety
In-shell
Yield (lbs/ac)
Kernel
Percent
Kernel Yield
(lbs/ac)
Estimated %
Length of
kernel fill
Percent
Tights
Trunk
Diameter
(in)
WO-3
4617.4 a1
58.4 abc
2679.5 a
78.8 bc
19.2 ab
6.8 ab
Barton
3240.9 b
62.2 ab
1948.7 b
71.3 c
27.1 a
7.4 a
Cheyenne
3084.1 b
59.7 abc
1841.3 b
Western Schley
3031.8 b
55.0 bc
1686.4 b
Wichita
1939.3 bc
64.3 a
Burkett
1306.8 d
Sullivan
557.6 d
Mohawk
9.0 cd
5.9 abc
86.3 b
22.6 ab
6.3 abc
1250.4 bc
83.8 b
13.9 bc
4.9
55.4 abc
712.6 d
91.3 ab
21.2 ab
6.8 ab
52.6
277.4 d
80.0 bc
3.6 d
5.3 bc
--
--
--
--
5.3 bc
--
c
100.0 a
Average
2539.7
58.5
1485.2
84.5
16.7
6.09
LSD(05)
1363.1
8.9
740.0
11.5
8.9
1.4
36.1
10.3
33.5
9.2
41.8
15.4
CV(%)
c
1. Values followed by the same letter, within columns, are not significantly different at the 95% level of
confidence using Duncan’s Multiple Range Test.
Table 2. Nut weights and dimensions of pecan variety trial harvested 1999 at the Safford Agricultural
Center.
Variety
Nuts per pound
Nut Shell Dimensions
Length (in)
Width 1 (in)
Width 2 (in)
Length to
Width Ratio
WO-3
69.0 ab1
1.57 a
0.95 c
0.83 bc
1.66 ab
Barton
77.4 a
1.48 a
0.95 c
0.83 bc
1.57 ab
Cheyenne
60.5 b
1.50 a
1.01 b
0.86 b
1.49 b
Western Schley
77.8 a
1.51 a
0.90 c
0.78 d
1.69 a
Wichita
70.3 ab
1.56 a
0.95 c
0.81 cd
1.65 ab
Burkett
58.6 b
1.31 b
1.09 a
0.95 a
1.20 c
Sullivan
59.7 b
1.62 a
1.01 b
0.83 bc
1.61 ab
--
--
--
--
--
Average
67.6
1.51
0.98
0.84
1.55
LSD(05)
11.5
0.14
0.05
0.04
0.18
CV(%)
11.4
6.0
3.7
3.2
7.9
Mohawk
1. Values followed by the same letter, within columns, are not significantly different at the 95% level of
confidence using Duncan’s Multiple Range Test.
Table 3. Nut meat characteristics by pecan variety at the Safford Agricultural Center, trial harvested 1999.
Variety
Fill Rating
Shell fragment
retention
Size uniformity
Rating
Appearance
Rating
Kernel Color
WO-3
7.9 bc1
3.8 a
7.6 c
7.6 c
med brown
Barton
7.3 c
3.8 a
7.6 c
7.6 c
med/drk brn
Cheyenne
9.2 a
2.5 a
9.1 a
9.1 a
light brown
Western Schley
8.4 b
0.0 a
8.0 bc
8.0 bc
med brown
Wichita
8.5 b
0.0 a
8.0 bc
8.0 bc
lt/med brown
Burkett
8.5 b
2.5 a
8.8 ab
9.0 ab
med brown
Sullivan
7.9 bc
0.0 a
9.0 a
8.5 abc
light brown
Mohawk
--
--
--
--
--
Average
8.2
1.8
8.3
8.3
--
LSD(05)
0.67
4.9
0.78
1.0
--
CV(%)
5.5
--
6.3
8.1
--
1. Values followed by the same letter, within columns, are not significantly different at the 95% level of
confidence using Duncan’s Multiple Range Test.
Table 4. Kernel yield summary of pecan variety trial from 1997 to 1999 at the Safford Agricultural Center.
Variety
1997
Kernel Yield
(lbs/ac)
1998
Kernel Yield
(lbs/ac)
1999
Kernel Yield
(lbs/ac)
Average Kernal
Yield
WO-3
966.8 (1)
1334.5 (1)
2679.5 (1)
1660.3
Cheyenne
958.0 (2)
269.1 (5)
1841.3 (3)
1022.8
Western Schley
840.4 (3)
383.9 (4)
1686.4 (4)
970.2
Barton
739.0 (5)
96.6 (7)
1948.7 (2)
928.1
Wichita
661.2 (6)
156.1 (6)
1250.4 (5)
689.2
Burkett
491.2 (7)
514.2 (3)
712.6 (6)
572.7
Mohawk
828.4 (4)
836.8 (2)
--
555.1
Sullivan
481.2 (8)
81.0 (8)
277.4 (7)
279.9
754.8
459.0
1299.5
837.8
Average
Fungicidal Performance in Managing Septoria Leaf Spot of
Pistachio in Arizona
Robert E. Call and Michael E. Matheron
Abstract
Septoria leaf spot was detected in the United States for the first time in 1964
within an experimental pistachio planting at Brownwood, Texas. The first
observation of the same disease in Arizona pistachio trees did not occur until
1986. In 1988, a survey of the 2,000 acres of pistachio orchards in southeastern
Arizona revealed a widespread incidence of the disease. Since the initial
discovery of the disease, Septoria leaf spot has appeared annually in some
Arizona pistachio acreage. The onset and severity of the disease is influenced by
summer rainfall that occurs in this region. Pistachio trees infected with Septoria
leaf spot and not treated with an effective fungicide can defoliate in the autumn
up to 2 months prematurely. The objective of this field study was to evaluate the
efficacy of several different fungicides against this disease. All fungicides were
applied to tree foliage on July 13 and August 10, 1999. Disease severity was
lowest on trees treated with Flint (trifloxystrobin). Other materials that
significantly reduced the final level of disease compared to nontreated trees
included Abound (azoxystrobin), Break (propiconazole), and Procop R (copper
hydroxide).
Introduction
Pistachio plantings were first established in North America around 1890 in Fresno, California (Maas et al., 1971).
Since then, pistachio trees also have been grown in Arizona, Nevada, Utah and Texas. Septoria leaf spot, caused by
the pathogenic fungus Septoria pistaciarum, has been reported in various Mediterranean countries where pistachios
are grown commercially. The disease was first detected in the United States in 1964 within an experimental pistachio
planting at Brownwood, Texas (Maas, et al., 1971). From 1965 to 1967, the first symptoms were observed during midMay in this Texas planting of pistachios, with the disease remaining mild during the remainder of the growing season.
In contrast, the spring seasons from 1968 to 1970 were very moist, followed by relatively dry summers. Under these
environmental conditions, leaf spots were observed as early as late April with subsequent disease development leading
to defoliation of trees during these years. Disease ratings in Texas revealed that leaves of Pistacia vera and all budded
trees of the Kerman variety were severely infected, whereas a more moderate level of disease was recorded on leaves
of P. chinensis, P. atlantica and P. terebinthus. A moderate level of Septoria leaf spot was first observed on leaves of
pistachio trees in Arizona in 1986 (Young and Michailides, 1989). A 1988 survey of the 2,000 acres of pistachios in
Arizona revealed that the disease was widespread. Adequate control of Septoria leaf spot has been reported in some
Mediterranean countries with applications of copper sulfate (Hallage, 1927; Pupillo and Di Caro, 1952; Sarjanni,
1935). The objective of this study was to evaluate some fungicides for their ability to inhibit development of Septoria
leaf spot in a pistachio orchard.
This is a part of publication az1178: “2000 Citrus and Deciduous Fruit and Nut Research Report,” College of
Agriculture and Life Sciences, the University of Arizona, Tucson, Arizona, 85721.
Materials and Methods
This experiment was established in a 16-yr-old commercial pistachio orchard in Cochise County, Arizona, during the
summer of 1999. Treatments were replicated five times in a randomized complete block design, with each replicate
consisting of one tree. Replicate trees were separated by nontreated trees. Tree spacing within the orchard was 17
x 17 ft. Fungicides were applied to the foliage of the trees July 13 and August 10 with an AgWay Air Blast Sprayer
that delivered 130 gal/acre. Monthly maximum and minimum ranges in air temperature (EF) for the duration of this
study were as follows: May, 63-91, 33-58; Jun, 77-99, 41-69; Jul, 77-100, 61-71; Aug, 74-98, 59-69; Sep 1-9, 84-96,
54-63. Rainfall (in.) during the same period of time was as follows: May, 0.00; Jun, 0.32; Jul, 4.34; Aug, 0.92; Sep
1-9, 0.00.
Disease severity was determined Sep 9 by counting the number of dead spots caused by Septoria pistaciarum on 10
leaves collected at random from each of the five replicate trees of each treatment.
Results and Discussion
Among the fungicides tested in 1999, disease severity was lowest on trees treated with Flint (trifloxystrobin). Other
materials that significantly reduced the final level of disease compared to nontreated trees included Abound
(azoxystrobin), Break (propiconazole), and Procop R (copper hydroxide). Single-tree replicates were too small to
detect any apparent effect of fungicide treatment on yield. Nontreated infected trees would begin to drop infected
leaves at least 6 weeks earlier than normal. Severe premature defoliation of trees likely would result in yield and
quality reduction of the pistachio nut crop.
These studies have demonstrated that several different chemistries applied during July and August can significantly
reduce the severity of Septoria leaf spot on pistachio in Arizona. Septoria leaf spot typically appears on pistachio
trees in southeastern Arizona during the month of August. It is interesting to note that on average, August is the
wettest month of the year in this region, with an average recorded rainfall of 4.0 inches during 1992 to 1996.
Literature Cited
Hallage, M.R. 1927. Fungus diseases of the pistachio tree in Syria. Internat. Bull. Plant Prot. 1(3):38-39.
Maas, J.L., van der Zwet, T., and Madden, G. 1971. A severe Septoria leaf spot of pistachio nut trees new to the
United States. Plant Dis. Reptr. 55:72-76.
Pupillo, M., and Di Caro, S. 1952. Alcune osservazioni sulle Septoria del Pistachio. Ann. Sper. Agr. N.S. 6(3):623634.
Sarjanni, J.A. 1935. Notes phytopathologiques; les septorioses du Pistachier. Ann. Inst. Phytopath. Benaki 1(3):6776.
Young, D.J., and Michailides, T.J. 1989. First report of Septoria leaf spot of pistachio in Arizona. Plant Dis. 73:775.
Table 1. 1999 Septoria leaf spot of pistachio fungicide trial.
Robert E. Call and Michael E. Matheron, University of Arizona, Cooperative Extension
Treatment
Rate of product/acre
Average number of
leaf
spots per leaf
Flint 50WG (trifloxystrobin)
0.125 lb
22 a
Abound 2.08SC (azoxystrobin)
15.4 fl oz
62 b
Procop R (copper hydroxide)
8.0 lb
74 bc
Break EC (propiconazole)
6.0 fl oz
128 cd
Elite 45DF (tebuconazole)
0.5 lb
259 de
Nontreated control
-------
293 e
*
Treatments were applied Jul 13 and Aug 10
**
Values followed by a different letter are significantly different (P = 0.05) from each
other according to the Duncan-Waller K-ratio test. A log transformation of data was
performed before Analysis of Variance test.
Performance of Mature Pecan Varieties in the Low Desert of Pinal County 1997-1999
Michael Kilby and Richard Gibson
Abstract
Twelve varieties of pecans were evaluated for yield, viviparity, and nut
quality. The commercially recommended varieties 'Western Schley' and
'Wichita' produced the greatest yields but also had the highest percentage
of pregermination. The varieties 'Cheyenne' and 'Sioux' exhibit great
potential for commercial production in the low desert of Arizona.
INTRODUCTION
In the past the primary pecan varieties recommended for planting in Arizona were 'Western Schley ' and ‘Wichita’.
The ‘Bradley’ is sometimes planted for pollination purposes opposite the ‘Western Schley’ in some situations but
because of low production is not acceptable as a main variety. The main varieties are fairly well adapted to the
low desert but in some years viviparity is devastating. Often, there is a low to no profit to the grower. The pecan
tree grows well but production is rather low (1500 lbs/acre) compared to trees grown in the mid to high elevations
(2000 lbs/acre). High night time temperatures, common in the low desert, are the probable cause for the yield
difference. In addition, the high daytime temperature occurring during nut maturity results in pregermination of
nuts on the tree aka viviparity. It appears the ‘Western Schley’ and ‘Wichita’ are not genetically conductive for
good consistent production without a high incidence of viviparity in the lower elevation ranges of the desert in AZ.
In this regard, we began to evaluate an array of pecan varieties for production and percentage of viviparity for
adaptation to these harsh enviromental conditions.
PROCEDURES
During the 1997 growing season we selected five trees from each variety in a commercial pecan orchard which
had been planted to an array of pecan varieties in the mid 1970’s. Each tree was marked so that we could return
and evaluate the same trees from year to year. At harvest yields were estimated by harvesting 1/25th of the area
beneath each tree using a set of ropes to designate the harvested area. A random sample of 100 nuts from this
harvested area were graded for viviparity and a random sample of ten nuts were processed for determination of
percent kernel.
RESULTS AND DISCUSSION
The average per tree yield for the three years varied considerable among varieties ( Table 1). The highest yielding
varieties were the old standards ‘Western Schley’ and ‘Wichita’ followed by’ Tejas’ and ‘Sioux’. Medium yielding
varieties were ‘Bradley’, ‘Cheyenne’ and ‘Shoshoni’. It was interesting to note that the 'Chickasaw' and 'Shoshoni'
did not yield any crop in 1997. The 'Shoshoni' did respond with a fairly decent yield in 1998, however the
'Chickasaw' did not. In 1998 the 'Choctaw', 'Cheyenne', 'Comanche', 'Mohawk', 'Sioux' and 'Tejas' did not yield
many pecans. Varieties that had yields below the medium yield range are not well suited for the environmental
conditions of this test. In terms of kernel percentage the 'Wichita' was the highest with 'Comanche' and 'Tejas' the
lowest ( Table 2). Kernel percentage is very important as price received is dependent on kernel percentage. In
other words in the shelling trade buyers are buying nut meats not in shell pecans.
An important aspect in growing pecans in the low desert is the factor of viviparity. Viviparity renders a nut non
salable and increases the cost to the grower who has to eliminate the damaged nut before delivery to the buyer.
The incidence of viviparity was very high in 1997 with weather conditions conducive for maximum expression of
the problem (Table 3). The primary commercial varieties, 'Western Schley' and 'Wichita' are very susceptible to
viviparity as evidenced by a loss of crop exceeding 30-46 percent. Conversely, the 'Tejas', 'Sioux', 'Cheyenne' and
This is a part of publication az1178: “2000 Citrus and Deciduous Fruit and Nut Research Report,” College of
Agriculture and Life Sciences, the University of Arizona, Tucson, Arizona, 85721.
'Bradley' exhibited substantially less at 5,14,14, and 20 percent respectively. The three year average resulted in
these four varieties exhibiting low viviparity rates. The Wonder Nut had a high incidence of viviparity. This
variety does not show promise for commercial production at this time.
CONCLUSIONS
The primary pecan varieties 'Western' and 'Wichita' performed superior to other varieties in terms of yield but
demonstrated a high incidence of viviparity. The high rate of viviparity expressed by these varieties are costly in
terms of harvesting, processing, and marketing. Varieties included in this evaluation showing extreme promise for
commercial planting are 'Cheyenne', 'Sioux', and 'Bradley'. The 'Tejas' yielded well and viviparity incidence was
low however kernel percentage was low. The two varieties with the greatest potential are 'Cheyenne' and 'Sioux'.
This experiment will be conducted one more year to fully ascertain parameters such as alternate bearing and
viviparity on variety performance. New cultural techniques such as hedge pruning will have a bearing on reducing
the alternate bearing habit of these varieties.
Table 1. Average per tree yield (lbs) of various pecan varieties grown at Picacho, AZ for 1997-1999.
Yield (lbs/tree)
VARIETIES
Bradley
Cheyenne
Chickasaw
Choctaw
Comanche
Mohawk
Shoshoni
Sioux
Tejas
Western Schley
Wichita
Wonder Nut
1997
34.4
98.2
----113.6
84.7
48.1
----113.1
133.3
83.7
95.1
-----
1998
61.9
----9.1
------------37.7
--------158.2
48.1
-----
1999
54.3
70.3
84.6
--------49.0
112.8
89.0
110.0
53.2
95.5
23.8*
Avg.
50.2
56.2
31.2
37.8
28.2
32.3
50.2
67.3
81.1
98.4
79.6
-----
* First Harvest
Table 2. Average nut percent kernel for various pecan varieties grown at Picacho, AZ 1997-1999.
% Kernel
VARIETIES
Bradley
Cheyenne
Chickasaw
Choctaw
Comanche
Mohawk
Shoshoni
Sioux
Tejas
Western Schley
Wichita
Wonder Nut
1997
59
58
----58
49
57
----58
51
59
58
-----
1998
61
----58
------------55
--------57
62
-----
1999
61
59
52
--------61
55
58
52
59
61
55
Avg.
60
59
55
58
49
59
55
58
52
58
60
55
Table 3. viviparity incidence as determined by nut splitting from various pecan varieties grown at Picacho, AZ
1997-1999.
% Splits
VARIETIES
Bradley
Cheyenne
Chickasaw
Choctaw
Comanche
Mohawk
Shoshoni
Sioux
Tejas
Western Schley
Wichita
Wonder Nut
1997
20
14
67
---35
26
---14
5
30
46
----
1998
1
---0
0
------8
------6
23
----
1999
5
3
6
------2
12
5
7
39
30
27
Avg.
9
9
37
---35
14
10
5
6
25
33
27


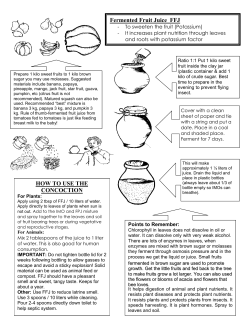

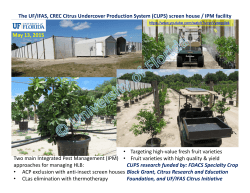


© Copyright 2026