Possible Per Acre Gross Revenues for Corn in 2015
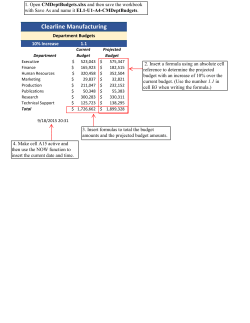
Possible Per Acre Gross Revenues for Corn in 2015 in Central Illinois Gary Schnitkey Department of Agricultural and Consumer Economics University of Illinois March 17, 2015 farmdoc daily (5):49 Recommended citation format: Schnitkey, G. “Possible Per Acre Gross Revenues for Corn in 2015 in Central Illinois.” farmdoc daily (5):49, Department of Agricultural and Consumer Economics, University of Illinois at Urbana-Champaign, March 17, 2015. Permalink http://farmdocdaily.illinois.edu/2015/03/possible-gross-revenues-corn-2015-central-il.html Possible gross revenues for corn grown in 2015 are estimated for a Logan County, Illinois farm having a 196 bushels per acre expected yield. Revenues are estimated for differing cases based on changes in prices and yields from 1972 through 2014. The mid-point of 2015 gross revenue range is $828 per acre, $52 below the estimate of total costs for cash rent farmland of $880 per acre. Gross revenue is estimated to exceed $880 per acre 23% of the time. Procedure Gross revenue in 2015 is projected for 43 cases representing conditions in each year from 1972 through 2014. Cases are centered on the 2015 projected price of $4.15 per bushel and an expected yield of 196 bushels per acre. For each case year, yield and price changes are calculated and applied to the $4.15 projected price and 196 bushel per acre expected yield. For each year, four items are estimated: 1) harvest price, 2) market-year-average (MYA) price, 3) county yield, and 4) farm yield. Each case’s harvest price is calculated by first dividing the harvest price by the projected price for that year. The result is then multiplied by the $4.15 projected price to determine the harvest price for that year’s case. Take 2012 as an example. In 2012, the projected price was $5.68 and the harvest price was $7.50 per bushel, resulting in a harvest price divided by the projected price of 1.32 ($7.50 harvest price / $5.68 projected price). The 2015 projected price of $4.15 is multiplied by 1.32 to arrive at a harvest price of $5.48 ($4.15 projected price x 1.32). The $5.48 is an estimate of the harvest price in 2015 if a year like 2012 happens in 2015. Conceptually similar procedures are used for determining the MYA price, the county yield, and the farm yield. Four revenue components are calculated: 1. Crop revenue. For each case, crop revenue equals farm yield time MYA price. The mid-point crop revenue has half the cases above it and half the cases below it. The mid-point crop revenue is $758 per acre. Ten percent of the cases are below $640 per acre, and 10% of the cases are above $950 per acre (see Table 1) 2. Revenue Protection (RP) insurance. Payments from an RP crop insurance policy at an 85% coverage level are calculated for each case. RP at the 85% coverage level was the most crop insurance policy in 2014 (see March 10, 2015 farmdoc daily article). The Trend Adjusted Actual Production History (TA-APH) yield used in these calculations is 196 bushels per acre. RP crop insurance is estimated to pay in 37% of the cases. We request all readers, electronic media and others follow our citation guidelines when re-posting articles from farmdoc daily. Guidelines are available here. The farmdoc daily website falls under University of Illinois copyright and intellectual property rights. For a detailed statement, please see the University of Illinois Copyright Information and Policies here. 1 farmdoc daily March 17, 2015 3. Agricultural Risk Coverage – County Coverage (ARC-CO). ARC-CO payments are calculated given a county benchmark yield of 175 bushels per acres and a benchmark price of $5.29 per bushel, representing likely parameters for Logan County, Illinois. The payment represents a base acre payment, taking into consideration that payments are received on only 85% of the base acres. ARC-CO is estimated to pay in 74% of the cases (see Table 1). 4. Price Loss Coverage (PLC) payments are calculate given a reference price of $3.70 and a program yield of 161 bushels per acre. PLC is estimated to pay in 44% of the cases. Table 1. Range in Gross Revenue and its Compnents, Logan County, Illinois Case Farm. 10% Mid 90% Lowest (1) Point (2) Highest (3) $ per acre Crop Revenue 630 758 950 RP Insurance (85%) 0 0 66 ARC-CO 0 35 78 PLC 0 0 80 Gross Rev. with ARC-CO (3) 746 828 949 Gross Rev. with PLC (3) 717 786 948 (1) Ten percent of the revenues are below these values. (2) Fifty percent of the revenues are above and 40% are below these values. (3) Ten percent of the revenues are above these values. (4) Include crop revenue plus RP insurance + government payment. Gross revenue takes into consideration the above components, equaling crop revenue plus crop insurance payment plus government program payments. Two gross revenues exist: one when government payments are received through ARC-CO and the other through PLC. When matching government payments in gross revenue, the above procedure assumes that there is one base acre for each planted acre. This does not necessarily have to be the case. Planting decisions do not influence base acres for calculating government payments when ARC-CO or PLC is chosen. Also, the 2015 government payments will not be received until the fall of 2016. Gross Revenue The mid-point of the gross revenue with ARC-CO is $828 per acre (see Table 1). There is a considerable range around this mid-point. Ten percent of the cases have gross revenue less than $746 per acre, and 10 percent of the cases have revenue above $948 per acre (see Table 1). 2 farmdoc daily March 17, 2015 In Figure 1, bars show revenue for each of the case years. The figure also includes two solid lines. The lowest is at $580 per acre, the estimated non-land costs associated with corn. None of the revenues are below non-land costs. The second line is at $880 per acre, the estimated total cost given cash rent at an average level. The $880 equals $580 of non-land cost plus $300 of cash rent. Only 23% of the cases exceed $880 per acre. The 23% of the cases when gross revenue exceeds $880 occurred in the following case years: 1973, 1975, 1987, 1988, 2003, 2006, 2007, 2010, and 2012. With the exception of 2003, all years had a higher harvest price than projected price. Note that two of these years were associated with large droughts: 2008 and 2012. In those drought years, RP payments aid in maintaining overall gross revenue. High yields are not necessarily associate with gross revenue exceeding $880. Three of the five years with the highest yield above trend are associated with gross revenue below $880 per acre (1986, 1994, and 2014). History would suggest higher gross revenue are more likely associated with price increases rather than higher yields alone. High yields often are associated with low prices, resulting in near averaged gross revenue. A “typical” year has yields near trend and prices near projected prices. These years result in revenue in the mid to low $800 per acre range. A string of these years occurred between 1996 through 2001. During these years, yields were within 10 bushels of trend and harvest prices were relatively close to projected prices. ARC-CO versus PLC payments This analysis suggests that ARC-CO has about a 75% chance of making a payment. Many of the years are projected at $78, the maximum payments for ARC-CO in 2015 (see Figure 2). In compassion, PLC is projected to pay in 44% of the cases. Average payments from ARC-CO are estimated at $49 per acre. PLC is at $25 per acre. Note that these represent estimates for 2015. ARC-CO and PLC payment expectations will change over time. In particular, ARC-CO guarantee will change as the benchmark yield and price changes. 3 farmdoc daily March 17, 2015 Summary There is a range of possible revenues in 2015. Expectations are for gross revenue to be below total costs given that farmland is cash rented at an average cash rent. Only 23% of the cases have gross revenue exceeding total costs. References Schnitkey, G. "Crop Insurance Decisions in 2015." farmdoc daily (5):44, Department of Agricultural and Consumer Economics, University of Illinois at Urbana-Champaign, March 10, 2015. Also available at: http://farmdoc.illinois.edu/manage/newsletters/fefo15_05/fefo_15_05.html 4 farmdoc daily March 17, 2015
© Copyright 2026


