
STORE SURVEY 2005/2006 - FINAL REPORT APPLIANCE STANDBY POWER CONSUMPTION
Report No: 2006/09
NATIONAL APPLIANCE AND EQUIPMENT ENERGY EFFICIENCY PROGRAM
APPLIANCE STANDBY POWER CONSUMPTION
STORE SURVEY 2005/2006 - FINAL REPORT
AUGUST 2006
AN INITIATIVE OF THE MINISTERIAL COUNCIL ON ENERGY FORMING PART OF THE
AUSTRALIAN NATIONAL FRAMEWORK FOR ENERGY EFFICIENCY AND
THE NEW ZEALAND NATIONAL ENERGY EFFICIENCY AND CONSERVATION STRATEGY
Appliance Standby Power Consumption: Store Survey 2005/06
August 2006
Contents
Introduction
1
Background
1
Definition of “Standby”
1
Aims & objectives
2
Research Methods
3
Equipment and Preparation
Problems encountered during data collection
Acknowledgements
Results
3
6
7
8
Overview
8
Product Profiles
9
Major Appliances
Small Appliances
Computers and Peripherals
Home Entertainment Equipment
References
9
35
47
63
108
Index of Tables
Table 1 – A summary of modes tested by appliance
5
Table 2 – A summary of air conditioner results
9
Table 3 – A summary of clothes dryer results
13
Table 4 – A summary of dishwasher results
15
Table 5 – A summary of front loading washing machine results
20
Table 6 – A summary of top loading washing machine results
25
Table 7 – A summary of clothes washer/dryer results
30
Table 8 – A summary of heaters – electric portable results
31
Table 9 – A summary of heaters – gas results
33
Table 10 – A summary of gas water heaters
34
Table 11 – A summary of breadmaker results
35
Table 12 – A summary of hand-held vacuum cleaner results
37
Table 13 – A summary of microwave results
40
Table 14 – A summary of espresso machine results
42
Table 15 – A summary of portable fans
44
Table 16 – A summary of juicers
45
Table 17– A summary of toasters
46
Table 18– A summary of EPS (External Power Supply)
46
Table 19 – A summary of multi function device results
48
Appliance Standby Power Consumption: Store Survey 2005/06
August 2006
Table 20 – A summary of hard drive/cpu box results
51
Table 21 – A summary of laptop computer results
53
Table 22 – A summary of computer monitor results
54
Table 23 – A summary of computer speaker results
56
Table 24 – A summary of home theatre box results
58
Table 25 – A summary of inkjet printer results
59
Table 26 – A summary of laser printer results
62
Table 27 – A summary of CRT television results
64
Table 28 – A summary of LCD TV results
67
Table 29 – A summary of projection TV results
70
Table 30 – A summary of plasma TV results
72
Table 31 – A summary of DVD player results
75
Table 32 – A summary of DVD recorder results
80
Table 33 – A summary of hard disk recorder results
83
Table 34 – A summary of integrated stereo results
86
Table 35 – A summary of portable stereo results
90
Table 36 – A summary of AV Receiver results
93
Table 37 – A summary of home theatre system results
97
Table 38 – A summary of subwoofer results
101
Table 39 – A summary of set top box results
104
Index of Figures
Figure 1 – Power measurements for air conditioners: off mode
10
Figure 2 – Average power measurements for air conditioners: off mode
10
Figure 3 – Power measurements for air conditioners: passive mode
11
Figure 4 – Average power measurements for air conditioners: passive mode
11
Figure 5 – Power measurements for air conditioners: delay start mode
12
Figure 6 – Power measurements for clothes dryers: off mode
13
Figure 7 – Average power measurements for clothes dryers: off mode
14
Figure 8 – Power measurements for clothes dryers: active standby mode
15
Figure 9 – Power measurements for dishwashers: off mode
16
Figure 10 – Average power measurements for dishwashers: off mode
17
Figure 11 – Power measurements for dishwashers: active standby mode
18
Figure 12 – Average power measurements for dishwashers: active standby mode
18
Figure 13 – Power measurements for dishwashers: delay start mode
19
Appliance Standby Power Consumption: Store Survey 2005/06
August 2006
Figure 14 – Average power measurements for dishwashers: delay start mode
19
Figure 15 – Power measurements for front loading washing machines: active standby mode
21
Figure 16 – Average power measurements for front loading washing machines: active standby mode
21
Figure17 – Power measurements for front loading washing machines: off mode
22
Figure 18 – Average power measurements for front loading washing machines: off mode
23
Figure 19 – Power measurements for front loading washing machines: delay start mode
24
Figure 20 – Average power measurements for front loading washing machines: delay start mode
24
Figure 21 – Power measurements for top loading washing machines: active standby mode
26
Figure 22 – Average power measurements for top loading washing machines: active standby mode
26
Figure 23 – Power measurements for top loading washing machines: off mode
27
Figure 24 –Average power measurements for top loading washing machines: off mode
28
Figure 25 – Power measurements for top loading washing machines: delay start mode
29
Figure 26 – Average power measurements for top loading washing machines: delay start mode
29
Figure 27 – Power measurements for portable electric heaters: off mode
31
Figure 28 – Average power measurements for portable electric heaters: off mode
32
Figure 29 – Power measurements for portable electric heaters: passive standby mode
32
Figure 30 – Power measurements for gas heaters: off mode
33
Figure 31 – Power measurements for gas water heaters: off mode
34
Figure 32 – Power measurements for breadmakers: active standby mode
36
Figure 33 – Average power measurements for breadmakers: active standby mode
36
Figure 34 – Power measurements for hand-held vacuum cleaners: active standby mode
38
Figure 35 – Average power measurements for hand-held vacuum cleaners: active standby mode
38
Figure 36 – Power measurements for hand-held vacuum cleaners: passive standby mode
39
Figure 37 – Average power measurements for hand-held vacuum cleaners: passive standby mode
39
Figure 38 – Power measurements for microwaves: passive standby mode
41
Figure 39 – Average power measurements for microwaves: passive standby mode
41
Figure 40 – Power measurements for espresso machines: off mode
43
Figure 41 – Average power measurements for espresso machines: off mode
43
Figure 42 – Power measurements for fans: off mode
44
Figure 43 – Power measurements for juicers: off mode
45
Figure 44 – Power measurements for EPS’: passive standby mode
47
Figure 45 – Power measurements for multi-function devices: active standby
48
Figure 46 – Average power measurements for multi-function devices: active standby
49
Figure 47 – Power measurements for multi-function devices: off mode
50
Figure 48 – Average Power measurements for Multi-function Devices in Off Mode
50
Figure 49 – Power measurements for computers: off mode
52
Figure 50 – Average power measurements for computers: off mode
52
Appliance Standby Power Consumption: Store Survey 2005/06
August 2006
Figure 51 – Power measurements for portable computers: off mode
53
Figure 52 – Average power measurements for portable computers: off mode
54
Figure 53 – Power measurements for monitors: off mode
55
Figure 54 – Average power measurements for monitors: off mode
56
Figure 55 – Power measurements for computer speakers: active standby mode
57
Figure 56 – Power measurements for computer speakers: off mode
57
Figure 57 – Power measurements for inkjet printers: passive standby mode
59
Figure 58 – Average power measurements for inkjet printers: passive standby mode
60
Figure 59 – Power measurements for inkjet printers: off mode
61
Figure 60 – Average power measurements for inkjet printers: off mode
61
Figure 61 – Power measurements for laser printers: passive standby mode
62
Figure 62 – Power measurements for CRT televisions: passive standby mode
64
Figure 63 – Average power measurements for CRT televisions: passive standby mode
65
Figure 64 – Power measurements for CRT televisions: off mode
66
Figure 65 – Power measurements for LCD televisions: passive mode
67
Figure 66 – Average power measurements for LCD televisions: passive mode
68
Figure 67 – Power measurements for LCD televisions: off mode
69
Figure 68 – Average power measurements for LCD televisions: off mode
69
Figure 69 – Power measurements for projection televisions: passive standby mode
71
Figure 70 – Average power measurements for projection televisions: passive standby mode
71
Figure 71 – Power measurements for plasma televisions: passive standby mode
73
Figure 72 – Average power measurements for plasma televisions: passive standby mode
73
Figure 73 – Power measurements for plasma televisions: off mode
74
Figure 74 – Average power measurements for plasma televisions: off mode
74
Figure 75 – Power measurements for DVD players: active standby mode
76
Figure 76 – Average power measurements for DVDs: active standby mode
76
Figure 77 – Power measurements for DVD players: passive standby mode
77
Figure 78 – Average power measurements for DVDs: passive standby mode
78
Figure 79 – Power measurements for DVD players: off mode
79
Figure 80 – Average power measurements for DVD players: off mode
79
Figure 81 – Power measurements for DVD recorders: active standby mode
81
Figure 82 – Average power measurements for DVD recorders: active standby
81
Figure 83 - Power measurements for DVD recorders: passive standby
82
Figure 84 - Average power measurements for DVD recorders: passive standby
82
Figure 85 – Power measurements for hard disk recorders: active standby mode
84
Figure 86 – Average power measurements for hard disk recorders: active standby
84
Figure 87 – Power measurements for hard disk recorders: passive standby mode
85
Appliance Standby Power Consumption: Store Survey 2005/06
August 2006
Figure 88 – Average power measurements for hard disk recorders: passive standby
85
Figure 89 – Power measurements for integrated stereos: active standby mode
87
Figure 90 – Average power measurements for integrated stereos: active standby mode
87
Figure 91 – Power measurements for integrated stereos: passive standby mode
88
Figure 92 – Average power measurements for integrated stereos: passive standby
89
Figure 93 – Power measurements for portable stereos: active standby mode
90
Figure 94 – Average Power measurements for portable stereos: active standby mode
91
Figure 95 – Power measurements for portable stereos: passive standby mode
92
Figure 96 – Average Power measurements for portable stereos: passive standby mode
92
Figure 97 – Power measurements for AV receivers: active standby mode
94
Figure 98 – Average Power measurements for AV receivers: active standby mode
94
Figure 99 – Power measurements for AV receivers: passive standby mode
95
Figure 100 – Average power measurements for AV receivers: passive standby mode
96
Figure 101 – Power measurements for AV receivers: off mode
96
Figure 102 – Power measurements for home theatre systems: active standby mode
98
Figure 103 – Average power measurements for home theatre systems: active standby mode
98
Figure 104 – Power measurements for home theatre systems: passive standby mode
99
Figure 105 – Average power measurements for home theatre systems: passive standby mode
100
Figure 106 – Power measurements for sub woofers: active standby mode
101
Figure 107 – Average power measurements for sub woofers: active standby mode
102
Figure 108 – Power measurements for sub woofers: off mode
103
Figure 109 – Average power measurements for sub woofers: off mode
103
Figure 110 – Power measurements for set top boxes: active standby mode
105
Figure 111 – Average power measurements for set top boxes: active standby mode
105
Figure 112 – Power measurements for set top boxes: passive standby mode
106
Figure 113 – Average power measurements for set top boxes: passive standby mode
106
Appliance Standby Power Consumption: Store Survey 2005/06
August 2006
Introduction
Background
In 2000 the Australian Greenhouse Office (AGO) and the National Appliance &
Equipment Energy Efficiency Committee (NAEEEC)1 commissioned the report,
Quantification of Residential Standby Power Consumption in Australia (Energy Efficient Strategies
and EnergyConsult, 2001). This study provided results of an intrusive survey where
measurements on 2,500 appliances were undertaken in 64 houses in Melbourne, Sydney
and Brisbane. This report also included results of measurements on 531 new appliances in
retail outlets and results of a telephone survey of 801 households in Australia, which
documented information on appliance ownership, age and usage patterns. This research
revealed that 11.6% of Australia’s household electricity consumption is attributed to
energy used by appliances and electronic equipment when not performing their primary
function (this figure includes some small continuous loads not traditionally classified as
“standby”). This “standby” consumption was estimated in 2000 to be costing Australians
more than $500 million per year and generating more than 5 million tonnes of carbon
dioxide per annum. A more recent intrusive survey conducted under the E3 programme
found that residential standby energy usage has increased by 3% per annum for the last
five years and is now generating 6.2 million tonnes of carbon dioxide per annum (EES
2005).
Following the 2000 study, five follow-up store surveys of new appliances have been
conducted. The reports titled Appliance Standby Power Consumption: Store Survey (Energy
Efficient Strategies & Energy Consult), measured energy consumption of 635 in 2002,
573 in 2003, 1431 in 2004, and 1313 in 2004/05, and 946 appliances in 2005/06. This
data was compared with the information recorded in the 2001 report; a large proportion
of products still consumed more than 1 W in standby and off modes and off modes.
The results presented in this report provide details of in-store standby measurements for
946 new household appliances that were undertaken in November 2005 and June 2006.
This report represents a continuation of the ongoing monitoring of appliance standby
power usage, which began with the store survey conducted in late 2000. A summary of
the findings from this report can be found in the report titled – Executive Summary
(EnergyConsult 2006).
Definition of “Standby”
Appliances and equipment with a “standby mode” may include any household product
that consumes power while not performing its primary function. A simple definition of
“standby” is when an appliance is at its lowest power consumption when connected to
mains power, even if the appliance is turned off (lowest power mode that can be
1
Now known as the Equipment Energy Efficiency (E3) Committee.
1
Appliance Standby Power Consumption: Store Survey 2005/06
August 2006
influenced by the user). However, “standby” is better defined under various modes and
for the purpose of this research, standby modes were defined as follows:
Off
When a product or appliance is connected to a power source but does not produce any
sound or picture, transmit or receive information or is waiting to be switched “on” by the
consumer. If the product has a remote control, it cannot be woken by the remote control
from off mode. While the product may be doing some internal functions in off mode (e.g.
memory functions, EMC filters) these are not obvious to the user.
Passive Standby
When a product or appliance is not performing its main function but it is ready to be
switched on (in most cases with a remote control) or is performing some secondary
function (e.g. has a display or clock). This mode also applies to power supplies for battery
operated equipment (portable appliances which are intended to be used when
disconnected from the base station) when the appliance is not being charged.
Active Standby:
Active standby is mostly applicable to VCRs and some stereo equipment where operating
involves some mechanical drive (such as DVD and CD players). Active standby is when
the appliance is on but not performing its main function. For example, the VCR may be
on but is not playing or recording. This mode also applies to power supplies for battery
operated equipment (portable appliances) when the appliance is being charged (various
sub-modes).
Delay Start:
Delay start mode was measured for the first time in the 2003/04 survey. This feature is
fast becoming common place on many major appliances. Essentially the appliance can be
programmed to begin functioning at a later time; in some cases up to 24 hours later.
Appliances left in this mode are in neither active nor passive standby and therefore it was
decided to measure this mode as a separate category. The effect this mode will have on
consumption will largely be determined by consumer behaviour. The recent EES (2005)
intrusive survey found between 20 to 25% of consumers used this function when it is
available.
Aims & objectives
The Equipment Energy Efficiency Committee commissioned this research as part of its
program to reduce the standby consumption of all electronic appliances to less than 1W.
This research was primarily undertaken to monitor changes in standby power
consumption with the results of previous annual surveys undertaken since 2001. The
main objectives of this survey were to:
2
Appliance Standby Power Consumption: Store Survey 2005/06
August 2006
Quantify the magnitude of electricity used in standby mode by new appliances
offered for sale in the Australian market in November 2005 and June 2006
Compare the results of this study with those from the five previous in store
surveys in order to track the industry’s progress in reducing standby power
consumption.
This survey was done in two separate time blocks to ensure a broader range of appliances
were included. This enabled the survey to include seasonal products such as heaters and
air conditioners.
During the survey, additional information is collected regarding the features of each
appliance, i.e. screen size of monitors and TVs, style of appliance, i.e. wall mount vs
portable air conditioner etc., price etc. This information assists in the analysis of the data
and identifying any trends in appliances. For example if a group of appliances with the
same features are all found to be high consuming products then the presence of that
feature could explain the extra power.
The survey also records the presence of an Energy Rating label or an ENERGY STAR
label on appliances. Products that displayed an ENERGY STAR label were cross
examined to reveal if the ENERGY STAR requirements to display the label for that
product type were met. For white goods, only the presence or absence of the Energy
Rating label has been noted in the analysis as a more complex and rigorous testing
procedure (that includes factors other than standby performance) is used when labelling
such products.
Research Methods
Equipment and Preparation
The majority of appliances were measured using a portable meter, (Sparmeter Model
NZR 230). The meter used for measuring TVs energy usage was a Yokogawa2 digital
power analyser Model WT200.
Seven Melbourne retail stores participated in the 2005/06 study. This allowed
measurements of a large range of appliances, across a number of manufacturers to be
taken. The metering device was systematically plugged into the floor stock across 40
appliances categories. This year some appliance categories were excluded from the
survey, i.e. cooking appliances such as cook tops & stoves as their impact on the standby
energy usage was deemed to be minimal from previous surveys. Some new appliances
were added for the first time, e.g. toasters. Where products have been redefined these
details are included in the results section of the report. Appliance brand and model
number were recorded to prevent duplication of measurements. There was no selection
2
Calibrated in February 2002. Fundamental power accuracy of 0.25%.
3
Appliance Standby Power Consumption: Store Survey 2005/06
August 2006
process, with most of the available stock on display in the store being measured. The
reasons for some appliances not being measured as part of this survey were as follows:
•
Appliance power cord missing or damaged;
•
European or US power cord;
•
Appliance difficult to access without disturbing the store display;
•
Shop Fixture design does not allow access to power cords without removing shelving
and panels. (This seems to be more common with stores seeing this as an anti theft
solution)
•
No display model available at the time or only appliance casing displayed (not a
working model);
•
Appliance locked in cabinets for security reasons.
•
Display appliances are hard wired or built in. (this was the case particularly for air
conditioning appliances.
For each appliance, power consumption was measured while the appliance was in use, in
standby (passive and/or active) and off, where applicable. Clearly for many appliances
such as washing machines and dishwashers, it was impractical to measure the appliance in
use. For most of these products there is an Australian Standard that adequately covers
the ‘in use’ mode consumption.
A new test procedure was used for measuring Televisions this year. As a new
international test method for televisions is currently being developed, in-use mode while
measured is not discussed in the results section. These measurements will again be
included in the future once the test method is established. Additionally as the appropriate
test method was not available during the November store survey a smaller number of
televisions have been recorded this year. Power factor was only recorded for passive
standby and crest factor was not included at all this survey.
Power factor traditionally means any phase shift between a sinusoidal voltage supply
waveform and a sinusoidal current waveform (power factor is 1.0 when these are perfectly
aligned). However, in the case of standby measurements where the current waveform is
often distorted and non-sinusoidal in shape, the power factor is the ratio of the active
power (Watts) to the average VA (volt-amps). The power factor is a measure of how
much of the current is performing useful work (contributing to active power use). Values
for power factor are low <0.5, moderate 0.5-0.8, high >0.8-1.0.
Table 1 documents which appliances were measured in the 2005/06 survey. It also shows
the various mode combinations measured, namely in-use, in standby (passive or active,
where applicable) and off mode. As previously mentioned it was not always practical to
measure appliances in normal use during an in store survey. The modes measured for
each product type reflect the design and operation of the product. While some product
types will have passive or active standby modes (e.g. a dishwasher can be switched on
4
Appliance Standby Power Consumption: Store Survey 2005/06
August 2006
prior to the start of a program – this would be passive standby), not all of these modes
were measured or are relevant to this study.
Table 1 – A summary of modes tested by appliance
Appliance List
In Use
Active
Standby
Passive
Standby
Delay Start
Off
EPS*
(likely)
Air Conditioner
AV Receiver
Breadmaker
Computers – Box
Computers – Home Theatre Box
Computers - Laptop
Computers - Monitor
Computers - Speakers
Computers - Other
Cordless Phone
Dishwasher
Dryer
DVD Player
DVD Recorder
Espresso Machine
Facsimile
Fan
Game Console
Gas Water Heaters
Hand-held Vacuum
Hard Disk Recorder
Heater - Electric Portable
Heater - Gas
Home Entertainment Other
Home Theatre Systems
Juicer
Microwave
Mobile Phone
Modem
Multi Function Device
Printer – Inkjet
Printer – Laser
Set Top Box
Stereo - Integrated
Stereo – Portable
Stereo - Component
Subwoofer
Toaster
TV – LCD
TV – Plasma
TV – Projection
TV – CRT
TV/VCR
5
Appliance Standby Power Consumption: Store Survey 2005/06
Appliance List
In Use
Active
Standby
Passive
Standby
August 2006
Delay Start
Off
EPS*
(likely)
VCR
Washer/Dryer
Washing Machines (all types)
Mode tested
*Note: All appliances with an EPS will have the EPS measured in a separate EPS column that also records the brand and model of the EPS.
In total 946 products were measured, resulting in 1625 measurements being recorded
during the survey. These results were analysed and compared with outcomes from the instore surveys carried out between 2001 and 2005 where possible.
Problems encountered during data collection
Not all products could be measured in all of the desired modes. For example, security
reasons prevented some remote controls being displayed with items. This year most
appliances reliant on remote controls for operation were able to be tested in all desired
modes as a universal remote control was used where device remote controls were not
available.
In some cases products had changed or were no longer available. Multi function devices
have replaced some single function devices. For example no facsimiles were found in
stores but rather the fax function was included in multi function devices which often
incorporated printing, copying and faxing functions.
Some devices previously included in the survey have not been included in this year’s
survey as the results from previous years indicate that the devices were not contributing
significantly to the standby energy consumption. For example stoves, range hoods and
cook tops. Additionally VCRs were included but were not reported in detail as only 3
units were found and it has been concluded that this product is about to become
obsolete. Some new devices were measured for the first time such as toasters.
Washing machines were divided into two categories, front loading and top loading. The
historical data was resorted to allow comparisons to be made with the data collected this
year.
Other problematic appliances included stereo units, such as integrated stereo equipment,
where active standby power varied depending on the part of the unit “waiting to be
used”. For example, active standby could be higher for some units when a CD was
present (but not playing) within the unit. To overcome the variation in standby
measurements for integrated stereo equipment, measurements were taken in CD mode
when the unit had finished searching for the disc. In most units a “No Disc” message
was displayed. For integrated stereo equipment without a CD player, measurements were
taken with the unit set to aux. Many appliances are no longer being made with an off
mode.
6
Appliance Standby Power Consumption: Store Survey 2005/06
August 2006
Acknowledgements
EnergyConsult undertook this study for the Equipment Energy Efficiency (E3)
Committee.
A number of organisations assisted with this project and their cooperation and assistance
is gratefully acknowledged. We would like to particularly thank management and staff of
the following Melbourne stores:
1. Clive Peters Moorabbin
2. Custom Sound & Vision Brunswick
3. Harvey Norman Hoppers Crossing
4. JB HiFi East Keilor
5. Just Electrical Sunshine
6. Origin Energy Shop Camberwell
7. Origin Energy Shop Maribyrnong
Melissa Damnics of EnergyConsult coordinated the study with support from Lloyd
Harrington of Energy Efficient Strategies. Melissa Damnics, Debra Frey and Michelle
Leeder of EnergyConsult were responsible for undertaking field measurements on
appliances and the recording of data. Paul Ryan of EnergyConsult was responsible for
the definition and providing of the TV measurement test procedure and tools and
subsequent data analysis software. Melissa Damnics and Michelle Leeder of
EnergyConsult and were responsible for the preparation of the main report.
Notwithstanding the many individuals and organisations that have assisted during this
project, the content and form of this report, and all of the views, conclusions and
recommendations expressed in it, are those of EnergyConsult.
7
Appliance Standby Power Consumption: Store Survey 2005/06
August 2006
Results
Overview
The following 40 appliance types were tested during the 2005/06 in store survey:
•
•
•
•
•
•
•
•
•
•
•
•
•
•
•
•
•
•
•
•
Air Conditioner
Breadmaker
Computers – Home Theatre
Box
Computers - Monitor
Dishwasher
DVD Player
Espresso Machine
Gas Water Heater
Hand-held Vacuum
Heater - Electric Portable
Home Entertainment Other
Juicer
Printer – Inkjet
Stereo - Integrated
Stereo - Component
Toaster
TV – Plasma
TV – CRT
VCR
Washing Machine – Top
Loading
•
AV Receiver
•
•
Computers – Box
Computers - Laptop
•
•
•
•
•
•
•
Computers - Speakers
Dryer
DVD Recorder
Fan
Hard Disk Recorder
Heater - Gas
Home Theatre Systems
Microwave
Multi Function Device
Printer – Laser
Set Top Box
Stereo – Portable
Subwoofer
TV – LCD
TV – Projection
Washer/Dryer
Washing Machine – Front
Loading
•
•
•
•
•
•
•
•
•
•
The following section details the results by appliance type. All histograms included in this
report use the same bin definitions for the first bin, which indicates the number of units
with no power consumption in the mode specified (i.e. equal to 0.0 Watts or effectively
less than 0.05 Watts in terms of metered data). Subsequent bins are labelled accordingly
however it should be noted that some bin sizes are non linear. Additionally data has been
analysed for statistical significance. In all instances significance has been tested at 95%.
8
Appliance Standby Power Consumption: Store Survey 2005/06
August 2006
Product Profiles
Major Appliances
Air Conditioners
In the 2005/06 store survey 39 air conditioner units were measured; 13 were window-wall
models, and 22 were portable appliances. Only 4 split system units could be measured as
most of the units found in stores were either hard wired or had 15 amp power plugs.
Seventeen of the air conditioners found are required to display energy labels however only
8 air conditioners displayed an energy rating label. Nine of the twenty-two portable units
used evaporative cooling.
Air conditioners were measured in off, passive and delay start mode.
The average power consumption in passive mode was 1.7W which is 0.5W lower than
2004/05 survey, with a high of 3.1W and a low of zero. In off mode average
consumption was 0.2W with 3.0W being the highest and 0.0W the lowest. Delay start
consumption was 3.0W average. The results for air conditioners are summarised in Table
2 below.
Table 2 – A summary of air conditioner results
Appliance:
Mode
Delay Start
Active
Passive
Off
Total Number of Units
Air Conditioner
Number of
Measurements
3
0
22
19
39
Average
Power (W)
Power
Max
3.0
NA
1.7
0.2
3.0
NA
3.1
3.0
Power
Min
3.0
NA
0.0
0.0
Figure 1 and Figure 2 presents the off mode data recorded for air conditioners during the
annual surveys undertaken thus far. The 2005/06 data shows that an overwhelming
majority of units still use less than 1W in off mode. Average energy consumption
dropped to levels similar to the 2003/04 survey.
The type of air conditioner appears to have no affect on consumption in off mode,
although the highest consuming models were all refrigerated units. Air conditioners were
not measured in the 2001 survey.
9
Appliance Standby Power Consumption: Store Survey 2005/06
August 2006
Figure 1 – Power measurements for air conditioners: off mode
100%
Percentage of appliances measured at load
90%
80%
2001
2002
2003Jan
2003-04
2004-05
2005-06
70%
60%
n= 0
n= 20
n= 26
n= 28
n= 27
n= 19
50%
40%
30%
20%
10%
0%
<0.05
<1
<2
<3
<4
<5
<6
<7
<8
<9
<10
<20
<50
>50
Power of Appliance in the specified mode - Watts
Figure 2 – Average power measurements for air conditioners: off mode
0.7
0.6
Average Consumption (Watts)
0.6
0.5
0.5
0.4
0.4
0.3
0.2
0.1
0.2
0.1
0.0
2001
2002
2003Jan
2003-04
2004-05
n= 0
n= 20
n= 26
n= 28
n= 27
2005-06
n= 19
Year
This year’s survey saw a large increase in the number of models with remote control,
particularly in the portable air conditioner category. Passive standby was found in over
56% of models tested in this survey, compared to between 25 and 30% in previous years.
Figure 3 shows the range of consumption in passive mode was relatively unchanged with
10
Appliance Standby Power Consumption: Store Survey 2005/06
August 2006
most models still consuming between 1 and 2 watts. As shown in Figure 4 average
passive standby for 2005/06 usage has decreased from 2.2W to 1.7W. There is no
statistical significance in this change, however if the large increase in models using remote
control function continues there is likely to be an overall increase in the passive standby
consumption in the air conditioner segment.
Figure 3 – Power measurements for air conditioners: passive mode
50%
Percentage of appliances measured at load
45%
2001
2002
2003Jan
2003-04
2004-05
2005-06
40%
35%
n= 0
n= 0
n= 0
n= 12
n= 8
n= 22
30%
25%
20%
15%
10%
5%
0%
<0.05
<1
<2
<3
<4
<5
<6
<7
<8
<9
<10
<20
<50
>50
Power of Appliance in the specified mode - Watts
Figure 4 – Average power measurements for air conditioners: passive mode
2.5
2.2
Average Consumption (Watts)
2.0
1.7
1.5
1.5
1.0
0.5
0.0
0.0
2001
2002
2003Jan
n= 0
n= 0
0.0
-
n= 0
2003-04
2004-05
2005-06
n= 12
n= 8
n= 22
Year
11
Appliance Standby Power Consumption: Store Survey 2005/06
August 2006
Less than 8% of units measured in this survey had a delay start function. From the 2005
intrusive home survey no air conditioners were found to be in delay start mode. It
appears that delay start function is not a significant contributing factor of power use in
the air conditioner segment. Average consumption for delay start mode increased to
3.0W from the previous 2 years average of 2.1W. The very small sample numbers for the
last 3 surveys (3, 4 and 5 respectively) make it difficult to draw conclusions. These results
are shown in Figure 5 below.
Figure 5 – Power measurements for air conditioners: delay start mode
Percentage of appliances measured at load
100%
90%
80%
70%
2001
2002
2003Jan
2003-04
2004-05
2005-06
n= 0
<7
<8
n= 0
n= 0
n= 5
n= 4
n= 3
60%
50%
40%
30%
20%
10%
0%
<0.05
<1
<2
<3
<4
<5
<6
<9
<10
<20
<50
>50
Power of Appliance in the specified mode - Watts
An important point to note regarding air conditioners is that the most popular type of air
conditioners are spilt systems (many of this type use remote controls and will therefore
have some standby) and almost all are “hard wired”, so in-store measurements were
limited (4 in 2005/06). Lab measurements (e.g. during energy labelling and MEPS tests)
will be necessary to collect data.
Clothes Dryers
This year 13 clothes dryers were surveyed. All units displayed an energy rating label.
Only 4 of the 13 (30%) models measured had an on/off switch allowing active standby to
be measured. Only one model had a delay start function. Measurements were taken in
active standby, off and delay start mode.
In active standby the average power consumption was 2.4W with a maximum of 3.6W
and a low of 1.7W. The average power consumption in off mode was 0.2W with the
maximum reading being 2.0W and the minimum zero. The unit with delay start function
12
Appliance Standby Power Consumption: Store Survey 2005/06
August 2006
recorded consumption of 3.8W in this mode. Table 3 below summarises the results for
clothes dryers.
Table 3 – A summary of clothes dryer results
Appliance:
Mode
Dryer
Number of
Measurements
Delay Start
Active
Passive
Off
Total Number of Units
1
4
NA
13
13
Average
Power (W)
3.8
2.4
0.2
NA
Power
Max
3.8
3.6
2.0
-
Power
Min
3.8
1.7
0
-
The 2005/06 survey found 11 of the 13 (85%) models used zero energy in off mode. Of
the remaining 2 units, one used below 1W and the other consumed 2W in off mode.
Average off mode consumption has remained stable since 2002. This is demonstrated in
Figure 6 and Figure 7 below. This result compared favourably to last years result of 67%
of units measured consuming zero energy when in off mode. This is the third year in a
row only one model consumed greater than 1W.
Figure 6 – Power measurements for clothes dryers: off mode
100%
Percentage of appliances measured at load
90%
80%
2001
2002
2003Jan
2003-04
2004-05
2005-06
70%
60%
n= 7
n= 16
n= 11
n= 38
n= 24
n= 13
50%
40%
30%
20%
10%
0%
<0.05
<1
<2
<3
<4
<5
<6
<7
<8
<9
<10
<20
<50
>50
Power of Appliance in the specified mode - Watts
13
Appliance Standby Power Consumption: Store Survey 2005/06
August 2006
Figure 7 – Average power measurements for clothes dryers: off mode
1.4
Average Consumption (Watts)
1.2
1.2
1.0
0.8
0.6
0.4
0.3
0.4
0.2
0.2
0.2
0.2
2001
2002
2003Jan
2003-04
2004-05
n= 7
n= 16
n= 11
n= 38
n= 24
2005-06
n= 13
Year
Figure 8 shows the distribution of clothes dryers in active standby. Whilst the small
sample size limits comparison of active standby, all models fell within the upper and
lower limits of previous surveys. With so few models incorporating an on/off switch, it
would appear that active standby will have little consequence for consumption in the
clothes dryer segment.
14
Appliance Standby Power Consumption: Store Survey 2005/06
August 2006
Figure 8 – Power measurements for clothes dryers: active standby mode
Percentage of appliances measured at load
100%
n= 0
2001
n= 0
2002
2003Jan n= 1
2003-04 n= 12
2004-05 n= 4
2005-06 n= 4
90%
80%
70%
60%
50%
40%
30%
20%
10%
0%
<0.05
<1
<2
<3
<4
<5
<6
<7
<8
<9
<10
<20
<50
>50
Power of Appliance in the specified mode - Watts
Dishwashers
During the survey 25 dishwashers were measured. Only one machine was displayed
without an energy rating label. The operating controls on the dishwashers varied; with
some having mechanical dials while others had soft touch electronic controls. Fourteen
of the twenty-five models (56%) measured had a delay start function.
These appliances were measured in delay start, active standby and off mode. Power
consumption in delay start ranged from 1.3W to 7.9W with the average being 3.0W. The
consumption range in active standby was quite wide again this year, with the minimum
0.4W and the maximum 7.4W averaging out at 2.7W. In off mode 18 of the models
consumed 0W. The remaining 7 units consumption between 0.2 and 4.3W, resulting in
the overall average consumption in off mode of 0.6W. Table 4, below summarises the in
store results for dishwashers.
Table 4 – A summary of dishwasher results
Appliance:
Mode
Delay Start
Active
Passive
Off
Total Number of Units
Dishwasher
Number of
Measurements
Average
Power (W)
13
24
0
25
25
3.0
2.7
NA
0.6
Power
Max
Power
Min
7.9
7.4
-
1.3
0.4
-
4.3
0.0
15
Appliance Standby Power Consumption: Store Survey 2005/06
August 2006
Figure 9 demonstrates that 80% of dishwashers in the 2005/06 survey consumed less
than 1W maintaining the improvement gained over the last 2 years. Average
consumption increased slightly from 0.4W in 2004/05 to 0.6W in 2005/06. Average
consumption data is presented in Figure 10
Figure 9 – Power measurements for dishwashers: off mode
100%
Percentage of appliances measured at load
90%
80%
2001
2002
2003Jan
2003-04
2004-05
2005-06
70%
60%
n= 0
n= 42
n= 27
n= 49
n= 52
n= 25
50%
40%
30%
20%
10%
0%
<0.05
<1
<2
<3
<4
<5
<6
<7
<8
<9
<10
<20
<50
>50
Power of Appliance in the specified mode - Watts
16
Appliance Standby Power Consumption: Store Survey 2005/06
August 2006
Figure 10 – Average power measurements for dishwashers: off mode
1.2
1.0
Average Consumption (Watts)
1.0
0.8
0.8
0.6
0.6
0.4
0.4
0.4
0.2
0.0
2001
2002
2003Jan
2003-04
2004-05
n= 0
n= 42
n= 27
n= 49
n= 52
2005-06
n= 25
Year
Active standby for dishwashers remained relatively stable again in 2005/06 with average
active standby at 2.7W compared to 2.6W last year. However the number of models
using less than 1W has decreased every year with the majority (70%) now consuming
between 1 and 3 watts. Additionally there has been no reduction in the proportion of
dishwashers consuming more than 5W, which still sits at around 18% of units. These
results are presented in Figure 11 and Figure 12. Almost a quarter of users leave their
dishwashers in active standby mode (EES 2005).
17
Appliance Standby Power Consumption: Store Survey 2005/06
August 2006
Figure 11 – Power measurements for dishwashers: active standby mode
Percentage of appliances measured at load
50%
n= 0
2001
n= 0
2002
2003Jan n= 0
2003-04 n= 34
2004-05 n= 38
2005-06 n= 24
45%
40%
35%
30%
25%
20%
15%
10%
5%
0%
<0.05
<1
<2
<3
<4
<5
<6
<7
<8
<9
<10
<20
<50
>50
Power of Appliance in the specified mode - Watts
Figure 12 – Average power measurements for dishwashers: active standby mode
3.5
3.0
Average Consumption (Watts)
3.0
2.6
2.7
2.5
2.0
1.5
1.0
0.5
-
0.0
0.0
0.0
2001
2002
2003Jan
2003-04
n= 0
n= 0
n= 0
n= 34
2004-05
n= 38
2005-06
n= 24
Year
Average delay start consumption also remained constant at 3.0W compared to 2.9W in
2004/05 and the distribution of results has been similar for the last 3 years. These results
are presented in Figure 13 and Figure 14. The recent intrusive survey (EES 2005) found
20% of consumers use the delay start function on their dishwasher however there is no
18
Appliance Standby Power Consumption: Store Survey 2005/06
August 2006
indication of what length of operation in this mode as this function can vary from a 1 to
23 hour delay.
Figure 13 – Power measurements for dishwashers: delay start mode
Percentage of appliances measured at load
50%
n= 0
2001
2002
n= 0
2003Jan n= 0
2003-04 n= 16
2004-05 n= 13
2005-06 n= 13
45%
40%
35%
30%
25%
20%
15%
10%
5%
0%
<0.05
<1
<2
<3
<4
<5
<6
<7
<8
<9
<10
<20
<50
>50
Power of Appliance in the specified mode - Watts
Figure 14 – Average power measurements for dishwashers: delay start mode
4.0
3.6
Average Consumption (Watts)
3.5
2.9
3.0
3.0
2.5
2.0
1.5
1.0
0.5
0.0
0.0
2001
2004-05
2002
n= 0
n= 0
n= 0
0.0
-
2003Jan
n= 16
2003-04
n= 13
2005-06
n= 13
Year
19
Appliance Standby Power Consumption: Store Survey 2005/06
August 2006
Washing Machines
It was decided for the 2005/06 survey to divide washing machines into two categories:
Top Loading and Front Loading. Historical data was sorted into these two categories to
enable comparisons to be made.
Front Loading Washing Machines
A total of 25 models were measured in 2005/06. The machines varied in their rated
capacity and all machines had power on/off switches. Thirteen of the twenty-five units
surveyed offered delay start mode. All models displayed an Energy Rating label.
Those models with an on/off switch and delay start function were measured in active
standby and delay start mode as well. In active mode the average consumption was 3.5W.
Eight models recorded measurements above 4W in active mode. Again most machines
(68%) consumed below 4W, which is similar to the last survey. In off mode the range of
consumption was 0W to 4.5W with an average consumption of 0.9W. This is the same as
last survey. Delay Start consumption ranged from 0.9W to 8.7W with an average of
4.0W. For a summary of these results see Table 6.
Table 5 – A summary of front loading washing machine results
Appliance:
Mode
Delay Start
Active
Passive
Off
Total Number of Units
Washing machine
Number of
Measurements
13
25
NA
25
25
Average
Power (W)
Power
Max
4.0
3.5
-
8.7
11.8
-
0.9
Power
Min
0.9
0.4
-
4.5
0.0
2005/06 saw the number of units consuming less than 1W in active standby decrease.
There were also two units found to consume more than 10W for the first time. One of
these units included a large visual display screen with detailed options and instructions.
Despite this average active standby has remained stable with no statistical evidence
supporting a trend of increasing consumption across this segment. In Australia around
25% of front loaders are left in active standby mode (EES 2005). Results from the survey
are presented in Figure 15 and Figure 16.
20
Appliance Standby Power Consumption: Store Survey 2005/06
August 2006
Figure 15 – Power measurements for front loading washing machines: active
standby mode
Percentage of appliances measured at load
50%
2001
2002
2003Jan
2003-04
2004-05
2005-06
45%
40%
n= 0
n= 0
n= 15
n= 29
n= 16
n= 25
35%
30%
25%
20%
15%
10%
5%
0%
<0.05
<1
<2
<3
<4
<5
<6
<7
<8
<9
<10
<20
<50
>50
Power of Appliance in the specified mode - Watts
Figure 16 – Average power measurements for front loading washing machines:
active standby mode
4.0
3.5
3.5
3.5
Average Consumption (Watts)
3.1
2.9
3.0
2.5
2.0
1.5
1.0
0.5
-
0.0
0.0
2001
2002
2003Jan
2003-04
n= 0
n= 0
n= 15
n= 29
2004-05
n= 16
2005-06
n= 25
Year
21
Appliance Standby Power Consumption: Store Survey 2005/06
August 2006
Most front loading washing machines have zero consumption in off mode. While the
proportion of machines consuming zero in this mode rose to the highest level ever (64%)
in 2005/06, average off mode consumption rose slightly to 0.9W. Given that this remains
below 1W and has been variable from survey to survey it would seem that off mode
consumption levels are fairly stable. It would also indicate that those models consuming
at the high end of the range (3W-4W) have ample room to improve off mode
consumption. For more details see Figure17 and Figure 18
Figure17 – Power measurements for front loading washing machines: off mode
100%
Percentage of appliances measured at load
90%
80%
2001
2002
2003Jan
2003-04
2004-05
2005-06
70%
60%
n= 10
n= 30
n= 21
n= 34
n= 27
n= 25
50%
40%
30%
20%
10%
0%
<0.05
<1
<2
<3
<4
<5
<6
<7
<8
<9
<10
<20
<50
>50
Power of Appliance in the specified mode - Watts
22
Appliance Standby Power Consumption: Store Survey 2005/06
August 2006
Figure 18 – Average power measurements for front loading washing machines: off
mode
1.0
0.9
0.9
0.9
0.8
0.7
Average Consumption (Watts)
0.8
0.7
0.6
0.5
0.5
0.5
0.4
0.3
0.2
0.1
2001
2002
2003Jan
2003-04
2004-05
n= 10
n= 30
n= 21
n= 34
n= 27
2005-06
n= 25
Year
Delay start mode is used by nearly a quarter of all consumers with this function (EES
2005). The distribution range for front loading machines in this mode has changed little
over the past 3 years, however there was a sharp rise in the number of machine using less
than 3W in the 2005/06 survey. Average consumption in this mode has experienced a
small decline each year however the change is not large enough to be considered a
statistically valid trend. Figure 19 and Figure 20 show the results delay start mode.
23
Appliance Standby Power Consumption: Store Survey 2005/06
August 2006
Figure 19 – Power measurements for front loading washing machines: delay start
mode
Percentage of appliances measured at load
50%
n= 0
2001
2002
n= 0
2003Jan n= 0
2003-04 n= 14
2004-05 n= 7
2005-06 n= 13
45%
40%
35%
30%
25%
20%
15%
10%
5%
0%
<0.05
<1
<2
<3
<4
<5
<6
<7
<8
<9
<10
<20
<50
>50
Power of Appliance in the specified mode - Watts
Figure 20 – Average power measurements for front loading washing machines:
delay start mode
5.0
4.7
4.4
4.5
Average Consumption (Watts)
4.0
4.0
3.5
3.0
2.5
2.0
1.5
1.0
0.5
0.0
0.0
2001
2004-05
2002
n= 0
n= 0
n= 0
0.0
-
2003Jan
n= 14
2003-04
n= 7
2005-06
n= 13
Year
24
Appliance Standby Power Consumption: Store Survey 2005/06
August 2006
Top Loading Washing Machines
A total of 36 top loading washing machines were measured in the 2005/06 survey.
Sixteen units surveyed offered the delay start mode. All models except one, displayed an
Energy Rating label. Thirty-five of the 36 models were measured in off mode. Those
models with an on/off switch and delay start function were measured in active standby
and delay start mode as well.
In active mode the average consumption was 3.2W with most machines (76%)
consuming between 0.8W and 3.8W. In off mode the range of consumption was 0W to
4.9W with an average consumption of 1.2W which is slightly higher than previous years
(2004/05 1.1W and 2003/04 0.7W). While there was no common link between
consumption and electronic controls in this mode, all the highest consuming models did
have electronic rather than manual dials. Delay Start consumption ranged from 0.9W to
5.2W with an average of 3.5W. For a summary of these results see Table 6 below.
Table 6 – A summary of top loading washing machine results
Appliance:
Mode
Delay Start
Active
Passive
Off
Total Number of Units
Washing machine
Number of
Measurements
16
29
NA
35
36
Average
Power (W)
Power
Max
3.5
3.2
-
5.2
5.2
-
1.2
Power
Min
4.9
0.9
0.8
0.0
The distribution range for top loading washing machines in active standby has shifted
slightly in 2005/2006. For the first time no models were found to consume more than
6W and one unit consumed less than 1W in this mode. Once again most machines used
between 3 and 4 watts in this mode. Despite the downward shift in distribution average
consumption remained stable at 3.2W. These results can be viewed in Figure 21 and
Figure 22.
25
Appliance Standby Power Consumption: Store Survey 2005/06
August 2006
Figure 21 – Power measurements for top loading washing machines: active
standby mode
Percentage of appliances measured at load
70%
2001
2002
2003Jan
2003-04
2004-05
2005-06
60%
50%
n= 0
n= 0
n= 13
n= 33
n= 42
n= 29
40%
30%
20%
10%
0%
<0.05
<1
<2
<3
<4
<5
<6
<7
<8
<9
<10
<20
<50
>50
Power of Appliance in the specified mode - Watts
Figure 22 – Average power measurements for top loading washing machines:
active standby mode
4.0
3.4
Average Consumption (Watts)
3.5
3.4
3.0
3.2
3.0
2.5
2.0
1.5
1.0
0.5
-
0.0
0.0
2001
2002
2003Jan
2003-04
2004-05
2005-06
n= 0
n= 0
n= 13
n= 33
n= 42
n= 29
Year
26
Appliance Standby Power Consumption: Store Survey 2005/06
August 2006
As demonstrated in Figure 23 below, the proportion of models recording zero
consumption in off mode has been over 50% for the last 3 years. There has been no
change in the range of consumption in off mode. A comparison of the average power
consumption of top loading washing machines indicates that average off mode
consumption has remained stable over time (see Figure 24).
Figure 23 – Power measurements for top loading washing machines: off mode
Percentage of appliances measured at load
70%
60%
2001
2002
2003Jan
2003-04
2004-05
2005-06
50%
n= 0
n= 0
n= 39
n= 49
n= 55
n= 35
40%
30%
20%
10%
0%
<0.05
<1
<2
<3
<4
<5
<6
<7
<8
<9
<10
<20
<50
>50
Power of Appliance in the specified mode - Watts
27
Appliance Standby Power Consumption: Store Survey 2005/06
August 2006
Figure 24 –Average power measurements for top loading washing machines: off
mode
1.4
1.2
1.1
Average Consumption (Watts)
1.1
1.2
1.0
0.8
0.7
0.6
0.4
0.2
-
0.0
0.0
2001
2002
2003Jan
2003-04
2004-05
n= 0
n= 0
n= 39
n= 49
n= 55
2005-06
n= 35
Year
As seen in Figure 25, the distribution of machines in delay start mode has diminished with
no units consuming more than 6W and several models (19%) now using less than 2W.
The average power measurements for top loading washing machines in delay start mode
has also decreased from 4.2W in 2003/04 to 3.5 W in 2005/06 (see Figure 26). Whilst
average delay start consumption has decreased each year, it can not be statistically
validated as a trend. However combined with the downward shift in the distribution
graph it should be viewed as positive and if these results continue validation should occur
in the near future. Around a quarter of consumers use this mode (EES 2005).
28
Appliance Standby Power Consumption: Store Survey 2005/06
August 2006
Figure 25 – Power measurements for top loading washing machines: delay start
mode
Percentage of appliances measured at load
60%
n= 0
2001
2002
n= 0
2003Jan n= 0
2003-04 n= 22
2004-05 n= 21
2005-06 n= 16
50%
40%
30%
20%
10%
0%
<0.05
<1
<2
<3
<4
<5
<6
<7
<8
<9
<10
<20
<50
>50
Power of Appliance in the specified mode - Watts
Figure 26 – Average power measurements for top loading washing machines:
delay start mode
4.5
4.2
3.9
Average Consumption (Watts)
4.0
3.5
3.5
3.0
2.5
2.0
1.5
1.0
0.5
0.0
0.0
2001
2004-05
2002
n= 0
n= 0
n= 0
0.0
-
2003Jan
n= 22
2003-04
n= 21
2005-06
n= 16
Year
29
Appliance Standby Power Consumption: Store Survey 2005/06
August 2006
Clothes Washer/Dryer
The 2005/06 survey tested 7 clothes washer-dryers. However 6 of the 7 washer-dryers
were from the same manufacturer. All models displayed Energy Rating labels. Four
machines had both manual and electronic controls and the other three models had
manual controls only.
All models had a power on/off switch; five had a delay start function. This was many
more than last year’s survey which recorded only one model with a delay start function.
They were tested in off, active standby and delay start mode.
A summary of these results can be found in Table 4 below.
Table 7 – A summary of clothes washer/dryer results
Appliance:
Mode
Washer/Dryer
Number of
Measurements
Delay Start
Active
Passive
Off
Total Number of Units
Average
Power (W)
5
7
0
7
7
5.5
4.5
NA
2.3
Power
Max
9.6
8.6
Power
Min
2
2
3.9
Cooking Appliances
These products were found to have low
standby energy consumption in previous studies and therefore have minimal impact on
overall energy consumption in the Residential sector; consequently it was decided not to
measure these appliances in the 2005/06 survey.
Cook Tops, Ovens, Stoves & Range hoods.
Heaters – Electric Portable
The 2005/06 survey measured 52 portable electric heaters. It is the third year that these
devices have been included in the survey. A portable electric heater is an appliance that is
plugged in rather than hard wired and therefore can be easily moved. Appliances in this
category included fan or blow heaters, radiant heaters and fan assisted radiant heaters.
Heaters were measured in delay start mode where applicable, passive standby and off
mode. Of the 52 heaters measured 38 had off mode. While over 63% of heaters had
zero consumption in off mode, the maximum recorded was 2.1W. The seven models
with passive standby readings all had remote control function and only 1 model measured
had delay start function. Results for portable electric heaters are summarised in Table 8
below.
30
Appliance Standby Power Consumption: Store Survey 2005/06
August 2006
Table 8 – A summary of heaters – electric portable results
Appliance:
Mode
Heaters – electric portable
Number of
Average
Measurements Power (W)
Delay Start
Active
Passive
Off
Total Number of Units
1
NA
7
48
52
Power
Max
Power
Min
1.4
-
1.4
-
1.4
1.7
0.3
3.0
2.1
0.7
0.0
Figure 27 below shows that the majority (69%) of portable electric heaters have no
consumption in off mode. This is similar to the previous survey results. As shown in
Figure 28 the average off mode consumption has remained stable for the past 3 years.
Figure 27 – Power measurements for portable electric heaters: off mode
100%
Percentage of appliances measured at load
90%
80%
2001
2002
2003Jan
2003-04
2004-05
2005-06
70%
60%
n= 0
n= 0
n= 0
n= 62
n= 61
n= 48
50%
40%
30%
20%
10%
0%
<0.05
<1
<2
<3
<4
<5
<6
<7
<8
<9
<10
<20
<50
>50
Power of Appliance in the specified mode - Watts
31
Appliance Standby Power Consumption: Store Survey 2005/06
August 2006
Figure 28 – Average power measurements for portable electric heaters: off mode
Average Consumption (Watts)
0.8
0.6
0.5
0.4
0.3
0.3
0.2
0.0
0.0
-
2001
2002
n= 0
n= 0
0.0
2003Jan
n= 0
2003-04
2004-05
n= 62
n= 61
2005-06
n= 48
Year
Seven portable electric heaters were found to have remote controls and so were also
measured in passive standby during this survey. The extremely small sample size makes it
difficult to draw any conclusions for these devices in this mode. See Figure 29 below.
Figure 29 – Power measurements for portable electric heaters: passive standby
mode
Percentage of appliances measured at load
80%
2001
2002
2003Jan
2003-04
2004-05
2005-06
70%
60%
n= 0
n= 0
n= 0
n= 0
n= 7
n= 7
50%
40%
30%
20%
10%
0%
<0.05
<1
<2
<3
<4
<5
<6
<7
<8
<9
<10
<20
<50
>50
Power of Appliance in the specified mode - Watts
32
Appliance Standby Power Consumption: Store Survey 2005/06
August 2006
Heaters - Gas
Fourteen gas heaters were surveyed in 2005/06. Electricity is used in gas heaters for the
operation of fans and/or ignition and/or electronic controls. Heaters were measured in
passive standby, delay start and off mode. Four heaters measured this year had a delay
start function. The same manufacturer made all four heaters. Of the ten units measured
in off mode one model had a maximum of 6.3W, while the other 9 models recorded 0W
in off mode. Gas heater results are summarised in Table 9 below.
Table 9 – A summary of heaters – gas results
Appliance:
Mode
Heaters – gas
Number of
Average
Measurements Power (W)
Delay Start
Active
Passive
Off
Total Number of Units
4
NA
4
10
14
Power
Max
8.2
Power
Min
8.2
-
8.1
6.9
0.6
7.0
6.3
6.8
0.0
Four units were measured in delay start and 4 units were measured in passive standby.
Due to the very small sample size no graphs have been included for gas heaters in either
passive standby or delay start modes. Off mode results are comparable with previous
years as can be seen in Figure 30.
Figure 30 – Power measurements for gas heaters: off mode
100%
Percentage of appliances measured at load
90%
80%
2001
2002
2003Jan
2003-04
2004-05
2005-06
70%
60%
n= 0
n= 0
n= 0
n= 25
n= 2
n= 10
50%
40%
30%
20%
10%
0%
<0.05
<1
<2
<3
<4
<5
<6
<7
<8
<9
<10
<20
<50
>50
Power of Appliance in the specified mode - Watts
33
Appliance Standby Power Consumption: Store Survey 2005/06
August 2006
Gas Water Heaters
The 2005/06 survey measured 6 gas hot water units. This was only the second time that
these devices have been included in the survey. Electricity is used in gas water heaters for
ignition and/or electronic controls. Gas heater results are summarised in Table 10.
Table 10 – A summary of gas water heaters
Appliance:
Mode
Gas Water Heaters
Number of
Average
Measurements Power (W)
Delay Start
Active
Passive
Off
Total Number of Units
0
NA
6
0
6
6.9
-
Power
Max
Power
Min
8.4
-
4.5
-
The results for gas water heaters in this survey are very similar to the previous survey
where these devices were measured, i.e. 2003/04, with the average passive standby mode
being 6.9W with a low of 4.5W and a high of 8.4W. The small sample size makes it
difficult to draw conclusions. Results are shown in Figure 31
Figure 31 – Power measurements for gas water heaters: off mode
50%
Percentage of appliances measured at load
45%
2001
2002
2003Jan
2003-04
2004-05
2005-06
40%
35%
30%
n= 0
n= 0
n= 0
n= 4
n= 0
n= 6
25%
20%
15%
10%
5%
0%
<0.05
<1
<2
<3
<4
<5
<6
<7
<8
<9
<10
<20
<50
>50
Power of Appliance in the specified mode - Watts
34
Appliance Standby Power Consumption: Store Survey 2005/06
August 2006
Small Appliances
Breadmakers
In the 2005/06 store survey, 13 breadmakers where measured. When switched on
breadmakers are in active standby as a display is lit up and the machine is awaiting
instructions from the user. As in previous surveys no units were found to have a power
on/off button and as such the units were measured in active standby mode only. Results
were similar to last year’s survey with the average active standby reading of 1.8W with a
low of 1.1 W and a high of 2.5W. Table 11 below summarises the results for
breadmakers.
Table 11 – A summary of breadmaker results
Appliance:
Mode
In Use
Active
Passive
Off
Total Number of Units
Breadmaker
Number of
Measurements
Average
Power (W)
0
13
0
0
13
NA
1.8
NA
NA
Power
Max
Power
Min
-
2.5
-
1.1
-
It has been noticed that there are less breadmakers on display in stores now, with only
one unit being measured in the second half of this survey. As noted in the 2004/05
survey the power consumption for breadmakers in active standby appears to be relatively
stable with most consuming less than 2W. Results are presented in Figure 32 and Figure
33.
35
Appliance Standby Power Consumption: Store Survey 2005/06
August 2006
Figure 32 – Power measurements for breadmakers: active standby mode
Percentage of appliances measured at load
100%
2001
n=
2002
2003Jann=
n=
2003-04 n=
9
2004-05 n=
n= 13
2005-06
90%
80%
70%
60%
50%
40%
30%
20%
10%
0%
<0.05
<1
<2
<3
<4
<5
<6
<7
<8
<9
<10
<20
<50
>50
Power of Appliance in the specified mode - Watts
Figure 33 – Average power measurements for breadmakers: active standby mode
2.0
1.8
1.7
1.8
1.6
Average Consumption (Watts)
1.6
1.5
1.8
1.6
1.4
1.2
1.0
0.8
0.6
0.4
0.2
2001
n= 12
2002
n= 14
2003Jan
2003-04
n= 17
n= 11
2004-05
n= 9
2005-06
n= 13
Year
36
Appliance Standby Power Consumption: Store Survey 2005/06
August 2006
Hand-held Vacuum cleaners
The 2005/06 in-store survey measured 12 hand-held vacuum cleaners. Eleven were
conventional hand held devices, 1 was a new robotic device that operated automatically
without an operator. This single device had a very high active standby measurement of
31.5W. Two conventional units measured 9W & 10.1W and the remaining 75% of
devices had active standby measurements of 6 W or less.
The hand-held vacuum cleaners were measured in active standby, that is, plugged in and
charging, and in passive standby, with the base station plugged in but not charging the
portable unit. When in passive standby the units recorded an average power
consumption of 1.1W with a low of 0.9W and a high of 2.0W (standing losses of the low
voltage power supply – typically a transformer). These results are summarised below in
Table 12.
Table 12 – A summary of hand-held vacuum cleaner results
Appliance:
Mode
In Use
Active
Passive
Off
Total Number of Units
Hand-held Vac
Number of
Measurements
Average
Power (W)
0
12
12
0
12
NA
7.4
1.1
NA
Power
Max
31.5
2.0
-
Power
Min
1.5
0.9
-
Figure 34 below shows the distribution of measurements for hand-held vacuum cleaners
in active standby mode for the past 6 surveys. The graph demonstrates that there is a
fairly large variation in active standby measurements for the majority of hand-held
vacuums from around 1W to 8W and this distribution has been noted over the past 6
years. Future surveys should monitor if more of the “robotic” style of vacs become
popular on the market as the single model measured for this survey shows a very high
power usage in active standby mode.
As shown in Figure 35 average active standby for handheld vacs has increased slightly for
the last 3 years. The average standby is shown as 5.2W due to the removal of the
excessively high consuming robotic model which gives a distorted impression of active
standby. These increases while consistent have no statistical significance and therefore a
trend can not be verified yet. If robotic models are found to become more common then
this will be reviewed.
37
Appliance Standby Power Consumption: Store Survey 2005/06
August 2006
Figure 34 – Power measurements for hand-held vacuum cleaners: active standby
mode
Percentage of appliances measured at load
70%
n= 9
2001
n= 8
2002
2003Jan n= 17
2003-04 n= 6
2004-05 n= 9
2005-06 n= 12
60%
50%
40%
30%
20%
10%
0%
<0.05
<1
<2
<3
<4
<5
<6
<7
<8
<9
<10
<20
<50
>50
Power of Appliance in the specified mode - Watts
Figure 35 – Average power measurements for hand-held vacuum cleaners: active
standby mode
6.0
5.2
4.9
5.0
Average Consumption (Watts)
4.7
4.0
3.6
3.3
3.2
3.0
2.0
1.0
2001
2002
2003Jan
n= 9
n= 8
n= 17
2003-04
n= 5
2004-05
n= 9
2005-06
n= 11
Year
Note: This average chart has had one unit removed from the 2003-04 data and one from the 2005-06 data due to extraordinarily high readings
skewing the average results.
38
Appliance Standby Power Consumption: Store Survey 2005/06
August 2006
In passive standby mode, all hand-held vacuum cleaners consumed 2W or less and this is
consistent over the years as shown below. Average passive standby for each of the years
has also remained stable at around 1W. These results are shown in Figure 36 and Figure
37.
Figure 36 – Power measurements for hand-held vacuum cleaners: passive standby
mode
100%
Percentage of appliances measured at load
90%
2001
2002
2003Jan
2003-04
2004-05
2005-06
80%
70%
n= 9
n= 9
n= 18
n= 6
n= 9
n= 12
60%
50%
40%
30%
20%
10%
0%
<0.05
<1
<2
<3
<4
<5
<6
<7
<8
<9
<10
<20
<50
>50
Power of Appliance in the specified mode - Watts
Figure 37 – Average power measurements for hand-held vacuum cleaners: passive
standby mode
1.4
1.2
1.2
1.3
1.1
1.1
Average Consumption (Watts)
1.0
0.9
1.0
0.8
0.6
0.4
0.2
2001
2002
2003Jan
n= 9
n= 9
n= 18
2003-04
2004-05
2005-06
n= 6
n= 9
n= 12
Year
39
Appliance Standby Power Consumption: Store Survey 2005/06
August 2006
Microwave Ovens
In the 2005/06 52 microwaves were measured. The majority (90%) had electronic
controls and digital clock displays; only 2 units had manual controls, with 3 units having
manual and electronic controls.
The microwaves varied in size and included both combined convection/microwave and
microwave only models. Microwave ovens were measured in passive mode only (even
though strictly models with mechanical controls should be classified as off mode). Table
13 below shows the average power measured for microwaves was 3.0W with a minimum
of 0W and a maximum of 5.5W.
Table 13 – A summary of microwave results
Appliance:
Mode
In Use
Active
Passive
Off
Total Number of Units
Microwave
Number of
Measurements
NA
NA
52
NA
52
Average
Power (W)
Power
Max
Power
Min
-
-
-
3.0
-
5.5
-
0
-
Figure 38 shows the distribution of passive standby power measurements taken over the
past five surveys. Some slight improvement in the number of measurements at the higher
end (more than 5W) is visible. Average power consumption for microwaves in passive
standby mode is shown in Figure 39 below. The last four surveys show that passive
standby for microwaves is reasonably constant. While the average passive standby was
3.5W in 2001, in 2004/2005 and 2005/06 it was 3.0W. The difference is not statistically
significant indicating that passive standby consumption has not improved for this
product.
40
Appliance Standby Power Consumption: Store Survey 2005/06
August 2006
Figure 38 – Power measurements for microwaves: passive standby mode
50%
2001
2002
2003Jan
2003-04
2004-05
2005-06
Percentage of appliances measured at load
45%
40%
35%
n= 56
n= 60
n= 40
n= 75
n= 60
n= 52
30%
25%
20%
15%
10%
5%
0%
<0.05
<1
<2
<3
<4
<5
<6
<7
<8
<9
<10
<20
<50
>50
Power of Appliance in the specified mode - Watts
Figure 39 – Average power measurements for microwaves: passive standby mode
4.0
3.5
3.5
Average Consumption (Watts)
3.1
3.0
2.8
3.0
3.0
2.7
2.5
2.0
1.5
1.0
0.5
2001
n= 56
2002
2003Jan
n= 60
n= 40
2003-04
2004-05
2005-06
n= 75
n= 60
n= 52
Year
41
Appliance Standby Power Consumption: Store Survey 2005/06
August 2006
Espresso Machines
The 2005/06 survey is the fourth year that Espresso machines have been measured. A
combination of manual, portion controlled and fully automatic machines were included
with a total of thirty-two espresso machines tested in 2005/06. The units ranged from
zero consumption to 6.1W averaging around 0.9W. Three units were measured in passive
standby with the average being 3.6W. Two of these units had both and off and a standby
button while the other had no off switch and was in standby ready to begin as soon as it
was plugged in. Table 14 presents these results.
Machines were not measured in active standby due to the cyclic nature of the machines in
this mode. In active standby, all machines consume a great deal of energy. Most
machines use this mode to heat the machine to its optimum operating temperature and
then perform a power on, power down cycle to maintain the temperature. As the length
of the cycle varies for each machine, measuring this mode in stores cannot provide a
reliable indication of the active power consumption of this product. .
Table 14 – A summary of espresso machine results
Appliance:
Mode
In Use
Active
Passive
Off
Total Number of Units
Espresso Machine
Number of
Measurements
0
0
3
31
32
Average
Power (W)
NA
NA
3.6
0.9
Power
Max
4.1
6.1
Power
Min
2.9
0.0
Figure 40 below demonstrates that the overwhelming majority of machines (69%) have
no consumption in off mode. There was a greater range of measurements this year with a
minimum of zero and a maximum of 6.1W. There appears to be no correlation between
features and those models with high consumption in off mode. Average power usage
results were similar to last survey with the average of 0.9W in off mode (see Figure 41).
42
Appliance Standby Power Consumption: Store Survey 2005/06
August 2006
Figure 40 – Power measurements for espresso machines: off mode
100%
Percentage of appliances measured at load
90%
80%
2001
2002
2003Jan
2003-04
2004-05
2005-06
70%
60%
n= 0
n= 0
n= 12
n= 43
n= 31
n= 31
50%
40%
30%
20%
10%
0%
<0.05
<1
<2
<3
<4
<5
<6
<7
<8
<9
<10
<20
<50
>50
Power of Appliance in the specified mode - Watts
Figure 41 – Average power measurements for espresso machines: off mode
2.0
1.8
1.8
Average Consumption (Watts)
1.6
1.4
1.2
1.0
0.8
0.8
0.6
0.9
0.4
0.4
0.2
0.0
0.0
2001
2002
2003Jan
2003-04
2004-05
n= 0
n= 0
n= 12
n= 43
n= 31
2005-06
n= 31
Year
43
Appliance Standby Power Consumption: Store Survey 2005/06
August 2006
Fans
In the 2005/06 survey 22 portable fans were measured. This is the second survey to
include measurement of these devices. Three units had a remote control. One had a
visual display. Fifteen of the fans measured were pedestal models, with a small number of
floor, wall and tower also measured in this survey. The majority of fans were measured at
0W in off mode. Three measured less than 1W in off mode and the two units with
remote controls measured 0.4 W in passive standby mode. Results are presented in
Table 15 and Figure 42.
The fans measured over the last 2 surveys indicate that fans are not a significant
consuming device when it comes to standby power and it is recommended that they are
not included in future surveys.
Table 15 – A summary of portable fans
Appliance:
Mode
Fans
Number of
Average
Measurements
Power (W)
In Use
NA
Active
0
NA
Passive
0.4
2
Off
20
0.1
Total Number of Units
22
Power
Max
NA
0.4
0.9
Power
Min
NA
0.4
0.0
Figure 42 – Power measurements for fans: off mode
100%
Percentage of appliances measured at load
90%
80%
2001
2002
2003Jan
2003-04
2004-05
2005-06
70%
60%
n= 0
n= 0
n= 0
n= 0
n= 14
n= 20
50%
40%
30%
20%
10%
0%
<0.05
<1
<2
<3
<4
<5
<6
<7
<8
<9
<10
<20
<50
>50
Power of Appliance in the specified mode - Watts
44
Appliance Standby Power Consumption: Store Survey 2005/06
August 2006
Juicers
In the 2005/06 survey 30 juicers were measured. This is the second survey to include
measurement of these devices. The majority of units had manual controls. Both
extractor & blender juicer types were measured. Most units (76%) consumed 0W in off
mode. Of the remaining 7 devices, one consumed 4.8W in off mode while the others
used 1.2W or less. See Table 16 and Figure 43 below for a summary of juicers.
Table 16 – A summary of juicers
Appliance:
Mode
Juicers
Number of
Measurements
In Use
Active
Passive
Off
Total Number of Units
0
0
0
30
30
Average
Power (W)
0.3
Power
Max
4.8
Power
Min
0.0
Figure 43 – Power measurements for juicers: off mode
100%
Percentage of appliances measured at load
90%
80%
2001
2002
2003Jan
2003-04
2004-05
2005-06
70%
60%
n= 0
n= 0
n= 0
n= 0
n= 3
n= 30
50%
40%
30%
20%
10%
0%
<0.05
<1
<2
<3
<4
<5
<6
<7
<8
<9
<10
<20
<50
>50
Power of Appliance in the specified mode - Watts
Toasters
In the 2005/06 survey toasters were measured for the first time after the intrusive survey
(EES 2005) discovered that several models were consuming energy in off mode. Twenty
models were included in the survey. Three toasters had electronic displays or led
indicators and these devices consumed power in the off mode. The average power used
45
Appliance Standby Power Consumption: Store Survey 2005/06
August 2006
for these 3 devices in off mode was 1.7W. All other toasters (85%) recorded 0W in off
mode. If electronic displays become more popular on toasters then these devices should
continue to be monitored in future surveys. See Table 17 below for summary of
Toasters.
Table 17– A summary of toasters
Appliance:
Mode
Juicers
Number of
Average
Measurements
Power (W)
0
0
0
20
0.3
20
In Use
Active
Passive
Off
Total Number of Units
Power
Max
2.3
Power
Min
0.0
EPS (External Power Supply)
In the 2005/06 survey 27 EPS’, were measured. These devices are fundamentally
transformers that provided a lower supply voltage to equipment. The type of equipment
found using EPS’ this year include: computer monitors, computer speakers, laptop
computers, home entertainment products, multi function devices, set top boxes and LCD
TVs.
Of the 27 devices measured the average passive standby power was 0.7W with a
maximum of 2.8 and a minimum of 0W. Last year 14 EPS’ were measured with an
average passive standby power measurement of 1.2W. While this is almost half this year’s
average it is too early to draw conclusions for this product. This is only the second time
these devices have been included in the survey so it is not yet possible to determine any
trend in standby power consumption. See Table 18 below for summary of EPS’ and
Figure 44 for the distribution of readings.
Table 18– A summary of EPS (External Power Supply)
Appliance:
Mode
In Use
Active
Passive
Off
Total Number of Units
EPS
Number of
Measurements
Average
Power (W)
0.7
0
0
27
0
Power
Max
2.8
Power
Min
0
27
46
Appliance Standby Power Consumption: Store Survey 2005/06
August 2006
Figure 44 – Power measurements for EPS’: passive standby mode
Percentage of appliances measured at load
70%
2001
2002
2003Jan
2003-04
2004-05
2005-06
60%
50%
n= 0
n= 0
n= 0
n= 0
n= 14
n= 27
40%
30%
20%
10%
0%
<0.05
<1
<2
<3
<4
<5
<6
<7
<8
<9
<10
<20
<50
>50
Power of Appliance in the specified mode - Watts
Computers and Peripherals
Multi Function Device
The 2005/06 survey is the third time these devices have been measured. A multi function
device (MFD) is a piece of equipment that can perform a variety of office tasks. These
may include any combination of the following: telephone, facsimile, printer, photocopier,
email, scanner, and answering machine. These appliances were measured in active mode,
as this is the lowest possible state for most models (especially those with telephone
function). If appropriate the units were also measured in off mode.
Twenty-nine MFD’s were measured in the 2005/06 survey. They consisted of six
different combinations of functions with copier, printer fax the most common. However
function appeared to have no impact on consumption. In active mode the average
consumption was 8.6W with a minimum of 3.2W and a maximum of 19.3W. Table 19
below, shows nineteen units were measured in off mode with an average consumption of
3.1W.
47
Appliance Standby Power Consumption: Store Survey 2005/06
August 2006
Table 19 – A summary of multi function device results
Appliance:
Mode
Multi Function Device
Number of
Average
Measurements
Power (W)
In Use
NA
Active
27
8.6
Passive
5.3
1
Off
19
3.1
Total Number of Units
29
Power
Max
19.3
5.3
9.2
Power
Min
3.2
5.3
0.0
Figure 45 below shows the distribution of measurements for multi function devices over
the last 3 years that they have been included in the store survey. This year’s results are
similar to previous surveys in that a large percentage of units measured (approximately
30%) had active standby readings of between 10W and 20W, although this year no
readings of greater than 20W were recorded. As shown in Figure 46 there was a decline
in the average active standby compared to the previous 2 surveys. This is not a
statistically significant reduction.
Figure 45 – Power measurements for multi-function devices: active standby
Percentage of appliances measured at load
50%
n= 0
2001
n= 0
2002
2003Jan n= 0
2003-04 n= 35
2004-05 n= 47
2005-06 n= 27
45%
40%
35%
30%
25%
20%
15%
10%
5%
0%
<0.05
<1
<2
<3
<4
<5
<6
<7
<8
<9
<10
<20
<50
>50
Power of Appliance in the specified mode - Watts
48
Appliance Standby Power Consumption: Store Survey 2005/06
August 2006
Figure 46 – Average power measurements for multi-function devices: active
standby
12.0
9.8
Average Consumption (Watts)
10.0
9.3
8.6
8.0
6.0
4.0
2.0
-
0.0
0.0
0.0
2001
2002
2003Jan
2003-04
n= 0
n= 0
n= 0
n= 35
2004-05
n= 47
2005-06
n= 27
Year
Both Figure 47 and Figure 48 seen below, indicate that there has been a reduction in the
power used by MFDs in off mode. This represents a statistically significant reduction for
power usage, over the 3 year period that MFDs have been included in the survey,
indicating a downward trend in off mode power.
49
Appliance Standby Power Consumption: Store Survey 2005/06
August 2006
Figure 47 – Power measurements for multi-function devices: off mode
50%
Percentage of appliances measured at load
45%
40%
2001
2002
2003Jan
2003-04
2004-05
2005-06
35%
30%
n= 0
n= 0
n= 0
n= 16
n= 26
n= 19
25%
20%
15%
10%
5%
0%
<0.05
<1
<2
<3
<4
<5
<6
<7
<8
<9
<10
<20
<50
>50
Power of Appliance in the specified mode - Watts
Figure 48 – Average Power measurements for Multi-function Devices in Off Mode
8.0
6.8
Average Consumption (Watts)
7.0
6.0
5.0
4.5
4.0
3.1
3.0
2.0
1.0
0.0
0.0
2001
2002
2003Jan
n= 0
n= 0
0.0
-
n= 0
2003-04
2004-05
n= 16
n= 26
2005-06
n= 19
Year
Computers - Hard Drive/CPU Box
The measurements included the hard drive/CPU box only, with peripherals such as
monitors and printers measured separately. As in the previous surveys, no products
50
Appliance Standby Power Consumption: Store Survey 2005/06
August 2006
measured displayed an ENERGY STAR label. A total of 12 computers were measured in
the 2005/06 store survey. Computers were measured in off mode. Generally active and
passive operating modes are not recorded for computers as they are complex and are
dependent on hardware and software settings. In addition, these modes are adequately
covered by existing standby related programs such as ENERGY STAR. However, two
models were also recorded in passive because they had a hard off switch. This was
located at the rear of the device hence these units are unlikely to be ever turned off in
practice. The two units measured in passive standby recorded an average power usage of
4.2W. The average off mode power consumption was 1.5W with the highest consuming
unit using 3.2W and the lowest using 0.0W. These results are summarised in Table 20
below.
Table 20 – A summary of hard drive/cpu box results
Appliance:
Mode
Computers - Box
Number of
Average
Measurements
Power (W)
In Use
NA
Active
NA
Passive
2
4.2
Off
12
1.5
Total Number of Units
12
Power
Max
4.3
3.2
Power
Min
4.1
0.0
As illustrated in Figure 49, the majority of computers consume between 2W and 3W in
off mode, which is a reduction, compared to the last survey results. For the second year
in a row no models were found to consume more than 4W. Figure 50 shows the average
measurements for computers in off mode. The results also show a decline in power
usage compared to all previous survey years. Average results indicate a positive trend of
declining off mode. This is a statistically significant reduction from the 2003 survey with
average consumption falling from 2.9W to 1.5W. It should be noted that only 12 units
were included in this year’s survey.
51
Appliance Standby Power Consumption: Store Survey 2005/06
August 2006
Figure 49 – Power measurements for computers: off mode
Percentage of appliances measured at load
70%
60%
2001
2002
2003Jan
2003-04
2004-05
2005-06
50%
n= 0
n= 15
n= 20
n= 38
n= 16
n= 12
40%
30%
20%
10%
0%
<0.05
<1
<2
<3
<4
<5
<6
<7
<8
<9
<10
<20
<50
>50
Power of Appliance in the specified mode - Watts
Figure 50 – Average power measurements for computers: off mode
4.0
3.6
3.2
Average Consumption (Watts)
3.5
2.9
3.0
2.5
2.0
2.0
1.5
1.5
1.0
0.5
-
0.0
2001
2002
2003Jan
2003-04
2004-05
n= 0
n= 15
n= 20
n= 38
n= 16
2005-06
n= 12
Year
52
Appliance Standby Power Consumption: Store Survey 2005/06
August 2006
Computers- Portable/Laptop
Eight portable computers were measured in this store survey. As was found last year,
none of these computers displayed an ENERGY STAR label. The units were measured
in off mode only. A minimum power consumption of 0.8W was recorded with an
average consumption of 1.2W. All units were powered using external power supply units
none of which used more than 0.5W. The results are summarised in Table 21 below.
Table 21 – A summary of laptop computer results
Appliance:
Mode
Computers - Laptop
Number of
Average
Measurements
Power (W)
In Use
0
NA
Active
0
NA
Passive
0
NA
Off
8
1.4
8
Total Number of Units
Power
Max
Power
Min
-
-
2.3
0.8
Figure 51 below shows the distribution of off mode consumption for portable computers
from the last four surveys. The average power use shown in Figure 52 has been
reasonably constant over all 4 surveys. There is little difference between the results
especially when taking into account the large difference in sample sizes.
Figure 51 – Power measurements for portable computers: off mode
Percentage of appliances measured at load
60%
50%
2001
2002
2003Jan
2003-04
2004-05
2005-06
40%
n= 0
n= 0
n= 9
n= 21
n= 7
n= 8
30%
20%
10%
0%
<0.05
<1
<2
<3
<4
<5
<6
<7
<8
<9
<10
<20
<50
>50
Power of Appliance in the specified mode - Watts
53
Appliance Standby Power Consumption: Store Survey 2005/06
August 2006
Figure 52 – Average power measurements for portable computers: off mode
6.0
5.5
Average Consumption (Watts)
5.0
4.5
4.0
3.5
3.0
2.5
2.0
1.5
1.4
1.5
1.2
1.4
1.0
0.5
-
0.0
0.0
2001
2002
n= 0
n= 0
2003Jan
n= 9
2003-04
2004-05
n= 21
n= 7
2005-06
n= 8
Year
Computer Monitors
The 2005/06 survey measured forty one computer monitors. They ranged in size from
15 inch to 20 inch screens and included both LCD (78%) and CRT (28%) monitors.
Twenty four percent of monitors were recorded as having an external power supply as
their power source. All were measured in off mode and 39 monitors were measured
while in use. Only one unit measured displayed an ENERGY STAR label. The average
off mode power consumption was 0.9W with a minimum of 0.0W and a maximum of
3.1W. The results for computer monitors are summarised in Table 22 below.
Table 22 – A summary of computer monitor results
Appliance:
Mode
Computers - Monitor
Number of
Average
Measurements
Power (W)
In Use
39
36.4
Active
0
NA
Passive
0
1.9
Off
41
0.9
Total Number of Units
41
Power
Max
60.9
4.7
3.1
Power
Min
14.8
0.8
0.0
The overwhelming majority of monitors consume energy in off mode. As shown in
Figure 53 only 3 monitors in the past three years have had zero off mode consumption.
There has been a downward shift in the distribution of consumption with 66% of
monitors now consuming less than 1W and a small minority consuming more than 2W.
54
Appliance Standby Power Consumption: Store Survey 2005/06
August 2006
Additionally the distribution of measurement values has shrunk from a maximum in 2003
of 6.3W to 3.1W in 2005/06. This is also reflected in the average power consumption for
computer monitors which has been decreasing in recent surveys, as can be seen in Figure
54. For the last 3 surveys where comparable percentages of LCD & CRT monitors have
been surveyed, there has been a steady decline. This represents a statistically significant
reduction in power use for computer monitors while in off mode.
Figure 53 – Power measurements for monitors: off mode
Percentage of appliances measured at load
60%
50%
2001
2002
2003Jan
2003-04
2004-05
2005-06
40%
n= 0
n= 7
n= 14
n= 71
n= 44
n= 41
30%
20%
10%
0%
<0.05
<1
<2
<3
<4
<5
<6
<7
<8
<9
<10
<20
<50
>50
Power of Appliance in the specified mode - Watts
55
Appliance Standby Power Consumption: Store Survey 2005/06
August 2006
Figure 54 – Average power measurements for monitors: off mode
3.0
2.6
Average Consumption (Watts)
2.5
2.0
1.4
1.5
1.2
1.2
1.0
0.9
0.5
-
0.0
2001
2002
2003Jan
2003-04
2004-05
n= 0
n= 7
n= 14
n= 71
n= 44
2005-06
n= 41
Year
Computer – Speakers
Prior to the 2003/04 survey only two computer speakers had been measured. This
resulted largely from the fact that many speakers are powered directly from the computer
box and that most products were packaged rather than displayed. With the emergence of
the computer as a home entertainment unit the sound quality and type of computer
speakers are of more interest to consumers and may include sub woofer and surround
sound packages. This would suggest that this product is likely to have increasing
consumption in the future.
The 2005/06 survey tested 7 units, 6 in off mode and all 7 units in active standby that is
turned on with no sound being produced. Average active standby consumption was
7.5W with a minimum of 2.4W and a maximum of 9.9. The average consumption in off
mode was 4.2W with a minimum of 1.5W and a maximum of 9.7W. The results are
summarised in Table 23 below.
Table 23 – A summary of computer speaker results
Appliance:
Mode
In Use
Active
Passive
Off
Total Number of Units
Computer speakers
Number of
Average
Measurements
Power (W)
0
7
7.5
0
6
7
4.2
Power
Max
Power
Min
9.9
-
2.4
-
9.7
1.5
56
Appliance Standby Power Consumption: Store Survey 2005/06
August 2006
The 2005 intrusive survey found that about 30% of consumers leave their computer
speakers in active standby with 56% using the off button. As seen in Figure 55 and
Figure 56 the distribution range for both modes has increased since speakers were first
measured in 2003/04. However given the small sample sizes it is difficult to draw any
conclusions about these devices.
Figure 55 – Power measurements for computer speakers: active standby mode
Percentage of appliances measured at load
80%
2001
2002
2003Jan
2003-04
2004-05
2005-06
70%
60%
n= 0
n= 0
n= 0
n= 8
n= 3
n= 7
50%
40%
30%
20%
10%
0%
<0.05
<1
<2
<3
<4
<5
<6
<7
<8
<9
<10
<20
<50
>50
Power of Appliance in the specified mode - Watts
Figure 56 – Power measurements for computer speakers: off mode
100%
Percentage of appliances measured at load
90%
80%
2001
2002
2003Jan
2003-04
2004-05
2005-06
70%
60%
n= 0
n= 2
n= 0
n= 13
n= 4
n= 6
50%
40%
30%
20%
10%
0%
<0.05
<1
<2
<3
<4
<5
<6
<7
<8
<9
<10
<20
<50
>50
Power of Appliance in the specified mode - Watts
57
Appliance Standby Power Consumption: Store Survey 2005/06
August 2006
Computers - Home Theatre Box
This product was measured for the first time in 2003/04. A home theatre box is a PC
box that has the ability to receive TV transmission and usually incorporates an am/fm
tuner as well. These units are marketed as home theatre packages and can record TV
directly onto the hard disk.
Only 2 units were measured during the survey. Both were measured in off mode, in use
and passive standby modes. In off mode consumption ranged from 2.9W up to 6.7W
averaging out at 4.8W. While in use the maximum consumption was 111.9W and the
minimum was 61.9W. During passive standby the average power usage was 5.4W with a
maximum of 6.7W and a minimum of 4W. The extremely small sample size makes it
impossible to draw any conclusions for these devices.
Table 24 – A summary of home theatre box results
Appliance:
Mode
Computers - Home Theatre Box
Number of
Average
Measurements
Power (W)
In Use
2
86.9
Active
NA
Passive
2
5.4
Off
2
4.8
2
Total Number of Units
Power
Max
111.9
6.7
6.7
Power
Min
61.9
4.0
2.9
Printers – Inkjet
A total of 21 inkjet printers were tested, of which five displayed an ENERGY STAR
label. The units were differentiated by the quality of print they were able to produce and
the speed at which they could print. These results also incorporate small photo type
printers that use inkjet technology.
During the survey inkjet printers were measured in passive standby mode and off mode.
One device could not be measured in passive standby mode due to the display
configuration. Seven of the units measured had a standby switch only. The remaining 14
models had a power on/off switch.
When in passive standby mode the average power consumption was 3.8W. The highest
power consumption was 8.5W and the lowest was 1.0W. In off mode the average power
was 0.8W, with a maximum of 3.4W and a minimum of 0.2W. Eleven of the 21 printers
measured were capable of printing photos directly from a camera or memory card. Table
25 summarises these findings.
58
Appliance Standby Power Consumption: Store Survey 2005/06
August 2006
Table 25 – A summary of inkjet printer results
Appliance:
Mode
In Use
Active
Passive
Off
Total Number of Units
Printer - Inkjet
Number of
Average
Measurements
Power (W)
NA
20
21
21
Power
Max
3.8
0.8
Power
Min
-
-
8.5
3.4
1.0
0.2
The power measurements for inkjet printers in passive mode are displayed in Figure 57.
The graph shows last years downwards shift was not maintained to the same extent in
2005/06. However, the distribution is still much lower than previous years with only one
model consuming more than 5W. When considering average passive standby power
Figure 58 shows inkjet printer consumption has been declining since 2002 and although
there has been a slight increase in average passive standby figure from last survey, the
statistically significant decline from 2002 has been maintained. This suggests that passive
standby for inkjet printers is currently stable.
Figure 57 – Power measurements for inkjet printers: passive standby mode
Percentage of appliances measured at load
40%
2001
2002
2003Jan
2003-04
2004-05
2005-06
35%
30%
n= 0
n= 20
n= 13
n= 41
n= 21
n= 20
25%
20%
15%
10%
5%
0%
<0.05
<1
<2
<3
<4
<5
<6
<7
<8
<9
<10
<20
<50
>50
Power of Appliance in the specified mode - Watts
59
Appliance Standby Power Consumption: Store Survey 2005/06
August 2006
Figure 58 – Average power measurements for inkjet printers: passive standby
mode
7.0
6.0
Average Consumption (Watts)
6.0
5.5
5.1
5.0
4.0
3.6
3.8
3.0
2.0
1.0
0.0
2001
2002
2003Jan
n= 0
n= 20
n= 13
2003-04
2004-05
n= 41
n= 21
2005-06
n= 20
Year
Figure 59 presents the power consumption results for inkjet printers in off mode. As was
found in the 2004/05 survey, the majority of inkjet printers (81% this year), are using less
than 1W in off mode. This year’s result for average off mode consumption is stable at
0.8W compared to last survey. Average power consumption has been lower or steady for
each survey undertaken over the past 5 years. Figure 60 below illustrates the results.
60
Appliance Standby Power Consumption: Store Survey 2005/06
August 2006
Figure 59 – Power measurements for inkjet printers: off mode
90%
Percentage of appliances measured at load
80%
2001
2002
2003Jan
2003-04
2004-05
2005-06
70%
60%
n= 0
n= 17
n= 11
n= 39
n= 21
n= 21
50%
40%
30%
20%
10%
0%
<0.05
<1
<2
<3
<4
<5
<6
<7
<8
<9
<10
<20
<50
>50
Power of Appliance in the specified mode - Watts
Figure 60 – Average power measurements for inkjet printers: off mode
3.5
3.0
Average Consumption (Watts)
3.0
2.4
2.5
2.0
1.4
1.5
1.0
0.8
0.8
0.5
-
0.0
2001
2002
2003Jan
2003-04
2004-05
n= 0
n= 17
n= 11
n= 39
n= 21
2005-06
n= 21
Year
61
Appliance Standby Power Consumption: Store Survey 2005/06
August 2006
Printers – Lasers
Ten laser printers were measured in passive standby and in off mode. Four models
measured were colour laser printers with the remainder black and white printers. Once
again no models displayed an ENERGY STAR label. The average power consumption in
passive standby mode was 8.2W with a maximum of 22.4W and a minimum of 2.3W. In
off mode laser printers recorded an average of 0W (see Table 26).
Table 26 – A summary of laser printer results
Appliance:
Mode
Printer - Laser
Number of
Average
Measurements
Power (W)
In Use
NA
Active
NA
Passive
10
8.2
Off
10
0.0
10
Total Number of Units
Power
Max
22.4
0.0
Power
Min
2.3
0.0
Figure 61 presents the distribution of passive standby measurements over the past five
surveys. With such a small sample it is difficult to determine if any trends are appearing.
However colour printers appear to consume significantly more power in passive standby
mode than black and white models. This has been noted in previous surveys and was
again observed in 2005/06, with the only 3 readings for passive standby above 6W being
attributed to colour printers. Across all survey’s only one printer has ever been found to
consume power in off mode.
Figure 61 – Power measurements for laser printers: passive standby mode
Percentage of appliances measured at load
60%
2001
2002
2003Jan
2003-04
2004-05
2005-06
50%
n= 0
n= 5
n= 2
n= 12
n= 10
n= 10
40%
30%
20%
10%
0%
<0.05
<1
<2
<3
<4
<5
<6
<7
<8
<9
<10
<20
<50
>50
Power of Appliance in the specified mode - Watts
62
Appliance Standby Power Consumption: Store Survey 2005/06
August 2006
Home Entertainment Equipment
The 2005/06 survey attempted to look at whether home entertainment products powered
down from active standby to passive mode after a predetermined period of time. Given
that the audio reminder that a product is still active is not present for many home
entertainment products there is an assumption that for this product group active standby
may be operational for lengthy periods of time. Measuring power down in the store
setting proved quite difficult, as it required the unit to be easily plugged into a meter for
up to 30 minutes without interfering with staff or customers. As result only 20 products
were tested. Of these only 2 DVD players were found to power down to their passive
state. One did so after 10 minutes, the other after 20 minutes. Products tested included
7 integrated stereos, 7 DVD players, 2 hard disk recorders, 1 portable stereo and 3 home
theatre systems.
Televisions
This report provides an analysis of televisions in off and passive standby modes only. As
a new international test method for televisions is currently being developed, in-use mode,
which, has previously been included, will not be discussed. The store survey did
undertake these measurements as part of the development trial process. These
measurements will again be included in the future once the test method is established.
Additionally as the appropriate test method was not available during the November store
survey a smaller number of televisions have been recorded this year. Power factor was
only recorded for passive standby and crest factor was not included at all due to the
significant amount of data collected in previous surveys and the minimal influence the
results have had on outcomes. A discussion of televisions by television type can be found
below.
CRT Televisions
This category covers standard cathode ray tube (CRT) models for UHF and VHF
reception and excludes those models with LCD, plasma or rear projection screens as well
as those with in built VCRs. While all models had remote control operation it was not
possible to access this for all models. The proportion of CRT models present in the store
visited was significantly smaller than previous surveys. In the past CRT models have
made up the overwhelming majority of televisions on sale in the stores, however this year
only 21% (14) of models were of this type. It is unclear whether this is due to an overall
consumer trend of phasing out CRT’s or whether that it is particular to the area where the
survey was conducted. The store chosen was in the heart of one of Melbourne’s growth
corridors which contains mostly new homes and a younger than average population. This
situation will be monitored in future surveys. The televisions ranged in size from 33cm to
79cm, with the average size on display being 62cm (down from 66cm in 2004/05 survey).
For the purposes of this report televisions were tested in 2 modes: passive standby and
off. Fourteen televisions were measured in passive standby mode with the average power
consumption being 3.4W with a maximum of 9.2W and a minimum of 0.5W. Low
63
Appliance Standby Power Consumption: Store Survey 2005/06
August 2006
average power factor was recorded at 0.29. The average off power consumption recorded
was zero. The highest reading was 0.1W. Table 27 summarises these results.
Table 27 – A summary of CRT television results
Appliance:
Mode
TV - standard
Number of
Average
Measurements Power (W)
In Use
Active
Passive
Off
Total Number of Units
NA
NA
14
14
14
3.4
0.0
Average
Power
Factor
0.29
-
Power
Max
Power
Min
-
9.2
0.1
0.5
0.0
Three televisions from the sample displayed an ENERGY STAR label. Two models
recorded a passive standby reading of less than 1W, which is the minimum criteria
required to display the label. The third model was recorded as 3.3W in passive standby.
Figure 62 shows the proportion of CRT TV’s among the categories less than 5W
continues to grow and has improved greatly since the surveys undertaken in 2001 and
2002. This is the first year all televisions consumed less than 10W in passive mode.
However it must be noted that the sample size is significantly smaller than previous years.
Figure 62 – Power measurements for CRT televisions: passive standby mode
50%
2001
2002
2003Jan
2003-04
2004-05
2005-06
Percentage of appliances measured at load
45%
40%
35%
n= 126
n= 89
n= 58
n= 92
n= 88
n= 14
30%
25%
20%
15%
10%
5%
0%
<0.05
<1
<2
<3
<4
<5
<6
<7
<8
<9
<10
<20
<50
>50
Power of Appliance in the specified mode - Watts
64
Appliance Standby Power Consumption: Store Survey 2005/06
August 2006
Figure 63 illustrates that the downward trend in passive standby mode appears to be
stabilising with only 0.1W difference between the averages for the last two surveys and no
statistical significance in the change since 2003/04.
Figure 63 – Average power measurements for CRT televisions: passive standby
mode
7.0
6.1
5.9
6.0
Average Consumption (Watts)
5.2
5.0
4.2
4.0
3.5
3.4
3.0
2.0
1.0
2001
n= 126
2002
2003Jan
n= 89
n= 58
2003-04
2004-05
2005-06
n= 92
n= 88
n= 14
Year
In off mode all televisions consume less than 1W with zero consumption recorded for the
vast majority. This is illustrated in Figure 64.
65
Appliance Standby Power Consumption: Store Survey 2005/06
August 2006
Figure 64 – Power measurements for CRT televisions: off mode
100%
Percentage of appliances measured at load
90%
80%
2001
2002
2003Jan
2003-04
2004-05
2005-06
70%
60%
n= 126
n= 100
n= 74
n= 107
n= 94
n= 14
50%
40%
30%
20%
10%
0%
<0.05
<1
<2
<3
<4
<5
<6
<7
<8
<9
<10
<20
<50
>50
Power of Appliance in the specified mode - Watts
LCD Televisions
In the 2005/06 survey, 40 LCD (liquid crystal display) televisions were measured. LCD
televisions made up the highest proportion of television types for the first time. It is
unclear whether this is an indication of the future trend in TV’s (see discussion under
CRT Televisions). The units were measured in passive standby and off modes. Two
units were energy star labelled and both met the Phase III 2006 criteria of less than 1W.
The screen size ranged from 43cm to 107 cm with the average being 76cm. This again
represents an increase in average screen size from previous surveys up from 63cm in
2004/05.
In passive standby average consumption was 1.6W reaching a maximum of 18.4W and a
minimum of 0.2W. The high maximum was the result of one model having a built in
digital tuner. This result was not included in the average and the next highest
consumption was only 5W. Average off mode consumption for LCD televisions was
1.6W with a maximum of 18.4W and a minimum of zero. Again the high maximum was
the result of the model with a built in digital tuner. The next highest consumption was
only 1.7W. Only four models recorded zero consumption in off mode. For 66% (27) of
models passive standby was the lowest possible state. It would appear that the off
button is becoming obsolete on LCD televisions, with the proportion of models being
sold with this function declining each year. Table 28 summarises these results.
66
Appliance Standby Power Consumption: Store Survey 2005/06
August 2006
Table 28 – A summary of LCD TV results
Appliance:
Mode
TV - LCD
Number of
Average
Measurements Power (W)
In Use
Active
Passive
Off
Total Number of
Units
NA
NA
39
14
41
Average
Power
Factor
Power
Max
Power
Min
-
-
-
1.6
0.5
0.14
18.4
18.4
-
0.2
0.0
Note: One LCD television was measured with a passive and off mode consumption of 18.4W. This has been removed from the average as
the high reading is likely to be caused by the built in digital tuner and will distort the average. The next highest results were 5W in passive
mode and 1.7W in off mode.
Once again more than one third (36%) of LCD televisions recorded consumption less
than 1W in passive standby mode, with 88% of models using less than 3W. Average
consumption was maintained with the decrease found in the previous survey being
supported. This reduction from 5.1W in 2003/04 to 1.6W in 2005/06 now has statistical
significance and can be considered a positive trend. Given that the presence of off mode
is declining, the importance of attaining low passive standby is increased. Passive standby
mode results are presented in Figure 65 and Figure 66.
Figure 65 – Power measurements for LCD televisions: passive mode
100%
2001
2002
2003Jan
2003-04
2004-05
2005-06
Percentage of appliances measured at load
90%
80%
70%
n= 0
n= 2
n= 1
n= 36
n= 40
n= 39
60%
50%
40%
30%
20%
10%
0%
<0.05
<1
<2
<3
<4
<5
<6
<7
<8
<9
<10
<20
<50
>50
Power of Appliance in the specified mode - Watts
67
Appliance Standby Power Consumption: Store Survey 2005/06
August 2006
Figure 66 – Average power measurements for LCD televisions: passive mode
6.0
5.1
4.9
Average Consumption (Watts)
5.0
4.0
3.0
1.9
2.0
1.6
1.2
1.0
0.0
2001
2002
n= 0
n= 2
2003Jan
n= 1
2003-04
2004-05
2005-06
n= 36
n= 40
n= 39
Year
Note: One model with a built in digital tuner was removed from the average as the high reading will distort any average trends
Off mode consumption for LCD televisions was recorded at less than 1W for most units
with little change in the distribution pattern from previous years. There average off mode
consumption decreased from 1.0W in 2004/05 to 0.5W in 2005/06, however there is no
statistical significance in the changes to average consumption over the surveys. Off mode
results are presented in Figure 67 and Figure 68 below.
68
Appliance Standby Power Consumption: Store Survey 2005/06
August 2006
Figure 67 – Power measurements for LCD televisions: off mode
100%
Percentage of appliances measured at load
90%
80%
2001
2002
2003Jan
2003-04
2004-05
2005-06
70%
60%
n= 0
n= 2
n= 1
n= 26
n= 22
n= 14
50%
40%
30%
20%
10%
0%
<0.05
<1
<2
<3
<4
<5
<6
<7
<8
<9
<10
<20
<50
>50
Power of Appliance in the specified mode - Watts
Figure 68 – Average power measurements for LCD televisions: off mode
1.2
1.0
Average Consumption (Watts)
1.0
0.8
0.7
0.7
0.6
0.5
0.4
0.2
0.1
0.0
2001
2002
n= 0
n= 2
2003Jan
n= 1
2003-04
2004-05
n= 26
n= 22
2005-06
n= 14
Year
Note: One model with a built in digital tuner was removed from the average as the high reading will distort any average trends
69
Appliance Standby Power Consumption: Store Survey 2005/06
August 2006
Projection Televisions
Projection televisions are made as either a front or rear projection type and may have an
LCD display. Only three models were found in the store survey and all were rear
projectors. The models in the survey ranged in size from 157cm to 182cm. One model
displayed an ENERGY STAR label and was found to comply with the specifications
required (passive consumption was <3W). There were 10 ceiling mounted projector units
present in the store but these could not be tested.
Projection televisions were measured when in passive standby. When in passive standby
the range of consumption in 2005/06 extended from 0.8W to 2.8W to 90.5W producing
an average of 31.4W. Only one unit had an off mode, recording a power consumption of
0.1W. This is consistent with data recorded in previous years where off mode has always
been less than 1W and each year averaged 0.1W.
Table 29 – A summary of projection TV results
Appliance:
Mode
TV - Projection
Number of
Average
Average
Measurements
Power (W) Power Factor
In Use
NA
Active
NA
Passive
3
31.4
0.4
Off
1
0.1
3
Total Number of Units
Power
Max
90.5
0.1
Power
Min
0.8
0.1
Given that only three units were present in the 2005/06 survey very little information of
any significance can be drawn. However Figure 69 and Figure 70 have been included
below to demonstrate that this category of appliance has been stable across all surveys.
The change in average passive standby is due to one product that was 88W higher than
the other models. However, each year a handful of models are recorded at these high
levels and this has only distorted the average due to the small sample size in 2005/06.
70
Appliance Standby Power Consumption: Store Survey 2005/06
August 2006
Figure 69 – Power measurements for projection televisions: passive standby mode
100%
2001
2002
2003Jan
2003-04
2004-05
2005-06
Percentage of appliances measured at load
90%
80%
70%
n= 10
n= 11
n= 12
n= 27
n= 32
n= 3
60%
50%
40%
30%
20%
10%
0%
<0.05
<1
<2
<3
<4
<5
<6
<7
<8
<9
<10
<20
<50
>50
Power of Appliance in the specified mode - Watts
Figure 70 – Average power measurements for projection televisions: passive
standby mode
35.0
31.4
Average Consumption (Watts)
30.0
25.0
20.0
15.0
10.0
5.7
5.8
5.0
3.0
2.0
2.3
2001
2002
2003Jan
n= 11
n= 12
n= 10
2003-04
2004-05
2005-06
n= 27
n= 32
n= 3
Year
Note: The small sample in 2005/06 has distorted the average. All 3 models were within the normal distribution range of previous projection
television samples. See discussion.
71
Appliance Standby Power Consumption: Store Survey 2005/06
August 2006
Plasma Televisions
This year 11 plasma televisions were measured. The plasma televisions in the survey were
measured in passive standby and in off mode. None of the plasma televisions displayed
an ENERGY STAR label.
Passive standby consumption for plasma televisions found a maximum at 3.2W and a
minimum at 0.1W. The average consumption for this mode is 1.4W. One plasma
television did not have passive mode recorded as the remote control could not be located.
Only 2 units had an on/off switch allowing off mode to be measured. The average
consumption for off was 0.6W with the maximum at 1.1W and minimum at 0.1W. Table
30 presents the results for the plasma televisions measured.
Table 30 – A summary of plasma TV results
Appliance:
Mode
In Use
Active
Passive
Off
Total Number of Units
TV - Plasma
Number of
Average
Measurements Power (W)
NA
NA
10
2
11
1.4
0.6
Average Power Power
Power
Max
Min
Factor
0.8
3.2
0.1
1.1
0.1
Figure 71 below shows the distribution of measurements for plasma televisions in passive
standby. The 2005/06 results show an increase in the proportion of models consuming
less than 1W, with 50% of models in this category compared with 15% or less in previous
surveys. Additionally none of the models tested consumed more than 4W. While caution
needs to be taken due to the small sample size, Figure 72 also demonstrates an
improvement in passive standby levels with the average dropping from 2.3W to 1.4W.
This change has statistical significance and would appear to be a positive result.
72
Appliance Standby Power Consumption: Store Survey 2005/06
August 2006
Figure 71 – Power measurements for plasma televisions: passive standby mode
100%
2001
2002
2003Jan
2003-04
2004-05
2005-06
Percentage of appliances measured at load
90%
80%
70%
n= 1
n= 0
n= 12
n= 21
n= 33
n= 10
60%
50%
40%
30%
20%
10%
0%
<0.05
<1
<2
<3
<4
<5
<6
<7
<8
<9
<10
<20
<50
>50
Power of Appliance in the specified mode - Watts
Figure 72 – Average power measurements for plasma televisions: passive standby
mode
3.0
Average Consumption (Watts)
2.4
2.4
2.5
2.3
2.0
1.5
1.4
1.3
1.0
0.5
0.0
2001
2002
2003Jan
n= 1
n= 0
n= 12
2003-04
2004-05
2005-06
n= 21
n= 33
n= 10
Year
Figure 73 shows the distribution of readings for plasma televisions in off, while Figure 74
presents average consumption in off mode. In 2005/06 there were only 2 models found
to have an off switch making any fresh analysis difficult. It is unclear whether, like LCD
73
Appliance Standby Power Consumption: Store Survey 2005/06
August 2006
televisions (see previous section), off mode is being phased out of the design or whether
this absence is the product of a small sample. However, the 2 models tested clearly fit
into the norm with the average being maintained from last year. Average consumption in
this mode has never been greater than 1W with nearly all models consuming less than 2W
in this state.
Figure 73 – Power measurements for plasma televisions: off mode
100%
Percentage of appliances measured at load
90%
80%
2001
2002
2003Jan
2003-04
2004-05
2005-06
70%
60%
n= 2
n= 0
n= 9
n= 20
n= 27
n= 2
50%
40%
30%
20%
10%
0%
<0.05
<1
<2
<3
<4
<5
<6
<7
<8
<9
<10
<20
<50
>50
Power of Appliance in the specified mode - Watts
Figure 74 – Average power measurements for plasma televisions: off mode
0.9
0.8
Average Consumption (Watts)
0.8
0.7
0.7
0.6
0.6
0.6
0.5
0.5
0.4
0.3
0.2
0.1
0.0
2001
2002
n= 2
n= 0
2003Jan
n= 9
2003-04
2004-05
n= 20
n= 27
2005-06
n= 2
Year
74
Appliance Standby Power Consumption: Store Survey 2005/06
August 2006
VCRs
In 2005/06 only 3 VCRs were found in all the stores visited. The anticipated decline of
this product appears to have arrived as it is by DVD recorders. Given this result unless
future surveys find a resurgence of this product, it will no longer be measured and will be
considered obsolete.
DVD Players
Digital Video Disk players are now commonplace in Australia, having been one of the
fastest selling products in the last few years. For the purpose of this study the DVD
player definition has be altered so that it may include a VCR component or provide a
decoder (set top box) function for transmitting images but can not record to DVD disk.
Additionally Portable DVD players are also included in this category. Past results have
been altered to reflect this.
Fifty-eight units were tested and of those, 12 displayed an ENERGY STAR label. Four
of these units did not meet the Phase II criteria of less than 1W; however they were all
less than 1.5W
DVDs were measured in 3 modes: active standby, that is, ready to play a disc, passive
standby, that is, ready to be activated and off (where present), that is, powered down but
not able to be activated by a remote. All 58 units measured in 2005/06 could be tested in
active standby with the average consumption being 8.8W. The range varied from a
minimum of 3.8W to a maximum of 19.2W. Passive standby could be measured on 54
units as remote controls/standby buttons were not always present. The average power
consumption was found to be 2.0W in passive standby with a minimum of 0.1W and a
maximum of 9.1W. Only thirteen DVD players had a power on/off control. All of these
models had less than 1W consumption in off mode. For a summary of these results see
Table 31 below.
Table 31 – A summary of DVD player results
Appliance:
Mode
DVD Player
Number of
Average
Measurements
Power (W)
In Use
NA
Active
58
8.8
Passive
54
2.0
Off
13
0.1
58
Total Number of Units
Power
Max
19.2
9.1
0.9
Power
Min
3.8
0.1
0.0
DVD players have been showing improvements in active standby power consumption in
the short time that they have become available. Figure 75 below shows how power
consumption has continually declined since 2001. In 2005/06 this trend continued with
50% of models now consuming less than 8W and no models consuming more than 20W.
As shown in Figure 76, average active standby has also continued to decrease. In
2005/06 average active standby reached a new low level of 8.8W. While not a statistically
75
Appliance Standby Power Consumption: Store Survey 2005/06
August 2006
significant decrease from 2004/05 it gives a strong indication that the downward trend in
active standby is being maintained if not continuing.
Figure 75 – Power measurements for DVD players: active standby mode
Percentage of appliances measured at load
50%
2001
2002
2003Jan
2003-04
2004-05
2005-06
45%
40%
35%
n= 28
n= 44
n= 45
n= 88
n= 69
n= 58
30%
25%
20%
15%
10%
5%
0%
<0.05
<2
<4
<6
<8
<10
<12
<14
<16
<18
<20
<22
<24
>24
Power of Appliance in the specified mode - Watts
Figure 76 – Average power measurements for DVDs: active standby mode
16.0
15.1
13.0
Average Consumption (Watts)
14.0
11.5
12.0
10.8
10.0
9.2
8.8
8.0
6.0
4.0
2.0
2001
n= 28
2002
n= 44
2003Jan
2003-04
n= 45
n= 88
2004-05
n= 69
2005-06
n= 58
Year
76
Appliance Standby Power Consumption: Store Survey 2005/06
August 2006
Figure 77 shows that the proportion of DVD players consuming less than 1W in passive
standby mode has again increased in 2005/06 rising from 33% to 41%. There was also a
decrease in the number of models registering passive standby greater than 4W, with only
16% of models recording high consumption compared with 28% last year. Figure 78
shows average power consumption in this mode has stabilised since the statistically
significant decrease in 2002 with average passive standby consumption sitting at 2W.
Figure 77 – Power measurements for DVD players: passive standby mode
Percentage of appliances measured at load
60%
2001
2002
2003Jan
2003-04
2004-05
2005-06
50%
n= 24
n= 37
n= 33
n= 78
n= 66
n= 54
40%
30%
20%
10%
0%
<0.05
<1
<2
<3
<4
<5
<6
<7
<8
<9
<10
<20
<50
>50
Power of Appliance in the specified mode - Watts
77
Appliance Standby Power Consumption: Store Survey 2005/06
August 2006
Figure 78 – Average power measurements for DVDs: passive standby mode
7.0
Average Consumption (Watts)
6.0
5.8
5.0
4.0
3.0
2.6
3.0
2.4
2.2
2.0
2.0
1.0
2001
n= 24
2002
2003Jan
n= 37
n= 33
2003-04
2004-05
2005-06
n= 78
n= 66
n= 54
Year
Thirteen units (22%) had an on/off switch. All units measured in off mode in 2005/06
registered consumption less than 1W with the overwhelming majority having zero
consumption. Figure 79 and Figure 80 illustrate these results.
78
Appliance Standby Power Consumption: Store Survey 2005/06
August 2006
Figure 79 – Power measurements for DVD players: off mode
100%
Percentage of appliances measured at load
90%
80%
2001
2002
2003Jan
2003-04
2004-05
2005-06
70%
60%
n= 15
n= 16
n= 12
n= 19
n= 13
n= 13
50%
40%
30%
20%
10%
0%
<0.05
<1
<2
<3
<4
<5
<6
<7
<8
<9
<10
<20
<50
>50
Power of Appliance in the specified mode - Watts
Figure 80 – Average power measurements for DVD players: off mode
0.9
0.8
Average Consumption (Watts)
0.8
0.7
0.6
0.5
0.4
0.3
0.2
0.1
0.1
0.1
0.1
0.1
0.0
2001
2002
2003Jan
2003-04
2004-05
n= 15
n= 16
n= 12
n= 19
n= 13
2005-06
n= 13
Year
79
Appliance Standby Power Consumption: Store Survey 2005/06
August 2006
These results indicate the downward trend continues to be evident for DVD players in
active and passive standby and that off mode has stabilised at very low consumption
levels.
Note: Portable DVD players are now readily available. These machines can be charged allowing a DVD
to be viewed away from the power source. Most stores had these products securely locked in cabinets to
prevent theft, making access for measurement during the store survey unlikely.
DVD Recorders
DVD Recorders allow the user to play DVDs as well as record from television onto a
DVD. Basic functions vary from unit to unit but essentially they are same as a VCR. For
the purpose of this study DVD recorders now do not include models with a hard disk but
may include other functions such as a VCR or a decoder (set top box) for transmitting
images. Past results have been altered to reflect this.
Only twenty DVD recorders were measured in the survey this year as it appears the
increase in popularity of hard disk recorders has seen the number of straight DVD
recorders on display decline. These units were measured in active, passive standby and off
mode. One of the units had an ENERGY STAR label however the recorded result of
2.5W did not meet phase II (1W) criteria. In active standby the average power consumed
was 21.5W with a maximum of 33.9W and a minimum of 13.5W. Average passive
standby was 7.3W with measurements ranging from 1.2W to 23.9W. The results are
summarised in Table 32.
Table 32 – A summary of DVD recorder results
Appliance:
Mode
DVD Recorder
Number of
Average
Measurements
Power (W)
In Use
NA
Active
20
21.5
Passive
20
7.3
Off
0
20
Total Number of Units
Power
Max
33.9
23.9
-
Power
Min
13.5
1.2
-
In active standby the distribution range of DVD recorders has remained relatively stable.
Once again average consumption in this mode decreased slightly, down from 23.0W last
year to 21.5W this year with a further increase in the proportion of models consuming
less than 24W in this mode. However there is no statistical significance in this result and
further measurements will be needed to establish if there is a trend. Figure 81 and Figure
82 present these results.
80
Appliance Standby Power Consumption: Store Survey 2005/06
August 2006
Figure 81 – Power measurements for DVD recorders: active standby mode
Percentage of appliances measured at load
100%
2001
2002
2003Jan
2003-04
2004-05
2005-06
90%
80%
70%
n= 0
n= 0
n= 1
n= 16
n= 43
n= 20
60%
50%
40%
30%
20%
10%
0%
<0.05
<2
<4
<6
<8
<10
<12
<14
<16
<18
<20
<22
<24
>24
Power of Appliance in the specified mode - Watts
Figure 82 – Average power measurements for DVD recorders: active standby
30.0
25.7
25.0
Average Consumption (Watts)
25.0
23.0
21.5
20.0
15.0
10.0
5.0
-
0.0
0.0
2001
2002
2003Jan
2003-04
n= 0
n= 0
n= 1
n= 16
2004-05
n= 43
2005-06
n= 20
Year
Passive standby consumption is distributed over a large range with the worst performers
using 23.9 watts. In 2005/06 the distribution was largely the same as last year with
consumption concentrated between 3W and 8W and 15% of models consuming more
81
Appliance Standby Power Consumption: Store Survey 2005/06
August 2006
than 15W in passive. For the first year average passive standby was static being 7.3W
compared to 7.5W in 2004/05. No statistical significance can be drawn from these
figures. These results are presented in Figure 83 and Figure 84
Figure 83 - Power measurements for DVD recorders: passive standby
100%
2001
2002
2003Jan
2003-04
2004-05
2005-06
Percentage of appliances measured at load
90%
80%
70%
n= 0
n= 0
n= 1
n= 15
n= 43
n= 20
60%
50%
40%
30%
20%
10%
0%
<0.05
<2
<4
<6
<8
<10
<12
<14
<16
<18
<20
<22
<24
>24
Power of Appliance in the specified mode - Watts
Figure 84 - Average power measurements for DVD recorders: passive standby
10.0
9.1
9.0
7.5
8.0
Average Consumption (Watts)
7.3
7.0
6.0
4.3
5.0
4.0
3.0
2.0
1.0
0.0
0.0
2001
2002
n= 0
n= 0
2003Jan
n= 1
2003-04
2004-05
2005-06
n= 15
n= 43
n= 20
Year
82
Appliance Standby Power Consumption: Store Survey 2005/06
August 2006
Hard Disk Recorders
Hard disk recorders (HDR) also known as Personal Video Recorders, Digital Video
Recorders or DVD hard disk recorders enable the user to record video images onto a
hard disk from an external source such as a television, VCR or Video Camera. These
units may include a DVD recorder/player, or a decoder (set top box) function for
transmitting images. The popularity of this product is steadily increasing with this survey
finding more HDR in the stores than DVD recorders.
Twenty-Eight units were measured in the 2005/06 store survey recording an average
active standby of 27.8 watts with consumption ranging from 18.4 watts to 38.8 watts.
Passive standby consumption was spread from 1.6 watts to 24.1 watts, averaging 5.6
watts. In use mode is measured only if the HDR is plugged in with an antenna; only one
unit was found in this state using 2W less than when in active standby. No units had an
off mode. Table 33 details these results.
Table 33 – A summary of hard disk recorder results
Appliance:
Mode
Hard Disk Recorder
Number of
Average
Measurements
Power (W)
In Use
1
20.9
Active
28
27.8
Passive
26
5.6
Off
0
28
Total Number of Units
Power
Max
20.9
38.8
24.1
-
Power
Min
20.9
18.4
1.6
-
There has been little change in the consumption patterns of hard disk recorders over the
three surveys this item has been measured. However in 2005/06 two units were found to
consume less than 20W, the lowest consumption across all surveys. Average
consumption shows a minor decrease but there is no statistical significance to this result.
All results are presented in Figure 85 and Figure 86.
83
Appliance Standby Power Consumption: Store Survey 2005/06
August 2006
Figure 85 – Power measurements for hard disk recorders: active standby mode
Percentage of appliances measured at load
100%
2001
2002
2003Jan
2003-04
2004-05
2005-06
90%
80%
70%
n= 0
n= 0
n= 0
n= 4
n= 20
n= 28
60%
50%
40%
30%
20%
10%
0%
<0.05
<5
<10
<15
<20
<25
<30
<35
<40
<45
<50
<55
<60
>60
Power of Appliance in the specified mode - Watts
Figure 86 – Average power measurements for hard disk recorders: active standby
35.0
29.6
30.0
29.4
Average Consumption (Watts)
27.8
25.0
20.0
15.0
10.0
5.0
-
0.0
0.0
0.0
2001
2002
2003Jan
n= 0
n= 0
n= 0
2003-04
n= 4
2004-05
n= 20
2005-06
n= 28
Year
Hard disk recorders in passive standby mode consume across a large range from 1.6W to
well over 20W. This has been constant across surveys. However, as with active standby
2005/06 found four units recording lower consumption (less than 2W) than in any
84
Appliance Standby Power Consumption: Store Survey 2005/06
August 2006
previous survey. This is reflected in a decrease in average consumption; however there is
no statistical significance to this data. Results are displayed in Figure 87 and Figure 88.
Figure 87 – Power measurements for hard disk recorders: passive standby mode
Percentage of appliances measured at load
70%
2001
2002
2003Jan
2003-04
2004-05
2005-06
60%
50%
n= 0
n= 0
n= 0
n= 4
n= 19
n= 26
40%
30%
20%
10%
0%
<0.05
<1
<2
<3
<4
<5
<6
<7
<8
<9
<10
<20
<50
>50
Power of Appliance in the specified mode - Watts
Figure 88 – Average power measurements for hard disk recorders: passive standby
8.0
7.2
Average Consumption (Watts)
7.0
5.5
6.0
5.6
5.0
4.0
3.0
2.0
1.0
0.0
0.0
2001
2002
2003Jan
n= 0
n= 0
0.0
-
n= 0
2003-04
2004-05
2005-06
n= 4
n= 19
n= 26
Year
85
Appliance Standby Power Consumption: Store Survey 2005/06
August 2006
Integrated Stereos
Integrated stereos are single units that perform more than one function such as CD
player, tuner, tape deck, amplifier etc. Most units had remote control as well as manual
operation. Variants included CD capacity, presence of a tape deck, and digital displays.
The survey measured 37 of units in 2005/06. Seven displayed an ENERGY STAR label.
Of the 7 units, six units complied with Phase II, where passive standby is required to be
less than 1W. The non-compliant unit was recorded at a quite high level of 7.3W. One
unit had an “eco” button which when activated allowed passive standby to be decreased
from 11.2W to 0.6W. Similarly some units had clock display functions which when
turned off reduced passive standby.
Integrated stereos were measured in 3 modes: active standby, that is, ready to play a disc
and passive standby, that is, ready to be activated and off mode. The thirty-seven units
measured in active mode showed a large variation in power consumption with an average
of 16.5W and a maximum of 39.4W and a minimum of 3.5W. In passive mode 34 stereos
could be measured with average power consumption for passive mode of 4.2W with a
maximum of 20.7W and a minimum of 0.2W. Off mode was present on six stereos, with
the consumption range being spread from zero to 11.5W. These results are summarised
in Table 34.
Table 34 – A summary of integrated stereo results
Appliance:
Mode
Stereo - Integrated
Number of
Average
Measurements
Power (W)
In Use
NA
Active
37
16.5
Passive
34
4.2
Off
6
3.6
38
Total Number of Units
Power
Max
39.4
20.7
11.5
Power
Min
3.5
0.2
0
Figure 89 indicates that a high proportion of integrated stereos are still consuming more
than 10W in active standby with little change over the five samples. Although there has
been a drop in average active standby since 2001 from 19.1W to 16.5W in 2005/06 there
has been no statistical significance with these results and this mode should be considered
stable. Average consumption results are shown in Figure 90.
86
Appliance Standby Power Consumption: Store Survey 2005/06
August 2006
Figure 89 – Power measurements for integrated stereos: active standby mode
Percentage of appliances measured at load
60%
2001
2002
2003Jan
2003-04
2004-05
2005-06
50%
n= 7
n= 52
n= 35
n= 60
n= 72
n= 37
40%
30%
20%
10%
0%
<0.05
<5
<10
<15
<20
<25
<30
<35
<40
<45
<50
<55
<60
>60
Power of Appliance in the specified mode - Watts
Figure 90 – Average power measurements for integrated stereos: active standby
mode
25.0
20.1
Average Consumption (Watts)
20.0
19.1
18.0
17.4
16.2
16.5
15.0
10.0
5.0
2001
n= 7
2002
n= 52
2003Jan
2003-04
n= 35
n= 60
2004-05
n= 72
2005-06
n= 37
Year
87
Appliance Standby Power Consumption: Store Survey 2005/06
August 2006
Figure 91 shows that for passive standby, some improvement can be seen in the
distribution of measurements over time. A smaller proportion of units are registering
passive standby of more than 10W and there has been a steady increase over the last five
surveys in the units consuming less than 1W. The 2005/06 survey found 42% of models
are now achieving passive standby readings of less than 1W. Based on average
consumption there was a statistically significant improvement (i.e. decrease) in passive
standby consumption from 2002 (7.8W) to 2003 (4.1W). Since this time consumption has
been stable with average passive standby in 2005/06 recorded at 4.2W. Average passive
standby results can be viewed in Figure 92.
Off mode is now present in such low sample sizes that comparison between years has no
relevance.
Figure 91 – Power measurements for integrated stereos: passive standby mode
Percentage of appliances measured at load
60%
2001
2002
2003Jan
2003-04
2004-05
2005-06
50%
n= 66
n= 51
n= 32
n= 51
n= 65
n= 34
40%
30%
20%
10%
0%
<0.05
<1
<2
<3
<4
<5
<6
<7
<8
<9
<10
<20
<50
>50
Power of Appliance in the specified mode - Watts
88
Appliance Standby Power Consumption: Store Survey 2005/06
August 2006
Figure 92 – Average power measurements for integrated stereos: passive standby
10.0
9.4
9.0
7.8
Average Consumption (Watts)
8.0
7.0
6.0
4.3
5.0
4.6
4.1
4.2
4.0
3.0
2.0
1.0
2001
n= 66
2002
2003Jan
n= 51
n= 32
2003-04
2004-05
2005-06
n= 51
n= 65
n= 34
Year
Portable Stereos
Portable stereos can be operated using mains power or batteries. They are mobile single
units that can perform more than one function such as CD player, tuner, tape deck, etc.
The survey measured 30 of these appliances and none displayed an ENERGY STAR
label. Some units had remote control as well as manual operation. Variants included CD
capacity (multi-disk), presence of a tape deck, and digital displays.
These appliances were measured in active and passive standby and off mode. In active
mode the average power was 6.4W with maximum power measured at 17.9W and
minimum at 2.8W. Average power consumption in passive mode was 2.4W and the
maximum power was 4.8W with a minimum of 0.9W. Eight units had an off mode
resulting in an average consumption of 1.6W and ranging from zero consumption to
2.4W. Table 35 presents these results.
89
Appliance Standby Power Consumption: Store Survey 2005/06
August 2006
Table 35 – A summary of portable stereo results
Appliance:
Mode
Stereo - Portable
Number of
Average
Measurements
Power (W)
In Use
NA
Active
26
6.4
Passive
25
2.4
Off
8
1.6
30
Total Number of Units
Power
Max
17.9
4.8
2.4
Power
Min
2.8
0.9
0.0
Figure 93 shows the distribution of measurements for portable stereos in active standby.
The graph shows that there has been little change in the distribution over the sample with
the majority of models using less than 6 watts. The average active standby measurements
shown in Figure 94 indicate that this mode is stable at present with little change over
occurring over the surveys.
Figure 93 – Power measurements for portable stereos: active standby mode
50%
2001
2002
2003Jan
2003-04
2004-05
2005-06
Percentage of appliances measured at load
45%
40%
n= 2
n= 32
n= 38
n= 34
n= 40
n= 26
35%
30%
25%
20%
15%
10%
5%
0%
<0.05
<1
<2
<3
<4
<5
<6
<7
<8
<9
<10
<20
<50
>50
Power of Appliance in the specified mode - Watts
90
Appliance Standby Power Consumption: Store Survey 2005/06
August 2006
Figure 94 – Average Power measurements for portable stereos: active standby
mode
18.0
16.0
15.5
Average Consumption (Watts)
14.0
12.0
10.0
8.0
6.7
5.2
6.0
5.4
5.4
2003Jan
2003-04
n= 38
n= 34
6.4
4.0
2.0
2001
n= 2
2002
n= 32
2004-05
n= 40
2005-06
n= 26
Year
Figure 95 shows that in 2005/06 there was once again an increase in the proportion of
units registering a passive standby greater than 3W. This year it rose to 28% compared
with 23% in 2004/05. Overall average passive standby shown in Figure 96 indicates that
there has been little change. For the last 4 years it has ranged from 1.8W to the current
2.4W. The graph does indicate average standby may be increase marginally over time but
there is no statistical significance to this data at this stage. Too few models have off mode
to allow a comparison. Overall it appears that portable stereo consumption is relatively
stable for all modes.
91
Appliance Standby Power Consumption: Store Survey 2005/06
August 2006
Figure 95 – Power measurements for portable stereos: passive standby mode
Percentage of appliances measured at load
80%
2001
2002
2003Jan
2003-04
2004-05
2005-06
70%
60%
n= 34
n= 32
n= 38
n= 29
n= 35
n= 25
50%
40%
30%
20%
10%
0%
<0.05
<1
<2
<3
<4
<5
<6
<7
<8
<9
<10
<20
<50
>50
Power of Appliance in the specified mode - Watts
Figure 96 – Average Power measurements for portable stereos: passive standby
mode
3.0
2.8
2.4
Average Consumption (Watts)
2.5
2.0
2.1
2.0
1.9
2002
2003Jan
2003-04
2004-05
2005-06
n= 32
n= 38
n= 29
n= 35
n= 25
1.8
1.5
1.0
0.5
2001
n= 34
Year
92
Appliance Standby Power Consumption: Store Survey 2005/06
August 2006
Separate Component Stereo Equipment
Previous store surveys conducted in 2001 and 2002 collected data on separate stereo
components such as tuners, tape decks, CD players, receivers and amplifiers. The advent
of “Home Theatre Systems” and DVD player technology has rendered separate stereo
components almost obsolete. Limited numbers of appliances were offered for sale the
stores visited in this year’s survey (2 turntables, 2 Audio Amps). Due to the small
numbers of these products and declining popularity they have not been reported on
individually.
Home Theatre – AV Receivers
AV Receivers or surround sound amplifiers3, consist of a number of output channels
suitable for both audio and visual (VCRs and DVDs) equipment. Most of the models
tested had inbuilt tuners while the others were purely amplification units. Most of the
models had remote operation. This category also includes receivers that have built in
DVD players and those with decoders for accessing digital television signals.
Forty-five AV Receivers were measured in active, passive standby and off modes. There
were 4 AV receivers displaying an ENERGY STAR label, and all complied with Phase II
passive standby criteria. When in active standby the average power consumption was
44.2W with a maximum of 87.4W and a minimum of 14.2W. A total of 43 units could be
tested in passive mode with the average power being 1.8W. The highest consumption in
the mode was recorded at 11.7W with the lowest zero. Off mode was present for 11 AV
receivers. The average power consumption was 0.2W with a high of 1.8W and a low of
0.1W. Table 36 provides a summary of the results for AV receivers.
Table 36 – A summary of AV Receiver results
Appliance:
Mode
Home Theatre - AV Receiver
Number of
Average
Measurements
Power (W)
In Use
NA
Active
44
44.2
Passive
43
1.8
Off
11
0.2
45
Total Number of Units
Power
Max
87.4
11.7
1.8
Power
Min
14.2
0.1
0.0
Figure 97 shows that the distribution of measurements taken in active standby has
remained relatively stable. The 2005/06 survey found that most units were consuming
between 35W and 50W in active standby. Average active standby increased for the
second year in a row from 41.2W to 44.2. There is no statistical significance to these
numbers and active standby should be considered stable at this stage. The recent
3
In the 2002 store survey, AV receivers were reported on as “surround sound systems”. As the technology is
new for these products, the market definitions are also changing and establishing themselves. At the time of writing
this report “AV receivers” were considered to be the standard name for this product type.
93
Appliance Standby Power Consumption: Store Survey 2005/06
August 2006
intrusive standby study conducted by EES (2005) showed that 13% of receivers were
found to be left in active standby, indicating that these high levels of consumption are
activated for lengthy periods of time.
Figure 97 – Power measurements for AV receivers: active standby mode
Percentage of appliances measured at load
50%
2001
2002
2003Jan
2003-04
2004-05
2005-06
45%
40%
35%
n= 0
n= 32
n= 38
n= 34
n= 51
n= 44
30%
25%
20%
15%
10%
5%
0%
<0.05
<5
<10
<15
<20
<25
<30
<35
<40
<45
<50
<55
<60
>60
Power of Appliance in the specified mode - Watts
Figure 98 – Average Power measurements for AV receivers: active standby mode
60.0
48.3
50.0
Average Consumption (Watts)
43.9
39.3
40.0
41.2
44.2
30.0
20.0
10.0
0.0
2001
n= 0
2002
n= 26
2003Jan
2003-04
n= 40
n= 71
2004-05
n= 51
2005-06
n= 44
Year
94
Appliance Standby Power Consumption: Store Survey 2005/06
August 2006
Figure 99 shows that the distribution of measurements taken in passive standby has
remained relatively stable in 2005/06. There has been an increase in the number of
appliances consuming less than 1W jumping to 63% this survey from below 50% in
previous studies. Average passive standby measurements indicate that there has been no
overall improvement standby consumption with the average rising for the first to 1.8W.
This indicates that previous data which hinted at a possible trend towards declining
standby can not be verified and that the statistically significant data indicates that passive
standby for AV receivers is stable. These results are demonstrated in Figure 100.
Figure 99 – Power measurements for AV receivers: passive standby mode
Percentage of appliances measured at load
70%
2001
2002
2003Jan
2003-04
2004-05
2005-06
60%
50%
n= 0
n= 22
n= 32
n= 52
n= 48
n= 43
40%
30%
20%
10%
0%
<0.05
<1
<2
<3
<4
<5
<6
<7
<8
<9
<10
<20
<50
>50
Power of Appliance in the specified mode - Watts
95
Appliance Standby Power Consumption: Store Survey 2005/06
August 2006
Figure 100 – Average power measurements for AV receivers: passive standby mode
2.5
2.1
2.0
Average Consumption (Watts)
2.0
1.7
1.8
1.3
1.5
1.0
0.5
0.0
-
2001
2002
2003Jan
n= 0
n= 22
n= 32
2003-04
2004-05
2005-06
n= 52
n= 48
n= 43
Year
The vast majority of AV receivers have no consumption when in off mode as
demonstrated in Figure 101. In 2005/06 all bar one unit consumed less than 1W in this
mode. Average off mode has remained constant at 0.2W for all 5 surveys.
Figure 101 – Power measurements for AV receivers: off mode
100%
Percentage of appliances measured at load
90%
80%
2001
2002
2003Jan
2003-04
2004-05
2005-06
70%
60%
n= 0
n= 19
n= 19
n= 29
n= 13
n= 11
50%
40%
30%
20%
10%
0%
<0.05
<1
<2
<3
<4
<5
<6
<7
<8
<9
<10
<20
<50
>50
Power of Appliance in the specified mode - Watts
96
Appliance Standby Power Consumption: Store Survey 2005/06
August 2006
Home Theatre Systems
Home Theatre Systems generally include various combinations of an AV receiver, a DVD
player, an amplifier, built in digital decoder and six speakers including a subwoofer for
bass sounds. The key defining feature for the purpose of this study is that all components
are powered by one power lead. Home Theatre Systems can be made up of separate
components or include several functions in one housing case. This category does not
include separate components packaged together and sold as a system if each component
has a separate lead. Those items were measured individually and recorded in the
appropriate category. Two systems displayed an ENERGY STAR label and both
complied with the Phase II criteria (<1W).
Home Theatre Systems were measured in active, passive standby and off mode. In total
28 units were measured. In active standby consumption ranged from 6.0W to 51.0W
averaging out at 24.1W. Five units could not be measured in passive standby as the
remote could not be located. The average consumption for passive standby was 2.5W
with a minimum was 0.2W and the maximum was 17.4W. Five home theatre systems had
an off mode. None of the units consumed energy in this mode. Table 37 summarises
these results.
Table 37 – A summary of home theatre system results
Appliance:
Mode
Home Theatre –Systems
Number of
Average
Measurements
Power (W)
In Use
NA
Active
28
24.1
Passive
23
2.5
Off
5
0.0
28
Total Number of Units
Power
Max
51.0
17.4
0.0
Power
Min
6.0
0.2
0.0
In active standby mode the 2005/06 survey found the proportion of units consuming less
than 25W in standby had almost doubled to 60%, compared with around 34% the
previous year. The distribution range has remained largely unchanged as shown in Figure
102. Average active standby also dropped from 31.5 W. to 24.1W. This decrease in
consumption has statistical significance and as shown in Figure 103 continues a decline
that has been occurring since home theatre systems were first measured.
97
Appliance Standby Power Consumption: Store Survey 2005/06
August 2006
Figure 102 – Power measurements for home theatre systems: active standby mode
Percentage of appliances measured at load
50%
2001
2002
2003Jan
2003-04
2004-05
2005-06
45%
40%
35%
n= 0
n= 0
n= 0
n= 33
n= 60
n= 28
30%
25%
20%
15%
10%
5%
0%
<0.05
<5
<10
<15
<20
<25
<30
<35
<40
<45
<50
<55
<60
>60
Power of Appliance in the specified mode - Watts
Figure 103 – Average power measurements for home theatre systems: active
standby mode
40.0
35.9
35.0
Average Consumption (Watts)
31.5
30.0
25.0
24.1
20.0
15.0
10.0
5.0
0.0
0.0
2001
2002
2003Jan
2003-04
n= 0
n= 0
n= 0
n= 33
0.0
2004-05
n= 60
2005-06
n= 28
Year
98
Appliance Standby Power Consumption: Store Survey 2005/06
August 2006
The distribution range of home theatre systems in passive standby has remained the same
for all surveys. As shown in Figure 104 most products consume less than 1W in this
mode. It is of concern that some products are using more than 8W in this mode.
Average consumption in passive standby is stable with less than half a watt difference
across the 3 surveys. This is demonstrated in Figure 105.
Figure 104 – Power measurements for home theatre systems: passive standby
mode
Percentage of appliances measured at load
70%
2001
2002
2003Jan
2003-04
2004-05
2005-06
60%
50%
n= 0
n= 0
n= 0
n= 30
n= 54
n= 23
40%
30%
20%
10%
0%
<0.05
<1
<2
<3
<4
<5
<6
<7
<8
<9
<10
<20
<50
>50
Power of Appliance in the specified mode - Watts
99
Appliance Standby Power Consumption: Store Survey 2005/06
August 2006
Figure 105 – Average power measurements for home theatre systems: passive
standby mode
3.0
2.4
Average Consumption (Watts)
2.5
2.5
2.2
2.0
1.5
1.0
0.5
-
0.0
0.0
2001
2002
2003Jan
n= 0
n= 0
0.0
n= 0
2003-04
2004-05
2005-06
n= 30
n= 54
n= 23
Year
Off mode is only present in a small number of units and over the 3 years only one unit
has had any consumption in this mode. At this stage it would appear that the
consumption patterns of the home theatre systems market are decreasing in active
standby but stable for passive and off mode.
Sub Woofers
Subwoofers are large speakers that produce low-frequency (bass) sounds. There are two
types of subwoofers: passive subwoofers rely entirely on the main amplifier for power
while active subwoofers have their own power source with a separate amplifier. A home
theatre system will generally have five speakers and a subwoofer, although not all home
theatre systems necessarily include subwoofers in the “package”.
The 2005/06 survey found 50 subwoofers that could be measured in stores. They were
measured in active, passive standby and off as appropriate. In active mode 49 models
were measured with average active standby calculated at 11W. The distribution of results
was quite wide with the minimum recorded at 2.1W and the maximum at 24.7W. One
unit could not be measured in active as it had no switch on the unit. Passive standby is
not usually considered as subwoofers generally do not have remote control operation,
however 7 units were found to have passive standby. Three units were controlled by the
AV receiver i.e. when the AV was in standby so were the subwoofers and four units had a
standby and a hard off button. In passive standby the units registered between 2.0W and
10.9W averaging 5.5W. In off mode 45 sub woofers were measured. The average was
2.0W with the vast majority having zero consumption and a total of 83% consuming less
than 1W. The maximum consumption was 13.4W and the minimum was zero. It should
100
Appliance Standby Power Consumption: Store Survey 2005/06
August 2006
be noted that the off switch for one third of sub woofers was at the rear of the appliance
and difficult to access. This may reduce the likelihood of consumers using this mode.
This is backed up by the recent intrusive survey conducted by EES (2005) where it found
56% of consumers left their sub woofer in active standby. Table 38 summarises the
results.
Table 38 – A summary of subwoofer results
Appliance:
Mode
Home Theatre - Subwoofer
Number of
Average
Measurements
Power (W)
In Use
NA
Active
49
11.0
Passive
7
5.5
Off
45
2.0
50
Total Number of Units
Power
Max
24.7
10.9
13.4
Power
Min
2.1
2.0
0.0
The active standby results from the previous survey are similar to the 2005/06 results.
Figure 106 shows and almost identical distribution pattern across the surveys which is
further reinforced by the average active standby results of 10.9W in 2003/04, 10.4W in
2004/05 and 11.0W in 2005/06. Average active standby results are presented in Figure
107.
Figure 106 – Power measurements for sub woofers: active standby mode
Percentage of appliances measured at load
80%
2001
2002
2003Jan
2003-04
2004-05
2005-06
70%
60%
n= 0
n= 0
n= 3
n= 38
n= 46
n= 49
50%
40%
30%
20%
10%
0%
<0.05
<2
<4
<6
<8
<10
<12
<14
<16
<18
<20
<22
<24
>24
Power of Appliance in the specified mode - Watts
101
Appliance Standby Power Consumption: Store Survey 2005/06
August 2006
Figure 107 – Average power measurements for sub woofers: active standby mode
16.0
13.6
Average Consumption (Watts)
14.0
12.0
10.9
10.4
11.0
10.0
8.0
6.0
4.0
2.0
0.0
0.0
2001
2002
2003Jan
2003-04
n= 0
n= 0
n= 3
n= 38
2004-05
n= 46
2005-06
n= 49
Year
Figure 108 and Figure 109 present the results for sub woofers in off mode. The
overwhelming majority of sub woofers in all surveys have no consumption in off mode.
However in 2005/06 there was an increase in the number of units consuming more than
8W in off. Many of these had a light that remained illuminated to indicate they were in
off mode. These high consuming units have brought the average up from less than 1.0W
in previous years to 2.0W in 2005/06. There is no statistical significance in this as it is a
distortion caused by a handful of relatively high consuming products. However it is
worth watching if this design trend continues in the future. Due to the small number of
subwoofers with Passive standby comparisons between years is impractical at this stage.
It can be noted that all subwoofers with passive standby fell within the distribution range
of previous years. The overall consumption pattern for subwoofers would appear to be
stable.
102
Appliance Standby Power Consumption: Store Survey 2005/06
August 2006
Figure 108 – Power measurements for sub woofers: off mode
100%
Percentage of appliances measured at load
90%
80%
n= 0
2001
2002
2003Jan
2003-04
2004-05
2005-06
70%
60%
n= 0
n= 3
n= 31
n= 45
n= 45
50%
40%
30%
20%
10%
0%
<0.05
<2
<4
<6
<8
<10
<12
<14
<16
<18
<20
<22
<24
>24
Power of Appliance in the specified mode - Watts
Figure 109 – Average power measurements for sub woofers: off mode
2.5
2.0
Average Consumption (Watts)
2.0
1.5
1.0
0.7
0.4
0.5
-
0.0
0.0
2001
2002
n= 0
n= 0
0.0
2003Jan
n= 3
2003-04
2004-05
n= 31
n= 45
2005-06
n= 45
Year
103
Appliance Standby Power Consumption: Store Survey 2005/06
August 2006
Set Top Box
In simple terms, a digital set top box converts digital signals from TV stations into a
signal that an analogue television or display screen can broadcast. From 2008 homes with
analogue televisions will require a set top box in order to view free to air broadcasts,
therefore this market is expected to grow rapidly. Set top boxes were measured active,
passive standby and off modes. Previous studies have recorded in-use consumption for
this product, however new definitions now view this state as active standby. As such past
results have been redefined to reflect this and all future measurements will be recorded as
active standby mode. In-use is now recorded for those units that have an antenna
plugged in, while active standby is measured for those without an antenna.
In 2005/06 the survey found 35 different models in the stores. Only 8 units were
measured in in-use mode. Consumption ranged from 14.5W to 22.2W with and average
of 17.8W. The difference in consumption between active and in-use mode was minimal
with 2.0W being the largest difference and most units around 1.0W. The average
consumption when in active standby was 13.5W with a minimum of 6.4W and a
maximum of 20.9W. In passive mode 32 units were measured ranging from 1.9W to
19.4W. The average passive standby consumption was 8.4W. Ten set top boxes had an
off mode. All of these had zero consumption in this mode. Table 39 summarises these
results.
Table 39 – A summary of set top box results
Appliance:
Mode
In Use
Active
Passive
Off
Total Number of Units
Set Top Box
Number of
Measurements
8
35
32
10
35
Average
Power (W)
17.8
13.5
8.4
0.0
Power
Max
22.2
20.9
19.4
0.0
Power
Min
14.5
6.4
1.9
0.0
The distribution range of set top boxes in active standby was reduced in 2005/06 with no
units found to consume more than 22W in active mode. As can be observed in Figure
110, the number of models at the lower end of consumption continued to grow. This
translated into a lower average standby of 13.5W which indicates a statistical significant
decline in consumption when compared with results over the last three surveys. As can
be seen in Figure 111 the reduction in active mode has been constant since the set top
box was included in the store survey. This would suggest that active standby for this
appliance is trending downwards. The intrusive survey (EES 2005) found 47% of units
were left in this mode.
104
Appliance Standby Power Consumption: Store Survey 2005/06
August 2006
Figure 110 – Power measurements for set top boxes: active standby mode
Percentage of appliances measured at load
50%
2001
2002
2003Jan
2003-04
2004-05
2005-06
45%
40%
n= 0
n= 0
n= 4
n= 31
n= 45
n= 35
35%
30%
25%
20%
15%
10%
5%
0%
<0.05
<2
<4
<6
<8
<10
<12
<14
<16
<18
<20
<22
<24
>24
Power of Appliance in the specified mode - Watts
Figure 111 – Average power measurements for set top boxes: active standby mode
25.0
21.5
Average Consumption (Watts)
20.0
16.8
14.2
15.0
13.5
10.0
5.0
0.0
0.0
2001
2002
2003Jan
2003-04
n= 0
n= 0
n= 4
n= 31
2004-05
n= 45
2005-06
n= 35
Year
Figure 112 and Figure 113 presents the passive standby data for set top boxes. The
spread of results are similar for all years. Average passive standby remained stable in
2005/06 recorded at 8.4W compared to 8.6W in 2004/05. In off mode most set top
105
Appliance Standby Power Consumption: Store Survey 2005/06
August 2006
boxes have no consumption. Over all the surveys only 3 set top boxes have been found
to consume in off mode and all used less than 1W.
Figure 112 – Power measurements for set top boxes: passive standby mode
Percentage of appliances measured at load
70%
2001
2002
2003Jan
2003-04
2004-05
2005-06
60%
50%
n= 0
n= 0
n= 4
n= 27
n= 43
n= 32
40%
30%
20%
10%
0%
<0.05
<1
<2
<3
<4
<5
<6
<7
<8
<9
<10
<20
<50
>50
Power of Appliance in the specified mode - Watts
Figure 113 – Average power measurements for set top boxes: passive standby
mode
10.0
8.6
9.0
8.4
7.7
Average Consumption (Watts)
8.0
7.2
7.0
6.0
5.0
4.0
3.0
2.0
1.0
0.0
-
0.0
2001
2002
n= 0
n= 0
2003Jan
n= 4
2003-04
2004-05
2005-06
n= 27
n= 43
n= 32
Year
106
Appliance Standby Power Consumption: Store Survey 2005/06
August 2006
Other Home Theatre Components
A number of other home theatre components were measured however as each category
contained less than five models they have not been reported individually. These included;
wireless speaker components (2), Portable Stereo with built-in television (3), Turntable
with built in Amp (1), Karaoke machine with built in camera (2), Jukebox with hard drive
and CD Player (1), Subwoofer with built-in tuner (1) and Audio Amp with Sub woofer
and speakers (1).
107
Appliance Standby Power Consumption: Store Survey 2005/06
August 2006
References
Energy Efficient Strategies and EnergyConsult. 2001, Quantification of Residential Standby
Power Consumption In Australia. NAEEEC.
Energy Efficient Strategies and EnergyConsult. 2002, Appliance Standby Power Consumption:
Store Survey 2002. NAEEEC
Energy Efficient Strategies and EnergyConsult. 2003, Appliance Standby Power Consumption:
Store Survey 2003. NAEEEC
Energy Efficient Strategies and EnergyConsult. 2004, Appliance Standby Power Consumption:
Store Survey 2003/04. NAEEEC
Energy Efficient Strategies and EnergyConsult. 2005, Appliance Standby Power Consumption:
Store Survey 2004/05. NAEEEC
Energy Efficient Strategies. 2005, 2005 Intrusive Residential Standby Survey Report, EEEC.
108


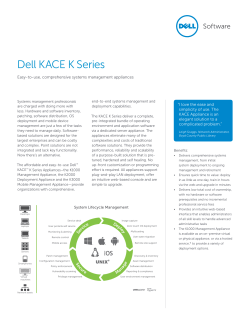
© Copyright 2026