
A Comparing Measures of Core Inflation By Todd E. Clark
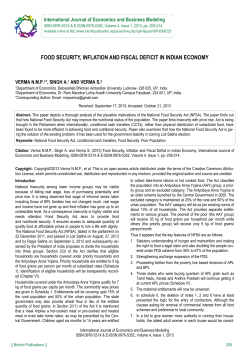
Clark.qxd 6/21/01 1:27 PM Page 5 Comparing Measures of Core Inflation By Todd E. Clark lthough many policymakers and analysts associate “core CPI inflation” with the CPI excluding food and energy, there are other measures of core consumer price inflation. Like the CPI excluding food and energy, these other measures typically attempt to identify the underlying trend in CPI inflation by excluding certain components subject to large relative price changes. The rationale is that unusual changes, such as the 14.2 percent increase in energy prices last year (December to December) or the 18 percent jump in tobacco prices from November to December 1998, are unlikely to be related to the underlying trend in CPI inflation. Some core inflation measures, such as the CPI excluding food and energy, systematically remove from overall inflation a limited set of components thought to be subject to large, temporary price changes often related to supply disturbances. Other measures, such as the trimmed mean CPI proposed by Bryan and Cecchetti (1994), remove the components experiencing large relative price changes in a given month, with the set of excluded components varying from month to month. A Todd E. Clark is an assistant vice president and economist at the Federal Reserve Bank of Kansas City. Edee Sweeney, a research associate at the bank, helped prepare the article. Guhan Venkatu of the Federal Reserve Bank of Cleveland provided some of the data used in the article and considerable help with the details of calculating trimmed inflation measures. The article is on the bank’s web site at www.kc.frb.org. 5 Clark.qxd 6/21/01 1:28 PM 6 Page 6 FEDERAL RESERVE BANK OF KANSAS CITY This article compares five different measures of core CPI inflation. The first section reviews the concepts underlying the idea of core inflation and the measures examined in this article. Three of the core measures have been developed in previous research, while two indicators are developed in this article. The second section evaluates the core inflation measures by three different criteria: accuracy in tracking trend inflation, predictive content for future overall inflation, and complexity. The article concludes that, of the core inflation measures considered, the CPI excluding just energy and the trimmed mean appear superior. I. CORE INFLATION: CONCEPTS AND MEASURES While policymakers and other analysts have long used what amount to indicators of core inflation, most formal attempts to define the concept of core inflation and develop alternative measures have occurred in just the last decade. For example, in 1972, the Economic Report of the President explained that the CPI excluding mortgage interest and food “has a special interest” but never applied any variant of the term “core inflation” (p. 41). In one of the first uses of the term, in 1981 Eckstein defined core inflation as the expected inflation variable in a Phillips curve equation relating overall inflation to expected inflation, the gap between the actual and potential levels of economic activity, and aggregate supply shocks.1 More recent research has developed somewhat different concepts of core inflation, as well as a range of measures. Concepts Today, most policymakers and analysts agree on a fundamental concept: core inflation should be a good indicator of the underlying inflation trend. More specifically, a good measure of core inflation should provide as much information on the underlying trend as is possible from each month’s CPI data (Bryan, Cecchetti, and Wiggins; Cecchetti). Moreover, core inflation should track the component of overall price change that is expected to persist for several years and therefore be useful for near-term and medium-term inflation forecasting (Blinder 1997; Bryan and Cecchetti 1994). Clark.qxd 6/21/01 1:28 PM Page 7 ECONOMIC REVIEW • SECOND QUARTER 2001 7 A second, related concept on which many agree is that core inflation should capture just the component of price change that is common to all items and exclude changes in the relative prices of goods and services (Bryan and Cecchetti 1994; Cecchetti; Wynne 1997, 1999).2 Over time, the prices of individual goods and services generally rise along with the underlying trend of prices in the economy. At any point in time, some item prices will rise at an above-trend rate, while others will increase at a below-trend rate or even fall. Such differences in rates of change reflect shifts in the relative prices of goods, which may be due to changes in relative demand or supply. In the 1970s, for example, OPEC’s cutbacks in the supply of crude oil caused gasoline prices to rise sharply compared with the prices of other goods. Core inflation should abstract from such relative price changes and isolate the common component in price changes that corresponds to the underlying trend in prices. Some analysts have motivated this second concept by linking core inflation to the measure of price change most closely related to monetary policy. By this reasoning, inflation is a monetary phenomenon in the long run, so core inflation should measure the component of price change related to monetary phenomena (Bryan and Cecchetti 1994; Wynne 1997, 1999). Because sustained relative price movements result from shifts in the relative demands for goods or changes in supply, not from monetary policy, core inflation should exclude relative price changes. Defined in this way, core inflation is the measure over which monetary policy has the most influence (Roger; Shiratsuka; Cutler; Hogan, Johnson, and Lafleche). Measures Drawing on these concepts, analysts have proposed a number of different core inflation measures. Some core indicators exclude the same fixed set of components from each month’s overall CPI, even though the changes in those components are not large in every month. Other measures remove from each month’s overall inflation rate the components experiencing large price changes in just that month. From these two basic categories, this article considers five different measures of core inflation.3 Three have been developed in previous research: the CPI excluding food and energy, the trimmed mean, and the median CPI Clark.qxd 6/21/01 1:28 PM Page 8 8 FEDERAL RESERVE BANK OF KANSAS CITY Chart 1 INFLATION IN THE CPI EX FOOD AND ENERGY, TRIMMED MEAN, AND MEDIAN CPI Percent 13.5 11.5 CPI ex food and energy 9.5 7.5 5.5 Median CPI 3.5 Trimmed mean 1.5 1968 1971 1974 1977 1980 1983 1986 1989 1992 1995 1998 Note: Data are 12-month rates of change. Sources: Bureau of Labor Statistics and author’s calculations (Chart 1). Two other measures are examined for the first time in this article: the CPI excluding energy, and the CPI excluding the eight most volatile components of the overall index (Chart 2). For all five core measures, as well as the overall CPI, the rate of inflation equals a particular weighted average of inflation rates of select CPI components.4 The weights correspond to the relative importances of the components in the CPI, normalized so the weights given to the components included in the core inflation measure add up to 1. The relative importance of an item in each month’s CPI equals its share in consumer expenditures, measured in terms of quantities purchased by consumers during the base period of the CPI and prices in the prior month. As in previous studies, such as Bryan and Cecchetti (1994), those measures of core inflation not published by the Bureau of Labor Statistics (BLS) are calculated starting in 1967 using roughly 40 com- Clark.qxd 6/21/01 1:28 PM Page 9 ECONOMIC REVIEW • SECOND QUARTER 2001 9 Chart 2 INFLATION IN THE CPI EX ENERGY AND CPI EX 8 COMPONENTS Percent 13.5 11.5 9.5 7.5 CPI ex energy 5.5 CPI ex 8 components 3.5 1.5 1968 1971 1974 1977 1980 1983 1986 1989 1992 1995 1998 Note: Data are 12-month rates of change. Sources: Bureau of Labor Statistics and author’s calculations ponents of the CPI—36 components from 1967 to 1997 and, reflecting the January 1998 change in CPI item structure, 41 components from 1998 to 2000 (appendix).5 CPI ex food and energy. The most commonly used measure of core inflation is the CPI excluding food and energy, published by the BLS. This measure of core inflation systematically excludes food and energy prices because, historically, they have been highly volatile.6 More specifically, food and energy prices are widely thought to be subject to large changes that often fail to persist and frequently represent relative price changes. In many instances, large movements in food and energy prices arise because of supply disruptions such as drought or OPEC-led cutbacks in production. Clark.qxd 6/21/01 10 1:28 PM Page 10 FEDERAL RESERVE BANK OF KANSAS CITY Trimmed mean. Bryan and Cecchetti (1994) propose tracking trend inflation with the so-called trimmed mean. The trimmed mean removes from overall CPI inflation all large relative price changes in each month, with the set of excluded components changing from month to month. In particular, the trimmed mean excludes the percent changes in price that rank among the smallest or largest (in numerical terms) changes for the month. Both small and large percent changes represent large price movements relative to the average for the month. The rationale for the trimmed mean is partly statistical, drawing on the historical properties of price changes in the United States and widely accepted statistics theory. In a typical month, a histogram of the price changes of the components of the CPI is somewhat wider than a bell curve, which is the shape the histogram would trace out if price changes could be described, in formal statistical terms, by the normal distribution. Statistically, then, the histogram—or the distribution of price changes—displays so-called fat tails. As a result, the average price change generally will be estimated more precisely by a trimmed mean than by a measure like the CPI, which averages across all components. As for its economic rationale, the trimmed mean has the potential to eliminate all relative price changes and thereby isolate the component of aggregate price change expected to persist. Because the price changes removed each month are much smaller or larger than the average for the month, they are likely to reflect relative price changes (Cutler). With the removal of relative price changes that are inherently unrelated to the long-run inflation trend, the resulting core inflation measure should capture the persistent component of overall price change. More specifically, some macroeconomic models imply that if firms normally adjust prices only gradually, then a trimmed mean provides the most precise measure of average price change (Bryan and Cecchetti 1994).7 In these models, removing relative price changes requires trimming. The trimmed mean indicator used in this article removes, on a relative importance-weighted basis, a total of 16 percent of the distribution of price changes.8 In particular, 8 percent of the smallest and 8 percent of the largest percent changes in price are excluded from each month’s overall inflation rate. To take a very simple example, if the overall price index included 100 components, and all had the same relative importance, trimmed mean inflation would be computed by excluding the 8 Clark.qxd 6/21/01 1:28 PM Page 11 ECONOMIC REVIEW • SECOND QUARTER 2001 11 smallest and 8 largest percent changes in price and averaging across the remaining components. The appendix describes the computation of the trimmed mean in more detail. Median CPI. Bryan and Cecchetti (1994) also propose a second formulation of a trimmed mean measure of core inflation: the median CPI. As detailed in the appendix, the median CPI trims all but the midpoint of the distribution of price changes. If, for example, the overall price index included 100 components with equal relative importance, the median CPI would simply be the 50th largest percent change in price.9 The statistical and economic rationale for the median CPI is the same as for the trimmed mean. Whether the median CPI performs better than the trimmed mean will depend on the statistical properties of the distribution of individual item price changes. In particular, the median may be superior to the trimmed mean if the distribution of price changes has very fat tails on a sufficiently routine basis (Roger). CPI ex energy. Although not commonly used as a measure of core inflation, a potentially useful alternative to the CPI ex food and energy is the CPI excluding just energy. Also published by the BLS, this core indicator excludes energy prices for the same reasons the CPI ex food and energy does. But food prices—which include prices of food away from home and prices of food at home—remain in the index, on two grounds. First, the rate of change in the cost of food away from home is very stable. As a result, the food away from home component of the CPI is unlikely to be subject to large relative price changes and may well be persistent enough to have important predictive power for future inflation. Second, the food at home component has become a less important source of volatility in the CPI. The relative importance of food at home—in effect, the weight of food at home in the CPI—has declined sharply, from 17.8 percent in December 1967 to 9.6 percent in December 2000. As a result, a large change in food-at-home prices affects overall CPI inflation much less today than it would have 30 years ago. Moreover, the variability of food-at-home prices has declined over time, even abstracting from the unusual inflation developments of the early 1970s through the early 1980s.10 For example, the standard deviation of annualized monthly inflation rates has fallen from 7.1 percent over 1957-72 to 5.1 percent over 1985-2000. The decrease in food price volatility may be partly due to a sharp fall in the share of retail food Clark.qxd 6/21/01 12 1:28 PM Page 12 FEDERAL RESERVE BANK OF KANSAS CITY costs accounted for by raw farm products, the most volatile component of retail costs.11 The share of farm costs in retail spending fell from approximately 40 percent over 1957-67 to 21 percent in 1999, reflecting forces such as consumers’ increased demand for more convenient and more processed foods (U.S. Department of Agriculture). CPI ex 8 components. Even if the overall food and energy price components of the CPI are viewed as being highly volatile, some specific food and energy items are much less variable than others, while some nonfood and nonenergy prices are highly volatile. Within energy, the volatilities of fuel oil and motor fuel far exceed the volatility of natural gas and electricity (Table 1). Similarly, prices of fruits and vegetables vary much more over time than do prices of dairy products or cereals and bakery products. At the same time, infants’ and toddlers’ apparel, public transportation, and used cars are some of the most volatile components of the CPI.12 Accordingly, this article examines a core inflation measure that systematically excludes the eight most volatile components of the CPI: fuel oil and other household fuel commodities; motor fuel; meats, poultry, fish, and eggs; fruits and vegetables; infants’ and toddlers’ apparel; public transportation; used cars; and other apparel commodities.13 Each of these components is at least three times as variable as the overall CPI (Table 1). Reflecting their high volatilities, these eight components also turn out to be among the nine components most frequently excluded by the trimmed mean measure of core inflation.14 For example, motor fuel ranks second in both volatility and the frequency with which the trimmed mean excludes it—motor fuel is trimmed in more than half of the months of the 1967-97 period. Moreover, the persistence of each of the eight most volatile components is very low, according to rankings based on standard estimates of the speed at which inflation in each component returns to baseline after an unexpected change. Although the number of series to exclude is a matter of judgment, eight seems to strike a good balance. Excluding fewer components does not improve the performance of the indicator. On the other hand, dropping a larger number of components would require even more difficult judgments. For example, the difference in the volatilities of the 10th and 12th most variable series (other food at home and other private transportation commodities) is much smaller than the difference in the Clark.qxd 6/21/01 1:28 PM Page 13 ECONOMIC REVIEW • SECOND QUARTER 2001 13 Table 1 VOLATILITY AND PERSISTENCE OF CPI COMPONENTS, 1967-97 Component Fuel oil and other household fuel commodities Motor fuel Meats, poultry, fish, and eggs Fruits and vegetables Infants’ and toddlers’ apparel Public transportation Used cars Other apparel commodities School books and supplies Other food at home Tobacco and smoking products Other private transportation commodities Cereals and bakery products Gas (piped) and electricity (energy services) Dairy products Women’s and girls’ apparel Other private transportation services Housekeeping services Housekeeping supplies Other utilities and public services New vehicles Personal and educational services Footwear Alcoholic beverages Toilet goods and personal care appliances Shelter Men’s and boys’ apparel Entertainment commodities Entertainment services House furnishings Apparel services Maintenance and repairs Medical care commodities Medical care services Food away from home Personal care services Addendum: Overall CPI Standard deviation (percent) Persistence rank (1=highest) 87.2 34.7 31.1 26.4 22.6 19.0 17.1 13.4 11.0 10.8 10.7 10.2 9.9 9.3 9.2 9.0 8.4 7.1 7.0 6.4 6.3 6.3 5.9 5.7 5.7 5.6 5.2 4.3 4.3 4.2 4.1 3.9 3.8 3.8 3.7 3.6 27 26 35 36 32 33 20 28 31 9 22 18 11 4 21 34 19 25 7 24 14 17 16 30 15 6 29 13 23 10 3 5 1 8 2 12 3.9 Notes: Standard deviations are calculated for annualized monthly inflation rates (percent changes expressed in percentage points). The sample period ends in December 1997 because the CPI item structure changed in January 1998. The results use the longest sample period and largest set of components for which data are available on a consistent basis: 1967-97 data on 36 components. The table sorts the CPI components from highest to lowest volatility. For each component, persistence is estimated as the sum of coefficients from a regression of inflation on lags of inflation. Sources: Bureau of Labor Statistics and author’s calculations Clark.qxd 6/21/01 14 1:28 PM Page 14 FEDERAL RESERVE BANK OF KANSAS CITY volatilities of the components ranked 7th and 9th (used cars and school books and supplies). So excluding 12 series would be nearly as reasonable as excluding 10. In addition, excluding more than the eight most volatile components could remove some, such as other food at home, that are relatively persistent and therefore more likely to provide useful information about the underlying inflation trend. While the CPI ex 8 components and the four other core inflation measures are all founded on some solid principles, no indicator is perfect.15 Bryan, Cecchetti, and Wiggins argue that, by excluding a fixed set of components, measures like the CPI ex food and energy, CPI ex energy, and CPI ex 8 components will sometimes include large price changes that are relative price changes. Consistent with this reasoning, in reviewing newly published data on the CPI ex food and energy, analysts sometimes strip out large movements in components such as tobacco. Moreover, at times, movements in systematically excluded components like food and energy may contain important information about the underlying inflation trend (Bryan, Cecchetti, and Wiggins). On the other hand, because the trimmed mean and median CPI exclude any component experiencing a very large relative price change, they may miss price changes that provide useful information on trend inflation (Cockerell; Cutler). For example, with some goods prices adjusting faster than others, trimming all large price changes may exclude some quick-to-rise components that signal a shift in aggregate demand and, in turn, the underlying inflation trend. Overall, in principle, each core inflation measure has advantages and disadvantages. Thus, whether one indicator is better than another depends on practical considerations such as empirical performance and complexity. II. THE PERFORMANCE OF CORE INFLATION MEASURES The concepts of core inflation described in the previous section suggest some basic criteria for evaluating the historical performance of core inflation measures. Two criteria are commonly used in analyses of core inflation: how well each core indicator tracks an estimate of trend inflation, and how well each one predicts future overall inflation. Another criterion by which core measures are sometimes judged is complexity.16 Clark.qxd 6/21/01 1:28 PM Page 15 ECONOMIC REVIEW • SECOND QUARTER 2001 15 This section examines the five measures described in the last section and finds that, by these criteria, the trimmed mean and the CPI ex energy are superior. Tracking trend inflation A good measure of core inflation should track trend inflation in two respects. First, over a long period of time, the average rate of core inflation should match the average rate of overall inflation. Most policymakers and other analysts prefer a measure of core inflation that neither understates nor overstates the long-term trend rate of price change. Over a period of, say, 30 years, the long-term trend rate of inflation can be accurately measured from the average rate of overall inflation because the period is long enough to eliminate the short-term influence of relative price changes. By this criterion, all five core inflation measures perform well. From 1967 to 2000, each core indicator matches the average rate of overall CPI inflation, although the trimmed mean only does so with some adjustment (Table 2).17 All core indicators except the trimmed mean measured inflation at an average of 5.1 percent, the same as for the overall CPI. Average trimmed mean inflation was slightly lower, at 4.9 percent. The understatement in the trimmed mean, however, can be eliminated by adjusting the trim so that, instead of removing equal portions of small and large price changes, the indicator removes a bigger portion of small price changes. The adjusted measure excludes 9 percent of the smallest and 7 percent of the largest percent changes in price. With the adjustment, average trimmed mean inflation rises to 5.1 percent. In addition to matching the average rate of overall inflation, core inflation should move closely with the trend rate of inflation. When trend inflation rises, for example, core inflation should increase commensurately. Following previous analyses, trend inflation in a given month or quarter is simply estimated by a three-year average of overall inflation, with the average centered on the given month or quarter. Some might prefer that trend inflation be computed with the CPI ex food and energy or estimated with a more sophisticated statistical approach such as that developed by Baxter and King. Yet these alternatives yield results very similar to those based on the three-year centered Clark.qxd 6/21/01 1:28 PM Page 16 16 FEDERAL RESERVE BANK OF KANSAS CITY Table 2 AVERAGE INFLATION RATES AND VOLATILITIES AROUND TREND 1967-2000 Inflation measure CPI CPI ex food & energy Trimmed mean Median CPI CPI ex energy CPI ex 8 components Addendum Adjusted trimmed mean Average rate (percent) 5.1 5.1 4.9 5.1 5.1 5.1 Volatility around trend: monthly (percent) 2.63 2.37 1.92 2.05 2.35 2.10 Volatility around trend: quarterly (percent) 1.55 1.58 1.31 1.43 1.30 1.51 5.1 1.94 1.33 Average rate (percent) 3.2 3.5 3.2 3.5 3.4 3.4 Volatility around trend: monthly (percent) 2.01 1.23 .93 1.18 1.20 .99 Volatility around trend: quarterly (percent) 1.17 .60 .47 .59 .60 .52 3.4 .93 .48 1985-2000 Inflation measure CPI CPI ex food & energy Trimmed mean Median CPI CPI ex energy CPI ex 8 components Addendum Adjusted trimmed mean Notes: The adjusted trimmed mean excludes 9 percent of the smallest and 7 percent of the largest percent changes in price, instead of 8 percent of each. The average rate figures are averages of annualized monthly inflation rates, measured by percent changes, for the indicated period. For each inflation measure, volatility around trend is calculated as the standard deviation of the difference between its annualized, monthly (or quarterly) inflation rate and a monthly (or quarterly) estimate of trend inflation. Trend inflation is estimated as a centered three-year moving average of monthly (or quarterly) overall inflation rates. Because the trend estimate is a centered three-year average and the raw inflation data end in December (or Q4) 2000, the last difference between core and trend inflation entering the volatility calculations is for June (or Q2) 1999. Sources: Bureau of Labor Statistics and author’s calculations average of overall inflation. The accuracy with which core inflation tracks trend inflation is measured, on a monthly and quarterly basis, as the standard deviation of the difference between core and trend inflation.18 For a core indicator that moves closely with trend, differences tend to be small, so the standard deviation is low. By this criterion, the trimmed mean appears superior. Historically, the trimmed mean has tracked movements in trend inflation more closely than the other core indicators. While in some instances measures Clark.qxd 6/21/01 1:28 PM Page 17 ECONOMIC REVIEW • SECOND QUARTER 2001 17 such as the CPI ex energy or CPI ex 8 components perform comparably, the trimmed mean consistently matches or outperforms all the other indicators (Table 2). For example, in monthly inflation rates from 1967 to 2000, the trend volatility of the trimmed mean (with and without adjustment) was about 1.9 percent. By contrast, the trend volatility of the CPI ex food and energy, the most commonly used measure of core inflation, was considerably higher, at about 2.4 percent, while the trend volatility of the CPI ex 8 components was 2.1 percent. From 1985 to 2000, a more recent period that many observers believe was distinguished by stability in the overall economy, the trimmed mean continues to match or outperform all the other indicators. Although generally more volatile than the trimmed mean, the CPI ex energy performs well in certain respects. In quarterly inflation rates from 1967 to 2000, the CPI ex energy matched the accuracy of the trimmed mean, at a standard deviation of 1.3 percent, while the volatilities of most of the other indicators were 1.5 percent. In all other instances, the trend volatility of the CPI ex energy was essentially the same as that of the CPI ex food and energy, the most commonly used measure of core inflation. Overall, in tracking trend inflation, the CPI ex energy matches or outperforms the CPI ex food and energy. Predicting future inflation Many analysts agree that, in addition to accurately tracking trend inflation, a good core measure should help predict future inflation in the overall CPI. Although predictive ability can be judged in many different ways, one common approach is based on the idea that if current overall inflation differs from the underlying trend rate, overall inflation should move toward trend.19 With core inflation corresponding to the underlying inflation trend, when current overall inflation is below core, overall inflation should rise. Thus, the predictive content in alternative measures of core inflation can be gauged from regressions of the change in overall inflation from today to some point in the future on the current gap between core and overall inflation.20 Clark.qxd 6/21/01 18 1:28 PM Page 18 FEDERAL RESERVE BANK OF KANSAS CITY More specifically, the ability of core inflation to predict future overall inflation is quantified by using monthly data to estimate the regression π t + h − π t = α + β (π tcore − π t ) + ε t , (1) where π denotes overall CPI inflation and π core refers to one of the indicators of core inflation, both measured on a year-over-year basis.21 The parameter h takes the values of 12 and 24 (months), so that the current gap between core and overall inflation is predicting how much overall inflation will change over the next one or two years. Many other variables potentially useful for forecasting inflation could be added to the model. But this simple formulation captures the predictive content of core inflation indicators as they are often used. Some policymakers and analysts take movements in core inflation, by themselves, as signals of how inflation is likely to change in the future. Estimates of the regression (1) indicate that the core measures with the most predictive content for future overall inflation are the trimmed mean (with and without adjustment), median CPI, and CPI ex energy. In results for 1967 to 2000, measuring core inflation with the CPI ex energy produces the highest regression R2 (Table 3). Moreover, with a forecasting horizon of one year, the t-statistic for the regression coefficient indicates only the CPI ex energy offers statistically significant explanatory power for future inflation. With a horizon of two years, the trimmed mean and median also have significant predictive power. In estimates for 1985 to 2000, the trimmed mean, median CPI, and CPI ex energy continue to offer superior explanatory power (Table 4). Although all core measures considered have significant predictive power for overall inflation one year ahead, the regression R2s are highest for these three indicators. The results for two-year-ahead inflation prediction follow the same basic pattern. The two-year results differ only in that the performance of CPI ex 8 components improves—the regression R2 for the CPI ex 8 components slightly exceeds that for the CPI ex energy, although, in practical terms, the two indicators predict inflation two years ahead equally well. Clark.qxd 6/21/01 1:28 PM Page 19 ECONOMIC REVIEW • SECOND QUARTER 2001 19 Table 3 PREDICTING FUTURE INFLATION, 1967-2000 Core inflation measure 1-year ahead (h=12) CPI ex food and energy Trimmed mean Median CPI CPI ex energy CPI ex 8 components Addendum Adjusted trimmed mean 2-years ahead (h=24) CPI ex food and energy Trimmed mean Median CPI CPI ex energy CPI ex 8 components Addendum Adjusted trimmed mean Regression R2 Coefficient (std. error) t-statistic .02 .01 .03 .08 .00 -.27 .33 .40 .85 -.18 (.33) (.65) (.48) (.24) (.55) -.82 .52 .85 3.49* -.33 .00 .20 (.69) .29 .02 .10 .14 .17 .04 .48 1.73 1.38 1.90 .83 (.32) (.67) (.51) (.43) (.71) 1.52 2.58* 2.72* 4.43* 1.18 .07 1.56 (.68) 2.28* Notes: The adjusted trimmed mean excludes 9 percent of the smallest and 7 percent of the largest percent changes in price, instead of 8 percent of each. Figures in the table are based on estimates of the regression (1) in the text. Coefficient and t-statistic entries are estimates of the slope coefficient β (with standard errors adjusted for serial correlation) and the associated t-statistic. * denotes t-statistics that indicate the coefficient is significantly different from zero at the 5 percent level. Sources: Bureau of Labor Statistics and author’s calculations Complexity A core inflation indicator that can satisfactorily track trend inflation and predict future overall inflation could be used at two levels. First, economists and other analysts who advise policymakers could incorporate a given measure of core inflation in analyses of underlying inflation trends and forecasts of future inflation. Second, policymakers could use a given indicator of core inflation in communicating with the public on inflation trends and policy decisions. The Federal Reserve’s recent monetary policy reports to Congress have included discussions of consumer prices ex food and energy (Board of Governors of the Federal Reserve System). Although economists can use both simple and complex measures of core inflation in advising policymakers, many observers believe Clark.qxd 6/21/01 1:28 PM Page 20 20 FEDERAL RESERVE BANK OF KANSAS CITY Table 4 PREDICTING FUTURE INFLATION, 1985-2000 Core inflation measure 1-year ahead (h=12) CPI ex food and energy Trimmed mean Median CPI CPI ex energy CPI ex 8 components Addendum Adjusted trimmed mean 2-years ahead (h=24) CPI ex food and energy Trimmed mean Median CPI CPI ex energy CPI ex 8 components Addendum Adjusted trimmed mean Regression R2 Coefficient (std. error) t-statistic .20 .35 .40 .36 .28 .78 1.29 .97 1.17 .89 (.29) (.26) (.19) (.20) (.21) 2.70* 4.89* 5.11* 5.91* 4.25* .35 1.24 (.25) 4.87* .30 .46 .46 .39 .41 1.15 1.80 1.26 1.50 1.30 (.18) (.22) (.14) (.23) (.18) 6.37* 8.02* 8.81* 6.64* 7.41* .44 1.73 (.22) 7.78* Notes: The adjusted trimmed mean excludes 9 percent of the smallest and 7 percent of the largest percent changes in price, instead of 8 percent of each. Figures in the table are based on estimates of the regression (1) in the text. Coefficient and t-statistic entries are estimates of the slope coefficient β (with standard errors adjusted for serial correlation) and the associated t-statistic. * denotes t-statistics that indicate the coefficient is significantly different from zero at the 5 percent level. Sources: Bureau of Labor Statistics and author’s calculations policymakers should rely on simple measures to communicate most effectively with the public. Simple measures of core inflation would likely enhance the transparency of monetary policy. In communicating with the public, the CPI ex food and energy and CPI ex energy may be preferable to the other three indicators of core inflation, which are more complex. The widespread use of the CPI ex food and energy by policymakers and the public alike indicates that measures which systematically exclude food or energy prices are simple and well understood. The CPI ex 8 components is probably more complex, in that the index excludes a relatively long list of components. Although Bryan and Cecchetti (1994) suggest the trimmed mean and median CPI are easy for the public to understand, these indexes seem likely to be the most difficult for policymakers to use in communicating Clark.qxd 6/21/01 1:28 PM Page 21 ECONOMIC REVIEW • SECOND QUARTER 2001 21 effectively with the public.22 The trimmed mean, for example, removes a different set of components each month, with the excluded set comprising a percentage of a distribution. Putting it all together In combination, the evidence on tracking trend inflation, the evidence on predicting future inflation, and consideration of the public transparency of each indicator suggest two measures of core inflation may be viewed as superior: the trimmed mean and the CPI ex energy. Among the indicators considered, the trimmed mean most accurately tracks trend inflation and is one of the most powerful predictors of future inflation. While the relative complexity of the trimmed mean may make it less useful to policymakers in communicating with the public, economists could still use the indicator in advising policymakers. Although the CPI ex energy does not track trend inflation quite as closely as the trimmed mean, it performs well in some important respects. The CPI ex energy measures trend inflation at least as accurately as the CPI ex food and energy, and it represents one of the most powerful predictors of future inflation. Moreover, policymakers could rely on the relatively simple CPI ex energy for communicating effectively with the public. CONCLUSIONS Core inflation measures are generally intended to identify the underlying inflation trend from monthly CPI releases that often include unusual price changes in some components. Using standard criteria for evaluating core inflation measures, this article examines five indicators of core inflation. Three of these indicators have been previously developed: the CPI excluding food and energy, trimmed mean, and median CPI. Two other indicators, the CPI excluding energy and a CPI excluding eight components, are developed in this article. Historical evidence on each indicator’s effectiveness in capturing the underlying inflation trend and considerations of each indicator’s complexity suggest the trimmed mean and CPI excluding energy are superior measures of core inflation. Clark.qxd 6/21/01 22 1:28 PM Page 22 FEDERAL RESERVE BANK OF KANSAS CITY Looking ahead, the most recently available figures on the trimmed mean and the CPI excluding energy appear to be providing similar signals on the underlying inflation trend. Trimmed mean inflation rose from 1.9 percent in 1999 to 2.9 percent in 2000 and 3.3 percent over the first three months of this year. Similarly, inflation in the CPI ex energy increased from 2.0 percent in 1999 to 2.6 percent last year and 3.4 percent in the first three months of 2001. With overall CPI inflation continuing in recent months to exceed both measures of core inflation, historical relationships suggest overall inflation should eventually fall. Clark.qxd 6/21/01 1:28 PM Page 23 ECONOMIC REVIEW • SECOND QUARTER 2001 23 APPENDIX This appendix provides detail on the data and calculations underlying the three measures of core inflation computed as part of this article’s analysis: the trimmed mean, median CPI, and CPI ex 8 components. Data All three measures of core inflation are computed as weighted averages of monthly percent changes in CPI components, with the weights corresponding to relative importances in the CPI. Monthly data on the component price indexes, listed in the appendix table, were obtained from the BLS’s web site. In most cases, the component data used to calculate the core inflation measures are seasonally adjusted over most of the sample. Specifically, for the 1967-97 structure of the CPI, if seasonally adjusted data for a component are available back to 1967, just adjusted data are used. If seasonally adjusted data for a component begin sometime after 1967, unadjusted data are used from 1967 to five years after the adjusted data become available, and adjusted data are used from that point forward. This approach is consistent with the current BLS convention of requiring five years of seasonally adjusted data before a component enters the CPI in adjusted form. For the 19982000 structure of the CPI, seasonally adjusted data are used for all of those components for which adjusted data are available, and unadjusted data are used for the remainder. Monthly data on relative importance weights were obtained from a combination of sources. For 1977 through 2000, relative importances for the month of December are from various issues of the CPI Detailed Report. For 1967 through 1976, Guhan Venkatu of the Federal Reserve Bank of Cleveland provided BLS-published data on December relative importances. Because the BLS only publishes relative importances for December of each year, relative importances for other months are computed on an iterative basis using the December benchmarks and the following relationship implied by the price index formula underlying the CPI: wi , t = Pi , t −1 Pi , t − 2 wi , t −1 , CPIt −1 CPIt − 2 Clark.qxd 6/21/01 1:28 PM Page 24 24 FEDERAL RESERVE BANK OF KANSAS CITY where wi denotes the relative importance for component i, Pi is the price index for component i, and CPI denotes the overall consumer price index. Computing core inflation Trimmed mean. Each month’s trimmed mean inflation rate is calculated using the following steps. 1. Compute the simple monthly percent change (without annualization) in each component price index. 2. Sort the percent changes in price from (numerically) smallest to largest, and sort the relative importance weights for each component along with the price changes. The ordered inflation rates and weights are denoted, respectively, π i and wi, i = 1,2,...,n. 3. Form the cumulative sum of the sorted relative importance weights for each ordered price change i. For example, the cumulative weight associated with π 3, the third-ranked price change, equals w1 + w2 + w3. 4. Exclude those percent changes in price for which the cumulative weight is either less than 8 percent (unusually small percent changes) or greater than 92 percent (unusually large percent changes). 5. For the first (smallest) percent change in price that has a cumulative weight greater than or equal to 8 percent, reset its weight wi to the value of its cumulative weight less 8 percent. 6. For the last (largest) percent change in price with a cumulative weight less than or equal to 92 percent, reset its weight wi to the value of 92 percent less its cumulative weight. 7. Compute the trimmed mean inflation rate as last last 1 / w ∑ i ∑ wiπ i , i = first i = first where the summations start with the first (ordered) price change to be included and end with the last (ordered) price change to be included, and the first term effectively renormalizes the weights of the included components to sum to 1. 8. For the purpose of computing quarterly and 12-month inflation rates, form a trimmed mean index series by setting the initial index value to 100 in January 1967 and then iteratively computing index values for each following month using the prior month’s index value and the trimmed mean inflation rate for the month. Clark.qxd 6/21/01 1:28 PM Page 25 ECONOMIC REVIEW • SECOND QUARTER 2001 25 Median CPI. Each month’s median CPI rate is calculated by first following steps 1-3 above and then simply setting the median rate equal to the first percent change in price with a cumulative weight greater than or equal to 50 percent. Quarterly and 12-month inflation rates are calculated from a monthly index for the median CPI, computed as described in step 8 above. CPI ex 8 components. Monthly inflation rates for this core measure are computed as a weighted sum of the price changes in the included components. The weights equal relative importances normalized to sum to 1 (across the included components). Quarterly and 12-month inflation rates are calculated from a monthly index based on the inflation rate of the CPI ex 8 components. Clark.qxd 6/21/01 1:28 PM Page 26 26 FEDERAL RESERVE BANK OF KANSAS CITY CPI COMPONENTS USED IN CALCULATING CORE INFLATION MEASURES 1967-97 Cereals and bakery products Meats, poultry, fish, and eggs Dairy products Fruits and vegetables Other food at home Food away from home Alcoholic beverages Shelter Fuel oil and other household fuel commodities Gas (piped) and electricity (energy services) Other utilities and public services House furnishings Housekeeping supplies Housekeeping services Men’s and boys’ apparel Women’s and girls’ apparel Infants’ and toddlers’ apparel Footwear Other apparel commodities Apparel services New vehicles Used cars Motor fuel Maintenance and repairs Other private transportation commodities Other private transportation services Public transportation Medical care commodities Medical care services Entertainment commodities Entertainment services Tobacco and smoking products Toilet goods and personal care appliances Personal care services School books and supplies Personal and educational services 1998-2000 Cereals and bakery products Meats, poultry, fish, and eggs Dairy and related products Fresh fruits and vegetables Processed fruits and vegetables Nonalcoholic beverages and beverage materials Other food at home Food away from home Alcoholic beverages Rent of primary residence Lodging away from home Owners’ equivalent rent of primary residence Tenants’ and household insurance Fuel oil and other fuels Gas (piped) and electricity Water and sewer and trash collection services Household furnishings and operations Men’s and boys’ apparel Women’s and girls’ apparel Infants’ and toddlers’ apparel Footwear Jewelry and watches New vehicles Used cars and trucks Car and truck rental Motor fuel Motor vehicle parts and equipment Motor vehicle maintenance and repair Motor vehicle insurance Motor vehicle fees Public transportation Medical care commodities Medical care services Recreation Education Communication Tobacco and smoking products Personal care products Personal care services Miscellaneous personal services Miscellaneous personal goods Clark.qxd 6/21/01 1:28 PM Page 27 ECONOMIC REVIEW • SECOND QUARTER 2001 27 ENDNOTES 1 In Eckstein’s definition, core inflation corresponds to the trend rate of increase in the cost of the factors of production. 2 Other studies discussing this basic concept for core inflation include Roger; Shiratsuka; Cockerell; Hogan, Johnson, and Lafleche; and Cutler. 3 The analysis for this article also included other measures, such as: the volatility-weighted indicators developed in Dow and Hogan, Johnson, and Lafleche; a persistence-weighted measure like Cutler’s; a factor model-based index like that proposed by Bryan and Cecchetti (1993) and Dow, computed as the first principal component; and Cogley’s exponentially smoothed measure. Although refinements might yield improvements, as formulated in this analysis none of the other indicators outperforms those this article finds superior. Moreover, in most cases, the January 1998 change in the CPI item structure makes it difficult to compute indicators that are comparable before and after the change. For a number of the new CPI items, data are available since only 1993 or December 1997. 4 This relationship holds only approximately for inflation in the CPI, CPI ex food and energy, and CPI ex energy. The Bureau of Labor Statistics computes these indexes using a different, although conceptually equivalent, formula. U.S. Department of Labor provides details on the computation of the CPI. 5 The set of 36 components is the same one used in studies such as Bryan and Cecchetti (1994). The set of 41 components is the same one the Federal Reserve Bank of Cleveland now uses in computing the median CPI. 6 The practice of excluding energy prices has a shorter history than the practice of excluding food prices. Excluding energy only became commonplace with the first spike in oil prices in the early 1970s. The BLS did not begin publishing the CPI ex food and energy until 1978. 7 In these models, relative price changes result from only relative shifts in product demand or shifts in supply. Bakhshi and Yates argue that, in the same general class of models, aggregate demand changes could create relative price shifts. In this case, a trimmed mean may be an inferior measure of core inflation. 8 While Bryan, Cecchetti, and Wiggins find a trim of 18 percent to be superior, more recent research lowers the trim to 16 percent (Federal Reserve Bank of Cleveland, p. 2). Over long periods, this trimmed mean excludes an average of seven to eight CPI components. 9 This article calculates the median CPI—which is, technically, a so-called weighted median—using the methodology underlying the series published by the Federal Reserve Bank of Cleveland. Under this approach, the median CPI in the example (in which all price changes have equal relative importances) is the 50th largest price change, although the simple, unweighted median would usually be calculated as the 51st price change. 10 Blinder (1982) argues the behavior of food prices in the 1970s—particularly, 1973 to 1979—was unusual compared with earlier periods. 11 The volatility of consumer food prices in the PPI has declined even more sharply than the volatility of CPI food prices. So although changes over time in CPI measurement may account for some of the decline in food price volatility in the CPI, other forces such as the declining farm share are likely important. Clark.qxd 6/21/01 28 1:28 PM Page 28 FEDERAL RESERVE BANK OF KANSAS CITY 12 Some analysts have used or proposed using core inflation measures that exclude used cars in addition to food and energy (Peach and Alvarez; Blinder 1997). 13 For simplicity, this listing uses identifiers from the 1967-97 item structure of the CPI. In most cases, the components excluded are exactly the same in 19982000 as in 1967-97, even if the names differ modestly. In two cases, however, the January 1998 change in item structure alters the list of excluded components. First, because the CPI now splits fruits and vegetables into fresh and processed components, from 1998 to 2000 the number of excluded series is nine rather than eight. Second, because the CPI no longer includes the other apparel commodities component, from 1998 to 2000, other apparel commodities is replaced by jewelry and watches, which made up most of other apparel commodities under the old CPI item structure. 14 Of the eight most volatile CPI components, meats, etc., ranks ninth in frequency of trim, while one of the eight most frequently trimmed components, other private transportation commodities, ranks 12th in volatility. 15 Although most evaluations of core inflation measures do not include breadth as a criterion, some observers believe that, in general, monetary policy should ultimately focus on the broadest price index possible. Of the indicators considered in this article, the CPI ex energy is broadest, excluding just 7.3 percent of the CPI in December 2000. The CPI ex 8 components and CPI ex food and energy remove 11.8 and 22.9 percent of the CPI, respectively (December 2000), while the trimmed mean excludes 16 percent. The median CPI is narrowest, excluding all but one component of the CPI. 16 Wynne (1999) suggests some other criteria for evaluating core inflation measures, such as whether they can be computed in real time and whether they will be free from historical revisions. All five indicators analyzed in this article satisfy these criteria. While not considered by other studies, an additional criterion for policymakers might be predictability. Based on the predictability measure proposed by Diebold and Kilian, the core indicators considered in this article appear to be about equally predictable. Marques, Neves, and Sarmento suggest even more criteria, on the assumption overall inflation has a unit root. 17 The trimmed mean has been observed to understate long-run average inflation rates in other countries such as New Zealand (Roger). Although Bryan, Cecchetti, and Wiggins and Cecchetti acknowledge that understating average inflation would warrant adjusting the trimmed mean as this article does, previous analyses for the United States have not made any adjustment. 18 Measuring volatility around trend by root mean squared errors instead of standard deviations produces the same results. 19 The basic regression model used in this article is also used in such other studies as Cogley 1998; Hogan, Johnson, and Lafleche 2001; and Cutler 2001. 20 While some studies simply regress overall inflation on lags of overall and core inflation, the near-unit root persistence in inflation makes inference in such a regression difficult. The regression (1), used in such other studies as Cogley 1998, Hogan, Johnson, and Lafleche 2001, and Cutler 2001, circumvents the econometric difficulties posed by the persistence in inflation. 21 Replacing year-over-year core inflation (in the regression notation, price change from t-12 to t) with core inflation over three months (from t-3 to t) or over six months (from t-6 to t) yields the same qualitative results. Using quarterly Clark.qxd 6/21/01 1:28 PM Page 29 ECONOMIC REVIEW • SECOND QUARTER 2001 29 rather than monthly data also produces very similar findings. Moreover, measuring the predictive content of core for overall inflation with the method developed by Diebold and Kilian yields comparable results. For example, Diebold-Kilian estimates indicate that, from 1967 to 2000, the CPI ex energy offers the most predictive power for future overall inflation (over and above the predictive content of past overall inflation)—and is the only core measure with statistically significant predictive power, at a horizon of one to two years. 22 Wynne (1999) also points out a trimmed mean will be more difficult for the public to understand than an alternative like the CPI ex food and energy. Clark.qxd 6/21/01 30 1:28 PM Page 30 FEDERAL RESERVE BANK OF KANSAS CITY REFERENCES Bakhshi, Hasan, and Tony Yates. 1999. “To Trim or Not to Trim: An Application of a Trimmed Mean Inflation Estimator to the United Kingdom,” Bank of England, working paper no. 97, July. Baxter, Marianne, and Robert G. King. 1999. “Measuring Business Cycles: Approximate Band-Pass Filters for Economic Time Series,” Review of Economics and Statistics, November. Blinder, Alan S. 1997. “Commentary,” Federal Reserve Bank of St. Louis, Review, May/June. __________. 1982. “Double-Digit Inflation in the 1970s,” in Robert E. Hall, ed., Inflation: Causes and Effects. Chicago: University of Chicago Press, pp. 261-82. Board of Governors of the Federal Reserve System. 2000. “Monetary Policy Report to the Congress,” in Federal Reserve Bulletin, August, pp. 539-65. Bryan, Michael F., and Stephen G. Cecchetti. 1994. “Measuring Core Inflation,” in N. Gregory Mankiw, ed., Monetary Policy. Chicago: University of Chicago Press, pp. 195-215. __________. 1993. “The Consumer Price Index as a Measure of Inflation,” Federal Reserve Bank of Cleveland, Economic Review, Fourth Quarter. Bryan, Michael F., Stephen G. Cecchetti, and Rodney L. Wiggins II. 1997. “Efficient Inflation Estimation,” National Bureau of Economic Research, working paper no. 6183, September. Cecchetti, Stephen G. 1997. “Measuring Short-Run Inflation for Central Bankers,” Federal Reserve Bank of St. Louis, Review, May/June. Cockerell, Lynne. 1999. “Measures of Inflation and Inflation Targeting in Australia,” Reserve Bank of Australia, manuscript. Cogley, Timothy. 1998. “A Simple Adaptive Measure of Core Inflation,” Federal Reserve Bank of San Francisco, working paper no. 98-06, September. Cutler, Joanne. 2001. “Core Inflation in the U.K.,” Bank of England, External MPC Unit discussion paper no. 3, March. Diebold, Francis X., and Lutz Kilian. Forthcoming. “Measuring Predictability: Theory and Macroeconomic Applications,” Journal of Applied Econometrics. Dow, James P., Jr. 1994. “Measuring Inflation Using Multiple Price Indexes,” University of California-Riverside, manuscript. Eckstein, Otto. 1981. Core Inflation. Englewood Cliffs, N.J.: Prentice-Hall. Federal Reserve Bank of Cleveland. 2001. Economic Trends, February. Hogan, Seamus, Marianne Johnson, and Therese Lafleche. 2001. “Core Inflation,” Bank of Canada, technical report no. 89, January. Marques, Carlos Robalo, Pedro Duarte Neves, and Luis Morais Sarmento. 2000. “Evaluating Core Inflation Indicators,” Bank of Portugal, working paper no. 3-00, April. Peach, Richard W., and Karen Alvarez. 1996. “Core CPI: Excluding Food, Energy…and Used Cars?” Federal Reserve Bank of New York, Current Issues in Economics and Finance, April. Roger, Scott. 1997. “A Robust Measure of Core Inflation in New Zealand, 194996,” Reserve Bank of New Zealand, discussion paper series no. G97/7, March. Shiratsuka, Shigenori. 1997. “Inflation Measures for Monetary Policy: Measuring the Underlying Inflation Trend and its Implication for Monetary Policy Implementation,” Bank of Japan, Monetary and Economic Studies, December. Clark.qxd 6/21/01 1:28 PM Page 31 ECONOMIC REVIEW • SECOND QUARTER 2001 31 U.S. Department of Agriculture. 2000. “Food Marketing and Price Spreads,” www.ers.usda.gov/briefing/foodpricespreads, December. U.S. Department of Labor, Bureau of Labor Statistics. 1997. BLS Handbook of Methods, Bulletin 2490, April. Wynne, Mark A. 1999. “Core Inflation: A Review of Some Conceptual Issues,” Federal Reserve Bank of Dallas, research department working paper no. 99-03, June. __________. 1997. “Commentary,” Federal Reserve Bank of St. Louis, Review, May/June.


© Copyright 2026