
The stability of a crystal with diamond structure for patchy
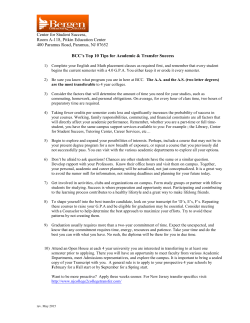
The stability of a crystal with diamond structure for
patchy particles with tetrahedral symmetry
Eva G. Noya, Carlos Vega, Jonathan P. K. Doye and Ard A. Louis
Supplementary material
TABLE I: Helmholtz free energies (Asol ) of the solid phases for the 12-6 model, as obtained by
the Einstein molecule method. The coupling parameters in the Einstein molecule were chosen as
2 ) = λ /(k T )=30000. The free energy A
λt /(kB T /σLJ
o
B
sol and the average potential energy energy
(U ) are given in units of N kB T . The uncertainty in Asol and U is about 0.02N kT . (TI) refers to
independent simulations run as consistency checks. It can be seen that the free energy obtained by
thermodynamic integration along an isotherm coincides with the value calculated from the Einstein
molecule method within statistical uncertainty.
Structure
T∗
p∗
ρ∗
U
Asol
diamond
0.10 0.3 0.466 -16.30 -5.09
diamond
0.10 1.2 0.513 -14.95 -3.69
diamond (TI) 0.10 1.2 0.513
-3.71
bcc
0.10 3.00 1.035 -15.28 -3.34
bcc
0.10 0.65 0.932 -16.56 -5.11
bcc (TI)
0.10 3.00 1.035
bcc
0.15 0.5 0.900 -9.70 -0.03
fcc-o
0.10 6.08 1.234 -8.31
3.17
fcc-d
0.50 10.0 1.208
5.98
1
-3.35
0.12
TABLE II: Coexistence points for the 12-6 model obtained using the Gibbs-Duhem method. Uncertainties in the densities ρ∗ are of the order of 0.001 and in the potential energy per particle u∗
are smaller than 0.01.
Phase 1 Phase 2
p∗
T∗
ρ∗1
u∗1
ρ∗2
u∗2
fluid
bcc
2.01 0.20 0.959 -0.30 0.999 -0.99
fluid
bcc
1.00 0.18 0.811 -0.32 0.922 -1.28
fluid
bcc
0.40 0.16 0.652 -0.34 0.833 -0.92
fluid
bcc
0.05 0.13 0.333 -0.35 0.868 -1.51
fluid
bcc
0.001 0.10 0.010 -0.05 0.881 -1.63
fluid
fcc-d
4.60 0.40 0.972 -0.07 1.072 -0.13
fluid
fcc-d
3.30 0.30 0.959 -0.16 1.055 -0.22
fluid
fcc-d
1.99 0.20 0.936 -0.31 1.034 -0.38
bcc
fcc-o
3.80 0.13 1.061 -1.34 1.164 -0.92
bcc
fcc-d
3.60 0.15 1.054 -1.28 1.153 -0.85
bcc
fcc-d
2.80 0.18 1.022 -1.18 1.118 -0.42
bcc
fcc-d
2.00 0.20 0.981 -1.08 1.030 -0.38
2
TABLE III: Helmholtz free energies (Asol ) of the solid phases, as obtained by the Einstein molecule
method, for the 20-10 model. The coupling parameters in the Einstein molecule were chosen as
2 ) = λ /(k T )=70000. The free energy A
λt /(kB T /σLJ
o
B
sol and the average potential energy (U )
are given in units of N kB T . (TI) refers to independent simulations run as consistency checks.
Uncertainties in the free energies and potential energies are of the order of 0.02 N kT .
Structure
T∗
p∗
ρ∗
U
Asol
diamond
0.10 0.473 0.530 -16.57 -4.35
diamond
0.10 0.01 0.515 -16.47 -4.47
diamond (TI) 0.10 0.01 0.515
-4.47
diamond
0.13 0.172 0.521 -11.65 -0.76
bcc
0.10 0.466 1.040 -16.86 -4.26
bcc
0.10 1.300 1.065 -16.93 -4.10
bcc (TI)
0.10 1.300 1.065
bcc
0.13 0.284 1.021 -12.02 -0.58
fcc-o
0.10 5.234 1.234 -10.83 1.78
fcc-o
0.10 8.000 1.272 -9.61
3.35
fcc-o (TI)
0.10 8.000 1.272
3.35
fcc-o
0.13 5.675 1.234 -7.59
4.18
fcc-d
0.50 5.423 1.050 -0.14
4.46
fcc-d
0.50 8.500 1.163 -0.09
5.70
fcc-d (TI)
0.50 8.500 1.163
5.71
3
-4.10
TABLE IV: Coexistence points for the 20-10 model obtained using the Gibbs-Duhem method.
Uncertainties in the densities ρ∗ are of the order of 0.001 and in the potential energy per particle
u∗ are smaller than 0.01.
Phase 1 Phase 2
p∗
T∗
fluid
bcc
1.0 0.184 0.806 -0.258 1.019 -1.334
fluid
bcc
1.4 0.197 0.837 -0.246 1.023 -1.274
fluid
bcc
1.6 0.202 0.886 -0.240 1.032 -1.248
diamond bcc
0.023 0.110 0.514 -1.604 1.021 -1.633
diamond bcc
0.010 0.080 0.519 -1.730 1.033 -1.746
diamond bcc
0.001 0.040 0.524 -1.874 1.046 -1.877
bcc
fcc-o
6.45 0.010 1.148 -1.762 1.269 -1.219
bcc
fcc-d
5.88 0.060 1.139 -1.658 1.252 -1.146
bcc
fcc-d
5.20 0.130 1.129 -1.457 1.227 -1.004
bcc
fcc-d
4.00 0.190 1.100 -1.281 1.189 -0.410
bcc
fcc-d
2.50 0.212 1.057 -1.187 1.088 -0.325
fluid
fcc-d
2.59 0.250 0.937 -0.043 1.051 -0.095
fluid
fcc-d
3.84 0.350 0.952 -0.104 1.056 -0.155
fluid
fcc-d
5.08 0.450 0.955 -0.182 1.060 -0.247
4
ρ∗1
u∗1
ρ∗2
u∗2
(a)
(b)
FIG. 1: Analysis of the bcc-diamond interface for the 12-6 model for a simulation box containing 2048
molecules. Initially the simulation box contained 1024 molecules in a bcc solid (i.e., 8×8× 8 unit cells) and
1024 molecules of fluid. As before, (a) and (b) show two different repesentations of the final configuration
of the simulation, in which all the fluid has crystallized. (a) The molecules that were in the bcc solid
structure in the initial configuration are coloured in blue, whereas those that were fluid molecules in the
starting configuration are coloured in red. It can be seen that almost all the fluid has solidified into a
diamond crystal. Only one or two incomplete bcc layers form at the two bcc-fluid interfaces. (b) The two
sublattices are highlighted by colouring the particles belonging to each sublattice in a different colour, red
for one sublattice and blue for the other. In contrast to the example discussed in the manuscript, a different
sublattice has grown from each of the bcc-fluid interfaces. Some defects appear when the two lattices meet.
It can be observed that one of the sublattices grew much more than the other.
5
FIG. 2: Final configuration for the bcc-diamond interface for the 12-6 model and a simulation box containing
4000 particles. Initially the simulation box contained 2000 molecules in the bcc solid (i.e., 10×10×10 unit
cells) and 2000 molecules in the fluid phase. Molecules that were in the bcc solid in the initial configuration
are coloured blue and those that were in the fluid phase in the initial configuration are coloured in red. As
before, the fluid crystallizes in a diamond crystal with some defects.
FIG. 3: Final configuration for the bcc-diamond interface for a simulation box containing 864 molecules for
the shorted ranged LJ 20-10 model. Initially the simulation box contained 432 molecules in the bcc solid
(i.e., 6×6× 6 unit cells) and other 432 molecules in the fluid phase. Molecules that were in the bcc solid in
the initial configuration are coloured blue and those that were in the fluid phase in the initial configuration
are coloured in red.
6


© Copyright 2026