
Orientational ordering and the low temperature structure of SF 6
MOLECULARPHYSICS,1987, VOL,62, No. 5, 112%1141
Orientational ordering and the low temperature
structure of S F 6
by B. M. POWELLt, M. T. DOVE~,
G. S. PAWLEYw and L. S. BARTELLII
f Atomic Energy of Canada Limited, Chalk River Nuclear Laboratories,
Chalk River, Ontario, KOJ 1JO, Canada
Department of Earth Sciences, University of Cambridge,
Cambridge, CB2 3EQ, England
wDepartment of Physics, University of Edinburgh,
Edinburgh, EH9 3JZ, Scotland
I[ Department of Chemistry, University of Michigan,
Ann Arbor, Michigan 48109. U.S.A.
(Received 5 June 1987; accepted 16 June 1987)
The crystal structure of sulphur hexafluoride in its low temperature phase
has been solved from neutron powder diffraction _measurements.At both 23 K
and 85 K the structure is triclinic, space group P1, with Z = 3. It is in good
agreement with the structure predicted previously by molecular dynamics simulations. No evidence was found for the existence of an hexagonal phase. The
phase transition is interpreted in terms of two separate lattice distortions from
the cubic, high temperature phase which couple to different stages of orientational ordering. The mechanism driving the transition is the resolution of orientational frustration as the temperature is reduced. The present results confirm
the validity of the simple intermolecular force model employed in the simulations for SF~ and they have been used to improve the parameters of this model.
1.
Introduction
The existence of a phase transition in sulphur hexafluoride (SF6) was first indicated by calorimetric measurements [1]. The transition, at 96 K, was subsequently
confirmed by N.M.R. measurements [2, 3], while a second transition at 45 K was
suggested by the temperature dependence of the linewidths and second moments
[3], X-ray diffraction data [2] showed the high temperature phase to be bcc and
probably orientationally disordered (OD). The detailed structure of this phase was
determined by neutron diffraction measurements [4, 5]. These showed that the
average orientation of the molecules has the S-F bonds lying along the cubic axes,
but there are large mean square deviations from this average orientation. Extensive
Molecular Dynamics Simulation (MDS) calculations [6-9] have shown that the
origin of the disorder in SF6 is associated with orientational frustration effects
rather than the more common statistical disorder or large amplitude thermal fluctuations. Many of the properties of this phase (e.g. temperature effects, single molecule dynamics, collective excitations and the effects of rotation-translation
coupling) are now reasonably well understood.
9 Government of Canada 1987
1128
B . M . Powell et al.
Despite this increased understanding of the high temperature O D phase, the
determination of the crystal structure of the phase (or phases) below 9 6 K has
remained an unsolved problem. Neutron powder diffraction data [10] indicated the
structure to be of low symmetry and showed that it must be very similar at 20 K
and 75 K. However, all efforts to find a set of unit cell parameters to match these
diffraction data failed. Since these efforts included the use of exhaustive search
methods [11] which would have identified a cell of monoclinic or higher symmetry,
this implied that the structure of SF 6 below 96 K is probably triclinic at all temperatures. On the other hand, electron diffraction data [12] obtained between 45 K
and 9 6 K could be analysed in terms of an hexagonal unit cell containing three
molecules. The hexagonal cell vectors a m, bh and eh are related to the cubic cell
vectors of length a c by
ah ~ at(0, 1, -- 1);
bh ~ at(l, -- 1, 0);
eh ~ ar
1, 1)/2.
These experiments also suggested that below 50 K there is a distortion of this cell to
a pseudo-orthorhombic C-centred cell of monoclinic or lower symmetry with the
new cell vectors a t , bt, et related to the cubic and hexagonal cell vectors by
at ~ at(l, 1, --2) ~ 2ah + bh;
bt ,~ ar
1, 1 , 0 ) ~ --bh;
Ct ~ a~(1, 1, 1)/2 ~ Ch.
These two distortions were reproduced independently in the MDS calculations
[13, 14], which indicated that the primitive unit cell of the lowest temperature
structure is triclinic with space group P1 and Z = 3. The pseudo-orthorhombic
setting (at, bt, ct) has space group Ci with Z = 6. Although it is not the primitive
cell it is convenient to use because the cell angles become equal to 90 ~ in the cubic
phase and therefore provide a good measure of the symmetry-breaking distortion
[14].
Subsequent attempts to use this information in the analysis of the neutron
diffraction data were unsuccessful, and the discrepancy between the neutron and
electron diffraction data immediately below the ordering transition at 9 6 K
remained unresolved. High resolution measurements were made with a neutron
wavelength of ~ 4 , ~ in an effort to split as many unresolved peaks as possible at low
scattering angles. Several of these peaks were indeed resolved at this longer wavelength, but the ambiguities in indexing the peaks were not eliminated and the crystal
structure remained unsolved.
Recently, during electron diffraction studies of nucleation in supersonic jets [15],
a new procedure was developed for the analysis of diffraction data starting from
trial structures suggested by considerations of molecular packing [16]. When
applied to the neutron diffraction data from SF6 [10] this procedure succeeded in
indexing the diffraction pattern in terms of a cell with triclinic symmetry [17]. The
analysis determined the unit cell parameters with sufficient accuracy that a complete
refinement became feasible.
In the present paper we report a determination of the detailed crystal structure
of SF 6 obtained from new neutron powder diffraction data at 23 K and 85 K. The
earlier data at 75 K [10] are also analysed and additional high resolution data at
18 K are presented. The experimental details and results are presented in ~ 2 and 3.
In w4 we consider in more detail the mechanism of the ordering phase transition,
Orientational ordering and the low temperature structure of
SF 6
1129
paying attention to the effects of orientational frustration on the molecular packing
and the discrepancies between the electron and neutron diffraction results. Finally,
in w5 we use the results obtained here to assess and improve the model intermolecular potential that has been used in the M D S calculations.
2.
Experimental details
The polycrystalline sample of SF 6 was prepared by cryogrinding the condensed
gas using the technique reported previously [18]. The sample container was a
thin-walled vanadium can of diameter 12mm and height 70mm and the sample was
'cold loaded' into a closed-cycle Displex cryostat. The diffraction measurements
were made on the C5 triple-axis spectrometer operated in its two-axis mode at the
N R U reactor, Chalk River. The monochromator was Si (115), and collimations of
0-44~ and 0-20 ~ were used before and after the sample respectively. A sapphire filter
(50mm) was placed in the incident beam to reduce unwanted background. The
spectrometer was calibrated using AI powder at room temperature as a standard
and the neutron wavelength was 1-48018(2)A. The experimental profiles were measured by stepping the detector in 0-1 ~ steps from 10~ to 120 ~ and typical counting
times were 2-3 rain per point. For these scans the maximum value of sin 0/2 was
0-585 A -1. The powder quality was checked by monitoring the intensity of the
strongest Debye-Scherrer peak as a function of specimen orientation around the
cylinder axis. The standard deviation from the mean was only 2.5 per cent, showing
the powder to be very homogeneous. However, the sample was continuously rotated
throughout the measurements to minimize any residual errors due to finite crystalline grain size. The transmission of the sample, measured with the incident beam
defined by a narrow slit, was 0-756. The experimental profiles for measurements at
23 K and 85 K are shown in figures 1 (a), (b).
The experiments described above used a short wavelength to reach as large a
value of sin 0/2 as allowed mechanically. But in the use of search procedures to
identify the crystal unit cell it is necessary to measure the low angle peaks with the
highest possible resolution. Consequently the powder profile of another low temperature sample of S F 6 w a s measured with a much longer neutron wavelength.
These experiments were done on the N5 spectrometer with graphite (0002) as the
monochromator. The neutron wavelength in this case was determined by calibration with KCI powder at room temperature as a standard and found to be
4-1037(2) A. The incident beam was filtered by 15 cm of cold Be to remove higher
order contamination. Collimations before and after the sample were 0.44 ~ and 0.20 ~
respectively and the detector was stepped by 0.1 ~ through a range of scattering
angles from 20 ~ to 111 ~ The sample was continuously rotated, and its temperature
was 18K. The experimental profile is shown in figure 2. The maximum value of
sin 0/2 in this case is 0.201 A - 1.
The earlier powder diffraction data at 75 K were measured on the L3 spectrometer with Ge (331) as the monochromator. The neutron wavelength was 1-83377(2)A
with collimations of 0.44 ~, 0.35 ~ before and after the sample respectively. The
maximum value of sin 0/2 was 0.421 A - 1.
3.
Results
The crystal structures were refined from the data sets using the powder fitting
program E D I N P El9]. The triclinic unit cell parameters obtained by Bartell et al.
1130
B . M . P o w e l l et al.
i
m
I
I
r III II Jl Iiiii IIIIFIIlIIIlIIIIll lilllill_-]!
-
-
w
23K
o
r
J
i
,
lid
Ul
I
I
.~
J
II
. $ O L I
i
I
m
i
i
i
Alil
i
I
i
i
II
:
9II
lO
Ill
'nO
i
i
i
i
i
,
i
l
,
/ ~mlE$
i
_
I III It II III'L:II IIII1:1111tlllllllllllI I I I I I I I I I I I I I I I I I I I I I l U l l l l l l l l l / l l l l i
m
8SK
m
IL
I
I
I
i
t
I
i
i
i
I
31
J
~
I
~
,
m
I
~
L
m
L
N
I
we
L
m
t
L
N
I
~
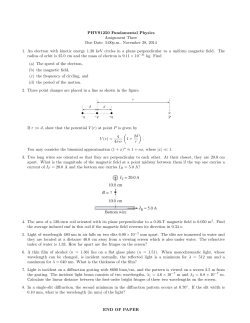
Figure i. Comparison of the observed and fitted neutron powder profiles of SF 6 measured
with a neutron wavelength of 1-48018 A (a) T = 23 K, (b) T = 85 K. The vertical tick
marks show the positions of individual Debye-Scherrer peaks. The lines marked (111),
(200) in (b) show the positions of these peaks for the cubic, high-temperature phase.
I
II
I I
li
I I
III
I
Iii!
Stm
j.
t
o
o
Figure 2.
L
J
I
I
[
I
I
Ii
Comparison of the observed and fitted profiles at 18 K measured with a neutron
wavelength of 4,1037 A.
Orientational ordering and the low temperature structure of S F 6
1131
Table 1. The temperature dependence of the structural parameters for the low temperature
phase of SFr. At 18 K only the unit cell parameters were refined. The Euler ranges ~b,
0, ~k are rotations about orthogonal axes X, Y, Z related to crystal lattice axes x, y, z
by X//x, Y//y and Z = XxY. A clockwise rotation is positive.
Temperature (K)
Wavelength 2 (A)
R (per cent)
Lattice parameters (A) a
b
c
Unit cell angles (deg) ct
fl
),
Unit cell volume (A~
Euler angles (radians)
~bI
Molecule 1
01
~bI
Molecule 2
~bz
02
Cz
S-F bond length (J~)
18
4.1037
7.2
75
1.83377
7.8
14.045(11) 14.140(4)
8.007(6)
8.091(2)
4.752(3)
4.801(1)
85.19(2)
85.55(2)
92-73(4)
92.53(2)
89.06(1)
89.14(1)
531.81
546.94
-2.36(4)
0.55(1)
2.49(4)
-0.70(1)
1.02(2)
0.45(1)
1-58142(3)
-
-
23
1.48018
4.9
85
1.48018
8.2
14.056(2)
8-0133(9)
4.7548(4)
85.193(5)
92.67(1)
89.05(1)
532.97
14.152(3)
8-105(1)
4.8124(9)
85.71(1)
92.48(2)
89.175(6)
549.87
-2.39(3)
0.552(4)
2.63(3)
-0.680(7)
-- 1.002(9)
0-484(8)
1-56808(9)
-2.35(2)
0.571(7)
2.50(2)
-0.687(8)
--0.989(9)
--0-467(8)
1-5799(2)
[17] from the earlier powder diffraction data [10] were used as initial values in the
refinements. A primitive unit cell of space group P i with Z = 3 was assumed, but
the refinements were performed using the C-centred pseudo-orthorhombic cell
(Z = 6) described above. The molecules were constrained to have On symmetry, and
initial values of the molecular orientations and centre of mass positions were
approximately those predicted by the simulations of Pawley and Thomas [14]. The
position of one molecule is fixed at the origin of the unit cell on a centre of
symmetry while the other two molecules have general positions related by a centre
of symmetry. The rigid-body constraint subroutine of E D I N P was modified to
allow refinement of the S - F bond length and of separate isotropic rigid-body translational and rotational temperature factors for the two independent molecules. The
peak widths were defined by the usual U V W parameters [20], and the asymmetry
of the Bragg peaks was modelled using the method proposed by Howard [21]
which involves one variable parameter. Three different functions were used to model
the background (see below). The total number of variables adjusted in the refinement
was thus a maximum of 2 9 : 6 unit cell parameters, 10 structural parameters, 4
temperature factors and up to 9 profile parameters (1 scale, 1 zero angle, 4 peak
shape and 1, 2 or 3 background). The results of the refinements with a linear sloping
background (see below) are presented in table 1, while table 2 shows the fractional
atomic coordinates derived from these parameters. The experimental diffraction
patterns are compared with the fitted ones in figures 1 (a), (b). The quality of fit is
specified by an R-factor defined as
i
1132
B. M. Powell et al.
Table 2. Fractional atomic position coordinates derived from structural parameters of
table 1.
Temperature (K)
18
Molecule 1
S
F
F
F
Molecule 2
S
F
F
F
F
F
F
75
23
85
x
y
z
x
y
z
x
y
z
x
y
z
0
0
0
0.1021
-0.0028
-0.1216
0.0216
0.1719
0.1231
0.0406
-0-0943
0.2819
0
0
0
0.1013
-0.0228
-0-1180
0-0326
0-1653
0-1274
0.0340
-0.1037
0-2822
0
0
0
0-1010
-0.0055
-0-1271
0-0244
0-1699
0-1249
0-0412
-0.0966
0.2773
x
y
z
x
y
z
x
y
z
x
y
z
x
y
z
x
y
z
x
y
z
0-3342
-0.0032
0-5913
0.4307
-0-0174
0-7719
0.2377
0-0111
0.4108
0-2913
0-1119
0-8077
0.3771
-0"1182
0.3750
0.2969
-0.1613
0.7646
0.3715
0-1550
0.4181
0-3346
-0.0018
0-5854
0-4319
-0"0228
0.7609
0.2372
0.0192
0-4100
0-2965
0.1171
0-8026
0-3726
-0.1207
0-3683
0.2951
-0.1567
0-7640
0.3740
0.1531
0.4069
0.3346
- 0.0029
0.5938
0.4319
-0.0180
0.7683
0-2373
0-0121
0-4192
0-2949
0.1172
0.8067
0.3743
-0.1230
0.3808
0"2965
-0.1565
0.7748
0.3726
0.1506
0.4127
where Yiobs (Y~t a l c ) are the observed (calculated) intensities at scattering angle 201. The
refined crystal structure at 23 K is shown in figure 3.
At 23 K there is very g o o d agreement between the observed and fitted diffraction
profiles. At 85 K discrepancies are m o r e evident. These are of two kinds: (i) the
b a c k g r o u n d , particularly at larger scattering angles, is m o r e intense than at 23 K
and is not as well represented by a simple analytic function. (ii) there are discrepancies between observed and fitted peaks at low scattering angles. The positions of
the (ll0) and (200) peaks of the cubic, high-temperature phase are shown in
figure 1 (b). T h e y clearly occur where there are discrepancies between the observed
and fitted profiles. This suggests there is some residual bcc phase present at 85 K,
even t h o u g h this is well below the transition temperature. Since the bcc contamination affects significantly only two low-angle peaks of the ~ 9 0 0 peaks in the
complete pattern, refinement in terms of the triclinic structure is not greatly affected
Orientational ordering and the low temperature structure of
SF 6
1133
0t
Figure 3. The crystal structure of S F 6 at 23 K derived in the present study. The structure is
viewed in perspective down the ct-axis. The centres of mass of the molecules have
fractional z coordinates of 0 and 1 (molecule 1), ~ -0-4 and ~0-6 (molecule 2) and
~0.4 and ~ 1-4 (molecule 2). The tapered lines between F atoms on different molecules denote the short F-.- F bonds that lie close to the cubic axes of the disordered
phase.
if these two peaks are omitted. The values of the structural parameters obtained
with these two peaks included or excluded do not differ by more than their fitted
errors. The results given in table 1 were obtained with the peaks excluded.
The diffraction patterns contain too many overlapping peaks to allow direct
observation of the background except at low scattering angles. Consequently, three
different analytic functions were used to model the background and the data were
refined with each one. The first assumption was that of a flat background described
by a single adjustable parameter. The second assumption was that of a flat background plus a term increasing linearly with scattering angle. This function is
described by two adjustable parameters. The b.c.c, contamination at 85 K, although
affecting only a few discrete peaks, will contribute a diffuse background appropriate
to the cubic phase. Thus, the third assumption was that of a cubic, diffuse background. Assuming randomly oriented molecules the analytic form is given by equations 2.29, 2.36 and 2.37 of Dolling et al. (4). In the notation of that reference it is
background = A + B[(Afl)2 +[(fl)12{1 - exp (-CQ2)}],
where A, B and C are adjustable parameters, (fl) is the rotational structure factor,
Aft is the equilibrium fluctuation of the molecular scattering amplitude and
Q = 4n sin 0/2. The assumption of randomly oriented molecules is clearly an oversimplification, but a more exact model would need to include higher order terms
and correspondingly more parameters.
For both temperatures the best fit is obtained with the linearly sloping background. The 'diffuse' background and the flat background both give poorer fits. At
23 K the R-factors are 4.9, 5.7, 6-0 per cent respectively while at 85 K they are 8.9,
11-3, 12-0 per cent with the cubic peaks included and 8.2, 10-4%, 10.3 per cent with
1134
B.M. Powell et al.
the cubic peaks excluded. Within the fitted errors the structural parameters are the
same with either sloping or diffuse background assumptions and are marginally
outside these errors for the flat background.
The success of the linear sloping background assumption a t 23 K suggests that
there must be two contributions to the diffuse background. At high temperatures
(e.g. 85K) b.c.c, contamination will contribute one component. But this will be
negligible at 23 K and the sloping background at this temperature must be a second
background component due to residual disorder. This suggests that residual orientational disorder may be present even at the lowest temperatures. The cubic, diffuse
assumption might be expected to model both these contributions. But the simplified
form used here is clearly not appropriate for the ordered phase. The presence of a
component of the cubic, disordered phase at 85 K in the ordered low temperature
phase is analogous to the co-existence of ordered and disordered phases observed in
hexafluoroethane [22]. It suggests that the phase boundaries in these molecular
solids may depend on the detailed specimen characterization and history, as well as
on temperature.
The earlier data at 75 K [10] show no evidence of contamination with cubic
peaks. These data are of lower resolution than the present data and extend over a
smaller range (sin 0/2 = 0.421 A- 1). The diffraction pattern was analysed in terms of
the triclinic structure described above with the same background assumptions.
However, the refinements with the disordered, diffuse background did not converge,
probably because any b.c.c, component is too weak to specify adequately the background parameters. The R-factors with the sloping and flat backgrounds are 7-8,
10.4 per cent respectively and the values of the structural parameters are also given
in tables 1 and 2.
Several points should be noted.
(1) The refined unit cell parameters are in good agreement with those calculated
by Bartell et al. El7], the discrepancies are due only to our use of improved
individual line profiles.
(2) It is clear from figure 1 that there is considerable overlap of Debye-Scherrer
peaks and several at low angles have such low intensity that they cannot be
discerned in the overall diffraction pattern. This explains why conventional
analysis of the diffraction pattern failed to yield a solution for the unit cell.
The complexity of the structure inevitably results in significant overlap of the
lines, for example in the region up to the twentieth observable peak there are
82 Debye-Scherrer lines, and the complete scans in figures 1 (a), (b) each
contain >900 reflections. An example of the peak overlap is shown in
figure 4, where diffraction patterns at different resolution are compared in
detail. Even at the best resolution available many of the overlapping peaks
cannot be separated.
(3) The refined structure is very similar to that obtained in the MDS calculations of Pawley and Thomas [14]. This suggests that the choice of the
model intermolecular potential used in that and subsequent studies of the
phases of SF6 is valid.
(4) Refinements were also performed using the lower symmetry space group P1,
with three independent molecules in the primitive cell instead of two. No
improvement in the fit was obtained, and the symmetry-breaking distortions
Orientational ordering and the low temperature structure of SF~
I
u
I
]
I
1135
I
I I I
m
~3
Z
Z
w
N
m
IE
Z
O:
I
0.120
i
I
K
0.125
sine / X
Figure. 4. Comparison of the profiles for measurements made with two neutron wavelengths: 1.48018k (upper curve) and 4.1037 k (lower curve). The two profiles have
been normalized to show equal integrated intensities, and the solid lines are hand
drawn through the data points. The vertical bars indicate the positions of the DebyeScherrer peaks. The range of sin 0/k extends across the largest peak (20 ~ 21~ of
figure 1 (a).
of the structure were negligibly small. Thus we conclude that P1 is the
correct symmetry of the lowest temperature phase of SF6.
(5) The use of rigid-body isotropic rotational and translational temperature
factors intuitively would seem to be a reasonable assumption. However, it
was found that these parameters were too highly correlated in the refinements to allow a meaningful interpretation of their values particularly at
85 K and 75 K. This is probably due to the difficulty in modelling the background correctly at large scattering angles for these temperatures. Consequently we do not report the refined values of these parameters.
(6) N o evidence was found for the existence of a partially ordered hexagonal
phase intermediate between the triclinic and disordered cubic phases, even
though such a phase has been observed in small single crystal samples by
electron diffraction [12] and was predicted in simulation calculations [13]. A
search for this phase was made by cooling from the cubic phase into the
expected temperature regime and also by heating from the triclinic phase,
thus eliminating possible hysteresis effects. However, no evidence for the
presence of this phase could be found and we must conclude that it does not
exist in bulk samples. But such a phase may well represent a possible transition pathway from the cubic to the triclinic phase, so that its existence may
be realized under different conditions (e.g. in small samples or with rapid
cooling through the transition). This point is discussed further below.
(7) To provide a further check on our refinements we have performed a fit to the
high resolution data shown in figure 2. As the range of sin 0/2 is limited
1136
B.M. Powell et al.
I
I 9
85.50
'I/,.I0
+"
J
lt,+OO
810
I
8S+00
I ~Pf
92+8
.
92A, ~8.00 1
I
1
+.
I
"I
~..80
i
C,75
0
~/t9
20
09.15
I
~,0
60
80
100
20
~.O
60
80
100
TEMPERATURE / K
Figure 5. Temperature dependence of the unit cell parameters.
(8)
through the use of long wavelength neutrons, we have constrained the structure to be that obtained from the refinement of the lower resolution data at
23 K and have fitted only profile and unit cell parameters. Any small adjustments in the atomic positions would affect the higher angle diffraction peaks
only. The results are presented in table 1 and the calculated diffraction
pattern is compared with the experimental one in figure 2. As can be seen,
the agreement is very good. The temperature dependence of the unit cell
parameters is shown in figure 5.
The errors given in table 1 for the S--F bond length are taken directly from
the fitting procedure and are too small to be realistic, a well-known problem
in powder profile structure determination. If more realistic errors are
assumed then the bond length at 23 K agrees with the value obtained from
gas phase electron diffraction measurements [23] and with that from the
previous neutron diffraction data in the disordered phase I-4]. The bond
lengths at 75 K and 85 K agree with each other, but the temperature dependence implied by the relative values at these temperatures and at 23 K does
not seem reasonable. This short bond length is determined primarily by the
high index reflections. It has been pointed out above that the difficulty in
modelling correctly the background at large scattering angles for high temperatures is probably responsible for the difficulty in refining the thermal
factors. It is also probably responsible for this discrepancy in the value of the
S-F bond length between high and low temperatures.
Orientational ordering and the low temperature structure of SF 6
4.
1137
Discussion
The phase transition in S F 6 at 96K is unusual in that it involves a dramatic
lowering of symmetry from cubic to triclinic. Nevertheless, the structures of the two
phases are very closely related and it is possible to view the low temperature
structure as derived from the cubic structure by small structural distortions which
accompany the onset of orientational order. As stated in the introduction, the high
temperature b.c.c, structure has two molecules in the cubic unit cell with average
molecular orientations that have the S-F bonds lying along the cubic cell axes. In
this structure each molecule is coordinated with eight nearest neighbours positioned
along (111) in favourable (i.e. favouring ordering) relative orientations. It is the
packing arrangement for these orientations that yields the b.c.c, structure. However,
the price to be paid for this favourable packing is that the next nearest neighbours
(positioned along (1OO)) have unfavourable (i.e. favouring disordering) relative
orientations because of overlap repulsion of the nearest fluorine atoms. Thus the
molecules must rotate (by ~ 20~ to move the S-F bonds away from the cubic axes,
dynamically relieving the competition between the ordering nearest neighbour interactions and the disordering next nearest neighbour interactions. We have called this
competition 'orientational frustration', and it is discussed in more detail in references [6-8].
At low temperatures the molecules no longer have enough kinetic energy to
resolve the frustration dynamically and the crystal undergoes the phase transition to
the ordered phase. In the ordered phase the volume per molecule is ~ 5 per cent
smaller than in the disordered phase. The key feature of the low temperature triclinic phase is that it retains the eight neighbour coordination of the b.c.c, phase
with za of the molecules having orientations close to the average orientation of the
b.c.c, phase but with small variations. In the structure shown in figure 3 these are
the molecules labelled 2 and 2'. In particular it should be noted that in the triclinic
structure there are no contacts between fluorine atoms of less than 2.9/~,, whereas
for the idealized b.c.c, structure with S-F bonds lying along (1OO) axes the closest
contact distance would be about 2-6A, although in practice the disorder would
rarely allow such short contact distances [7].
It is possible to view the cubic-to-triclinic phase transition as a two stage
process. In the first stage the b.c.c, cell transforms to a hexagonal cell with Z = 3,
and with the hexagonal c-axis lying along a cubic (111) direction. The relationship
between the hexagonal cell vectors and the cubic cell vectors is given in w1. This
hexagonal modulation gives some of the largest distortions from the cubic phase, as
seen in the unit cell lengths and the position of molecule 2. Compared with the
cubic cell length, ac, the triclinic cell lengths at, bt, c, are approximately x/6ac, x/2a~
and x/3aff2. At 23K the lengths at/x/6, bdx/2 and 2cJx/3 are 5.738, 5-666 and
5,490A respectively. Since a~ = 5.78A at 100K (4) it is clear that the greatest
contraction is along ct. In a pseudo-orthorhombic setting of the b.c.c, lattice, molecule 2 would have fractional coordinates of 13, 0, ~. The actual displacements of
molecule 2 from this position at 23 K in the at, b t and ct directions are 0-0183, 0-144
and 0.3861 A respectively, and it is clearly the latter displacement which is the most
significant. The contraction and displacement along ct are consistent with a large
hexagonal distortion. The MDS calculations [13] have shown that this hexagonal
distortion will leave the orientation of molecule 1 (at the origin) disordered, while
the orientations of the other two molecules in the unit cell will be ordered.
1138
B . M . Powell et al.
The second stage of the total transformation involves a shear of the hexagonal
cell to form the triclinic cell. This is characterized by the three distortion angles
A~ = a - 90 ~ etc, of the pseudo-orthorhombic cell, and at 23 K A~, Ap and A~ are
- 4 . 8 1 ~ 2-67 ~ and - 0 - 9 5 ~ respectively. As Ar is significantly smaller than the other
two distortions we suggest that the primary distortion is not a shear within the
hexagonal basal plane (the triclinic a-b plane) but involves a shear perpendicular to
this plane. Noting that the ratio - A , / b , is approximately three times greater than
the ratio AB/at, we surmise that this shear involves a tilting of the hexagonal c-axis
towards the triclinic [130] direction, which is the hexagonal [ i l 0 ] direction. By
combining A~ and Ap we find a shear angle of 5"5~ at 23 K and 5.0 ~ at 85 K. The
shear in the at-b t plane (Av) follows as a second order effect. This analysis is consistent with calculations of the rotation of molecule 2 from an idealized b.c.c, orientation defined with respect to three orthogonal axes with one lying along the a t axis
and another in the at-b t plane: the rotations about the at, b t and ct axes are - 4 . 8 4 ~
2-93 ~ and - 1.18 ~ respectively, which are similar in value to the distortions A~etc.
Thus we conclude that the cubic-to-triclinic distortion involves two instabilities,
namely a contraction along a cubic (111) direction to form a hexagonal intermediate structure, followed by a shear of the intermediate structure towards an hexagonal [110] direction. We have argued elsewhere [13] on the basis of MDS
calculations that these two stages also involve different ordering processes. The first
stage is associated with ordering of the orientations of ~3 of the molecules (2 and 2'),
which is caused by the attractive nearest neighbour interaction and which also
leaves molecule 1 (at the origin) with more orientational freedom. The second stage
is then associated with the ordering of the remaining molecules. Since we did not
observe the hexagonal phase, it appears from our experiments that both stages
occur together at the first order transition at 96 K. However, the possibility of b.c.c.
contamination below the transition and the consequent diffuse background, as
observed in the 85 K data (and to a lesser extent at 23 K) and the disorder seen in
the MDS calculation at 8 0 K [13] all suggest that at temperatures even well below
the transition not all molecules are necessarily orientationally ordered. Consequently, it is not unreasonable to suppose that in small samples or at surfaces the internal
strain may not be strong enough to stabilize the shear distortion of the triclinic
phase and the hexagonal phase might then be metastable in some temperature
range. Thus the electron diffraction [12] and MDS [13] results are not inconsistent
with the findings of the present study.
5.
A model inter molecular potential
In the MDS calculations for S F 6 the intermolecular potential was modelled
[6-9, 13, 14, 24] using a simple Lennard-Jones potential for pairwise a t o m - a t o m
interactions between fluorine atoms only
V(%) = - 4s[(a/r,j) 6 - (~/ro) ~z],
where ri~ is the distance between the ith fluorine atom of one molecule and the jth
fluorine atom of a different molecule; the total interaction is the complete summation over i and j. The parameter s defines an energy scale, so that at temperatures
close to 0 K the crystal structure obtained with the model is determined only by the
value of a. Explicit interactions involving the sulphur atoms were neglected, for it
was assumed that the effects of such interactions would be to modify the values of E
Orientational orderino and the low temperature structure of SF 6
1139
and tr for the F . . . F interactions. Similarly, electrostatic interactions were not
included in the model as these are expected to be relatively weak and of short range
due to the high symmetry of the SF 6 molecule.
We can now use the low temperature structure of SF 6 to assess and improve this
potential model, which was developed on the basis of the idealized structure of the
high temperature disordered phase [24]. We have used the energy minimization
program W M I N [25] to adjust the value of o. This was found by minimization of
the residual
M = ~ (t~W/dPt) 2,
l
where W is the lattice energy and P~ represents any of the 15 structural parameters
whose values are not determined by symmetry. A value of a = 2.8591A was
obtained, compared with o = 2-7 A used in the simulations [6, 24]. The latter value
was obtained from the measured cell parameter and an estimated value for the
sublimation energy. This small (6 per cent) increase in a is consistent with the
previous observation [6, 8] that the parameters used in the MDS calculations
apparently gave a potential that is softer than the real one. The value of o = 3.024 A
suggested by Powles et al. [26] from analysis of gas phase data deviates from our
revised value as much as that used in the simulations, although it differs from the
old value in the correct direction.
We have attempted to extend the above simple model to incorporate S... S and
S... F interactions by using W M I N to find appropriate values for the potential
parameters. Although the residual M was reduced in the fitting procedure, the
minimization yielded unphysical values for all parameters. This suggests that the
effects of the sulphur interactions are no more significant than departures from the
isotropic nature of the a t o m - a t o m model, so that it is a reasonable approximation
to neglect them.
We have allowed the experimental low-temperature structure to relax in order to
minimize the calculated lattice energy, using both new and old values of o. The
results of these minimizations are shown in table 3. Both sets of relaxed structural
parameters are in reasonable agreement with the experimental values, but the new
value of r does give smaller discrepancies.
Since we are using a one-parameter model (tr is the only effective parameter at
T _~ 0) to seek agreement with 15 structural parameters, the quality of the agreement is excellent. The results for the old potential do not exactly match the unit cell
parameters reported by Pawley and Thomas [14] from their simulation results. But
their cell parameters were taken from the centre of a large crystallite and were not
space or time averaged and so the discrepancy is probably not significant. We
conclude from the above discussion that the simple potential model which has been
used in the simulations can, with only slight modification of the parameter values,
account fully for the details of the low temperature ordered structure of SF 6 .
6.
Conclusions
The crystal structure of the low temperature ordered phase of SF6 has been
solved from neutron powder diffraction data. Along with CDBr 3 [27] it is the
lowest symmetry structure yet solved by this technique. The large symmetry change
from cubic to triclinic can be understood in terms of two lattice distortions that
1140
B . M . Powell et al.
Table 3. Results of the lattice relaxation procedure described in the text using two values of
the potential parameter a and starting from the refined structure at 23 K. The results
for the unit cell parameters (~-y) are shown as the changes from the refined values of
table 1. The orthogonal rotations (rx etc.) and translations (tx etc.) show the changes in
the structure following minimization of the lattice energy. AW is the fractional change
in lattice energy (the absolute value depends on the undetermined parameter t). A~
gives the measure of the intermediate hexagonal distortion as described in the text,
and is defined as A~ = 100 x (a + x/3b - ~/2c)/(a + ~3b). 0, gives a measure of the
triclinic shear modulation defined in the text, and is given by 0t = [ ( 9 0 - ~)2
+ (90 -/~)211/2.
Parameter
a = 2-70A
a = 2.8591 A
a (A)
b (A)
c (A)
(deg)
fl (deg)
(deg)
-0.502
-0.327
-0.171
-0.367
0-259
-0-834
-0.017
-0"035
-0.006
-0.180
0.158
-0.615
r x (deg)
ry (deg)
r z (deg)
Molecule 1
1-78
-2.49
-0.47
1'32
-0.51
1.95
r x (deg)
ry (deg)
r z (deg)
t~ (A)
ty (h)
t~ (A)
AW (per cent)
A~ (per cent)
0t (deg)
Molecule 2
-0.24
- 1.09
- 0.15
-0.0082
--0"0026
--0.0509
8-40
3-48
5-146
- 1.59
- 0.60
- 0.40
-0.0083
-0.0033
--0.0380
0.69
3-55
5-734
couple to two ordering processes involving different molecules. Thus the apparent
inconsistencies between structural data obtained by different techniques can be
partially understood. The disordering mechanism in the cubic high temperature
phase is orientational frustration. As the temperature is lowered t h r o u g h the transition the distortions from the cubic phase are consistent with the resolution of this
frustration being the driving mechanism of the transition. The results are in agreement with molecular dynamics simulation calculations and thus add weight to the
validity of the intermolecular potential model used in the simulations. They have
also shown the considerable predictive power of such simulations. The results
obtained here have been used to improve the intermolecular force model used in the
simulations.
O n e of the authors (M.T.D.) thanks S E R C (U.K.) for supporting a stay in Chalk
River and thanks the staff of Atomic Energy of C a n a d a Limited for their kind
hospitality during this visit. Gerald Dolling participated in the early measurements
and Peter Gerlach assisted with the high resolution measurements. The authors
thank J. C. Evans for his technical expertise in preparing the sample.
Orientational ordering and the low temperature structure of SF 6
1141
Note added in proof--It has been brought to the attention of the authors that
the triclinic cell described in the present paper may be reduced and described in
terms of a higher symmetry monoclinic cell with space group C2/m (CocKROFT, J. K.,
and FITCH, A. N., 1987, Science, N.Y. (to be published)). The structure reported here
is equivalent to that with space group C2/m and departures from this higher symmetry are negligibly small. The conclusions drawn from our refinements with space
group P1 are therefore unaffected by the description of the structure in terms of the
higher symmetry space group. We shall publish a short note expressing our results
in terms of the higher symmetry cell.
[1]
[2]
[3]
[4]
[5]
[6]
[7]
[8]
[9]
[10]
[11]
[12]
[13]
[14]
[15]
[16]
[17]
[18]
[19]
[20]
[21]
[22]
[23]
[24]
[25]
[26]
[27]
References
EUCKEN,A., and SCHRODER,E., 1938, Z. phys. Chem., 1141, 307.
MICHEL,J., DRIFFORD,M., and RIGNY,P., 1970, J. Chim. phys., 67, 31.
GARG,S. K., 1977, J. chem. Phys., 66, 2517.
TAYLOR,J. C., and WAUGH, A. B., 1976, J. Solid State Chem., 18, 241. DOLLING,G.,
POWELL,B. M., and SEARS,V. F., 1979, Molec. Phys., 37, 1859.
POWELL,B. M., SEARS,V. F., and DOLLING,G., 1982, Neutron Scatterino---1981, edited
by J. Faber, Jr. (AIP #89), p. 221.
DovE, M. T., and PAWLEY,G. S., 1983, J. Phys. C, 16, 5969.
DovE, M. T., and PAWLEY,G. S., 1984, J. Phys. C, 17, 6581.
DovE, M. T., PAWLEY,G. S., DOLLING,G., and POWELL,B. M., 1986, Molec. Phys., 57,
865.
DovE, M. T., and LYNDEN-BELL,R. M., 1987, Dynamics of Molecular Crystals, edited by
J. Laseombe (Elsevier), p. 705.
POWELL,B. M., DOLLING,G., EVANS,J. C., and NmMAN, H. F., 1980, AECL Report No.
7055 (unpublished data).
LOUER,D., and LO~R, M., 1972, J. appl. Crystallogr., 5, 271.
RAYNERD,G., TATLOCK,G. J., and VENABLES,J. A., 1980, Acta crystalloor. B, 38, 1896.
PAWLEY,G. S., and DOvE, M. T., 1983, Chem. Phys. Lett., 99, 45.
PAWLEY,G. S., and THOMAS,G. W., 1982, Phys. Rev. Lett., 48, 410.
BARTELL,L. S., VALENTE,E. J., and CAILLAT,J. C., 1987, J. phys. Chem., 91, 2498.
CAILLAT,J. C., and BARTELL,L. S., 1986, Quant. Chem. Proo. Exch., program 520,
Indiana University, Bloomington, Indiana 47405.
BARTELL,L. S., CAILLAT,J. C., and POWELL,B. M., 1987, Science, N.Y., 236, 1463.
NIEMAN,H. F., EVANS,J. C., HEAL, K. M., and POWELL,B. M., 1984, J. appl. CrystalIgor., 17, 372.
PAWLEY,G. S., 1980 J. appl. Crystallogr., 13, 630.
RIETVELD,H. M., 1969, J. appl. Crystalloor., 2, 625.
HOWARD,C. J., 1982, J. appl. Crystalloor., 15, 615.
POWELL,B. M., PRESS,W., DOLLING,G., and SEARS,V. F., 1984, Molec. Phys., 53, 941.
BARTELL,L. S., and DOUN, S. K., 1978, J. molec. Struct., 43, 245. GOAT~, S. R., and
BARTELL,L. S., 1982, J. chem. Phys., 77, 1866.
PAWLEY,G. S., 1981, Molec. Phys., 43, 1321.
BUSING,W. R., 1981, internal report ORNL-5747, Oak Ridge National Laboratory.
POWLES,J. G., DORE, J. C., DERAMAN,M. B., and OSAE, E. K., 1983, Molec. Phys., 50,
1089.
MYERS,R., Tom~, B. H., and POWELL,B. M., 1983, J. chem. Phys., 79, 1495.


© Copyright 2026